Embed Size (px)
Citation preview

NI 43-101 Technical Report
Preliminary Economic Assessment (PEA) #3 of the
Tamarack North Project – Tamarack, Minnesota
Submitted to: Talon Metals Corp.
Effective Date of Report: January 8, 2021
Effective Date of Resource: January 8, 2021
Prepared by Qualified Persons:
Leslie Correia, Pr. Eng.
Tim Fletcher, P. Eng.
Daniel Gagnon, P. Eng.
André-François Gravel, P. Eng.
Volodymyr Liskovych, P. Eng.
Andrea Martin, P.E.
Oliver Peters, P. Eng.
David Ritchie, P. Eng.
Brian Thomas, P. Geo.

Document Number
Revision
Page
Rev Date
G4932-RPT-01 0 08 Jan 2021 2
Talon Metals Corp. – Preliminary Economic Assessment #3 on the Tamarack North Project
TABLE OF CONTENTS
EXECUTIVE SUMMARY .................................................................................................... 7
1.1 Introduction ........................................................................................................................... 7
1.2 Location and Ownership ....................................................................................................... 8
1.3 Environmental Considerations and Permitting ...................................................................... 9
1.4 Geology and Mineralization ................................................................................................ 12
1.5 Exploration Programs ......................................................................................................... 14
1.6 Sample Preparation, Quality Assurance (QA)/ Quality Control (QC) and Security ............ 15
1.7 Data Validation .................................................................................................................... 16
1.8 Mineral Processing and Metallurgical Testing .................................................................... 16
1.9 Mineral Resource Estimate ................................................................................................. 18
1.10 Mining Methods ................................................................................................................... 19
1.11 Recovery Methods .............................................................................................................. 21
1.12 Project Infrastructure ........................................................................................................... 22
1.13 Capital Costs ....................................................................................................................... 23
1.14 Operating Costs .................................................................................................................. 24
1.15 Economic Analysis .............................................................................................................. 25
1.16 Conclusions......................................................................................................................... 27
1.17 Recommendations .............................................................................................................. 28
INTRODUCTION .............................................................................................................. 29
2.1 Sources of Information ........................................................................................................ 30
2.2 Qualified Persons (QPs) ..................................................................................................... 31
2.3 Units of Measure and Abbreviations ................................................................................... 32
RELIANCE ON OTHER EXPERTS .................................................................................. 39
PROPERTY DESCRIPTION AND LOCATION ................................................................ 41
4.1 Property Location ................................................................................................................ 41
4.2 Property Ownership ............................................................................................................ 42
4.3 Permitting for Exploration .................................................................................................... 60
4.4 Environmental ..................................................................................................................... 61
ACCESSIBILITY, CLIMATE, LOCAL RESOURCES, INFRASTRUCTURE & PHYSIOGRAPHY ............................................................................................................ 63
5.1 Introduction ......................................................................................................................... 63
5.2 Accessibility......................................................................................................................... 63

Document Number
Revision
Page
Rev Date
G4932-RPT-01 0 08 Jan 2021 3
Talon Metals Corp. – Preliminary Economic Assessment #3 on the Tamarack North Project
5.3 Physiography ...................................................................................................................... 63
5.4 Climate ................................................................................................................................ 64
5.5 Local Resources ................................................................................................................. 64
5.6 Sufficiency of Surface Rights .............................................................................................. 64
HISTORY ......................................................................................................................... 65
6.1 Discovery ............................................................................................................................ 65
6.2 Historical Drilling ................................................................................................................. 66
6.3 Kennecott Drilling Programs (2002-2013) .......................................................................... 66
6.4 Kennecott-Talon Drilling Programs (2014-2018) ................................................................ 69
6.5 Mineral Resource Estimates ............................................................................................... 72
GEOLOGICAL SETTING AND MINERALIZATION ......................................................... 75
7.1 Regional Geological Setting; Introduction ........................................................................... 75
7.2 Property Geology ................................................................................................................ 82
DEPOSIT TYPES ............................................................................................................. 98
EXPLORATION ............................................................................................................. 100
9.1 Historical Investigations .................................................................................................... 100
9.2 Mineral Exploration ........................................................................................................... 100
DRILLING ...................................................................................................................... 110
10.1 Talon Drilling Programs (2020 - Present) ......................................................................... 110
10.2 Resource Drill Holes ......................................................................................................... 110
10.3 Drill Hole and Core Logging Procedures .......................................................................... 118
SAMPLE PREPARATION, ANALYSES, AND SECURITY ............................................ 122
11.1 Core Sampling and Chain of Custody .............................................................................. 122
11.2 Sample Preparation and Assay Protocols ........................................................................ 125
11.3 Assay Data Handling ........................................................................................................ 127
11.4 Quality Assurance and Quality Control (QA/QC) .............................................................. 128
DATA VERIFICATION ................................................................................................... 132
12.1 Golder ............................................................................................................................... 132
MINERAL PROCESSING AND METALLURGICAL TESTING ...................................... 140
13.1 Historic Metallurgical Data ................................................................................................ 140
13.2 Cleaner Flotation Performance ......................................................................................... 152
13.3 Life-of-Mine Mass Balance ............................................................................................... 156

Document Number
Revision
Page
Rev Date
G4932-RPT-01 0 08 Jan 2021 4
Talon Metals Corp. – Preliminary Economic Assessment #3 on the Tamarack North Project
13.4 Analysis and Recommendations....................................................................................... 158
13.5 Hydrometallurgical Testing ............................................................................................... 159
MINERAL RESOURCE ESTIMATE ............................................................................... 164
14.1 Introduction ....................................................................................................................... 164
14.2 Drill Hole Data ................................................................................................................... 164
14.3 Geological Interpretation ................................................................................................... 165
14.4 Exploratory Data Analysis (EDA) ...................................................................................... 167
14.5 Compositing ...................................................................................................................... 175
14.6 Resource Estimation ......................................................................................................... 176
14.7 Mineral Resource Classification........................................................................................ 182
14.8 Block Model Validation ...................................................................................................... 185
14.9 Cut-off Grade (COG) ......................................................................................................... 190
14.10 Assessment of Mining Continuity ...................................................................................... 190
14.11 Mineral Resource Statements........................................................................................... 191
14.12 Risk Assessment .............................................................................................................. 193
MINERAL RESERVE ESTIMATE .................................................................................. 194
MINING .......................................................................................................................... 195
16.1 Mining Methods ................................................................................................................. 195
16.2 Bulk Mining........................................................................................................................ 196
16.3 Drift and Fill Mining ........................................................................................................... 198
16.4 Underground Mine Plan and Schedule ............................................................................. 200
16.5 Underground Development Mine Design .......................................................................... 201
16.6 Resource Mine Design Selection ...................................................................................... 202
16.7 Cut off Value/NSR ............................................................................................................. 203
16.8 Underground Development ............................................................................................... 205
16.9 Geotechnical Analysis ....................................................................................................... 216
16.10 Hydrological Parameters – Bedrock ................................................................................. 221
16.11 Hydrological Parameters –Surficial ................................................................................... 224
16.12 Mine Services.................................................................................................................... 224
RECOVERY METHODS ................................................................................................ 239
17.1 Key Process Design Criteria – Concentrator .................................................................... 240
17.2 Process Block Flow Diagram – Concentrator ................................................................... 243
17.3 Process Description – Concentrator ................................................................................. 245

Document Number
Revision
Page
Rev Date
G4932-RPT-01 0 08 Jan 2021 5
Talon Metals Corp. – Preliminary Economic Assessment #3 on the Tamarack North Project
17.4 Energy, Water, and Process Materials Consumption - Concentrator ............................... 248
17.5 Major Equipment List - Concentrator ................................................................................ 250
17.6 Key Process Design Criteria – Hydrometallurgical Plant for Ni Sulphate Production ...... 250
17.7 Process Block Flow Diagram – Hydrometallurgical Plant for Ni Sulphate Production ..... 252
17.8 Process Description – Hydrometallurgical Plant ............................................................... 254
17.9 Energy, Water, and Process Materials Consumption – Hydrometallurgical Plant ............ 256
17.10 Major Equipment List – Hydrometallurgical Plant ............................................................. 257
INFRASTRUCTURE ...................................................................................................... 259
18.1 Introduction ....................................................................................................................... 259
18.2 Site Access and Power ..................................................................................................... 259
18.3 Site Layout Considerations and Concept ......................................................................... 259
18.4 Buildings and Facilities ..................................................................................................... 261
18.5 Logistics ............................................................................................................................ 262
18.6 Co-disposed Filtered Tailings Facility (CFTF) .................................................................. 263
18.7 Tamarack North Project Preliminary Water Balance ........................................................ 276
MARKET STUDIES AND CONTRACTS ........................................................................ 279
19.1 Market Analysis ................................................................................................................. 279
19.2 Premium for Green NickelTM ............................................................................................. 283
19.3 Metal Prices ...................................................................................................................... 284
ENVIRONMENTAL STUDIES, PERMITTING & SOCIAL OR COMMUNITY IMPACT ... 286
20.1 Introduction ....................................................................................................................... 286
20.2 Environmental Studies – Summary of Results ................................................................. 286
20.3 Water Management for Operations and Post Mine Closure ............................................. 292
20.4 Project Permitting Requirements ...................................................................................... 293
20.5 Permitting Requirements .................................................................................................. 295
20.6 Social or Community Engagement ................................................................................... 302
CAPITAL AND OPERATING COSTS ............................................................................ 304
21.1 Capital Costs ..................................................................................................................... 304
21.2 Operating Costs ................................................................................................................ 308
ECONOMIC ANALYSIS ................................................................................................. 313
22.1 Basis of Evaluation ........................................................................................................... 313
22.2 Economic, Taxation and Royalty Assumptions ................................................................. 314
22.3 Technical Assumptions ..................................................................................................... 317

Document Number
Revision
Page
Rev Date
G4932-RPT-01 0 08 Jan 2021 6
Talon Metals Corp. – Preliminary Economic Assessment #3 on the Tamarack North Project
22.4 Sensitivity and Risk Analysis ............................................................................................ 333
ADJACENT PROPERTIES ............................................................................................ 337
OTHER RELEVANT DATA AND INFORMATION ......................................................... 338
INTERPRETATION AND CONCLUSIONS .................................................................... 339
25.1 Mineral Resource .............................................................................................................. 339
25.2 Mining Methods ................................................................................................................. 339
25.3 Mineral Processing and Metallurgical Testing .................................................................. 340
25.4 Recovery Methods ............................................................................................................ 341
25.5 Infrastructure ..................................................................................................................... 341
25.6 Environmental Considerations and Permitting .................................................................. 342
25.7 Economics......................................................................................................................... 342
RECOMMENDATIONS .................................................................................................. 343
REFERENCES ............................................................................................................... 346
CERTIFICATES OF QUALIFIED PERSONS – NI 43-101 .............................................. 349

Document Number
Revision
Page
Rev Date
G4932-RPT-01 0 08 Jan 2021 7
Talon Metals Corp. – Preliminary Economic Assessment #3 on the Tamarack North Project
EXECUTIVE SUMMARY
1.1 Introduction
The Tamarack Project, located in Minnesota, USA, comprises the Tamarack North Project
and the Tamarack South Project (refer Figure 7-5).
The Tamarack Project is currently 17.56% owned by Talon Metals Corp. (Talon), and
82.44% owned by Kennecott Exploration Company (Kennecott) and is operated by Talon.
On November 7, 2018, Talon and Kennecott entered into an agreement (the 2018 Tamarack
Earn-in Agreement) pursuant to which Talon has the right, subject to certain funding and
reporting obligations, to increase its interest in the Tamarack Project to a maximum 60%
interest. The 2018 Tamarack Earn-in Agreement came into effect on March 31, 2019 (the
Kennecott Agreement Effective Date) and Talon is now the operator of the Tamarack
Project.
Talon has commissioned a team of consultants to complete a Preliminary Economic
Assessment (PEA) in accordance with National Instrument 43-101 (NI 43-101) guidelines
for the Tamarack North Project.
The following consultants contributed to completing the component PEA sections:
• DRA Americas Inc. (DRA): Mining methods, hydrometallurgical processing, project
infrastructure, market studies and contracts, capital and operating costs, and economic
analysis;
• Foth Infrastructure & Environment (Foth): Environmental studies, permitting, and
social or community impacts;
• Golder Associates Ltd. (Golder): Property description and location, accessibility,
climate and physiography, history, geological setting and mineralization, deposit types,
exploration, drilling, sample preparation, data verification, adjacent properties, and
mineral resource estimate;
• Metpro Management Inc. (Metpro): Mineral processing, metallurgical testing, and
recovery methods;
• Paterson & Cooke Canada Inc. (Paterson & Cooke): Paste backfill methods;
• SLR Consulting (Canada) Ltd. (SLR): Tailings/waste rock co-disposal methods.

Document Number
Revision
Page
Rev Date
G4932-RPT-01 0 08 Jan 2021 8
Talon Metals Corp. – Preliminary Economic Assessment #3 on the Tamarack North Project
1.2 Location and Ownership
The Tamarack Project is located in north-central Minnesota, approximately 89 kilometres
(km) (55 miles) west (W) of Duluth and 210 km (130 miles) north (N) of Minneapolis, in Aitkin
County. The Tamarack North Project, which this report represents, covers approximately
20,348 acres. The town of Tamarack (population 88, 2016 US Census Bureau) lies within
the boundaries of the Tamarack Project (though away from the known mineralization) at an
elevation of 386 metres (m) (1,266 feet (ft)) above sea level. The project area is
characterized by farms, plantations, wetlands, and forested areas.
On June 25, 2014, Talon’s wholly-owned, indirect subsidiary, Talon Nickel (USA) LLC
(collectively, Talon), entered into an exploration and option agreement (the 2014 Tamarack
Earn-in Agreement) with Kennecott (part of the Rio Tinto Group), pursuant to which Talon,
subject to certain funding conditions, received the right to acquire a 30% interest in the
Tamarack Project.
On November 25, 2015, Kennecott and Talon amended the 2014 Tamarack Earn-in
Agreement to provide that, subject to certain funding conditions, Talon would earn an
18.45% interest in the Tamarack Project.
On January 11, 2018, Talon and Kennecott entered into a mining venture agreement (the
Original MVA). Pursuant to the Original MVA, Talon elected not to financially participate in
the 2018 winter exploration program at the Tamarack Project. Consequently, Talon’s interest
in the Tamarack Project was diluted below 18.45% to 17.56%.
On November 7, 2018, Talon and Kennecott entered into the 2018 Tamarack Earn-in
Agreement pursuant to which Talon has the right to increase its interest in the Tamarack
Project to a maximum 60% interest. The Tamarack Earn-in Agreement came into effect on
the Kennecott Agreement Effective Date.
Pursuant to the 2018 Tamarack Earn-in Agreement, Talon has taken over operatorship of
the Tamarack Project and has the right to initially increase its interest in the Tamarack
Project to 51% by:
• The payment of US$6M in cash to Kennecott – this has been completed;
• The issuance of US$1.5M worth of common shares in Talon to Kennecott – this has
been completed;

Document Number
Revision
Page
Rev Date
G4932-RPT-01 0 08 Jan 2021 9
Talon Metals Corp. – Preliminary Economic Assessment #3 on the Tamarack North Project
• Within three years of the Kennecott Agreement Effective Date, Talon either spending
US$10M in exploration expenditures on the Tamarack Project, or delivering a Pre-
Feasibility Study (PFS) in accordance with NI 43-101, whichever comes first; and
• Also within three years of the Kennecott Agreement Effective Date, Talon paying
Kennecott the additional sum in cash of US$5M.
• Provided Talon earned a 51% interest in the Tamarack Project, Talon will then have the
right to further increase its interest in the Tamarack Project to 60% by:
o Completing a Feasibility Study on the Tamarack Project within seven years of the
Kennecott Agreement Effective Date; and
o Paying Kennecott the additional sum of US$10M in cash on or before the seventh
anniversary date of the Kennecott Agreement Effective Date.
Upon Talon earning a 60% interest in the Tamarack Project, the parties have agreed to enter
into a new mining venture agreement (the New MVA) under which Talon would assume the
role of Manager of the Tamarack Project, and the parties would each be required to fund
their pro rata share of expenditures in respect of the Tamarack Project or be diluted.
Section 4 of this PEA contains further details regarding Talon’s interest in the Tamarack
Project.
1.3 Environmental Considerations and Permitting
The Tamarack North Project will be subject to state and federal environmental review and
permitting processes, which are described in Section 20. Since the review and permitting
processes have an influence on environmental considerations, Section 20 addresses
associated topics, including:
• Summary of results of baseline studies and anticipated additional studies needed for
environmental review and permitting;
• Plans for mine waste management, site monitoring, and water management;
• Social and community relations; and,
• Mine closure.
Throughout the regulatory approval processes, Talon is required to demonstrate that the
Tamarack North Project can avoid or mitigate potential environmental impacts in accordance

Document Number
Revision
Page
Rev Date
G4932-RPT-01 0 08 Jan 2021 10
Talon Metals Corp. – Preliminary Economic Assessment #3 on the Tamarack North Project
with regulatory requirements and stakeholder considerations. That demonstration relies in
part on the baseline studies and additional studies and analyses noted in Section 20.
Baseline studies initiated in 2006 focus on hydrology and wetlands in the region. A
description of baseline studies conducted to date is provided in Table 20-1. The studies have
not identified any environmental issue that could materially impact the ability to mine the
resource. Substantial baseline data collection and studies have been completed to date,
focusing on hydrology in the region and wetland habitat at the site.
On-going environmental baseline studies have (and continue) to document the following:
• Hydrogeological understanding of the Tamarack North Project area: Stratigraphy and
geology in the project area are important to characterize, especially as they relate to
water flows and interactions between surface and groundwater.
• Hydrological understanding of the watershed: Surface water monitoring stations have
been located on significant water bodies, with data collection focusing on quantity
(flows, levels) and water quality (field parameters and laboratory analytes). The data
have been collected quarterly since 2006 and data collection continues.
• Geochemistry: Understanding the geochemistry of the ore and waste rock is critical to
water management and environmental impact assessment. Geochemical testing has
identified and confirmed mineralogical understanding of the ore body. Additional
geochemical testing will be needed to optimize methods of water management, waste
management, mine backfill approaches, and reclamation alternatives.
• Wetlands, vegetation, and potential presence of rare, threatened, and endangered
(RTE) plant species: Studies supporting exploration activities and general infrastructure
siting are summarized in Section 20. These resources at the site are consistent with the
surrounding region. Vegetative communities include Pine Plantation, Northern Wet-
Mesic-Hardwood Forest, and Northern Alder Swamp. Wetlands, lakes, and streams are
common in the area, which is rural with agricultural and natural areas. Studies have thus
far not identified any listed vegetation species.
As the project moves forward in design and plan for operations, additional environmental
studies will be needed. These studies will support the environmental impact analysis specific
to the proposed facility. Anticipated future studies include:

Document Number
Revision
Page
Rev Date
G4932-RPT-01 0 08 Jan 2021 11
Talon Metals Corp. – Preliminary Economic Assessment #3 on the Tamarack North Project
• Geology and Minerals – a report describing the resource, host rock, and regional
geology. Building on the exploration drilling data, geologic characterization, geophysical
testing, mineralogical characterization, and geotechnical characterization of the
resource, host rock, and intrusive complex. This information will assist in the
underground mine stability analysis and the analysis of groundwater flow in the mine
during and after operations.
• Geochemistry and Waste Characterization – performed in accordance with Minnesota
rules, with guidance from Minnesota Department of Natural Resources (MDNR).
• Additional hydrological studies to build on current data. This might include additional
analytics and surface water monitoring locations and additional groundwater data to
characterize the Quaternary system and Precambrian bedrock. Wetlands hydrologic
study may also be needed to understand the groundwater surface water interactions.
• Wetlands – formal delineations have a five-year validity. Wetland assessments in hand
will need updating. Once the site plan has been confirmed, a Level III assessment will
be conducted to support permitting and environmental impact assessment.
• Vegetation, biota, and habitat studies – these studies will likely need updating and
revalidation in and around the site area with emphasis on identifying potential listed
species. This includes examining terrestrial and aquatic biota.
• Cultural resource studies – tribal, archaeological, and historical resources at the site
and in the area will be documented and evaluated according to state and federal
requirements. This topic is of great interest to stakeholders including tribes and the local
communities. Social and community outreach is currently preliminary and will be
developed to engage interested stakeholders.
• Aesthetic resource studies – visual and noise resources will be examined for potential
impact on wildlife, the surrounding communities, and the activities common in the area.
Mine waste including tailings and waste rock will be managed in engineered facilities,
minimizing potential environmental impacts in accordance with state and federal regulations.
An innovative co-disposed filtered tailings facility (CFTF) will manage the low-sulphide (LS)
tailings using waste rock for construction and structural stability. The tailings will have low
water content, thereby minimizing water management issues and facilitating closure.
Materials with the potential to react and produce contaminants will be managed in areas

Document Number
Revision
Page
Rev Date
G4932-RPT-01 0 08 Jan 2021 12
Talon Metals Corp. – Preliminary Economic Assessment #3 on the Tamarack North Project
where drainage water will be collected and either used in the operation or treated before
discharging to the environment. In concept, high-sulphide (HS) tailings and a portion of the
LS tailings will be blended with cement and backfilled to the underground mine excavation,
reducing the capacity needs of the CFTF and preventing subsidence.
A rigorous monitoring program will be implemented, building on baseline data. Once the
facility is constructed, monitoring will demonstrate permit compliance and identify
unanticipated impacts. Monitoring data will be submitted to the agencies regularly and will
be accessible to the public, providing transparency.
Water management during operations and post closure will be accomplished in accordance
with requirements using the most current tools and industry practices. Managing water on
site, conserving mill water, and treating excess water to stringent standards prior to
discharge are components of water management. During final reclamation, the CFTF will be
fitted with an engineered cover system to prevent potential migration of contaminants into
the surface and groundwater systems. Backfilling the mine will be completed to durably
prevent migration of contaminants.
The project will undergo an environmental review, likely resulting in preparation of a federal-
state Environmental Impact Statement (EIS). Significant permits and approvals will be
needed including a Permit to Mine, Section 404 Wetland Permit, an Air Permit, a National
Pollutant Discharge Elimination System (NPDES) permit, and others listed in Table 20-2.
Project permit applications will be prepared once the project design and operation basis
have been established. EIS development and permitting include closure plans and analyses
to assure satisfactory long-term environmental conditions. A detailed closure plan will be
developed in future studies.
1.4 Geology and Mineralization
The Tamarack Intrusive Complex (TIC) is an ultramafic to mafic intrusive complex that hosts
Ni-Cu-Co sulphide mineralization with associated platinum (Pt), palladium (Pd) (PGEs) and
gold (Au). The TIC is a multi-magmatic phase intrusion that consists of a minimum of two
pulses: The fine grained ortho-cumulate olivine (FGO) and the coarse-grained ortho-
cumulative (CGO) intrusion of the TIC (dated at 1105 Ma+/-1.2 Ma, Goldner 2011). The FGO
and CGO intrusions are related to the early evolution of the approximately 1.1 Ga

Document Number
Revision
Page
Rev Date
G4932-RPT-01 0 08 Jan 2021 13
Talon Metals Corp. – Preliminary Economic Assessment #3 on the Tamarack North Project
Midcontinent Rift (MCR) and have intruded into slates and greywackes of the Thomson
Formation of the Animikie Group, which formed as a foreland basin during the
Paleoproterozoic Penokean Orogen (approximately 1.85 Ga, Goldner 2011). The TIC is
completely buried beneath approximately 35 m to 55 m of Quaternary age glacial and fluvial
sediments. The TIC is consistent with other earlier intrusions associated with the MCR that
are often characterized by more primitive melts.
The geometry of the TIC, as outlined by a well-defined aeromagnetic anomaly, consists of a
curved, elongated intrusion striking north-south (NS) to southeast (SE) over 18 km. The
configuration has been likened to a tadpole shape with its elongated, northern tail up to 1
km wide and large, 4 km wide, ovoid shaped body in the south (S) (Figure 7-5). The northern
portion of the TIC (the Tamarack North Project), which hosts the currently defined mineral
resource and identified exploration targets, is over 7 km long and is the focus of this PEA.
The nickel (Ni)-copper (Cu)-cobalt (Co) sulphide mineralization with associated PGEs and
Au formed as the result of segregation and concentration of liquid sulphide from mafic or
ultramafic magma and the partitioning of chalcophile elements into the sulphide from the
silica melt (Naldrett, 1999). The various mineralized zones at the Tamarack North Project
occur within different host lithologies, exhibit different types of mineralization styles, and
display varying sulphide concentrations and tenors. These mineralized zones range from
massive sulphides hosted by altered sediments in the massive sulphide unit (MSU), to net
textured and disseminated sulphide mineralization hosted by the CGO in the semi-massive
sulphide unit (SMSU), to a more predominantly disseminated sulphide mineralization as well
as layers of net textured sulphide mineralization, in the 138 Zone (Table 1-1). Mineralization
in the 138 Zone, where interlayered disseminated and net textured mineralization occurs, is
also referred to as mixed zone (MZ) mineralization. All these mineralization types are typical
of many sulphide ore bodies around the world. The current known mineral zones of the
Tamarack North Project (SMSU, MSU and 138 Zone) that are the basis of the mineral
resource estimate in this PEA are referred to collectively as the “Tamarack Zone”. Also
located within the Tamarack North Project are currently, four lesser-defined mineral zones,
namely the 480 Zone, 221 Zone, 164 Zone and the CGO Bend Zone.

Document Number
Revision
Page
Rev Date
G4932-RPT-01 0 08 Jan 2021 14
Talon Metals Corp. – Preliminary Economic Assessment #3 on the Tamarack North Project
Table 1-1: Key Geological and Mineralization Relationships of the Tamarack North Project
Area Mineral Zone Host Lithology Project Specific Lithology
Mineralization Type
Tamarack Zone
SMSU Feldspathic Peridotite CGO Net textured and disseminated sulphides
MSU Meta-Sediments/ Peridotite (basal FGO mineralization)
Sediments Massive sulphides
138 Zone Peridotite and Feldspathic Peridotite
MZ/FGO Disseminated and net textured sulphides
CGO Bend
Feldspathic Peridotite CGO Disseminated sulphides
Peridotite footwall (basal FGO mineralization)
FGO Disseminated sulphides, MMS and MSU
Other
221 Zone Feldspathic Peridotite CGO Disseminated sulphides with ripped up clasts of massive sulphides
480 Zone Peridotite FGO Disseminated sulphides
164 Zone Peridotite FGO Blebby sulphides, sulphides veins
1.5 Exploration Programs
The TIC and associated mineralization were discovered as part of a regional program by
Kennecott initiated in 1991. The focus on Ni and Cu sulphide mineralization was intensified
in 1999 based on a model proposed by Dr. A. J. Naldrett of the potential for smaller feeder
conduits associated with continental rift volcanism and mafic intrusions to host Ni sulphide
deposits similar to Norilsk and Voisey’s Bay.
Disseminated mineralization was first intersected at the Tamarack Project in 2002, and the
first significant mineralization of massive and net-textured sulphides was intersected in 2008
at the Tamarack North Project.
To date, exploration has included a wide range of geophysical surveys including:
• Airborne magnetics and electromagnetics (AEM) (fixed wing and helicopter based);
• Ground magnetics;
• Surface electromagnetics (EM);
• Surface gravity;

Document Number
Revision
Page
Rev Date
G4932-RPT-01 0 08 Jan 2021 15
Talon Metals Corp. – Preliminary Economic Assessment #3 on the Tamarack North Project
• Magnetotellurics (MT);
• Induced polarization (IP);
• Seismic;
• Mise-à-la-masse (MALM);
• Magnetometric resistivity (MMR);
• Downhole electromagnetics (DHEM).
Kennecott conducted extensive drilling at the Tamarack North Project since 2002. This
drilling has comprised 260 diamond drill holes totalling 112,394.22 m with holes between
33.5 m and over 1,224 m depth for an average hole depth of 428 m.
1.6 Sample Preparation, Quality Assurance (QA)/ Quality Control (QC) and Security
The qualified person (QP) of the mineral resource estimate reviewed Kennecott’s sampling
and QA/QC protocols along with the chain of custody of samples. Kennecott samples core
continuously through the mineralization, and their sampling and logging procedures are
consistent with industry standards and the assay methods are appropriate for the base metal
sulphide mineralization found at the Tamarack North Project.
Their QA/QC program is based on insertion of certified reference materials (CRM), including
a variety of standards, blanks and duplicate samples, used to monitor the precision and
accuracy of their primary assay lab, and to prevent inaccurate data from being accepted into
their assay database. The Kennecott QA/QC protocol is consistent with industry best
practises.
Kennecott uses a system of metal seals to secure pails used to ship samples from the core
shack to the assay lab ensuring that they have not been tampered with. Samples are
prepared and stored in a secure facility and are monitored each step of the way to the lab.
It is the QP’s opinion that the sampling process is representative of the mineralization at
Tamarack North and that the sample preparation and QA/CQ procedures used, and the
sample chain of custody were found to be consistent with Canadian Institute of Mining,
Metallurgy, and Petroleum (CIM) Mineral Exploration Best Practice Guidelines (November
2018).

Document Number
Revision
Page
Rev Date
G4932-RPT-01 0 08 Jan 2021 16
Talon Metals Corp. – Preliminary Economic Assessment #3 on the Tamarack North Project
1.7 Data Validation
Golder compared recent assay data (2017, 2020) from the Kennecott database to the
original assay certificates from ALS Chemex for the entire sample population used for
resource estimation. Minor errors were identified during this review that were found to not
be material to the mineral resource estimate.
During the QP site visit in 2014, Brian Thomas of Golder, surveyed four drill hole collars and
then compared the coordinates to those provided by Kennecott. All collars were found to be
consistent with the Kennecott collar coordinates, within the accuracy of the handheld global
positioning system (GPS).
Golder, in 2014, conducted verification sampling of drill core from each of the three mineral
domains. A total of nine samples were taken along with three additional CRM samples,
including two standards and one blank. Assay values from the verification sample program
were consistent with results obtained by Kennecott.
There have been no material changes to the drilling, logging, sampling, or chain of custody
procedures since the 2014 site visit; therefore, it is the QP’s opinion that the Tamarack North
Project drill hole database has been prepared in accordance to CIM Estimation of mineral
resources and Mineral Reserves Best Practise Guidelines (November 2018) and is of
suitable quality to support the mineral resource estimate in this PEA.
1.8 Mineral Processing and Metallurgical Testing
The flotation flowsheet and conditions that were established in the 2016/2017 program were
further optimized using a life-of-mine (LOM) composite that represented the entire 8.02 Mt
of mineralized material that was reported in the March 2020 PEA. The head grade of this
LOM composite was 1.69% Ni and 0.95% Cu. The primary focus of the program was to
produce Ni and Cu concentrates that provide marketing optionality. The program considered
three possible scenarios for the flotation concentrates:
• The Ni Concentrate Scenario would include shipping both Ni and Cu concentrates to
smelters for processing.

Document Number
Revision
Page
Rev Date
G4932-RPT-01 0 08 Jan 2021 17
Talon Metals Corp. – Preliminary Economic Assessment #3 on the Tamarack North Project
• The Ni Powder Scenario would include shipping Cu concentrate to a smelter for
processing, and transferring Ni concentrate to a co-located facility for production of Ni
powder.
• The Ni Sulphate Scenario would still ship the Cu concentrate to smelters, but the Ni
concentrate would be converted to Ni sulphates in a hydrometallurgical facility.
The flotation program on the LOM composite aimed to produce a Ni concentrate of at least
10.5% Ni to ensure marketability to a smelter. The simplified flowsheet that was developed
for the March 2020 PEA was confirmed. The flowsheet comprises a bulk rougher, followed
by bulk cleaning of the bulk rougher concentrate and Cu/Ni separation. A desulphurization
stage is treating the bulk rougher tailings to produce high-sulphur and low-sulphur tailings
streams. The high-sulphur tailings will be placed underground in the form of paste backfill.
The metallurgical projections that were developed for the March 2020 PEA were validated
and adjustments were made for the LOM composite to take into account the addition of the
138 Zone mineralization, which displays a distinctively different metallurgical response.
A locked cycle flotation test (LCT) was completed on the LOM composite and the results are
presented in Table 1-2.
Table 1-2: Simplified Circuit Mass Balance
A scoping level hydrometallurgical program was completed to evaluate the amenability of
the Ni concentrate to leaching and downstream processing. The program included pressure
oxidation (POX) and Albion leach tests, followed by neuralization tests to remove most
impurities. Metal extraction rates in the POX tests were over 99% for Ni and Co and 88% for
Cu. The extraction values were similar for the Albion test at 97% to 99%. Ni and Co losses
in the neutralization stages were minimal at 1.1% and 0.9%, respectively. Most of the Cu
was recovered into product streams that would be combined with the Cu flotation
Weight
% Cu Ni S Fe MgO Cu Ni S Fe MgO
Cu Conc 2.2 29.9 1.13 32.5 32.5 0.80 71.6 1.6 12.9 4.8 0.1
Ni Conc 11.9 1.22 10.7 28.6 40.6 4.66 15.9 83.2 61.8 32.8 2.4
Bulk 1st Clnr Scav Tails 9.3 0.40 0.74 6.42 17.5 22.7 4.0 4.5 10.8 11.0 9.0
Bulk Scavenger Tails 76.6 0.10 0.21 1.05 10.0 27.1 8.5 10.7 14.6 51.4 88.6
Combined 100.0 0.92 1.53 5.54 14.8 23.4 100.0 100.0 100.0 100.0 100.0
Assays, % % DistributionProduct

Document Number
Revision
Page
Rev Date
G4932-RPT-01 0 08 Jan 2021 18
Talon Metals Corp. – Preliminary Economic Assessment #3 on the Tamarack North Project
concentrate to maximize revenue. Downstream tests will continue for the next 12 months to
produce a sample of a battery grade Ni sulphate.
1.9 Mineral Resource Estimate
Caution to readers: In this Section, all estimates and descriptions related to mineral
resource estimates are forward-looking information. There are many material factors that
could cause actual results to differ from the conclusions, forecasts or projections set out in
this item. Some of the material factors include differences from the assumptions regarding
the following: estimates of cut-off grade (COG) and geological continuity at the selected cut-
off, metallurgical recovery, commodity prices or product value, mining and processing
methods and general and administrative (G&A) costs. The material factors or assumptions
that were applied in drawing the conclusions, forecasts and projections set forth in this Item
are summarized in other Items of this report.
This resource estimate has been prepared by Mr. Brian Thomas (B.Sc, P.Geo), Senior
Resource Geologist at Golder and is summarized in Table 1-3 below. The effective date of
the resource estimate is January 8, 2021. Mr. Brian Thomas is an independent QP pursuant
to NI 43-101.
Table 1-3: Tamarack North Project Mineral Resource Estimate (January 8, 2021)
Domain Classification %Ni
Cut-Off Tonnes
(000) Ni
(%) Cu (%)
Co (%)
Pt (g/t)
Pd (g/t)
Au (g/t)
NiEq (%)
Upper SMSU Indicated Resource 0.5 1,462 1.32 0.78 0.04 0.17 0.11 0.11 1.81
Lower SMSU Indicated Resource 0.5 2,340 2.08 1.10 0.05 0.55 0.34 0.25 2.87
MSU Indicated Resource 0.5 124 5.72 2.36 0.12 0.60 0.46 0.23 7.23
Total Indicated Resource 0.5 3,926 1.91 1.02 0.05 0.41 0.26 0.20 2.62
Upper SMSU Inferred Resource 0.5 2,652 0.76 0.47 0.02 0.25 0.14 0.12 1.10
Lower SMSU Inferred Resource 0.5 115 0.86 0.51 0.02 0.57 0.36 0.24 1.34
MSU Inferred Resource 0.5 443 5.93 2.52 0.12 0.70 0.52 0.26 7.53
138 Inferred Resource 0.5 3,953 0.82 0.63 0.02 0.21 0.12 0.14 1.21
Total Inferred Resource 0.5 7,163 1.11 0.68 0.03 0.26 0.16 0.14 1.57

Document Number
Revision
Page
Rev Date
G4932-RPT-01 0 08 Jan 2021 19
Talon Metals Corp. – Preliminary Economic Assessment #3 on the Tamarack North Project
- All resources reported at a 0.5% Ni cut-off.
- No modifying factors have been applied to the estimates.
- Tonnage estimates are rounded to the nearest 1,000 tonnes.
- Metallurgical recovery factored in to the reporting cut-off.
- Where used in this Mineral Resource estimate, NiEq% = Ni%+ Cu% x $3.00/$8.00 + Co% x $25.00/$8.00 +
Pt [g/t]/31.103 x $1,000/$8.00/22.04 + Pd [g/t]/31.103 x $1,000/$8.00/22.04 + Au [g/t]/31.103 x
$1,300/$8.00/22.04. No adjustments were made for recovery or payability in the calculation of NiEq.
The mineral resources are derived from a Datamine-constructed block model (block sizes =
5 m by 5 m by 5 m for the SMSU and the 138 Zone; with 2.5 m x 2.5 m x 2.5 m sub-blocks
for the MSU) of three mineral domains and are reported above a Ni cut-off of 0.5%. All
domains were “unfolded” and had top cuts applied to restrict outlier values (Pt, Pd and Au).
The three domains (Figure 14-1) utilized either Ordinary Kriging (OK) or inverse distance
cubed (ID3) methodology to interpolate grades (Ni, Cu, Co, Pt, Pd and Au) from 1.5 m
(SMSU, 138) and 1.0 m (MSU) composited drill holes. Specific Gravity (SG) estimates were
based on laboratory measurements taken from whole core and where absent, regression
formulas. The resources reported are based on a “blocks above cut-off” basis and were then
examined visually by Golder and found to have good continuity.
The QP is unaware of any known environmental, permitting, legal, title, taxation, socio-
economic, marketing, political or any other potential factors that could materially impact the
Tamarack North Project mineral resource estimate provided in this PEA.
The mineral resource estimate may be materially impacted by the following:
• Changes in the break-even COG, as a result of changes in mining costs, processing
recoveries, or metal prices;
• Changes in geological knowledge/interpretation, as a result of new exploration data.
1.10 Mining Methods
The underground mine will use underground mining methods with the objective of utilizing
the best available technologies (BATs) that are as efficient, practical, and as environmentally
responsible as possible. The mining methods and infrastructure for both the Ni Concentrate
and Ni Sulphate Scenarios will be the same. Both bulk and selective mining methods (long
hole stoping and drift and fill respectively) will be used. All stopes will be filled with a blend
of development waste rock, where possible and paste backfill. Paste fill will be produced in

Document Number
Revision
Page
Rev Date
G4932-RPT-01 0 08 Jan 2021 20
Talon Metals Corp. – Preliminary Economic Assessment #3 on the Tamarack North Project
a dedicated paste plant on surface adjacent to the mill and comprise 100% of the HS tailings
as well as a portion of the LS tailings.
The primary access for personnel and materials will be a decline ramp from surface, which
will also serve as the main fresh air intake for the mine and the main conduit for mine
services. A multi-purpose shaft will be driven in close proximity to the mill, which will be the
main exhaust for the mine. Additionally, it will house a vertical conveyor, which will serve as
the primary materials handling system, secondary egress and redundant services, where
required.
The underground mine will use a full battery/electric fleet containing no diesel powered
equipment. Lateral development, including the main decline, and drift and fill mining will be
predominantly done using a continuous miner. A jumbo will be utilized for traditional drill/blast
mining, where the ground conditions and logistics prohibit the continuous miner from mining
effectively.
The proposed mine plan includes the combined production from of each the mineral domains
in the resource model (i.e., 138, MSU, Upper SMSU and Lower SMSU). The planned
production rate is approximately 3,600 tonnes per day (tpd) (1.3 million tonnes per annum
(Mtpa)). A summary of the mine plan is shown below:
Figure 1-1: Mine Production Plan

Document Number
Revision
Page
Rev Date
G4932-RPT-01 0 08 Jan 2021 21
Talon Metals Corp. – Preliminary Economic Assessment #3 on the Tamarack North Project
Major infrastructure including maintenance and storage will be located on surface. An
allowance for minor maintenance and temporary storage underground has been made in
the mine plan and will be centralized in close proximity to the main ramp.
1.11 Recovery Methods
The process plant design is based on an average daily mill feed rate of 3,600 tpd for all three
scenarios. The average LOM head grade is 1.34% Ni and 0.74% Cu. The plant feed
characteristics and metallurgical performance are summarized in Table 1-4.
Table 1-4: Plant Feed Characteristics and Metallurgical Performance
Criteria Units Value Source
Expected Range
Design
Solids SG t/m3 2.60 – 3.75 2.90 D
Run of Mine (ROM) Bulk Density t/m3 1.60 – 2.00 1.80 B
LOM Mill Ni Head Grade % Ni 0.52 – 6.03 1.34 D
LOM Mill Cu Head Grade % Cu 0.24 – 2.41 0.74 D
Mill Treatment Capacity ktpa 1,314 C/D
Ni Recovery to Ni Concentrate % 81.5 E/C
Ni Concentrate Grade % Ni 10.2 E/C
Ni Concentrate Production ktpa 141.9 E/C
Overall Cu Recovery % 84.7 E/C
Cu Recovery to Cu Concentrate % 69.3 E/C
Cu Concentrate Grade % Cu 28.5 E/C
Cu Concentrate Production ktpa 23.6 E/C
The metallurgical process consists of bulk rougher followed by two stages of cleaning of the
rougher concentrate. The 2nd cleaner concentrate is subjected to Cu/Ni separation. The
process generates separate Cu and Ni concentrates, which will be shipped to different
smelters via rail in the form of wet filter cake for the Ni Concentrate Scenario.
For the Ni Sulphate and Ni Powder Scenarios, only the Cu concentrate is shipped to a
smelter. For the Ni Sulphate Scenario, the Ni concentrate is subjected to hydrometallurgical
treatment comprising POX leach, neutralization, Cu removal, Ni/Co solvent extraction (SX),
Document Number
Revision
Page
Rev Date
G4932-RPT-01 0 08 Jan 2021 22
Talon Metals Corp. – Preliminary Economic Assessment #3 on the Tamarack North Project
Co SX, and magnesium (Mg) removal. For the Ni Powder Scenario, the Ni concentrate is
transferred to a co-located facility for the production of Ni powder.
The bulk rougher tailings are treated in a desulphurization stage to produce a low-mass HS
stream and high-mass non-acid-generating (NAG) tailings. In concept, HS tailings will be
placed underground in form of cemented paste backfill together with a portion of the LS
tailings. The balance of the LS tailings will be placed in a CFTF. During the start of the
mining activities, minimal HS tailings may report to the CFTF when voids are not available.
In such situations, HS tailings will be distributed within LS tailings and covered in the CFTF.
The equipment that was selected for the processing plant represents well established
technology, such as a jaw and cone crusher, ball mill, tank flotation cells, and stirred media
mills for the concentrator. The hydrometallurgical circuit equipment has also been used in
numerous commercial operations and includes equipment such as POX autoclaves, mixing
tanks, SX mixers and settlers, thickeners, and belt filters. Initial dewatering is generally
performed in high-rate thickeners followed by filter presses or belt filters.
The concentrator plant will employ a standard reagent suite consisting of sulphide collectors
sodium isopropyl xanthate (SIPX) and potassium amyl xanthate (PAX), frother methyl
isobutyl carbinol (MIBC), gangue depressant Depramin C, and pH modifier lime. Flocculants
will be employed to assist in the dewatering of the concentrates and tailings streams.
The hydrometallurgical plant will also employ typical reagents such as oxygen, ferric
chloride, pH modifiers (limestone, lime), sodium hydrogen sulphide (NaHS), SX diluent and
extractant, and flocculants.
The total connected power for the concentrator is 9.8 MW, with 85% drawn. The total
connected power of the hydrometallurgical plant is 6.0 MW with 85% drawn. It is assumed
at this time that electrical power will be supplied through the electrical grid.
1.12 Project Infrastructure
The existing local transportation infrastructure is excellent. The site is accessible via an
existing road which connects to the Minnesota State highway network.
Document Number
Revision
Page
Rev Date
G4932-RPT-01 0 08 Jan 2021 23
Talon Metals Corp. – Preliminary Economic Assessment #3 on the Tamarack North Project
The active Burlington Northern Santa Fe (BNSF) Railway passes by the town of Tamarack
approximately 2.5 km S of the site layout area and connects to an extensive network of rail
lines throughout the United States (US) and Canada, including access to the Duluth port.
The city of Duluth lies on the westernmost point of Lake Superior, and provides worldwide
shipping access via the Great Lakes, St. Lawrence Seaway, and Atlantic Ocean shipping
routes. For the benefit of the Tamarack Project, Kennecott has secured surface rights
adjacent to the BNSF railway line to allow for the construction of a railroad siding near the
site layout area, should this be required.
The Great River Energy Transmission Line crosses through the Tamarack North Project.
The line connects through substations close to the nearby towns of Wright and Cromwell.
A conceptual site layout is shown in Section 18.3, comprising approximately 90 acres.
The CFTF will require approximately 75 acres. The remainder of the site layout area
comprises decline and ore bin, mine and mill services building, communication, and
concentrator facilities, hydromet plant, paste backfill plant temporary development rock
storage, water treatment plant, mine offices, warehouse, and workshops, vehicle washing
bays, security gatehouse and parking areas.
1.13 Capital Costs
The total estimated capital cost for either the Ni Powder Scenario or the Ni Concentrate
Scenario is US$394.99M of which US$315.80M is the initial cost required during the first
three years, including the first production year. The total estimated capital cost of the Ni
Sulphate Scenario is US$646.44M, of which US$552.61M is the initial cost required during
the first three years, including the first production year. The amounts include indirect costs
and contingency.
Document Number
Revision
Page
Rev Date
G4932-RPT-01 0 08 Jan 2021 24
Talon Metals Corp. – Preliminary Economic Assessment #3 on the Tamarack North Project
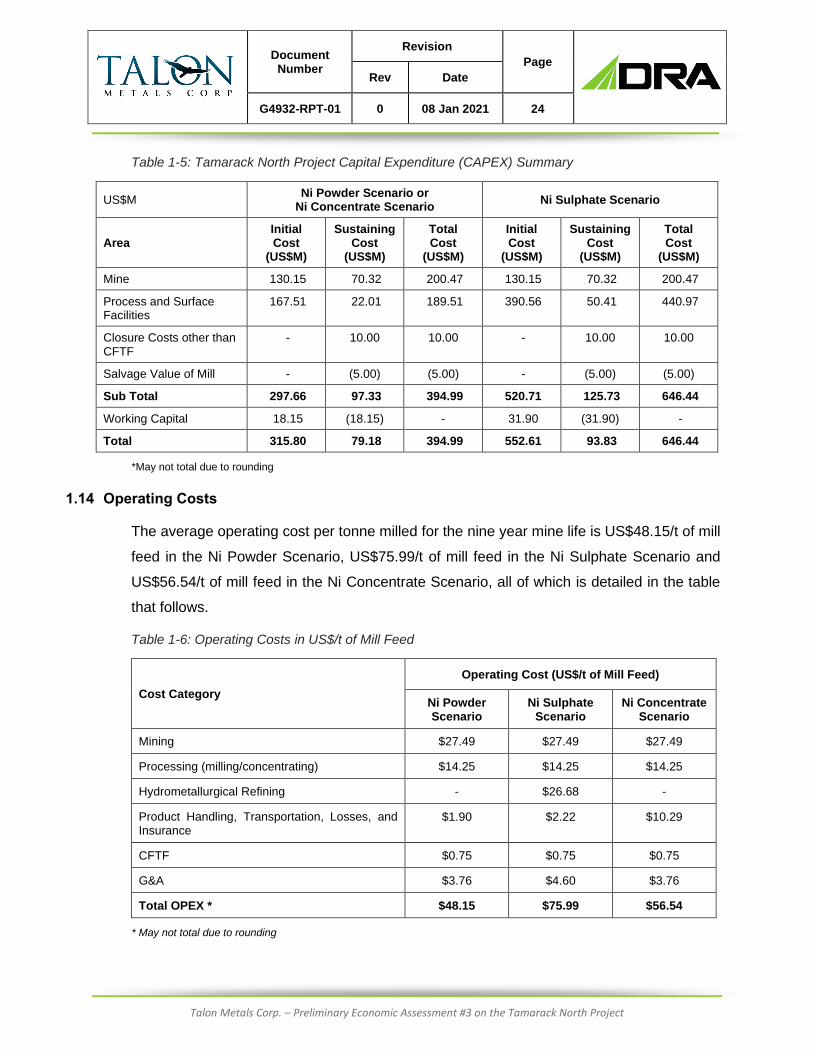
Table 1-5: Tamarack North Project Capital Expenditure (CAPEX) Summary
US$M Ni Powder Scenario or
Ni Concentrate Scenario Ni Sulphate Scenario
Area Initial Cost
(US$M)
Sustaining Cost
(US$M)
Total Cost
(US$M)
Initial Cost
(US$M)
Sustaining Cost
(US$M)
Total Cost
(US$M)
Mine 130.15 70.32 200.47 130.15 70.32 200.47
Process and Surface Facilities
167.51 22.01 189.51 390.56 50.41 440.97
Closure Costs other than CFTF
- 10.00 10.00 - 10.00 10.00
Salvage Value of Mill - (5.00) (5.00) - (5.00) (5.00)
Sub Total 297.66 97.33 394.99 520.71 125.73 646.44
Working Capital 18.15 (18.15) - 31.90 (31.90) -
Total 315.80 79.18 394.99 552.61 93.83 646.44
*May not total due to rounding
1.14 Operating Costs
The average operating cost per tonne milled for the nine year mine life is US$48.15/t of mill
feed in the Ni Powder Scenario, US$75.99/t of mill feed in the Ni Sulphate Scenario and
US$56.54/t of mill feed in the Ni Concentrate Scenario, all of which is detailed in the table
that follows.
Table 1-6: Operating Costs in US$/t of Mill Feed
Cost Category
Operating Cost (US$/t of Mill Feed)
Ni Powder Scenario
Ni Sulphate Scenario
Ni Concentrate Scenario
Mining $27.49 $27.49 $27.49
Processing (milling/concentrating) $14.25 $14.25 $14.25
Hydrometallurgical Refining - $26.68 -
Product Handling, Transportation, Losses, and Insurance
$1.90 $2.22 $10.29
CFTF $0.75 $0.75 $0.75
G&A $3.76 $4.60 $3.76
Total OPEX * $48.15 $75.99 $56.54
* May not total due to rounding

Document Number
Revision
Page
Rev Date
G4932-RPT-01 0 08 Jan 2021 25
Talon Metals Corp. – Preliminary Economic Assessment #3 on the Tamarack North Project
1.15 Economic Analysis
DRA has prepared its assessment of the Tamarack North Project on the basis of a financial
model, from which net present value (NPV), internal rate of return (IRR), payback and other
measures can be determined. NPV and IRR can assist in the determination of the economic
value and viability of a project.
The financial model is based on the results of the PEA which is preliminary in nature and
includes inferred resources that are considered too speculative geologically to have the
economic consideration applied to them that would enable them to be categorized as mineral
reserves, and there is no certainty that the preliminary economic assessment will be realized.
The objective of the study is to determine the viability of the proposed facilities to mine and
process the Tamarack North Project mineralized material. In order to do this, the cash flow
arising from the base case was forecast, enabling a computation of NPV and IRR. The
sensitivity of this NPV and IRR to changes in the base case assumptions is then examined.
Three scenarios, as detailed in Section 19 “Market Studies and Contracts”, were modelled:
Table 1-7: PEA Scenarios
Scenario Description
1 Nickel Powder Scenario Nickel concentrates produced at site and thereafter, used to produce refined nickel powder by a third party for the EV market
2 Nickel Sulphate Scenario Nickel concentrates from the project are refined at site in a hydrometallurgical process to produce nickel sulphates which are sold to the EV market
3 Nickel Concentrate Scenario Nickel concentrates produced at site are transported and sold to a smelter, who in turn transports it to a refinery to produce LME grade nickel primarily for the stainless steel market
“Base Case”, “Low” and “Incentive” metal prices are presented in Table 1-8 and are in “real”
(i.e. without inflation) dollars.

Document Number
Revision
Page
Rev Date
G4932-RPT-01 0 08 Jan 2021 26
Talon Metals Corp. – Preliminary Economic Assessment #3 on the Tamarack North Project
Table 1-8: Assumed Real Metal Prices
Unit Low Base Case Incentive
Ni US$/lb $6.75 $8.00 $9.50
Cu US$/lb $2.75 $3.00 $3.50
Co US$/lb 15.00 25.00 $30.00
Pt US$/oz $1,000 $1,000 $1,000
Pd US$/oz $1,000 $1,000 $1,000
Au US$/oz $1,300 $1,300 $1,300
The base case cash flow, in real dollars, was evaluated by determining the after-tax NPV at
a discount rate of 7.0% and the after-tax IRR as shown in Table 1-9. Results are also shown
at comparative discount rates of 8% and 10% and on a pre-tax basis.
Table 1-9: Base Case NPV for all Scenarios in Million US$ and IRR
After-tax NPV at a 7% discount rate, initial CAPEX including working capital and after-tax
IRR at base case pricing are illustrated in Figure 1-2 below.
Nickel Powder
Scenario
Nickel Sulphate
Scenario
Nickel Concentrate
Scenario
Pre-tax 7% 688 711 629
NPV in 8% 646 660 589
$ millions 10% 570 568 518
Pre-tax IRR 56.0% 37.6% 52.6%
After-tax 7% 567 569 520
NPV in 8% 530 524 485
$ millions 10% 463 443 423
After-tax IRR 48.3% 31.9% 45.6%
316 553 316
Initial CAPEX and
working capital in $
millions
Base Case Pricing
Discount
rate

Document Number
Revision
Page
Rev Date
G4932-RPT-01 0 08 Jan 2021 27
Talon Metals Corp. – Preliminary Economic Assessment #3 on the Tamarack North Project
Figure 1-2: After-tax NPV, Initial CAPEX and Working Capital, and After-tax IRR for all Scenarios
The sensitivities of the after-tax and pre-tax NPV and IRR as well as other measures for all
scenarios were tested using alternate metal price assumptions and discount rates as shown
in Table 1-10.
Table 1-10: After-Tax and Pre-tax NPV Sensitivity Analysis and Additional Metrics
1.16 Conclusions
The PEA demonstrates a high after-tax IRR, low All-in Sustaining Cost (AISC), low capital
intensity and a quick payback for the Tamarack Nickel Project. The PEA also clearly
567 569
520
316
553
316
48.3%
31.9%
45.6%
0%
5%
10%
15%
20%
25%
30%
35%
40%
45%
50%
$0
$100
$200
$300
$400
$500
$600
After-tax NPV, Initial CAPEX and After-tax IRR for Nickel Powder Scenario, Nickel Sulphate Scenario and Nickel Concentrate Scenario
After-tax NPV-7 (US$ millions) Initial CAPEX and working capital (US$ millions) After-tax IRR (RHS)
Low Base Incentive Low Base Incentive Low Base Incentive
Pre-tax NPV 7% 496 688 917 478 711 970 439 629 854
US$ millions 8% 463 646 863 438 660 906 409 589 803
10% 404 570 767 367 568 790 355 518 712
Pre-tax IRR 45.0% 56.0% 67.4% 29.2% 37.6% 45.7% 41.5% 52.6% 64.2%
After-tax NPV 7% 415 567 744 387 569 769 369 520 695
US$ millions 8% 386 530 698 351 524 714 342 485 651
10% 333 463 616 286 443 615 293 423 573
After-tax IRR 39.3% 48.3% 57.7% 25.1% 31.9% 38.6% 36.4% 45.6% 55.1%
64% 68% 70% 60% 64% 66% 60% 64% 67%
43% 50% 55% 34% 41% 47% 39% 46% 52%
1.6 1.4 1.2 2.2 1.8 1.6 1.7 1.4 1.2
1.8 1.5 1.3 2.4 2.1 1.8 1.9 1.6 1.4
Nickel Powder Scenario
Payback from start of production
(after-tax, undiscounted)
Nickel Sulphate ScenarioNickel Concentrate
Scenario
Discount
rate
Metal Price Case Metal Price Case Metal Price Case
EBITDA margin
EBIT margin
Payback from start of production
(pre-tax, undiscounted)

Document Number
Revision
Page
Rev Date
G4932-RPT-01 0 08 Jan 2021 28
Talon Metals Corp. – Preliminary Economic Assessment #3 on the Tamarack North Project
demonstrates that the Tamarack Nickel Project has the optionality to produce either Ni
sulphates or concentrates for refined Ni powders to be used for the EV market or a Ni
concentrate for the stainless steel market, with all contemplated scenarios having robust
economics.
1.17 Recommendations
During 2021 Talon should primarily focus on resource expansion and definition to collect
data required to complete a PFS and a Feasibility Study. It is recommended that between
25,000 and 30,000 m of drilling be completed for this purpose. Talon’s in-house team of
experienced specialists operate their own drilling and geophysical equipment efficiently and
at low cost. It is therefore believed that this is achievable during 2021.
Talon has a comprehensive geotechnical logging program in place and should therefore
continue with laboratory testing of drill core, collecting down hole data using acoustic
televiewer (ATV) and full wave sonic technology, as well as in-situ stress measurement
testing. Hydrological work should be conducted as appropriate for each level of study. It is
recommended to install multilevel vibrating wire piezometers in selected historical drill holes
and to conduct additional aquifer property testing within the glacial till and bedrock aquifers.
Geo-metallurgical testing programs should continue and should be based on the predicted
LOM feed. Ni concentrates produced from geo-metallurgical testing programs should be
used to complete the second phase of hydrometallurgical testing to produce Ni sulphates.
Ni concentrates should also be used to develop a flowsheet that produce both Ni and iron
(Fe) powders for use in battery precursor and battery cathode (see Section 19: Market
Studies and Contracts). Waste products from geo-metallurgical testing should be used to
continue environmental test work.
Detailed study recommendations are noted in Section 26.

Document Number
Revision
Page
Rev Date
G4932-RPT-01 0 08 Jan 2021 29
Talon Metals Corp. – Preliminary Economic Assessment #3 on the Tamarack North Project
INTRODUCTION
DRA was retained by Talon to participate in this independent PEA, in collaboration with
various consulting companies, including DRA, Foth, Golder, Metpro, SLR, and Paterson &
Cooke. The purpose of this PEA is to support the disclosure of the results of a PEA for the
Tamarack North Project, in accordance with NI 43-101 guidelines. More specifically, each
consultant contributed to the completion of the component PEA sections as follows:
• DRA: Mining methods, hydrometallurgical processing, project infrastructure, market
studies and contracts, capital and operating costs, and economic analysis;
• Foth: Environmental studies, permitting, and social or community impacts;
• Golder: Property description and location, accessibility, climate and physiography,
history, geological setting and mineralization, deposit types, exploration, drilling, sample
preparation, data verification, adjacent properties, and mineral resource estimate;
• Metpro: Mineral processing, metallurgical testing, and recovery methods;
• Paterson & Cooke: Paste backfill methods;
• SLR: Tailings / waste rock co-disposal methods.
This PEA demonstrates a conceptual mine development plan based on BATs. These
technologies have been incorporated because of Talon’s mandate to consistently follow BAT
principles and practices. It is important to note that all design work is conceptual at the PEA
stage and that additional drilling, testing, studies and engineering work will be necessary to
complete a PFS as articulated in Section 26 (Recommendations) of this document.
Three independent NI 43-101 mineral resource estimates for the Tamarack North Project
have been prepared to date, each by Mr. Brian Thomas (B.Sc., P. Geo.), Senior Resource
Geologist at Golder. The effective date of the most recent mineral resource estimate is
January 8, 2021. Mr. Brian Thomas completed a site visit to the Tamarack North Project on
July 16, 2014. Mr. Thomas is a QP as defined by NI 43-101 guidelines.
A summary of the metallurgical test work completed on the Tamarack North Project,
including hydrometallurgical test work performed in 2020, has been compiled by Mr. Oliver
Peters, P. Eng. Mr. Peters is the Principal Metallurgist and President of Metpro. This work is
an update of previous metallurgical work completed on the Tamarack North Project by both

Document Number
Revision
Page
Rev Date
G4932-RPT-01 0 08 Jan 2021 30
Talon Metals Corp. – Preliminary Economic Assessment #3 on the Tamarack North Project
Metpro and Hatch Ltd. The recently performed hydrometallurgical test work has also been
reviewed by Dr. Volodymyr Liskovych, P. Eng.
Talon is a TSX-listed company (symbol TLO) focused on the exploration and development
of the Tamarack Project (which comprises the Tamarack North Project and the Tamarack
South Project). Talon has a well-qualified exploration and mine management team with
extensive experience in project management.
The PEA summarized in this Technical Report is considered by DRA to meet the
requirements of a “Preliminary Economic Assessment” as defined in NI 43-101. The
economic analysis contained in this PEA is preliminary in nature.
2.1 Sources of Information
The sources of information utilized in the preparation of this PEA were provided by Talon
and by Kennecott. This PEA is based on the following data and pre-existing reports:
• PEA of the Tamarack North Project published in December 2018;
• Updated PEA of the Tamarack North Project published in March 2020;
• The 2014 Tamarack Earn-in Agreement (and all amendments thereto);
• The Original MVA;
• The 2018 Tamarack Earn-in Agreement;
• The New MVA;
• The Amended MVA;
• Tamarack Magmatic Nickel Copper Sulfide Due Diligence (Talon) report;
• Talon internal reports;
• Kennecott internal reports;
• Kennecott database of surface drill holes that included:
o Ni, Cu, Co, Pt, Pd, Au, lithology sample/assay data;
o Sample SG;
o Drill hole collar survey data and down-hole survey data; and
o QA/QC summary data and graphs.
• Assay certificates from ALS Chemex;

Document Number
Revision
Page
Rev Date
G4932-RPT-01 0 08 Jan 2021 31
Talon Metals Corp. – Preliminary Economic Assessment #3 on the Tamarack North Project
• Metal price assumptions based on an average of forecast long-term prices provided by
major financial institutions located in North America and Europe.
Further sources of information utilized by the authors are listed in Section 27.
2.2 Qualified Persons (QPs)
The QPs listed in Table 2-1 are responsible for the preparation of this PEA. Certificates are
also contained herein. The following QPs have completed property site visits:
• Brian Thomas, P. Geo., completed site visit on July 16, 2014;
• Daniel Gagnon, P. Eng., completed site visit on October 5, 2017;
• Andrea Martin, P.E., completed site visits on April 18, 2014, January 23, 2019, and
January 27, 2020.
Table 2-1: List of Responsible QPs
Name Title, Company Responsible for Section
Leslie Correia, Pr.Eng Engineering Manager, Paterson & Cooke Canada Inc.
portions of 1 and 16
Tim Fletcher, P. Eng. Senior Project Manager, DRA Americas Inc. 2, portions of 1, 3, 21, 25, 26, and 27, and overall report compilation
Daniel Gagnon, P. Eng. Vice President Mining and Geology, DRA Americas Inc.
19, 22, and portions of 1, 18, 21, 25, and 26
André-François Gravel, P. Eng. Senior Mining Engineer, DRA Americas Inc. portions of 1 and 16
Volodymyr Liskovych, P. Eng. Principal Process Engineer, DRA Americas Inc.
13, 17, and portions of 1, 21, 25, 26, and 27 (hydromet aspects)
Andrea Martin, P.E. Lead Environmental Engineer, Foth Infrastructure & Environment
20, and portions of 1, 3, and 26
Oliver Peters, P. Eng. Principal Metallurgist and President, Metpro Management Inc.
13, 17, and portions of 1, 21, 25, 26, and 27 (mineral processing aspects)
David Ritchie, P. Eng. Mine Waste Engineering Manager, SLR Consulting (Canada) Ltd.
portions of 1, 3 and 18
Brian Thomas, P. Geo. Senior Resource Geologist, Golder Associates Ltd.
4, 5, 6, 7, 8, 9, 10, 11, 12, 14, 23, and portions of 1, 3, 25, 26, and 27
For all sections, Talon participated in the preparation of the report under the supervision of
the QPs named above.

Document Number
Revision
Page
Rev Date
G4932-RPT-01 0 08 Jan 2021 32
Talon Metals Corp. – Preliminary Economic Assessment #3 on the Tamarack North Project
2.3 Units of Measure and Abbreviations
All units of measure used in this Technical Report are in the metric system, unless stated
otherwise. Currencies outlined in the report are in US dollars unless otherwise stated.
The following symbols and abbreviations are used in this PEA.
< Less than
> Greater than
# Number
% Percent
° Degree
°C Degrees Celsius
3D Three dimensional
μm Micron
ABA Acid Base Accounting
ACT Ace Core Orientation Tool
AEM Airborne Electromagnetic
AERA Air Emission Risk Analysis
Ag Silver
AISC All in Sustaining Cost
Al Aluminium
Al2O3 Alumina, aluminum oxide
AMT Audio-frequency magnetotellurics
AP Acid Potential
ARD Acid rock drainage
As Arsenic
ATV Acoustic televiewer
Au Gold
Avg Average
Azm Azimuth
B.Sc Bachelor of Science
BATs Best Available Technologies
BH Borehole
BHEM Borehole electromagnetic
Bi Bismuth
Bouguer Regional earth gravity anomaly identified by height and bedrock
corrections
BNSF Burlington Northern Santa Fe (railway company)
BTS Brazilian tensile strength
BWi Bond Work Index
Ca Calcium
CaCO3 Calcium carbonate
CAPEX Capital expenditure
CCD Counter-current decantation
Cd Cadmium
CEO Chief Executive Officer
cfm Cubic feet per minute

Document Number
Revision
Page
Rev Date
G4932-RPT-01 0 08 Jan 2021 33
Talon Metals Corp. – Preliminary Economic Assessment #3 on the Tamarack North Project
CFR Code of Federal Regulations
CFTF Co-disposed Filtered Tailings Facility
CGO Coarse grained ortho-cumulate olivine
CIM Canadian Institute of Mining, Metallurgy, and Petroleum
cm Centimetre
cm/s Centimetres per second
cm3 Cubic centimetre
CMC Carboxy methyl cellulose
Co Cobalt
COG Cut-off Grade
Cpy Chalcopyrite
Cr Chromium
CRM Certified reference material
CSAMT Controlled source audio-frequency magnetotellurics
.csv Comma-separate values file (electronic file format)
Cu Copper
CuSO4 Copper sulphate
CV Coefficient of Variation
DDR Dip Direction
DHEM Downhole Electromagnetic
DMS Dense media separation
dmt Dry metric tonnes
DRA DRA Americas Inc.
E East
EAW Environmental Assessment Worksheet
EDA Exploratory data analysis
EIS Environmental Impact Statement
EM Electromagnetic
EMIT Electromagnetic Imaging Technology
EPA Environmental Protection Agency
EPCM Engineering, Procurement, and Construction Management
EPS Enhanced Production Scheduler
EV Electric Vehicle
Fe Iron
FGO Fine grained ortho-cumulate olivine
FKL Frontier Kemper Lakeshore
Fo Forsterite
Foth Foth Infrastructure & Environment
ft Feet
FW Footwall
G&A General and Administrative
g Gram
g/cc Gram per cubic centimetre
g/t Grams per tonne
Ga Giga-annum (one billion years)
GCL Geosynthetic Clay Liner
GLTZ Great Lakes Tectonic Zone
Golder Golder Associates Ltd

Document Number
Revision
Page
Rev Date
G4932-RPT-01 0 08 Jan 2021 34
Talon Metals Corp. – Preliminary Economic Assessment #3 on the Tamarack North Project
GOMS Goals, Operators, Methods, Selection rules
GPa Gigapascal
gpm Gallons per minute
GPS Global positioning system
HELP Hydrogeologic Evaluation of Landfill Performance
Hg Mercury
HLS Heavy liquid separation
HPAL High Pressure Acid Leach
HQ Hole (outside diameter): 96 mm; core (inside diameter): 63.5 mm
HS High-sulphide
HW Hanging wall
ICP Inductively coupled plasma
ICP-AES Inductively coupled plasma atomic emission spectroscopy
ICP-MS Inductively coupled plasma mass spectroscopy
ID Inverse distance
ID2 Inverse distance squared
ID3 Inverse distance cubed
IFRS International Financial Reporting Standards
In Indium
IP Induced polarization
IPD Inverse power distance
IRR Internal rate of return
ISO International Organization for Standardization
ITH In-the-hole
JCR Joint condition rating
Kennecott Kennecott Exploration Company
kg Kilogram
kg/m2 Kilograms per square metre
km Kilometre
kW Kilowatt
kWh Kilowatt-hour
kWh/t Kilowatt-hours per tonne
lb Pound(s)
LCT Locked cycle test
LG Low-grade
LHD load-haul-dump
Li Lithium
LLDPE Linear low-density polyethylene
LME London Metal Exchange
LOM Life of Mine
LS Low-sulphide
LV Low voltage
M Million
m Metre
m2 Square metre
m3 Cubic metre
m3/h Cubic metre per hour
Ma Mega-annum

Document Number
Revision
Page
Rev Date
G4932-RPT-01 0 08 Jan 2021 35
Talon Metals Corp. – Preliminary Economic Assessment #3 on the Tamarack North Project
MALM Mise-à-la-masse (test method)
mASL Metres above sea level
MAWP Maximum allowable working pressure
MCR Mid Continent Rift
MDH Minnesota Department of Health
MDNR Minnesota Department of Natural Resources
MEPA Minnesota Environmental Policy Act
Metpro Metpro Management Inc.
Mg Magnesium
mg/L Milligrams per litre
MgO Magnesium oxide, magnesia
mGal Milligal
MGS Minnesota Geological Survey
MHP Mixed hydroxide precipitate
MIBC Methyl isobutyl carbinol
mL Millilitre
ML Metal leaching
mm Millimetre
MMR Magnetometric resistivity
MMS Mixed massive sulphide
Mn Manganese
Mo Molybdenum
MOU Memorandum of Understanding
MPa Megapascal
MPCA Minnesota Pollution Control Agency
MPUC MN Public Utility Commission
MRV Minnesota River Valley
MSO Mineable Shape Optimizer
MSU Massive sulphide unit
MT Magnetotelluric
Mt Million tonnes
Mtpa Million tonnes per annum
MVA Mining Venture Agreement
MVI Magnetization Vector Inversion
MW Megawatt
MZ Mixed zone
MZNO Mixed zone olivine
n/a, N/A Not applicable
N North
NAAQS National Ambient Air Quality Standards
NAG Non-Acid Generating
NaHS Sodium hydrogen sulphide
NB Nominal Bore
NE Northeast
NEPA National Environmental Protection Act
NESHAPS New Source Performance Standards and National Emission Standards
for Hazardous Air Pollutants
NI 43-101 National Instrument 43-101

Document Number
Revision
Page
Rev Date
G4932-RPT-01 0 08 Jan 2021 36
Talon Metals Corp. – Preliminary Economic Assessment #3 on the Tamarack North Project
Ni Nickel
NiEq Equivalent nickel
NN Nearest neighbour
NP Neutralization Potential
NPDES National Pollutant Discharge Elimination System
NPR Neutralization potential to acid potential
NPC Net present cost
NPV Net present value
NQ Hole (outside diameter): 75.7 mm; core (inside diameter): 47.6 mmm
NRIA Net Revenue Inflation Adjustment
NS North-South
NSR Net smelter return
NW Northwest
NYMEX New York Mercantile Exchange
OB Overburden
OEM Original Equipment Manufacturer
OK Ordinary Kriging
OPEX Operating expenditure
OTV Optical televiewer
oz Ounce (troy ounce - 31.1035 grams)
P. E. Professional Engineer (US designation)
P. Eng. Professional Engineer (Canadian designation)
P. Geo. Professional Geologist
Pr. Eng. Professional Engineer (South African designation)
PAG Potentially Acid Generating
PAX Potassium amyl xanthate
Paterson & Cooke Paterson & Cooke Canada Inc.
Pb Lead
Pd Palladium
PEA Preliminary Economic Assessment
PEM Privacy enhanced mail (electronic file format)
PFS Pre-Feasibility Study
PGE Platinum group element
PGM Platinum group metal
pH Potential of hydrogen (measure of acidity)
PLS Pregnant leach solution
Pn Pentlandite
Po Pyrrhotite
POX Pressure oxidation
PPI Producer price inflation index
ppm Parts per million
psi Pounds per square inch
Pt Platinum
Q’ Rock mass quality
QA Quality assurance
QC Quality control
QCu Density-weighted copper grade
QCo Density-weighted cobalt grade

Document Number
Revision
Page
Rev Date
G4932-RPT-01 0 08 Jan 2021 37
Talon Metals Corp. – Preliminary Economic Assessment #3 on the Tamarack North Project
QEMSCAN Quantitative Evaluation of Materials by Scanning Electron Microscope
QNi Density-weighted nickel grade
QP Qualified Person
Re Rhenium
RGU Responsible Government Unit
RIM Radio Imaging Method
RMR Rock mass rating
ROD Record of Decision
ROFR Right of first refusal
ROM Run of mine
RQD Rock quality designation
RTE Rare, Threatened, and Endangered
S South
S Sulphur
Sb Antimony
SCR Solid core recovery
SDD Scoping Decision Document
SDS State Disposal System
SE Southeast
Se Selenium
SEAW Scoping Environmental Assessment Worksheet
SED Metasediments
SEM Sequential excavation method
SG Specific gravity
SHPO State Historic Preservation Office
Sigci Uniaxial Compressive Strength
Sigt Tensile Strength
SIPX Sodium isopropyl xanthate
SLR SLR Consulting (Canada) Ltd.
SMSU Semi-massive sulphide unit
SO Stope optimizer
SPLP Synthetic Precipitation Leaching Procedure
SSTS Subsurface Sewage Treatment System
STB Surface Transportation Board
STP Step data
.stp Step file (electronic file format)
SW Southwest
SWPPP Stormwater Pollution Prevention Plans
SX Solvent extraction
T, t Tonnes
t/m3 Tonnes per cubic metre
Talon Talon Metals Corp.
TCS Triaxial compressive strength
TCR Total core recovery
TDEM Time domain electromagnetic
Te Tellurium
TEM Transient electromagnetic
TIC Tamarack Intrusive Complex

Document Number
Revision
Page
Rev Date
G4932-RPT-01 0 08 Jan 2021 38
Talon Metals Corp. – Preliminary Economic Assessment #3 on the Tamarack North Project
Tl Thallium
tpa Tonnes per annum
tph Tonnes per hour
tpd Tonnes per day
TSF Tailings Storage Facility
U-Pb Uranium-Lead
UCS Uniaxial compressive strength (Chapter 11), Unfolded coordinate
system (Chapter 14)
UIC Underground Injection Control
US United States
US$ United States Dollars
USACE US Army Corps of Engineers
UTEM University of Toronto Electromagnetic System
UTM Universal Transverse Mercator (coordinate system)
VOXI Cloud based 3-D Inversion Service (Geosoft)
VPmg 3D modeling and inversion program for gravity, gravity-gradient, TMI
and magnetic gradient data
VWP Vibrating wire piezometer
W West
w/w By weight
WCA Wetlands Conservation Act
wmt Wet metric tonne
Zn Zinc

Document Number
Revision
Page
Rev Date
G4932-RPT-01 0 08 Jan 2021 39
Talon Metals Corp. – Preliminary Economic Assessment #3 on the Tamarack North Project
RELIANCE ON OTHER EXPERTS
This PEA has been prepared by DRA, Foth, Golder, Metpro, SLR, and Paterson & Cooke
for Talon. The information, conclusions, opinions, and estimates contained herein are based
on:
• Information available to DRA, Foth, Golder, Metpro, SLR, and Paterson & Cooke at the
time of report preparation;
• Assumptions, conditions, and qualifications as set forth in this report; and
• Data, reports, and other information supplied by Talon and other third-party sources.
In Sections 4.2 (Property Ownership), 4.3 (Permitting) and 4.4 (Environmental) of this PEA,
the QPs have relied upon, and believe there is a reasonable basis for this reliance on,
information provided by Talon regarding mineral tenure, surface rights, ownership details,
the 2014 Earn-in Agreement, the Original MVA, the 2018 Earn-in Agreement, and other
agreements relating to the Tamarack North Project, royalties, environmental obligations,
permitting requirements and applicable legislation relevant to the Tamarack North Project.
The QPs have not independently verified the information in these sections and have fully
relied upon, and disclaim responsibility for, information provided by Talon in these sections.
DRA has relied upon data and documentation from Talon in respect of Market Studies
(Section 19) and Economic Analysis (Section 22) of this PEA.
For Environmental Studies, Permitting and Community Impact (Section 20) and associated
sub-sections, Foth has relied upon information it has developed as contracted by Kennecott
Exploration Company and information provided by Talon for baseline data related to site
hydrogeology, hydrology, geochemistry, wetlands, vegetative communities, and protected
species. For Permitting Requirements (Section 20.7), Foth relied upon Federal, State, and
local regulations as well as institutional knowledge gained from developing similar mining
projects in northern Minnesota.
Metpro has relied upon data and documentation from Talon with regards to the metallurgical
results that were obtained in historical metallurgical programs. Metpro managed the
2019/2020 metallurgical test programs at XPS in Sudbury and SGS in Lakefield on behalf of
Talon to further improve the metallurgical results for the Tamarack mineralization. This
information was used in the generation of Mineral Processing and Metallurgical Testing

Document Number
Revision
Page
Rev Date
G4932-RPT-01 0 08 Jan 2021 40
Talon Metals Corp. – Preliminary Economic Assessment #3 on the Tamarack North Project
(Section 13) and of the process design criteria. The process design criteria provided critical
input for Recovery Methods (Section 17) and Capital and Operating Costs (Section 21) of
this PEA.
SLR has relied upon backfill / waste tonnages provided by Paterson & Cooke, mine plan
tonnages and geochemical characterization of the tailings and mine rock provide by Talon,
and site selection guidance by Talon.

Document Number
Revision
Page
Rev Date
G4932-RPT-01 0 08 Jan 2021 41
Talon Metals Corp. – Preliminary Economic Assessment #3 on the Tamarack North Project
PROPERTY DESCRIPTION AND LOCATION
4.1 Property Location
The Tamarack Project located in north-central Minnesota is approximately 100 km (62 miles)
W of Duluth and 210 km (130 miles) N of Minneapolis, in Aitkin County (Figure 4-1). The
Tamarack North Project, which this report represents, covers approximately 20,348 acres.
The boundary between the Tamarack North Project and the Tamarack South Project is
located approximately along the 5165000 N Universal Transverse Mercator (UTM) line. More
specifically, it occurs along the southern extremity of State Mineral Leases MM 10006 N,
MM-9768-P, and MM-9767-P (Figure 4-2). The current Tamarack North Project
mineralization is centred at approximately 490750 E/5168700 N NAD 83 15 N. The town of
Tamarack, which gives the project its name, lies in the southern portion of the Tamarack
North Project area (though away from the known mineralization).
Figure 4-1: Location of the Tamarack North Project

Document Number
Revision
Page
Rev Date
G4932-RPT-01 0 08 Jan 2021 42
Talon Metals Corp. – Preliminary Economic Assessment #3 on the Tamarack North Project
4.2 Property Ownership
Both Kennecott and Talon hold interests in the Tamarack Project, which comprises the
Tamarack North Project and the Tamarack South Project. As of the date of this PEA, Talon
holds a 17.56% interest, and Kennecott holds an 82.44% interest, in the Tamarack Project.
Talon is presently the operator of the Tamarack Project.
On November 7, 2018, Talon and Kennecott entered into the 2018 Tamarack Earn-in
Agreement, pursuant to which Talon has the right to increase its interest in the Tamarack
Project to a maximum 60% interest (the Kennecott Agreement came into effect on the
Kennecott Agreement Effective Date). The 2018 Tamarack Earn-in Agreement is described
in Section 4.2.3 below.
Prior to the 2018 Tamarack Earn-in Agreement, the relationship between Talon and
Kennecott was governed by several other agreements (2014 Tamarack Earn-in Agreement,
Original MVA, etc.), which are further described below.
2014 Tamarack Earn-in Agreement
On June 25, 2014, Talon entered into the 2014 Tamarack Earn-in Agreement with
Kennecott, part of the Rio Tinto Group, pursuant to which Talon was granted the right to
acquire an interest in the Tamarack Project.
Pursuant to the original terms of the 2014 Tamarack Earn-in Agreement, Talon had the right
to acquire a 30% interest in the Tamarack Project over a three-year period (the Earn-in
Period) by making US$7.5M in installment payments to Kennecott, and incurring US$30M
in exploration expenditures (the Tamarack Earn-in Conditions). In addition, Talon agreed to
make certain land option payments on behalf of Kennecott, which were payable over the
Earn-in Period (and, when payable, were to be included as part of the Tamarack Earn-in
Conditions).
On March 26, 2015, Kennecott and Talon amended the 2014 Tamarack Earn-in Agreement
(the 2014 Tamarack Earn-in First Amending Agreement) to defer one of the option payments
(the Deferred Option Payment) and delay further cash calls from being made by Kennecott.
On November 25, 2015, Kennecott and Talon entered into a further agreement to amend
the 2014 Tamarack Earn-in Agreement (the 2014 Tamarack Earn-in Second Amending
Agreement), to provide, among other things:

Document Number
Revision
Page
Rev Date
G4932-RPT-01 0 08 Jan 2021 43
Talon Metals Corp. – Preliminary Economic Assessment #3 on the Tamarack North Project
• That upon receipt by Kennecott from Talon of the sum of US$15M (which was in addition
to previous amounts paid to Kennecott of US$10.52M), Talon would earn an 18.45%
interest in the Tamarack Project and Talon would have no further funding requirements
to earn its interest in the Tamarack Project;
• Once Kennecott had spent the funds advanced by Talon on exploration activities in
respect of the Tamarack Project, subject to certain self-funding rights by Kennecott
during such period, Kennecott would have 180 days to elect whether to: (a) proceed
with an 81.55/18.45 joint venture with respect to the Tamarack Project in accordance
with the terms of the original MVA, with Kennecott owning an 81.55% participating
interest, and Talon owning an 18.45% participating interest; or (b) grant Talon the right
to purchase Kennecott’s interest in the Tamarack Project for a total purchase price of
US$114M (the Tamarack Purchase Option). In the event Kennecott granted Talon the
Tamarack Purchase Option, and Talon elected to proceed with the Tamarack Purchase
Option, Talon would have up to 18 months to close the transaction, provided it made an
upfront non-refundable payment of US$14M; and
• Until Kennecott made its decision as to whether to grant Talon the Tamarack Purchase
Option, Talon would be responsible for certain costs to keep the Tamarack Project in
good standing based on its 18.45% interest. If Talon failed to make any of such
payments, its interest in the Tamarack Project would be diluted in accordance with the
terms of the Tamarack Earn-in Agreement.
On January 4, 2016, Talon made the US$15M payment to Kennecott (the Final 2014 Earn-
in Payment) and earned an 18.45% interest in the Tamarack Project.
The total amount paid by Talon to Kennecott to earn its 18.45% interest in the Tamarack
Project was US$25,520,800, broken down as follows:
Option payments $ 1,000,000
Exploration $ 21,200,000
Land purchases $ 3,320,800
TOTAL $ 25,520,800

Document Number
Revision
Page
Rev Date
G4932-RPT-01 0 08 Jan 2021 44
Talon Metals Corp. – Preliminary Economic Assessment #3 on the Tamarack North Project
On December 16, 2016, Talon entered into a third amending agreement with Kennecott (the
2014 Tamarack Earn-in Third Amending Agreement) in respect of the 2014 Tamarack Earn-
in Agreement.
Pursuant to the 2014 Tamarack Earn-in Third Amending Agreement, Talon and Kennecott
agreed to co-fund a 2016/2017 winter exploration program at the Tamarack Project in the
approximate amount of US$3.5M, with Talon funding its proportionate share of 18.45%
thereof. The 2014 Tamarack Earn-in Third Amending Agreement also provided that
Kennecott could elect at any time up to and including September 25, 2017 to grant Talon
the Tamarack Purchase Option or proceed with the Original MVA (the Kennecott Decision
Deadline).
On the Kennecott Decision Deadline, Talon received notification from Kennecott that it had
decided to grant Talon the Tamarack Purchase Option on the terms of the 2014 Tamarack
Earn-in Agreement. Pursuant to the 2014 Tamarack Earn-in Agreement, Talon had until
November 6, 2017 to advise Kennecott as to whether or not it would exercise the Tamarack
Purchase Option.
On November 1, 2017, Talon entered into a fourth amending agreement with Kennecott (the
2014 Tamarack Earn-in Fourth Amending Agreement) in respect of the 2014 Tamarack
Earn-in Agreement. Pursuant to the 2014 Tamarack Earn-in Fourth Amending Agreement,
Kennecott agreed to grant Talon an extension until December 31, 2017 to make its election
as to whether it would exercise the Tamarack Purchase Option. In return for the granting of
such extension by Kennecott, Talon agreed to grant Kennecott a 0.5% net smelter return
(NSR) in the event Talon elected to exercise the Tamarack Purchase Option.
On November 16, 2017, Talon advised Kennecott that it had elected not to exercise the
Tamarack Purchase Option. Consequently, under the terms of the 2014 Tamarack Earn-in
Agreement, in February 2018 the parties were required to proceed to execute and deliver
and operate under the Original MVA.

Document Number
Revision
Page
Rev Date
G4932-RPT-01 0 08 Jan 2021 45
Talon Metals Corp. – Preliminary Economic Assessment #3 on the Tamarack North Project
Original Mining Venture Agreement (Original MVA)
On January 11, 2018, Talon entered into a fifth amending agreement with Kennecott (the
2014 Tamarack Earn-in Fifth Amending Agreement) in respect of the 2014 Tamarack Earn-
in Agreement. Pursuant to the 2014 Tamarack Earn-in Fifth Amending Agreement, Talon
and Kennecott agreed to accelerate the timeframe for entering into the Original MVA, such
that the parties would enter into the agreement with immediate effect (on January 11, 2018),
rather than in February 2018.
Some notable characteristics of the Original MVA include the following:
• Kennecott was appointed Manager of the Tamarack Project, with a number of explicit
duties and obligations articulated under the Original MVA;
• Talon and Kennecott agreed to establish a management committee to determine overall
policies, objectives, procedures, methods and actions under the Original MVA, and to
provide general oversight and direction to the manager who was vested with full power
and authority to carry out day-to-day management under the Original MVA. The
management committee consisted of two members appointed by Talon and two
members appointed by Kennecott;
• Upon formation of the Original MVA and beginning with the first program and budget
under the Original MVA, each proposed program and budget had to provide for an
annual expenditure of at least US$6.15M until the completion of a Feasibility Study (as
defined under the Original MVA). The failure of either party to fund its share of each
proposed program and budget was to result in dilution (and in certain circumstances
accelerated dilution) in accordance with the terms of the Original MVA;
• In the event either party’s participating interest in the Tamarack Project diluted below
10%, such party’s interest would be converted into a 1% NSR royalty; and
• In the event of a proposed transfer of either party’s interest in the Tamarack Project to
a third party, the other party had a right of first refusal (ROFR). In the event the non-
transferring party elected not to exercise its ROFR, the non-transferring party had a tag-
along right, while the transferring party had a drag-along right.
On January 11, 2018, pursuant to the terms of the Original MVA, Talon elected to not
financially participate in the 2018 winter exploration program at the Tamarack Project.

Document Number
Revision
Page
Rev Date
G4932-RPT-01 0 08 Jan 2021 46
Talon Metals Corp. – Preliminary Economic Assessment #3 on the Tamarack North Project
Consequently, Talon’s interest in the Tamarack Project was diluted below 18.45%, and
eventually diluted to 17.56%.
2018 Tamarack Earn-in Agreement
On November 7, 2018, Talon and Kennecott entered into the 2018 Tamarack Earn-in
Agreement. The 2018 Tamarack Earn-in Agreement came into effect on the Kennecott
Agreement Effective Date. Pursuant to the 2018 Tamarack Earn-in Agreement, Talon
received the right to increase its interest in the Tamarack Project up to a maximum 60%
interest. Under the 2018 Tamarack Earn-in Agreement, the Original MVA is in abeyance.
Pursuant to the 2018 Tamarack Earn-in Agreement, Talon has taken over operatorship of
the Tamarack Project (with certain Kennecott employees being seconded to Talon) and has
the right to increase its interest in the Tamarack Project to 51% by:
• The payment of US$6M in cash to Kennecott – this has been completed;
• The issuance of US$1.5M worth of common shares in Talon to Kennecott – this has
been completed;
• Within three years of the Kennecott Agreement Effective Date, Talon either spending
US$10M in exploration expenditures on the Tamarack Project or delivering a PFS in
accordance with NI 43-101, whichever comes first; and
• Also within three years of the Kennecott Agreement Effective Date, Talon paying
Kennecott the additional sum in cash of US$5M.
• Provided Talon has earned a 51% interest in the Tamarack Project, Talon will then have
the right to further increase its interest in the Tamarack Project to 60% by:
o Completing a Feasibility Study (as defined under the 2018 Tamarack Earn-in
Agreement) on the Tamarack Project within seven years of the Kennecott
Agreement Effective Date; and
o Paying Kennecott an additional sum of US$10M in cash on or before the seventh
anniversary date of the Kennecott Agreement Effective Date.
The New MVA
Upon Talon earning a 60% interest in the Tamarack Project, Talon and Kennecott have
agreed to enter into a new mining venture agreement (the New MVA).

Document Number
Revision
Page
Rev Date
G4932-RPT-01 0 08 Jan 2021 47
Talon Metals Corp. – Preliminary Economic Assessment #3 on the Tamarack North Project
Some notable characteristics of the New MVA include the following:
• Talon will be appointed Manager of the Tamarack Project, with a number of explicit
duties and obligations articulated under the New MVA;
• Each party will be required to fund its pro rata share of expenditures or be diluted;
• Talon and Kennecott will establish a management committee to determine overall
policies, objectives, procedures, methods and actions under the New MVA, and to
provide general oversight and direction to the Manager who will be vested with full power
and authority to carry out the day-to-day management under the New MVA. The
management committee will consist of two members appointed by Talon and two
members appointed by Kennecott;
• In the event either party’s participating interest in the Tamarack Project dilutes below
10%, such party’s interest will be converted into a 1% NSR;
• In the event of a proposed transfer of either party’s interest in the Tamarack Project to
a third party, the other party will have a ROFR.
Other Potential Agreements
In addition to the 2018 Tamarack Earn-in Agreement and the New MVA, Talon and
Kennecott have contemplated two potential scenarios that would necessitate the entering
into of alternative forms of MVAs.
First, in the event Talon does not earn a 51% interest in the Tamarack Project, the Original
MVA will come back into force (excluding the requirement for an annual expenditure of at
least US$6.15M until the completion of a Feasibility Study), with Kennecott once again taking
on the role of the Manager of the Tamarack Project, and Talon commencing with a 17.56%
interest in the Tamarack Project (subject to any additional dilution that may apply).
Second, in the event Talon earns a 51% interest in the Tamarack Project, but does not earn
a 60% interest in the Tamarack Project, the parties have agreed to enter into an amended
mining venture agreement (Amended MVA) pursuant to which Talon will continue to be the
Manager of the Tamarack Project, and will be required to free-carry Kennecott through to
the completion of a feasibility study (as defined under the Amended MVA). Under the
Amended MVA, and beginning with the first program and budget under the Amended MVA,
each proposed program and budget by Talon must provide for an annual expenditure of at

Document Number
Revision
Page
Rev Date
G4932-RPT-01 0 08 Jan 2021 48
Talon Metals Corp. – Preliminary Economic Assessment #3 on the Tamarack North Project
least US$6.15M until the completion of a feasibility study (as defined under the Amended
MVA), failing which Talon will be subject to dilution.
Mineral Tenure
4.2.6.1 Introduction
Land in Minnesota is held by a combination of private, state and federal ownership. In
addition, surface estate owner(s) may be the same or different to the mineral estate owner(s)
(i.e. mineral interest may be severed from surface interest and form its own property
ownership right).
The Tamarack North Project comprises:
• Minnesota State Leases (many of which also include the surface rights);
• Private Mineral Leases, Surface Use Agreements and Options to Purchase; and
• Fee Mineral and Surface Interests owned outright by Kennecott.
These various interests are summarized in Table 4-1. The mineral and surface rights owned
or controlled by Kennecott and Talon are summarized in Figure 4-2. All Tamarack North
Project mineral and surface interests are held in Kennecott’s own name and are currently
subject to the 2018 Tamarack Earn-in Agreement. The Tamarack land package has been
reduced from 28,334 acres (2018) in order to save costs and shed non-essential land
holdings.
Table 4-1: Summary of Tamarack North Project Interests
Type Number Acreage
Minnesota State Leases 40 18,730
Private Mineral Leases 1 38
Fee Minerals and Surface Interests 18 1,580
Total 59 20,348
It is noted that all locations for mineral leases and other property locations are described in
the US Public Land Survey System in Township, Range, Section and Section subdivisions.

Document Number
Revision
Page
Rev Date
G4932-RPT-01 0 08 Jan 2021 49
Talon Metals Corp. – Preliminary Economic Assessment #3 on the Tamarack North Project
Figure 4-2: Tamarack North Project Mineral and Surface Rights
Document Number
Revision
Page
Rev Date
G4932-RPT-01 0 08 Jan 2021 50
Talon Metals Corp. – Preliminary Economic Assessment #3 on the Tamarack North Project
4.2.6.2 Minnesota State Leases
State Leases to Explore, Mine and Remove Metallic Minerals (State Leases) are issued by
the MDNR and may be held for up to 50 years. “Metallic Minerals” are defined in the State
Leases as “any mineral substances of a metalliferous nature, except Fe ores and taconite
ores”. State Leases allow a mining company to engage in mineral exploration and mineral
development located on the State-owned property, subject to compliance with all laws and
issued permits.
The Tamarack North Project comprises 40 State Leases, covering an area of approximately
18,730 acres (Table 4-2 contains further details of State Leases). The State Leases are
issued on standard lease forms and generally contain uniform terms and conditions.
In order to keep the State Leases in good standing, certain quarterly and/or annual payments
must be made to the State and/or County. Rental payments must be made to the State, and
are paid quarterly in arrears on each February 20, May 20, August 20 and November 20 for
the previous calendar quarter. The quantum of such rental payments are as follows:
• Initially, US$1.50 per acre for the unexpired portion of the then current year and
US$1.50 per acre for each of the two succeeding years;
• US$5 per acre for the next three calendar years, payable quarterly;
• US$15 per acre for the next five calendar years, payable quarterly; and
• US$30 per acre per calendar year for the duration of the lease.
A county tax is also levied on the State Leases, with the current amount being US$0.40 per
acre, payable on May 15 of each year.
An operating mining company must also pay a production royalty. The base royalty consists
of a base rate (3.95%) and in some cases an additional royalty (applicable only to those
leases acquired through state bids or negotiations with the State). Details are included in
Table 4-2. State leases also contain a royalty escalation clause that increases the base
royalty as the net return value per tonne of raw ore increases. This escalation of the royalty
rate begins at a net return value per tonne of US$75.01. It rises to the maximum of 20% if
such net return value exceeds US$444/t of raw ore.
The State of Minnesota has an option to cancel a mineral lease after the end of the 20th
year if, by that time, a lessee is not actively engaged in mining ore under the lease from the

Document Number
Revision
Page
Rev Date
G4932-RPT-01 0 08 Jan 2021 51
Talon Metals Corp. – Preliminary Economic Assessment #3 on the Tamarack North Project
mining unit, a mine within the same government township as the mining unit or an adjacent
government township and has not paid at least US$100,000 to the State in earned royalty
under a state lease in any one calendar year. The State must exercise that option within the
21st year of the lease. If the State does not cancel within the 21st year, the lessee has until
the end of the 35th calendar year to meet the conditions. If the lessee has not met the
conditions by the end of the 35th year, the State has another window to cancel the lease
during the 36th calendar year of the lease.
Table 4-2: Tamarack North Project State Lease Details
State Lease Number
Start Date Term Base
Royalty Additional
Royalty
Royalty Escalator Applies
Lands Acreage
MM 9765-P 9/7/2000 50
years 3.95% N/A Yes
Township 48 North, Range 22 West, Aitkin County, Minnesota Sec. 3: Lot 3, NE/4SW/4, SW/4SW/4 Minerals and mineral rights Sec. 3: Lots 1-2, S/2NE/4, SE/4NW/4, SE/4SW/4, SE/4 Minerals and mineral rights, including the interest in the surface thereof owned by the State, if any
482.26
MM 9766-P 9/7/2000 50
years 3.95% N/A Yes
Township 48 North, Range 22 West, Aitkin County, Minnesota Sec. 10: NE/4NW/4, S/2NW/4, NW/4SE/4
Minerals, mineral rights and surface Sec. 10: SW/4, NE/4 Minerals and mineral rights Sec. 10: NW/4NW/4, NE/4SE/4, S/2SE/4 Minerals and mineral rights, including the interest in the surface thereof owned by the State, if any
640
MM 9767-P 9/7/2000 50
years 3.95% N/A Yes
Township 48 North, Range 22 West, Aitkin County, Minnesota Sec. 14: N/2NE/4
Minerals, mineral rights and surface Sec. 14: N/2SE/4, SE/4SE/4, S/2NE/4, NW/4, NE/4SW/4, NW/4SW/4 except 2.58 acres for highway right-of-way, E/2SE/4SW/4 Minerals and mineral rights Sec. 14: SW/4SW/4 Minerals and mineral rights, including the interest in the surface thereof owned by the State, if any
577.42
MM 9768-P 11/9/2005 50
years 3.95% N/A Yes
Township 48 North, Range 22 West, Aitkin County, Minnesota Sec. 15: SW/4NE/4, NE/4NW/4 except 3.17 acres for railroad right-of-way, NW/4NW/4 except 2.14 acres for railroad right-of-way Minerals and mineral rights Sec. 15: NE/4NE/4 except 0.80 acres for railroad right-of-way, NW/4NE/4 except 3.17 acres for railroad right-of-way, SE/4NE/4, SE/4SW/4, SE/4 Minerals and mineral rights, including the interest in the surface thereof owned by the State, if any
430.72

Document Number
Revision
Page
Rev Date
G4932-RPT-01 0 08 Jan 2021 52
Talon Metals Corp. – Preliminary Economic Assessment #3 on the Tamarack North Project
State Lease Number
Start Date Term Base
Royalty Additional
Royalty
Royalty Escalator Applies
Lands Acreage
MM 9849-N 9/6/2001 50
years 3.95% 0.50% Yes
Township 49 North, Range 22 West, Aitkin County, Minnesota Sec. 34: NE/4NE/4, E/2NW/4
Minerals, mineral rights and surface Sec. 34: W/2NW/4, NW/4NE/4, SW/4 Minerals and mineral rights Sec. 34: S/2NE/4, SE/4 Minerals and mineral rights, including the interest in the surface thereof owned by the State, if any
640.00
MM 10002-N 6/5/2003 50
years 3.95% 0.30% Yes
Township 48 North, Range 22 West, Aitkin County, Minnesota Sec. 2: Lots 1-4, S/2NE/4, S/2NW/4, S/2 Minerals and mineral rights, including the interest in the surface thereof owned by the State, if any
605.04
MM 10003-N 6/5/2003 50
years 3.95% 0.30% Yes
Township 48 North, Range 22 West, Aitkin County, Minnesota Sec. 4: SW/4NE/4, SE/4NE/4, SW/4SW/4, N/2SE/4 Minerals and mineral rights Sec. 4: Lots 2-4, S/2NW/4, N/2SW/4, S/2SE/4 Minerals and mineral rights, including the interest in the surface thereof owned by the State, if any
505.85
MM 10004-N 6/5/2003 50
years 3.95% 0.30% Yes
Township 48 North, Range 22 West, Aitkin County, Minnesota Sec. 9: S/2NE/4, NE/4NW/4 Minerals and mineral rights Sec. 9: N/2NE/4; SE/4NW/4, that part commencing at NW corner, thence S along W line of SE/4NW/4 206 ft to Round Lake Road the point of beginning, thence S along same W line a distance of 427 ft, thence deflect left 73° a distance of 612.5 ft, thence deflect left 87° 10 minutes a distance of 400 ft to centre of Round Lake Road, thence deflect left 92° along said road a distance of 762 ft to point of beginning; W/2SW/4; SE/4SW/4 Minerals and mineral rights, including the interest in the surface thereof owned by the State, if any
326.50
MM 10005-N 6/5/2003 50
years 3.95% 0.30% Yes
Township 48 North, Range 22 West, Aitkin County, Minnesota Sec. 11: All Minerals and mineral rights, including the interest in the surface thereof owned by the State, if any
640.00
MM 10006-N 6/5/2003 50
years 3.95% 0.30% Yes
Township 48 North, Range 22 West, Aitkin County, Minnesota Sec. 16: N/2NE/4, SW/4NE/4, W/2, SE/4 Minerals and mineral rights
600.00
MM 10007-N 6/5/2003 50
years 3.95% 0.40% Yes
Township 49 North, Range 22 West, Aitkin County, Minnesota Sec. 27: W/2NW/4, SE/4 Minerals and mineral rights Sec. 27: SE/4NW/4 Minerals and mineral rights, including the interest in the surface thereof owned by the State, if any
280.00

Document Number
Revision
Page
Rev Date
G4932-RPT-01 0 08 Jan 2021 53
Talon Metals Corp. – Preliminary Economic Assessment #3 on the Tamarack North Project
State Lease Number
Start Date Term Base
Royalty Additional
Royalty
Royalty Escalator Applies
Lands Acreage
MM 10008-N 6/5/2003 50
years 3.95% 0.40% Yes
Township 49 North, Range 22 West, Aitkin County, Minnesota Sec. 28: NE/4, NE/4SE/4, SW/4SE/4
Minerals, mineral rights and surface Sec. 28: E/2NW/4, NE/4SW/4 Minerals and mineral rights Sec. 28: W/2SW/4, SE/4SW/4, NW/4SE/4 Minerals and mineral rights, including the interest in the surface thereof owned by the State, if any
520.00
MM 10009-N 6/5/2003 50
years 3.95% 0.30% Yes
Township 49 North, Range 22 West, Aitkin County, Minnesota Sec. 33: N/2NE/4SE/4 Minerals and mineral rights Sec. 33: W/2NE/4, W/2, W/2SE/4 Minerals and mineral rights, including the interest in the surface thereof owned by the State, if any
500.00
MM 10010-N 6/5/2003 50
years 3.95% 0.30% Yes
Township 49 North, Range 22 West, Aitkin County, Minnesota Sec. 35: E/2NE/4, SW/4NE/4, SW/4, NE/4SE/4 except coal and iron, NW/4SE/4 except coal and iron, SW/4SE/4 except coal and iron, SE/4SE/4 except coal and iron Minerals and mineral rights, including the interest in the surface thereof owned by the State, if any
440.00
MM 10202-N 6/21/2008 50
years 3.95% 0.50% Yes
Township 49 North, Range 22 West, Aitkin County, Minnesota Sec. 22: N/2SW/4
Minerals, mineral rights and surface Sec. 22: NW/4, SW/4SW/4, E/2NE/4 Minerals and mineral rights
360.00
MM 10203-N 6/21/2008 50
years 3.95% 0.50% Yes
Township 49 North, Range 22 West, Aitkin County, Minnesota Sec. 26: E/2NE/4, W/2NE/4, E/2NW/4, NE/4SW/4, NW/4SE/4 Minerals and mineral rights Sec. 26: W/2SW/4, SE/4SW/4, NE/4SE/4, S/2SE/4 Minerals and mineral rights, including the interest in the surface thereof owned by the State, if any
560
MM 10204-N 6/21/2008 50
years 3.95% 0.50% Yes
Township 49 North, Range 22 West, Aitkin County, Minnesota Sec. 29: SW/4NW/4, E/2SW/4, SW/4SW/4, W/2SE/4, undivided ½ interest in N/2NW/4 Minerals and mineral rights Sec. 29: E/2SE/4 Minerals and mineral rights, including the interest in the surface thereof owned by the State, if any
400.00
MM 10205-N 6/21/2008 50
years 3.95% 0.50% Yes
Township 49 North, Range 22 West, Aitkin County, Minnesota Sec. 32: E/2SE/4
Minerals, mineral rights and surface Sec. 32: N/2, SW/4, W/2SE/4 Minerals and mineral rights, including the interest in the surface thereof owned by the State, if any
640.00
MM 10252-N 9/30/2009 50
years 3.95% 0.50% Yes
Township 49 North, Range 22 West, Aitkin County, Minnesota Sec. 22: W/2NE/4 Minerals and mineral rights, except coal and iron
80.00

Document Number
Revision
Page
Rev Date
G4932-RPT-01 0 08 Jan 2021 54
Talon Metals Corp. – Preliminary Economic Assessment #3 on the Tamarack North Project
State Lease Number
Start Date Term Base
Royalty Additional
Royalty
Royalty Escalator Applies
Lands Acreage
MM 10253-N 9/30/2009 50
years 3.95% 0.50% Yes
Township 49 North, Range 22 West, Aitkin County, Minnesota Sec. 23: All Minerals and mineral rights, except coal and iron
640.00
MM 10315 2/26/2010 50
years 3.95% 0.611% Yes
Township 48 North, Range 22 West, Aitkin County, Minnesota Sec. 1: SE/4NE/4, NE/4SE/4 Minerals and mineral rights Sec. 1: Lots 2-4, SW/4NE/4, S/2NW/4, SW/4, W/2SE/4, SE/4SE/4 Minerals and mineral rights, including the interest in the surface thereof owned by the State, if any
588.30
MM 10316 2/26/2010 50
years 3.95% 0.611% Yes
Township 48 North, Range 22 West, Aitkin County, Minnesota Sec. 7: Lots 1-4, E/2, E/2NW/4, E/2SW/4 Minerals and mineral rights
626.07
MM 10317 2/26/2010 50
years 3.95% 0.611% Yes
Township 48 North, Range 22 West, Aitkin County, Minnesota Sec. 8: E/2SW/4
Minerals, mineral rights and surface Sec. 8: S/2NE/4, NW/4, W/2SW/4, SE/4 Minerals and mineral rights
560.00
MM 10318 2/26/2010 50
years 3.95% 0.611% Yes
Township 48 North, Range 22 West, Aitkin County, Minnesota Sec. 12: NW/4NE/4, N/2NW/4
Minerals, mineral rights and surface Sec. 12: SE/4NE/4, SW/4SW/4 Minerals and mineral rights Sec. 12: NE/4NE/4 Minerals and mineral rights, including the interest in the surface thereof owned by the
State, if any
240.00
MM 10319 2/26/2010 50
years 3.95% 0.611% Yes
Township 48 North, Range 22 West, Aitkin County, Minnesota Sec. 13: N/2NE/4, W/2NW/4 Minerals and mineral rights Sec. 13: NE/4SE/4 Minerals and mineral rights, including the interest in the surface thereof owned by the State, if any
200.00
MM 10335 2/26/2010 50
years 3.95% 0.611% Yes
Township 49 North, Range 22 West, Aitkin County, Minnesota Sec. 4: Lots 3-4, SW/4NW/4, NW/4SW/4, NE/4SE/4
Minerals, mineral rights and surface Sec. 4: SE/4NE/4, SE/4SE/4, SW/4SE/4 Minerals and mineral rights Sec. 4: Lots 1-2, SW/4NE/4, SE/4NW/4, NE/4SW/4, S/2SW/4, NW/4SE/4 Minerals and mineral rights, including the interest in the surface thereof owned by the State, if any
610.96
MM 10340 2/26/2010 50
years 3.95% 0.611% Yes
Township 49 North, Range 22 West, Aitkin County, Minnesota Sec. 9: NE/4NE/4, SW/4NE/4 except the north 100 ft, SE/4NE/4 except the N 100 ft, NE/4NW/4, S/2SW/4 Minerals and mineral rights Sec. 9: NW/4NE/4, SW/4NE/4 the N 100 ft, SE/4NE/4 the N 100 ft, W/2NW/4, SE/4NW/4, N/2SW/4 Minerals and mineral rights, including the interest in the surface thereof owned by the State, if any
480.00
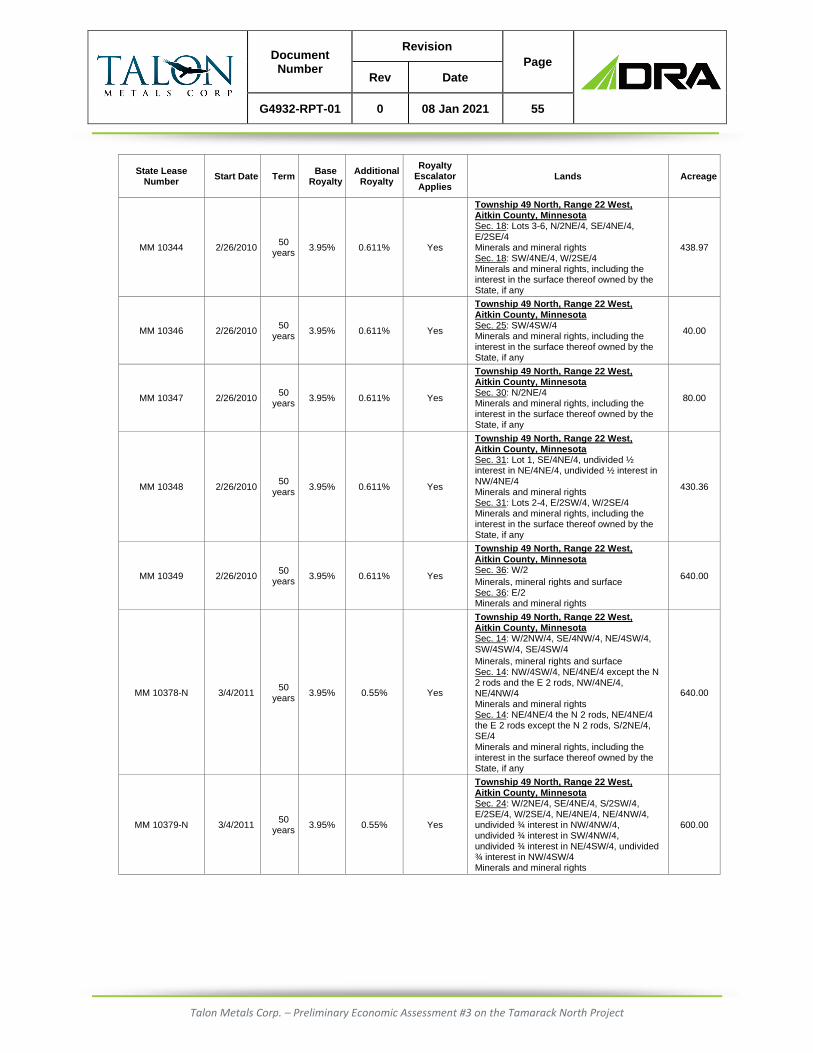
Document Number
Revision
Page
Rev Date
G4932-RPT-01 0 08 Jan 2021 55
Talon Metals Corp. – Preliminary Economic Assessment #3 on the Tamarack North Project
State Lease Number
Start Date Term Base
Royalty Additional
Royalty
Royalty Escalator Applies
Lands Acreage
MM 10344 2/26/2010 50
years 3.95% 0.611% Yes
Township 49 North, Range 22 West, Aitkin County, Minnesota Sec. 18: Lots 3-6, N/2NE/4, SE/4NE/4, E/2SE/4 Minerals and mineral rights Sec. 18: SW/4NE/4, W/2SE/4 Minerals and mineral rights, including the interest in the surface thereof owned by the State, if any
438.97
MM 10346 2/26/2010 50
years 3.95% 0.611% Yes
Township 49 North, Range 22 West, Aitkin County, Minnesota Sec. 25: SW/4SW/4 Minerals and mineral rights, including the interest in the surface thereof owned by the State, if any
40.00
MM 10347 2/26/2010 50
years 3.95% 0.611% Yes
Township 49 North, Range 22 West, Aitkin County, Minnesota Sec. 30: N/2NE/4 Minerals and mineral rights, including the interest in the surface thereof owned by the State, if any
80.00
MM 10348 2/26/2010 50
years 3.95% 0.611% Yes
Township 49 North, Range 22 West, Aitkin County, Minnesota Sec. 31: Lot 1, SE/4NE/4, undivided ½ interest in NE/4NE/4, undivided ½ interest in NW/4NE/4 Minerals and mineral rights Sec. 31: Lots 2-4, E/2SW/4, W/2SE/4 Minerals and mineral rights, including the interest in the surface thereof owned by the State, if any
430.36
MM 10349 2/26/2010 50
years 3.95% 0.611% Yes
Township 49 North, Range 22 West, Aitkin County, Minnesota Sec. 36: W/2
Minerals, mineral rights and surface Sec. 36: E/2 Minerals and mineral rights
640.00
MM 10378-N 3/4/2011 50
years 3.95% 0.55% Yes
Township 49 North, Range 22 West, Aitkin County, Minnesota Sec. 14: W/2NW/4, SE/4NW/4, NE/4SW/4, SW/4SW/4, SE/4SW/4
Minerals, mineral rights and surface Sec. 14: NW/4SW/4, NE/4NE/4 except the N 2 rods and the E 2 rods, NW/4NE/4, NE/4NW/4 Minerals and mineral rights Sec. 14: NE/4NE/4 the N 2 rods, NE/4NE/4 the E 2 rods except the N 2 rods, S/2NE/4, SE/4 Minerals and mineral rights, including the interest in the surface thereof owned by the State, if any
640.00
MM 10379-N 3/4/2011 50
years 3.95% 0.55% Yes
Township 49 North, Range 22 West, Aitkin County, Minnesota Sec. 24: W/2NE/4, SE/4NE/4, S/2SW/4, E/2SE/4, W/2SE/4, NE/4NE/4, NE/4NW/4, undivided ¾ interest in NW/4NW/4, undivided ¾ interest in SW/4NW/4, undivided ¾ interest in NE/4SW/4, undivided ¾ interest in NW/4SW/4 Minerals and mineral rights
600.00

Document Number
Revision
Page
Rev Date
G4932-RPT-01 0 08 Jan 2021 56
Talon Metals Corp. – Preliminary Economic Assessment #3 on the Tamarack North Project
State Lease Number
Start Date Term Base
Royalty Additional
Royalty
Royalty Escalator Applies
Lands Acreage
MLMB200001 3/3/2016 50 3.95% 0.75% Yes
Township 49 North, Range 22 West, Aitkin County, Minnesota
Sec. 15: undivided 1/3 interest in NE1/4-NW1/4, undivided 2/3 interest in NW1/4-NW1/4, undivided 1/3 interest in NW1/4-NW1/4, undivided 2/3 interest in SW1/4-NW1/4, undivided 1/3 interest in SW1/4-NW1/4, undivided 1/3 interest in SE1/4-NW1/4, undivided 1/3 interest in NE1/4-SW1/4, undivided 1/3 interest in NW1/4-SW1/4, undivided 2/3 interest in SW1/4-SW1/4, undivided 1/3 interest in SW1/4-SW1/4, undivided 1/3 interest in SE1/4-SW1/4, undivided 1/3 interest in NE1/4-SE1/4, undivided 1/3 interest in NW1/4-SE1/4 SE1/4-SE1/4, undivided 1/3 interest in SE1/4-SE1/4
Mineral and mineral rights
Sec. 15: undivided 2/3 interest in NE1/4-NW1/4, undivided 2/3 interest in SE1/4-NW1/4, undivided 2/3 interest in NE1/4-SW1/4, undivided 2/3 interest in NW1/4-SW1/4, undivided 2/3 interest in SE1/4-SW1/4, undivided 2/3 interest in NE1/4-SE1/4, undivided 2/3 interest in NW1/4-SE1/4, undivided 2/3 interest in SW1/4-SE1/4, undivided 2/3 interest in SE1/4-SE1/4
Mineral, mineral rights, and surface rights
640
MLMB200002 3/3/2016 50 3.95% 0.75% Yes
Township 49 North, Range 22 West, Aitkin County, Minnesota
Sec. 16: W1/2-NE1/4, NW1/4, S1/2, E1/2-NE1/4
Mineral and mineral rights
640
MLMB200003 3/3/2016 50 3.95% 0.75% Yes
Township 49 North, Range 22 West, Aitkin County, Minnesota
Sec. 21: NE1/4
Mineral and mineral rights
160
MLMN200001 2/24/2017 50 3.95% 0.50% Yes
Township 48 North, Range 22 West, Aitkin County, Minnesota
Sec. 5: Lot Four, SW1/4, S1/2-SE1/4
- Mineral and mineral rights
Sec. 5: Lot One, Lot Two, S1/2-NE1/4, Lot Three, N1/2-SE1/4
Mineral, mineral rights and surface rights
556.31
MLMN200028 2/24/2017 50 3.95% 0.50% Yes
Township 48 North, Range 22 West, Aitkin County, Minnesota
Sec. 6: S1/2-NE1/4, SE1/4-NW1/4, E1/2-SW1/4, Lot Six, Lot Seven, SE1/4
Mineral and mineral rights
Sec. 6: Lot Two, Lot Three, Lot Four, Lot Five
Mineral, mineral rights, and surface rights
581.71
MLMN200029 2/24/2017 50 3.95% 0.50% Yes
Township 49 North, Range 22 West, Aitkin County, Minnesota
Sec. 21: undivided ½ interest NE1/4-SW1/4, undivided ½ interest NW1/4-SW1/4, undivided ½ interest SW1/4-SW1/4, undivided ½ interest SE1/4-SW1/4, undivided ¾ interest SE1/4-SE1/4
Mineral and mineral rights
110

Document Number
Revision
Page
Rev Date
G4932-RPT-01 0 08 Jan 2021 57
Talon Metals Corp. – Preliminary Economic Assessment #3 on the Tamarack North Project
4.2.6.3 Private Mineral Leases, Surface Use Agreements and Options to Purchase
In addition to the State Leases, the parties hold a surface use agreement covering privately
owned surface interests (Private Agreement). There is currently one Private Agreement,
which covers approximately 38 acres of surface use within the Tamarack North Project area.
Table 4-3 provides further information on the Private Agreement.
Kennecott has also entered into easement agreements with certain property owners which
allow the parties to install and monitor groundwater monitoring wells for a nominal annual
fee.
Table 4-3: Summary of Private Agreement
Type of Agreement
Term Annual Fee
(US$) Lands Acreage
Lease and Option Agreement
May 1/18 to May 1/22
5,000
Township 49 North, Range 22 West, Aitkin County, Minnesota
Sec. 22: SWSW
Surface Only
38.2
4.2.6.4 Fee and Mineral Surface Interests
The parties also own fee surface and/or mineral interests, which cover approximately 1,580
acres of land within the Tamarack North Project area. Details of the fee surface and mineral
interests are detailed in Table 4-4. In certain instances, as part of the purchase price paid
for the mineral rights, Kennecott agreed (in its previous capacity of Manager under the
Original MVA) to pay a royalty to the previous mineral rights owner. The royalties range from
a 2% NSR to a 3.9% NSR. There are also buy-back rights on certain of these royalties.
Table 4-4: Summary of Fee Mineral and Surface Interests
Township Range Section Acreage
48 North 22 West Sec. 3: NW/4 SW/4, SW/4 NW/4 except Parcel Nos. 8 and 9
80
(Surface and Mineral)
49 North 22 West Sec. 22: SE/4SW/4 40
(Surface and Mineral)
48 North 22 West Sec. 3: Government Lot 3 26.54
(Surface Only)
49 North 22 West Sec 35: NW/4, NW/4 NE/4, NE/4 NW/4 240
(Surface and Mineral)

Document Number
Revision
Page
Rev Date
G4932-RPT-01 0 08 Jan 2021 58
Talon Metals Corp. – Preliminary Economic Assessment #3 on the Tamarack North Project
Township Range Section Acreage
48 North 22 West Sec. 3: SW/4 SW/4 except parcel no. 7 40
(Surface Only)
48 North 22 West Sec. 3: NE/4 SW/4 40
(Surface Only)
49 North 22 West Sec. 22: SE/4 SE/4 except Parcel No. 28 36
(Surface and Mineral)
49 North 22 West Sec. 22: SW/4 SE/4 excepting certain lands
36.5
(Part Surface and Minerals,
Part Surface Only)
48 North 22 West Sec. 10: NW/4 SW/4 except Parcel No.6, Highway Plat No. 10; NE/4
198
(Surface Only)
48 North 22 West Sec. 4: SE/4 NE/4 38.18
(Surface Only)
48 North 22 West Sec. 4: NW/4 SE/4 40
(Surface Only)
48 North 22 West Sec. 10: S/2 SW/4, SW/4 SE/4
Sec. 15: NE/4 NW/4 excepting certain lands
177.92
(Surface Only)
49 North 22 West
Sec. 26: W/2NW/4
Sec. 26: N/2 NE/4 SW/4, SE/4 NE/4 SW/4, NW/4 SE/4
Sec. 27: NE less 10 acres in the NW corner
300
(Surface and Minerals)
(Surface)
(Surface and Mineral)
49 North 22 West Sec. 34: NE/4SW/4, SE/4SW/4, SW/4SW/4 excepting certain lands
118.01
(Surface Only)
48 North 22 West Sec. 4: The South 561’ of Lot 1 16.51
(Surface and Mineral)
49 North 22 West Sec. 27: NWNW excepting certain lands 36.49
(Surface Only)
49 North 22 West Sec. 27: SWNW excepting certain lands 37.96 (Surface Only)
49 North 22 West Sec. 27: NWSW excepting certain lands
Sec. 27: SENW excepting certain lands
78.18
(Surface and Mineral)
(Surface Only)
Surface Rights
The State Leases also grant the parties the right to use surface lands owned by the State of
Minnesota within the leased land.
From a legal standpoint, where surface rights are owned by third parties, the State Leases
provide that written notice to the owner of the surface estate must be provided at least 20
days in advance of surface activities and contemplate compensation payable by lessees to
surface owners for any disturbance of the surface estate. Many states also address the rights

Document Number
Revision
Page
Rev Date
G4932-RPT-01 0 08 Jan 2021 59
Talon Metals Corp. – Preliminary Economic Assessment #3 on the Tamarack North Project
of surface owners in case law, and although the Minnesota Supreme Court has not
specifically opined on the issue, the general rule is that mineral rights carry with them the
right to use as much of the surface as reasonably necessary to reach and remove the
minerals, unless otherwise restricted by the mineral severance deed. Guidance provided by
the MDNR takes this approach.
Notwithstanding the above, to date, Kennecott’s approach (initially as sole owner of the
Tamarack North Project and then in its capacity as Manager under the Original MVA) for
surface access over areas that it is interested in drilling has been to negotiate with the
applicable surface land owner a surface use agreement. Also, in certain cases, Kennecott
(initially as sole owner of the Tamarack North Project and then in its capacity as Manager
under the Original MVA) negotiated an option to purchase the surface lands.
In the case of Private Agreements where there has been no severance of the surface and
mineral estates, surface use is provided as part of the mineral lease. Where the mineral and
surface estates are severed and where surface rights are held privately, surface access has
typically been negotiated with the surface owner.
The surface rights held under the 2018 Tamarack Earn-in Agreement are detailed in Table
4-4.
Tax Forfeiture and Leasing of Mineral Rights
The Minnesota Severed Mineral Interests Law (Forfeiture Law) requires owners of severed
mineral interests (i.e. mineral rights that are owned separately from the surface interest) to
register their interests with the office of the county recorder.
Severed mineral interests are taxed. If the mineral interest owner does not file the severed
mineral interest statement within the deadline provided by the law, the mineral interest
forfeits to the State after notice and an opportunity for a hearing.
The owner, to avoid forfeiture, must prove to the court that the taxes were timely paid and
that the county records specified the true ownership, or, in the alternative, that procedures
affecting the title of the interest had been timely initiated and pursued by the true owner
during the time when the interest should have been registered. To the extent the owner fails
to prove this, the forfeiture to the State is deemed to be absolute. Additionally, if the owner

Document Number
Revision
Page
Rev Date
G4932-RPT-01 0 08 Jan 2021 60
Talon Metals Corp. – Preliminary Economic Assessment #3 on the Tamarack North Project
of record fails to show up to the hearing, the forfeiture to the State is also deemed to be
absolute.
The State may lease mineral rights prior to the completion of the forfeiture procedures,
provided that the leased rights are limited to exploration activities, exploratory boring,
trenching, test pitting, test shafts and drifts, and related activities. A lessee under such a
lease may not mine the leased mineral rights until the forfeiture procedures are completed.
The State may have obtained interests in certain of the mineral rights leased under one or
more of the State Leases pursuant to the Forfeiture Law and the forfeiture procedures may
not have been completed for all the lands covered by these State Leases (forfeiture
procedures are not required to have been completed until a lessee is looking to mine a
property).
Until the forfeiture procedures have been completed, there is a remote risk that the owner of
a mineral interest that the State has leased for the Tamarack North Project will demonstrate
at a required hearing that the owner was in compliance with the registration and taxation
requirements as detailed above. In such a case, the mineral rights would revert to this
original owner. However, the State Leases that compose the area where the mineral
resources are contained are not at risk of reversion to an original owner under Forfeiture
Law.
4.3 Permitting for Exploration
The Tamarack North Project is currently in the exploration phase. It is understood that
Kennecott (previously as Operator under the 2014 Earn-in Agreement, and then in its
capacity as Manager under the Original MVA) had all the required permits and approvals for
exploration operations. Going forward, Talon, in its capacity as Operator under the 2018
Tamarack Earn-in Agreement, is responsible for making application for the required permits
and approvals for exploration. Federal, state, and local entities all have regulatory authority
over various elements of the Tamarack North Project. Key agencies involved with project
permitting will include the US Army Corps of Engineers (USACE), US Fish and Wildlife
Service, MDNR, State Historic Preservation Office (SHPO), Minnesota Department of Health
(MDH), Minnesota Pollution Control Agency (MPCA), Aitkin County, Carlton County, and

Document Number
Revision
Page
Rev Date
G4932-RPT-01 0 08 Jan 2021 61
Talon Metals Corp. – Preliminary Economic Assessment #3 on the Tamarack North Project
City of Tamarack. Information on permits and approvals required for pursuing exploration
operations at the Tamarack North Project is provided in Table 4-5 below.
Table 4-5: Summary of Current and Potential Exploration Permits/Approvals
Federal
Agency Permit/Approval
USACE Clean Water Act – Section 404 Permit
SHPO National Historic Preservation Act – Section 106
US Fish & Wildlife Service Endangered Species Act Compliance – Section 7
State
Agency Permit/Approval
MDNR Exploration Plan
MDH Explorer’s License and Designated Responsible Individual; Exploratory Boring Notification
MDH Temporary and Permanent Sealing Reports
MPCA NPDES/SDS Construction Storm Water Permit (General Permit)
MPCA NPDES/SDS Industrial & Storm Water Discharge Permit (General Permit)
MPCA Storm Water Pollution Prevention Plan
MDNR Burning Permit
MDNR Permit to Work in Public Waters, including Public Waters Wetlands
MDNR Water Appropriation Permit
MDNR Wetland Conservation Act approvals for activities impacting certain wetlands
MDNR Threatened and Endangered Species Review
Local
Agency Permit/Approval
City of Tamarack Zoning and Building Permits
County Conditional Use Permit
County Zoning Permits
4.4 Environmental
Baseline Work
Kennecott (initially as owner, and then in its capacity of Manager under the Original MVA)
initiated baseline studies to support future environmental review and permitting of a potential
mine at the Tamarack North Project. Work to date has included surface water and
groundwater monitoring; wetland delineation and evaluation surveys; and RTE species and
vegetative community surveys.

Document Number
Revision
Page
Rev Date
G4932-RPT-01 0 08 Jan 2021 62
Talon Metals Corp. – Preliminary Economic Assessment #3 on the Tamarack North Project
Initiated in 2007/2008, Kennecott monitored 23 surface water locations and 12 ground water
wells. As of 2014, Kennecott operated the regular, quarterly, monitoring of 19 surface water
monitoring locations (18 streams/ditches and one lake) and 12 groundwater monitoring
wells. Kennecott has also completed a limited amount (14 samples from six rock units) of
static short-term acid-base accounting and leaching tests on various rock types.
Independent oversight and sign-off of the sampling and analysis was completed by Foth, of
De Pere, Wisconsin.
Since taking over operations of the Tamarack project, Talon has continued the
environmental baseline program initiated by Kennecott. Field parameters are collected from
all 19 surface water monitoring sites in quarters two and four, groundwater measurements
are read quarterly and samples for laboratory analysis and field parameters are collected
annually.
Talon has started data collection for future bedrock hydrology studies, with the installation
of two nested vibrating wire piezometers (VWPs). Future environmental work will include but
not be limited to planning the Tamarack project’s waste characterization program, continuing
the bedrock hydrology/hydrogeology studies and initial air quality monitoring.
Environmental Liabilities
Talon has advised the QP that it is not aware of the property having any environmental
liabilities. A review of the MPCA’s “What’s in my Neighbourhood” database was completed
for the property by Talon, and no contaminated site records were identified. The QP has not
independently verified this information as described in Item 3 of this report.
Significant Risk Factors
Talon has advised the QP that it is not aware of any significant factors or risks which may
affect access, title, or the right or ability to perform work on the Tamarack North Project. The
QP has not independently verified this information as described in Item 3 of this report.

Document Number
Revision
Page
Rev Date
G4932-RPT-01 0 08 Jan 2021 63
Talon Metals Corp. – Preliminary Economic Assessment #3 on the Tamarack North Project
ACCESSIBILITY, CLIMATE, LOCAL RESOURCES, INFRASTRUCTURE & PHYSIOGRAPHY
5.1 Introduction
The Tamarack Project is located in north-central Minnesota, approximately 100 km (62
miles) W of Duluth and 210 km (130 miles) N of Minneapolis, in Aitkin County (Figure 4-1).
The area is characterized by farms, plantations, wetlands and forested areas. The town of
Tamarack (population 83, 2019 State of Minnesota Demographics Center), which gives the
project its name, lies within the boundaries of the Tamarack North Project (though away from
the known mineralization) at an elevation of 386 m above sea level (mASL). The Tamarack
Project’s field office is located in the city of Tamarack. Other small towns in the area are
Wright (10 km east (E) from Tamarack) and McGregor (15 km W from Tamarack).
5.2 Accessibility
Access to the Tamarack North Project is via paved state and county highways and roads.
From the city of Duluth, the Tamarack North Project can be accessed by Interstate 35 S for
32 km and then onto State Highway 210 W for 61 km to the town of Tamarack. The Tamarack
North Project is easily accessible from Tamarack by paved road, with the current known
mineralization located approximately 500 m laterally from a paved all-weather road.
5.3 Physiography
The Tamarack North Project transitions between the Minnesota/Wisconsin Upland Till Plain
and the Glacial Lakes Upham and Aitkin ecoregion as defined by the Environmental
Protection Agency (EPA) (Level III and IV Ecoregions of Minnesota, June 2015). The
topography is level to gently rolling as is typical of old glacial lake plains. The soils are
dominated by clay-silt to silty-sand Culver associated moraine deposits or by silty sand to
sandy silt with clay interpreted as reworked pre-existing lake and stream sediments. Peat
bogs are also found overlying the glacial till in the area (Jennings and Kostka, 2014). Relief
is minimal, and where found is generally a result of small till moraines. As a result of the flat
to gentle relief, poor drainage has allowed the area to be dominated by lowland conifers
surrounding sedge meadows and marshland. Areas of higher relief will support aspen-birch
and upland conifers.

Document Number
Revision
Page
Rev Date
G4932-RPT-01 0 08 Jan 2021 64
Talon Metals Corp. – Preliminary Economic Assessment #3 on the Tamarack North Project
5.4 Climate
The climate of Minnesota is typical of a continental climate, with hot summers and cold
winters. Minnesota's location in the Upper Midwest allows it to experience some of the widest
variety of weather in the US, with each of the four seasons having its own distinct
characteristics. The annual average temperature at the Tamarack North Project is 5°C. The
temperature averages a high of -7°C and a low of -18°C in January and a high of 26°C and
a low of 13°C in July. Annual rainfall averages approximately 764 mm. Annual snowfall
averages 142 centimetres (cm). (Tamarack Weather Averages, November 2017).
Exploration operations at the Tamarack North Project can be conducted throughout the
whole year (subject to any permitting restrictions) and future mining activities could be
conducted on a year-round basis.
5.5 Local Resources
The mining support industries and industrial infrastructure in Minnesota are well developed
and of a high standard, though most of the mining in the State occurs in the Mesabi Iron
Range approximately 150 km to the northeast (NE). Any exploration and mining efforts will
be well served by an extensive talent pool located throughout the area.
5.6 Sufficiency of Surface Rights
The Tamarack North Project has an extensive package of surface rights previously secured
by Kennecott (previously as Operator under the 2014 Earn-in Agreement, and then as
Manager under the Original MVA) (Figure 4-2). The parties have sufficient rights to allow for
mining operations and supporting infrastructure in the area of mining interest.

Document Number
Revision
Page
Rev Date
G4932-RPT-01 0 08 Jan 2021 65
Talon Metals Corp. – Preliminary Economic Assessment #3 on the Tamarack North Project
HISTORY
6.1 Discovery
Starting in 1972, the Minnesota Geological Survey (MGS) oversaw a 12-year program to
collect high-resolution airborne magnetic data over the entire State, including the Tamarack
area. The program was paid for by a penny per pack tax on cigarettes sold in the State. This
program ran concurrently to an MDNR-sponsored program of regional lake sediment
sampling. As part of the follow up to the airborne surveys, the State carried out a program
of scientific drilling to try to identify the bedrock source of selected magnetic anomalies.
Information from MDNR staff involved with the program indicates that the magnetic
anomalies were prioritized by the presence of anomalous lake sediment geochemistry. This
is reported as being the case for the TIC, with two local lakes being anomalous in Ni, Cu and
chromium (Cr).
In the summer of 2000, Kennecott leased mineral title in Aitkin County from the State of
Minnesota covering areas of the Tamarack North Project. There were no apparent non-
ferrous leases in this area previous to Kennecott’s initial leasing (Historic State Nonferrous
Metallic Mineral Leases, October 2017).
Kennecott began exploration on the Tamarack North Project in 2001 when Kennecott flew
an airborne MEGATEM and magnetic survey covering most of the TIC. Ground EM and
gravity surveys were also carried out to refine anomalies identified in the airborne survey.
Prior to 2002, the Tamarack area was subject to only very limited exploration efforts and
there had been no prior mineral production from the Tamarack North Project. The relatively
thick post mineral, glacial fluvial sediment cover and nearly complete lack of bedrock
exposure severely hampered any early exploration (the nearest known bedrock exposure to
the Tamarack North Project is located approximately 15 km to the SE of the deposit).
In the winter of 2002, Kennecott began drilling at the Tamarack North Project (see Section 9
for further details of exploration work conducted by Kennecott). Drilling has occurred
continuously on site since 2002, except for the years 2005 and 2006 (see Section 10 for
further details of the drilling programs conducted by Kennecott).

Document Number
Revision
Page
Rev Date
G4932-RPT-01 0 08 Jan 2021 66
Talon Metals Corp. – Preliminary Economic Assessment #3 on the Tamarack North Project
6.2 Historical Drilling
The historical drilling at the Tamarack Project is restricted to the two drill holes by the MGS
that were targeted as follow-up on anomalies generated by the State Aeromagnetic Survey.
These included AB-6 (1984) located N of the town of Tamarack, which intersected peridotite,
and AB-5 (1984), which was drilled further S and intersected metamorphosed sediments.
This drilling is not part of the current resource but contributes to the overall regional
geological interpretation.
6.3 Kennecott Drilling Programs (2002-2013)
Kennecott has conducted extensive drilling at the Tamarack North Project since 2002. Prior
to Talon’s involvement, this drilling comprised 182 diamond drill holes (Table 6-1, Figure 6-1
and Figure 6-2) totalling 67,541 m with holes between 33.5 m and over 956 m depth for an
average hole depth of 534 m. Drilling had been conducted in both summer and winter
programs.
Drilling at the Tamarack North Project was initiated in the winter of 2002, with L02-01
intersecting broad zones of low-grade (LG) disseminated sulphide mineralization N of the
Tamarack Zone.
Between 2003 and 2004 drilling was limited to a few holes (Table 6-1) with the first multi-
hole program of 13 holes carried out in the winter of 2007, when the first significant
intersection of disseminated sulphide mineralization was made with drill hole 07L031 N of
the Tamarack Zone.
Drilling was stepped up in the summer and winter of 2008 with 51 drill holes after the first
intersections of the SMSU in drill hole 08L042. During the subsequent delineation of the
SMSU Zone in the same year, the MSU was first intersected in drill hole 08TK0049.
Drilling was reduced in 2009 to 15 holes following the economic downturn and mainly tested
new targets while focusing on the 480 Zone to the N of the Tamarack North Project. Drilling
in 2010 followed on from 2009 with 20 holes testing new targets with continued focus on the
480 Zone. Drilling in 2011 included five holes N of the Tamarack Zone.
In 2012, the program was stepped up with 27 holes drilled to the S of the SMSU, with the
first wide intersection of predominantly disseminated mineralization and interlayered net

Document Number
Revision
Page
Rev Date
G4932-RPT-01 0 08 Jan 2021 67
Talon Metals Corp. – Preliminary Economic Assessment #3 on the Tamarack North Project
textured mineralization from drill hole 12TK0138 (in what was later to be called the 138
Zone).
39 holes were drilled during the 2013 campaign. The highlights included the defining of the
138 Zone, the first intercept of massive sulphide veins in meta-sediments in what is referred
to as the 164 Zone (located approximately 1.5 km S of the 138 Zone), and further
encountering of disseminated mineralization to the N of the Tamarack Zone.
Table 6-1: Breakdown of Drilling Conducted by Kennecott to 2013
Year Number of Holes Metres Targets
2002 1 276 CGO Bend
2003 8 2,009 Tamarack, CGO Bend, 221 Zones
2004 3 915 Tamarack, 221 Zone, 164 Zones
2007 13 3,082 Tamarack and CGO Bend Zones
2008 51 19,286 Tamarack, CGO Bend, 221, 480 Zones
2009 15 5,215 Tamarack, 164, CGO Bend, 480 Zones
2010 20 7,347 Tamarack, 142, 164, CGO Bend, 221, 480 Zones
2011 5 1,857 Tamarack, CGO Bend, 480 Zones
2012 27 13,683 Tamarack, 164, 142 Zones
2013 39 13,378 Tamarack, CGO Bend, 142, 164 Zones
TOTAL 182 67,048
Note: Due to pre-collared holes (OB) existing in one year and the full cored hole not drilled/completed till a
following campaign, the hole completion date has been used as the qualifier for Year and Meterage drilled.

Document Number
Revision
Page
Rev Date
G4932-RPT-01 0 08 Jan 2021 68
Talon Metals Corp. – Preliminary Economic Assessment #3 on the Tamarack North Project
Figure 6-1: Plan View Showing the Locations of the Holes Drilled between 2002 and 2013 at
Tamarack North

Document Number
Revision
Page
Rev Date
G4932-RPT-01 0 08 Jan 2021 69
Talon Metals Corp. – Preliminary Economic Assessment #3 on the Tamarack North Project
Figure 6-2: Enlarged Map Showing Localities of Drill Holes, in the Tamarack North Project
(background 1VD magnetic image). Modified from Kennecott Internal Report and Survey Data, 2013
6.4 Kennecott-Talon Drilling Programs (2014-2018)
The drilling programs conducted by Kennecott (in its capacity as Operator under the 2014
Earn-in Agreement) were generally to be focused on the discovery of large tonnage
economic Ni-Cu mineralization compliant with a Rio Tinto Tier One target (large, long-lived,
low cost and upper quartile of worldwide commodity specific deposits). Subsequently
however, the drilling targeted a wide range of purposes: 1) new targets based on current
geologic models, 2) new targets based on geophysical characteristics but no lithologic
knowledge, 3) extrapolation of existing mineralization, and 4) infill/delineation of existing
mineralization.

Document Number
Revision
Page
Rev Date
G4932-RPT-01 0 08 Jan 2021 70
Talon Metals Corp. – Preliminary Economic Assessment #3 on the Tamarack North Project
Figure 6-3: Plan View Showing the Locations of the Holes Drilled between 2014 and 2019 at
Tamarack North
The 2014 drilling season saw 12 new holes drilled primarily concentrated in the Tamarack
Zone. Extension of the MSU/SMSU was the primary focus. The continuation of the CGO

Document Number
Revision
Page
Rev Date
G4932-RPT-01 0 08 Jan 2021 71
Talon Metals Corp. – Preliminary Economic Assessment #3 on the Tamarack North Project
intrusion between the Tamarack and 164 Zones was also tested. A single hole in the 480
Zone tested a magnetic low (Figure 6-3 above).
The 2015 drilling season saw 10 new holes drilled, one historic hole deepened, and two
holes pre-collared through overburden (OB) (Table 6-2 notes). 12LV0143 was deepened
due to a reinterpreted borehole electromagnetic (BHEM) suggesting the possibility of a CGO
intrusion at depth. The 480 Zone was tested targeting further magnetic lows. Several holes
in the 221 Zone tested newly discovered mineralization within a thin “FGO-Like” Brecciated
intrusion that occurred at the contact between a thick overlying CGO intrusive and the host
sedimentary (SED) Thomson Formation. The remaining holes tested for a continuation of
the CGO intrusion S of the Tamarack Zone within the 164 and 142 Zones (Figure 6-3).
2016 drilling saw an aggressive campaign where 19 new holes were drilled, four new wedge
(daughter) holes and the completion of one previously pre-collared hole (15TK0220). Further
drilling testing the newly recognized, but thin mineralization at the base of the CGO intrusion
continued in the 221 and CGO Bend Zones. Extending MSU and infilling both the existing
MSU and SMSU mineralization completed the rest of the drilling.
The 2017 drilling program consisting of 12 holes was primarily focused to the N of the 221
Zone with the minor exception of one hole located to the far W of the 221 Zone and another
in the 164 Zone (Figure 6-3 for locations). One hole consisted of a pre-collared depth (OB).
Four holes were focused on extending previously identified (2009-2010) shallow
mineralization within the 480 Zone. Two holes were in the previously untested western 480
Zone targeted a negative magnetic and a high gravity anomaly. Two holes located in the SW
of the 480 Zone targeted negative magnetic and a low gravity anomaly. One hole located to
the extreme N of the 221 Zone was targeted as a significant step-out of the existing thin,
deep basal mineralization characteristic of the 221 Zone. Drill hole 17TK0261 targeted a
high gravity anomaly approximately 670 m W of the Talon-modeled CGO intrusion. The final
hole within the 164 Zone targeted a potential basal depression in the Talon-modelled FGO
intrusion interpreted from gravity and magnetic data.
The 2018 campaign saw four holes drilled; one new hole in the 480 Zone and three wedge
holes in the 221 Zone. The 480 Zone hole followed up on a DHEM anomaly from previous
drilling. The three wedge holes in the 221 Zone were 25 to 35 m step-outs from hole
15TK0229 looking for extensions of known MSU mineralization.

Document Number
Revision
Page
Rev Date
G4932-RPT-01 0 08 Jan 2021 72
Talon Metals Corp. – Preliminary Economic Assessment #3 on the Tamarack North Project
No drilling was completed in 2019.
Table 6-2: Breakdown of Drilling Conducted by Kennecott-Talon Joint Venture
Year Number of Holes Metres Targets
2014 12 7,298 Tamarack, CGO Bend and 480 Zones
2015 12 7,580 480, 221, Tamarack, 164, and 142 Zones
2016 24 13,596 Tamarack, CGO Bend, and 221 Zones
2017 12 5,456 480, 221, and 164 Zones
2018 4 1,383 480 and 221 Zones
TOTAL 64 35,313
*Hole 12LV0143 was deepened by 494.5m in 2015.
Note: Due to pre-collared holes (OB) existing in one year and the full cored hole not drilled/completed till a
following campaign, the hole completion date has been used as the qualifier for Year and Meterage drilled.
6.5 Mineral Resource Estimates
On October 6, 2014 Talon published a maiden NI 43-101 report and mineral resource
statement estimate (effective date August 29, 2014) for the Tamarack North Project as
shown in Table 6-3 for the 2014 resource statement). The following resource estimates
summarized in Table 6-3 and Table 6-4 are prepared in accordance with NI 43-101 but are
historic in nature. The QP has not completed sufficient work for them to be considered as
being current.
Table 6-3: Tamarack North Project Maiden Resource Statement (Effective Date August 29, 2014)
Domain Mineral Resource
Classification Tonnes
(000) Ni
(%) Cu (%)
Co (%)
Pt (g/t)
Pd (g/t)
Au (g/t)
NiEq (%)
SMSU Indicated Mineral Resource 3,751 1.81 1.00 0.05 0.41 0.25 0.19 2.35
SMSU Inferred Mineral Resource 949 1.12 0.62 0.03 0.25 0.16 0.14 1.47
MSU Inferred Mineral Resource 158 5.25 2.47 0.11 0.66 0.44 0.22 6.42
138 Zone Inferred Mineral Resource 2,012 0.95 0.78 0.03 0.23 0.14 0.17 1.33
TOTAL Indicated Mineral Resource 3,751 1.81 1.00 0.05 0.41 0.25 0.19 2.35
TOTAL Inferred Mineral Resource 3,119 1.22 0.82 0.03 0.26 0.16 0.16 1.63
All resources reported above a 0.9% NiEq cut-off.
Mining recovery and dilution factors have not been applied to the estimates.
Tonnage estimates are rounded down to the nearest 1,000 tonnes.
Estimates do not include metallurgical recovery.
*Where used in this Mineral Resource estimate, NiEq% = Ni%+ Cu% x 2.91/9.20 + Co% x 14/9.20 + Pt
[g/t]/31.103 x 1,400/9.2/22.04 + Pd [g/t]/31.103 x 600/9.2/22.04 + Au [g/t]/31.103 x 1,300/9.2/22.04

Document Number
Revision
Page
Rev Date
G4932-RPT-01 0 08 Jan 2021 73
Talon Metals Corp. – Preliminary Economic Assessment #3 on the Tamarack North Project
An updated mineral resource statement estimate was publicly disclosed in a press release
(effective dated April 3, 2015) entitled “Talon Metals Announces 167% Increase in Tonnage
for the Inferred Massive Sulphide Resource, and an Increase in Grade from 6.42% to 7.26%
NiEQ in the Massive Sulphide Unit at Tamarack” resulting from an increase in the MSU
mineralization (see Table 6-4). A technical report was not published at the time, as the
increase was determined as to be not being material to the overall project tonnage.
Table 6-4: Tamarack North Project Updated Mineral Resource Estimate (Effective Date April 3, 2015)
Domain Mineral Resource
Classification Tonnes
(000) Ni
(%) Cu (%)
Co (%)
Pt (g/t)
Pd (g/t)
Au (g/t)
NiEq (%)
SMSU Indicated Mineral Resource 3,751 1.81 1.00 0.05 0.41 0.25 0.19 2.35
SMSU Inferred Mineral Resource 949 1.12 0.62 0.03 0.25 0.16 0.14 1.47
MSU Inferred Mineral Resource 422 6.00 2.48 0.013 0.78 0.53 0.26 7.26
138 Zone Inferred Mineral Resource 2,012 0.95 0.78 0.03 0.23 0.14 0.17 1.33
TOTAL Indicated Mineral Resource 3,751 1.81 1.00 0.05 0.41 0.25 0.19 2.35
TOTAL Inferred Mineral Resource 3,386 1.63 0.94 0.04 0.31 0.19 0.17 2.11
All resources reported above a 0.9% NiEq cut-off.
Mining recovery and dilution factors have not been applied to the estimates.
Tonnage estimates are rounded down to the nearest 1,000 tonnes.
Estimates do not include metallurgical recovery.
*Where used in this Mineral Resource estimate, NiEq% = Ni%+ Cu% x 2.91/9.20 + Co% x 14/9.20 + Pt
[g/t]/31.103 x 1,400/9.2/22.04 + Pd [g/t]/31.103 x 600/9.2/22.04 + Au [g/t]/31.103 x 1,300/9.2/22.04
An updated mineral resource statement estimate was publicly disclosed in a technical report
and published in the release (effective dated February 15, 2018) entitled “Talon Metals Files
Updated National Instrument 43-101 Technical Report on the Tamarack North Project”
resulting from an increase in the MSU mineralization (see Table 6-5).

Document Number
Revision
Page
Rev Date
G4932-RPT-01 0 08 Jan 2021 74
Talon Metals Corp. – Preliminary Economic Assessment #3 on the Tamarack North Project
Table 6-5: Tamarack North Project Maiden Resource Statement (Effective Date February 15, 2018)
Domain Mineral Resource
Classification Tonnes
(000) Ni
(%) Cu (%)
Co (%)
Pt (g/t)
Pd (g/t)
Au (g/t)
NiEq (%)
SMSU Indicated Resource 3,639 1.83 0.99 0.05 0.42 0.26 0.2 2.45
Total Indicated Mineral Resource 3,639 1.83 0.99 0.05 0.42 0.26 0.2 2.45
SMSU Inferred Mineral Resource 1,107 0.9 0.55 0.03 0.22 0.14 0.12 1.25
MSU Inferred Mineral Resource 570 5.86 2.46 0.12 0.68 0.51 0.25 7.24
138 Zone Inferred Mineral Resource 2,705 0.95 0.74 0.03 0.23 0.13 0.16 1.38
Total Inferred Mineral Resource 4,382 1.58 0.92 0.04 0.29 0.18 0.16 2.11
All resources reported at a 0.83% NiEq cut-off.
No modifying factors have been applied to the estimates
Tonnage estimates are rounded to the nearest 1,000 tonnes. Metallurgical recovery factored in to the reporting cut-off *Where used in this Mineral Resource estimate, NiEq% = Ni%+ Cu% x $3.00/$8.00 + Co% x $12.00/$8.00 + Pt [g/t]/31.103 x $1,300/$8.00/22.04 + Pd [g/t]/31.103 x $700/$8.00/22.04 + Au [g/t]/31.103 x $1,200/$8.00/22.04
The 2014, 2015 and 2018 mineral resource estimates are no longer current and the QP has
not completed sufficient work to consider either the 2014, 2015 or 2018 mineral resource
estimates as current and therefore, they should not be relied upon.
The 2014, 2015 and 2018 estimates were completed in accordance with NI 43-101 and
following the requirements of Form 43-101F1. The mineral resource estimates followed the
CIM Estimation of Mineral Resource and Mineral Reserves Best Practices Guidelines
(November 2003) and were classified according to CIM Definition Standards for Mineral
Resources & Mineral Reserves (May 2014).
The mineral resource estimates were derived using a geostatistical block modeling approach
based on linear interpolation of the drill hole assay data available at the time of reporting.
For more information, the reader may refer to the 2014 Technical Report filed on Sedar.com
and Referenced in Item 27.
A detailed chronology of business agreements, decisions, and developments between
Kennecott and Talon with respect to the Tamarack Project is contained in Section 4.

Document Number
Revision
Page
Rev Date
G4932-RPT-01 0 08 Jan 2021 75
Talon Metals Corp. – Preliminary Economic Assessment #3 on the Tamarack North Project
GEOLOGICAL SETTING AND MINERALIZATION
7.1 Regional Geological Setting; Introduction
The TIC is an ultramafic to mafic intrusive, hosting Ni-Cu-Co sulphide mineralization with
associated PGEs and Au. The intrusion of the TIC (minimum age of 1105 Ma+/-1.2 Ma,
Goldner 2011) is related to the early evolution of the approximately 1.1 Ga Mesoproterozoic
MCR and has intruded into slates and greywackes of the Thomson Formation of the Animikie
Group which formed as a foreland basin during the Paleoproterozoic Penokean Orogen
(approximately 1.85 Ga, Goldner 2011). The TIC is completely buried beneath
approximately 30 to 60 m of Quaternary age glacial and fluvial sediments.
The lack of outcrop has limited the understanding of the TIC in its regional geological context
relative to its location in the deformed southern margin of the Animikie Basin. The TIC is
completely buried beneath approximately 30 to 60 m of Quaternary age glacial and fluvial
sediments The TIC is intruding part of the Penokean accreted terrain, based on the age of
the CGO intrusion (Goldner, 2011). The closest known portion of the accreted Penok.ean
magmatic Arc terrane is located well to the S and E of the TIC. The TIC intrudes deformed
sediments deposited in part in foreland basin in front of the accreted terrane, which likely
was in turn dissected by subsequent rifting associated with the MCR and thus has
contributed to a complex geological and structural setting. The regional geological setting is
described below within the context of the major depositional periods and tectonic events
(Figure 7-1 and Figure 7-2).

Document Number
Revision
Page
Rev Date
G4932-RPT-01 0 08 Jan 2021 76
Talon Metals Corp. – Preliminary Economic Assessment #3 on the Tamarack North Project
Figure 7-1: Major Depositional Periods and Structural Events Affecting Geological Emplacement and
history of the TIC - Modified After Lundin Mining Corporation (2013)
Figure 7-2: Regional Geological and Tectonic Setting for the TIC. The Great Lakes Tectonic Zone
(GLTZ) Structure Represents an Inferred Position Due to Younger, Overlying Lithology - Modified
from Khirkham (1995) and Lundin Mining Corporation (2013)

Document Number
Revision
Page
Rev Date
G4932-RPT-01 0 08 Jan 2021 77
Talon Metals Corp. – Preliminary Economic Assessment #3 on the Tamarack North Project
Archean Stratigraphy and the Great Lakes Tectonic Zone (GLTZ)
Archean basement and supra-crustal rocks underlie the Paleoproterozoic Animikie SED
Basin. The nearest outcrop of Archean basement rocks is located 35 km to the S of the TIC
in the McGrath gneiss dome. In western Minnesota, the Archean is divided into an older,
southern block referred to as the Minnesota River Valley (MRV) Terrane and the northern
Wawa Sub-province of the Archean Superior Craton (Figure 7-1).
The southern Paleoarchean MRV Terrane comprises 3.3 Ga gneiss, migmatite and
amphibolite of predominantly Middle Archean age, intruded by Late Archean granitoids.
The northern Wawa Sub-province comprises late Archean (2.6-2.7 Ga) supra-crustal rocks
intruded by a variety of intrusions. Wawa Sub-province rocks are believed to form the
basement beneath the southern part of the Animikie Basin at Tamarack.
A broad E-W striking regional structural zone marks the boundary between the MRV Terrane
and the Wawa Sub-province and is referred to as the GLTZ (Figure 7-2). The GLTZ can be
inferred eastward from western Minnesota into northern Michigan. Kinematic analysis in the
only known outcrop of the GLTZ S of Marquette, Michigan suggests the GLTZ at this location
dips steeply southward, and that vergence was to the northwest (NW), indicative of an
oblique collision that brought the Paleoarchean rocks over the younger Archean rocks of the
Wawa Sub-province (Sims et al., 1993). The collision along the GLTZ is believed to have
occurred between 2692-2686 Ma (Schneider et al., 2002).
The GLTZ appears to have played a direct role in localizing later Paleoproterozoic
sedimentation and volcanism. Possible structures related to the GLTZ may have localized
other Paleoproterozoic SED basins and later MCR related intrusions in the region (Owen et
al., 2013). Although the exact location of GLTZ beneath the Animikie Basin is uncertain, it
has been interpreted by Holm et al. (2007) to occur just S of the TIC. Based on this
interpretation it may be possible that it played a role in the localization of the Tamarack
intrusion.
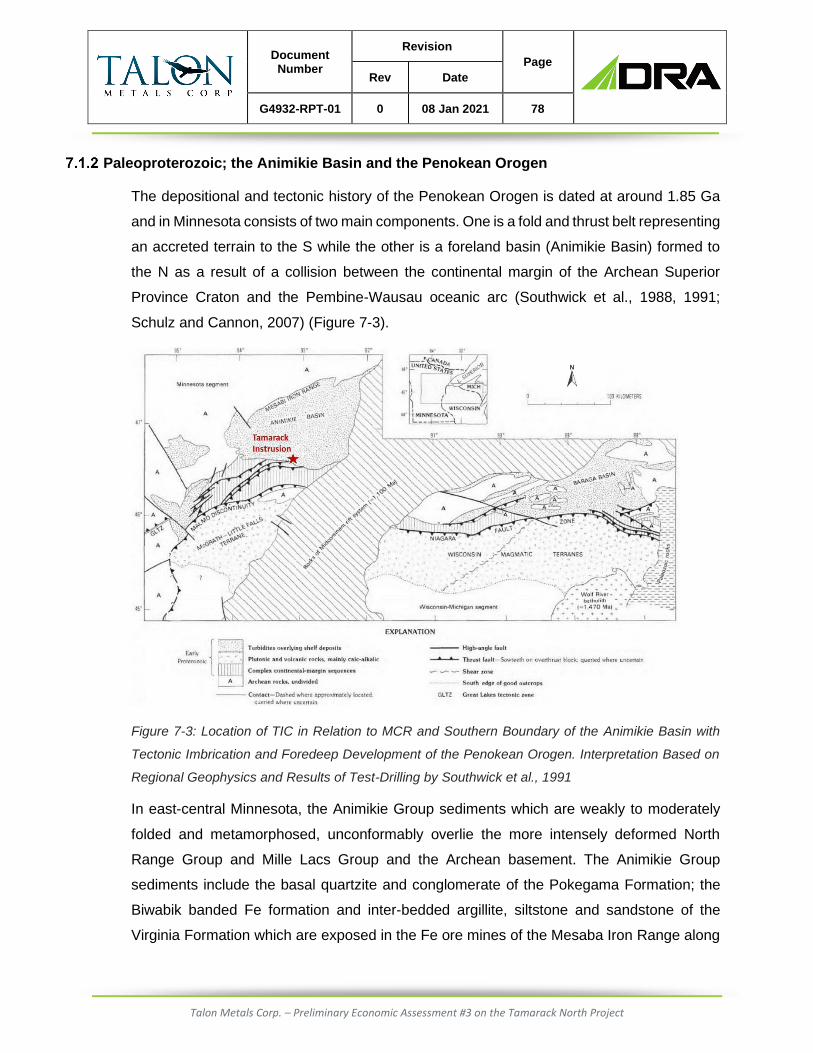
Document Number
Revision
Page
Rev Date
G4932-RPT-01 0 08 Jan 2021 78
Talon Metals Corp. – Preliminary Economic Assessment #3 on the Tamarack North Project
Paleoproterozoic; the Animikie Basin and the Penokean Orogen
The depositional and tectonic history of the Penokean Orogen is dated at around 1.85 Ga
and in Minnesota consists of two main components. One is a fold and thrust belt representing
an accreted terrain to the S while the other is a foreland basin (Animikie Basin) formed to
the N as a result of a collision between the continental margin of the Archean Superior
Province Craton and the Pembine-Wausau oceanic arc (Southwick et al., 1988, 1991;
Schulz and Cannon, 2007) (Figure 7-3).
Figure 7-3: Location of TIC in Relation to MCR and Southern Boundary of the Animikie Basin with
Tectonic Imbrication and Foredeep Development of the Penokean Orogen. Interpretation Based on
Regional Geophysics and Results of Test-Drilling by Southwick et al., 1991
In east-central Minnesota, the Animikie Group sediments which are weakly to moderately
folded and metamorphosed, unconformably overlie the more intensely deformed North
Range Group and Mille Lacs Group and the Archean basement. The Animikie Group
sediments include the basal quartzite and conglomerate of the Pokegama Formation; the
Biwabik banded Fe formation and inter-bedded argillite, siltstone and sandstone of the
Virginia Formation which are exposed in the Fe ore mines of the Mesaba Iron Range along

Document Number
Revision
Page
Rev Date
G4932-RPT-01 0 08 Jan 2021 79
Talon Metals Corp. – Preliminary Economic Assessment #3 on the Tamarack North Project
the northern margin of the Animikie Basin. In the N of the basin these sediments are only
weakly metamorphosed, but metamorphism and deformation increase towards the S where
similar sediments have a well-developed axial planer foliation and are folded into N verging
upright folds which become increasingly tighter and possibly overturned along the S margin
of the basin. These more deformed and metamorphosed sediments are referred to as the
Thomson Formation and have been interpreted to be the deformed equivalents of the
Virginia Formation (Severson et al, 2003). Boerboom (2009) has subdivided the Thomson
Formation into Upper and Lower sequences. The Lower sequence comprises carbonaceous
siltstone and mudstone that is locally sulphide rich; and a proposed source for the sulphide
in the TIC. The Upper Thomson consists of turbidite-like siltstone and sandstone.
At the Tamarack North Project, the host rocks to the TIC are the Upper Thomson Formation.
The Lower Thomson Formation which sub-crops to the S of Tamarack North Project, dips
towards the N (beneath the Upper Thomson Formation), and is interpreted to underlie the
TIC at depth. A prominent seismic reflector under the TIC deposit at a depth of 4.6 to 4.8 km
may represent the unconformity of the crystalline basement or potentially the base of the
Lower Thomson Formation in the TIC area (Goldner 2011).
Mesoproterozoic Mid-Continental Rift (MCR)
The Mesoproterozoic MCR is represented by a large igneous province that formed from
intra-continental rifting at approximately 1.1 Ga (Hutchinson et al., 1990) resulting from a
mantle plume. The MCR extends along a 2,000 km arcuate path from the Lake Superior
region to the southwest (SW) as far as Kansas and to the SE beneath Lower Michigan (Hinze
et al., 1997). Although only exposed in the Lake Superior area, the extent of the MCR
beneath younger cover can be interpreted from its pronounced gravity and aeromagnetic
signature.
In the Lake Superior region, the Keweenaw Flood Basalt province represents the exposed
portion of the MCR system. Seismic data indicates the rift below Lake Superior is filled with
more than 25 km of volcanic rocks buried beneath a total thickness of up to 8 km of rift
sediments (Bornhorst et al., 1994).
The Keweenaw Flood Basalt province was formed over a period of approximately 23 Ma
(Miller and Vervoort, 1996) and shows various magnetic polarity reversals. Volcanism

Document Number
Revision
Page
Rev Date
G4932-RPT-01 0 08 Jan 2021 80
Talon Metals Corp. – Preliminary Economic Assessment #3 on the Tamarack North Project
occurred in distinct phases, with an earlier phase dominated by low alumina basalts (<15%
Al2O3) that include both olivine and pyroxene phyric picrites. These may have been derived
from primitive magmas tapping a deep mantle source. The later volcanic phases are
dominated by high alumina basalts (>15% Al2O3) with Mid Ocean Ridge Basalt like
chemistry. The evolution of the MCR closely resembles that of other large igneous provinces
such as the North Atlantic Igneous Province and the Siberian Traps. In the North Atlantic
Igneous Province, picritic volcanic rock, associated with an early phase of “plateau like” flood
basalts, are spread out over an area of 2,000 km (Larsen et al., 2000).
In addition to the extrusive rocks, a large volume of intrusive rocks was emplaced and
include the Duluth Complex, the Mellen Complex, the Coldwell Complex, the Beaver Bay
Complex and the Nipigon Sill Complex, in addition to numerous dyke swarms and sills that
may have acted as feeders for lava flows along the flanks of the rift. The TIC is one of the
numerous smaller satellite intrusions which also include Eagle; Echo Lake; Bovine Intrusive
Complex intrusions in upper Michigan; the Coldwell Complex near Marathon, Ontario; the
Seagull Lake; Kitto, and Disraeli Lake intrusions in the Lake Nipigon area; and the Crystal
Lake Gabbro in the Thunder Bay area (Goldner 2011, Figure 7-4). Many of these smaller
intrusions, relative to the MCR volcanics, are falling within the same time frame, occur
distally, and have more primitive melt signatures. They are interpreted to represent the early
evolution of the MCR.

Document Number
Revision
Page
Rev Date
G4932-RPT-01 0 08 Jan 2021 81
Talon Metals Corp. – Preliminary Economic Assessment #3 on the Tamarack North Project
Figure 7-4: Map Showing Locality of TIC and Geology of Lake Superior Region with Location of Other
Intrusive Components of the MCR (Goldner 2011, modified from Miller et al., 1995)
The MCR was terminated by a compressional tectonic phase resulting in the inversion of
original, graben bounding, normal faults, into reverse faults. The compressional event has
been interpreted to possibly be the result of the Grenville Orogeny which may have started
as early as 1080 Ma and was probably completed by 1040 Ma (Bornhorst et al., 1994). The
orogeny resulted in rotation of blocks towards the rift axis with local sediments derived from
the erosion of uplifted horst blocks (e.g. Hinckley Sandstone formation in Minnesota). There
is currently no evidence to suggest that the TIC has been affected by this rotational event.
Cretaceous
Cretaceous sediments that include fluvial conglomerates and sandstones, overlain by
transgressive tidal flats deposits (including lignite layers) and progressively deeper marine
sediments representing a transgression, are preserved in western and central Minnesota.
These sediments often overlie a well-developed paleo-lateritic weathering profile. At
Tamarack, Cretaceous siltstone and sandstone unconformably overlie parts of the TIC in the
N and a layer of up to 30 m thick of Kaolinitic mudstone occurs in the NE of the TIC and is
similar to other deposits that have been mined in the MRV for manufacturing brick and tiles.

Document Number
Revision
Page
Rev Date
G4932-RPT-01 0 08 Jan 2021 82
Talon Metals Corp. – Preliminary Economic Assessment #3 on the Tamarack North Project
Quaternary
Thick glacial-lacustrine deposits cover most of the Tamarack area as they do other large
areas of Minnesota. The deposits are a complex sequence of lobes representing multiple
advances and retreats from the last Pleistocene glaciation which spanned a period from
10,000 to 100,000 years ago. Fluvial reworked glacial sediments and varved clay layers
occur between various lobe layers. Varved clay layers underlie widespread peat bogs in the
Tamarack area and are believed to have been deposited in Glacial Lake Upham which
covered much of NE Aitkin County.
7.2 Property Geology
Introduction
The TIC consists of a multistage magmatic event composed of mafic to ultramafic body that
is associated with the early evolution of the MCR (with the youngest intrusion dated at 1105
Ma +/- 1.2 Ma, Goldner, 2011). This age is significantly older than other Duluth Complex
Intrusions, which consistently date at 1099 Ma. The TIC is consistent with other earlier
intrusions associated with the MCR that are often characterized by more primitive melts.
The TIC has intruded into Thomson Formation siltstones and sandstones of the Animikie
Group and is preserved beneath remnant shallow Cretaceous fluvial and tidal sediments
and Quaternary glacial sediments which unconformably overlie the intrusive. The geometry
of the TIC, as outlined by the well-defined aeromagnetic anomaly (Figure 7-5), consists of a
curved, elongated intrusion striking N-S to S-E over 18 km. The configuration has been
likened to a tadpole shape with its elongated, northern tail up to 1 km wide and large, 4 km
wide, ovoid shaped body in the S (Figure 7-5). The northern portion of the TIC (the Tamarack
North Project), which hosts the currently defined resource and identified exploration targets,
is over 7 km long and is the focus of this PEA.

Document Number
Revision
Page
Rev Date
G4932-RPT-01 0 08 Jan 2021 83
Talon Metals Corp. – Preliminary Economic Assessment #3 on the Tamarack North Project
Figure 7-5: Interpreted Bedrock Geology Map Showing 18 km Long Strike of TIC with Long Narrow
Intrusion that Hosts Currently Defined Mineralization Termed “Tail” forming Tamarack North Project
(Kennecott Aeromagnetic Survey, Modified by Talon, 2017)
Paleoproterozoic (Thomson Formation)
The TIC is intruded into a folded and metamorphosed (greenschist facies) sequence of
siltstone and sandstone turbiditic sediments of the Upper Thomson Formation that dip
shallowly towards the N. Contact metamorphism peripheral to the TIC ranges from
granoblastic to spotted hornfels and partial melting. Observations from core at Tamarack
North indicate that SED and structural fabrics have largely been obliterated by the contact
metamorphism.

Document Number
Revision
Page
Rev Date
G4932-RPT-01 0 08 Jan 2021 84
Talon Metals Corp. – Preliminary Economic Assessment #3 on the Tamarack North Project
Overview of the Tamarack North Project
The Tamarack North Project has been interpreted to consist of at least two and possibly
three separate phases of intrusions based on contact relationships, textural, and
geochemical differences. The two main intrusive distinguishable phases include an FGO
that forms the wider, upper part of the intrusion in the mid and southern part of the tail; and
a coarse grained, intrusive phase of CGO interpreted to have intruded dyke-like along
structures and underplated the base of the FGO in the form of a keel that sub-crops as a
result of pre-Cretaceous erosion in the N of the ‘tail’ area. N of the Tamarack Zone, the CGO
intrusive extends in a curvilinear shape with a N-S orientation. The intrusive nature of the
CGO is variant from dyke to sills. The recent 3D inversion geological model using Magnetic
and Gravity surveys best exemplifies the CGO intrusion nature (see Figure 7-5). In some
areas (i.e. 221 Zone), the CGO appears to over-plate an FGO-like intrusive.
Associated with the contact between these two intrusions is also a hybrid phase, the MZ.
The MZ geochemical signature resembles the FGO, however its mineralogy is slightly
different with possible country rock contamination associated with possible sediment
assimilation by FGO magma. It is interpreted that the MZ represents a contaminated FGO
by thermal erosion of the country rock sediments, thus in the geological model both
lithologies have been combined into single one, the FGO (Figure 7-6).

Document Number
Revision
Page
Rev Date
G4932-RPT-01 0 08 Jan 2021 85
Talon Metals Corp. – Preliminary Economic Assessment #3 on the Tamarack North Project
Figure 7-6: Plan, Long Section (S-N) and Cross Section Showing Main Components of Tamarack
North Project including CGO at Base Intruding Dyke-Like Beneath FGO in Shape of a Keel. MZ
intrusive occurs near interface of the two intrusions. Mineralization in SMSU occurs at top of the CGO,
MSU occurs in what is interpreted as a wedge of remnant wall rock. In 138 Zone to the S of this
section matrix and disseminated mineralization occurs in the MZ. Horizontal gridlines are mASL

Document Number
Revision
Page
Rev Date
G4932-RPT-01 0 08 Jan 2021 86
Talon Metals Corp. – Preliminary Economic Assessment #3 on the Tamarack North Project
Sulphide mineralization occurs within various lithological settings but is primarily associated
near the FGO/CGO contact, within the 138 Zone and along the CGO/Sediment contact
(Figure 7-6). More specifically, these zones are the SMSU (occurring in the upper part of the
CGO near the FGO contact); the MSU (hosted within sediment but proximal to the wall rock
contact of the FGO and CGO); and the 138 Zone (occurs S of the SMSU and within a large
zone of MZ).
Other less developed exploration targets with defined mineralization include the shallow
mineralization within the 480 Zone towards the northern part of the ’tail’, the 164-style
mineralization in the 164 Zone towards the southern end of the ’tail’, widespread
disseminated to mixed massive sulphide (MMS) mineralization developed at shallow depths
in the FGO, N of the SMSU mineralization, and a disseminated sulphide mineralization
hosted in the CGO extending N of the SMSU, both known as the CGO Bend Zone.
The TIC consists of a tilted intrusion with dip to the S and E based on the magmatic layering
observed in the FGO. The FGO is eroded progressively towards the N exposing the CGO N
of the Tamarack North Project (Figure 7-5). Evidence for this apparent dip being the result
of tectonic block rotation however has not been conclusively proven.
Intrusion Types
The different intrusions of the Tamarack North Project include:
• FGO: The FGO is a chonolithic intrusion that forms an elongated, S plunging, gutter
shaped intrusion primarily in the centre and S portions of the Tamarack North Project
that is progressively eroded to the N. To the N, in the 480 Zone, the FGO intrusion
appears to have a more complex plumbing system and does not appear to have been
as affected by erosion. The FGO intrusion is approximately 1 km wide at its erosional
surface and up to 475 m thick. The intrusion is composed primarily of dunite/peridotite
with FGO. The olivine (forsterite (Fo) at 70-86%, Goldner, 2011) decreases in modal
amount downward towards the basal contact. The FGO intrusion is magmatically
layered and defined by specific geochemical markers. The Magmatic layering dips to
the S at 8° to 12°. The magmatic layering is observed in Geochemical profile which
consists of, from base to top, a Basal FGO, Mid-Lower FGO, FGO cumulate,
Intermediate FGO and upper FGO. In the northern part of the FGO intrusion, the contact

Document Number
Revision
Page
Rev Date
G4932-RPT-01 0 08 Jan 2021 87
Talon Metals Corp. – Preliminary Economic Assessment #3 on the Tamarack North Project
zone with sediments (country rock) is marked by a FGO and MZ lithology (MZNO). The
Ni content of olivine is relatively low as plotted on a Ni vs Fo plot (Figure 7-7).
Mineralization can occur as disseminated, MMS or blebby sulphides near or at the base
of the FGO. When comparing Ni content of olivine vs the Mg number, we can determine
that the FGO was sulphur saturated and likely provided the metals to form the
mineralization within the FGO-MZNO/CGO;
• CGO: The CGO intrusion (age dated at 1105 Ma +/- 1.2 Ma) is currently interpreted as
a separate, younger intrusive. In the Tamarack Zone, the CGO underplates and eroded
the base of the FGO complex (described as the Keel). In the Tamarack Zone, the CGO
has a dyke like behavior. The SMSU defined mineralization in the Tamarack North
Project is contained within and near the top of the CGO. The CGO underplates the FGO
and observation of chilling against the FGO, coupled with xenolith of FGO-like, SED and
MSU within CGO, Magnetic field reversal corresponding to CGO magnetic polarity
overprinting in part the Magnetic signature of the FGO, indicates that the CGO post-
dates the FGO. N of the Tamarack Zone, the CGO intrusive sills out into the country
rock. Within the 221 Zone and 480 Zone the CGO appears to over-plate the FGO
intrusive. The CGO is, lithologically, a feldspathic peridotite (60-30 modal percent
olivine) with olivine gabbro present at the contact with enclosing sediments. The olivine’s
are substantially coarser in grain than those of the FGO, reaching as much as 1 cm in
diameter. They also define a higher Ni trend on a plot of Ni content vs Fo in olivine
(Figure 7-7). Although the CGO is chilled against the FGO in the N, further S the contact
between the CGO and FGO bodies is commonly marked by what has been logged as
a MZ. In this unit, the two distinctive intrusive types (FGO-CGO) do not show any
obvious chill zone, and FGO and CGO occur together with smaller olivines occurring in
the interstices between coarser olivine. When comparing Ni content of olivine vs the Mg
number, we can determine that the CGO was sulphur under-saturated, never reach
saturation within the study area, and did not provide significant metals to sulphides;
• MZ: MZ lithology is the least understood of the TIC. Models suggested included:
o The MZ represents the contaminated lower portion of the FGO by country rock
(meta-SED rocks) due to thermal erosion;
o Separate intermediate phase intrusion between the FGO and CGO; and
o A zone of mixing between the CGO and FGO.
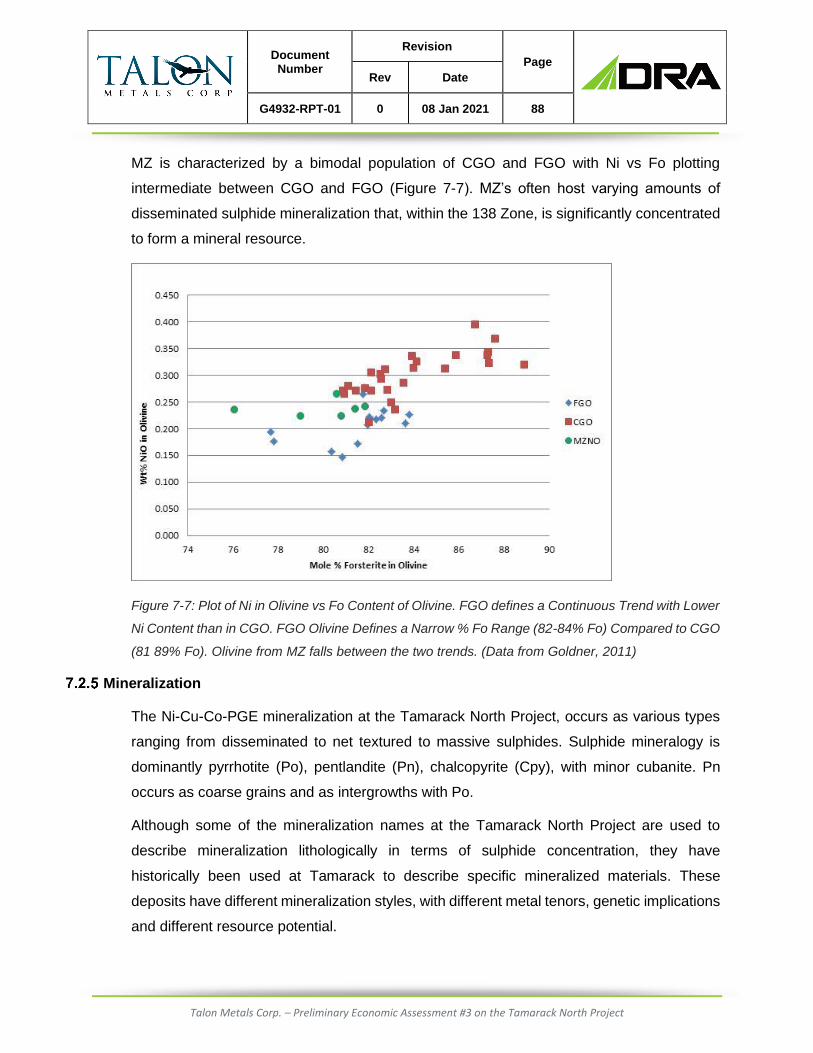
Document Number
Revision
Page
Rev Date
G4932-RPT-01 0 08 Jan 2021 88
Talon Metals Corp. – Preliminary Economic Assessment #3 on the Tamarack North Project
MZ is characterized by a bimodal population of CGO and FGO with Ni vs Fo plotting
intermediate between CGO and FGO (Figure 7-7). MZ’s often host varying amounts of
disseminated sulphide mineralization that, within the 138 Zone, is significantly concentrated
to form a mineral resource.
Figure 7-7: Plot of Ni in Olivine vs Fo Content of Olivine. FGO defines a Continuous Trend with Lower
Ni Content than in CGO. FGO Olivine Defines a Narrow % Fo Range (82-84% Fo) Compared to CGO
(81 89% Fo). Olivine from MZ falls between the two trends. (Data from Goldner, 2011)
Mineralization
The Ni-Cu-Co-PGE mineralization at the Tamarack North Project, occurs as various types
ranging from disseminated to net textured to massive sulphides. Sulphide mineralogy is
dominantly pyrrhotite (Po), pentlandite (Pn), chalcopyrite (Cpy), with minor cubanite. Pn
occurs as coarse grains and as intergrowths with Po.
Although some of the mineralization names at the Tamarack North Project are used to
describe mineralization lithologically in terms of sulphide concentration, they have
historically been used at Tamarack to describe specific mineralized materials. These
deposits have different mineralization styles, with different metal tenors, genetic implications
and different resource potential.

Document Number
Revision
Page
Rev Date
G4932-RPT-01 0 08 Jan 2021 89
Talon Metals Corp. – Preliminary Economic Assessment #3 on the Tamarack North Project
7.2.5.1 The 164 Zone
The mineralization type within the 164 Zone (Figure 7-8), which is located around 1.5 km S
of the 138 Zone, typically occurs as variable massive sulphide veins and pods <2 m thick
with blebby disseminated mineralization occurring at the base of FGO intrusion on the wall-
rock contact (500 m depth), and often within hornfelsed and partially melted sediments near
the chilled contact with the FGO. Mineralization is generally low tenor and has been
interpreted as early cumulate mineralization associated with the base of the FGO. In the 164
Zone, the base of the FGO is more complex. Thick intervals of variable textured gabbro,
magmatic breccia, and thin sills or dykes occur within the partially melted meta-sediment
where coarse blebby disseminated mineralization occurs in variable textured gabbro with
granophyric patches.
Recent geophysical modeling, using magnetic and gravity surveys has enabled
interpretation of the footwall (FW) contact between FGO and country rock sediments. The
work was completed by Mira Geoscience and identified the possible location of the keel of
the FGO where it is the loci of sulphide mineralization in the Tamarack Zone. Along the keel,
potential basin, local depression in the FGO base has been identified. Historical and current
drilling has only covered the flank of the FGO sediments identifying blebby sulphide
(mentioned above). The area remains open with regard to the basin which has a local
dimension of 100 m x 200 m x 100 m for the southern basin and 170 m x 270 m x 100 m for
the northern basin (Figure 7-8).
Figure 7-8: 164 Zone, Showing Emplacement of Interpreted Local Basin at Base of FGO. Results
from 3D Interpolation of Integrated Magnetic and Gravity Modelling

Document Number
Revision
Page
Rev Date
G4932-RPT-01 0 08 Jan 2021 90
Talon Metals Corp. – Preliminary Economic Assessment #3 on the Tamarack North Project
A surface EM survey in the 164 zone has identified a string of EM anomalies at a depth of
500 to 600 m (Figure 7-9). The surface EM was also deployed over previously define
resource areas to calibrate the survey. The same methodology was then used in areas
outside of the resource area.
Figure 7-9: Plan view map of the Tamarack Zone (resource area) and 164 Zone (1 km S of the
resource area) showing the location of the surface EM survey. The solid red line shows the location
of the interpreted conductive anomalies
The surface EM appears to connect the Tamarack resource area to historical hole
12TK0164, an area of ~1.0 km of strike length within the TIC.

Document Number
Revision
Page
Rev Date
G4932-RPT-01 0 08 Jan 2021 91
Talon Metals Corp. – Preliminary Economic Assessment #3 on the Tamarack North Project
7.2.5.2 The 138 Zone
A wide range of disseminated to net-textured and patchy net-textured sulphides typically
occur in the 138 Zone. This type of mineralization is referred to as MZ mineralization. In the
138 Zone, MZ type sulphides appear to form a wedge-like zone of 200 m length, 120 m to
160 m height and a width of approximately 50 to 90 m, starting at ~350 m depth. The
mineralization is hosted in FGO and contaminated FGO, i.e. in MZNO and FGO lithologies.
7.2.5.3 The SMSU
The SMSU forms the bulk of the defined mineral resource and occurs in the upper part of
the CGO intrusion as an elongated boudin-aged tubular-shaped zone at the top of the CGO
(Figure 7-6). Two SMSUs (Upper and Lower) have been modeled. The Upper SMSU body
dimensions are 400 m long, 40 m to 80 m wide and 40 to 70 m vertically at a depth of 300 m
to 325 m. The Lower SMSU body dimensions are 350 m long, 40 m to 65 m wide and 40 to
70 m vertically at a depth of 445 m to 485 m. Within the SMSU is a core of interstitial net
textured sulphides (50% sulphides) (Figure 7-10). Surrounding the net textured sulphides
are disseminated sulphides forming a peripheral halo decreasing towards the CGO margins.
This halo has been shown to have elevated Cu and PGE tenors that could be used in
targeting SMSU extensions. The SMSU appears spatially associated with the presence of
the MSU, emplaced approximately 50 m below the MSU. SMSU has only been observed in
the CGO when MSU is present at the base of the FGO-Country rock above.
Figure 7-10: SMSU (net textured) Sulphide from Tamarack Drill Core

Document Number
Revision
Page
Rev Date
G4932-RPT-01 0 08 Jan 2021 92
Talon Metals Corp. – Preliminary Economic Assessment #3 on the Tamarack North Project
7.2.5.4 The MSU
MSU-type mineralization is defined as containing 80-90% sulphide (Figure 7-11). The MSU
also refers to a mineralized body hosted by intensely metamorphosed and partially melted
meta-sediments occurring as fragments or wedges of country rock at the base of the FGO
with typical dimensions of 10 to 30 m wide by 0.5 m to 18 m thick. The MSU has a strike
length of 550 m at a depth of 275 m N to 550 m S. Close to moderately spaced drilling (35 m
to 100 m) to test these massive sulphides suggests that they form southward plunging, pipe-
like zones. The zone has been drill intersected intermittently over 550 m from the SMSU to
the 138 Zone. Texturally these massive sulphides occur in intensely metamorphosed
sediments.
Figure 7-11: MSU from Tamarack Drill Hole 12TK0158
7.2.5.5 The CGO Bend Area
The CGO Bend East and West
The CGO Bend consists of disseminated and basal FGO MSU-MMS mineralization,
observed in the CGO E and W (Figure 7-12) and signifies where CGO forms a dog leg bend
immediately N of the Tamarack Zone. The CGO Bend sulphide mineralization consist of a
thick sheet of disseminated sulphide 1 to 38 m, with a FW accumulation of primary sulphides
in the FGO Keel and basin that vary in thickness from 0.2 m to 2.3 m, strike length of 500 to
900 m, at a depth of 150 m to 250 m and a weak plunge to the S at 15°. The sheet like
mineralization in the CGO E has a span of 500 m (E to W) by 900 m (N to S), whereas the
CGO W has a span of 400 m (E to W) by 500 m (N to S). The sulphides are disseminated
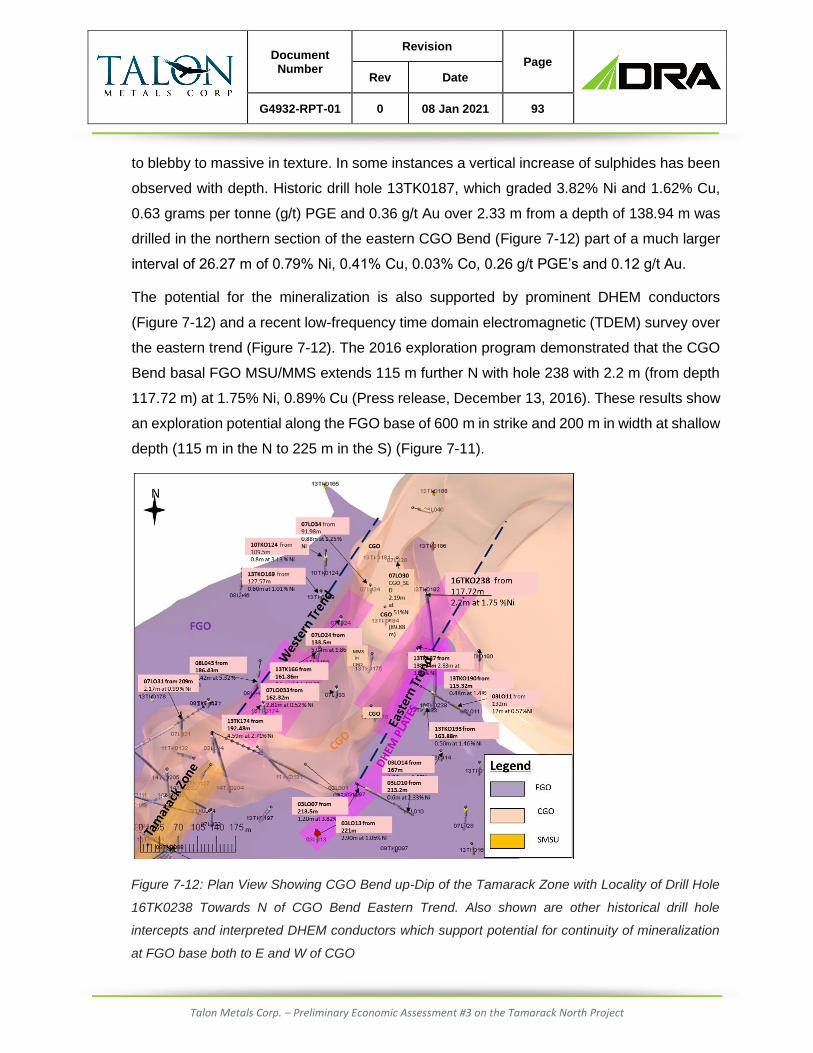
Document Number
Revision
Page
Rev Date
G4932-RPT-01 0 08 Jan 2021 93
Talon Metals Corp. – Preliminary Economic Assessment #3 on the Tamarack North Project
to blebby to massive in texture. In some instances a vertical increase of sulphides has been
observed with depth. Historic drill hole 13TK0187, which graded 3.82% Ni and 1.62% Cu,
0.63 grams per tonne (g/t) PGE and 0.36 g/t Au over 2.33 m from a depth of 138.94 m was
drilled in the northern section of the eastern CGO Bend (Figure 7-12) part of a much larger
interval of 26.27 m of 0.79% Ni, 0.41% Cu, 0.03% Co, 0.26 g/t PGE’s and 0.12 g/t Au.
The potential for the mineralization is also supported by prominent DHEM conductors
(Figure 7-12) and a recent low-frequency time domain electromagnetic (TDEM) survey over
the eastern trend (Figure 7-12). The 2016 exploration program demonstrated that the CGO
Bend basal FGO MSU/MMS extends 115 m further N with hole 238 with 2.2 m (from depth
117.72 m) at 1.75% Ni, 0.89% Cu (Press release, December 13, 2016). These results show
an exploration potential along the FGO base of 600 m in strike and 200 m in width at shallow
depth (115 m in the N to 225 m in the S) (Figure 7-11).
Figure 7-12: Plan View Showing CGO Bend up-Dip of the Tamarack Zone with Locality of Drill Hole
16TK0238 Towards N of CGO Bend Eastern Trend. Also shown are other historical drill hole
intercepts and interpreted DHEM conductors which support potential for continuity of mineralization
at FGO base both to E and W of CGO

Document Number
Revision
Page
Rev Date
G4932-RPT-01 0 08 Jan 2021 94
Talon Metals Corp. – Preliminary Economic Assessment #3 on the Tamarack North Project
7.2.5.6 The 264 Zone
The 264 Zone limited drilling has identified geology similar to the Tamarack Zone with the
distinction that the CGO is over plating the FGO. Both appear to be a sill-like intrusion within
the country rock meta-sedimentary. The mineralization is observed at the base of the FGO
in the form of mixed and massive sulphides. Drill hole 18TK0264 intersected 0.25 m of 9.95%
Ni, 5.74% Cu, 0.16% Co, 2.46 g/t PGEs and 0.32 g/t Au starting at 539.09 m. Bore hole EM
shows an EM anomaly with a northwestern strike and shallow plunge to the N-W at ~-15°.
7.2.5.7 The 480 Zone
Drilling in a narrow linear, E-W trending, positive magnetic anomaly at the northern portion
of the Tamarack North Project, referred to as the 480 Zone, has intersected disseminated
and net textured sulphide mineralization at a relatively shallow depth. The host olivine
visually resembling the olivine cumulates of the FGO intrusion to the S and include intervals
of quartz xenolith rich magmatic breccia similar to those in the 164 Zone. The 2017 drilling
program tested the extent of the FGO and mineralization in the area. The interpretation of
the results in the area have defined the relatively limited extent of mineralization, however
the FGO-like intrusion that is extending E would require additional geophysical surveys to
define a suitable target.
7.2.5.8 The 221 Zone
Drilling a bulging pattern in the first vertical derivative along the CGO intrusive has identified
signification mineralization near the base of the intrusion. Hole 15TK0221 intersected
massive sulphide mineralization with 0.3 m of 2.0% Ni, 0.56% Cu, 0.53 g/t PGE’s and 0.51
g/t Au starting at 682.6 m. The mineralization is located near the FW contact of the CGO. In
other holes the mineralization is hosted in the country rock sediments just blow the CGO FW
contact, hole 15TK0229 intersected 9.88 m of 2.35% Ni 1.40% Cu, 0.77g/t PGE’s and 0.17g/t
Au (3.04% NiEq) including a 1.63 m basal zone of high-grade massive sulphide
mineralization assaying 9.33% Ni, 5.14% Cu, 3.65 g/t PGE’s and 0.71 g/t Au (12.01%NiEq).
Further work is required to test the extend of the mineralization.
7.2.5.9 Mineralization in the Weathered Laterite Zone
A weathered lateritic profile is irregularly preserved in the northeastern part of Tamarack
North Project beneath Cretaceous and Quaternary cover and has concentrated Ni, Cu, Cr,

Document Number
Revision
Page
Rev Date
G4932-RPT-01 0 08 Jan 2021 95
Talon Metals Corp. – Preliminary Economic Assessment #3 on the Tamarack North Project
and Fe. The weathered profile is up to 10 m thick, at 35 m depth and consists typically of a
0.5 m pisolithic, limontic hard cap, underlain by massive greenish saprolite, and saprock with
remnant igneous textures. Native Cu up to 2% (visual estimation) can be observed as 1 to
3 mm nuggets and veinlets in the weathered profile and persists into the serpentinized upper
part of the FGO (Goldner, 2011).
7.2.5.10 Quaternary and Cretaceous Cover and Weathering Profile
The Tamarack North Project does not outcrop at surface, as it underlies 20 to 50 m of
Quaternary glacial and fluvial sediments and in the N of the Tamarack North Project along
the E part of the intrusion. Cretaceous siltstone and mudstone are preserved and
unconformably overlie in places the preserved paleo-weathered lateritic profile of the FGO.
In the Tamarack North Project, the lateritic weathering profile is variably preserved. This is
seen particularly in the E where up to 10 m thick saprock with remnant igneous textures and
massive greenish saprolite covered with a pisolitic limonitic duri-crust can be found. Native
Cu occurring as nuggets and veinlets can also be observed.
Serpentinization of olivine cumulates occurs over considerable thicknesses in the FGO
below the weathered lateritic profile and is believed to be due to supergene alteration
processes related to pre-Cretaceous weathering. Magnetite generated by the
serpentinization process in the upper layers of the FGO is the main cause for the strong
positive magnetic anomaly associated with parts of the Tamarack North Project.
Quaternary glacial-lacustrine deposits between 20 to 50 m cover the TIC with thicknesses
increasing towards the S. The deposits are a complex arrangement of glacial and interglacial
fluvial sands and silt and clay from lake sediments.
Current Models for Formation of the Ni-Cu-Co Sulphide Mineralization in the Tamarack
North Project and Extended Mineralization Area
The Tamarack North Project area contains two intrusions, the FGO rich intrusion and a CGO
rich intrusion. Based on the geochemistry, both intrusions are derived from the same high-
Mg olivine tholeiitic parental magma (Goldner, 2011).
Based on data available at the time Goldner (2011) proposed that the CGO was emplaced
before the FGO intrusion. There are no uranium-lead (U-Pb) zircon age dates for the FGO
intrusion, however contact relationships and paleomagnetic correlations with MCR volcanic
Document Number
Revision
Page
Rev Date
G4932-RPT-01 0 08 Jan 2021 96
Talon Metals Corp. – Preliminary Economic Assessment #3 on the Tamarack North Project
rocks may indicate that the FGO is older than the CGO. The FGO is believed to be the
primary source of the sulphide mineralization at Tamarack. The FGO intrusion is an open
system magma conduit (termed a chonolith) that likely followed a zone of structural
weakness in the meta-SED Animikie basin. The FGO magma likely intruded along a rift
associated structure to produce the dyke-like CGO and the FGO sill-like body.
The low Ni content of olivine in the FGO coupled with the Ni, Cu, and PGE-depleted
geochemistry of the upper part of the intrusion indicate that the magma achieved sulphide
saturation well-before the crystallization of large amounts of olivine. In the TIC, the FGO
intrusion has the geometry of an elongate lopolithic sill. The FGO magma either carried
sulphide formed at a greater depth in the plumbing system or it formed in-situ from the
overlying open system magma column as the FGO intruded the Animikie Group SED rocks.
Sulphur Isotope studies indicate that the sulfur originates from a mantle source with some
samples suggesting Proterozoic or Archean crust. As the flow rate of magma within the FGO
intrusion decreased, the dense immiscible magmatic sulphide started to settle and coalesce
towards the base of the intrusion. Sulphide that reached the basal contact, flowed toward
topographic lows on the chamber floor and was able to accumulate in pools forming massive
sulphide. Crystallization of olivine in the overlying FGO magma column resulted in trapping
sulphides as disseminations and blebs. These sulphide textures occur in the ultramafic rocks
above the keel of the intrusion and on the flanking sides of the N-S trending lopolithic sheet.
The most important control on the loci of massive sulphide deposition is at the base of the
FGO or along the keel of the FGO where, for example, the Tamarack Zone mineralization
occurs.
The second phase of magmatic intrusion occurred at 1105 +-1.2 Ma (U-Pb age date on
zircon) to form the CGO intrusion. The CGO intruded along a similar or perhaps, the same
structure as the FGO, with a dyke-like configuration. The high Ni content of CGO and the
normal Ni abundance levels in the un-mineralized CGO indicate that the magma did not
reach sulphide saturation. The existing sulphide is in disequilibrium with the melts that
formed the ultramafic rocks of the CGO, and so the CGO magma contributed negligible
sulphide to the mineral zones at the Tamarack Project. As a result, the CGO did not form
the mineral zones found within it.

Document Number
Revision
Page
Rev Date
G4932-RPT-01 0 08 Jan 2021 97
Talon Metals Corp. – Preliminary Economic Assessment #3 on the Tamarack North Project
The evidence suggests that the CGO intruded the country rock directly below the keel of the
FGO in the Tamarack Zone. The CGO magma eroded the base of the FGO as well as
portions of the basal accumulation of previously solidified magmatic sulphide mineralization
at the base of the FGO, which represented a proto ore for the CGO mineral zone. The eroded
basal sulphide melted and digested by the CGO magma to form the SMSU. The remnant
massive sulphides are preserved on the flanks of the FGO keel current as the MSU and the
primary massive sulphide mineralization from the FGO keel was likely re-assimilated and re-
concentrated by the CGO to form the SMSU which is hosted in the CGO directly below the
FGO keel. The mineral zone in the CGO has a zoned composition grading from Ni-rich
massive sulphides at the core to more Cu- and PGE-rich mineralization at the flanks. It
appears that the nexus of CGO-related mineralization occurs where the CGO is proximal to
the keel of the FGO. Whereas in areas where the CGO has not intruded at the Keel of the
FGO, sulphide pool at the base of FGO may remain in their primary undisturbed location.
The MZ contact relationship with the FGO is gradual and likely shows a gradation textural
change to the FGO. The MZ chemical composition resemble the FGO chemical signature,
however it shows a crustal SED contamination. The MZ has been interpreted to represent
the contamination of FGO with country rocks sediments by thermal erosion.
Document Number
Revision
Page
Rev Date
G4932-RPT-01 0 08 Jan 2021 98
Talon Metals Corp. – Preliminary Economic Assessment #3 on the Tamarack North Project
DEPOSIT TYPES
The Tamarack North Project hosts magmatic Ni-Cu-Co-PGE sulphide mineralization. These
deposits form as the result of segregation and concentration of liquid sulphide from mafic or
ultramafic magma and the partitioning of chalcophile elements into the sulphide from the
silica melt (Naldrett, 1999).
In order to sufficiently concentrate metals in a system, a number of basic factors are believed
to be necessary including:
• A tectonic rift setting with upwelling mantle and deep-seated structures necessary to
generate partial melting of primitive magmas;
• Large volumes of magma flowing through an open system to achieve a high R factor
(ratio of melt to sulphide);
• Mid-level external sulphur source from crustal assimilation of sulphur rich rocks to
maintain sulphur saturation and continued partitioning with a rising magma;
• Physical and chemical conditions for sulphide accumulation such as cumulate settling,
changes in flow velocity, magma mixing and other changes in physical and chemical
conditions in the magma likely contributed to sulphide accumulation.
Ni-Cu-Co sulphide deposits are economically important because they present favourable
economics compared to the mining and processing of Ni laterite deposits.
The various mineralized zones at the Tamarack North Project occur within different host
lithologies, exhibit different types of mineralization styles, and display varying sulphide
concentrations and tenors. These mineralized zones range from massive sulphides hosted
by altered sediments in the MSU, to net textured and disseminated sulphide mineralization
hosted by the CGO in the SMSU; to a more predominantly disseminated sulphide
mineralization, as well as layers of net textured sulphide mineralization, in the 138 Zone
(Table 8-1). Mineralization in the 138 Zone, where interlayered disseminated and net
textured mineralization occurs, is referred to as MZ mineralization. All these mineralization
types are typical of many magmatic sulphide deposits around the world. The current known
mineral zones of the Tamarack North Project (SMSU, MSU and 138 Zone) that are the basis
of this resource statement are referred to as the Tamarack Zone. Also located within the

Document Number
Revision
Page
Rev Date
G4932-RPT-01 0 08 Jan 2021 99
Talon Metals Corp. – Preliminary Economic Assessment #3 on the Tamarack North Project
Tamarack North Project are four currently lesser defined mineral zones, namely the 480
Zone, the 221 Zone, the 164 Zone, and the CGO Bend.
Table 8-1: Tamarack North Project – Key Geological and Mineralization Relationships
Area Mineral Zone Host Lithology Project Specific
Lithology Mineralization Type
Tamarack Zone
SMSU Feldspathic Peridotite CGO Net textured and disseminated sulphides
MSU Meta-Sediments/ Peridotite (basal FGO mineralization)
Sediments Massive sulphides
138 Zone Peridotite and Feldspathic Peridotite
MZ/FGO Disseminated and net textured sulphides
CGO Bend East and West
Feldspathic Peridotite CGO Disseminated sulphides
Peridotite FW (basal FGO mineralization)
FGO Disseminated, Mixed and massive sulphides
Other
221 Zone Feldspathic Peridotite CGO Disseminated sulphides with ripped up clasts of massive sulphides
480 Zone Peridotite FGO Disseminated sulphides
164 Zone Peridotite FGO Blebby sulphides, sulphides veins

Document Number
Revision
Page
Rev Date
G4932-RPT-01 0 08 Jan 2021 100
Talon Metals Corp. – Preliminary Economic Assessment #3 on the Tamarack North Project
EXPLORATION
9.1 Historical Investigations
The TIC was initially targeted from the Minnesota State airborne magnetic survey flown
between 1979 and 1983 and the follow-up drill-testing by MGS in 1984 of two holes, with
peridotite intersected in AB-6 which was drilled on an anomaly N of the town of Tamarack.
9.2 Mineral Exploration
The TIC and associated mineralization were discovered as part of a regional program
initiated by Kennecott in 2000. The focus on Ni and Cu sulphide mineralization was initiated
in response to a 1999 model proposed by Dr. A.J. Naldrett, of the potential for smaller feeder
conduits associated with continental rift volcanism and mafic intrusions to host Ni sulphide
deposits similar to Norilsk and Voisey’s Bay. This model (Dynamic Conduit Model)
challenged previously held models that Ni sulphide deposits were only associated with large,
layered complexes.
Exploration by Kennecott continued at the Tamarack Project concurrently with their testing
of other targets since 2014. Disseminated mineralization was first intersected at the
Tamarack Project in 2002, and the first significant mineralization of massive and semi-
massive sulphide was intersected in 2008.
To date, exploration has included a wide range of geophysical surveys including:
• Airborne magnetics and AEM (fixed wing and helicopter based);
• Ground magnetics;
• Surface EM;
• Surface gravity;
• MT;
• IP;
• Seismic;
• MALM;
• MMR; and
• BHEM.

Document Number
Revision
Page
Rev Date
G4932-RPT-01 0 08 Jan 2021 101
Talon Metals Corp. – Preliminary Economic Assessment #3 on the Tamarack North Project
From 2015 to 2016, a number of new geophysical surveys were conducted. These included
Gravity, MT and TDEM surveys. New inversions and 3D modeling were also conducted
using current and pre-existing geophysical data. This new geophysical data and data
products have enhanced the understanding of the Tamarack Project, and improved focus
on existing targets.
Drilling in the main target areas of the Tamarack North Project has included 254 diamond
drill holes totalling 109,907.4 m with holes between 33.5 m and over 1,224 m depth for an
average hole depth of 431 m.
Geophysics
The Tamarack Project is covered by Minnesota government regional magnetic and gravity
surveys. The magnetic data in particular is recent, of good quality and has played a key role
in the recognition of the TIC and the targeting of early drilling.
A wide variety of airborne, ground, and borehole (BH) geophysical surveys have been
conducted by Kennecott at the Tamarack Project since 2001 (Figure 9-1). AEM and
magnetic surveys have included airborne MEGATEM (2001) and AeroTEM (2007, 2008,
2009).
Ground EM surveys were conducted using the Geonics EM-37 (2002), Crone Pulse EM
(2003, 2012, and 2016), Lamontange UTEM-3 (2006), and the SJ Geophysics Volterra
system (2019 and 2020).
A test line to evaluate different surface transient electromagnetic (TEM) systems was
surveyed in 2012. The systems tested included:
• the UTEM-3 system;
• the Crone system using a SQUID sensor;
• the Crone system using a CRA95 coil sensor; and
• the electromagnetic imaging technology (EMIT) SMARTEM system using a SQUID
sensor.
In addition, different BHEM systems were evaluated. These included:
• Crone Geophysics with a fluxgate sensor and a coil sensor;
• UTEM-4; and

Document Number
Revision
Page
Rev Date
G4932-RPT-01 0 08 Jan 2021 102
Talon Metals Corp. – Preliminary Economic Assessment #3 on the Tamarack North Project
• EMIT SMARTEM system with fluxgate sensor.
BHEM was first tested in 2003 and has been used since as an important tool for the detection
and delineation of sulphide bodies in and near drill holes. Most holes since 2007 and all
holes drilled since 2011 have been surveyed with Crone BHEM.
Other surface geophysical surveys included: DC Resistivity/IP (2008), MALM (2008 and
2010), Gradient & Dipole IP/Resistivity (2010), and gravity (2001, 2002, 2011, 2015, and
2016).
Figure 9-1: Map Showing Localities of Various Geophysical Surveys Conducted Over the entire TIC
(composite magnetic TMI image background) Modified from Kennecott Internal Report and Survey
Data, 2013

Document Number
Revision
Page
Rev Date
G4932-RPT-01 0 08 Jan 2021 103
Talon Metals Corp. – Preliminary Economic Assessment #3 on the Tamarack North Project
9.2.1.1 Airborne Surveys (Magnetic and TEM)
The MEGATEM survey in 2001 identified a conductive anomaly that led to the drilling of the
first hole of the program. The hole intersected disseminated mineralization hosted within a
gabbro. The survey was strongly affected by the numerous power lines in the area.
Subsequent AEM surveying was conducted using the AeroTEM system, which has a smaller
footprint than the more powerful but extended MEGATEM system and hence less sensitivity
to nearby power lines (Figure 9-1).
The AeroTEM system operates at lower power and higher frequency than the MEGATEM
system. As such there is potentially less penetration through nuisance conductivity however
due its smaller footprint it is less affected by power lines. The higher resolution (50 m line
spacing vs 200 m line spacing for MEGATEM) AeroTEM surveys mapped with increased
detail shallow conductivity within the FGO unit which, at the time, was felt to be spatially
related to potentially deeper mineralization. Based on Kennecott’s subsequent work it
appears that the response from both AEM systems over the known mineralization is mostly
due to near-surface (top 300 m) conductivity within the FGO unit. Direct detection of
economic mineralization from the air has yet to be confirmed at Tamarack.
9.2.1.2 Ground Surveys
Electrical and EM Surveys
A variety of ground electrical and EM surveys have been conducted on the property. Surveys
included EM 37 (2002), Crone TEM/TDEM (2003 and 2016), audio-frequency
magnetotellurics (AMT) (2003), Controlled source audio-frequency magnetotellurics
(CSAMT) (2006), UTEM (2006), 3D RES/IP (2008), MALM (2008 and 2010), Gradient &
Dipole-Dipole IP/Resistivity (2010), and MT (2016).
TDEM Survey, September 2016
A new high-power low-frequency TDEM was conducted along the eastern CGO Bend by
Crone Geophysics in September 2016 (Figure 9-2). The fixed in-loop survey was testing
potential thicker zones of base of FGO massive sulphide in the 40 m to 240 m depth range.
The lower frequency data successfully penetrated through the nuisance conductivity and
highlighted conductors at the base of the FGO that were confirmed from drill intersections to
be sulphides. These conductors also correspond with modeled BHEM plates.

Document Number
Revision
Page
Rev Date
G4932-RPT-01 0 08 Jan 2021 104
Talon Metals Corp. – Preliminary Economic Assessment #3 on the Tamarack North Project
Figure 9-2: Colour Shaded Grids of Ch 20 Crone TEM Z Component for Loop 1 and 2 of TDEM Survey
in CGO Bend Zone, Showing Anomalous Conductivity at Depth to the E of the CGO
Kennecott completed detailed gravity surveying over both the Tamarack North and South
properties in 2001, 2002 and 2011 to add to the available Minnesota State data. The new
data did not change the larger picture much but provided more detail over the TIC.
TDEM Survey, December 2019
A high-power low-frequency large loop TDEM was conducted along the trend of the known
mineralization in December of 2019. This survey was conducted by SJ Geophysics out of
Vancouver, British Columbia, using their proprietary Volterrra EM system. A 1,500 by
2,000 m loop was deployed around the known mineralization and extending more than one
km to the S as shown in Figure 9-3, and 12 line km of data was collected using an inside-
loop configuration.

Document Number
Revision
Page
Rev Date
G4932-RPT-01 0 08 Jan 2021 105
Talon Metals Corp. – Preliminary Economic Assessment #3 on the Tamarack North Project
This survey identified a long linear current anomaly along the known mineralization, that
progressed much further S than what was expected. It is believed that the currents
generated within the known mineralization are finding a path through the geology in the S to
a distant ground. This path through the geology may be through mineralization and will be
followed up on in 2020.
Figure 9-3: Plan view map of the Tamarack Zone (resource area) and 164 Zone (1 km S of the
resource area) showing the location of the Surface EM survey. The solid red line shows the location
of the interpreted conductive anomalies
Gravity Surveys
Gravity surveys conducted in 2015 and 2016 over the entire TIC have added considerable
definition primarily to the Tamarack North Project area (Figure 9-4). These surveys were
conducted in a number of phases and have been integrated with the older surveys. The
2015 ground survey consisted of 453 stations at a 200 m spacing and was conducted by
Eastern Geophysics. The survey was initially targeted on the high density intrusive drilled in

Document Number
Revision
Page
Rev Date
G4932-RPT-01 0 08 Jan 2021 106
Talon Metals Corp. – Preliminary Economic Assessment #3 on the Tamarack North Project
15TK0221. The 2016 survey (Eastern Geophysics) with a total of 865 ground stations both
expanded on and infilled gaps within the existing data. Survey data was integrated with
previous data and unconstrained and constrained 3D VPmg inversions models were
produced.
Figure 9-4: Bouguer (2.6 g/cc) Gravity Grid Combining 2011, 2015 and 2016 Surveys with Second
Order Trend. Removed. Dots show locations of new data acquired in 2016 (Kennecott Gravity Survey,
2001, 2002, 2011, 2015 and 2016)
Figure 9-5 shows the dominant anomalies located in the 221 Zone S to the CGO Bend as
well as the 480 Zone and W of the Tamarack Zone.

Document Number
Revision
Page
Rev Date
G4932-RPT-01 0 08 Jan 2021 107
Talon Metals Corp. – Preliminary Economic Assessment #3 on the Tamarack North Project
Figure 9-5: Unconstrained Bouguer (2.6 g/cc) Gravity Grid of Northern Tamarack with Modeled CGO
Showing the 221 to CGO Bend Anomaly, the 480 Anomalies and the Western Anomaly (Kennecott
Gravity Survey 2016)
Seismic Reflection (2006)
Seismic reflection surveys were carried out on one test line and two survey lines.
BHEM Surveys
To date, approximately 192 of the 265 holes at Tamarack North have been surveyed with
the Crone BHEM system.

Document Number
Revision
Page
Rev Date
G4932-RPT-01 0 08 Jan 2021 108
Talon Metals Corp. – Preliminary Economic Assessment #3 on the Tamarack North Project
The off-time data was delivered as a Pulse-EM (PEM) format, while the step response was
given in the Crone Step (STP) format. The BHEM surveys are very successful in locating
sulphides in and near the drill holes. The careful interpretation of the step response data has
proven to be very successful in delineating and expanding the MSU in the Tamarack Zone.
MT Survey
An MT survey was completed in August 2016 by Quantec Geophysics, with 456 ground
stations (including 52 repeats) over the Tamarack Project. Final 3D modeling was conducted
subsequently. It was anticipated that the MT would provide an efficient way of extending
known mineralization or identifying new large, deep conductive features. In 2020, a review
was conducted of the Tamarack MT dataset by Bill Doerner of SourceOne Geophysical. The
review of the data quality was positive, and three lines of data were inverted, yielding
interesting results. While the data quality was acceptable, the station spacing was deemed
to be too sparse for the target geometries. A recommended station spacing of 100 m over
the deposit trend, which can be expanded to 400 m at the ends of each survey line was
given in the study.
Radio Imaging
In early 2020, Talon completed seven panels of Radio Imaging (RIM) Survey during the
winter program. The final results are pending for these panels, however preliminary results
are encouraging. The panel, which comprises a section between holes 16TK0248 and
12TK0153, was completed and interpreted, highlighting the potential use of the technique
on the Tamarack project. Drill hole 12TK0153 had intersected two intervals of the MSU,
12.19 m and 2.5 m respectively, whereas hole 16TK0248 has intersected disseminated
sulphides but no massive sulphides. Figure 9-6 shows a cross-hole section between hole
16TK0248 and 12TK0153 and the signature of the MSU resource envelop. The resolution
quality is in the order that it can map the MSU within 1 m error. This is visible by the interval
of 2 m with no sulphide in the MSU interval of hole 12TK0153. The data also demonstrates
the nature of the disseminated sulphide mineralization of the 138 zone where moderate
attenuation of the signal compares to the near-complete attenuation in the MSU.
The results from the RIM survey are very encouraging and could potentially enable future
drilling programs to delineate the edges of the Tamarack mineralization with high precision.

Document Number
Revision
Page
Rev Date
G4932-RPT-01 0 08 Jan 2021 109
Talon Metals Corp. – Preliminary Economic Assessment #3 on the Tamarack North Project
Figure 9-6: Cross hole interpretation of the RIM between holes 16TK0248 (left) and hole 12TK0153
(right). Rays that exhibit maximum attenuation appear red on this image, while weaker attenuation
appears as rays coloured from yellow to blue. Two intercepts of massive sulphide mineralization in
hole 12TK0153 that are 12.2 m and 2.5 m in thickness appear clearly in this image as two distinct
zones of maximum attenuation, while the known semi-massive sulphides of the 138 Zone appear as
a cloud of yellow, partially attenuated rays

Document Number
Revision
Page
Rev Date
G4932-RPT-01 0 08 Jan 2021 110
Talon Metals Corp. – Preliminary Economic Assessment #3 on the Tamarack North Project
DRILLING
10.1 Talon Drilling Programs (2020 - Present)
In November of 2019, Talon became the operator of the Tamarack Project and planned a
winter drilling program targeting massive sulfides in the southern portion of massive sulfide
body. These drill holes were planned utilizing open historic drill holes and directional drilling
to optimize time and cost to hit the targets. A total of eight holes were drilled in and around
the MSU in order to bring the southern portion of the MSU into indicated from inferred by
getting the drill spacing down to 25 m.
Table 10-1: Breakdown of 2020 Drilling Conducted by Kennecott-Talon Joint Venture
Year Number of Holes Meters Targets
2020 8 2,573 Tamarack Zone Southern MSU
TOTAL 8 2,573
10.2 Resource Drill Holes
The number of total drill holes in the Tamarack North Project and the number of drill holes
that were included in the mineral resource estimate are different. Drill holes that had
mineralized intercepts that were sufficient to meet the domain modeling cut-off and had
sufficient continuity or weakly- to non-mineralized that helped define the limits of
mineralization were included in the mineral resource estimate (see Section 14 for further
details). The drill holes and the mineral intercepts that were used in the mineral resource are
provided in Table 10-2. Some of the remaining drill holes, occurring outside of the current
mineral resource estimate (as defined in Section 14), do include relevant mineralization that
could be included in an updated mineral resource estimate depending on results of future
exploration programs.
Provided in Table 10-2 are the drill hole composited, mineralized intersections for the SMSU,
MSU and 138 Zones from the mineral resource estimate provided in Section 14. The SMSU
and MSU Zones consist of plunging pipe-like mineralization domains, which do not have a
tabular type geometry. The orientation of the drilling is mainly in the vertical to sub-vertical
dip component, therefore there is some uncertainty regarding the relationship between drill
hole intersection length and the true width of the deposit in some areas. Each drill hole listed
in Table 10-2 includes the entire composited length used in the mineral resource estimate

Document Number
Revision
Page
Rev Date
G4932-RPT-01 0 08 Jan 2021 111
Talon Metals Corp. – Preliminary Economic Assessment #3 on the Tamarack North Project
and may also include a selection of significant mineralization intervals within the composited
length. If a drill hole intersection was composed entirely of significant mineralization the
entire composited length was provided.
Golder has estimated the true width to be perpendicular to the plunge based on an average
plunge of -25° and an average plunge direction of 170° for the SMSU and MSU Zones. There
is a distinct curving of the MSU orebody below the 138 Zone. A plunge of -25° and plunge
direction of 130° was used in those holes (Table 10-2).
Due to the strictly vertical nature of the drill holes in the 138 Zone there is a weak
understanding of the plunge and plunge direction. Mineralization appears to be horizontal to
sub-horizontal and therefore a dip of 0° and 0° dip direction (DDR) was used to estimate the
true width of intersections (Table 10-2).
The estimated true width may be subject to change with additional drilling oriented across
the deposit. Figure 14-17 to Figure 14-20 show drill hole cross-sections of the respective
orebodies.

Document Number
Revision
Page
Rev Date
G4932-RPT-01 0 08 Jan 2021 112
Talon Metals Corp. – Preliminary Economic Assessment #3 on the Tamarack North Project
Table 10-2: Drill Hole Composites Used in Mineral Resource for Each Mineralized Zone
Zone Hole No. Easting
(m) Northing
(m) Elev.
(mASL)
Total Hole Length
(m) Azm Dip
From (m)
To (m)
Sample Length
(m)
Estimated True
Width (m)
Ni (%)
Cu (%)
Co (%)
Pt (g/t)
Pd (g/t)
Au (g/t)
NiEq (%)
Upper SMSU
08L042 490735 5168848 389 515.7 180 -80 327.0 407.0 80.0 65.6 1.18 0.78 0.03 0.17 0.12 0.12 1.60
Upper SMSU
08TK0048 490715 5168730 391 908.0 33 -79 334.0 407.5 73.5 69.6 1.48 0.83 0.04 0.17 0.12 0.12 1.93
392.5 397.0 4.5 4.3 4.04 1.31 0.10 0.42 0.27 0.11 4.84
Upper SMSU
08TK0061 490673 5168988 389 634.3 146 -66 395.5 397.0 1.5 1.0 0.12 0.01 0.01 0.01 0.00 0.00 0.14
Upper SMSU
08TK0064 490672 5168987 389 492.9 96 -63 367.5 409.5 42.0 32.5 0.68 0.44 0.02 0.18 0.10 0.10 0.95
Upper SMSU
08TK0067 490735 5168847 389 590.4 168 -70 372.0 415.5 43.5 32.0 0.43 0.29 0.01 0.10 0.07 0.06 0.60
Upper SMSU
08TK0073 490846 5168867 390 550.5 251 -74 327.5 386.0 58.5 50.9 0.40 0.26 0.01 0.07 0.05 0.05 0.56
Upper SMSU
08TK0074 490846 5168867 389 531.9 250 -77 323.5 398.5 75.0 65.7 1.44 0.86 0.04 0.15 0.10 0.12 1.90
332.5 335.5 3.0 2.6 2.86 1.32 0.07 0.20 0.11 0.09 3.55
Upper SMSU
08TK0089 490846 5168866 389 603.7 237 -76 330.5 409.5 79.0 67.2 2.90 1.51 0.07 0.20 0.14 0.13 3.66
360.5 390.5 30.0 25.4 4.10 2.01 0.10 0.21 0.15 0.15 5.10
Upper SMSU
08TK0090 490848 5168866 390 534.0 217 -71 355.3 415.0 59.7 47.0 0.75 0.58 0.02 0.14 0.08 0.11 1.06
Upper SMSU
08TK0091 490596 5168734 390 526.7 79 -65 391.1 411.5 20.5 15.8 0.73 0.43 0.02 0.12 0.08 0.07 0.98
Upper SMSU
08TK0093 490598 5168729 390 545.0 64 -57 393.5 411.5 18.0 13.7 0.62 0.50 0.02 0.36 0.20 0.15 0.98
Upper SMSU
09TK0094 490970 5168799 389 509.6 310 -61 352.5 429.0 76.5 72.5 0.56 0.35 0.02 0.08 0.05 0.06 0.76
Upper SMSU
10TK0127 490909 5169024 389 599.9 282 -86 304.0 353.5 49.5 45.6 0.73 0.46 0.02 0.23 0.13 0.12 1.03
Upper SMSU
14TK0203 490910 5168938 388 651.7 326 -80 326.5 352.0 25.5 24.4 0.44 0.22 0.02 0.28 0.16 0.10 0.65
Upper SMSU
14TK0204 490909 5169083 388 557.2 141 -83 304.5 335.0 30.5 26.2 0.66 0.49 0.02 0.29 0.17 0.18 1.00
Upper SMSU
16TK0237 490839 5168769 389 502.3 268 -82 342.4 381.5 39.1 35.0 0.83 0.69 0.02 0.14 0.09 0.14 1.20
Upper SMSU
16TK0237A 490839 5168769 389 456.6 268 -82 343.5 365.0 21.5 18.4 0.45 0.32 0.01 0.20 0.12 0.09 0.67
Upper SMSU
16TK0241 490840 5168865 389 480.4 269 -84 321.0 403.0 82.0 74.7 1.42 0.83 0.04 0.16 0.10 0.11 1.86
Upper SMSU
16TK0242 490707 5168733 391 551.1 74 -85 361.7 390.0 28.3 25.4 0.78 0.51 0.02 0.13 0.09 0.09 1.07

Document Number
Revision
Page
Rev Date
G4932-RPT-01 0 08 Jan 2021 113
Talon Metals Corp. – Preliminary Economic Assessment #3 on the Tamarack North Project
Zone Hole No. Easting
(m) Northing
(m) Elev.
(mASL)
Total Hole Length
(m) Azm Dip
From (m)
To (m)
Sample Length
(m)
Estimated True
Width (m)
Ni (%)
Cu (%)
Co (%)
Pt (g/t)
Pd (g/t)
Au (g/t)
NiEq (%)
Upper SMSU
16TK0251 490799 5168870 389 450.3 354 -84 316.0 382.5 66.5 62.7 0.31 0.15 0.01 0.06 0.03 0.04 0.41
Lower SMSU
08L042 490735 5168848 389 515.7 180 -80 410.0 464.0 54.0 44.3 2.36 1.55 0.06 0.54 0.38 0.28 3.26
417.5 428.0 10.5 8.6 4.53 2.48 0.10 0.48 0.41 0.14 5.80
Lower SMSU
08TK0048 490715 5168730 391 908.0 33 -79 407.5 479.5 72.0 68.7 2.35 1.48 0.05 0.63 0.39 0.32 3.25
418.0 428.5 10.5 10.0 4.18 2.46 0.09 0.53 0.36 0.23 5.45
Lower SMSU
08TK0049 490718 5168728 391 553.5 183 -80 435.0 460.5 25.5 20.9 0.61 0.51 0.02 1.03 0.51 0.29 1.21
Lower SMSU
08TK0058 490590 5168609 390 649.5 89 -71 473.0 558.5 85.5 70.0 2.09 0.96 0.06 0.58 0.35 0.24 2.77
489.5 513.5 24.0 19.6 3.44 1.34 0.09 0.42 0.28 0.13 4.24
Lower SMSU
08TK0061 490673 5168988 389 634.3 146 -66 445.0 493.0 48.0 31.9 0.88 0.67 0.02 0.67 0.39 0.31 1.44
Lower SMSU
08TK0067 490735 5168847 389 590.4 168 -70 423.0 506.5 83.5 62.0 2.43 1.20 0.06 0.56 0.33 0.24 3.20
448.5 462.0 13.5 10.0 4.19 1.80 0.11 0.36 0.29 0.13 5.17
Lower SMSU
08TK0075 490588 5168610 390 578.1 71 -68 449.0 514.5 65.5 56.6 2.93 1.45 0.07 0.55 0.36 0.22 3.81
459.5 485.0 25.5 21.9 3.97 1.78 0.10 0.35 0.30 0.17 4.95
Lower SMSU
08TK0076 490593 5168728 390 553.8 101 -69 448.5 493.5 45.0 34.1 0.96 0.72 0.03 0.76 0.40 0.32 1.57
Lower SMSU
08TK0077 490592 5168729 390 558.1 100 -72 449.0 482.0 33.0 26.9 0.46 0.29 0.01 0.46 0.27 0.17 0.77
Lower SMSU
08TK0079 490589 5168605 390 582.8 90 -66 458.7 525.5 66.8 54.2 2.24 1.13 0.06 0.39 0.27 0.18 2.92
476.0 500.0 24.0 19.5 3.87 1.17 0.10 0.39 0.27 0.13 4.80
Lower
SMSU 08TK0081 490587 5168610 390 601.1 71 -69
452.5 522.5 70.0 60.8 1.85 0.94 0.05 0.58 0.34 0.27 2.51
466.9 487.5 20.7 17.9 3.39 1.34 0.09 0.33 0.30 0.13 4.17
Lower SMSU
08TK00821 490587 5168609 390 708.5 70 -73 467.5 478.0 10.5 9.2 0.17 0.05 0.01 0.14 0.07 0.03 0.26
Lower SMSU
08TK0083 490583 5168542 390 705.0 98 -67 533.0 563.0 30.0 23.3 0.34 0.18 0.01 0.24 0.14 0.11 0.52
Lower SMSU
08TK0086 490584 5168542 390 621.5 82 -68 501.5 560.0 58.5 48.9 2.04 0.95 0.06 0.51 0.32 0.27 2.71

Document Number
Revision
Page
Rev Date
G4932-RPT-01 0 08 Jan 2021 114
Talon Metals Corp. – Preliminary Economic Assessment #3 on the Tamarack North Project
Zone Hole No. Easting
(m) Northing
(m) Elev.
(mASL)
Total Hole Length
(m) Azm Dip
From (m)
To (m)
Sample Length
(m)
Estimated True
Width (m)
Ni (%)
Cu (%)
Co (%)
Pt (g/t)
Pd (g/t)
Au (g/t)
NiEq (%)
Lower SMSU
08TK0089 490846 5168866 389 603.7 237 -76 412.5 483.0 70.5 60.8 2.13 1.16 0.05 0.56 0.36 0.28 2.88
423.0 430.5 7.5 6.5 4.28 2.17 0.10 0.41 0.39 0.13 5.42
Lower SMSU
08TK0090 490848 5168866 390 534.0 217 -71 419.5 461.5 42.0 33.4 1.20 0.80 0.03 0.51 0.29 0.27 1.77
Lower SMSU
12TK0162 490775 5168529 388 620.9 230 -90 475.0 518.0 43.0 38.9 0.62 0.47 0.02 0.59 0.36 0.23 1.06
Lower SMSU
15TK0220 490843 5168638 389 538.9 276 -84 458.6 468.2 9.7 9.0 0.25 0.16 0.01 0.24 0.14 0.08 0.42
Lower SMSU
15TK0220A 490843 5168638 389 545.0 276 -84 438.0 506.5 68.5 62.4 2.15 1.06 0.06 0.65 0.40 0.30 2.90
457.5 469.5 12.0 10.9 3.49 1.34 0.09 0.42 0.30 0.19 4.31
Lower SMSU
16TK0235 490845 5168713 389 539.2 282 -81 436.0 463.5 27.5 24.2 0.51 0.39 0.02 0.44 0.25 0.18 0.85
Lower SMSU
16TK0235A 490845 5168713 389 538.9 282 -81 418.5 497.5 79.0 69.3 1.36 0.87 0.04 0.75 0.45 0.32 2.05
435.5 441.5 6.0 5.3 3.42 1.73 0.09 0.85 0.50 0.24 4.51
Lower SMSU
16TK0237 490839 5168769 389 502.3 268 -82 407.0 429.5 22.5 20.2 1.36 0.71 0.03 0.44 0.30 0.21 1.89
Lower SMSU
16TK0237A 490839 5168769 389 456.6 268 -82 404.5 412.0 7.5 6.5 0.50 0.32 0.02 0.54 0.31 0.19 0.85
Lower SMSU
16TK0242 490707 5168733 391 551.1 74 -85 404.5 466.5 62.0 55.8 2.10 1.22 0.05 0.73 0.37 0.30 2.93
412.5 430.5 18.0 16.2 3.70 1.71 0.10 0.31 0.27 0.15 4.63
Lower SMSU
16TK0243 490864 5168569 388 605.9 260 -83 478.0 503.5 25.5 23.5 0.70 0.40 0.02 0.64 0.37 0.28 1.14
Lower SMSU
16TK0244 490708 5168541 389 554.4 88 -84 493.5 510.0 16.5 14.8 0.32 0.25 0.01 0.22 0.35 0.13 0.56
Lower SMSU
16TK0247 490833 5168672 389 480.1 253 -86 442.0 466.0 24.0 21.6 0.40 0.29 0.01 0.47 0.27 0.18 0.71
MSU 08TK0049 490718 5168728 391 553.5 183 -80 396.0 408.0 12.0 9.8 6.03 3.30 0.11 0.67 0.59 0.33 7.74
MSU 08TK0058 490590 5168609 390 649.5 89 -71 448.8 452.2 3.3 2.7 4.96 2.56 0.08 0.52 0.45 0.46 6.31
MSU 08TK0068 490733 5168847 389 516.3 194 -75 378.4 382.2 3.7 2.9 3.63 1.36 0.09 0.31 0.30 0.08 4.41
MSU 08TK0075 490588 5168610 390 578.1 71 -68 420.5 423.7 3.1 2.7 5.15 2.11 0.10 0.44 0.35 0.09 6.26
MSU 08TK0077 490592 5168729 390 558.1 100 -72 396.4 409.9 13.6 11.0 5.82 2.68 0.13 0.51 0.44 0.22 7.25
MSU 08TK0081 490587 5168610 390 601.1 71 -69 421.1 431.6 10.5 9.1 5.05 3.03 0.09 0.96 0.52 0.28 6.68
MSU 08TK0083 490583 5168542 390 705.0 98 -67 497.5 507.8 10.3 8.0 7.01 2.89 0.14 1.32 0.70 0.30 8.78

Document Number
Revision
Page
Rev Date
G4932-RPT-01 0 08 Jan 2021 115
Talon Metals Corp. – Preliminary Economic Assessment #3 on the Tamarack North Project
Zone Hole No. Easting
(m) Northing
(m) Elev.
(mASL)
Total Hole Length
(m) Azm Dip
From (m)
To (m)
Sample Length
(m)
Estimated True
Width (m)
Ni (%)
Cu (%)
Co (%)
Pt (g/t)
Pd (g/t)
Au (g/t)
NiEq (%)
MSU 08TK0086 490584 5168542 390 621.5 82 -68 468.0 469.5 1.5 1.3 0.02 0.01 0.00 0.00 0.00 0.00 0.02
MSU 09TK0095 490983 5168407 389 663.9 265 -74 512.9 516.6 3.7 3.4 4.75 2.23 0.10 1.06 0.53 0.33 6.13
MSU* 12TK0153 490982 5168405 388 683.7 161 -82 554.5 575.3 20.8 17.9 4.96 2.11 0.10 0.41 0.37 0.12 6.07
558.5 568.1 9.5 8.2 7.18 3.38 0.14 0.52 0.53 0.11 8.86
MSU 12TK0158 490850 5168418 388 594.7 58 -89 482.9 495.7 12.8 11.6 5.86 2.28 0.13 1.28 0.58 0.40 7.37
MSU 12TK0162 490775 5168529 388 620.9 230 -90 439.1 443.0 3.9 3.5 2.64 1.15 0.06 0.13 0.23 0.13 3.26
MSU* 13TK0171 491049 5168348 389 641.9 157 -90 573.3 581.0 7.7 7.0 8.01 2.87 0.15 0.41 0.54 0.21 9.53
MSU 14TK0211 490857 5168535 389 648.0 265 -85 425.0 429.0 4.0 3.7 5.74 2.07 0.13 0.68 0.40 0.10 6.94
441.0 456.9 15.9 14.7 7.14 2.43 0.17 0.81 0.68 0.37 8.67
MSU 14TK0213 490857 5168535 389 618.0 216 -85 435.7 443.4 7.7 6.9 5.09 2.22 0.10 0.91 0.47 0.31 6.42
455.1 464.7 9.6 8.6 7.04 2.43 0.15 1.20 0.79 0.98 8.79
MSU 15TK0220A 490843 5168638 389 545.0 276 -84 411.0 415.1 4.1 3.7 2.01 1.24 0.05 0.50 0.53 1.16 2.99
414.0 415.1 1.1 1.0 4.79 1.97 0.14 1.05 1.18 0.37 6.19
MSU* 16TK0233A 490914 5168369 388 583.3 309 -84 508.0 517.0 9.0 8.4 4.94 2.08 0.10 0.57 0.43 0.24 6.12
515.0 516.0 1.0 0.9 9.06 3.37 0.19 0.23 0.76 0.14 10.79
MSU* 16TK0234 490950 5168389 388 696.8 181 -85 547.0 552.1 5.0 4.4 4.49 1.86 0.09 0.62 0.50 0.27 5.59
MSU 16TK0235 490845 5168713 389 539.2 282 -81 381.4 392.3 10.8 9.5 4.90 2.47 0.08 0.42 0.34 0.14 6.13
MSU 16TK0235A 490845 5168713 389 538.9 281 -82 379.5 390.7 11.2 9.8 4.73 2.38 0.09 0.32 0.28 0.10 5.89
MSU 16TK0243 490864 5168569 388 605.9 260 -83 418.0 428.5 10.5 9.7 5.88 2.32 0.14 0.51 0.42 0.09 7.16
435.3 438.3 3.0 2.8 7.35 2.91 0.17 0.76 0.55 0.14 8.97
MSU 16TK0244 490708 5168541 389 554.4 88 -84 448.8 450.8 2.0 1.8 9.60 4.04 0.18 0.88 0.96 0.45 11.81
MSU* 16TK0246 490881 5168290 388 611.4 10 -81 529.0 533.4 4.4 4.0 5.13 2.12 0.12 0.69 0.48 0.29 6.39
MSU 16TK0247 490833 5168672 389 480.1 253 -86 398.0 403.0 5.0 4.5 3.26 2.59 0.04 0.16 0.30 0.28 4.43
MSU 12TK0153A 490982 5168405 388 615.09 160 -82 555 566.36 11.4 10.5 7.10 2.98 0.14 0.62 0.49 0.16 8.67
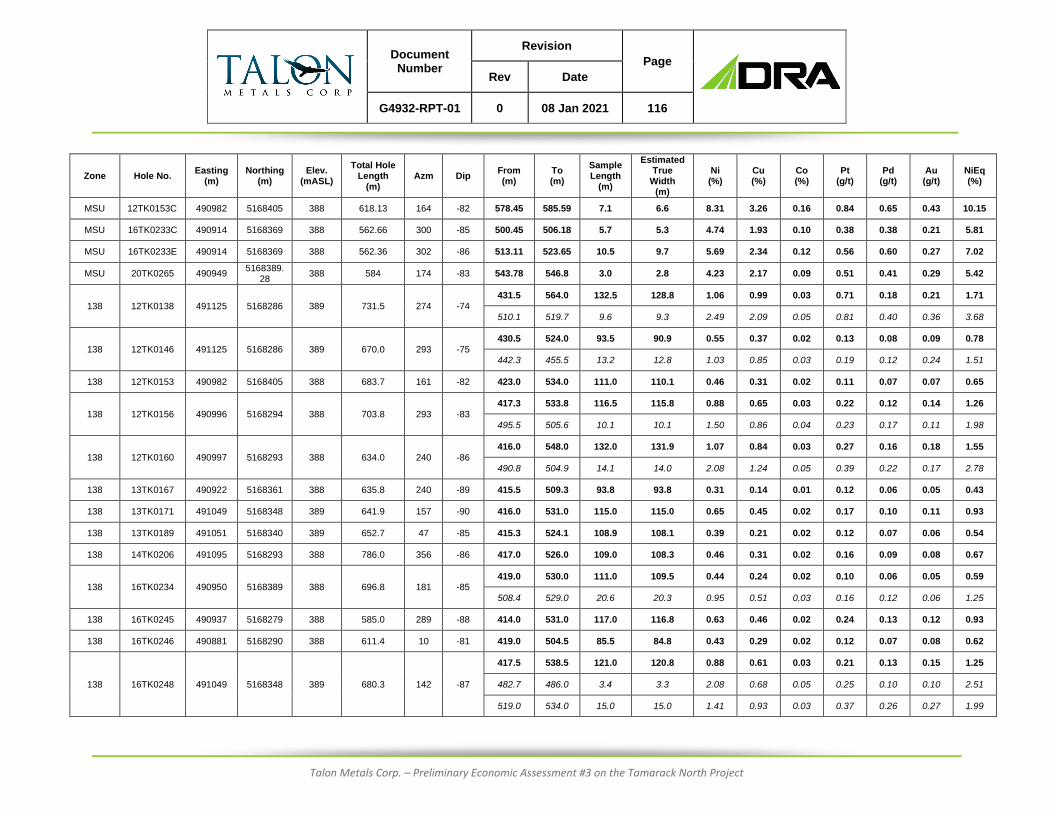
Document Number
Revision
Page
Rev Date
G4932-RPT-01 0 08 Jan 2021 116
Talon Metals Corp. – Preliminary Economic Assessment #3 on the Tamarack North Project
Zone Hole No. Easting
(m) Northing
(m) Elev.
(mASL)
Total Hole Length
(m) Azm Dip
From (m)
To (m)
Sample Length
(m)
Estimated True
Width (m)
Ni (%)
Cu (%)
Co (%)
Pt (g/t)
Pd (g/t)
Au (g/t)
NiEq (%)
MSU 12TK0153C 490982 5168405 388 618.13 164 -82 578.45 585.59 7.1 6.6 8.31 3.26 0.16 0.84 0.65 0.43 10.15
MSU 16TK0233C 490914 5168369 388 562.66 300 -85 500.45 506.18 5.7 5.3 4.74 1.93 0.10 0.38 0.38 0.21 5.81
MSU 16TK0233E 490914 5168369 388 562.36 302 -86 513.11 523.65 10.5 9.7 5.69 2.34 0.12 0.56 0.60 0.27 7.02
MSU 20TK0265 490949 5168389.
28 388 584 174 -83 543.78 546.8 3.0 2.8 4.23 2.17 0.09 0.51 0.41 0.29 5.42
138 12TK0138 491125 5168286 389 731.5 274 -74 431.5 564.0 132.5 128.8 1.06 0.99 0.03 0.71 0.18 0.21 1.71
510.1 519.7 9.6 9.3 2.49 2.09 0.05 0.81 0.40 0.36 3.68
138 12TK0146 491125 5168286 389 670.0 293 -75 430.5 524.0 93.5 90.9 0.55 0.37 0.02 0.13 0.08 0.09 0.78
442.3 455.5 13.2 12.8 1.03 0.85 0.03 0.19 0.12 0.24 1.51
138 12TK0153 490982 5168405 388 683.7 161 -82 423.0 534.0 111.0 110.1 0.46 0.31 0.02 0.11 0.07 0.07 0.65
138 12TK0156 490996 5168294 388 703.8 293 -83 417.3 533.8 116.5 115.8 0.88 0.65 0.03 0.22 0.12 0.14 1.26
495.5 505.6 10.1 10.1 1.50 0.86 0.04 0.23 0.17 0.11 1.98
138 12TK0160 490997 5168293 388 634.0 240 -86 416.0 548.0 132.0 131.9 1.07 0.84 0.03 0.27 0.16 0.18 1.55
490.8 504.9 14.1 14.0 2.08 1.24 0.05 0.39 0.22 0.17 2.78
138 13TK0167 490922 5168361 388 635.8 240 -89 415.5 509.3 93.8 93.8 0.31 0.14 0.01 0.12 0.06 0.05 0.43
138 13TK0171 491049 5168348 389 641.9 157 -90 416.0 531.0 115.0 115.0 0.65 0.45 0.02 0.17 0.10 0.11 0.93
138 13TK0189 491051 5168340 389 652.7 47 -85 415.3 524.1 108.9 108.1 0.39 0.21 0.02 0.12 0.07 0.06 0.54
138 14TK0206 491095 5168293 388 786.0 356 -86 417.0 526.0 109.0 108.3 0.46 0.31 0.02 0.16 0.09 0.08 0.67
138 16TK0234 490950 5168389 388 696.8 181 -85 419.0 530.0 111.0 109.5 0.44 0.24 0.02 0.10 0.06 0.05 0.59
508.4 529.0 20.6 20.3 0.95 0.51 0.03 0.16 0.12 0.06 1.25
138 16TK0245 490937 5168279 388 585.0 289 -88 414.0 531.0 117.0 116.8 0.63 0.46 0.02 0.24 0.13 0.12 0.93
138 16TK0246 490881 5168290 388 611.4 10 -81 419.0 504.5 85.5 84.8 0.43 0.29 0.02 0.12 0.07 0.08 0.62
138 16TK0248 491049 5168348 389 680.3 142 -87
417.5 538.5 121.0 120.8 0.88 0.61 0.03 0.21 0.13 0.15 1.25
482.7 486.0 3.4 3.3 2.08 0.68 0.05 0.25 0.10 0.10 2.51
519.0 534.0 15.0 15.0 1.41 0.93 0.03 0.37 0.26 0.27 1.99

Document Number
Revision
Page
Rev Date
G4932-RPT-01 0 08 Jan 2021 117
Talon Metals Corp. – Preliminary Economic Assessment #3 on the Tamarack North Project
Zone Hole No. Easting
(m) Northing
(m) Elev.
(mASL)
Total Hole Length
(m) Azm Dip
From (m)
To (m)
Sample Length
(m)
Estimated True
Width (m)
Ni (%)
Cu (%)
Co (%)
Pt (g/t)
Pd (g/t)
Au (g/t)
NiEq (%)
138 16TK0250 490999 5168293 388 648.9 169 -88 419.0 547.5 128.5 128.5 0.50 0.33 0.02 0.14 0.07 0.08 0.71
428.0 437.0 9.0 9.0 1.19 0.87 0.03 0.18 0.12 0.16 1.66
138 12TK0153A 490982 5168405 388 615.09 160 -82 424.12 471 46.9 46.9 0.58 0.38 0.02 0.11 0.06 0.09 0.81
138 12TK0153B 490982 5168405 388 600.47 159 -83 426 458 32 32 0.58 0.39 0.02 0.10 0.06 0.09 0.80
138 12TK0153C 490982 5168405 388 618.13 164 -82 426 459 33 33 0.58 0.43 0.02 0.11 0.06 0.08 0.83
138 20TK0265 490949 5168389.
28 388 584 174 -83 422 482 60 60 0.58 0.38 0.02 0.11 0.07 0.07 0.80
Note: Bold text indicates total hole composite used for mineral resource calculation.
Note: Italicized text indicates a significant intersection within the larger composite.
Note: Upper SMSU, Lower SMSU, and MSU (unless otherwise noted) assumed a Dip and DDR of 25/170 for the calculation of estimated true thickness.
Note: *Uses an assumed Dip and DDR of 25/130 for the calculation of estimated true thickness.
Note: The 138 orebody assumed a Dip and DDR of 0/0 for the calculation of estimated true thickness.
Note: Estimated true thickness calculated via Datamine® "TRUETHK" Process.

Document Number
Revision
Page
Rev Date
G4932-RPT-01 0 08 Jan 2021 118
Talon Metals Corp. – Preliminary Economic Assessment #3 on the Tamarack North Project
10.3 Drill Hole and Core Logging Procedures
Drill Site Management
Drilling at the Tamarack North Project is challenged by the extensive wetlands. Drilling
initially was restricted to winter months with frozen ground to minimize impacts to swamps
and wetlands in the project area. In 2008, drilling was also initiated in the summer months
using swamp mats for both access roads and drill platforms which have been very successful
in minimizing the impact on the environment.
Kennecott has previously implemented and maintained strict environmental and safety
protocols with regard to drilling which include: drilling contracts that ensure safety standards
are not compromised, the use of swamp mats for drill platforms and access, and
photographing the site before and after drilling and rehabilitation.
Diamond drilling diameters utilized at the Tamarack North Project have been primarily hole
(outside diameter): 75.7 mm; core (inside diameter): 47.6 mm (NQ) and hole (outside
diameter): 96 mm; core (inside diameter): 63.5 mm (HQ) wireline. Sonic drilling has been
used extensively to pre-collar holes through the overlying glacial sediments which are then
completely cased off prior to commencing diamond core drilling. All casing depths and sizes
are recorded in the Kennecott acQuire® database.
Typical industry standard procedures are followed with all drilling and are outlined in the
“Tamarack Core Processing Procedures Manual” including:
• All statutory permits and approvals received by appropriate regulatory bodies prior to
drilling. (see
http://www.dnr.state.mn.us/lands_minerals/metallic_nf/regulations.html)
• Drill collars initially located in the field using handheld GPS. Following completion of
drilling each collar is either professionally surveyed or by differential GPS reading and
collar position permanently marked with marker on cement cap. If permanent marker
cannot be established because of ground conditions a certificate is issued by surveyor.
Collar positions are subsequently checked against high resolution satellite imagery.
• Closure of holes follow regulatory procedures as outlined by the MDH both for
permanently abandoned holes, which are cemented from the base to surface with all
casing removed, and temporarily abandoned holes, which are temporarily sealed

Document Number
Revision
Page
Rev Date
G4932-RPT-01 0 08 Jan 2021 119
Talon Metals Corp. – Preliminary Economic Assessment #3 on the Tamarack North Project
according to regulations if there is a possibility of the hole being deepened or the hole
is awaiting a DHEM survey.
Core Delivery and Logging
Kennecott has previously defined and adopted clear procedures for core processing. A split-
tube coring system has been adopted for all holes. Exploration holes are designated as
either reconnaissance or as resource with each being treated somewhat differently.
Resource core is transferred to V-rails directly from the core tube. Core is then transported
a short distance to the core storage site via a customized, secure, v-rail enabled trailer. Core
is only transferred to core boxes by the geologist after transport to the core storage site and
after being marked up and processed. This procedure minimizes breakage and ensures the
core-orientation (by the Reflex Ace Core Orientation Tool (ACT)) that is used with each core-
run is maintained. Reconnaissance designated core is primarily placed into boxes directly
from the core tube although it can also be placed in the v-rail system at the discretion of the
project manager.
Geological Logging Procedures
Geological summary logging is completed immediately on receiving the core while still in the
V-rails and is intended to provide an overview of the key lithologies and features with
accurate estimates of mineralization. The main unit lithologies are recorded with the codes;
SED, FGO, CGO, MZ, SMSU, MSU, MMS etc. The logs are entered into the acQuire®
database and also prioritized for detailed logging.
Prioritization of core is determined during the summary logging. High priority core is
processed and logged as soon as possible. Lower priority core is retained and stored in
boxes until it can be processed and logged. Core processing and logging procedures
include:
• Reference orientation line marking (based on Reflex ACT);
• Measurement conversion and run depth marking (Imperial to Metric);
• Run recovery logging and marking (core loss record);
• Core photography in boxes;

Document Number
Revision
Page
Rev Date
G4932-RPT-01 0 08 Jan 2021 120
Talon Metals Corp. – Preliminary Economic Assessment #3 on the Tamarack North Project
• Detailed geotechnical logging (logging interval based on geotechnical characteristics
that are at least 25 cm long and up to 3.05 m at maximum). Standard logging and testing
includes:
o Total core recovery (TCR) and Solid Core Recovery (SCR)
o Rock Quality Designation (RQD or L10)
o Natural fracture count
o Open vein count
o IRS Hardness (Rock strength estimation)
o Weathering Index
o Alteration Index
o Rock structure and texture
o Joint set number (Jn)
o Joint Roughness (Ja)
o Joint Condition Rating (JCR)
o Defect feature details and orientation
o Pont structure details and orientation
o Point load testing (axial and diametral every 6 m)
o Laboratory sampling for uniaxial compressive strength (UCS), triaxial compressive
strength (TCS) and Brazilian tensile strength (BTS) testing every 20 m
• Detailed Geological Logging: Detailed geological logging is an important process for
recording and understanding the geology and mineralization. Kennecott has adopted
the system of logging into the acQuire® database with specific custom fields and drop-
down lists to ensure consistency. The logging includes a lithology log, an alteration log,
a mineralization log, a point structure log, a linear structure log (where structure
orientations and dips are measured); and a magnetic susceptibility log with a handheld
magnetometer (discontinued temporarily in 2008 but subsequently resumed).
Surveying
All collars are professionally surveyed to sub-meter accuracy after completion of the drill
hole. Down-hole deviation surveys are conducted on all holes at the Tamarack North Project
and include two independent surveys conducted on the hole completion, which include:

Document Number
Revision
Page
Rev Date
G4932-RPT-01 0 08 Jan 2021 121
Talon Metals Corp. – Preliminary Economic Assessment #3 on the Tamarack North Project
• A multi-shot survey with a magnetic tool (Flexit) provided by the drill contractor (survey
shots conducted at least 10 m intervals);
• A multi-shot gyroscopic survey conducted by a down-hole survey contractor (survey
shots conducted at a minimum of 20 m intervals).
The Flexit tool is susceptible to poor azimuth accuracy in the presence of strongly magnetic
lithologies, such as those found at the Tamarack North Project. However, the dip readings
are not affected by in hole magnetics and provide a reliable source of dip measurements as
the hole progresses. Multi-shot gyroscopic surveys are not affected by magnetics and
provide accurate downhole deviation.

Document Number
Revision
Page
Rev Date
G4932-RPT-01 0 08 Jan 2021 122
Talon Metals Corp. – Preliminary Economic Assessment #3 on the Tamarack North Project
SAMPLE PREPARATION, ANALYSES, AND SECURITY
11.1 Core Sampling and Chain of Custody
Standardized core sampling procedures were introduced by Kennecott in January 2007 and
have been incorporated for all the sampling at the Tamarack North Project with only minor
modifications made subsequently. The Tamarack North Project has adopted the use of split-
tube coring as a means of minimizing core breakage and facilitating the recording of
geotechnical and oriented core data (Kennecott Internal Doc, 2016). It is standard practice
to sample all core irrespective of lithology type or sulphide content, although sulphide
intervals are prioritized. Core is sampled on a minimum of 0.5 m intervals to a maximum of
3 m, with 1.5 m being the preferred sample length in mineralized zones. The following
procedures are adhered to:
• Core is picked up at the drill site by Talon staff and returned to the secure core logging
facility in the town of Tamarack (Figure 11-1).
Figure 11-1: Photo of Kennecott/Talon Core Processing Facility Tamarack, Minnesota

Document Number
Revision
Page
Rev Date
G4932-RPT-01 0 08 Jan 2021 123
Talon Metals Corp. – Preliminary Economic Assessment #3 on the Tamarack North Project
• Once at the core processing facility, the core is “quick-logged” for major lithological units
and sulphide mineralization and entered directly into the acQuire® system database.
Further detailed lithological logging will occur later in the process chain once
geotechnical logging processes have occurred;
• Sample interval marking: Prior to being photographed the core is transferred to
cardboard core boxes where the tags are stapled to the inside wall of the appropriate
rows. Duplicate, blank, and standard sample tags are inserted and displayed on the
core boxes for photographing;
• Core photography is conducted after the sample mark-up is completed on V-rails
(definition and some reconnaissance holes);
• Boxed core (definition and reconnaissance holes) is photographed and was
reintroduced in 2012 after being discontinued in 2008;
• In “definition” and “reconnaissance” categorized holes, a 20 cm sample is cut from the
core for the purposes of BTS, TCS and UCS measurements approximately every 20 m.
Preference is given to core representative of the dominant lithology in the 20 m interval
at the discretion of the geologist (i.e. at changes in lithology). The UCS sample is
labelled “UCS” with a unique sample tag associated with it, photographed (as part of
the regular core photo process) and ultimately placed in a unique sample bag (with tag)
until despatched to an appropriate testing laboratory;
• A density measurement via the hydrostatic-gravimetric method is performed every 20 m
on a 10 cm sample in the core shack. Dry and wet weights for three density standards
are recorded per use of the instrument setup. The scale is also calibrated using
calibration weights at this time;
• Core sawing is conducted after core marking, sample tagging, and photography has
occurred. Core is consistently cut 1 cm to the right of the orientation line. Both halves
are returned to the box;
• Sample packaging: half-core samples (the half without the orientation line) are packed,
after air drying, in individual plastic bags with the sample ticket inserted inside the bag
and the sample number written in permanent marker on the outside. The remaining core
is secured, and stored locally, out of the elements, until such time as it can be
transported to the State core library in Hibbing, Minnesota;
Document Number
Revision
Page
Rev Date
G4932-RPT-01 0 08 Jan 2021 124
Talon Metals Corp. – Preliminary Economic Assessment #3 on the Tamarack North Project
• The QC protocol is documented by Kennecott and was generally followed at the
Tamarack North Project since the start of the program (reportedly modified to the
present procedure in early 2008). Current QC samples include:
o Blanks: inserted at the beginning of every batch, at every 30th sample, at changes
in lithology, and specifically, prior to and after highly mineralized samples. Blanks
used have included commercially derived Silica Sand; GABBRO-1 (unmineralized
half core from hole 07L039); GABBRO-2 (unmineralized half core from 07L038 since
July 2008); GABBRO-128 (unmineralized half core from hole 10TK0128); and
GABBRO-18 (unmineralized half core from hole 04L018);
o Standards: a matrix-matched standard (corresponding to the sulphide content of the
flanking samples) is inserted into the sample stream every 30 samples to monitor
sample accuracy. A corresponding standard is also inserted at the beginning of
significant changes in mineralization. The standards were prepared from coarse
rejects of the Eagle Deposit (Michigan) (EA type) and Tamarack North Project (TAM
type) drill holes and are certified by an independent subject matter expert after
Round Robin testing at accredited laboratories;
o Duplicates: Field, Coarse Reject, and Pulp duplicates are routinely used to monitor
sampling and assay precision according to the following protocols:
▪ Field Duplicates include two quartered core lengths submitted consecutively
every 30 samples and are offset from the standards by 10 samples;
▪ Coarse Reject Duplicates are splits from the coarse reject material that are
inserted every 20 samples by the lab at the request of Kennecott. See Figure
11-3 and Figure 11-4;
▪ Pulp Duplicates are randomly generated and assayed by ALS Minerals as an
internal process at a rate of one every 30 samples. See Figure 11-5 and Figure
11-6;
▪ Check assays from a secondary laboratory were not utilized by Kennecott to
confirm the quality of the ALS Minerals values. However, the quality of the ALS
Minerals values is monitored using acQuire® protocols for evaluating standards
and blanks.

Document Number
Revision
Page
Rev Date
G4932-RPT-01 0 08 Jan 2021 125
Talon Metals Corp. – Preliminary Economic Assessment #3 on the Tamarack North Project
• Sample batches are packed in collapsible plastic bins for shipping. Sample
consignments are limited to 200 samples and are grouped in batches of the same rock
types and using the same assay methods. A dispatch form is created, with one copy
being sealed in the container and the other emailed to the lab. The container is sealed
with randomly selected, security tags that are listed in the Chain of Custody Sheet.
Access to the samples cannot occur without breaking a seal;
• Samples are shipped to the ALS Minerals lab in Thunder Bay, Ontario, Canada via
Manitoulin Transport for sample preparation;
• The Chain of Custody Sheet is signed upon receipt at the lab in Thunder Bay, confirming
that they are not damaged or tampered with. These forms are scanned and emailed to
Kennecott/Talon;
• ALS Minerals is independent to Kennecott and Talon and is one of the world’s largest
and most diversified testing services providers, with over 120 labs and offices in the
Minerals Division. ALS Thunder Bay and Vancouver laboratories are accredited by the
Canadian Association for Laboratory Accreditation and Standards Council of Canada
(http://www.alsglobal.com/).
11.2 Sample Preparation and Assay Protocols
Sample preparation at ALS Minerals in Thunder Bay includes the following procedure:
• Samples are logged into the ALS Minerals database (LOG-21);
• Samples are weighed upon receipt then dried overnight (DRY-21);
• Entire sample is crushed to 70% -2 mm or better (CRU-31);
• 1000 g is split off using a rotary splitter or a Boyd crusher/rotary splitter combination
(SPL-22);
• Entire 1000 g is pulverized to better than 85% passing 75 micron (μm) (PUL-32);
• Assay aliquots are taken from each sample and packaged for shipment to ALS
Vancouver where the samples are digested and analyzed;
• Vacuum seal master pulp and all master pulp material is returned to Kennecott/Talon
and stored at the Tamarack Project site;

Document Number
Revision
Page
Rev Date
G4932-RPT-01 0 08 Jan 2021 126
Talon Metals Corp. – Preliminary Economic Assessment #3 on the Tamarack North Project
• Crushers, splitters and pulverizers are washed with barren material at the start of each
batch and as necessary within batches. Between-sample washes (WSH-21 and WSH-
22) are used at the request of Kennecott/Talon for high-grade sample batches;
• Crushing QC tests are conducted every 20th to 40th sample;
• Pulverizing QC tests are conducted every 20th to 40th sample.
Sample analyses are conducted at the ALS Minerals Vancouver laboratory. The
methodology for mineralized material at the Tamarack North Project is reported as follows:
• Ni, Cu, and Co grades are first analyzed by a 4-acid digestion and inductively coupled
plasma atomic emission spectroscopy (ICP-AES) and inductively coupled plasma mass
spectroscopy (ICP-MS) (ME-MS61). Grades reporting greater than 0.25% Ni and/or
0.1% Cu, using ME-MS61, trigger a sodium peroxide fusion with ICP-AES finish
(ICP81);
• Pt, Pd and Au are initially analyzed by a 50 g fire assay with an ICP-MS finish (platinum
group metal (PGM)-MS24). Any samples reporting greater than 1 g/t Pt or Pd trigger an
over-limit analysis by ICP-AES finish (PGM-ICP27) and any samples reporting greater
than 1 g/t Au trigger an over-limit analysis by AAS (Au-AA26);
• Total sulphur is analyzed by Leco Furnace (S-IR08).
The methodology for non-mineralized samples is reported as follows:
• Ni, Cu, and Co grades are first analyzed by a 4-acid digestion and mixed ICP-AES and
ICP-MS (ME-MS61). Grades reporting greater than 0.25% Ni and/or 0.1% Cu, using
ME-MS61, trigger a sodium peroxide fusion with ICP-AES finish (ICP81);
• Pt, Pd and Au are initially analyzed by a 50 g fire assay with an ICP-MS finish (PGM-
MS24).
The methodology for litho-geochemical characterization of samples is reported as follows:
• ALS Minerals Code ME-ICP06 – Whole rock package for 13 oxides plus loss on ignition
(ALS Minerals Code OA-GRA05) and total (ALS Minerals TOT-ICP06) – lithium (Li)
metaborate or tetraborate fusion/ICP-AES finish;
• ALS Minerals Code ME-MS81 – Resistive trace 30 elements by Li meta-borate fusion
and ICP-MS finish;
Document Number
Revision
Page
Rev Date
G4932-RPT-01 0 08 Jan 2021 127
Talon Metals Corp. – Preliminary Economic Assessment #3 on the Tamarack North Project
• ALS Minerals Code ME-4ACD81 – Eight base metals plus Li and Sc by 4-acid digestion
with an ICP-AES finish (silver (Ag), cadmium (Cd), Co, Cu, molybdenum (Mo), Ni, Pb,
and zinc (Zn));
• ALS Minerals Code ME-MS42 – Nine volatile trace elements by aqua regia digest with
an ICP-MS finish (arsenic (As), bismuth (Bi), mercury (Hg), indium (In), rhenium (Re),
antimony (Sb), selenium (Se), tellurium (Te), thallium (Tl));
• ALS Minerals Code ME-IR08 – Total sulphur and total carbon analyzed by combustion
furnace.
The methodology for density measurements is reported as follows:
• ALS Minerals Code OA-GRA08 – SG is determined by the weighing a sample in air and
in water, and it is reported as a ratio between the density of the sample and the density
of water.
11.3 Assay Data Handling
After receiving assay results for each despatch, QA/QC standards, blanks and duplicate
data are immediately processed (GOMS acQuire®) to confirm that results are consistent
with expected ranges and values. The values reported for ALS Minerals internal standards
are also monitored. Kennecott/Talon has adopted a number of rules of variance that are
acceptable vs those of exceedance. An internal QA/QC analysis manual is available for all
users of the data. If established quality thresholds are exceeded, then the sample is logged
as a “Fail” and an investigation is initiated. Re-analysis, sample switch checks, and other
means of investigation are acted upon to resolve exceedances. All actions are tracked and
logged (See Figure 11-2). Assay data is only considered final within the acQuire® system
once they have passed all QA/QC checks.

Document Number
Revision
Page
Rev Date
G4932-RPT-01 0 08 Jan 2021 128
Talon Metals Corp. – Preliminary Economic Assessment #3 on the Tamarack North Project
Figure 11-2: Table of Failures and Corrections
11.4 Quality Assurance and Quality Control (QA/QC)
QA/QC programs are intended to monitor the accuracy and precision of the sampling and
analysis process in order to quantify the reliability and accuracy of assay data. Typical
QA/QC programs consist of a routine insertion of QC materials to measure laboratory
performance. QC materials generally consist of CRM including standards and blanks
(materials containing no economic minerals) as well as duplicate samples (duplicates).
The Tamarack North Project has shown QA programs consistent with industry standards.
Written procedures, acceptable industry software, database organization, and data
presentation all contribute to confidence in the current program. QC at the Tamarack North
Project has evolved over the life of the project. The initial phase of the project saw duplicates,
blanks and standards inserted at a rate of approximately 5% to 6%. With the maturity of the
program and confidence in the laboratory the rate of insertion has been reduced to 3.5% to
4%. There is a consistent program of analyzing duplicates of pulps (lab), coarse rejects (lab)
and core (field). Analysis of the coarse reject duplicate samples for Ni and Cu show a strong
correlation and thus confirm proper sample splitting methodology carried out at the lab (see
Figure 11-3 and Figure 11-4). Analysis of the pulp duplicate samples for Ni and Cu also
show a strong correlation and thus confirm the lab precision (see Figure 11-5 and Figure
11-6).
The QA/QC standards, blanks and duplicate testing protocols applied by Kennecott/Talon
are outlined in Section 11.1 above.

Document Number
Revision
Page
Rev Date
G4932-RPT-01 0 08 Jan 2021 129
Talon Metals Corp. – Preliminary Economic Assessment #3 on the Tamarack North Project
It is the QP’s opinion that the sampling process is representative of the mineralization at
Tamarack North and that the sample preparation and QA/CQ procedures used, and the
sample chain of custody were found to be consistent with CIM Mineral Exploration Best
Practice Guidelines (November 2018).
The QP recommends that Talon prepare an annual report summarizing the QA/QC analysis
of their CRM data and that they incorporate laboratory check assays, from a referee lab, into
their protocol as a check against lab bias from their primary lab.
Figure 11-3: Comparison of Original vs Duplicate Coarse Reject Ni (%) values for Tamarack North
Drill Hole Samples between 2002 and 2017

Document Number
Revision
Page
Rev Date
G4932-RPT-01 0 08 Jan 2021 130
Talon Metals Corp. – Preliminary Economic Assessment #3 on the Tamarack North Project
Figure 11-4: Comparison of Original vs Duplicate Coarse Reject Cu (%) values for Tamarack North
Drill Hole Samples between 2002 and 2017
Figure 11-5: Comparison of Original vs Duplicate Pulps Ni (%) values for Tamarack North Drill Hole
Samples between 2002 and 2017
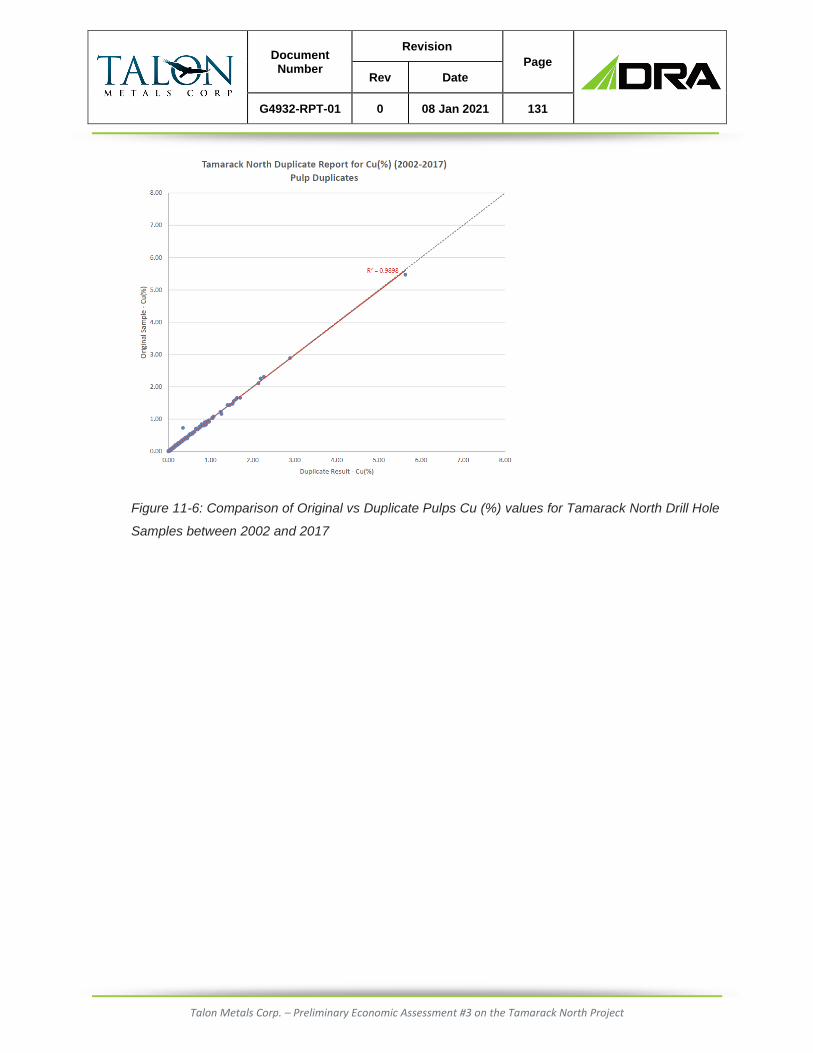
Document Number
Revision
Page
Rev Date
G4932-RPT-01 0 08 Jan 2021 131
Talon Metals Corp. – Preliminary Economic Assessment #3 on the Tamarack North Project
Figure 11-6: Comparison of Original vs Duplicate Pulps Cu (%) values for Tamarack North Drill Hole
Samples between 2002 and 2017
Document Number
Revision
Page
Rev Date
G4932-RPT-01 0 08 Jan 2021 132
Talon Metals Corp. – Preliminary Economic Assessment #3 on the Tamarack North Project
DATA VERIFICATION
12.1 Golder
The QP completed a number of data verification checks in 2014, 2017, and 2020 while
completing the mineral resource estimate for the Tamarack North Project. The verification
work included a check of the drill hole database provided against original assay records
(2014, 2017 and 2020) and a site visit by the QP (2014) to check drill hole collars, logging
procedures, sample chain of custody and collection of independent samples for metal
verification. In addition, a number of verifications were completed for the mineral resource
estimate which is outlined in Section 14.
Database Verification
The QP compared 2,091 sample assays for %Ni, %Cu, %Co, Pt parts per million (ppm), Pd
ppm, Au ppm, from the supplied drill hole database to the original ALS Minerals certificates
in the First Independent Technical Report on the Tamarack North Project with an effective
date of August 29, 2014 (see Table 12-1). For the updated mineral resource estimate in
2017, the QP reviewed a further 533 samples for %Ni, %Cu, %Co, Pt ppm, Pd ppm, Au
ppm, from the supplied drill hole database (for holes drilled since the previous estimate) to
the original ALS Minerals certificates. In 2020, an additional 157 samples having a Ni grade
above 0.4%, representing 1,978 assays were checked identifying minor issues with three
samples and eight Pt, Pd and Au assays. These issues were reviewed and found to be not
material to the 2020 mineral resource estimate and are recommended to be corrected in the
assay database. The database encompasses the entire set of drill holes at the Tamarack
North Project. Samples found within the resource areas were preferentially chosen (2008 to
2020 drill programs – Tamarack North Project) as they are material to the validity of the
mineral resource estimate. Assay certificates were available for all samples. A summary of
the data validation is listed in Table 12-1.
Table 12-1: Drill Hole Sample Data Validation
Years of Drill Program # of Holes # of Samples # of Assays # of Errors Check Year
2008-2013 37 2,091 25,983 0 2014
2014-2018 19 533 3,198 0 2017
2019-2020 7 157 1,978 8 2020

Document Number
Revision
Page
Rev Date
G4932-RPT-01 0 08 Jan 2021 133
Talon Metals Corp. – Preliminary Economic Assessment #3 on the Tamarack North Project
Only a small selection of all the drill holes at Tamarack North Project were validated against
the original data. A total of 63 unique drill holes (2,781 samples), representing 6.7% of the
total available assay data, was reviewed. The validated samples consisted of those used in
the mineral resource estimate that were above the chosen COGs used at the time. No
validation checks were completed on the remaining samples since most drill holes and
samples were not included in the mineral resource estimate. It should be noted that certain
assay values in ppm were expressed as percentages rounded to three decimal places in the
database. Values below the detection limit were set to half of the detection limit instead of a
zero value.
Site Visit
A site visit to the Tamarack North Project and Kennecott office, located in the town of
Tamarack, Minnesota was carried out by Brian Thomas, P.Geo., QP for this mineral
resource estimate and Technical Report, on July 16, 2014. No active drilling or core logging
was ongoing at the time of the visit. The visit to the Tamarack North Project included:
• An overview tour of the exploration property;
• Inspection and GPS co-ordinate reading of drill collars 08TK0054, 08TK0058,
08TK0079 and 12TK0158 (Table 12-2);
• Visual inspection of physiography and general conditions.
Table 12-2: Validation Check of Drill Collars
Hole Number Source Easting Northing Elevation
08TK0054 Kennecott 490713 5168726 391
Golder 490713 5168727 395
08TK0058 Kennecott 490590 5168609 390
Golder 490588 5168610 391
08TK0079 Kennecott 490589 5168605 390
Golder 490584 5168607 389
12TK0158 Kennecott 490850 5168418 388
Golder 490850 5168419 390
All collar co-ordinates were found to closely match the Kennecott co-ordinates, generally
within the accuracy of the GPS readings (±3 m).

Document Number
Revision
Page
Rev Date
G4932-RPT-01 0 08 Jan 2021 134
Talon Metals Corp. – Preliminary Economic Assessment #3 on the Tamarack North Project
The site visit to the Kennecott office and core logging facilities in Tamarack, Minnesota,
included the following items:
• Review of logging and sampling procedures used on the drill holes;
• Review of core logs against the core available at time of visit;
• Review of Tamarack geological and mineralization characteristics with Kennecott staff;
• Collection of representative duplicate samples for analysis at an independent
laboratory;
• Collection and review of all available data required for the mineral resource estimate;
• Review of QA/QC protocol; and
• Review of sampling and shipping protocol.
No significant issues were identified during the review of data collection procedures and
sample chain of custody. The core logging matched the core well and all processes were
found to meet or exceed industry standards.
A site visit was not completed for the updated mineral resource in this PEA, as there were
no material changes to any of the procedures used by Kennecott for data collection.
Independent Sampling
As part of the 2014 sample verification program, nine core samples and three CRM samples
were collected and transported back to Sudbury, Ontario, Canada where they were analyzed
by Actlabs using sodium peroxide fusion with inductively coupled plasma (ICP) finish for
base metals including Ni, Cu, and Co and fire assay with ICP finish for precious metals
including Pt, Pd, and Au. Two Kennecott standards and one blank sample were also
submitted to Actlabs to confirm their precision and accuracy. SG was also measured on the
pulps. The Actlabs laboratory in Sudbury is certified International Organization for
Standardization (ISO) 17025.
The objective of the samples collected was to represent the low, medium and high-grade
mineralized samples of the three mineralized domains, and to confirm SG. Pictures of
samples representing each mineral domain are displayed in Figure 12-1 to Figure 12-3.
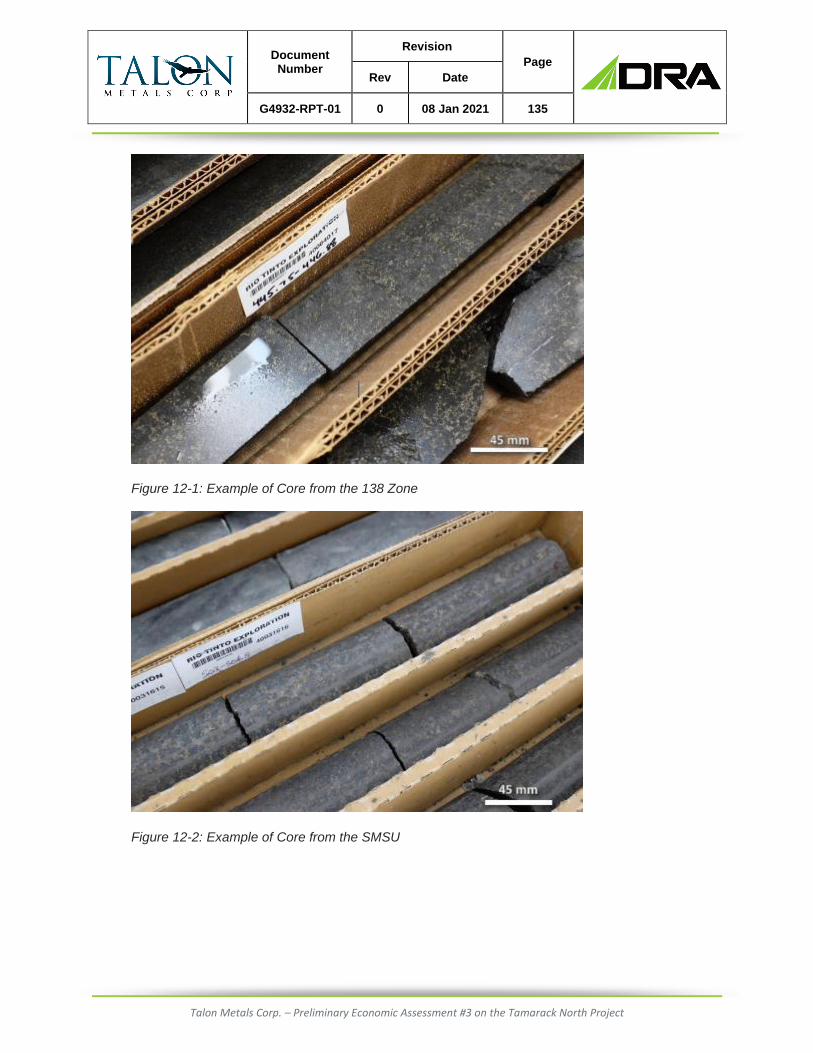
Document Number
Revision
Page
Rev Date
G4932-RPT-01 0 08 Jan 2021 135
Talon Metals Corp. – Preliminary Economic Assessment #3 on the Tamarack North Project
Figure 12-1: Example of Core from the 138 Zone
Figure 12-2: Example of Core from the SMSU

Document Number
Revision
Page
Rev Date
G4932-RPT-01 0 08 Jan 2021 136
Talon Metals Corp. – Preliminary Economic Assessment #3 on the Tamarack North Project
Figure 12-3: Example of Core from the MSU
Golder samples 1310101-1310104 were from hole 12TK0138 (138), samples 1310105-
1310107 (SMSU) were from hole 08TK0079, while samples 1310108-1310109 were from
12TK0158 (MSU). Sample 1310110 was a typical blank, and samples 1310111-1310112
were medium and high-grade standards. Generally, low to medium grade samples
compared favourably as seen in Table 12-3 and Figure 12-4 to Figure 12-6. However, higher
grade samples (Figure 12-5) incurred slightly more variation likely due to sample volume
variance (Kennecott samples were ½ core while Golder used ¼ core) than due to analytical
concerns. All assay results were found to fall within acceptable tolerances of the Kennecott
results and no grade bias was evident.
The SG measured from sample pulps (Actlabs) showed some variance to the measurements
taken from whole core by ALS Minerals (GRA08). SG measurements from ALS Minerals
were only used for the MSU and SMSU domains. Kennecott did collect field SG
measurements from select sections of core from all domains including the 138 Zone (see
Section 11.1 for a description of the process). These values (10-15 cm) were not used by
Golder in the resource model because there was concern regarding how representative they
would be with respect to the larger assay sample interval (Golder used a density weighted
assay estimation methodology in their model as described in Section 14).

Document Number
Revision
Page
Rev Date
G4932-RPT-01 0 08 Jan 2021 137
Talon Metals Corp. – Preliminary Economic Assessment #3 on the Tamarack North Project
Table 12-3: Sample Validation Check
Golder No.
Kennecott No.
Cu (%)
Ni (%)
Co (%)
Au ppm (g/t)
Pt ppm (g/t)
Pd ppm (g/t)
SG
Golder Kennecott Golder Kennecott Golder Kennecott Golder Kennecott Golder Kennecott Golder Kennecott Golder Kennecott
1310101 40064017 1.8 1.71 2.23 2.08 0.045 0.042 0.242 0.427 0.287 0.316 0.251 0.258 2.87 0
1310102 40064027 0.967 0.892 1.03 0.924 0.027 0.025 0.114 0.313 0.202 0.186 0.114 0.117 2.89 0
1310103 40064076 1.75 1.645 1.64 1.67 0.039 0.039 0.215 0.246 0.395 0.4 0.273 0.286 2.78 0
1310104 40064087 0.704 0.671 0.835 0.769 0.025 0.024 0.096 0.108 0.214 0.1945 0.139 0.137 2.78 0
1310105 40031592 1.1 1.525 1.81 2.62 0.044 0.058 0.15 0.227 0.197 0.348 0.312 0.469 2.92 3.29
1310106 40031612 1.64 1.59 4.08 4.15 0.097 0.1 0.182 0.101 0.471 0.543 0.371 0.338 3.28 3.38
1310107 40031616 1.58 1.475 3.4 3.54 0.09 0.096 0.141 0.142 0.371 0.293 0.352 0.339 3.37 3.45
1310108 40067371 1.67 1.595 6.07 5.11 0.125 0.107 0.385 0.249 0.346 0.543 0.61 0.504 3.44 0
1310109 40067377 2.59 1.88 5.47 4.73 0.121 0.102 0.33 0.445 0.497 0.872 0.651 0.483 3.37 0
1310110 blank 0.006 0 0.008 0 0.008 0 < 2 0 < 5 0 < 5 0 2.78 0
1310111 standard 1.35 1.35 3.35 3.34 0.087 0.0087 0.149 0.134 0.386 0.364 0.26 0.272 3.28 0
1310112 standard 4.35 4.52 6.26 6.607 0.162 0.179 0.227 0.265 1.2 1.2 0.794 0.778 4.18 0

Document Number
Revision
Page
Rev Date
G4932-RPT-01 0 08 Jan 2021 138
Talon Metals Corp. – Preliminary Economic Assessment #3 on the Tamarack North Project
Figure 12-4: Validation Check of Cu Assays
Figure 12-5: Validation Check of Ni Assays

Document Number
Revision
Page
Rev Date
G4932-RPT-01 0 08 Jan 2021 139
Talon Metals Corp. – Preliminary Economic Assessment #3 on the Tamarack North Project
Figure 12-6: Validation Check of Pt Assays
On completion of the data validation, site visit and verification sampling, it is the QP’s opinion
that the Tamarack North Project drill hole database has been prepared in accordance to CIM
Estimation of Mineral Resources and Mineral Reserves Best Practise Guidelines and is of
suitable quality to support the mineral resource estimate in this PEA.
The QP recommends that SG measurements are completed from sample pulps where data
is currently only available from field measurements.
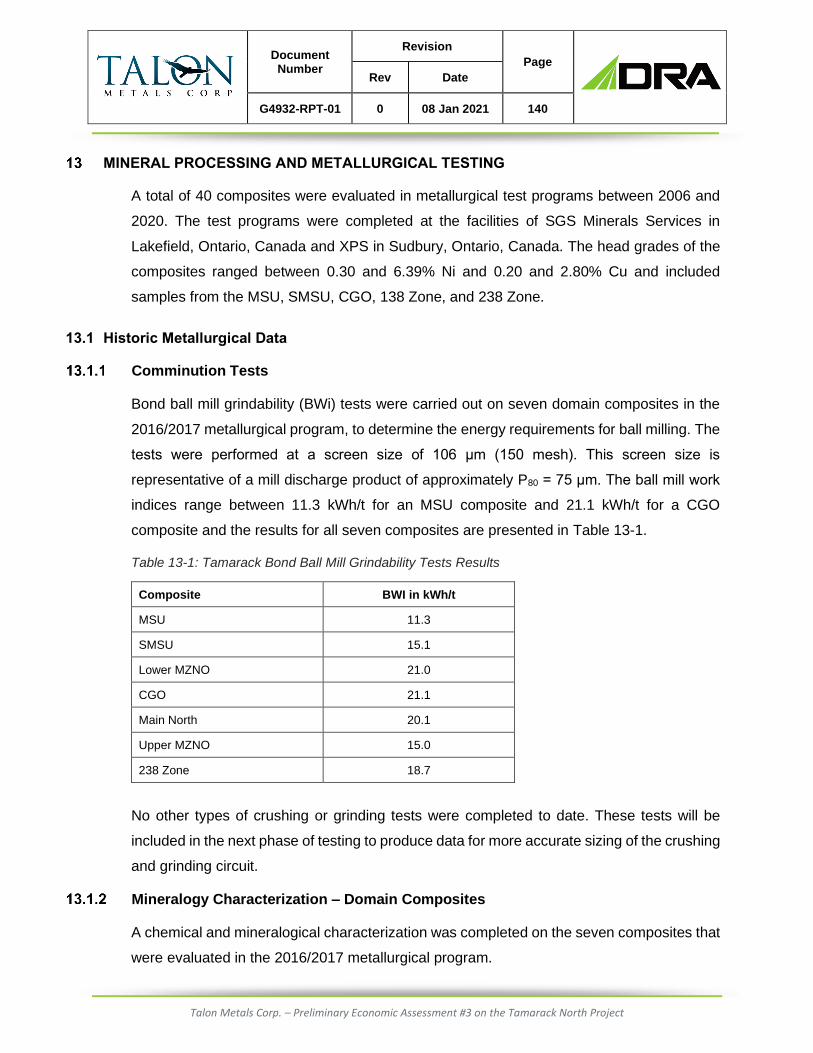
Document Number
Revision
Page
Rev Date
G4932-RPT-01 0 08 Jan 2021 140
Talon Metals Corp. – Preliminary Economic Assessment #3 on the Tamarack North Project
MINERAL PROCESSING AND METALLURGICAL TESTING
A total of 40 composites were evaluated in metallurgical test programs between 2006 and
2020. The test programs were completed at the facilities of SGS Minerals Services in
Lakefield, Ontario, Canada and XPS in Sudbury, Ontario, Canada. The head grades of the
composites ranged between 0.30 and 6.39% Ni and 0.20 and 2.80% Cu and included
samples from the MSU, SMSU, CGO, 138 Zone, and 238 Zone.
13.1 Historic Metallurgical Data
Comminution Tests
Bond ball mill grindability (BWi) tests were carried out on seven domain composites in the
2016/2017 metallurgical program, to determine the energy requirements for ball milling. The
tests were performed at a screen size of 106 μm (150 mesh). This screen size is
representative of a mill discharge product of approximately P80 = 75 μm. The ball mill work
indices range between 11.3 kWh/t for an MSU composite and 21.1 kWh/t for a CGO
composite and the results for all seven composites are presented in Table 13-1.
Table 13-1: Tamarack Bond Ball Mill Grindability Tests Results
Composite BWI in kWh/t
MSU 11.3
SMSU 15.1
Lower MZNO 21.0
CGO 21.1
Main North 20.1
Upper MZNO 15.0
238 Zone 18.7
No other types of crushing or grinding tests were completed to date. These tests will be
included in the next phase of testing to produce data for more accurate sizing of the crushing
and grinding circuit.
Mineralogy Characterization – Domain Composites
A chemical and mineralogical characterization was completed on the seven composites that
were evaluated in the 2016/2017 metallurgical program.

Document Number
Revision
Page
Rev Date
G4932-RPT-01 0 08 Jan 2021 141
Talon Metals Corp. – Preliminary Economic Assessment #3 on the Tamarack North Project
A minor element scan identified Fe, Mg, and aluminum (Al) as the most abundant elements
in the seven composites. No elevated concentrations of deleterious elements were identified
in the samples.
The mineral abundance of the seven composites is depicted in Figure 13-1. Cpy, Pn, and
Po represent almost 70% of the mass in the MSU composite and this value decreases to
slightly over 30% in the SMSU composite. Olivine and pyroxenes were the most abundant
non-sulphide gangue minerals in the SMSU and disseminated composites. Serpentine made
up between 0.11% in the MSU composite and 7.3% in the CGO composite. The
concentrations of talc were low in all composites and ranged between 0.14% in the SMSU
and 0.91% in the CGO composite.
Figure 13-1: Modals of Tamarack Composites
0
10
20
30
40
50
60
70
80
90
100
MSU SMSU Lower MZNO CGO Main North Upper MZNO 238 Zone
Modals
Other
Carbonates
Ti/Fe Oxides
Fe/Cr Oxides
Other Silicates
Epidote Group
Amphibole
K-Feldspar
Plagioclase
Quartz
Talc
Chlorites
Clays
Micas
Clinopyroxene
Orthopyroxene
Serpentine(Fe)
Serpentine
Olivine
Other Sulphides
Valleriite
Tochilinite
Pyrite
Pyrrhotite
Pentlandite
Other Cu Sulphides
Cubanite
Chalcopyrite

Document Number
Revision
Page
Rev Date
G4932-RPT-01 0 08 Jan 2021 142
Talon Metals Corp. – Preliminary Economic Assessment #3 on the Tamarack North Project
The Cu deportment into the different Cu-bearing minerals is presented in Figure 13-2. In the
MSU and SMSU composites almost all Cu units in the sample were associated with Cpy at
97.2% and 95.2%, respectively. Cubanite as the second most abundant Cu-sulphide mineral
contained between 1.4% and 1.0% of the Cu in the MSU and SMSU composites,
respectively. Only 1.3% of the Cu reported to Pn and valleriite in the MSU composite, while
this number increased to 3.8% in the SMSU composite.
In the CGO and Main North disseminated composites, the Cu deportment into Cpy was only
75.6% to 77.0%. Between 15.5% and 16.3% of the Cu was associated with cubanite and
5.9% to 8.2% with valleriite. Cubanite has a Cu content of only 23.4% compared to 34.6%
in Cpy and, therefore, has negative implications on the Cu concentrate grade that can be
achieved with this material. The deportment of Cu into valleriite will result in an overall lower
recoverable percentage of Cu since the valleriite proves difficult to recover in the flotation
process.
Figure 13-2: Elemental Deportment of Cu
Electron microprobe analysis was conducted on the seven composites to determine the
chemical composition of specific minerals and to quantify the deportment of Ni into sulphide
and non-sulphide gangue minerals. The concentrations of pertinent elements in Cpy, Pn,
MSU SMSU Lower MZNO CGO Main North Upper MZNO 238 Zone
Valleriite 0.1 2.8 22.7 5.9 8.2 13.0 4.0
Pentlandite 1.2 1.0 0.8 0.7 0.8 0.9 0.7
Other Cu Sulphides 0.0 0.0 0.0 0.2 0.0 0.8 0.0
Cubanite 1.4 1.0 17.2 16.3 15.5 22.5 2.6
Chalcopyrite 97.2 95.2 59.3 77.0 75.6 62.7 92.7
0
10
20
30
40
50
60
70
80
90
100
Ma
ss (
% C
u)
Elemental Deportment (Mass % Cu)

Document Number
Revision
Page
Rev Date
G4932-RPT-01 0 08 Jan 2021 143
Talon Metals Corp. – Preliminary Economic Assessment #3 on the Tamarack North Project
and Po are presented in Table 13-2. Further the elemental deportment of Ni as determined
by microprobe and Quantitative Evaluation of Materials by Scanning Electron Microscope
(QEMSCAN) analyses is presented in Figure 13-3. While 98.1% and 96.0% of the Ni was
associated with Pn in the MSU and SMSU composites respectively, the values decreased
to 84.3% in the CGO composites. Up to 10.4% of the Ni units in the CGO composite were
associated with olivine, which renders them unrecoverable by means of sulphide flotation.
The increased deportment of Ni into non-sulphide gangue minerals is the primary reason for
the sharp decrease in Ni rougher recovery for the lower grade samples. While mineralogical
analysis was conducted on very few samples, Ni sulphide chemical analysis identified a
consistent 0.1% Ni head grade associated with non-sulphide gangue minerals in low-grade
composites, which is not recoverable by means of sulphide flotation. In a sample with a 0.5%
Ni head grade, the Ni content in non-sulphide gangue minerals represents approximately
20% of the entire Ni values in the sample.
Table 13-2: Concentrations of Pertinent Elements in Sulphide Minerals
Note: Cpy = chalcopyrite, Pn = pentlandite, Po = pyrrhotite
Element MSU SMSULower
MNZOCGO
Main
North
Upper
MZNO238
%Cu in Cpy 32.8 33.7 28.2 29.2 29.2 32.4 33.5
%Ni in Po 0.26 0.25 0.29 0.10 0.14 0.10 0.43
%Ni in Pn 33.9 34.8 32.3 31.3 31.8 25.9 32.9
%S in Cpy 34.7 34.9 35.0 34.5 34.8 34.5 34.7
%S in Po 39.2 39.2 38.5 39.1 39.0 38.7 38.6
%S in Pn 33.4 33.2 33.2 33.0 33.4 29.5 35.5

Document Number
Revision
Page
Rev Date
G4932-RPT-01 0 08 Jan 2021 144
Talon Metals Corp. – Preliminary Economic Assessment #3 on the Tamarack North Project
Figure 13-3: Elemental Deportment of Ni
At a primary grind size of P80 ~ 100 μm free and liberated Cu-sulphides accounted for 85.8%
in the MSU composite and 78.3% in the SMSU composite. These values decreased to
66.0% and 72.7% in the CGO and Main North composites.
Free and liberated Pn accounted for 87.2% in the MSU composite and 83.9% in the SMSU
composite. Again, the degree of liberation was reduced in the CGO and Main North
composites with values of 58.1% and 69.5%, respectively.
Metallurgical Optimization
A flowsheet optimization program was carried out at XPS in Sudbury, Ontario and SGS in
Lakefield, Ontario using an LOM composite that attempted to replicate the combined SMSU,
MSU, and 138 Zone. The objective of the metallurgical program was to develop a flowsheet
and suitable conditions to produce a Ni concentrate that could be marketed to smelters,
converted into Ni powder, or treated in a downstream hydrometallurgical processing facility.
The minimum grade target for the Ni concentrate was established at 10.5% Ni to ensure
MSU SMSU Lower MZNO CGO Main North Upper MZNO 238 Zone
Amphibole 0.00 0.01 0.07 0.15 0.07 0.04 0.19
Amphibole 0.00 0.01 0.07 0.15 0.07 0.04 0.19
Micas 0.11 0.03 0.36 0.57 0.49 0.19 0.81
Clinopyroxene 0.00 0.00 0.02 0.05 0.02 0.02 0.03
Orthopyroxene 0.01 0.19 2.35 1.71 2.20 0.97 4.57
Serpentine(Fe) 0.00 0.02 0.17 0.12 0.14 0.14 0.23
Serpentine 0.00 0.30 3.70 2.28 1.20 1.59 0.86
Olivine 0.04 1.44 8.49 10.44 6.38 10.43 4.74
Pyrite 0.00 0.00 0.00 0.00 0.01 0.00 0.02
Pyrrhotite 1.21 1.13 0.38 0.40 0.58 0.40 0.37
Pentlandite 98.62 96.89 84.47 84.27 88.91 86.22 88.18
0
10
20
30
40
50
60
70
80
90
100
Ma
ss (
% N
i)
Elemental Deportment (Mass % Ni)

Document Number
Revision
Page
Rev Date
G4932-RPT-01 0 08 Jan 2021 145
Talon Metals Corp. – Preliminary Economic Assessment #3 on the Tamarack North Project
good marketability for the pyrometallurgical option. Further, the process development aimed
to produce a saleable Cu concentrate grading at least 25% Cu.
At the beginning of the optimization program, two composites were generated for
mineralogical characterization. One composite attempted to be representative of the
combined SMSU and MSU mineralization and the second composite aimed to represent
only the 138 Zone mineralization. The two composites were subjected to mineralogical
characterization by QEMSCAN. The modal mineralogy of the two composites is presented
in Figure 13-4. Total sulphides accounted for 7.94% and 20.1% of the total sample mass in
the 138 Zone and SMSU/MSU composites, respectively. Pn was the only Ni mineral, while
Cpy and cubanite were identified as the Cu minerals. No electron probe analysis was
performed on the two composites to quantify the deportment of Ni into Po, but it was
assumed to be in line with the mineralogical analysis of the domain composites.
Figure 13-4: Modal Mineralogy of 138 Zone and SMSU/MSU Composites
The average mineral grain size of Pn was 25 μm in the 138 Zone composite and 42 μm in
the SMSU/MSU composite. The average Cpy grain size was smaller at 15 μm and 37 μm in
the 138 Zone composite and SMSU/MSU composite, respectively. The average mineral
grain sizes of Po was comparable with Cpy.
0
10
20
30
40
50
60
70
80
90
100
138 Zone SMSU/MSU
mass%
min
era
l in
fra
cti
on
Mineral Mass (% in sample)
Other
Talc
Carbonate
FeTi-Oxide
Epidote
Pyroxene
Olivine
Amphibole
Serpentine
Chlorite
Mica
Feldspar
Quartz
Pyrite
Pyrrhotite
Cubanite
Chalcopyrite
Pentlandite

Document Number
Revision
Page
Rev Date
G4932-RPT-01 0 08 Jan 2021 146
Talon Metals Corp. – Preliminary Economic Assessment #3 on the Tamarack North Project
To determine the mineralogical differences of material making up the two composites, the
mineralization was further broken down into a high-grade and low-grade composite for the
138 Zone, MSU, as well as an Upper SMSU and Lower SMSU composite for the SMSU/MSU
mineralization. The modal mineralogy of the five composites is depicted in Figure 13-5.
The total sulphide content in the MSU composite was 26.7% compared to 4.29% and 6.82%
in the Lower and Upper SMSU composites, respectively. The main difference between the
Lower and Upper SMSU composites was the higher Po content of 4.03% in the Upper SMSU
compared to only 1.74% in the Lower SMSU. The concentration of Pn was identical in both
composites at 2.00%. The two SMSU composites yielded higher cubanite concentrations of
0.25% and 0.18% in the Lower and Upper SMSU, respectively, compared to only 0.08% in
the MSU composite. Cubanite is frequently linked to decreased Cu recoveries and lower Cu
concentrate grades.
The two 138 Zone composites yielded serpentine concentrations of 53.4% to 54.7%, which
may affect the selectivity of the flotation process.
Talc concentrations were low in all five composites at 0.02% to 0.06%.

Document Number
Revision
Page
Rev Date
G4932-RPT-01 0 08 Jan 2021 147
Talon Metals Corp. – Preliminary Economic Assessment #3 on the Tamarack North Project
Figure 13-5: Modal Mineralogy of SMSU, MSU, and 138 Zone Composites
Prior to determining the composite recipe, it was necessary to establish if the inclusion of
the 138 Zone mineralization in an LOM composite results in metallurgical challenges that
would potentially prevent the ability to produce acceptable concentrates. Hence, one
MSU/SMSU composite representing 5.32 Mt of the Tamarack mineralization and one
MSU/SMSU/138 Zone composite representing the entire 8.02 Mt of the Tamarack
mineralized material were generated and subjected to flotation testing. It should be noted
that these tonnage numbers reflect the previous March 2020 PEA resources and do not
include the additional tonnes that are reported in this PEA as a result of additional drilling
that was performed between the March 2020 PEA and February 2021 PEA. At the beginning
of the metallurgical optimization program, the mineralized material of 8.02 Mt was the most
current information.
In order to determine the impact of the 138 Zone on the metallurgical performance, a total
of 10 rougher kinetics tests were carried out on the two composites. Side-by-side tests on
the two composites were completed on the LOM with and without the 138 Zone composites
0
10
20
30
40
50
60
70
80
90
100
MSU 138 Low-Grade
138 High-Grade
Lower SMSU Upper SMSU
ma
ss
% m
inera
l in
fra
cti
on
Mineral Mass (% Sample)Other
Talc
Carbonate
FeTi-Oxide
Epidote
Pyroxene
Olivine
Amphibole
Serpentine
Chlorite
Mica
Feldspar
Quartz
Pyrite
Pyrrhotite
Cubanite
Chalcopyrite
Pentlandite

Document Number
Revision
Page
Rev Date
G4932-RPT-01 0 08 Jan 2021 148
Talon Metals Corp. – Preliminary Economic Assessment #3 on the Tamarack North Project
to investigate the impact of primary grind size, flotation time, reagent dosage, and reagent
addition points. The results revealed that despite a more challenging mineralogy, the
flotation selectivity in the rougher was not negatively impacted by the 138 Zone
mineralization. One baseline cleaner test performed on each of the two composites
confirmed a consistent selectivity in the cleaner stages and, therefore, a decision was made
to include the 138 Zone mineralization in the LOM composite.
Seven batch cleaner flotation tests were carried out on the LOM with 138 Zone composite
to establish suitable cleaner flotation conditions that maximize the Ni, Cu, and Co recovery
into a 2nd cleaner concentrate while minimizing the entrainment of gangue minerals.
Due to scheduling conflicts a decision was made to perform the remaining tests at SGS in
Lakefield, Ontario. A total of two rougher and eight batch cleaner tests were carried out by
SGS to replicate the initial work performed by XPS and to develop suitable conditions for the
Cu/Ni separation circuit.
At the end of the test program, a LCT was carried out on the LOM with 138 Zone composite
to simulate a continuous operation of the circuit. The flowsheet that was used in the LCT is
depicted in Figure 13-6. The mineralized material was ground to a size of P80 = 100 μm and
then subjected to bulk rougher and bulk scavenger flotation. The combined product was
upgraded in two stages of bulk cleaning. The bulk 1st cleaner tailings were subjected to a
scavenger stage to minimize metal loses to the cleaner tailings. The bulk 1st cleaner
scavenger concentrate and the bulk 2nd cleaner tailings were reground in a ball mill to
improve mineral liberation before being combined with the bulk rougher and bulk scavenger
concentrate of the next cycle. The bulk 2nd cleaner concentrate constituted the Cu/Ni
separation circuit feed and was reground to P80 ~ 25 μm to improve liberation of the Ni and
Cu minerals. This target grind size was established based on the results of the QEMSCAN
analysis. The Cu/Ni separation circuit consisted of a standard Cu rougher and two stages of
cleaning. Lime was added to maintain a pH of 12.0 and no further depressants or collectors
were required.

Document Number
Revision
Page
Rev Date
G4932-RPT-01 0 08 Jan 2021 149
Talon Metals Corp. – Preliminary Economic Assessment #3 on the Tamarack North Project
Figure 13-6: Flowsheet of LCT
The results of the LCT are presented in Table 13-3. A total of 83.2% of the Ni and 15.9% of
the Cu were recovered into a Ni concentrate grading 10.7% Ni and 1.22% Cu. The Cu
concentrate contained 71.6% of the Cu at a grade of 29.9% Cu. Less than 2% of the Ni
reported to the Cu concentrate at a grade of 1.13% Ni. Mineralogical analysis of the Cu
concentrate revealed that almost 50% of the Pn reporting to this product was free or
liberated. This suggests that 50% of the Ni units were recovered to the Cu concentrate
through entrainment, which is difficult to control in small laboratory scale tests. It is
postulated that the Ni recovery into the Cu concentrate will be substantially lower in a
commercial scale continuous operation due to better control of entrainment.
The Tamarack mineralization hosts a range of Mg bearing minerals and recovery into the Ni
concentrate must be minimized. The proposed process conditions include depressants for
the Mg minerals in the cleaning stage but carry over of Mg minerals into the Ni concentrate
was still significant for the disseminated domains. The MgO concentration in the Ni
concentrate of the LOM with 138 Zone composite was 4.66% MgO and, therefore, just below
Primary Grind Bulk Rougher Bulk Scavenger
Cu Rougher
Cu Rougher Tails (Ni Conc)
Cu 2nd Cleaner Conc (Cu Conc)
Cu 2nd Clnr
Cu 1st Clnr
Cu/Ni Separation
RegrindBulk 1st Clnr
Bulk 2nd Clnr
Bulk 1st Clnr Scavenger
Bulk Scavenger Tailings
Bulk 1st Clnr Scavenger Tails
Bulk 2nd ClnrConcentrate
Regrind Mill

Document Number
Revision
Page
Rev Date
G4932-RPT-01 0 08 Jan 2021 150
Talon Metals Corp. – Preliminary Economic Assessment #3 on the Tamarack North Project
the typical smelter penalty threshold value of 5.0% MgO. Non-sulphide gangue rejection
optimization is planned for future test programs to further reduce the gangue content in the
Ni concentrate.
Table 13-3: Process Mass Balance
Metallurgical Analysis
A thorough analysis of all current and historical flotation tests was carried out to develop
regression models for the flotation performance as a function of the Ni and Cu head grades.
The process variables of over 240 rougher, batch cleaner, and locked cycle flotation tests
were reviewed, and tests with suitable conditions such as grind size and reagent regime
were selected to develop refined grade and recovery projections. Further, samples well
below the cut-of grade were not included in the analysis. Of the over 240 flotation tests, the
rougher flotation conditions of approximately 60 tests were deemed suitable for the
Tamarack mineralization in terms of primary grind size, reagent suite and dosages, and
flotation time.
The bulk rougher flotation test results suggest that a natural pH and a primary grind size P80
of 100 to 130 μm should be targeted to achieve high Ni and Cu recoveries into a bulk rougher
concentrate. Sufficient flotation time and collector addition is instrumental in achieving high
Pn recovery into the bulk rougher concentrate.
The Ni rougher recoveries are plotted against the Ni head grade in Figure 13-7. The Ni
rougher recovery model employs two different regression curves for head grades above and
below 1.0% Ni:
< 1.0% Ni Ni Rec = 21.757*ln(Ni Head) + 88.027
> 1.0% Ni Ni Rec = 1.3936*Ni Head + 86.88
Weight
% Cu Ni S Fe MgO Cu Ni S Fe MgO
Cu Conc 2.2 29.9 1.13 32.5 32.5 0.80 71.6 1.6 12.9 4.8 0.1
Ni Conc 11.9 1.22 10.7 28.6 40.6 4.66 15.9 83.2 61.8 32.8 2.4
Bulk 1st Clnr Scav Tails 9.3 0.40 0.74 6.42 17.5 22.7 4.0 4.5 10.8 11.0 9.0
Bulk Scavenger Tails 76.6 0.10 0.21 1.05 10.0 27.1 8.5 10.7 14.6 51.4 88.6
Combined 100.0 0.92 1.53 5.54 14.8 23.4 100.0 100.0 100.0 100.0 100.0
Assays, % % DistributionProduct

Document Number
Revision
Page
Rev Date
G4932-RPT-01 0 08 Jan 2021 151
Talon Metals Corp. – Preliminary Economic Assessment #3 on the Tamarack North Project
Figure 13-7: Ni Rougher Recovery vs Ni Head Grade
The Cu rougher recovery vs Cu head grade results are depicted in Figure 13-8. While the
inclusion of the 138 Zone did not have a fundamental impact on the flotation selectivity or Ni
recovery, the Cu flotation performance is negatively impacted by the 138 Zone
mineralization. This inferior flotation performance was expected based on the mineralogical
characterization of this domain and previous laboratory scale results.
Cu displays more variation compared to Ni but follows the same overall trend. At higher Cu
head grades the variation in Cu recoveries was relatively small for a given head grade but
increased noticeably at lower head grades. It is postulated that varying valleriite contents in
the composites that were included in the development of the regression curve for Cu may
be a primary reason for the increased variation in results. A complete Cu deportment study
would be required for each composite to determine if more accurate projections could be
made when taking into account the different Cu mineral species.

Document Number
Revision
Page
Rev Date
G4932-RPT-01 0 08 Jan 2021 152
Talon Metals Corp. – Preliminary Economic Assessment #3 on the Tamarack North Project
The applicable Cu rougher recovery regression curves for the LOM with 138 Zone are as
follows:
< 0.30% Cu Cu Rec = 7.979*ln(Cu Head) +100.67
> 0.30% Cu Cu Rec = 0.8661* Cu Head + 90.75
Figure 13-8: Cu Rougher Recovery vs Cu Head Grade
13.2 Cleaner Flotation Performance
Bulk cleaner concentrates of over 20% combined Cu and Ni were achieved for most
composites with a single stage of cleaning. Regrinding of the bulk rougher concentrate
resulted in elevated Ni losses, but conditions were not optimized.
Open circuit cleaner tests underestimate the overall metal recovery since intermediate
concentrates and tailings are treated as final tailings. In a commercial operation, these
intermediate products are cycled within the circuit, and the majority of the contained metal
units eventually report to a final concentrate. On a laboratory scale, LCTs simulate the
< 0.30% Cuy = 7.979ln(x) + 100.67
R² = 0.4381
y = 0.8661x + 95.074R² = 0.1024
75.0
77.0
79.0
81.0
83.0
85.0
87.0
89.0
91.0
93.0
95.0
97.0
99.0
0.00 0.20 0.40 0.60 0.80 1.00 1.20 1.40 1.60 1.80 2.00 2.20 2.40 2.60 2.80 3.00
% C
u R
eco
very
% Cu Head Grade
Cu Rougher Recovery
<0.53% Cu>0.53% CuXPS ResultsSGS LCT2020LCT LOM6 Grade Composites
> 0.30% Cuy = 0.8661x + 90.75

Document Number
Revision
Page
Rev Date
G4932-RPT-01 0 08 Jan 2021 153
Talon Metals Corp. – Preliminary Economic Assessment #3 on the Tamarack North Project
operation of a commercial plant by circulating all intermediate streams from one cycle to the
next. LCTs are the only laboratory scale tests that provides a good assessment of the
closed-circuit performance that is to be expected during continuous operation. Only seven
LCTs were carried out to-date. The closed-circuit stage recoveries for Ni and Cu are
presented in Figure 13-9 and Figure 13-10, respectively.
The three data points highlighted in blue were derived from LCTs on the SMSU, MSU, and
LOM with 138 Zone composite. The red data points were recent open circuit tests on six
low-grade composites with modelled closed-circuit performance. The cleaner Ni stage-
recovery gradually decreased with lower head grades. However, owing to the simplicity of
the flowsheet, stage-recoveries remain over 90% even for low-grade samples.
The cleaner Cu stage-recovery followed a similar trend, but with increased data scatter at
the lower head grades.
Figure 13-9: Closed Circuit Ni Stage-Recovery as a Function of Ni Head Grade
y = 1.541ln(x) + 94.034R² = 0.8433
80.0
82.0
84.0
86.0
88.0
90.0
92.0
94.0
96.0
98.0
100.0
0.00 1.00 2.00 3.00 4.00 5.00 6.00 7.00
% N
i S
tage
-Recovery
% Ni Head Grade

Document Number
Revision
Page
Rev Date
G4932-RPT-01 0 08 Jan 2021 154
Talon Metals Corp. – Preliminary Economic Assessment #3 on the Tamarack North Project
Figure 13-10: Closed Circuit Cu Stage-Recovery as a Function of Cu Head Grade
While several cleaner flotation tests employed Cu/Ni separation stages, they were also
operated in open circuit. The only closed-circuit tests were the LCTs performed in 2016/2017
and the LCT on the LOM with 138 Zone composite in 2020. Hence, these results were
chosen to project the deportment of Ni and Cu into the two concentrates. The Ni and Cu
concentrate grades as a function of their respective head grades are depicted in Figure
13-11 and Figure 13-12, respectively.
y = 2.5081ln(x) + 95.734R² = 0.1841
84.0
86.0
88.0
90.0
92.0
94.0
96.0
98.0
100.0
0.00 0.50 1.00 1.50 2.00 2.50 3.00
% C
u S
tage-R
ecovery
% Cu Head Grade
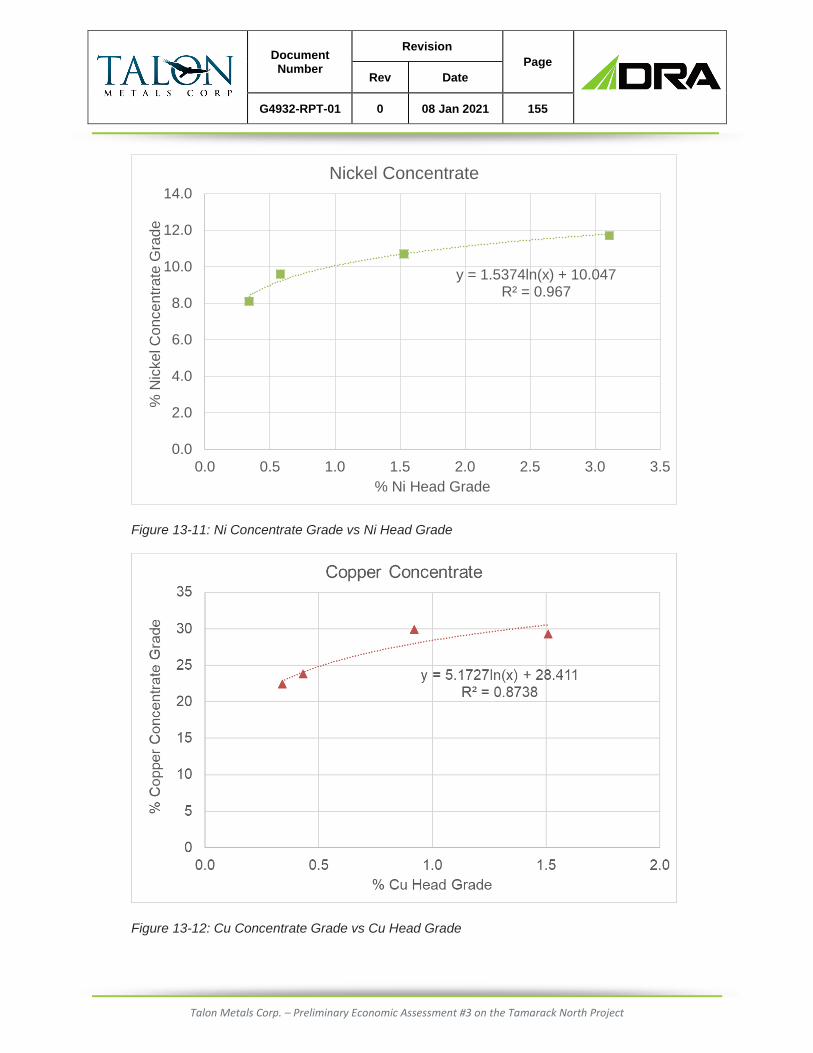
Document Number
Revision
Page
Rev Date
G4932-RPT-01 0 08 Jan 2021 155
Talon Metals Corp. – Preliminary Economic Assessment #3 on the Tamarack North Project
Figure 13-11: Ni Concentrate Grade vs Ni Head Grade
Figure 13-12: Cu Concentrate Grade vs Cu Head Grade
y = 1.5374ln(x) + 10.047R² = 0.967
0.0
2.0
4.0
6.0
8.0
10.0
12.0
14.0
0.0 0.5 1.0 1.5 2.0 2.5 3.0 3.5
% N
icke
l C
on
ce
ntr
ate
Gra
de
% Ni Head Grade
Nickel Concentrate

Document Number
Revision
Page
Rev Date
G4932-RPT-01 0 08 Jan 2021 156
Talon Metals Corp. – Preliminary Economic Assessment #3 on the Tamarack North Project
Concentrate Characterization
The final Cu and Ni concentrates of the LOM with 138 Zone composite LCT were submitted
for chemical analysis to identify potential credit and penalty elements.
Credit elements in the two concentrates are presented in Table 13-4. The Cu concentrate
contained 5.88 g/t Au, which will be payable above a deduction of typically 1 g/t. The
platinum grade of 2.42 g/t in the Ni concentrate is likely another payable element.
Table 13-4: Ni Concentrate – Credit Elements
The analysis of the individual products of the LCT produced an average MgO content in the
Cu and Ni concentrate of 0.80% MgO and 4.66% MgO, respectively. The complete results
of the detailed concentrate analysis are presented in Table 13-5. Both concentrates reveal
low levels of deleterious elements for Cu and Ni smelters and no penalty payments are
expected.
Table 13-5: Detailed Concentrate Analysis
13.3 Life-of-Mine Mass Balance
The findings of the metallurgical analysis were used to develop of the LOM mass balance
for the head grade of the February 2021 PEA.
The results of the LCT on the LOM with 138 Zone composites and the regression curves
were employed to develop a high-level mass balance. This manual mass balance was used
Co Pt Pd Au
Ni Concentrate 11.9 0.240 2.42 1.26 0.28 64.1 82.5 69.3 18.7
Cu Concentrate 2.2 0.020 1.31 1.14 5.88 1.0 8.3 11.6 72.6
Feed 100 0.045 0.349 0.216 0.178 100 100 100 100
Sample ID Co %Mass Pt (g/t) Pd (g/t) Au (g/t)% Distribution
Au Pt Pd F Cl Hg Ag Al As Ba Be Bi Ca Cd Cr Fe K
Ni Concentrate 0.28 2.42 1.26 9 170 < 0.3 13 3,410 14 37.4 0.06 5.1 4,270 < 2 325 405,000 474
Cu Concentrate 5.88 1.31 1.14 5 41 < 0.3 35 439 < 10 4.5 < 0.03 5.7 1,020 12 18 320,000 < 70
Sample ID Li Mn Mo Na P Pb Sb Se Si Sn Sr Ti Tl U V Y Zn
Ni Concentrate < 8 258 12.4 932 < 200 55.7 2.1 93 32,200 < 2 9.45 399 < 0.4 < 0.4 20 < 1 192
Cu Concentrate < 8 57.1 2.5 194 < 200 185 1.3 97 4,100 12 1.5 36.8 < 0.4 < 0.4 4 < 1 555
Assays (g/t)Sample ID

Document Number
Revision
Page
Rev Date
G4932-RPT-01 0 08 Jan 2021 157
Talon Metals Corp. – Preliminary Economic Assessment #3 on the Tamarack North Project
as a starting point to generate a full circuit mass balance using the Outotec HSC modelling
software. The HSC mass balance is presented in Table 13-6.
The anticipated Ni concentrate grade is 10.2% Ni at 81.5% Ni recovery. A total of 15.4% of
the Cu units in the mill feed is also expected to report to the Ni concentrate. The Cu
concentrate is projected to contain 69.3% of the total Cu units at a grade of 28.5% Cu and
1.10% Ni.
Table 13-6: Process Mass Balance Ni Sulphate Scenario
Cu Ni S Cu Ni S
Bulk Rougher Feed 100.0 0.74 1.34 5.10 100.0 100.0 100.0
Bulk Rougher Conc 21.8 2.98 5.32 19.7 87.6 86.6 84.0
Bulk Rougher Tails 78.2 0.12 0.23 1.04 12.7 13.4 16.0
Mags 7.1 0.17 0.48 3.86 1.6 2.5 5.3
High Sulphur Thickener UF 16.3 0.30 0.51 5.09 6.6 6.2 16.3
Non-Mags 71.1 0.12 0.20 0.76 11.0 10.9 10.7
Low S Thickener Underflow 71.1 0.12 0.20 0.76 11.0 10.9 10.7
Low-Sulphur Tailings Filter Cake 71.1 0.12 0.20 0.76 11.0 10.9 10.7
Regrind Ball Mill Discharge 19.0 0.81 2.20 19.3 20.6 31.2 71.9
Bulk Cleaner 1 Conc 17.9 3.81 7.17 27.5 91.9 95.6 96.3
Bulk Cleaner 1 Tails 22.9 0.54 1.30 13.3 16.6 22.2 59.6
Bulk Cleaner Scav Conc 13.7 0.64 1.81 18.1 11.8 18.5 48.7
Bulk Cleaner Scav Tails 9.2 0.40 0.53 6.0 5.0 3.7 10.9
Bulk Cleaner 2 Conc 12.6 4.93 8.85 29.7 83.5 82.9 73.1
Bulk Cleaner 2 Tails 5.3 1.20 3.20 22.3 8.6 12.7 23.2
Cu-Ni Sep Regrind Mill Discharge 12.6 4.94 8.85 29.7 83.7 83.0 73.1
Cu Rougher Conc 2.8 20.9 3.59 31.3 78.4 7.4 17.1
Ni Concentrate 10.8 1.04 10.2 29.3 15.2 81.5 61.6
Cu Cleaner Conc 2.4 25.1 1.94 31.6 81.8 3.5 15.0
Cu Cleaner Tails 1.0 7.29 8.23 29.4 9.6 6.0 5.6
Cu Reclnr Conc (Cu Conc) 1.8 28.5 1.10 32.4 69.3 1.5 11.4
Cu Reclnr Tails 0.6 15.5 4.45 29.4 12.7 2.0 3.5
Cu Conc Thickener UF 1.8 28.5 1.10 32.4 69.3 1.5 11.4
Cu Conc Filter Cake 1.8 28.5 1.10 32.4 69.3 1.5 11.4
Ni Conc Thickener UF 10.8 1.06 10.2 29.3 15.4 81.5 61.6
Ni Conc Filter Cake 10.8 1.06 10.2 29.3 15.4 81.5 61.6
Stream Mass Rec %
Assay (%) Recovery (%)

Document Number
Revision
Page
Rev Date
G4932-RPT-01 0 08 Jan 2021 158
Talon Metals Corp. – Preliminary Economic Assessment #3 on the Tamarack North Project
13.4 Analysis and Recommendations
A comprehensive review of the current and historical test results formed the basis for
updated overall Ni and Cu recovery projections. The equations to determine the Ni and Cu
recovery into the two concentrates as a function of the head grade are presented below:
Ni in Ni Concentrate
>1.0% Ni % Ni Recovery = (1.3936x+86.88)*(1.541ln(x) +94.034)/100*0.98
0.40 – 1.0% Ni % Ni Recovery = (21.757ln(x)+88.027)*(1.541ln(x) +94.034)/100*0.98
Ni in Cu Concentrate
>1.0% Ni % Ni Recovery = (1.3936x+86.88)*(1.541ln(x) +94.034)/100*0.02
0.40 – 1.0% Ni % Ni Recovery = (21.757ln(x)+88.027)*(1.541ln(x) +94.034)/100*0.02
Cu in Cu Concentrate
>0.30% Cu % Cu Recovery = (0.8661y+90.75)*(2.5081ln(x)+95.734)/100*0.85
<0.30% Cu % Cu Recovery = ((7.979ln(x)+100.67) *(2.5081ln(x)+95.734)/100*0.85
Cu in Ni Concentrate
>0.30% Cu % Cu Recovery = (0.8661y+90.75)*(2.5081ln(x)+95.734)/100*0.15
<0.30% Cu % Cu Recovery = ((7.979ln(x)+100.67) *(2.5081ln(x)+95.734)/100*0.15
During the next phase of testing, it will be paramount to further refine the regression curves
with additional LCTs using domain samples and composites that reflect the actual mill feed
grades and domain blends over the projected mine life. The production of a geo-metallurgical
model to assess the suitability of the samples tested and a full variability test program
throughout the deposit will have to be conducted during the PFS phase.
Ni smelters generally prefer a Ni concentrate with a minimum Fe:MgO ratio of 5:1. The Ni
concentrate generated from the Tamarack LOM composite produced a good Fe:MgO ratio
of 8.7:1, which is 75% higher than the desired minimum Fe:MgO ratio.
The reagent regime developed for the Tamarack mineralization is presented in Table 13-7.
Given the significant cost of the proposed reagent regime, a dosage optimization will be
carried out during the next phase of optimization testing.

Document Number
Revision
Page
Rev Date
G4932-RPT-01 0 08 Jan 2021 159
Talon Metals Corp. – Preliminary Economic Assessment #3 on the Tamarack North Project
Also, collector dosages will have to be optimized separately for each mineral domain as a
function of head grades and the composition of non-sulphide gangue minerals because
some minerals act as reagent robbers.
Table 13-7: Reagent Dosages
Reagent Consumption of Mill Feed (g/t)
SIPX 215
PAX 230
MIBC 150
Depramin C 30
Lime 2,150
Flocculant 30
13.5 Hydrometallurgical Testing
The Ni concentrate that was generated in the LCT using the LOM with 138 Zone composite
was utilized for a scoping level hydrometallurgical testing. The test program included
leaching and impurity removal tests to establish metal extraction rates during leaching and
metal losses in the impurity removal stages.
Two leach technologies were investigated, namely POX and the Albion process. The main
differences between the two technologies are that the POX process employs a pressurized
vessel (an autoclave) with a relatively short retention time, whereas the Albion process
operates at atmospheric pressure with longer retention times and a fine regrind of the Ni
concentrate prior to leaching.
Five POX tests were completed to evaluate the impact of temperature, regrind size and the
addition of chlorides on metal extraction rates. Further, one Albion test was carried out
employing conditions recommended by the Glencore technical team.
The results are presented in Table 13-8. Tests POX2, POX3, and POX4 produced the best
overall results of the five POX tests. Test POX4 included a fine regrind of the Ni concentrate
to P80 ~ 8 μm, and the results matched those of test POX2 for Ni and Co but yielded a 7%
lower Cu extraction. Further, the precipitate of this test displayed very poor filtration
properties, which suggests that solid-liquid separation would be challenging in a commercial
operation. Test POX3 eliminated chlorides but was operated at a higher temperature of

Document Number
Revision
Page
Rev Date
G4932-RPT-01 0 08 Jan 2021 160
Talon Metals Corp. – Preliminary Economic Assessment #3 on the Tamarack North Project
225°C. Cu and Co recoveries matched or exceeded the results of test POX2, but Ni
recoveries were 3% lower. Since test POX2 produced amongst the best overall extraction
rates, required a lower temperature, and has the lowest sulphide oxidation rate (translating
into oxygen savings), a decision was made to proceed with the conditions of test POX2 for
the POX approach.
The test using the Albion process yielded good extraction rates of 97 to 99% for Ni, Co, and
Cu. The leach liquor contained one of the highest Fe concentrations of all leach tests at
28,100 mg/L. A high Fe content in the leach liquor can lead to elevated metal losses during
the impurity removal stage.

Document Number
Revision
Page
Rev Date
G4932-RPT-01 0 08 Jan 2021 161
Talon Metals Corp. – Preliminary Economic Assessment #3 on the Tamarack North Project
Table 13-8: POX and Albion Leach Conditions and Results
The autoclave discharge was subjected to a neutralization stage to remove most of the
impurities such as Fe, Cr, and Al from the leach solution. The test revealed that a pH of 4.75
is required to precipitate the beforementioned elements to below detection limits. While Ni
and Co precipitation were minimal at this pH, over 97% of the Cu co-precipitated into the
residue. It was postulated that the high Fe concentration in the leach liquor resulted in the
high Cu losses and, therefore, a two-stage neutralization approach was evaluated.
Test ID POX1 POX2 POX3 POX4 POX5 Albion
Feed
As-Received
Concentrate
Sample
As-Received
Concentrate
Sample
As-Received
Concentrate
Sample
Fine Grind
Feed
Concentrate
Sample
As-Received
Concentrate
Sample
Fine Grind
Feed
Concentrate
Sample
Temperature (°C) 150 150 225 150 180 95
Oxygen Overpressure (kPa) 689 689 689 689 689 N/A
Initial Pulp Density (%) 10 10 10 10 10 25
Chloride Target (g/L) 0 2 0 0 0 0
Final PLS Acidity (g/L) 29 29 67 35 58 20
Sulphide Oxidation (%)* 70 69 99 99 98 65
* based on sulphide accountability
Extraction (%) POX1 POX2 POX3 POX4 POX5 Albion
Ni 88 99 96 100 97 98
Co 89 99 99 99 96 97
Cu 53 88 100 81 97 99
Zn 93 91 91 90 90 96
Fe 40 12 7 45 44 89
Mg 81 79 86 82 84 86
Al 72 64 61 66 80 85
Cr 22 19 41 61 43 58
Mn 93 89 92 91 92 96
Ca 87 84 94 85 91 93
Na 24 32 60 42 50 26
Final PLS (mg/L) POX1 POX2 POX3 POX4 POX5 Albion
Ni 10,000 11,800 12,500 11,100 12,000 5,410
Co 232 261 275 249 246 116
Cu 622 1,070 1,390 966 1,280 1,600
Zn 30 30 34 20 20 23
Fe 17,000 5,020 3,500 20,200 20,300 28,100
Mg 2,500 2,490 3,120 2,440 2,800 1,380
Al 251 235 240 237 284 144
Cr 10 7 20 73 17 34
Mn 54 36 39 36 36 63
Ca 411 430 537 227 473 202
Na 13 18 36 23 30 5
Final Residue (g/t) POX1 POX2 POX3 POX4 POX5 Albion
Ni 15,500 641 4,550 627 6,080 5,610
Co 391 15 21 22 158 169
Cu 7,480 1,440 69 3,910 729 778
Zn 40 40 40 40 40 40
Fe 345,000 397,000 573,000 434,000 474,000 145,000
Mg 7,850 6,440 6,180 9,270 9,600 9,580
Al 1,270 1,300 1,870 2,030 1,280 1,060
Cr 450 298 355 815 419 1,030
Mn 48 46 45 64 59 99
Ca 831 816 462 702 807 635
Na 560 389 324 701 516 796

Document Number
Revision
Page
Rev Date
G4932-RPT-01 0 08 Jan 2021 162
Talon Metals Corp. – Preliminary Economic Assessment #3 on the Tamarack North Project
A target pH of 3.25 was established for the primary neutralization to maximize precipitation
of Fe, Al, and Cr while minimizing co-precipitation of Cu. The results of the primary
neutralization test are presented in Table 13-9. Only 3.7% of the Cu units reported to the
precipitate together with 99.8% of Fe, 97.7% of Cr, and 72.7% of Al. This residue represents
a final tailings stream.
Table 13-9: Results of Primary Neutralization
The leach liquor of the primary neutralization stage was then contacted with limestone to
increase the pH to 5.0. The results of the secondary neutralization are presented in Table
13-10. The secondary neutralization stage reduced the Fe, Al, and Cr content to below
detection limit. Almost 85% of the Cu co-precipitated at a grade of 18.2% Cu. This product
would be combined with the Cu concentrate prior to transport to a Cu smelter.
Sample &
Quant.
Feed
Solution
Final
FiltrateResidue
Precip.
%
Account
. Out/in
Ni mg/L, g/t 10,900 9,360 51 0.0 102
Co mg/L, g/t 235 201 <4 0.2 101
Cu mg/L, g/t 951 723 370 3.7 97
Zn mg/L, g/t 20 18 <20 7.9 116
Fe mg/L, g/t 9,000 23.7 146,000 99.8 150
Mg mg/L, g/t 2,650 2,700 915 2.6 123
Al mg/L, g/t 231 24.6 930 72.7 51
Cr mg/L, g/t 4.9 <0.2 135 97.7 260
Mn mg/L, g/t 33.1 31.6 2.2 0.5 113
Ca mg/L, g/t 423.0 573 167,000 94.8 83
Na mg/L, g/t 21 17 62 22.3 122
Assay
Units

Document Number
Revision
Page
Rev Date
G4932-RPT-01 0 08 Jan 2021 163
Talon Metals Corp. – Preliminary Economic Assessment #3 on the Tamarack North Project
Table 13-10: Results of Secondary Neutralization
Cu precipitation, shake-out-tests, and mixed hydroxide precipitation (MHP) tests were
ongoing at the time the design basis was frozen for the PEA. The hydrometallurgical test
program completed to date provided a proof of concept for the leaching and neutralization
stages and produced low overall metal losses to the leach residue and neutralization tailings.
Also, the leach liquor after the secondary neutralization stage contained low concentrations
of deleterious elements. While remaining impurities such as manganese (Mn), Zn, and
calcium (Ca) may be co-loaded with Ni and Co, subsequent impurity removal stages should
work well given the much lower concentrations compared to leach liquors from other mineral
sources such as laterites.
Sample &
Quant.
Feed
Solution
Final
FiltrateResidue
Precip.
%
Ni mg/L, g/t 9,360 9,870 30,100 1.1
Co mg/L, g/t 201 215 434 0.7
Cu mg/L, g/t 723 17.2 182,000 84.5
Zn mg/L, g/t 18 17 684 12.2
Fe mg/L, g/t 23.7 <0.2 7,080 99.0
Mg mg/L, g/t 2,700 2,960 3,790 0.5
Al mg/L, g/t 24.6 <0.2 7,120 95.2
Cr mg/L, g/t <0.2 <0.2 <20 22.5
Mn mg/L, g/t 31.6 33.1 19.8 0.2
Ca mg/L, g/t 573 715 114,000 34.2
Na mg/L, g/t 17 21 32 0.5
Assay
Units

Document Number
Revision
Page
Rev Date
G4932-RPT-01 0 08 Jan 2021 164
Talon Metals Corp. – Preliminary Economic Assessment #3 on the Tamarack North Project
MINERAL RESOURCE ESTIMATE
14.1 Introduction
Caution to readers: In this Item, all estimates and descriptions related to mineral resource
estimates are forward-looking information. There are many material factors that could cause
actual results to differ materially from the conclusions, forecasts or projections set out in this
item. Some of the material factors include differences from the assumptions regarding the
following: estimates of COG and geological continuity at the selected cut-off, metallurgical
recovery, commodity prices or product value, mining and processing methods, and G&A
costs. The material factors or assumptions that were applied in drawing the conclusions,
forecasts and projections set forth in this Item are summarized in other Items of this report.
The updated mineral resource estimate for the Tamarack North Project was completed by
Mr. Brian Thomas, P.Geo., Senior Resource Geologist with Golder Associates Limited. The
estimate is based on assay data from drill programs completed by Kennecott and Talon
between 2008 and 2020. The Tamarack North Project mineralization consists of three
distinct geological domains as previously discussed in Section 7.2.5 of this report, including
the SMSU hosted in CGO, the MSU hosted in meta-sediments, and the 138 Zone hosted in
mixed FGO and CGO peridotites. Grade variables evaluated in this PEA include Ni, Cu, Co,
Pt, Pd and Au as well as SG.
The software used for the updated mineral resource estimate in this PEA was Datamine
Studio RM, release 1.6.87.0 (Datamine).
14.2 Drill Hole Data
A total of 297 diamond drill holes were provided by Talon containing 41,689 assay intervals
having a total core length of 129,147 m. All drill hole data was provided as of June 1, 2020.
The drill hole data was imported into Datamine from electronic .csv files and no interval
errors were encountered during the process.
The drill hole file was reviewed in plan and section to validate the accuracy of the collar
locations, hole orientations and down hole trace, and the assay data was analyzed for out-
of-range values.

Document Number
Revision
Page
Rev Date
G4932-RPT-01 0 08 Jan 2021 165
Talon Metals Corp. – Preliminary Economic Assessment #3 on the Tamarack North Project
Un-assayed intervals were assumed to be waste and assigned a metal value of one-half the
detection limit for each metal as listed in Table 14-1.
Table 14-1: Default Grades for Absent Data
Metal Default Value # Records Set to Default
Ni 0.001% 152
Cu 0.001% 331
Co 0.001% 130
Pt 0.001 ppm 5,308
Pd 0.001 ppm 1,024
Au 0.001 ppm 1,278
S 0.005% 200
It is the QP’s opinion that the drill hole database is of suitable quality to support the Mineral
Resource estimate in this Technical Report.
14.3 Geological Interpretation
Mineralization
Mineral domain models were interpreted from drill hole grade and lithology data for the
SMSU, MSU, and 138 zones using a 0.4% Ni cut-off. New drilling was available in the MSU
and 138 domains. No new holes were drilled in the SMSU, but model limits were increased
to 5169600N, and the domain modeling COG was changed from 0.83% NiEq to 0.4% Ni,
resulting in the Upper SMSU being significantly extended up to the top of bedrock surface.
No changes to the lower portion of the SMSU were required, as there were only minor
discontinuous samples above the modeling cut-off that were outside of the previous 2018
model. The MSU and 138 domains were updated to account for the new infill drilling and the
138 was also adjusted for the 0.4% Ni modeling cut-off. Figure 14-1 and Figure 14-2 provide
an overview of the updated 2020 mineral domain models and extended model limits.

Document Number
Revision
Page
Rev Date
G4932-RPT-01 0 08 Jan 2021 166
Talon Metals Corp. – Preliminary Economic Assessment #3 on the Tamarack North Project
Figure 14-1: Plan View of Mineral Domains Tamarack North Project (red outline indicates model
boundary limits)
Figure 14-2: Oblique View of Mineral Domains Tamarack North Project (Facing N-W)
All mineral domain wireframe volumes were constructed by snapping points to the drill holes
on the hanging wall (HW) and FW contacts, above the %Ni modeling COG. These points,
along with boundary strings, were used to construct HW and FW surfaces, which were then
linked to create 3D solid volumes.

Document Number
Revision
Page
Rev Date
G4932-RPT-01 0 08 Jan 2021 167
Talon Metals Corp. – Preliminary Economic Assessment #3 on the Tamarack North Project
A low-grade mineral envelope was interpreted to account for minor discontinuous
mineralization outside of the main mineral domains, as shown in green in Figure 14-3.
Figure 14-3: Plan View of low-grade Halo (shown in green)
Raw sample intervals were captured inside each mineral domain wireframe and verified
visually to confirm the accuracy of the domain assignment process. Table 14-2 provides the
sample break down by domain. It is noted that some holes intersect multiple domains.
Table 14-2: Summary of Captured Samples Tamarack North Project
Domain Number of Samples
Upper SMSU 1,686
Lower SMSU 828
Total SMSU 2,514
MSU 227
138 Zone 1,412
Total 4,153
14.4 Exploratory Data Analysis (EDA)
Descriptive statistics combined with a series of histograms and X-Y scatter plots were used
to analyze the grade distribution of each sample population and to determine the presence
of outliers and correlations between metals for each mineral domain.

Document Number
Revision
Page
Rev Date
G4932-RPT-01 0 08 Jan 2021 168
Talon Metals Corp. – Preliminary Economic Assessment #3 on the Tamarack North Project
Descriptive Statistics
Table 14-3 provides a summary of the descriptive statistics for the raw sample populations
captured from within each mineral domain.
Table 14-3: Descriptive Statistics of the Tamarack North Project Sample Population
Domain Field Samples Minimum Maximum Mean Standard Deviation
Skewness Coefficient of
Variation
Upper SMSU Ni (%) 1,686 0.06 7.00 0.59 0.69 3.24 1.15
Upper SMSU Cu (%) 1,686 0.00 2.40 0.34 0.39 2.06 1.15
Upper SMSU Co (%) 1,686 0.00 0.17 0.02 0.02 3.23 0.81
Upper SMSU Pt (ppm) 1,686 0.00 1.35 0.14 0.18 2.66 1.31
Upper SMSU Pd (ppm) 1,686 0.00 0.72 0.08 0.10 2.49 1.26
Upper SMSU Au (ppm) 1,685 0.00 0.57 0.07 0.08 1.78 1.09
Lower SMSU Ni (%) 828 0.12 5.06 1.68 1.28 0.68 0.76
Lower SMSU Cu (%) 828 0.01 2.98 0.94 0.59 0.7 0.63
Lower SMSU Co (ppm) 828 0.01 0.13 0.04 0.03 0.72 0.71
Lower SMSU Pt (ppm) 828 0.01 5.41 0.58 0.41 2.95 0.72
Lower SMSU Pd (ppm) 828 0.00 1.51 0.35 0.19 1.24 0.54
Lower SMSU Au (ppm) 828 0.00 1.27 0.25 0.17 1.18 0.66
MSU Ni (%) 227 0.02 10.15 5.33 2.54 -0.63 0.48
MSU Cu (%) 227 0.01 5.75 2.30 1.09 -0.47 0.47
MSU Co (ppm) 227 0.00 0.22 0.11 0.05 -0.47 0.49
MSU Pt (ppm) 227 0.00 4.65 0.64 0.55 2.72 0.86
MSU Pd (ppm) 227 0.00 1.18 0.47 0.24 -0.04 0.52
MSU Au (ppm) 227 0.00 5.03 0.27 0.41 8.16 1.53
138 Ni (%) 1,412 0.12 10.05 0.57 0.62 7.57 1.08
138 Cu (%) 1,412 0.00 7.56 0.39 0.48 5.42 1.22
138 Co (ppm) 1,412 0.01 0.20 0.02 0.01 7.26 0.57
138 Pt (ppm) 1,412 0.00 112.00 0.18 1.66 66.78 9.14
138 Pd (ppm) 1,412 0.00 4.88 0.09 0.12 19.01 1.3
138 Au (ppm) 1,412 0.00 23.00 0.11 0.58 38.68 5.39
Figure 14-4 to Figure 14-7 provide examples of the frequency distribution of the Ni sample
populations of each domain. The Ni population was found to be weakly bi-modal in the
SMSU domains, normal in the MSU and positively skewed in the 138 Zone.

Document Number
Revision
Page
Rev Date
G4932-RPT-01 0 08 Jan 2021 169
Talon Metals Corp. – Preliminary Economic Assessment #3 on the Tamarack North Project
Figure 14-4: Histogram of %Ni for the Upper SMSU
Figure 14-5: Histogram of %Ni for the Lower SMSU

Document Number
Revision
Page
Rev Date
G4932-RPT-01 0 08 Jan 2021 170
Talon Metals Corp. – Preliminary Economic Assessment #3 on the Tamarack North Project
Figure 14-6: Histogram of %Ni for MSU
Figure 14-7: Histogram of %Ni for 138 Zone

Document Number
Revision
Page
Rev Date
G4932-RPT-01 0 08 Jan 2021 171
Talon Metals Corp. – Preliminary Economic Assessment #3 on the Tamarack North Project
Correlations
A correlation matrix was generated for each domain to determine the relationship between
all metals and density values, as presented for the Lower SMSU domain in Table 14-4.
Table 14-4: Correlation Matrix of the Lower SMSU Domain
Ni (%) Cu (%) Co (%) Pt (ppm) Pd (ppm) Au (ppm) S (%) SG
Ni (%) 1
Cu (%) 0.88 1
Co (%) 0.99 0.83 1
Pt (ppm) -0.12 0.08 -0.17 1
Pd (ppm) 0.03 0.2 -0.04 0.77 1
Au (ppm) -0.09 0.17 -0.17 0.71 0.7 1
S (%) 0.99 0.84 1 -0.16 -0.03 -0.16 1
SG 0.83 0.68 0.86 -0.21 -0.1 -0.29 0.86 1
Ni demonstrated a strong correlation with Cu, Co, and sulphur and a good correlation with
measured density values. Ni did not demonstrate a correlation with PGM. A strong
correlation between Ni, Cu, Co, and sulphur was shown across all five mineral domains. The
correlation between sulphur and SG was used as the basis to calculate SG for absent
intervals in the Lower SMSU domain, as described in Section 14.4.3. These correlations
were also used to make assumptions that Co and SG have similar spatial continuity to Ni,
as described in Section 14.6.2.
In the Upper SMSU, Ni was found to have the similar correlations with Cu, Co, sulphur but
did not correlate well with SG; therefore, SG values were not calculated.
Specific Gravity (SG)
SG data from lab measurements (ALS Minerals) obtained from cut core was the main source
of the data values in the supplied database. Field measurements were also taken on site
from 10 cm core samples, taken approximately every 20 m using the weight in air vs the
weight in water method based on the following formula:
• SG = weight in air / (weight in air – weight in water)
The QP elected to only use the SG measurements obtained from lab measurements and did
not use the field measurements. Calculated SG values were substituted, where no lab

Document Number
Revision
Page
Rev Date
G4932-RPT-01 0 08 Jan 2021 172
Talon Metals Corp. – Preliminary Economic Assessment #3 on the Tamarack North Project
measured data was available, based on polynomial regression formulas defined for each
mineral domain. An SG was assigned to absent drill hole intervals by polynomial regression
for the MSU and Lower SMSU domains based on moderate to good correlations with Ni and
sulphur.
There was a poor correlation between SG, Ni, and %S in the Upper SMSU, so no regression
was used, and density was estimated using OK with the available lab measured data. No
lab measured SG data were available for the 138. An SG was calculated for the 138 based
on a regression formula derived from the Lower SMSU domain, limited to the same Ni and
Cu grade range, as observed in the 138 and then estimated using OK. The SG data from
field measurements was later used to validate the model. The regression formulas used for
each domain are listed below:
• SG (Lower SMSU) = 2.75988 + Sulphur (%) x 0.03808
• SG (MSU) = 2.77825 + Ni x 0.16578
• SG (138 Zone) = 2.76785 + Ni x 0.09198
Based on reasonably good correlations with the SG data, base metal grades (Ni, Cu and
Co) were weighted by SG for estimation purposes for the Lower SMSU and MSU domains.
New grade fields QNi, QCu, and QCo were calculated by multiplying the metal grade by
measured SG, where available, and calculated SG in the absence of measured data. Grades
in the Upper SMSU and 138 Zones were not weighted by SG.
X-Ok the Lower SMSU domain, and Ni and SG for the MSU domain, as shown in Figure 14-8
to Figure 14-9.

Document Number
Revision
Page
Rev Date
G4932-RPT-01 0 08 Jan 2021 173
Talon Metals Corp. – Preliminary Economic Assessment #3 on the Tamarack North Project
Figure 14-8: Scatter Plot of %S vs SG in the Lower SMSU
Figure 14-9: Scatter Plot of %Ni vs SG in MSU
Outliers
High-grade outlier data has the potential to bias block model grades if they are not handled
by top cutting or, otherwise, restricting their influence through other estimation criteria. X-Y
scatter plots were generated to assess the sample population for outlier values. A minor
number of high-grade outliers were identified in the Pt, Pd, and Au populations of each
domain and top-cut, as summarized in Table 14-5. Minor top cuts were also performed on
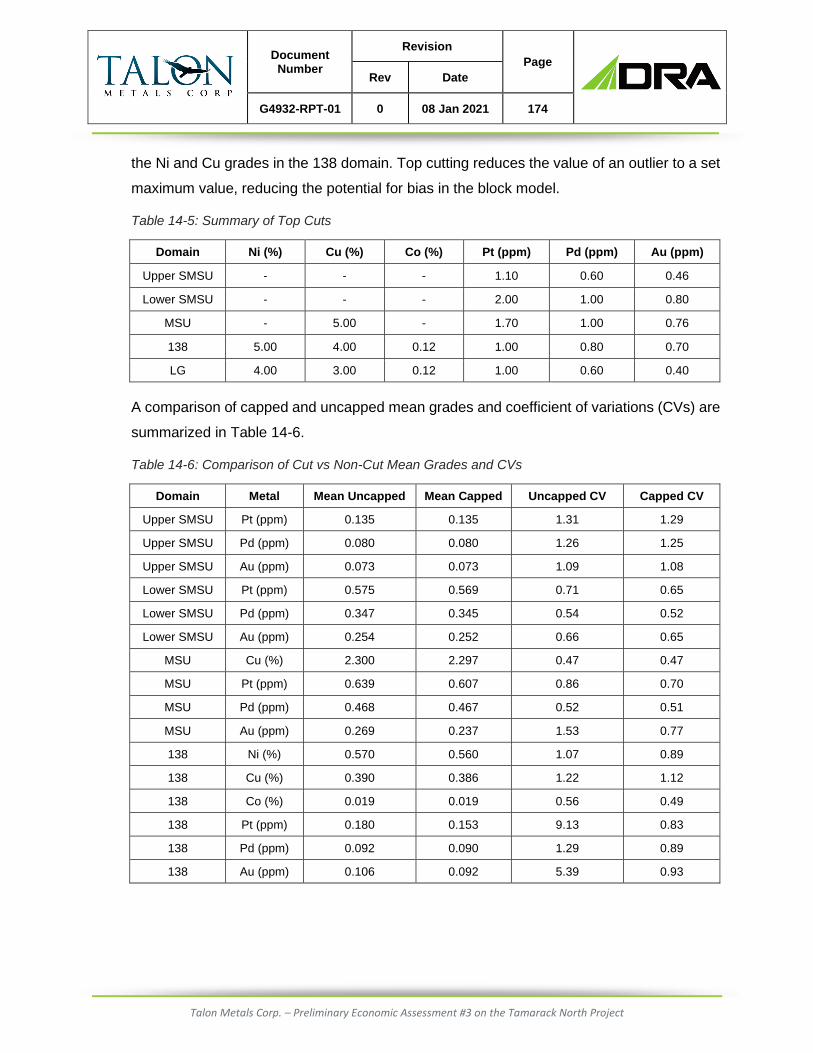
Document Number
Revision
Page
Rev Date
G4932-RPT-01 0 08 Jan 2021 174
Talon Metals Corp. – Preliminary Economic Assessment #3 on the Tamarack North Project
the Ni and Cu grades in the 138 domain. Top cutting reduces the value of an outlier to a set
maximum value, reducing the potential for bias in the block model.
Table 14-5: Summary of Top Cuts
Domain Ni (%) Cu (%) Co (%) Pt (ppm) Pd (ppm) Au (ppm)
Upper SMSU - - - 1.10 0.60 0.46
Lower SMSU - - - 2.00 1.00 0.80
MSU - 5.00 - 1.70 1.00 0.76
138 5.00 4.00 0.12 1.00 0.80 0.70
LG 4.00 3.00 0.12 1.00 0.60 0.40
A comparison of capped and uncapped mean grades and coefficient of variations (CVs) are
summarized in Table 14-6.
Table 14-6: Comparison of Cut vs Non-Cut Mean Grades and CVs
Domain Metal Mean Uncapped Mean Capped Uncapped CV Capped CV
Upper SMSU Pt (ppm) 0.135 0.135 1.31 1.29
Upper SMSU Pd (ppm) 0.080 0.080 1.26 1.25
Upper SMSU Au (ppm) 0.073 0.073 1.09 1.08
Lower SMSU Pt (ppm) 0.575 0.569 0.71 0.65
Lower SMSU Pd (ppm) 0.347 0.345 0.54 0.52
Lower SMSU Au (ppm) 0.254 0.252 0.66 0.65
MSU Cu (%) 2.300 2.297 0.47 0.47
MSU Pt (ppm) 0.639 0.607 0.86 0.70
MSU Pd (ppm) 0.468 0.467 0.52 0.51
MSU Au (ppm) 0.269 0.237 1.53 0.77
138 Ni (%) 0.570 0.560 1.07 0.89
138 Cu (%) 0.390 0.386 1.22 1.12
138 Co (%) 0.019 0.019 0.56 0.49
138 Pt (ppm) 0.180 0.153 9.13 0.83
138 Pd (ppm) 0.092 0.090 1.29 0.89
138 Au (ppm) 0.106 0.092 5.39 0.93

Document Number
Revision
Page
Rev Date
G4932-RPT-01 0 08 Jan 2021 175
Talon Metals Corp. – Preliminary Economic Assessment #3 on the Tamarack North Project
14.5 Compositing
Compositing samples is a technique used to give each sample a relatively equal length
weighting to reduce the potential for bias, due to uneven sample lengths. Histograms of raw
sample length were generated for each domain to determine the most common (modal)
sample length used at the Tamarack North Project which was the basis used to determine
the composite length.
Samples captured within the Upper SMSU and Lower SMSU and 138 Zone domains were
composited to an average length of 1.5 m and the samples in the MSU domain were
composited to an average length of 1 m. An option to use a variable composite length was
chosen for all domains to prevent the loss of sample information and the creation of short
composites that are generally formed along the contacts when using a fixed length.
Composite samples were validated visually in plan and section and a histogram of composite
length was generated to confirm compositing was completed as expected. The histograms
displayed a normal distribution around the chosen composite lengths and the total length of
the sample data remained unchanged. The mean composite grades were found to be
unchanged from the cut composite grades and there was no loss of sample length during
the process, as summarized in Table 14-7.
Table 14-7: Comparison of Composite vs Raw Sample Lengths
Domain Raw Sample Length Composite Sample Length
Upper SMSU 2,653.83 2,653.83
Lower SMSU 1,245.98 1,245.98
MSU 264.35 264.35
138 2,334.11 2,334.11
LG 29,405.32 29,405.32

Document Number
Revision
Page
Rev Date
G4932-RPT-01 0 08 Jan 2021 176
Talon Metals Corp. – Preliminary Economic Assessment #3 on the Tamarack North Project
14.6 Resource Estimation
Unfolding
All mineral domains, with the exception of the LG domain, were unfolded for the purpose of
grade estimation. The “Unfold” process within Datamine RM™ was used to transform the
composite sample data from Cartesian coordinates into an unfolded coordinate system
(UCS), as defined by the geometry of the FW and HW contacts of each mineral domain
model. This transformation essentially removes bends, pinches, and swells, allowing for
more robust variogram calculations and grade estimation. This was considered an
appropriate process to employ, given the variable orientations of each mineral wireframe.
Strings representing the FW (white) and HW (red) contacts of each mineral domain were
constructed and tagged in cross-section view, as shown in the Upper SMSU example in
Figure 14-10. These strings were then used to transform the composite samples into the
UCS. The same unfold strings are used in the grade estimation process to unfold the blocks
into the transformed system as the composite samples. The process unfolds discretization
points from the prototype model and estimates the grades for each in the UCS. The process
then assigns the estimated grades back to the corresponding cell in the Cartesian model. In
the UCS, the X-axis is assigned to UCSA, which represents the across strike thickness of
the zone, the Y-axis is assigned to UCSB representing the down-DDR of the zone and the
Z-axis is assigned to UCSC representing the along strike direction of the zone.
Figure 14-10: Example of Unfold Strings for the Upper SMSU Domain (facing N-E)

Document Number
Revision
Page
Rev Date
G4932-RPT-01 0 08 Jan 2021 177
Talon Metals Corp. – Preliminary Economic Assessment #3 on the Tamarack North Project
The unfolded samples were validated visually in unfold space for each zone. Quadrilateral
strings created during the process were inspected to confirm that unfolding had performed
as expected, as shown in Figure 14-11 for the Upper SMSU domain.
Figure 14-11: Example of Quadrilateral Strings for the Upper SMSU Domain
Visual inspection of the Nearest Neighbor (NN) models confirmed that the unfolding process
had worked as expected for all zones and all of the samples were confirmed to be properly
unfolded and used during the estimation process.
Grade Variography
Experimental grade variograms were generated from the unfolded composite data for all
model variables to assess the spatial variability for the purpose of assigning Kriging weights
to the composite samples. Samples situated in the directions of preferred geological
continuity receive higher Kriging weights resulting in a greater influence on the block
estimate.
Pairwise relative experimental grade variograms were generated based on the parameters
outlined in Table 14-8. Variograms were not generated for the MSU domain due to
insufficient data across the width of the deposit.

Document Number
Revision
Page
Rev Date
G4932-RPT-01 0 08 Jan 2021 178
Talon Metals Corp. – Preliminary Economic Assessment #3 on the Tamarack North Project
Table 14-8: Grade Variogram Parameters
Elements SMSU (Upper and Lower) 138 Zone
Rotations 0 0
Lag Distance (m) 20 30
Number of Lags 15 15
Sub-Lag Distance (m) 5 15
Number Lags to be Sub-Lagged 5 4
Regularization Angle (degrees) 22 22
Number of Azimuths 2 2
Cylindrical Search Radius 30 30
A set of two structure spherical variogram models were fitted to the variogram data. An
example of the variogram model for Ni in the Lower SMSU is provided in Figure 14-12.
Summaries of all the variogram models are provided in Table 14-9.
Figure 14-12: Lower SMSU %Ni Variogram Model

Document Number
Revision
Page
Rev Date
G4932-RPT-01 0 08 Jan 2021 179
Talon Metals Corp. – Preliminary Economic Assessment #3 on the Tamarack North Project
Table 14-9: Tamarack Grade Variogram Models (Unfolded)
Mineral Domain
Element Nugget
1st Structure 2nd Structure
X-Range Y-Range Z-Range Variance X-Range Y-Range Z-Range Variance
Upper SMSU
Ni 0.021 6.4 9.9 34.8 0.143 20.5 39.6 79.9 0.392
Cu 0.053 12.0 11.3 45.1 0.227 20.0 59.7 80.1 0.296
Pt 0.073 9.0 21.7 32.6 0.163 27.4 60.7 79.5 0.270
Pd 0.075 10.9 17.5 27.4 0.173 25.9 59.7 79.7 0.259
Au 0.074 5.4 18.5 38.8 0.303 20.1 60.3 79.9 0.129
Lower SMSU
QNi 0.021 12.9 26.3 42.2 0.006 18.8 40.1 70.2 0.568
QCu 0.053 12.9 17.3 20.3 0.084 27.4 31.8 50.7 0.357
Pt 0.073 2.4 18.3 44.6 0.135 26.3 50.9 79.7 0.211
Pd 0.058 13.9 18.1 17.9 0.082 37.0 40.2 59.7 0.194
Au 0.074 6.5 11.4 25.6 0.116 18.1 27.4 60.1 0.226
138
Ni 0.056 9.7 23.5 16.8 0.003 20.2 45.8 50.1 0.317
Cu 0.129 7.9 18.6 21.1 0.003 20.0 45.7 50.2 0.470
Pt 0.088 7.5 21.1 12.1 0.001 20.6 46.4 49.6 0.266
Pd 0.108 7.7 16.4 15.8 0.019 19.8 44.7 50.2 0.228
Au 0.155 8.5 17.0 17.6 0.040 20.2 45.3 50.0 0.259
Notes:
In the UCS, X (vertical) is across the mineralization, Y is down-dip, and Z is along strike.
QNi (density-weighted Ni grade) and QCu (density-weighted Cu grade) are SG weighted variables.
The down-dip (Y-Range) and along strike (Z-Range) directions of the mineralization were
determined to be the directions of greatest grade continuity. The second structure range of
each axis was used as the basis to define the search ellipse dimensions used for
interpolating grades into the mineral resource block model.
Block Model Definition
A 3D block model was defined as summarized in Table 14-10. Figure 14-2 displays the
location of the model outlined in red.

Document Number
Revision
Page
Rev Date
G4932-RPT-01 0 08 Jan 2021 180
Talon Metals Corp. – Preliminary Economic Assessment #3 on the Tamarack North Project
Table 14-10: Block Model Definition
Direction Minimum
(m) Maximum
(m) Range
(m) Block Size
(m) No. of Blocks
Easting (X) 490,600 491,400 800 5 160
Northing (Y) 5,168,000 5,169,600 1,600 5 320
Elevation (Z) -400 200 600 5 160
All mineral domain solids were filled with blocks using the parameters described in Table
14-8. Cell splitting (2X) was used for improved definition of boundaries. All domain volumes
were then compared to the filled model volumes to confirm there were no errors during the
process.
Estimation Methodology
OK was the interpolation method chosen to estimate grades in the Upper SMSU, Lower
SMSU, and 138. This method assigns weights to the samples based on the modeled spatial
continuity of the sample data. The MSU domain did not have sufficient data for variogram
modeling, so the ID3 interpolation method was chosen. This method assigns weights to
samples based on the distance from the block centroid, with closer samples having a higher
weighting. ID3 was chosen over inverse distance squared (ID2) due to the high-grade nature
of the domain, in order to prevent high-grades from spreading through areas of lower grade.
ID2 was also used in the SMSU and 138 for comparative purposes, but not chosen for
resource reporting. ID2 was used to estimate the LG domain.
Base metals (Ni, Cu, Co) were SG weighted for the Lower SMSU and MSU zones based on
the observed correlations previously discussed. The 138 and Upper SMSU were not SG
weighted, due to insufficient density data (138) and poor correlations with SG (Upper
SMSU). Density values in the 138 were estimated from calculated values based on a
regression formula, as discussed in Section 14.4.3. SG in the Upper SMSU was estimated
from the raw lab determined values using OK, and missing values were assigned the NN
value or a default of 2.89 g/cm3. All domains utilized a nested search strategy, along with
unfolding and top-cutting as summarized in Figure 14-11.
NN interpolation was also used to estimate each domain for model validation purposes. NN
estimates use the sample grade closest to the centroid of the block and represent de-
clustered sample grades for use in block model validation.

Document Number
Revision
Page
Rev Date
G4932-RPT-01 0 08 Jan 2021 181
Talon Metals Corp. – Preliminary Economic Assessment #3 on the Tamarack North Project
Table 14-11: Summary of Estimation Methodology
Geological Domain
Interpolation Methods
SG Weighting of Base Metals
Nested Search
Unfolding Top Cutting
Upper SMSU OK, ID2, NN No Yes Yes Yes
Lower SMSU OK, ID2, NN Yes Yes Yes Yes
MSU ID3, NN Yes Yes Yes Yes
138 OK, ID2, NN No Yes Yes Yes
LG ID2 No Yes No Yes
Nested, anisotropic searches were performed for all domains using the modelled second
structure variogram ranges for each element as the approximate search distances for each
of the three axes, orthogonal to the unfolded plane of the deposit. The search parameters
for all elements are summarized in Table 14-12. It is noted that, as with the variogram
ranges, these search parameters are used in unfolded space during the interpolation
process, where X is across the deposit, Y is down-dip, and Z is in the strike direction. The
search radius of the first search was restricted to approximately one-half the variogram
range, with the second search being the full variogram range, and the third search being
twice the variogram range. For the MSU domain, the search ellipse was based on the relative
geometry of the mineralization. Search strategies for each domain used an elliptical search
with a minimum of four samples and a maximum of 12 samples, utilizing a sample restriction
with a maximum of six samples per hole. Un-estimated blocks were flagged in the model
and then estimated without hole restrictions, along with expanded search distances.
Table 14-12: Summary of Search Parameters (Unfolded)
Element
1st Search 2nd Search 3rd Search All
X-Range
Y-Range
Z-Range
Min. Samples
Max. Samples
SVOL Factor
2
Min. Samples
Max. Samples
SVOL Factor
3
Min. Samples
Max. Samples
Max. per hole
Upper SMSU
10 30 60 4 12 2 4 12 4 2 12 6
Lower SMSU
10 20 35 4 12 2 4 12 4 2 12 6
MSU 4 10 20 4 12 2 4 12 3 4 12 6
138 Zone 15 30 60 4 12 2 4 12 4 2 12 6
LG 40 40 20 4 12 2 4 12 4 2 12 6

Document Number
Revision
Page
Rev Date
G4932-RPT-01 0 08 Jan 2021 182
Talon Metals Corp. – Preliminary Economic Assessment #3 on the Tamarack North Project
14.7 Mineral Resource Classification
Resource categories were assigned to broad regions of the block model based on the
confidence of the estimates as they related to the geological understanding, continuity of
mineralization relative to the style of mineralization, data quality, and drill hole density. A
combination of drill hole density and the search volume used to estimate the grade of the
block was used as an additional guide for outlining classification regions. Areas where the
drill hole spacing is on average 25 m or less and most of the blocks were estimated in the
first or second search volume are classified as “Indicated Mineral Resource”. Areas where
the drill hole spacing is wider than 25 m and the majority of block was estimated in the
second or third search volume was classified as “Inferred Mineral Resource”. No Measured
Mineral Resources were outlined from the block model, as it is the QP’s opinion that the drill
spacing and orientation of drilling was insufficient to adequately define the volume and extent
of mineralization to meet the definition of the Measured Resource category.
Figure 14-13 to Figure 14-16 outline the mineral resource categories assigned to each
mineral domain, where cyan (light blue) areas are Indicated Resources and orange areas
are Inferred Resources. The 138 Zone was classified entirely as Inferred Resources due to
limited metallurgical information and greater than 25 m drill spacing. Regions that were not
assigned a resource category were flagged in the model as “potential” exploration target and
were excluded from the 2020 MRE.

Document Number
Revision
Page
Rev Date
G4932-RPT-01 0 08 Jan 2021 183
Talon Metals Corp. – Preliminary Economic Assessment #3 on the Tamarack North Project
Figure 14-13: Upper SMSU Resource Classification (Plan view)
Figure 14-14: Lower SMSU Resource Classification

Document Number
Revision
Page
Rev Date
G4932-RPT-01 0 08 Jan 2021 184
Talon Metals Corp. – Preliminary Economic Assessment #3 on the Tamarack North Project
Figure 14-15: MSU Resource Classification
Figure 14-16: 138 Resource Classification

Document Number
Revision
Page
Rev Date
G4932-RPT-01 0 08 Jan 2021 185
Talon Metals Corp. – Preliminary Economic Assessment #3 on the Tamarack North Project
The number of blocks estimated in each of the search volumes was reviewed to ensure that
the proportion of cells estimated for each was relatively consistent with the spacing of the
drill hole data and supported the categories assigned to the model. The majority of blocks in
the Upper SMSU, Lower SMSU, and 138 were estimated within the first search volume,
while the MSU was 54%, as listed in Table 14-13.
Table 14-13: Proportion of Model Tonnes by Search Volume
Domain % 1st % 2nd
Upper SMSU 89% 11%
Lower SMSU 97% 3%
MSU 54% 37%
138 99% 1%
14.8 Block Model Validation
The model validation process included a visual comparison of block model and composite
grades in plan and section, along with a global comparison of mean grades and an
evaluation of smoothing ratios. Block grades were visually compared to the drill hole
composite data in all domains to ensure agreement and no material grade bias issues were
identified, as demonstrated in Figure 14-17 to Figure 14-20.

Document Number
Revision
Page
Rev Date
G4932-RPT-01 0 08 Jan 2021 186
Talon Metals Corp. – Preliminary Economic Assessment #3 on the Tamarack North Project
Figure 14-17: Comparison of Block Grades and Composite Samples in the Upper SMSU (5169060
N)
Figure 14-18: Comparison of Block Grades and Composite Samples in the Upper SMSU and Lower
SMSU (5168780 N)
Lower SMSU
Upper
SMSU

Document Number
Revision
Page
Rev Date
G4932-RPT-01 0 08 Jan 2021 187
Talon Metals Corp. – Preliminary Economic Assessment #3 on the Tamarack North Project
Figure 14-19: Comparison of Block Grades and Composite Samples in the MSU and Lower SMSU
(5168660 N)
Figure 14-20: Comparison of Block Grades and Composite Samples in the MSU and 138 Domains
(5168340 N)
M
S
U
MSU
138
MSU
Lower SMSU

Document Number
Revision
Page
Rev Date
G4932-RPT-01 0 08 Jan 2021 188
Talon Metals Corp. – Preliminary Economic Assessment #3 on the Tamarack North Project
Global statistical comparisons between the composite samples, NN estimates and the final
estimates (OK or ID) for each metal were compared to assess global bias, where the NN
model estimates represent de-clustered composite data. Clustering of the drill hole data can
result in differences between the global means of the composites and NN estimates. The
results summarized in Table 14-14 indicate that no significant grade bias was found in the
block model.
Table 14-14: Validation Comparison of Global Mean Grades
Metal Source Upper SMSU
(mean) Lower SMSU
(mean) MSU
(mean) 138
(mean) LG
(mean)
Ni (%)
Composites 0.59 1.68 5.33 0.56 0.14
NN Model 0.50 1.93 5.94 0.69 0.12
Final Model 0.50 1.93 5.88 0.69 0.12
Cu (%)
Composites 0.34 0.93 2.30 0.39 0.05
NN Model 0.27 1.03 2.49 0.51 0.05
Final Model 0.27 1.03 2.48 0.51 0.04
Co (%)
Composites 0.02 0.04 0.11 0.02 0.01
NN Model 0.02 0.05 0.12 0.02 0.01
Final Model 0.02 0.05 0.12 0.02 0.01
Pt (ppm)
Composites 0.14 0.57 0.61 0.15 0.03
NN Model 0.14 0.55 0.69 0.19 0.03
Final Model 0.14 0.54 0.68 0.18 0.03
Pd (ppm)
Composites 0.08 0.35 0.47 0.09 0.02
NN Model 0.08 0.34 0.52 0.11 0.02
Final Model 0.08 0.33 0.51 0.11 0.02
Au (ppm)
Composites 0.07 0.25 0.24 0.09 0.02
NN Model 0.07 0.24 0.26 0.12 0.01
Final Model 0.07 0.24 0.26 0.12 0.01
Smoothing (i.e. spreading, blending, averaging) of estimated grades can occur due to
processes such as compositing samples, linear interpolation methods such as OK and ID,
along with various other estimation parameters, including search distances and the number
of samples used in the estimate. A certain degree of smoothing is expected due to the
change of support size from core sized samples to large mining blocks, ex., 5 m3. It is

Document Number
Revision
Page
Rev Date
G4932-RPT-01 0 08 Jan 2021 189
Talon Metals Corp. – Preliminary Economic Assessment #3 on the Tamarack North Project
common to see higher smoothing than expected, which is an issue when reporting resources
above a mining cut-off, as the overly smoothed distribution results in resource tonnages
being overestimated and grades being underestimated.
Smoothing ratios were calculated for estimated model grades in the Upper SMSU and Lower
SMSU and 138 domains, as shown in Table 14-15. Smoothing ratios are based on the ratio
between the theoretical model variance and actual model variance, where the theoretical
variance is calculated based on the sum of the variance inside the block and variance
between blocks using parameters, including the variogram model, block size, and F-
Function.
A smoothing ratio of 1 represents the ideal scenario where the expected variance equals the
model variance, and ratios between 0.8 to 1.2 are within acceptable tolerances and would
not require any corrective actions. Ratios less than 0.8 are considered “under-smoothed”
(low tonnes and high-grade) and over 1.2 are considered “over-smoothed” (high tonnes and
low-grade) and could require corrective actions, as the proportion of tonnes and grade above
the selective mining cut-off may not be representative of the deposit. Corrective actions
would include options such as adjusting various estimation parameters or conducting a
variance correction. Smoothing ratios were not calculated for the MSU as variograms were
not modelled.
Table 14-15: Summary of Smoothing Ratios
Metal Upper SMSU Lower SMSU 138
Ni (%) 1.21 1.13 1.02
Cu (%) 1.18 1.15 1.47
Co (%) 1.23 1.11 0.98
Pt (ppm) 1.32 1.33 0.99
Pd (ppm) 1.30 1.50 1.15
Au (ppm) 1.45 1.50 1.59
The smoothing ratio assessment indicated a low degree of smoothing within accepted
tolerances with a few minor exceptions mainly seen in the precious metals. As a result, no
variance correction was applied to the block model.

Document Number
Revision
Page
Rev Date
G4932-RPT-01 0 08 Jan 2021 190
Talon Metals Corp. – Preliminary Economic Assessment #3 on the Tamarack North Project
14.9 Cut-off Grade (COG)
The break-even reporting COG determined by Talon for this MRE was 0.5% Ni. Table 14-16
lists the long-term- metal prices and recovery assumptions used for the Ni cut-off calculation
that were determined by Talon. Talon excluded Co, Pt, Pd, and Au as payable metals for
the purpose of calculating the COG.
Table 14-16: Summary of Metal Price and Recovery Assumptions
Metal Recovery Price ($US)
Ni 82% $8.00 / lb
Cu 70% $3.00 / lb
Co 50% $25.00 / lb
Pt 50% $1,000 / oz
Pd 50% $1,000 / oz
Au 50% $1,300 / oz
Talon’s long-term metal price assumptions are based on the average metal price forecast
from a number of recognized financial institutions from North America and Europe.
Operating costs (OPEX) based on the previous PEA Technical Report were estimated for
bulk underground mining as summarized in Table 14-17 and appear to be within industry
norms.
Table 14-17: Summary of Mining Cost Assumptions
OPEX (US$/tonne)
Mining $22.25
Processing $13.63
G&A $4.70
TOTAL $40.58
14.10 Assessment of Mining Continuity
Grade shells were created from the block model to evaluate mining continuity at the 0.5%
Ni COG. The grade shells demonstrated good continuity at the break-even COG as shown
in Figure 14-21. The grade shells outline blocks above the COG and do not consider any
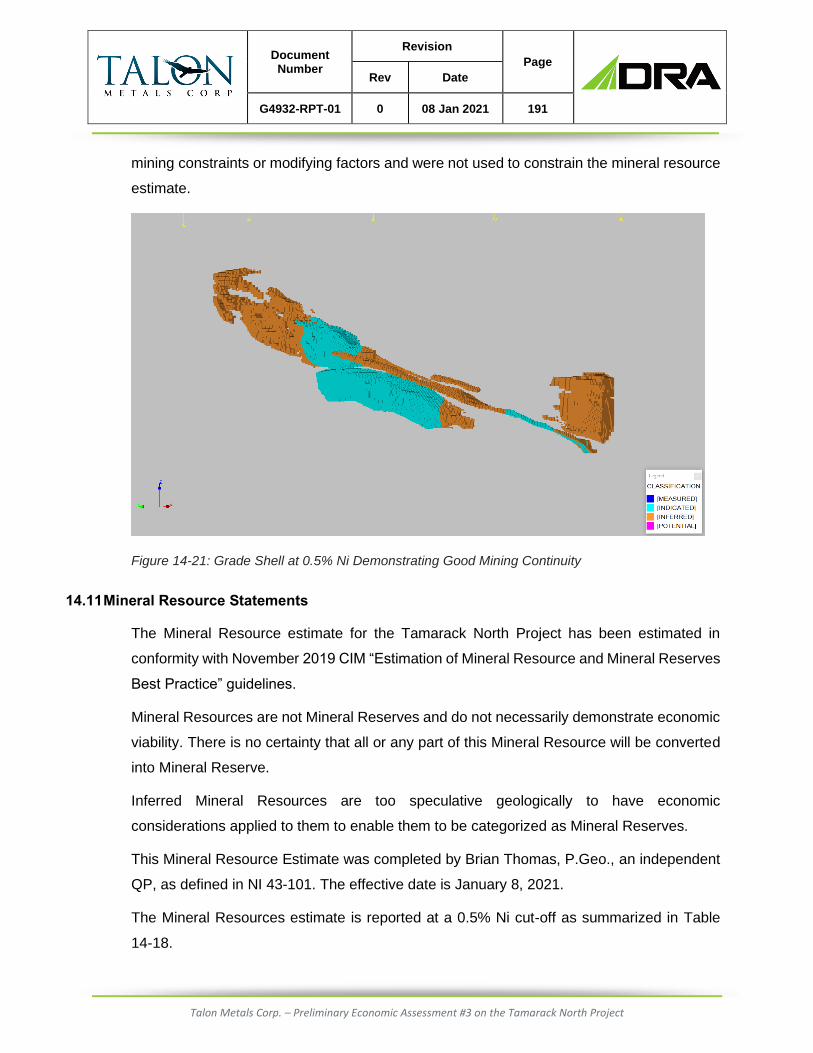
Document Number
Revision
Page
Rev Date
G4932-RPT-01 0 08 Jan 2021 191
Talon Metals Corp. – Preliminary Economic Assessment #3 on the Tamarack North Project
mining constraints or modifying factors and were not used to constrain the mineral resource
estimate.
Figure 14-21: Grade Shell at 0.5% Ni Demonstrating Good Mining Continuity
14.11 Mineral Resource Statements
The Mineral Resource estimate for the Tamarack North Project has been estimated in
conformity with November 2019 CIM “Estimation of Mineral Resource and Mineral Reserves
Best Practice” guidelines.
Mineral Resources are not Mineral Reserves and do not necessarily demonstrate economic
viability. There is no certainty that all or any part of this Mineral Resource will be converted
into Mineral Reserve.
Inferred Mineral Resources are too speculative geologically to have economic
considerations applied to them to enable them to be categorized as Mineral Reserves.
This Mineral Resource Estimate was completed by Brian Thomas, P.Geo., an independent
QP, as defined in NI 43-101. The effective date is January 8, 2021.
The Mineral Resources estimate is reported at a 0.5% Ni cut-off as summarized in Table
14-18.

Document Number
Revision
Page
Rev Date
G4932-RPT-01 0 08 Jan 2021 192
Talon Metals Corp. – Preliminary Economic Assessment #3 on the Tamarack North Project
Table 14-18: Mineral Resource Estimate for the Tamarack North Project, Effective Date January 8,
2021
Domain Classification %Ni Cut-
Off Tonnes
(000) Ni
(%) Cu (%)
Co (%)
Pt (g/t)
Pd (g/t)
Au (g/t)
NiEq
(%)
Upper SMSU Indicated Resource 0.5 1,462 1.32 0.78 0.04 0.17 0.11 0.11 1.81
Lower SMSU Indicated Resource 0.5 2,340 2.08 1.10 0.05 0.55 0.34 0.25 2.87
MSU Indicated Resource 0.5 124 5.72 2.36 0.12 0.60 0.46 0.23 7.23
Total Indicated Resource 0.5 3,926 1.91 1.02 0.05 0.41 0.26 0.20 2.62
Upper SMSU Inferred Resource 0.5 2,652 0.76 0.47 0.02 0.25 0.14 0.12 1.10
Lower SMSU Inferred Resource 0.5 115 0.86 0.51 0.02 0.57 0.36 0.24 1.34
MSU Inferred Resource 0.5 443 5.93 2.52 0.12 0.70 0.52 0.26 7.53
138 Inferred Resource 0.5 3,953 0.82 0.63 0.02 0.21 0.12 0.14 1.21
Total Inferred Resource 0.5 7,163 1.11 0.68 0.03 0.26 0.16 0.14 1.57
- All resources reported at a 0.5% Ni cut-off.
- No modifying factors have been applied to the estimates.
- Tonnage estimates are rounded to the nearest 1,000 tonnes.
- Metallurgical recovery factored into the reporting cut-off.
- Where used in this Mineral Resource estimate, NiEq% = Ni%+ Cu% x $3.00/$8.00 + Co% x $25.00/$8.00 +
Pt [g/t]/31.103 x $1,000/$8.00/22.04 + Pd [g/t]/31.103 x $1000/$8.00/22.04 + Au [g/t]/31.103 x
$1,300/$8.00/22.04 No adjustments were made for recovery or payability in the calculation of NiEq.
Table 14-19 summarizes the changes from the 2018 reported resource estimates for
tonnage and Ni and Cu.
Table 14-19: Comparison of 2018 and 2020 Mineral Resource Estimates
Domain Classification
2018 2020 Difference
Tonnes (000)
Ni (%)
Cu (%)
Tonnes (000)
Ni (%)
Cu (%)
Tonnes (000)
Ni (%)
Cu (%)
Total Indicated 3,639 1.83 0.99 3,926 1.91 1.02 287 0.08 0.03
Total Inferred 4,382 1.58 0.92 7,163 1.11 0.68 2,781 -0.47 -0.24

Document Number
Revision
Page
Rev Date
G4932-RPT-01 0 08 Jan 2021 193
Talon Metals Corp. – Preliminary Economic Assessment #3 on the Tamarack North Project
The difference between the mineral resource estimate from 2018 reflects the change of the
reporting COG from 0.83% NiEq to 0.5% Ni, as well as the increase of project limits to
5,169,600 N that resulted in a large volume increase in the Upper SMSU and 138 domains.
Indicated resources increased marginally due to the conversion of some of the MSU from
Inferred to Indicated Resource as a result of the 2020 winter drill hole program that provided
more definition in the down-plunge region.
14.12 Risk Assessment
The QP is unaware of any known environmental, permitting, legal, title, taxation, socio-
economic, marketing, political, or any other potential factors that could materially impact the
Tamarack North Project resource estimate provided in this Technical Report. Portions of the
resource are located 200 m to 600 m below designated wetlands, but this is not expected to
affect future permitting.
The mineral resource estimate may be materially impacted by the following:
• Changes in the break-even COG, as a result of changes in mining costs, processing
recoveries, or metal prices;
• Changes in geological knowledge/interpretation, as a result of new exploration data.

Document Number
Revision
Page
Rev Date
G4932-RPT-01 0 08 Jan 2021 194
Talon Metals Corp. – Preliminary Economic Assessment #3 on the Tamarack North Project
MINERAL RESERVE ESTIMATE
Not applicable.
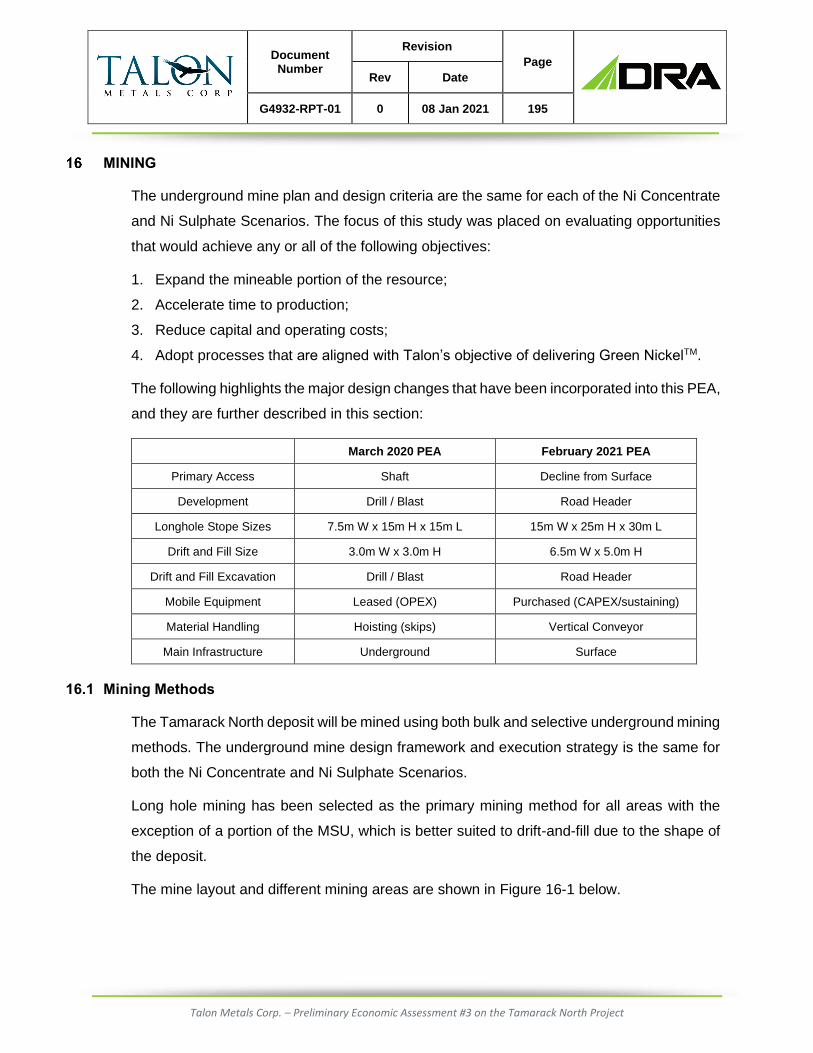
Document Number
Revision
Page
Rev Date
G4932-RPT-01 0 08 Jan 2021 195
Talon Metals Corp. – Preliminary Economic Assessment #3 on the Tamarack North Project
MINING
The underground mine plan and design criteria are the same for each of the Ni Concentrate
and Ni Sulphate Scenarios. The focus of this study was placed on evaluating opportunities
that would achieve any or all of the following objectives:
1. Expand the mineable portion of the resource;
2. Accelerate time to production;
3. Reduce capital and operating costs;
4. Adopt processes that are aligned with Talon’s objective of delivering Green NickelTM.
The following highlights the major design changes that have been incorporated into this PEA,
and they are further described in this section:
March 2020 PEA February 2021 PEA
Primary Access Shaft Decline from Surface
Development Drill / Blast Road Header
Longhole Stope Sizes 7.5m W x 15m H x 15m L 15m W x 25m H x 30m L
Drift and Fill Size 3.0m W x 3.0m H 6.5m W x 5.0m H
Drift and Fill Excavation Drill / Blast Road Header
Mobile Equipment Leased (OPEX) Purchased (CAPEX/sustaining)
Material Handling Hoisting (skips) Vertical Conveyor
Main Infrastructure Underground Surface
16.1 Mining Methods
The Tamarack North deposit will be mined using both bulk and selective underground mining
methods. The underground mine design framework and execution strategy is the same for
both the Ni Concentrate and Ni Sulphate Scenarios.
Long hole mining has been selected as the primary mining method for all areas with the
exception of a portion of the MSU, which is better suited to drift-and-fill due to the shape of
the deposit.
The mine layout and different mining areas are shown in Figure 16-1 below.

Document Number
Revision
Page
Rev Date
G4932-RPT-01 0 08 Jan 2021 196
Talon Metals Corp. – Preliminary Economic Assessment #3 on the Tamarack North Project
Figure 16-1: Mine Development and Production Areas
16.2 Bulk Mining
The primary mining method for each zone is transverse long hole open stoping with
cemented paste backfill. Stopes are orientated E/W in the Upper SMSU and Lower SMSU
and N/S in the 138 deposit. Figure 16-2 shows a typical layout for a primary-secondary
transverse long hole open stopping method with paste backfill. The typical stope size is 15 m
wide by 25 m high.
Figure 16-2: Long Section View of Primary-Secondary Transverse Long Hole Open Stoping Method
with Paste Backfill

Document Number
Revision
Page
Rev Date
G4932-RPT-01 0 08 Jan 2021 197
Talon Metals Corp. – Preliminary Economic Assessment #3 on the Tamarack North Project
Long hole stopes will be mined in a bottom-up, primary/secondary sequence, with primary
stopes designed four stope widths apart, and generally adhere to the following design basis:
• Accessed from a FW drive from waste cross cuts driven with a road header on 15 m
spacing;
• Both upper and lower sill drives are driven with a road header from the FW drives, to
the extents of the deposit using a road header. In the case where lower stopes have
been mined and filled, the upper sill drift remaining from the bottom stope is utilized as
the lower sill drift in subsequent levels;
• Stopes will be mined from HW to FW and generally be no longer than 30 m;
• Stopes will be mined in a “primary-secondary” sequence from the bottom levels and
advancing upwards, trending up-dip along the deposit, as shown in Figure 16-3;
Figure 16-3: SMSU Stope Sequence
• A vertical slot will be driven from the top sill drive to the full width of the stope on the HW
side. The slot is required to allow space for blast swell muck from the initial blast.
Subsequent blasts will blast material into the open void toward the HW;
• After each blast, a remote-controlled load-haul-dump (LHD) will muck out the blasted
material from the lower sill drift. Mineralized material will then be either loaded into trucks
or transported directly to a central ore pass by LHD;

Document Number
Revision
Page
Rev Date
G4932-RPT-01 0 08 Jan 2021 198
Talon Metals Corp. – Preliminary Economic Assessment #3 on the Tamarack North Project
• Once the stope is fully mucked out, a fill fence is constructed at the FW contact of the
stope in the lower sill drive. Cemented paste backfill, in addition to development waste
rock, where available, is placed into the stope from the top sill;
• Once the paste backfill is cured the stope directly above it can be mined;
• Once three stopes are mined vertically in a column and the top stope in that series is
cured, a secondary stope can be mined adjacent to the primary stope as shown in
Figure 16-4;
Figure 16-4: Secondary Stope Lag
• Similarly, once three stopes in a column are mined and cured from the secondary
stopes, the tertiary stopes can be mined;
• Once the secondary stopes are mined out and backfilled, the stope above the initial
primary can then be mined. This pattern continues throughout the orebody, advancing
in a vertical chevron style pattern.
16.3 Drift and Fill Mining
Drift and fill mining will be used in the MSU as it requires a high degree of selectivity in order
to minimize dilution and because the narrow shape isn’t favorable for bulk mining. Drift and
fill mining will be completed using a road header. Standard cuts will be 6.5 m wide by 5.0 m
with cuts along the contact of the deposit being cut to the profile; this will allow full extraction

Document Number
Revision
Page
Rev Date
G4932-RPT-01 0 08 Jan 2021 199
Talon Metals Corp. – Preliminary Economic Assessment #3 on the Tamarack North Project
of the high-grade areas, while minimizing dilution. Drift and fill mining will be progressed as
follows:
• Unlike bulk stoping, drift and fill access for the MSU will be on the W side of the deposit
in order to maximize recovery;
• Drift and fill mining will be completed on 5.0 m level spacing;
• Access to each level will be a single 4.5 m wide by 5.0 m high cross cut drifts from a
dedicated access/FW drive and mining;
• Once the economic mineralized material is reached, the road header will drive parallel
primary/secondary drifts, while maintaining access to each subsequent drift within the
mineralized material in order to minimize waste development.
• Primary and secondary stopes will alternate by the standard width of the drifting (i.e. 6.5
m), where possible;
• Once a primary stope is mined out to the full width of the deposit, a fill fence will be
constructed and a blend of development waste rock and paste fill will be used to tight-
fill the drift;
• Once all primary drifts are developed and the paste fill is cured, secondary drifts will be
mined.
Figure 16-5 shows an example of drift-and-fill stopes in the MSU.
Figure 16-5: 3D View of Drift-and-Fill Stopes in the MSU

Document Number
Revision
Page
Rev Date
G4932-RPT-01 0 08 Jan 2021 200
Talon Metals Corp. – Preliminary Economic Assessment #3 on the Tamarack North Project
16.4 Underground Mine Plan and Schedule
Mine Design Criteria
Mine and operating criteria used for design and scheduling of the Tamarack deposit are
given in Table 16-1.
Table 16-1: Mine Design Criteria
Parameter Unit Value
Main Ramp System
Development Gradient % ≤ 15
Excavated Width M 6.50
Excavated Height m 5.50
Road Bed Height m 0.30
Concrete Road Bed Yes/No No
Shotcrete Thickness m (as needed)
Advance Rates (road header) m/month 195 - 300
Advance Rates (traditional) m/month 110 - 180
Development Overbreak % 5
Re-muck Bays
Length m 12.00
Excavated Width m 5.00
Excavated Height m 5.50
Other Internal Development (typical)
Development Gradient % 0.00
Excavated Width m 5.00
Excavated Height m 5.00
Road Bed Height m 0.30
Concrete Road Bed Yes/No No
Advance Rates (road header) m/month 195 - 300
Advance Rates (traditional) m/month 110 - 180
Drift and Fill
Excavated Width m 6.50
Excavated Height m 5.00
Road Bed Height m 0.00
Concrete Road Bed Yes/No No
Total Advance Rates (road header) m/month 200

Document Number
Revision
Page
Rev Date
G4932-RPT-01 0 08 Jan 2021 201
Talon Metals Corp. – Preliminary Economic Assessment #3 on the Tamarack North Project
Equivalent Production Rate tpd 700-800
Transverse Long Hole Open Stoping
Excavated Width (average) m 15.00
Excavated Height (average) m 25.00
Production Rate (maximum) t/month/stope 30,000
Dilution % 15
Recovery % 85
Vent Shaft
Diameter m 6.00
Excavation Methodology Blind Bore from Surface
Internal Raises
Diameter m 3.00 – 4.00
Excavation Methodology Raise Bore/Alimak
16.5 Underground Development Mine Design
Due to shape and size, the Tamarack North deposit, with the exception of the MSU is well
suited to be mined using bulk methods, such as long hole stope mining. The mine will be
therefore designed across a series of levels at roughly equal intervals (25 m). Stopes will be
roughly identical in size and consistently spaced. Levels will be joined by an internal ramp
that connects to the main decline from surface, allowing easy access and egress from the
mine.
Design of the Tamarack underground development was completed utilizing CAD software
from Deswik. The Deswik.CAD product was used to complete the design utilizing floor
centerlines (polylines) with appropriate attributes that describe the resulting tunnel solid
(development) to be created. This includes an attribute for dimensions (height, width, arch)
that will be used for creation of that solid. Tools within the Deswik.CAD will automatically
convert floor centerlines directly into tunnel solids and wall outlines (polylines). Tunnel solids
were also created at an appropriate length (mainly for economic consideration) to allow for
an interrogation against the geological block model. These incremental solids and
associated interrogation values (metal content, density, etc.) were subsequently turned into
task activities in the mine schedule. The mine schedule will then apply resource allocation,
further calculations, constraints, targets, or anything to aid in completing an economic

Document Number
Revision
Page
Rev Date
G4932-RPT-01 0 08 Jan 2021 202
Talon Metals Corp. – Preliminary Economic Assessment #3 on the Tamarack North Project
sensitivity analysis. The mine schedule was completed with Deswik software utilizing both
the Deswik Scheduler product and Deswik.IS (interactive scheduler) product.
16.6 Resource Mine Design Selection
The mine plan is based on the updated 2020 resource model. Prior to performing the
development design, all block models were subject to a series of optimization scenarios
using Deswik Stope Optimizer (SO). The purpose was to produce practical mining shapes
used in conjunction with mine development design; together, they would contribute to an
economic analysis.
The final parameters and/or assumptions used for the SO runs against the Tamarack block
model are summarized in Table 16-2 below.
Table 16-2: Cut-off and SO Parameters
SO Parameter Unit Value Variance
Resource Model As Supplied by Talon
Default Density t/m3 2.84
Block Density t/m3 Variable per each block in the
resource model
Default Dip Degrees 90
Default Strike Degrees 0
Stope Height m 25
Maximum Waste Fraction % 0 to 100
Maximum Length of Shape m 15
Minimum Dip Angle of Shape Degrees 70
Maximum Dip Angle of Shape Degrees 110
Maximum Strike Angle of Shape Degrees -45 to 45
Maximum Side Length Ratio 1.5
Optimization Field Field NSR
Figure 16-6 displays SO dimensional nomenclatures.

Document Number
Revision
Page
Rev Date
G4932-RPT-01 0 08 Jan 2021 203
Talon Metals Corp. – Preliminary Economic Assessment #3 on the Tamarack North Project
Figure 16-6: SO Framework
16.7 Cut off Value/NSR
When evaluating any resource block models, one of the largest determining factors of
outcome is the COG that is selected to determine economic feasibility from an operating
point of view. COGs are a minimum mineral grade associated with the value needed to
“break-even” when mined. Both the mineral determined for the COG and the value of “break-
even” are to be determined, prior to determining the COG. In this study, NSR was selected
as the cut-off method. The NSR is the value of the concentrate delivered to the downstream
user such as a smelter or hydromet facility, less the costs associated with delivering that
product. These include:
• Mining Costs;
• Milling/Process Costs;
• CFTF Costs;
• G&A;
• Transportation;
• Royalties.

Document Number
Revision
Page
Rev Date
G4932-RPT-01 0 08 Jan 2021 204
Talon Metals Corp. – Preliminary Economic Assessment #3 on the Tamarack North Project
The NSR of each block in the resource model has been calculated separately for both the
Ni Concentrate and Ni Sulphate Scenarios and differ based on payabilities and
transportation costs. The stopes that are included in the mine plan are those where the
average NSR of all blocks within the stope are profitable. The NSR for each block is unique
as it is based on metallurgical recoveries of both Ni and Cu, shipping and handling costs by
weight as well as government royalties, which vary with grade. Ni and Cu recoveries have
been calculated for each block based on metallurgical recovery regression curves, which
are as follows:
1. Ni Recovery (SMSU, MSU &138) > 1.00% Ni
• (1.3936 * %Ni Head + 86.88)/100*(0.0122*(%Ni Head)2 + 0.4154*%Ni Head + 94.011)
/100*0.981
2. Ni Recovery (SMSU, MSU &138) < 1.00% Ni
• (24.373*ln(x)+88.472)*(0.0247x^2+0.3631x+93.871)/100
3. SMSU and MSU mineralization > 0.50% Cu
• SMSU/MSU Cu Recovery into Cu Conc = (0.8661 * % Cu Head + 95.074)/100 * 0.98 * 0.82
• SMSU/MSU Cu Recovery into Ni Conc = (0.8661 * % Cu Head + 95.074)/100 * 0.98 * 0.18
4. SMSU and MSU mineralization < 0.50% Cu
• SMSU/MSU Cu Recovery into Cu Conc = (7.979 * LN(% Cu Head) + 100.67)/100 * 0.98 * 0.82
• SMSU/MSU Cu Recovery into Ni Conc = (7.979 * LN(% Cu Head) + 100.67)/100 * 0.98 * 0.18
5. For all 138 Zone Cu Head Grades
• 138 Zone Cu Recovery into Cu Conc = (0.8661 * % Cu Head + 81.000)/100 * 0.90 * 0.82
• 138 Zone Cu Recovery into Ni Conc = (0.8661 * % Cu Head + 81.000)/100 * 0.90 * 0.18
It should be noted that only Ni and Cu revenue has been included in the NSR calculation,
since the remainder of the metals (Co, Au, Pt, Pd only account for approximately 4% of total
revenue). For a detailed description of assumed pay abilities, see Section 22.
The NSR per tonne was calculated using the prices below.

Document Number
Revision
Page
Rev Date
G4932-RPT-01 0 08 Jan 2021 205
Talon Metals Corp. – Preliminary Economic Assessment #3 on the Tamarack North Project
Table 16-3: Commodity Prices Used to Calculate NSR/tonne
Unit Base Case
Ni US$/lb $8.00
Cu US$/lb $3.00
16.8 Underground Development
Primary Access
The primary access for personnel and materials will be via a 6.5 m wide by 5.5 m high decline
ramp from surface, which will be portaled next to the mill stockpile.
Past studies have considered both shaft and decline access options to mine the Tamarack
North deposits. A shaft access has been favoured over a decline as it minimized surface
impacts. Previous evaluation considered a large box cut that would be 337 m long x 155 m
wide x 30 m deep box cut to access bedrock. This would result in the removal of 384,000 m3
of material. The shaft, on the other hand, was sunk through a freeze wall down to bedrock
and then unlined via traditional sinking methods to a depth of 540 m.
The mine access was revisited in this study since many of the key criteria had changed,
resulting from a significantly larger resource, production throughput and overall LOM
timeframe. This included the requirements for a larger shaft and a longer mine life, which
would both require a more robust shaft design than previously considered.
Alternate excavation methods were considered to construct a portal and mine through the
top 30 to 40 m of glacial till. It was determined that civil tunneling methods would offer a
more appropriate means of access from an environmental impact standpoint, compared to
a large box cut, therefore civil tunneling and excavation specialists from McMillan Jacobs,
were retained to evaluate a practical methodology that would maximize safety and minimize
surface impacts. Shaft and hoisting specialists from Stantec were retained to review the
shaft and hoisting requirements to supplement this trade-off.

Document Number
Revision
Page
Rev Date
G4932-RPT-01 0 08 Jan 2021 206
Talon Metals Corp. – Preliminary Economic Assessment #3 on the Tamarack North Project
Ramp Access
The Tamarack North deposit is well suited for a decline access given that it is shallow and
dips at approximately 20° along the entire strike length of the deposit. The benefits of a
decline are significant and include:
• Ease of access in and out of the mine during normal operations and during an
emergency;
• Early mineralized material potential prior to the completion of major infrastructure;
• Reduced overall underground exposure to personnel as infrastructure can be located
to surface;
• Decouples production and primary access from a single entry-point.
McMillan Jacobs was retained to design a portal and access methodology that would mine
through the surface till until sufficient bedrock coverage would be suitable for traditional
lateral development methods. The primary objective was to minimize surface impacts.
For the portal construction, secant pile excavation support has been designed, as it provides
the most robust and feasible form of excavation support in the widest range of conditions.
Additionally, it will provide a barrier that will sufficiently mitigate most of the water seepage
into the mine access. The portal excavation will be 61 m long, providing approximately 3 m
of coverage over the tunnel. The width of the excavation has been designed to be 12 m,
which allows sufficient clearance to install pre-support for the tunnel, prior to going
underground.

Document Number
Revision
Page
Rev Date
G4932-RPT-01 0 08 Jan 2021 207
Talon Metals Corp. – Preliminary Economic Assessment #3 on the Tamarack North Project
Figure 16-7: Typical Secant Pile Excavation Support
The conceptual design for the tunnel assumes tunneling will be performed using sequential
excavation method (SEM) in soils and drill and blast methods or grinding using a hardrock
road header within rock. The excavation will utilize pre-support, consisting of a grouted pipe
canopy that is constructed from the headwall inside of the box cut in advance of declining
for the first 46 m of the tunnel. This will be followed by short excavation advances and then
the application of support, which will include any combination of spiling, lattice girders and
shotcrete.
Figure 16-8: Typical Tunnel Sections

Document Number
Revision
Page
Rev Date
G4932-RPT-01 0 08 Jan 2021 208
Talon Metals Corp. – Preliminary Economic Assessment #3 on the Tamarack North Project
In the transition zone, where bedrock is intercepted, mixed mining methods will be used,
included SEM, drill and blast and/or roadheader excavation. Once full bedrock is reached,
the decline will advance using a road header and proceed with standard decline
development.
The final design of the surface box cut will be 61 m long by 12 m wide by 10 m deep, which
will result in the removal of only 3,700 m3 of material, and a surface footprint of 732 m2. This
is approximately 2.5% of the footprint area and less than 1% of the material moved when
compared to the previous box cut design.
Figure 16-9: Box Cut Design
The capital cost for the portal and excavation including the development required until typical
development crews could be mobilized is estimated at US$12.6M and will take
approximately eight to 10 months to complete.
Shaft Method
The production shaft was designed to have a 6.0 m finished diameter, sunk to a depth of
528 m below collar. Unlike past mine scenarios, the production shaft will be concrete lined
from collar to shaft bottom. This is due to both the functional life requirements of the shaft
and the increase in size resulting from ventilation requirements. Stantec was retained to
complete a shaft design, schedule and budget for a shaft that could support the LOM.
In order to assess the shaft requirements, both the main shaft and vent shaft requirements
were evaluated. For a shaft scenario, the main shaft would comprise both skip hoisting and

Document Number
Revision
Page
Rev Date
G4932-RPT-01 0 08 Jan 2021 209
Talon Metals Corp. – Preliminary Economic Assessment #3 on the Tamarack North Project
a personnel and materials cage, in addition to the main conduit for mine services and an
auxiliary cage. The corresponding vent shaft for this scenario, would be a bald 5.0 m shaft
that raise bored from surface once an underground access from the main shaft could be
established. The shaft configuration is as shown below in Figure 16-10.
Figure 16-10: Shaft Cross Section
The key shaft and hoist plant parameters are shown below in Table 16-4.
Table 16-4: Shaft and Hoist Plant Parameters
Description Value
Production Rate 4,000 tpd (Ultimate)
Shaft Diameter (finished) 6.0 m
Ventilation Flow Down casting fresh air supply
Shaft Liner Concrete, 12 inches thick
Shaft Depth 528 m
Number of Stations 3
Guide Type Fixed
Surface Headframe Enclosed steel structure c/w bins

Document Number
Revision
Page
Rev Date
G4932-RPT-01 0 08 Jan 2021 210
Talon Metals Corp. – Preliminary Economic Assessment #3 on the Tamarack North Project
The hoist requirements are outlined in Table 16-5 below:
Table 16-5: Hoist Requirements
Hoist Plant Type Drum Size Payload Rope Size
Production Hoist Double Drum 12 foot 8 t 13/8 inches
Service Hoist Single Drum 12 foot 13 t 13/8 inches
Auxiliary Hoist Single Drum 6 foot 2 t ¾ inch
The shaft pre-sink would be through a freeze wall for the first 40 m until bedrock is reached,
then through traditional shaft sinking methods to the final depth with intermittent stops to cut
shaft stations.
Shaft sinking will advance at 1.0 m/day through the glacial till and a learning curve for the
first 100 m of development in bedrock, after which a steady-state full development rate of
2.5 m/day will apply. It will take approximately two months to construct each of the three
shaft stations. Each shaft station will be completed before advancing the shaft. Once shaft
excavation is complete, the sinking gear will be replaced with staging that will be used to
equip the shaft. The shaft will be equipped in a top-down sequence and will include the
construction and installation of guides, steel sets, brackets, utilities, the loading pocket
equipment and other permanent infrastructure around the shaft area. The total time to
complete the shaft will be 38 months. At this point, off-shaft development that could access
the mine zones can start. The total CAPEX for the shaft and associated infrastructure is
estimated to be approximately $130M.
Selection of Primary Access
A decline from surface was selected as the primary mine access going forward. The key
benefits to the decline include:
• Minimizes operational and safety risks associated with constructing and operating a
shaft;
• Allows early access to mineralized material in the Upper SMSU extension;
• Accelerates time to first mineralized material by at least 18 months;
• Significantly lower capital cost;
• Greater operational flexibility (can employ multiple material flow streams);

Document Number
Revision
Page
Rev Date
G4932-RPT-01 0 08 Jan 2021 211
Talon Metals Corp. – Preliminary Economic Assessment #3 on the Tamarack North Project
• Major infrastructure (shops, services, etc) can be relocated to surface, reducing overall
underground exposure and improving overall logistics;
• Greatly improves and allows early underground exploration potential.
Internal Development
Internal development is classified by development type and purpose. General assumptions
pertaining to ground support, road bed material, etc, have been made and have been
factored into the advance rate calculations and unit costs for each heading. All internal
development is based on using a road header for 90% of the total development and 10% for
traditional drill/blast using a jumbo. A 10% allowance has been added to development
quantities to account for miscellaneous development, slashing, cut-outs, etc. The
underground development heading sizes are as follows:
Table 16-6: Development Heading Properties
Development Width Height Profile
Main Decline to Vent Shaft Access 6.5 m 5.5 m Semi-Arch
Internal Decline 5.0 m 5.5 m Semi-Arch
FW 5.0 m 5.5 m Semi-Arch
Level Development 5.0 m 5.0 m Semi-Arch
Waste Cross Cut 5.0 m 4.5 m Square
Ore Cross Cut 6.5 m 5.0 m Square
Drift and Fill Production Drives 6.5 m 5.0 m Square
Vertical Development
16.8.6.1 Ore Passes
A 3.5 m ore pass will be driven in a central location in both the 138 and SMSU/MSU zones
and be connected to each level by a finger raise. These ore passes will load out onto two
separate conveyors that will join prior to the jaw crusher that will subsequently feed the
vertical conveyor.
16.8.6.2 Vent Raises
The main exhaust will be through a vent shaft collared at surface and reaching a final depth
of approximately 550 m below surface. conveying system, secondary egress and redundant

Document Number
Revision
Page
Rev Date
G4932-RPT-01 0 08 Jan 2021 212
Talon Metals Corp. – Preliminary Economic Assessment #3 on the Tamarack North Project
services. The vent shaft will be blind bored from surface to its final depth and supported with
shotcrete and bolts. Construction will be completed just-in-time with development as the
decline access reaches the top access of the vent shaft. A total of two shaft accesses will
be constructed: the first which will support the top half of the mine, and the second which
will support the bottom half and the 138 Zone. A series of internal vent raises will be
constructed to support operations in each of the mining areas. These will be typically
constructed to allow for flow-through ventilation on each of the mine levels. An allowance
has been made for an additional 300 m of ventilation raises that will be necessary to support
the decline development that have not been detailed in the mine plan.
Mine Schedule and Analysis
The mine schedule was developed by linking production stopes as well and drift and fill
headings in order to adhere to the geotechnical sequencing (primary/secondary sequencing)
that was assumed for this study. These stopes were then linked to the development
headings in order to generate a project critical path that would tie back to the decline portal.
Basic productivity factors were then built into the model, including development, production
and backfill rates as well as any planned delays and dependencies between tasks that are
required to construct the mine. After the key criteria were programmed into the model, a
series of priorities were incorporated in order to create a plan that was ideal from both a
practical and financial standpoint.
16.8.7.1 Mine Production Rate
A series of production schedules were generated using the Deswik model ranging from
2,000 to 6,000 tpd then subsequently run through the financial model in order to assess the
options that yielded the best financials for the project. The decision criteria for the production
rate selection were as follows:
• Overall LOM (in years);
• Ability of the mine to maintain steady state production;
• Mine financials;
• Distribution of grade (mill feed).
The timing to first mineralized material should coincide with current indicators for Ni demand
and an anticipated dip in future supply resulting from the expanding electric vehicle (EV)

Document Number
Revision
Page
Rev Date
G4932-RPT-01 0 08 Jan 2021 213
Talon Metals Corp. – Preliminary Economic Assessment #3 on the Tamarack North Project
market. For this reason, it is believed that the ideal LOM for Tamarack is approximately 8-
12 years. Based on the outputs from the model, the production rate selected for the
Tamarack North Project is 3,600 tpd. This appeared to be the ‘sweet spot’ as it provided a
suitable balance between production timing and the decision criteria list above. In scenarios
with lower and higher production rates, the following challenges exist:
Lower Production Rates
• Production is extended longer than desired, yielding sub-optimal economics;
• Mine equipment and facilities are not optimized;
• A large amount of infrastructure is required relative to the throughput in order to mine
from each of the zones to deliver a constant blend of material to the mill.
Higher Production Rates
• Exposed bottlenecks, such as mine sequence, lateral development and backfilling, lead
to dips in production;
• Higher production rates require much more low-grade material to be mined early in the
mine life in order to avoid dips;
• Higher production rates will inevitably require a step-change in infrastructure including
the likelihood of an additional raise and/or decline to surface to support ventilation;
• Operational risk is associated with a fast ramp-up and maintaining a large number of
active headings.
16.8.7.2 Pre-Production and Early Ramp-up
A pre-production period of 20 months is necessary to construct the portal and develop the
decline down to the Upper SMSU where production will initiate. This allows approximately
nine months to construct the portal and upper decline access down to bedrock and an
additional 11 months to decline down to the Upper SMSU and upper vent access using a
road header at 6.7 m/day. The decline development assumes that 10% of total development
meters will be driven with a jumbo since it is expected that some areas may be unsuitable
for road header development. The average decline advance rate has been de-rated to
compensate for this. Production will begin once the vent shaft is connected to the main
decline, producing a flow-through vent circuit. To accelerate time to first mineralized material,
the vent shaft will be bored and lined from surface using blind boring so that the vent shaft

Document Number
Revision
Page
Rev Date
G4932-RPT-01 0 08 Jan 2021 214
Talon Metals Corp. – Preliminary Economic Assessment #3 on the Tamarack North Project
is fully constructed by the time the decline and upper vent shaft access reaches it.
Once the SMSU is reached, a ramp up period of approximately two years is necessary to
achieve steady-state mining of 3,600 tpd.
16.8.7.3 Mine Production Profile
The steady-state mine production rate averages approximately 3,600 tpd. The following
figures outline the final mineralized material and waste production schedules.
Figure 16-11: LOM Mineralized Material Production Plan
Figure 16-12: LOM Waste Production Plan
A summary of the mine plan is shown in Table 16-7 below:

Document Number
Revision
Page
Rev Date
G4932-RPT-01 0 08 Jan 2021 215
Talon Metals Corp. – Preliminary Economic Assessment #3 on the Tamarack North Project
Table 16-7: LOM Production Plan
Description Unit Y-2 Y-1 Y1 Y2 Y3 Y4 Y5 Y6 Y7 Y8 Y9 Total/Average
Mineralized Material Tonnes
t - - 867,569 1,286,664 1,315,005 1,360,754 1,302,589 1,298,742 1,299,601 1,190,479 837,393
10,758,796
Mineralized Material tonnes per day
tpd - - 2,376.9 3,525.1 3,602.8 3,728.1 3,568.7 3,558.2 3,560.6 3,261.6 2,294.2
3,600 (avg)
Waste Development t 242,948 377,426 331,531 230,514 96,189 88,786 37,495 69,789 51,807 36,287 13,410 1,576,182
Total Ni Tonnes t - - 20,822 26,445 21,693 15,938 14,265 14,498 11,708 10,653 7,896 143,918
Ni Grade % - - 2.40 2.06 1.65 1.17 1.10 1.12 0.90 0.90 0.94 1.34
Cu Tonnes t - - 9,375 12,610 11,937 9,714 9,253 9,090 7,638 6,787 4,861 81,265
Cu Grade % - - 1.08 0.98 0.91 0.71 0.71 0.70 0.59 0.57 0.58 0.76
Co Tonnes t - - 488 654 538 429 393 399 334 308 229 3,773
Co Grade % - - 0.056 0.051 0.041 0.032 0.030 0.031 0.026 0.026 0.027 0.035
Pt Ounces g/t - - 13,102 16,404 13,640 12,238 11,165 9,559 8,740 6,578 3,806 95,232
Pt Grades % - - 0.000 0.000 0.468 0.395 0.322 0.279 0.266 0.228 0.209 0.275
Pd Ounces oz - - 8,792 10,589 8,654 7,423 6,853 5,952 5,235 4,004 2,375 59,877
Pd Grade % - - 0.293 0.239 0.192 0.160 0.155 0.135 0.118 0.099 0.083 0.162
Au Ounces oz - - 5,671 7,275 6,631 6,454 6,300 5,478 4,861 4,127 2,767 49,564
Au Grade % - - 0.189 0.164 0.147 0.139 0.142 0.124 0.110 0.102 0.096 0.135

Document Number
Revision
Page
Rev Date
G4932-RPT-01 0 08 Jan 2021 216
Talon Metals Corp. – Preliminary Economic Assessment #3 on the Tamarack North Project
16.9 Geotechnical Analysis
Geotechnical Parameters
Initial geotechnical rock mass characterization was obtained from study work completed by
Golder in 2008. Additional geotechnical logging, point load testing and laboratory sampling
for future UCS testing as required was conducted on 30 selected holes from 2008 to 2016.
During the 2020 infill drilling program, detailed geotechnical logging, as well as a dedicated
sampling program were conducted. ATV data was also collected in nine holes drilled during
the 2020 infill drilling program, in addition to Optical Televiewer (OTV) data collected in four
BHs in 2008 during a hydrophysical logging program.
Although geotechnical data is being collected continuously, including ATV and Full Wave
Sonic BH logging, for selected infill drilling BHs, detailed statistical analyses and 3D
modeling have not been completed to-date. Thus, rock mass characteristics and empirical
stability assessments are based on study work completed previously.
Table 16-8 and Table 16-9 illustrate the rock mass characteristics (RMR’76 and Q') of the
rock types that will be encountered during development and mining. The tables show that
most rock types can be classified as “good” (RMR’ = 61 to 80) according to the Beniawski
(1976) Rock Mass Rating (RMR) system. Serpentinized zones are classified as “poor” (RMR’
= 41 to 60) and are usually present in the contact between the igneous intrusion and the
host sediment country rock. The extent and impact of this weak/altered zone will be
quantified and mitigated with additional information collected in future drilling programs.
Table 16-8: Summary of RMR Data (Golder and Associates, 2008)
Lithology
RMR’76
Average Standard Deviation
Typical Range
From To
CGO 62 10 69 52 72
FGO/MZNO 66 9 66 57 75
SED 65 8 59 to 74 57 73
SMSU 61 9 66 52 70
MSU 70 11 72 to 77 59 81
Serpentinized Zones 41 13 34 28 54

Document Number
Revision
Page
Rev Date
G4932-RPT-01 0 08 Jan 2021 217
Talon Metals Corp. – Preliminary Economic Assessment #3 on the Tamarack North Project
Table 16-9: Summary of RMR Data (Golder and Associates, 2008)
Lithology
Q'
Average Typical Median by
Discontinuity Median by
Domain
Range
From To
CGO 18.7 11.1 14.5 8.2 1.7 75
FGO/MZNO 51.1 33.3 32.8 16 5 300
SED 18.4 5.6 5.6 7.8 1.3 50
SMSU 25.7 33.3 14.2 10.4 3.5 75
MSU 88.3 300 49.8 100 4.2 300
Serpentinized Zones 0.7 0.06 0.15 0.13 0.05 5.6
Detailed geotechnical logging was conducted on a total of 39 holes prior to the 2020 winter
drilling program with a good distribution throughout the resource area. All infill BHs will be
geotechnically logged in future study.
ATV logging had been conducted in 13 holes prior to the 2020 winter drilling program. This
provides valuable information regarding orientation and in-situ conditions of small and large-
scale geological structures encountered. ATV logging will be completed in selected infill
holes to obtain a representative distribution of structural data throughout the resource area.
Laboratory rock property testing was conducted in 2008 and 2020. A total of 57 UCS, 25
BTS and 21 TCS tests were conducted during these two testing programs. Summary tables
of all laboratory data available is illustrated in Table 16-10,Table 16-11 and Table 16-12. In
addition to this data, more than 470 UCS samples have been collected and stored for future
testing, as required.

Document Number
Revision
Page
Rev Date
G4932-RPT-01 0 08 Jan 2021 218
Talon Metals Corp. – Preliminary Economic Assessment #3 on the Tamarack North Project
Table 16-10: Summary of UCS Test Data
Lithology
UCS(MPa)
Average Minimum Maximum Standard Deviation
Tests
CGO 99.7 42.0 146.1 25.5 18
FGO 83.9 50.3 109.8 17.0 15
MSU/MMS 96.3 61.1 142.9 32.5 8
SMSU 89.6 71.6 112.4 25.7 6
SED 183.7 136.7 222.2 34.3 8
MZNO 95.4 54.5 136.2 40.9 2
Lithology
E(GPa)
Average Minimum Maximum Standard Deviation
Tests
CGO 45.0 10.8 69.7 14.3 18
FGO 30.1 11.9 46.0 10.5 15
MSU/MMS 42.4 30.0 52.9 7.8 8
SMSU 37.7 14.3 48.1 11.1 6
SED 42.4 37.2 48.1 4.1 8
MZNO 40.9 37.2 45.9 3.3 2
Lithology
Poisson (v)
Average Minimum Maximum Standard Deviation
Tests
CGO 0.211 0.110 0.350 0.058 17
FGO 0.210 0.070 0.260 0.053 15
MSU/MMS 0.296 0.160 0.390 0.085 8
SMSU 0.210 0.180 0.230 0.019 6
SED 0.213 0.180 0.230 0.020 8
MZNO 0.207 0.180 0.230 0.021 2

Document Number
Revision
Page
Rev Date
G4932-RPT-01 0 08 Jan 2021 219
Talon Metals Corp. – Preliminary Economic Assessment #3 on the Tamarack North Project
Table 16-11: Summary of BTS Test Results
Lithology
BTS(MPa)
Average Minimum Maximum Standard Deviation
Tests
CGO 12.3 12.3 12.3 - 1
FGO 10.3 10.0 10.5 0.3 2
MSU/MMS 6.4 4.2 9.6 1.6 15
SMSU - - - - -
SED 17.3 16.1 18.7 1.0 4
MZNO 11.1 9.8 12.1 1.0 3
Table 16-12: Results of TCS Test Results
Lithology
TCS
Sigci (MPa)
mi Sigt
(MPa) Cohesion
(MPa)
Internal Friction Angle
Tests
MSU/MMS 140.32 9.193 15.26 42.02 28.87° 11
MZNO 156.59 9.366 16.71 32.07 42.23° 5
BH breakout and in-situ stress orientation data were collected as part of the ATV logging
program. The orientation of the major principal stress has been determined to NNE-SSW in
the majority if the BHs. A detailed analysis, which will include determining the true magnitude
and orientation will be completed in future study.
In terms of large scale structures that might influence excavation stability, a possible duplex
system of faults has been interpreted in the project area and regionally by aeromagnetic
data. One fault has been confirmed within the 221 Zone drilling. The faults in the 221
zone was observed in the country rock metasedimentary sequence and sealed by quartz
veins observed over 17 m. No faults have been observed in the Tamarack resource area,
however offsets beds by small brittle fractures are observed in the country rock. The
kinematics of the faults remains unknown and timing of faulting with respect to the intrusion
of the TIC is also unknown. Future drilling and interpretation of areas where the structures
are expected will form part of the development of a detailed structural model for the project
area during the next phases.

Document Number
Revision
Page
Rev Date
G4932-RPT-01 0 08 Jan 2021 220
Talon Metals Corp. – Preliminary Economic Assessment #3 on the Tamarack North Project
Empirical Stope Stability Analysis
An empirical stability analysis on the proposed stope sizes was completed with geotechnical
data currently available. The geotechnical parameters reported in the previous section were
used to analyze stability of the typical stope sizes assumed for the mine design. The
empirical method used for the stability analysis is the Potvin (1988) stability charts utilizing
the stability number and the hydraulic radius of the back, HW, FW and vertical ends.
Separate stability analyses were conducted for the stopes in the SMSU and 138 Zones, as
they have different orientations and are situated in different lithological units.
The parameters represented in Table 16-13 were used to complete the empirical stability
analysis, which includes laboratory rock property testing, geotechnical logging data, joint set
orientation and in-situ stress orientation from ATV and OTV data.
Table 16-13: Input Parameters for Empirical Stope Design
Input Parameter SMSU 138 Zone (FGO)
Stope Orientation E-W N-S
Stope Height 24 m - 25 m 24 m - 25 m
Stope Back Width 14 m - 16 m 14 m - 16 m
Hydraulic Radius Back 14.2 – 15.7 14.2 – 15.7
Hydraulic Radius Vertical Ends 5.00 – 7.69 5.00 – 7.69
Hydraulic Radius HW 4.12 – 4.88 4.12 – 4.88
Hydraulic Radius FW 4.12 – 4.88 4.12 – 4.88
Stope Length 20 m - 30 m 20 m - 30 m
Average Depth 400 m 400 m
Sigma 1 29.7 MPa 29.7 MPa
Sigma 1 Orientation NNE-SSW NNE-SSW
Sigma 2 15.4 MPa 15.4 MPa
Sigma 2 Orientation WNW-ESE WNW-ESE
Sigma 3 11.0 MPa 11.0 MPa
Sigma 3 Orientation OB OB
UCS 83.8 MPa 89.6 MPa
Q' 10 - 40 10 - 100
Joint Set 1 Dip/DDR 85/163 74/55
Joint Set 2 Dip/DDR 21/227 39/164

Document Number
Revision
Page
Rev Date
G4932-RPT-01 0 08 Jan 2021 221
Talon Metals Corp. – Preliminary Economic Assessment #3 on the Tamarack North Project
The results of the empirical analysis for the SMSU indicate that the unsupported rock mass
in the HW and the FW are generally expected to be stable, while the back and the vertical
ends will generally be in the “Transition Zone”, meaning some instability can be expected,
however, which will either contribute to stope dilution (which is expected) or could be
effectively mitigated with simple ground support. The results for the 138 Zone indicated that
the vertical ends will generally be stable and the HW, FW and back rock masses are
generally expected to be either “Stable” or in the “Transition Zone”. Similarly, any area within
transition can be mitigated with ground support, if required. Future data collection will reduce
the range of the data and refine the plots.
The following activities are recommended to validate and refine the results above in future
study:
• Geotechnical logging and statistical data analysis of all infill drill holes to refine the rock
mass characteristics in the SMSU and 138 Zone;
• ATV (discontinuity orientation) and Full Wave Sonic (variation in rock strength) wireline
logging to be conducted in specified BHs to obtain an adequate distribution of
discontinuity orientation and continuous rock strength data;
• Laboratory testing of all lithologies to obtain an adequate confidence level in data
(typically 80% confidence level for design) for numerical modelling;
• Conduct sufficient in-situ stress conditions (magnitude and orientation) testing, typically
done by means of over-coring, to use in empirical and numerical stability analysis;
• Validate empirical design with numerical modelling, including stope stability with regards
to extraction and backfill sequence, as well as regional mining induced stresses.
An empirical stope stability assessment approach is deemed sufficient at this project phase,
as there is a high possibility that stope design, orientation and sequencing as well as mine
layout optimization will occur during the next phases. A numerical modelling approach will
be implemented during the PFS and Feasibility Study phases of the project, accompanied
by in-situ stress measurement data, as this has a significant impact on stope stability.
16.10 Hydrological Parameters – Bedrock
In 2008, interval-specific fractures were logged in four drill holes that intercepted the SMSU,
MSU, CGO, FGO and Sediments (drill holes 08TK0048, 49,50 and 08TK0054) to determine

Document Number
Revision
Page
Rev Date
G4932-RPT-01 0 08 Jan 2021 222
Talon Metals Corp. – Preliminary Economic Assessment #3 on the Tamarack North Project
the frequency of features that could be water producing. The geophysical techniques
included caliper, full wave form sonic, fluid temperature, fluid resistivity, and optical BH
imager logs. A total of 10 features with a hydraulic conductivity greater than 1x10⁻⁶ cm/s
were found along the total bore length of 2,161 m, or an average feature frequency of 1 per
216 m of length. 50% of these features were determined to be independent.
Additionally, hydraulic testing of discrete intervals using packers was performed to determine
the potential volume of water that each of the independent features with a hydraulic
conductivity greater than 1x10⁻⁶ cm/s could produce. A preliminary estimate of the inflows
per independent bedrock features to a working mine was calculated to be 9.9 gpm.
The expected frequency of independent features was multiplied by the proposed
development meters for the decline and mine footprint development respectively in order to
calculate the groundwater inflows for each feature. The results are shown in Table 16-14
and Table 16-15 below and assume none of the water producing features are sealed.
Table 16-14: Potential Mine Water Production by Year for the Decline
Year of Mining 1 2 3 4 5 6 7
Decline m 1,477.2 1,925.5 2,130.0 285.2 0.0 0.0 0.0
Cumulative Decline m 1,477.2 3,402.7 5,532.8 5,817.9 5,817.9 5,817.9 5,817.9
Estimated Number of Independent, Water Producing Features
3.4 7.9 12.8 13.5 13.5 13.5 13.5
Potential Production (from development) gpm
33.9 78.0 126.8 133.3 133.3 133.3 133.3
Potential Inflow (from decline) m3/h
7.7 17.7 28.8 30.3 30.3 30.3 30.3
Year of Mining 8 9 10 11
Total Decline m 0.0 0.0 0.0 0.0
Cumulative Decline m 5,817.9 5,817.9 5,817.9 5,817.9
Estimated Number of Independent, Water Producing Features
13.5 13.5 13.5 13.5
Potential Inflow (from development) gpm
133.3 133.3 133.3 133.3
Potential Inflow (from development) m3/h
30.3 30.3 30.3 30.3

Document Number
Revision
Page
Rev Date
G4932-RPT-01 0 08 Jan 2021 223
Talon Metals Corp. – Preliminary Economic Assessment #3 on the Tamarack North Project
Table 16-15: Potential Mine Water Production by Year for Footprint Development
Year of Mining 1 2 3 4 5 6 7
Development m 0.0 1,333.1 3,550.0 5,923.0 4,655.9 2,991.0 2,971.0
Cumulative Development m
0.0 1,333.1 4,883.1 10,806.1 15,462.0 18,453.1 21,424.0
Estimated Number of Independent, Water Producing Features
0.0 3.1 11.3 25.0 35.8 42.7 49.6
Potential Inflow (from development) gpm
0.0 30.6 111.9 247.6 354.3 422.9 491.0
Potential Inflow (from development) m3/h
0.0 6.9 25.4 56.2 80.5 96.0 111.5
Year of Mining 8 9 10 11
Total Development m 2,940.9 1,230.6 2,065.1 1,267.4
Cumulative Development m
24,364.9 25,595.5 27,660.6 28,928.0
Estimated Number of Independent, Water Producing Features
56.4 59.2 64.0 67.0
Potential Inflow (from development) gpm
558.4 586.6 633.9 662.9
Potential Inflow (from development) m3/h
126.8 133.2 144.0 150.6
The following work/tests are recommended to refine/confirm the above results during the
next stages of the project:
• Conduct additional spatially distributed hydrophysical logging;
• Conduct additional double packer testing to determine inflow expected from water
producing features;
• Conduct additional spatial distributed pump testing in the shallow (till) and deep
(fractured) aquifers with real time monitoring to determine the extent to which these
aquifers are connected;
• Determine the influence the shallow (till) aquifer will have on groundwater inflow into the
mining areas and what influence dewatering of the bedrock aquifer will have on the till
aquifer;
• Compile a numerical groundwater model to integrate all data collected and refine
estimated groundwater inflow into the decline and production development for the LOM.

Document Number
Revision
Page
Rev Date
G4932-RPT-01 0 08 Jan 2021 224
Talon Metals Corp. – Preliminary Economic Assessment #3 on the Tamarack North Project
16.11 Hydrological Parameters –Surficial
In 2008, a pump test to evaluate the hydraulic characteristics of the water bearing sand was
designed and implemented to the NE of the site layout area. The pump test required the
design and installation of a pumping well and two monitoring wells. The pump test data were
best matched to a theoretical model for a leaky confined aquifer. The test data yielded an
average transmissivity of 165 ft/day and a hydraulic conductivity of 2.4 ft/day. The average
value of hydraulic conductivity was input to an analytical groundwater inflow model to
estimate the seepage of groundwater into an idealized excavation. Output from the model
bounded the average value with reasonable upper and lower values.
The results of the model indicate initial average seepage into an idealized excavation
(circular excavation with a radius of 30.5 m) may be above 224 gpm (1,220 m3/day).
However, an average inflow of 68 gpm (374 m3/day) is estimated for periods after dewatering
effects have stabilized.
16.12 Mine Services
Mine Backfill System
Stopes will utilize paste backfill, mixed with development waste rock, when possible. Paste
backfill has been selected as the primary fill method for long hole stoping and drift and fill
stopes because of its physical properties, which provide a high degree of stability, generally
allowing for increased mineral recovery and it will minimize the quantity of tailings stored on
surface.
16.12.1.1 Paste Plant System Capacity
A paste plant will be constructed on surface, adjacent to the concentrator. For the Ni
Concentrate and Ni Powder Scenarios, the tailings recipe will utilize two main tailings
streams that are by-products of the flotation circuits in the concentrator: a LS tailings stream
(NAG character to be confirmed in dynamic geochem tests), and a HS tailings stream
containing 5.25% sulphur (~15% sulphides). For the Ni Sulphate Scenario, LS and HS
tailings streams will also be produced, as well as tailings streams for leach residue, primary
neutralization residue, and Mg residue.

Document Number
Revision
Page
Rev Date
G4932-RPT-01 0 08 Jan 2021 225
Talon Metals Corp. – Preliminary Economic Assessment #3 on the Tamarack North Project
For each scenario, all HS tailings, leach residue, primary neutralization residue, and Mg
residue generated will be used in the paste backfill recipe, with LS tailings blended in to fill
all the required voids. The impact of storing the HS tailings on surface will be higher than the
LS tailings, due to the need for a lined impoundment and the socio-environmental concerns
attached to storing sulphides on surface.
The steady-state system capacity for the plant will be 188 t/h (90 m3/h). The system design
is based on the following assumptions:
• The mass balances have been set to a 60% annual paste plant utilization. These flow
rates are also achievable with the instantaneous production rate of all tailings;
• Mill availability is assumed to be 92%. The hourly tailings production rates incorporate
this factor;
• A mineral replacement value of 90% was used;
• A solids concentration of 79.5% by mass was assumed;
• Binder addition rate was assumed to be 4%.
The system utilizations by year for the Ni Concentrate and Ni Sulphate Scenarios are shown
below in Figure 16-13 and Figure 16-14 respectively.
Figure 16-13: Backfill System Capacity at 90 m3/h

Document Number
Revision
Page
Rev Date
G4932-RPT-01 0 08 Jan 2021 226
Talon Metals Corp. – Preliminary Economic Assessment #3 on the Tamarack North Project
16.12.1.2 Paste Delivery and Distribution
The paste distribution network is designed so that a single network can service all mine
zones. Paste will be pumped from the paste plant to a pair of twin 8-inch BHs, cased with 6-
inch diameter pipes located at the top of the deposit (the Upper SMSU). The paste will then
gravity flow down the BHs and cascade down dip through the mine through inter-level BHs
between levels.
Figure 16-14: Paste Distribution System
Mine Service Water
Annual mine service water requirements are calculated for the LOM and are based on:
• Equipment usage;
• Dust suppression;
• General usage;
• Miscellaneous allowances.
The following assumptions are made for calculating the estimated underground mine water
requirements:
• Equipment consumption is based on the manufacturers’ specified water consumption
multiplied by the estimated average equipment utilization per day;
• Muck pile wash down is based on four active areas;

Document Number
Revision
Page
Rev Date
G4932-RPT-01 0 08 Jan 2021 227
Talon Metals Corp. – Preliminary Economic Assessment #3 on the Tamarack North Project
• Dust suppression for the underground crusher and conveyor loading area are both
assumed to be 5 m3/h;
• An allowance of 10% is made for miscellaneous underground usage;
• A 5% allowance is made for leakage.
It is generally expected that the service water requirements will be fairly consistent on a day-
to-day basis and no seasonal variations are expected. Based on these assumptions water
steady-state consumption is expected to be achieved by year four and is estimated to be
approximately 50 to 55 m3/h (220 to 240 gpm). The estimated annual service requirements
are shown in Figure 16-15 below:
Figure 16-15: Annual Service Water Consumption
Underground Dewatering
Wastewater resulting from equipment usage, dust suppression and groundwater inflows will
be captured in underground sumps, strategically positioned around the mine. The sumps
will allow for the settling of solids, which will be periodically removed and disposed of in
mined out stopes. Overflow water will be routed to a central sump located adjacent to the
main pumping station, which will be located at a low point in the mine around the conveyor
level. The main sump will have clean and dirty sides with the purpose of settling out solids
prior to being pumped to surface. Clean water (with minimal fines) will then be pumped to
surface up the ramp through intermediate pumping stations connected in series. Water will
ultimately be pumped to and treated at the concentrator, then recycled for future use.
0
10
20
30
40
50
60
Y1 Y2 Y3 Y4 Y5 Y6 Y7 Y8 Y9 Y10 Y11
LOM Service Water m3/h

Document Number
Revision
Page
Rev Date
G4932-RPT-01 0 08 Jan 2021 228
Talon Metals Corp. – Preliminary Economic Assessment #3 on the Tamarack North Project
Pumping requirements are based on the combined water collected resulting from consumed
service water and groundwater inflows. Tamarack can expect seasonal variations in
groundwater inflows, therefore the peak seasonal inflows are assumed in calculating the
pumping requirements. The total pumping requirements are based on the following
assumptions:
• Groundwater inflows are based on an average inflow of 9.9 gpm per water bearing
feature. An average of one water bearing feature per 216 m of drill data has been
measured through past logging;
• It is assumed that groundwater inflows can be reduced by 20% by grouting;
• 6% of the total inflows will evaporate through moisture losses and report to the
ventilation system;
• A contingency of 25% is added to the total groundwater inflows and 10% to equipment
usage;
• Pumping calculations are based on 75% pump utilization.
The average instantaneous pumping requirements during steady state-mining are between
320 and 370 m3/h, which accounts for peak groundwater inflows, which generally occur in
mid-spring (April/May) each year. The estimated pumping requirements are shown in Figure
16-16.
Figure 16-16: Mine Dewatering Requirements
0
50
100
150
200
250
300
350
400
450
Y1 Y2 Y3 Y4 Y5 Y6 Y7 Y8 Y9 Y10 Y11
LOM Dewatering - Total m3/h

Document Number
Revision
Page
Rev Date
G4932-RPT-01 0 08 Jan 2021 229
Talon Metals Corp. – Preliminary Economic Assessment #3 on the Tamarack North Project
Material Handling
16.12.4.1 Material Flow
Vertical conveyors are not as common as other material handling methods in underground
hard rock applications, due to the functional hoisting limits, which are much less than skips.
Additionally, they offer limited operational flexibility, compared to haul trucks, in that they are
fixed in one location and typically cannot be expanded once in operation. Tamarack,
however, is amenable to both of these criteria given that the overall strike length of the
deposit is short enough that it can be easily centralized and that the deposit is relatively
shallow compared to most underground mines. The vertical conveyor was then viewed as a
reasonable option because it satisfied this criteria, and there is precedent in the industry with
installations having been successfully used to support underground operations both in the
USA and abroad.
The main benefits of a vertical conveyor when compared to other options, such as an
inclined conveyor include:
• It has low relative capital costs;
• It can easily be automated;
• Maintenance is typically very low, as there are few moving parts;
• In-shaft maintenance is not needed;
• It can be almost completely isolated from people and other equipment.
A vertical conveying system was designed by Frontier Kemper Lakeshore (FKL), with
support from Continental-Contitech, (the belt supplier) out of Germany. The system was
designed at capacity of approximately 3,500 tpd and would be installed in the vent shaft.
Two belt styles were considered: a Pocketlift® and Flexowell® belt style. The Flexowell®
system was selected because it is lighter and therefore better suited for longer hoisting
distances and yet still easily meets the functional requirements needed to support the
underground operation. There currently exists global precedence at similar depths and
throughput at other mines that have been designed and built by FKL and Continental-
Contitech.

Document Number
Revision
Page
Rev Date
G4932-RPT-01 0 08 Jan 2021 230
Talon Metals Corp. – Preliminary Economic Assessment #3 on the Tamarack North Project
Figure 16-17: Flexowell® Vertical Conveyor
The vertical conveyor will be installed in the vent shaft. The head will sit on top of the shaft
collar on surface and the tail end will be in a dedicated underground loading chamber. The
belt will free-hang in the shaft and will not require any direct shaft access for maintenance.
The belt is designed to a 10:1 safety factor. Mineralized material will be brought to the vertical
conveyor by a central conveyor that will be fed by a central orepass for the Upper and Lower
SMSU. A second conveyor will bring material from the 138 Zone, fed by a central orepass
in the 138 Zone that will tie into the main conveyor. Prior to loading onto the vertical
conveyor, mineralized material will be crushed to -6 inch by a jaw crusher, and tramp steel
will be removed by a magnet/picking belt arrangement.
The vertical conveyor was ultimately selected as the preferred method due to the following
reasons:
• Net present cost (NPC): An economic trade-off was completed comparing truck haulage
to the vertical conveyor. Overall, the NPC of the vertical conveyor was $5.9M less than
the trucking option;

Document Number
Revision
Page
Rev Date
G4932-RPT-01 0 08 Jan 2021 231
Talon Metals Corp. – Preliminary Economic Assessment #3 on the Tamarack North Project
• Operating costs: the annual steady-state operating costs are estimated to be
approximately $1.3M lower for the vertical conveying option;
• The vertical conveyor offers greater operational efficiency than trucks. Should a truck
be out of commission, it is typically not possible to ‘make-up’ lost tonnes, whereas the
vertical conveyor is only scheduled to operate 18 hours per day and could easily make
up additional tonnes, as required;
• Safety: The vertical conveyor can be better isolated from personnel and other
equipment, thereby decoupling the primary access to the mine (the main decline from
surface) from material flow;
• Maintenance: the maintenance requirements for the vertical conveyor are much less
than a fleet of trucks and requires less mechanics and shop space;
• The underground truck fleet required for waste handling and internal haulage could
subsidize the material flow to surface, if needed.
16.12.4.2 Waste Flow
Waste rock will be either placed into open stopes during the backfill cycle or hauled to
surface using 50 t haul trucks and dumped at the surface stockpile or at the CFTF. A total of
two 50 t haul trucks will be required to support the underground mine. These will be shared
with the material flow circuit, where some internal haulage is required for material handling.
Mine Facilities
16.12.5.1 Mine Maintenance and Service Area
A central maintenance facility will be located on surface close to the portal. This will include
a three-bay facility for heavy mobile equipment and a small bay for light vehicles and
equipment, as well as a wash bay area. An underground service bay will be constructed in
a central location that will be dedicated to light duty repair.
16.12.5.2 Warehousing and Storage
A central warehouse will be situated on surface that will facilitate storage of underground
equipment and supplies. This will be in close proximity to the central maintenance facility.
Underground storage will utilize abandoned remuck bays, as required. These will be used
as short-term facilities for mine consumables, including bolts and screen. A dedicated
maintenance storage bay will be adjacent to the underground shop.

Document Number
Revision
Page
Rev Date
G4932-RPT-01 0 08 Jan 2021 232
Talon Metals Corp. – Preliminary Economic Assessment #3 on the Tamarack North Project
16.12.5.3 Explosives Storage
Explosives will be stored on surface in an area that is away from the main surface
infrastructure area. Detonators and bulk explosives will be stored in separate buildings no
less than 50 ft from one another. Explosives will be transported underground in underground
charge trucks as required; there will be no explosives storage underground.
16.12.5.4 Refuge Stations
The underground mine will be serviced with a total of four self-contained portable refuge
chambers, which will be used in an emergency, where immediate egress via either the ramp
to surface or secondary egress hoist is not possible. Four stations will be required to provide
sufficient refuge for the peak underground personnel per shift plus a contingency of 50%.
Portable refuge stations have been selected because they offer flexibility in that they can
easily be moved to active areas, as required. During steady-state operations, it is expected
that a 16-person refuge chamber will be located on the conveyor level close to the vent shaft
(which houses the emergency hoist), and three 12-person refuge chambers will be
positioned in a central location in each of the 138, Lower SMSU and Upper SMSU mining
areas.
16.12.5.5 Charging Stations
The Tamarack North mine will use a full fleet of battery/electric powered equipment. (No
diesel equipment is assumed for this study). Current battery fleets are designed to require
periodic battery swaps that are typically aligned to a shift length or half-shift length of time.
Generally speaking, heavy use mobile equipment such as trucks and LHDs have a functional
charge life between four and six hours, whereas low use equipment, such as utility vehicles
or drills, which generally run on connected electric power aside from transport from one area
to another, have a functional charge length of a full shift. A series of charging bays will be
situated next to the underground shop that will support the heavy underground equipment
that does not periodically return to surface, i.e. haul trucks, LHDs, drills and bolters. Service
equipment, which includes, the grader, explosives trucks, mechanics trucks, light vehicles
and shotcrete haulers and sprayers will utilize battery charge stations on surface.

Document Number
Revision
Page
Rev Date
G4932-RPT-01 0 08 Jan 2021 233
Talon Metals Corp. – Preliminary Economic Assessment #3 on the Tamarack North Project
Emergency Egress
The primary egress from the mine will be through the main decline to surface. A secondary
egress system was designed by FKL. It will be a dedicated electric hoisting system located
in the vent shaft and comprise a 4-person cage suspended by a small headframe on surface.
The cage will be guided on rope guides in the vent shaft and only be used in an emergency
and for periodic shaft inspections.
Figure 16-18: 4-Person Emergency Egress Hoist
Emergency interlevel egress will be via internal raises equipped with a pre-fabricated
ladderway system. A ladder system (Laddertube) was designed for Talon by Safescape.
This was selected because they are economical and can be installed quickly with minimal
effort.

Document Number
Revision
Page
Rev Date
G4932-RPT-01 0 08 Jan 2021 234
Talon Metals Corp. – Preliminary Economic Assessment #3 on the Tamarack North Project
Figure 16-19: Inter-Level Escapeway
Mobile Equipment
16.12.7.1 Battery/Electric vs Diesel Powered Equipment
The equipment original equipment manufacturers (OEMs) are currently investing
significantly into the development battery powered equipment to eventually eliminate diesel
from underground operations. Talon Metals has a bold goal of becoming one of the most
environmentally friendly underground mines constructed. Given recent advancements in
battery technology, it is expected that battery powered equipment will be standard by the
time the Tamarack North mine is in production. For that reason, a full fleet of battery/electric
mobile equipment is assumed for this study. Fully mobile equipment, such as loaders or haul
trucks will be battery powered, where stationary equipment, including drills or the road
header will be tethered during operations, but driven on battery-powered drives that are used
during transport.
16.12.7.2 Lateral Development Equipment
The Sandvik MH621 roadheader was selected as the basis for this study because it currently
has the best proven track record for underground hard rock applications and a more
complete set of operational data could be provided to support this study. It should be noted
that the MH621 replaces the need for a jumbo and LHD during typical operations.
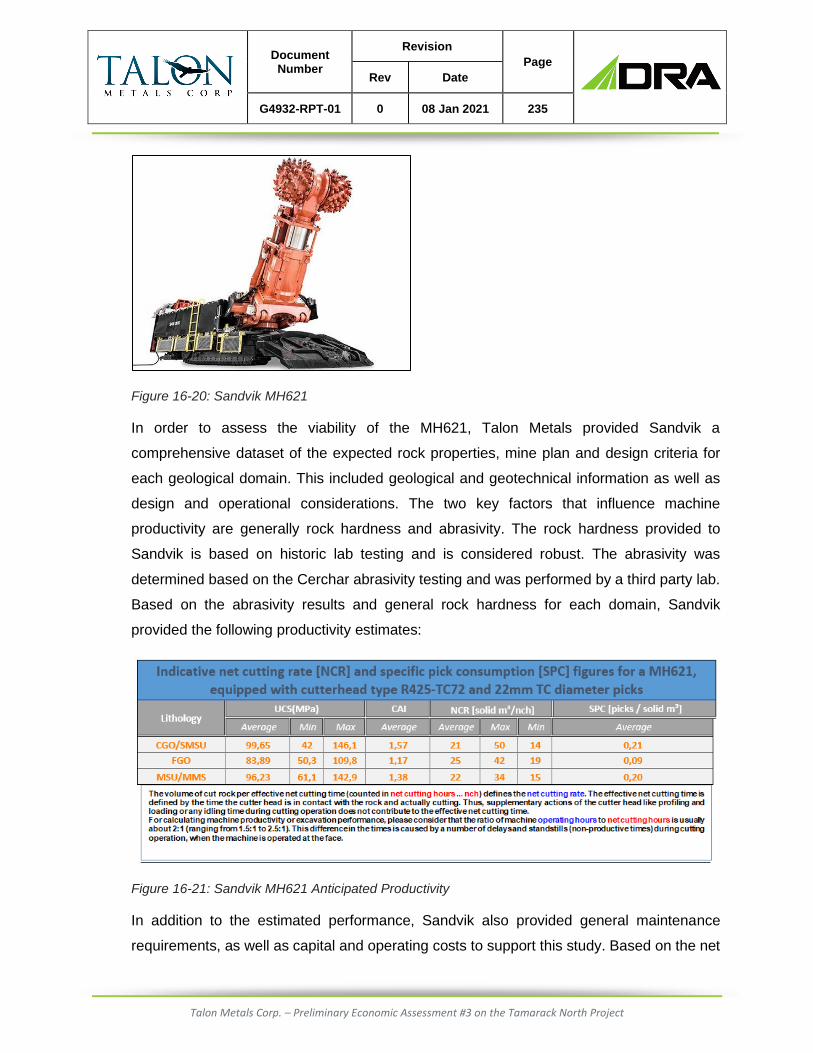
Document Number
Revision
Page
Rev Date
G4932-RPT-01 0 08 Jan 2021 235
Talon Metals Corp. – Preliminary Economic Assessment #3 on the Tamarack North Project
Figure 16-20: Sandvik MH621
In order to assess the viability of the MH621, Talon Metals provided Sandvik a
comprehensive dataset of the expected rock properties, mine plan and design criteria for
each geological domain. This included geological and geotechnical information as well as
design and operational considerations. The two key factors that influence machine
productivity are generally rock hardness and abrasivity. The rock hardness provided to
Sandvik is based on historic lab testing and is considered robust. The abrasivity was
determined based on the Cerchar abrasivity testing and was performed by a third party lab.
Based on the abrasivity results and general rock hardness for each domain, Sandvik
provided the following productivity estimates:
Figure 16-21: Sandvik MH621 Anticipated Productivity
In addition to the estimated performance, Sandvik also provided general maintenance
requirements, as well as capital and operating costs to support this study. Based on the net

Document Number
Revision
Page
Rev Date
G4932-RPT-01 0 08 Jan 2021 236
Talon Metals Corp. – Preliminary Economic Assessment #3 on the Tamarack North Project
cutting rate determined by Sandvik, the estimated advance rates in the decline will be 1.7
times faster than that of face drilling with a jumbo. It should be noted that, past experience
has shown that the road header will periodically encounter ground or situations that are not
best suited for normal operations. In this case, Sandvik recommended retaining a jumbo and
LHD to deal with challenging ground. It is assumed that 10% of total lateral development will
therefore be driven with a jumbo using drill/blast cycles; this has been factored into the
development costs and advance rates.
16.12.7.3 Equipment Fleet
The following table includes the full LOM equipment fleet requirement.
Table 16-16: Mining Equipment Fleet
Equipment Size/Use Y1 Y2 Y3 Y4 Y5 Y6 Y7 Y8 Y9 Y10 Y11
Lateral Development
Road Header Sandvik MH621 1 1 2 2 2 2 2 2 2 1 1
Boom Jumbo 2 Boom 1 1 1 1 1 1 1 1 1 1 1
LHD 17.5 t 1 1 1 1 1 1 1 1 1 1 1
Haul Truck 50 t 1 1 1 1 1 1 1 1 1 1 1
Rock Bolter Ground Support 1 2 3 3 3 3 3 2 2 2 2
Scissor Lift 5 m reach 1 2 3 3 3 3 3 3 3 2 2
Shotcrete Sprayer Ground support 1 2 2 2 2 2 2 2 2 2 2
Shotcrete/Concrete Hauler
5 m3 Capacity 1 2 2 2 2 2 2 2 2 2 2
Anfo Loader Development 1 1 1 1 1 1 1 1 1 1 1
Production
Long-Hole Drill Production 0 0 1 3 3 3 3 3 3 3 3
LHD 17.5 t 0 0 1 4 4 4 4 4 4 4 4
Haul Truck 50 t 0 0 0 1 1 1 1 1 1 1 1
Anfo Loader Production 0 1 3 3 3 3 3 3 3 3 3
General Services
Road Grader Road maintenance 1 1 1 1 1 1 1 1 1 1 1
Maintenance Truck Flatbed w/crane 0 1 2 2 2 2 2 2 2 2 2
Boom Truck Supplies delivery 0 1 2 2 2 2 2 2 2 2 2
Personnel Carriers 16 person 0 0 2 4 4 4 4 4 4 4 4
Supervisor Vehicle Supervision 2 4 6 6 6 6 6 6 6 6 6

Document Number
Revision
Page
Rev Date
G4932-RPT-01 0 08 Jan 2021 237
Talon Metals Corp. – Preliminary Economic Assessment #3 on the Tamarack North Project
Staffing Requirements
Mine staffing includes both company employees and contract workers. Mine staffing is
exclusive of labour that is specified for the surface operations, including the concentrator,
hydromet plant, CFTF, and general administration. It is assumed that company employees
will include:
• Administrative staff and safety;
• Engineering;
• Geology;
• Maintenance management.
Contract employees will include both engineering, procurement, and construction
management (EPCM) and operational staff, including:
• EPCM leadership team;
• Contract supervision;
• Shift miners;
• Hourly maintenance employees.
The total number of company employees is estimated and based on past experience for
similar operations. During steady-state mining, an average of 34 company employees will
be required to support the underground operations.
Contract mining staffing is based on the following assumptions:
• EPCM and supervision are based on past experience for similar operations;
• Mining staff are based on one miner per piece of mobile equipment, three crews;
• Mobile equipment mechanics are based on one mechanic per the sum of unavailable
equipment, i.e. if five pieces of equipment each have an availability of 80%, it is
assumed that one mechanic would be required to service those five pieces of equipment
(i.e. 5 X (1-0.8) = 1). A total of seven mechanics is therefore required per shift, or 21
total mechanics during steady-state mining.
A total of 121 contract miners are required for steady-state mining.
The total staffing requirements of approximately 300 people will therefore be required to
support the underground operations during steady-state mining.

Document Number
Revision
Page
Rev Date
G4932-RPT-01 0 08 Jan 2021 238
Talon Metals Corp. – Preliminary Economic Assessment #3 on the Tamarack North Project
Figure 16-22: Mine Staffing Requirements

Document Number
Revision
Page
Rev Date
G4932-RPT-01 0 08 Jan 2021 239
Talon Metals Corp. – Preliminary Economic Assessment #3 on the Tamarack North Project
RECOVERY METHODS
This section describes the process design basis for the generation of the circuit mass and
water balance, the metallurgical plant process design criteria, and the selection and sizing
of the major processing equipment required to process the Tamarack mineralized material
under the mine production schedule outlined in Section 16.
Three different processing routes are being considered at this stage, as follows:
• Ni Concentrate Scenario: This scenario represents a conventional processing
approach for the Tamarack mineralization comprising a concentrator that produces Cu
and Ni concentrates, which will be both shipped to smelters for further processing.
• Ni Sulphate Scenario: This scenario includes a hydrometallurgical plant to transform
the Ni concentrate into a value-add product. In this scenario, only the Cu concentrate will
be shipped to a smelter for further processing.
• Ni Powder Scenario: This scenario includes Ni concentrates produced from the project
are used to produce refined Ni powder for the EV market. The Cu concentrate will be
shipped to a smelter for further processing.
The flotation process design for all processing routes comprise bulk rougher flotation
followed by cleaning of the bulk rougher concentrate. The upgraded rougher concentrate is
subjected to Cu/Ni separation. The process generates separate Cu and Ni concentrates.
Further, the bulk rougher tailings are treated in a desulphurization stage to produce a low-
mass, high-sulphur tailings stream and a high-mass, low-sulphur tailings product. In the
case of the Ni Concentrate and Ni Powder Scenarios, the Ni concentrate represents the final
output of the Tamarack metallurgical facility.
The Ni Sulphate Scenario treats the Ni concentrate in a POX autoclave followed by two
stages of neutralization, Cu removal, Ni and Co SX, and Mg precipitation. The extract
(loaded organic) is scrubbed and stripped and then subjected to Co SX. The Ni is
precipitated as Ni (II) sulphate hexahydrate in a crystallizer and the Co is precipitated with
sodium hydrosulphide as Co sulphide.
The concentrator is identical for the three scenarios.

Document Number
Revision
Page
Rev Date
G4932-RPT-01 0 08 Jan 2021 240
Talon Metals Corp. – Preliminary Economic Assessment #3 on the Tamarack North Project
17.1 Key Process Design Criteria – Concentrator
To maximize the NPV of the project, the mine plan was developed to extract higher grade
mineralized material in the early stage and then process the lower grade material towards
the end of the mine life. This approach necessitates a different sizing approach for the
concentrator to avoid equipment limitations due to more metal units in the mill feed during
the early mine life and harder mineralized material towards the end of the mine life.
The process design criteria were generated based on an average daily mill feed rate of
3,600 tpd and a maximum annual head grade of 2.40% Ni and 1.08% Cu. The results of the
metallurgical test program described in Section 13 were used to generate a circuit mass
balance for the Tamarack flowsheet, which is presented in Table 17-1. The higher-than-
average Cu and Ni head grades resulted in slightly larger equipment in the cleaning and
concentrate dewatering circuits.

Document Number
Revision
Page
Rev Date
G4932-RPT-01 0 08 Jan 2021 241
Talon Metals Corp. – Preliminary Economic Assessment #3 on the Tamarack North Project
Table 17-1: Flotation Circuit Mass Balance for High-grade Mill Feed
The process design criteria were developed from a range of different sources, which are
outlined below:
A – Talon Metals
B – Metpro recommendation
C – Metpro calculation
D – DRA Input
E – Metallurgical testing
F – Standard industry practise
G – Vendor recommendation
Cu Ni S Cu Ni S
Bulk Rougher Feed 100.0 1.08 2.40 9.00 100.0 100.0 100.0
Bulk Rougher Conc 33.6 3.00 6.46 22.9 93.1 90.3 85.2
Bulk Rougher Tails 66.4 0.11 0.35 2.00 6.9 9.7 14.8
Mags 8.5 0.20 0.59 10.6 1.6 2.1 10.0
High Sulphur Thickener UF 20.7 0.25 0.75 10.2 4.8 6.4 23.5
Non-Mags 58.0 0.10 0.31 0.75 5.3 7.6 4.8
Low S Thickener Underflow 58.0 0.10 0.31 0.75 5.3 7.6 4.8
Low-Sulphur Tailings Filter Cake 58.0 0.10 0.31 0.75 5.3 7.6 4.8
Regrind Ball Mill Discharge 20.7 0.79 2.09 18.5 15.2 18.0 42.6
Bulk Cleaner 1 Conc 26.5 3.89 8.41 28.6 95.5 92.8 84.3
Bulk Cleaner 1 Tails 27.8 0.50 1.34 14.1 12.7 15.5 43.5
Bulk Cleaner Scav Conc 15.6 0.66 1.73 17.3 9.6 11.2 29.9
Bulk Cleaner Scav Tails 12.2 0.28 0.85 10.0 3.2 4.3 13.6
Bulk Cleaner 2 Conc 21.3 4.55 9.67 30.2 89.9 86.0 71.7
Bulk Cleaner 2 Tails 5.2 1.18 3.18 22.1 5.6 6.8 12.7
Cu-Ni Sep Regrind Mill Discharge 21.3 4.55 9.67 30.2 89.9 86.0 71.7
Cu Rougher Conc 4.1 20.7 3.82 31.3 79.4 6.6 14.4
Ni Concentrate 18.8 1.21 10.8 29.9 21.0 84.6 62.4
Cu Cleaner Conc 3.2 26.2 2.04 31.9 78.2 2.7 11.4
Cu Cleaner Tails 1.6 7.30 8.02 29.4 10.6 5.2 5.1
Cu Reclnr Conc (Cu Conc) 2.6 28.9 1.28 32.5 68.9 1.4 9.3
Cu Reclnr Tails 0.7 15.4 5.01 29.3 9.3 1.4 2.1
Cu Conc Thickener UF 2.6 29.0 1.28 32.5 69.2 1.4 9.3
Cu Conc Filter Cake 2.6 29.0 1.28 32.5 69.2 1.4 9.3
Ni Conc Thickener UF 18.8 1.21 10.8 29.9 21.0 84.6 62.4
Ni Conc Filter Cake 18.8 1.21 10.8 29.9 21.0 84.6 62.4
Stream Mass Rec %
Assay (%) Recovery (%)

Document Number
Revision
Page
Rev Date
G4932-RPT-01 0 08 Jan 2021 242
Talon Metals Corp. – Preliminary Economic Assessment #3 on the Tamarack North Project
The mineralized mill feed material characteristics and the expected metallurgical
performance over the life of mine are presented in Table 17-2.
Table 17-2: Plant Feed Characteristics and Metallurgical Performance
Criteria Units Value Source
Expected Range Design
Solids SG t/m3 2.60 – 3.75 2.90 D
ROM Bulk Density t/m3 1.60 – 2.00 1.80 B
LOM Mill Ni Head Grade Ni 0.52 – 6.03 1.34 D
LOM Mill Cu Head Grade Cu 0.24 – 2.41 0.74 D
Mill Treatment Capacity ktpa 1,314 C/D
Ni Recovery to Ni Concentrate % 81.5 E/C
Ni Concentrate Grade % Ni 10.2 E/C
Ni Concentrate Production ktpa 141.9 E/C
Overall Cu Recovery % 84.7 E/C
Cu Recovery to Cu Concentrate % 69.3 E/C
Cu Concentrate Grade % Cu 28.5 E/C
Cu Concentrate Production ktpa 23.7 E/C
The operating schedule of the processing plant is detailed in Table 17-3.
Table 17-3: Plant Design Operating Schedule
Criteria Units Value Source
Expected / Average Design
ROM Material Delivered to Mill ktpa 1,314
C/D
Crusher Plant Operating Schedule
Days per Week days 7 B
Shifts per Day shifts 3 B
Hours per Shift h 8 B
Utilization % 70 B
Operator Hours per Day h 24 B
Operating Hours per Annum h 6,132 B
Crusher Circuit Throughput tph 214.3 267.9 B

Document Number
Revision
Page
Rev Date
G4932-RPT-01 0 08 Jan 2021 243
Talon Metals Corp. – Preliminary Economic Assessment #3 on the Tamarack North Project
Criteria Units Value Source
Expected / Average Design
Milling and Flotation Operating Schedule
Days per Annum days 365 B
Hours per Day h 24 B
Utilization % 92 B
Operating Hours per Annum h 8,059 B
Average Mill Feed Rate tph 163.0 195.6 C
17.2 Process Block Flow Diagram – Concentrator
The simplified process flowsheet for the crushing and grinding circuit, the flotation circuit,
and the dewatering circuit is presented in Figure 17-1.
The crushing circuit comprises primary jaw crushing, secondary cone crushing, and ball mill
grinding. The grinding circuit product is subjected to bulk rougher flotation, followed by
cleaning of the bulk rougher concentrate and a Cu/Ni separation circuit to produce Cu and
Ni concentrates. The concentrates will be thickened and filtered separately and shipped to
different smelters via rail. The desulphurization flotation stage comprising a magnetic
separator will recover most remaining sulphides into a HS tailings stream for use as paste
backfill.
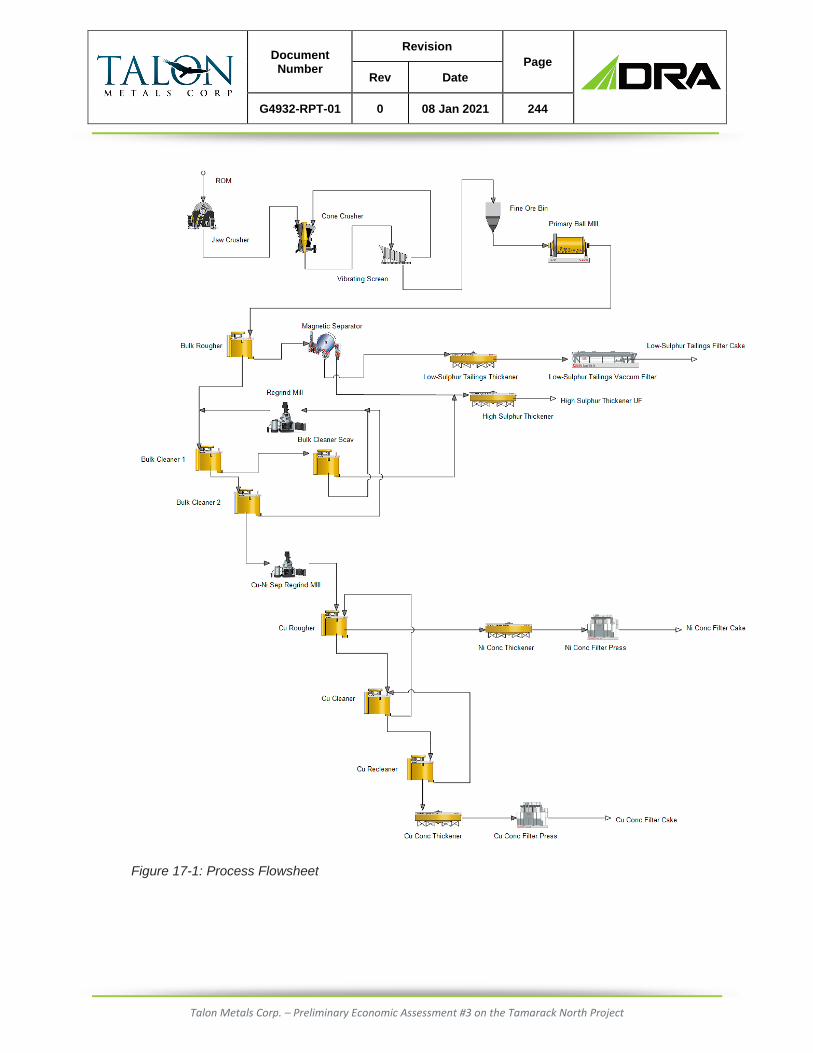
Document Number
Revision
Page
Rev Date
G4932-RPT-01 0 08 Jan 2021 244
Talon Metals Corp. – Preliminary Economic Assessment #3 on the Tamarack North Project
Figure 17-1: Process Flowsheet

Document Number
Revision
Page
Rev Date
G4932-RPT-01 0 08 Jan 2021 245
Talon Metals Corp. – Preliminary Economic Assessment #3 on the Tamarack North Project
17.3 Process Description – Concentrator
Crushing and Primary Grinding
Mineralized ROM material that was crushed underground is delivered to a ROM bin feeding
the crushing and screening section of the plant. The ROM material with an F100 of 153 mm
is reduced to a product size P80 of 17 mm in the two stages of crushing. The crushing circuit
comprises a jaw crusher that is operated in open circuit followed by a cone crusher that is
operated in closed circuit with a vibrating screen. The two-stage crushing circuit operates at
approximately 70% utilization and a design factor of 25%, equating to a feed capacity of
approximately 267.9 tph.
The cone crusher product is transferred to two fine ore bins with a combined capacity of
3,000 m3 to decouple the crushing and grinding circuits due to the lower mechanical
availability of the crushing circuit. The mineralized material is transferred from the fine ore
bins to a 5.7 m x 8.7 m EGL ball mill that is operated in closed circuit with classifying
hydrocyclones to generate a flotation circuit feed with a P80 of 100 µm.
Bulk Rougher and Magnetic Separation
The ball mill cyclone overflow gravitates to the bulk rougher flotation cells at a mass flow
rate of 163.0 tph. The sulphide collectors SIPX and PAX and frother MIBC are added to the
flotation feed box to recover the Cu and Ni values in the mineralized material. Bulk rougher
flotation is carried out in tank cells with a volume of 4 x 160 m3, corresponding to a retention
time of approximately 72 minutes that is instrumental in achieving maximum metal
recoveries. The pH of the slurry is lowered to 7.0 in the last tank cell using sulphuric acid
(H2SO4) to maximize metal recovery. The bulk rougher concentrate is transferred to the bulk
rougher cleaning circuit.
The bulk rougher tailings gravitate to a magnetic separator to further reduce the sulphide
content in the bulk rougher flotation tailings. The slurry is treated in a low-intensity magnetic
field strength of 0.115T. The non-mags represent the LS tailings stream and the magnetic
fraction is combined with the bulk cleaner 1 scavenger tailings to form the high-sulphur
tailings product.

Document Number
Revision
Page
Rev Date
G4932-RPT-01 0 08 Jan 2021 246
Talon Metals Corp. – Preliminary Economic Assessment #3 on the Tamarack North Project
Bulk Cleaner
The bulk rougher concentrate is transferred to the bulk cleaner 1 flotation stage, which
comprises 3 x 50 m3 tank cells. The combined retention time in the bulk cleaner 1 flotation
cells is 14 minutes. A small dosage of Depramin C is added to the pump feed box to assist
with the depression of non-sulphide gangue minerals.
The bulk cleaner 1 concentrate is subjected to one additional stage of cleaner flotation to
further reduce the amount of gangue minerals reporting to the Cu/Ni separation circuit. The
bulk cleaner 2 stage comprises 3 x 30 m3 tank cells with a combined retention time of 12
minutes. The bulk cleaner 2 concentrate presents the Cu/Ni separation feed.
The bulk cleaner 1 flotation tailings gravitate towards the bulk cleaner 1 scavenger flotation
cells to recover slow floating particles and middlings of sulphides and gangue minerals. The
3 x 50 m3 tank cells correspond to a retention time of 24 minutes. The bulk cleaner 1
scavenger tailings are combined with the magnetic fraction of the magnetic separation stage
before being subjected to dewatering.
The combined bulk cleaner 1 scavenger concentrate and the bulk cleaner 2 tailings are
dewatered in a cyclone, and the cyclone underflow gravitates to a regrind in a VTM-250-WB
Vertimill® to reduce the particle size from P80 = 100 µm to P80 = 60 µm. The purpose of the
regrind mill is to improve liberation of the sulphide minerals. The mill discharge is returned
to the hydrocyclone. The cyclone overflow is combined with the bulk rougher concentrate
prior to processing in the bulk cleaner 1 flotation stage. A small dosage of SIPX is added to
the bulk cleaner 1 feed box to promote the flotation of newly liberated sulphide minerals.
Cu/Ni Separation
The bulk cleaner 2 concentrate is directed to the feed pump box of the Cu/Ni separation
regrind mill cyclone. The regrind mill is operated in closed-circuit to reduce the P80 in the
bulk cleaner 2 concentrate from 60 µm to 25 µm prior to Cu/Ni separation. Regrinding is
performed in a VTM-400-WB Vertimill® with steel grinding media.
The regrind mill cyclone overflow gravitates to the feed box of the Cu/Ni separation flotation
cells. Lime is added to the feed box of the flotation cell to maintain a pH of 12.0 to promote
the separation of Cu and Ni minerals. No further reagents are added at this stage. The
separation is carried out in 2 x 30 m3 tank cells with a combined retention time of 12 minutes.

Document Number
Revision
Page
Rev Date
G4932-RPT-01 0 08 Jan 2021 247
Talon Metals Corp. – Preliminary Economic Assessment #3 on the Tamarack North Project
The Cu/Ni separation tailings represent the Ni concentrate, which is pumped to the Ni
concentrate thickener.
The Cu/Ni separation concentrate still contains significant quantities of Ni and is treated in
two additional cleaning stages to minimize the recovery of Ni into the Cu concentrate, given
that no credit will be received for any Ni units in the Cu concentrate.
The Cu/Ni separation concentrate is transferred to the Cu cleaner flotation stage with 2 x 5
m3 tank cells and a retention time of 10 minutes. The Cu cleaner tailings are transferred back
to the Cu/Ni separation feed and the Cu cleaner concentrate is pumped to the Cu recleaner
stage, which consists of 2 x 5 m3 tank cells and a retention time of 10 minutes. The pH is
controlled at 12.0 in both cleaning stages, and only MIBC is added to promote Cu flotation.
Ni and Cu Concentrate Thickening
The plant sizing was performed for a peak daily Ni and Cu concentrate production levels of
675 tpd and 93 tpd, respectively, are anticipated at a mill feed rate of 3,600 tpd. The
concentrate production will decrease from those values depending on the stage of mine
development and actual mill feed rates and grades. Both thickeners have been designed for
the peak expected production demand, plus a 20% design factor for concentrate tonnage.
The two concentrates are transferred to two high rate thickeners. The thickened slurry is
pumped to separate holding tanks. The solution from the overflow of the two thickeners is
returned to the plant process water tank.
Ni and Cu Concentrate Filtration
The thickened Ni and Cu concentrate slurries are pumped from their stock tanks to pressure
filters. The dewatered filter cakes are stockpiled. The concentrates are reclaimed from the
stockpiles using a front-end loader, transferred into rail cars, and shipped to Ni and Cu
smelters for further processing in the case of the Ni Concentrate Scenario. In the other two
scenarios, the Ni concentrate filter cake will be reclaimed and processed in the co-located
facilities. Filtrates from the pressure filters are pumped to the concentrate thickeners.

Document Number
Revision
Page
Rev Date
G4932-RPT-01 0 08 Jan 2021 248
Talon Metals Corp. – Preliminary Economic Assessment #3 on the Tamarack North Project
Tailings Thickening
Daily average LS and HS tailings production levels of 2,561 tpd and 587 tpd, respectively,
are anticipated at a feed rate of 3,600 tpd. The actual production will fluctuate from those
values depending on the stage of mine development and actual mill feed rates and grades.
The two tailings streams are transferred to two high rate thickeners. Both thickeners have
been sized for the maximum annual production demand plus a 20% design factor for
throughput. The thickened slurries are pumped to separate holding tanks. The overflow
solution of the two thickeners is returned to the plant process water tank.
Tailings Filtration
The results of the hydraulic model, conducted by Paterson & Cooke in Sudbury, predict that
sufficient head is available such that a paste mixture with 79.5% w/w can be distributed to
all of the underground areas. HS tailings generated will be used in the paste backfill recipe.
LS tailings will be primarily used in the paste backfill recipe blended with HS tailings to fill all
the required voids. The balance of the LS tailings filter cake will be placed into a CFTF.
17.4 Energy, Water, and Process Materials Consumption - Concentrator
Energy
The total plant energy requirements from the major mechanical equipment list was
established at 8,153 kW. Pumps and plant services were factored at 20% for a total
connected power of 9,784 kW. The operational power draw is projected to be 85% of
connected power or 8,316 kW. Power will be supplied by the electrical grid.
Water
The total water requirements of the grinding and flotation circuit are estimated at 543.0 m3/h.
This water requirement includes water addition in the grinding circuit, dilution water, and
launder water. The mineralized material is assumed to contain a moisture content of at least
3% or 5.0 m3/h.
All process water that is recovered in the dewatering circuits of the two concentrates and
two tailings streams are returned to the process water tank. The water in the concentrate
and tailings streams amounts to 35.3 m3/h.

Document Number
Revision
Page
Rev Date
G4932-RPT-01 0 08 Jan 2021 249
Talon Metals Corp. – Preliminary Economic Assessment #3 on the Tamarack North Project
The total amount of reclaimed water is projected to be 426.0 m3/h. Hence, the freshwater
requirement to make up the water deficit is 117.0 m3/h, which includes an allowance of
35.0 m3/h of fresh water for gland water, potable water, reagent makeup, etc.
Process Consumables
Reagent types and dosages were established in the two metallurgical programs conducted
at XPS Sudbury and SGS Lakefield in 2019 and 2020.
The grinding media, liner, and lifter consumption were calculated based on an estimated
Bond abrasion index that corresponds to the 70th percentile of abrasiveness of more than
2,000 samples that were tested at SGS. This approach was taken since no Bond abrasion
index data is presently available for the Tamarack mineralization.
The reagent consumption and grinding media wear rates are presented in Table 17-4 and
Table 17-5 respectively.
Table 17-4: Reagent Consumption Rates
Reagent Consumption (g/t)
SIPX 215
PAX 230
MIBC 150
Carboxy methyl cellulose (CMC) 30
Lime 2,150
Flocculant 30
Table 17-5: Grinding Media Consumption
Application Consumption (kg/t
of mill feed)
Primary Ball Mill Balls 0.99
Bulk Rougher Concentrate Vertimill Media 0.31
Cu/Ni Separation Vertimill Media 0.57

Document Number
Revision
Page
Rev Date
G4932-RPT-01 0 08 Jan 2021 250
Talon Metals Corp. – Preliminary Economic Assessment #3 on the Tamarack North Project
17.5 Major Equipment List - Concentrator
A list of major mechanical equipment of the concentrator is provided in Table 17-6, which
served as the basis for the development of the capital cost estimate.
Table 17-6: Major Mechanical Equipment
Description Equipment
Primary Crusher Metso C120 jaw crusher
Secondary Crusher Metso HP6 cone crusher
Crusher Closed-Circuit Screen Inclined screen (31 m2 screening surface)
Fine Ore Bin 3,000 m3
Primary Ball Mill 5.7 m x 8.7 m ball mill (4,200 kW)
Bulk Rougher Flotation Cells 4 x 160 m3
Magnetic Separator LIMS (0.115 T)
Bulk Cleaner Regrind Mill Vertimill VTM-250-WB®
Bulk 1st Cleaner Flotation Cells 3 x 50 m3 Tank Cells
Bulk 1st Cleaner Scavenger Flotation Cells 3 x 50 m3 Tank Cells
Bulk 2nd Cleaner Flotation Cells 3 x 30 m3 Tank Cells
Cu/Ni Separation Circuit Regrind Mill Vertimill VTM-400-WB
Cu Rougher 2 x 30 m3 Tank Cells
Cu Cleaner 2 x 5 m3 Tank Cells
Cu Recleaner 2 x 5 m3 Tank Cells
Ni Concentrate Thickener 20 m diameter, high-rate
Ni Concentrate Filter Press Pressure Filter - 130 m2
Cu Concentrate Thickener 7 m diameter, high-rate
Cu Concentrate Filter Press Pressure Filter - 22 m2
HS Tailings Thickener 18 m diameter, high-rate
LS Tailings Thickener 36 m diameter, high-rate
LS Tailings Vacuum Filter 200 m2 Belt Filter
17.6 Key Process Design Criteria – Hydrometallurgical Plant for Ni Sulphate Production
The process design criteria were generated based on an average daily hydrometallurgical
plant feed rate of 475 tpd and an average Ni concentrate head grade of 10.2% Ni, 0.23%
Co, and 1.06% Cu. A hydrometallurgical test program provided the results for the leaching,

Document Number
Revision
Page
Rev Date
G4932-RPT-01 0 08 Jan 2021 251
Talon Metals Corp. – Preliminary Economic Assessment #3 on the Tamarack North Project
neutralization, and purity removal stages for this LOM Ni concentrate. The SX circuits and
the Mg precipitation circuit were designed using available engineering data of similar
projects.
The process design criteria were developed from a range of different sources, which are
outlined below:
A – Talon Metals
B – Metpro recommendation
C – Metpro calculation
D – DRA Input
E – Metallurgical testing
F – Standard industry practise
G – Vendor recommendation
The average LOM mineralized mill feed material characteristics and expected metallurgical
performance are presented in Table 17-7.
Table 17-7: Plant Feed Characteristics and Metallurgical Performance
Criteria Units Value Source
Expected Range
Design
Solids SG t/m3 4.00 – 4.40 4.19 D
Bulk Density t/m3 2.50 – 2.75 2.62 B
Ni Concentrate Grade % Ni 9.90 – 10.5 10.2 D
Cu Grade in Ni Concentrate % Cu 0.90 – 1.32 1.06 D
Ni Recovery to Ni Sulphates % 77.4 E/C
Ni Sulphate Production (as NiSO4*6H2O) ktpa 61.9 E/C
Co Recovery to Co Sulphides % 60.9 E/C
Co Sulphide Production ktpa 0.320 E/C
Cu Recovery Cu Conc, Sec Neut & CuS % 81.8 E/C
Cu Concentrate Grade % Cu 27.4 E/C
Cu Concentrate Production ktpa 29.0 E/C
The operating schedule of the processing plant is detailed in Table 17-8.

Document Number
Revision
Page
Rev Date
G4932-RPT-01 0 08 Jan 2021 252
Talon Metals Corp. – Preliminary Economic Assessment #3 on the Tamarack North Project
Table 17-8: Hydrometallurgical Plant Design Operating Schedule
Criteria Units Design Source
Ni Concentrate to POX Circuit ktpa 173.4 C/D
Days per Week days 7 B
Shifts per Day shifts 3 B
Hours per Shift h 8 B
Utilization % 85 B
Operator Hours per Day h 24 B
Operating Hours per Annum h 7,446 B
17.7 Process Block Flow Diagram – Hydrometallurgical Plant for Ni Sulphate Production
The simplified process flowsheet for the hydrometallurgical plant is presented in Figure 17-2.
The Ni concentrate is repulped and leached in an autoclave. The autoclave discharge is
treated in two stages of neutralization followed by Cu removal. Ni and Co are removed with
SX before the barren solution is treated to remove Mg. Ni and Co are separated by a second
SX circuit. Ni is crystallized as Ni sulphate hexahydrate and Co is precipitated as Co
sulphides.

Document Number
Revision
Page
Rev Date
G4932-RPT-01 0 08 Jan 2021 253
Talon Metals Corp. – Preliminary Economic Assessment #3 on the Tamarack North Project
Figure 17-2: Process Flowsheet – Hydrometallurgical Plant

Document Number
Revision
Page
Rev Date
G4932-RPT-01 0 08 Jan 2021 254
Talon Metals Corp. – Preliminary Economic Assessment #3 on the Tamarack North Project
17.8 Process Description – Hydrometallurgical Plant
Pressure Oxidation
The hydrometallurgical plant has been designed to operate at approximately 85% utilization
with an average feed rate of 19.8 tph of Ni concentrate. The Ni concentrate is repulped in a
4.5 m x 8.0 m (D x H) agitated tank at a solids concentration of 10% w/w. The slurry is heated
to approximately 70°C using direct steam from the autoclave discharge vent before being
pumped into the autoclave.
The 5 m x 23 m (D x L) autoclave operates at a temperature of 150°C with a maximum
allowable working pressure (MAWP) of 580 kPa (absolute). The purpose of the autoclave is
to oxidize the sulphides in the Ni concentrate to form soluble metal sulphides. The autoclave
retention time is 90 minutes, and it operates at a pH of 1.2. Chloride ions are added to the
autoclave as a catalyst at a concentration of 2 g/l of chlorides in the slurry.
The extraction rates of the POX leach for Ni, Co, and Cu are 99.5%, 99.4%, and 88.9%,
respectively.
The autoclave discharge is transferred to a flash vessel, which reduces the slurry to
atmospheric pressure. The steam that is generated in the flash vessel is recycled to pre-
heat the Ni concentrate slurry in the pre-pulp tank.
The leach residue consists mainly of goethite (~50%), hematite (~25%), and elemental
sulphur (~15%). Minor minerals include jarosite, talc, quartz, and diopside.
Primary, Secondary Neutralization, and Cu Removal
Besides the valuable elements (Ni, Co, and Cu), the leach residue contains impurities that
must be removed prior to downstream processing of the leach liquor. These impurities
include Fe (~413,000 mg/L), Al (~3,300 mg/L), Mn (~270mg/L), Cr (~210 mg/L), and Zn
(~190 mg/L).
Most impurities are removed by raising the pH of the leach liquor using calcium carbonate
(CaCO3) (limestone). Initial neutralization tests aimed to achieve the impurity removal in a
single stage, but co-precipitation of Cu was high and resulted in Cu losses of over 90%.
Hence, impurity removal is performed in two stages with a target pH of 3.25 in the first stage
and a target pH of 4.75 in the second stage.

Document Number
Revision
Page
Rev Date
G4932-RPT-01 0 08 Jan 2021 255
Talon Metals Corp. – Preliminary Economic Assessment #3 on the Tamarack North Project
Limestone is added to the autoclave discharge in the first of two agitated tanks (4.5 m D x
8.0 m H). The discharge of the first tank gravitates to the second agitated tank and then
discharges into an 8 m diameter high-rate thickener. The thickener overflow is directed to
the secondary neutralization stage and the thickener underflow is pumped onto a vacuum
belt filter with a combined filtration area of 90 m2. Three stages of washing are performed on
the belt filter and washing is performed in counter current mode.
Almost all Fe and chromite are precipitated in the first neutralization stage with very low Ni,
Co, and Cu losses of <0.1%, 0.2%, and 3.6% respectively.
The primary neutralization liquor is then treated in the secondary neutralization stage to
further lower Fe and Al concentrations to below the detection limit. The secondary
neutralization is performed in two 4.5 m D x 8.0 m H agitated tanks. Limestone is added to
the first tank only to prevent short-circuiting. Approximately 60% to 70% of the Cu is co-
precipitated.
The secondary neutralization slurry is transferred to a 11 m diameter high-rate thickener and
the thickener overflow is pumped to the to the Cu removal circuit. The thickener underflow
is transferred to a three-stage counter-current decantation (CCD) circuit consisting of three
2 m diameter thickeners. The underflow of the last thickener is combined with the Cu
concentrate prior to thickening.
The secondary neutralization thickener overflow is transferred into the first of two 4 m D x
7.0 m H agitated tanks for Cu removal. NaHS is added at approximately 240% stoichiometric
to precipitate any remaining Cu ions as Cu sulphide. The discharge of the second Cu
removal tank is treated in a 11 m diameter high rate thickener followed by a 3-stage CCD
circuit with 2 m diameter thickeners. The thickener underflow is combined with the Cu
concentrate and the thickener overflow is transferred to the SX circuit.
Ni and Cu SX
The Cu-free thickener overflow is subjected to the first stage of SX in a mixer and settler
using Versatic 10 as the extractant and Exxsol D80 as the diluent. The loaded organic is
pumped to the stripping stage in another mixer and settler, while the raffinate is transferred
to the Mg removal circuit. The striped organic is returned to the loading stage and the
pregnant aqueous phase containing Ni and Co is treated in the Co SX circuit.

Document Number
Revision
Page
Rev Date
G4932-RPT-01 0 08 Jan 2021 256
Talon Metals Corp. – Preliminary Economic Assessment #3 on the Tamarack North Project
The pregnant solution is processed in a mixer and settler using Cyanex 272 as the extractant
and Exxsol D80 as the diluent. Co is loaded onto Cyanex 272 while Ni remains in the
aqueous phase, which effectively separates Ni and Co. The loaded Cyanex 272 is stripped
in another mixer and settler to transfer Co into the aqueous phase for further treatment in
the Co sulphide recovery circuit. The raffinate of the Ni and Co separation SX stage is
transferred to the Ni sulphate recovery circuit.
Ni Sulphate Recovery Circuit
The aqueous phase after Co SX only contains Ni and trace amounts of other elements and
is treated in a crystallizer to precipitate the Ni as Ni sulphate hexahydrate particles. The
crystallizer discharge is thickened, and the thickener underflow is further dewatered in a
pressure filter. The filter cake is dried, and the dry Ni sulphate hexahydrate is bagged in one
tonne bulk bags.
Co Sulphide Recovery Circuit
The Co solution is treated with NaHS to precipitate the Co as a sulfide. The CoS is dewatered
in a thickener and filter press. The filter cake is dried and the product is bagged.
Mg Removal
The barren leach solution is subjected to a final precipitation stage to remove the 2.8 g/L of
Mg that remains in solution. The barren solution is pumped into the first of two 5.0 m D x
9.0 m H agitated tanks and the pH is raised to 9.0 using lime. The discharge of the second
tank is transferred to a 11 m diameter high-rate thickener and the thickener overflow is
returned to the front-end of the circuit to re-pulp Ni concentrate. The thickener underflow is
pumped onto a 90 m2 belt filter. The filtrate is returned to the thickener and the filter cake is
combined with the high-sulphur tailings stream.
17.9 Energy, Water, and Process Materials Consumption – Hydrometallurgical Plant
Energy
The total hydrometallurgical plant energy requirements were estimated at a total connected
power of 6,000 kW. The operational power draw is anticipated to be 85% of connected power
or 5,100 kW. Power will be supplied by the electrical grid.

Document Number
Revision
Page
Rev Date
G4932-RPT-01 0 08 Jan 2021 257
Talon Metals Corp. – Preliminary Economic Assessment #3 on the Tamarack North Project
Water
The total water requirements of the hydrometallurgical circuit are estimated at 30 m3/h or
1.67 m3/t of Ni concentrate.
The process water that is recovered in the dewatering circuit of the Mg precipitation stage is
circulated back to the process water tank at a rate of 208 m3/h.
Process Consumables
Reagent types and dosages were established in the 2020 hydrometallurgical program up to
the Cu precipitation stage. The balance of the reagent dosages was developed from similar
operations. The reagent dosages are presented in Table 17-9.
Table 17-9: Reagent Consumption Rates
Reagent Consumption (kg/t of Ni Concentrate)
Ferric Chloride 27.8
Oxygen 298
Limestone – Primary Neutralization 390
Limestone – Secondary Neutralization 10.0
NaHS 17.6
SX – Diluent 1.19
Extractant 0.12
Lime – Mg Precipitation 135
Flocculant 0.10
17.10 Major Equipment List – Hydrometallurgical Plant
A high-level list of major mechanical equipment is provided in Table 17-10, which served as
the basis for the development of the capital cost estimate. Detailed equipment specifications
were developed for the front end of the hydrometallurgical plant up to Cu sulphide
precipitation based on testwork results. All other equipment sizing was determined by
comparison of the proposed circuit with similar plants.

Document Number
Revision
Page
Rev Date
G4932-RPT-01 0 08 Jan 2021 258
Talon Metals Corp. – Preliminary Economic Assessment #3 on the Tamarack North Project
Table 17-10: Major Mechanical Equipment for Hydrometallurgical Plant
Description Specification – Hydrometallurgical Plant
Ni Concentrate Repulp Agitated tank
Leach Circuit Autoclave (brick lined)
Primary Neutralization Agitated tanks, belt filter with three stage wash
Secondary Neutralization Agitated tanks, four-stage CCD
Cu Removal Agitated tanks, four-stage CCD
SX – Ni and Co Mixer & settlers (loading, stripping)
SX – Co Mixer & settlers (loading, stripping)
Ni Sulphate Circuit Crystallizer, thickener, dryer, bagging system
Co Sulphide Circuit Agitated tanks, thickener, belt filter, dryer, bagging system
Mg Removal Agitated tanks, thickener

Document Number
Revision
Page
Rev Date
G4932-RPT-01 0 08 Jan 2021 259
Talon Metals Corp. – Preliminary Economic Assessment #3 on the Tamarack North Project
INFRASTRUCTURE
18.1 Introduction
The existing local transportation infrastructure is excellent. The site is accessible via an
existing road which connects to the Minnesota State highway network. The active BNSF
Railway passes by the town of Tamarack and connects to an extensive network of rail lines
throughout the US and Canada, including access to the Duluth port. The city of Duluth lies
on the westernmost point of Lake Superior, and provides worldwide shipping access via the
Great Lakes, St. Lawrence Seaway, and Atlantic Ocean shipping routes. For the benefit of
the Tamarack Project, Kennecott has secured surface rights adjacent to the BNSF railway
line to allow for the construction of a railroad siding near the project site, should this be
required.
18.2 Site Access and Power
For the purposes of this PEA study, it is assumed that the site will be accessible by a two-
lane road directly from paved County Highway 31.
A Great River Energy Transmission Line crosses the Tamarack North Project property. The
line connects through substations close to the nearby towns of Wright (10 km away) and
Cromwell (20 km away). A standby diesel generator will be used to supply emergency power
if utility power is interrupted.
A powerhouse industrial facility will be provided for the distribution of power and backup
power generation. The powerhouse will contain a step-down facility from the main
transmission line and a back up generator.
18.3 Site Layout Considerations and Concept
A conceptual site layout is presented in Figure 18-1.

Document Number
Revision
Page
Rev Date
G4932-RPT-01 0 08 Jan 2021 260
Talon Metals Corp. – Preliminary Economic Assessment #3 on the Tamarack North Project
Figure 18-1: Concept Project Site Layout

Document Number
Revision
Page
Rev Date
G4932-RPT-01 0 08 Jan 2021 261
Talon Metals Corp. – Preliminary Economic Assessment #3 on the Tamarack North Project
18.4 Buildings and Facilities
Surface Portal
The main decline portal will be a small box cut 12 m wide x 61 m long x 8.5 m deep. It will
serve as the primary entrance and egress from the mine and be situated in a location that
minimizes the traffic on the surface footprint.
Mine Vent Shaft Surface Infrastructure
A multi-purpose shaft will be constructed on the main surface footprint. The shaft will house
a vertical conveyor, in addition to emergency hoisting system and mine services such as
power and water. An emergency hoisting system and small headframe will be constructed
adjacent to the shaft collar. Additionally, the head discharge end of the vertical conveyor will
be constructed on surface that will deliver mineralized material to the surface stockpile.
Ore Storage
An allowance is made for the mineralized material stockpile that will be adjacent to the mill.
Mine and Mill Services Building
The mine and mill services building will be located to ensure optimal and safe movement of
personnel and equipment.
Comminution
The Jaw and Cone crushers as well as the ball mill will be constructed and operated in an
enclosed facility to reduce noise and contain dust while ensuring the safety of operating and
maintenance personnel, especially during summer lightning storms.
Concentrator
The concentrator building will house equipment for the recovery of Ni and Cu concentrates
and storage for these concentrates prior to shipping. A metallurgical laboratory will also be
contained within the concentrator building.
Hydromet (Hydrometallurgical) Plant
The hydromet building will house equipment for the production of a Ni sulphate product.

Document Number
Revision
Page
Rev Date
G4932-RPT-01 0 08 Jan 2021 262
Talon Metals Corp. – Preliminary Economic Assessment #3 on the Tamarack North Project
Paste Backfill Plant
The paste plant will be located adjacent to the mill. Paste fill will be pumped from the paste
plant to the to a BH to the E of the main footprint area.
Water Treatment Plant
The investigation of Water Treatment Plant alternatives is outside of the scope of this PEA.
Further work is therefore required to determine and study Water Treatment Plant options.
Temporary Development Rock Storage Area
An allowance is made for a Temporary Development Rock Storage Area, for the purpose of
containing waste rock until such time as the permanent CFTF (per Section 18.6) is
established. Further details of this facility will be developed in future project phases.
Vehicle Washing Bays
All vehicles leaving the main operations area will be washed before leaving. Underground
vehicles will be washed at the end of shift, upon return to surface or prior to scheduled
maintenance.
Mine Office, Warehouse and Workshops
The concentrator and mine are supported by administrative, supplies and maintenance
functions housed in the mine office, warehouses (to store supplies used in the mining
operation) and workshops (mechanical, electrical and instrumentation), including powder
and detonator magazines which are located remote from the rest of the surface
infrastructure. A parking area will be located near the warehouse and workshops.
Security Gatehouse
Site access and exit will be security controlled at all times.
18.5 Logistics
Raw materials and maintenance supplies will be shipped to the site by road. Ni and Cu
concentrates will be despatched to customers by road to the port of Duluth. The concentrates
will be shipped in specialized sealed containers designed to prevent loss of concentrate
product and any potential for concentrate dust evolution. The specialized 20 ft containers

Document Number
Revision
Page
Rev Date
G4932-RPT-01 0 08 Jan 2021 263
Talon Metals Corp. – Preliminary Economic Assessment #3 on the Tamarack North Project
will require minimal infrastructure to load at both the site and at the port or train loading
areas.
18.6 Co-disposed Filtered Tailings Facility (CFTF)
Talon commissioned the investigation of alternative options for the management and storage
of LS tailings at surface (DRA 2018):
• Slurry tailings pumped, and deposited in a lined Tailings Storage Facility (TSF);
• High density slurry or paste tailings pumped and deposited in a lined TSF;
• Cemented paste tailings pumped and deposited in a lined TSF;
• Filtered tailings transported to a lined TSF by conveyor or by haul truck.
After assessing the alternatives and the design drivers for the project the project team
determined that a CFTF was ideal for the project to optimize waste management footprints
and address geochemical uncertainties (DRA 2018).
The LS tailings will be filtered to remove sufficient water to produce a soil-like consistency
to allow LS tailings and development rock to be deposited together in the lined CFTF, as
described below. Any precipitation falling on the facility or moisture that is released from the
tailings will be collected in a lined ditch around the CFTF perimeter and directed to one of
two CFTF collection ponds. Any collected water will be recycled back to the processing plant
for re-use or treated by the Water Treatment Plant and recycled or discharged.
Co-disposal of filtered tailings and development rock offers significant environmental and
operating advantages over separate tailings and development rock storage facilities,
including:
• Reduced risk of failure as the facility is not required to store water;
• A major reduction in the waste facility footprint;
• Improved tailings stability and reduced dusting compared to a standalone filtered tailings
facility without co-disposal with development rock;
• A reduced project footprint creating less disturbed area and reducing initial earthworks
requirements;

Document Number
Revision
Page
Rev Date
G4932-RPT-01 0 08 Jan 2021 264
Talon Metals Corp. – Preliminary Economic Assessment #3 on the Tamarack North Project
• At closure, the CFTF will be covered with a composite closure cover system. This will
limit the amount of infiltration into the CFTF post closure, potentially reducing long-term
water treatment and post-closure care liabilities;
• A reduction in fresh water requirements.
The original tailings disposal alternatives evaluation and CFTF design concept were
conducted by Golder (DRA, 2018). The updated CFTF design and facility description was
provided by SLR Consulting. The following sections summarize its key criteria and features.
Mining and Processing
All three processing scenarios will produce 10.76 Mt of mined mineralized material (see
Section 16.8 for an annual production schedule). The mine will generate up to 1.58 Mt of
development rock. To date, static geochemical testing has been conducted on the various
development rock and mineralized material types at the Tamarack North Project. However,
no testing has been carried out on samples of tailings; this is planned for later stages of
study.
The development rock types consist of sediments, FGO and CGO (see Section 7.2.4 for
descriptions of FGO and CGO).
The preliminary geochemical results for the sediment and FGO development rock suggest
this material may be NAG, while the CGO was interpreted to be Potentially Acid Generating
(PAG). Since limited geochemical testing has been performed to date, a conservative
approach was used for this PEA and assumes that only the sediments and FGO rock types
will be NAG. No further geochemical information has been collected, so this PEA update
assumes that the ratio between NAG and PAG development rock is unchanged from the
previous March 2020 PEA at 69% PAG. Therefore, approximately 0.56 Mt of development
rock is classified as NAG while the remaining 1.25 Mt (all CGO) is classified as PAG.
The processing plant was designed to process up to 3,600 tpd (1.314 Mtpa) of mineralized
material. The processing plant will generate two separate concentrate streams, namely Ni
and Cu, and two tailings streams: HS tailings which comprise Po and other sulphides and
low LS tailings which comprise mainly silicates. Over the LOM, the hydrometallurgical
processes will generate a total of 11.18 Mt of tailings including residues from the primary

Document Number
Revision
Page
Rev Date
G4932-RPT-01 0 08 Jan 2021 265
Talon Metals Corp. – Preliminary Economic Assessment #3 on the Tamarack North Project
neutralization circuit and the MgO removal circuit process residue, of which 9.10 Mt will be
LS tailings and the remaining 2.08 Mt will be HS tailings as detailed in Table 18-1.
It is planned that approximately 56% of the total tailings (6.26 Mt) will be used for backfilling
underground stopes. This includes HS tailings and close to one-quarter of LS tailings. The
remaining 5.44 Mt of LS tailings are dewatered using a filtration plant to a solids content of
approximately 85% and trucked to the CFTF for co-disposal with development rock.
Tailings and Development Rock Production
The CFTF is designed to provide adequate storage capacity for the PAG development rock,
NAG development rock, and filtered LS tailings. The in-place dry densities of these waste
streams are required to estimate the storage volume requirements of the CFTF as presented
in Table 18-1. The specific and void ratio assumed for the various waste streams are based
on preliminary information available from Talon as well as SLR’s experience on similar
projects.
Table 18-1: Assumed Geotechnical Properties and Volumes of Waste Streams for Co-disposal
Material Streams Symbol
Assumed Porosity (n)
or Dry Density LOM Waste Totals
Void Ratio (e) t/m3 Mt Mm3
Development Waste Rock
NAG A n = 0.3 1.94 0.51 0.26
PAG B n = 0.3 2.02 1.13 0.56
PAG Voids C - - (0.19)
Total Milled Mineralized Material D - - 10.76
Tailings
LS E - - 6.99
HS F - - 1.60
Residue G - - 2.14
Tailings Paste Backfill H - - 4.85
Tailings to CFTF I =
E+F+G-H e = 0.73 1.58 5.88 3.72
Required CFTF Capacity (A+B+I) - (0.5 C) 4.45
Notes:
1. NAG/PAG waste rock fraction split assumed to be unchanged from Updated PEA (DRA 2020).
2. Portion of HS tailings to backfill is 92%. Tailings to the CFTF comprise 5.44 Mt LS, 0.13 Mt HS, and 0.32 Mt residues.

Document Number
Revision
Page
Rev Date
G4932-RPT-01 0 08 Jan 2021 266
Talon Metals Corp. – Preliminary Economic Assessment #3 on the Tamarack North Project
Based on the densities in Table 18-1, the volumes of NAG development rock, PAG
development rock, LS tailings that will be sent to the CFTF for the Ni Sulphate Scenario is
included in Table 18-1. The other two scenarios do not involve neutralization residues and
would result in a lower deposited volume in the CFTF. The NAG development rock will be
used to construct the perimeter wall of the CFTF whereas the PAG development rock will
be co-disposed with the filtered tailings within the CFTF. The full volume of NAG
development rock will be used for construction of the perimeter wall. It was conservatively
assumed that approximately 50% of the PAG development rock void space will be filled with
filtered tailings. That is, approximately 93,000 m3 of the filtered tailings will be filling the void
space of the PAG development rock which otherwise would have been filled with air and/or
water. The CFTF storage capacity is 4.45 Mm3. Flexibility for variations in design
assumptions can be provided by varying the height.
Geochemical Characterization of Development Rock
A preliminary geochemical characterization program was completed on various lithologies
in 2008 (Foth, 2008). Fourteen samples of rock core from six rock units were selected from
the available exploration drill core and submitted for static testing including: Acid Base
Accounting (ABA), NAG pH, Elemental Analysis, and Synthetic Precipitation Leaching
Procedure (SPLP). Of the fourteen samples, seven samples are considered representative
of development rock as further explained below. In addition to rock core testing one
desulfurized tailings sample was subjected to the same suite of geochemical testing.
Two samples of both sediment and FGO were submitted for analysis. Three CGO samples
were also analyzed; however, two of the CGO samples were re-classified as SMSU and
included in the mine plan. The third CGO sample with sulphur content of 0.21% is considered
representative of CGO development rock.
Review of the BH database shows that sulphide contents typically increase with proximity to
the mineralized material zone. This is consistent with the preliminary ABA results with LS
contents in units farthest from the mineralized material zone (SED and FGO) and increasing
sulphide contents within the units closest to the mineralized material zone (CGO
transitioning to SMSU).

Document Number
Revision
Page
Rev Date
G4932-RPT-01 0 08 Jan 2021 267
Talon Metals Corp. – Preliminary Economic Assessment #3 on the Tamarack North Project
Acid Potential (AP) of the sediment samples are 1.9 and 2.2 (t CaCO3/1000 t) while AP of
the FGO samples ranged from 9.4 to 12.5. AP was 6.6 for the CGO sample representative
of development rock and 62.8 for the CGO sample representative of CGO rock presently
included in the mine plan.
Neutralization Potential (NP) for the sediment samples were 42 and 28 (t CaCO3/1000 t) and
ranged from 68 to 338 for the FGO samples. NP was 64 for the CGO sample representative
of development rock and 253 for the CGO sample representative of CGO rock presently
included in the mine plan.
The ratio of neutralization potential to acid potential (NPR) is used to determine a sample’s
propensity to generate acid conditions as per guidelines presented in MEND (2009) and as
follows:
• NPR value less than 1 is an indication of PAG;
• NPR value between 1 and 2 indicates an uncertain potential; and
• NPR value above 2 indicates NAG.
NPR values for the sediment samples were 22.4 and 12.8. NPR values ranged from 7.25 to
34.89 for the FGO samples. NPR was 9.75 for the CGO sample representative of
development rock and 4.03 for the CGO sample representative of CGO material presently
included in the mine plan.
Based on the ABA results to date, the FGO, sediment and CGO samples representative of
development rock are considered NAG. Nonetheless, pending further testing, this PEA
assumes that all CGO development rock will be classified as PAG and consequently will not
be used in the perimeter wall, but will be stored inside the CFTF.
Elemental (whole rock) analysis results were presented by Foth (2008); however, a detailed
assessment was not completed. A review of the data in comparison to average crustal
abundances presented by Price (1997) shows that some elements in the FGO and CGO
had concentrations higher than the average crustal abundance, including: Co, Cu, Ni and
Zn. It should be noted, however, that higher concentrations in the solid phase do not
necessarily identify elements that will be released at elevated concentrations when the
material comes in contact with water.

Document Number
Revision
Page
Rev Date
G4932-RPT-01 0 08 Jan 2021 268
Talon Metals Corp. – Preliminary Economic Assessment #3 on the Tamarack North Project
SPLP analysis was performed on all rock core samples. SPLP is designed to determine the
potential mobility of both organic and inorganic analytes present in liquids, soils, and wastes.
The concentrations of most metals in the leachate solutions were close to or below limits of
detection.
The tailings sample was found to have an NPR of 4.34 and a total sulphur concentration of
0.93%. Further geochemical testing is needed but the tailings are generally assumed to be
NAG or mildly PAG.
The current geochemical characterization is considered sufficient for the purpose of the PEA
considering the amount of development rock anticipated over the LOM. Additional
geochemical characterization is required as the Tamarack North Project progresses into
future phases, and should be completed in accordance with regulatory requirements and
accepted best practice guidelines. The ongoing characterization will be based on the
updated mine plan for the Tamarack North Project with sampling representative of the
anticipated tonnages of development rock, mineralized material, and tailings and will include
additional static testing as well as long-term kinetic testing to further understand the acid
rock drainage (ARD)/ metal leaching (ML) potential. The ARD/ML potential inferred from the
results of geochemical characterization will be used to identify rock units that may require
special handling or treatment, in order to develop mine development management and
mitigation strategies that minimize the Tamarack North Project’s effect on the receiving
environment during construction, operations, closure and into post-closure. A key operating
criterion for CFTF operations will be the time to onset of acid production (or “fuse-time”) of
the PAG rock.
CFTF Conceptual Design and Design Criteria
The CFTF general arrangement plan is shown in Figure 18-2. The CFTF will be rectangular
and will cover a footprint area of approximately 75 acres (303,300 m2 or 3.26 million ft2) with
a height of 25 m (82 ft) for the Ni Sulphate Scenario and lower for the other two scenarios.
Key CFTF components include:
• Base Grade – 0.5% slope from the middle of the facility N and S towards the collection
ponds, to collect runoff water and seepage;
• Base Liner System – composite liner as explained in Section 18.6.5 below;

Document Number
Revision
Page
Rev Date
G4932-RPT-01 0 08 Jan 2021 269
Talon Metals Corp. – Preliminary Economic Assessment #3 on the Tamarack North Project
• Perimeter Containment – to protect the interior of the CFTF, and will provide stability,
erosion protection, and dust control – refer Section 18.6.6 below;
• Perimeter Berm and Ditch – at the CFTF perimeter, about 3 m from the toe of the first
perimeter wall lift. The berm will be 1 m high, and will be used for anchoring the base
liner system and for creating a perimeter ditch – refer to Section 18.6.7 below;
• CFTF Collection Ponds – at fixed locations to collect underdrainage and surface runoff
for environmental protection;
• Access Ramp – at the NW corner of the facility, to access the surface of the co-disposal
area. The ramp will be 15 m wide and have a 10% slope. Refer to Section 18.6.8 below;
• Co-Disposal Area – Filtered tailings from the processing plant trucked to co-disposal
area, placed in thin lifts and compacted. The tailings will be co-disposed with adjacent
layers of development rock or co-mingled as dictated by the geochemical drivers – refer
to Section 18.6.9 below.
The CFTF development can be staged into two parts to reduce runoff volumes collected and
to defer capital cost. The N or the S half can be developed first with its accompanying base
grading, liner, perimeter ditch and berms, and stormwater management pond. Construction
of the CFTF up to its design height within one half of the facility is expected to be adequate
for approximately the first four years of tailings production. Staging of the CFTF in this way
is also ideal for progressive rehabilitation and minimizing runoff collection and treatment
requirements. A 50% footprint CFTF for the Ni Sulphate Scenario is illustrated on Figure
18-2.
The design criteria for the CFTF is summarized in Table 18-2 below.
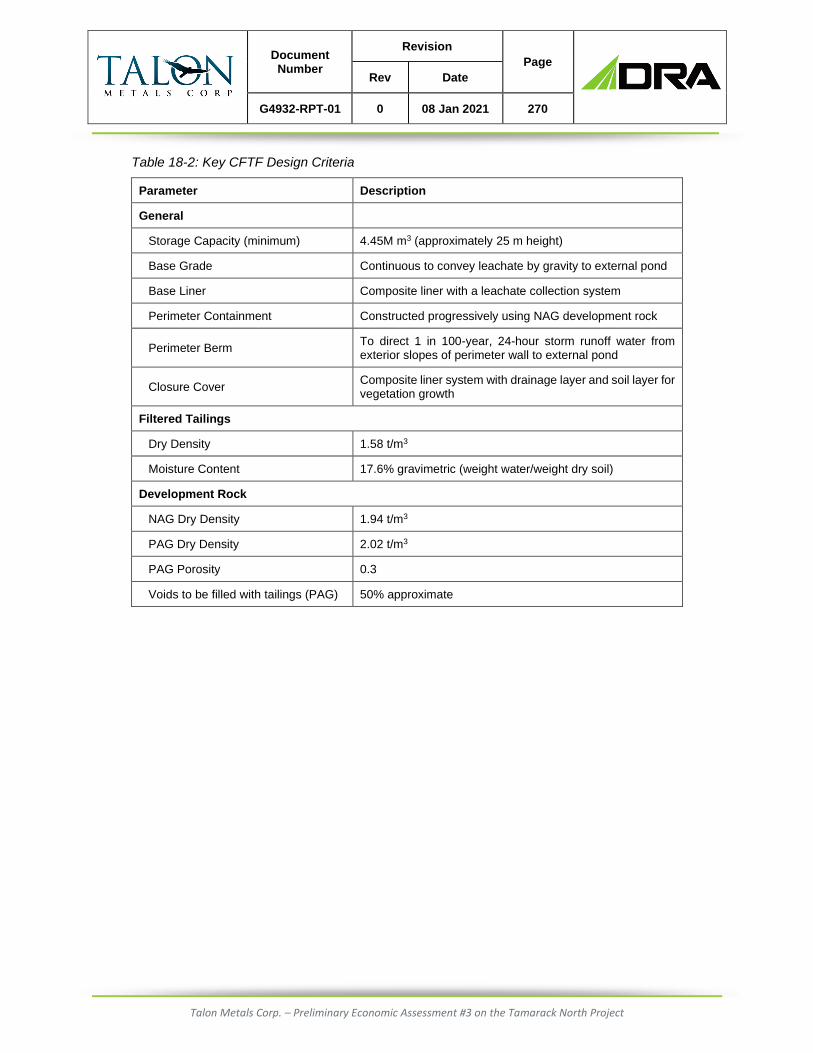
Document Number
Revision
Page
Rev Date
G4932-RPT-01 0 08 Jan 2021 270
Talon Metals Corp. – Preliminary Economic Assessment #3 on the Tamarack North Project
Table 18-2: Key CFTF Design Criteria
Parameter Description
General
Storage Capacity (minimum) 4.45M m3 (approximately 25 m height)
Base Grade Continuous to convey leachate by gravity to external pond
Base Liner Composite liner with a leachate collection system
Perimeter Containment Constructed progressively using NAG development rock
Perimeter Berm To direct 1 in 100-year, 24-hour storm runoff water from exterior slopes of perimeter wall to external pond
Closure Cover Composite liner system with drainage layer and soil layer for vegetation growth
Filtered Tailings
Dry Density 1.58 t/m3
Moisture Content 17.6% gravimetric (weight water/weight dry soil)
Development Rock
NAG Dry Density 1.94 t/m3
PAG Dry Density 2.02 t/m3
PAG Porosity 0.3
Voids to be filled with tailings (PAG) 50% approximate

Document Number
Revision
Page
Rev Date
G4932-RPT-01 0 08 Jan 2021 271
Talon Metals Corp. – Preliminary Economic Assessment #3 on the Tamarack North Project
Figure 18-2: CFTF General Arrangement Plan

Document Number
Revision
Page
Rev Date
G4932-RPT-01 0 08 Jan 2021 272
Talon Metals Corp. – Preliminary Economic Assessment #3 on the Tamarack North Project
CFTF Base Grade and Base Liner
The base of the CFTF will be graded to provide a 0.5% slope to the N and S with a drainage
divide across the middle of the facility. The base grading will allow runoff water collected by
the perimeter ditch and seepage collected by the leachate collection system to flow by
gravity to the CFTF collection ponds. The base grade will be prepared through a cut-to-fill
operation and care will be taken to ensure an even base.
A composite liner will be provided over the finished base grade of the CFTF, which will
consist of the following, from bottom to top:
• 3.5 kg/m2 geosynthetic clay liner (GCL);
• 1.5 mm HDPE geomembrane liner;
• 0.3 m thick <6.4 mm aggregate leachate collection layer;
• 330 g/m2 non-woven filter geotextile;
• 0.3 m thick OB soil protection layer.
The geomembrane liner will serve as a hydraulic and a diffusion barrier against contaminant
transport from the CFTF into the environment. The GCL will act as a back-up hydraulic and
diffusion barrier in the unexpected event of deterioration of the geomembrane liner. Both the
HDPE geomembrane liner and the GCL will be anchored on the crest of the perimeter berm.
A geotextile will be provided over the leachate drainage layer to reduce the potential for
clogging of the leachate drainage layer with fines from the overlying tailings and from the
soil protection layer. The soil protection layer provided over the leachate drainage layer
reduces the potential for the liner system to be damaged during the initial placement of the
filtered tailings and co-disposing of filtered tailings and development rock.
A perimeter trench containing perforated pipes and coarse aggregate will be provided to
convey the leachate collected from the base of the CFTF into the external pond. A thermal
berm will be provided over a portion of the perimeter trench to prevent the leachate pipeline
from freezing during winter months. The thermal berm will be constructed using NAG
development rock.

Document Number
Revision
Page
Rev Date
G4932-RPT-01 0 08 Jan 2021 273
Talon Metals Corp. – Preliminary Economic Assessment #3 on the Tamarack North Project
Perimeter Wall
The interior of the CFTF will be protected using perimeter NAG rock containment to enhance
stability, erosion protection, and dust control. Enough NAG rock is present in the mine plan
to provide an average horizontal perimeter thickness of 6 to 7 m with a 3.5H:1V exterior side
slope. The wall will be constructed in 1.5 m high lifts in the upstream construction method.
The lower lifts of the perimeter rockfill will have a filter zone separating the NAG rock from
tailings to prevent fines migration. For upper lifts of the perimeter rockfill a geotextile will be
provided between the development rock and the tailings to act as a filter to allow seepage
to flow into the perimeter ditch but preclude tailings migration.
NAG development rock production in the initial years of mining will exceed the needs for
CFTF construction, but NAG needs will exceed the production in the later years of mining.
Therefore, approximately 15% of the NAG rock will need to be temporarily stockpiled outside
of the CFTF footprint before ultimately being incorporated into the CFTF.
Perimeter Berm and Ditch
A berm approximately 1 m high and a ditch will be provided at the perimeter of the CFTF
approximately 3 m from the toe of the first perimeter wall lift. The berm will be used for
anchoring the base liner system and also for supplementing the flow capacity of the
perimeter ditch. The ditch will direct the one in 100 year, 24 hour storm runoff water from the
exterior slopes of the perimeter wall into the CFTF collection ponds from where it will be
pumped to the plant.
Access Ramp
A ramp will be provided on the NW end of the facility to access the top surface of the CFTF.
The ramp will be 15 m wide and will have a 10% slope.
Co-disposal Area
Tailings will be dewatered to near the optimum water content, assumed to be 17.6%
moisture by mass, using the filtration plant located within the process plant area. Filtering to
optimum water content allows the tailings to be hauled, placed and compacted like a soil.
The filtered tailings will be trucked to the co-disposal area, placed in thin lifts, and compacted
adjacent to layers or zones of NAG and PAG development rock. Conventional vibratory

Document Number
Revision
Page
Rev Date
G4932-RPT-01 0 08 Jan 2021 274
Talon Metals Corp. – Preliminary Economic Assessment #3 on the Tamarack North Project
rollers will be used to compact the filtered tailings. The PAG development rock will be placed
in the interior of the CFTF such that a buffer zone of NAG tailings will separate the PAG rock
from the perimeter wall of the CFTF to mitigate the risk for ARD and ML. Filtered tailings will
also be co-mingled with the PAG development rock by alternating truck-loads of tailings and
PAG and working them together while spreading with a dozer. For design purposes it is
assumed that half of the PAG rock pore space is filled with tailings. Future geochemical
studies will examine the cost-benefit of further void filling to inhibit oxidation reactions.
Dust suppression covers will be installed on all trucks. Dust generation will be mitigated by
having a perimeter wall height that exceeds the tailings height. ARD generation will be
mitigated through regularly covering the PAG rock or co-mingled with NAG tailings. Future
studies should examine the exposure (“fuse”) time required before acid production to confirm
the operational requirements for co-mingling.
Tight process controls will be required for the filtering of tailings to ensure the design intent
is met. However, during operations performance variability and plant upsets in the tailings
filtering process should be expected. During such periods, off-spec tailings should be
deposited in the middle of the CFTF and co-mingled with PAG so they do not affect the
physical stability of the facility.
CFTF Closure Cover
At closure, the top of the co-disposal area will be regraded to have a 1% crown. This will
create a stable post-closure landform that will shed precipitation runoff.
The perimeter wall and the top of the CFTF will be provided with a closure cover system that
will consist of the following, from bottom to top:
• 552 g/m2 non-woven cushion geotextile;
• 0.6 m thick liner bedding (soil);
• 3.5 kg/m2 GCL;
• 1.5 mm linear low-density polyethylene (LLDPE) geomembrane liner;
• 0.3 m thick coarse aggregate drainage layer;
• 330 g/m2 non-woven filter geotextile;
• 0.45 m thick soil for root penetration;
• 0.15 m thick topsoil;
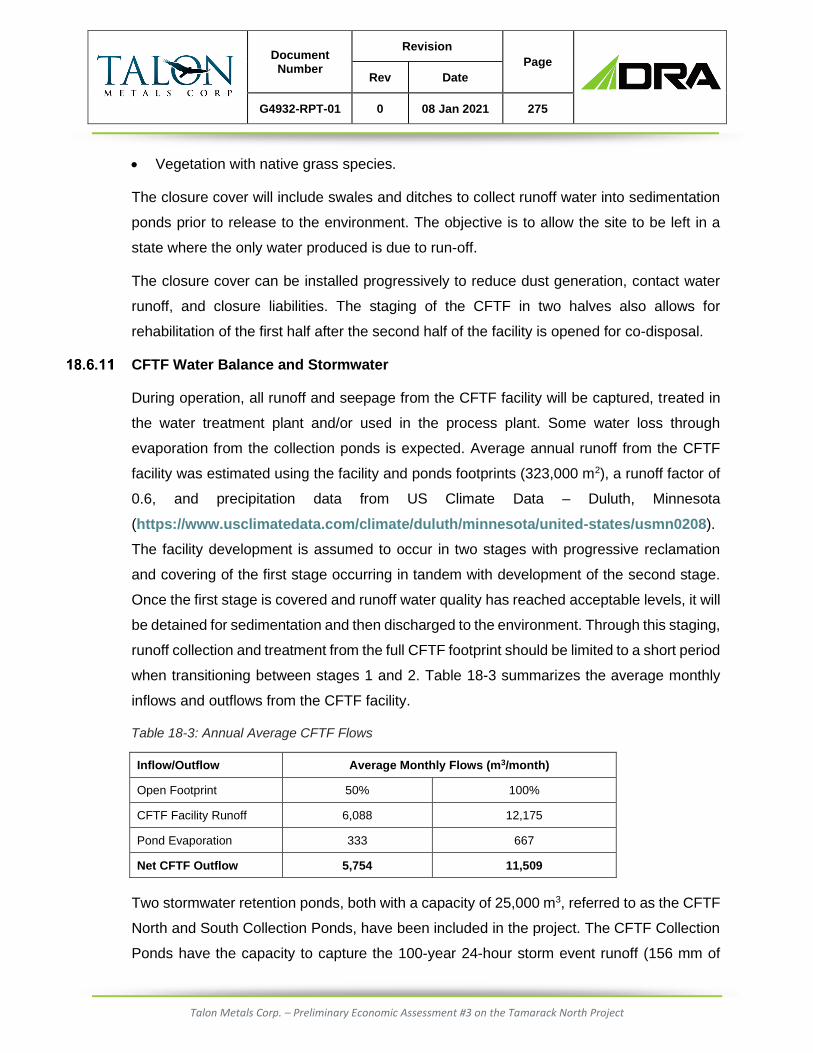
Document Number
Revision
Page
Rev Date
G4932-RPT-01 0 08 Jan 2021 275
Talon Metals Corp. – Preliminary Economic Assessment #3 on the Tamarack North Project
• Vegetation with native grass species.
The closure cover will include swales and ditches to collect runoff water into sedimentation
ponds prior to release to the environment. The objective is to allow the site to be left in a
state where the only water produced is due to run-off.
The closure cover can be installed progressively to reduce dust generation, contact water
runoff, and closure liabilities. The staging of the CFTF in two halves also allows for
rehabilitation of the first half after the second half of the facility is opened for co-disposal.
CFTF Water Balance and Stormwater
During operation, all runoff and seepage from the CFTF facility will be captured, treated in
the water treatment plant and/or used in the process plant. Some water loss through
evaporation from the collection ponds is expected. Average annual runoff from the CFTF
facility was estimated using the facility and ponds footprints (323,000 m2), a runoff factor of
0.6, and precipitation data from US Climate Data – Duluth, Minnesota
(https://www.usclimatedata.com/climate/duluth/minnesota/united-states/usmn0208).
The facility development is assumed to occur in two stages with progressive reclamation
and covering of the first stage occurring in tandem with development of the second stage.
Once the first stage is covered and runoff water quality has reached acceptable levels, it will
be detained for sedimentation and then discharged to the environment. Through this staging,
runoff collection and treatment from the full CFTF footprint should be limited to a short period
when transitioning between stages 1 and 2. Table 18-3 summarizes the average monthly
inflows and outflows from the CFTF facility.
Table 18-3: Annual Average CFTF Flows
Inflow/Outflow Average Monthly Flows (m3/month)
Open Footprint 50% 100%
CFTF Facility Runoff 6,088 12,175
Pond Evaporation 333 667
Net CFTF Outflow 5,754 11,509
Two stormwater retention ponds, both with a capacity of 25,000 m3, referred to as the CFTF
North and South Collection Ponds, have been included in the project. The CFTF Collection
Ponds have the capacity to capture the 100-year 24-hour storm event runoff (156 mm of

Document Number
Revision
Page
Rev Date
G4932-RPT-01 0 08 Jan 2021 276
Talon Metals Corp. – Preliminary Economic Assessment #3 on the Tamarack North Project
rainfall, 0.9 runoff factor) from the CFTF facility plus some additional capacity for regular
operation.
18.7 Tamarack North Project Preliminary Water Balance
Water Sources and Water Storage
A preliminary water balance was developed, to account for major water streams through the
mine, processing plant, tailings management area, and paste backfill facility.
The following data were used for the calculations:
• Concentrator and hydromet plant mass balance water quantities estimated in the course
of process design;
• Quantities of water from the CFTF were advised by SLR as per Section 18.6;
• Quantities of mine water production were estimated as explained in Section 16.10;
• Quantities of mine water required were estimated as explained in Section 16.12.
The calculations focused on maximizing the reuse of water and excluded any water for
domestic use on site. The results are summarized below:
• Net water required at surface for the concentrator and hydromet plant were calculated
by estimating the total water requirement for all processes less water recycled from
thickening and filtering, resulting in a net water requirement for the Ni Concentrate or Ni
Powder Scenarios of 515 USgpm at plant capacity. Note that 78.5% of water required
by the processing plant will be recycled;
• Net water requirement for the Ni Sulphate Scenario (concentrator plus hydromet plant)
will demand about 1200 USgpm at plant capacity due to fresh water demand for the
hydromet plant circuits. About 54% of concentrator plus hydromet plant water required
will be recycled;
• Water collected from the CFTF is estimated at:
o 37 USgpm from year 3 through year 4;
o 55 USgpm for years 5 to 8; and
o 37 USgpm for years 9 to 11.
• Water required by underground operations at plant capacity is estimated to be in a range
from 805 to 1605 USgpm;
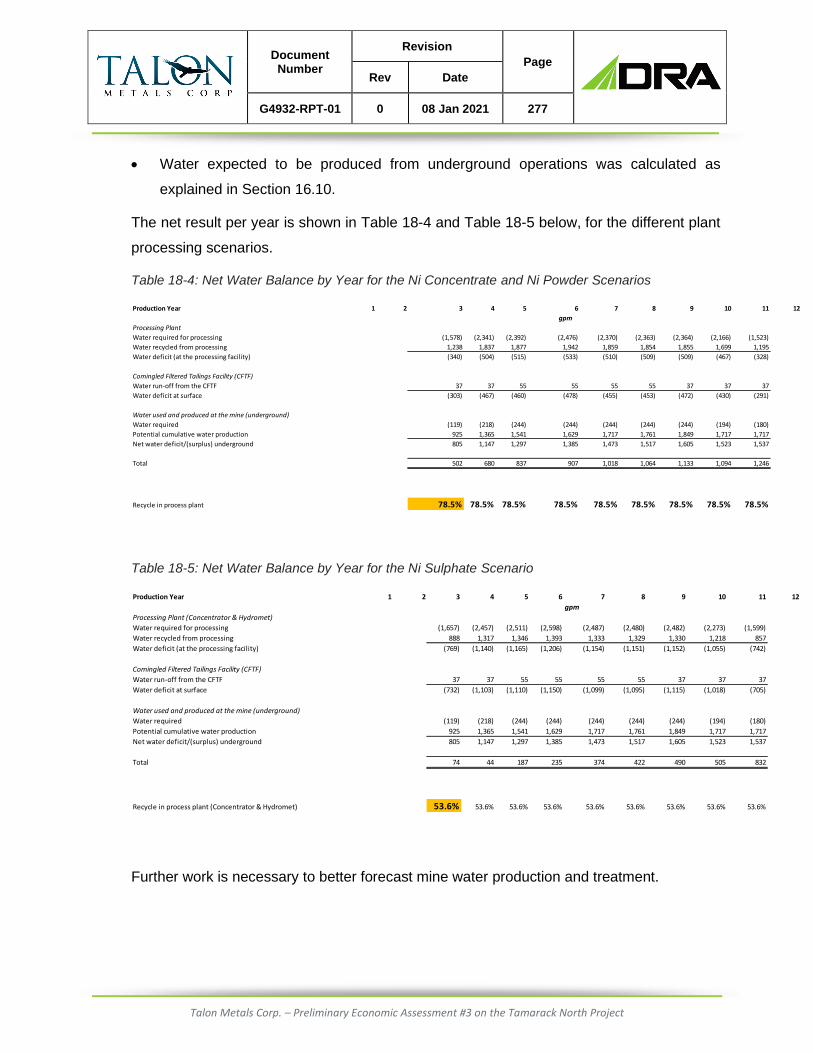
Document Number
Revision
Page
Rev Date
G4932-RPT-01 0 08 Jan 2021 277
Talon Metals Corp. – Preliminary Economic Assessment #3 on the Tamarack North Project
• Water expected to be produced from underground operations was calculated as
explained in Section 16.10.
The net result per year is shown in Table 18-4 and Table 18-5 below, for the different plant
processing scenarios.
Table 18-4: Net Water Balance by Year for the Ni Concentrate and Ni Powder Scenarios
Table 18-5: Net Water Balance by Year for the Ni Sulphate Scenario
Further work is necessary to better forecast mine water production and treatment.
Production Year 1 2 3 4 5 6 7 8 9 10 11 12
Processing Plant
Water required for processing (1,578) (2,341) (2,392) (2,476) (2,370) (2,363) (2,364) (2,166) (1,523)
Water recycled from processing 1,238 1,837 1,877 1,942 1,859 1,854 1,855 1,699 1,195
Water deficit (at the processing facility) (340) (504) (515) (533) (510) (509) (509) (467) (328)
Comingled Filtered Tailings Facility (CFTF)
Water run-off from the CFTF 37 37 55 55 55 55 37 37 37
Water deficit at surface (303) (467) (460) (478) (455) (453) (472) (430) (291)
Water used and produced at the mine (underground)
Water required (119) (218) (244) (244) (244) (244) (244) (194) (180)
Potential cumulative water production 925 1,365 1,541 1,629 1,717 1,761 1,849 1,717 1,717
Net water deficit/(surplus) underground 805 1,147 1,297 1,385 1,473 1,517 1,605 1,523 1,537
Total 502 680 837 907 1,018 1,064 1,133 1,094 1,246
Recycle in process plant 78.5% 78.5% 78.5% 78.5% 78.5% 78.5% 78.5% 78.5% 78.5%
gpm
Production Year 1 2 3 4 5 6 7 8 9 10 11 12
Processing Plant (Concentrator & Hydromet)
Water required for processing (1,657) (2,457) (2,511) (2,598) (2,487) (2,480) (2,482) (2,273) (1,599)
Water recycled from processing 888 1,317 1,346 1,393 1,333 1,329 1,330 1,218 857
Water deficit (at the processing facility) (769) (1,140) (1,165) (1,206) (1,154) (1,151) (1,152) (1,055) (742)
Comingled Filtered Tailings Facility (CFTF)
Water run-off from the CFTF 37 37 55 55 55 55 37 37 37
Water deficit at surface (732) (1,103) (1,110) (1,150) (1,099) (1,095) (1,115) (1,018) (705)
Water used and produced at the mine (underground)
Water required (119) (218) (244) (244) (244) (244) (244) (194) (180)
Potential cumulative water production 925 1,365 1,541 1,629 1,717 1,761 1,849 1,717 1,717
Net water deficit/(surplus) underground 805 1,147 1,297 1,385 1,473 1,517 1,605 1,523 1,537
Total 74 44 187 235 374 422 490 505 832
Recycle in process plant (Concentrator & Hydromet) 53.6% 53.6% 53.6% 53.6% 53.6% 53.6% 53.6% 53.6% 53.6%
gpm

Document Number
Revision
Page
Rev Date
G4932-RPT-01 0 08 Jan 2021 278
Talon Metals Corp. – Preliminary Economic Assessment #3 on the Tamarack North Project
Temporary Water Storage Ponds
An estimated 1.4M gallons of water will need to be stored in water storage ponds, which
amounts to roughly the water storage capacity of two Olympic sized swimming pools.
Consideration in future project phases should be given to construction methods and the
number of temporary water storage ponds that could initially serve as water collection ponds
during construction.
All water pumped from the water storage ponds will be treated at the Water Treatment Plant
from where it will be pumped to a process water tank for re-use.

Document Number
Revision
Page
Rev Date
G4932-RPT-01 0 08 Jan 2021 279
Talon Metals Corp. – Preliminary Economic Assessment #3 on the Tamarack North Project
MARKET STUDIES AND CONTRACTS
19.1 Market Analysis
Nickel Powder Scenario
The inefficiency of the present supply chain from mine to battery cathode was articulated
during Tesla’s Battery Day on September 22, 2020 (Battery Day).
Below is an illustration of the traditional cathode process:
Figure 19-1: Traditional Cathode Process: Battery Day
Mined ore is typically crushed, concentrated, and shipped to a smelter, where it is converted
to a Ni matte using a pyrometallurgical process. From there, the Ni matte is shipped to a
hydrometallurgical refinery where Ni metal is produced. The metal is then shipped to a
different hydrometallurgical facility that uses sulphuric acid to produce a metal sulphate
(called a Ni sulphate). When making battery cathode material, the Ni sulphate is further
processed through the addition of more chemicals and water, thus yielding additional by-
products and wastewater.
“It’s insanely complicated. It’s a small world journey of, ‘I am a nickel atom, what happens to
me?’ And it is crazy. You’re going around the world three times, it’s the equivalent of digging
the ditch, filling the ditch and digging the ditch again, it’s total madness basically.”
Elon Musk, Battery Day, September 22, 2020

Document Number
Revision
Page
Rev Date
G4932-RPT-01 0 08 Jan 2021 280
Talon Metals Corp. – Preliminary Economic Assessment #3 on the Tamarack North Project
During Battery Day, Tesla proposed a new cathode process, which is illustrated below:
Figure 19-2: Proposed Tesla Cathode Process: Battery Day
Working from first principles, Tesla asked the question: “How do we get from the nickel ore
in the ground to the finished nickel product for a battery” looking at the entire value chain.
The solution is by directly consuming raw metal Ni powder, which dramatically simplifies the
value chain, thereby eliminating intermediate steps and consequently unnecessary
transportation. The same process could also potentially consume metal powder from
recycled EV and grid storage batteries. The process enables both simpler processing and
recycling.
During Battery Day, Tesla announced that they are going to start building their own cathode
facility in North America, leveraging North American resources that exist for Ni and Li. By
localizing the cathode supply chain and production, Tesla can significantly reduce miles
traveled and the cost of the materials that end up in the cathode. To be clear, Tesla
announced that cathode production would be part of the Tesla cell production plant.
“So it would just be basically raw materials coming from the mine”.
Elon Musk, Battery Day, September 22, 2020
By 2026 the Tamarack Project is expected to be one of the only sources of
domestically produced Ni in the USA.

Document Number
Revision
Page
Rev Date
G4932-RPT-01 0 08 Jan 2021 281
Talon Metals Corp. – Preliminary Economic Assessment #3 on the Tamarack North Project
The Ni powder market for EV battery cathode is one of three product markets that Talon is
focussed on. Under the Ni Powder Scenario, Talon will produce Ni concentrates that are
optimized for producing Ni powders, which could be used for EV battery cathode production.
As articulated during Battery Day, this approach has the potential to materially decrease the
cost of Ni used in batteries, by eliminating intermediate processes and associated
transportation, creating a win-win for both the battery cathode manufacturer and the mining
company, leading to higher profitability for both parties. Further details are contained in
Section 22 Economic Analysis of this PEA.
The process that is being considered for producing Ni powders is also being evaluated for
producing refined Fe powders as a by-product which could potentially be used for Li Fe
phosphate batteries.
When selling Ni concentrates to smelters, no credit or revenue is realized for Fe content,
however a high Fe to Mg ratio is advantageous, which means the Ni concentrate producer
(i.e., the mine) is not compensated for its Fe content. The Tamarack North Project
concentrates have approximately four times as much Fe as Ni. The price of refined Fe
powders is estimated at $1.50/lb (calculated as 5.50 $/kWh / 1000 x 600 Wh/kg / 2.2046)
(source: Battery Day). From the same process Talon could therefore generate substantial
additional revenues at very little additional cost. So far, Talon has not included any revenues
derived from the sale of refined Fe powders in its economic forecasts, however flowsheet
development is focussed on the production of both Ni and Fe powders to supply the Ni and
Fe battery markets.

Document Number
Revision
Page
Rev Date
G4932-RPT-01 0 08 Jan 2021 282
Talon Metals Corp. – Preliminary Economic Assessment #3 on the Tamarack North Project
Nickel Sulphate Scenario
As shown in Figure 19-3 below, Talon has a unique opportunity in the United States to
remove a myriad of steps and unnecessary transportation costs from the supply chain to
produce Ni sulphates locally for use in battery cathode materials.
Figure 19-3: The Efficient Ni Sulphates Supply Chain Developed by Talon vs the Traditional (Present)
Ni Sulphate Supply Chain
The present methodology of producing Ni sulphates is inefficient as it is an extension of the
process that manufactures Ni for the stainless-steel market: The equivalent of digging the
ditch, filling the ditch and digging the ditch again.
As explained in Section 13, Talon has successfully completed the first step of developing a
flowsheet to produce Ni sulphates directly from Tamarack Ni concentrates at site. Talon will
continue to develop the Ni Sulphate Scenario should there be a demand for this product
when the Tamarack Project is in production, as Ni sulphate is currently the preferred Ni
feedstock of battery manufacturers.

Document Number
Revision
Page
Rev Date
G4932-RPT-01 0 08 Jan 2021 283
Talon Metals Corp. – Preliminary Economic Assessment #3 on the Tamarack North Project
Nickel Concentrate Scenario
Wood Mackenzie forecasted a prolonged Ni concentrate deficit, as shown in Figure 19-4
below.
Figure 19-4: Forward-Looking Ni Concentrate Supply and Demand. (Wood Mackenzie, The Future of
Nickel Production – Page 19, February 2015)
On a regional scale, the Tamarack Project is expected to play an important role in replacing
declining Ni concentrates at Sudbury, Ontario, Canada smelters. Given that the Tamarack
Project is on excellent infrastructure and is in proximity to North American Ni smelters, the
Tamarack Project is expected to be an essential source of Ni concentrates for these North
American smelters. Notwithstanding this, Talon has used the most recent publicly available
economic terms for Ni concentrates in its economic analysis.
19.2 Premium for Green NickelTM
As outlined in Section 20 of this PEA, the Tamarack Project is ideally positioned to minimize
its carbon footprint. Currently, most mining companies only consider their carbon footprint
from ore to concentrate; however, going forward, it is expected that future customers,

Document Number
Revision
Page
Rev Date
G4932-RPT-01 0 08 Jan 2021 284
Talon Metals Corp. – Preliminary Economic Assessment #3 on the Tamarack North Project
particularly within the EV market, will demand a full life cycle assessment (from mine to
finished product) and all attempts to minimize carbon footprint be undertaken from mine to
EV.
The Tamarack Project is endeavoring to have the lowest carbon footprint of all known Ni
projects globally when producing Green NickelTM. This is expected to be possible because:
• Tamarack mineralization has high-grades compared to other projects currently in the
exploration and development phases. This means more Ni will be produced per tonne of
rock mined, therefore requiring less energy and less waste as well as a significantly
smaller footprint than comparatively low-grade Ni sulphide projects or laterite Ni projects;
• Tamarack’s electricity will be sourced from 100% renewable energy sources;
• Waste produced from the Tamarack Project will be dewatered and stored underground
while remaining waste will be blended with development rock in a CFTF that will utilize
pore space, thereby reducing overall mine footprint and avoiding the need for a tailings
dam. Water captured will be recycled resulting in a substantial reduction of freshwater
usage;
• The proposed CFTF at the Tamarack Project is also expected to be amenable to capture
and store carbon (i.e., carbon sequestration). Testing is currently underway to determine
quantities and deployment.
Note that a premium price for Green NickelTM has not been included in Talon’s economic
analysis; however, it is expected that there will be a bifurcation between Green NickelTM and
other Ni products. It is therefore reasonably believed that Green NickelTM will ultimately
command a premium price in the coming years.
19.3 Metal Prices
Base case metal prices are based on present London Metal Exchange (LME) prices and
analyst consensus long-term “real” (i.e. without inflation) prices. These metals are sold on
openly traded markets such as the LME, the London Platinum and Palladium Market, the
New York Mercantile Exchange (NYMEX) and the London Bullion Market.
The base case financial analysis of the Tamarack North Project uses the following estimated
real metal prices. Alternative metal price scenarios were also considered.

Document Number
Revision
Page
Rev Date
G4932-RPT-01 0 08 Jan 2021 285
Talon Metals Corp. – Preliminary Economic Assessment #3 on the Tamarack North Project
Table 19-1: Assumed Real Metal Prices
Commodity Unit Low Base Case Incentive
Ni US$/lb $6.75 $8.00 $9.50
Cu US$/lb $2.75 $3.00 $3.50
Co US$/lb 15.00 25.00 $30.00
Pt US$/oz $1,000 $1,000 $1,000
Pd US$/oz $1,000 $1,000 $1,000
Au US$/oz $1,300 $1,300 $1,300
Discounts to these prices have been assumed for both the Ni Powder and Ni Concentrate
Scenarios, as both scenarios will require further processing to yield final products.
A premium of $1.25/lb to the LME Ni price has been applied for the Ni Sulphate Scenario as
although it is expected to be produced directly from Ni concentrates at the Tamarack Project,
Ni sulphate producers who use LME Ni as a feedstock must incur additional costs, over and
above the LME Ni price and therefore are expected to charge a premium.
Incentive price is an estimated price believed to be required to incentivize new mines to be
constructed. Selected incentive price is based on Talon research, however it may be higher
or lower depending on numerous factors such as: inflation, future volume of demand for Ni,
required return on capital and cost profile (both CAPEX and OPEX) of new projects that
potentially could be constructed to meet a supply shortfall among other factors. Incentive
price represents a possible price during periods of Ni demand growth such as due to the
projected growth in the EV market.

Document Number
Revision
Page
Rev Date
G4932-RPT-01 0 08 Jan 2021 286
Talon Metals Corp. – Preliminary Economic Assessment #3 on the Tamarack North Project
ENVIRONMENTAL STUDIES, PERMITTING & SOCIAL OR COMMUNITY IMPACT
20.1 Introduction
The Tamarack North Project will be subject to state and federal level environmental review
and permitting processes, which are described in Section 20.4 and Section 20.5. Throughout
the regulatory processes, Talon will illustrate that the Tamarack North Project will avoid or
mitigate potential impacts to the environment in accordance with regulatory requirements.
Additional data collection and analysis beyond the current environmental baseline studies
will be completed to support these processes.
In accordance with Technical Report content expectations, this section addresses:
• Summary of results of environmental baseline studies and known environmental issues;
• Requirements and plans for waste and tailings disposal, site monitoring, and water
management during operations and post mine closure;
• Project permitting requirements, status of applications, and requirements for
performance or reclamation bonds;
• Potential social or community related requirements and plans for the project, status of
any negotiations;
• Mine closure requirements and costs.
20.2 Environmental Studies – Summary of Results
Environmental baseline studies to characterize existing physical and biological conditions
were initiated in 2006. A summary of environmental characterization from studies to date is
provided in Table 20-1. Additional baseline and environmental engineering studies will be
needed to support project siting, design, and environmental review and permitting efforts.
There are no known environmental issues that could materially impact the ability to mine the
resource.

Document Number
Revision
Page
Rev Date
G4932-RPT-01 0 08 Jan 2021 287
Talon Metals Corp. – Preliminary Economic Assessment #3 on the Tamarack North Project
Table 20-1: Environmental Studies – Summary of Results
Subject Summary of Results
Hydrogeology
The hydrostratigraphic units in the Tamarack North Project area consist of unconsolidated glacial deposits with a typical thickness of >30 m overlaying Precambrian bedrock. Onsite testing indicates that the hydraulic conductivity of the glacial deposits, which consist of a complex sequence of sand and gravel, clay, and silt, is generally significantly higher than the hydraulic conductivity of the bedrock.
Groundwater elevations and groundwater quality continue to be monitored regularly since data collection was initiated in 2008. The monitoring network includes 12 monitoring wells constructed in the unconsolidated glacial deposits. The monitoring program details have varied somewhat since 2008, but in recent years has included quarterly groundwater elevation measurements and annual groundwater sample collection from a subset of eight monitoring wells. The groundwater flow direction is generally from E to W across the site area.
There are no permanent monitoring wells constructed in the bedrock. Groundwater conditions in the bedrock have been assessed using BH geophysical techniques and packer testing at four exploration BHs. Discrete groundwater samples were collected from the bedrock during packer testing to characterize groundwater quality.
This information was used to estimate the potential mine water inflows for purposes of completing a water balance (refer Section 18.7).
Hydrology
Surface water monitoring stations were established on a series of stream sections and lake sites surrounding the site and within the water basin. A surface water monitoring program commenced in 2008 and data was collected related to measurement of flow, field water quality measurements, and collection of surface water samples for analysis. Approximately 20 surface water monitoring locations were sampled with some adjustments in locations and stations since the program inception. Recent sampling includes measurement of flow three times a year, biannual measurement of field parameters and an annual collection of surface water samples at a subset of locations.
The results from this data were used to complete three mine access trade off
studies. (refer Section 16.8)
Geochemistry
Fourteen drill core samples have been analyzed. The samples were selected to comprise rock types, spatial distribution, and sulphur content at site. Rock types tested included:
• fine-grained olivine orthocumulate (4);
• coarse-grained olivine orthocumulate (2);
• sedimentary units (2);
• semi-massive sulfide units (3);
• saprolite (2);
• massive sulfide unit (1).
Tests included static ABA tests targeting similar but slightly variable information on the potential for the rock samples to generate or neutralize acidity. Whole rock analysis of around 60 elements was conducted on all 14 samples. An SPLP leach was conducted on all 14 samples; major and trace metals were analyzed in the leachate.
The results from these studies were used for purposes of designing an innovative
CFTF: Refer Section 18.6.

Document Number
Revision
Page
Rev Date
G4932-RPT-01 0 08 Jan 2021 288
Talon Metals Corp. – Preliminary Economic Assessment #3 on the Tamarack North Project
Subject Summary of Results
Wetlands
Multiple wetland delineation and evaluation studies have been conducted in and around the site since 2008. The studies were consistent with federal and local guidelines. Wetland boundaries were mapped and reviewed with local regulatory staff. A 120-acre study area was initially evaluated, then expanded to a 580-acre study area.
The conceptual site layout (refer Section 18.3) has been placed close to the ore body, straddling upland areas (57.37 acres) and wetland areas (178.64 acres). Alternative site layouts will be considered in accordance with regulatory requirements. Wetland surveys will need to be updated before the start of the formal environmental review process.
The wetland type by approximate area of the Project site is shown below:
Description Acres
Upland 57.37
Sedge meadow 58.18
Alder thicket 29.36
Shrub carr 63.53
Deep marsh (in man-made pond) 2.38
Coniferous bog 25.04
Hardwood swamp 0.15
Total 236.01
Vegetative Communities
A survey of a 322-acre study area of vegetative communities was conducted in 2008 over most of the site layout area. Flora was inventoried onsite and vegetative communities and habitats were mapped by type within the study area.
The area where the conceptual site is located (refer Section 18.3) was delineated as Fallow Farm Fields/Young Pine Plantation. Satellite imagery dated 1991 suggests that much of this vegetative community had previously been farmed. This community is now dominated by scattered, young red pine (Pinus resinosa), white pine (Pinus strobus), and black spruce (Picea mariana). The herbaceous stratum is dominated by goldenrods (Solidago spp.), pearly everlasting (Anaphalis margaritacea), and a host of non-native species such as reed canary grass (Phalaris arundinacea), redtop (Agrostis gigantea), smooth brome (Bromus inermis), ox-eye daisy (Chrysanthemum leucanthemum), clovers (Trifolium spp.), yarrow (Achillea millefolium), timothy (Phleum pretense), and tall buttercup (Ranunculus acris). Man-Made Pond (2.8 acres): A man-made pond exists within the western portion of the study area. Its herbaceous community is relatively diverse, with no species exhibiting complete dominance. The small farm pond (also man-made), directly E of the farmstead lot, is somewhat older and has a more mature herbaceous community. Thick stands of narrow-leaved cattail (Typha angustifolia) dominate the littoral zone, and node pondweed (Potamogeton nodosus) covers much of the water surface.
The vegetative communities observed in the study area are characteristic of much of northeastern Minnesota, including Aitkin County. No unusual or uncommon natural vegetative communities were identified within the study area. Two invasive plant species (reed canary grass and narrow-leaved cattail) were abundant within several of the habitat types. RTE plant species or their potential

Document Number
Revision
Page
Rev Date
G4932-RPT-01 0 08 Jan 2021 289
Talon Metals Corp. – Preliminary Economic Assessment #3 on the Tamarack North Project
Subject Summary of Results
habitat was not observed. This survey will need to be updated before the start of the formal environmental review process with anticipated similar results.
The approximate area by Vegetative community type is shown below:
Description Acres
Northern Poor Fen 153.5
Northern Wet-Mesic-Hardwood Forest 9
Northern Wet-Mesic Hardwood Forest/Northern Wet Ash Swamp
41
Northern Poor Conifer Swamp 38
Northern Alder Swamp 11.5
Man-made Pond 2
Mature Alder Thicket 1
Fallow Farm Fields/Pine Plantation 66
Total 322
RTE Plant Species
A survey for RTE species was conducted in 2008. The survey study area covered much of the site area with the exception of a farm residence and adjacent buildings, and areas to the S and NW which were subsequently added to the site. The MDNR maintains a restricted geographic database of documented occurrences of threatened, endangered, and special concern species in Minnesota. An authorized database search was conducted for RTE species that have been known to occur within several miles of the study area. This information and Minnesota’s entire published list (MDNR Division of Ecological Resources 2008) of RTE species were utilized while conducting the RTE field investigation within the study area in August 2008. The site was carefully surveyed using a series of thorough meander transects within all natural vegetative communities and other habitat types.
No federally listed or state listed threatened, endangered, special concern plant species or other rare natural features were documented within the study area. Because all habitat types documented within the study area are relatively common in Aitkin County and the associated ecoregion, the presence of RTE species is anticipated. These surveys will need to be updated before the start of
formal environmental review process.
Requirements and Plans for Waste and Tailings Disposal
Waste generated from mining activities will be managed in a manner that protects the
environment. Mine waste includes:
• Development rock generated from the excavating decline, levels, ramps, cross-cuts and
drifts;
• Tailings generated in the production of Ni and Cu concentrates.

Document Number
Revision
Page
Rev Date
G4932-RPT-01 0 08 Jan 2021 290
Talon Metals Corp. – Preliminary Economic Assessment #3 on the Tamarack North Project
The approach to managing these wastes will follow industry practice and will address the
mechanisms of potential environmental impacts. Collecting drainage and seepage water
from stored material, mitigating dust, providing satisfactory reclamation for long term
environmental protection are required in accordance with Minnesota nonferrous metallic
mineral mining rules (Minnesota Rules, Chapter 6132).
The two waste streams will be managed as they are generated:
• Development rock will be generated over the full LOM, initially from rock excavated from
the main access decline ramp originating from a portal on-site and then from on-going
mine operations. A portion of the waste rock will be blended with paste fill and deposited
into stopes as part of the backfill cycle. Where this isn’t possible, the remainder will be
trucked to surface through the main decline and stored on a lined Temporary
Development Rock Storage Area (refer Section 18.4.10). This structure will be designed
and managed such that all drainage water will be collected and either used in operations
or treated to water quality limits before discharging to the environment. Dust will be
minimized by a variety of practices and management techniques.
• Tailings will be generated once ore processing commences. Metallurgical testing has
proven that HS tailings may be generated in addition to a LS tailings stream (refer
Section 17.3.9). HS tailings and a portion of LS tailings will be used in the paste backfill
recipe to fill stopes, with remaining LS tailings permanently managed in an engineered
storage facility, the CFTF. A paste backfill study was commissioned to determine if and
how much of the HS tailings and LS tailings can be mixed with cement and stored in
mined out, underground voids. The results of this study showed that the HS tailings and
a portion of LS tailings can be blended with cement and cured underground (refer Section
17.3.8).
The CFTF concept was developed to manage the aboveground waste storage design. A
number of studies were commissioned to investigate the use of BAT to manage development
rock and the remaining LS tailings (refer Section 18.6). These studies led to the development
of an innovative CFTF, which offers significant environmental and operating advantages
over separate tailings storage and development rock storage facilities. Advantages include:
• Reduced risk of failure as the facility stores minimal water;
• A major reduction in the waste facility footprint since stored water is minimal;

Document Number
Revision
Page
Rev Date
G4932-RPT-01 0 08 Jan 2021 291
Talon Metals Corp. – Preliminary Economic Assessment #3 on the Tamarack North Project
• Improved tailings stability and reduced dusting compared to a standalone filtered tailings
facility without co-disposal with development rock;
• At closure, the CFTF will be covered with a composite closure cover system. This will
limit the amount of infiltration into the CFTF post-closure, reducing long-term water
treatment needs and post-closure care liabilities;
• A significant reduction in fresh water requirements. Almost 90% of the water required by
the processing plant will be recycled water;
• Potential to sequester carbon, thus reducing the project’s overall carbon footprint.
Section 18.6 contains a more detailed discussion of the CFTF.
Other Environmental Considerations
Groundwater in the surficial aquifer in the region is generally located near the surface and
of high quality. The groundwater is hydraulically connected to surface waters in the area,
although the degree of connectivity has not been determined. Mine operations, therefore
have the potential to impact water quality. Localized dewatering associated with near-
surface mining, including construction of the portal or vent shaft collar, therefore has the
potential to impact surface waters. Construction will employ water stoppage measures,
which may include a grouted pipe canopy or freeze wall that would be built in advance of
development. Employing one of these measures will limit water seepage into the mine
workings during development and will later be replaced with ground support appropriate for
conditions encountered during the working phase of mining operations.
In order to manage waste, Talon is addressing environmental sensitivities, such as:
• Potential mitigation for lost habitat of state and federal protected species;
• Potential wetland impacts and need for wetland impact mitigation;
• Potential generation of ARD and ML;
• Potential impacts to surface and ground water quality;
• Potential drawdown of surface water levels and flows;
• Potential sequestration of carbon.
• Site Monitoring
Monitoring will be required throughout operations and after mine closure. A groundwater and
surface water monitoring network similar to the current baseline monitoring network is

Document Number
Revision
Page
Rev Date
G4932-RPT-01 0 08 Jan 2021 292
Talon Metals Corp. – Preliminary Economic Assessment #3 on the Tamarack North Project
anticipated as a permit requirement. After mine closure, some or all of the monitoring
network will remain, and monitoring will continue for an approved duration. Monitoring is
overseen by the MDNR, with regular data submittals required. Changes in monitoring must
be approved by the agency.
20.3 Water Management for Operations and Post Mine Closure
A water management plan will be developed, detailing a strategy for managing water in a
manner consistent with environmental requirements related to both water quantity and water
quality. The water management plan will be designed to avoid, minimize and mitigate
adverse changes in surface water hydrology and confirm compliance with surface and
groundwater water quality standards.
A preliminary annual water balance was developed for purposes of this PEA (refer Section
18.7). Based on this water balance, the Tamarack North Project is expected to have a
potentially negative water balance during the first three years of production, followed by
potentially a positive water balance over the rest of the LOM (Section 18.7). Although it has
been assumed that approximately 20% of underground water bearing features will be
grouted, further hydrogeological work is needed to assess the practical requirements, in
addition to the overall impacts of fracture sealing. Further work is required to assess potential
water sources. Trade-off studies of Water Treatment Plant options will be conducted in future
study.
During operations, water entering the site and potentially contacting reactive materials
(called contact water) will need to be managed. Contact water sources include mine water
inflow, water consumed during normal mine operations, precipitation within the contact area
of the site, seepage through the Temporary Development Rock Storage Area and CFTF.
The site is located in an area with relatively high precipitation including both rain and snow.
During operations, all contact water will be collected and either used in ore processing,
stored, or treated to permit limits prior to discharge to the environment.
Water management post mine closure will be greatly reduced compared to the management
needs during operations. Sources of contact water will be removed with the completed
reclamation; the mine excavation will be backfilled, and infrastructure and storage piles
removed. The CFTF will be covered with a composite closure cover system that limits

Document Number
Revision
Page
Rev Date
G4932-RPT-01 0 08 Jan 2021 293
Talon Metals Corp. – Preliminary Economic Assessment #3 on the Tamarack North Project
infiltration into the CFTF and associated drainage, reducing long-term water treatment
needs.
20.4 Project Permitting Requirements
For nonferrous mining projects in Minnesota, permitting can proceed after or in parallel to
environmental review. State-level and federal-level environmental review would be
completed through an EIS process subject to the Minnesota Environmental Policy Act
(MEPA) requirements for nonferrous mines, and the National Environmental Policy Act
(NEPA).
NEPA/MEPA compliance may be achieved through one of the following paths. A
Memorandum of Understanding (MOU) between the lead federal and state agencies could
be entered to prepare a single, joint EIS that fulfills both federal and state lead agency
requirements. Alternately, the lead federal agency and lead state agency may decide that a
joint EIS is not appropriate and that each level of government would require its own EIS. In
this scenario, two EIS documents would be prepared – one under NEPA and a second under
MEPA.
The lead agencies would include the MDNR as the MEPA Responsible Government Unit
(RGU) (Minnesota Rules, part 4410.2000, subpart 2) and likely the USACE as the federal
lead agency. Additional cooperating agencies may also be identified and could potentially
include the US EPA, US Fish and Wildlife Service, and one or more Native American Tribes.
The four major steps in the EIS environmental review process are:
• Scoping of the EIS;
• Preparation of the draft EIS;
• Preparation of the final EIS; and
• Documentation of the Record of Decision (ROD) and Adequacy Decision regarding the
adequacy of the EIS.
The EIS environmental review process invites participation from the public and interested
stakeholders. A brief summary of each of the four major steps, as described in Minnesota
Rules, chapter 4410, is provided in the subsequent sections. A similar process is required
under federal rules (consistent with the NEPA) however, there are differences related to

Document Number
Revision
Page
Rev Date
G4932-RPT-01 0 08 Jan 2021 294
Talon Metals Corp. – Preliminary Economic Assessment #3 on the Tamarack North Project
scoping procedures, time frames, decision processes, etc. The environmental review
process has not yet been initiated by Talon, nor have any permit applications been prepared.
Scoping
The purpose of the scoping process is to reduce the scope and bulk of an EIS. During the
scoping process, potentially significant issues relevant to the proposed project are identified.
Additionally, the level of detail, content, potential alternatives to the proposed action
(project), procedures for assessment of cumulative impacts, timetable for preparation, and
preparers of the EIS, as well as the permits for which information will be developed
concurrently with the EIS, are determined during scoping. A Minnesota Environmental
Assessment Worksheet (EAW) must be filed for all projects that require an EIS (Minnesota
Rules, part 4410.2100, subpart 2) under MEPA; the EAW provides a basis for preparation
of a draft and subsequent final Scoping Decision Document (SDD). Under the Council on
Environmental Quality NEPA guidelines, an agency has the discretion to accept comments
on the EIS process from the publication of the Notice of Intent through the release of a final
EIS. Typically, scoping comments are received prior to the release of a draft EIS and
incorporated in the draft EIS, whereas comments on the draft EIS are received after its
release and incorporated into the final EIS. Therefore, stakeholders may provide
suggestions for modification of the scope and analysis throughout the EIS process.
Draft EIS
A Draft EIS would be prepared by the RGU consistent with Minnesota Rule, parts 4410.0200
through 4410.6500 and in accordance with the final SDD and by the lead federal agency in
accordance with the agency’s NEPA program. The Draft EIS would describe the proposed
project, assess the potential environmental, economic and sociological impacts of the
proposed project and consider reasonable alternatives or modifications to avoid adverse
impacts. Minnesota Rules and NEPA provide for robust evaluation of alternatives to the
proposed action, including alternative size, configuration, location, etc. to avoid and minimize
potential adverse impacts of the proposed action. The Draft EIS would be distributed and
made available for review and comment by the public and other government agencies. It is
expected that the RGU and lead federal agency would hold an informational meeting once
the Draft EIS is released for public review.
Document Number
Revision
Page
Rev Date
G4932-RPT-01 0 08 Jan 2021 295
Talon Metals Corp. – Preliminary Economic Assessment #3 on the Tamarack North Project
Final EIS
The Final EIS would ultimately identify the likely impacts of the Tamarack North Project as
well as alternatives that may lessen or mitigate adverse impacts. It would respond to the
comments on the Draft EIS consistent with the scoping decision. The RGU and lead federal
agency would discuss any responsible opposing views relating to scoped issues which were
not adequately discussed in the Draft EIS, as appropriate, and would indicate the agency’s
responses to the views.
ROD and/or Adequacy Decision
The EIS process would conclude with a federal ROD and state Adequacy Decision that
would explain each agency’s decision, summarize the alternatives considered, and provide
the plans for mitigation and monitoring, as necessary.
20.5 Permitting Requirements
After the environmental review process, the Tamarack North Project would be required to
obtain applicable local, state, and federal permits. A preliminary list of permits that may be
required for the Tamarack North Project is provided in Table 20-2. Permitting requirements
may change if additional permitting requirements are identified within the environmental
review process and/or as the Tamarack North Project siting and design progresses.
Generally, significant permits are obtained through a process that includes a public comment
period. Talon has not initiated permitting efforts to date.
Significant permits anticipated for the Tamarack North Project’s include the Permit to Mine
from the MDNR (Section 20.5.1), the NPDES / State Disposal System (SDS) Permits from
the MPCA (refer to Section 20.5.2), the Air Permit from the MPCA (refer to Section 20.5.3),
and Section 404 Permit from the USACE (Section 20.5.4).
Equally important are the local permitting and approvals. County and municipal units of
government have building and zoning requirements to address. The local communities and
their representatives will have opportunities to provide input, understand the Tamarack North
Project, and negotiate on relevant issues. Talon has not defined social or community related
requirements and plans for the Tamarack North Project. Formal negotiations and
agreements with local communities for the Tamarack North Project have not been initiated.
Community engagement is further described in Section 20.6.

Document Number
Revision
Page
Rev Date
G4932-RPT-01 0 08 Jan 2021 296
Talon Metals Corp. – Preliminary Economic Assessment #3 on the Tamarack North Project
Table 20-2: Potentially Applicable Permits and Approvals for the Tamarack North Project
Permit or Approval Regulatory Agency Regulatory Citation Description
Scoping Environmental Assessment Worksheet (SEAW)
MDNR and Environmental Quality Board
MN Rules Chapter 4410.1000
Ch. 4410 rules require that any metallic mining project have an EIS prepared. The first step in the EIS process is to prepare a SEAW that will serve as the basis for the EIS scoping process. The MDNR will be designated as the RGU.
EIS MDNR and Environmental Quality Board, USACE
MN Rules Chapter 4410.2000, 40 Code of Federal Regulations (CFR) Section 1500-1518
Completion of EIS is mandatory for development of a metallic mining facility. The EIS must include the requirements of Ch. 4410.2300. Information must include a description of the project and potential alternatives. The EIS must address the environmental, economic, employment and sociological impacts from the project and potential mitigation measures.
Environmental Assessment (EA)
USACE 40 CFR Section 1500-1518
NEPA is triggered by a proposal to any Federal agency for a major Federal action. CEQ broadly defines a major Federal action and includes:
• adoption of official policy;
• adoption of formal plans;
• adoption of programs;
• approval of specific projects.
Data needs for an EA are similar to the SEAW required by the MDNR.
Section 106 Review. National Historic Preservation Act Compliance
USACE and SHPO 36 CFR Section 800 Section 106 of the NHPA requires federal agencies to account for the effects of their undertakings on historic properties and provide the Advisory Council on Historic Preservation a reasonable opportunity to comment.
Endangered Species Consultation
USFWS Endangered Species Act, section 7(a)(1), (2)
Consultation by the USACE to determine ESA impacts of federal action on federally endangered species.
Permit to Mine – Non Ferrous Metallic Mining
MDNR MN Rules Chapter 6132.1000 to 6132.5300
PTM application (Ch. 6132.1100) must be preceded by a mine waste conference per Ch. 6132.1000. Mine waste characterization must be included with the application along with information on the environmental setting, mining and reclamation plans and mining and reclamation maps. The application must include financial assurance and a plan for the first year of operation.
Dam Safety Permit MDNR MN Rules Chapter 6115.0300 to 6115.0520
Rules apply to structures that pose potential threat to public safety or property. Exemptions apply for dams less than 6 ft high and/or impoundments less than 15 acre-ft of water. Permits are required for new dams, to perform major maintenance, modify dam operation, or reconstruct a dam.

Document Number
Revision
Page
Rev Date
G4932-RPT-01 0 08 Jan 2021 297
Talon Metals Corp. – Preliminary Economic Assessment #3 on the Tamarack North Project
Permit or Approval Regulatory Agency Regulatory Citation Description
Water Appropriation Permit
MDNR MN Rules Chapter 6115.0600 to 6115.0810
Ch. 6115.0600 to 6115.0810 require a water use permit for withdrawal of more than 10,000 gallons per day or 1M gallons per year from waters of the state. Permit applications for metallic mining facilities must provide additional information per Ch. 6115.0720 including withdrawal plans, water use and storage, and disposal of waters of the state.
Public Waters Permit Program
MDNR and Aitkin County
MN Rules Chapter 6115.0160 to 6115.0280 MN Status 103G.245; Aitkin County
Applies to a facility that changes or diminishes the course, current, or cross section of public waters, entirely or partially within waters of the state, including filling, excavating or placing of materials in or on the beds of public waters. State permitting would also be required for work in delineated wetland areas.
Wetland Permits
Section 404 of the Clean Water Act Permit
USACE CWA 40 CFR 230; Section 404(b)(1)
Filling, excavating or placing materials into either waters of the state or waters of the US, will require wetlands permits. Depending on the classification of the wetland area, both state and federal jurisdictions could be triggered. For dredge and fill impacts to wetlands or waters of the US - USACE permit required. under the jurisdiction of the USACE.
Minnesota Wetland Conservation Act – Wetland Replacement Plan Approval
MDNR MN Rules Chapters 8420 and 6132.5300
Wetland permitting necessary for impacts under a Permit to Mine require Wetland Replacement Plan as part of approval. This follow the WCA but is administered by the MDNR.
Section 401 Water Quality Certification or Waiver
MPCA CWA 40 CFR 230: Section 401
For projects needing federal authorization with a discharge to the waters of the US. Required in conjunction with Section 404 Permit.
State Agency – MPCA Permits
Individual NPDES and SDS Permits
MPCA MN Rules Chapter 7001.1035
NPDES permit is required for wastewater discharge containing any pollutants to Waters of the US. The SDS may be applied to the project through the minimal seepage through lined facilities and the backfilled excavation.
NPDES Construction Storm Water Permit
MPCA MN Rules Chapter 7090.2000 to 7090.2060
Likely a general permit will not be applicable. The permit requires implementation of Best Management Practices in accordance with a Storm Water Pollution Prevention Plan addressing the construction duration.
Air Permit MPCA MN Rules Chapter 7007
All facilities with sources of air emissions are required to obtain an air permit, unless it meets certain exemptions under Ch. 7007.0300. MPCA has several types of air permits that may apply depending on facility-wide emission estimates. A likely air permit type for this facility is a state synthetic minor permit.

Document Number
Revision
Page
Rev Date
G4932-RPT-01 0 08 Jan 2021 298
Talon Metals Corp. – Preliminary Economic Assessment #3 on the Tamarack North Project
Permit or Approval Regulatory Agency Regulatory Citation Description
USEPA Requirements
Underground Injection Control (UIC) Permit
USEPA 40 CFR 144.3. 146; MN Rules 4725.2050 for variance approval
Applicable to activities that could allow movement of fluid containing contaminants into an underground source of drinking water and that violate primary drinking water standards. If a Class V injection well is determined for mine backfill, a variance from the MN non-injection rule is needed from MDH.
Miscellaneous Requirements
Permit for the Take of Threatened and Endangered Species Incidental to a Development Project
MDNR MN Rules Chapter 6212.1800 to 6212.2300
A permit may be required if one removes, transports or sells any portion of a species designated as threatened, endangered or a species of special concern. A list of species is codified at Ch. 6134. Permits are available for certain conditions by the MDNR. Certain exemptions are also available, especially for situations where unknowing destruction takes place.
Hazardous Waste Generator License
MPCA MN Rules Chapter 7045.0225
Hazardous waste generators must obtain a license for each generation site. Facilities generating more than 10 gallons of hazardous waste are subject to annual fees and reporting.
Aboveground Storage Tank Permit and Notification
MPCA MN Rules Chapter 7001.4205
Facilities storing less than 1M gallons of industrial products need to notify MPCA of tanks storing 1,100 gallons or more.
Open Burning Permit MDNR MN Statute 88.16 Permission is required from the local MDNR forestry office or fire warden prior to starting any open fire.
Subsurface Sewage Treatment System (SSTS) Permit
Aitkin County MN Rules Chapter 7082.500 and Aitkin County Individual Sewage Treatment System and Wastewater Ordinance No. 1
By state rule, Aitkin County has been delegated authority to issue licenses for SSTS in its jurisdiction. Counties are required to adopt ordinances in accordance with Ch. 7080 and 7081. Aitkin County has rules for obtaining a permit under its own ordinance.
Aquatic Vegetation Removal Permit
MDNR MN Rules Chapter 6280
Permit is required for removal of emergent and submerged vegetation, but removal of the latter may be allowed if area is less than 2,500 square ft. Physical removal of floating leaf vegetation is allowed if channel is no greater than 15 ft wide.
License to Cross Public Lands and Waters
MDNR MN Rules Chapter 6135
For installation of utility services (as defined in statute), across MDNR administered land and public waters.
Easement or Lease to Construct
MDNR MN Statutes 84.63 and 84.631
If a road is constructed across state land, either a lease or easement must be issued by the state.
Road Across State Land MDNR Easements are issued for constructing and maintaining roads, while leases are issued for the long-term right to use or occupy land.

Document Number
Revision
Page
Rev Date
G4932-RPT-01 0 08 Jan 2021 299
Talon Metals Corp. – Preliminary Economic Assessment #3 on the Tamarack North Project
Permit or Approval Regulatory Agency Regulatory Citation Description
Railroad Spur Installation
Surface Transportation Board (STB) and/or MN Department of Transportation
MN Rules Chapter 8830.2150 and 8830.9991
If a railroad spur is installed, approval may depend on a multifaceted jurisdictional test through the STB. An operating license may be needed if a railroad crossing includes necessity for a warning signal
Conditional Use Permit Aitkin County General Zoning Ordinance; Shoreland Management Ordinance; Floodplain Management Ordinance; Mining Ordinance
Pursuant to county ordinances for zoning, shoreland management, floodplain management, mining of metallic minerals and wetlands protection, a conditional use permit will be required.
Building Permits Aitkin County City Ordinance Permits will be required for building construction, including compliance with various building codes.
Electrical Transmission MN Public Utility Commission (MPUC)
MN Rules Chapter 7849 and 5350
MN Statutes 216B.42
If transmission upgrades are needed, coordination will be needed between transmission owners in the area. A site or route permit may be needed from the MPUC if it involves installation of power lines or substations at certain thresholds or re-routing of high transmission line to serve a single customer and will be located on property owned at least 80% by the customer.
Permit to Mine (MDNR)
Pursuant to Minnesota Rules, chapter 6132, a Permit to Mine will be required and signifies
a legal approval issued by the commissioner of the MDNR to conduct a mining operation.
The purpose of the MDNR Permit to Mine program is to control possible adverse
environmental effects of nonferrous metallic mineral mining, to preserve natural resources,
and to encourage planning of future land utilization (Minnesota Rules, part 6132.0200).
Therefore, it is MDNR policy that mining activities be planned and executed in a manner to
reduce environmental impacts, mitigate impacts where unavoidable, and reclaim the mining
area to a condition that protects natural resources and minimizes the need for maintenance
to the extent practicable.
The nonferrous mining rules set forth in Minnesota Rules, chapter 6132 include a detailed
procedure for obtaining a Permit to Mine, including requirements for:
• Mine waste characterization (Minnesota Rules, part 6132.1000);
• The contents of a Permit to Mine application (Minnesota Rules, part 6132.1100);
• Financial assurance (Minnesota Rules, part 6132.1200); and

Document Number
Revision
Page
Rev Date
G4932-RPT-01 0 08 Jan 2021 300
Talon Metals Corp. – Preliminary Economic Assessment #3 on the Tamarack North Project
• Annual reporting (Minnesota Rules, part 6132.1300).
Reclamation standards are further defined in Minnesota Rules, part 6132.2000 through part
6132.3200 and include standards for siting, buffers, reactive mine waste, OB portion of
pitwalls, storage pile design, tailings basins, heap and dump leaching facilities, vegetation,
dust suppression, air overpressure and ground vibrations from blasting, subsidence,
corrective action, and closure and post-closure maintenance. Meeting these standards is
accomplished through the use of appropriate mining methods, proper mine waste
management, and implementing passive reclamation procedures that maximize physical,
chemical, and biological stabilization of areas disturbed by mining, along with the use of
active treatment technologies when necessary. The requirements for financial assurance
are also determined in the Permit to Mine application process. Financial assurance is
designed to address the cost for reclamation of the Tamarack North Project, should the mine
be required to close for any reason at any time, and includes closure and post-closure
maintenance activities. The financial assurance requirements are reviewed annually by the
MDNR and can be adjusted at any time.
NPDES/SDS Permits (MPCA)
Permits with the intent to protect waters for uses such as drinking water, aquatic life, and
recreation are required under the NPDES/SDS program (refer to Minnesota Statutes,
Section 115.04 and Section 115.07), which is administered by the MPCA.
The NPDES program applies to wastewater and stormwater discharges from point sources
into surface waters. Potential project discharges requiring permit coverage may include mine
dewatering, wastewater, industrial stormwater, and construction stormwater. Pursuant to
water quality standards of receiving and downstream waters, the individual NPDES/SDS
permit establishes wastewater discharge effluent limitations and monitoring requirements.
An anti-degradation analysis is required at the time of the application. The objective of the
anti-degradation analysis is to demonstrate that the project will achieve and preserve the
highest possible water quality in surface waters, such as lakes, streams, and wetlands, by
maintaining and protecting existing uses. Where applicable, the analysis will document how
degradation of high water quality is avoided and minimized and only allowed for the purpose
of important economic or social development.
Document Number
Revision
Page
Rev Date
G4932-RPT-01 0 08 Jan 2021 301
Talon Metals Corp. – Preliminary Economic Assessment #3 on the Tamarack North Project
Coverage for industrial stormwater discharges will likely be included with the individual
NPDES/SDS permit. Additionally, a Construction Stormwater General Permit requires
implementation of best management practices and permanent stormwater management
techniques specific to managing stormwater run-off from construction sites. Water
management during construction and operations must comply with the requirements of the
permits by implementing best management practices described in the Stormwater Pollution
Prevention Plans (SWPPPs).
The SDS program applies to the construction and operation of disposal systems, regardless
of whether they discharge to surface waters and/or groundwater. A groundwater non-
degradation analysis is required at the time of the application. The objective of the non-
degradation analysis is to show that, to the maximum practicable extent, groundwater will
be maintained at its natural quality. Where applicable, the analysis will document how a
proposed change is justifiable for economic or social development and will not preclude
appropriate present and future uses of the groundwater.
Air Permit (MPCA)
For most sizable mining facilities, an air permit will be needed before construction and
operations can begin (40 CFR parts 52 and 70. Minnesota rules part 7007). State and federal
programs have been established to protect air quality as it relates to human health and the
environment. Applicability of federal and state air permitting rules will need to be evaluated
for the project. The applicable rules depend on the quantity and type of pollutants emitted
and the potentially affected air shed.
Production, design and operational details are incorporated into the permit and are the basis
for the facility emission calculations. Regardless of the type of air permit needed, the
environmental review and permit application must demonstrate how the facility will maintain
compliance with applicable standards. Analyses include the Class I modeling evaluation of
facility impacts on air quality at wilderness areas, national parks and other similar air sheds;
and Class II modeling to demonstrate compliance with National Ambient Air Quality
Standards (NAAQS). Federal and state rules may also mandate Best Available Control
Technology, New Source Performance Standards, and National Emission Standards for
Hazardous Air Pollutants (NESHAPS). Evaluations of Hg emissions, emission deposition on
soils and local water bodies, and Air Emission Risk Analysis (AERA) will be documented.
Document Number
Revision
Page
Rev Date
G4932-RPT-01 0 08 Jan 2021 302
Talon Metals Corp. – Preliminary Economic Assessment #3 on the Tamarack North Project
Management approaches to airborne dust avoidance and mitigation are also included in the
air permit application.
Air permits are specific to infrastructure, equipment selection, and operations descriptions.
Changes in the design basis and selections necessitates a permit amendment evaluation
that may require changes to the permit. Permit amendments can range from minor to major
levels of effort and time.
Wetland Permitting
A permit from the USACE for the discharge of dredged or fill material to waters of the US is
required under Section 404 of the Clean Water Act. Where project impacts to wetlands are
unavoidable, compensation (i.e. the construction, restoration or enhancement of wetlands)
is required as replacement for affected wetlands. In order to obtain the Section 404 Permit,
a Section 401 Water Quality Certification is required from the MPCA.
The MDNR regulates impacts to wetlands and other waters listed on the state’s Public
Waters Inventory. The Minnesota Wetlands Conservation Act (WCA) requires a state permit
for impacts to wetlands beyond those covered by USACE and/or public waters permitting. A
Wetland Replacement Plan is required and would be incorporated into the mining and
reclamation plans for the Tamarack North Project under the Permit to Mine. Aitkin County
will also require compliance with its wetland ordinances.
Applications for wetland impacts and an associated Wetland Replacement Plan needs to be
submitted to the USACE, MDNR, and Aitkin County under each entity’s respective
application process. Financial assurance could be part of the WCA permitting.
20.6 Social or Community Engagement
The primary agencies that Talon interacts with for the Tamarack Project include the MDNR,
MPCA, MDH, USACE, and Aitkin County.
With the status of the Tamarack Project, Talon’s current objective is to maintain open
communication with agencies in order to keep regulators informed on project activities and
future plans. The MDNR and Aitkin County managers have both attended site tours to learn
about the Company and activities for moving the project forward. The MPCA has participated
in Talon presentations and interactions with MDH and ACE primarily fall into communications

Document Number
Revision
Page
Rev Date
G4932-RPT-01 0 08 Jan 2021 303
Talon Metals Corp. – Preliminary Economic Assessment #3 on the Tamarack North Project
regarding exploration work permits. There have been no issues to date with these agencies
approving Talon’s work permits. All primary agencies receive Talon’s quarterly newsletter
updates as an additional avenue to stay up to date on the project.
Talon maintains engagement with the community by attending local meetings, sending out
a community newsletter, and maintaining an open-door policy for anyone to stop by and
learn more about the project. This communication is proactive, providing information before,
during, and after any increased activity or changes to the project. Talon also strives to
participate in local events and support local organizations. This engagement will increase as
the project reaches the PFS stage.
Discussion of Mine Closure
Talon’s strategy is to engage with stakeholders with the end in mind. A robust closure plan
that engages stakeholders is therefore ongoing. Developing an understanding of
stakeholder concerns, needs, and preferences will help shape plans that will avoid adverse
environmental impacts while at the same time achieving common end goals. A detailed
closure plan will be developed in future study and will align with state PTM and reclamation
requirements.

Document Number
Revision
Page
Rev Date
G4932-RPT-01 0 08 Jan 2021 304
Talon Metals Corp. – Preliminary Economic Assessment #3 on the Tamarack North Project
CAPITAL AND OPERATING COSTS
21.1 Capital Costs
Nickel Powder Scenario and Nickel Concentrate Scenario
The total estimated capital cost of the Ni Powder Scenario or the Ni Concentrate Scenario
is US$394.99M and is summarized in Table 21-1, of which US$315.80M is the initial cost
required during the first three years, including the first production year. The amounts include
indirect costs and contingency which are detailed in the various sections further below.
Table 21-1: Tamarack North Project CAPEX Summary - Ni Powder or Ni Concentrate Scenarios
Area Initial Cost
(US$) Sustaining Cost
(US$) Total Cost
(US$)
Mine $130.15M $70.32M $200.47M
Process and Surface Facilities $167.51M $ 22.01M $189.51M
Closure Costs other than CFTF - $10.00M $10.00M
Salvage Value of Mill - ($5.00M) ($5.00M)
Sub Total* $297.66M $97.33M $394.99M
Working Capital $18.15M ($18.15M) -
Total* $315.80M $79.18M $394.99M
* May not total due to rounding
All costs are estimated in fourth quarter 2020 US dollars, without provision for inflation or
escalation.
Nickel Sulphate Scenario
The total estimated capital cost of the Ni Sulphate Scenario is US$646.44M and is
summarized in Table 21-2, of which US$552.49M is the initial cost required during the first
three years, including the first production year. The amounts include indirect costs and
contingency which are detailed in the various sections further below.

Document Number
Revision
Page
Rev Date
G4932-RPT-01 0 08 Jan 2021 305
Talon Metals Corp. – Preliminary Economic Assessment #3 on the Tamarack North Project
Table 21-2: Tamarack North Project CAPEX Summary - Ni Sulphate Scenario
Area Initial Cost
(US$) Sustaining Cost
(US$) Total Cost
(US$)
Mine $130.15M $70.32M $200.47M
Process and Surface Facilities $390.56M $50.41M $440.97M
Closure Costs other than CFTF - $10.00M $10.00M
Salvage Value of Mill - ($5.00M) ($5.00M)
Sub Total* $520.71M $125.73M $646.44M
Working Capital $31.90M ($31.90M) -
Total* $552.61M $93.83M $646.44M
* May not total due to rounding
All costs are estimated in fourth quarter 2020 US dollars, without provision for inflation or
escalation.
Mine Capital Costs
The estimated initial mine CAPEX comprises decline development, vent shaft development
and associated infrastructure, mine surface facilities, mobile equipment, underground
development and services.
It is assumed that the mine will be developed and operated with mine contractors, but
equipment will be owner-supplied, therefore mobile equipment purchases are included in
the CAPEX.
Sustaining CAPEX includes ongoing development as well as mobile equipment rebuild and
replacement costs over the LOM.

Document Number
Revision
Page
Rev Date
G4932-RPT-01 0 08 Jan 2021 306
Talon Metals Corp. – Preliminary Economic Assessment #3 on the Tamarack North Project
Table 21-3: Mine CAPEX Summary – All Scenarios
Area Initial Cost
(US$) Sustaining Cost
(US$) Total Cost
(US$)
Primary Access $21.15M - $21.15M
Underground Development $ 45.27 M $7.53M $52.79M
Mobile Equipment $28.79M $49.26M $78.05M
Fixed Equipment and Services $18.62M $9.04M $27.66M
Sub-total $113.83M $65.83M $179.66M
Indirect Costs $9.01M $3.67M $12.68M
Contingency $7.31M $0.83M $8.13M
Total * $130.15M $70.32M $200.47M
* May not total due to rounding
Process and Surface Facilities Capital Costs
The estimated process and surface facilities CAPEX comprises the process plant, plant
infrastructure (concentrator building, electrical substation and distribution, reverse osmosis
plant, water supply system, and fire protection), CFTF and paste backfill, and other surface
facilities (administrative office, maintenance shops, mine change house, surface
warehouses, garages, security, parking lots). The CFTF is built-up in two stages over the
mine life (first phase during construction and expansion phase in year four), followed by
closure in the final year of operation.

Document Number
Revision
Page
Rev Date
G4932-RPT-01 0 08 Jan 2021 307
Talon Metals Corp. – Preliminary Economic Assessment #3 on the Tamarack North Project
Table 21-4: Process and Surface Facilities CAPEX Summary – Ni Powder Scenario or Ni Concentrate
Scenario
Area Initial Cost
(US$) Sustaining Cost
(US$) Total Cost
(US$)
Process Plant $48.41M $9.68M $58.09M
Plant Infrastructure $30.64M - $30.64M
CFTF and Paste Backfill $21.85M $9.72M $31.58M
General Plant Services $6.05M - $6.05M
Other Surface Facilities $1.06M - $1.06M
Sub-total $108.01M $19.41M $127.42M
Indirect Costs $28.65M - $28.65M
Contingency $30.84M $2.60 $33.45M
Total * $167.51M $22.01M $189.51M
* May not total due to rounding
Table 21-5: Process and Surface Facilities CAPEX Summary – Ni Sulphate Scenario
Area Initial Cost
(US$) Sustaining Cost
(US$) Total Cost
(US$)
Process Plant $194.06M $38.81M $232.87M
Plant Infrastructure $29.62M - $29.62M
CFTF and Paste Backfill $22.58M $9.00M $31.58M
General Plant Services $5.72M - $5.72M
Other Surface Facilities $0.79M - $0.79M
Sub-total $252.76M $47.81M $300.57M
Indirect Costs $63.64M - $63.64M
Contingency $74.16M $2.60M $76.77M
Total * $390.56M $50.41M $440.97M
* May not total due to rounding

Document Number
Revision
Page
Rev Date
G4932-RPT-01 0 08 Jan 2021 308
Talon Metals Corp. – Preliminary Economic Assessment #3 on the Tamarack North Project
Other Capital Costs
Closure costs excluding the CFTF are estimated at US$10M and relate to the removal of the
process plant and other surface infrastructure facilities as well as land reclamation and other
general site closure costs. Closure costs associated with the CFTF, such as a closure cover
on the CFTF facility and drainage equipment are included in Process and Surface Facilities
Capital Costs in the amount of US$6.65M including contingency.
As the mill, equipment and facilities will have been in operation for approximately 9 years, it
is assumed that the mill and other components of the Tamarack North Project will be able to
be sold on the secondary and scrap markets for US$5M at the end of the mine life.
21.2 Operating Costs
The OPEX for the Tamarack North Project at the processing plant design capacity of
3,600 tpd is summarized in Table 21-6 below.
Table 21-6: Operating Costs in US$/t of Mill Feed
Cost Category
Operating Cost (US$/t of Mill Feed)
Ni Powder Scenario
Ni Sulphate Scenario
Ni Concentrate Scenario
Mining $27.49 $27.49 $27.49
Processing (milling/concentrating) $14.25 $14.25 $14.25
Hydrometallurgical Refining - $26.68 -
Product Handling, Transportation, Losses, and Insurance
$1.90 $2.22 $10.29
CFTF $0.75 $0.75 $0.75
G&A $3.76 $4.60 $3.76
Total OPEX * $48.15 $75.99 $56.54
* May not total due to rounding

Document Number
Revision
Page
Rev Date
G4932-RPT-01 0 08 Jan 2021 309
Talon Metals Corp. – Preliminary Economic Assessment #3 on the Tamarack North Project
Mine Operating Costs
The estimated mine OPEX average over the mine life is $27.49/t of mill feed or material
mined. This average cost includes direct mining costs, including contract mining labour (the
CAPEX includes purchase of mobile mining equipment) in addition to backfill, stope
development (in waste), ore flow, ventilation, and mine services costs. Costs were derived
from guidance from OEMs, and recent contacting prices obtained by DRA from reputable
mining contractors.
The updated mine OPEX costs for this PEA are considerably less than the previous study.
This is largely attributed to the realized efficiencies of larger stopes (15 m W x 25 m H x 30
m L in this January 2021 PEA, vs 7.5 m W x 15 m H x 15 m L in the March 2020 PEA),
efficiency gains for utilizing a road header for the development of the sill drifts, relocation of
key infrastructure on surface resulting from the decline ramp and utilizing a vertical conveyor
as opposed to skip hoisting as the primary ore flow circuit).
A summary of the mine OPEX split by mining method is shown in Table 21-7 below.
Table 21-7: Mine Operating Cost Summary
Mining Method
Tonnes Mined
Percentage of Total
Mine Operating
Cost (US$/t of
mill feed)
Direct Cost
Indirect Cost
Total Cost
Drift & Fill 779,382 7.2% $39.95 $18.58M $12.55M $31.13M
Long hole Stoping 8,456,397 78.6% $22.86 $57.08M $136.20M $193.28M
Mineralized Material Development
1,523,017 14.2% $46.88 $46.86M $24.53M $71.39M
Totals 10,758,796 100.0% $27.49 (weighted average)
$122.52M $173.28M $295.80M
Mine sustaining CAPEX is an additional $70.32M over the LOM, equivalent to $6.54/t mined
or of mill feed. The two pre-production years and the first operating years were classified as
initial CAPEX.

Document Number
Revision
Page
Rev Date
G4932-RPT-01 0 08 Jan 2021 310
Talon Metals Corp. – Preliminary Economic Assessment #3 on the Tamarack North Project
Process Plant Operating Costs
A breakdown of the processing operating costs is provided in Table 21-8 and further details
for the basis of the estimates are provided in the following sections.
Table 21-8: Processing Operating Cost Breakdown
Cost Category
All Scenarios
Annual Cost US$/year
Unit Cost US$/t of Mill
Feed
Percentage of Total
Labour $6,615,000 $5.03 35.3
Electrical Power $4,370,921 $3.33 23.3
Reagents $2,753,487 $2.10 14.7
Grinding Media $1,996,052 $1.52 10.7
Consumables $2,360,319 $1.80 12.6
Spares & Miscellaneous $629,418 $0.48 3.4
Total Processing Costs* $18,725,198 $14.25 100.0
* May not total due to rounding
A breakdown of the hydrometallurgical refining costs for the hydrometallurgical facility is
provided in Table 21-9 and further details of the basis of the estimates are provided in the
following sections.
Table 21-9: Hydrometallurgical Refining Operating Cost Breakdown
Cost Category Annual Cost
US$/year Unit Cost US$/t of
Hydromet Feed
Unit Cost US$/t of Mill
Feed
Percentage of Total
Labour $8,896,500 $71.67 $7.44 27.9%
Electrical Power $3,153,600 $25.41 $2.64 9.9%
Reagents $11,575,183 $93.25 $9.68 36.3%
Consumables $5,906,321 $47.58 $4.94 18.5%
Spares & Miscellaneous $2,362,528 $19.03 $1.98 7.4%
Total Processing Costs * $31,894,132 $256.94 $26.68 100.0%
*May not total due to rounding
Methodology

Document Number
Revision
Page
Rev Date
G4932-RPT-01 0 08 Jan 2021 311
Talon Metals Corp. – Preliminary Economic Assessment #3 on the Tamarack North Project
The operating costs are estimated based on the actual projected annual tonnes of Ni
concentrate generated from the concentrator that feeds into the hydrometallurgical refinery.
The operating cost estimates considered pertinent metallurgical results and mass balance
outputs.
21.2.2.1 Labour
Staffing is established based on the resource requirements of plants with comparable size
and unit operations. Staffing requirements were differentiated between mine and mill
operation, maintenance, technical, and administration.
21.2.2.2 Electrical Power
An electricity cost of US$0.06/kWh was utilized for cost estimation purposes, which is
consistent with publicly available posted rates for the region. The total connected power of
the concentrator was determined by summation of the connected power of all major
mechanical equipment plus 20% for pumps and plant services. The total power draw was
estimated at 85% of the total connected power.
The total electrical power draw of the hydrometallurgical plant is estimated at 6.0 MW.
21.2.2.3 Reagents
The reagent dosages were established using the metallurgical data that was developed in
recent test programs at XPS in Sudbury and SGS in Lakefield. The reagents costs were then
calculated using recent prices from reputable North American reagent suppliers.
In cases where no test results were available such as the diluent and extractant consumption
in the SX circuit, data from comparable plants were used to estimate the reagent costs.
21.2.2.4 Grinding Media
The grinding media consumption was determined using a Bond abrasion work index that
was projected from other comminution data, anticipated grinding media load, mill
dimensions, and anticipated grinding energy. The unit costs for the grinding media were
obtained from North American grinding media suppliers.

Document Number
Revision
Page
Rev Date
G4932-RPT-01 0 08 Jan 2021 312
Talon Metals Corp. – Preliminary Economic Assessment #3 on the Tamarack North Project
21.2.2.5 Consumables, Spares and Miscellaneous
The concentrator consumables, which include all items except reagents and grinding media,
were calculated as 15% of the labour, electrical, reagents, and grinding media costs. The
concentrator allowance for spares and miscellaneous items was determined as 4% of the
labour, electrical, reagents, and grinding media costs.
The maintenance consumables for the hydrometallurgical plant were estimated as 25% of
labour, electrical, and reagent costs. The allowance for spares and miscellaneous items for
the hydrometallurgical plant was established at 10% of the labour, electrical, and reagent
costs.
Product Handling, Transportation, Losses, and Insurance
This item consists of US$1.90/t of mineralized material for the Ni Powder Scenario,
US$2.22/t of mineralized material for the Ni Sulphate Scenario and US$10.29/t of
mineralized material for the Ni Concentrate Scenario, related to the handling of concentrates
or Ni sulphate, transportation, losses and insurance costs, with the exception that Ni
concentrates in the Ni Powder Scenario and Ni sulphate in the Ni Sulphate Scenario is sold
on an FOB basis.
Co-disposed Filtered Tailings Facility (CFTF)
Operating expenses for the CFTF consist of labour, fuel, maintenance and perimeter
embankment filters.
General and Administrative (G&A)
The G&A costs are estimated at US$4.5M per year for the Ni Powder and Ni Concentrate
Scenarios and US$5.5M per year for the Ni Sulphate Scenario, and include rent, utilities,
insurance, office, property taxes, mineral leases and salaries related to management,
accounting, human resources, procurement, environment, safety and administration.

Document Number
Revision
Page
Rev Date
G4932-RPT-01 0 08 Jan 2021 313
Talon Metals Corp. – Preliminary Economic Assessment #3 on the Tamarack North Project
ECONOMIC ANALYSIS
22.1 Basis of Evaluation
DRA has prepared its assessment of the Tamarack North Project on the basis of a financial
model, from which NPV, IRR, payback and other measures can be determined. NPV and
IRR can assist in the determination of the economic value and viability of a project.
The objective of the study is to determine the viability of the proposed facilities to mine and
process the Tamarack North Project mineralized material. In order to do this, the cash flow
arising from the base case was forecast, enabling a computation of NPV and IRR. The
sensitivity of this NPV and IRR to changes in the base case assumptions is then examined.
Three scenarios, as detailed in Section 19 “Market Studies and Contracts”, were modelled:
Scenario Description
1 Nickel Powder Scenario Nickel concentrates produced at site and thereafter used to produce refined nickel powder by a third party for the EV market
2 Nickel Sulphate Scenario Nickel concentrates from the project are refined at site in a hydrometallurgical refinery to produce nickel sulphates which are sold to the EV market
3 Nickel Concentrate Scenario Nickel concentrates produced at site are transported and sold to a smelter, who in turn transports a product to a refinery to produce LME-
grade nickel primarily for the stainless steel market
Under all the three scenarios, the Cu concentrate produced from the project is shipped to a
traditional Cu smelter. The CAPEX of the Ni Sulphate Scenario is greater than that of the Ni
Powder and Ni Concentrate Scenarios, which corresponds with higher revenues and OPEX
as a result of additional hydrometallurgical refining processing costs associated with the
hydrometallurgical refinery. Hydrometallurgical refining yields a value-added product,
namely Ni sulphate, that sells for a premium. The Cu produced by the hydrometallurgical
refinery is combined with the Cu concentrate.
The financial model is based on the results of the PEA which is preliminary in nature and
includes inferred resources that are considered too speculative geologically to have the
economic consideration applied to them that would enable them to be categorized as mineral
reserves, and there is no certainty that the preliminary economic assessment will be realized.

Document Number
Revision
Page
Rev Date
G4932-RPT-01 0 08 Jan 2021 314
Talon Metals Corp. – Preliminary Economic Assessment #3 on the Tamarack North Project
22.2 Economic, Taxation and Royalty Assumptions
Exchange Rates
All cost estimates are forecast in US dollars and metal prices are in US dollars, therefore no
exchange rate is required. All results are expressed in US dollars.
Inflation Rates and Escalation
All cost estimates are prepared using constant, fourth quarter 2020 dollars, i.e. in “real”
dollars without provision for inflation or escalation.
Weighted Average Cost of Capital
The weighted average cost of capital is determined based on many factors relating to risk
and return including:
• location and country risk;
• characteristics of the project, such as:
o access to infrastructure;
o availability of labour;
o expected position on the global cost curve;
o project size;
o project complexity such as risks associated with mining, processing and capital cost
overruns.
• that the forecast is in “real” as opposed to nominal dollars;
• availability and cost of capital such as debt financing and off-take financing;
• corporate income tax rates; and
• the metal prices used in the forecast.
Based on the above, DRA has assumed a 7% discount rate as the weighted average cost
of capital for the Tamarack North Project as the base case. Alternative results at different
discount rates are provided for comparative purposes.

Document Number
Revision
Page
Rev Date
G4932-RPT-01 0 08 Jan 2021 315
Talon Metals Corp. – Preliminary Economic Assessment #3 on the Tamarack North Project
Metal Prices
“Base Case”, “Low” and “Incentive” metal prices are discussed in Section 19. Price
assumptions presented in Section 19 are replicated in Table 22-1 below, and are in “real”
(i.e. without inflation) dollars.
Table 22-1: Assumed Real Metal Prices
Unit Low Base Case Incentive
Ni US$/lb $6.75 $8.00 $9.50
Cu US$/lb $2.75 $3.00 $3.50
Co US$/lb 15.00 25.00 $30.00
Pt US$/oz $1,000 $1,000 $1,000
Pd US$/oz $1,000 $1,000 $1,000
Au US$/oz $1,300 $1,300 $1,300
Royalty
Royalties in Minnesota are complex and based on a sliding-scale that increases
exponentially with an increase in the value of the mineralized material. Since the mineralized
material value used to determine the royalty is not updated annually, a Net Revenue Inflation
Adjustment (NRIA) must be deducted from a mine’s NSR per tonne (imperial tonne) before
transportation costs to arrive at an adjusted NSR per tonne, which is then compared to a list
of values per tonne and royalties provided in a table by the state of Minnesota.
The NRIA is calculated based on the US producer price inflation index (PPI) of the current
period and the PPI for November 1994 (“Base Index”) which had a value of 121.5, using the
following formula:
• (PPI USA – 121.5) / 121.5 x 75
In order to forecast the NRIA, an estimated inflation rate of 2.25% was used. The NRIA for
2020 is approximately US$49.21. The Minnesota royalty rates mapped to present-day
mineralized material value less the NRIA (i.e. a 1994 ore value) are shown in Table 22-2.

Document Number
Revision
Page
Rev Date
G4932-RPT-01 0 08 Jan 2021 316
Talon Metals Corp. – Preliminary Economic Assessment #3 on the Tamarack North Project
Table 22-2: Minnesota Royalty Rates to be Applied to Present-day NSR per tonne Less the NRIA
Index Royalty Index Royalty Index Royalty Index Royalty Index Royalty
$ 75.00 3.95% $ 100.00 4.19% $ 200.00 6.39% $ 300.00 10.53% $ 400.00 16.62%
$ 80.00 3.99% $ 110.00 4.33% $ 210.00 6.71% $ 310.00 11.05% $ 410.00 17.34%
$ 85.00 4.03% $ 120.00 4.48% $ 220.00 7.06% $ 320.00 11.59% $ 420.00 18.07%
$ 90.00 4.08% $ 130.00 4.65% $ 230.00 7.43% $ 330.00 12.15% $ 430.00 18.83%
$ 95.00 4.14% $ 140.00 4.84% $ 240.00 7.81% $ 340.00 12.73% $ 440.00 19.61%
$ 150.00 5.05% $ 250.00 8.21% $ 350.00 13.33% $ 444.01 20.00%
$ 160.00 5.28% $ 260.00 8.64% $ 360.00 13.95%
$ 170.00 5.52% $ 270.00 9.08% $ 370.00 14.59%
$ 180.00 5.79% $ 280.00 9.55% $ 380.00 15.25%
$ 190.00 6.08% $ 290.00 10.03% $ 390.00 15.93%
Under the Ni Powder Scenario, the average net revenue per (imperial) tonne of ore over the
LOM is US$182/t before the NRIA and US$130/t after the NRIA, resulting in an average
royalty of approximately 5.6%. Under the Ni Sulphate Scenario, the average net revenue
per (imperial) tonne of ore over the LOM is US$197/t before the NRIA and US$145/t after
the NRIA, resulting in an average royalty of approximately 6.5%. Under the Ni Concentrate
Scenario, the average net revenue per (imperial) tonne of ore over the LOM is US$182/t
before the NRIA and US$129/t after the NRIA, resulting in an average royalty of
approximately 5.6%.
Private royalties of 1.86% on NSR were also included, which primarily reflects a 1.85% NSR
royalty to a subsidiary of Triple Flag Mining Finance Bermuda Ltd. (“Triple Flag Royalty”).
The Triple Flag Royalty is 3.5% of NSR and will be based on Talon’s participating interest in
the Tamarack Project, except (i) where Talon’s interest reduces below 17.56%, in which
case it will be paid assuming Talon’s interest is unchanged at 17.56% or (ii) where Talon
has vested at 51% and Talon’s interest reduces below 51%, in which case it will be paid
assuming Talon’s interest is unchanged at 51%; or (iii) where Talon has vested at 60% and
Talon’s interest reduces below 60%, in which case it will be paid assuming Talon’s interest
is unchanged at 60%.
The royalty agreement contains a one-time put right pursuant to which the Royalty Holder
has an option, exercisable within 10 calendar days of March 7, 2022, to cause Talon to
repurchase the entire NSR royalty for a cash payment of US$8.6M (“the Royalty Put

Document Number
Revision
Page
Rev Date
G4932-RPT-01 0 08 Jan 2021 317
Talon Metals Corp. – Preliminary Economic Assessment #3 on the Tamarack North Project
Option”). The Royalty Put Option may be accelerated in a number of circumstances,
including upon an event of default as defined under the Royalty Agreement. In the event the
Royalty Holder does not exercise the one-time put right, Talon has a one-time option to
reduce the percentage of the NSR royalty by 1.65% from 3.5% to 1.85% in exchange for
cash in the amount of US$4.5M.
Given that the US$4.5M buy-down of the royalty is expected to occur in 2022 and is prior to
the construction period of the Tamarack North Project and outside of the forecast period
contemplated in the LOM model, a 1.85% royalty has been applied in the financial model.
Were a 3.5% royalty included instead of the 1.85% royalty, the after-tax NPV would decrease
by approximately 2.8% to 3.6% and the after-tax IRR would decrease by approximately 0.6%
to 0.7%.
Taxation
The forecast uses a federal corporate tax rate of 21% and a Minnesota Occupation Tax rate
of 2.45%. The Minnesota tax is deductible against federal tax. Federal tax deductions related
to depletion respecting limitations were considered in accordance with US tax law for mining
companies. The combined federal and state tax rate is therefore 22.94%.
22.3 Technical Assumptions
Mine Production Schedule
The following graph illustrates the annual mining rate by mining method. The peak mining
rate is 3,728 tpd in year four and the average during years 2 to 8 is 3,544 tpd.

Document Number
Revision
Page
Rev Date
G4932-RPT-01 0 08 Jan 2021 318
Talon Metals Corp. – Preliminary Economic Assessment #3 on the Tamarack North Project
Figure 22-1: Mining Production Schedule (by mining method, tonnes and years)
Processing Schedule
Processing occurs concurrently with mining. The peak processing rate of 3,728 tpd occurs
in year four which is consistent with the capacity of the concentrator of 3,600 tpd plus a 20%
design factor. The average milling rate during years two to eight is 3,544 tpd.
Figure 22-2 illustrates the milled tonnes and grade profile over the LOM. The equivalent
grades are calculated using the base case metal prices in Table 22-1.
0
200,000
400,000
600,000
800,000
1,000,000
1,200,000
1,400,000
1,600,000
1 2 3 4 5 6 7 8 9
Mined tonnes by mining method
Drift & fill mining Bulk mining Ore development

Document Number
Revision
Page
Rev Date
G4932-RPT-01 0 08 Jan 2021 319
Talon Metals Corp. – Preliminary Economic Assessment #3 on the Tamarack North Project
Figure 22-2: LOM Milled Tonnes and Grade Profile
Net Smelter Return (NSR)
In both the Ni Powder Scenario and the Ni Sulphate Scenario, the products sold, namely Ni
concentrate and Ni sulphate respectively, are sold on an FOB basis into the EV battery
supply chain. In the Ni Concentrate Scenario, Ni concentrate will be sold to a smelter.
The Cu concentrate will be sold directly to smelters or to traders in North America, Europe,
and Asia in all scenarios.
Based on metallurgical testing results to date, both the Ni and the Cu concentrates are of
clean quality with low levels of impurities and good by-product credits. The Ni sulphate
produced under the Ni Sulphate Scenario is expected to be battery-grade material.
DRA has reviewed the smelter terms, the terms for the payment of metal, and the deductions
for treatment and refining, and in the case of the Ni Sulphate Scenario has additionally
reviewed the Ni sulphate premium for Ni contained in sulphate form. DRA is of the opinion
that the smelter and product contract terms, as applied in the economic model, are
reasonable.
-
0.25
0.50
0.75
1.00
1.25
1.50
1.75
2.00
2.25
2.50
2.75
3.00
3.25
3.50
-
200,000
400,000
600,000
800,000
1,000,000
1,200,000
1,400,000
1,600,000
1,800,000
2,000,000
1 2 3 4 5 6 7 8 9
Milled Tonnes per year (LHS) and Ni/NiEq grades (RHS)
Milled Tonnes NiEq grade Ni grade

Document Number
Revision
Page
Rev Date
G4932-RPT-01 0 08 Jan 2021 320
Talon Metals Corp. – Preliminary Economic Assessment #3 on the Tamarack North Project
Cu concentrate handling and transport costs were estimated to be US$82.00/wmt of Cu
concentrate. As for the Ni concentrate, transportation costs were only assumed in the Ni
Concentrate Scenario (US$72.00/wmt) because under the Ni Concentrate Scenario, Ni
concentrate is shipped to a smelter. In the Ni Powder and Ni Sulphate Scenarios, the
products are sold on an FOB basis. An additional charge of 0.16% was included to cover
insurance and losses where concentrate is transported which includes the Cu concentrate
in all scenarios and the Ni concentrate in the Ni Concentrate Scenario.
Table 22-4: NSR and NSR After Royalties and Transportation – Payable Ni Basis
Using the Base Case metal price assumptions, the contribution of each metal to the NSR
over the LOM is shown in Figure 22-3.
Figure 22-3: Contributions of Metals to NSR
LOM Total
(US$M)
US$/tonne of
Mill Feed
US$/lb of
Payable Ni
LOM Total
(US$M)
US$/tonne of
Mill Feed
US$/lb of
Payable Ni
LOM Total
(US$M)
US$/tonne of
Mill Feed
US$/lb of
Payable Ni
Payable nickel revenue 1,666.4 154.89 8.00 1,978.9 183.93 8.00 1,624.7 151.02 8.00
Nickel sulphate premium - - - 309.2 28.74 1.25 - - -
Payable by-product revenue 524.5 48.75 2.52 598.2 55.60 2.42 561.3 52.17 2.76
Total payable revenue 2,190.9 203.64 10.52 2,886.2 268.27 11.67 2,186.1 203.19 10.76
Treatment and refining charges
for copper concentrates28.1 2.61 0.13 32.5 3.02 0.13 28.1 2.61 0.14
Insurance and losses 0.6 0.06 0.00 0.7 0.07 0.00 3.5 0.32 0.02
Net smelter return revenue 2,162.2 200.97 10.38 2,853.0 265.18 11.53 2,154.5 200.26 10.61 Government and private
royalties 160.7 14.94 0.77 193.1 17.95 0.78 153.1 14.23 0.75
Product handling and
transportation costs19.8 1.84 0.10 23.1 2.15 0.09 107.2 9.97 0.53
Net smelter return revenue
after royalties and
transportation costs
1,981.7 184.19 9.51 2,636.7 245.08 10.66 1,894.2 176.06 9.33
Nickel Powder Scenario Nickel Sulphate Scenario Nickel Concentrate Scenario
0%
10%
20%
30%
40%
50%
60%
70%
80%
90%
100%
Ni Powder Scenario Ni Sulphate Scenario Ni Concentrate Scenario
Net Revenue by Commodity
Nickel Copper Cobalt Gold Platinum Palladium

Document Number
Revision
Page
Rev Date
G4932-RPT-01 0 08 Jan 2021 321
Talon Metals Corp. – Preliminary Economic Assessment #3 on the Tamarack North Project
Operating Costs
Direct (on-site) operating costs average $41.02/t milled over the LOM for the Ni Powder
Scenario or the Ni Concentrate Scenario, and $66.26 for the Ni Sulphate Scenario as further
detailed in Table 22-5.
Table 22-5: On-site Costs over LOM – Payable Ni Basis
Figure 22-4 provides a breakdown of operating costs by year over the LOM.
Figure 22-4: Direct Operating Cost Breakdown over LOM
Capital Costs
Initial cost for the Ni Powder Scenario or Ni Concentrate Scenario is estimated to be
$315.80M while for the Ni Sulphate Scenario, initial cost is estimated to be $552.61M,
reflecting the incremental cost of the hydrometallurgical refining facility. The higher
sustaining cost of the Ni Sulphate Scenario also reflects the inclusion of the
LOM Total
(US$M)
US$/tonne of
Mill Feed
US$/lb of
Payable Ni
LOM Total
(US$M)
US$/tonne of
Mill Feed
US$/lb of
Payable Ni
LOM Total
(US$M)
US$/tonne of
Mill Feed
US$/lb of
Payable Ni
On-Site Costs
Mining Costs 295.8 27.49 1.42 295.8 27.49 1.20 295.8 27.49 1.46
Processing Costs 153.3 14.25 0.74 153.3 14.25 0.62 153.3 14.25 0.75
Hydromet Refining Costs - - - 287.0 26.68 1.16 - - -
Co-Disposed Filtered Tailings
Facility 8.0 0.75 0.04 8.0 0.75 0.03 8.0 0.75 0.04
General & Administrative Costs 40.5 3.76 0.19 49.5 4.60 0.20 40.5 3.76 0.20
Total On-Site Costs 497.7 46.26 2.39 793.7 73.77 3.21 497.7 46.26 2.45
Nickel Powder Scenario Nickel Sulphate Scenario Nickel Concentrate Scenario
$0
$20,000,000
$40,000,000
$60,000,000
$80,000,000
$100,000,000
$120,000,000
Year 1 Year 2 Year 3 Year 4 Year 5 Year 6 Year 7 Year 8 Year 9
Direct Operating Cost breakdown over LOM
Mining Processing and CFTF G&A Hydrometallurgical refining (Nickel Sulphate Scenario only)

Document Number
Revision
Page
Rev Date
G4932-RPT-01 0 08 Jan 2021 322
Talon Metals Corp. – Preliminary Economic Assessment #3 on the Tamarack North Project
hydrometallurgical refining facility. Table 22-6 compares the initial and sustaining capital
costs of the three scenarios.
Table 22-6: Capital Cost Summary
Figure 22-5 illustrates the CAPEX including working capital by year. Initial Cost is CAPEX
during years -2, -1 and 1 and initial working capital.
Figure 22-5: Capital Costs (US$) Including Working Capital by Year
Initial CostSustaining
CostTotal Cost Initial Cost
Sustaining
CostTotal Cost
(US$) (US$) (US$) (US$) (US$) (US$)
Mine 130.15 70.32 200.47 130.15 70.32 200.47
Process and Surface Facilities 167.51 22.01 189.51 390.56 50.41 440.97
Salvage Value of Mill - (5.00) (5.00) - (5.00) (5.00)
Closure Costs other than CFTF - 10.00 10.00 - 10.00 10.00
Sub Total 297.66 97.33 394.99 520.71 125.73 646.44
Working Capital 18.15 (18.15) - 31.90 (31.90) -
Total 315.80 79.18 394.99 552.61 93.83 646.44
Nickel Powder Scenario or Nickel
Concentrate ScenarioNickel Sulphate Scenario
US$ millions
$0
$50,000,000
$100,000,000
$150,000,000
$200,000,000
$250,000,000
Year -2 Year -1 Year 1 Year 2 Year 3 Year 4 Year 5 Year 6 Year 7 Year 8 Year 9
CAPEX including Working Capital by Year
Nickel Powder Scenario or Nickel Concentrate Scenario Nickel Sulphate Scenario

Document Number
Revision
Page
Rev Date
G4932-RPT-01 0 08 Jan 2021 323
Talon Metals Corp. – Preliminary Economic Assessment #3 on the Tamarack North Project
Tamarack North Project Cash Flow Summary
The following table summarizes the base case LOM cash flow:
Table 22-7: Summary of Base Case LOM Cash Flow
Table 22-8 provides the annual cash flow over LOM for the Ni Powder Scenario.
Table 22-9 provides the annual cash flow over LOM for the Ni Sulphate Scenario.
Table 22-10 provides the annual cash flow over LOM for the Ni Concentrate Scenario.
LOM Total
(US$M)
US$/tonne of
Mill Feed
US$/lb of
Payable Ni
LOM Total
(US$M)
US$/tonne of
Mill Feed
US$/lb of
Payable Ni
LOM Total
(US$M)
US$/tonne of
Mill Feed
US$/lb of
Payable Ni
Net smelter return revenue
after royalties and
transportation costs 1,981.7 184.19 9.51 2,636.7 245.1 10.66 1,894.2 176.06 9.33
On-Site Costs
Mining Costs 295.8 27.49 1.42 296 27.49 1.20 295.8 27.49 1.46
Processing Costs 153.3 14.25 0.74 153 14.25 0.62 153.3 14.25 0.75
Hydromet Refining Costs - 287 26.68 1.16 -
Co-Disposed Filtered Tailings
Facility 8.0 0.75 0.04 8 0.75 0.03 8.0 0.75 0.04
General & Administrative Costs 40.5 3.76 0.19 50 4.60 0.20 40.5 3.76 0.20
Total On-Site Costs 497.7 46.26 2.39 793.7 73.77 3.21 497.7 46.26 2.45
Net Operating Margin 1,484.0 137.94 7.12 1,843.0 171.30 7.45 1,396.6 129.81 6.88
Capital Expenditures 395.0 36.71 1.90 646.4 60.09 2.61 395.0 36.71 1.94
Working Capital - - - - - - - - -
Net Cash Flow (before tax) 1,089.0 101.22 5.23 1,196.6 111.22 4.84 1,001.6 93.09 4.93
Corporate Tax 171.8 15.97 0.82 198.5 18.45 0.80 152.4 14.17 0.75
Net Cash Flow (after tax) 917.3 85.26 4.40 998.1 92.77 4.03 849.2 78.93 4.18
Nickel Powder Scenario Nickel Sulphate Scenario Nickel Concentrate Scenario

Document Number
Revision
Page
Rev Date
G4932-RPT-01 0 08 Jan 2021 324
Talon Metals Corp. – Preliminary Economic Assessment #3 on the Tamarack North Project
Table 22-8: Base Case LOM Annual Cash Flow – Ni Powder Scenario
Unit LOM Total Year -2 Year -1 Year 1 Year 2 Year 3 Year 4 Year 5 Year 6 Year 7 Year 8 Year 9
Diluted tonnes processed 10,758,796 867,569 1,286,664 1,315,005 1,360,754 1,302,589 1,298,742 1,299,601 1,190,479 837,393
Diluted grades
Nickel % 1.34 2.40 2.06 1.65 1.17 1.10 1.12 0.90 0.89 0.94
Copper % 0.76 1.08 0.98 0.91 0.71 0.71 0.70 0.59 0.57 0.58
Platinum g/t 0.27 0.47 0.40 0.32 0.28 0.27 0.23 0.21 0.17 0.14
Palladium g/t 0.17 0.31 0.26 0.20 0.17 0.16 0.14 0.12 0.10 0.09
Gold g/t 0.14 0.20 0.18 0.16 0.15 0.15 0.13 0.12 0.11 0.10
Cobalt % 0.04 0.06 0.05 0.04 0.03 0.03 0.03 0.03 0.03 0.03
Recovery to concentrates and/or sulphate
Nickel % 82.1 84.34 83.68 82.86 81.78 81.59 81.64 78.89 78.75 79.86
Copper % 86.9 87.95 87.65 87.41 86.70 86.68 86.64 86.15 86.07 86.11
Cobalt % 64.1 64.10 64.10 64.10 64.10 64.10 64.10 64.10 64.10 64.10
NSR before transportation costs and royalties $ 2,162,804,149 306,585,499 390,672,226 326,190,917 243,200,960 220,588,145 221,906,475 176,308,780 159,171,236 118,179,912
Transportation, losses and insurance $ 20,419,698 2,241,385 3,055,625 2,923,785 2,467,779 2,352,644 2,315,543 2,000,921 1,786,614 1,275,403
NSR after transportation costs, insurance and
losses, but before royalties $ 2,142,384,451 304,344,114 387,616,601 323,267,132 240,733,181 218,235,501 219,590,932 174,307,859 157,384,622 116,904,509
Minnesota royalty $ 120,884,522 27,881,781 28,168,316 18,259,685 10,432,915 9,194,190 9,251,294 6,876,130 6,208,539 4,611,672
Private royalty $ 39,798,492 5,653,718 7,200,648 6,005,245 4,472,035 4,054,101 4,079,281 3,238,070 2,923,691 2,171,703
NSR net of transportation and royalties $ 1,981,701,437 270,808,615 352,247,637 299,002,201 225,828,231 204,987,209 206,260,358 164,193,660 148,252,392 110,121,134
Mining $ 295,804,571 30,882,141 42,334,855 38,532,828 36,630,937 32,244,204 33,072,835 33,703,101 29,339,213 19,064,457
Dense media seperation - - - - - - - - - -
Processing $ 153,318,563 12,363,325 18,335,640 18,739,515 19,391,472 18,562,580 18,507,765 18,520,007 16,964,958 11,933,302
Hydrometallurgical refining - - - - - - - - - -
Filtered tailings facility $ 8,044,000 648,653 961,996 983,186 1,017,391 973,903 971,027 971,669 890,082 626,092
G&A $ 40,500,000 4,500,000 4,500,000 4,500,000 4,500,000 4,500,000 4,500,000 4,500,000 4,500,000 4,500,000
Net profit before tax, interest, CAPEX and
working capital $ 1,484,034,303 222,414,495 286,115,145 236,246,673 164,288,431 148,706,523 149,208,731 106,498,882 96,558,139 73,997,284
Capital expenditures $ -
Mine Development $ 89,472,861 27,094,465 35,645,361 17,624,482 7,850,153 810,701 223,850 223,850 - - - -
Mine Equipment and depreciable $ 110,998,261 13,865,495 6,117,291 29,802,600 18,886,232 5,077,233 10,920,824 15,741,581 7,157,391 3,429,615 - -
Process and Surface Facilities CAPEX $ 170,835,210 83,631,975 77,520,995 242,056 484,112 726,168 968,224 1,210,280 1,452,336 1,694,392 1,936,448 968,224
Salvage value of mill and moveable equipment (5,000,000) - - - - - - - - - - 5,000,000-
CFTF 18,678,860 - 6,110,980 - - - 5,915,780 - - - - 6,652,100
Closure costs other than CFTF $ 10,000,000 - - - - - - - - - - 10,000,000
Total CAPEX $ 394,985,192 124,591,935 125,394,626 47,669,138 27,220,497 6,614,102 18,028,678 17,175,711 8,609,727 5,124,007 1,936,448 12,620,324
Working capital $ - - 18,147,795 1,614,672- 844,241- 303,932- 1,314,778- 192,735 160,788 1,500,131- (3,892,601) (9,030,962)
Pre-tax cash flow $ 1,089,049,111 (124,591,935) (143,542,421) 176,360,029 259,738,889 229,936,503 147,574,532 131,338,077 140,438,216 102,875,006 98,514,292 70,407,923
Income tax $ 171,789,497 - - 29,014,054 36,346,136 29,688,677 17,292,747 17,419,874 17,757,009 10,106,319 10,934,166 3,230,515
After-tax cash flow $ 917,259,614 (124,591,935) (143,542,421) 147,345,975 223,392,753 200,247,827 130,281,785 113,918,203 122,681,207 92,768,687 87,580,125 67,177,408
Cumulative cash flow $ (124,591,935) (268,134,356) (120,788,380) 102,604,372 302,852,199 433,133,984 547,052,187 669,733,394 762,502,081 850,082,206 917,259,614
Funding requirement to positive cash flow $ 315,803,494
Project after-tax NPV-7 567,000,000
Project after-tax IRR 48.3%

Document Number
Revision
Page
Rev Date
G4932-RPT-01 0 08 Jan 2021 325
Talon Metals Corp. – Preliminary Economic Assessment #3 on the Tamarack North Project
Table 22-9: Base Case LOM Annual Cash Flow – Ni Sulphate Scenario
Unit LOM Total Year -2 Year -1 Year 1 Year 2 Year 3 Year 4 Year 5 Year 6 Year 7 Year 8 Year 9
Diluted tonnes processed 10,758,796 867,569 1,286,664 1,315,005 1,360,754 1,302,589 1,298,742 1,299,601 1,190,479 837,393
Diluted grades
Nickel % 1.34 2.40 2.06 1.65 1.17 1.10 1.12 0.90 0.89 0.94
Copper % 0.76 1.08 0.98 0.91 0.71 0.71 0.70 0.59 0.57 0.58
Platinum g/t 0.27 0.47 0.40 0.32 0.28 0.27 0.23 0.21 0.17 0.14
Palladium g/t 0.17 0.31 0.26 0.20 0.17 0.16 0.14 0.12 0.10 0.09
Gold g/t 0.14 0.20 0.18 0.16 0.15 0.15 0.13 0.12 0.11 0.10
Cobalt % 0.04 0.06 0.05 0.04 0.03 0.03 0.03 0.03 0.03 0.03
Recovery to concentrates and/or sulphate
Nickel % 78.0 84.34 83.68 82.86 81.78 81.59 81.64 78.89 78.75 79.86
Copper % 84.5 87.95 87.65 87.41 86.70 86.68 86.64 86.15 86.07 86.11
Cobalt % 64.1 64.10 64.10 64.10 64.10 64.10 64.10 64.10 64.10 64.10
NSR before transportation costs and royalties $ 2,853,680,593 407,996,822 519,163,378 430,666,095 319,675,185 289,045,655 291,525,908 231,043,796 208,982,414 155,581,340
Transportation, losses and insurance $ 23,834,397 2,639,889 3,589,760 3,428,018 2,874,782 2,740,261 2,696,158 2,318,927 2,068,920 1,477,683
NSR after transportation costs, insurance and
losses, but before royalties $ 2,829,846,196 405,356,933 515,573,619 427,238,077 316,800,404 286,305,394 288,829,750 228,724,870 206,913,494 154,103,656
Minnesota royalty $ 150,134,033 38,435,764 39,221,367 23,173,535 11,711,373 10,002,822 10,108,237 6,971,167 6,162,990 4,346,778
Private royalty $ 42,980,299 6,376,863 8,236,095 6,715,489 4,813,716 4,287,677 4,318,433 3,282,824 2,902,242 2,046,961
NSR net of transportation and royalties $ 2,636,731,864 360,544,305 468,116,157 397,349,053 300,275,315 272,014,895 274,403,081 218,470,879 197,848,263 147,709,917
Mining $ 295,804,571 30,882,141 42,334,855 38,532,828 36,630,937 32,244,204 33,072,835 33,703,101 29,339,213 19,064,457
Dense media seperation - - - - - - - - - -
Processing $ 153,318,563 12,363,325 18,335,640 18,739,515 19,391,472 18,562,580 18,507,765 18,520,007 16,964,958 11,933,302
Hydrometallurgical refining 287,047,185 35,671,352 41,241,568 37,186,326 32,213,555 30,650,991 30,853,640 28,028,392 26,960,397 24,240,963
Filtered tailings facility $ 8,044,000 648,653 961,996 983,186 1,017,391 973,903 971,027 971,669 890,082 626,092
G&A $ 49,500,000 5,500,000 5,500,000 5,500,000 5,500,000 5,500,000 5,500,000 5,500,000 5,500,000 5,500,000
Net profit before tax, interest, CAPEX and
working capital $ 1,843,017,545 275,478,834 359,742,096 296,407,198 205,521,960 184,083,218 185,497,814 131,747,709 118,193,612 86,345,104
Capital expenditures $ -
Mine Development $ 89,472,861 27,094,465 35,645,361 17,624,482 7,850,153 810,701 223,850 223,850 - - - -
Mine Equipment and depreciable $ 110,998,261 13,865,495 6,117,291 29,802,600 18,886,232 5,077,233 10,920,824 15,741,581 7,157,391 3,429,615 - -
Process and Surface Facilities CAPEX $ 422,293,558 194,796,630 188,685,650 970,282 1,940,564 2,910,846 3,881,128 4,851,410 5,821,692 6,791,974 7,762,256 3,881,128
Salvage value of mill and moveable equipment (5,000,000) - - - - - - - - - - 5,000,000-
CFTF 18,678,860 - 6,110,980 - - - 5,915,780 - - - - 6,652,100
Closure costs other than CFTF $ 10,000,000 - - - - - - - - - - 10,000,000
Total CAPEX $ 646,443,540 235,756,590 236,559,281 48,397,364 28,676,949 8,798,779 20,941,581 20,816,841 12,979,083 10,221,588 7,762,256 15,533,228
Working capital $ - - 31,899,552 4,806,037- 1,858,051- 1,547,125- 1,705,419- 243,397 545,524- 1,767,130- (4,572,459) (15,341,203)
Pre-tax cash flow $ 1,196,574,005 (235,756,590) (268,458,833) 231,887,506 332,923,199 289,155,544 186,285,798 163,022,980 173,064,255 123,293,250 115,003,816 86,153,079
Income tax $ 198,504,590 - - 35,007,822 44,287,728 35,862,393 19,240,809 20,170,085 20,976,011 10,787,416 12,707,041 (534,714)
After-tax cash flow $ 998,069,415 (235,756,590) (268,458,833) 196,879,684 288,635,471 253,293,151 167,044,990 142,852,895 152,088,244 112,505,834 102,296,775 86,687,793
Cumulative cash flow $ (235,756,590) (504,215,423) (307,335,738) (18,700,268) 234,592,883 401,637,873 544,490,768 696,579,012 809,084,846 911,381,621 998,069,415
Funding requirement to positive cash flow $ 552,612,787
Project after-tax NPV-7 569,000,000
Project after-tax IRR 31.9%

Document Number
Revision
Page
Rev Date
G4932-RPT-01 0 08 Jan 2021 326
Talon Metals Corp. – Preliminary Economic Assessment #3 on the Tamarack North Project
Table 22-10: Base Case LOM Annual Cash Flow – Ni Concentrate Scenario
Unit LOM Total Year -2 Year -1 Year 1 Year 2 Year 3 Year 4 Year 5 Year 6 Year 7 Year 8 Year 9
Diluted tonnes processed 10,758,796 867,569 1,286,664 1,315,005 1,360,754 1,302,589 1,298,742 1,299,601 1,190,479 837,393
Diluted grades
Nickel % 1.34 2.40 2.06 1.65 1.17 1.10 1.12 0.90 0.89 0.94
Copper % 0.76 1.08 0.98 0.91 0.71 0.71 0.70 0.59 0.57 0.58
Platinum g/t 0.27 0.47 0.40 0.32 0.28 0.27 0.23 0.21 0.17 0.14
Palladium g/t 0.17 0.31 0.26 0.20 0.17 0.16 0.14 0.12 0.10 0.09
Gold g/t 0.14 0.20 0.18 0.16 0.15 0.15 0.13 0.12 0.11 0.10
Cobalt % 0.04 0.06 0.05 0.04 0.03 0.03 0.03 0.03 0.03 0.03
Recovery to concentrates and/or sulphate
Nickel % 82.1 84.34 83.68 82.86 81.78 81.59 81.64 78.89 78.75 79.86
Copper % 86.9 87.95 87.65 87.41 86.70 86.68 86.64 86.15 86.07 86.11
Cobalt % 64.1 64.10 64.10 64.10 64.10 64.10 64.10 64.10 64.10 64.10
NSR before transportation costs and royalties $ 2,157,968,417 305,610,987 389,329,235 325,217,953 243,329,357 220,817,786 221,480,243 176,423,460 158,781,594 116,977,802
Transportation, losses and insurance $ 110,678,555 14,719,902 19,106,636 16,357,120 12,695,068 11,575,876 11,668,164 9,536,305 8,636,676 6,382,809
NSR after transportation costs, insurance and
losses, but before royalties $ 2,047,289,862 290,891,084 370,222,599 308,860,834 230,634,289 209,241,910 209,812,079 166,887,155 150,144,918 110,594,993
Minnesota royalty $ 115,036,101 26,384,950 26,768,591 17,363,590 9,995,248 8,815,293 8,839,314 6,583,397 5,922,946 4,362,773
Private royalty $ 38,031,945 5,403,804 6,877,524 5,737,623 4,284,430 3,887,030 3,897,622 3,100,217 2,789,201 2,054,493
NSR net of transportation and royalties $ 1,894,221,816 259,102,330 336,576,484 285,759,620 216,354,611 196,539,587 197,075,143 157,203,541 141,432,771 104,177,727
Mining $ 295,804,571 30,882,141 42,334,855 38,532,828 36,630,937 32,244,204 33,072,835 33,703,101 29,339,213 19,064,457
Dense media seperation - - - - - - - - - -
Processing $ 153,318,563 12,363,325 18,335,640 18,739,515 19,391,472 18,562,580 18,507,765 18,520,007 16,964,958 11,933,302
Hydrometallurgical refining - - - - - - - - - -
Filtered tailings facility $ 8,044,000 648,653 961,996 983,186 1,017,391 973,903 971,027 971,669 890,082 626,092
G&A $ 40,500,000 4,500,000 4,500,000 4,500,000 4,500,000 4,500,000 4,500,000 4,500,000 4,500,000 4,500,000
Net profit before tax, interest, CAPEX and
working capital $ 1,396,554,682 210,708,211 270,443,992 223,004,091 154,814,811 140,258,901 140,023,517 99,508,764 89,738,518 68,053,877
Capital expenditures $ -
Mine Development $ 89,472,861 27,094,465 35,645,361 17,624,482 7,850,153 810,701 223,850 223,850 - - - -
Mine Equipment and depreciable $ 110,998,261 13,865,495 6,117,291 29,802,600 18,886,232 5,077,233 10,920,824 15,741,581 7,157,391 3,429,615 - -
Process and Surface Facilities CAPEX $ 170,835,210 83,631,975 77,520,995 242,056 484,112 726,168 968,224 1,210,280 1,452,336 1,694,392 1,936,448 968,224
Salvage value of mill and moveable equipment (5,000,000) - - - - - - - - - - 5,000,000-
CFTF 18,678,860 - 6,110,980 - - - 5,915,780 - - - - 6,652,100
Closure costs other than CFTF $ 10,000,000 - - - - - - - - - - 10,000,000
Total CAPEX $ 394,985,192 124,591,935 125,394,626 47,669,138 27,220,497 6,614,102 18,028,678 17,175,711 8,609,727 5,124,007 1,936,448 12,620,324
Working capital $ - - 18,147,795 1,614,672- 844,241- 303,932- 1,314,778- 192,735 160,788 1,500,131- (3,892,601) (9,030,962)
Pre-tax cash flow $ 1,001,569,490 (124,591,935) (143,542,421) 164,653,745 244,067,736 216,693,922 138,100,911 122,890,455 131,253,002 95,884,888 91,694,671 64,464,516
Income tax $ 152,407,184 - - 26,329,159 32,751,879 26,651,424 15,119,925 15,482,369 15,650,334 8,503,101 9,370,052 2,548,940
After-tax cash flow $ 849,162,306 (124,591,935) (143,542,421) 138,324,586 211,315,857 190,042,498 122,980,987 107,408,086 115,602,667 87,381,787 82,324,619 61,915,576
Cumulative cash flow $ (124,591,935) (268,134,356) (129,809,770) 81,506,087 271,548,585 394,529,571 501,937,657 617,540,324 704,922,112 787,246,730 849,162,306
Funding requirement to positive cash flow $ 315,803,494
Project after-tax NPV-7 520,000,000
Project after-tax IRR 45.6%

Document Number
Revision
Page
Rev Date
G4932-RPT-01 0 08 Jan 2021 327
Talon Metals Corp. – Preliminary Economic Assessment #3 on the Tamarack North Project
C1 Cost and AISC
C1 cost or C1 cash cost, total cost and AISC are not IFRS (International Financial Reporting
Standards) measures and, although calculated according to accepted industry practice, they
may not be directly comparable to calculations carried out by other companies.
A) Nickel Powder Scenario
No benchmark has been set for expressing C1 cash cost or AISC for selling Ni powders to
the EV industry in large quantities.
To be consistent with the Ni-to-stainless steel industry best practices, the following
methodology has been used:
C1 Cash Cost: The cash cost of producing a pound of Ni in concentrate sold FOB at the
mine gate less all by-product credits is shown in the following table.
Table 22-11: C1 Cash Cost of the Ni Powder Scenario
Ni concentrates need to be refined to produce Ni powder for the EV industry, which will
require additional capital and operating costs: For instance, if it costs $1.17/lb to convert Ni
concentrate to a Ni powder, the C1 cash cost of producing Ni powder would be $1.25/lb of
Ni. Talon is working towards developing a flowsheet to determine the actual cost of
converting Ni concentrates to Ni powder at the mine site.
AISC: The AISC of producing a pound of Ni in concentrate sold FOB at the mine gate is the
C1 cash cost plus royalties and sustaining CAPEX as shown in the following table.
Cost
LOM Total
(US$M)
US$/tonne of
Mill Feed
US$/lb of Ni in
concentrate
On-site Cash Costs 497.7 46.26 1.91
Off-site Cost of By-products 48.5 4.51 0.19
Less: By-product Revenue (524.5) (48.75) (2.01)
Net Cost of Producing Nickel
in Concentrate at the Mine 21.7 2.02 0.08
Nickel Powder Scenario

Document Number
Revision
Page
Rev Date
G4932-RPT-01 0 08 Jan 2021 328
Talon Metals Corp. – Preliminary Economic Assessment #3 on the Tamarack North Project
Table 22-12: AISC of the Ni Powder Scenario
In the Ni Powder Scenario, Ni concentrates are sold at a discount to the LME Ni price, similar
to the Ni Concentrate Scenario. However, the discount to the LME Ni price is expected to
be smaller for the Ni Powder Scenario as compared to the Ni Concentrate Scenario, given
the supply chain from mine to battery removes several processing and transportation steps
(thereby creating a win-win for both the mining company and the battery company).
Should the facility that converts Ni concentrates to Ni powders for the EV industry be co-
located at the mine site, transportation costs will be extremely low compared to the Ni
Concentrate Scenario: Ni powders for the EV industry require 99.99%+ purity and therefore,
almost no waste is transported. In contrast, Ni concentrates at approximately 12% by mass
of valuable metals requires the transportation of 88% waste. As with the Ni Sulphate
Scenario, the product under the Ni Powder Scenario is sold FOB at the mine gate.
Ni concentrates need to be refined to produce Ni powder for the EV market, which will require
additional capital and operating cost: For instance, if it costs $1.17/lb to convert Ni
concentrate to a Ni powder, the AISC of producing Ni powder would be $2.24/lb of Ni. Talon
is working towards developing a flowsheet to determine the actual cost of converting Ni
concentrates to Ni powder at the mine site.
B) Nickel Sulphate Scenario
Ni sulphates produced at site will be sold FOB at the mine gate and therefore, the C1 cash
cost is calculated as shown in the following table.
Cost
LOM Total
(US$M)
US$/tonne of
Mill Feed
US$/lb of Ni in
concentrate
C1 Cash Cost 21.7 2.02 0.08
Government and Private 160.7 14.94 0.62
Sustaining CAPEX 97.3 9.05 0.37
AISC of Producing Nickel in
Concentrate at the Mine Gate 279.7 26.00 1.07
Nickel Powder Scenario
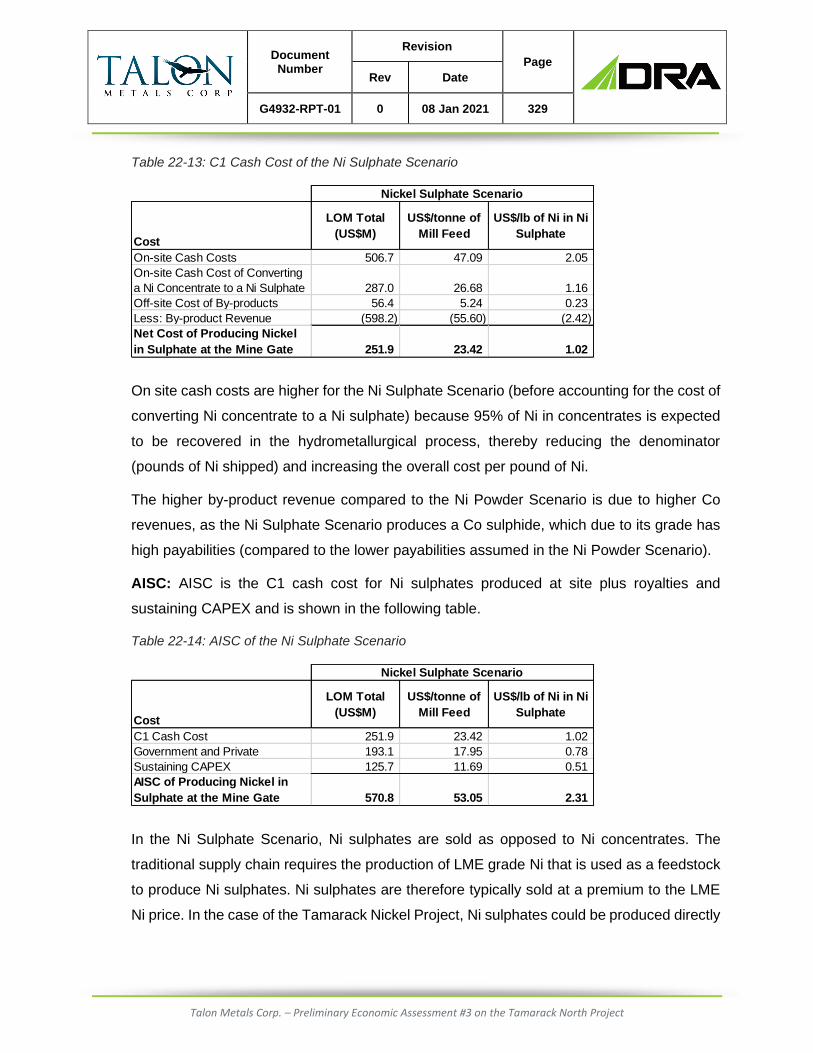
Document Number
Revision
Page
Rev Date
G4932-RPT-01 0 08 Jan 2021 329
Talon Metals Corp. – Preliminary Economic Assessment #3 on the Tamarack North Project
Table 22-13: C1 Cash Cost of the Ni Sulphate Scenario
On site cash costs are higher for the Ni Sulphate Scenario (before accounting for the cost of
converting Ni concentrate to a Ni sulphate) because 95% of Ni in concentrates is expected
to be recovered in the hydrometallurgical process, thereby reducing the denominator
(pounds of Ni shipped) and increasing the overall cost per pound of Ni.
The higher by-product revenue compared to the Ni Powder Scenario is due to higher Co
revenues, as the Ni Sulphate Scenario produces a Co sulphide, which due to its grade has
high payabilities (compared to the lower payabilities assumed in the Ni Powder Scenario).
AISC: AISC is the C1 cash cost for Ni sulphates produced at site plus royalties and
sustaining CAPEX and is shown in the following table.
Table 22-14: AISC of the Ni Sulphate Scenario
In the Ni Sulphate Scenario, Ni sulphates are sold as opposed to Ni concentrates. The
traditional supply chain requires the production of LME grade Ni that is used as a feedstock
to produce Ni sulphates. Ni sulphates are therefore typically sold at a premium to the LME
Ni price. In the case of the Tamarack Nickel Project, Ni sulphates could be produced directly
Cost
LOM Total
(US$M)
US$/tonne of
Mill Feed
US$/lb of Ni in Ni
Sulphate
On-site Cash Costs 506.7 47.09 2.05
On-site Cash Cost of Converting
a Ni Concentrate to a Ni Sulphate 287.0 26.68 1.16
Off-site Cost of By-products 56.4 5.24 0.23
Less: By-product Revenue (598.2) (55.60) (2.42)
Net Cost of Producing Nickel
in Sulphate at the Mine Gate 251.9 23.42 1.02
Nickel Sulphate Scenario
Cost
LOM Total
(US$M)
US$/tonne of
Mill Feed
US$/lb of Ni in Ni
Sulphate
C1 Cash Cost 251.9 23.42 1.02
Government and Private 193.1 17.95 0.78
Sustaining CAPEX 125.7 11.69 0.51
AISC of Producing Nickel in
Sulphate at the Mine Gate 570.8 53.05 2.31
Nickel Sulphate Scenario

Document Number
Revision
Page
Rev Date
G4932-RPT-01 0 08 Jan 2021 330
Talon Metals Corp. – Preliminary Economic Assessment #3 on the Tamarack North Project
from Ni concentrates at site, thereby reducing the number of process and transportation
steps. The premium to market price applies irrespective of processing route.
Royalties per pound are higher in the Ni Sulphate Scenario compared to the Ni Powder
Scenario because under the Ni Sulphate Scenario, a value-added product (that results in a
premium price) is sold.
AISC under the Ni Sulphate Scenario is higher than the Ni Concentrate Scenario because
of the incremental CAPEX associated with the hydrometallurgical refinery and higher
royalties because Ni sulphate is a value-added product that sells at a premium to LME Ni.
C) Nickel Concentrate Scenario
The Ni Concentrate Scenario contemplates the traditional Ni-to-stainless steel supply chain
in which concentrate is sold to a smelter, which is in turn sold to a refinery to produce LME-
grade Ni.
C1 Cost: The cost of producing a pound of LME-grade Ni per pound of Ni in concentrate
sold CIF to the smelter less all by-product credits is shown in the following table.
Table 22-15: C1 Cost of the Ni Concentrate Scenario
Under the Ni Concentrate Scenario, by-product revenue is the highest because the by-
products are calculated using the gross value of metal in the concentrate transported to the
smelter.
Cost
LOM Total
(US$M)
US$/tonne of
Mill Feed
US$/lb of Ni in
concentrate
On-site Cash Costs 497.7 46.26 1.91
Less: Value of By-product in
Concentrate (767.0) (71.29) (2.95)
Net Cost of Producing Ni in
Concentrate at the Mine Gate (269.3) (25.03) (1.03)
Product Handling, Transportation,
Insurance and Losses 110.7 10.29 0.43
Smelting, Refining, and
Deductions by the 692.0 64.32 2.66
C1 Cost of a lb of Nickel in
LME Grade Briquettes 533.4 49.58 2.05
Nickel Concentrate Scenario

Document Number
Revision
Page
Rev Date
G4932-RPT-01 0 08 Jan 2021 331
Talon Metals Corp. – Preliminary Economic Assessment #3 on the Tamarack North Project
Product handling, transportation insurance and losses in the Ni Concentrate Scenario are
high because of the need to transport both the Ni and Cu concentrates from the mine to
smelters.
The smelting, refining and deductions line item consists of both cash charges by the
smelters/refiners such as treatment charges and refining charges, as well as deduction of
metal units sent to the smelter but not paid to the mine.
AISC: The C1 cost of producing a pound of LME-grade Ni per pound of Ni in concentrate
sold CIF to the smelter plus royalties and sustaining CAPEX as shown in the following table.
Table 22-16: AISC of the Ni Concentrate Scenario
In the Ni Concentrate Scenario, NI concentrates are sold at a discount to the LME Ni price.
This discount to the LME Ni price is expected to be higher for the Ni Concentrate Scenario
compared to the Ni Powder Scenario, as the traditional supply chain from mine to stainless
steel requires more processing and transportation steps. Traditionally, transportation and
insurance costs are incurred by the mining company and is therefore included in the cost
calculation.
The C1 cost of $2.05/lb Ni to produce a Ni briquette calculated for this PEA is lower than the
C1 cost of $2.67/lb Ni in the March 2020 PEA: There was a cost increase due to the addition
of lower grade disseminated sulphide materials to the mine plan from both the 138 and
Upper SMSU Domains, which was more than offset by the reduction in costs due to
economies of scale realized from increasing the production rate from 2,000 tpd to 3,600 tpd,
as well as major improvements to mine access, development and stoping costs and the
application of the latest publicly available smelting and refining terms, which have improved
since the March 2020 PEA.

Document Number
Revision
Page
Rev Date
G4932-RPT-01 0 08 Jan 2021 332
Talon Metals Corp. – Preliminary Economic Assessment #3 on the Tamarack North Project
Base Case Evaluation
The base case cash flow, in real dollars, was evaluated by determining the after-tax NPV at
a discount rate of 7.0% and the after-tax IRR as shown in Table 22-17. Results are also
shown at comparative discount rates of 8% and 10% and on a pre-tax basis.
Table 22-17: Base Case NPV for all Scenarios at Various Discount Rates in Million US$ and IRR
After-tax NPV at a 7% discount rate, initial CAPEX including working capital and after-tax
IRR at base case pricing are illustrated in Figure 22-6 below.
Figure 22-6: After-tax NPV, Initial CAPEX and Working Capital, and After-tax IRR for all Scenarios
Nickel Powder
Scenario
Nickel Sulphate
Scenario
Nickel Concentrate
Scenario
Pre-tax 7% 688 711 629
NPV in 8% 646 660 589
$ millions 10% 570 568 518
Pre-tax IRR 56.0% 37.6% 52.6%
After-tax 7% 567 569 520
NPV in 8% 530 524 485
$ millions 10% 463 443 423
After-tax IRR 48.3% 31.9% 45.6%
316 553 316
Initial CAPEX and
working capital in $
millions
Base Case Pricing
Discount
rate
567 569
520
316
553
316
48.3%
31.9%
45.6%
0%
5%
10%
15%
20%
25%
30%
35%
40%
45%
50%
$0
$100
$200
$300
$400
$500
$600
After-tax NPV, Initial CAPEX and After-tax IRR for Nickel Powder Scenario, Nickel Sulphate Scenario and Nickel Concentrate Scenario
After-tax NPV-7 (US$ millions) Initial CAPEX and working capital (US$ millions) After-tax IRR (RHS)

Document Number
Revision
Page
Rev Date
G4932-RPT-01 0 08 Jan 2021 333
Talon Metals Corp. – Preliminary Economic Assessment #3 on the Tamarack North Project
The undiscounted pre-tax payback period is 2.2 years under the Ni Powder Scenario, 2.7
years under the Ni Sulphate Scenario and 2.3 years under the Ni Concentrate Scenario from
the production start date. Payback measures on a pre-tax, after-tax, undiscounted and
discounted basis are included in Table 22-18.
Table 22-18: Payback Period in Years from Production Start Date
22.4 Sensitivity and Risk Analysis
Metal Price Assumptions and Discount Rates
The sensitivities of the after-tax and pre-tax NPV and IRR as well as other measures were
tested using alternate metal price assumptions and discount rates as shown in Table 22-19.
Table 22-19: After-Tax and Pre-tax NPV in Million US$ and After-Tax and Pre-tax IRR and Other
Measures using Base Case and Alternate Metal Price Assumptions and Discount Rates
Nickel Powder
Scenario
Nickel Sulphate
Scenario
Nickel Concentrate
Scenario
Pre-tax Undiscounted 1.4 1.8 1.4
Discounted 1.5 2.1 1.6
After-tax Undiscounted 1.5 2.1 1.6
Discounted 1.7 2.4 1.8
Base Case Pricing
Years from start of production
Low Base Incentive Low Base Incentive Low Base Incentive
Pre-tax NPV 7% 496 688 917 478 711 970 439 629 854
US$ millions 8% 463 646 863 438 660 906 409 589 803
10% 404 570 767 367 568 790 355 518 712
Pre-tax IRR 45.0% 56.0% 67.4% 29.2% 37.6% 45.7% 41.5% 52.6% 64.2%
After-tax NPV 7% 415 567 744 387 569 769 369 520 695
US$ millions 8% 386 530 698 351 524 714 342 485 651
10% 333 463 616 286 443 615 293 423 573
After-tax IRR 39.3% 48.3% 57.7% 25.1% 31.9% 38.6% 36.4% 45.6% 55.1%
64% 68% 70% 60% 64% 66% 60% 64% 67%
43% 50% 55% 34% 41% 47% 39% 46% 52%
1.6 1.4 1.2 2.2 1.8 1.6 1.7 1.4 1.2
1.8 1.5 1.3 2.4 2.1 1.8 1.9 1.6 1.4
Nickel Powder Scenario
Payback from start of production
(after-tax, undiscounted)
Nickel Sulphate ScenarioNickel Concentrate
Scenario
Discount
rate
Metal Price Case Metal Price Case Metal Price Case
EBITDA margin
EBIT margin
Payback from start of production
(pre-tax, undiscounted)

Document Number
Revision
Page
Rev Date
G4932-RPT-01 0 08 Jan 2021 334
Talon Metals Corp. – Preliminary Economic Assessment #3 on the Tamarack North Project
Capital, Operating Costs, Grade and Revenue Sensitivity
The sensitivity of the after-tax NPV under the three scenarios was tested assuming changes
in metal prices, operating costs, head grade and capital costs in a range of 30% around the
Base Case as shown in Figure 22-7, Figure 22-8 and Figure 22-9 for the Ni Powder, Ni
Sulphate and Ni Concentrate Scenarios, respectively.
Figure 22-7: Sensitivity of Base Case After-Tax NPV to Changes in Metal Prices, Grade, Operating
Costs and Capital Costs – Ni Powder Scenario
Figure 22-8: Sensitivity of Base Case After-Tax NPV to Changes in Metal Prices, Grade, Operating
Costs and Capital Costs – Ni Sulphate Scenario
70% 75% 80% 85% 90% 95% 100% 105% 110% 115% 120% 125% 130%
Metal prices 237 298 355 411 464 516 567 617 666 715 762 809 855
Operating costs 652 638 623 609 595 581 567 552 538 524 509 495 481
CAPEX 655 640 626 611 596 581 567 552 537 522 508 493 478
Grade 213 278 340 400 458 513 567 619 671 722 771 819 866
-
100
200
300
400
500
600
700
800
900
1,000
Aft
er t
ax N
PV
USD
mill
ion
s
Percentage of base case
Metal prices Operating costs CAPEX Grade
70% 75% 80% 85% 90% 95% 100% 105% 110% 115% 120% 125% 130%
Metal prices 197 264 329 392 452 511 569 625 681 735 788 840 890
Operating costs 702 680 657 635 613 591 569 547 525 502 480 458 435
CAPEX 713 689 665 641 617 593 569 545 521 497 473 449 425
Grade 137 215 291 366 437 504 569 632 695 755 814 870 925
-
100
200
300
400
500
600
700
800
900
1,000
Aft
er t
ax N
PV
USD
mill
ion
s
Percentage of base case
Metal prices Operating costs CAPEX Grade

Document Number
Revision
Page
Rev Date
G4932-RPT-01 0 08 Jan 2021 335
Talon Metals Corp. – Preliminary Economic Assessment #3 on the Tamarack North Project
Figure 22-9: Sensitivity of Base Case After-Tax NPV to Changes in Metal Prices, Grade, Operating
Costs and Capital Costs – Ni Concentrate Scenario
The sensitivity of the after-tax IRR under the three scenarios was tested assuming changes
in metal prices, operating costs, head grade and capital costs in a range of 30% around the
Base Case as shown in Figure 22-10, Figure 22-11 and Figure 22-12 for the Ni Powder, Ni
Sulphate and Ni Concentrate Scenarios, respectively.
Figure 22-10: Sensitivity of Base Case After-Tax IRR to Changes in Metal Prices, Operating Costs,
Grade and Capital Costs – Ni Powder Scenario
70% 75% 80% 85% 90% 95% 100% 105% 110% 115% 120% 125% 130%
Metal prices 184 245 305 362 416 469 520 570 620 668 716 763 809
Operating costs 618 602 585 569 553 536 520 504 487 470 454 437 420
CAPEX 609 594 579 564 550 535 520 505 490 476 461 446 431
Grade 176 238 300 358 415 468 520 571 621 669 717 763 809
-
100
200
300
400
500
600
700
800
900
Aft
er t
ax N
PV
USD
mill
ion
s
Percentage of base case
Metal prices Operating costs CAPEX Grade
70% 75% 80% 85% 90% 95% 100% 105% 110% 115% 120% 125% 130%
Metal prices 27% 32% 36% 39% 42% 45% 48.3% 51% 54% 56% 59% 61% 63%
Operating costs 53% 52% 52% 51% 50% 49% 48.3% 47% 47% 46% 45% 44% 43%
CAPEX 68% 64% 60% 57% 54% 51% 48.3% 46% 44% 41% 39% 38% 36%
Grade 26% 31% 35% 39% 42% 45% 48.3% 51% 54% 56% 59% 61% 63%
0%
10%
20%
30%
40%
50%
60%
70%
80%
Aft
er t
ax IR
R
Percentage of base case
Metal prices Operating costs CAPEX Grade
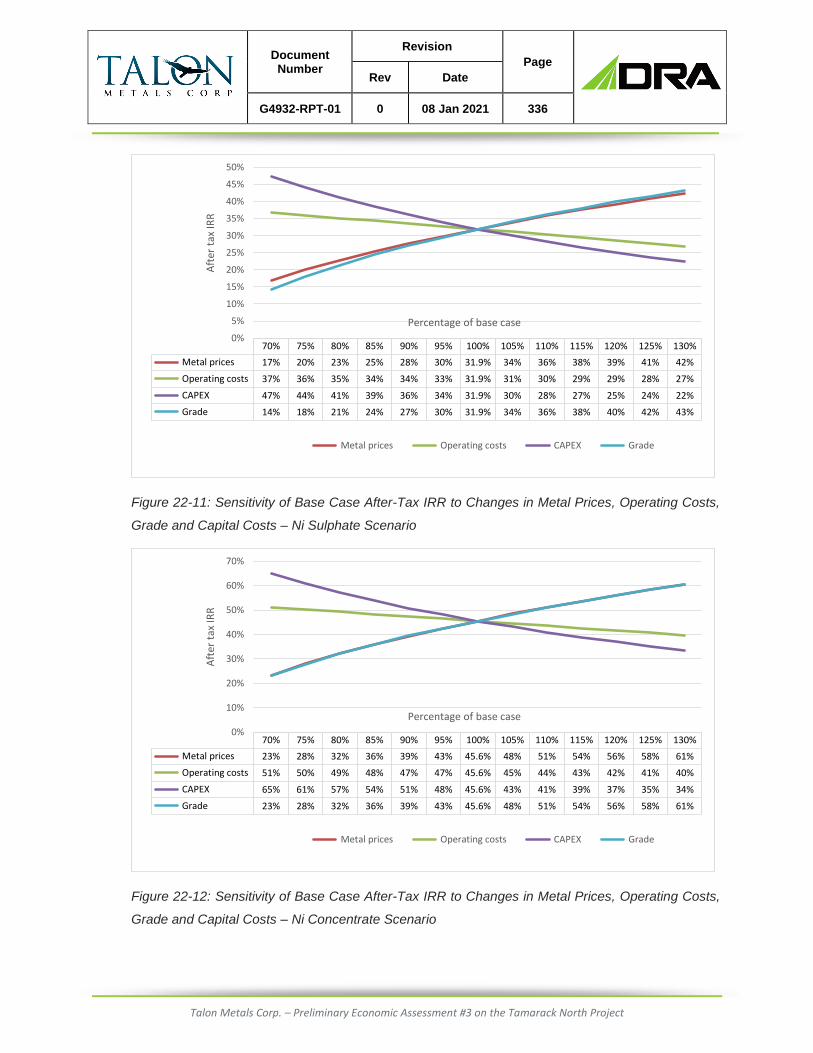
Document Number
Revision
Page
Rev Date
G4932-RPT-01 0 08 Jan 2021 336
Talon Metals Corp. – Preliminary Economic Assessment #3 on the Tamarack North Project
Figure 22-11: Sensitivity of Base Case After-Tax IRR to Changes in Metal Prices, Operating Costs,
Grade and Capital Costs – Ni Sulphate Scenario
Figure 22-12: Sensitivity of Base Case After-Tax IRR to Changes in Metal Prices, Operating Costs,
Grade and Capital Costs – Ni Concentrate Scenario
70% 75% 80% 85% 90% 95% 100% 105% 110% 115% 120% 125% 130%
Metal prices 17% 20% 23% 25% 28% 30% 31.9% 34% 36% 38% 39% 41% 42%
Operating costs 37% 36% 35% 34% 34% 33% 31.9% 31% 30% 29% 29% 28% 27%
CAPEX 47% 44% 41% 39% 36% 34% 31.9% 30% 28% 27% 25% 24% 22%
Grade 14% 18% 21% 24% 27% 30% 31.9% 34% 36% 38% 40% 42% 43%
0%
5%
10%
15%
20%
25%
30%
35%
40%
45%
50%
Aft
er t
ax IR
R
Percentage of base case
Metal prices Operating costs CAPEX Grade
70% 75% 80% 85% 90% 95% 100% 105% 110% 115% 120% 125% 130%
Metal prices 23% 28% 32% 36% 39% 43% 45.6% 48% 51% 54% 56% 58% 61%
Operating costs 51% 50% 49% 48% 47% 47% 45.6% 45% 44% 43% 42% 41% 40%
CAPEX 65% 61% 57% 54% 51% 48% 45.6% 43% 41% 39% 37% 35% 34%
Grade 23% 28% 32% 36% 39% 43% 45.6% 48% 51% 54% 56% 58% 61%
0%
10%
20%
30%
40%
50%
60%
70%
Aft
er t
ax IR
R
Percentage of base case
Metal prices Operating costs CAPEX Grade

Document Number
Revision
Page
Rev Date
G4932-RPT-01 0 08 Jan 2021 337
Talon Metals Corp. – Preliminary Economic Assessment #3 on the Tamarack North Project
ADJACENT PROPERTIES
There are no adjacent properties considered material to the Tamarack North Project
resources.

Document Number
Revision
Page
Rev Date
G4932-RPT-01 0 08 Jan 2021 338
Talon Metals Corp. – Preliminary Economic Assessment #3 on the Tamarack North Project
OTHER RELEVANT DATA AND INFORMATION
There is no additional information or explanation necessary with respect to this report.

Document Number
Revision
Page
Rev Date
G4932-RPT-01 0 08 Jan 2021 339
Talon Metals Corp. – Preliminary Economic Assessment #3 on the Tamarack North Project
INTERPRETATION AND CONCLUSIONS
25.1 Mineral Resource
It is the QP’s opinion that the information relating to geology, exploration and mineral
resource estimation presented in this Technical Report is representative of the Tamarack
North Project, and based on the verification and data analysis work completed, is of the
opinion that the sample database is of suitable quality to support the basis of the mineral
resource estimates and recommendations reached in this Technical Report.
The QP has taken reasonable steps to make the block model and Mineral Resource estimate
representative of the project data, but notes that there are risks related to the accuracy of
the estimates related to the following:
• The assumptions used by the QP to prepare the data for resource estimation;
• The accuracy of the interpretation of mineralization;
• Estimation parameters used by the QP;
• Assumptions and methodologies used to estimate SG;
• Orientation of drill holes;
• COG and related assumptions of commodity prices, mining costs and metallurgical
recovery.
For these reasons, actual results may differ materially from the reported Mineral Resource
estimates.
25.2 Mining Methods
The Tamarack North Project is amenable to underground mining methods at a rate of
3,600 tpd using drift-and-fill and longhole stoping with cemented paste backfill. Access will
be from a decline from surface, and development and production performed by mining
contractors. The expected mine life based on current deposit extent and Mineral Resources
is up to 11 years, however the deposit is open and a longer mine life is believed to be
possible.

Document Number
Revision
Page
Rev Date
G4932-RPT-01 0 08 Jan 2021 340
Talon Metals Corp. – Preliminary Economic Assessment #3 on the Tamarack North Project
25.3 Mineral Processing and Metallurgical Testing
A metallurgical test program on a revised LOM composite representing the entire 8.02 Mt of
the March 2020 PEA mineralized material confirmed the robustness of the simplified
flowsheet and conditions that were generated in the March 2020 PEA.
The results that were obtained in the 2019 / 2020 metallurgical results were in good
agreement with the Ni and Cu recovery regression curves that were reported in the March
2020 PEA. Adjustments to the LOM regression curves were made to reflect the fact that the
138 Zone mineralization was included in the overall LOM composite compared to only SMSU
and MSU mineralization in the March 2020 PEA.
The low Po to Pn ratio compared to many other Ni deposits simplifies the process circuit,
and a Po rejection circuit is not required to achieve high Ni recoveries into a saleable Ni
concentrate grading at least 10% Ni.
The low levels of deleterious elements in the Cu and Ni concentrates are not expected to
trigger any penalty payments. The MgO content in the Ni concentrate of the LOM composite
was just below the typical 5% threshold of smelters. Also, very limited work was completed
on determining the most effective MgO depressant.
Credits for by-products will mostly derive from Cu and Co with potentially minor contribution
from Au, Pt, and Pd.
A scoping level hydrometallurgical program demonstrated that both POX and Albion leach
technologies are suitable to achieve very high metal extraction rates into the pregnant leach
solution (PLS). The current flowsheet employs POX pending a capital and operating cost
trade-off study for the Albion process. The two stage neutralization steps are successful in
removing most impurities while minimizing the Ni and Co losses. Further, the residue of the
secondary neutralization stage and the Cu removal circuit generate two product streams that
can be combined with the Cu concentrate. This is significant, since payability of Cu in the Ni
concentrate is very low. The two Cu bearing product streams from the hydrometallurgical
plant reduce the Cu concentrate grade by only 1%.
While development of the complete hydrometallurgical circuit is still ongoing, the leach,
neutralization, and impurity removal tests have demonstrated high extraction rates during
leaching and low metal losses during impurity removal. These results are very encouraging

Document Number
Revision
Page
Rev Date
G4932-RPT-01 0 08 Jan 2021 341
Talon Metals Corp. – Preliminary Economic Assessment #3 on the Tamarack North Project
since losses to the leach, neutralization, and impurity removal residues are the primary
sources of metal losses in the hydrometallurgical process.
25.4 Recovery Methods
The flowsheet was designed for a nameplate capacity throughput of 3,600 tpd and an annual
throughput of 1,314,000 tpa. Conventional mineral processing technologies were selected
to produce one Ni and one Cu concentrate as well as one LS and one HS tailings stream.
The LOM Ni and Cu concentrate recoveries are estimated at 81.5% and 74.7% respectively.
The Ni and Cu concentrate grades are projected to be 10.2% Ni and 28.5% Cu.
The low feed rate facilitates a simple crushing and grinding circuit with two stages of crushing
and a single stage of ball milling but a SAG mill circuit will be evaluated once additional
comminution data will be available.
The hydrometallurgical process employs technologies that have been implemented on a
commercial scale in numerous operations. The overall Ni recovery from mineralized material
to Ni sulphates was established at 77.4%. A total of 60.9% of the Co contained in the
mineralized material can be recovered into a Co sulphite product. The Cu recovery into the
Cu concentrate improved from 69.3% for the Ni Concentrate Scenario (the balance of 15.4%
of the Cu units reported to the Ni concentrate) to 81.8% for the Ni Sulphate Scenario.
25.5 Infrastructure
The conceptual site layout designed during the previous March 2020 PEA was modified and
updated for the currently envisaged project definition. Notably, the updated CFTF design
concept still negates the need for a tailings dam while reducing the site footprint and the
potential wetland impact. Although a portion of the site was delineated as wetlands in 2008
and 2009, a significant portion of the area was utilized as farmland in 1992.
Preliminary water balances were completed for the processing scenarios contemplated,
based on waste rock characterization, geophysical measurements, pump tests and
estimates of water requirements for the mine and the processing plant.

Document Number
Revision
Page
Rev Date
G4932-RPT-01 0 08 Jan 2021 342
Talon Metals Corp. – Preliminary Economic Assessment #3 on the Tamarack North Project
25.6 Environmental Considerations and Permitting
The process of environmental review and permitting for a mining project of this type is well
understood. The existing environmental baseline information that has been gathered to date
will need to be augmented to support the engineering design of the project and the
environmental review and permitting processes. Based on the information available to date,
there are no environmental aspects that should prevent the project development.
25.7 Economics
At the assumed base case metal prices, key metrics of the PEA of the Tamarack North
Project are summarized in the following table. All amounts are in US dollars.
Table 25-1: Key Metrics of the PEA
All amounts in US$
Scenario
Nickel Powder Scenario
Nickel Sulphate Scenario
Nickel Concentrate Scenario
After-Tax NPV(1), (2) $567M $569M $520M
After-Tax IRR(1) 48.3% 31.9% 45.6%
Initial CAPEX and Working Capital $316M $553M $316M
Payback Period, pre-tax(3) 1.4 years 1.8 years 1.4 years
Payback Period, after-tax(3) 1.5 years 2.1 years 1.6 years
Mine Life(3) 9 years 9 years 9 years
(1) Metal prices of $8.00/lb Ni, $3.00/lb Cu, $25.00/lb Co, $1,000/oz Pt, $1,000/oz Pd and $1,300/oz Au.
(2) Discount rate of 7%
(3) From the start of production
The PEA illustrates a high after-tax IRR, low AISC, low capital intensity and a quick payback
for the Tamarack Nickel Project. The PEA also clearly demonstrates that the Tamarack
Nickel Project has the optionality to produce either Ni sulphates or concentrates for refined
Ni powders to be used for the EV market or a Ni concentrate for the stainless steel market,
with all contemplated scenarios having robust economics.
The financial model is based on the results of the PEA which is preliminary in nature and
includes inferred resources that are considered too speculative geologically to have the
economic consideration applied to them that would enable them to be categorized as mineral
reserves, and there is no certainty that the preliminary economic assessment will be realized.

Document Number
Revision
Page
Rev Date
G4932-RPT-01 0 08 Jan 2021 343
Talon Metals Corp. – Preliminary Economic Assessment #3 on the Tamarack North Project
RECOMMENDATIONS
It was previously recommended that Talon should determine whether it should sell Ni
concentrates or Ni sulphates by developing and contrasting the economic impact of these
two scenarios. The Company’s targeted completion date to achieve this milestone was the
end of February 2021.
With this PEA, Talon has now achieved this objective.
Since that time, Tesla, Inc. has articulated that it has the goal of consuming raw Ni powder,
which will dramatically simplify the Ni-to-battery supply chain. The Ni Powder Scenario
contemplated by Talon in this PEA is based on selling Ni concentrates to a co-located
refinery that produces high purity Ni powders. Talon believes, however, that the same
refinery could potentially produce high purity Fe powders as a by-product. It is therefore
recommended that going forward, the economic impact of a scenario where Talon produces
both refined Ni and Fe powders is quantified.
If successful, Talon could potentially produce three products:
• Refined Ni powders for the Ni battery cathode market;
• Refined Fe powders for the lithium iron phosphate (LFP) market; and
• Cu concentrates.
Talon’s next milestone (Milestone 1) should therefore be to develop a flowsheet in addition
to CAPEX and OPEX estimates for the above scenario. A successful outcome could allow
Talon to lower its cut-off grade and therefore, increase the amount of metal it could produce
from the Tamarack Nickel Project, which would lead to a different resource envelope and
consequently mine plan.
Once Talon has decided whether it should produce Ni concentrates, Ni sulphates or Ni and
Fe powders, the Company will complete a PFS (Milestone 2).
In the meantime, going forward Talon should also focus on resource expansion and
definition drilling to progress towards PFS and Feasibility Study assuming the Company
proceeds with the Ni Powder Scenario contemplated in the February 2021 PEA. It is
estimated that between 25,000 and 30,000 m of drilling will be required, mostly focused on
expansion of the Tamarack Nickel Project’s current resource area. Talon’s in-house team of

Document Number
Revision
Page
Rev Date
G4932-RPT-01 0 08 Jan 2021 344
Talon Metals Corp. – Preliminary Economic Assessment #3 on the Tamarack North Project
experienced specialists operate their own drilling and geophysical equipment efficiently and
at low cost. It is therefore expected that this recommendation is achievable during 2021.
Talon also has a comprehensive geotechnical logging program in place and should therefore
continue with laboratory testing of drill core, collecting down hole data using acoustic
televiewer and full wave sonic technology, as well as in-situ stress measurement testing.
Hydrological work should be conducted as appropriate for each level of study. Installation of
multilevel vibrating wire piezometers in selected historical drill holes and additional aquifer
property testing within the glacial till and bedrock aquifers are also recommended.
Geo-metallurgical testing programs should continue and should be based on the predicted
LOM feed bearing in mind the specific requirements of each of the potential customers for
the different products listed above. It is thus recommended that Talon maintain optionality
and complete the second phase of hydrometallurgical testing for production of Ni sulphates.
Waste products from geo-metallurgical testing programs should be used to continue
environmental test work.
The following budget allocation is recommended:
Table 26-1: Milestone 1: Flowsheet Development including Mine Planning, Metallurgy and
Engineering
Item Description Details Amount (C$) Amount (US$)
1.0 Mine planning, metallurgy, and
engineering
Includes extensive metallurgical testing and trade-off studies in advance of a feasibility study as well as a final PEA to enable the Company to select one of the three markets listed above
$2,300,000 $1,800,000
Total $2,300,000 $1,800,000
The budget to collect data for a PFS and a Feasibility Study is shown below.

Document Number
Revision
Page
Rev Date
G4932-RPT-01 0 08 Jan 2021 345
Talon Metals Corp. – Preliminary Economic Assessment #3 on the Tamarack North Project
Table 26-2: Milestone 2: Resource Expansion and Data Collection for a PFS and a Feasibility Study
Item Description Details Amount (C$) Amount (US$)
1.0 Exploration Includes geophysical, geological, assays, geotechnical and hydrogeological data collection and related site costs
$9,300,000 $7,300,000
2.0 Environmental baseline, permitting and community
Includes baseline data collection as well as extensive testing of tailings and waste rock to optimize the CFTF
$700,000 $550,000
3.0 Mineral leases and land Payments required to keep all properties in good standing
$1,000,000 $800,000
Total $11,000,000 $8,650,000

Document Number
Revision
Page
Rev Date
G4932-RPT-01 0 08 Jan 2021 346
Talon Metals Corp. – Preliminary Economic Assessment #3 on the Tamarack North Project
REFERENCES
• Annual Estimates of Resident Population: April 1, 2010 to July 1, 2016. US Census
Bureau, Population Division. Release Date May 2017.
• Boerboom Terrence J., project manager. 2009. 6 pls. Scales 1:100,000 and 1:200,000.
Pl. 1 data-base map; pl. 2, bedrock geology; pl. 3, surficial geology; pl. 4, Quaternary
stratigraphy; pl. 5, bedrock topography, depth to bedrock, and sand distribution model;
pl. 6, mineral endowment.
• Bornhorst, T.J., and Rose, W.I., 1994. Self-guided geological field trip to the Keweenaw
Peninsula, Michigan. Institute on Lake Superior Geology, Proceedings 40th annual
meeting, Houghton, Michigan. vol. 40 - part 2. 185p.
• Correia, L., Del Carpio, S., Fletcher, T., Gagnon, D., Habte, K., Peters, O., Radue, T.,
Thomas, B., Preliminary Economic Assessment (PEA) of the Tamarack North Project –
Tamarack, Minnesota, NI 43-101 Technical Report, DRA America Inc. et al, Report
Number G02420-PA-RPT-007-02, December 14, 2018.
• Correia, L., Fletcher, T., Gagnon, D., Gravel, A.-F., Peters, O., Pint, T., Ritchie, D.,
Thomas, B., Updated Preliminary Economic Assessment (PEA) of the Tamarack North
Project – Tamarack, Minnesota, NI 43-101 Technical Report, DRA America Inc. et al,
Report Number G4314-RPT-01, March 12, 2020.
• Goldner B.D. 2011. Igneous petrology of the Ni-Cu-PGE mineralised Tamarack
Intrusion. Aiken and Carlton Counties, Minnesota. MSC Thesis, University of Minnesota.
• Hinze, W.J., Allen, D.J., Braile, L.W., Mariano, J., 1997. The Midcontinent rift system: a
major Proterozoic continental rift. Eds.
• Historic State Nonferrous Metallic Mineral Leases. October 2017. Minnesota Department
of Natural Resources, Division of Lands and Minerals, State Nonferrous Metallic Mineral
Leasing Web Map.
• Holm, D.K., R. Anderson, T.J. Boerboom, W.F. Cannon, V. Chandler, M. Jirsa, J. Miller,
D.A. Schneider, K.J. Schulz, W.R. Van Schmus, 2007, Reinterpretation of
Paleoproterozoic accretionary boundaries of the north-central US based on a new
aeromagnetic-geologic compilation. Precambrian Research, v. 157, P. 71–79.
• https://factfinder.census.gov/faces/tableservices/jsf/pages/productview.xhtml?sr
c=bkmk

Document Number
Revision
Page
Rev Date
G4932-RPT-01 0 08 Jan 2021 347
Talon Metals Corp. – Preliminary Economic Assessment #3 on the Tamarack North Project
• http://files.dnr.state.mn.us/lands_minerals/aitkin_sandandgravel_resources.pdf
• http://mndnr.maps.arcgis.com/apps/webappviewer/index.html?id=094ca0b7a81d
45ffae670e125cd82487
• https://www.usclimatedata.com/climate/tamarack/minnesota/united-
states/usmn1351
• Hutchinson, D R., R F. White, W F. Cannon, and K J. Schulz, 1990, Keweenaw Hot Spot;
Geophysical Evidence for a 1.1 Ga Mantle Plume Beneath the Midcontinent Rift System.
Journal of Geophysical Research 95, p. 10869-10884.Larsen et al., 2000.
• Jennings, Carrie E. and Kostka, Steven J., April 2014. Aitkin County Aggregate
Resources Sand And Gravel Potential, Plate A. Department of Natural Resources,
Division of Lands and Minerals, Scale 1:100,000 with digital data.
• Kennecott Aeromagnetic Survey, Modified by Talon, 2017.
• King & McGregor Environmental, Inc., Survey of Vegetative Communities and Rare,
Threatened, & Endangered Plant Species, Prepared for Foth Infrastructure &
Environment, LLC, November 25, 2008.
• Larsen, M.L., and Pedersen, A.K., 2000. Processes in High-Mg, High-T magmas:
evidence from olivine, chromite and glass in Palaeogene picrites from West Greenland.
J. of Petrology, vol. 41, n.7 pp. 1071-1098.
• Level III and IV Ecoregions of Minnesota, June 2015. Scale 1:2,250,000. United States
Environmental Protection Agency, Ecosystem Research, Region 5.
ftp://newftp.epa.gov/EPADataCommons/ORD/Ecoregions/mn/mn_map.pdf
• Miller, J.D., Jr., Smyk, M., Sage, R.P., and Green, J.C., 1995, Geology, petrology and
metallogeny of intrusive igneous rocks of the Midcontinent Rift system. in Miller, J.D., Jr.
(ed.), Field trip guidebook for the geology and ore deposits of the Midcontinent rift in the
Lake Superior region. Minnesota Geological Survey Guidebook Series 20 p. 121-216.
• Miller, J.D., Jr., and Vervoort, J.D., 1996, The latent magmatic stage of the Midcontinent
rift: a period of magmatic underplating and melting of the lower crust: Institute on Lake
Superior Geology, 42nd Annual Meeting, Cable, Wis., Proceedings, v. 42, Program and
Abstracts, pt. 1, p. 33-35.
• Naldrett, A. J. 1999: World-class Ni-Cu-PGE deposits: key factors in their genesis.
Mineralium Deposita (1999) 34, pg. 227-240.

Document Number
Revision
Page
Rev Date
G4932-RPT-01 0 08 Jan 2021 348
Talon Metals Corp. – Preliminary Economic Assessment #3 on the Tamarack North Project
• Owen et al. 2013. NI 43-101 Technical Report on the Eagle Mine, Upper Peninsula of
Michigan, USA. Lundin Mining Corporation.
• Peters, O. Imeson, D., An Investigation into Metallurgical Testwork on Seven Samples
from the Tamarack Deposit, SGS Report, Project 12061-005, September 27, 2017.
• Schneider, D.A., Bickford, M.E., Cannon, W.F., Schultz, K.J., and Hamilton, M.A., 2002,
Age of volcanic rocks and syndepositional Fe formations, Marquette Range Supergroup:
implications for the tectonic setting of Paleoproterozoic Fe formations of the Lake
Superior region. Can. J. Earth Sci., vol. 39, pp. 999-1012. Severson, 2003.
• Severson, M.J., and Heine, J.J., 2003, Sedimentary exhalative (SEDEX) potential of the
Cuyuna North Range, Cuyuna South Range, Emily District, and portions of Aitkin County
- Old drill log searches: Natural Resources Research Institute, University of Minnesota,
Duluth, Technical Report NRRI/TR-2003/13, 40 p.
• Sims, P.K., and Day, W.C., 1993. The Great Lakes Tectonic Zone-revisited. US
Geological Survey Bull. 1904-S, 11 p.
• Southwick, D. L., Morey, G. B., Holst, Timothy B., edited by Sims, P. K., Carter, L. M. H.
1991. Tectonic imbrication and foredeep development of the Penokean orogen, east-
central Minnesota – an interpretation based on regional geophysics and the result of
test-drilling. US Geological Survey Bulletin 1904, 17pp.
• Talon Metals Corp., 2016. Talon Metals Summer 2016 Exploration Update: Positive
results from Infill drilling at the Tamarack Zone. Press release, 13th December 2016.
• Tamarack Weather Averages, November 2017. US Climate Data.
• Thomas, B., Palmer, P., Khorakchy, M. O., First Independent Technical Report on the
Tamarack North Project, Tamarack, Minnesota, NI 43-101 Technical Report, Golder
Associates, Report Number 1707088, August 29, 2014.

Document Number
Revision
Page
Rev Date
G4932-RPT-01 0 08 Jan 2021 349
Talon Metals Corp. – Preliminary Economic Assessment #3 on the Tamarack North Project
CERTIFICATES OF QUALIFIED PERSONS – NI 43-101

CERTIFICATE OF AUTHOR
To Accompany the NI 43-101 Technical Report entitled “Preliminary Economic Assessment (PEA) #3 of the Tamarack North Project – Tamarack, Minnesota” (the “Technical Report”), prepared for Talon Metals Corp. with an effective date of January 8, 2021.
I, Leslie Correia, Pr. Eng., do hereby certify that:
1) I am an Engineering Manager with Paterson & Cooke Canada Inc., with an office at 1351-C Kelly Lake Road, Unit #2, Sudbury, Ontario, Canada;
2) I am a graduate from University of Stellenbosch a Bachelor of Engineering in Chemical Engineering in 2005;
3) I am a member in good standing of the Engineering Council of South Africa (ECSA, Membership 20120236);
4) My relevant experience is 13 years as an independent consultant. I have been responsible for hydraulic, process and mechanical design of slurry pump and pipeline systems, backfill plant and reticulation system design, capital and operation cost estimates and project management of mining projects worldwide;
5) I have read the definition of “qualified person” set out in National Instrument 43-101 (NI 43-101) and certify that by reason of my education, affiliation with a professional association (as defined by NI 43-101) and past relevant work experience, I fulfill the requirements to be a "qualified person" for the purposes of NI 43-101;
6) I have participated in the preparation of the report entitled " titled “Preliminary Economic Assessment (PEA) #3 of the Tamarack North Project – Tamarack, Minnesota " dated January 8, 2021 and am responsible for portions of Section 16;
7) I have not visited the site;
8) My prior involvement with the property is limited to participation in previous technical reports and in the previous PEAs for the property that is the subject of the Technical Report;
9) At the date of the Technical Report, to the best of my knowledge, information and belief, the Technical Report contains all scientific and technical information that is required to be disclosed to make the Technical Report not misleading;
10) I have no personal knowledge, as of the date of the Technical Report, of any material fact or material change which is not reflected in this Technical Report;
11) I am independent of the issuer as defined in Section 1.5 of NI 43-101; and
12) I have read National Instrument 43-101 and Form 43-101F1, and the Technical Report has been prepared in compliance with that instrument and form.
This 8th day of January 2021.
(Signed) Leslie Correia ______________________________ Leslie Correia, Pr. Eng. Engineering Manager Paterson & Cooke Canada Inc.

CERTIFICATE OF AUTHOR
To Accompany the NI 43-101 Technical Report entitled “Preliminary Economic Assessment (PEA) #3 of the Tamarack North Project – Tamarack, Minnesota” (the “Technical Report”), prepared for Talon Metals Corp. with an effective date of January 8, 2021.
I, Tim Fletcher, P. Eng., do hereby certify that:
1) I am a Senior Project Manager with DRA Americas Inc., with an office at 2900 – 20 Queen Street West Toronto, Ontario, Canada;
2) I am a graduate from University of Toronto, with a B.A.Sc. in Mechanical Engineering in 1992 and an M.A.Sc. in Metallurgical Engineering in 1995;
3) I am a Professional Engineer licensed by Professional Engineers Ontario (Membership Number 90451964);
4) I have worked as an Engineer in the Mining & Metals industry continuously since my graduation from university;
5) I have read the definition of “qualified person” set out in National Instrument 43-101 (NI 43-101) and certify that by reason of my education, affiliation with a professional association (as defined by NI 43-101) and past relevant work experience, I fulfill the requirements to be a "qualified person" for the purposes of NI 43-101;
6) I have participated in the preparation of the report entitled " titled “Preliminary Economic Assessment (PEA) #3 of the Tamarack North Project – Tamarack, Minnesota " dated January 8, 2021 and am responsible for Section 2, portions of Sections 1, 3, 21, 25, 26, and 27, and overall report compilation;
7) I have not visited the site;
8) My prior involvement with the property is limited to participation in previous technical reports and in the previous PEAs for the property that is the subject of the Technical Report;
9) At the date of the Technical Report, to the best of my knowledge, information and belief, the Technical Report contains all scientific and technical information that is required to be disclosed to make the Technical Report not misleading;
10) I have no personal knowledge, as of the date of the Technical Report, of any material fact or material change which is not reflected in this Technical Report;
11) I am independent of the issuer as defined in Section 1.5 of NI 43-101; and
12) I have read National Instrument 43-101 and Form 43-101F1, and the Technical Report has been prepared in compliance with that instrument and form.
This 8th day of January 2021.
(signed) Tim Fletcher _______________________________ Tim Fletcher, P. Eng. Senior Project Manager DRA Americas Inc.

CERTIFICATE OF AUTHOR
To Accompany the NI 43-101 Technical Report entitled “Preliminary Economic Assessment (PEA) #3 of the Tamarack North Project – Tamarack, Minnesota” (the “Technical Report”), prepared for Talon Metals Corp. with an effective date of January 8, 2021.
I, Daniel M. Gagnon, P. Eng., do hereby certify that:
1) I am the VP Mining and Geology with Met-Chem, a division of DRA Americas Inc., with an office at Suite 600, 555 Rene-Levesque Blvd. W. Montreal, Quebec, Canada;
2) I am a graduate from Ecole Polytechnique de Montreal with a B. Eng. In Mining Engineering in 1995;
3) I am registered member of Ordre des Ingenieurs du Quebec (Membership Number 118521);
4) I have worked as a Mining Engineer continuously since my graduation from university;
5) I have read the definition of “qualified person” set out in National Instrument 43-101 (NI 43-101) and certify that by reason of my education, affiliation with a professional association (as defined by NI 43-101) and past relevant work experience, I fulfill the requirements to be a "qualified person" for the purposes of NI 43-101;
6) I have participated in the preparation of the report entitled " titled “Preliminary Economic Assessment (PEA) #3 of the Tamarack North Project – Tamarack, Minnesota " dated January 8, 2021 and am responsible for Sections 19 and 22, and portions of Sections 1, 18, 21, 25, and 26;
7) I have visited the site on October 5, 2017;
8) My prior involvement with the property is limited to participation in previous technical reports and in the previous PEAs for the property that is the subject of the Technical Report;
9) At the date of the Technical Report, to the best of my knowledge, information and belief, the Technical Report contains all scientific and technical information that is required to be disclosed to make the Technical Report not misleading;
10) I have no personal knowledge, as of the date of the Technical Report, of any material fact or material change which is not reflected in this Technical Report;
11) I am independent of the issuer as defined in Section 1.5 of NI 43-101; and
12) I have read National Instrument 43-101 and Form 43-101F1, and the Technical Report has been prepared in compliance with that instrument and form.
This 8th day of January 2021.
(signed) Daniel M. Gagnon _______________________________ Daniel M. Gagnon, P. Eng. VP Mining and Geology DRA Americas Inc.

CERTIFICATE OF AUTHOR
To Accompany the NI 43-101 Technical Report entitled “Preliminary Economic Assessment (PEA) #3 of the Tamarack North Project – Tamarack, Minnesota” (the “Technical Report”), prepared for Talon Metals Corp. with an effective date of January 8, 2021.
I, Andre-Francois Gravel, P. Eng., do hereby certify that:
1) I am a Senior Mining Engineer with Met-Chem, a division of DRA Americas Inc., with an office at Suite 600, 555 Rene-Levesque Blvd. W. Montreal, Quebec, Canada;
2) I am a graduate from Ecole Polytechnique de Montreal with a Bachelor’s degree in Mining Engineering in 2000;
3) I am registered member of Ordre des Ingenieurs du Quebec (Membership Number 125135);
4) I have worked as an Engineer in the Mining & Metals industry continuously since my graduation from university;
5) I have read the definition of “qualified person” set out in National Instrument 43-101 (NI 43-101) and certify that by reason of my education, affiliation with a professional association (as defined by NI 43-101) and past relevant work experience, I fulfill the requirements to be a "qualified person" for the purposes of NI 43-101;
6) I have participated in the preparation of the report entitled " titled “Preliminary Economic Assessment (PEA) #3 of the Tamarack North Project – Tamarack, Minnesota " dated January 8, 2021 and am responsible for portions of Section 16;
7) I have not visited the site;
8) My prior involvement with the property is limited to participation in previous technical reports and in the previous PEAs for the property that is the subject of the Technical Report;
9) At the date of the Technical Report, to the best of my knowledge, information and belief, the Technical Report contains all scientific and technical information that is required to be disclosed to make the Technical Report not misleading;
10) I have no personal knowledge, as of the date of the Technical Report, of any material fact or material change which is not reflected in this Technical Report;
11) I am independent of the issuer as defined in Section 1.5 of NI 43-101; and
12) I have read National Instrument 43-101 and Form 43-101F1, and the Technical Report has been prepared in compliance with that instrument and form.
This 8th day of January 2021.
(signed) André-François Gravel _______________________________ Andre-Francois Gravel, P. Eng. Senior Mining Engineer DRA Americas Inc.

CERTIFICATE OF AUTHOR
To Accompany the NI 43-101 Technical Report entitled “Preliminary Economic Assessment (PEA) #3 of the Tamarack North Project – Tamarack, Minnesota” (the “Technical Report”), prepared for Talon Metals Corp. with an effective date of January 8, 2021.
I, Volodymyr Liskovych, PhD, P. Eng., do hereby certify that:
1) I am Process Engineer at DRA Americas Inc., with an office at 2900 – 20 Queen Street West Toronto, Ontario, Canada;
2) I am a graduate from the Zaporizhzhia State Engineering Academy (Zaporizhzhia, Ukraine) with a Metallurgical Engineer degree in 1996 and from the National Metallurgical Academy of Ukraine (Dnipro, Ukraine) with a PhD degree in Metallurgical Engineering in 2001;
3) I am a Professional Engineer licensed by Professional Engineers Ontario (Membership Number 100157409);
4) I have worked as a Metallurgical Engineer continuously since my graduation from Zaporizhzhia State Engineering Academy;
5) I have read the definition of “qualified person” set out in National Instrument 43-101 (NI 43-101) and certify that by reason of my education, affiliation with a professional association (as defined by NI 43-101) and past relevant work experience, I fulfill the requirements to be a "qualified person" for the purposes of NI 43-101;
6) I have participated in the preparation of the report entitled " titled “Preliminary Economic Assessment (PEA) #3 of the Tamarack North Project – Tamarack, Minnesota " dated January 8, 2021 and am responsible for hydrometallurgical aspects of Sections 13 and 17, and portions of Sections 1, 21, 25, 26, and 27;
7) I have not visited the site;
8) I have no prior involvement with the property that is the subject of the Technical Report;
9) At the date of the Technical Report, to the best of my knowledge, information and belief, the Technical Report contains all scientific and technical information that is required to be disclosed to make the Technical Report not misleading;
10) I have no personal knowledge, as of the date of the Technical Report, of any material fact or material change which is not reflected in this Technical Report;
11) I am independent of the issuer as defined in Section 1.5 of NI 43-101; and
12) I have read National Instrument 43-101 and Form 43-101F1, and the Technical Report has been prepared in compliance with that instrument and form.
This 8th day of January 2021.
(signed) Volodymyr Liskovych _______________________________ Volodymyr Liskovych, PhD, P. Eng. Principal Process Engineer DRA Americas Inc.

CERTIFICATE OF AUTHOR
To accompany the NI 43-101 Technical Report entitled “Preliminary Economic Assessment (PEA) #3 of the Tamarack North Project – Tamarack, Minnesota” (the “Technical Report”), prepared for Talon Metals Corp. with an effective date of January 8, 2021.
I, Andrea K. Martin, P.E., do hereby certify that:
1) I am a Lead Environmental Engineer with Foth Infrastructure & Environment, LLC, with an office at 2121 Innovation Court, Suite 300, De Pere, Wisconsin, USA;
2) I am a graduate from Michigan Technological University in Chemical Engineering in 1981 and University of Wisconsin Green Bay with a Master’s Degree in Environmental Science & Policy;
3) I have current professional engineer licenses in Minnesota (License No. 48512), Michigan (License No. 6201052301), Illinois (License No. 062.045871), and Wisconsin (License No. 359942-6) and I am a Registered Member of the Society for Mining, Metallurgy & Exploration (SME) (No. 4173551RM);
4) I have worked as an Engineer in the Mining & Metals industry since 2005 and prior to that, 17 years for a large metal plate construction company;
5) I have read the definition of “qualified person” set out in National Instrument 43-101 (NI 43-101) and certify that by reason of my education, affiliation with a professional association (as defined by NI 43-101) and past relevant work experience, I fulfill the requirements to be a "qualified person" for the purposes of NI 43-101;
6) I have participated in the preparation of the report entitled " titled “Preliminary Economic Assessment (PEA) #3 of the Tamarack North Project – Tamarack, Minnesota " dated January 8, 2021 and am responsible for Section 20, and portions of Sections 1, 3, and 26;
7) I have visited the site on April 18, 2014, January 23, 2019, and January 27, 2020; 8) My prior involvement with the property is related to the environmental baseline studies and other
conceptual site studies; 9) At the date of the Technical Report, to the best of my knowledge, information and belief, the
Technical Report contains all scientific and technical information that is required to be disclosed to make the Technical Report not misleading;
10) I have no personal knowledge, as of the date of the Technical Report, of any material fact or material change which is not reflected in this Technical Report;
11) I am independent of the issuer as defined in Section 1.5 of NI 43-101; and 12) I have read National Instrument 43-101 and Form 43-101F1, and the Technical Report has been
prepared in compliance with that instrument and form.
This 8th day of January 2021.
I hereby certify that Section 20 and associated portions of Sections 1, 3, and 26 of this report were prepared by me and that I am a duly Licensed Professional Engineer under the laws of the state of Minnesota.
(signed) Andrea Martin _______________________________ Andrea K. Martin, P.E. Lead Environmental Engineer Foth Infrastructure & Environment, LLC Minnesota P.E. License No. 48512

CERTIFICATE OF AUTHOR
To Accompany the NI 43-101 Technical Report entitled “Preliminary Economic Assessment (PEA) #3 of the Tamarack North Project – Tamarack, Minnesota” (the “Technical Report”), prepared for Talon Metals Corp. with an effective date of January 8, 2021.
I, Oliver Peters, P. Eng., do hereby certify that:
1) I am Principal Metallurgist and President with Metpro Management Inc., with a business address at 102 Milroy Drive, Peterborough, Ontario, Canada;
2) I am a graduate of the mineral processing program at the Technical University of Aachen, Germany in 1998;
3) I am a Professional Engineer licensed by Professional Engineers Ontario (Membership Number 100078050);
4) I have worked as a Mineral Processing Engineer continuously since my graduation from university;
5) I have read the definition of “qualified person” set out in National Instrument 43-101 (NI 43-101) and certify that by reason of my education, affiliation with a professional association (as defined by NI 43-101) and past relevant work experience, I fulfill the requirements to be a "qualified person" for the purposes of NI 43-101;
6) I have participated in the preparation of the report entitled " titled “Preliminary Economic Assessment (PEA) #3 of the Tamarack North Project – Tamarack, Minnesota " dated January 8, 2021 and am responsible for mineral processing aspects of Sections 13 and 17, and portions of Sections 1, 21, 25, 26, and 27;
7) I have not visited the site;
8) My prior involvement with the property is limited to participation in previous technical reports and in the previous PEAs for the property that is the subject of the Technical Report;
9) At the date of the Technical Report, to the best of my knowledge, information and belief, the Technical Report contains all scientific and technical information that is required to be disclosed to make the Technical Report not misleading;
10) I have no personal knowledge, as of the date of the Technical Report, of any material fact or material change which is not reflected in this Technical Report;
11) I am independent of the issuer as defined in Section 1.5 of NI 43-101; and
12) I have read National Instrument 43-101 and Form 43-101F1, and the Technical Report has been prepared in compliance with that instrument and form.
This 8th day of January 2021.
(signed) Oliver M. Peters _______________________________ Oliver M. Peters, P. Eng. Principal Metallurgist and President Metpro Management Inc.

CERTIFICATE OF AUTHOR
To Accompany the NI 43-101 Technical Report entitled “Preliminary Economic Assessment (PEA) #3 of the Tamarack North Project – Tamarack, Minnesota” (the “Technical Report”), prepared for Talon Metals Corp. with an effective date of January 8, 2021.
I, David Ritchie, P. Eng., do hereby certify that:
1) I am a Geotechnical Engineer and Engineering Service Line Manager with SLR Consulting (Canada) Ltd., with an office at 36 King Street East, 4th Floor, Toronto, Ontario, Canada;
2) I am a graduate from Ryerson Polytechnic University in 1995 with a B. Eng in Civil Engineering, and from the University of Western Ontario in 2000 with an M. Eng. (Geotechnical);
3) I am a Professional Engineer licensed by Professional Engineers Ontario (Membership Number 90488198);
4) I have worked as an Engineer in the Mining & Metals industry continuously since my graduation from university;
5) I have read the definition of “qualified person” set out in National Instrument 43-101 (NI 43-101) and certify that by reason of my education, affiliation with a professional association (as defined by NI 43-101) and past relevant work experience, I fulfill the requirements to be a "qualified person" for the purposes of NI 43-101;
6) I have participated in the preparation of the report entitled " titled “Preliminary Economic Assessment (PEA) #3 of the Tamarack North Project – Tamarack, Minnesota " dated January 8, 2021 and am responsible for portions of Sections 3 and 18.6;
7) I have not visited the site;
8) My prior involvement with the property is limited to participation in previous technical reports and in the previous PEAs for the property that is the subject of the Technical Report;
9) At the date of the Technical Report, to the best of my knowledge, information and belief, the Technical Report contains all scientific and technical information that is required to be disclosed to make the Technical Report not misleading;
10) I have no personal knowledge, as of the date of the Technical Report, of any material fact or material change which is not reflected in this Technical Report;
11) I am independent of the issuer as defined in Section 1.5 of NI 43-101; and
12) I have read National Instrument 43-101 and Form 43-101F1, and the Technical Report has been prepared in compliance with that instrument and form.
This 8th day of January 2021.
(signed) David Ritchie _______________________________ David Ritchie, P. Eng. Engineering Service Line Manager SLR Consulting (Canada) Ltd.

Golder
33 Mackenzie Street, Suite 100 Sudbury, Ontario, P3C 4Y1 Canada
T: +1 705 524 6861 | F: +1 705 524 1984
Golder and the G logo are trademarks of Golder Associates Corporation golder.com
CERTIFICATE OF QUALIFIED PERSON BRIAN THOMAS I, Brian Thomas P.Geo., state that:
(a) I am a Geologist at: Golder Associates Limited 33 Mackenzie Street, Suite 100 Sudbury, Ontario, P3C 4Y1
(b) This certificate applies to the technical report titled “Preliminary Economic Assessment (PEA) #3 of the Tamarack North Project – Tamarack, Minnesota” (the “Technical Report”), prepared for Talon Metals Corp. with an effective date of: January 8, 2021.
(c) I am a “qualified person” for the purposes of National Instrument 43-101 (the “Instrument”). My
qualifications as a qualified person are as follows. I am a graduate of Laurentian University with a B.Sc. in Geology from 1994, am a member in good standing of the Association of Professional Geoscientists of Ontario (#1366) and a member in good standing of the Engineers and Geoscientists of British Columbia (#38094). My relevant experience after graduation includes over twenty-six years of mine geology, mineral resource estimation and consulting experience in a variety of mineral projects nationally and internationally covering gold and base metal deposits including 9 years of direct nickel-copper, magmatic sulphide deposit experience with Vale in Sudbury, Ontario (formerly INCO LTD).
(d) My most recent personal inspection of the property described in the Technical Report occurred on
July 16th, 2014 and for a duration of 1 day.
(e) I am responsible for Items 4, 5, 6, 7, 8, 9, 10, 11, 12, 14, 23 and relevant portions of Items 1, 3, 25, 26, and 27 of the Technical Report.
(f) I am independent of the issuer as described in section 1.5 of the Instrument. (g) My prior involvement with the property that is the subject of the Technical Report is as follows. I
have previously participated in the Mineral Resource estimate and technical report titled “First Independent Technical Report on the Tamarack North Project, Tamarack, Minnesota” with an effective date of August 29, 2014 and have completed an interim Mineral Resource estimate of the MSU zone, with an effective date of April 3, 2015 publicly disclosed in the April 8, 2015 press release entitled “Talon Metals Announces 167% Increase in Tonnage for the Inferred Massive Sulphide Resource, and an Increase in Grade from 6.42% to 7.26% NiEQ in the Massive Sulphide Unit at Tamarack”. I have also participated in the preparation of the technical report titled “Second Independent Technical Report on the Tamarack North Project – Tamarack, Minnesota” with an effective date of: March 26, 2018 as well as the technical report titled “Preliminary Economic Assessment (PEA) of the Tamarack North Project – Tamarack, Minnesota” with an effective date of December 14, 2018 and the technical report titled “Updated Preliminary Economic Assessment (PEA) of the Tamarack North Project – Tamarack, Minnesota” with an effective date of March 12, 2020.
(h) I have read National Instrument 43-101. The part of the Technical Report for which I am responsible
has been prepared in compliance with this Instrument; and

Golder
33 Mackenzie Street, Suite 100 Sudbury, Ontario, P3C 4Y1 Canada
T: +1 705 524 6861 | F: +1 705 524 1984
Golder and the G logo are trademarks of Golder Associates Corporation golder.com
Golder
33 Mackenzie Street, Suite 100 Sudbury, Ontario, P3C 4Y1 Canada
T: +1 705 524 6861 | F: +1 705 524 1984
Golder and the G logo are trademarks of Golder Associates Corporation golder.com
(i) At the effective date of the Technical Report, to the best of my knowledge, information, and belief, the part of Technical Report for which I am responsible, contains all scientific and technical information that is required to be disclosed to make the Technical Report not misleading.
Dated at Sudbury, Ontario this 8th day of January 2021.
(signed and sealed) Brian Thomas _______________________________ Brian Thomas, P. Geo. Senior Resource Geologist Golder Associates Ltd.