Embed Size (px)
Citation preview
applied sciences
Article
Potential of Biogas Production from ProcessingResidues to Reduce Environmental Impacts fromCassava Starch and Crisp Production—A Case Studyfrom Malaysia
Jens Lansche * , Sebastian Awiszus , Sajid Latif and Joachim Müller
Institute of Agricultural Engineering, Tropics and Subtropics Group, University of Hohenheim, 70599 Stuttgart,Germany; [email protected] (S.A.); [email protected] (S.L.);[email protected] (J.M.)* Correspondence: [email protected] or [email protected]; Tel.: +49-711-459-23464
Received: 8 March 2020; Accepted: 22 April 2020; Published: 24 April 2020�����������������
Abstract: The cultivation of cassava (Manihot esculenta) is widely spread in a variety of tropicalcountries with an estimated annual production of 291.9 million tons. The crop is the most importantsource of carbohydrates in producing countries. In Malaysia, cassava is mainly cultivated for starchproduction. Despite the economic and nutritional importance of cassava, there is only limitedknowledge available regarding the overall environmental impacts of cassava starch production or theproduction of alternative food products like cassava crisps. This study presents an environmentalassessment of different scenarios of cassava production and processing by a life cycle assessment(LCA) approach. The results indicate that the environmental impacts of cassava-based productscan be reduced considerably with the utilization of processing residues for anaerobic digestion ifthe resulting biogas is used for the production of electricity and heat. In the industrial scenario, theresults indicate that the highest relative reductions are achieved for cumulated energy demand (CED),global warming potential (GWP) and deforestation (DEF) with −39%, −26% and −18%, respectively,while in the advanced scenario, environmental impacts for CED, GWP, ozone formation potential(OFP) and water stress index (WSI) can be reduced by more than 10% with −281%, −37%, −16% and−14%, respectively. The impacts for global warming potential found in this study are slightly highercompared to other studies that focused on the carbon footprint of starch production from cassava,while the savings due to biogas production are similar.
Keywords: LCA; life cycle assessment; cassava crisps; anaerobic digestion; renewable energy;circular economy
1. Introduction
The cultivation of cassava (Manihot esculenta) is widely spread in a variety of tropical countrieswith an estimated annual production of 291.9 million tons [1]. Cassava products are used for humannutrition, animal feed as well as for industrial applications and energy supply [2]. Both the rootsand leaves of cassava can be used as food. The crop is the most important source of carbohydratesin producing countries and it can contribute to the supply of proteins, micronutrients and mineralsadditionally [3]. The latter nutrients are mainly provided by cassava leaves, if consumed. As reportedby Vetter [4], both cassava roots and leaves contain cyanogenic components that vary in concentrationaccording to genetic variety and growth stage and need to be detoxified before utilization in animal orhuman nutrition.
Appl. Sci. 2020, 10, 2975; doi:10.3390/app10082975 www.mdpi.com/journal/applsci
Appl. Sci. 2020, 10, 2975 2 of 12
Due to the diversity of ingredients and its suitability for different applications, cassava is avaluable feedstock for cascade use. An example for the implementation of cascade use is the conceptof the green biorefinery [5]. In comparison with conventional production systems, processing in greenbiorefineries can lead to environmental advantages. However, the dissemination of such concepts indeveloping countries is still very limited. A simple implementation of cascade use is a utilization ofresidues for energy production and plant nutrition. While recent studies assessed the potential ofseveral substrates for biogas production in Malaysia [6,7], there is only little knowledge available aboutthe utilization of residues from cassava processing and its environmental consequences. In Malaysia,cassava is mainly cultivated for starch production [8]. Different technologies exist for processing ofcassava roots to cassava starch [9]. In addition, alternative food products can be produced that are richin carbohydrates, like cassava crisps, which are deep-fried cassava slices.
Torquati et al. have shown that there can be trade-offs between economic and ecological benefitsin agricultural production systems [10]. However, despite the economic and nutritional importanceof cassava, there is only limited knowledge available regarding the overall environmental impactsof cassava starch production or the production of alternative food products like cassava crisps. Inseveral studies, the carbon footprint was evaluated, while full life cycle assessment (LCA) studies forcassava starch production are not available yet to our knowledge, especially not for Malaysia. ForThailand, Usubharatana and Phungrassami [11] found that producing 1 t of cassava starch causesabout 600 kg of CO2-equivalents (CO2-eq) where the agricultural production dominated the impact(40–59%). Hansupalak et al. [12] reported higher emissions with 609–966 kg CO2-eq. For starchproduction in Thailand, Vietnam, Colombia, Tran et al. [9] reported 93–539 kg CO2-eq without takinginto consideration the production of cassava roots. Olaniran et al. assessed the environmental impactsof processing cassava roots to flour [13] and reported 11 kg CO2 eq per kg of flour. For the productionof cassava crisps, however, there is no information available yet. The lack of knowledge about theenvironmental impacts of cassava products becomes relevant in the context of the international goalsfor sustainable development [14]. Sala and Castellani propose a method based on life cycle assessment(LCA) as an indicator and basis for monitoring the sustainable development goal No. 12 “sustainableproduction and consumption” [15].
This study presents an environmental assessment of different scenarios of cassava production andprocessing by a life cycle assessment (LCA) approach. In addition to estimating the absolute level ofenvironmental impacts, the question is answered to what extent the production of biogas from residualmaterials can contribute to a reduction in the environmental impacts of cassava starch production. Asprevious studies indicate a major influence of primary agricultural production on the greenhouse gasemissions of cassava starch production, it is also hypothesized that other environmental impacts aresignificantly influenced by this production step. Therefore, a specific focus is set on primary production.
2. Materials and Methods
2.1. Description of the System under Study
2.1.1. Feedstock for the Production of Starch, Crisps and Biogas
Cassava is considered the main feedstock. Cassava cultivation covers all steps starting from theproduction of seedlings, including essential disinfection, field preparation, planting, fertilization andpest control as well as harvesting. The processing of the main parts of the cassava plant (roots, stemsand peel) is included in the scenarios. For the evaluation of different cultivation intensities besidesthe traditional cultivation based on manual labor, a modern, i.e., fully mechanized scenario, was alsomodelled. Table 1 shows the assumptions for the traditional system and the modern system. Bothsystems were modelled with two sub-scenarios where leaves are (i) left on the field and burned or(ii) harvested. For the combustion of leaves, the following emissions were taken into consideration:CO2, SO2, dust (PM10 and PM2.5) as well as NOx.
Appl. Sci. 2020, 10, 2975 3 of 12
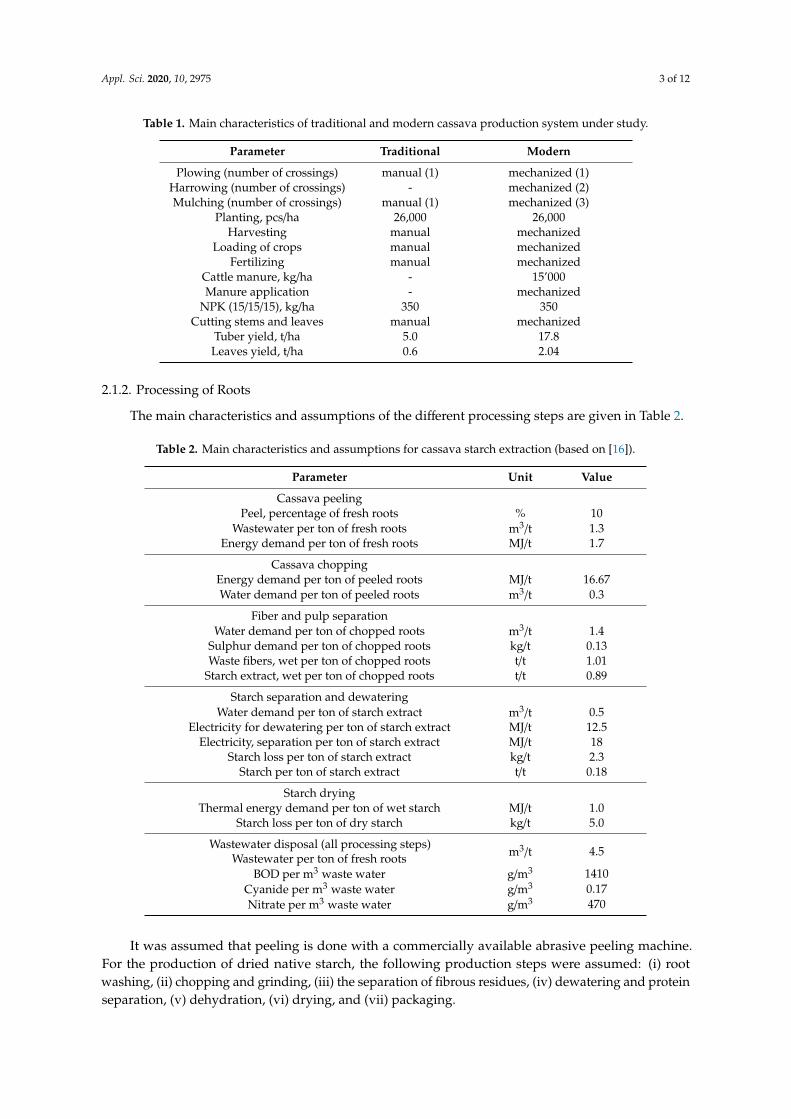
Table 1. Main characteristics of traditional and modern cassava production system under study.
Parameter Traditional Modern
Plowing (number of crossings) manual (1) mechanized (1)Harrowing (number of crossings) - mechanized (2)Mulching (number of crossings) manual (1) mechanized (3)
Planting, pcs/ha 26,000 26,000Harvesting manual mechanized
Loading of crops manual mechanizedFertilizing manual mechanized
Cattle manure, kg/ha - 15’000Manure application - mechanized
NPK (15/15/15), kg/ha 350 350Cutting stems and leaves manual mechanized
Tuber yield, t/ha 5.0 17.8Leaves yield, t/ha 0.6 2.04
2.1.2. Processing of Roots
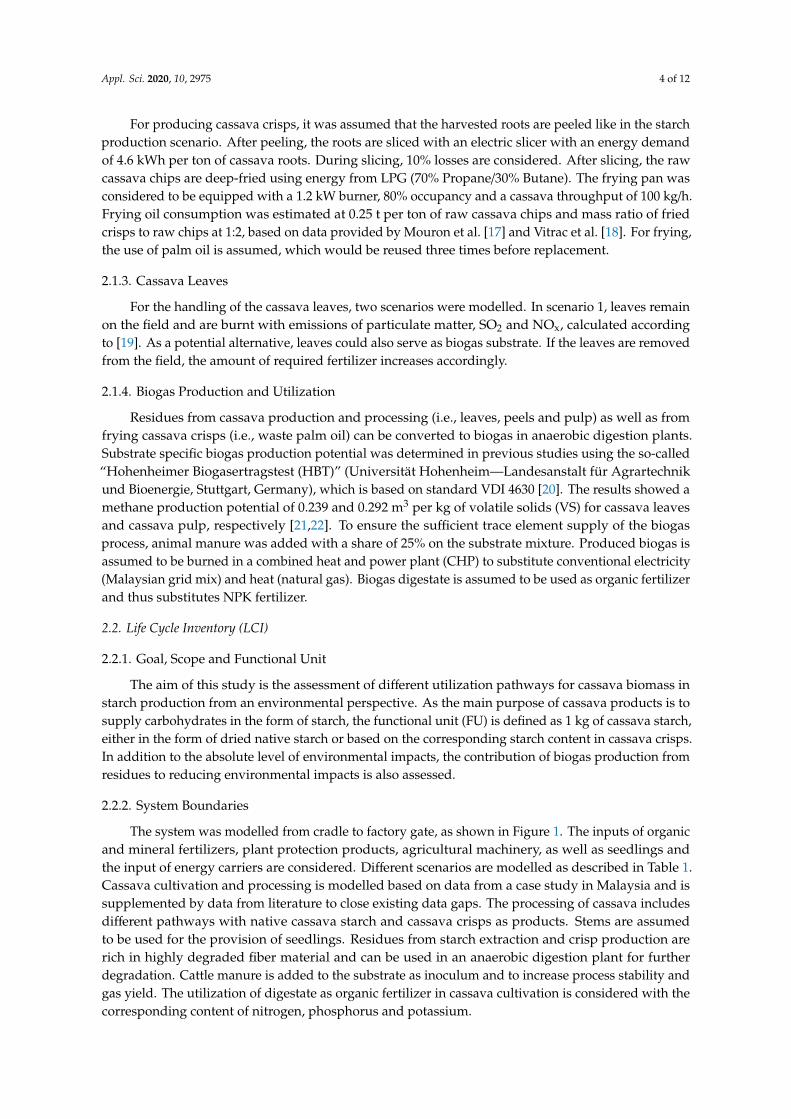
The main characteristics and assumptions of the different processing steps are given in Table 2.
Table 2. Main characteristics and assumptions for cassava starch extraction (based on [16]).
Parameter Unit Value
Cassava peelingPeel, percentage of fresh roots % 10
Wastewater per ton of fresh roots m3/t 1.3Energy demand per ton of fresh roots MJ/t 1.7
Cassava choppingEnergy demand per ton of peeled roots MJ/t 16.67Water demand per ton of peeled roots m3/t 0.3
Fiber and pulp separationWater demand per ton of chopped roots m3/t 1.4
Sulphur demand per ton of chopped roots kg/t 0.13Waste fibers, wet per ton of chopped roots t/t 1.01
Starch extract, wet per ton of chopped roots t/t 0.89
Starch separation and dewateringWater demand per ton of starch extract m3/t 0.5
Electricity for dewatering per ton of starch extract MJ/t 12.5Electricity, separation per ton of starch extract MJ/t 18
Starch loss per ton of starch extract kg/t 2.3Starch per ton of starch extract t/t 0.18
Starch dryingThermal energy demand per ton of wet starch MJ/t 1.0
Starch loss per ton of dry starch kg/t 5.0
Wastewater disposal (all processing steps)Wastewater per ton of fresh roots m3/t 4.5
BOD per m3 waste water g/m3 1410Cyanide per m3 waste water g/m3 0.17Nitrate per m3 waste water g/m3 470
It was assumed that peeling is done with a commercially available abrasive peeling machine.For the production of dried native starch, the following production steps were assumed: (i) rootwashing, (ii) chopping and grinding, (iii) the separation of fibrous residues, (iv) dewatering and proteinseparation, (v) dehydration, (vi) drying, and (vii) packaging.
Appl. Sci. 2020, 10, 2975 4 of 12
For producing cassava crisps, it was assumed that the harvested roots are peeled like in the starchproduction scenario. After peeling, the roots are sliced with an electric slicer with an energy demandof 4.6 kWh per ton of cassava roots. During slicing, 10% losses are considered. After slicing, the rawcassava chips are deep-fried using energy from LPG (70% Propane/30% Butane). The frying pan wasconsidered to be equipped with a 1.2 kW burner, 80% occupancy and a cassava throughput of 100 kg/h.Frying oil consumption was estimated at 0.25 t per ton of raw cassava chips and mass ratio of friedcrisps to raw chips at 1:2, based on data provided by Mouron et al. [17] and Vitrac et al. [18]. For frying,the use of palm oil is assumed, which would be reused three times before replacement.
2.1.3. Cassava Leaves
For the handling of the cassava leaves, two scenarios were modelled. In scenario 1, leaves remainon the field and are burnt with emissions of particulate matter, SO2 and NOx, calculated accordingto [19]. As a potential alternative, leaves could also serve as biogas substrate. If the leaves are removedfrom the field, the amount of required fertilizer increases accordingly.
2.1.4. Biogas Production and Utilization
Residues from cassava production and processing (i.e., leaves, peels and pulp) as well as fromfrying cassava crisps (i.e., waste palm oil) can be converted to biogas in anaerobic digestion plants.Substrate specific biogas production potential was determined in previous studies using the so-called“Hohenheimer Biogasertragstest (HBT)” (Universität Hohenheim—Landesanstalt für Agrartechnikund Bioenergie, Stuttgart, Germany), which is based on standard VDI 4630 [20]. The results showed amethane production potential of 0.239 and 0.292 m3 per kg of volatile solids (VS) for cassava leavesand cassava pulp, respectively [21,22]. To ensure the sufficient trace element supply of the biogasprocess, animal manure was added with a share of 25% on the substrate mixture. Produced biogas isassumed to be burned in a combined heat and power plant (CHP) to substitute conventional electricity(Malaysian grid mix) and heat (natural gas). Biogas digestate is assumed to be used as organic fertilizerand thus substitutes NPK fertilizer.
2.2. Life Cycle Inventory (LCI)
2.2.1. Goal, Scope and Functional Unit
The aim of this study is the assessment of different utilization pathways for cassava biomass instarch production from an environmental perspective. As the main purpose of cassava products is tosupply carbohydrates in the form of starch, the functional unit (FU) is defined as 1 kg of cassava starch,either in the form of dried native starch or based on the corresponding starch content in cassava crisps.In addition to the absolute level of environmental impacts, the contribution of biogas production fromresidues to reducing environmental impacts is also assessed.
2.2.2. System Boundaries
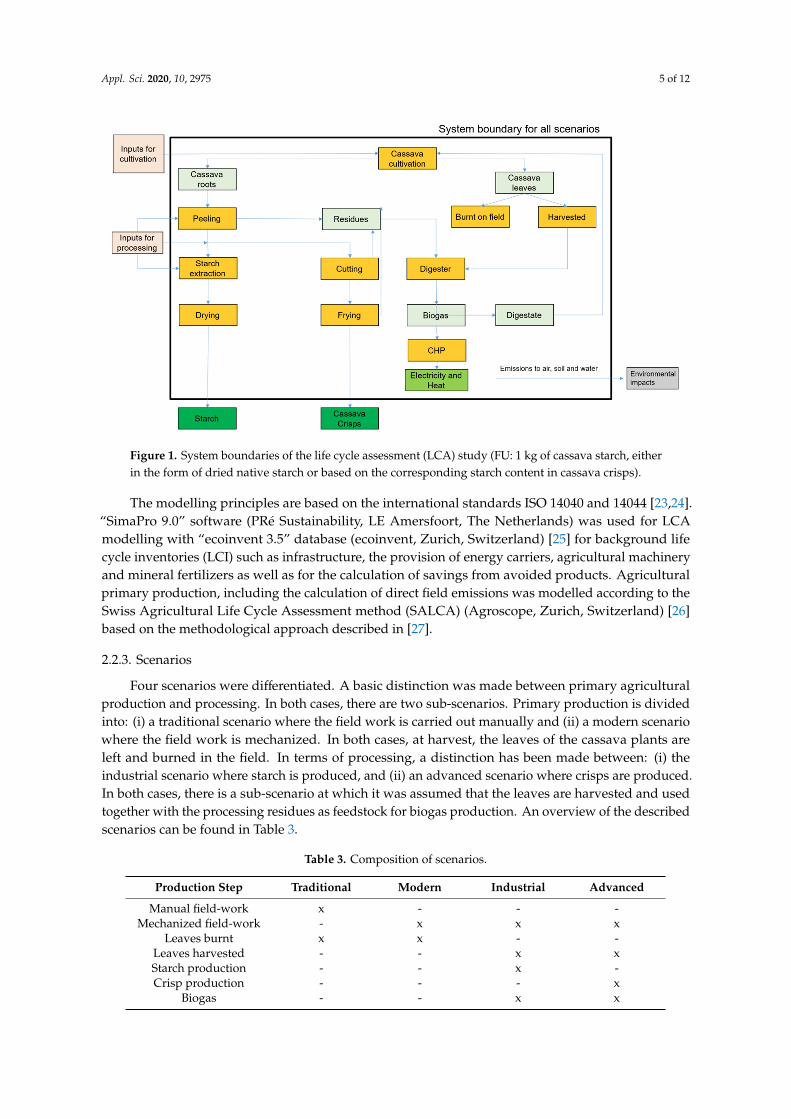
The system was modelled from cradle to factory gate, as shown in Figure 1. The inputs of organicand mineral fertilizers, plant protection products, agricultural machinery, as well as seedlings andthe input of energy carriers are considered. Different scenarios are modelled as described in Table 1.Cassava cultivation and processing is modelled based on data from a case study in Malaysia and issupplemented by data from literature to close existing data gaps. The processing of cassava includesdifferent pathways with native cassava starch and cassava crisps as products. Stems are assumedto be used for the provision of seedlings. Residues from starch extraction and crisp production arerich in highly degraded fiber material and can be used in an anaerobic digestion plant for furtherdegradation. Cattle manure is added to the substrate as inoculum and to increase process stability andgas yield. The utilization of digestate as organic fertilizer in cassava cultivation is considered with thecorresponding content of nitrogen, phosphorus and potassium.
Appl. Sci. 2020, 10, 2975 5 of 12
Appl. Sci. 2020, 10, x FOR PEER REVIEW 5 of 12
and gas yield. The utilization of digestate as organic fertilizer in cassava cultivation is considered with the corresponding content of nitrogen, phosphorus and potassium.
Figure 1. System boundaries of the life cycle assessment (LCA) study (FU: 1 kg of cassava starch, either in the form of dried native starch or based on the corresponding starch content in cassava crisps).
The modelling principles are based on the international standards ISO 14040 and 14044 [23,24]. “SimaPro 9.0” software (PRé Sustainability, LE Amersfoort, Netherlands) was used for LCA modelling with “ecoinvent 3.5” database (ecoinvent, Zurich, Switzerland) [25] for background life cycle inventories (LCI) such as infrastructure, the provision of energy carriers, agricultural machinery and mineral fertilizers as well as for the calculation of savings from avoided products. Agricultural primary production, including the calculation of direct field emissions was modelled according to the Swiss Agricultural Life Cycle Assessment method (SALCA) (Agroscope, Zurich, Switzerland) [26] based on the methodological approach described in [27].
2.2.3. Scenarios
Four scenarios were differentiated. A basic distinction was made between primary agricultural production and processing. In both cases, there are two sub-scenarios. Primary production is divided into: (i) a traditional scenario where the field work is carried out manually and (ii) a modern scenario where the field work is mechanized. In both cases, at harvest, the leaves of the cassava plants are left and burned in the field. In terms of processing, a distinction has been made between: (i) the industrial scenario where starch is produced, and (ii) an advanced scenario where crisps are produced. In both cases, there is a sub-scenario at which it was assumed that the leaves are harvested and used together with the processing residues as feedstock for biogas production. An overview of the described scenarios can be found in Table 3.
Figure 1. System boundaries of the life cycle assessment (LCA) study (FU: 1 kg of cassava starch, eitherin the form of dried native starch or based on the corresponding starch content in cassava crisps).
The modelling principles are based on the international standards ISO 14040 and 14044 [23,24].“SimaPro 9.0” software (PRé Sustainability, LE Amersfoort, The Netherlands) was used for LCAmodelling with “ecoinvent 3.5” database (ecoinvent, Zurich, Switzerland) [25] for background lifecycle inventories (LCI) such as infrastructure, the provision of energy carriers, agricultural machineryand mineral fertilizers as well as for the calculation of savings from avoided products. Agriculturalprimary production, including the calculation of direct field emissions was modelled according to theSwiss Agricultural Life Cycle Assessment method (SALCA) (Agroscope, Zurich, Switzerland) [26]based on the methodological approach described in [27].
2.2.3. Scenarios
Four scenarios were differentiated. A basic distinction was made between primary agriculturalproduction and processing. In both cases, there are two sub-scenarios. Primary production is dividedinto: (i) a traditional scenario where the field work is carried out manually and (ii) a modern scenariowhere the field work is mechanized. In both cases, at harvest, the leaves of the cassava plants areleft and burned in the field. In terms of processing, a distinction has been made between: (i) theindustrial scenario where starch is produced, and (ii) an advanced scenario where crisps are produced.In both cases, there is a sub-scenario at which it was assumed that the leaves are harvested and usedtogether with the processing residues as feedstock for biogas production. An overview of the describedscenarios can be found in Table 3.
Table 3. Composition of scenarios.
Production Step Traditional Modern Industrial Advanced
Manual field-work x - - -Mechanized field-work - x x x
Leaves burnt x x - -Leaves harvested - - x xStarch production - - x -Crisp production - - - x
Biogas - - x x
Appl. Sci. 2020, 10, 2975 6 of 12
2.2.4. LCI Data
The primary data for cassava cultivation were collected in Malaysia by a questionnaire in theyears 2016/2017 and complemented with data from literature. Pesticide application was modelledbased on data from [28]. Table 4 shows the emission models used in this study for calculation of directfield emissions.
Table 4. Emission models used (adapted from [27]).
Emission Emission Model
Ammonia (NH3) EMEP Tier 2 [29]Nitrogen oxides (NOx, NO, NO2) EMEP [29]
Nitrous oxide (N2O) IPCC Tier1 [30]Nitrate (NO3
−) SQCB [31]Phosphorous (P, PO4
3−) SALCA-P [32]Heavy metals (Cd, Cr, Cu, Hg, Ni, Pb, Zn) Freiermuth [33]
Carbon dioxide (CO2) IPCC [30]
In more detail, the following formulas were used for calculation of direct emissions (adaptedfrom [27]).
For ammonia (NH3) emissions to air, the following equation was used:
NH3 =1714·
∑m
1((p·EFam + (1− p)·EFbm))·Nmin·Mm− 1), (1)
where NH3 is ammonia emission after mineral fertilizer application (kg NH3), m is fertilizer type (M isnumber of fertilizer types), EFam is emission factor on soils with pH ≤ 7 (kg NH3-N/kg N), EFbm isemission factor on soils with pH > 7 (kg NH3-N/kg N), p is fraction of soils with pH ≤ 7 (%/100) andNmin is mineral fertiliser application (kg N/ha).
The emissions of various nitrogen oxides (NOx, NO, NO2) were calculated based on the remainingN after NH3 emission. The emission factor for the application of all types of mineral and organicfertilizer is 0.012 kg NOx-N per kg of applied N based on [29].
For the calculation of nitrate (NO3) leaching to ground water, the SQCB-NO3 model was used asreported in [31]:
NO3 = 21.37 +P
C·L
(0.0037·Nsup + 0.0000601 · Norg − 0.00362·Nup
), (2)
where NO3 is leached NO3-N (kg N/(ha a)), P is precipitation and irrigation (mm/year), c is clay content(%), L is rooting depth (m), Nsup is nitrogen supply through fertilizer (kg N/ha), Norg is nitrogen inorganic matter (kg N/ha) and Nup is nitrogen uptake by crop (kg N/ha).
Nitrous oxide (N2O) from nitrification and denitrification processes are considered by thefollowing equation:
N2O =4428·
(0.01
(Ntot + Ncr + Nsom +
1417·NH3 +
1446·NOx
)+ 0.0075 ·
1462·NO3
), (3)
where N2O is the emission of N2O (kg N2O/ha a), Ntot is total nitrogen in mineral and organicfertiliser (kg N/ha), Ncr is nitrogen contained in the crop residues (kg N/ha), Nsom is nitrogen from themineralization of soil organic matter (kg N/ha), NH3 is the loss of nitrogen in the form of ammonia(kg NH3/ha), NOx is losses of nitrogen in the form of nitrogen oxides (kg NO2/ha) and NO3 is the lossof nitrogen in the form of nitrate (kg NO3/ha).
For urea application, in addition, CO2 emission were also calculated at 1.57 kg CO2 per kg ofapplied urea-N.
Appl. Sci. 2020, 10, 2975 7 of 12
Regarding phosphorus emissions to water, the following pathways have been differentiatedaccording to [27,32]: (i) leaching of PO4 to ground water, (ii) run-off of PO4 to surface water, and (iii)phosphorus emissions to surface water through soil particles transported by water erosion.
Heavy metal emissions to soil, surface water and ground water were calculated for Cd, Cr, Cu, Pb,Hg, Ni, Zn according to the SALCA-heavy metal method, as described in [33].
Pesticide emissions were modelled based on the assumption that 100% of the active ingredientsapplied will end up in the soil. This assumption is in accordance with the current modelling approachof renowned LCI databases like “ecoinvent” and “USDA LCA digital commons” [34].
2.3. Life Cycle Impact Assessment (LCIA)
The following impact categories were selected for this study, each of which are related to 1 kgstarch output (FU): cumulated energy demand (CED) in Megajoule (MJ), deforestation (DEF) in m2
forest loss, water stress index (WSI) in m3 consumed water, global warming potential (GWP) in kgCO2-eq, photochemical ozone formation potential (OFP) in kg NMVOC-equivalents (non-methanevolatile organic compounds), acidification potential (AP) in mol H+, human toxicity potential (HTP)and aquatic ecotoxicity potential (ETP) both in kg 1,4-DB-equivalents (dichlorobenzene). More detailsregarding the selected impact assessment categories are described by Bystricky et al. [35].
3. Results and Discussion
3.1. Cassava Cultivation
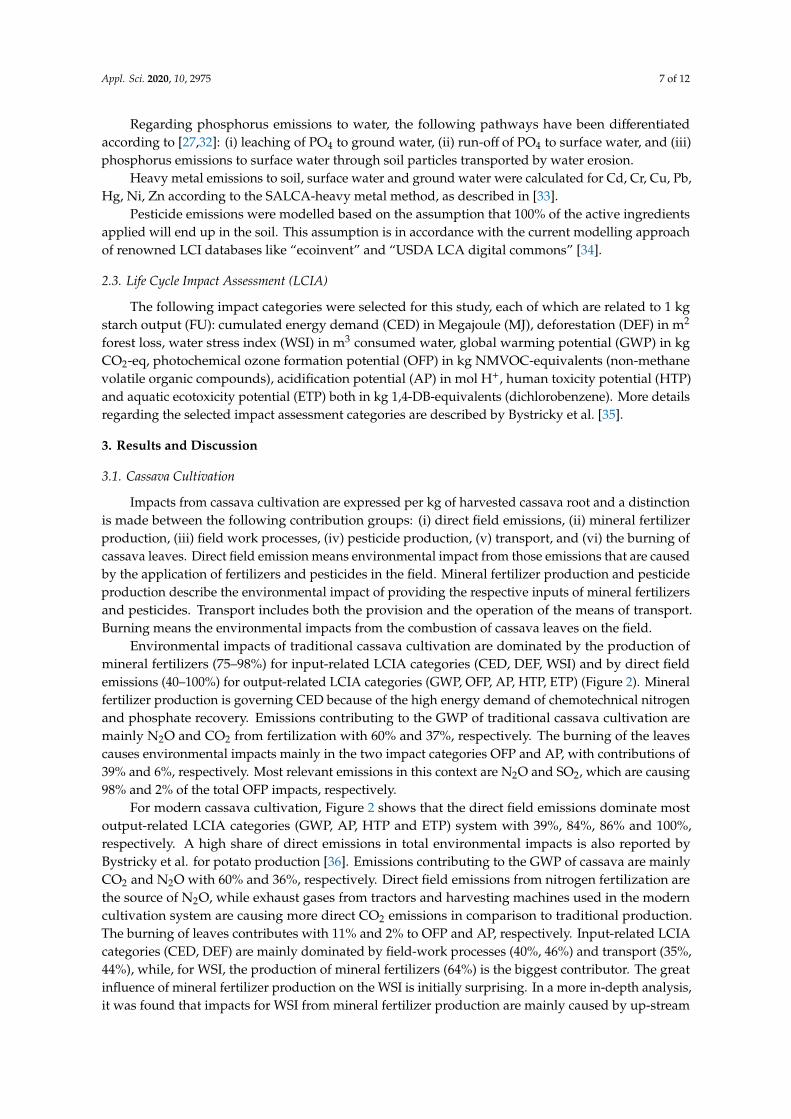
Impacts from cassava cultivation are expressed per kg of harvested cassava root and a distinctionis made between the following contribution groups: (i) direct field emissions, (ii) mineral fertilizerproduction, (iii) field work processes, (iv) pesticide production, (v) transport, and (vi) the burning ofcassava leaves. Direct field emission means environmental impact from those emissions that are causedby the application of fertilizers and pesticides in the field. Mineral fertilizer production and pesticideproduction describe the environmental impact of providing the respective inputs of mineral fertilizersand pesticides. Transport includes both the provision and the operation of the means of transport.Burning means the environmental impacts from the combustion of cassava leaves on the field.
Environmental impacts of traditional cassava cultivation are dominated by the production ofmineral fertilizers (75–98%) for input-related LCIA categories (CED, DEF, WSI) and by direct fieldemissions (40–100%) for output-related LCIA categories (GWP, OFP, AP, HTP, ETP) (Figure 2). Mineralfertilizer production is governing CED because of the high energy demand of chemotechnical nitrogenand phosphate recovery. Emissions contributing to the GWP of traditional cassava cultivation aremainly N2O and CO2 from fertilization with 60% and 37%, respectively. The burning of the leavescauses environmental impacts mainly in the two impact categories OFP and AP, with contributions of39% and 6%, respectively. Most relevant emissions in this context are N2O and SO2, which are causing98% and 2% of the total OFP impacts, respectively.
For modern cassava cultivation, Figure 2 shows that the direct field emissions dominate mostoutput-related LCIA categories (GWP, AP, HTP and ETP) system with 39%, 84%, 86% and 100%,respectively. A high share of direct emissions in total environmental impacts is also reported byBystricky et al. for potato production [36]. Emissions contributing to the GWP of cassava are mainlyCO2 and N2O with 60% and 36%, respectively. Direct field emissions from nitrogen fertilization arethe source of N2O, while exhaust gases from tractors and harvesting machines used in the moderncultivation system are causing more direct CO2 emissions in comparison to traditional production.The burning of leaves contributes with 11% and 2% to OFP and AP, respectively. Input-related LCIAcategories (CED, DEF) are mainly dominated by field-work processes (40%, 46%) and transport (35%,44%), while, for WSI, the production of mineral fertilizers (64%) is the biggest contributor. The greatinfluence of mineral fertilizer production on the WSI is initially surprising. In a more in-depth analysis,it was found that impacts for WSI from mineral fertilizer production are mainly caused by up-stream
Appl. Sci. 2020, 10, 2975 8 of 12
processes for phosphate recovery, namely phosphoric acid and sulfuric acid. Even more surprising isthe high influence of transport processes on DEF. Again, an up-stream process is responsible for this;onshore wells that produce the fuels used in the transport processes cause 95% of these impacts.
In addition to the difference in mechanization, different yields in both systems lead to differencesin the results.Appl. Sci. 2020, 10, x FOR PEER REVIEW 8 of 12
Figure 2. Environmental impacts of traditional (1) and modern (2) cassava cultivation per kg of harvested cassava root; cumulated energy demand (CED) in MJ, deforestation (DEF) in 4 × 10⁻³ m2, water stress index (WSI) in 4 × 10⁻² m3, global warming potential (GWP) in 4 × 100 kg CO2-eq, ozone formation potential (OFP) in 10−2 kg NMVOC-eq, acidification potential (AP) in 2 × 10⁻¹ mol H+, human toxicity potential (HTP) in 10−4 kg 1,4-DB-eq and ecotoxicity potential (ETP) in 10−2 kg 1,4-DB-eq.
For modern cassava cultivation, Figure 2 shows that the direct field emissions dominate most output-related LCIA categories (GWP, AP, HTP and ETP) system with 39%, 84%, 86% and 100%, respectively. A high share of direct emissions in total environmental impacts is also reported by Bystricky et al. for potato production [36]. Emissions contributing to the GWP of cassava are mainly CO2 and N2O with 60% and 36%, respectively. Direct field emissions from nitrogen fertilization are the source of N2O, while exhaust gases from tractors and harvesting machines used in the modern cultivation system are causing more direct CO2 emissions in comparison to traditional production. The burning of leaves contributes with 11% and 2% to OFP and AP, respectively. Input-related LCIA categories (CED, DEF) are mainly dominated by field-work processes (40%, 46%) and transport (35%, 44%), while, for WSI, the production of mineral fertilizers (64%) is the biggest contributor. The great influence of mineral fertilizer production on the WSI is initially surprising. In a more in-depth analysis, it was found that impacts for WSI from mineral fertilizer production are mainly caused by up-stream processes for phosphate recovery, namely phosphoric acid and sulfuric acid. Even more surprising is the high influence of transport processes on DEF. Again, an up-stream process is responsible for this; onshore wells that produce the fuels used in the transport processes cause 95% of these impacts.
In addition to the difference in mechanization, different yields in both systems lead to differences in the results.
3.2. Cassava Processing and the Utilization of Processing Residues for Biogas Production
Figure 3 shows the environmental impacts of industrial and advanced cassava processing, including cassava cultivation and taking into consideration the credits from biogas production and utilization. Environmental impacts are expressed per kg of starch content to allow a comparison of the two main products from both production systems, i.e., cassava starch and cassava crisps. The following contribution groups are differentiated: (i) the processing of peeled cassava roots to starch and crisps, respectively, (ii) the washing and peeling of harvested cassava roots, (iii) cassava
0
0.5
1
1.5
2
2.5
3
1 2 1 2 1 2 1 2 1 2 1 2 1 2 1 2
CED DEF WSI GWP OFP AP HTP ETP
Impa
ct v
alue
/kg
of h
arve
sted
cas
sava
root
Burning
Transport
Pesticide production
Field work processes
Mineral fertilizer production
Direct field emissions
Figure 2. Environmental impacts of traditional (1) and modern (2) cassava cultivation per kg ofharvested cassava root; cumulated energy demand (CED) in MJ, deforestation (DEF) in 4 × 10⁻³ m2,water stress index (WSI) in 4 × 10⁻² m3, global warming potential (GWP) in 4 × 100 kg CO2-eq,ozone formation potential (OFP) in 10−2 kg NMVOC-eq, acidification potential (AP) in 2 × 10⁻¹ molH+, human toxicity potential (HTP) in 10−4 kg 1,4-DB-eq and ecotoxicity potential (ETP) in 10−2 kg1,4-DB-eq.
3.2. Cassava Processing and the Utilization of Processing Residues for Biogas Production
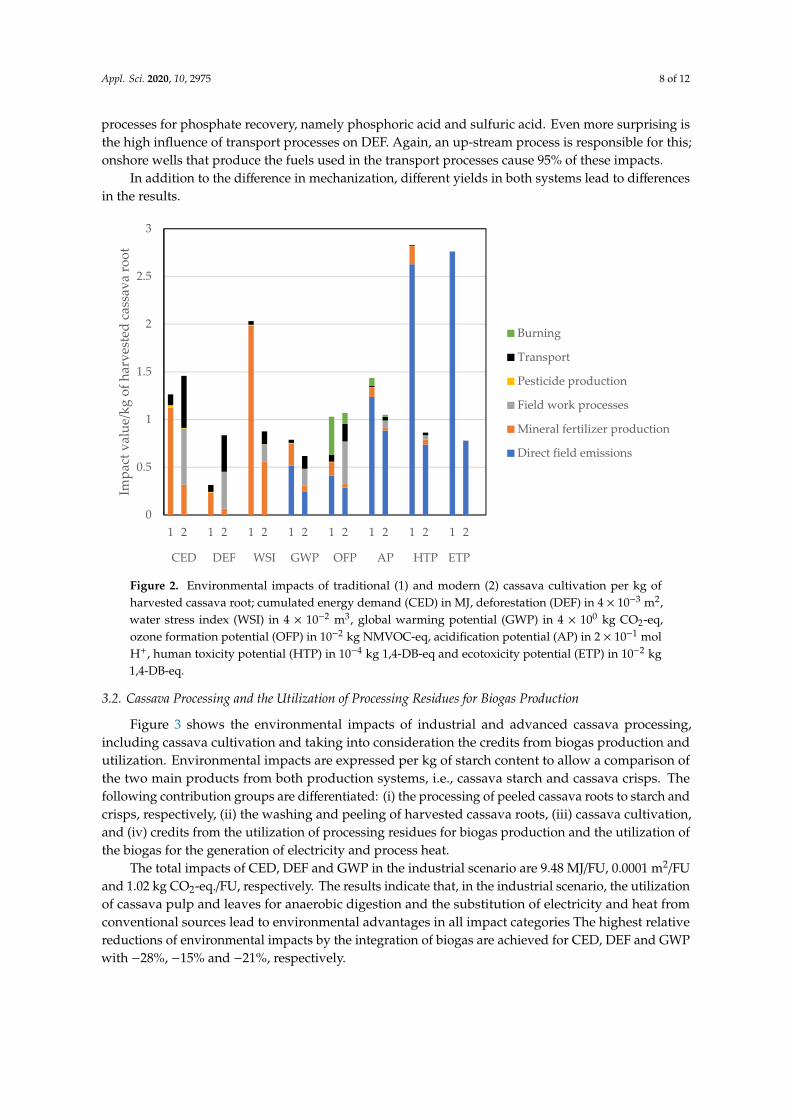
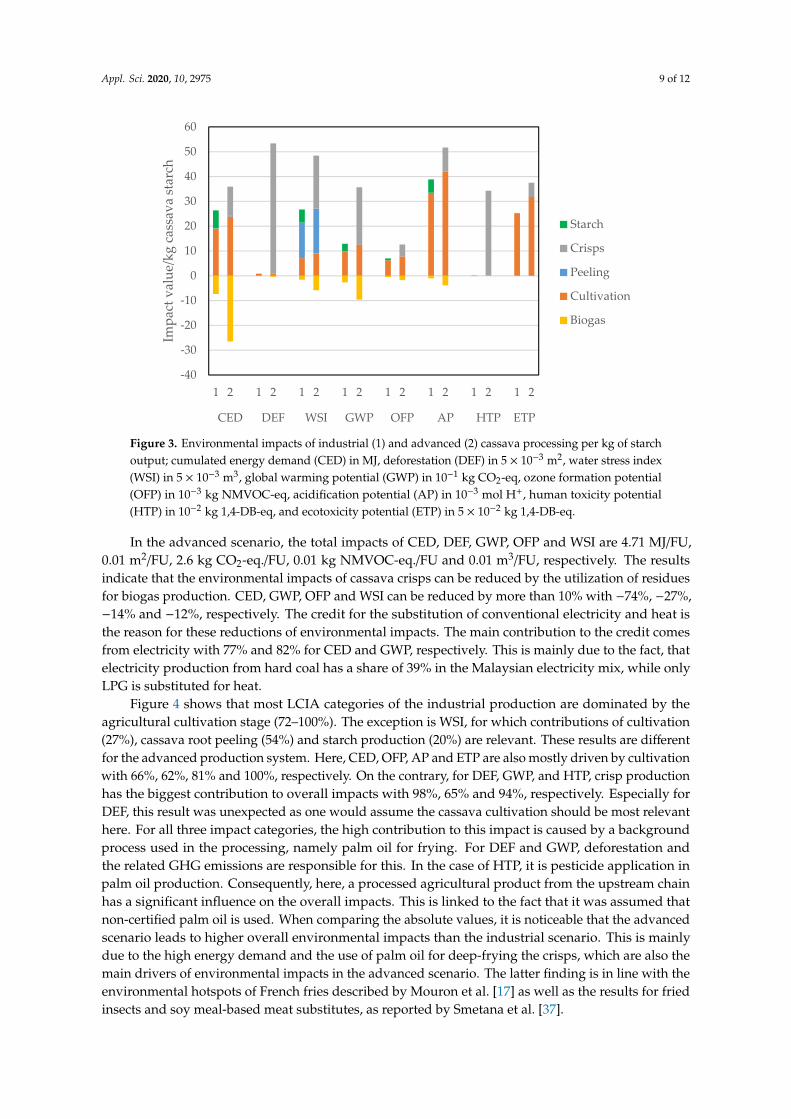
Figure 3 shows the environmental impacts of industrial and advanced cassava processing,including cassava cultivation and taking into consideration the credits from biogas production andutilization. Environmental impacts are expressed per kg of starch content to allow a comparison ofthe two main products from both production systems, i.e., cassava starch and cassava crisps. Thefollowing contribution groups are differentiated: (i) the processing of peeled cassava roots to starch andcrisps, respectively, (ii) the washing and peeling of harvested cassava roots, (iii) cassava cultivation,and (iv) credits from the utilization of processing residues for biogas production and the utilization ofthe biogas for the generation of electricity and process heat.
The total impacts of CED, DEF and GWP in the industrial scenario are 9.48 MJ/FU, 0.0001 m2/FUand 1.02 kg CO2-eq./FU, respectively. The results indicate that, in the industrial scenario, the utilizationof cassava pulp and leaves for anaerobic digestion and the substitution of electricity and heat fromconventional sources lead to environmental advantages in all impact categories The highest relativereductions of environmental impacts by the integration of biogas are achieved for CED, DEF and GWPwith −28%, −15% and −21%, respectively.
Appl. Sci. 2020, 10, 2975 9 of 12
Appl. Sci. 2020, 10, x FOR PEER REVIEW 9 of 12
cultivation, and (iv) credits from the utilization of processing residues for biogas production and the utilization of the biogas for the generation of electricity and process heat.
Figure 3. Environmental impacts of industrial (1) and advanced (2) cassava processing per kg of starch output; cumulated energy demand (CED) in MJ, deforestation (DEF) in 5 × 10⁻³ m2, water stress index (WSI) in 5 × 10⁻³ m3, global warming potential (GWP) in 10−1 kg CO2-eq, ozone formation potential (OFP) in 10−3 kg NMVOC-eq, acidification potential (AP) in 10−3 mol H+, human toxicity potential (HTP) in 10−2 kg 1,4-DB-eq, and ecotoxicity potential (ETP) in 5 × 10⁻² kg 1,4-DB-eq.
The total impacts of CED, DEF and GWP in the industrial scenario are 9.48 MJ/FU, 0.0001 m2/FU and 1.02 kg CO2-eq./FU, respectively. The results indicate that, in the industrial scenario, the utilization of cassava pulp and leaves for anaerobic digestion and the substitution of electricity and heat from conventional sources lead to environmental advantages in all impact categories The highest relative reductions of environmental impacts by the integration of biogas are achieved for CED, DEF and GWP with −28%, −15% and −21%, respectively.
In the advanced scenario, the total impacts of CED, DEF, GWP, OFP and WSI are 4.71 MJ/FU, 0.01 m2/FU, 2.6 kg CO2-eq./FU, 0.01 kg NMVOC-eq./FU and 0.01 m3/FU, respectively. The results indicate that the environmental impacts of cassava crisps can be reduced by the utilization of residues for biogas production. CED, GWP, OFP and WSI can be reduced by more than 10% with −74%, −27%, −14% and −12%, respectively. The credit for the substitution of conventional electricity and heat is the reason for these reductions of environmental impacts. The main contribution to the credit comes from electricity with 77% and 82% for CED and GWP, respectively. This is mainly due to the fact, that electricity production from hard coal has a share of 39% in the Malaysian electricity mix, while only LPG is substituted for heat.
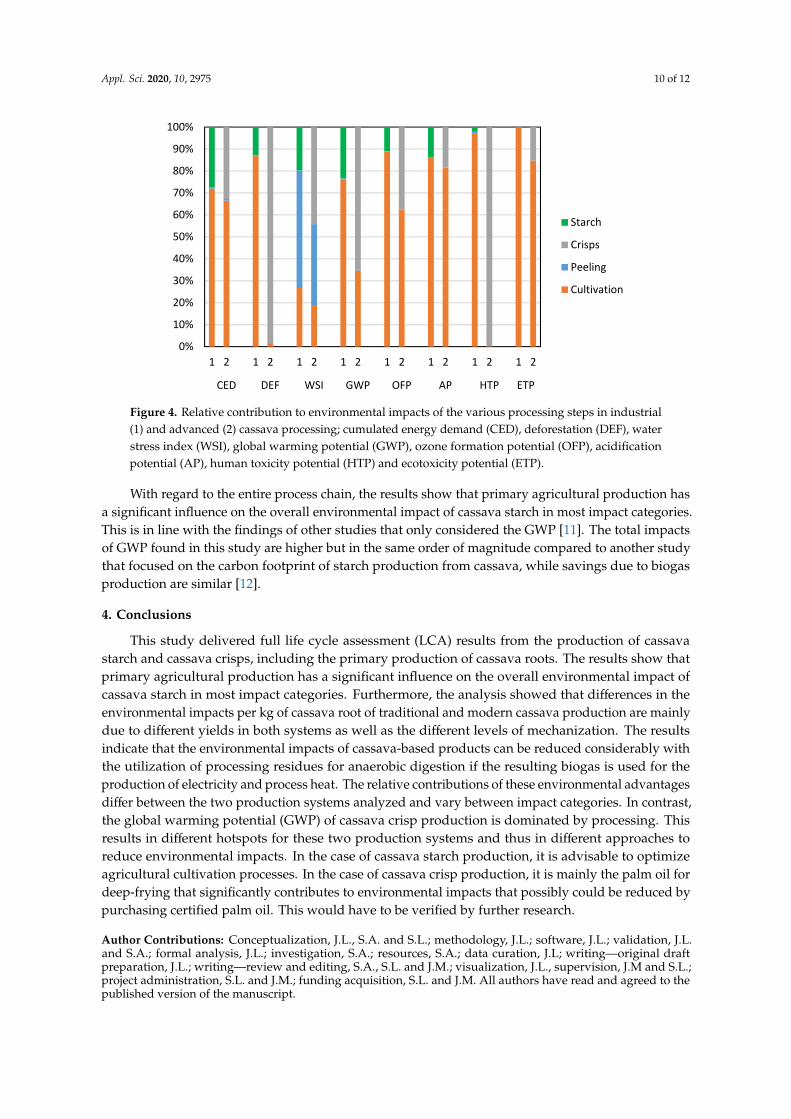
Figure 4 shows that most LCIA categories of the industrial production are dominated by the agricultural cultivation stage (72–100%). The exception is WSI, for which contributions of cultivation (27%), cassava root peeling (54%) and starch production (20%) are relevant. These results are different for the advanced production system. Here, CED, OFP, AP and ETP are also mostly driven by cultivation with 66%, 62%, 81% and 100%, respectively. On the contrary, for DEF, GWP, and HTP, crisp production has the biggest contribution to overall impacts with 98%, 65% and 94%, respectively. Especially for DEF, this result was unexpected as one would assume the cassava cultivation should be most relevant here. For all three impact categories, the high contribution to this impact is caused by a background process used in the processing, namely palm oil for frying. For DEF and GWP, deforestation and the related GHG emissions are responsible for this. In the case of HTP, it is pesticide application in palm oil production. Consequently, here, a processed agricultural product from the
-40
-30
-20
-10
0
10
20
30
40
50
60
1 2 1 2 1 2 1 2 1 2 1 2 1 2 1 2
CED DEF WSI GWP OFP AP HTP ETP
Impa
ct v
alue
/kg
cass
ava
star
ch
Starch
Crisps
Peeling
Cultivation
Biogas
Figure 3. Environmental impacts of industrial (1) and advanced (2) cassava processing per kg of starchoutput; cumulated energy demand (CED) in MJ, deforestation (DEF) in 5 × 10⁻³ m2, water stress index(WSI) in 5 × 10⁻³ m3, global warming potential (GWP) in 10−1 kg CO2-eq, ozone formation potential(OFP) in 10−3 kg NMVOC-eq, acidification potential (AP) in 10−3 mol H+, human toxicity potential(HTP) in 10−2 kg 1,4-DB-eq, and ecotoxicity potential (ETP) in 5 × 10⁻² kg 1,4-DB-eq.
In the advanced scenario, the total impacts of CED, DEF, GWP, OFP and WSI are 4.71 MJ/FU,0.01 m2/FU, 2.6 kg CO2-eq./FU, 0.01 kg NMVOC-eq./FU and 0.01 m3/FU, respectively. The resultsindicate that the environmental impacts of cassava crisps can be reduced by the utilization of residuesfor biogas production. CED, GWP, OFP and WSI can be reduced by more than 10% with −74%, −27%,−14% and −12%, respectively. The credit for the substitution of conventional electricity and heat isthe reason for these reductions of environmental impacts. The main contribution to the credit comesfrom electricity with 77% and 82% for CED and GWP, respectively. This is mainly due to the fact, thatelectricity production from hard coal has a share of 39% in the Malaysian electricity mix, while onlyLPG is substituted for heat.
Figure 4 shows that most LCIA categories of the industrial production are dominated by theagricultural cultivation stage (72–100%). The exception is WSI, for which contributions of cultivation(27%), cassava root peeling (54%) and starch production (20%) are relevant. These results are differentfor the advanced production system. Here, CED, OFP, AP and ETP are also mostly driven by cultivationwith 66%, 62%, 81% and 100%, respectively. On the contrary, for DEF, GWP, and HTP, crisp productionhas the biggest contribution to overall impacts with 98%, 65% and 94%, respectively. Especially forDEF, this result was unexpected as one would assume the cassava cultivation should be most relevanthere. For all three impact categories, the high contribution to this impact is caused by a backgroundprocess used in the processing, namely palm oil for frying. For DEF and GWP, deforestation andthe related GHG emissions are responsible for this. In the case of HTP, it is pesticide application inpalm oil production. Consequently, here, a processed agricultural product from the upstream chainhas a significant influence on the overall impacts. This is linked to the fact that it was assumed thatnon-certified palm oil is used. When comparing the absolute values, it is noticeable that the advancedscenario leads to higher overall environmental impacts than the industrial scenario. This is mainlydue to the high energy demand and the use of palm oil for deep-frying the crisps, which are also themain drivers of environmental impacts in the advanced scenario. The latter finding is in line with theenvironmental hotspots of French fries described by Mouron et al. [17] as well as the results for friedinsects and soy meal-based meat substitutes, as reported by Smetana et al. [37].
Appl. Sci. 2020, 10, 2975 10 of 12
Appl. Sci. 2020, 10, x FOR PEER REVIEW 10 of 12
upstream chain has a significant influence on the overall impacts. This is linked to the fact that it was assumed that non-certified palm oil is used. When comparing the absolute values, it is noticeable that the advanced scenario leads to higher overall environmental impacts than the industrial scenario. This is mainly due to the high energy demand and the use of palm oil for deep-frying the crisps, which are also the main drivers of environmental impacts in the advanced scenario. The latter finding is in line with the environmental hotspots of French fries described by Mouron et al. [17] as well as the results for fried insects and soy meal-based meat substitutes, as reported by Smetana et al. [37].
With regard to the entire process chain, the results show that primary agricultural production has a significant influence on the overall environmental impact of cassava starch in most impact categories. This is in line with the findings of other studies that only considered the GWP [11]. The total impacts of GWP found in this study are higher but in the same order of magnitude compared to another study that focused on the carbon footprint of starch production from cassava, while savings due to biogas production are similar [12].
Figure 4. Relative contribution to environmental impacts of the various processing steps in industrial (1) and advanced (2) cassava processing; cumulated energy demand (CED), deforestation (DEF), water stress index (WSI), global warming potential (GWP), ozone formation potential (OFP), acidification potential (AP), human toxicity potential (HTP) and ecotoxicity potential (ETP).
4. Conclusions
This study delivered full life cycle assessment (LCA) results from the production of cassava starch and cassava crisps, including the primary production of cassava roots. The results show that primary agricultural production has a significant influence on the overall environmental impact of cassava starch in most impact categories. Furthermore, the analysis showed that differences in the environmental impacts per kg of cassava root of traditional and modern cassava production are mainly due to different yields in both systems as well as the different levels of mechanization. The results indicate that the environmental impacts of cassava-based products can be reduced considerably with the utilization of processing residues for anaerobic digestion if the resulting biogas is used for the production of electricity and process heat. The relative contributions of these environmental advantages differ between the two production systems analyzed and vary between impact categories. In contrast, the global warming potential (GWP) of cassava crisp production is dominated by processing. This results in different hotspots for these two production systems and thus in different approaches to reduce environmental impacts. In the case of cassava starch production, it is advisable to optimize agricultural cultivation processes. In the case of cassava crisp production, it is mainly the palm oil for deep-frying that significantly contributes to environmental
0%
10%
20%
30%
40%
50%
60%
70%
80%
90%
100%
1 2 1 2 1 2 1 2 1 2 1 2 1 2 1 2
CED DEF WSI GWP OFP AP HTP ETP
Starch
Crisps
Peeling
Cultivation
Figure 4. Relative contribution to environmental impacts of the various processing steps in industrial(1) and advanced (2) cassava processing; cumulated energy demand (CED), deforestation (DEF), waterstress index (WSI), global warming potential (GWP), ozone formation potential (OFP), acidificationpotential (AP), human toxicity potential (HTP) and ecotoxicity potential (ETP).
With regard to the entire process chain, the results show that primary agricultural production hasa significant influence on the overall environmental impact of cassava starch in most impact categories.This is in line with the findings of other studies that only considered the GWP [11]. The total impactsof GWP found in this study are higher but in the same order of magnitude compared to another studythat focused on the carbon footprint of starch production from cassava, while savings due to biogasproduction are similar [12].
4. Conclusions
This study delivered full life cycle assessment (LCA) results from the production of cassavastarch and cassava crisps, including the primary production of cassava roots. The results show thatprimary agricultural production has a significant influence on the overall environmental impact ofcassava starch in most impact categories. Furthermore, the analysis showed that differences in theenvironmental impacts per kg of cassava root of traditional and modern cassava production are mainlydue to different yields in both systems as well as the different levels of mechanization. The resultsindicate that the environmental impacts of cassava-based products can be reduced considerably withthe utilization of processing residues for anaerobic digestion if the resulting biogas is used for theproduction of electricity and process heat. The relative contributions of these environmental advantagesdiffer between the two production systems analyzed and vary between impact categories. In contrast,the global warming potential (GWP) of cassava crisp production is dominated by processing. Thisresults in different hotspots for these two production systems and thus in different approaches toreduce environmental impacts. In the case of cassava starch production, it is advisable to optimizeagricultural cultivation processes. In the case of cassava crisp production, it is mainly the palm oil fordeep-frying that significantly contributes to environmental impacts that possibly could be reduced bypurchasing certified palm oil. This would have to be verified by further research.
Author Contributions: Conceptualization, J.L., S.A. and S.L.; methodology, J.L.; software, J.L.; validation, J.L.and S.A.; formal analysis, J.L.; investigation, S.A.; resources, S.A.; data curation, J.L; writing—original draftpreparation, J.L.; writing—review and editing, S.A., S.L. and J.M.; visualization, J.L., supervision, J.M and S.L.;project administration, S.L. and J.M.; funding acquisition, S.L. and J.M. All authors have read and agreed to thepublished version of the manuscript.
Appl. Sci. 2020, 10, 2975 11 of 12
Funding: This research was funded by German Federal Ministry of Education and Research (BMBF) under ProjectNo. 031B0217 “CassavaUpgrade”.
Conflicts of Interest: The authors declare no conflict of interest.
References
1. FAO. FAOSTAT Database; Food and Agriculture Organization of the United Nations: Rome, Italy, 2019.2. Latif, S.; Müller, J. Cassava—How to explore the "all-sufficient". Rural 21 2014, 3, 2.3. Latif, S.; Müller, J. Potential of cassava leaves in human nutrition: A review. Trends Food Sci. Technol. 2015, 44,
147–158. [CrossRef]4. Vetter, J. Plant cyanogenic glycosides. Toxicon 2000, 38, 11–36. [CrossRef]5. Corona, A.; Ambye-Jensen, M.; Vega, G.C.; Hauschild, M.Z.; Birkved, M. Techno-environmental assessment
of the green biorefinery concept: Combining process simulation and life cycle assessment at an early designstage. Sci. Total Environ. 2018, 635, 100–111. [CrossRef] [PubMed]
6. Abdeshahian, P.; Lim, J.S.; Ho, W.S.; Hashim, H.; Lee, C.T. Potential of biogas production from farm animalwaste in Malaysia. Renew. Sustain. Energy Rev. 2016, 60, 714–723. [CrossRef]
7. Abdullah, W.S.W.; Osman, M.; Kadir MZ, A.A.; Verayiah, R. The Potential and Status of Renewable EnergyDevelopment in Malaysia. Energies 2019, 12, 2437. [CrossRef]
8. Lian, T.S.; Idris, K. Present situation and future potential of cassava in Malaysia. In Proceedings of the SixthRegional Workshop, Ho Chi Minh City, Vietnam, 21–25 February 2000.
9. Tran, T.; Da, G.; Alonso, M.; Moreno-Santander, Adolfo, G.; Vélez-Hernández; Giraldo-Toro, A.;Piyachomkwan, K.; Sriroth, K.; Dufour, D. A comparison of energy use, water use and carbon footprint ofcassava starch production in Thailand, Vietnam and Colombia. Resour. Conserv. Recycl. 2015, 100, 31–40.[CrossRef]
10. Torquati, B.; Venanzi, S.; Ciani, A.; Diotallevi, F.; Tamburi, V.; Asdrubali, F. Environmental sustainability andeconomic benefits of dairy farm biogas energy production: A case study in Umbria. Sustainability 2014, 6,6696–6713. [CrossRef]
11. Usubharatana, P.; Phungrassami, H. Carbon footprint of cassava starch production in North-Eastern Thailand.Proced. CIRP 2015, 29, 462–467. [CrossRef]
12. Hansupalak, N.; Piromkraipak, P.; Tamthirat, P.; Manitsorasak, A.; Sriroth, K.; Tran, T. Biogas reduces thecarbon footprint of cassava starch: A comparative assessment with fuel oil. J. Clean. Prod. 2016, 134, 539–546.[CrossRef]
13. Olaniran, J.; Jekayinfa, S.; Agbarha, H. Life cycle assessment of cassava flour production: A case study inSouthwest Nigeria. J. Eng. Technol. Res. 2017, 9, 6–13. [CrossRef]
14. United Nations (UN). Sustainable Development Goals; Sustainable Development Goals: New York, NY,USA,2015.
15. Sala, S.; Castellani, V. The consumer footprint: Monitoring sustainable development goal 12 withprocess-based life cycle assessment. J. Clean. Prod. 2019, 240, 118050. [CrossRef] [PubMed]
16. Chavalparit, O.; Ongwandee, M. Clean technology for the tapioca starch industry in Thailand. J. Clean. Prod.2009, 17, 105–110. [CrossRef]
17. Mouron, P.; Willersinn, C.; Möbius, S.; Lansche, J. Environmental profile of the swiss supply chain for Frenchfries: Effects of food loss reduction, loss treatments and process modifications. Sustainability 2016, 8, 1214.[CrossRef]
18. Vitrac, O.; Dominique, D.; Trystram, G.; Raoult-Wack, A.-L. Deep-fat frying of cassava: Influence of rawmaterial properties on chip quality. J. Sci. Food Agric. 2001, 81, 227–236. [CrossRef]
19. Phairuang, W.; Hata, M.; Furuuchi, M. Influence of agricultural activities, forest fires and agro-industries onair quality in Thailand. J. Environ. Sci. 2017, 52, 85–97. [CrossRef] [PubMed]
20. Standard, V. VDI 4630 Fermentation of Organic Materials. Characterization of the Substrate, Sampling, Collection ofMaterial Data, Fermentation Tests; Verlag des Vereins Deutscher Ingenieure: Düsseldorf, Germany, 2006; p. 92.
21. Grünwasser, S. Determination of the influence of hydrocyanic acid glycosides on the biogas yield potentialof cassava leaves (in German). In Institut für Agrartechnik; Universität Hohenheim: Stuttgart, Germany, 2017.
22. Awiszus, S. Methane Production Potential of Cassava Bagasse; Universität Hohenheim: Stuttgart, Germany, 2019.
Appl. Sci. 2020, 10, 2975 12 of 12
23. ISO. ISO 14044—Environmental Management—Life Cycle Assessment—Requirements and Guidelines; ISO: Geneva,Switzerland, 2006.
24. ISO. ISO 14040—Environmental Management—Life Cycle Assessment—Principles and Framework; ISO: Geneva,Switzerland, 2006.
25. Ecoinvent Centre. Ecoinvent Data—The Life Cycle Inventory Data V3.3; Swiss Centre for Life Cycle Inventories:Dübendorf, Switzerland, 2016.
26. Gaillard, G.; Nemecek, T. Swiss Agricultural Life Cycle Assessment (SALCA): An integrated environmentalassessment concept for agriculture. In Proceedings of the Integrated Assessment of Agriculture andSustainable Development, Setting the Agenda for Science and Policy, Egmond aan Zee, The Netherlands,10–12 March 2009; AgSAP Office, Wageningen University: Egmond aan Zee, The Netherlands, 2009.
27. Nemecek, T.; Bengoa, X.; Lansche, J.; Mouron, P.; Riedener, E.; Rossi, V.; Humbert, S. Methodological Guidelinesfor the Life Cycle Inventory of Agricultural Products. Version 3.0, July 2015; World Food LCA Database (WFLDB);Quantis and Agroscope: Lausanne, Switzerland, 2015; p. 84.
28. Hanif, M.; Mahlia, T.M.I.; Aditiya, H.B.; Bakar, M.S.A. Energy and environmental assessments of bioethanolproduction from Sri Kanji 1 cassava in Malaysia. Biofuel Res. J. 2017, 4, 537–544. [CrossRef]
29. EEA. EMEP/EEA air pollutant emission inventory guidebook 2013—Technical guidance to prepare nationalemission inventories. In EEA Technical Report No 12/2013; European Environment Agency: Luxembourg, 2013.
30. IPCC. 2006 IPCC Guidelines for National Greenhouse Gas Inventories. Volume 4: Agriculture, Forestry and OtherLand Use; Eggleston, S., Buendia, L., Miwa, K., Ngara, T., Tanabe, K., Eds.; IGES: Kanagawa, Japan, 2006.
31. Faist Emmenegger, M.; Reinhard, J.; Zah, R. Sustainability Quick Check for Biofuels—Intermediate BackgroundReport; EMPA: Dübendorf, Switzerland, 2009; p. 129.
32. Prasuhn, V. Erfassung der PO4-Austräge für die Ökobilanzierung—SALCA-Phosphor; Agroscope FAL Reckenholz:Zürich, Switzerland, 2006; p. 22.
33. Freiermuth, R. Modell zur Berechnung der Schwermetallflüsse in der Landwirtschaftlichen Ökobilanz; AgroscopeFAL Reckenholz: Zürich, Switzerland, 2006; p. 42.
34. Rosenbaum, R.K.; Anton, A.; Bengoa, X.; Bjørn, A.; Brain, R.; Bulle, C.; Cosme, N.; Dijkman, T.J.; Fantke, P.;Felix, M.; et al. The Glasgow consensus on the delineation between pesticide emission inventory and impactassessment for LCA. Int. J. Life Cycle Assess. 2015, 20, 765–776. [CrossRef]
35. Bystricky, M.; Nemecek, T. SALCA-Emissionsmodelle: Anwendung in Österreich; Abschlusstagung des ProjektesFarmLife; Höhere Bundeslehr-und Forschungsanstalt Raumberg-Gumpenstein: Irdning, Austria, 2015;pp. 23–32.
36. Bystricky, M.; Alig Ceesay, M.; Nemecek, T.; Gaillard, G. Ökobilanz ausgewählter SchweizerLandwirtschaftsprodukte im Vergleich zum Import. Agroscope Sci. 2014, 2, 1–177.
37. Smetana, S.; Mathys, A.; Knoch, A.; Heinz, V. Meat alternatives: Life cycle assessment of most known meatsubstitutes. Int. J. Life Cycle Assess 2015, 20, 1254–1267. [CrossRef]
© 2020 by the authors. Licensee MDPI, Basel, Switzerland. This article is an open accessarticle distributed under the terms and conditions of the Creative Commons Attribution(CC BY) license (http://creativecommons.org/licenses/by/4.0/).