Embed Size (px)
Citation preview
QuarterlyStatistical
Digest
Volume 20, No. 2May 2011
The Statistical Digest is a quarterly publication of the Central Bank of The Bahamas, prepared by the Research Department for issue in February, May, August and November. The first issue, Volume I, No. 3 (August, 1992), replaced the former Quarterly Review which was last published for March 1992. All correspondence pertaining to the Digest should be addressed to:
The Manager Research Department
The Central Bank of The Bahamas P. O .Box N-4868 Nassau, Bahamas
email address: [email protected]
website address: www.centralbankbahams.com
GENERAL NOTES
The following symbols and conventions are used: 1. n.a. Not Available 2. p Provisional Data 3. -- Nil 4. B$ Bahamian Dollars 5. F/C Foreign Currency 6. * See notes to tables 7. YTD Year to date 8. . . . Not Specified 9. R Revised Data Users should note that: a. Data in tables are subject to periodic revisions as more updated information becomes available. b. Due to rounding, the sum of separate items may differ from the totals shown.
Acknowledgement
The Central Bank of The Bahamas wishes to express its appreciation for the assistance received from the Ministry of Finance, the Ministry of Agriculture, the Ministry of Tourism, Commercial Banks, Other Local Financial Institutions, the Public Corporations, the Department of Statistics, and other government and private sector agencies in the compilation of the data.
(iii)
CONTENTS
Page No.
GENERAL NOTES
SECTION 1 MONETARY AUTHORITY
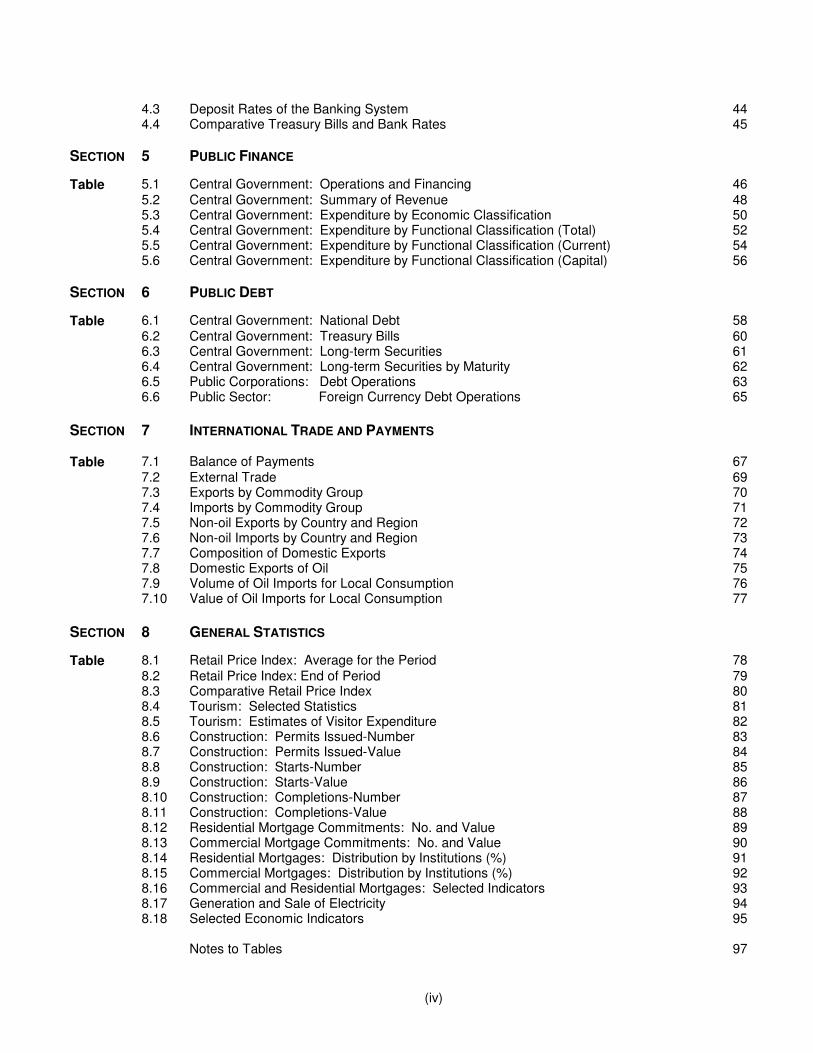
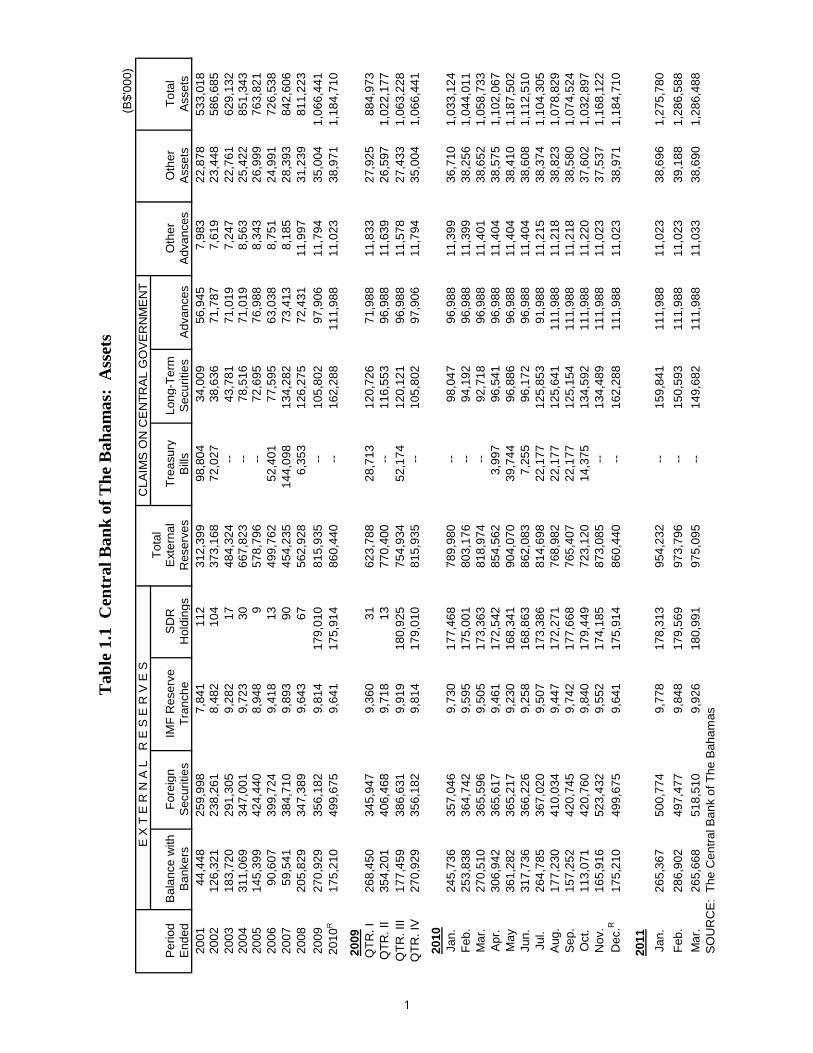
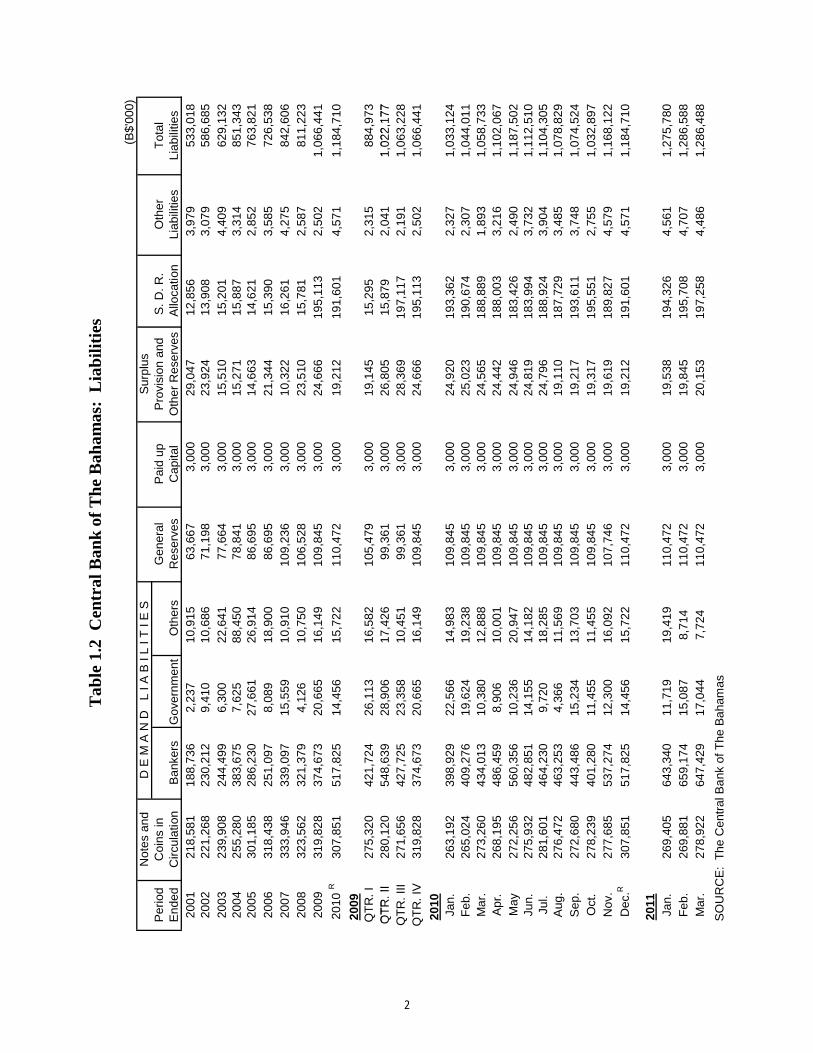
Table 1.1 Central Bank of The Bahamas: Assets 1 1.2 Central Bank of The Bahamas: Liabilities 2 1.3 Factors Affecting External Reserves 3 1.4 Central Bank of The Bahamas: Notes in Circulation 4 1.5 Central Bank of The Bahamas: Coins in Circulation 5
SECTION 2 BANKING SYSTEM
Table 2.1 Financial Survey 6 2.2 Monetary Survey 7 2.3 Money Supply 8 2.4 Factors Affecting Money Supply 9 2.5 Summary of Domestic Assets of the Banking System 10 2.6 Summary of Domestic Liabilities of the Banking System 11 2.7 Summary of Foreign Assets of the Banking System 12 2.8 Summary of Foreign Liabilities of the Banking System 13 2.9 Banking System: Total Deposits by Depositors (All Currencies) 14 2.10 Banking System: Total Deposits by Depositors (Bahamian Dollars) 15 2.11 Banking System: Demand Deposits by Depositors (All currencies) 16 2.12 Banking System: Savings Deposits by Depositors (All currencies) 17 2.13 Banking System: Fixed Deposits by Depositors (All currencies) 18 2.14 Banking System: Fixed Deposits by Maturity 19 2.15 Banking System: Overdrafts and Loans by Maturity 20 2.16 Banking System: Sectoral Distribution of Credit (All Currencies) 21 2.17 Banking System: Sectoral Distribution of Credit (Bahamian Dollars) 23 2.18 Banking System: Sectoral Distribution of Credit (Foreign Currency) 25 2.19 Summary of Bank Consumer Credit 27 2.20 Banking System: Consumer Credit - Debt Outstanding 28 2.21 Banking System: Consumer Credit – Repayments 29 2.22 Banking System: Consumer Credit – New Credit 30 2.23 Summary of Liquidity in the Banking System 31 2.24 Profit and Loss Accounts of Banks in The Bahamas 32 2.25 Banking System: Foreign Exchange Transactions 33 2.26 Banking System: Clearing 34 2.27 Real Time Gross Settlement Transactions 35 2.28 Banks and Trust Companies Licensed in The Bahamas 36
CHART 2.1 Banks and Trust Companies Licensed in The Bahamas 37
SECTION 3 OTHER FINANCIAL SECTOR STATISTICS
Table 3.1 Bahamas Development Bank: Assets 38 3.2 Bahamas Development Bank: Liabilities 39 3.3 Bahamas Development Bank: Sectoral Distribution of Credit 40 3.4 Post Office Savings Bank: Assets and Liabilities 41
SECTION 4 INTEREST RATE DEVELOPMENTS
Table 4.1 Selected Interest Rates 42
4.2 Loan Rates of the Banking System 43
(iv)
4.3 Deposit Rates of the Banking System 44 4.4 Comparative Treasury Bills and Bank Rates 45
SECTION 5 PUBLIC FINANCE
Table 5.1 Central Government: Operations and Financing 46 5.2 Central Government: Summary of Revenue 48 5.3 Central Government: Expenditure by Economic Classification 50 5.4 Central Government: Expenditure by Functional Classification (Total) 52 5.5 Central Government: Expenditure by Functional Classification (Current) 54 5.6 Central Government: Expenditure by Functional Classification (Capital) 56
SECTION 6 PUBLIC DEBT
Table 6.1 Central Government: National Debt 58 6.2 Central Government: Treasury Bills 60 6.3 Central Government: Long-term Securities 61 6.4 Central Government: Long-term Securities by Maturity 62 6.5 Public Corporations: Debt Operations 63 6.6 Public Sector: Foreign Currency Debt Operations 65
SECTION 7 INTERNATIONAL TRADE AND PAYMENTS
Table 7.1 Balance of Payments 67 7.2 External Trade 69 7.3 Exports by Commodity Group 70 7.4 Imports by Commodity Group 71 7.5 Non-oil Exports by Country and Region 72 7.6 Non-oil Imports by Country and Region 73 7.7 Composition of Domestic Exports 74 7.8 Domestic Exports of Oil 75 7.9 Volume of Oil Imports for Local Consumption 76 7.10 Value of Oil Imports for Local Consumption 77
SECTION 8 GENERAL STATISTICS
Table 8.1 Retail Price Index: Average for the Period 78 8.2 Retail Price Index: End of Period 79 8.3 Comparative Retail Price Index 80 8.4 Tourism: Selected Statistics 81 8.5 Tourism: Estimates of Visitor Expenditure 82 8.6 Construction: Permits Issued-Number 83 8.7 Construction: Permits Issued-Value 84 8.8 Construction: Starts-Number 85 8.9 Construction: Starts-Value 86 8.10 Construction: Completions-Number 87 8.11 Construction: Completions-Value 88 8.12 Residential Mortgage Commitments: No. and Value 89 8.13 Commercial Mortgage Commitments: No. and Value 90 8.14 Residential Mortgages: Distribution by Institutions (%) 91 8.15 Commercial Mortgages: Distribution by Institutions (%) 92 8.16 Commercial and Residential Mortgages: Selected Indicators 93 8.17 Generation and Sale of Electricity 94 8.18 Selected Economic Indicators 95 Notes to Tables 97
(B$'
000)
E X
T E
R N
A L
R
E S
E R
V E
SC
LAIM
S O
N C
EN
TR
AL
GO
VE
RN
ME
NT
Tot
alP
erio
dB
alan
ce w
ithF
orei
gnIM
F R
eser
veS
DR
Ext
erna
lT
reas
ury
Long
-Ter
mO
ther
Oth
erT
otal
End
edB
anke
rsS
ecur
itie
sT
ranc
heH
oldi
ngs
Res
erve
sB
ills
Sec
uriti
es
Adv
ance
sA
dvan
ces
Ass
ets
Ass
ets
2001
44,4
4825
9,99
87,
841
112
312,
399
98,8
0434
,009
56,9
457,
983
22,8
7853
3,01
820
0212
6,32
123
8,26
18,
482
104
373,
168
72,0
2738
,636
71,7
877,
619
23,4
4858
6,68
520
0318
3,72
029
1,30
59,
282
1748
4,32
4
--
43,7
8171
,019
7,24
722
,761
629,
132
2004
311,
069
347,
001
9,72
330
667,
823
--78
,516
71,0
198,
563
25,4
2285
1,34
320
0514
5,39
942
4,44
08,
948
957
8,79
6
--
72,6
9576
,988
8,34
326
,999
763,
821
2006
90,6
0739
9,72
49,
418
1349
9,76
252
,401
77,5
9563
,038
8,75
124
,991
726,
538
2007
59,5
4138
4,71
09,
893
9045
4,23
514
4,09
813
4,28
273
,413
8,18
528
,393
842,
606
2008
205,
829
347,
389
9,64
367
562,
928
6,35
312
6,27
572
,431
11,9
9731
,239
811,
223
2009
270,
929
356,
182
9,81
417
9,01
081
5,93
5
--
105,
802
97,9
0611
,794
35,0
041,
066,
441
201
0R
175,
210
499,
675
9,64
117
5,91
486
0,44
0
--
162,
288
111,
988
11,0
2338
,971
1,18
4,71
0
2009
QT
R. I
268,
450
345,
947
9,36
031
623,
788
28,7
1312
0,72
671
,988
11,8
3327
,925
884,
973
QT
R. I
I35
4,20
140
6,46
89,
718
1377
0,40
0
--
116,
553
96,9
8811
,639
26,5
971,
022,
177
Tab
le 1
.1 C
entr
al B
ank
of T
he
Bah
amas
: A
sset
s
QT
R. I
I35
4,20
140
6,46
89,
718
1377
0,40
0
--
116,
553
96,9
8811
,639
26,5
971,
022,
177
QT
R. I
II17
7,45
938
6,63
19,
919
180,
925
754,
934
52,1
7412
0,12
196
,988
11,5
7827
,433
1,06
3,22
8Q
TR
. IV
270,
929
356,
182
9,81
417
9,01
081
5,93
5
--
105,
802
97,9
0611
,794
35,0
041,
066,
441
2010
Jan.
245,
736
357,
046
9,73
017
7,46
878
9,98
0
--
98,0
4796
,988
11,3
9936
,710
1,03
3,12
4F
eb.
253,
838
364,
742
9,59
517
5,00
180
3,17
6
--
94,1
9296
,988
11,3
9938
,256
1,04
4,01
1M
ar.
270,
510
365,
596
9,50
517
3,36
381
8,97
4
--
92,7
1896
,988
11,4
0138
,652
1,05
8,73
3A
pr.
306,
942
365,
617
9,46
117
2,54
285
4,56
23,
997
96,5
4196
,988
11,4
0438
,575
1,10
2,06
7 M
ay
361,
282
365,
217
9,23
016
8,34
190
4,07
039
,744
96,8
8696
,988
11,4
0438
,410
1,18
7,50
2 J
un.
317,
736
366,
226
9,25
816
8,86
386
2,08
37,
255
96,1
7296
,988
11,4
0438
,608
1,11
2,51
0Ju
l.26
4,78
536
7,02
09,
507
173,
386
814,
698
22,1
7712
5,85
391
,988
11,2
1538
,374
1,10
4,30
5A
ug.
177,
230
410,
034
9,44
717
2,27
176
8,98
222
,177
125,
641
111,
988
11,2
1838
,823
1,07
8,82
9S
ep.
157,
252
420,
745
9,74
217
7,66
876
5,40
722
,177
125,
154
111,
988
11,2
1838
,580
1,07
4,52
4O
ct.
113,
071
420,
760
9,84
017
9,44
972
3,12
014
,375
134,
592
111,
988
11,2
2037
,602
1,03
2,89
7N
ov.
165,
916
523,
432
9,55
217
4,18
587
3,08
5
--
134,
489
111,
988
11,0
2337
,537
1,16
8,12
2 D
ec.R
175,
210
499,
675
9,64
117
5,91
486
0,44
0
--
162,
288
111,
988
11,0
2338
,971
1,18
4,71
0
2011
Jan.
265,
367
500,
774
9,77
817
8,31
395
4,23
2
--
159,
841
111,
988
11,0
2338
,696
1,27
5,78
0
Feb
.28
6,90
249
7,47
79,
848
179,
569
973,
796
--15
0,59
311
1,98
811
,023
39,1
881,
286,
588
Mar
.26
5,66
851
8,51
09,
926
180,
991
975,
095
--14
9,68
211
1,98
811
,033
38,6
901,
286,
488
S
OU
RC
E:
The
Cen
tral
Ban
k of
The
Bah
amas
1
(B$'
000)
Not
es a
ndD
E M
A N
D
L I A
B I
L I T
I E
SS
urpl
usP
erio
dC
oins
inG
ener
alP
aid
upP
rovi
sion
and
S. D
. R.
Oth
erT
otal
End
edC
ircul
atio
nB
anke
rsG
over
nmen
tO
ther
sR
eser
ves
Cap
ital
Oth
er R
eser
ves
Allo
catio
nLi
abili
ties
Liab
ilitie
s20
0121
8,58
118
8,73
62,
237
10,9
1563
,667
3,00
029
,047
12,8
563,
979
533,
018
2002
221,
268
230,
212
9,41
010
,686
71,1
983,
000
23,9
2413
,908
3,07
958
6,68
520
0323
9,90
824
4,49
96,
300
22,6
4177
,664
3,00
015
,510
15,2
014,
409
629,
132
2004
255,
280
383,
675
7,62
588
,450
78,8
413,
000
15,2
7115
,887
3,31
485
1,34
320
0530
1,18
528
6,23
027
,661
26,9
1486
,695
3,00
014
,663
14,6
212,
852
763,
821
2006
318,
438
251,
097
8,08
918
,900
86,6
953,
000
21,3
4415
,390
3,58
572
6,53
820
0733
3,94
633
9,09
715
,559
10,9
1010
9,23
63,
000
10,3
2216
,261
4,27
584
2,60
620
0832
3,56
232
1,37
94,
126
10,7
5010
6,52
83,
000
23,5
1015
,781
2,58
781
1,22
320
0931
9,82
837
4,67
320
,665
16,1
4910
9,84
53,
000
24,6
6619
5,11
32,
502
1,06
6,44
1
201
0 R
307,
851
517,
825
14,4
5615
,722
110,
472
3,00
019
,212
191,
601
4,57
11,
184,
710
2009
QT
R. I
275,
320
421,
724
26,1
1316
,582
105,
479
3,00
019
,145
15,2
952,
315
884,
973
QT
R. I
I28
0,12
054
8,63
928
,906
17,4
2699
,361
3,00
026
,805
15,8
792,
041
1,02
2,17
7
Tab
le 1
.2 C
entr
al B
ank
of T
he
Bah
amas
: L
iab
ilit
ies
QT
R. I
I28
0,12
054
8,63
928
,906
17,4
2699
,361
3,00
026
,805
15,8
792,
041
1,02
2,17
7Q
TR
. III
271,
656
427,
725
23,3
5810
,451
99,3
613,
000
28,3
6919
7,11
72,
191
1,06
3,22
8Q
TR
. IV
319,
828
374,
673
20,6
6516
,149
109,
845
3,00
024
,666
195,
113
2,50
21,
066,
441
2010
Jan.
263,
192
398,
929
22,5
6614
,983
109,
845
3,00
024
,920
193,
362
2,32
71,
033,
124
Feb
.26
5,02
440
9,27
619
,624
19,2
3810
9,84
53,
000
25,0
2319
0,67
42,
307
1,04
4,01
1M
ar.
273,
260
434,
013
10,3
8012
,888
109,
845
3,00
024
,565
188,
889
1,89
31,
058,
733
Apr
. 26
8,19
548
6,45
98,
906
10,0
0110
9,84
53,
000
24,4
4218
8,00
33,
216
1,10
2,06
7 M
ay
272,
256
560,
356
10,2
3620
,947
109,
845
3,00
024
,946
183,
426
2,49
01,
187,
502
Jun.
275,
932
482,
851
14,1
5514
,182
109,
845
3,00
024
,819
183,
994
3,73
21,
112,
510
Jul.
281,
601
464,
230
9,72
018
,285
109,
845
3,00
024
,796
188,
924
3,90
41,
104,
305
Aug
.27
6,47
246
3,25
34,
366
11,5
6910
9,84
53,
000
19,1
1018
7,72
93,
485
1,07
8,82
9S
ep.
272,
680
443,
486
15,2
3413
,703
109,
845
3,00
019
,217
193,
611
3,74
81,
074,
524
Oct
.27
8,23
940
1,28
011
,455
11,4
5510
9,84
53,
000
19,3
1719
5,55
12,
755
1,03
2,89
7N
ov.
277,
685
537,
274
12,3
0016
,092
107,
746
3,00
019
,619
189,
827
4,57
91,
168,
122
Dec
.R30
7,85
151
7,82
514
,456
15,7
2211
0,47
23,
000
19,2
1219
1,60
14,
571
1,18
4,71
0
2011
Jan.
269,
405
643,
340
11,7
1919
,419
110,
472
3,00
019
,538
194,
326
4,56
11,
275,
780
Feb
.26
9,88
165
9,17
415
,087
8,71
411
0,47
23,
000
19,8
4519
5,70
84,
707
1,28
6,58
8M
ar.
278,
922
647,
429
17,0
447,
724
110,
472
3,00
020
,153
197,
258
4,48
61,
286,
488
SO
UR
CE
: T
he C
entr
al B
ank
of T
he B
aham
as
2
(B$'
000)
FO
RE
IGN
CU
RR
EN
CY
SA
LES
TO
:F
OR
EIG
N C
UR
RE
NC
Y P
UR
CH
AS
ES
FR
OM
:C
hang
es in
Cha
nges
inIn
crea
se/
Res
erve
s at
Res
erve
S
.D.R
.O
ther
(Dec
reas
e)R
eser
ves
Beg
inni
ngC
omm
erci
alG
over
n-O
ther
Tot
alC
omm
erci
alG
over
n-O
ther
Tot
alT
ranc
heH
oldi
ngs
Inco
me
Dur
ing
at E
nd o
fP
erio
dof
Per
iod
Ban
ksm
ent
Cus
tom
ers
Sal
esB
anks
men
tC
usto
mer
sP
urch
ases
()=
decr
ease
()=
decr
ease
or (
Loss
)P
erio
dP
erio
d
2001
342,
561
275,
857
137,
568
142,
986
556,
411
396,
198
100,
985
15,6
0851
2,79
1(2
88)
(4)
13,7
50(3
0,16
2)
312,
399
2002
312,
399
254,
465
163,
372
132,
182
550,
019
317,
489
244,
766
25,0
5358
7,30
864
1
(8)
22,8
4760
,769
37
3,16
820
0337
3,16
836
9,95
824
6,80
617
0,32
578
7,08
955
7,23
031
1,21
615
,779
884,
225
800
(8
7)
13,3
0711
1,15
648
4,32
420
0448
4,32
434
0,99
612
0,11
518
1,00
264
2,11
365
3,56
913
1,06
913
,971
798,
609
441
1326
,549
183,
499
667,
823
2005
667,
823
454,
029
134,
888
256,
036
844,
953
475,
185
178,
724
35,0
5768
8,96
6(7
75)
(21)
67
,756
(89,
027)
57
8,79
620
0657
8,79
631
9,36
415
2,97
428
2,67
275
5,01
036
8,27
622
0,77
368
,723
657,
772
470
4
17,7
30(7
9,03
4)
499,
762
2007
499,
762
283,
612
189,
815
306,
637
780,
064
472,
878
219,
508
18,7
1771
1,10
343
6
77
22,9
21(4
5,52
7)
454,
235
2008
454,
235
243,
677
203,
379
481,
342
928,
398
439,
422
444,
064
133,
665
1,01
7,15
1(2
50)
(23)
20
,213
108,
693
562,
928
2009
562,
928
276,
020
448,
226
286,
931
1,01
1,17
731
5,12
673
3,20
119
,957
1,06
8,28
417
1
178,
943
16,7
8625
3,00
781
5,93
5 2
010
R81
5,93
535
2,35
321
2,71
034
2,28
890
7,35
158
9,67
632
9,23
99,
142
928,
057
(173
)
(3
,096
)
27,0
6844
,505
86
0,44
0
2009
QT
R. I
562,
928
21,3
0037
,532
82,2
0114
1,03
310
9,75
074
,672
13,6
9219
8,11
4(2
83)
(36)
4,
098
60,8
60
623,
788
Tab
le 1
.3 F
acto
rs A
ffec
tin
g E
xter
nal
Res
erve
s
QT
R. I
562,
928
21,3
0037
,532
82,2
0114
1,03
310
9,75
074
,672
13,6
9219
8,11
4(2
83)
(36)
4,
098
60,8
60
623,
788
QT
R. I
I62
3,78
830
,048
58,5
3056
,085
144,
663
90,4
3319
5,90
61,
128
287,
467
358
(1
8)
3,46
8
14
6,61
277
0,40
0Q
TR
. III
770,
400
169,
644
70,0
5263
,297
302,
993
51,8
7148
,477
2,48
610
2,83
420
1
180,
912
3,58
0
(1
5,46
6)
754,
934
QT
R. I
V75
4,93
455
,028
282,
112
85,3
4842
2,48
863
,072
414,
146
2,65
147
9,86
9(1
05)
(1,9
15)
5,
640
61,0
01
815,
935
2010
Jan.
815,
935
56,7
728,
015
39,7
5610
4,54
348
,461
22,2
214,
462
75,1
44(8
4)
(1,5
42)
5,
070
(25,
955)
78
9,98
0F
eb.
789,
980
3,86
011
,125
20,4
7535
,460
27,9
1422
,105
249
50,2
68(1
35)
(2,4
67)
99
0
13,1
96
803,
176
Mar
.80
3,17
6
-
-10
,706
29,1
3939
,845
33,6
5420
,974
1954
,647
(90)
(1
,638
)
2,72
4
15
,798
81
8,97
4A
pr.
818,
974
--
24,6
1225
,557
50,1
6971
,893
12,3
8246
284
,737
(44)
(8
21)
1,88
5
35
,588
85
4,56
2 M
ay
854,
562
5,00
026
,918
25,3
3157
,249
85,6
5117
,645
138
103,
434
(231
)
(4
,201
)
7,75
5
49
,508
90
4,07
0Ju
n.
904,
070
54,6
2621
,524
26,5
4910
2,69
929
,813
28,7
731,
083
59,6
6928
52
2
493
(4
1,98
7)
862,
083
Jul.
862,
083
42,1
5119
,519
30,4
0792
,077
13,7
1824
,828
313
38,8
5924
9
4,52
3
1,
061
(47,
385)
81
4,69
8A
ug.
814,
698
85,0
3912
,719
25,6
2112
3,37
911
,143
66,4
3518
577
,763
(60)
(1
,115
)
1,07
5
(4
5,71
6)
768,
982
Sep
.76
8,98
223
,391
14,1
4826
,299
63,8
3817
,666
35,8
1625
53,5
0729
5
5,39
7
1,
064
(3,5
75)
765,
407
Oct
.76
5,40
719
,834
23,9
5033
,866
77,6
5014
,681
17,3
0144
432
,426
98
1,78
1
1,
058
(42,
287)
72
3,12
0N
ov.
723,
120
34,9
3027
,322
31,4
9293
,744
213,
453
32,8
281,
695
247,
976
(288
)
(5
,264
)
1,28
5
14
9,96
587
3,08
5 D
ec.R
87
3,08
526
,750
12,1
5227
,796
66,6
9821
,629
27,9
3167
49,6
2789
1,
729
2,60
8
(1
2,64
5)
860,
440
2011
Jan.
860,
440
25,9
0014
,997
26,2
4467
,141
72,0
0184
,845
471
157,
317
137
2,
399
1,08
0
93
,792
95
4,23
2F
eb.
954,
232
9,50
014
,785
34,1
8058
,465
42,1
6233
,024
360
75,5
4670
1,
256
1,15
7
19
,564
97
3,79
6M
ar.
973,
796
22,4
0520
,743
29,6
5472
,802
41,7
1229
,484
254
71,4
5078
1,
422
1,15
1
1,
299
975,
095
S
OU
RC
E:
The
Cen
tral
Ba
nk o
f The
Bah
amas
3
Tab
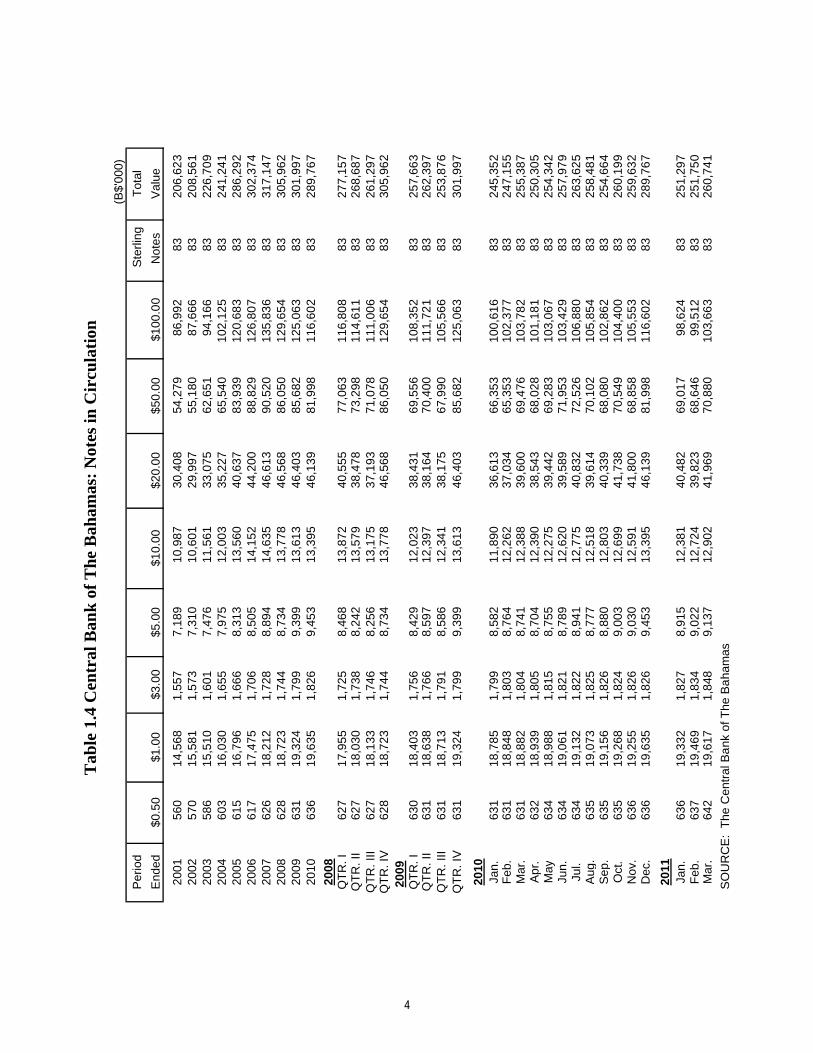
le 1
.4 C
entr
al B
ank
of
Th
e B
aham
as:
Not
es in
Cir
cula
tion
(
B$'
000)
Per
iod
Ste
rling
Tot
al
End
ed$0
.50
$1.0
0$3
.00
$5.0
0$1
0.00
$20.
00$5
0.00
$100
.00
Not
esV
alue
2001
560
14,5
681,
557
7,18
910
,987
30,4
0854
,279
86,9
9283
206,
623
2002
570
15,5
811,
573
7,31
010
,601
29,9
9755
,180
87,6
6683
208,
561
2003
586
15,5
101,
601
7,47
611
,561
33,0
7562
,651
94,1
6683
226,
709
2004
603
16,0
301,
655
7,97
512
,003
35,2
2765
,540
102,
125
8324
1,24
120
0561
516
,796
1,66
68,
313
13,5
6040
,637
83,9
3912
0,68
383
286,
292
2006
617
17,4
751,
706
8,50
514
,152
44,2
0088
,829
126,
807
8330
2,37
420
0762
618
,212
1,72
88,
894
14,6
3546
,613
90,5
2013
5,83
683
317,
147
2008
628
18,7
231,
744
8,73
413
,778
46,5
6886
,050
129,
654
8330
5,96
220
0963
119
,324
1,79
99,
399
13,6
1346
,403
85,6
8212
5,06
383
301,
997
2010
636
19,6
351,
826
9,45
313
,395
46,1
3981
,998
116,
602
8328
9,76
7
2008
QT
R. I
627
17,9
551,
725
8,46
813
,872
40,5
5577
,063
116,
808
8327
7,15
7Q
TR
. II
627
18,0
301,
738
8,24
213
,579
38,4
7873
,298
114,
611
8326
8,68
7Q
TR
. III
627
18,1
331,
746
8,25
613
,175
37,1
9371
,078
111,
006
8326
1,29
7Q
TR
. IV
628
18,7
231,
744
8,73
413
,778
46,5
6886
,050
129,
654
8330
5,96
220
09Q
TR
. I63
018
,403
1,75
68,
429
12,0
2338
,431
69,5
5610
8,35
283
257,
663
QT
R. I
I63
118
,638
1,76
68,
597
12,3
9738
,164
70,4
0011
1,72
183
262,
397
QT
R. I
II63
118
,713
1,79
18,
586
12,3
4138
,175
67,9
9010
5,56
683
253,
876
QT
R. I
V63
119
,324
1,79
99,
399
13,6
1346
,403
85,6
8212
5,06
383
301,
997
2010
Jan.
631
18,7
851,
799
8,58
211
,890
36,6
1366
,353
100,
616
8324
5,35
2F
eb.
631
18,8
481,
803
8,76
412
,262
37,0
3465
,353
102,
377
8324
7,15
5M
ar.
631
18,8
821,
804
8,74
112
,388
39,6
0069
,476
103,
782
8325
5,38
7A
pr.
632
18,9
391,
805
8,70
412
,390
38,5
4368
,028
101,
181
8325
0,30
5M
ay63
418
,988
1,81
58,
755
12,2
7539
,442
69,2
8310
3,06
783
254,
342
Jun.
634
19,0
611,
821
8,78
912
,620
39,5
8971
,953
103,
429
8325
7,97
9Ju
l.63
419
,132
1,82
28,
941
12,7
7540
,832
72,5
2610
6,88
083
263,
625
Aug
.63
519
,073
1,82
58,
777
12,5
1839
,614
70,1
0210
5,85
483
258,
481
Sep
.63
519
,156
1,82
68,
880
12,8
0340
,339
68,0
8010
2,86
283
254,
664
Oct
.63
519
,268
1,82
49,
003
12,6
9941
,738
70,5
4910
4,40
083
260,
199
Nov
.63
619
,255
1,82
69,
030
12,5
9141
,800
68,8
5810
5,55
383
259,
632
Dec
.63
619
,635
1,82
69,
453
13,3
9546
,139
81,9
9811
6,60
283
289,
767
2011
Jan.
636
19,3
321,
827
8,91
512
,381
40,4
8269
,017
98,6
2483
251,
297
Feb
.63
719
,469
1,83
49,
022
12,7
2439
,823
68,6
4699
,512
8325
1,75
0M
ar.
642
19,6
171,
848
9,13
712
,902
41,9
6970
,880
103,
663
8326
0,74
1
S
OU
RC
E:
The
Cen
tral
Ba
nk o
f The
Ba
ham
as
4
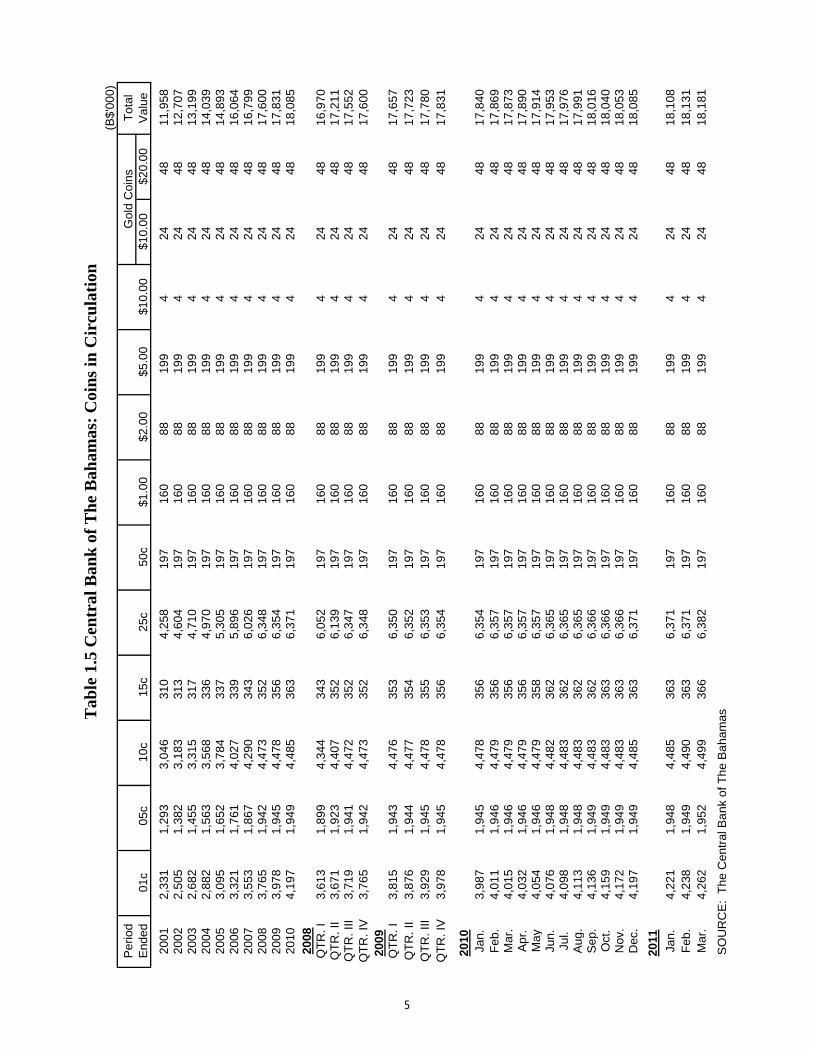
Tab
le 1
.5 C
entr
al B
ank
of
Th
e B
aham
as:
Coi
ns
in C
ircu
lati
on(B
$'00
0)
Per
iod
Gol
d C
oins
Tot
alE
nded
01c
05c
10c
15c
25c
50c
$1.0
0$2
.00
$5.0
0$1
0.00
$10.
00$2
0.00
Val
ue
2001
2,33
11,
293
3,04
631
04,
258
197
160
8819
94
2448
11,9
5820
022,
505
1,38
23,
183
313
4,60
419
716
088
199
424
4812
,707
2003
2,68
21,
455
3,31
531
74,
710
197
160
8819
94
2448
13,1
9920
042,
882
1,56
33,
568
336
4,97
019
716
088
199
424
4814
,039
2005
3,09
51,
652
3,78
433
75,
305
197
160
8819
94
2448
14,8
9320
063,
321
1,76
14,
027
339
5,89
619
716
088
199
424
4816
,064
2007
3,55
31,
867
4,29
034
36,
026
197
160
8819
94
2448
16,7
9920
083,
765
1,94
24,
473
352
6,34
819
716
088
199
424
4817
,600
2009
3,97
81,
945
4,47
835
66,
354
197
160
8819
94
2448
17,8
3120
104,
197
1,94
94,
485
363
6,37
119
716
088
199
424
4818
,085
2008
QT
R. I
3,61
31,
899
4,34
434
36,
052
197
160
8819
94
2448
16,9
70Q
TR
. II
3,67
11,
923
4,40
735
26,
139
197
160
8819
94
2448
17,2
11Q
TR
. III
3,71
91,
941
4,47
235
26,
347
197
160
8819
94
2448
17,5
52Q
TR
. IV
3,76
51,
942
4,47
335
26,
348
197
160
8819
94
2448
17,6
0020
09Q
TR
. I3,
815
1,94
34,
476
353
6,35
019
716
088
199
424
4817
,657
QT
R. I
I3,
876
1,94
44,
477
354
6,35
219
716
088
199
424
4817
,723
QT
R. I
II3,
929
1,94
54,
478
355
6,35
319
716
088
199
424
4817
,780
QT
R. I
V3,
978
1,94
54,
478
356
6,35
419
716
088
199
424
4817
,831
2010
Jan.
3,98
71,
945
4,47
835
66,
354
197
160
8819
94
2448
17,8
40F
eb.
4,01
11,
946
4,47
935
66,
357
197
160
8819
94
2448
17,8
69M
ar.
4,01
51,
946
4,47
935
66,
357
197
160
8819
94
2448
17,8
73A
pr.
4,03
21,
946
4,47
935
66,
357
197
160
8819
94
2448
17,8
90M
ay4,
054
1,94
64,
479
358
6,35
719
716
088
199
424
4817
,914
Jun.
4,07
61,
948
4,48
236
26,
365
197
160
8819
94
2448
17,9
53Ju
l.4,
098
1,94
84,
483
362
6,36
519
716
088
199
424
4817
,976
Aug
.4,
113
1,94
84,
483
362
6,36
519
716
088
199
424
4817
,991
Sep
.4,
136
1,94
94,
483
362
6,36
619
716
088
199
424
4818
,016
Oct
.4,
159
1,94
94,
483
363
6,36
619
716
088
199
424
4818
,040
Nov
.4,
172
1,94
94,
483
363
6,36
619
716
088
199
424
4818
,053
Dec
.4,
197
1,94
94,
485
363
6,37
119
716
088
199
424
4818
,085
2011
Jan.
4,22
11,
948
4,48
536
36,
371
197
160
8819
94
2448
18,1
08F
eb.
4,23
81,
949
4,49
036
36,
371
197
160
8819
94
2448
18,1
31M
ar.
4,26
21,
952
4,49
936
66,
382
197
160
8819
94
2448
18,1
81
S
OU
RC
E:
The
Cen
tral
Ba
nk o
f The
Ba
ham
as
5
(B$
Mill
ions
)
D O
M E
S T
I C
C
R E
D I
TQ
U A
S I
M
O N
E Y
DE
MA
ND
DE
PO
SIT
SN
ET
To
To
To
Cur
renc
yF
orei
gnO
TH
ER
Per
iod
FO
RE
IGN
Gov
ernm
ent
Priv
ate
Pub
licIn
Act
ive
Com
mer
cial
Dom
estic
Cen
tral
Sav
ings
Fix
edC
urre
ncy
ITE
MS
End
edA
SS
ET
S(N
et)
Sec
tor
Cor
pora
tions
T O
T A
LC
ircul
atio
nB
anks
(A
dj.)
Ban
ks (
Adj
.)B
ank
T O
T A
LD
epos
itsD
epos
itsD
epos
itsT
O T
A L
(NE
T)
2001
(234
.5)
626.
03,
902.
114
8.8
4,67
6.9
153.
561
2.9
10.3
776.
760
4.6
2,24
4.0
91.8
2,94
0.4
(725
.3)
2002
(357
.3)
651.
44,
069.
621
9.4
4,94
0.4
154.
865
2.8
10.1
817.
763
0.7
2,29
6.2
91.6
3,01
8.5
(746
.9)
2003
(143
.8)
506.
54,
094.
637
2.9
4,97
4.0
160.
172
5.6
21.7
907.
467
8.8
2,31
5.9
101.
23,
095.
9(8
26.9
)20
0410
4.3
547.
14,
339.
434
0.7
5,22
7.2
176.
687
0.1
87.7
1,13
4.4
779.
92,
410.
396
.93,
287.
1(9
10.0
)20
05(3
2.3)
642.
54,
953.
730
3.3
5,89
9.5
195.
31,
026.
226
.11,
247.
688
1.8
2,55
6.6
144.
23,
582.
6(1
,037
.0)
2006
(254
.5)
677.
05,
668.
739
7.2
6,74
2.9
202.
11,
030.
718
.31,
251.
195
3.3
2,78
1.5
159.
13,
894.
0(1
,343
.3)
2007
(213
.8)
866.
86,
218.
434
9.1
7,43
4.3
223.
71,
066.
110
.41,
300.
399
2.1
3,14
4.8
200.
14,
337.
0(1
,583
.3)
2008
(140
.9)
924.
06,
536.
844
8.3
7,90
9.1
205.
81,
058.
310
.41,
274.
51,
020.
43,
427.
720
1.4
4,64
9.5
(1,8
44.2
)20
0913
4.0
1,02
3.9
6,59
5.9
419.
98,
039.
720
7.8
1,05
9.9
15.9
1,28
3.6
995.
43,
521.
423
1.9
4,74
8.7
(2,1
41.4
) 2
010
R15
2.1
1,41
3.5
6,57
2.7
461.
88,
448.
119
4.5
1,12
5.2
15.4
1,33
5.2
1,01
5.8
3,61
5.4
224.
74,
855.
9(2
,409
.1)
2009
QT
R. I
(42.
0)1,
042.
96,
483.
840
7.1
7,93
3.8
197.
01,
123.
016
.31,
336.
31,
031.
43,
451.
820
9.1
4,69
2.3
(1,8
63.2
)Q
TR
. II
(58.
1)1,
041.
86,
516.
840
5.6
7,96
4.2
194.
31,
073.
717
.21,
285.
21,
040.
53,
480.
521
3.7
4,73
4.7
(1,8
86.2
)Q
TR
. III
(41.
9)1,
205.
26,
557.
741
1.5
8,17
4.4
184.
21,
083.
410
.21,
277.
81,
007.
13,
506.
724
4.6
4,75
8.4
(2,0
96.3
)Q
TR
. IV
134.
01,
023.
96,
595.
941
9.9
8,03
9.7
207.
81,
059.
915
.91,
283.
699
5.4
3,52
1.4
231.
94,
748.
7(2
,141
.4)
2010
Jan.
116.
41,
051.
86,
624.
142
5.9
8,10
1.8
191.
41,
093.
514
.71,
299.
61,
004.
93,
530.
323
7.7
4,77
2.9
(2,1
45.7
)F
eb.
130.
81,
088.
66,
586.
842
0.8
8,09
6.2
191.
71,
049.
819
.01,
260.
51,
011.
83,
595.
922
3.0
4,83
0.7
(2,1
35.8
)M
ar.
178.
81,
131.
36,
548.
743
8.4
8,11
8.4
186.
91,
075.
312
.61,
274.
81,
004.
63,
610.
623
7.4
4,85
2.6
(2,1
69.8
)A
pr.
178.
41,
169.
96,
552.
743
9.9
8,16
2.5
194.
01,
083.
39.
71,
287.
01,
009.
83,
613.
523
4.5
4,85
7.8
(2,1
96.1
)M
ay28
4.8
1,20
9.6
6,51
2.8
437.
48,
159.
819
3.9
1,14
2.4
20.7
1,35
7.0
1,00
8.9
3,63
2.5
234.
64,
876.
0(2
,211
.7)
Jun.
250.
01,
257.
16,
526.
443
9.6
8,22
3.1
186.
71,
174.
113
.91,
374.
71,
012.
43,
641.
522
8.7
4,88
2.6
(2,2
15.8
)
Jul.
180.
71,
260.
16,
527.
345
2.1
8,23
9.5
202.
31,
133.
018
.01,
353.
31,
024.
53,
630.
223
0.2
4,88
4.9
(2,1
82.0
)
Aug
.29
.91,
302.
56,
570.
145
4.5
8,32
7.1
193.
51,
139.
111
.31,
343.
999
9.6
3,65
3.7
202.
74,
856.
0(2
,157
.1)
Sep
.(2
8.0)
1,34
6.2
6,57
5.5
522.
88,
444.
518
8.7
1,16
3.7
13.4
1,36
5.8
1,00
6.0
3,65
3.5
208.
64,
868.
1(2
,182
.6)
Oct
.(4
1.5)
1,39
3.9
6,55
4.9
523.
98,
472.
619
7.5
1,11
8.5
11.2
1,32
7.2
1,01
3.6
3,65
2.9
220.
34,
886.
8(2
,217
.1)
Nov
.93
.41,
412.
96,
560.
849
8.1
8,47
1.8
194.
41,
122.
115
.81,
332.
31,
017.
13,
608.
622
5.8
4,85
1.5
(2,3
81.4
)
Dec
.R15
2.1
1,41
3.5
6,57
2.7
461.
88,
448.
119
4.5
1,12
5.2
15.4
1,33
5.2
1,01
5.8
3,61
5.4
224.
74,
855.
9(2
,409
.1)
2011
Jan.
265.
81,
377.
56,
590.
046
1.4
8,42
8.9
193.
41,
126.
519
.11,
339.
01,
017.
13,
630.
422
6.0
4,87
3.5
(2,4
82.2
)
Feb
.27
9.9
1,35
1.8
6,49
0.2
453.
58,
295.
519
6.2
1,12
5.7
8.4
1,33
0.3
1,02
7.1
3,64
1.9
210.
24,
879.
2(2
,365
.9)
Mar
.31
2.0
1,36
6.8
6,48
5.1
450.
28,
302.
119
4.3
1,13
8.2
7.5
1,34
0.0
1,03
9.9
3,64
7.3
200.
84,
888.
0(2
,386
.0)
S
OU
RC
E:
The
Cen
tral
Ba
nk o
f The
Ba
ham
as
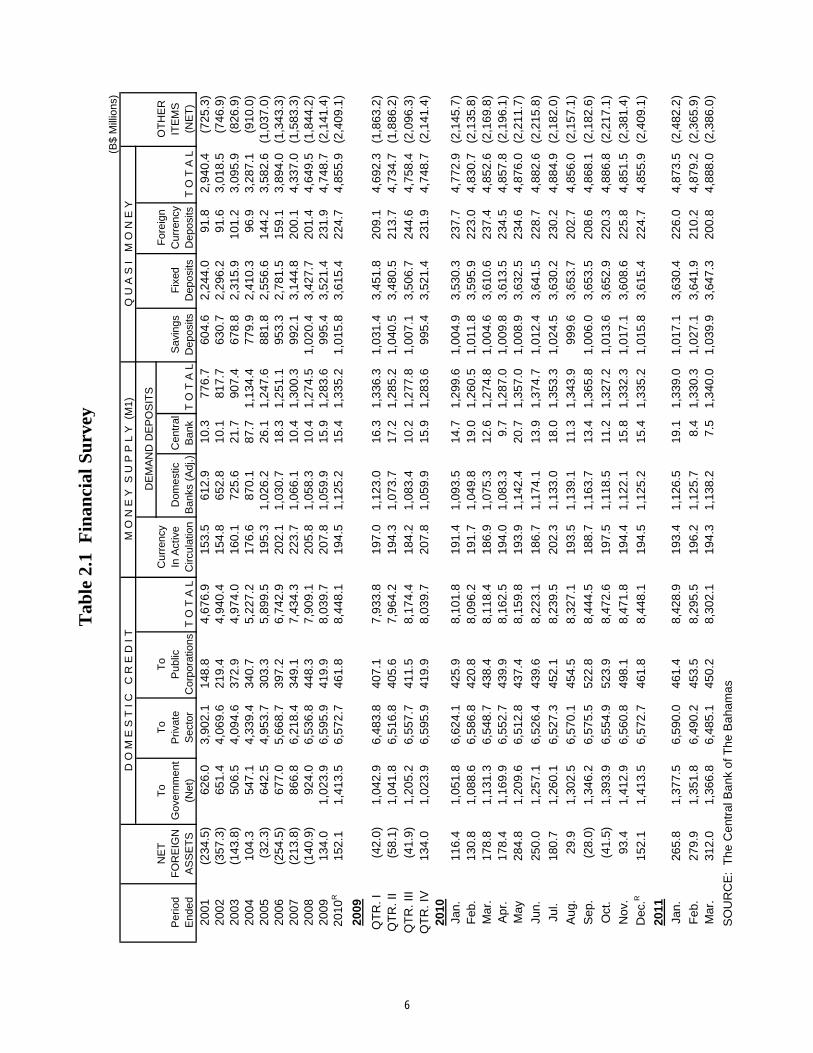
Tab
le 2
.1 F
inan
cial
Su
rvey
M O
N E
Y
S U
P P
L Y
(M
1)
DE
MA
ND
DE
PO
SIT
S
6
(B$
Mill
ions
)
D O
M E
S T
I C
C
R E
D I
TM
O N
E Y
S
U P
P L
Y (
M1)
Q U
A S
I
M O
N E
YD
EM
AN
D D
EP
OS
ITS
NE
TT
oT
oT
oC
urre
ncy
For
eign
OT
HE
RP
erio
dF
OR
EIG
NG
over
nmen
tP
rivat
eR
est o
fIn
Act
ive
Com
mer
cial
Cen
tral
Sav
ings
Fix
edC
urre
ncy
ITE
MS
End
edA
SS
ET
S(N
et)
Sec
tor
Pub
lic S
ecto
rT
O T
A L
Circ
ulat
ion
Ban
ks (
Adj
.)B
ank
T O
T A
LD
epos
itsD
epos
itsD
epos
itsT
O T
A L
(NE
T)
2001
(236
.0)
622.
83,
781.
814
8.8
4,55
3.4
153.
560
5.4
10.3
769.
260
4.3
2,17
3.4
91.8
2,86
9.5
678.
720
02(3
49.7
)64
8.2
3,92
5.6
219.
44,
793.
215
4.8
643.
610
.180
8.5
630.
42,
212.
291
.62,
934.
270
0.8
2003
(130
.7)
502.
13,
947.
937
2.8
4,82
2.8
160.
171
4.0
21.7
895.
867
8.5
2,21
8.8
101.
32,
998.
679
7.7
2004
70.9
542.
74,
199.
734
0.7
5,08
3.1
176.
686
0.4
87.7
1,12
4.7
779.
72,
316.
896
.93,
193.
483
5.9
2005
(65.
9)63
7.9
4,80
6.9
303.
05,
747.
819
5.3
1,00
1.6
26.1
1,22
3.0
881.
62,
467.
414
4.2
3,49
3.2
965.
720
06(2
35.1
)67
1.7
5,51
9.9
397.
26,
588.
820
2.1
1,01
7.7
18.3
1,23
8.1
953.
12,
714.
115
9.1
3,82
6.3
1,28
9.4
2007
(197
.6)
863.
86,
188.
634
9.0
7,40
1.4
223.
71,
044.
810
.41,
278.
999
1.9
3,13
2.2
200.
14,
324.
21,
600.
820
08(1
23.6
)92
1.0
6,51
3.4
448.
37,
882.
720
5.8
1,04
1.4
10.4
1,25
7.6
1,02
0.2
3,41
5.8
201.
34,
637.
31,
864.
220
0916
7.2
1,00
8.4
6,57
1.7
419.
98,
000.
020
7.8
1,03
8.2
15.9
1,26
1.9
995.
33,
511.
123
1.9
4,73
8.3
2,16
7.0
2010
R11
3.9
1,40
4.6
6,55
6.1
456.
48,
417.
119
4.5
1,10
4.8
15.4
1,31
4.7
1,01
5.8
3,60
1.8
222.
24,
839.
82,
376.
5
2009
QT
R. I
(28.
0)1,
038.
76,
463.
040
7.1
7,90
8.8
197.
01,
106.
416
.31,
319.
71,
031.
13,
440.
620
9.1
4,68
0.8
1,88
0.3
QT
R. I
I(2
7.1)
1,01
7.1
6,49
6.2
405.
67,
918.
919
4.3
1,05
3.5
17.2
1,26
5.0
1,04
0.2
3,46
9.5
213.
74,
723.
41,
903.
4Q
TR
. III
(0.5
)1,
177.
26,
538.
241
1.4
8,12
6.8
184.
21,
066.
710
.21,
261.
11,
007.
03,
497.
024
4.6
4,74
8.6
2,11
6.6
QT
R. I
V16
7.2
1,00
8.4
6,57
1.7
419.
98,
000.
020
7.8
1,03
8.2
15.9
1,26
1.9
995.
33,
511.
123
1.9
4,73
8.3
2,16
7.0
2010
Jan.
147.
41,
034.
76,
602.
242
5.9
8,06
2.8
191.
41,
075.
614
.71,
281.
71,
004.
83,
518.
323
7.6
4,76
0.7
2,16
7.8
Feb
.15
9.8
1,07
1.4
6,56
7.0
420.
88,
059.
219
1.7
1,03
2.5
19.0
1,24
3.2
1,01
1.7
3,58
5.2
223.
04,
819.
92,
155.
9
Mar
.20
3.8
1,11
4.2
6,52
8.1
438.
38,
080.
618
6.9
1,05
3.7
12.6
1,25
3.2
1,00
4.5
3,59
8.3
237.
44,
840.
22,
191.
0
Apr
.20
5.3
1,15
2.1
6,53
3.3
439.
98,
125.
319
4.0
1,06
5.9
9.7
1,26
9.6
1,00
9.7
3,60
1.5
234.
54,
845.
72,
215.
3
May
311.
01,
191.
96,
493.
843
7.4
8,12
3.1
193.
91,
125.
920
.71,
340.
41,
008.
83,
620.
123
4.6
4,86
3.5
2,23
0.3
Jun.
269.
01,
243.
36,
508.
943
9.6
8,19
1.8
186.
61,
144.
513
.91,
345.
11,
012.
43,
630.
422
8.6
4,87
1.4
2,24
4.4
J
ul.
201.
91,
246.
36,
510.
345
2.1
8,20
8.7
202.
41,
114.
618
.01,
335.
01,
024.
43,
618.
723
0.2
4,87
3.3
2,20
2.3
Aug
.50
.71,
288.
56,
554.
145
4.5
8,29
7.1
193.
51,
121.
211
.31,
326.
099
9.6
3,64
0.7
202.
74,
843.
02,
178.
8
Sep
.(1
9.2)
1,33
2.2
6,55
9.9
522.
78,
414.
918
8.7
1,14
0.5
13.4
1,34
2.6
1,00
5.9
3,64
0.2
208.
64,
854.
72,
198.
4
Oct
.(2
2.7)
1,37
8.9
6,53
9.9
519.
58,
438.
319
7.5
1,10
0.0
11.2
1,30
8.6
1,01
3.6
3,63
8.2
220.
14,
871.
92,
235.
1
Nov
.10
4.8
1,40
3.8
6,54
6.8
492.
78,
443.
219
4.4
1,10
2.2
15.8
1,31
2.4
1,01
7.1
3,59
5.2
225.
54,
837.
82,
397.
9
Dec
.R11
3.9
1,40
4.6
6,55
6.1
456.
48,
417.
119
4.5
1,10
4.8
15.4
1,31
4.7
1,01
5.8
3,60
1.8
222.
24,
839.
82,
376.
5
2011
Jan.
225.
91,
368.
16,
571.
545
6.0
8,39
5.6
193.
41,
108.
319
.11,
320.
91,
017.
03,
616.
922
4.2
4,85
8.1
2,44
2.5
Feb
.23
7.2
1,34
2.4
6,47
3.0
448.
18,
263.
519
6.2
1,10
7.4
8.4
1,31
2.0
1,02
7.1
3,62
8.1
207.
04,
862.
22,
326.
5
Mar
.26
6.4
1,35
7.4
6,47
0.9
444.
88,
273.
119
4.3
1,11
4.6
7.5
1,31
6.4
1,03
9.9
3,63
2.1
197.
44,
869.
42,
353.
7
S
OU
RC
E:
The
Cen
tral
Ban
k o
f The
Bah
amas
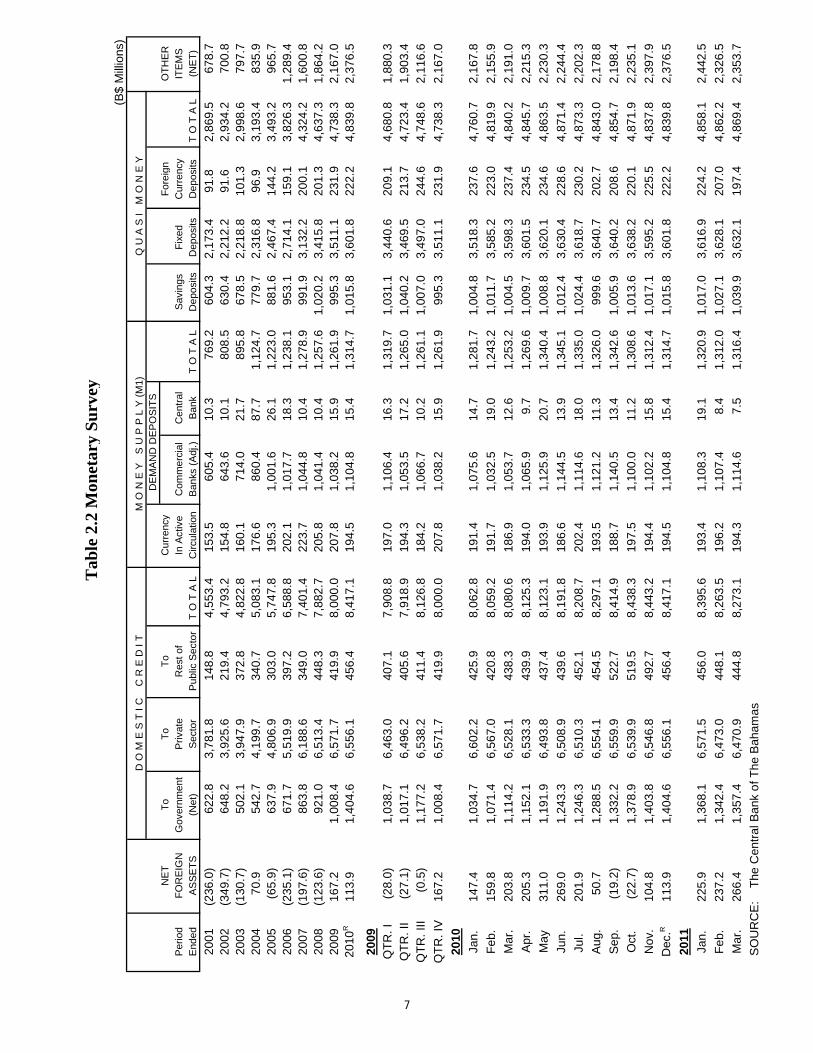
T
able
2.2
Mon
etar
y S
urv
ey
7
(B
$'00
0)
(3)
(4)
(5)
(6)
(7)
(8)
(9)
For
eign
Oth
erM
oney
Sav
ings
Fix
edM
oney
Cur
renc
yF
orei
gnM
oney
Per
iod
Cen
tral
Sup
ply
(M1)
Dep
osits
Dep
osits
Sup
ply
(M2)
Dem
and
Cur
renc
yS
uppl
y (M
3)E
nded
Ban
k(1
+ 2
)(A
dj.)
(Adj
.)
(3 +
4 +
5)
Dep
osits
Dep
osits
(6 +
7 +
8)
2001
153,
485
612,
915
10,3
2877
6,72
860
4,56
12,
244,
013
3,62
5,3
0282
,440
9,33
83,
717,
080
2002
154,
802
652,
827
10,0
4781
7,67
663
0,70
42,
296,
189
3,74
4,5
6970
,719
20,8
663,
836,
154
2003
160,
130
725,
617
21,6
4790
7,39
467
8,78
32,
315,
867
3,90
2,0
4489
,179
12,0
774,
003,
300
2004
176,
643
870,
133
87,6
671,
134,
443
779,
889
2,41
0,3
034,
324,
635
87,8
689,
009
4,42
1,5
1220
0519
5,25
31,
026,
258
26,0
561,
247,
567
881,
826
2,55
6,6
364,
686,
029
115,
484
28,6
634,
830,
176
2006
202,
087
1,03
0,7
0918
,326
1,25
1,1
2295
3,29
12,
781,
532
4,98
5,9
4513
3,08
426
,057
5,14
5,0
8620
0722
3,66
71,
066,
145
10,4
431,
300,
255
992,
118
3,14
4,8
175,
437,
190
150,
721
49,3
525,
637,
263
2008
205,
836
1,05
8,3
1310
,366
1,27
4,5
151,
020,
421
3,42
7,7
385,
722,
674
133,
128
68,2
245,
924,
026
2009
207,
836
1,05
9,8
6215
,876
1,28
3,5
7499
5,44
23,
521,
376
5,80
0,3
9220
0,94
730
,948
6,03
2,2
87 2
010
R19
4,52
01,
125,
201
15,4
411,
335,
162
1,01
5,8
233,
615,
390
5,96
6,3
7520
0,35
624
,296
6,19
1,0
27
2009
QT
R. I
196,
996
1,12
3,0
5016
,305
1,33
6,3
511,
031,
429
3,45
1,7
875,
819,
567
144,
872
64,2
746,
028,
713
QT
R. I
I19
4,32
31,
073,
740
17,1
521,
285,
215
1,04
0,5
033,
480,
479
5,80
6,1
9716
7,15
846
,534
6,01
9,8
89Q
TR
. III
184,
232
1,08
3,4
4710
,180
1,27
7,8
591,
007,
147
3,50
6,6
965,
791,
702
212,
026
32,6
176,
036,
345
QT
R. I
V20
7,83
61,
059,
862
15,8
761,
283,
574
995,
442
3,52
1,3
765,
800,
392
200,
947
30,9
486,
032,
287
2010
Jan.
191,
338
1,09
3,5
1914
,711
1,29
9,5
681,
004,
908
3,53
0,3
285,
834,
804
184,
550
53,1
056,
072,
459
Feb
.19
1,69
71,
049,
810
18,9
631,
260,
470
1,01
1,8
323,
595,
892
5,86
8,1
9417
0,00
452
,960
6,09
1,1
58M
ar.
186,
912
1,07
5,3
0512
,615
1,27
4,8
321,
004,
558
3,61
0,6
265,
890,
016
179,
873
57,5
716,
127,
460
Apr
.19
3,95
61,
083,
354
9,72
81,
287,
038
1,00
9,7
963,
613,
523
5,91
0,3
5717
7,21
657
,236
6,14
4,8
09M
ay19
3,88
81,
142,
394
20,6
751,
356,
957
1,00
8,8
803,
632,
549
5,99
8,3
8619
6,44
038
,148
6,23
2,9
74Ju
n.18
6,64
11,
174,
123
13,9
011,
374,
665
1,01
2,4
313,
641,
538
6,02
8,6
3419
6,57
732
,067
6,25
7,2
78
Jul
.20
2,36
11,
132,
958
18,0
031,
353,
322
1,02
4,4
903,
630,
190
6,00
8,0
0220
3,25
926
,955
6,23
8,2
16A
ug.
193,
524
1,13
9,1
1611
,288
1,34
3,9
2899
9,62
53,
653,
670
5,99
7,2
2317
5,89
826
,811
6,19
9,9
32S
ep.
188,
692
1,16
3,6
7813
,422
1,36
5,7
921,
005,
964
3,65
3,4
666,
025,
222
182,
566
26,0
696,
233,
857
Oct
.19
7,52
01,
118,
531
11,1
741,
327,
225
1,01
3,6
043,
652,
880
5,99
3,7
0919
4,83
225
,487
6,21
4,0
28N
ov.
194,
401
1,12
2,0
5615
,811
1,33
2,2
681,
017,
147
3,60
8,5
995,
958,
014
200,
951
24,7
996,
183,
764
Dec
.R19
4,52
01,
125,
201
15,4
411,
335,
162
1,01
5,8
233,
615,
390
5,96
6,3
7520
0,35
624
,296
6,19
1,0
27
2011
Jan.
193,
410
1,12
6,5
0419
,138
1,33
9,0
521,
017,
073
3,63
0,3
925,
986,
517
201,
771
24,2
576,
212,
545
Feb
.19
6,15
91,
125,
690
8,43
31,
330,
282
1,02
7,1
363,
641,
873
5,99
9,2
9118
4,70
525
,471
6,20
9,4
67
Mar
.19
4,26
21,
138,
247
7,50
21,
340,
011
1,03
9,8
983,
647,
274
6,02
7,1
8317
5,41
125
,460
6,22
8,0
54
SO
UR
CE
: T
he C
entr
al B
ank
of T
he B
aham
as
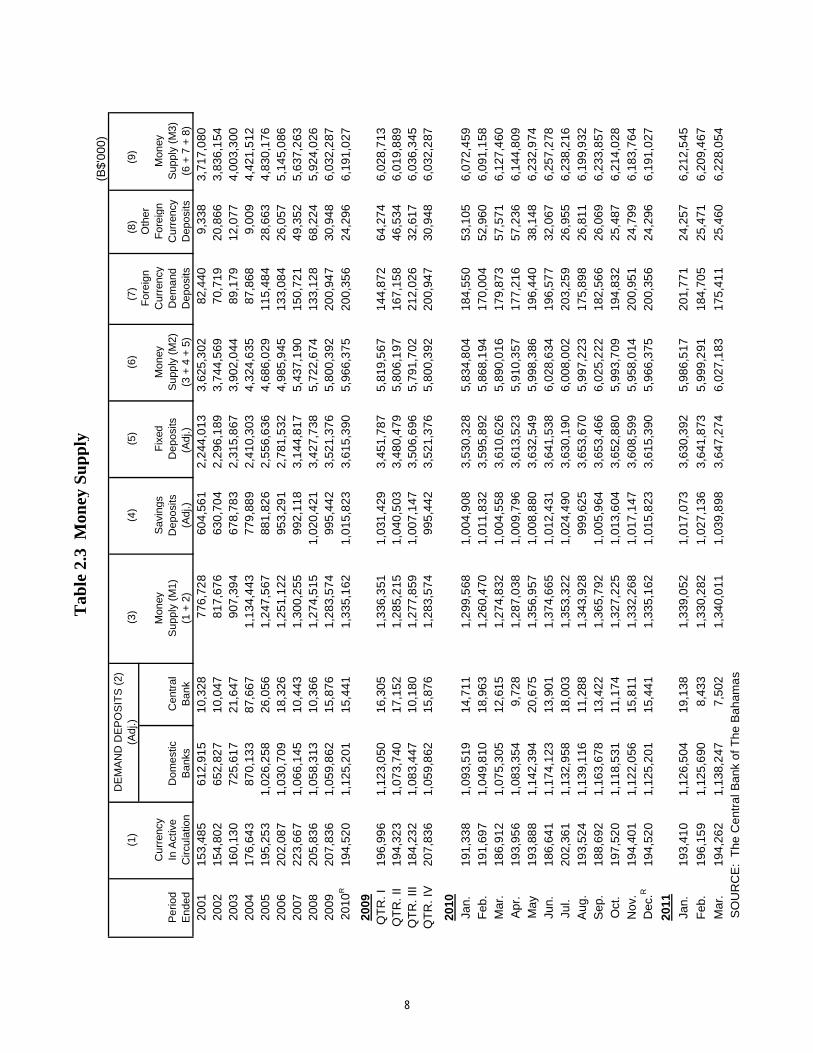
Tab
le 2
.3 M
oney
Su
pp
ly
Cur
renc
yIn
Act
ive
Circ
ulat
ion
(1)
DE
MA
ND
DE
PO
SIT
S (
2)(A
dj.)
Dom
estic
Ban
ks
8
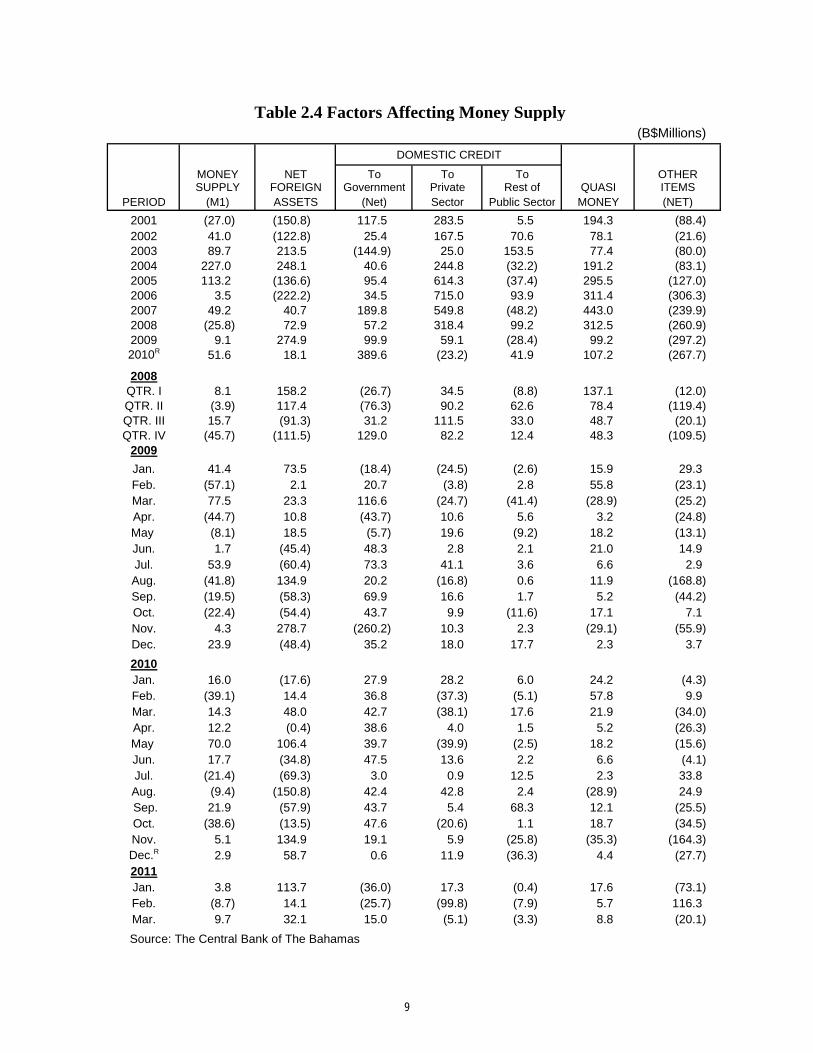
(B$Millions)
DOMESTIC CREDIT
MONEY NET To To To OTHERSUPPLY FOREIGN Government Private Rest of QUASI ITEMS
PERIOD (M1) ASSETS (Net) Sector Public Sector MONEY (NET)
2001 (27.0) (150.8) 117.5 283.5 5.5 194.3 (88.4)2002 41.0 (122.8) 25.4 167.5 70.6 78.1 (21.6)2003 89.7 213.5 (144.9) 25.0 153.5 77.4 (80.0)2004 227.0 248.1 40.6 244.8 (32.2) 191.2 (83.1)2005 113.2 (136.6) 95.4 614.3 (37.4) 295.5 (127.0)2006 3.5 (222.2) 34.5 715.0 93.9 311.4 (306.3)2007 49.2 40.7 189.8 549.8 (48.2) 443.0 (239.9)2008 (25.8) 72.9 57.2 318.4 99.2 312.5 (260.9)2009 9.1 274.9 99.9 59.1 (28.4) 99.2 (297.2)2010R 51.6 18.1 389.6 (23.2) 41.9 107.2 (267.7)
2008QTR. I 8.1 158.2 (26.7) 34.5 (8.8) 137.1 (12.0)QTR. II (3.9) 117.4 (76.3) 90.2 62.6 78.4 (119.4)QTR. III 15.7 (91.3) 31.2 111.5 33.0 48.7 (20.1)QTR. IV (45.7) (111.5) 129.0 82.2 12.4 48.3 (109.5)
2009
Jan. 41.4 73.5 (18.4) (24.5) (2.6) 15.9 29.3Feb. (57.1) 2.1 20.7 (3.8) 2.8 55.8 (23.1)Mar. 77.5 23.3 116.6 (24.7) (41.4) (28.9) (25.2)Apr. (44.7) 10.8 (43.7) 10.6 5.6 3.2 (24.8)May (8.1) 18.5 (5.7) 19.6 (9.2) 18.2 (13.1)Jun. 1.7 (45.4) 48.3 2.8 2.1 21.0 14.9Jul. 53.9 (60.4) 73.3 41.1 3.6 6.6 2.9Aug. (41.8) 134.9 20.2 (16.8) 0.6 11.9 (168.8)Sep. (19.5) (58.3) 69.9 16.6 1.7 5.2 (44.2)Oct. (22.4) (54.4) 43.7 9.9 (11.6) 17.1 7.1Nov. 4.3 278.7 (260.2) 10.3 2.3 (29.1) (55.9)Dec. 23.9 (48.4) 35.2 18.0 17.7 2.3 3.7
2010Jan. 16.0 (17.6) 27.9 28.2 6.0 24.2 (4.3)Feb. (39.1) 14.4 36.8 (37.3) (5.1) 57.8 9.9Mar. 14.3 48.0 42.7 (38.1) 17.6 21.9 (34.0)Apr. 12.2 (0.4) 38.6 4.0 1.5 5.2 (26.3)May 70.0 106.4 39.7 (39.9) (2.5) 18.2 (15.6)Jun. 17.7 (34.8) 47.5 13.6 2.2 6.6 (4.1)Jul. (21.4) (69.3) 3.0 0.9 12.5 2.3 33.8Aug. (9.4) (150.8) 42.4 42.8 2.4 (28.9) 24.9 Sep. 21.9 (57.9) 43.7 5.4 68.3 12.1 (25.5)Oct. (38.6) (13.5) 47.6 (20.6) 1.1 18.7 (34.5)Nov. 5.1 134.9 19.1 5.9 (25.8) (35.3) (164.3)Dec.R 2.9 58.7 0.6 11.9 (36.3) 4.4 (27.7)2011Jan. 3.8 113.7 (36.0) 17.3 (0.4) 17.6 (73.1)Feb. (8.7) 14.1 (25.7) (99.8) (7.9) 5.7 116.3Mar. 9.7 32.1 15.0 (5.1) (3.3) 8.8 (20.1)
Source: The Central Bank of The Bahamas
Table 2.4 Factors Affecting Money Supply
9
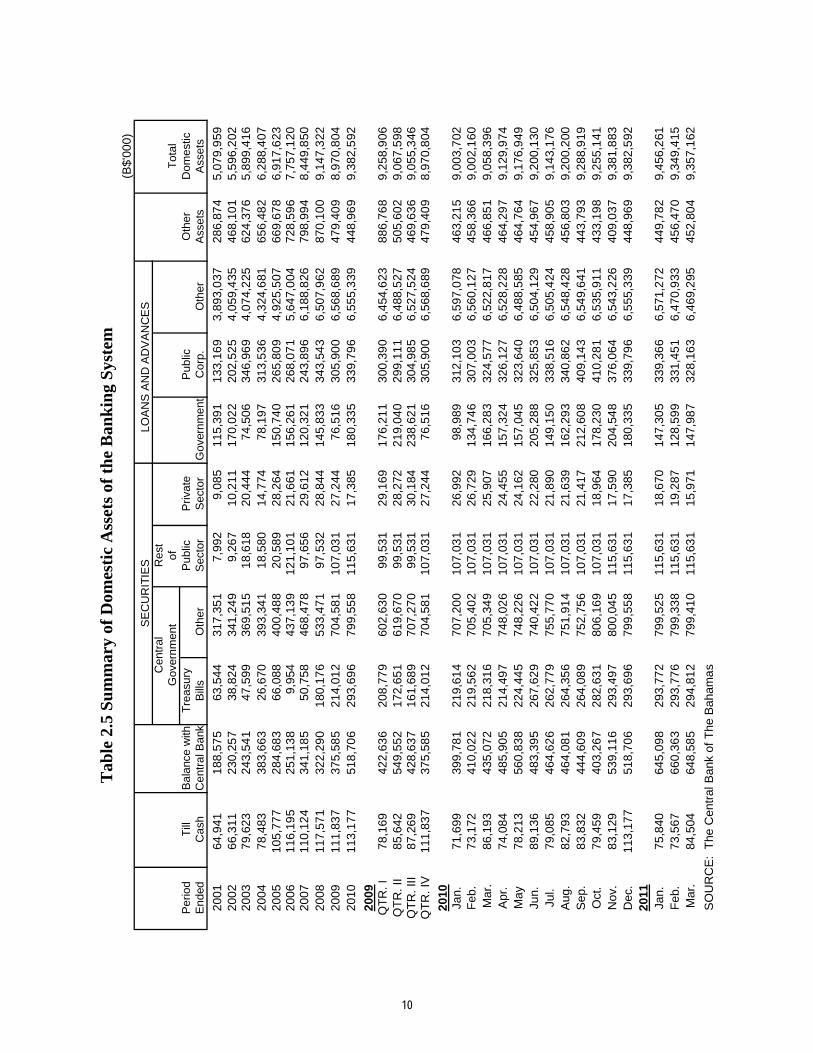
Tab
le 2
.5 S
um
mar
y of
Dom
esti
c A
sset
s of
th
e B
ank
ing
Sys
tem
(B$'
000)
SE
CU
RIT
IES
LO
AN
S A
ND
AD
VA
NC
ES
Cen
tral
Res
tG
over
nmen
tof
Tot
alP
erio
dT
illB
alan
ce w
ithT
reas
ury
Pub
licP
rivat
eP
ublic
Oth
erD
omes
ticE
nded
Cas
hC
entr
al B
ank
Bill
sO
ther
Sec
tor
Sec
tor
Gov
ernm
ent
Cor
p.O
ther
Ass
ets
Ass
ets
2001
64,9
4118
8,57
563
,544
317,
351
7,99
29,
085
115,
391
133,
169
3,89
3,0
3728
6,87
45,
079,
959
2002
66,3
1123
0,25
738
,824
341,
249
9,26
710
,211
170,
022
202,
525
4,05
9,4
3546
8,10
15,
596,
202
2003
79,6
2324
3,54
147
,599
369,
515
18,6
1820
,444
74,5
0634
6,96
94,
074,
225
624,
376
5,89
9,4
1620
0478
,483
383,
663
26,6
7039
3,34
118
,580
14,7
7478
,197
313,
536
4,32
4,6
8165
6,48
26,
288,
407
2005
105,
777
284,
683
66,0
8840
0,48
820
,589
28,2
6415
0,74
026
5,80
94,
925,
507
669,
678
6,91
7,6
2320
0611
6,19
525
1,13
89,
954
437,
139
121,
101
21,6
6115
6,26
126
8,07
15,
647,
004
728,
596
7,75
7,1
2020
0711
0,12
434
1,18
550
,758
468,
478
97,6
5629
,612
120,
321
243,
896
6,18
8,8
2679
8,99
48,
449,
850
2008
117,
571
322,
290
180,
176
533,
471
97,5
3228
,844
145,
833
343,
543
6,50
7,9
6287
0,10
09,
147,
322
2009
111,
837
375,
585
214,
012
704,
581
107,
031
27,2
4476
,516
305,
900
6,56
8,6
8947
9,40
98,
970,
804
2010
113,
177
518,
706
293,
696
799,
558
115,
631
17,3
8518
0,33
533
9,79
66,
555,
339
448,
969
9,38
2,5
92
2009
QT
R. I
78,1
6942
2,63
620
8,77
960
2,63
099
,531
29,1
6917
6,21
130
0,39
06,
454,
623
886,
768
9,25
8,9
06Q
TR
. II
85,6
4254
9,55
217
2,65
161
9,67
099
,531
28,2
7221
9,04
029
9,11
16,
488,
527
505,
602
9,06
7,5
98Q
TR
. III
87,2
6942
8,63
716
1,68
970
7,27
099
,531
30,1
8423
8,62
130
4,98
56,
527,
524
469,
636
9,05
5,3
46Q
TR
. IV
111,
837
375,
585
214,
012
704,
581
107,
031
27,2
4476
,516
305,
900
6,56
8,6
8947
9,40
98,
970,
804
2010
Jan.
71,6
9939
9,78
121
9,61
470
7,20
010
7,03
126
,992
98,9
8931
2,10
36,
597,
078
463,
215
9,00
3,7
02F
eb.
73,1
7241
0,02
221
9,56
270
5,40
210
7,03
126
,729
134,
746
307,
003
6,56
0,1
2745
8,36
69,
002,
160
Mar
.86
,193
435,
072
218,
316
705,
349
107,
031
25,9
0716
6,28
332
4,57
76,
522,
817
466,
851
9,05
8,3
96A
pr.
74,0
8448
5,90
521
4,49
774
8,02
610
7,03
124
,455
157,
324
326,
127
6,52
8,2
2846
4,29
79,
129,
974
May
78,2
1356
0,83
822
4,44
574
8,22
610
7,03
124
,162
157,
045
323,
640
6,48
8,5
8546
4,76
49,
176,
949
Jun.
89,1
3648
3,39
526
7,62
974
0,42
210
7,03
122
,280
205,
288
325,
853
6,50
4,1
2945
4,96
79,
200,
130
Jul.
79,0
8546
4,62
626
2,77
975
5,77
010
7,03
121
,890
149,
150
338,
516
6,50
5,4
2445
8,90
59,
143,
176
Aug
.82
,793
464,
081
264,
356
751,
914
107,
031
21,6
3916
2,29
334
0,86
26,
548,
428
456,
803
9,20
0,2
00S
ep.
83,8
3244
4,60
926
4,08
975
2,75
610
7,03
121
,417
212,
608
409,
143
6,54
9,6
4144
3,79
39,
288,
919
Oct
.79
,459
403,
267
282,
631
806,
169
107,
031
18,9
6417
8,23
041
0,28
16,
535,
911
433,
198
9,25
5,1
41N
ov.
83,1
2953
9,11
629
3,49
780
0,04
511
5,63
117
,590
204,
548
376,
064
6,54
3,2
2640
9,03
79,
381,
883
Dec
.11
3,17
751
8,70
629
3,69
679
9,55
811
5,63
117
,385
180,
335
339,
796
6,55
5,3
3944
8,96
99,
382,
592
2011
Jan.
75,8
4064
5,09
829
3,77
279
9,52
511
5,63
118
,670
147,
305
339,
366
6,57
1,2
7244
9,78
29,
456,
261
Feb
.73
,567
660,
363
293,
776
799,
338
115,
631
19,2
8712
8,59
933
1,45
16,
470,
933
456,
470
9,34
9,4
15 M
ar.
84,5
0464
8,58
529
4,81
279
9,41
011
5,63
115
,971
147,
987
328,
163
6,46
9,2
9545
2,80
49,
357,
162
S
OU
RC
E:
The
Cen
tral
Ban
k of
The
Bah
ama
s
10
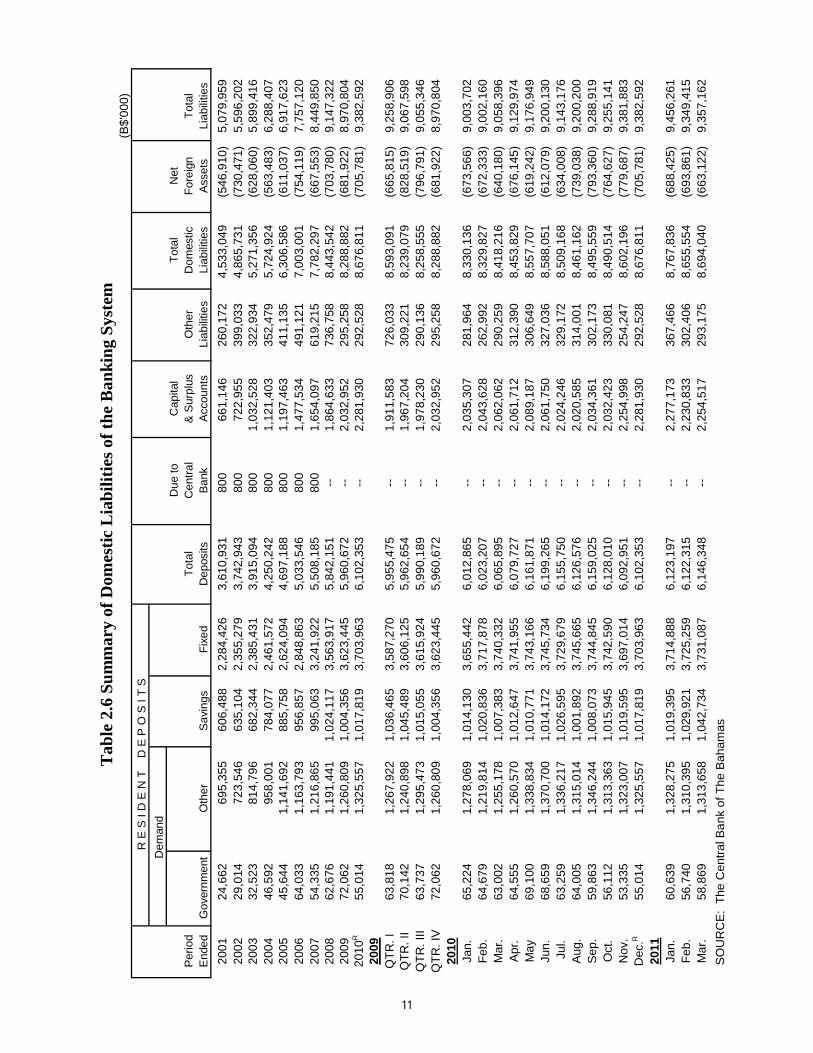
Tab
le 2
.6 S
um
mar
y of
Dom
esti
c L
iab
ilit
ies
of t
he
Ban
kin
g S
yste
m(B
$'00
0)
R E
S I
D E
N T
D
E P
O S
I T
S
Dem
and
Due
toC
apita
lT
otal
Net
Per
iod
Tot
alC
entr
al&
Sur
plus
Oth
erD
omes
ticF
orei
gnT
otal
End
edG
over
nmen
tO
ther
Sav
ings
Fix
edD
epos
itsB
ank
Acc
ount
sLi
abili
ties
Liab
ilitie
sA
sset
sLi
abili
ties
2001
24,6
6269
5,35
560
6,48
82,
284,
426
3,61
0,93
180
066
1,14
626
0,17
24,
533,
049
(546
,910
)
5,07
9,95
920
0229
,014
723,
546
635,
104
2,35
5,27
93,
742,
943
800
722,
955
399,
033
4,86
5,73
1(7
30,4
71)
5,
596,
202
2003
32,5
2381
4,79
668
2,34
42,
385,
431
3,91
5,09
480
01,
032,
528
322,
934
5,27
1,35
6(6
28,0
60)
5,
899,
416
2004
46,5
9295
8,00
178
4,07
72,
461,
572
4,25
0,24
280
01,
121,
403
352,
479
5,72
4,92
4(5
63,4
83)
6,
288,
407
2005
45,6
441,
141,
692
885,
758
2,62
4,09
44,
697,
188
800
1,19
7,46
341
1,13
56,
306,
586
(611
,037
)
6,91
7,62
320
0664
,033
1,16
3,79
395
6,85
72,
848,
863
5,03
3,54
680
01,
477,
534
491,
121
7,00
3,00
1(7
54,1
19)
7,
757,
120
2007
54,3
351,
216,
865
995,
063
3,24
1,92
25,
508,
185
800
1,65
4,09
761
9,21
57,
782,
297
(667
,553
)
8,44
9,85
020
0862
,676
1,19
1,44
11,
024,
117
3,56
3,91
75,
842,
151
--
1,86
4,63
373
6,75
88,
443,
542
(703
,780
)
9,14
7,32
220
0972
,062
1,26
0,80
91,
004,
356
3,62
3,44
55,
960,
672
--
2,03
2,95
229
5,25
88,
288,
882
(681
,922
)
8,97
0,80
420
10R
55,0
141,
325,
557
1,01
7,81
93,
703,
963
6,10
2,35
3
-
-2,
281,
930
292,
528
8,67
6,81
1(7
05,7
81)
9,38
2,59
220
0920
09Q
TR
. I63
,818
1,26
7,92
21,
036,
465
3,58
7,27
05,
955,
475
--
1,91
1,58
372
6,03
38,
593,
091
(665
,815
)
9,25
8,90
6Q
TR
. II
70,1
421,
240,
898
1,04
5,48
93,
606,
125
5,96
2,65
4
-
-1,
967,
204
309,
221
8,23
9,07
9(8
28,5
19)
9,
067,
598
QT
R. I
II63
,737
1,29
5,47
31,
015,
055
3,61
5,92
45,
990,
189
--
1,97
8,23
029
0,13
68,
258,
555
(796
,791
)
9,05
5,34
6Q
TR
. IV
72,0
621,
260,
809
1,00
4,35
63,
623,
445
5,96
0,67
2
-
-2,
032,
952
295,
258
8,28
8,88
2(6
81,9
22)
8,
970,
804
2010
Jan.
65,2
241,
278,
069
1,01
4,13
03,
655,
442
6,01
2,86
5
-
-2,
035,
307
281,
964
8,33
0,13
6(6
73,5
66)
9,
003,
702
Feb
.64
,679
1,21
9,81
41,
020,
836
3,71
7,87
86,
023,
207
--
2,04
3,62
826
2,99
28,
329,
827
(672
,333
)
9,00
2,16
0M
ar.
63,0
021,
255,
178
1,00
7,38
33,
740,
332
6,06
5,89
5
-
-2,
062,
062
290,
259
8,41
8,21
6(6
40,1
80)
9,
058,
396
Apr
.64
,555
1,26
0,57
01,
012,
647
3,74
1,95
56,
079,
727
--
2,06
1,71
231
2,39
08,
453,
829
(676
,145
)
9,12
9,97
4M
ay69
,100
1,33
8,83
41,
010,
771
3,74
3,16
66,
161,
871
--
2,08
9,18
730
6,64
98,
557,
707
(619
,242
)
9,17
6,94
9Ju
n.68
,659
1,37
0,70
01,
014,
172
3,74
5,73
46,
199,
265
--
2,06
1,75
032
7,03
68,
588,
051
(612
,079
)
9,20
0,13
0 J
ul.
63,2
591,
336,
217
1,02
6,59
53,
729,
679
6,15
5,75
0
-
-2,
024,
246
329,
172
8,50
9,16
8(6
34,0
08)
9,
143,
176
Aug
.64
,005
1,31
5,01
41,
001,
892
3,74
5,66
56,
126,
576
--
2,02
0,58
531
4,00
18,
461,
162
(739
,038
)
9,20
0,20
0S
ep.
59,8
631,
346,
244
1,00
8,07
33,
744,
845
6,15
9,02
5
-
-2,
034,
361
302,
173
8,49
5,55
9(7
93,3
60)
9,
288,
919
Oct
.56
,112
1,31
3,36
31,
015,
945
3,74
2,59
06,
128,
010
--
2,03
2,42
333
0,08
18,
490,
514
(764
,627
)
9,25
5,14
1N
ov.
53,3
351,
323,
007
1,01
9,59
53,
697,
014
6,09
2,95
1
-
-2,
254,
998
254,
247
8,60
2,19
6(7
79,6
87)
9,
381,
883
Dec
.R55
,014
1,32
5,55
71,
017,
819
3,70
3,96
36,
102,
353
--
2,28
1,93
029
2,52
88,
676,
811
(705
,781
)
9,38
2,59
220
11Ja
n.60
,639
1,32
8,27
51,
019,
395
3,71
4,88
86,
123,
197
--
2,27
7,17
336
7,46
68,
767,
836
(688
,425
)
9,45
6,26
1F
eb.
56,7
401,
310,
395
1,02
9,92
13,
725,
259
6,12
2,31
5
-
-2,
230,
833
302,
406
8,65
5,55
4(6
93,8
61)
9,
349,
415
Mar
.58
,869
1,31
3,65
81,
042,
734
3,73
1,08
76,
146,
348
--
2,25
4,51
729
3,17
58,
694,
040
(663
,122
)
9,35
7,16
2
S
OU
RC
E:
The
Cen
tral
Ba
nk o
f The
Bah
amas
11
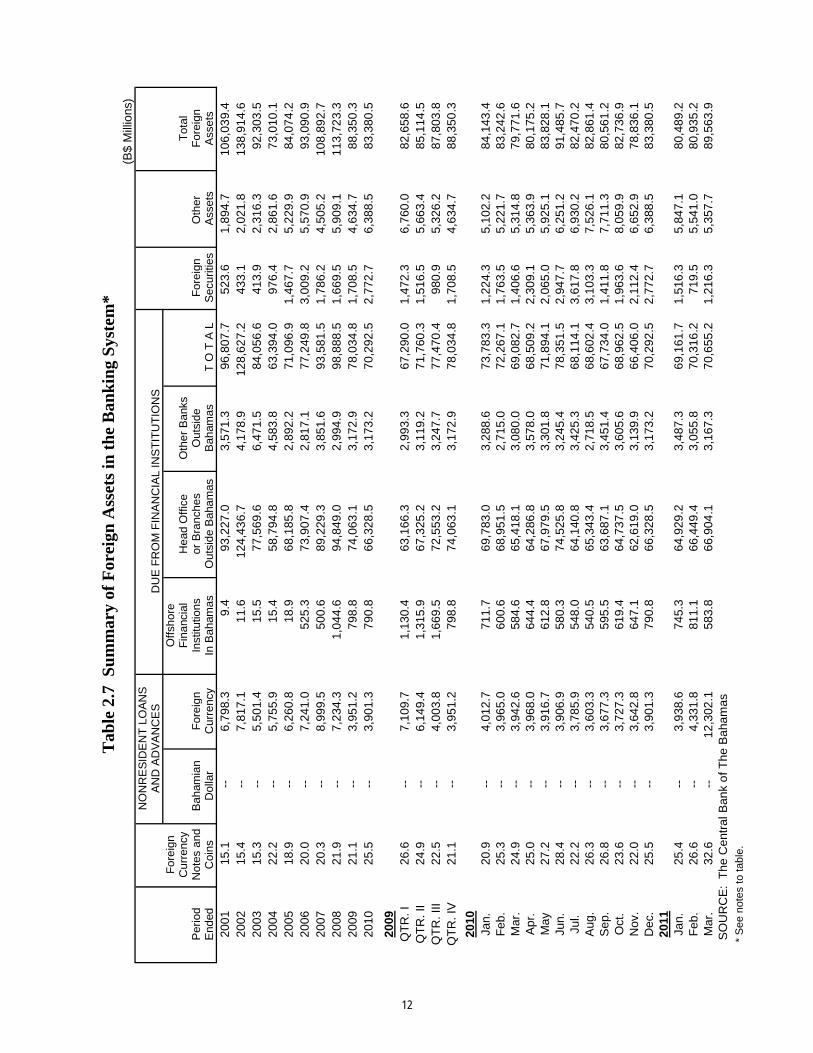
Tab
le 2
.7 S
um
mar
y of
For
eign
Ass
ets
in t
he
Ban
kin
g S
yste
m*
(B$
Mill
ions
)N
ON
RE
SID
EN
T L
OA
NS
AN
D A
DV
AN
CE
SD
UE
FR
OM
FIN
AN
CIA
L IN
ST
ITU
TIO
NS
For
eign
Offs
hore
Cur
renc
yF
inan
cial
Hea
d O
ffice
Oth
er B
anks
Tot
alP
erio
dN
otes
and
Bah
amia
nF
orei
gnIn
stitu
tions
or B
ranc
hes
Out
side
For
eign
Oth
er
For
eign
End
edC
oins
Dol
lar
Cur
renc
yIn
Bah
amas
Out
side
Bah
amas
Bah
amas
T O
T A
LS
ecur
ities
Ass
ets
Ass
ets
2001
15.1
--
-
-6,
798.
39.
493
,227
.03,
571.
396
,807
.752
3.6
1,89
4.7
106,
039.
420
0215
.47,
817.
111
.612
4,43
6.7
4,17
8.9
128,
627.
243
3.1
2,02
1.8
138,
914.
620
0315
.35,
501.
415
.577
,569
.66,
471.
584
,056
.641
3.9
2,31
6.3
92,3
03.5
2004
22.2
5,75
5.9
15.4
58,7
94.8
4,58
3.8
63,3
94.0
976.
42,
861.
673
,010
.120
0518
.96,
260.
818
.968
,185
.82,
892.
271
,096
.91,
467.
75,
229.
984
,074
.220
0620
.07,
241.
052
5.3
73,9
07.4
2,81
7.1
77,2
49.8
3,00
9.2
5,57
0.9
93,0
90.9
2007
20.3
-
-8,
999.
550
0.6
89,2
29.3
3,85
1.6
93,5
81.5
1,78
6.2
4,50
5.2
108,
892.
720
0821
.9
--
7,23
4.3
1,04
4.6
94,8
49.0
2,99
4.9
98,8
88.5
1,66
9.5
5,90
9.1
113,
723.
320
0921
.1
--
3,95
1.2
798.
874
,063
.13,
172.
978
,034
.81,
708.
54,
634.
788
,350
.320
1025
.5
--
3,90
1.3
790.
866
,328
.53,
173.
270
,292
.52,
772.
76,
388.
583
,380
.5
2009
QT
R. I
26.6
7,10
9.7
1,13
0.4
63,1
66.3
2,99
3.3
67,2
90.0
1,47
2.3
6,76
0.0
82,6
58.6
QT
R. I
I24
.96,
149.
41,
315.
967
,325
.23,
119.
271
,760
.31,
516.
55,
663.
485
,114
.5Q
TR
. III
22.5
4,00
3.8
1,66
9.5
72,5
53.2
3,24
7.7
77,4
70.4
980.
95,
326.
287
,803
.8Q
TR
. IV
21.1
3,95
1.2
798.
874
,063
.13,
172.
978
,034
.81,
708.
54,
634.
788
,350
.3
2010
Jan.
20.9
4,01
2.7
711.
769
,783
.03,
288.
673
,783
.31,
224.
35,
102.
284
,143
.4F
eb.
25.3
3,96
5.0
600.
668
,951
.52,
715.
072
,267
.11,
763.
55,
221.
783
,242
.6M
ar.
24.9
3,94
2.6
584.
665
,418
.13,
080.
069
,082
.71,
406.
65,
314.
879
,771
.6A
pr.
25.0
3,96
8.0
644.
464
,286
.83,
578.
068
,509
.22,
309.
15,
363.
980
,175
.2M
ay27
.23,
916.
761
2.8
67,9
79.5
3,30
1.8
71,8
94.1
2,06
5.0
5,92
5.1
83,8
28.1
Jun.
28.4
3,90
6.9
580.
374
,525
.83,
245.
478
,351
.52,
947.
76,
251.
291
,485
.7Ju
l.22
.23,
785.
954
8.0
64,1
40.8
3,42
5.3
68,1
14.1
3,61
7.8
6,93
0.2
82,4
70.2
Aug
.26
.33,
603.
354
0.5
65,3
43.4
2,71
8.5
68,6
02.4
3,10
3.3
7,52
6.1
82,8
61.4
Sep
.26
.83,
677.
359
5.5
63,6
87.1
3,45
1.4
67,7
34.0
1,41
1.8
7,71
1.3
80,5
61.2
Oct
.23
.63,
727.
361
9.4
64,7
37.5
3,60
5.6
68,9
62.5
1,96
3.6
8,05
9.9
82,7
36.9
Nov
.22
.03,
642.
864
7.1
62,6
19.0
3,13
9.9
66,4
06.0
2,11
2.4
6,65
2.9
78,8
36.1
Dec
.25
.53,
901.
379
0.8
66,3
28.5
3,17
3.2
70,2
92.5
2,77
2.7
6,38
8.5
83,3
80.5
2011
Jan.
25.4
3,93
8.6
745.
364
,929
.23,
487.
369
,161
.71,
516.
35,
847.
180
,489
.2F
eb.
26.6
4,33
1.8
811.
166
,449
.43,
055.
870
,316
.271
9.5
5,54
1.0
80,9
35.2
Mar
.32
.612
,302
.158
3.8
66,9
04.1
3,16
7.3
70,6
55.2
1,21
6.3
5,35
7.7
89,5
63.9
SO
UR
CE
: T
he C
entr
al B
ank
of T
he B
aham
as
*
See
not
es t
o ta
ble.
-
-
--
-
-
-
-
-
-
--
-
-
-
-
--
-
-
-
-
-
-
--
-
-
-
-
--
-
-
--
-
-
-
-
-
-
--
-
-
-
-
12
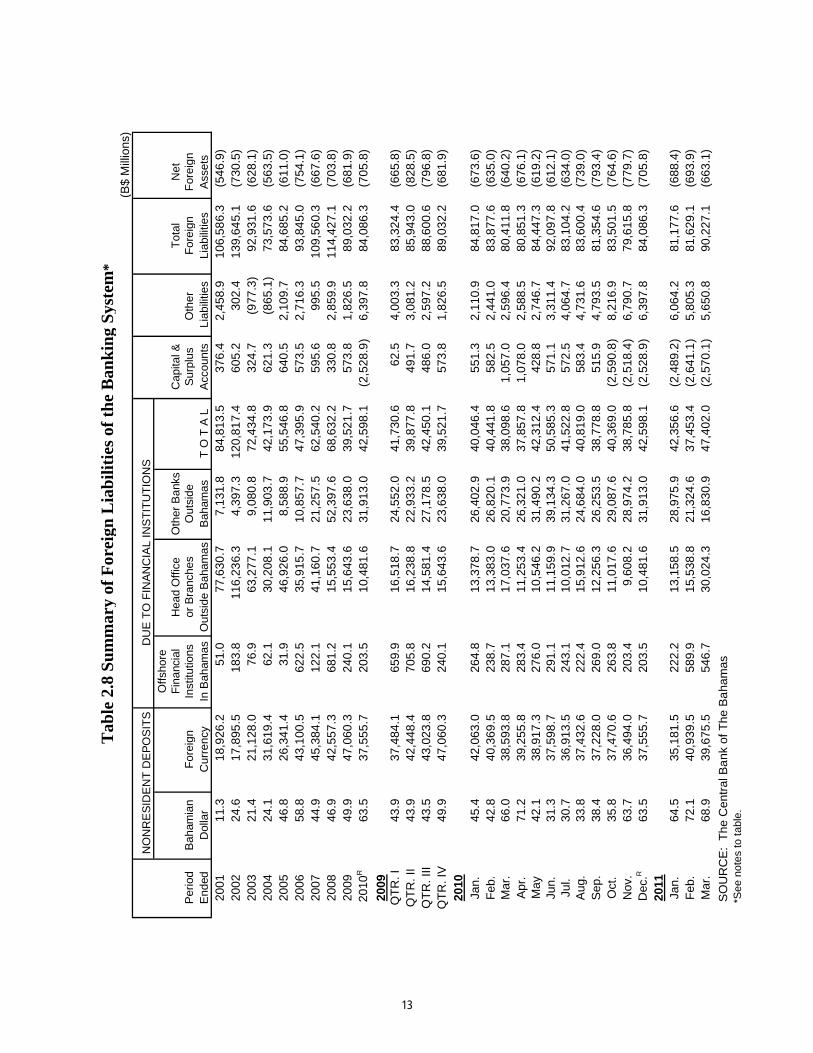
Tab
le 2
.8 S
um
mar
y of
For
eign
Lia
bil
itie
s of
th
e B
ank
ing
Sys
tem
*
DU
E T
O F
INA
NC
IAL
INS
TIT
UT
ION
SO
ffsho
reF
inan
cial
Hea
d O
ffice
Oth
er B
anks
Cap
ital &
Tot
alN
etP
erio
dB
aham
ian
For
eign
Inst
itutio
nsor
Bra
nche
sO
utsi
deS
urpl
usO
ther
F
orei
gnF
orei
gnE
nded
Dol
lar
Cur
renc
yIn
Bah
amas
Out
side
Bah
amas
Bah
amas
T O
T A
LA
ccou
nts
Liab
ilitie
sLi
abili
ties
Ass
ets
2001
11.3
18,9
26.2
51.0
77,6
30.7
7,13
1.8
84,8
13.5
376.
42,
458.
910
6,58
6.3
(546
.9)
2002
24.6
17,8
95.5
183.
811
6,23
6.3
4,39
7.3
120,
817.
460
5.2
302.
413
9,64
5.1
(730
.5)
2003
21.4
21,1
28.0
76.9
63,2
77.1
9,08
0.8
72,4
34.8
324.
7(9
77.3
)92
,931
.6(6
28.1
)20
0424
.131
,619
.462
.130
,208
.111
,903
.742
,173
.962
1.3
(865
.1)
73,5
73.6
(563
.5)
2005
46.8
26,3
41.4
31.9
46,9
26.0
8,58
8.9
55,5
46.8
640.
52,
109.
784
,685
.2(6
11.0
)20
0658
.843
,100
.562
2.5
35,9
15.7
10,8
57.7
47,3
95.9
573.
52,
716.
393
,845
.0(7
54.1
)20
0744
.945
,384
.112
2.1
41,1
60.7
21,2
57.5
62,5
40.2
595.
699
5.5
109,
560.
3(6
67.6
)20
0846
.942
,557
.368
1.2
15,5
53.4
52,3
97.6
68,6
32.2
330.
82,
859.
911
4,42
7.1
(703
.8)
2009
49.9
47,0
60.3
240.
115
,643
.623
,638
.039
,521
.757
3.8
1,82
6.5
89,0
32.2
(681
.9)
201
0R
63.5
37,5
55.7
203.
510
,481
.631
,913
.042
,598
.1(2
,528
.9)
6,39
7.8
84,0
86.3
(705
.8)
2009
QT
R. I
43.9
37,4
84.1
659.
916
,518
.724
,552
.041
,730
.662
.54,
003.
383
,324
.4(6
65.8
)Q
TR
. II
43.9
42,4
48.4
705.
816
,238
.822
,933
.239
,877
.849
1.7
3,08
1.2
85,9
43.0
(828
.5)
QT
R. I
II43
.543
,023
.869
0.2
14,5
81.4
27,1
78.5
42,4
50.1
486.
02,
597.
288
,600
.6(7
96.8
)Q
TR
. IV
49.9
47,0
60.3
240.
115
,643
.623
,638
.039
,521
.757
3.8
1,82
6.5
89,0
32.2
(681
.9)
2010
Jan.
45.4
42,0
63.0
264.
813
,378
.726
,402
.940
,046
.455
1.3
2,11
0.9
84,8
17.0
(673
.6)
Feb
.42
.840
,369
.523
8.7
13,3
83.0
26,8
20.1
40,4
41.8
582.
52,
441.
083
,877
.6(6
35.0
)M
ar.
66.0
38,5
93.8
287.
117
,037
.620
,773
.938
,098
.61,
057.
02,
596.
480
,411
.8(6
40.2
)A
pr.
71.2
39,2
55.8
283.
411
,253
.426
,321
.037
,857
.81,
078.
02,
588.
580
,851
.3(6
76.1
)M
ay42
.138
,917
.327
6.0
10,5
46.2
31,4
90.2
42,3
12.4
428.
82,
746.
784
,447
.3(6
19.2
)Ju
n.31
.337
,598
.729
1.1
11,1
59.9
39,1
34.3
50,5
85.3
571.
13,
311.
492
,097
.8(6
12.1
)Ju
l.30
.736
,913
.524
3.1
10,0
12.7
31,2
67.0
41,5
22.8
572.
54,
064.
783
,104
.2(6
34.0
)A
ug.
33.8
37,4
32.6
222.
415
,912
.624
,684
.040
,819
.058
3.4
4,73
1.6
83,6
00.4
(739
.0)
Sep
.38
.437
,228
.026
9.0
12,2
56.3
26,2
53.5
38,7
78.8
515.
94,
793.
581
,354
.6(7
93.4
)O
ct.
35.8
37,4
70.6
263.
811
,017
.629
,087
.640
,369
.0(2
,590
.8)
8,21
6.9
83,5
01.5
(764
.6)
Nov
.63
.736
,494
.020
3.4
9,60
8.2
28,9
74.2
38,7
85.8
(2,5
18.4
)6,
790.
779
,615
.8(7
79.7
) D
ec.R
63.5
37,5
55.7
203.
510
,481
.631
,913
.042
,598
.1(2
,528
.9)
6,39
7.8
84,0
86.3
(705
.8)
2011
Jan.
64.5
35,1
81.5
222.
213
,158
.528
,975
.942
,356
.6(2
,489
.2)
6,06
4.2
81,1
77.6
(688
.4)
Feb
.72
.140
,939
.558
9.9
15,5
38.8
21,3
24.6
37,4
53.4
(2,6
41.1
)5,
805.
381
,629
.1(6
93.9
)M
ar.
68.9
39,6
75.5
546.
730
,024
.316
,830
.947
,402
.0(2
,570
.1)
5,65
0.8
90,2
27.1
(663
.1)
S
OU
RC
E:
The
Cen
tral
Ba
nk o
f The
Ba
ham
as
*S
ee n
otes
to t
able
.
NO
NR
ES
IDE
NT
DE
PO
SIT
S
(B$
Mill
ions
)
13
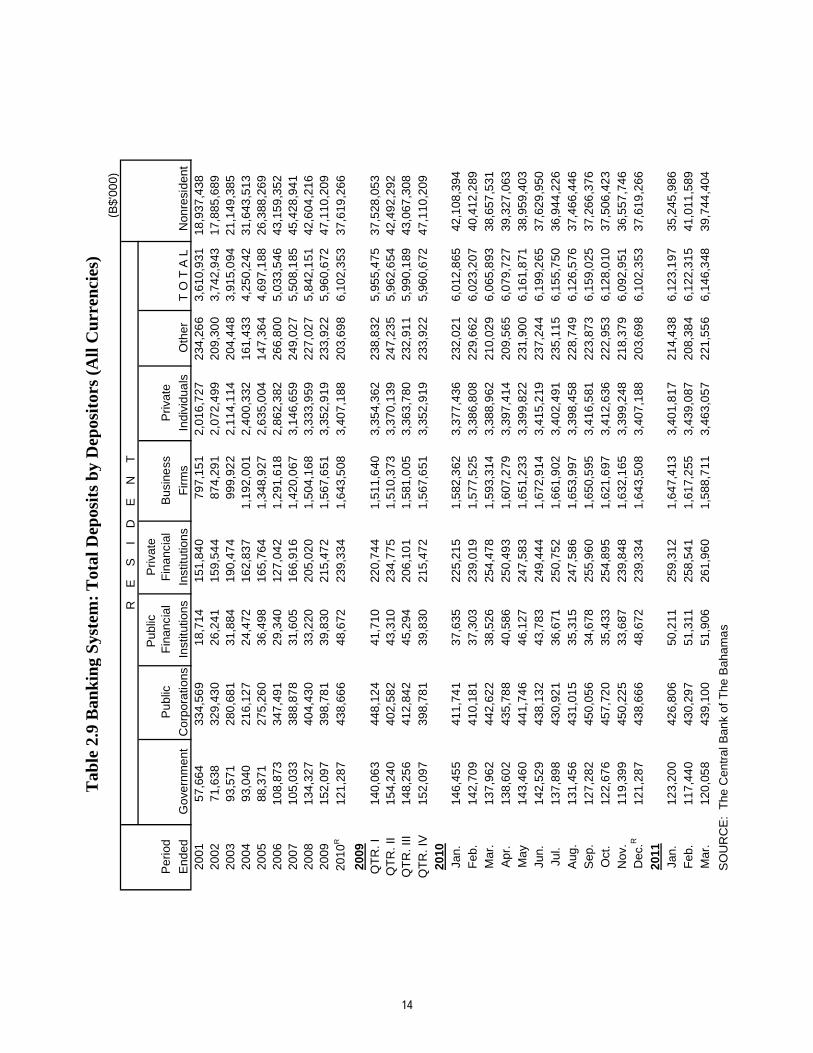
(B
$'00
0)
R
E
S
I
D
E
N
T
Pub
lic
Priv
ate
Per
iod
Pub
licF
inan
cial
Fin
anci
alB
usin
ess
Priv
ate
End
edG
over
nmen
tC
orpo
ratio
nsIn
stitu
tions
Inst
itutio
nsF
irms
Indi
vidu
als
Oth
erT
O T
A L
Non
resi
dent
2001
57,6
6433
4,56
918
,714
151,
840
797,
151
2,01
6,7
2723
4,26
63,
610,
931
18,9
37,4
3820
0271
,638
329,
430
26,2
4115
9,54
487
4,29
12,
072,
499
209,
300
3,74
2,9
4317
,885
,689
2003
93,5
7128
0,68
131
,884
190,
474
999,
922
2,11
4,1
1420
4,44
83,
915,
094
21,1
49,3
8520
0493
,040
216,
127
24,4
7216
2,83
71,
192,
001
2,40
0,3
3216
1,43
34,
250,
242
31,6
43,5
1320
0588
,371
275,
260
36,4
9816
5,76
41,
348,
927
2,63
5,0
0414
7,36
44,
697,
188
26,3
88,2
6920
0610
8,87
334
7,49
129
,340
127,
042
1,29
1,6
182,
862,
382
266,
800
5,03
3,5
4643
,159
,352
2007
105,
033
388,
878
31,6
0516
6,91
61,
420,
067
3,14
6,6
5924
9,02
75,
508,
185
45,4
28,9
4120
0813
4,32
740
4,43
033
,220
205,
020
1,50
4,1
683,
333,
959
227,
027
5,84
2,1
5142
,604
,216
2009
152,
097
398,
781
39,8
3021
5,47
21,
567,
651
3,35
2,9
1923
3,92
25,
960,
672
47,1
10,2
09 2
010
R12
1,28
743
8,66
648
,672
239,
334
1,64
3,5
083,
407,
188
203,
698
6,10
2,3
5337
,619
,266
2009
QT
R. I
140,
063
448,
124
41,7
1022
0,74
41,
511,
640
3,35
4,3
6223
8,83
25,
955,
475
37,5
28,0
53Q
TR
. II
154,
240
402,
582
43,3
1023
4,77
51,
510,
373
3,37
0,1
3924
7,23
55,
962,
654
42,4
92,2
92Q
TR
. III
148,
256
412,
842
45,2
9420
6,10
11,
581,
005
3,36
3,7
8023
2,91
15,
990,
189
43,0
67,3
08Q
TR
. IV
152,
097
398,
781
39,8
3021
5,47
21,
567,
651
3,35
2,9
1923
3,92
25,
960,
672
47,1
10,2
0920
10Ja
n.14
6,45
541
1,74
137
,635
225,
215
1,58
2,3
623,
377,
436
232,
021
6,01
2,8
6542
,108
,394
Feb
.14
2,70
941
0,18
137
,303
239,
019
1,57
7,5
253,
386,
808
229,
662
6,02
3,2
0740
,412
,289
Mar
.13
7,96
244
2,62
238
,526
254,
478
1,59
3,3
143,
388,
962
210,
029
6,06
5,8
9338
,657
,531
Apr
.13
8,60
243
5,78
840
,586
250,
493
1,60
7,2
793,
397,
414
209,
565
6,07
9,7
2739
,327
,063
May
143,
460
441,
746
46,1
2724
7,58
31,
651,
233
3,39
9,8
2223
1,90
06,
161,
871
38,9
59,4
03Ju
n.14
2,52
943
8,13
243
,783
249,
444
1,67
2,9
143,
415,
219
237,
244
6,19
9,2
6537
,629
,950
Jul.
137,
898
430,
921
36,6
7125
0,75
21,
661,
902
3,40
2,4
9123
5,11
56,
155,
750
36,9
44,2
26A
ug.
131,
456
431,
015
35,3
1524
7,58
61,
653,
997
3,39
8,4
5822
8,74
96,
126,
576
37,4
66,4
46S
ep.
127,
282
450,
056
34,6
7825
5,96
01,
650,
595
3,41
6,5
8122
3,87
36,
159,
025
37,2
66,3
76O
ct.
122,
676
457,
720
35,4
3325
4,89
51,
621,
697
3,41
2,6
3622
2,95
36,
128,
010
37,5
06,4
23N
ov.
119,
399
450,
225
33,6
8723
9,84
81,
632,
165
3,39
9,2
4821
8,37
96,
092,
951
36,5
57,7
46 D
ec.R
121,
287
438,
666
48,6
7223
9,33
41,
643,
508
3,40
7,1
8820
3,69
86,
102,
353
37,6
19,2
6620
11Ja
n.12
3,20
042
6,80
650
,211
259,
312
1,64
7,4
133,
401,
817
214,
438
6,12
3,1
9735
,245
,986
Feb
.11
7,44
043
0,29
751
,311
258,
541
1,61
7,2
553,
439,
087
208,
384
6,12
2,3
1541
,011
,589
Mar
.12
0,05
843
9,10
051
,906
261,
960
1,58
8,7
113,
463,
057
221,
556
6,14
6,3
4839
,744
,404
S
OU
RC
E:
The
Cen
tral
Ban
k of
The
Bah
ama
s
Tab
le 2
.9 B
ank
ing
Sys
tem
: T
otal
Dep
osit
s b
y D
epos
itor
s (A
ll C
urr
enci
es)
14
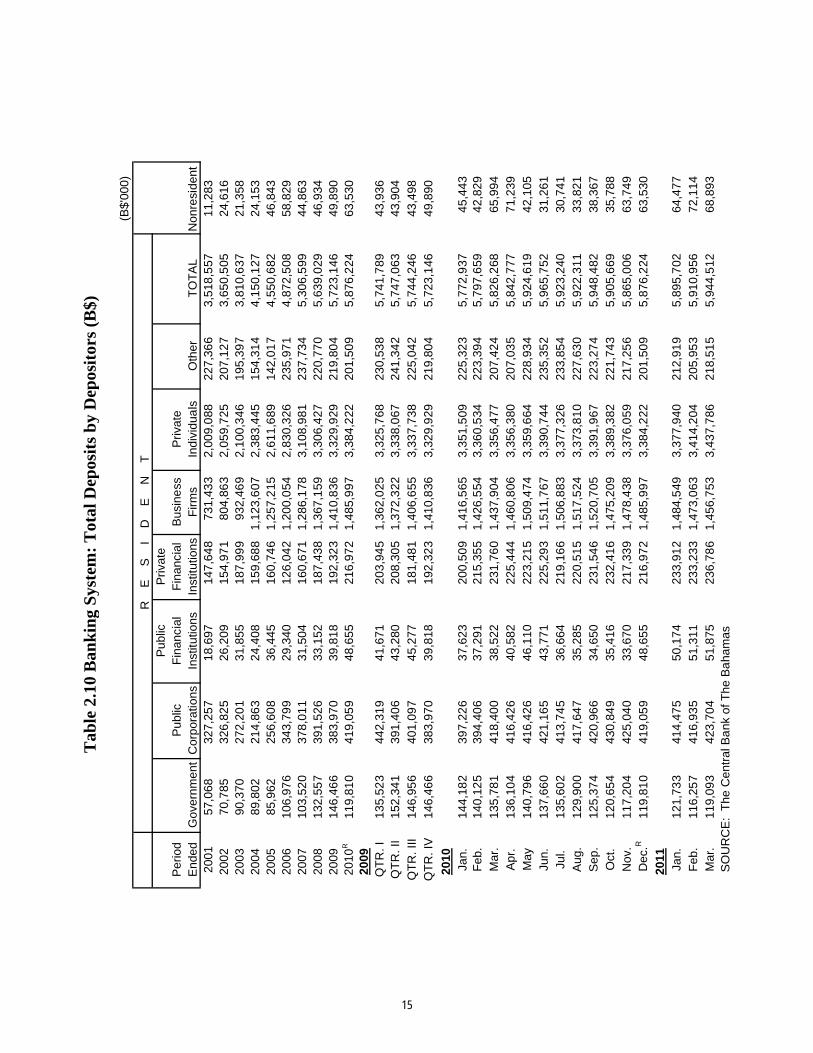
(B
$'00
0)
Pub
licP
rivat
eP
erio
dP
ublic
Fin
anci
alF
inan
cial
Bus
ine
ssP
rivat
eE
nded
Gov
ernm
ent
Cor
pora
tions
Inst
itutio
nsIn
stitu
tions
Firm
sIn
divi
dua
lsO
ther
TO
TA
LN
onre
side
nt20
0157
,068
327,
257
18,6
9714
7,64
873
1,43
32,
009,
088
227,
366
3,51
8,5
5711
,283
2002
70,7
8532
6,82
526
,209
154,
971
804,
863
2,05
9,7
2520
7,12
73,
650,
505
24,6
1620
0390
,370
272,
201
31,8
5518
7,99
993
2,46
92,
100,
346
195,
397
3,81
0,6
3721
,358
2004
89,8
0221
4,86
324
,408
159,
688
1,12
3,6
072,
383,
445
154,
314
4,15
0,1
2724
,153
2005
85,9
6225
6,60
836
,445
160,
746
1,25
7,2
152,
611,
689
142,
017
4,55
0,6
8246
,843
2006
106,
976
343,
799
29,3
4012
6,04
21,
200,
054
2,83
0,3
2623
5,97
14,
872,
508
58,8
2920
0710
3,52
037
8,01
131
,504
160,
671
1,28
6,1
783,
108,
981
237,
734
5,30
6,5
9944
,863
2008
132,
557
391,
526
33,1
5218
7,43
81,
367,
159
3,30
6,4
2722
0,77
05,
639,
029
46,9
3420
0914
6,46
638
3,97
039
,818
192,
323
1,41
0,8
363,
329,
929
219,
804
5,72
3,1
4649
,890
2010
R11
9,81
041
9,05
948
,655
216,
972
1,48
5,9
973,
384,
222
201,
509
5,87
6,2
2463
,530
2009
QT
R. I
135,
523
442,
319
41,6
7120
3,94
51,
362,
025
3,32
5,7
6823
0,53
85,
741,
789
43,9
36Q
TR
. II
152,
341
391,
406
43,2
8020
8,30
51,
372,
322
3,33
8,0
6724
1,34
25,
747,
063
43,9
04Q
TR
. III
146,
956
401,
097
45,2
7718
1,48
11,
406,
655
3,33
7,7
3822
5,04
25,
744,
246
43,4
98Q
TR
. IV
146,
466
383,
970
39,8
1819
2,32
31,
410,
836
3,32
9,9
2921
9,80
45,
723,
146
49,8
90
2010
Jan.
144,
182
397,
226
37,6
2320
0,50
91,
416,
565
3,35
1,5
0922
5,32
35,
772,
937
45,4
43F
eb.
140,
125
394,
406
37,2
9121
5,35
51,
426,
554
3,36
0,5
3422
3,39
45,
797,
659
42,8
29M
ar.
135,
781
418,
400
38,5
2223
1,76
01,
437,
904
3,35
6,4
7720
7,42
45,
826,
268
65,9
94A
pr.
136,
104
416,
426
40,5
8222
5,44
41,
460,
806
3,35
6,3
8020
7,03
55,
842,
777
71,2
39M
ay14
0,79
641
6,42
646
,110
223,
215
1,50
9,4
743,
359,
664
228,
934
5,92
4,6
1942
,105
Jun.
137,
660
421,
165
43,7
7122
5,29
31,
511,
767
3,39
0,7
4423
5,35
25,
965,
752
31,2
61Ju
l.13
5,60
241
3,74
536
,664
219,
166
1,50
6,8
833,
377,
326
233,
854
5,92
3,2
4030
,741
Aug
.12
9,90
041
7,64
735
,285
220,
515
1,51
7,5
243,
373,
810
227,
630
5,92
2,3
1133
,821
Sep
.12
5,37
442
0,96
634
,650
231,
546
1,52
0,7
053,
391,
967
223,
274
5,94
8,4
8238
,367
Oct
.12
0,65
443
0,84
935
,416
232,
416
1,47
5,2
093,
389,
382
221,
743
5,90
5,6
6935
,788
Nov
.11
7,20
442
5,04
033
,670
217,
339
1,47
8,4
383,
376,
059
217,
256
5,86
5,0
0663
,749
Dec
.R11
9,81
041
9,05
948
,655
216,
972
1,48
5,9
973,
384,
222
201,
509
5,87
6,2
2463
,530
2011
Jan.
121,
733
414,
475
50,1
7423
3,91
21,
484,
549
3,37
7,9
4021
2,91
95,
895,
702
64,4
77F
eb.
116,
257
416,
935
51,3
1123
3,23
31,
473,
063
3,41
4,2
0420
5,95
35,
910,
956
72,1
14M
ar.
119,
093
423,
704
51,8
7523
6,78
61,
456,
753
3,43
7,7
8621
8,51
55,
944,
512
68,8
93
SO
UR
CE
: T
he C
entr
al B
ank
of T
he B
aha
mas
Tab
le 2
.10
Ban
kin
g S
yste
m:
Tot
al D
epos
its
by
Dep
osit
ors
(B$)
R
E
S
I
D
E
N
T
15
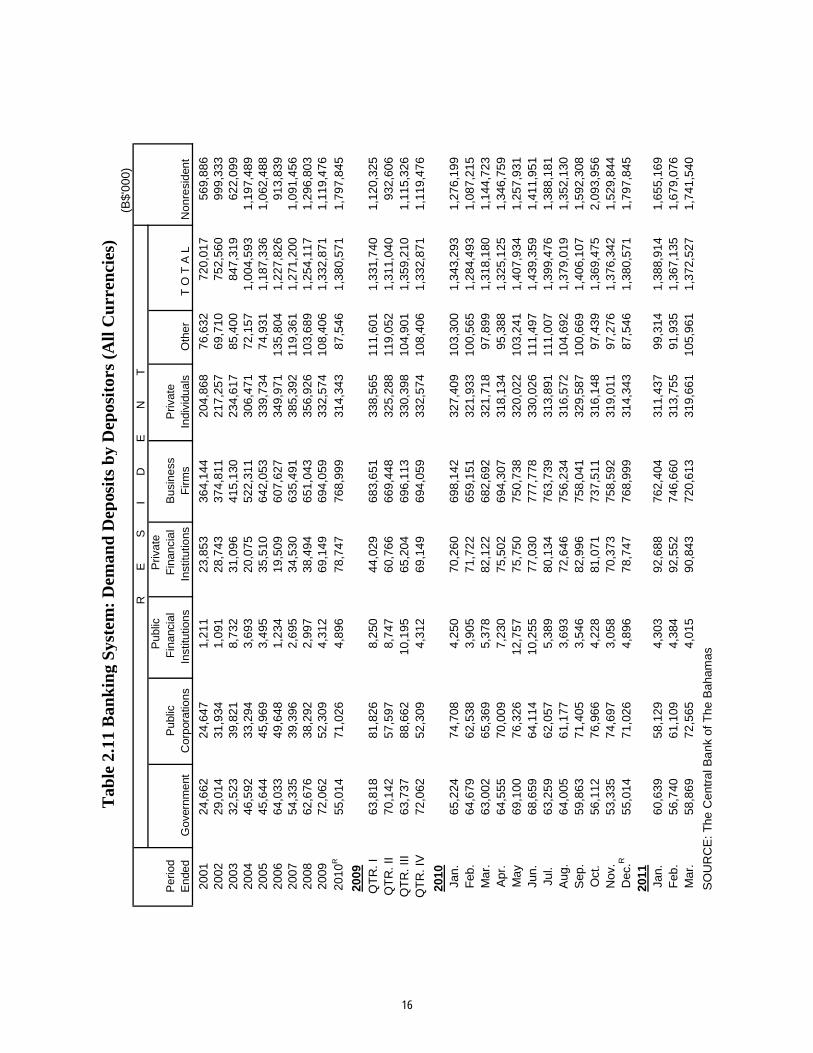
(B
$'00
0)
R
E
S
I
D
E
N
T
Pub
lic
Priv
ate
Per
iod
Pub
lic F
inan
cial
F
inan
cial
Bus
ines
sP
rivat
eE
nded
Gov
ernm
ent
Cor
pora
tions
Inst
itutio
ns
Inst
itutio
nsF
irms
Indi
vidu
als
Oth
erT
O T
A L
Non
resi
dent
2001
24,6
6224
,647
1,21
123
,853
364,
144
204,
868
76,6
3272
0,01
756
9,88
620
0229
,014
31,9
341,
091
28,7
4337
4,81
121
7,25
769
,710
752,
560
999,
333
2003
32,5
2339
,821
8,73
231
,096
415,
130
234,
617
85,4
0084
7,31
962
2,09
920
0446
,592
33,2
943,
693
20,0
7552
2,31
130
6,47
172
,157
1,00
4,59
31,
197,
489
2005
45,6
4445
,969
3,49
535
,510
642,
053
339,
734
74,9
311,
187,
336
1,06
2,48
820
0664
,033
49,6
481,
234
19,5
0960
7,62
734
9,97
113
5,80
41,
227,
826
913,
839
2007
54,3
3539
,396
2,69
534
,530
635,
491
385,
392
119,
361
1,27
1,20
01,
091,
456
2008
62,6
7638
,292
2,99
738
,494
651,
043
356,
926
103,
689
1,25
4,11
71,
296,
803
2009
72,0
6252
,309
4,31
269
,149
694,
059
332,
574
108,
406
1,33
2,87
11,
119,
476
201
0R
55,0
1471
,026
4,89
678
,747
768,
999
314,
343
87,5
461,
380,
571
1,79
7,84
5
2009
QT
R. I
63,8
1881
,826
8,25
044
,029
683,
651
338,
565
111,
601
1,33
1,74
01,
120,
325
Tab
le 2
.11
Ban
kin
g S
yste
m:
Dem
and
Dep
osit
s b
y D
epos
itor
s (A
ll C
urr
enci
es)
QT
R. I
63,8
1881
,826
8,25
044
,029
683,
651
338,
565
111,
601
1,33
1,74
01,
120,
325
QT
R. I
I70
,142
57,5
978,
747
60,7
6666
9,44
832
5,28
811
9,05
21,
311,
040
932,
606
QT
R. I
II63
,737
88,6
6210
,195
65,2
0469
6,11
333
0,39
810
4,90
11,
359,
210
1,11
5,32
6Q
TR
. IV
72,0
6252
,309
4,31
269
,149
694,
059
332,
574
108,
406
1,33
2,87
11,
119,
476
2010
Jan.
65,2
2474
,708
4,25
070
,260
698,
142
327,
409
103,
300
1,34
3,29
31,
276,
199
Feb
.64
,679
62,5
383,
905
71,7
2265
9,15
132
1,93
310
0,56
51,
284,
493
1,08
7,21
5M
ar.
63,0
0265
,369
5,37
882
,122
682,
692
321,
718
97,8
991,
318,
180
1,14
4,72
3A
pr.
64,5
5570
,009
7,23
075
,502
694,
307
318,
134
95,3
881,
325,
125
1,34
6,75
9M
ay69
,100
76,3
2612
,757
75,7
5075
0,73
832
0,02
210
3,24
11,
407,
934
1,25
7,93
1Ju
n.68
,659
64,1
1410
,255
77,0
3077
7,77
833
0,02
611
1,49
71,
439,
359
1,41
1,95
1Ju
l.63
,259
62,0
575,
389
80,1
3476
3,73
931
3,89
111
1,00
71,
399,
476
1,38
8,18
1A
ug.
64,0
0561
,177
3,69
372
,646
756,
234
316,
572
104,
692
1,37
9,01
91,
352,
130
Sep
.59
,863
71,4
053,
546
82,9
9675
8,04
132
9,58
710
0,66
91,
406,
107
1,59
2,30
8O
ct.
56,1
1276
,966
4,22
881
,071
737,
511
316,
148
97,4
391,
369,
475
2,09
3,95
6N
ov.
53,3
3574
,697
3,05
870
,373
758,
592
319,
011
97,2
761,
376,
342
1,52
9,84
4 D
ec.R
55
,014
71,0
264,
896
78,7
4776
8,99
931
4,34
387
,546
1,38
0,57
11,
797,
845
2011
Jan.
60,6
3958
,129
4,30
392
,688
762,
404
311,
437
99,3
141,
388,
914
1,65
5,16
9F
eb.
56,7
4061
,109
4,38
492
,552
746,
660
313,
755
91,9
351,
367,
135
1,67
9,07
6M
ar.
58,8
6972
,565
4,01
590
,843
720,
613
319,
661
105,
961
1,37
2,52
71,
741,
540
S
OU
RC
E: T
he C
entr
al B
ank
of T
he B
aham
as
16
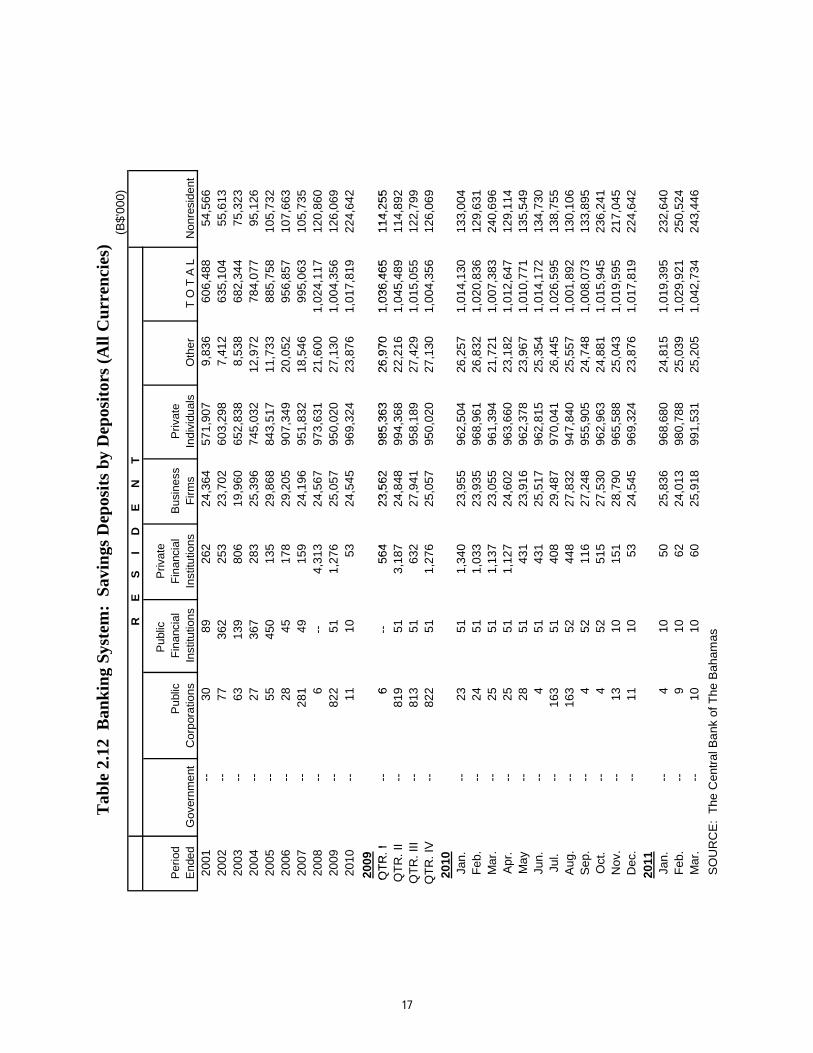
(B
$'00
0)
Pub
lic
Priv
ate
Per
iod
Pub
licF
inan
cial
Fin
anci
alB
usin
ess
Priv
ate
End
edC
orpo
ratio
nsIn
stitu
tions
Inst
itutio
nsF
irms
Indi
vidu
als
Oth
erT
O T
A L
Non
resi
dent
2001
--30
8926
224
,364
571,
907
9,83
660
6,48
854
,566
2002
--77
362
253
23,7
0260
3,29
87,
412
635,
104
55,6
1320
03
--
6313
980
619
,960
652,
838
8,53
868
2,34
475
,323
2004
--27
367
283
25,3
9674
5,03
212
,972
784,
077
95,1
2620
05
--
5545
013
529
,868
843,
517
11,7
3388
5,75
810
5,73
220
06
--
2845
178
29,2
0590
7,34
920
,052
956,
857
107,
663
2007
--28
149
159
24,1
9695
1,83
218
,546
995,
063
105,
735
2008
--6
--
4,31
324
,567
973,
631
21,6
001,
024,
117
120,
860
2009
--82
251
1,27
625
,057
950,
020
27,1
301,
004,
356
126,
069
2010
--11
1053
24,5
4596
9,32
423
,876
1,01
7,81
922
4,64
2
2009
QT
R. I
--6
-
-56
423
,562
985,
363
26,9
701,
036,
465
114,
255
Tab
le 2
.12
Ban
kin
g Sy
stem
: S
avin
gs D
epos
its
by D
epos
itor
s (A
ll C
urr
enci
es)
Gov
ernm
ent
R
E
S
I
D
E
N
T
QT
R. I
--6
-
-56
423
,562
985,
363
26,9
701,
036,
465
114,
255
QT
R. I
I
--
819
513,
187
24,8
4899
4,36
822
,216
1,04
5,48
911
4,89
2Q
TR
. III
--81
351
632
27,9
4195
8,18
927
,429
1,01
5,05
512
2,79
9Q
TR
. IV
--82
251
1,27
625
,057
950,
020
27,1
301,
004,
356
126,
069
2010
Jan.
--23
511,
340
23,9
5596
2,50
426
,257
1,01
4,13
013
3,00
4F
eb.
--24
511,
033
23,9
3596
8,96
126
,832
1,02
0,83
612
9,63
1M
ar.
--25
511,
137
23,0
5596
1,39
421
,721
1,00
7,38
324
0,69
6A
pr.
--25
511,
127
24,6
0296
3,66
023
,182
1,01
2,64
712
9,11
4M
ay
--
2851
431
23,9
1696
2,37
823
,967
1,01
0,77
113
5,54
9Ju
n.
--
451
431
25,5
1796
2,81
525
,354
1,01
4,17
213
4,73
0Ju
l.
--
163
5140
829
,487
970,
041
26,4
451,
026,
595
138,
755
Aug
.
--
163
5244
827
,832
947,
840
25,5
571,
001,
892
130,
106
Sep
.
--
452
116
27,2
4895
5,90
524
,748
1,00
8,07
313
3,89
5O
ct.
--4
5251
527
,530
962,
963
24,8
811,
015,
945
236,
241
Nov
.
--
1310
151
28,7
9096
5,58
825
,043
1,01
9,59
521
7,04
5D
ec.
--11
1053
24,5
4596
9,32
423
,876
1,01
7,81
922
4,64
220
11Ja
n.
--
410
5025
,836
968,
680
24,8
151,
019,
395
232,
640
Feb
.
--
910
6224
,013
980,
788
25,0
391,
029,
921
250,
524
Mar
.
--
1010
6025
,918
991,
531
25,2
051,
042,
734
243,
446
S
OU
RC
E:
The
Cen
tral
Ba
nk o
f The
Bah
amas
17
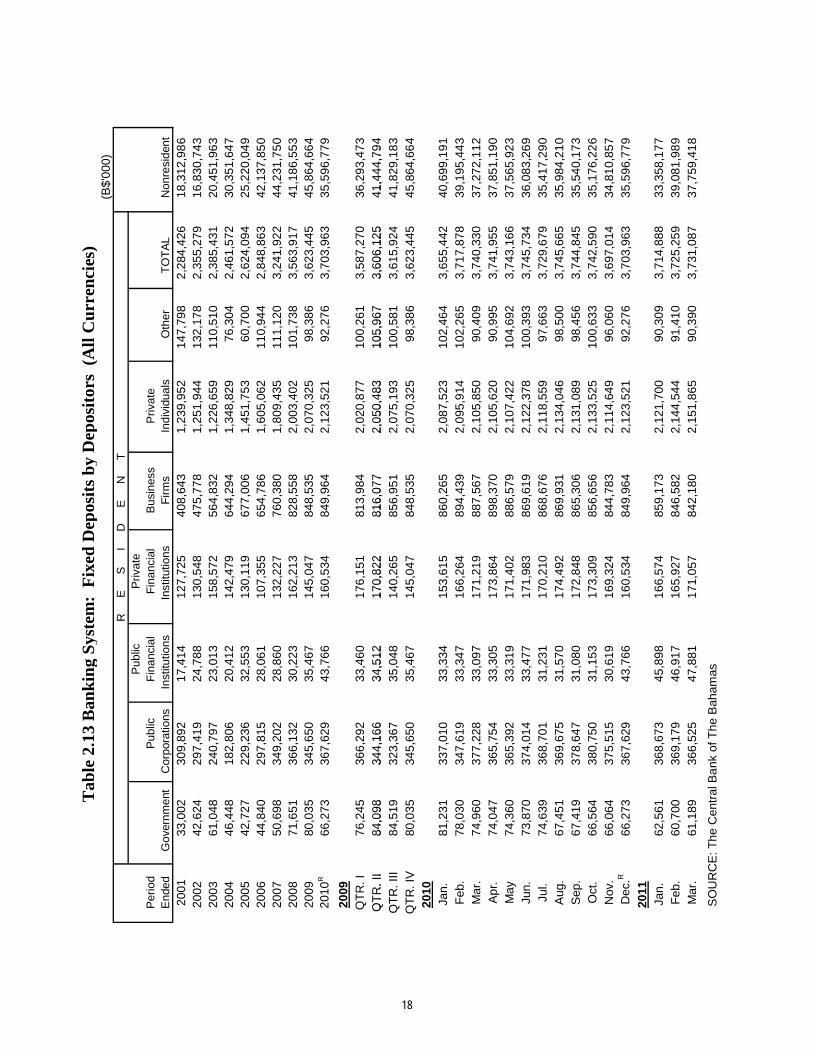
(B
$'00
0)R
E
S
I
D
E
N
T
P
ublic
Priv
ate
Per
iod
Fin
anci
al
Fin
anci
alB
usin
ess
Priv
ate
End
edIn
stitu
tions
Ins
titut
ions
Firm
sIn
divi
dual
sO
ther
TO
TA
L N
onre
side
nt
2001
33,0
0230
9,89
217
,414
127,
725
408,
643
1,23
9,95
214
7,79
82,
284,
426
18,3
12,9
86
2002
42,6
2429
7,41
924
,788
130,
548
475,
778
1,25
1,94
413
2,17
82,
355,
279
16,8
30,7
43
2003
61,0
4824
0,79
723
,013
158,
572
564,
832
1,22
6,65
911
0,51
02,
385,
431
20,4
51,9
63
2004
46,4
4818
2,80
620
,412
142,
479
644,
294
1,34
8,82
976
,304
2,46
1,57
230
,351
,64
720
0542
,727
229,
236
32,5
5313
0,11
967
7,00
61,
451,
753
60,7
002,
624,
094
25,2
20,0
49
2006
44,8
4029
7,81
528
,061
107,
355
654,
786
1,60
5,06
211
0,94
42,
848,
863
42,1
37,8
50
2007
50,6
9834
9,20
228
,860
132,
227
760,
380
1,80
9,43
511
1,12
03,
241,
922
44,2
31,7
50
2008
71,6
5136
6,13
230
,223
162,
213
828,
558
2,00
3,40
210
1,73
83,
563,
917
41,1
86,5
53
2009
80,0
3534
5,65
035
,467
145,
047
848,
535
2,07
0,32
598
,386
3,62
3,44
545
,864
,66
420
10R
66,2
7336
7,62
943
,766
160,
534
849,
964
2,12
3,52
192
,276
3,70
3,96
335
,596
,77
9
2009
QT
R. I
76,2
4536
6,29
233
,460
176,
151
813,
984
2,02
0,87
710
0,26
13,
587,
270
36,2
93,4
73
QT
R. I
I84
,098
344,
166
34,5
1217
0,82
281
6,07
72,
050,
483
105,
967
3,60
6,12
541
,444
,79
4
Tab
le 2
.13
Ban
kin
g S
yste
m:
Fix
ed D
epos
its
by
Dep
osit
ors
(A
ll C
urr
enci
es)
Gov
ernm
ent
P
ublic
Cor
pora
tions
QT
R. I
I84
,098
344,
166
34,5
1217
0,82
281
6,07
72,
050,
483
105,
967
3,60
6,12
541
,444
,79
4Q
TR
. III
84,5
1932
3,36
735
,048
140,
265
856,
951
2,07
5,19
310
0,58
13,
615,
924
41,8
29,1
83
QT
R. I
V80
,035
345,
650
35,4
6714
5,04
784
8,53
52,
070,
325
98,3
863,
623,
445
45,8
64,6
64
2010
Jan.
81
,231
337,
010
33,3
3415
3,61
586
0,26
52,
087,
523
102,
464
3,65
5,44
240
,699
,19
1F
eb.
78,0
3034
7,61
933
,347
166,
264
894,
439
2,09
5,91
410
2,26
53,
717,
878
39,1
95,4
43
Mar
.74
,960
377,
228
33,0
9717
1,21
988
7,56
72,
105,
850
90,4
093,
740,
330
37,2
72,1
12
Apr
.74
,047
365,
754
33,3
0517
3,86
489
8,37
02,
105,
620
90,9
953,
741,
955
37,8
51,1
90
May
74,3
6036
5,39
233
,319
171,
402
886,
579
2,10
7,42
210
4,69
23,
743,
166
37,5
65,9
23
Jun.
73,8
7037
4,01
433
,477
171,
983
869,
619
2,12
2,37
810
0,39
33,
745,
734
36,0
83,2
69
Jul.
74,6
3936
8,70
131
,231
170,
210
868,
676
2,11
8,55
997
,663
3,72
9,67
935
,417
,29
0A
ug.
67,4
5136
9,67
531
,570
174,
492
869,
931
2,13
4,04
698
,500
3,74
5,66
535
,984
,21
0S
ep.
67,4
1937
8,64
731
,080
172,
848
865,
306
2,13
1,08
998
,456
3,74
4,84
535
,540
,17
3O
ct.
66,5
6438
0,75
031
,153
173,
309
856,
656
2,13
3,52
510
0,63
33,
742,
590
35,1
76,2
26
Nov
.66
,064
375,
515
30,6
1916
9,32
484
4,78
32,
114,
649
96,0
603,
697,
014
34,8
10,8
57
Dec
.R66
,273
367,
629
43,7
6616
0,53
484
9,96
42,
123,
521
92,2
763,
703,
963
35,5
96,7
79
2011
Jan.
62
,561
368,
673
45,8
9816
6,57
485
9,17
32,
121,
700
90,3
093,
714,
888
33,3
58,1
77
Feb
.60
,700
369,
179
46,9
1716
5,92
784
6,58
22,
144,
544
91,4
103,
725,
259
39,0
81,9
89
Mar
.61
,189
366,
525
47,8
8117
1,05
784
2,18
02,
151,
865
90,3
903,
731,
087
37,7
59,4
18
S
OU
RC
E: T
he C
entr
al B
ank
of T
he B
aham
as
18
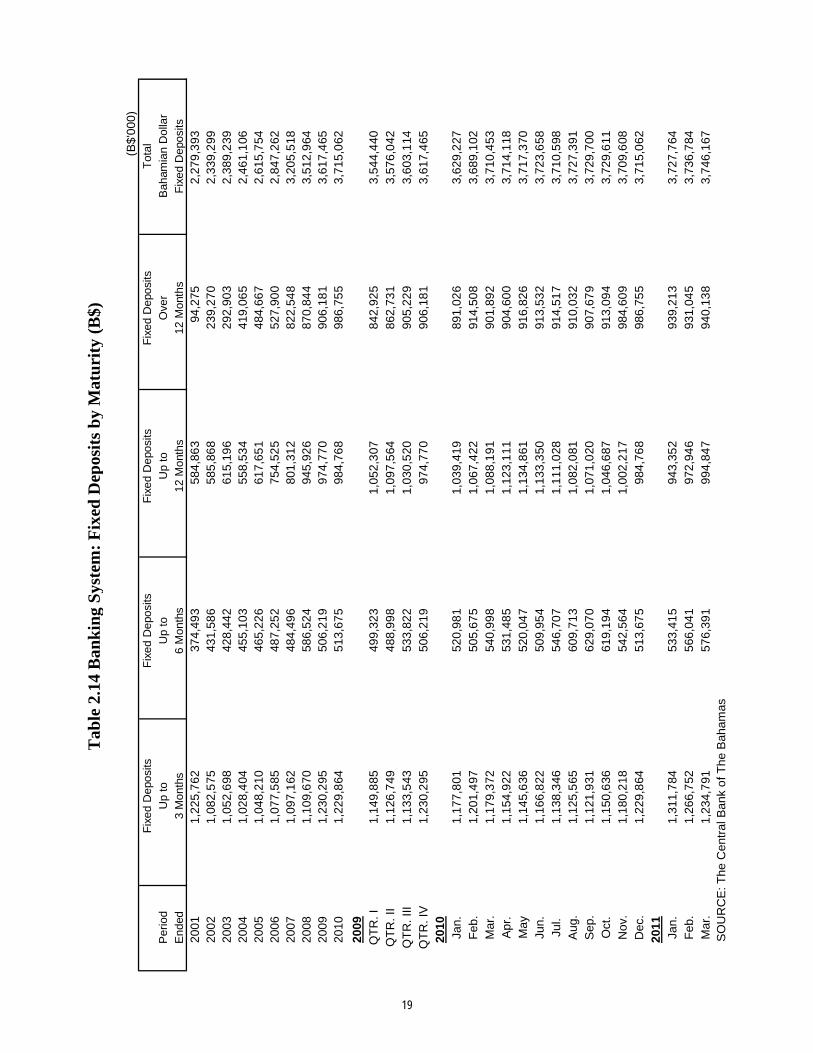
Tab
le 2
.14
Ban
kin
g S
yste
m:
Fix
ed D
epos
its
by
Mat
uri
ty (
B$)
(B$'
000)
Fix
ed D
epos
itsF
ixed
Dep
osits
Fix
ed D
epos
itsF
ixed
Dep
osits
Tot
al
Per
iod
Up
toU
p to
Up
toO
ver
Bah
amia
n D
olla
r
End
ed3
Mon
ths
6 M
onth
s12
Mon
ths
12 M
onth
sF
ixed
Dep
osits
2001
1,22
5,7
6237
4,49
358
4,86
394
,275
2,27
9,3
9320
021,
082,
575
431,
586
585,
868
239,
270
2,33
9,2
9920
031,
052,
698
428,
442
615,
196
292,
903
2,38
9,2
3920
041,
028,
404
455,
103
558,
534
419,
065
2,46
1,1
0620
051,
048,
210
465,
226
617,
651
484,
667
2,61
5,7
5420
061,
077,
585
487,
252
754,
525
527,
900
2,84
7,2
6220
071,
097,
162
484,
496
801,
312
822,
548
3,20
5,5
1820
081,
109,
670
586,
524
945,
926
870,
844
3,51
2,9
6420
091,
230,
295
506,
219
974,
770
906,
181
3,61
7,4
6520
101,
229,
864
513,
675
984,
768
986,
755
3,71
5,0
62
2009
QT
R. I
1,14
9,8
8549
9,32
31,
052,
307
842,
925
3,54
4,4
40Q
TR
. II
1,12
6,7
4948
8,99
81,
097,
564
862,
731
3,57
6,0
42Q
TR
. III
1,13
3,5
4353
3,82
21,
030,
520
905,
229
3,60
3,1
14Q
TR
. IV
1,23
0,2
9550
6,21
997
4,77
090
6,18
13,
617,
465
2010
Jan.
1,17
7,8
0152
0,98
11,
039,
419
891,
026
3,62
9,2
27F
eb.
1,20
1,4
9750
5,67
51,
067,
422
914,
508
3,68
9,1
02M
ar.
1,17
9,3
7254
0,99
81,
088,
191
901,
892
3,71
0,4
53A
pr.
1,15
4,9
2253
1,48
51,
123,
111
904,
600
3,71
4,1
18M
ay1,
145,
636
520,
047
1,13
4,8
6191
6,82
63,
717,
370
Jun.
1,16
6,8
2250
9,95
41,
133,
350
913,
532
3,72
3,6
58Ju
l.1,
138,
346
546,
707
1,11
1,0
2891
4,51
73,
710,
598
Aug
.1,
125,
565
609,
713
1,08
2,0
8191
0,03
23,
727,
391
Sep
.1,
121,
931
629,
070
1,07
1,0
2090
7,67
93,
729,
700
Oct
.1,
150,
636
619,
194
1,04
6,6
8791
3,09
43,
729,
611
Nov
.1,
180,
218
542,
564
1,00
2,2
1798
4,60
93,
709,
608
Dec
.1,
229,
864
513,
675
984,
768
986,
755
3,71
5,0
6220
11Ja
n.1,
311,
784
533,
415
943,
352
939,
213
3,72
7,7
64F
eb.
1,26
6,7
5256
6,04
197
2,94
693
1,04
53,
736,
784
Mar
.1,
234,
791
576,
391
994,
847
940,
138
3,74
6,1
67
S
OU
RC
E: T
he C
entr
al B
ank
of T
he B
aham
as
19
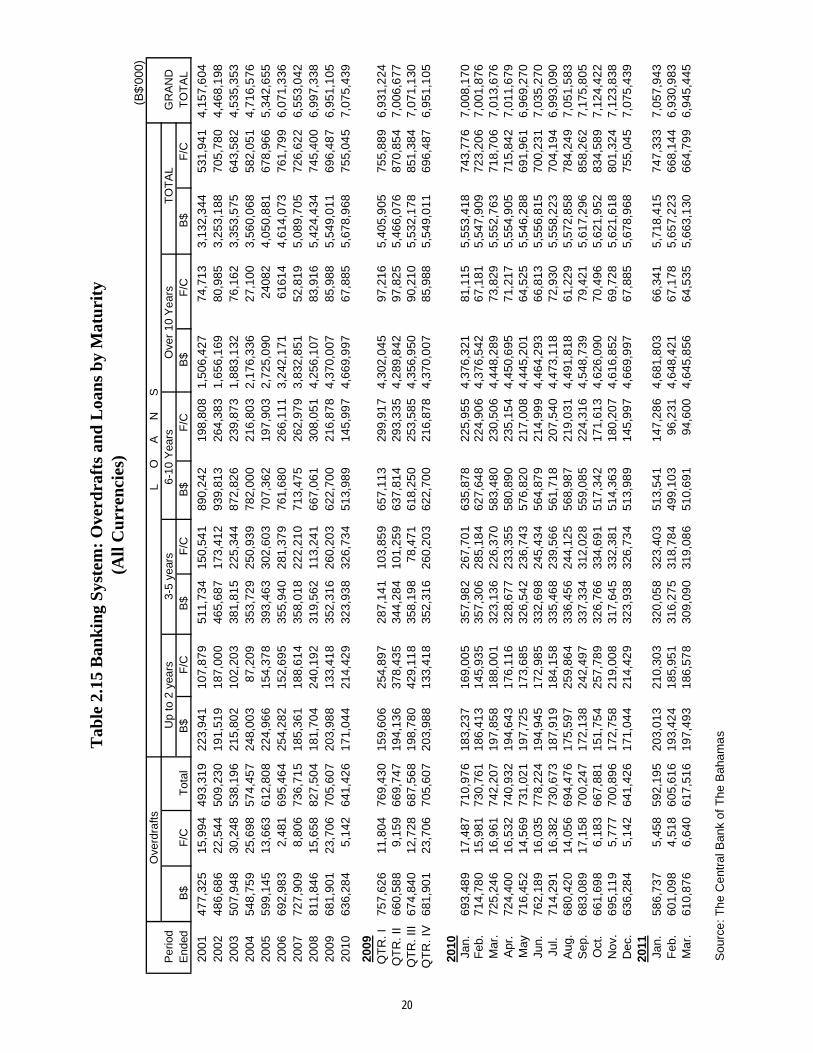
(B$'
000)
Ove
rdra
ftsL
O
A
N
S
Per
iod
Up
to 2
yea
rs3-
5 ye
ars
6-10
Yea
rsO
ver
10 Y
ears
TO
TA
L G
RA
ND
End
edB
$F
/CT
otal
B$
F/C
B$
F/C
B$
F/C
B$
F/C
B$
F/C
TO
TA
L
2001
477,
325
15,9
9449
3,31
922
3,94
110
7,87
951
1,73
415
0,54
189
0,24
219
8,80
81,
506,
427
74,7
133,
132,
344
531,
941
4,15
7,6
0420
0248
6,68
622
,544
509,
230
191,
519
187,
000
465,
687
173,
412
939,
813
264,
383
1,65
6,1
6980
,985
3,25
3,1
8870
5,78
04,
468,
198
2003
507,
948
30,2
4853
8,19
621
5,80
210
2,20
338
1,81
522
5,34
487
2,82
623
9,87
31,
883,
132
76,1
623,
353,
575
643,
582
4,53
5,3
5320
0454
8,75
925
,698
574,
457
248,
003
87,2
0935
3,72
925
0,93
978
2,00
021
6,80
32,
176,
336
27,1
003,
560,
068
582,
051
4,71
6,5
7620
0559
9,14
513
,663
612,
808
224,
966
154,
378
393,
463
302,
603
707,
362
197,
903
2,72
5,0
9024
082
4,05
0,8
8167
8,96
65,
342,
655
2006
692,
983
2,48
169
5,46
425
4,28
215
2,69
535
5,94
028
1,37
976
1,68
026
6,11
13,
242,
171
6161
44,
614,
073
761,
799
6,07
1,3
3620
0772
7,90
98,
806
736,
715
185,
361
188,
614
358,
018
222,
210
713,
475
262,
979
3,83
2,8
5152
,819
5,08
9,7
0572
6,62
26,
553,
042
2008
811,
846
15,6
5882
7,50
418
1,70
424
0,19
231
9,56
211
3,24
166
7,06
130
8,05
14,
256,
107
83,9
165,
424,
434
745,
400
6,99
7,3
3820
0968
1,90
123
,706
705,
607
203,
988
133,
418
352,
316
260,
203
622,
700
216,
878
4,37
0,0
0785
,988
5,54
9,0
1169
6,48
76,
951,
105
2010
636,
284
5,14
264
1,42
617
1,04
421
4,42
932
3,93
832
6,73
451
3,98
914
5,99
74,
669,
997
67,8
855,
678,
968
755,
045
7,07
5,4
39
2009
QT
R. I
757,
626
11,8
0476
9,43
015
9,60
625
4,89
728
7,14
110
3,85
965
7,11
329
9,91
74,
302,
045
97,2
165,
405,
905
755,
889
6,93
1,2
24Q
TR
. II
660,
588
9,15
966
9,74
719
4,13
637
8,43
534
4,28
410
1,25
963
7,81
429
3,33
54,
289,
842
97,8
255,
466,
076
870,
854
7,00
6,6
77Q
TR
. III
674,
840
12,7
2868
7,56
819
8,78
042
9,11
835
8,19
878
,471
618,
250
253,
585
4,35
6,9
5090
,210
5,53
2,1
7885
1,38
47,
071,
130
QT
R. I
V68
1,90
123
,706
705,
607
203,
988
133,
418
352,
316
260,
203
622,
700
216,
878
4,37
0,0
0785
,988
5,54
9,0
1169
6,48
76,
951,
105
2010
Jan.
693,
489
17,4
8771
0,97
618
3,23
716
9,00
535
7,98
226
7,70
163
5,87
822
5,95
54,
376,
321
81,1
155,
553,
418
743,
776
7,00
8,1
70F
eb.
714,
780
15,9
8173
0,76
118
6,41
314
5,93
535
7,30
628
5,18
462
7,64
822
4,90
64,
376,
542
67,1
815,
547,
909
723,
206
7,00
1,8
76M
ar.
725,
246
16,9
6174
2,20
719
7,85
818
8,00
132
3,13
622
6,37
058
3,48
023
0,50
64,
448,
289
73,8
295,
552,
763
718,
706
7,01
3,6
76A
pr.
724,
400
16,5
3274
0,93
219
4,64
317
6,11
632
8,67
723
3,35
558
0,89
023
5,15
44,
450,
695
71,2
175,
554,
905
715,
842
7,01
1,6
79M
ay71
6,45
214
,569
731,
021
197,
725
173,
685
326,
542
236,
743
576,
820
217,
008
4,44
5,2
0164
,525
5,54
6,2
8869
1,96
16,
969,
270
Jun.
762,
189
16,0
3577
8,22
419
4,94
517
2,98
533
2,69
824
5,43
456
4,87
921
4,99
94,
464,
293
66,8
135,
556,
815
700,
231
7,03
5,2
70Ju
l.71
4,29
116
,382
730,
673
187,
919
184,
158
335,
468
239,
566
561,
718
207,
540
4,47
3,1
1872
,930
5,55
8,2
2370
4,19
46,
993,
090
Aug
.68
0,42
014
,056
694,
476
175,
597
259,
864
336,
456
244,
125
568,
987
219,
031
4,49
1,8
1861
,229
5,57
2,8
5878
4,24
97,
051,
583
Sep
.68
3,08
917
,158
700,
247
172,
138
242,
497
337,
334
312,
028
559,
085
224,
316
4,54
8,7
3979
,421
5,61
7,2
9685
8,26
27,
175,
805
Oct
.66
1,69
86,
183
667,
881
151,
754
257,
789
326,
766
334,
691
517,
342
171,
613
4,62
6,0
9070
,496
5,62
1,9
5283
4,58
97,
124,
422
Nov
.69
5,11
95,
777
700,
896
172,
758
219,
008
317,
645
332,
381
514,
363
180,
207
4,61
6,8
5269
,728
5,62
1,6
1880
1,32
47,
123,
838
Dec
.63
6,28
45,
142
641,
426
171,
044
214,
429
323,
938
326,
734
513,
989
145,
997
4,66
9,9
9767
,885
5,67
8,9
6875
5,04
57,
075,
439
2011
Jan.
586,
737
5,45
859
2,19
520
3,01
321
0,30
332
0,05
832
3,40
351
3,54
114
7,28
64,
681,
803
66,3
415,
718,
415
747,
333
7,05
7,9
43F
eb.
601,
098
4,51
860
5,61
619
3,42
418
5,95
131
6,27
531
8,78
449
9,10
396
,231
4,64
8,4
2167
,178
5,65
7,2
2366
8,14
46,
930,
983
Mar
.61
0,87
66,
640
617,
516
197,
493
186,
578
309,
090
319,
086
510,
691
94,6
004,
645,
856
64,5
355,
663,
130
664,
799
6,94
5,4
45
S
ourc
e: T
he C
entr
al B
ank
of T
he B
aham
as
Tab
le 2
.15
Ban
kin
g S
yste
m:
Ove
rdra
fts
and
Loa
ns
by
Mat
uri
ty(A
ll C
urr
enci
es)
20
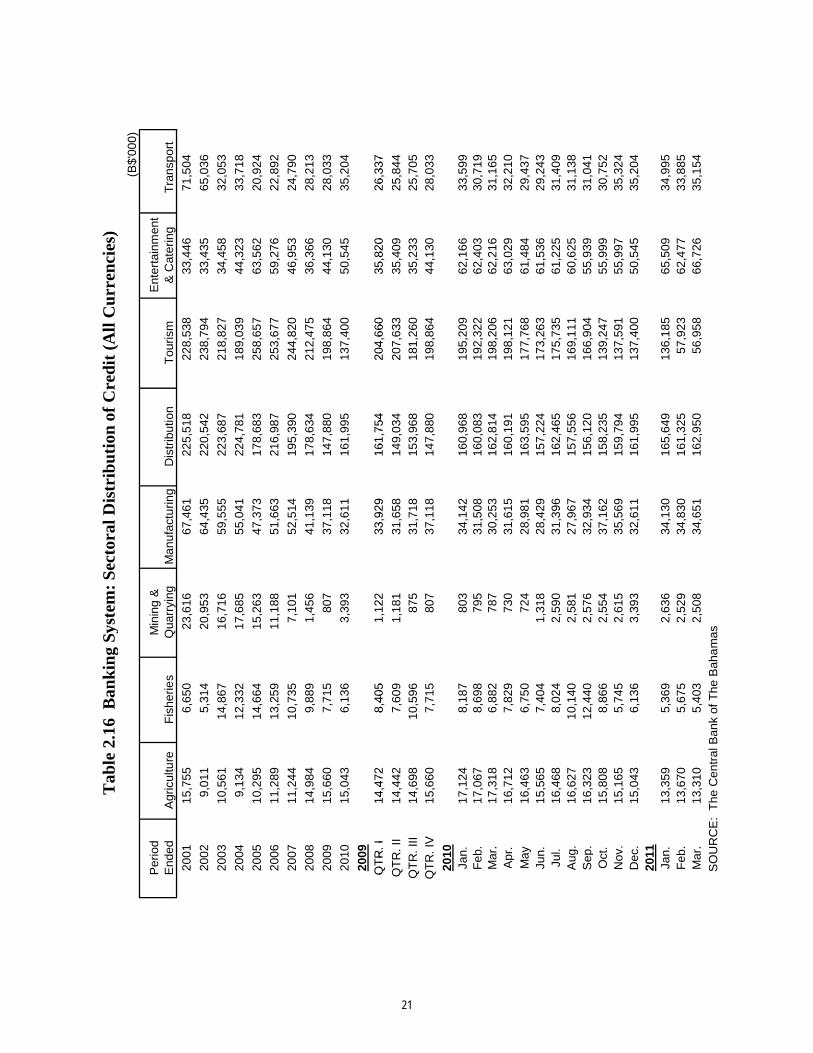
(B$'
000)
Per
iod
Min
ing
&E
nter
tain
men
tE
nded
Agr
icul
ture
Fis
herie
sQ
uarr
ying
Dis
trib
utio
nT
ouris
m&
Cat
erin
g T
rans
port
2001
15,7
556,
650
23,6
1667
,461
225,
518
228,
538
33,4
4671
,504
2002
9,01
15,
314
20,9
5364
,435
220,
542
238,
794
33,4
3565
,036
2003
10,5
6114
,867
16,7
1659
,555
223,
687
218,
827
34,4
5832
,053
2004
9,13
412
,332
17,6
8555
,041
224,
781
189,
039
44,3
2333
,718
2005
10,2
9514
,664
15,2
6347
,373
178,
683
258,
657
63,5
6220
,924
2006
11,2
8913
,259
11,1
8851
,663
216,
987
253,
677
59,2
7622
,892
2007
11,2
4410
,735
7,10
152
,514
195,
390
244,
820
46,9
5324
,790
2008
14,9
849,
889
1,45
641
,139
178,
634
212,
475
36,3
6628
,213
2009
15,6
607,
715
807
37,1
1814
7,88
019
8,86
444
,130
28,0
33
2010
15,0
436,
136
3,39
332
,611
161,
995
137,
400
50,5
4535
,204
2009
QT
R. I
14,4
728,
405
1,12
233
,929
161,
754
204,
660
35,8
2026
,337
Tab
le 2
.16
Ban
kin
g Sy
stem
: S
ecto
ral D
istr
ibu
tion
of
Cre
dit
(A
ll C
urr
enci
es)
Man
ufac
turin
g
QT
R. I
14,4
728,
405
1,12
233
,929
161,
754
204,
660
35,8
2026
,337
QT
R. I
I14
,442
7,60
91,
181
31,6
5814
9,03
420
7,63
335
,409
25,8
44Q
TR
. III
14,6
9810
,596
875
31,7
1815
3,96
818
1,26
035
,233
25,7
05Q
TR
. IV
15,6
607,
715
807
37,1
1814
7,88
019
8,86
444
,130
28,0
33
2010
Jan.
17,1
248,
187
803
34,1
4216
0,96
819
5,20
962
,166
33,5
99F
eb.
17,0
678,
698
795
31,5
0816
0,08
319
2,32
262
,403
30,7
19M
ar.
17,3
186,
882
787
30,2
5316
2,81
419
8,20
662
,216
31,1
65A
pr.
16,7
127,
829
730
31,6
1516
0,19
119
8,12
163
,029
32,2
10M
ay16
,463
6,75
072
428
,981
163,
595
177,
768
61,4
8429
,437
Jun.
15,5
657,
404
1,31
828
,429
157,
224
173,
263
61,5
3629
,243
Jul.
16,4
688,
024
2,59
031
,396
162,
465
175,
735
61,2
2531
,409
Aug
.16
,627
10,1
402,
581
27,9
6715
7,55
616
9,11
160
,625
31,1
38S
ep.
16,3
2312
,440
2,57
632
,934
156,
120
166,
904
55,9
3931
,041
Oct
.15
,808
8,86
62,
554
37,1
6215
8,23
513
9,24
755
,999
30,7
52N
ov.
15,1
655,
745
2,61
535
,569
159,
794
137,
591
55,9
9735
,324
Dec
.15
,043
6,13
63,
393
32,6
1116
1,99
513
7,40
050
,545
35,2
0420
11Ja
n.13
,359
5,36
92,
636
34,1
3016
5,64
913
6,18
565
,509
34,9
95F
eb.
13,6
705,
675
2,52
934
,830
161,
325
57,9
2362
,477
33,8
85M
ar.
13,3
105,
403
2,50
834
,651
162,
950
56,9
5866
,726
35,1
54
S
OU
RC
E:
The
Cen
tral
Ban
k of
The
Bah
am
as
21
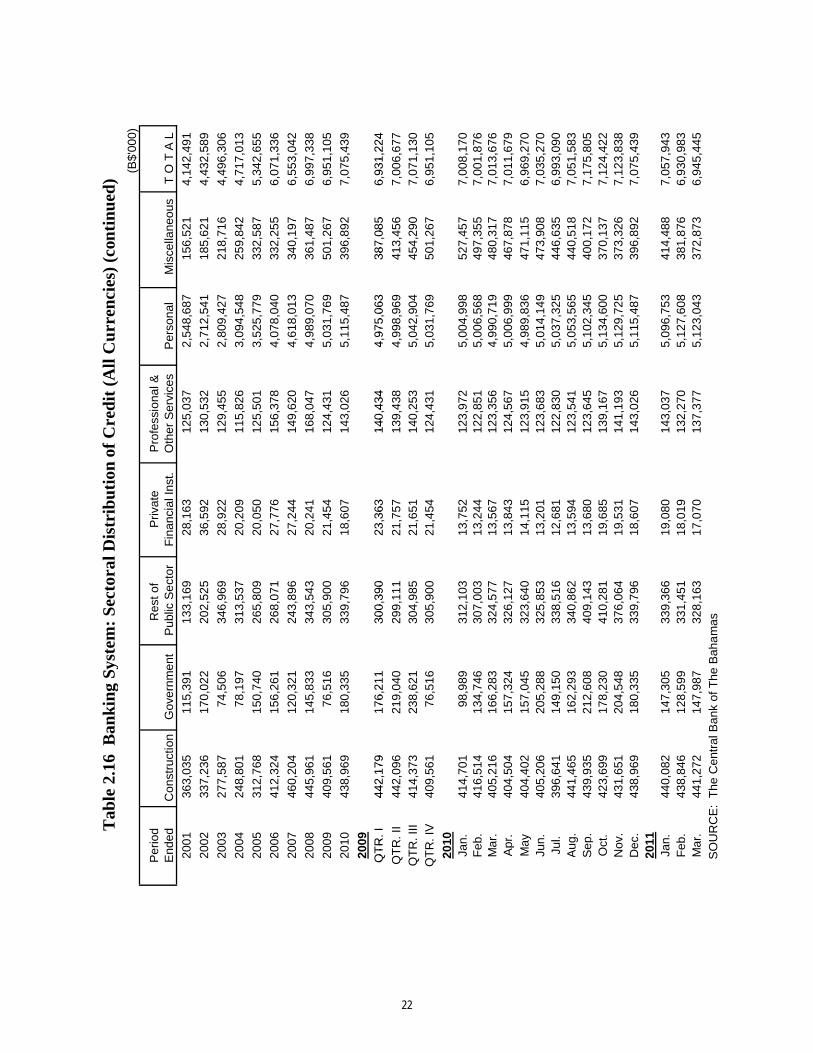
(B$'
000)
Per
iod
Res
t of
Priv
ate
Pro
fess
iona
l &E
nded
Con
stru
ctio
nG
over
nmen
tP
ublic
Se
ctor
Fin
anci
al In
st.
Oth
er S
ervi
ces
Per
sona
lM
isce
llane
ous
T O
T A
L
2001
363,
035
115,
391
133,
169
28,1
6312
5,03
72,
548,
687
156,
521
4,14
2,49
1
2002
337,
236
170,
022
202,
525
36,5
9213
0,53
22,
712,
541
185,
621
4,43
2,58
9
2003
277,
587
74,5
0634
6,96
928
,922
129,
455
2,80
9,42
721
8,71
64,
496,
306
2004
248,
801
78,1
9731
3,53
720
,209
115,
826
3,09
4,54
825
9,84
24,
717,
013
2005
312,
768
150,
740
265,
809
20,0
5012
5,50
13,
525,
779
332,
587
5,34
2,65
5
2006
412,
324
156,
261
268,
071
27,7
7615
6,37
84,
078,
040
332,
255
6,07
1,33
6
2007
460,
204
120,
321
243,
896
27,2
4414
9,62
04,
618,
013
340,
197
6,55
3,04
2
2008
445,
961
145,
833
343,
543
20,2
4116
8,04
74,
989,
070
361,
487
6,99
7,33
8
2009
409,
561
76,5
1630
5,90
021
,454
124,
431
5,03
1,76
950
1,26
76,
951,
105
2010
438,
969
180,
335
339,
796
18,6
0714
3,02
65,
115,
487
396,
892
7,07
5,43
9
2009
QT
R. I
442,
179
176,
211
300,
390
23,3
6314
0,43
44,
975,
063
387,
085
6,93
1,22
4
Tab
le 2
.16
Ban
kin
g Sy
stem
: S
ecto
ral D
istr
ibu
tion
of
Cre
dit
(A
ll C
urr
enci
es)
(con
tin
ued
)
QT
R. I
442,
179
176,
211
300,
390
23,3
6314
0,43
44,
975,
063
387,
085
6,93
1,22
4
QT
R. I
I44
2,09
621
9,04
029
9,11
121
,757
139,
438
4,99
8,96
941
3,45
67,
006,
677
QT
R. I
II41
4,37
323
8,62
130
4,98
521
,651
140,
253
5,04
2,90
445
4,29
07,
071,
130
QT
R. I
V40
9,56
176
,516
305,
900
21,4
5412
4,43
15,
031,
769
501,
267
6,95
1,10
5
2010
Jan.
414,
701
98,9
8931
2,10
313
,752
123,
972
5,00
4,99
852
7,45
77,
008,
170
Feb
.41
6,51
413
4,74
630
7,00
313
,244
122,
851
5,00
6,56
849
7,35
57,
001,
876
Mar
.40
5,21
616
6,28
332
4,57
713
,567
123,
356
4,99
0,71
948
0,31
77,
013,
676
Apr
.40
4,50
415
7,32
432
6,12
713
,843
124,
567
5,00
6,99
946
7,87
87,
011,
679
May
404,
402
157,
045
323,
640
14,1
1512
3,91
54,
989,
836
471,
115
6,96
9,27
0Ju
n.40
5,20
620
5,28
832
5,85
313
,201
123,
683
5,01
4,14
947
3,90
87,
035,
270
Jul.
396,
641
149,
150
338,
516
12,6
8112
2,83
05,
037,
325
446,
635
6,99
3,09
0A
ug.
441,
465
162,
293
340,
862
13,5
9412
3,54
15,
053,
565
440,
518
7,05
1,58
3S
ep.
439,
935
212,
608
409,
143
13,6
8012
3,64
55,
102,
345
400,
172
7,17
5,80
5O
ct.
423,
699
178,
230
410,
281
19,6
8513
9,16
75,
134,
600
370,
137
7,12
4,42
2N
ov.
431,
651
204,
548
376,
064
19,5
3114
1,19
35,
129,
725
373,
326
7,12
3,83
8D
ec.
438,
969
180,
335
339,
796
18,6
0714
3,02
65,
115,
487
396,
892
7,07
5,43
920
11Ja
n.44
0,08
214
7,30
533
9,36
619
,080
143,
037
5,09
6,75
341
4,48
87,
057,
943
Feb
.43
8,84
612
8,59
933
1,45
118
,019
132,
270
5,12
7,60
838
1,87
66,
930,
983
Mar
.44
1,27
214
7,98
732
8,16
317
,070
137,
377
5,12
3,04
337
2,87
36,
945,
445
SO
UR
CE
: T
he C
entr
al B
ank
of T
he B
aha
mas
22
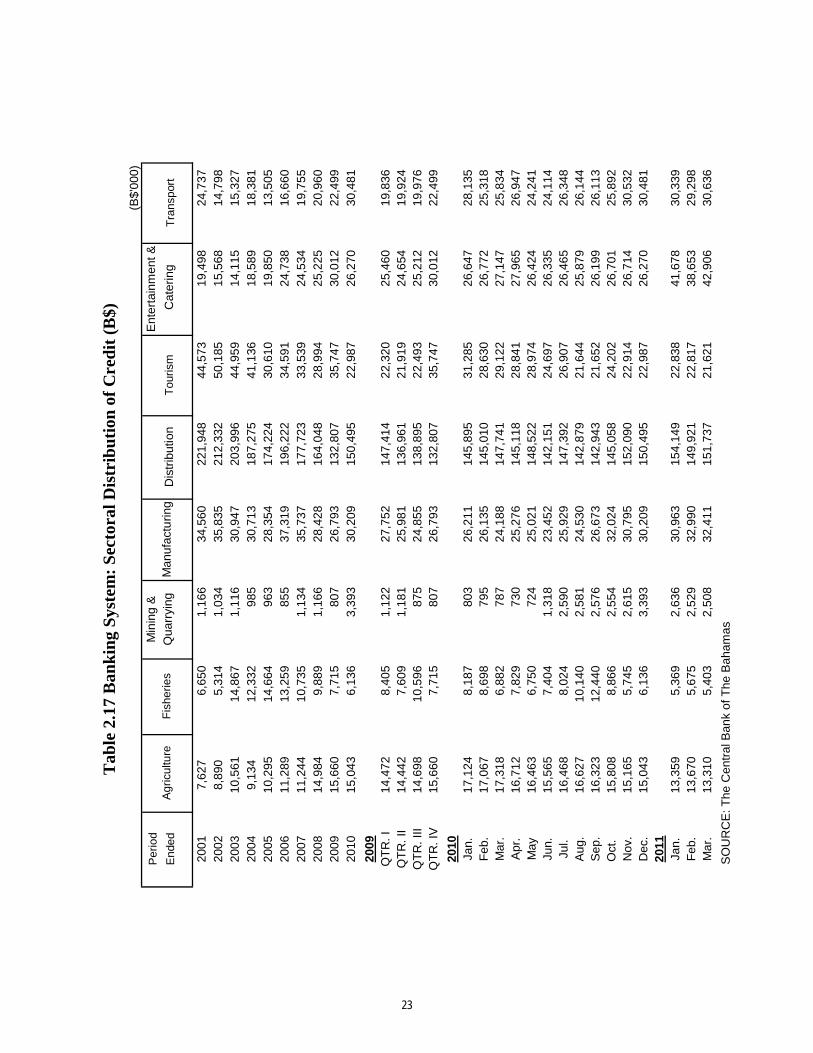
Tab
le 2
.17
Ban
kin
g S
yste
m:
Sec
tora
l Dis
trib
uti
on o
f C
red
it (
B$)
(B$'
000)
Per
iod
Min
ing
&E
nter
tain
men
t &
End
edQ
uarr
ying
Dis
trib
utio
nT
ouris
m C
ater
ing
Tra
nspo
rt
2001
7,62
76,
650
1,16
634
,560
221,
948
44,5
7319
,498
24,7
3720
028,
890
5,31
41,
034
35,8
3521
2,33
250
,185
15,5
6814
,798
2003
10,5
6114
,867
1,11
630
,947
203,
996
44,9
5914
,115
15,3
2720
049,
134
12,3
3298
530
,713
187,
275
41,1
3618
,589
18,3
8120
0510
,295
14,6
6496
328
,354
174,
224
30,6
1019
,850
13,5
0520
0611
,289
13,2
5985
537
,319
196,
222
34,5
9124
,738
16,6
6020
0711
,244
10,7
351,
134
35,7
3717
7,72
333
,539
24,5
3419
,755
2008
14,9
849,
889
1,16
628
,428
164,
048
28,9
9425
,225
20,9
6020
0915
,660
7,71
580
726
,793
132,
807
35,7
4730
,012
22,4
9920
1015
,043
6,13
63,
393
30,2
0915
0,49
522
,987
26,2
7030
,481
2009
QT
R. I
14,4
728,
405
1,12
227
,752
147,
414
22,3
2025
,460
19,8
36
Agr
icul
ture
Fis
herie
sM
anuf
actu
ring
QT
R. I
14,4
728,
405
1,12
227
,752
147,
414
22,3
2025
,460
19,8
36Q
TR
. II
14,4
427,
609
1,18
125
,981
136,
961
21,9
1924
,654
19,9
24Q
TR
. III
14,6
9810
,596
875
24,8
5513
8,89
522
,493
25,2
1219
,976
QT
R. I
V15
,660
7,71
580
726
,793
132,
807
35,7
4730
,012
22,4
99
2010
Jan.
17,1
248,
187
803
26,2
1114
5,89
531
,285
26,6
4728
,135
Feb
.17
,067
8,69
879
526
,135
145,
010
28,6
3026
,772
25,3
18M
ar.
17,3
186,
882
787
24,1
8814
7,74
129
,122
27,1
4725
,834
Apr
.16
,712
7,82
973
025
,276
145,
118
28,8
4127
,965
26,9
47M
ay16
,463
6,75
072
425
,021
148,
522
28,9
7426
,424
24,2
41Ju
n.15
,565
7,40
41,
318
23,4
5214
2,15
124
,697
26,3
3524
,114
Jul.
16,4
688,
024
2,59
025
,929
147,
392
26,9
0726
,465
26,3
48A
ug.
16,6
2710
,140
2,58
124
,530
142,
879
21,6
4425
,879
26,1
44S
ep.
16,3
2312
,440
2,57
626
,673
142,
943
21,6
5226
,199
26,1
13O
ct.
15,8
088,
866
2,55
432
,024
145,
058
24,2
0226
,701
25,8
92N
ov.
15,1
655,
745
2,61
530
,795
152,
090
22,9
1426
,714
30,5
32D
ec.
15,0
436,
136
3,39
330
,209
150,
495
22,9
8726
,270
30,4
8120
11Ja
n.13
,359
5,36
92,
636
30,9
6315
4,14
922
,838
41,6
7830
,339
Feb
.13
,670
5,67
52,
529
32,9
9014
9,92
122
,817
38,6
5329
,298
Mar
.13
,310
5,40
32,
508
32,4
1115
1,73
721
,621
42,9
0630
,636
SO
UR
CE
: The
Cen
tral
Ban
k of
The
Bah
amas
23
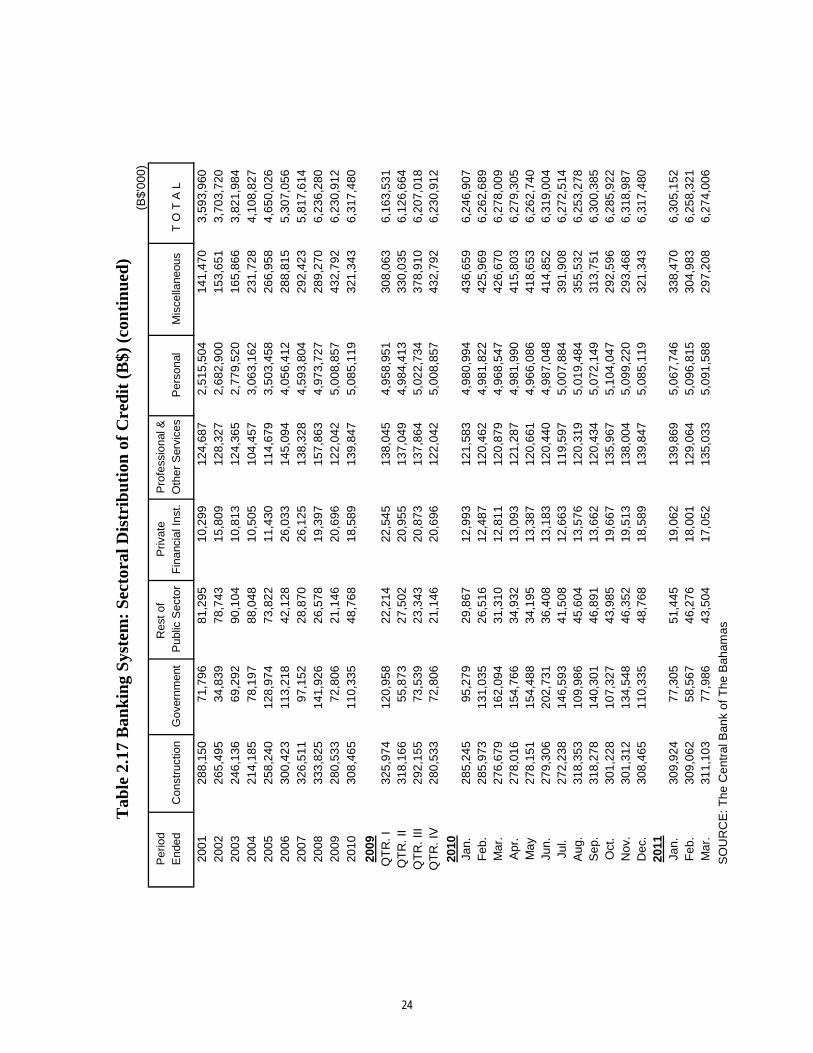
Tab
le 2
.17
Ban
kin
g S
yste
m:
Sec
tora
l Dis
trib
uti
on o
f C
red
it (
B$)
(co
nti
nu
ed)
(B
$'00
0)
Per
iod
Res
t of
Priv
ate
Pro
fess
iona
l &E
nded
Con
stru
ctio
nG
over
nmen
tP
ublic
Sec
tor
Fin
anci
al In
st.
Oth
er S
ervi
ces
Per
sona
lM
isce
llane
ous
T
O T
A L
2001
288,
150
71,7
9681
,295
10,2
9912
4,68
72,
515,
504
141,
470
3,59
3,96
020
0226
5,49
534
,839
78,7
4315
,809
128,
327
2,68
2,90
015
3,65
13,
703,
720
2003
246,
136
69,2
9290
,104
10,8
1312
4,36
52,
779,
520
165,
866
3,82
1,98
420
0421
4,18
578
,197
88,0
4810
,505
104,
457
3,06
3,16
223
1,72
84,
108,
827
2005
258,
240
128,
974
73,8
2211
,430
114,
679
3,50
3,45
826
6,95
84,
650,
026
2006
300,
423
113,
218
42,1
2826
,033
145,
094
4,05
6,41
228
8,81
55,
307,
056
2007
326,
511
97,1
5228
,870
26,1
2513
8,32
84,
593,
804
292,
423
5,81
7,61
420
0833
3,82
514
1,92
626
,578
19,3
9715
7,86
34,
973,
727
289,
270
6,23
6,28
020
0928
0,53
372
,806
21,1
4620
,696
122,
042
5,00
8,85
743
2,79
26,
230,
912
2010
308,
465
110,
335
48,7
6818
,589
139,
847
5,08
5,11
932
1,34
36,
317,
480
2009
QT
R. I
325,
974
120,
958
22,2
1422
,545
138,
045
4,95
8,95
130
8,06
36,
163,
531
QT
R. I
325,
974
120,
958
22,2
1422
,545
138,
045
4,95
8,95
130
8,06
36,
163,
531
QT
R. I
I31
8,16
655
,873
27,5
0220
,955
137,
049
4,98
4,41
333
0,03
56,
126,
664
QT
R. I
II29
2,15
573
,539
23,3
4320
,873
137,
864
5,02
2,73
437
8,91
06,
207,
018
QT
R. I
V28
0,53
372
,806
21,1
4620
,696
122,
042
5,00
8,85
743
2,79
26,
230,
912
2010
Jan.
285,
245
95,2
7929
,867
12,9
9312
1,58
34,
980,
994
436,
659
6,24
6,90
7F
eb.
285,
973
131,
035
26,5
1612
,487
120,
462
4,98
1,82
242
5,96
96,
262,
689
Mar
.27
6,67
916
2,09
431
,310
12,8
1112
0,87
94,
968,
547
426,
670
6,27
8,00
9A
pr.
278,
016
154,
766
34,9
3213
,093
121,
287
4,98
1,99
041
5,80
36,
279,
305
May
278,
151
154,
488
34,1
9513
,387
120,
661
4,96
6,08
641
8,65
36,
262,
740
Jun.
279,
306
202,
731
36,4
0813
,183
120,
440
4,98
7,04
841
4,85
26,
319,
004
Jul.
272,
238
146,
593
41,5
0812
,663
119,
597
5,00
7,88
439
1,90
86,
272,
514
Aug
.31
8,35
310
9,98
645
,604
13,5
7612
0,31
95,
019,
484
355,
532
6,25
3,27
8S
ep.
318,
278
140,
301
46,8
9113
,662
120,
434
5,07
2,14
931
3,75
16,
300,
385
Oct
.30
1,22
810
7,32
743
,985
19,6
6713
5,96
75,
104,
047
292,
596
6,28
5,92
2N
ov.
301,
312
134,
548
46,3
5219
,513
138,
004
5,09
9,22
029
3,46
86,
318,
987
Dec
.30
8,46
511
0,33
548
,768
18,5
8913
9,84
75,
085,
119
321,
343
6,31
7,48
020
11Ja
n.30
9,92
477
,305
51,4
4519
,062
139,
869
5,06
7,74
633
8,47
06,
305,
152
Feb
.30
9,06
258
,567
46,2
7618
,001
129,
064
5,09
6,81
530
4,98
36,
258,
321
Mar
.31
1,10
377
,986
43,5
0417
,052
135,
033
5,09
1,58
829
7,20
86,
274,
006
SO
UR
CE
: The
Cen
tral
Ban
k of
The
Bah
amas
24
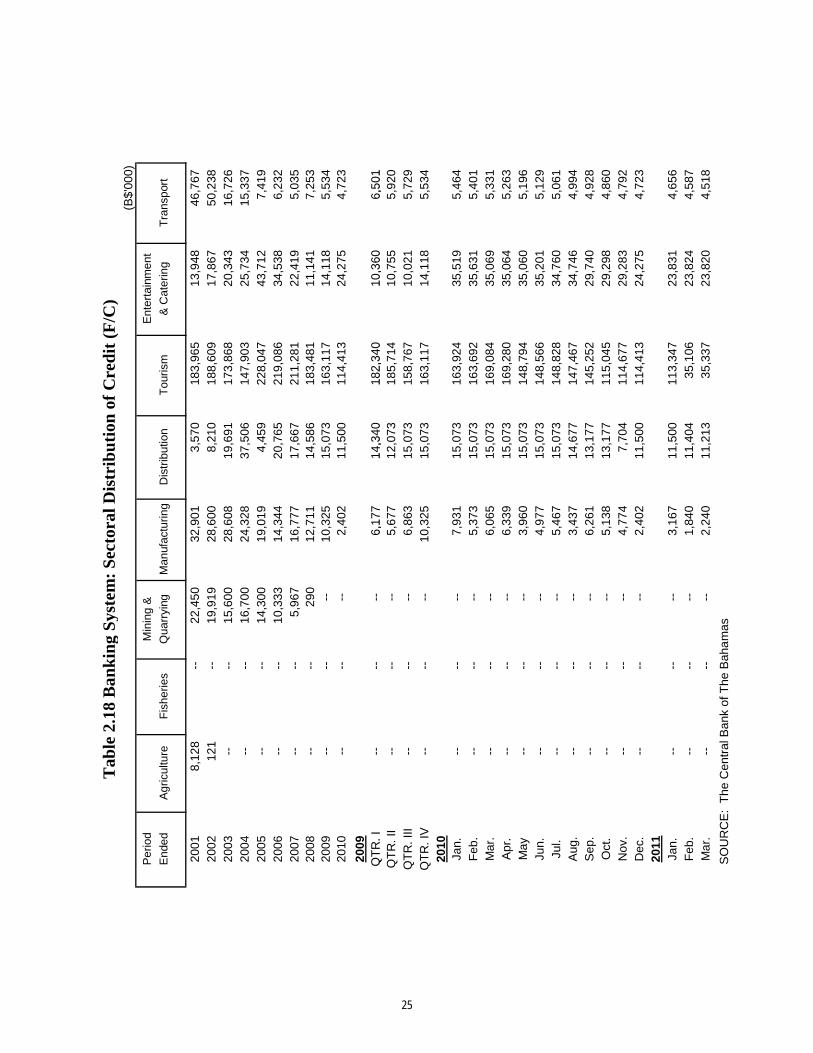
Tab
le 2
.18
Ban
kin
g S
yste
m:
Sec
tora
l Dis
trib
uti
on o
f C
red
it (
F/C
)(B
$'00
0)
Per
iod
Min
ing
&E
nter
tain
men
t
End
edA
gric
ultu
reF
ishe
ries
Qua
rryi
ngM
anuf
actu
ring
Dis
trib
utio
nT
ouris
m&
Cat
erin
gT
rans
port
2001
8,12
8
--
22,4
5032
,901
3,57
018
3,96
513
,948
46,7
6720
0212
1
--
19,9
1928
,600
8,21
018
8,60
917
,867
50,2
3820
03
--
-
-15
,600
28,6
0819
,691
173,
868
20,3
4316
,726
2004
-
-
--
16,7
0024
,328
37,5
0614
7,90
325
,734
15,3
3720
05
--
-
-14
,300
19,0
194,
459
228,
047
43,7
127,
419
2006
-
-
--
10,3
3314
,344
20,7
6521
9,08
634
,538
6,23
220
07
--
-
-5,
967
16,7
7717
,667
211,
281
22,4
195,
035
2008
-
-
--
290
12,7
1114
,586
183,
481
11,1
417,
253
2009
-
-
--
-
-10
,325
15,0
7316
3,11
714
,118
5,53
420
10--
-
-
--
2,40
211
,500
114,
413
24,2
754,
723
2009
QT
R. I
-
-
--
-
-6,
177
14,3
4018
2,34
010
,360
6,50
1Q
TR
. I
--
-
-
--
6,17
714
,340
182,
340
10,3
606,
501
QT
R. I
I
--
-
-
--
5,67
712
,073
185,
714
10,7
555,
920
QT
R. I
II
--
-
-
--
6,86
315
,073
158,
767
10,0
215,
729
QT
R. I
V
--
-
-
--
10,3
2515
,073
163,
117
14,1
185,
534
2010
Jan.
-
-
--
-
-7,
931
15,0
7316
3,92
435
,519
5,46
4F
eb.
-
-
--
-
-5,
373
15,0
7316
3,69
235
,631
5,40
1M
ar.
-
-
--
-
-6,
065
15,0
7316
9,08
435
,069
5,33
1A
pr.
-
-
--
-
-6,
339
15,0
7316
9,28
035
,064
5,26
3M
ay
--
-
-
--
3,96
015
,073
148,
794
35,0
605,
196
Jun.
-
-
--
-
-4,
977
15,0
7314
8,56
635
,201
5,12
9Ju
l.
--
-
-
--
5,46
715
,073
148,
828
34,7
605,
061
Aug
.
--
-
-
--
3,43
714
,677
147,
467
34,7
464,
994
Sep
.
--
-
-
--
6,26
113
,177
145,
252
29,7
404,
928
Oct
.
--
-
-
--
5,13
813
,177
115,
045
29,2
984,
860
Nov
.
--
-
-
--
4,77
47,
704
114,
677
29,2
834,
792
Dec
.
--
-
-
--
2,40
211
,500
114,
413
24,2
754,
723
2011
Jan.
-
-
--
-
-3,
167
11,5
0011
3,34
723
,831
4,65
6F
eb.
-
-
--
-
-1,
840
11,4
0435
,106
23,8
244,
587
Mar
.
--
-
-
--
2,24
011
,213
35,3
3723
,820
4,51
8
SO
UR
CE
: T
he C
entr
al B
ank
of T
he B
aha
mas
25
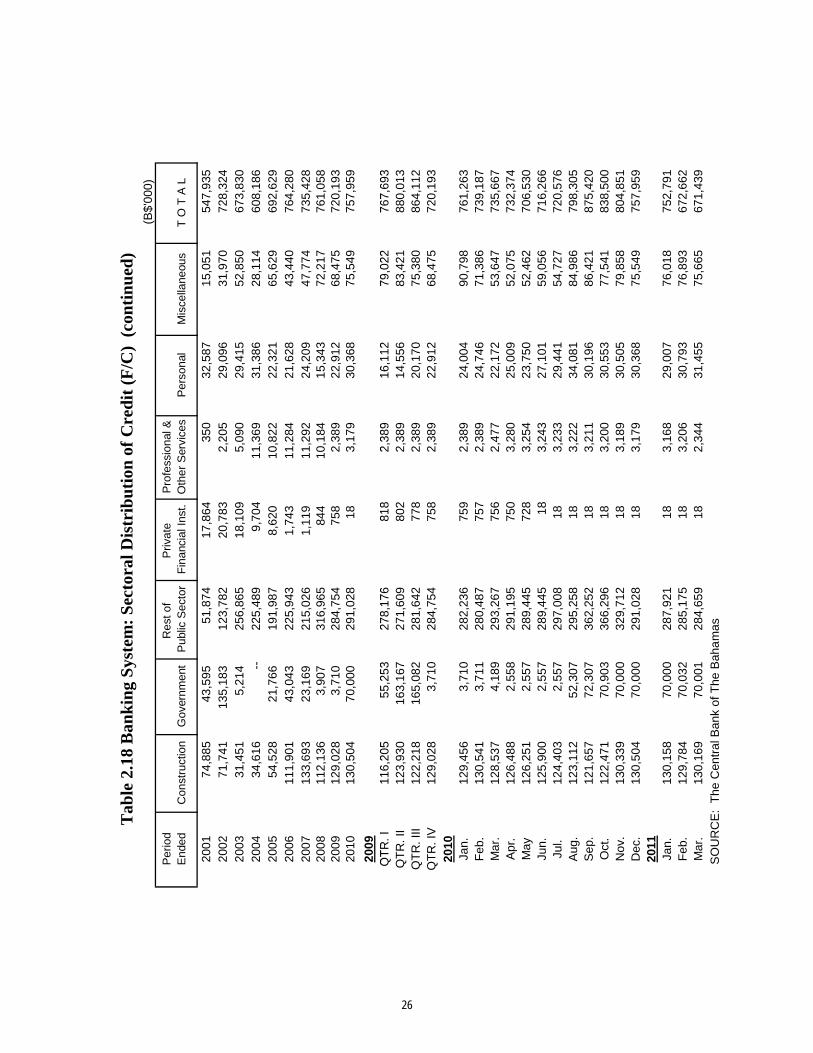
Tab
le 2
.18
Ban
kin
g S
yste
m:
Sec
tora
l Dis
trib
uti
on o
f C
red
it (
F/C
) (
con
tin
ued
)
(B
$'00
0)
Per
iod
Res
t of
Priv
ate
Pro
fess
iona
l &E
nded
Con
stru
ctio
nG
over
nmen
tP
ublic
Sec
tor
Fin
anci
al In
st.
Oth
er S
ervi
ces
Per
sona
lM
isce
llane
ous
T O
T A
L
2001
74,8
8543
,595
51,8
7417
,864
350
32,5
8715
,051
547,
935
2002
71,7
4113
5,18
312
3,78
220
,783
2,20
529
,096
31,9
7072
8,32
420
0331
,451
5,21
425
6,86
518
,109
5,09
029
,415
52,8
5067
3,83
020
0434
,616
--22
5,48
99,
704
11,3
6931
,386
28,1
1460
8,18
620
0554
,528
21,7
6619
1,98
78,
620
10,8
2222
,321
65,6
2969
2,62
920
0611
1,90
143
,043
225,
943
1,74
311
,284
21,6
2843
,440
764,
280
2007
133,
693
23,1
6921
5,02
61,
119
11,2
9224
,209
47,7
7473
5,42
820
0811
2,13
63,
907
316,
965
844
10,1
8415
,343
72,2
1776
1,05
820
0912
9,02
83,
710
284,
754
758
2,38
922
,912
68,4
7572
0,19
320
1013
0,50
470
,000
291,
028
183,
179
30,3
6875
,549
757,
959
2009
QT
R. I
116,
205
55,2
5327
8,17
681
82,
389
16,1
1279
,022
767,
693
QT
R. I
116,
205
55,2
5327
8,17
681
82,
389
16,1
1279
,022
767,
693
QT
R. I
I12
3,93
016
3,16
727
1,60
980
22,
389
14,5
5683
,421
880,
013
QT
R. I
II12
2,21
816
5,08
228
1,64
277
82,
389
20,1
7075
,380
864,
112
QT
R. I
V12
9,02
83,
710
284,
754
758
2,38
922
,912
68,4
7572
0,19
320
10Ja
n.12
9,45
63,
710
282,
236
759
2,38
924
,004
90,7
9876
1,26
3F
eb.
130,
541
3,71
128
0,48
775
72,
389
24,7
4671
,386
739,
187
Mar
.12
8,53
74,
189
293,
267
756
2,47
722
,172
53,6
4773
5,66
7A
pr.
126,
488
2,55
829
1,19
575
03,
280
25,0
0952
,075
732,
374
May
126,
251
2,55
728
9,44
572
83,
254
23,7
5052
,462
706,
530
Jun.
125,
900
2,55
728
9,44
518
3,24
327
,101
59,0
5671
6,26
6Ju
l.12
4,40
32,
557
297,
008
183,
233
29,4
4154
,727
720,
576
Aug
.12
3,11
252
,307
295,
258
183,
222
34,0
8184
,986
798,
305
Sep
.12
1,65
772
,307
362,
252
183,
211
30,1
9686
,421
875,
420
Oct
.12
2,47
170
,903
366,
296
183,
200
30,5
5377
,541
838,
500
Nov
.13
0,33
970
,000
329,
712
183,
189
30,5
0579
,858
804,
851
Dec
.13
0,50
470
,000
291,
028
183,
179
30,3
6875
,549
757,
959
2011
Jan.
130,
158
70,0
0028
7,92
118
3,16
829
,007
76,0
1875
2,79
1F
eb.
129,
784
70,0
3228
5,17
518
3,20
630
,793
76,8
9367
2,66
2M
ar.
130,
169
70,0
0128
4,65
918
2,34
431
,455
75,6
6567
1,43
9
S
OU
RC
E:
The
Cen
tral
Ban
k of
The
Bah
am
as
26
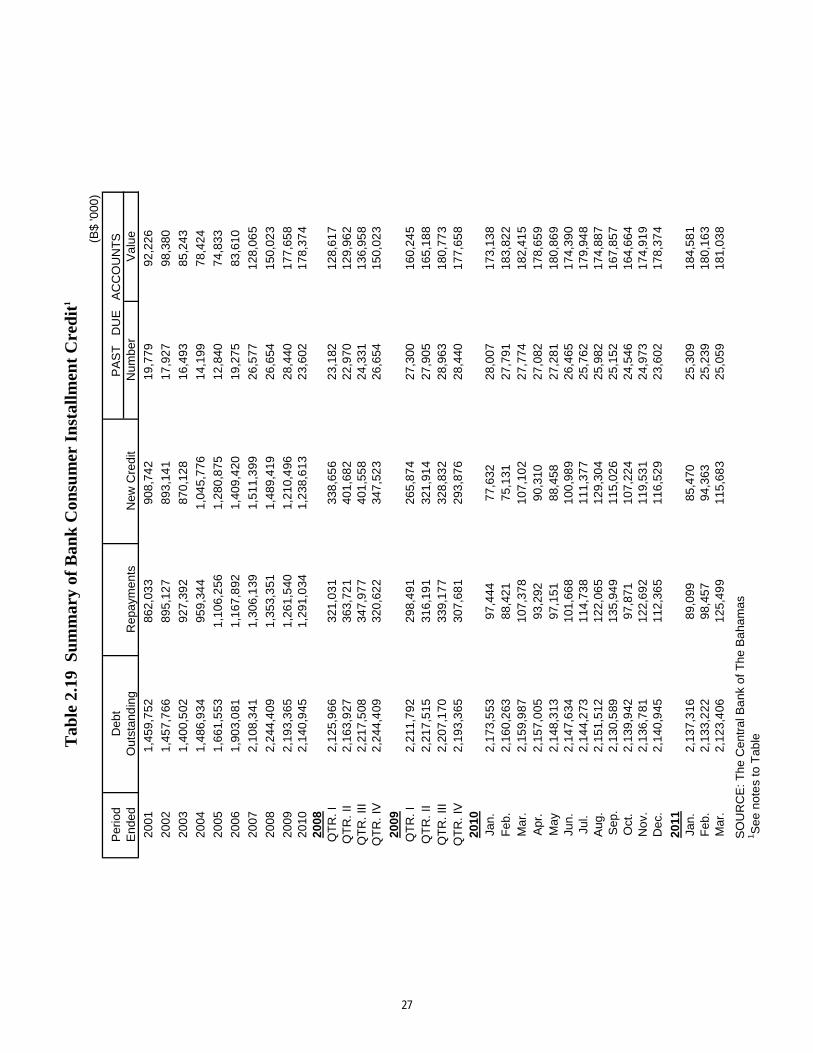
Tab
le 2
.19
Su
mm
ary
of B
ank
Con
sum
er I
nst
allm
ent
Cre
dit
1
(B$
'000
)
Per
iod
End
ed
2001
1,45
9,7
5286
2,03
390
8,74
219
,779
92,2
26
2002
1,45
7,7
6689
5,12
789
3,14
117
,927
98,3
80
2003
1,40
0,5
0292
7,39
287
0,12
816
,493
85,2
43
2004
1,48
6,9
3495
9,34
41,
045,
776
14,1
9978
,424
2005
1,66
1,5
531,
106,
256
1,28
0,8
7512
,840
74,8
33
2006
1,90
3,0
811,
167,
892
1,40
9,4
2019
,275
83,6
10
2007
2,10
8,3
411,
306,
139
1,51
1,3
9926
,577
128,
065
2008
2,24
4,4
091,
353,
351
1,48
9,4
1926
,654
150,
023
2009
2,19
3,3
651,
261,
540
1,21
0,4
9628
,440
177,
658
2010
2,14
0,9
451,
291,
034
1,23
8,6
1323
,602
178,
374
2008
QT
R. I
2,12
5,9
6632
1,03
133
8,65
623
,182
128,
617
QT
R. I
I2,
163,
927
363,
721
401,
682
22,9
7012
9,96
2Q
TR
. III
2,21
7,5
0834
7,97
740
1,55
824
,331
136,
958
QT
R. I
V2,
244,
409
320,
622
347,
523
26,6
5415
0,02
3
2009
QT
R. I
2,21
1,7
9229
8,49
126
5,87
427
,300
160,
245
QT
R. I
I2,
217,
515
316,
191
321,
914
27,9
0516
5,18
8Q
TR
. III
2,20
7,1
7033
9,17
732
8,83
228
,963
180,
773
QT
R. I
V2,
193,
365
307,
681
293,
876
28,4
4017
7,65
820
10Ja
n.2,
173,
553
97,4
4477
,632
28,0
0717
3,13
8F
eb.
2,16
0,2
6388
,421
75,1
3127
,791
183,
822
Mar
.2,
159,
987
107,
378
107,
102
27,7
7418
2,41
5A
pr.
2,15
7,0
0593
,292
90,3
1027
,082
178,
659
May
2,14
8,3
1397
,151
88,4
5827
,281
180,
869
Jun.
2,14
7,6
3410
1,66
810
0,98
926
,465
174,
390
Jul.
2,14
4,2
7311
4,73
811
1,37
725
,762
179,
948
Aug
.2,
151,
512
122,
065
129,
304
25,9
8217
4,88
7 S
ep.
2,13
0,5
8913
5,94
911
5,02
625
,152
167,
857
Oct
.2,
139,
942
97,8
7110
7,22
424
,546
164,
664
Nov
.2,
136,
781
122,
692
119,
531
24,9
7317
4,91
9D
ec.
2,14
0,9
4511
2,36
511
6,52
923
,602
178,
374
2011
Jan.
2,13
7,3
1689
,099
85,4
7025
,309
184,
581
Feb
.2,
133,
222
98,4
5794
,363
25,2
3918
0,16
3M
ar.
2,12
3,4
0612
5,49
911
5,68
325
,059
181,
038
S
OU
RC
E: T
he C
entr
al B
ank
of T
he B
aha
mas
1S
ee n
ote
s to
Tab
le
Num
ber
Val
ueP
AS
T
DU
E
AC
CO
UN
TS
Deb
tO
utst
and
ing
Rep
aym
ents
New
Cre
dit
27
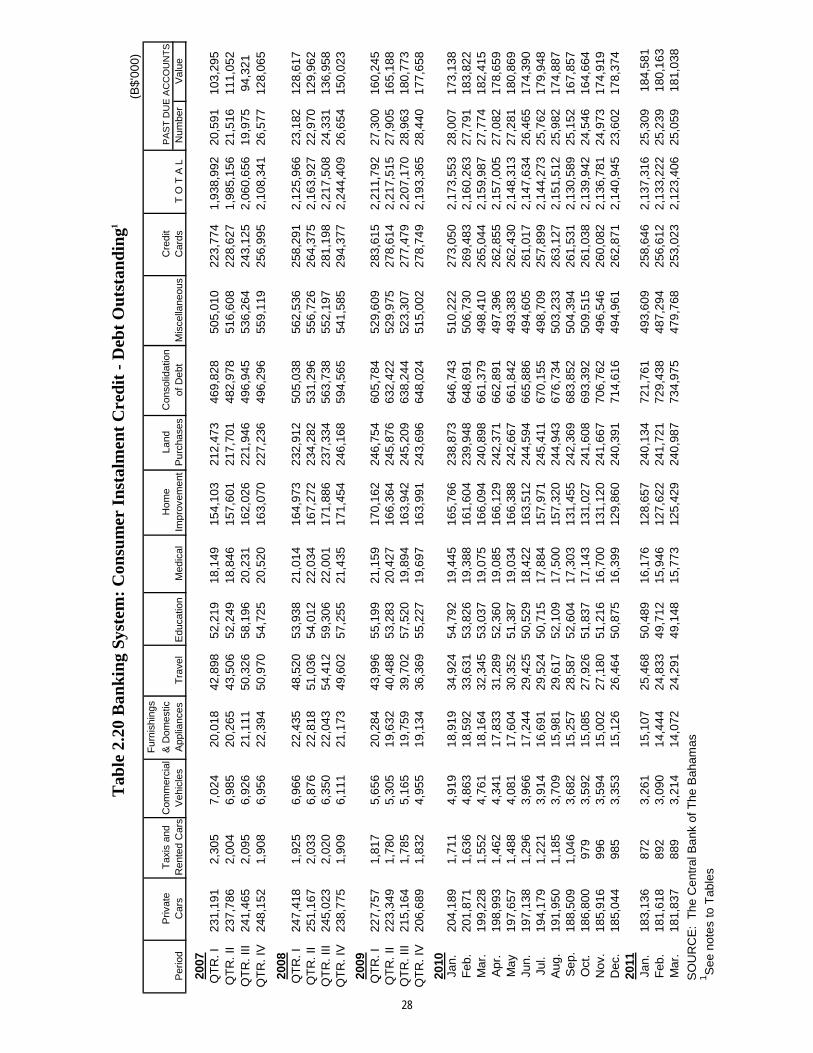
(B$'
000)
Fur
nish
ings
Priv
ate
Tax
is a
ndC
omm
erci
al&
Dom
estic
Hom
eLa
ndC
onso
lidat
ion
Cre
dit
PA
ST
DU
E A
CC
OU
NT
S
Per
iod
Car
sR
ente
d C
ars
Veh
icle
sA
pplia
nces
Tra
vel
Edu
catio
n M
edic
alIm
prov
emen
tP
urch
ases
of D
ebt
Mis
cella
neou
sC
ards
T O
T A
LN
umbe
rV
alue
2007
QT
R. I
231,
191
2,30
57,
024
20,0
1842
,898
52,2
1918
,149
154,
103
212,
473
469,
828
505,
010
223,
774
1,93
8,99
220
,591
103,
295
QT
R. I
I23
7,78
62,
004
6,98
520
,265
43,5
0652
,249
18,8
4615
7,60
121
7,70
148
2,97
851
6,60
822
8,62
71,
985,
156
21,5
1611
1,05
2Q
TR
. III
241,
465
2,09
56,
926
21,1
1150
,326
58,1
9620
,231
162,
026
221,
946
496,
945
536,
264
243,
125
2,06
0,65
619
,975
94,3
21Q
TR
. IV
248,
152
1,90
86,
956
22,3
9450
,970
54,7
2520
,520
163,
070
227,
236
496,
296
559,
119
256,
995
2,10
8,34
126
,577
128,
065
2008
QT
R. I
247,
418
1,92
56,
966
22,4
3548
,520
53,9
3821
,014
164,
973
232,
912
505,
038
562,
536
258,
291
2,12
5,96
623
,182
128,
617
QT
R. I
I25
1,16
72,
033
6,87
622
,818
51,0
3654
,012
22,0
3416
7,27
223
4,28
253
1,29
655
6,72
626
4,37
52,
163,
927
22,9
7012
9,96
2Q
TR
. III
245,
023
2,02
06,
350
22,0
4354
,412
59,3
0622
,001
171,
886
237,
334
563,
738
552,
197
281,
198
2,21
7,50
824
,331
136,
958
QT
R. I
V23
8,77
51,
909
6,11
121
,173
49,6
0257
,255
21,4
3517
1,45
424
6,16
859
4,56
554
1,58
529
4,37
72,
244,
409
26,6
5415
0,02
3
2009
QT
R. I
227,
757
1,81
75,
656
20,2
8443
,996
55,1
9921
,159
170,
162
246,
754
605,
784
529,
609
283,
615
2,21
1,79
227
,300
160,
245
T
able
2.2
0 B
ank
ing
Syst
em:
Con
sum
er I
nst
alm
ent
Cre
dit
- D
ebt
Ou
tsta
nd
ing1
QT
R. I
227,
757
1,81
75,
656
20,2
8443
,996
55,1
9921
,159
170,
162
246,
754
605,
784
529,
609
283,
615
2,21
1,79
227
,300
160,
245
QT
R. I
I22
3,34
91,
780
5,30
519
,632
40,4
8853
,283
20,4
2716
6,36
424
5,87
663
2,42
252
9,97
527
8,61
42,
217,
515
27,9
0516
5,18
8Q
TR
. III
215,
164
1,78
55,
165
19,7
5939
,702
57,5
2019
,894
163,
942
245,
209
638,
244
523,
307
277,
479
2,20
7,17
028
,963
180,
773
QT
R. I
V20
6,68
91,
832
4,95
519
,134
36,3
6955
,227
19,6
9716
3,99
124
3,69
664
8,02
451
5,00
227
8,74
92,
193,
365
28,4
4017
7,65
8
2010
Jan.
204,
189
1,71
14,
919
18,9
1934
,924
54,7
9219
,445
165,
766
238,
873
646,
743
510,
222
273,
050
2,17
3,55
328
,007
173,
138
Feb
.20
1,87
11,
636
4,86
318
,592
33,6
3153
,826
19,3
8816
1,60
423
9,94
864
8,69
150
6,73
026
9,48
32,
160,
263
27,7
9118
3,82
2M
ar.
199,
228
1,55
24,
761
18,1
6432
,345
53,0
3719
,075
166,
094
240,
898
661,
379
498,
410
265,
044
2,15
9,98
727
,774
182,
415
Apr
.19
8,99
31,
462
4,34
117
,833
31,2
8952
,360
19,0
8516
6,12
924
2,37
166
2,89
149
7,39
626
2,85
52,
157,
005
27,0
8217
8,65
9M
ay19
7,65
71,
488
4,08
117
,604
30,3
5251
,387
19,0
3416
6,38
824
2,66
766
1,84
249
3,38
326
2,43
02,
148,
313
27,2
8118
0,86
9Ju
n.19
7,13
81,
296
3,96
617
,244
29,4
2550
,529
18,4
2216
3,51
224
4,59
466
5,88
649
4,60
526
1,01
72,
147,
634
26,4
6517
4,39
0Ju
l.19
4,17
91,
221
3,91
416
,691
29,5
2450
,715
17,8
8415
7,97
124
5,41
167
0,15
549
8,70
925
7,89
92,
144,
273
25,7
6217
9,94
8A
ug.
191,
950
1,18
53,
709
15,9
8129
,617
52,1
0917
,500
157,
320
244,
943
676,
734
503,
233
263,
127
2,15
1,51
225
,982
174,
887
Sep
.18
8,50
91,
046
3,68
215
,257
28,5
8752
,604
17,3
0313
1,45
524
2,36
968
3,85
250
4,39
426
1,53
12,
130,
589
25,1
5216
7,85
7O
ct.
186,
800
979
3,59
215
,085
27,9
2651
,837
17,1
4313
1,02
724
1,60
869
3,39
250
9,51
526
1,03
82,
139,
942
24,5
4616
4,66
4N
ov.
185,
916
996
3,59
415
,002
27,1
8051
,216
16,7
0013
1,12
024
1,66
770
6,76
249
6,54
626
0,08
22,
136,
781
24,9
7317
4,91
9D
ec.
185,
044
985
3,35
315
,126
26,4
6450
,875
16,3
9912
9,86
024
0,39
171
4,61
649
4,96
126
2,87
12,
140,
945
23,6
0217
8,37
420
11Ja
n.18
3,13
687
23,
261
15,1
0725
,468
50,4
8916
,176
128,
657
240,
134
721,
761
493,
609
258,
646
2,13
7,31
625
,309
184,
581
Feb
.18
1,61
889
23,
090
14,4
4424
,833
49,7
1215
,946
127,
622
241,
721
729,
438
487,
294
256,
612
2,13
3,22
225
,239
180,
163
Mar
.18
1,83
788
93,
214
14,0
7224
,291
49,1
4815
,773
125,
429
240,
987
734,
975
479,
768
253,
023
2,12
3,40
625
,059
181,
038
S
OU
RC
E:
The
Cen
tral
Ba
nk o
f The
Bah
amas
1 S
ee n
otes
to T
able
s
28
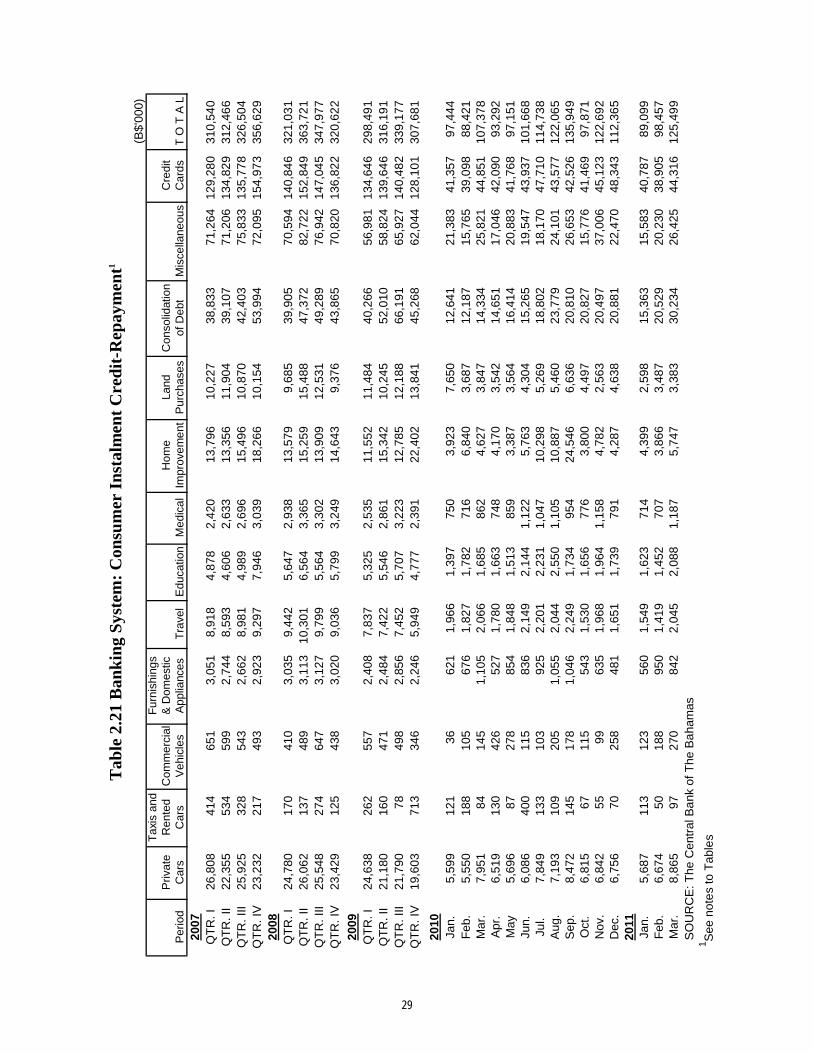
Tab
le 2
.21
Ban
kin
g S
yste
m:
Con
sum
er I
nst
alm
ent
Cre
dit
-Rep
aym
ent1
(B$'
000)
Tax
is a
ndF
urni
shin
gsP
rivat
eR
ente
dC
omm
erci
al&
Dom
estic
Hom
eLa
ndC
onso
lidat
ion
Cre
dit
Per
iod
Car
sC
ars
Veh
icle
sA
pplia
nces
Tra
vel
Edu
catio
nM
edic
alIm
prov
emen
tP
urch
ases
of D
ebt
Mis
cella
neou
sC
ards
T O
T A
L20
07Q
TR
. I26
,808
414
651
3,05
18,
918
4,87
82,
420
13,7
9610
,227
38,8
3371
,264
129,
280
310,
540
QT
R. I
I22
,355
534
599
2,74
48,
593
4,60
62,
633
13,3
5611
,904
39,1
0771
,206
134,
829
312,
466
QT
R. I
II25
,925
328
543
2,66
28,
981
4,98
92,
696
15,4
9610
,870
42,4
0375
,833
135,
778
326,
504
QT
R. I
V23
,232
217
493
2,92
39,
297
7,94
63,
039
18,2
6610
,154
53,9
9472
,095
154,
973
356,
629
2008
QT
R. I
24,7
8017
041
03,
035
9,44
25,
647
2,93
813
,579
9,68
539
,905
70,5
9414
0,84
632
1,03
1Q
TR
. II
26,0
6213
748
93,
113
10,3
016,
564
3,36
515
,259
15,4
8847
,372
82,7
2215
2,84
936
3,72
1Q
TR
. III
25,5
4827
464
73,
127
9,79
95,
564
3,30
213
,909
12,5
3149
,289
76,9
4214
7,04
534
7,97
7Q
TR
. IV
23,4
2912
543
83,
020
9,03
65,
799
3,24
914
,643
9,37
643
,865
70,8
2013
6,82
232
0,62
2
2009
QT
R. I
24,6
3826
255
72,
408
7,83
75,
325
2,53
511
,552
11,4
8440
,266
56,9
8113
4,64
629
8,49
1Q
TR
. II
21,1
8016
047
12,
484
7,42
25,
546
2,86
115
,342
10,2
4552
,010
58,8
2413
9,64
631
6,19
1Q
TR
. III
21,7
9078
498
2,85
67,
452
5,70
73,
223
12,7
8512
,188
66,1
9165
,927
140,
482
339,
177
QT
R. I
V19
,603
713
346
2,24
65,
949
4,77
72,
391
22,4
0213
,841
45,2
6862
,044
128,
101
307,
681
2010
Jan.
5,59
912
136
621
1,96
61,
397
750
3,92
37,
650
12,6
4121
,383
41,3
5797
,444
Feb
.5,
550
188
105
676
1,82
71,
782
716
6,84
03,
687
12,1
8715
,765
39,0
9888
,421
Mar
.7,
951
8414
51,
105
2,06
61,
685
862
4,62
73,
847
14,3
3425
,821
44,8
5110
7,37
8A
pr.
6,51
913
042
652
71,
780
1,66
374
84,
170
3,54
214
,651
17,0
4642
,090
93,2
92M
ay5,
696
8727
885
41,
848
1,51
385
93,
387
3,56
416
,414
20,8
8341
,768
97,1
51Ju
n.6,
086
400
115
836
2,14
92,
144
1,12
25,
763
4,30
415
,265
19,5
4743
,937
101,
668
Jul.
7,84
913
310
392
52,
201
2,23
11,
047
10,2
985,
269
18,8
0218
,170
47,7
1011
4,73
8A
ug.
7,19
310
920
51,
055
2,04
42,
550
1,10
510
,887
5,46
023
,779
24,1
0143
,577
122,
065
Sep
.8,
472
145
178
1,04
62,
249
1,73
495
424
,546
6,63
620
,810
26,6
5342
,526
135,
949
Oct
.6,
815
6711
554
31,
530
1,65
677
63,
800
4,49
720
,827
15,7
7641
,469
97,8
71N
ov.
6,84
255
9963
51,
968
1,96
41,
158
4,78
22,
563
20,4
9737
,006
45,1
2312
2,69
2D
ec.
6,75
670
258
481
1,65
11,
739
791
4,28
74,
638
20,8
8122
,470
48,3
4311
2,36
520
11Ja
n.5,
687
113
123
560
1,54
91,
623
714
4,39
92,
598
15,3
6315
,583
40,7
8789
,099
Feb
.6,
674
5018
895
01,
419
1,45
270
73,
866
3,48
720
,529
20,2
3038
,905
98,4
57M
ar.
8,86
597
270
842
2,04
52,
088
1,18
75,
747
3,38
330
,234
26,4
2544
,316
125,
499
S
OU
RC
E: T
he C
entr
al B
ank
of T
he B
aha
mas
1 S
ee n
ote
s to
Tab
les
29
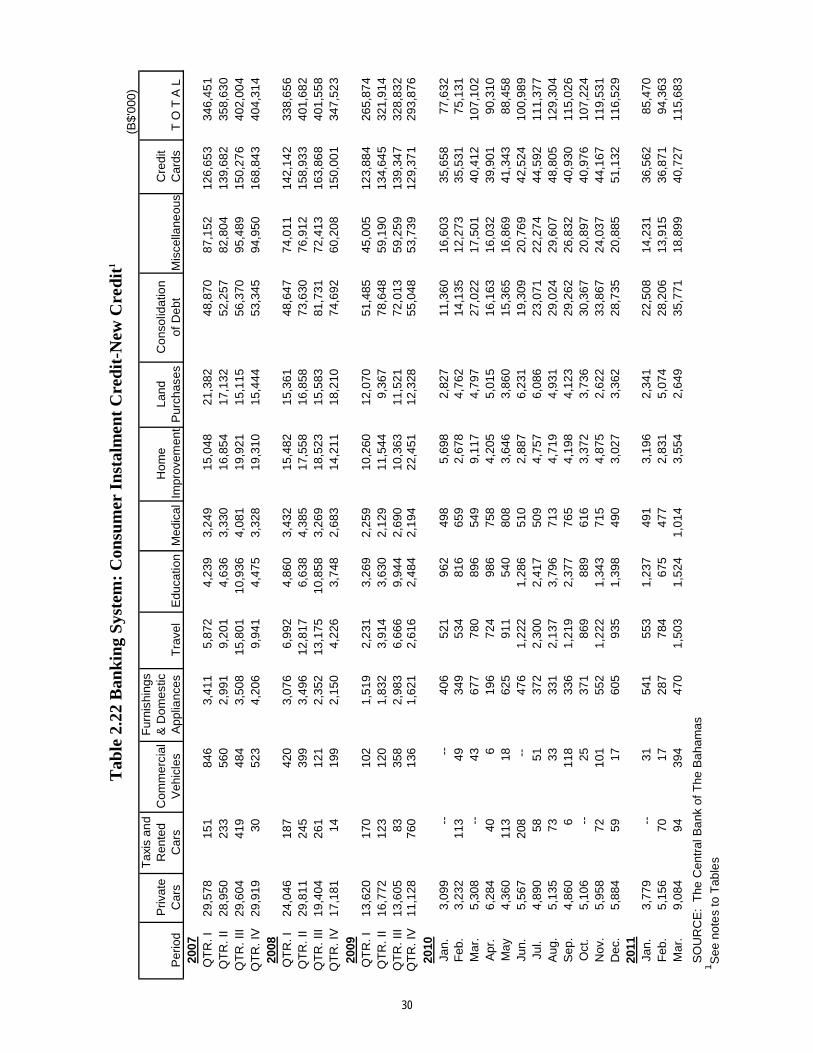
(B
$'00
0)T
axis
an
dF
urni
shin
gsP
rivat
eR
ente
dC
omm
erci
al&
Dom
estic
Hom
eLa
ndC
onso
lidat
ion
Cre
dit
Per
iod
Car
sC
ars
Veh
icle
sA
pplia
nces
Tra
vel
Edu
catio
nM
edic
alIm
prov
emen
tP
urch
ases
of D
ebt
Mis
cella
neou
sC
ards
T O
T A
L20
07Q
TR
. I29
,578
151
846
3,41
15,
872
4,23
93,
249
15,0
4821
,382
48,8
7087
,152
126,
653
346,
451
QT
R. I
I28
,950
233
560
2,99
19,
201
4,63
63,
330
16,8
5417
,132
52,2
5782
,804
139,
682
358,
630
QT
R. I
II29
,604
419
484
3,50
815
,801
10,9
364,
081
19,9
2115
,115
56,3
7095
,489
150,
276
402,
004
QT
R. I
V29
,919
3052
34,
206
9,94
14,
475
3,32
819
,310
15,4
4453
,345
94,9
5016
8,84
340
4,31
420
08Q
TR
. I24
,046
187
420
3,07
66,
992
4,86
03,
432
15,4
8215
,361
48,6
4774
,011
142,
142
338,
656
QT
R. I
I29
,811
245
399
3,49
612
,817
6,63
84,
385
17,5
5816
,858
73,6
3076
,912
158,
933
401,
682
QT
R. I
II19
,404
261
121
2,35
213
,175
10,8
583,
269
18,5
2315
,583
81,7
3172
,413
163,
868
401,
558
QT
R. I
V17
,181
1419
92,
150
4,22
63,
748
2,68
314
,211
18,2
1074
,692
60,2
0815
0,00
134
7,52
320
09Q
TR
. I13
,620
170
102
1,51
92,
231
3,26
92,
259
10,2
6012
,070
51,4
8545
,005
123,
884
265,
874
QT
R. I
I16
,772
123
120
1,83
23,
914
3,63
02,
129
11,5
449,
367
78,6
4859
,190
134,
645
321,
914
QT
R. I
II13
,605
8335
82,
983
6,66
69,
944
2,69
010
,363
11,5
2172
,013
59,2
5913
9,34
732
8,83
2Q
TR
. IV
11,1
2876
013
61,
621
2,61
62,
484
2,19
422
,451
12,3
2855
,048
53,7
3912
9,37
129
3,87
620
10Ja
n.3,
099
--
-
-40
652
196
249
85,
698
2,82
711
,360
16,6
0335
,658
77,6
32F
eb.
3,23
211
349
349
534
816
659
2,67
84,
762
14,1
3512
,273
35,5
3175
,131
Mar
.5,
308
--
4367
778
089
654
99,
117
4,79
727
,022
17,5
0140
,412
107,
102
Apr
.6,
284
406
196
724
986
758
4,20
55,
015
16,1
6316
,032
39,9
0190
,310
May
4,36
011
318
625
911
540
808
3,64
63,
860
15,3
6516
,869
41,3
4388
,458
Jun.
5,56
720
8
--47
61,
222
1,28
651
02,
887
6,23
119
,309
20,7
6942
,524
100,
989
Jul.
4,89
058
5137
22,
300
2,41
750
94,
757
6,08
623
,071
22,2
7444
,592
111,
377
Aug
.5,
135
7333
331
2,13
73,
796
713
4,71
94,
931
29,0
2429
,607
48,8
0512
9,30
4S
ep.
4,86
06
118
336
1,21
92,
377
765
4,19
84,
123
29,2
6226
,832
40,9
3011
5,02
6O
ct.
5,10
6
-
-25
371
869
889
616
3,37
23,
736
30,3
6720
,897
40,9
7610
7,22
4N
ov.
5,95
872
101
552
1,22
21,
343
715
4,87
52,
622
33,8
6724
,037
44,1
6711
9,53
1D
ec.
5,88
459
1760
593
51,
398
490
3,02
73,
362
28,7
3520
,885
51,1
3211
6,52
920
11Ja
n.3,
779
--
3154
155
31,
237
491
3,19
62,
341
22,5
0814
,231
36,5
6285
,470
Feb
.5,
156
7017
287
784
675
477
2,83
15,
074
28,2
0613
,915
36,8
7194
,363
Mar
.9,
084
9439
447
01,
503
1,52
41,
014
3,55
42,
649
35,7
7118
,899
40,7
2711
5,68
3
S
OU
RC
E:
The
Cen
tral
Ba
nk o
f The
Ba
ham
as
1 S
ee n
ote
s to
Tab
les
Tab
le 2
.22
Ban
kin
g S
yste
m:
Con
sum
er I
nst
alm
ent
Cre
dit
-New
Cre
dit
1
30
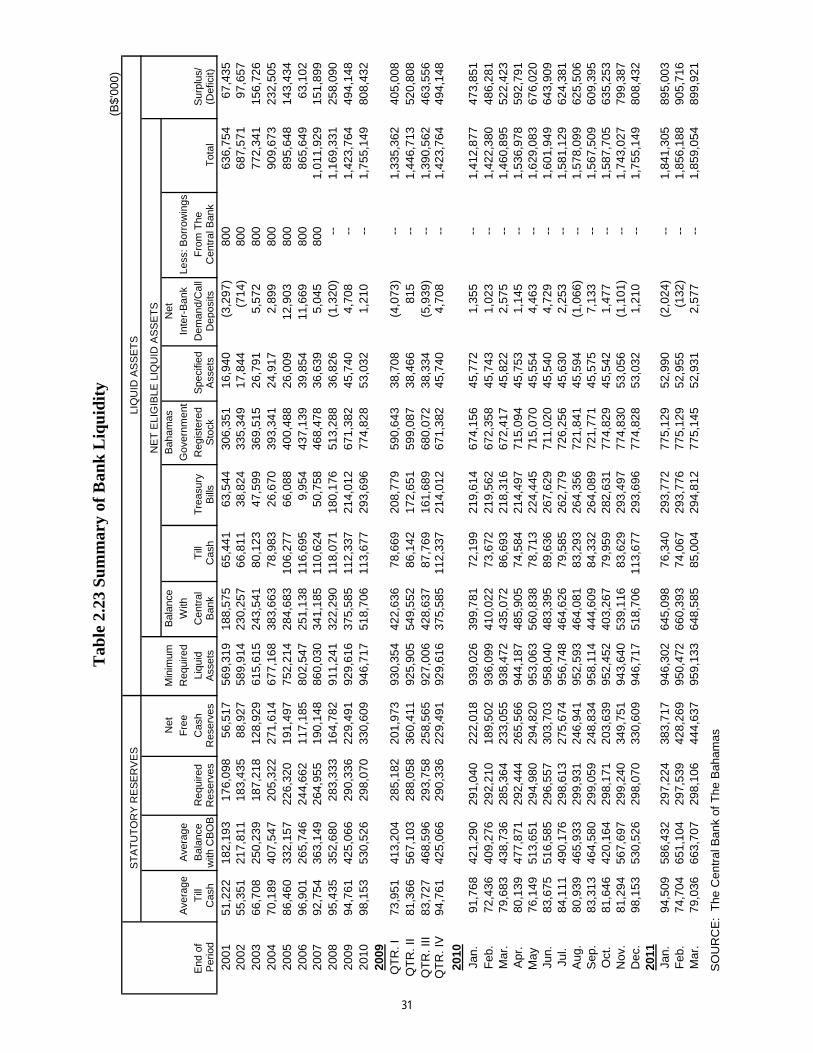
(B$'
000)
Net
Min
imum
Bal
ance
Bah
amas
Net
Ave
rage
Ave
rage
Fre
eR
equi
red
With
Gov
ernm
ent
Inte
r-B
ank
Less
: Bor
row
ings
End
of
Till
Bal
ance
Req
uire
dC
ash
Liqu
idC
entr
alT
illT
reas
ury
Reg
iste
red
Spe
cifie
dD
eman
d/C
all
Fro
m T
heS
urpl
us/
Per
iod
Cas
hw
ith C
BO
BR
eser
ves
Res
erve
sA
sset
sB
ank
Cas
hB
ills
Sto
ckA
sset
sD
epos
itsC
entr
al B
ank
Tot
al(D
efic
it)
2001
51,2
2218
2,19
317
6,09
856
,517
569,
319
188,
575
65,4
4163
,544
306,
351
16,9
40(3
,297
)
800
636,
754
67,4
3520
0255
,351
217,
811
183,
435
88,9
2758
9,91
423
0,25
766
,811
38,8
2433
5,34
917
,844
(714
)
80
068
7,57
197
,657
2003
66,7
0825
0,23
918
7,21
812
8,92
961
5,61
524
3,54
180
,123
47,5
9936
9,51
526
,791
5,57
2
800
772,
341
156,
726
2004
70,1
8940
7,54
720
5,32
227
1,61
467
7,16
838
3,66
378
,983
26,6
7039
3,34
124
,917
2,89
9
800
909,
673
232,
505
2005
86,4
6033
2,15
722
6,32
019
1,49
775
2,21
428
4,68
310
6,27
766
,088
400,
488
26,0
0912
,903
800
895,
648
143,
434
2006
96,9
0126
5,74
624
4,66
211
7,18
580
2,54
725
1,13
811
6,69
59,
954
437,
139
39,8
5411
,669
800
865,
649
63,1
0220
0792
,754
363,
149
264,
955
190,
148
860,
030
341,
185
110,
624
50,7
5846
8,47
836
,639
5,04
580
01,
011,
929
151,
899
2008
95,4
3535
2,68
028
3,33
316
4,78
291
1,24
132
2,29
011
8,07
118
0,17
651
3,28
836
,826
(1,3
20)
-
-1,
169,
331
258,
090
2009
94,7
6142
5,06
629
0,33
622
9,49
192
9,61
637
5,58
511
2,33
721
4,01
267
1,38
245
,740
4,70
8
--
1,42
3,76
449
4,14
820
1098
,153
530,
526
298,
070
330,
609
946,
717
518,
706
113,
677
293,
696
774,
828
53,0
321,
210
-
-1,
755,
149
808,
432
2009
QT
R. I
73,9
5141
3,20
428
5,18
220
1,97
393
0,35
442
2,63
678
,669
208,
779
590,
643
38,7
08(4
,073
)
--
1,33
5,36
240
5,00
8Q
TR
. II
81,3
6656
7,10
328
8,05
836
0,41
192
5,90
554
9,55
286
,142
172,
651
599,
087
38,4
6681
5
-
-1,
446,
713
520,
808
QT
R. I
II83
,727
468,
596
293,
758
258,
565
927,
006
428,
637
87,7
6916
1,68
968
0,07
238
,334
(5,9
39)
-
-1,
390,
562
463,
556
QT
R. I
V94
,761
425,
066
290,
336
229,
491
929,
616
375,
585
112,
337
214,
012
671,
382
45,7
404,
708
-
-1,
423,
764
494,
148
2010
Jan.
91,7
6842
1,29
029
1,04
022
2,01
893
9,02
639
9,78
172
,199
219,
614
674,
156
45,7
721,
355
--
1,41
2,87
747
3,85
1F
eb.
72,4
3640
9,27
629
2,21
018
9,50
293
6,09
941
0,02
273
,672
219,
562
672,
358
45,7
431,
023
--
1,42
2,38
048
6,28
1M
ar.
79,6
8343
8,73
628
5,36
423
3,05
593
8,47
243
5,07
286
,693
218,
316
672,
417
45,8
222,
575
--
1,46
0,89
552
2,42
3A
pr.
80,1
3947
7,87
129
2,44
426
5,56
694
4,18
748
5,90
574
,584
214,
497
715,
094
45,7
531,
145
--
1,53
6,97
859
2,79
1M
ay
76,1
4951
3,65
129
4,98
029
4,82
095
3,06
356
0,83
878
,713
224,
445
715,
070
45,5
544,
463
--
1,62
9,08
367
6,02
0Ju
n.83
,675
516,
585
296,
557
303,
703
958,
040
483,
395
89,6
3626
7,62
971
1,02
045
,540
4,72
9
-
-1,
601,
949
643,
909
Jul.
84,1
1149
0,17
629
8,61
327
5,67
495
6,74
846
4,62
679
,585
262,
779
726,
256
45,6
302,
253
--
1,58
1,12
962
4,38
1A
ug.
80,9
3946
5,93
329
9,93
124
6,94
195
2,59
346
4,08
183
,293
264,
356
721,
841
45,5
94(1
,066
)
--
1,57
8,09
962
5,50
6S
ep.
83,3
1346
4,58
029
9,05
924
8,83
495
8,11
444
4,60
984
,332
264,
089
721,
771
45,5
757,
133
--
1,56
7,50
960
9,39
5O
ct.
81,6
4642
0,16
429
8,17
120
3,63
995
2,45
240
3,26
779
,959
282,
631
774,
829
45,5
421,
477
--
1,58
7,70
563
5,25
3N
ov.
81,2
9456
7,69
729
9,24
034
9,75
194
3,64
053
9,11
683
,629
293,
497
774,
830
53,0
56(1
,101
)
-
-1,
743,
027
799,
387
Dec
.98
,153
530,
526
298,
070
330,
609
946,
717
518,
706
113,
677
293,
696
774,
828
53,0
321,
210
--
1,75
5,14
980
8,43
220
11Ja
n.94
,509
586,
432
297,
224
383,
717
946,
302
645,
098
76,3
4029
3,77
277
5,12
952
,990
(2,0
24)
--
1,84
1,30
589
5,00
3F
eb.
74,7
0465
1,10
429
7,53
942
8,26
995
0,47
266
0,39
374
,067
293,
776
775,
129
52,9
55(1
32)
--
1,85
6,18
890
5,71
6M
ar.
79,0
3666
3,70
729
8,10
644
4,63
795
9,13
364
8,58
585
,004
294,
812
775,
145
52,9
312,
577
--
1,85
9,05
489
9,92
1
SO
UR
CE
: T
he C
entr
al B
ank
of T
he B
aham
as
Tab
le 2
.23
Su
mm
ary
of B
ank
Liq
uid
ity
ST
AT
UT
OR
Y R
ES
ER
VE
SLI
QU
ID A
SS
ET
S
NE
T E
LIG
IBLE
LIQ
UID
AS
SE
TS
31
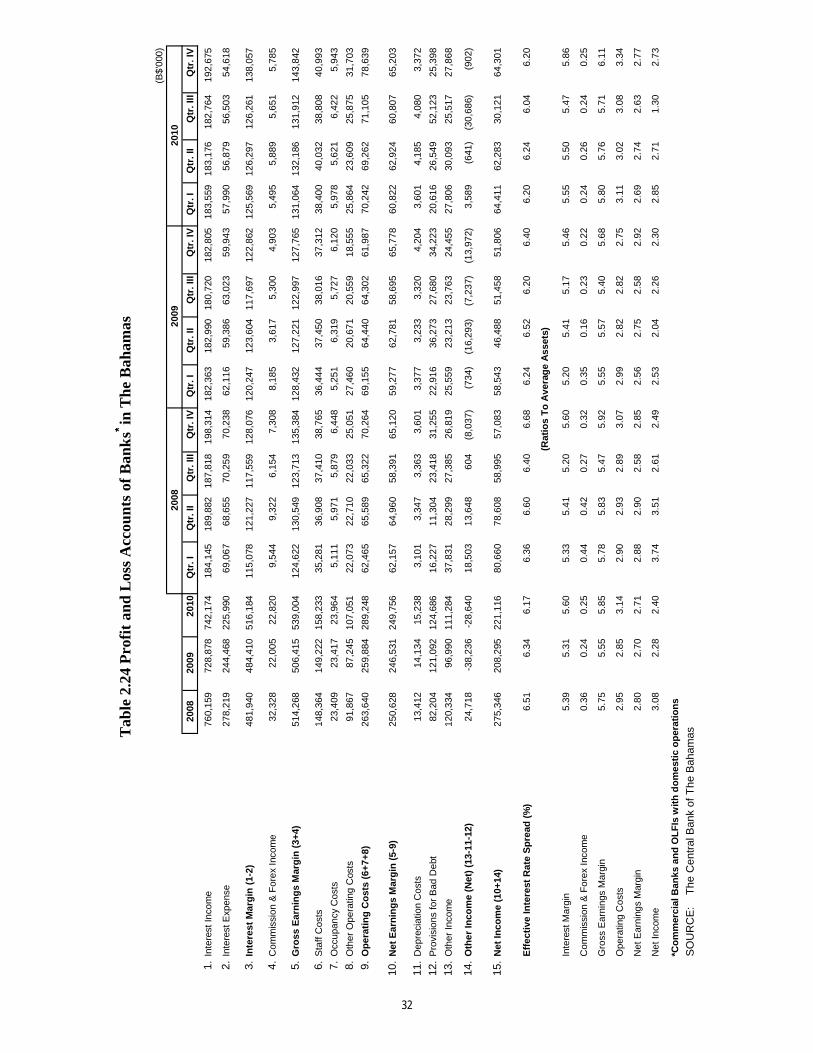
(B$'
000)
2008
2009
2010
Qtr
. IQ
tr. I
IQ
tr. I
IIQ
tr. I
VQ
tr. I
Qtr
. II
Qtr
. III
Qtr
. IV
Qtr
. IQ
tr. I
IQ
tr. I
IIQ
tr. I
V
1.In
tere
st In
com
e76
0,15
972
8,87
874
2,17
418
4,14
518
9,88
218
7,81
819
8,31
418
2,36
318
2,99
018
0,72
018
2,80
518
3,55
918
3,17
618
2,76
419
2,67
5
2.In
tere
st E
xpen
se27
8,21
924
4,46
822
5,99
069
,067
68,6
5570
,259
70,2
3862
,116
59,3
8663
,023
59,9
4357
,990
56,8
7956
,503
54,6
18
3.In
tere
st M
arg
in (
1-2)
481,
940
484,
410
516,
184
115,
078
121,
227
117,
559
128,
076
120,
247
123,
604
117,
697
122,
862
125,
569
126,
297
126,
261
138,
057
4.C
omm
issi
on &
For
ex In
com
e32
,328
22,0
0522
,820
9,54
49,
322
6,15
47,
308
8,18
53,
617
5,30
04,
903
5,49
55,
889
5,65
15,
785
5.G
ross
Ear
nin
gs
Mar
gin
(3+
4)51
4,26
850
6,41
553
9,00
412
4,62
213
0,54
912
3,71
313
5,38
412
8,43
212
7,22
112
2,99
712
7,76
513
1,06
413
2,18
613
1,91
214
3,84
2
6.S
taff
Cos
ts14
8,36
414
9,22
215
8,23
335
,281
36,9
0837
,410
38,7
6536
,444
37,4
5038
,016
37,3
1238
,400
40,0
3238
,808
40,9
93
7.O
ccup
ancy
Cos
ts23
,409
23,4
1723
,964
5,11
15,
971
5,87
96,
448
5,25
16,
319
5,72
76,
120
5,97
85,
621
6,42
25,
943
8.O
ther
Ope
ratin
g C
osts
91,8
6787
,245
107,
051
22,0
7322
,710
22,0
3325
,051
27,4
6020
,671
20,5
5918
,555
25,8
6423
,609
25,8
7531
,703
9.O
per
atin
g C
ost
s (6
+7+
8)26
3,64
025
9,88
428
9,24
862
,465
65,5
8965
,322
70,2
6469
,155
64,4
4064
,302
61,9
8770
,242
69,2
6271
,105
78,6
39
10.
Net
Ear
nin
gs
Mar
gin
(5-
9)25
0,62
824
6,53
124
9,75
662
,157
64,9
6058
,391
65,1
2059
,277
62,7
8158
,695
65,7
7860
,822
62,9
2460
,807
65,2
03
11.
Dep
reci
atio
n C
osts
13,4
1214
,134
15,2
383,
101
3,34
73,
363
3,60
13,
377
3,23
33,
320
4,20
43,
601
4,18
54,
080
3,37
2
12.
Pro
visi
ons
for
Bad
Deb
t82
,204
121,
092
124,
686
16,2
2711
,304
23,4
1831
,255
22,9
1636
,273
27,6
8034
,223
20,6
1626
,549
52,1
2325
,398
13.
Oth
er In
com
e12
0,33
496
,990
111,
284
37,8
3128
,299
27,3
8526
,819
25,5
5923
,213
23,7
6324
,455
27,8
0630
,093
25,5
1727
,868
14.
Oth
er In
com
e (N
et)
(13-
11-1
2)24
,718
-38,
236
-28,
640
18,5
0313
,648
604
(8,0
37)
(7
34)
(16,
293)
(7
,237
)
(13,
972)
3,
589
(641
)
(3
0,68
6)(9
02)
15.
Net
Inco
me
(10+
14)
275,
346
208,
295
221,
116
80,6
6078
,608
58,9
9557
,083
58,5
4346
,488
51,4
5851
,806
64,4
1162
,283
30,1
2164
,301
Eff
ecti
ve In
tere
st R
ate
Sp
read
(%
)6.
516.
346.
176.
366.
606.
406.
686.
246.
526.
206.
406.
206.
246.
046.
20
Inte
rest
Mar
gin
5.39
5.31
5.60
5.33
5.41
5.20
5.60
5.20
5.41
5.17
5.46
5.55
5.50
5.47
5.86
Com
mis
sion
& F
orex
Inco
me
0.36
0.24
0.25
0.44
0.42
0.27
0.32
0.35
0.16
0.23
0.22
0.24
0.26
0.24
0.25
Gro
ss E
arni
ngs
Mar
gin
5.75
5.55
5.85
5.78
5.83
5.47
5.92
5.55
5.57
5.40
5.68
5.80
5.76
5.71
6.11
Ope
ratin
g C
osts
2.95
2.85
3.14
2.90
2.93
2.89
3.07
2.99
2.82
2.82
2.75
3.11
3.02
3.08
3.34
Net
Ear
ning
s M
argi
n2.
802.
702.
712.
882.
902.
582.
852.
562.
752.
582.
922.
692.
742.
632.
77
Net
Inco
me
3.08
2.28
2.40
3.74
3.51
2.61
2.49
2.53
2.04
2.26
2.30
2.85
2.71
1.30
2.73
*Co
mm
erci
al B
anks
an
d O
LF
Is w
ith
do
mes
tic
op
erat
ion
s
SO
UR
CE
: T
he C
entr
al B
ank
of T
he B
aham
as
2008
2010
2009
Tab
le 2
.24
Pro
fit
and
Los
s A
ccou
nts
of
Ban
ks* in
Th
e B
aham
as
(Rat
ios
To
Ave
rag
e A
sset
s)
32
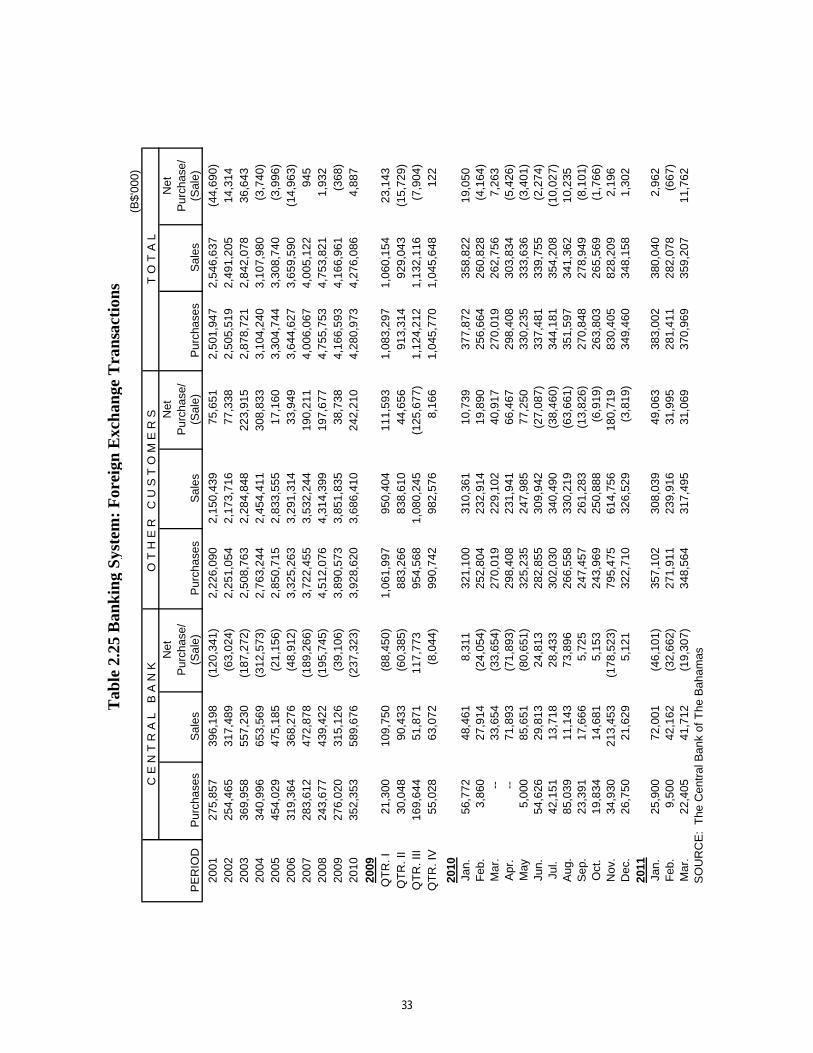
Tab
le 2
.25
Ban
kin
g S
yste
m:
For
eign
Exc
han
ge T
ran
sact
ion
s
(B$'
000)
C E
N T
R A
L
B A
N K
O T
H E
R
C U
S T
O M
E R
S
T O
T A
LN
etN
etN
etP
urch
ase/
Pur
chas
e/P
urch
ase/
PE
RIO
DP
urch
ases
Sal
es(S
ale)
Pur
chas
esS
ales
(Sal
e)P
urch
ases
Sal
es(S
ale)
2001
275,
857
396,
198
(120
,341
)
2,22
6,09
02,
150,
439
75,6
512,
501,
947
2,54
6,63
7(4
4,69
0)
2002
254,
465
317,
489
(63,
024)
2,25
1,05
42,
173,
716
77,3
382,
505,
519
2,49
1,20
514
,314
2003
369,
958
557,
230
(187
,272
)
2,50
8,76
32,
284,
848
223,
915
2,87
8,72
12,
842,
078
36,6
43
20
0434
0,99
665
3,56
9(3
12,5
73)
2,
763,
244
2,45
4,41
130
8,83
33,
104,
240
3,10
7,98
0(3
,740
)
20
0545
4,02
947
5,18
5(2
1,15
6)
2,
850,
715
2,83
3,55
517
,160
3,30
4,74
43,
308,
740
(3,9
96)
2006
319,
364
368,
276
(48,
912)
3,32
5,26
33,
291,
314
33,9
493,
644,
627
3,65
9,59
0(1
4,96
3)
2007
283,
612
472,
878
(189
,266
)
3,72
2,45
53,
532,
244
190,
211
4,00
6,06
74,
005,
122
945
2008
243,
677
439,
422
(195
,745
)
4,51
2,07
64,
314,
399
197,
677
4,75
5,75
34,
753,
821
1,93
2
2009
276,
020
315,
126
(39,
106)
3,89
0,57
33,
851,
835
38,7
384,
166,
593
4,16
6,96
1(3
68)
20
1035
2,35
358
9,67
6(2
37,3
23)
3,
928,
620
3,68
6,41
024
2,21
04,
280,
973
4,27
6,08
64,
887
2009
QT
R. I
21,3
0010
9,75
0(8
8,45
0)
1,
061,
997
950,
404
111,
593
1,
083,
297
1,06
0,15
423
,143
QT
R. I
I30
,048
90,4
33(6
0,38
5)
88
3,26
683
8,61
044
,656
913,
314
929,
043
(15,
729)
Q
TR
. III
169,
644
51,8
7111
7,77
3
954,
568
1,08
0,24
5(1
25,6
77)
1,
124,
212
1,13
2,11
6(7
,904
)
Q
TR
. IV
55,0
2863
,072
(8,0
44)
990,
742
982,
576
8,16
6
1,04
5,77
01,
045,
648
122
2010
Jan.
56,7
7248
,461
8,31
1
321,
100
310,
361
10,7
39
37
7,87
235
8,82
219
,050
Feb
.3,
860
27,9
14(2
4,05
4)
25
2,80
423
2,91
419
,890
256,
664
260,
828
(4,1
64)
Mar
.
-
-33
,654
(33,
654)
270,
019
229,
102
40,9
17
27
0,01
926
2,75
67,
263
A
pr.
--
71,8
93(7
1,89
3)
29
8,40
823
1,94
166
,467
298,
408
303,
834
(5,4
26)
May
5,00
085
,651
(80,
651)
325,
235
247,
985
77,2
50
33
0,23
533
3,63
6(3
,401
)
Ju
n.54
,626
29,8
1324
,813
282,
855
309,
942
(27,
087)
337,
481
339,
755
(2,2
74)
Jul.
42,1
5113
,718
28,4
33
30
2,03
034
0,49
0(3
8,46
0)
34
4,18
135
4,20
8(1
0,02
7)
Aug
.85
,039
11,1
4373
,896
266,
558
330,
219
(63,
661)
351,
597
341,
362
10,2
35
S
ep.
23,3
9117
,666
5,72
5
247,
457
261,
283
(13,
826)
270,
848
278,
949
(8,1
01)
Oct
.19
,834
14,6
815,
153
24
3,96
925
0,88
8(6
,919
)
26
3,80
326
5,56
9(1
,766
)
N
ov.
34,9
3021
3,45
3(1
78,5
23)
79
5,47
561
4,75
618
0,71
9
830,
405
828,
209
2,19
6
Dec
.26
,750
21,6
295,
121
32
2,71
032
6,52
9(3
,819
)
34
9,46
034
8,15
81,
302
20
11Ja
n.25
,900
72,0
01(4
6,10
1)
35
7,10
230
8,03
949
,063
383,
002
380,
040
2,96
2
Feb
.9,
500
42,1
62(3
2,66
2)
27
1,91
123
9,91
631
,995
281,
411
282,
078
(667
)
Mar
.22
,405
41,7
12(1
9,30
7)
34
8,56
431
7,49
531
,069
370,
969
359,
207
11,7
62
SO
UR
CE
: T
he C
entr
al B
ank
of T
he B
aham
as
33
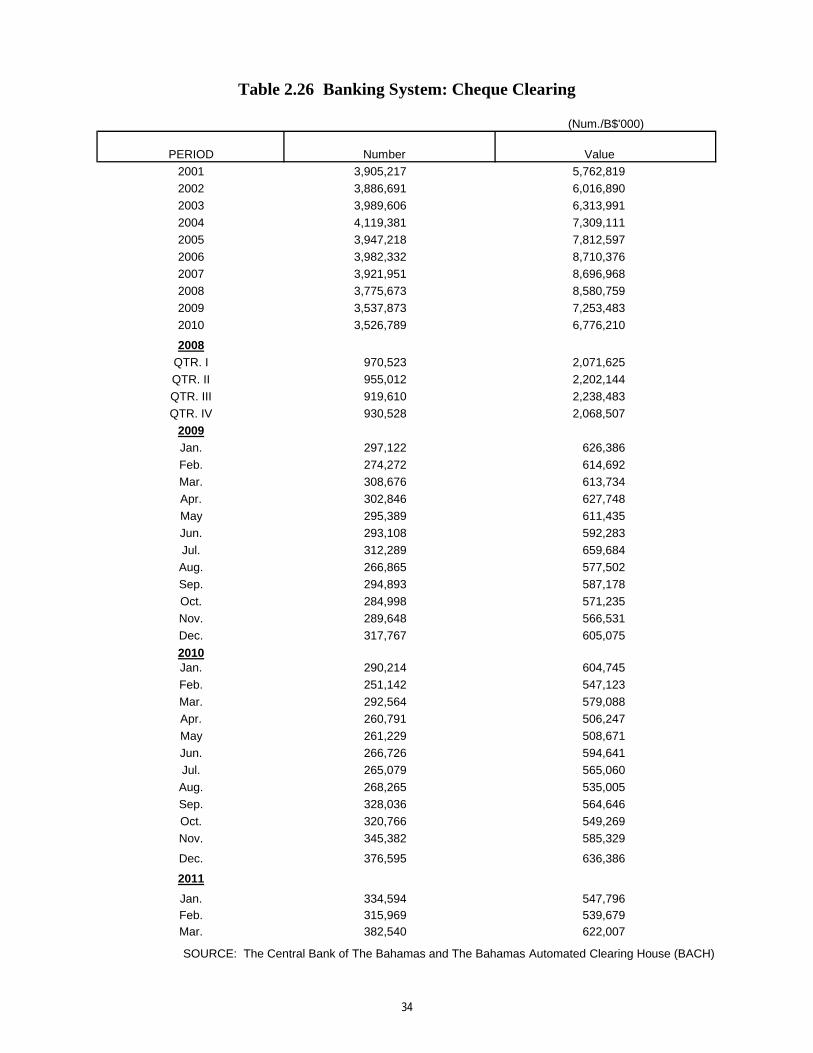
(Num./B$'000)
PERIOD Number Value
2001 3,905,217 5,762,819
2002 3,886,691 6,016,890
2003 3,989,606 6,313,991
2004 4,119,381 7,309,111
2005 3,947,218 7,812,597
2006 3,982,332 8,710,376
2007 3,921,951 8,696,968
2008 3,775,673 8,580,759
2009 3,537,873 7,253,483
2010 3,526,789 6,776,210
2008
QTR. I 970,523 2,071,625
QTR. II 955,012 2,202,144
QTR. III 919,610 2,238,483
QTR. IV 930,528 2,068,507
2009
Jan. 297,122 626,386
Feb. 274,272 614,692
Mar. 308,676 613,734
Apr. 302,846 627,748
May 295,389 611,435
Jun. 293,108 592,283
Jul. 312,289 659,684
Aug. 266,865 577,502
Sep. 294,893 587,178
Oct. 284,998 571,235
Nov. 289,648 566,531
Dec. 317,767 605,075
2010Jan. 290,214 604,745
Feb. 251,142 547,123
Mar. 292,564 579,088
Apr. 260,791 506,247
May 261,229 508,671
Jun. 266,726 594,641
Jul. 265,079 565,060
Aug. 268,265 535,005
Sep. 328,036 564,646
Oct. 320,766 549,269
Nov. 345,382 585,329
Dec. 376,595 636,386
2011
Jan. 334,594 547,796Feb. 315,969 539,679Mar. 382,540 622,007
SOURCE: The Central Bank of The Bahamas and The Bahamas Automated Clearing House (BACH)
Table 2.26 Banking System: Cheque Clearing
34
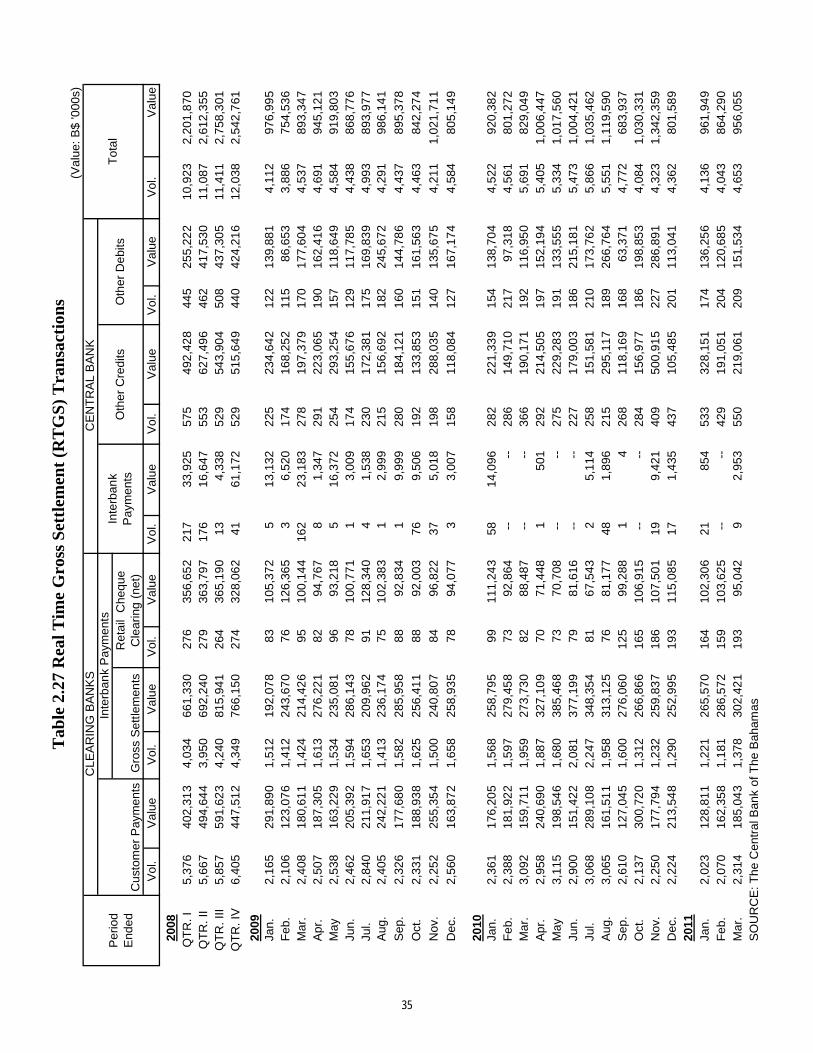
(Val
ue: B
$ '0
00s)
Vol
.V
alue
Vol
.V
alue
Vol
.V
alue
Vol
.V
alue
Vol
.V
alue
Vol
.V
alue
Vol
.V
alue
2008
QT
R. I
5,37
640
2,31
3
4,03
466
1,33
0
276
356,
652
217
33,9
25
57
549
2,42
8
445
255,
222
10
,923
2,
201,
870
QT
R. I
I5,
667
494,
644
3,
950
692,
240
27
936
3,79
7
17
616
,647
553
627,
496
46
241
7,53
0
11,0
87
2,61
2,3
55Q
TR
. III
5,85
759
1,62
3
4,24
081
5,94
1
264
365,
190
13
4,33
8
529
543,
904
50
843
7,30
5
11,4
11
2,75
8,3
01Q
TR
. IV
6,40
544
7,51
2
4,34
976
6,15
0
274
328,
062
41
61,1
72
52
951
5,64
9
440
424,
216
12
,038
2,
542,
761
2009
Jan.
2,16
529
1,89
0
1,51
219
2,07
8
8310
5,37
2
5
13,1
32
22
523
4,64
2
122
139,
881
4,
112
976,
995
Feb
. 2,
106
123,
076
1,
412
243,
670
76
126,
365
3
6,
520
17
416
8,25
2
115
86,6
53
3,
886
754,
536
Mar
.2,
408
180,
611
1,
424
214,
426
95
100,
144
162
23,1
83
27
819
7,37
9
170
177,
604
4,
537
893,
347
Apr
.2,
507
187,
305
1,
613
276,
221
82
94,7
67
8
1,
347
29
122
3,06
5
190
162,
416
4,
691
945,
121
May
2,53
816
3,22
9
1,53
423
5,08
1
9693
,218
5
16,3
72
25
429
3,25
4
157
118,
649
4,
584
919,
803
Jun.
2,46
220
5,39
2
1,59
428
6,14
3
7810
0,77
1
1
3,00
9
174
155,
676
12
911
7,78
5
4,43
8
86
8,77
6
Ju
l.2,
840
211,
917
1,
653
209,
962
91
128,
340
4
1,
538
23
017
2,38
1
175
169,
839
4,
993
893,
977
Aug
.2,
405
242,
221
1,
413
236,
174
75
102,
383
1
2,
999
21
515
6,69
2
182
245,
672
4,
291
986,
141
Sep
.2,
326
177,
680
1,
582
285,
958
88
92,8
34
1
9,
999
28
018
4,12
1
160
144,
786
4,
437
895,
378
Oct
.2,
331
188,
938
1,
625
256,
411
88
92,0
03
76
9,50
6
192
133,
853
15
116
1,56
3
4,46
3
84
2,27
4
Nov
.2,
252
255,
354
1,
500
240,
807
84
96,8
22
37
5,01
8
198
288,
035
14
013
5,67
5
4,21
1
1,
021,
711
Dec
.2,
560
163,
872
1,
658
258,
935
78
94,0
77
3
3,
007
15
811
8,08
4
127
167,
174
4,
584
805,
149
2010
Jan.
2,36
117
6,20
5
1,56
825
8,79
5
9911
1,24
3
58
14
,096
282
221,
339
15
413
8,70
4
4,52
2
92
0,38
2
F
eb.
2,38
818
1,92
2
1,59
727
9,45
8
7392
,864
--
--28
614
9,71
0
217
97,3
18
4,
561
801,
272
Mar
.3,
092
159,
711
1,
959
273,
730
82
88,4
87
--
--
366
190,
171
19
211
6,95
0
5,69
1
82
9,04
9
A
pr.
2,95
824
0,69
0
1,88
732
7,10
9
7071
,448
1
501
292
214,
505
19
715
2,19
4
5,40
5
1,
006,
447
May
3,11
519
8,54
6
1,68
038
5,46
8
7370
,708
--
--
275
229,
283
19
113
3,55
5
5,33
4
1,
017,
560
Jun.
2,90
015
1,42
2
2,08
137
7,19
9
7981
,616
--
--
227
179,
003
18
621
5,18
1
5,47
3
1,
004,
421
Jul.
3,06
828
9,10
8
2,24
734
8,35
4
8167
,543
2
5,11
4
258
151,
581
21
017
3,76
2
5,86
6
1,
035,
462
Aug
.3,
065
161,
511
1,
958
313,
125
76
81,1
77
48
1,89
6
215
295,
117
18
926
6,76
4
5,55
1
1,
119,
590
Sep
.2,
610
127,
045
1,
600
276,
060
12
599
,288
1
4
26
811
8,16
9
168
63,3
71
4,
772
683,
937
Oct
.2,
137
300,
720
1,
312
266,
866
16
510
6,91
5
--
--28
415
6,97
7
186
198,
853
4,
084
1,03
0,3
31N
ov.
2,25
017
7,79
4
1,23
225
9,83
7
186
107,
501
19
9,42
1
409
500,
915
22
728
6,89
1
4,32
3
1,
342,
359
Dec
.2,
224
213,
548
1,
290
252,
995
19
311
5,08
5
17
1,
435
43
710
5,48
5
201
113,
041
4,
362
801,
589
2011
Jan.
2,02
312
8,81
1
1,22
126
5,57
0
164
102,
306
21
854
533
328,
151
17
413
6,25
6
4,13
6
96
1,94
9
F
eb.
2,07
016
2,35
8
1,18
128
6,57
2
159
103,
625
--
--
429
191,
051
20
412
0,68
5
4,04
3
86
4,29
0
M
ar.
2,31
418
5,04
3
1,37
830
2,42
1
193
95,0
42
9
2,
953
55
021
9,06
1
209
151,
534
4,
653
956,
055
SO
UR
CE
: The
Cen
tral
Ban
k of
The
Bah
amas
Inte
rban
k P
aym
ents
Ret
ail
Che
que
Cle
arin
g (
net)
Tot
alIn
terb
ank
Pay
men
tsC
LEA
RIN
G B
AN
KS
Cus
tom
er P
aym
ents
Tab
le 2
.27
Rea
l Tim
e G
ross
Set
tlem
ent
(RT
GS
) T
ran
sact
ion
s
Gro
ss S
ettle
men
ts
Per
iod
End
ed
CE
NT
RA
L B
AN
K
Oth
er C
redi
tsO
ther
Deb
its
35
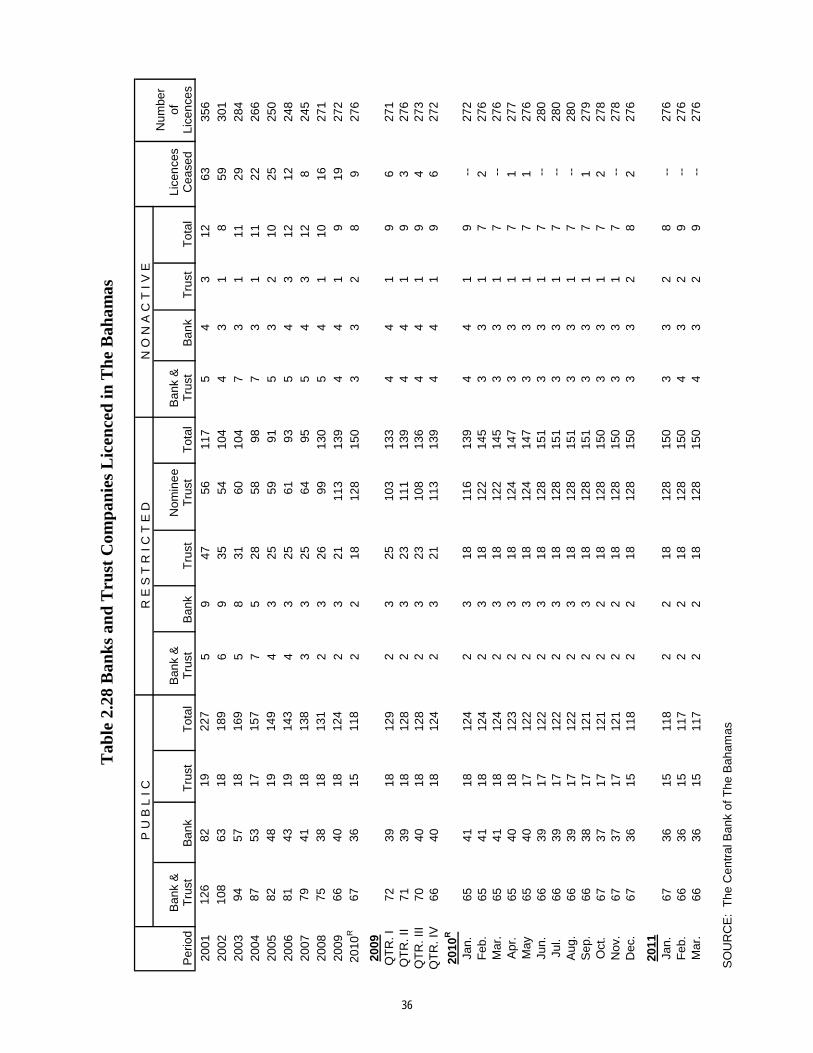
P U
B L
I C
R E
S T
R I
C T
E D
N O
N A
C T
I V
EN
umbe
rB
ank
&B
ank
&N
omin
ee
Ban
k &
Lice
nce
sof
Per
iod
Tru
stB
ank
Tru
stT
otal
Tru
stB
ank
Tru
stT
rust
Tot
alT
rust
Ban
kT
rust
Tot
alC
ease
dLi
cen
ces
2001
126
8219
227
59
4756
117
54
312
6335
620
0210
863
1818
96
935
5410
44
31
859
301
2003
9457
1816
95
831
6010
47
31
1129
284
2004
8753
1715
77
528
5898
73
111
2226
620
0582
4819
149
43
2559
915
32
1025
250
2006
8143
1914
34
325
6193
54
312
1224
820
0779
4118
138
33
2564
955
43
128
245
2008
7538
1813
12
326
9913
05
41
1016
271
2009
6640
1812
42
321
113
139
44
19
1927
2 2
010
R67
3615
118
22
1812
815
03
32
89
276
2009
QT
R. I
7239
1812
92
325
103
133
44
19
627
1Q
TR
. II
7139
1812
82
323
111
139
44
19
327
6Q
TR
. III
7040
1812
82
323
108
136
44
19
427
3Q
TR
. IV
6640
1812
42
321
113
139
44
19
627
2
2010
R
Jan.
6541
1812
42
318
116
139
44
19
--27
2F
eb.
6541
1812
42
318
122
145
33
17
227
6M
ar.
6541
1812
42
318
122
145
33
17
--27
6A
pr.
6540
1812
32
318
124
147
33
17
127
7M
ay65
4017
122
23
1812
414
73
31
71
276
Jun.
6639
1712
22
318
128
151
33
17
--28
0Ju
l.66
3917
122
23
1812
815
13
31
7--
280
Aug
.66
3917
122
23
1812
815
13
31
7--
280
Sep
.66
3817
121
23
1812
815
13
31
71
279
Oct
.67
3717
121
22
1812
815
03
31
72
278
Nov
.67
3717
121
22
1812
815
03
31
7--
278
Dec
.67
3615
118
22
1812
815
03
32
82
276
2011
Jan.
6736
1511
82
218
128
150
33
28
--27
6F
eb.
6636
1511
72
218
128
150
43
29
--27
6M
ar.
6636
1511
72
218
128
150
43
29
--27
6
SO
UR
CE
: T
he C
entr
al B
ank
of T
he B
aham
as
Tab
le 2
.28
Ban
ks
and
Tru
st C
omp
anie
s L
icen
ced
in T
he
Bah
amas
36
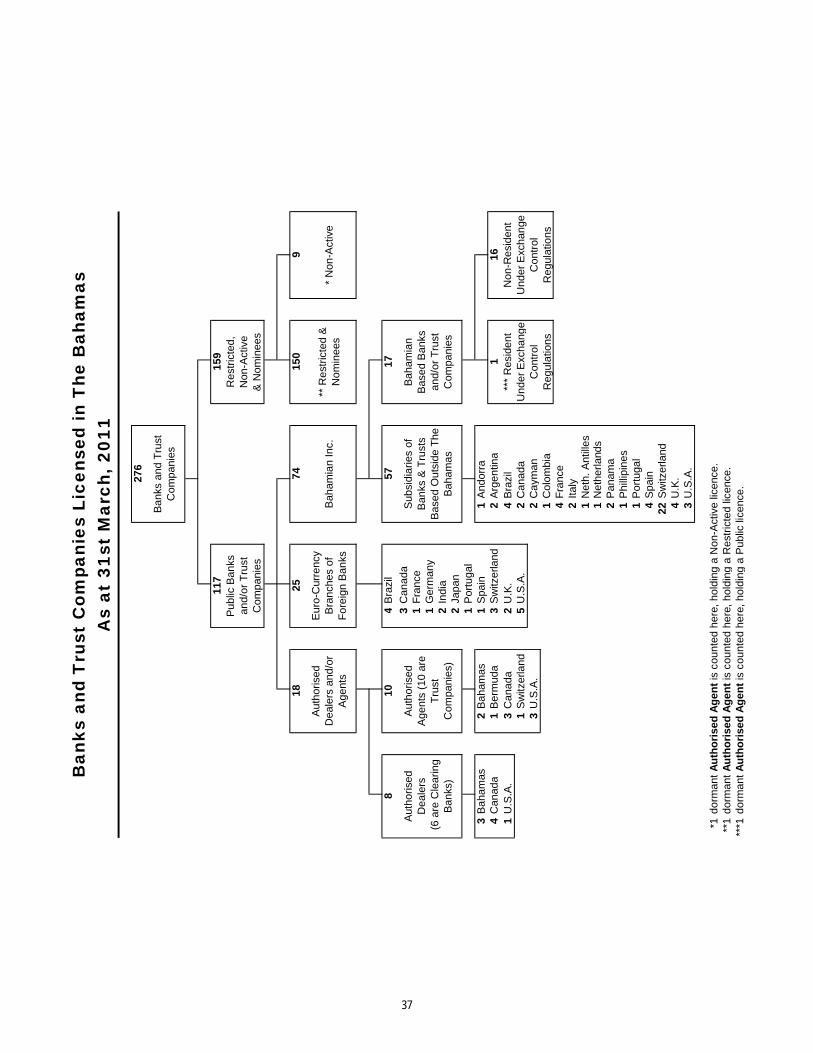
4B
razi
l
3C
anad
a1
Fra
nce
1G
erm
any
2In
dia
2Ja
pan
1P
ortu
gal
3B
aham
as2
Bah
amas
1S
pain
1A
ndor
ra4
Can
ada
1B
erm
uda
3S
witz
erla
nd2
Arg
entin
a1
U.S
.A.
3C
anad
a2
U.K
.4
Bra
zil
1S
witz
erla
nd5
U.S
.A.
2C
anad
a3
U.S
.A.
2C
aym
an1
Col
ombi
a4
Fra
nce
2Ita
ly1
Net
h. A
ntill
es1
Net
herla
nds
2P
anam
a1
Phi
llipi
nes
1P
ortu
gal
4S
pain
22S
witz
erla
nd4
U.K
.3
U.S
.A.
*1do
rman
t A
uth
ori
sed
Ag
ent
is c
ount
ed h
ere,
hol
ding
a N
on-A
ctiv
e lic
ence
.**
1do
rman
t A
uth
ori
sed
Ag
ent
is c
ount
ed h
ere,
hol
ding
a R
estr
icte
d lic
ence
. **
*1do
rman
t A
uth
ori
sed
Ag
ent
is c
ount
ed h
ere,
hol
ding
a P
ublic
lice
nce.
116
***
Res
iden
t U
nder
Exc
hang
e C
ontr
ol
Reg
ulat
ions
Non
-Res
iden
t U
nder
Exc
hang
e C
ontr
ol
Reg
ulat
ions
810
5717
Aut
horis
edD
eale
rs (
6 ar
e C
lear
ing
Ban
ks)
Aut
horis
edA
gent
s (1
0 ar
e T
rust
C
ompa
nies
)
Sub
sidi
arie
s of
B
anks
& T
rust
s B
ased
Out
side
The
B
aham
as
Bah
amia
nB
ased
Ban
ksan
d/or
Tru
stC
ompa
nies
9
Aut
horis
ed
Dea
lers
and
/or
Age
nts
Eur
o-C
urre
ncy
Bra
nche
s of
F
orei
gn B
anks
B
aham
ian
Inc.
** R
estr
icte
d &
N
omin
ees
* N
on-A
ctiv
e
Pub
lic B
anks
an
d/or
Tru
st
Com
pani
es
Res
tric
ted,
Non
-Act
ive
& N
omin
ees
1825
7415
0
Ban
ks a
nd T
rust
Com
pani
es L
icen
sed
in T
he B
aham
asA
s at
31s
t M
arch
, 201
1
276
Ban
ks a
nd T
rust
C
ompa
nies
117
159
37
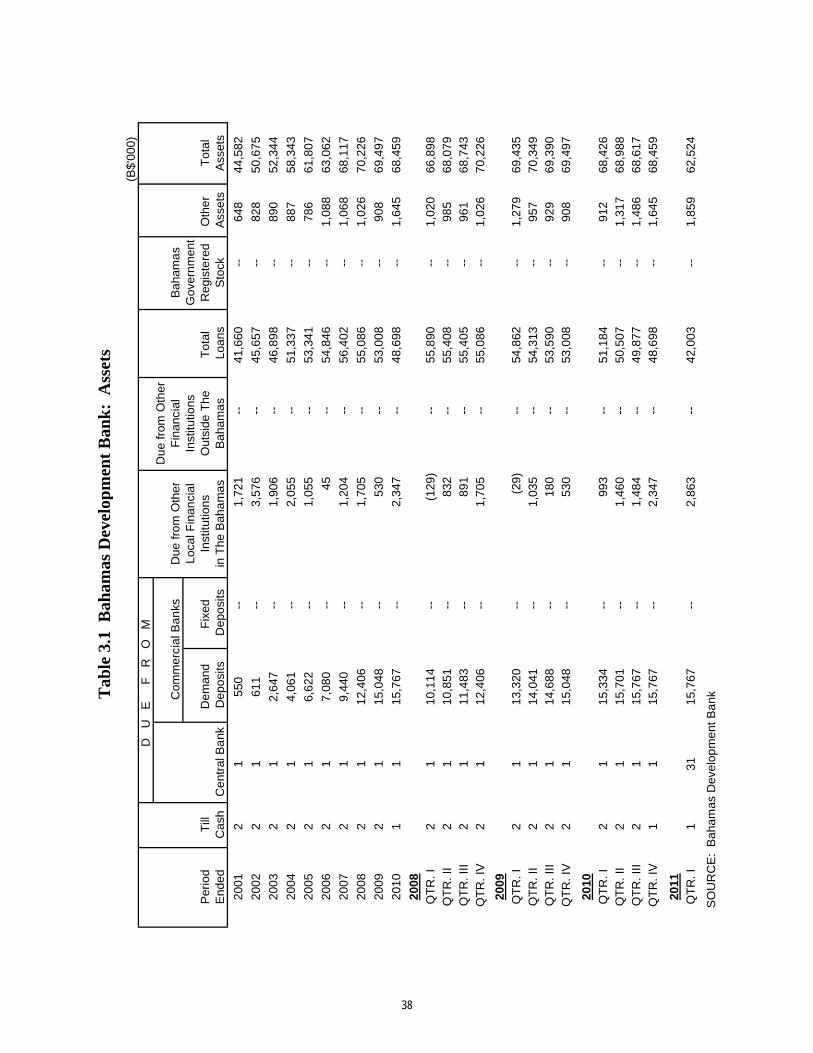
(B$'
000)
D
U
E
F
R
O
MD
ue fr
om O
ther
Com
mer
cial
Ban
ksD
ue fr
om O
ther
Fin
anci
alB
aham
as
Loca
l Fin
anci
alIn
stitu
tions
Gov
ernm
ent
Per
iod
Till
Dem
and
Fix
ed
Inst
itutio
nsO
utsi
de T
heT
otal
R
egis
tere
dO
ther
T
otal
End
edC
ash
Cen
tral
Ba
nkD
epos
itsD
epos
itsin
The
Bah
am
asB
aham
as
Loan
sS
tock
Ass
ets
Ass
ets
2001
21
550
--1,
721
--
41,6
60
-
-64
844
,582
2002
21
611
--3,
576
--
45,6
57
-
-82
850
,675
2003
21
2,64
7
--
1,90
6
-
-46
,898
--
890
52,3
44
2004
21
4,06
1
--
2,05
5
-
-51
,337
--
887
58,3
43
2005
21
6,62
2
--
1,05
5
-
-53
,341
--
786
61,8
07
2006
21
7,08
0
--
45
-
-54
,846
--
1,08
863
,062
2007
21
9,44
0
--
1,20
4
-
-56
,402
--
1,06
868
,117
2008
21
12,4
06
--
1,70
5
-
-55
,086
--
1,02
670
,226
2009
21
15,0
48
--
530
-
-53
,008
--
908
69,4
97
2010
11
15,7
67
--
2,34
7
-
-48
,698
--
1,64
568
,459
2008
QT
R. I
21
10,1
14
--
(129
)
--
55,8
90
-
-1,
020
66,8
98Q
TR
. II
21
10,8
51
--
832
-
-55
,408
--
985
68,0
79 Q
TR
. III
21
11,4
83
--
891
-
-55
,405
--
961
68,7
43 Q
TR
. IV
21
12,4
06
--
1,70
5
-
-55
,086
--
1,02
670
,226
2009
QT
R. I
21
13,3
20
--
(29)
--
54,8
62
-
-1,
279
69,4
35Q
TR
. II
21
14,0
41
--
1,03
5
-
-54
,313
--
957
70,3
49 Q
TR
. III
21
14,6
88
--
180
-
-53
,590
--
929
69,3
90 Q
TR
. IV
21
15,0
48
--
530
-
-53
,008
--
908
69,4
97
2010
QT
R. I
21
15,3
34
--
993
-
-51
,184
--
912
68,4
26Q
TR
. II
21
15,7
01
--
1,46
0
-
-50
,507
--
1,31
768
,988
QT
R. I
II2
115
,767
--1,
484
--
49,8
77
-
-1,
486
68,6
17 Q
TR
. IV
11
15,7
67
--
2,34
7
-
-48
,698
--
1,64
568
,459
2011
QT
R. I
131
15,7
67
--
2,86
3
-
-42
,003
--
1,85
962
,524
S
OU
RC
E:
Bah
amas
Dev
elop
men
t Ba
nkTab
le 3
.1 B
aham
as D
evel
opm
ent
Ban
k:
Ass
ets
38
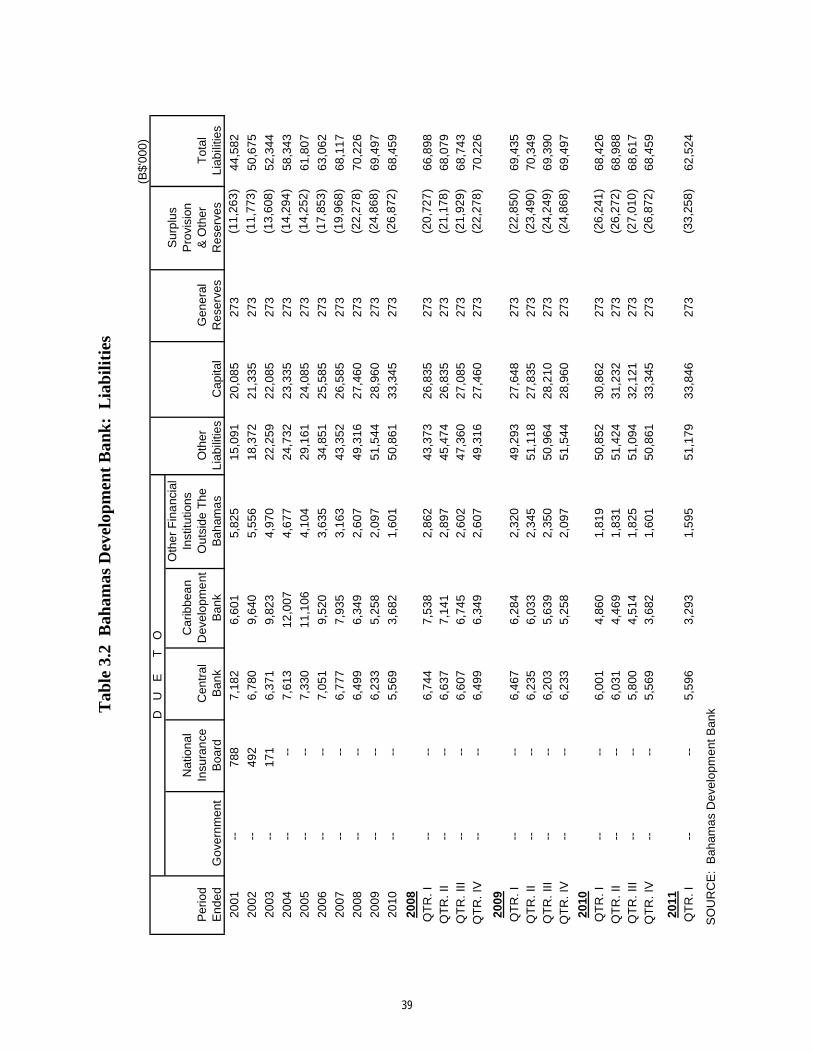
Tab
le 3
.2 B
aham
as D
evel
opm
ent
Ban
k:
Lia
bil
itie
s
(B$'
000)
D
U
E
T
OO
ther
Fin
anc
ial
Sur
plus
Nat
iona
lC
arib
bea
nIn
stitu
tions
Pro
visi
onP
erio
dIn
sura
nce
Cen
tral
Dev
elop
me
ntO
utsi
de T
heO
ther
Gen
eral
& O
ther
Tot
alE
nded
Gov
ernm
ent
Boa
rdB
ank
Ban
kB
aham
as
Liab
ilitie
sC
apita
lR
eser
ves
Res
erve
sLi
abili
ties
2001
-
-
788
7,18
26,
601
5,82
515
,091
20
,085
273
(11,
263
)
44,5
82
2002
-
-
492
6,78
09,
640
5,55
618
,372
21
,335
273
(11,
773
)
50,6
75
2003
-
-
171
6,37
19,
823
4,97
022
,259
22
,085
273
(13,
608
)
52,3
44
2004
-
-
-
-
7,61
312
,007
4,67
724
,732
23
,335
273
(14,
294
)
58,3
43
2005
-
-
-
-
7,33
011
,106
4,10
429
,161
24
,085
273
(14,
252
)
61,8
07
2006
-
-
-
-
7,05
19,
520
3,63
534
,851
25
,585
273
(17,
853
)
63,0
62
2007
-
-
-
-
6,77
77,
935
3,16
343
,352
26
,585
273
(19,
968
)
68,1
17
2008
-
-
-
-
6,49
96,
349
2,60
749
,316
27
,460
273
(22,
278
)
70,2
26
2009
-
-
-
-
6,23
35,
258
2,09
751
,544
28
,960
273
(24,
868
)
69,4
97
2010
-
-
-
-
5,56
93,
682
1,60
150
,861
33
,345
273
(26,
872
)
68,4
59
2008
QT
R. I
-
-
-
-
6,74
47,
538
2,86
243
,373
26
,835
273
(20,
727
)
66,8
98Q
TR
. II
-
-
-
-
6,63
77,
141
2,89
745
,474
26
,835
273
(21,
178
)
68,0
79 Q
TR
. III
-
-
-
-
6,60
76,
745
2,60
247
,360
27
,085
273
(21,
929
)
68,7
43 Q
TR
. IV
-
-
-
-
6,49
96,
349
2,60
749
,316
27
,460
273
(22,
278
)
70,2
26
2009
QT
R. I
-
-
-
-
6,46
76,
284
2,32
049
,293
27
,648
273
(22,
850
)
69,4
35Q
TR
. II
-
-
-
-
6,23
56,
033
2,34
551
,118
27
,835
273
(23,
490
)
70,3
49 Q
TR
. III
-
-
-
-
6,20
35,
639
2,35
050
,964
28
,210
273
(24,
249
)
69,3
90 Q
TR
. IV
-
-
-
-
6,23
35,
258
2,09
751
,544
28
,960
273
(24,
868
)
69,4
97
2010
QT
R. I
-
-
-
-
6,00
14,
860
1,81
950
,852
30
,862
273
(26,
241
)
68,4
26Q
TR
. II
-
-
-
-
6,03
14,
469
1,83
151
,424
31
,232
273
(26,
272
)
68,9
88 Q
TR
. III
-
-
-
-
5,80
04,
514
1,82
551
,094
32
,121
273
(27,
010
)
68,6
17 Q
TR
. IV
-
-
-
-
5,56
93,
682
1,60
150
,861
33
,345
273
(26,
872
)
68,4
59
2011
QT
R. I
-
-
-
-
5,59
63,
293
1,59
551
,179
33
,846
273
(33,
258
)
62,5
24
SO
UR
CE
: B
aham
as
Dev
elop
men
t Ban
k
39
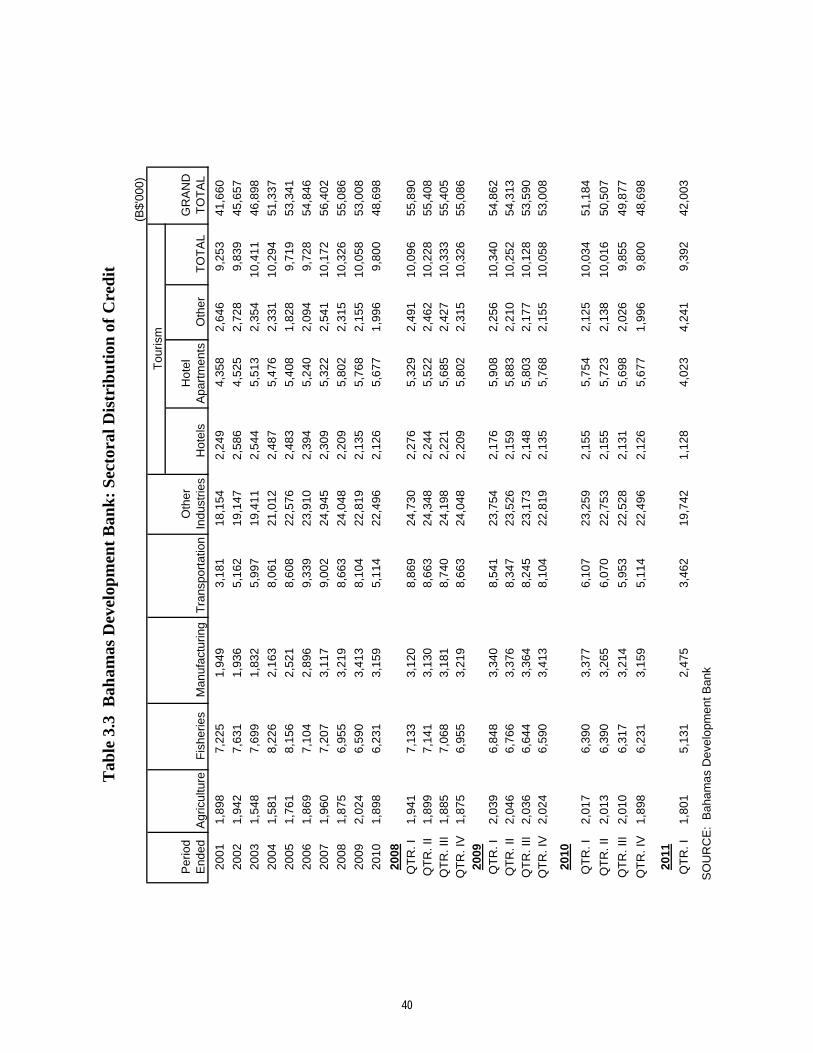
Tab
le 3
.3 B
aham
as D
evel
opm
ent
Ban
k:
Sec
tora
l Dis
trib
uti
on o
f C
red
it
(B$'
000)
Tou
rism
Per
iod
Oth
erH
otel
GR
AN
DE
nded
Agr
icul
ture
Fis
herie
sM
anuf
actu
ring
Tra
nspo
rtat
ion
Indu
strie
sH
otel
sA
part
men
tsO
ther
TO
TA
LT
OT
AL
2001
1,89
87,
225
1,94
93,
181
18,1
542,
249
4,35
82,
646
9,25
341
,660
2002
1,94
27,
631
1,93
65,
162
19,1
472,
586
4,52
52,
728
9,83
945
,657
2003
1,54
87,
699
1,83
25,
997
19,4
112,
544
5,51
32,
354
10,4
1146
,898
2004
1,58
18,
226
2,16
38,
061
21,0
122,
487
5,47
62,
331
10,2
9451
,337
2005
1,76
18,
156
2,52
18,
608
22,5
762,
483
5,40
81,
828
9,71
953
,341
2006
1,86
97,
104
2,89
69,
339
23,9
102,
394
5,24
02,
094
9,72
854
,846
2007
1,96
07,
207
3,11
79,
002
24,9
452,
309
5,32
22,
541
10,1
7256
,402
2008
1,87
56,
955
3,21
98,
663
24,0
482,
209
5,80
22,
315
10,3
2655
,086
2009
2,02
46,
590
3,41
38,
104
22,8
192,
135
5,76
82,
155
10,0
5853
,008
2010
1,89
86,
231
3,15
95,
114
22,4
962,
126
5,67
71,
996
9,80
048
,698
2008
QT
R. I
1,94
17,
133
3,12
08,
869
24,7
302,
276
5,32
92,
491
10,0
9655
,890
QT
R. I
I1,
899
7,14
13,
130
8,66
324
,348
2,24
45,
522
2,46
210
,228
55,4
08Q
TR
. III
1,88
57,
068
3,18
18,
740
24,1
982,
221
5,68
52,
427
10,3
3355
,405
QT
R. I
V1,
875
6,95
53,
219
8,66
324
,048
2,20
95,
802
2,31
510
,326
55,0
8620
09Q
TR
. I2,
039
6,84
83,
340
8,54
123
,754
2,17
65,
908
2,25
610
,340
54,8
62Q
TR
. II
2,04
66,
766
3,37
68,
347
23,5
262,
159
5,88
32,
210
10,2
5254
,313
QT
R. I
II2,
036
6,64
43,
364
8,24
523
,173
2,14
85,
803
2,17
710
,128
53,5
90Q
TR
. IV
2,02
46,
590
3,41
38,
104
22,8
192,
135
5,76
82,
155
10,0
5853
,008
2010
QT
R. I
2,01
76,
390
3,37
76,
107
23,2
592,
155
5,75
42,
125
10,0
3451
,184
QT
R. I
I2,
013
6,39
03,
265
6,07
022
,753
2,15
55,
723
2,13
810
,016
50,5
07
QT
R. I
II2,
010
6,31
73,
214
5,95
322
,528
2,13
15,
698
2,02
69,
855
49,8
77
QT
R. I
V1,
898
6,23
13,
159
5,11
422
,496
2,12
65,
677
1,99
69,
800
48,6
98
2011
QT
R. I
1,80
15,
131
2,47
53,
462
19,7
421,
128
4,02
34,
241
9,39
242
,003
SO
UR
CE
: B
aham
as D
evel
opm
ent B
ank
40
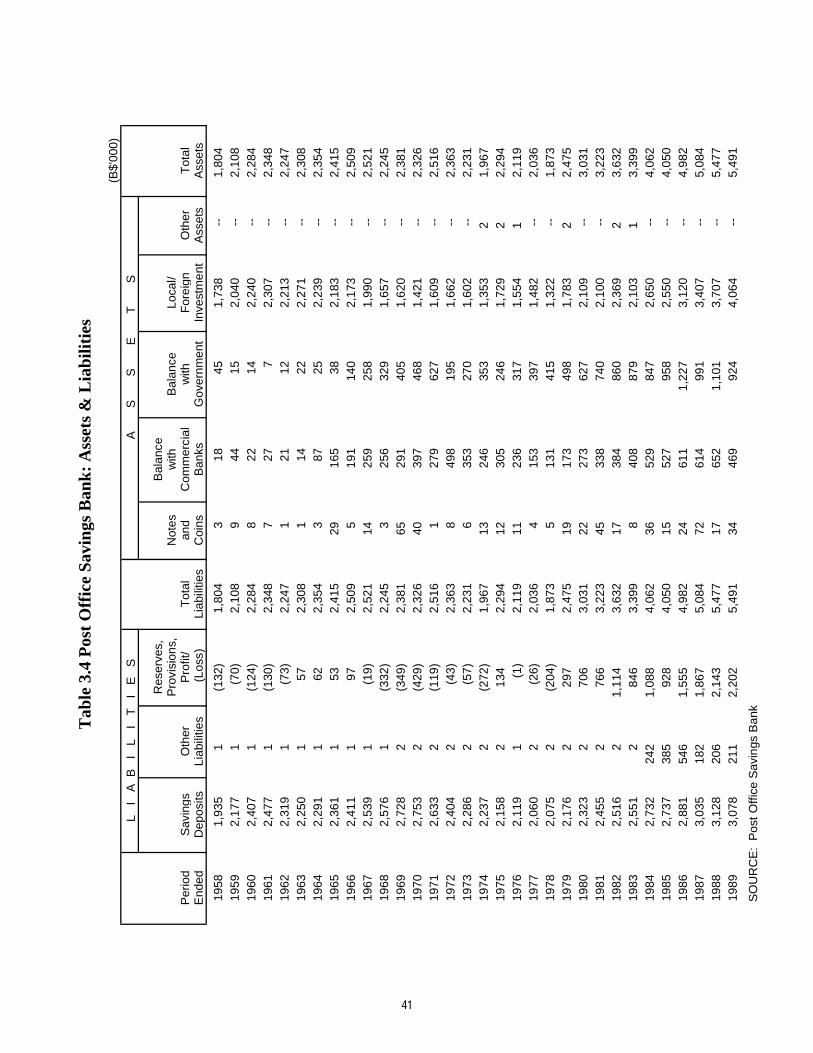
Tab
le 3
.4 P
ost
Off
ice
Sav
ings
Ban
k:
Ass
ets
& L
iab
ilit
ies
(B$'
000)
L I
A
B
I
L
I T
I
E
SA
S
S
E
T
S
Res
erve
s,B
alan
ceP
rovi
sion
s,N
otes
with
Bal
ance
Loca
l/P
erio
dS
avin
gsO
ther
Pro
fit/
Tot
alan
dC
omm
erci
alw
ithF
orei
gnO
ther
Tot
alE
nded
Dep
osits
Liab
ilitie
s (
Loss
)Li
abili
ties
Coi
nsB
anks
Gov
ernm
ent
Inve
stm
ent
Ass
ets
Ass
ets
1958
1,93
51
(132
)
1,80
43
1845
1,73
8
--
1,80
419
592,
177
1(7
0)
2,
108
944
152,
040
--2,
108
1960
2,40
71
(124
)
2,28
48
2214
2,24
0
--
2,28
419
612,
477
1(1
30)
2,
348
727
72,
307
--2,
348
1962
2,31
91
(73)
2,24
71
2112
2,21
3
--
2,24
719
632,
250
157
2,30
81
1422
2,27
1
--
2,30
819
642,
291
162
2,35
43
8725
2,23
9
--
2,35
419
652,
361
153
2,41
529
165
382,
183
--2,
415
1966
2,41
11
97
2,
509
519
114
02,
173
--2,
509
1967
2,53
91
(19)
2,52
114
259
258
1,99
0
--
2,52
119
682,
576
1(3
32)
2,
245
325
632
91,
657
--2,
245
1969
2,72
82
(349
)
2,38
165
291
405
1,62
0
--
2,38
119
702,
753
2(4
29)
2,
326
4039
746
81,
421
--2,
326
1971
2,63
32
(119
)
2,51
61
279
627
1,60
9
--
2,51
619
722,
404
2(4
3)
2,
363
849
819
51,
662
--2,
363
1973
2,28
62
(57)
2,23
16
353
270
1,60
2
--
2,23
119
742,
237
2(2
72)
1,
967
1324
635
31,
353
21,
967
1975
2,15
82
134
2,
294
1230
524
61,
729
22,
294
1976
2,11
91
(1)
2,11
911
236
317
1,55
41
2,11
919
772,
060
2(2
6)
2,
036
415
339
71,
482
--2,
036
1978
2,07
52
(204
)
1,87
35
131
415
1,32
2
--
1,87
319
792,
176
229
7
2,47
519
173
498
1,78
32
2,47
519
802,
323
270
6
3,03
122
273
627
2,10
9
--
3,03
119
812,
455
276
6
3,22
345
338
740
2,10
0
--
3,22
319
822,
516
21,
114
3,63
217
384
860
2,36
92
3,63
219
832,
551
284
6
3,39
98
408
879
2,10
31
3,39
919
842,
732
242
1,08
84,
062
3652
984
72,
650
--4,
062
1985
2,73
738
592
8
4,05
015
527
958
2,55
0
--
4,05
019
862,
881
546
1,55
54,
982
2461
11,
227
3,12
0
--
4,98
219
873,
035
182
1,86
75,
084
7261
499
13,
407
--5,
084
1988
3,12
820
62,
143
5,47
717
652
1,10
13,
707
--5,
477
1989
3,07
821
12,
202
5,49
134
469
924
4,06
4
--
5,49
1
SO
UR
CE
: P
ost
Offi
ce S
avin
gs B
ank
41
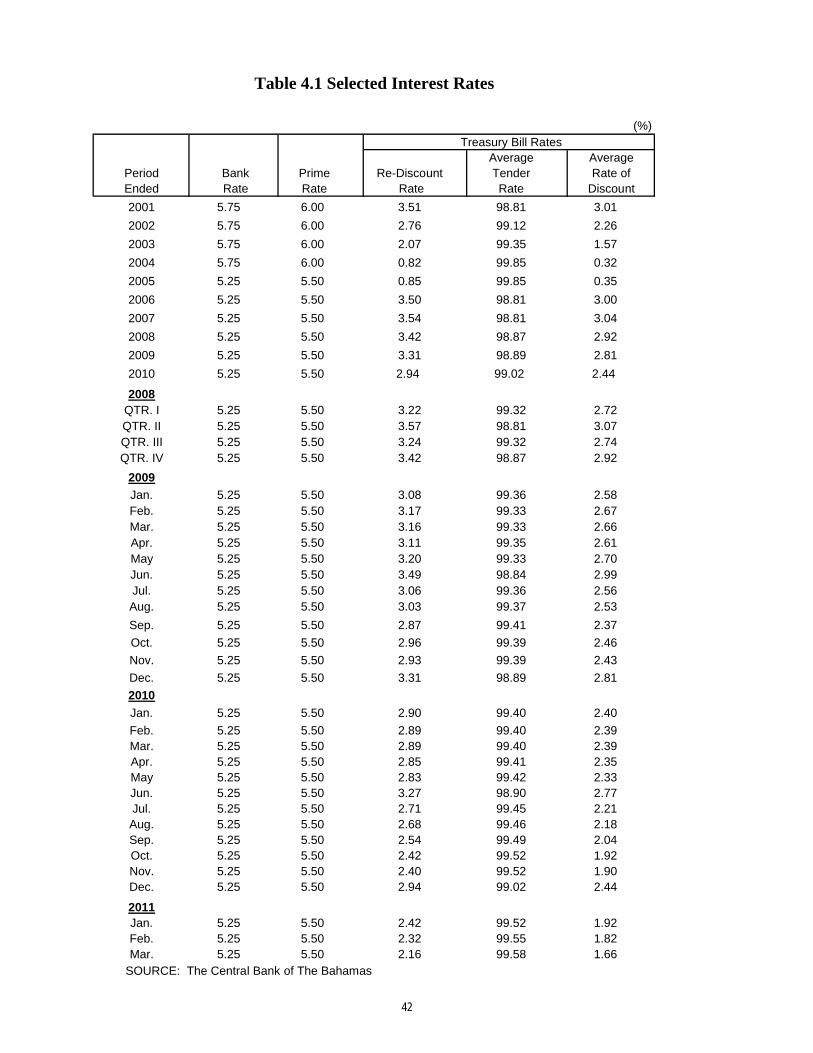
Table 4.1 Selected Interest Rates
(%)Treasury Bill Rates
Average AveragePeriod Bank Prime Re-Discount Tender Rate ofEnded Rate Rate Rate Rate Discount
2001 5.75 6.00 3.51 98.81 3.01
2002 5.75 6.00 2.76 99.12 2.26
2003 5.75 6.00 2.07 99.35 1.57
2004 5.75 6.00 0.82 99.85 0.32
2005 5.25 5.50 0.85 99.85 0.35
2006 5.25 5.50 3.50 98.81 3.00
2007 5.25 5.50 3.54 98.81 3.04
2008 5.25 5.50 3.42 98.87 2.92
2009 5.25 5.50 3.31 98.89 2.81
2010 5.25 5.50 2.94 99.02 2.44
2008QTR. I 5.25 5.50 3.22 99.32 2.72QTR. II 5.25 5.50 3.57 98.81 3.07QTR. III 5.25 5.50 3.24 99.32 2.74QTR. IV 5.25 5.50 3.42 98.87 2.92
2009
Jan. 5.25 5.50 3.08 99.36 2.58Feb. 5.25 5.50 3.17 99.33 2.67Mar. 5.25 5.50 3.16 99.33 2.66Apr. 5.25 5.50 3.11 99.35 2.61May 5.25 5.50 3.20 99.33 2.70Jun. 5.25 5.50 3.49 98.84 2.99Jul. 5.25 5.50 3.06 99.36 2.56Aug. 5.25 5.50 3.03 99.37 2.53
Sep. 5.25 5.50 2.87 99.41 2.37
Oct. 5.25 5.50 2.96 99.39 2.46
Nov. 5.25 5.50 2.93 99.39 2.43
Dec. 5.25 5.50 3.31 98.89 2.81
2010
Jan. 5.25 5.50 2.90 99.40 2.40
Feb. 5.25 5.50 2.89 99.40 2.39Mar. 5.25 5.50 2.89 99.40 2.39Apr. 5.25 5.50 2.85 99.41 2.35May 5.25 5.50 2.83 99.42 2.33Jun. 5.25 5.50 3.27 98.90 2.77Jul. 5.25 5.50 2.71 99.45 2.21Aug. 5.25 5.50 2.68 99.46 2.18Sep. 5.25 5.50 2.54 99.49 2.04Oct. 5.25 5.50 2.42 99.52 1.92Nov. 5.25 5.50 2.40 99.52 1.90Dec. 5.25 5.50 2.94 99.02 2.44
2011Jan. 5.25 5.50 2.42 99.52 1.92Feb. 5.25 5.50 2.32 99.55 1.82Mar. 5.25 5.50 2.16 99.58 1.66
SOURCE: The Central Bank of The Bahamas
42
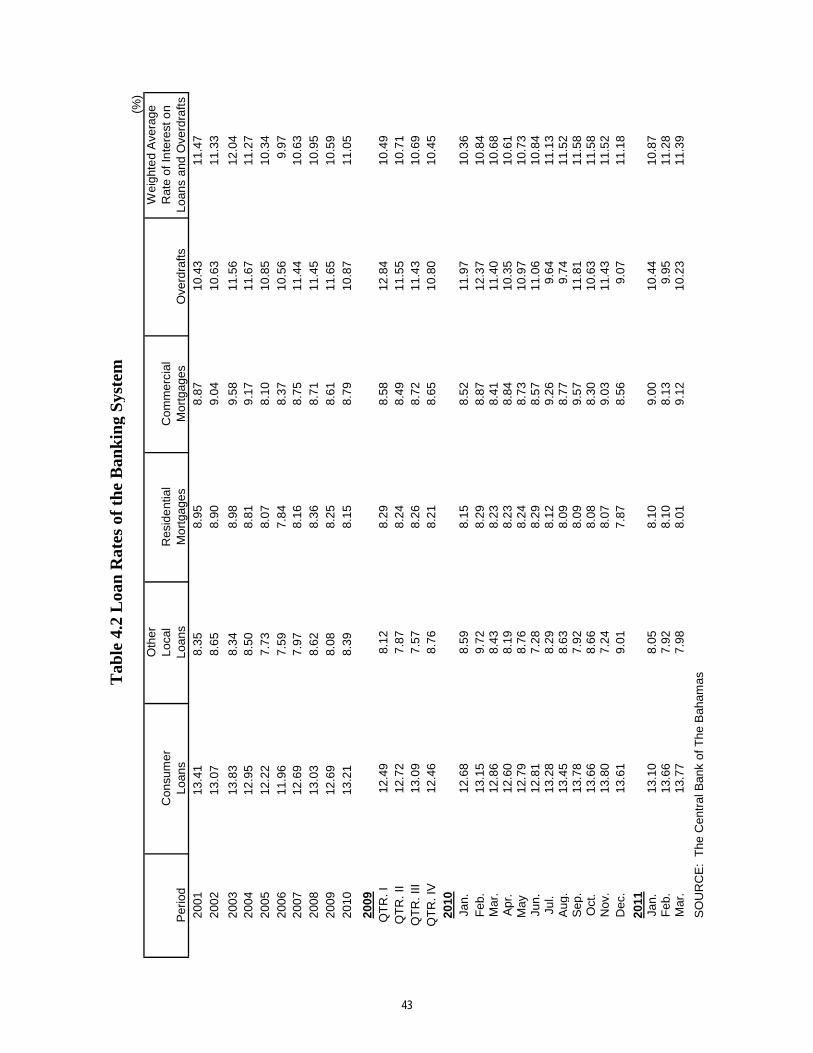
(%)
Oth
erW
eigh
ted
Ave
rage
Con
sum
erLo
cal
Res
ide
ntia
lC
omm
erci
alR
ate
of In
tere
st o
nP
erio
dLo
ans
Loan
sM
ortg
ages
Mor
tgag
esO
verd
rafts
Loan
s an
d O
verd
raft
s20
0113
.41
8.35
8.95
8.87
10.4
311
.47
2002
13.0
78.
658.
909.
0410
.63
11.3
3
2003
13.8
38.
348.
989.
5811
.56
12.0
420
0412
.95
8.50
8.81
9.17
11.6
711
.27
2005
12.2
27.
738.
078.
1010
.85
10.3
420
0611
.96
7.59
7.84
8.37
10.5
69.
9720
0712
.69
7.97
8.16
8.75
11.4
410
.63
2008
13.0
38.
628.
368.
7111
.45
10.9
520
0912
.69
8.08
8.25
8.61
11.6
510
.59
2010
13.2
18.
398.
158.
7910
.87
11.0
5
2009
QT
R. I
12.4
98.
128.
298.
5812
.84
10.4
9Q
TR
. II
12.7
27.
878.
248.
4911
.55
10.7
1Q
TR
. III
13.0
97.
578.
268.
7211
.43
10.6
9Q
TR
. IV
12.4
68.
768.
218.
6510
.80
10.4
520
10Ja
n.12
.68
8.59
8.15
8.52
11.9
710
.36
Feb
.13
.15
9.72
8.29
8.87
12.3
710
.84
Mar
.12
.86
8.43
8.23
8.41
11.4
010
.68
Apr
.12
.60
8.19
8.23
8.84
10.3
510
.61
May
12
.79
8.76
8.24
8.73
10.9
710
.73
Jun.
12.8
17.
288.
298.
5711
.06
10.8
4Ju
l.13
.28
8.29
8.12
9.26
9.64
11.1
3A
ug.
13.4
58.
638.
098.
779.
7411
.52
Sep
.13
.78
7.92
8.09
9.57
11.8
111
.58
Oct
.13
.66
8.66
8.08
8.30
10.6
311
.58
Nov
.13
.80
7.24
8.07
9.03
11.4
311
.52
Dec
.13
.61
9.01
7.87
8.56
9.07
11.1
8
2011
Jan.
13.1
08.
058.
109.
0010
.44
10.8
7F
eb.
13.6
67.
928.
108.
139.
9511
.28
Mar
.13
.77
7.98
8.01
9.12
10.2
311
.39
SO
UR
CE
: T
he C
entr
al B
ank
of T
he B
aham
as Tab
le 4
.2 L
oan
Rat
es o
f th
e B
ank
ing
Sys
tem
43
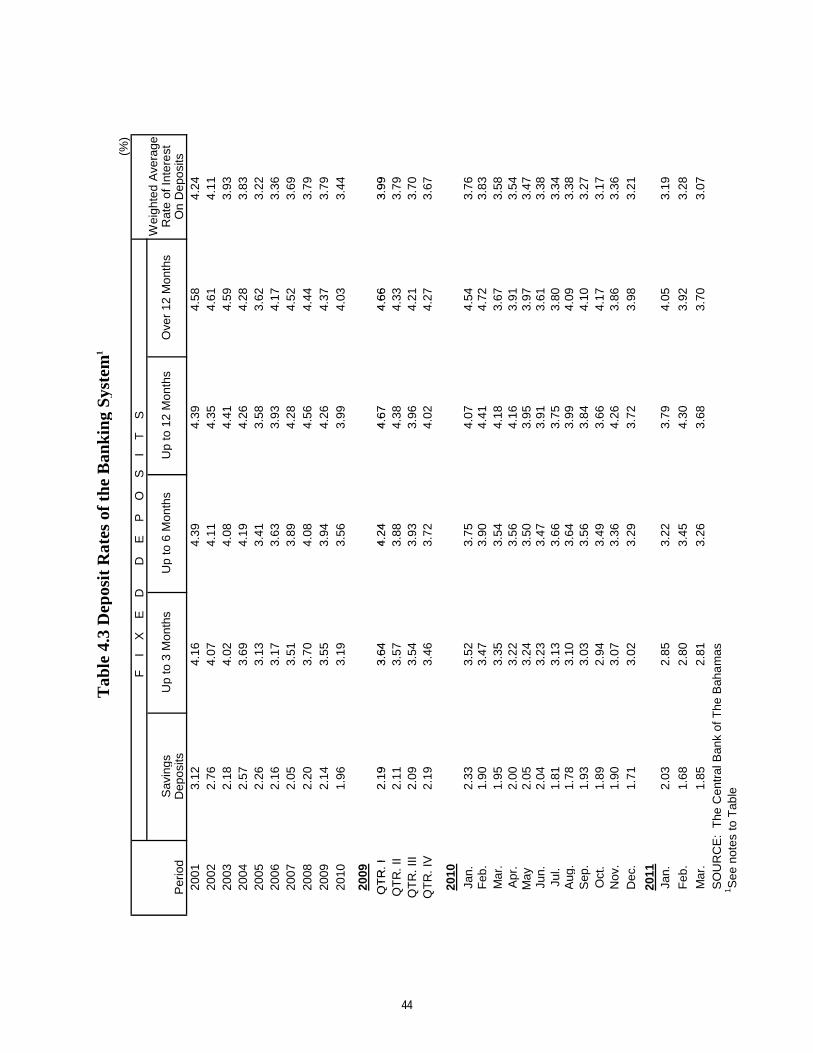
Tab
le 4
.3 D
epos
it R
ates
of
the
Ban
kin
g S
yste
m1
(%)
F
I
X
E
D
D
E
P
O
S
I
T
S
W
eigh
ted
Ave
rage
Sav
ings
Up
to 3
Mon
ths
Up
to 6
Mon
ths
Up
to 1
2 M
onth
sO
ver
12 M
onth
sR
ate
of In
tere
stP
erio
dD
epos
itsO
n D
epos
its20
013.
124.
164.
394.
394.
584.
2420
022.
764.
074.
114.
354.
614.
1120
032.
184.
024.
084.
593.
9320
043.
8320
053.
2220
063.
3620
073.
6920
083.
7920
093.
7920
103.
44
2009
QT
R. I
3.99
1.96
3.19
3.56
3.99
4.03
2.19
3.64
4.24
4.67
4.66
4.28
2.57
4.41
3.69
4.19
4.26
3.58
3.62
2.26
3.13
3.41
2.16
3.17
3.63
3.93
4.17
4.52
2.05
3.51
3.89
4.28
2.20
3.70
4.08
4.56
4.44
2.14
3.55
3.94
4.26
4.37
QT
R. I
3.99
QT
R. I
I3.
79Q
TR
. III
3.70
QT
R. I
V3.
67
2010
Jan.
3.76
Feb
.3.
83M
ar.
3.58
Apr
.3.
54M
ay
3.47
Jun.
3.38
Jul.
3.34
Aug
.3.
38S
ep.
3.27
Oct
.3.
17N
ov.
3.36
Dec
.3.
21
2011
Jan.
3.19
Feb
.3.
28
Mar
.3.
07
S
OU
RC
E:
The
Cen
tral
Ban
k of
The
Bah
am
as
1S
ee n
otes
to T
able
2.09
3.54
3.93
3.96
4.21
2.19
3.46
3.72
4.02
4.27
2.19
3.64
4.24
4.67
4.66
2.11
3.57
3.88
4.38
4.33
3.72
3.98
1.89
1.90
1.71
4.17
3.86
2.94
3.07
3.02
3.49
3.66
3.36
4.26
3.29
2.33
1.90
1.95
3.52
3.47
3.35
4.54
4.72
3.67
3.75
3.90
3.54
4.07
4.41
4.18
2.00
2.05
2.04
3.22
3.56
4.16
3.91
3.24
3.50
3.95
3.97
3.23
3.47
3.91
3.61
1.81
1.78
1.93
3.13
3.66
3.75
3.80
3.10
3.64
3.99
4.09
3.03
3.56
3.84
4.10
4.30
3.68
2.03
1.68
1.85
2.85
2.80
2.81
4.05
3.92
3.70
3.22
3.45
3.26
3.79
44
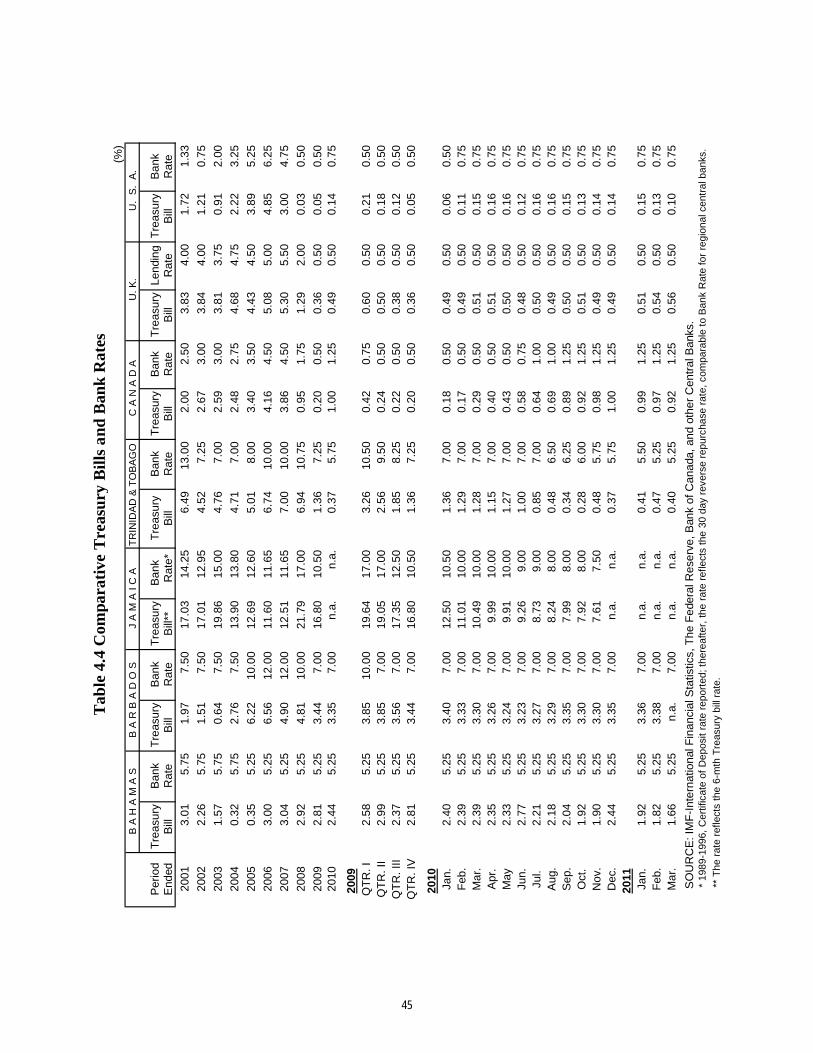
(%)
B A
H A
M A
SB
A R
B A
D O
SJ
A M
A I
C A
TR
INID
AD
& T
OB
AG
O C
A N
A D
A U
. K.
U.
S.
A.
Per
iod
Tre
asur
yB
ank
Tre
asur
yB
ank
Tre
asur
yB
ank
Tre
asur
yB
ank
Tre
asur
yB
ank
Tre
asur
yLe
ndin
gT
reas
ury
Ban
kE
nded
Bill
Rat
eB
illR
ate
Bill
**
Rat
e*B
illR
ate
Bill
Rat
eB
illR
ate
Bill
Rat
e
2001
3.01
5.75
1.97
7.50
17.0
314
.25
6.49
13.0
02.
002.
503.
834.
001.
721.
33
2002
2.26
5.75
1.51
7.50
17.0
112
.95
4.52
7.25
2.67
3.00
3.84
4.00
1.21
0.75
2003
1.57
5.75
0.64
7.50
19.8
615
.00
4.76
7.00
2.59
3.00
3.81
3.75
0.91
2.00
2004
0.32
5.75
2.76
7.50
13.9
013
.80
4.71
7.00
2.48
2.75
4.68
4.75
2.22
3.25
2005
0.35
5.25
6.22
10.0
012
.69
12.6
05.
018.
003.
403.
504.
434.
503.
895.
25
2006
3.00
5.25
6.56
12.0
011
.60
11.6
56.
7410
.00
4.16
4.50
5.08
5.00
4.85
6.25
2007
3.04
5.25
4.90
12.0
012
.51
11.6
57.
0010
.00
3.86
4.50
5.30
5.50
3.00
4.75
2008
2.92
5.25
4.81
10.0
021
.79
17.0
06.
9410
.75
0.95
1.75
1.29
2.00
0.03
0.50
2009
2.81
5.25
3.44
7.00
16.8
010
.50
1.36
7.25
0.20
0.50
0.36
0.50
0.05
0.50
2010
2.44
5.25
3.35
7.00
n.a.
n.a.
0.37
5.75
1.00
1.25
0.49
0.50
0.14
0.75
2009
QT
R. I
2.58
5.25
3.85
10.0
019
.64
17.0
03.
2610
.50
0.42
0.75
0.60
0.50
0.21
0.50
QT
R. I
I2.
995.
253.
857.
0019
.05
17.0
02.
569.
500.
240.
500.
500.
500.
180.
50Q
TR
. III
2.37
5.25
3.56
7.00
17.3
512
.50
1.85
8.25
0.22
0.50
0.38
0.50
0.12
0.50
QT
R. I
V2.
815.
253.
447.
0016
.80
10.5
01.
367.
250.
200.
500.
360.
500.
050.
50
2010
Jan.
2.40
5.25
3.40
7.00
12.5
010
.50
1.36
7.00
0.18
0.50
0.49
0.50
0.06
0.50
Feb
.2.
395.
253.
337.
0011
.01
10.0
01.
297.
000.
170.
500.
490.
500.
110.
75M
ar.
2.39
5.25
3.30
7.00
10.4
910
.00
1.28
7.00
0.29
0.50
0.51
0.50
0.15
0.75
Apr
.2.
355.
253.
267.
009.
9910
.00
1.15
7.00
0.40
0.50
0.51
0.50
0.16
0.75
May
2.33
5.25
3.24
7.00
9.91
10.0
01.
277.
000.
430.
500.
500.
500.
160.
75Ju
n.2.
775.
253.
237.
009.
269.
001.
007.
000.
580.
750.
480.
500.
120.
75Ju
l.2.
215.
253.
277.
008.
739.
000.
857.
000.
641.
000.
500.
500.
160.
75A
ug.
2.18
5.25
3.29
7.00
8.24
8.00
0.48
6.50
0.69
1.00
0.49
0.50
0.16
0.75
Sep
.2.
045.
253.
357.
007.
998.
000.
346.
250.
891.
250.
500.
500.
150.
75O
ct.
1.92
5.25
3.30
7.00
7.92
8.00
0.28
6.00
0.92
1.25
0.51
0.50
0.13
0.75
Nov
.1.
905.
253.
307.
007.
617.
500.
485.
750.
981.
250.
490.
500.
140.
75D
ec.
2.44
5.25
3.35
7.00
n.a.
n.a.
0.37
5.75
1.00
1.25
0.49
0.50
0.14
0.75
2011
Jan.
1.92
5.25
3.36
7.00
n.a.
n.a.
0.41
5.50
0.99
1.25
0.51
0.50
0.15
0.75
Feb
.1.
825.
253.
387.
00n.
a.n.
a.0.
475.
250.
971.
250.
540.
500.
130.
75M
ar.
1.66
5.25
n.a.
7.00
n.a.
n.a.
0.40
5.25
0.92
1.25
0.56
0.50
0.10
0.75
S
OU
RC
E: I
MF
-Int
erna
tiona
l Fin
anci
al S
tatis
tics,
The
Fed
eral
Res
erve
, Ban
k of
Can
ada,
and
oth
er C
entr
al B
anks
.
*
1989
-199
6, C
ertif
icat
e of
Dep
osit
rate
rep
orte
d; t
here
afte
r, th
e ra
te r
efle
cts
the
30 d
ay r
ever
se r
epur
chas
e ra
te, c
ompa
rabl
e to
Ban
k R
ate
for
regi
onal
cen
tral
ban
ks.
** T
he r
ate
refle
cts
the
6-m
th T
reas
ury
bill
rate
.
Tab
le 4
.4 C
ompa
rati
ve T
reas
ury
Bil
ls a
nd
Ban
k R
ates
45
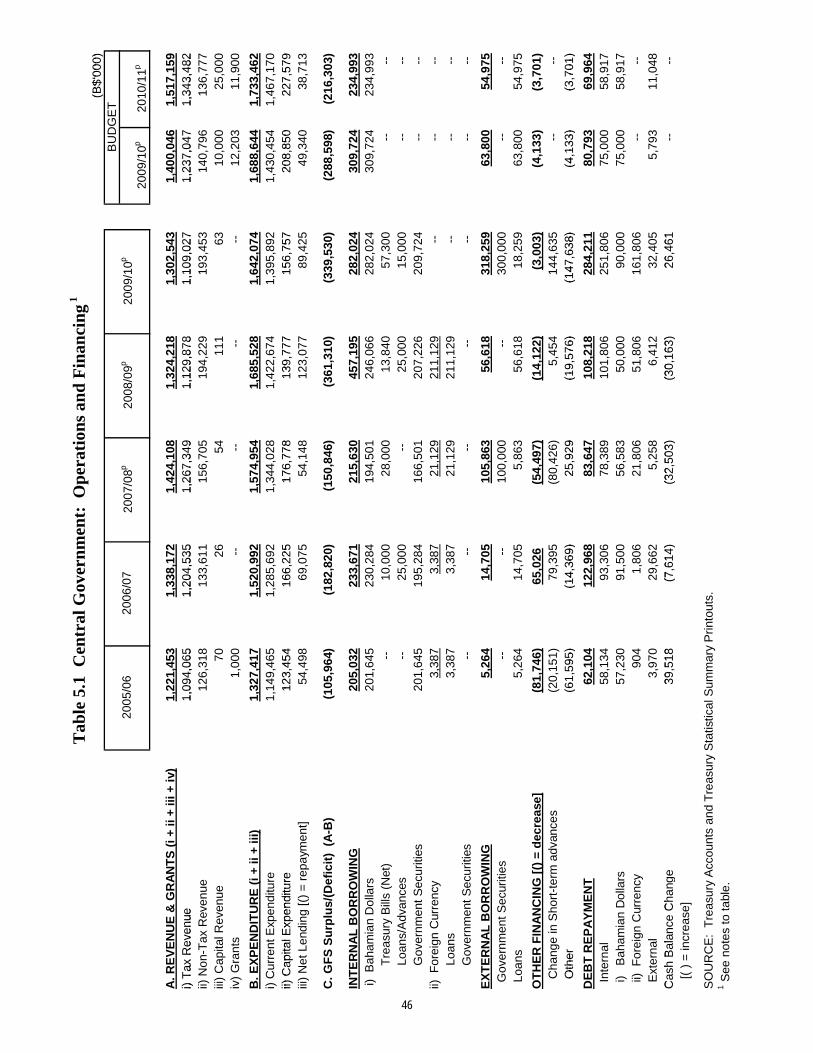
(B$'
000)
Tab
le 5
.1 C
entr
al G
over
nm
ent:
Op
erat
ion
s an
d F
inan
cin
g 1
(B$'
000)
2009
/10p
2010
/11p
A. R
EV
EN
UE
& G
RA
NT
S (
i + ii
+ ii
i + i
v)1,
221,
453
1,33
8,17
21,
424,
108
1,32
4,21
81,
302,
543
1,40
0,04
61,
517,
159
i) T
ax R
even
ue1,
094,
065
1,20
4,53
51,
267,
349
1,12
9,87
81,
109,
027
1,23
7,04
71,
343,
482
2008
/09p
2009
/10p
BU
DG
ET
2006
/07
2007
/08p
2005
/06
i) T
ax R
even
ue1,
094,
065
1,20
4,53
51,
267,
349
1,12
9,87
81,
109,
027
1,23
7,04
71,
343,
482
ii) N
on-T
ax R
even
ue12
6,31
813
3,61
115
6,70
519
4,22
919
3,45
314
0,79
613
6,77
7iii
) C
apita
l Rev
enue
7026
5411
163
10,0
0025
,000
iv)
Gra
nts
1,00
0--
--
--
--
12
,203
11,9
00
B. E
XP
EN
DIT
UR
E (
i + ii
+ ii
i)1,
327,
417
1,52
0,99
21,
574,
954
1,68
5,52
81,
642,
074
1,68
8,64
41,
733,
462
i) C
urre
nt E
xpen
ditu
re1,
149,
465
1,28
5,69
21,
344,
028
1,42
2,67
41,
395,
892
1,43
0,45
41,
467,
170
ii) C
apita
l Exp
endi
ture
123,
454
166,
225
176,
778
139,
777
156,
757
208,
850
227,
579
ii) C
apita
l Exp
endi
ture
123,
454
166,
225
176,
778
139,
777
156,
757
208,
850
227,
579
iii)
Net
Len
ding
[()
= r
epay
men
t]54
,498
69,0
7554
,148
123,
077
89,4
2549
,340
38,7
13
C. G
FS
Su
rplu
s/(D
efic
it)
(A
-B)
(105
,964
)(1
82,8
20)
(150
,846
)(3
61,3
10)
(339
,530
)(2
88,5
98)
(216
,303
)
INT
ER
NA
L B
OR
RO
WIN
G20
5,03
223
3,67
121
5,63
045
7,19
528
2,02
430
9,72
423
4,99
3 i)
Bah
amia
n D
olla
rs20
1,64
523
0,28
419
4,50
124
6,06
628
2,02
430
9,72
423
4,99
3
T
reas
ury
Bill
s (N
et)
--
10,0
0028
,000
13,8
4057
,300
--
--
Tre
asur
y B
ills
(Net
)--
10
,000
28,0
0013
,840
57,3
00--
--
L
oans
/Adv
ance
s--
25
,000
--
25,0
0015
,000
--
--
Gov
ernm
ent S
ecur
ities
201,
645
195,
284
166,
501
207,
226
209,
724
--
--
ii) F
orei
gn C
urre
ncy
3,38
73,
387
21,1
2921
1,12
9--
--
--
L
oans
3,38
73,
387
21,1
2921
1,12
9--
--
--
G
over
nmen
t Sec
uriti
es--
--
--
--
--
--
--
EX
TE
RN
AL
BO
RR
OW
ING
5,26
414
,705
105,
863
56,6
1831
8,25
963
,800
54,9
75 G
over
nmen
t Sec
uriti
es--
--
10
0,00
0--
30
0,00
0--
--
L
oans
5,26
414
,705
5,86
356
,618
18,2
5963
,800
54,9
75
OT
HE
R F
INA
NC
ING
[()
= d
ecre
ase]
(81,
746)
65,0
26(5
4,49
7)(1
4,12
2)(3
,003
)(4
,133
)(3
,701
)
Cha
nge
in S
hort
-ter
m a
dvan
ces
(20,
151)
79,3
95(8
0,42
6)5,
454
144,
635
--
--
O
ther
(61,
595)
(14,
369)
25,9
29(1
9,57
6)(1
47,6
38)
(4,1
33)
(3,7
01)
O
ther
(61,
595)
(14,
369)
25,9
29(1
9,57
6)(1
47,6
38)
(4,1
33)
(3,7
01)
DE
BT
RE
PA
YM
EN
T62
,104
122,
968
83,6
4710
8,21
828
4,21
180
,793
69,9
64 I
nter
nal
58,1
3493
,306
78,3
8910
1,80
625
1,80
675
,000
58,9
17 i
) B
aham
ian
Dol
lars
57,2
3091
,500
56,5
8350
,000
90,0
0075
,000
58,9
17 i
i) F
orei
gn C
urre
ncy
904
1,80
621
,806
51,8
0616
1,80
6--
--
E
xter
nal
3,97
029
,662
5,25
86,
412
32,4
055,
793
11,0
48C
ash
Bal
ance
Cha
nge
39,5
18(7
,614
)(3
2,50
3)(3
0,16
3)26
,461
--
--
Cas
h B
alan
ce C
hang
e 39
,518
(7,6
14)
(32,
503)
(30,
163)
26,4
61--
--
[( )
= in
crea
se]
SO
UR
CE
: T
reas
ury
Acc
ount
s an
d T
reas
ury
Sta
tistic
al S
umm
ary
Prin
tout
s.1 S
ee n
otes
to ta
ble.
46
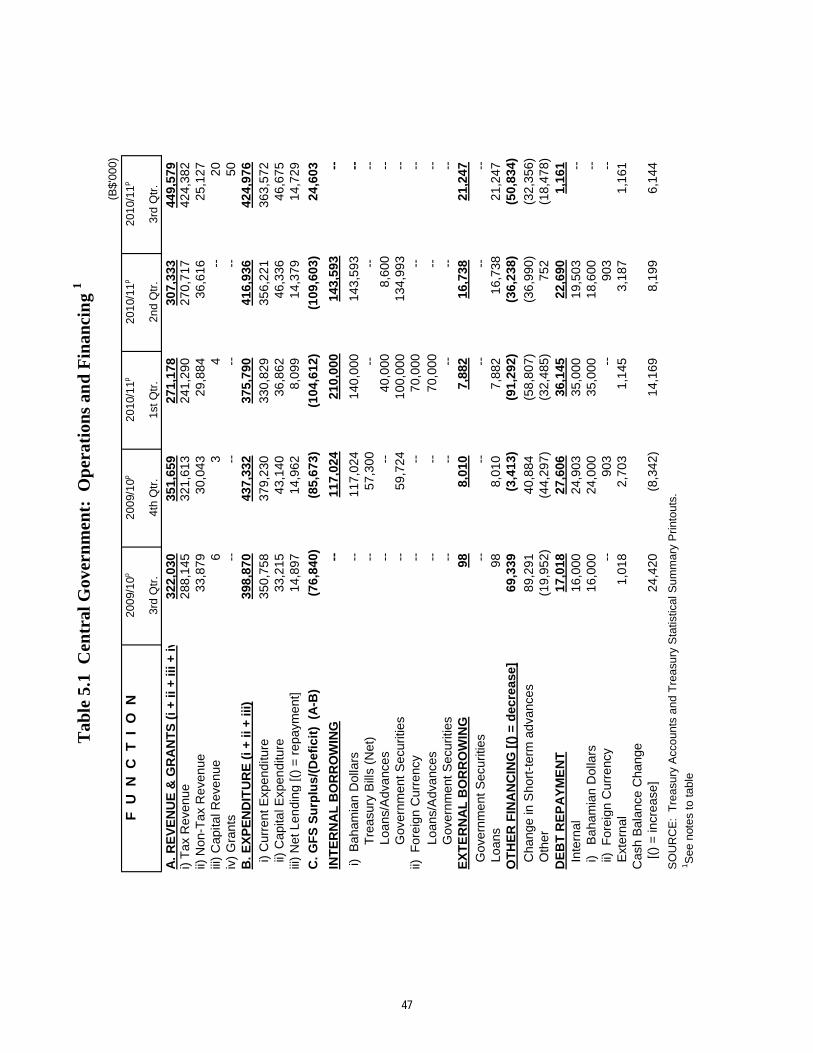
(B$'
000)
F U
N C
T I
O N
2009
/10p
2009
/10p
2010
/11p
2010
/11p
2010
/11p
3rd
Qtr
.4t
h Q
tr.
1st Q
tr.
2nd
Qtr
.3r
d Q
tr.
A. R
EV
EN
UE
& G
RA
NT
S (
i + ii
+ ii
i + iv
)32
2,03
035
1,65
927
1,17
830
7,33
344
9,57
9i)
Tax
Rev
enue
288,
145
321,
613
241,
290
270,
717
424,
382
ii) N
on-T
ax R
even
ue33
,879
30,0
4329
,884
36,6
1625
,127
iii)
Cap
ital R
even
ue6
34
--
20iv
) G
rant
s--
--
--
--
50
B. E
XP
EN
DIT
UR
E (
i + ii
+ ii
i)39
8,87
043
7,33
237
5,79
041
6,93
642
4,97
6
i)
Cur
rent
Exp
endi
ture
350,
758
379,
230
330,
829
356,
221
363,
572
ii)
Cap
ital E
xpen
ditu
re33
,215
43,1
4036
,862
46,3
3646
,675
iii)
Net
Len
ding
[()
= r
epay
men
t]14
,897
14,9
628,
099
14,3
7914
,729
C. G
FS
Su
rplu
s/(D
efic
it)
(A
-B)
(76,
840)
(85,
673)
(104
,612
)
(1
09,6
03)
24,6
03
INT
ER
NA
L B
OR
RO
WIN
G--
11
7,02
421
0,00
014
3,59
3--
i) B
aham
ian
Dol
lars
--
117,
024
140,
000
143,
593
--
Tre
asur
y B
ills
(Net
)--
57
,300
--
--
--
Loa
ns/A
dvan
ces
--
--
40,0
008,
600
--
Tab
le 5
.1 C
entr
al G
over
nm
ent:
Op
erat
ion
s an
d F
inan
cin
g 1
Loa
ns/A
dvan
ces
--
--
40,0
008,
600
--
Gov
ernm
ent S
ecur
ities
--
59,7
2410
0,00
013
4,99
3--
ii)
For
eign
Cur
renc
y--
--
70
,000
--
--
Loa
ns/A
dvan
ces
--
--
70,0
00--
--
G
over
nmen
t Sec
uriti
es--
--
--
--
--
E
XT
ER
NA
L B
OR
RO
WIN
G98
8,01
07,
882
16,7
3821
,247
Gov
ernm
ent S
ecur
ities
--
--
--
--
--
Loa
ns98
8,01
07,
882
16,7
3821
,247
OT
HE
R F
INA
NC
ING
[()
= d
ecre
ase]
69,3
39
(3,4
13)
(9
1,29
2)
(3
6,23
8)
(5
0,83
4)
Cha
nge
in S
hort
-ter
m a
dvan
ces
89,2
91
40,8
84
(58,
807)
(36,
990)
(32,
356)
Oth
er(1
9,95
2)
(4
4,29
7)
(3
2,48
5)
75
2
(1
8,47
8)
D
EB
T R
EP
AY
ME
NT
17,0
1827
,606
36,1
4522
,690
1,16
1 I
nter
nal
16,0
0024
,903
35,0
0019
,503
--
i)
Bah
amia
n D
olla
rs16
,000
24,0
0035
,000
18,6
00--
i
i) F
orei
gn C
urre
ncy
--
903
--
903
--
Ext
erna
l 1,
018
2,70
31,
145
3,18
71,
161
Cas
h B
alan
ce C
hang
e
[()
= in
crea
se]
24,4
20
(8,3
42)
14
,169
8,
199
6,
144
SO
UR
CE
: T
reas
ury
Acc
ount
s an
d T
reas
ury
Sta
tistic
al S
umm
ary
Prin
tout
s. 1S
ee n
otes
to ta
ble
47
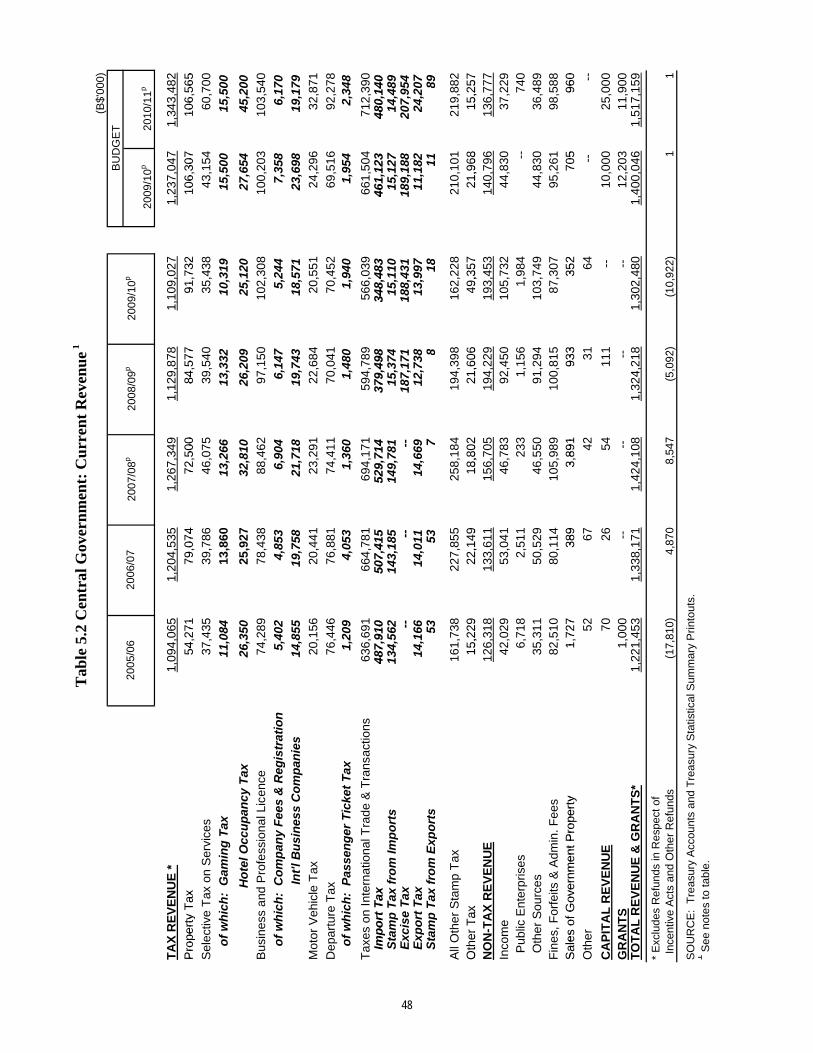
(B$'
000)
Tab
le 5
.2 C
entr
al G
over
nm
ent:
Cu
rren
t R
even
ue 1
(B$'
000)
TA
X R
EV
EN
UE
*1,
094,
065
1,20
4,53
51,
267,
349
1,12
9,87
81,
109,
027
1,23
7,04
71,
343,
482
Pro
pert
y T
ax54
,271
79,0
7472
,500
84,5
7791
,732
106,
307
106,
565
2009
/10
p
2010
/11
p
BU
DG
ET
2006
/07
2009
/10
p
2005
/06
2007
/08
p20
08/0
9p
Pro
pert
y T
ax54
,271
79,0
7472
,500
84,5
7791
,732
106,
307
106,
565
Sel
ectiv
e T
ax o
n S
ervi
ces
37,4
3539
,786
46,0
7539
,540
35,4
3843
,154
60,7
00
o
f w
hic
h:
Gam
ing
Tax
11,0
8413
,860
13,2
6613
,332
10,3
1915
,500
15,5
00
H
ote
l Occ
up
ancy
Tax
26,3
5025
,927
32,8
1026
,209
25,1
2027
,654
45,2
00
Bus
ines
s an
d P
rofe
ssio
nal L
icen
ce74
,289
78,4
3888
,462
97,1
5010
2,30
810
0,20
310
3,54
0
o
f w
hic
h:
Co
mp
any
Fee
s &
Reg
istr
atio
n5,
402
4,85
36,
904
6,14
75,
244
7,35
86,
170
o
f w
hic
h:
Co
mp
any
Fee
s &
Reg
istr
atio
n5,
402
4,85
36,
904
6,14
75,
244
7,35
86,
170
Int'
l Bu
sin
ess
Co
mp
anie
s14
,855
19,7
5821
,718
19,7
4318
,571
23,6
9819
,179
Mot
or V
ehic
le T
ax20
,156
20,4
4123
,291
22,6
8420
,551
24,2
9632
,871
Dep
artu
re T
ax76
,446
76,8
8174
,411
70,0
4170
,452
69,5
1692
,278
o
f w
hic
h:
Pas
sen
ger
Tic
ket
Tax
1,20
94,
053
1,36
01,
480
1,94
01,
954
2,34
8
Tax
es o
n In
tern
atio
nal T
rade
& T
rans
actio
ns63
6,69
166
4,78
169
4,17
159
4,78
956
6,03
966
1,50
471
2,39
0
Imp
ort
Tax
487,
910
507,
415
529,
714
379,
498
348,
483
461,
123
480,
140
Im
po
rt T
ax48
7,91
050
7,41
552
9,71
437
9,49
834
8,48
346
1,12
348
0,14
0
Sta
mp
Tax
fro
m Im
po
rts
134,
562
143,
185
149,
781
15,3
7415
,110
15,1
2714
,489
E
xcis
e T
ax--
----
187,
171
188,
431
189,
188
207,
954
E
xpo
rt T
ax14
,166
14,0
1114
,669
12,7
3813
,997
11,1
8224
,207
S
tam
p T
ax f
rom
Exp
ort
s53
537
818
1189
All
Oth
er S
tam
p T
ax16
1,73
822
7,85
525
8,18
419
4,39
816
2,22
821
0,10
121
9,88
2O
ther
Tax
15,2
2922
,149
18,8
0221
,606
49,3
5721
,968
15,2
57O
ther
Tax
15,2
2922
,149
18,8
0221
,606
49,3
5721
,968
15,2
57N
ON
-TA
X R
EV
EN
UE
126,
318
133,
611
156,
705
194,
229
193,
453
140,
796
136,
777
Inco
me
42,0
2953
,041
46,7
8392
,450
105,
732
44,8
3037
,229
Pub
lic E
nter
pris
es6,
718
2,51
123
31,
156
1,98
4--
740
Oth
er S
ourc
es35
,311
50,5
2946
,550
91,2
9410
3,74
944
,830
36,4
89F
ines
, For
feits
& A
dmin
. Fee
s82
,510
80,1
1410
5,98
910
0,81
587
,307
95,2
6198
,588
Sal
es o
f Gov
ernm
ent P
rope
rty
1,72
738
93,
891
933
352
705
960
Sal
es o
f Gov
ernm
ent P
rope
rty
1,72
738
93,
891
933
352
705
960
Oth
er52
6742
3164
--
--
CA
PIT
AL
RE
VE
NU
E70
2654
111
--
10,0
0025
,000
GR
AN
TS
1,00
0--
--
--
--
12
,203
11,9
00T
OT
AL
RE
VE
NU
E &
GR
AN
TS
*1,
221,
453
1,33
8,17
11,
424,
108
1,32
4,21
81,
302,
480
1,40
0,04
61,
517,
159
0
* E
xclu
des
Ref
unds
in R
espe
ct o
f I
ncen
tive
Act
s an
d O
ther
Ref
unds
(17,
810)
4,87
08,
547
(5,0
92)
(10,
922)
11
Inc
entiv
e A
cts
and
Oth
er R
efun
ds(1
7,81
0)4,
870
8,54
7(5
,092
)(1
0,92
2)1
1
SO
UR
CE
: T
reas
ury
Acc
ount
s an
d T
reas
ury
Sta
tistic
al S
umm
ary
Prin
tout
s.1
See
not
es to
tabl
e.
48
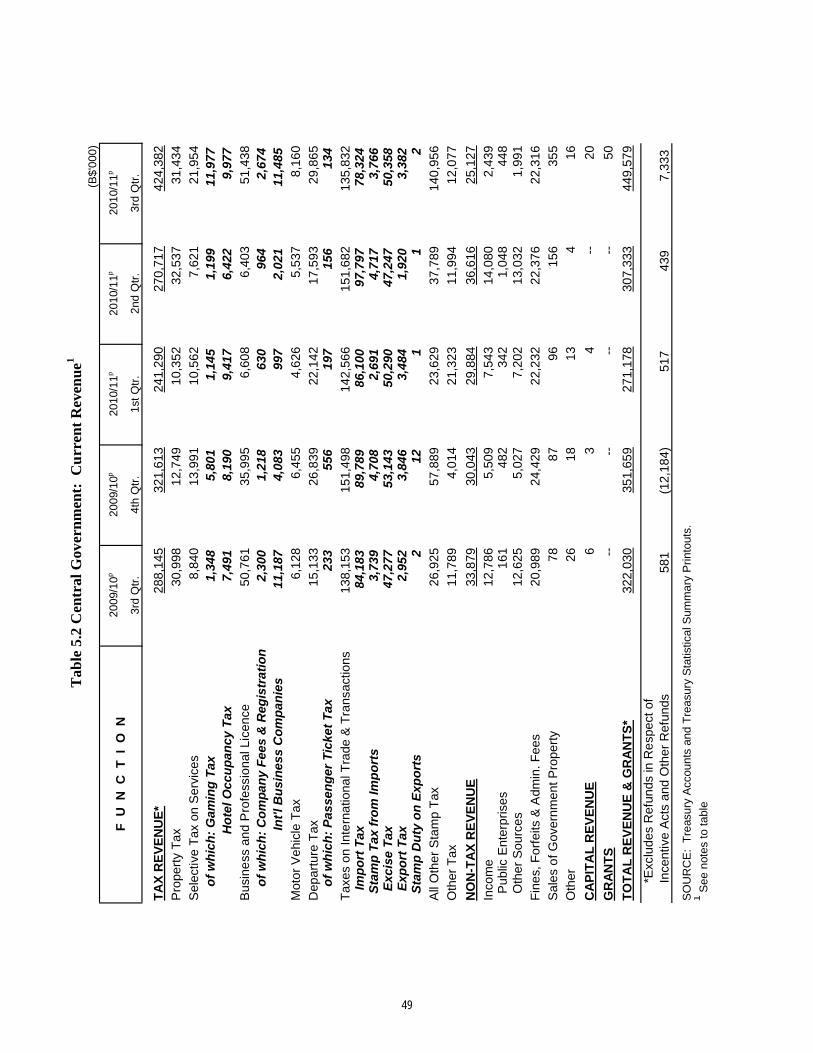
(B$'
000)
2009
/10p
2009
/10p
2010
/11p
2010
/11p
2010
/11p
3rd
Qtr
.4t
h Q
tr.
1st Q
tr.
2nd
Qtr
.3r
d Q
tr.
TA
X R
EV
EN
UE
*28
8,14
532
1,61
324
1,29
027
0,71
742
4,38
2
Pro
pert
y T
ax30
,998
12,7
4910
,352
32,5
3731
,434
Sel
ectiv
e T
ax o
n S
ervi
ces
8,84
013
,991
10,5
627,
621
21,9
54
of
wh
ich
: G
amin
g T
ax1,
348
5,80
11,
145
1,19
911
,977
Ho
tel O
ccu
pan
cy T
ax7,
491
8,19
09,
417
6,42
29,
977
Bus
ine
ss a
nd P
rofe
ssio
nal L
icen
ce50
,761
35,9
956,
608
6,40
351
,438
o
f w
hic
h:
Co
mp
any
Fee
s &
Reg
istr
atio
n2,
300
1,21
863
096
42,
674
In
t'l B
usi
nes
s C
om
pan
ies
11,1
874,
083
997
2,02
111
,485
Mot
or V
ehic
le T
ax6,
128
6,45
54,
626
5,53
78,
160
Dep
artu
re T
ax15
,133
26,8
3922
,142
17,5
9329
,865
o
f w
hic
h:
Pas
sen
ger
Tic
ket
Tax
233
556
197
156
134
Tax
es o
n In
tern
atio
nal T
rade
& T
rans
actio
ns13
8,15
315
1,49
814
2,56
615
1,68
213
5,83
2
Imp
ort
Tax
84,1
8389
,789
86,1
0097
,797
78,3
24 S
tam
p T
ax f
rom
Imp
ort
s3,
739
4,70
82,
691
4,71
73,
766
Tab
le 5
.2 C
entr
al G
over
nm
ent:
Cu
rren
t R
even
ue1
F U
N C
T I
O N
Sta
mp
Tax
fro
m Im
po
rts
3,73
94,
708
2,69
14,
717
3,76
6E
xcis
e T
ax47
,277
53,1
4350
,290
47,2
4750
,358
Exp
ort
Tax
2,95
23,
846
3,48
41,
920
3,38
2 S
tam
p D
uty
on
Exp
ort
s2
121
12
All
Oth
er S
tam
p T
ax26
,925
57,8
8923
,629
37,7
8914
0,95
6
Oth
er T
ax11
,789
4,01
421
,323
11,9
9412
,077
NO
N-T
AX
RE
VE
NU
E33
,879
30,0
4329
,884
36,6
1625
,127
Inco
me
12,7
865,
509
7,54
314
,080
2,43
9 P
ublic
Ent
erpr
ises
161
482
342
1,04
844
8 O
ther
Sou
rces
12,6
255,
027
7,20
213
,032
1,99
1
Fin
es, F
orfe
its &
Adm
in. F
ees
20,9
8924
,429
22,2
3222
,376
22,3
16
Sal
es o
f Gov
ernm
ent P
rope
rty
7887
9615
635
5
Oth
er26
1813
416
CA
PIT
AL
RE
VE
NU
E6
34
--20
GR
AN
TS
----
----
50
TO
TA
L R
EV
EN
UE
& G
RA
NT
S*
322,
030
351,
659
271,
178
307,
333
449,
579
*
Exc
lude
s R
efun
ds in
Re
spec
t of
I
ncen
tive
Act
s an
d O
ther
Ref
unds
581
(1
2,18
4)
51
7
439
7,
333
** A
pril
& M
ay 2
003
SO
UR
CE
: T
reas
ury
Acc
ount
s an
d T
reas
ury
Sta
tistic
al S
umm
ary
Prin
tout
s.1
See
not
es to
tabl
e
49
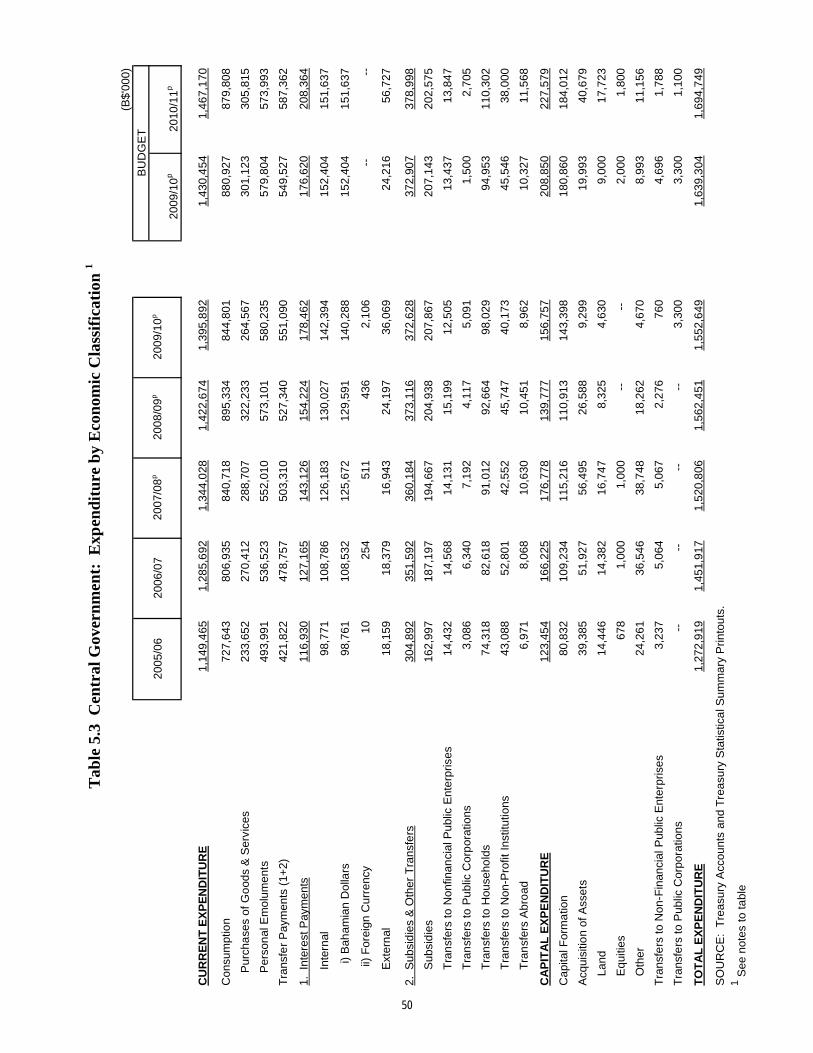
(B$'
000)
2005
/06
2006
/07
2007
/08
p20
08/0
9p
2009
/10
p
2009
/10
p20
10/1
1p
CU
RR
EN
T E
XP
EN
DIT
UR
E1,
149,
465
1,28
5,6
921,
344,
028
1,42
2,6
741,
395,
892
1,43
0,4
541,
467,
170
Con
sum
ptio
n72
7,64
380
6,93
584
0,71
889
5,33
484
4,80
188
0,92
787
9,80
8
P
urch
ase
s of
Go
ods
& S
ervi
ces
233,
652
270,
412
288,
707
322,
233
264,
567
301,
123
305,
815
P
erso
nal
Em
olum
ents
493,
991
536,
523
552,
010
573,
101
580,
235
579,
804
573,
993
Tra
nsfe
r P
aym
ents
(1+
2)42
1,82
247
8,75
750
3,31
052
7,34
055
1,09
054
9,52
758
7,36
2
1. I
nter
est P
aym
ents
116,
930
127,
165
143,
126
154,
224
178,
462
176,
620
208,
364
I
nter
nal
98,7
7110
8,78
612
6,18
313
0,02
714
2,39
415
2,40
415
1,63
7
i) B
aham
ian
Dol
lars
98,7
6110
8,53
212
5,67
212
9,59
114
0,28
815
2,40
415
1,63
7
ii) F
orei
gn C
urre
ncy
1025
451
143
62,
106
--
--
E
xter
nal
18,1
5918
,379
16,9
4324
,197
36,0
6924
,216
56,7
27
2. S
ubsi
die
s &
Oth
er T
rans
fers
304,
892
351,
592
360,
184
373,
116
372,
628
372,
907
378,
998
S
ubsi
die
s16
2,99
718
7,19
719
4,66
720
4,93
820
7,86
720
7,14
320
2,57
5
T
ran
sfer
s to
Non
finan
cial
Pub
lic E
nter
pris
es14
,432
14,5
6814
,131
15,1
9912
,505
13,4
3713
,847
T
ran
sfer
s to
Pub
lic C
orp
orat
ions
3,08
66,
340
7,19
24,
117
5,09
11,
500
2,70
5
T
ran
sfer
s to
Hou
seho
lds
74,3
1882
,618
91,0
1292
,664
98,0
2994
,953
110,
302
T
ran
sfer
s to
Non
-Pro
fit I
nstit
utio
ns43
,088
52,8
0142
,552
45,7
4740
,173
45,5
4638
,000
T
ran
sfer
s A
bro
ad6,
971
8,06
810
,630
10,4
518,
962
10,3
2711
,568
CA
PIT
AL
EX
PE
ND
ITU
RE
123,
454
166,
225
176,
778
139,
777
156,
757
208,
850
227,
579
Cap
ital F
orm
atio
n80
,832
109,
234
115,
216
110,
913
143,
398
180,
860
184,
012
Acq
uisi
tion
of A
sset
s39
,385
51,9
2756
,495
26,5
889,
299
19,9
9340
,679
La
nd14
,446
14,3
8216
,747
8,32
54,
630
9,00
017
,723
E
quiti
es67
81,
000
1,00
0--
--
2,
000
1,80
0
O
ther
24,2
6136
,546
38,7
4818
,262
4,67
08,
993
11,1
56
Tra
nsfe
rs to
Non
-Fin
anci
al P
ublic
Ent
erpr
ises
3,23
75,
064
5,06
72,
276
760
4,69
61,
788
Tra
nsfe
rs to
Pub
lic C
orpo
ratio
ns--
--
--
--
3,
300
3,30
01,
100
TO
TA
L E
XP
EN
DIT
UR
E1,
272,
919
1,45
1,9
171,
520,
806
1,56
2,4
511,
552,
649
1,63
9,3
041,
694,
749
SO
UR
CE
: T
reas
ury
Acc
ount
s an
d T
reas
ury
Sta
tistic
al S
umm
ary
Prin
tout
s.1 S
ee n
otes
to ta
ble
BU
DG
ET
Tab
le 5
.3 C
entr
al G
over
nm
ent:
Exp
end
itu
re b
y E
con
omic
Cla
ssif
icat
ion
1
50
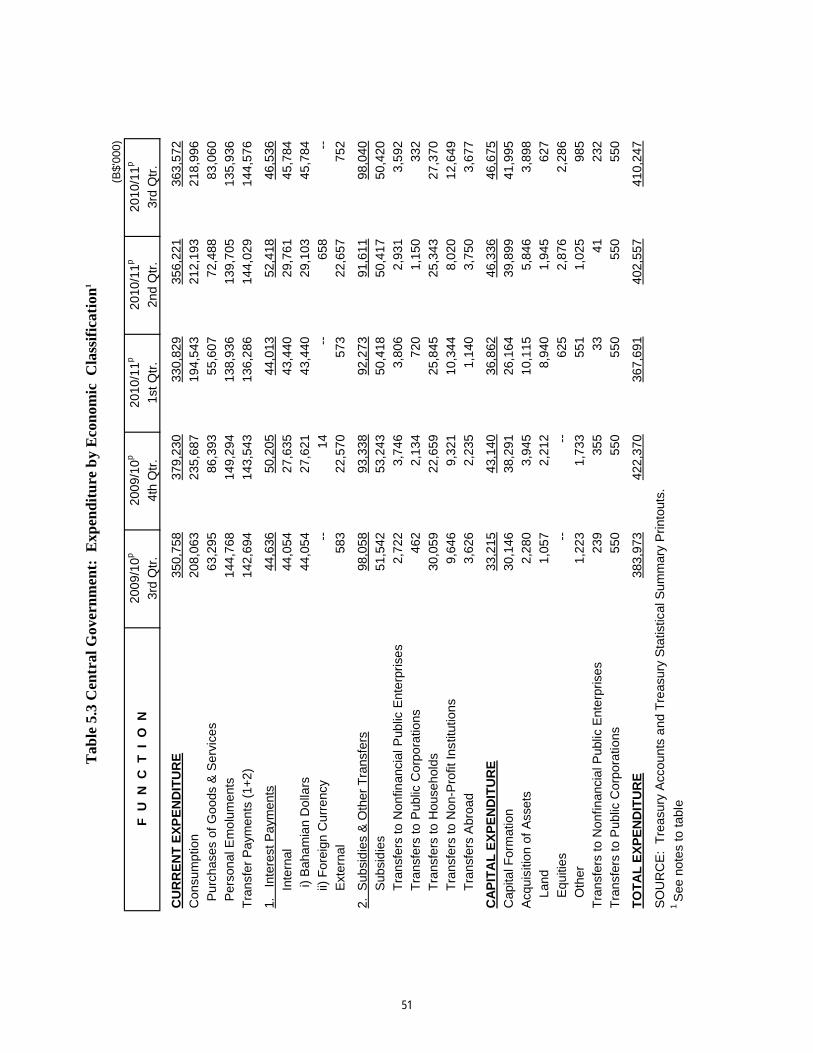
(B$'
000)
2009
/10
p20
09/1
0p
2010
/11
p20
10/1
1p
2010
/11
p
3rd
Qtr
.4t
h Q
tr.
1st Q
tr.
2nd
Qtr
.3r
d Q
tr.
CU
RR
EN
T E
XP
EN
DIT
UR
E35
0,75
837
9,23
033
0,82
935
6,22
136
3,57
2
Con
sum
ptio
n20
8,06
323
5,68
719
4,54
321
2,19
321
8,99
6
Pur
chas
es o
f Goo
ds &
Ser
vice
s63
,295
86,3
9355
,607
72,4
8883
,060
Per
sona
l Em
olum
ents
144,
768
149,
294
138,
936
139,
705
135,
936
Tra
nsfe
r P
aym
ents
(1+
2)14
2,69
414
3,54
313
6,28
614
4,02
914
4,57
6
1.
Inte
rest
Pay
men
ts44
,636
50,2
0544
,013
52,4
1846
,536
I
nter
nal
44,0
5427
,635
43,4
4029
,761
45,7
84
i) B
aham
ian
Dol
lars
44,0
5427
,621
43,4
4029
,103
45,7
84
i
i) F
orei
gn C
urre
ncy
--14
--65
8--
E
xter
nal
583
22,5
7057
322
,657
752
2. S
ubsi
die
s &
Oth
er T
rans
fers
98,0
5893
,338
92,2
7391
,611
98,0
40
S
ubsi
die
s51
,542
53,2
4350
,418
50,4
1750
,420
T
rans
fers
to N
onfin
anci
al P
ublic
Ent
erpr
ises
2,72
23,
746
3,80
62,
931
3,59
2
T
rans
fers
to P
ublic
Cor
pora
tions
462
2,13
472
01,
150
332
T
rans
fers
to H
ouse
hold
s30
,059
22,6
5925
,845
25,3
4327
,370
T
rans
fers
to N
on-P
rofit
Inst
itutio
ns9,
646
9,32
110
,344
8,02
012
,649
T
rans
fers
Abr
oad
3,62
62,
235
1,14
03,
750
3,67
7
CA
PIT
AL
EX
PE
ND
ITU
RE
33,2
1543
,140
36,8
6246
,336
46,6
75
Cap
ital F
orm
atio
n30
,146
38,2
9126
,164
39,8
9941
,995
Acq
uisi
tion
of A
sset
s2,
280
3,94
510
,115
5,84
63,
898
La
nd1,
057
2,21
28,
940
1,94
562
7
E
quiti
es--
--62
52,
876
2,28
6
O
ther
1,22
31,
733
551
1,02
598
5
Tra
nsfe
rs to
Non
finan
cia
l Pub
lic E
nter
pris
es23
935
533
4123
2
Tra
nsfe
rs to
Pub
lic C
orpo
ratio
ns55
055
055
055
055
0
TO
TA
L E
XP
EN
DIT
UR
E38
3,97
342
2,37
036
7,69
140
2,55
741
0,24
7
SO
UR
CE
: T
reas
ury
Acc
ount
s a
nd T
reas
ury
Sta
tistic
al S
umm
ary
Prin
tout
s.1
See
not
es to
tabl
e
F U
N C
T I
O N
Tab
le 5
.3 C
entr
al G
over
nm
ent:
Exp
end
itu
re b
y E
con
omic
Cla
ssif
icat
ion
1
51
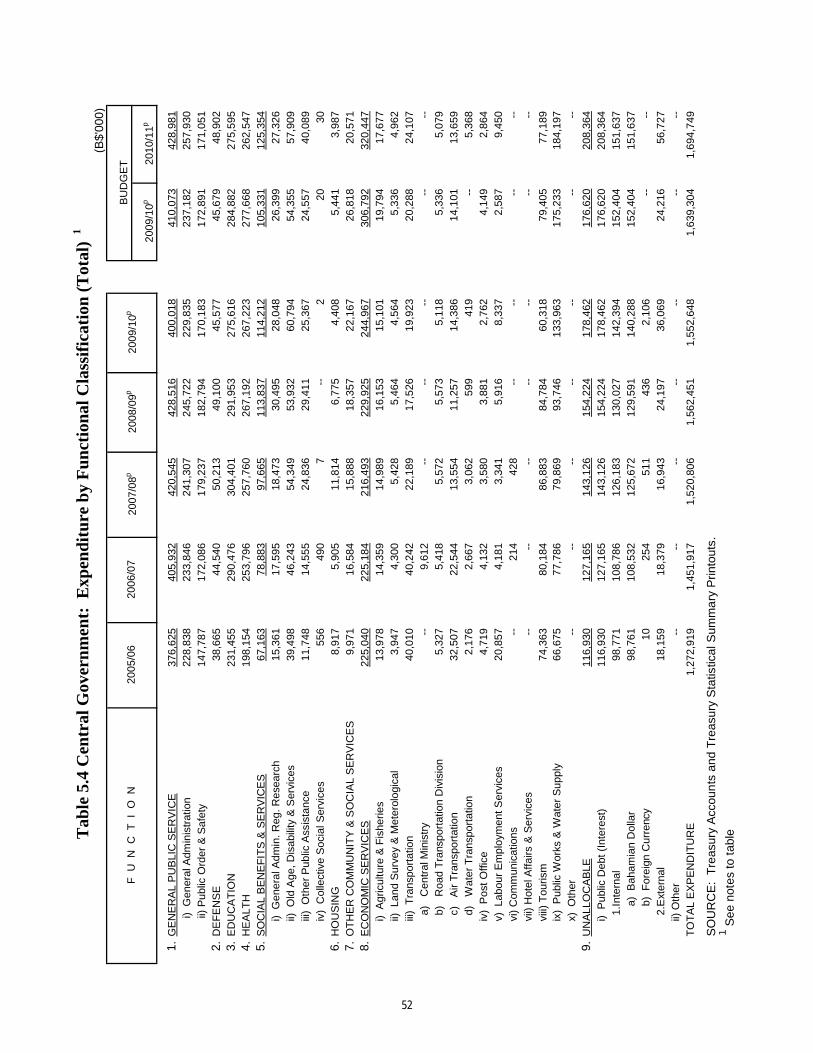
(B$'
000)
2009
/10p
2010
/11p
1.G
EN
ER
AL
PU
BLI
C S
ER
VIC
E37
6,62
540
5,93
242
0,54
542
8,51
640
0,01
841
0,07
342
8,98
1
i)
Gen
eral
Adm
inis
trat
ion
228,
838
233,
846
241,
307
245,
722
229,
835
237,
182
257,
930
ii)
Pub
lic O
rder
& S
afet
y14
7,78
717
2,08
617
9,23
718
2,79
417
0,18
317
2,89
117
1,05
12.
DE
FE
NS
E38
,665
44,5
4050
,213
49,1
0045
,577
45,6
7948
,902
3.E
DU
CA
TIO
N23
1,45
529
0,47
630
4,40
129
1,95
327
5,61
628
4,88
227
5,59
54.
HE
ALT
H19
8,15
425
3,79
625
7,76
026
7,19
226
7,22
327
7,66
826
2,54
75.
SO
CIA
L B
EN
EF
ITS
& S
ER
VIC
ES
67,1
6378
,883
97,6
6511
3,83
711
4,21
210
5,33
112
5,35
4
i)
Gen
eral
Adm
in. R
eg. R
esea
rch
15,3
6117
,595
18,4
7330
,495
28,0
4826
,399
27,3
26
ii)
Old
Age
, Dis
abili
ty &
Ser
vice
s39
,498
46,2
4354
,349
53,9
3260
,794
54,3
5557
,909
iii)
Oth
er P
ublic
Ass
ista
nce
11,7
4814
,555
24,8
3629
,411
25,3
6724
,557
40,0
89
iv
) C
olle
ctiv
e S
ocia
l Ser
vice
s55
649
07
--2
2030
6.H
OU
SIN
G8,
917
5,90
511
,814
6,77
54,
408
5,44
13,
987
7.O
TH
ER
CO
MM
UN
ITY
& S
OC
IAL
SE
RV
ICE
S9,
971
16,5
8415
,888
18,3
5722
,167
26,8
1820
,571
8.E
CO
NO
MIC
SE
RV
ICE
S22
5,04
022
5,18
421
6,49
322
9,92
524
4,96
730
6,79
232
0,44
7
i)
Agr
icul
ture
& F
ishe
ries
13,9
7814
,359
14,9
8916
,153
15,1
0119
,794
17,6
77
ii)
Lan
d S
urve
y &
Met
erol
ogic
al3,
947
4,30
05,
428
5,46
44,
564
5,33
64,
962
iii)
Tra
nspo
rtat
ion
40,0
1040
,242
22,1
8917
,526
19,9
2320
,288
24,1
07
a
)
Cen
tral
Min
istr
y -
-9,
612
--
--
--
----
b)
R
oad
Tra
nspo
rtat
ion
Div
isio
n5,
327
5,41
85,
572
5,57
35,
118
5,33
65,
079
c)
Air
Tra
nspo
rtat
ion
32,5
0722
,544
13,5
5411
,257
14,3
8614
,101
13,6
59
d
)
Wat
er T
rans
port
atio
n2,
176
2,66
73,
062
599
419
--5,
368
iv)
Pos
t O
ffice
4,71
94,
132
3,58
03,
881
2,76
24,
149
2,86
4
v)
Lab
our
Em
ploy
men
t Ser
vice
s20
,857
4,18
13,
341
5,91
68,
337
2,58
79,
450
vi)
Com
mun
icat
ions
--
214
428
-- -
- -
- -
-
vi
i) H
otel
Affa
irs &
Ser
vice
s -
- -
---
-- -
- -
- -
-
vi
ii) T
ouris
m74
,363
80,1
8486
,883
84,7
8460
,318
79,4
0577
,189
ix)
Pub
lic W
orks
& W
ater
Sup
ply
66,6
7577
,786
79,8
6993
,746
133,
963
175,
233
184,
197
x) O
ther
--
--
----
--
-- -
-9.
UN
ALL
OC
AB
LE11
6,93
012
7,16
514
3,12
615
4,22
417
8,46
217
6,62
020
8,36
4
i)
Pub
lic D
ebt (
Inte
rest
)11
6,93
012
7,16
514
3,12
615
4,22
417
8,46
217
6,62
020
8,36
4
1
.Int
erna
l98
,771
108,
786
126,
183
130,
027
142,
394
152,
404
151,
637
a
) B
aham
ian
Dol
lar
98,7
6110
8,53
212
5,67
212
9,59
114
0,28
815
2,40
415
1,63
7
b)
For
eign
Cur
renc
y10
254
511
436
2,10
6 -
- -
-
2
.Ext
erna
l18
,159
18,3
7916
,943
24,1
9736
,069
24,2
1656
,727
ii) O
ther
--
--
----
--
--
--
TO
TA
L E
XP
EN
DIT
UR
E1,
272,
919
1,45
1,91
71,
520,
806
1,56
2,45
11,
552,
648
1,63
9,30
41,
694,
749
SO
UR
CE
: T
reas
ury
Acc
oun
ts a
nd T
reas
ury
Sta
tistic
al S
umm
ary
Prin
tout
s.1 S
ee n
otes
to t
able
2008
/09p
2005
/06
2006
/07
2007
/08p
2009
/10p
BU
DG
ET
Tab
le 5
.4 C
entr
al G
over
nm
ent:
Exp
end
itu
re b
y F
un
ctio
nal
Cla
ssif
icat
ion
(T
otal
) 1
F U
N
C T
I O
N
52
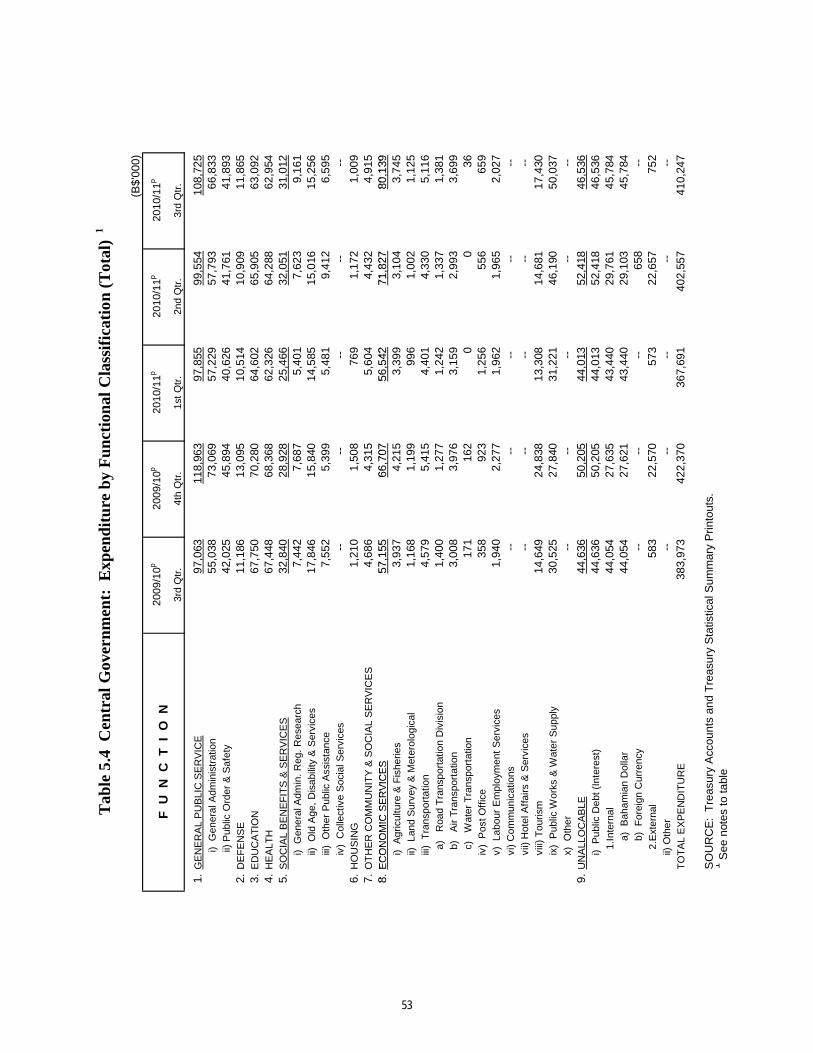
(B$'
000)
2009
/10p
2009
/10p
2010
/11p
2010
/11p
2010
/11p
3rd
Qtr
.4t
h Q
tr.
1st
Qtr
.2n
d Q
tr.
3rd
Qtr
.
1.G
EN
ER
AL
PU
BLI
C S
ER
VIC
E97
,063
118,
963
97,8
5599
,554
108,
725
i) G
ener
al A
dmin
istr
atio
n55
,038
73,0
6957
,229
57,7
9366
,833
ii) P
ublic
Ord
er &
Saf
ety
42,0
2545
,894
40,6
2641
,761
41,8
932.
DE
FE
NS
E11
,186
13,0
9510
,514
10,9
0911
,865
3.E
DU
CA
TIO
N67
,750
70,2
8064
,602
65,9
0563
,092
4.H
EA
LTH
67,4
4868
,368
62,3
2664
,288
62,9
545.
SO
CIA
L B
EN
EF
ITS
& S
ER
VIC
ES
32,8
4028
,928
25,4
6632
,051
31,0
12
i)
Gen
eral
Adm
in. R
eg.
Res
earc
h7,
442
7,68
75,
401
7,62
39,
161
i
i) O
ld A
ge,
Dis
abili
ty &
Ser
vice
s17
,846
15,8
4014
,585
15,0
1615
,256
i
ii)
Oth
er P
ublic
Ass
ista
nce
7,55
25,
399
5,48
19,
412
6,59
5
iv)
Col
lect
ive
Soc
ial S
ervi
ces
--
--
--
--
--
6.H
OU
SIN
G1,
210
1,50
876
91,
172
1,00
97.
OT
HE
R C
OM
MU
NIT
Y &
SO
CIA
L S
ER
VIC
ES
4,68
64,
315
5,60
44,
432
4,91
58.
EC
ON
OM
IC S
ER
VIC
ES
57,1
5566
,707
56,5
4271
,827
80,1
39
F U
N C
T I
O N
Tab
le 5
.4 C
entr
al G
over
nm
ent:
Exp
end
itu
re b
y F
un
ctio
nal
Cla
ssif
icat
ion
(T
otal
) 1
8.E
CO
NO
MIC
SE
RV
ICE
S57
,155
66,7
0756
,542
71,8
2780
,139
i
) A
gric
ultu
re &
Fis
herie
s3,
937
4,21
53,
399
3,10
43,
745
i
i) L
and
Sur
vey
& M
eter
olog
ical
1,16
81,
199
996
1,00
21,
125
i
ii)
Tra
nspo
rtat
ion
4,57
95,
415
4,40
14,
330
5,11
6
a
)
Roa
d T
rans
port
atio
n D
ivis
ion
1,40
01,
277
1,24
21,
337
1,38
1
b
)
Air
Tra
nspo
rtat
ion
3,00
83,
976
3,15
92,
993
3,69
9
c
) W
ater
Tra
nspo
rtat
ion
171
162
00
36
iv)
Pos
t Off
ice
358
923
1,25
655
665
9
v)
Lab
our
Em
ploy
men
t S
ervi
ces
1,94
02,
277
1,96
21,
965
2,02
7
vi)
Com
mun
icat
ions
--
--
--
--
--
v
ii) H
otel
Aff
airs
& S
ervi
ces
--
--
--
--
--
v
iii)
Tou
rism
14,6
4924
,838
13,3
0814
,681
17,4
30
ix)
P
ublic
Wor
ks &
Wat
er S
uppl
y30
,525
27,8
4031
,221
46,1
9050
,037
x
) O
ther
--
--
--
--
--
9.U
NA
LLO
CA
BLE
44,6
3650
,205
44,0
1352
,418
46,5
36
i)
Pub
lic D
ebt (
Inte
rest
)44
,636
50,2
0544
,013
52,4
1846
,536
1.I
nter
nal
44,0
5427
,635
43,4
4029
,761
45,7
84
a)
Bah
amia
n D
olla
r44
,054
27,6
2143
,440
29,1
0345
,784
b
) F
orei
gn C
urre
ncy
--
--
--
658
--
2.E
xter
nal
583
22,5
7057
322
,657
752
i
i) O
ther
--
--
--
--
--
TO
TA
L E
XP
EN
DIT
UR
E38
3,97
342
2,37
036
7,69
140
2,55
741
0,24
7
SO
UR
CE
: T
reas
ury
Acc
ount
s an
d T
reas
ury
Sta
tistic
al S
umm
ary
Prin
tout
s.1 S
ee n
otes
to ta
ble
53
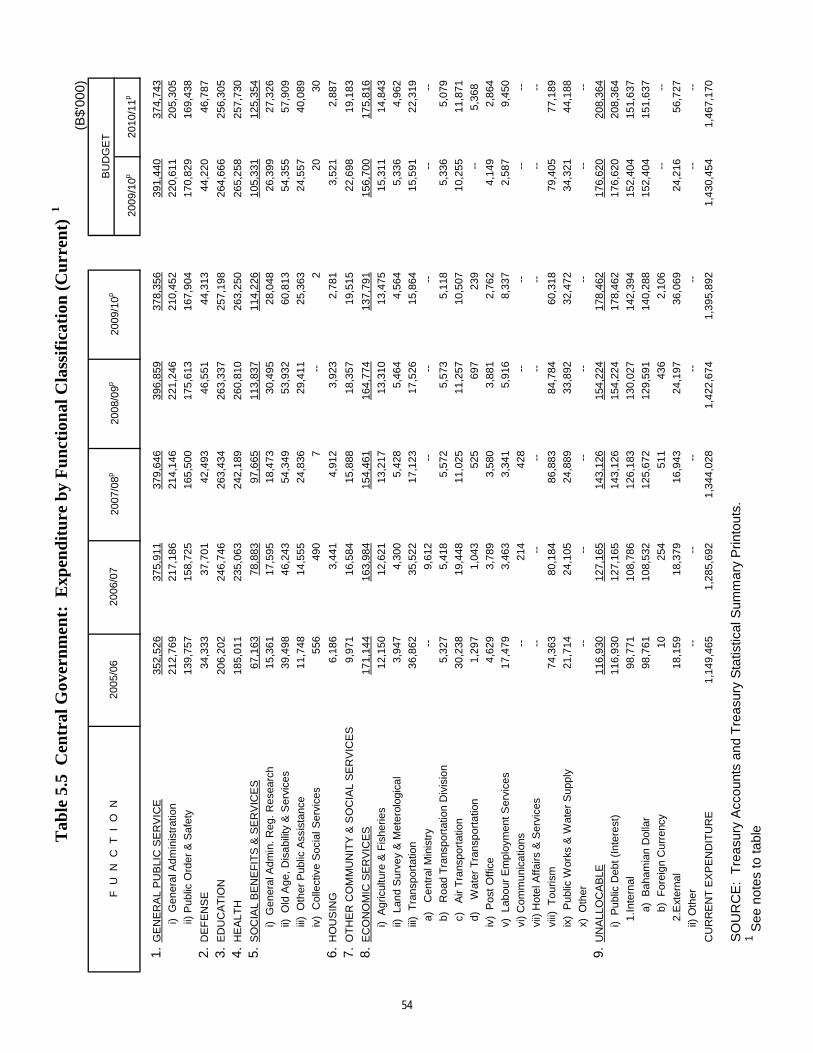
(B$'
000)
2009
/10p
2010
/11p
1.G
EN
ER
AL
PU
BLI
C S
ER
VIC
E35
2,52
637
5,91
137
9,64
639
6,85
937
8,35
639
1,44
037
4,74
3
i) G
ener
al A
dmin
istr
atio
n21
2,76
921
7,18
621
4,14
622
1,24
621
0,45
222
0,61
120
5,30
5
ii)
Pub
lic O
rder
& S
afet
y13
9,75
715
8,72
516
5,50
017
5,61
316
7,90
417
0,82
916
9,43
8
2.D
EF
EN
SE
34,3
3337
,701
42,4
9346
,551
44,3
1344
,220
46,7
87
3.E
DU
CA
TIO
N20
6,20
224
6,74
626
3,43
426
3,33
725
7,19
826
4,66
625
6,30
5
4.H
EA
LTH
185,
011
235,
063
242,
189
260,
810
263,
250
265,
258
257,
730
5.S
OC
IAL
BE
NE
FIT
S &
SE
RV
ICE
S67
,163
78,8
8397
,665
113,
837
114,
226
105,
331
125,
354
i) G
ener
al A
dmin
. Reg
. Res
earc
h15
,361
17,5
9518
,473
30,4
9528
,048
26,3
9927
,326
ii) O
ld A
ge, D
isab
ility
& S
ervi
ces
39,4
9846
,243
54,3
4953
,932
60,8
1354
,355
57,9
09
iii)
Oth
er P
ublic
Ass
ista
nce
11,7
4814
,555
24,8
3629
,411
25,3
6324
,557
40,0
89
iv)
Col
lect
ive
Soc
ial S
ervi
ces
556
490
7 -
-2
2030
6.H
OU
SIN
G6,
186
3,44
14,
912
3,92
32,
781
3,52
12,
887
7.O
TH
ER
CO
MM
UN
ITY
& S
OC
IAL
SE
RV
ICE
S9,
971
16,5
8415
,888
18,3
5719
,515
22,6
9819
,183
8.E
CO
NO
MIC
SE
RV
ICE
S17
1,14
416
3,98
415
4,46
116
4,77
413
7,79
115
6,70
017
5,81
6
i) A
gric
ultu
re &
Fis
herie
s12
,150
12,6
2113
,217
13,3
1013
,475
15,3
1114
,843
ii) L
and
Sur
vey
& M
eter
olog
ical
3,94
74,
300
5,42
85,
464
4,56
45,
336
4,96
2
iii)
Tra
nspo
rtat
ion
36,8
6235
,522
17,1
2317
,526
15,8
6415
,591
22,3
19
a)
C
entr
al M
inis
try
--
9,61
2 -
- -
- -
- -
---
b)
R
oad
Tra
nspo
rtat
ion
Div
isio
n5,
327
5,41
85,
572
5,57
35,
118
5,33
65,
079
c)
Air
Tra
nspo
rtat
ion
30,2
3819
,448
11,0
2511
,257
10,5
0710
,255
11,8
71
d)
W
ater
Tra
nspo
rtat
ion
1,29
71,
043
525
697
239
--5,
368
iv)
Pos
t O
ffice
4,62
93,
789
3,58
03,
881
2,76
24,
149
2,86
4
v) L
abou
r E
mpl
oym
ent S
ervi
ces
17,4
793,
463
3,34
15,
916
8,33
72,
587
9,45
0
vi)
Com
mun
icat
ions
--
214
428
--
--
--
--
vii)
Hot
el A
ffairs
& S
ervi
ces
--
--
-- -
- -
- -
---
viii)
Tou
rism
74,3
6380
,184
86,8
8384
,784
60,3
1879
,405
77,1
89
ix)
Pub
lic W
orks
& W
ater
Sup
ply
21,7
1424
,105
24,8
8933
,892
32,4
7234
,321
44,1
88
x) O
ther
--
--
-- -
- -
- -
---
9.U
NA
LLO
CA
BLE
116,
930
127,
165
143,
126
154,
224
178,
462
176,
620
208,
364
i) P
ublic
Deb
t (In
tere
st)
116,
930
127,
165
143,
126
154,
224
178,
462
176,
620
208,
364
1.I
nter
nal
98,7
7110
8,78
612
6,18
313
0,02
714
2,39
415
2,40
415
1,63
7
a
) B
aham
ian
Dol
lar
98,7
6110
8,53
212
5,67
212
9,59
114
0,28
815
2,40
415
1,63
7
b
) F
orei
gn C
urre
ncy
1025
451
143
62,
106
--
--
2.E
xter
nal
18,1
5918
,379
16,9
4324
,197
36,0
6924
,216
56,7
27
ii) O
ther
--
--
----
--
--
--
CU
RR
EN
T E
XP
EN
DIT
UR
E1,
149,
465
1,28
5,69
21,
344,
028
1,42
2,67
41,
395,
892
1,43
0,45
41,
467,
170
SO
UR
CE
: T
reas
ury
Acc
ount
s an
d T
reas
ury
Sta
tistic
al S
umm
ary
Prin
tout
s.1 S
ee n
otes
to ta
ble
2007
/08p
2006
/07
BU
DG
ET
Tab
le 5
.5 C
entr
al G
over
nm
ent:
Exp
end
itu
re b
y F
un
ctio
nal
Cla
ssif
icat
ion
(C
urr
ent)
1
2005
/06
F U
N
C T
I O
N20
08/0
9p20
09/1
0p
54
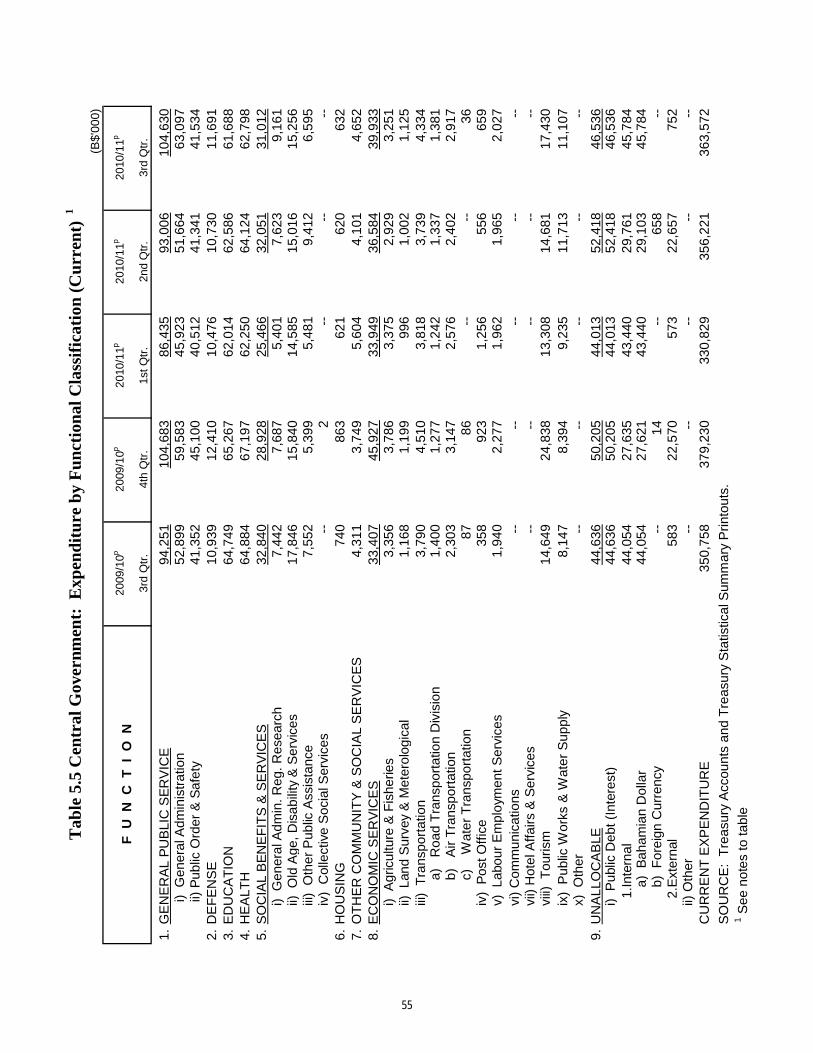
(B$'
000)
2009
/10p
2009
/10p
2010
/11p
2010
/11p
2010
/11p
3rd
Qtr
.4t
h Q
tr.
1st Q
tr.
2nd
Qtr
.3r
d Q
tr.
1.G
EN
ER
AL
PU
BLI
C S
ER
VIC
E94
,251
104,
683
86,4
3593
,006
104,
630
i) G
ener
al A
dmin
istr
atio
n52
,899
59,5
8345
,923
51,6
6463
,097
ii) P
ublic
Ord
er &
Saf
ety
41,3
5245
,100
40,5
1241
,341
41,5
342.
DE
FE
NS
E10
,939
12,4
1010
,476
10,7
3011
,691
3.E
DU
CA
TIO
N64
,749
65,2
6762
,014
62,5
8661
,688
4.H
EA
LTH
64,8
8467
,197
62,2
5064
,124
62,7
985.
SO
CIA
L B
EN
EF
ITS
& S
ER
VIC
ES
32,8
4028
,928
25,4
6632
,051
31,0
12
i)
Gen
eral
Adm
in. R
eg. R
esea
rch
7,44
27,
687
5,40
17,
623
9,16
1
ii)
Old
Age
, Dis
abili
ty &
Ser
vice
s17
,846
15,8
4014
,585
15,0
1615
,256
i
ii) O
ther
Pub
lic A
ssis
tanc
e7,
552
5,39
95,
481
9,41
26,
595
i
v) C
olle
ctiv
e S
ocia
l Ser
vice
s--
2--
----
6.H
OU
SIN
G74
086
362
162
063
27.
OT
HE
R C
OM
MU
NIT
Y &
SO
CIA
L S
ER
VIC
ES
4,31
13,
749
5,60
44,
101
4,65
28.
EC
ON
OM
IC S
ER
VIC
ES
33,4
0745
,927
33,9
4936
,584
39,9
33
Tab
le 5
.5 C
entr
al G
over
nmen
t: E
xpen
dit
ure
by
Fu
nct
ion
al C
lass
ific
atio
n (
Cu
rren
t) 1
F U
N C
T I
O N
8.E
CO
NO
MIC
SE
RV
ICE
S33
,407
45,9
2733
,949
36,5
8439
,933
i
) A
gric
ultu
re &
Fis
herie
s3,
356
3,78
63,
375
2,92
93,
251
i
i) L
and
Sur
vey
& M
eter
olog
ical
1,16
81,
199
996
1,00
21,
125
i
ii) T
rans
port
atio
n3,
790
4,51
03,
818
3,73
94,
334
a)
Roa
d T
rans
port
atio
n D
ivis
ion
1,40
01,
277
1,24
21,
337
1,38
1b)
A
ir T
rans
port
atio
n2,
303
3,14
72,
576
2,40
22,
917
c)
Wat
er T
rans
port
atio
n87
86--
--36
i
v) P
ost O
ffic
e35
892
31,
256
556
659
v
) L
abou
r E
mpl
oym
ent S
ervi
ces
1,94
02,
277
1,96
21,
965
2,02
7
vi)
Com
mun
icat
ions
----
----
--
vii)
Hot
el A
ffairs
& S
ervi
ces
----
----
--
viii
) T
ouris
m14
,649
24,8
3813
,308
14,6
8117
,430
i
x) P
ublic
Wor
ks &
Wat
er S
uppl
y8,
147
8,39
49,
235
11,7
1311
,107
x
) O
ther
----
----
--9.
UN
ALL
OC
AB
LE44
,636
50,2
0544
,013
52,4
1846
,536
i
) P
ublic
Deb
t (In
tere
st)
44,6
3650
,205
44,0
1352
,418
46,5
36
1
.Inte
rnal
44,0
5427
,635
43,4
4029
,761
45,7
84
a)
Bah
amia
n D
olla
r44
,054
27,6
2143
,440
29,1
0345
,784
b
) F
orei
gn C
urre
ncy
--14
--65
8--
2.E
xter
nal
583
22,5
7057
322
,657
752
i
i) O
ther
----
----
--C
UR
RE
NT
EX
PE
ND
ITU
RE
350,
758
379,
230
330,
829
356,
221
363,
572
SO
UR
CE
: T
reas
ury
Acc
ount
s an
d T
reas
ury
Sta
tistic
al S
umm
ary
Prin
tout
s. 1 S
ee n
otes
to ta
ble
55
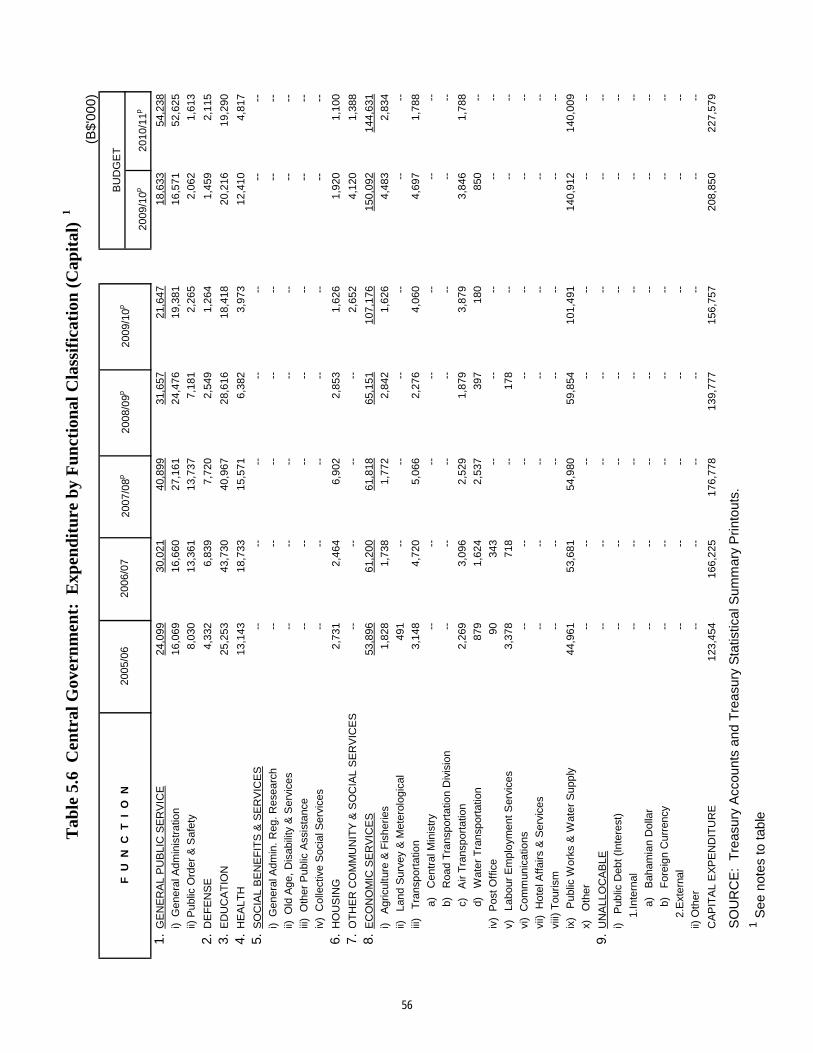
(B$'
000)
2009
/10p
2010
/11p
1.G
EN
ER
AL
PU
BLI
C S
ER
VIC
E24
,099
30,0
2140
,899
31,6
5721
,647
18,6
3354
,238
i) G
ener
al A
dmin
istr
atio
n16
,069
16,6
6027
,161
24,4
7619
,381
16,5
7152
,625
ii) P
ublic
Ord
er &
Saf
ety
8,03
013
,361
13,7
377,
181
2,26
52,
062
1,61
3
2.D
EF
EN
SE
4,33
26,
839
7,72
02,
549
1,26
41,
459
2,11
5
3.E
DU
CA
TIO
N25
,253
43,7
3040
,967
28,6
1618
,418
20,2
1619
,290
4.H
EA
LTH
13,1
4318
,733
15,5
716,
382
3,97
312
,410
4,81
7
5.S
OC
IAL
BE
NE
FIT
S &
SE
RV
ICE
S -
- -
- -
---
--
--
--
i) G
ener
al A
dmin
. R
eg. R
esea
rch
--
--
--
-- -
- -
- -
-ii)
Old
Age
, D
isab
ility
& S
ervi
ces
--
--
--
-- -
- -
- -
-iii
) O
ther
Pub
lic A
ssis
tanc
e -
- -
- -
---
--
--
--
iv)
Col
lect
ive
Soc
ial S
ervi
ces
--
--
--
-- -
- -
- -
-6.
HO
US
ING
2,73
12,
464
6,90
22,
853
1,62
61,
920
1,10
0
7.O
TH
ER
CO
MM
UN
ITY
& S
OC
IAL
SE
RV
ICE
S -
---
----
2,65
24,
120
1,38
8
8.E
CO
NO
MIC
SE
RV
ICE
S53
,896
61,2
0061
,818
65,1
5110
7,17
615
0,09
214
4,63
1
i) A
gric
ultu
re &
Fis
herie
s1,
828
1,73
81,
772
2,84
21,
626
4,48
32,
834
ii)
Land
Sur
vey
& M
eter
olog
ical
491
--
--
-- -
---
--
iii)
Tra
nspo
rtat
ion
3,14
84,
720
5,06
62,
276
4,06
04,
697
1,78
8
a)
Cen
tral
Min
istr
y -
- -
- -
---
--
----
b)
Roa
d T
rans
port
atio
n D
ivis
ion
--
--
--
-- -
---
--
c)
Air
Tra
nspo
rtat
ion
2,26
93,
096
2,52
91,
879
3,87
93,
846
1,78
8
d)
Wat
er T
rans
port
atio
n87
91,
624
2,53
739
718
085
0--
iv)
Pos
t Off
ice
9034
3--
-- -
- -
---
v)
Labo
ur E
mpl
oym
ent S
ervi
ces
3,37
871
8--
178
--
--
--
vi)
Com
mun
icat
ions
--
--
--
-- -
- -
---
vii)
Hot
el A
ffairs
& S
ervi
ces
--
--
--
-- -
- -
---
viii)
Tou
rism
--
--
--
-- -
- -
---
ix)
Pub
lic W
orks
& W
ater
Sup
ply
44,9
6153
,681
54,9
8059
,854
101,
491
140,
912
140,
009
x)
Oth
er -
- -
- -
---
--
--
--
9.U
NA
LLO
CA
BLE
--
--
--
-- -
- -
- -
-
i) P
ublic
Deb
t (In
tere
st)
--
--
--
-- -
- -
- -
-
1.In
tern
al -
- -
- -
---
--
--
--
a)
Bah
amia
n D
olla
r -
- -
- -
---
--
--
--
b)
For
eign
Cur
renc
y -
- -
- -
---
--
--
--
2.E
xter
nal
--
--
--
-- -
- -
- -
-
ii) O
ther
--
--
--
-- -
- -
- -
-
CA
PIT
AL
EX
PE
ND
ITU
RE
123,
454
166,
225
176,
778
139,
777
156,
757
208,
850
227,
579
SO
UR
CE
: T
reas
ury
Acc
ount
s an
d T
reas
ury
Sta
tistic
al S
umm
ary
Prin
tout
s.1 S
ee n
otes
to ta
ble
F U
N
C T
I O
N
2008
/09p
2009
/10p
Tab
le 5
.6 C
entr
al G
over
nm
ent:
Exp
end
itu
re b
y F
un
ctio
nal
Cla
ssif
icat
ion
(C
apit
al)
1
2007
/08p
2005
/06
2006
/07
BU
DG
ET
56
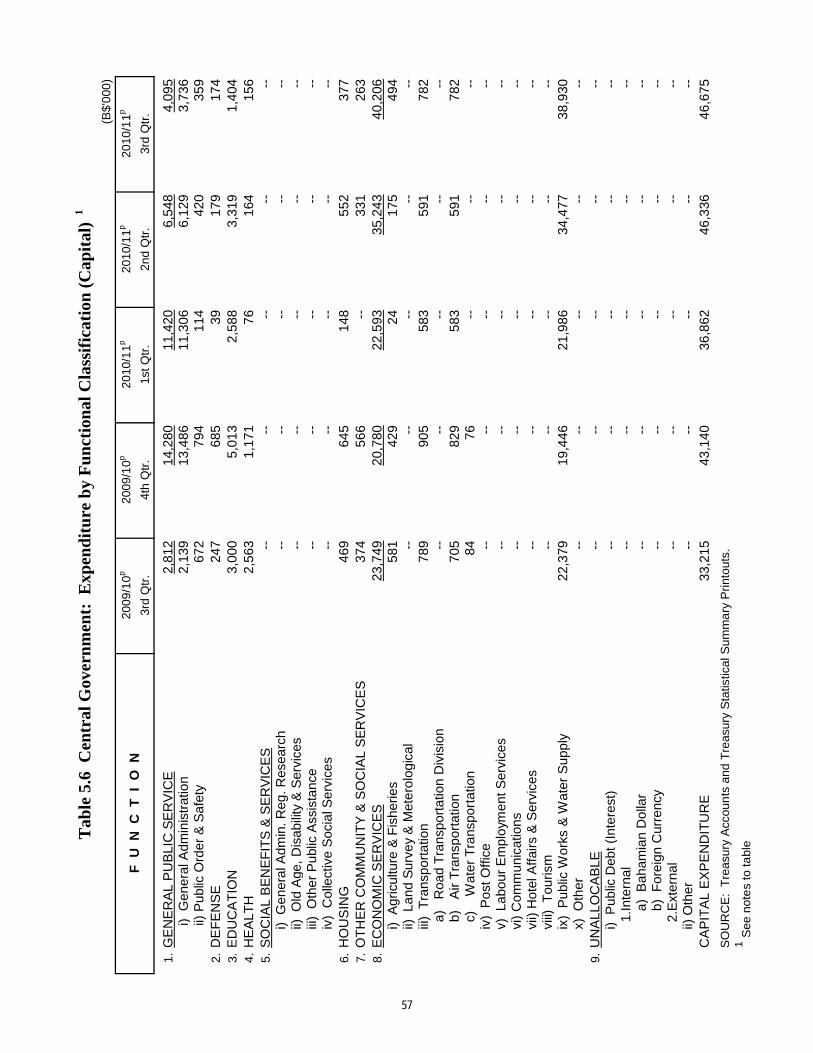
(B$'
000)
2009
/10
p20
09/1
0p
2010
/11
p20
10/1
1p
2010
/11
p
3rd
Qtr
.4t
h Q
tr.
1st Q
tr.
2nd
Qtr
.3r
d Q
tr.
1.G
EN
ER
AL
PU
BLI
C S
ER
VIC
E2,
812
14,2
8011
,420
6,54
84,
095
i) G
ener
al A
dmin
istr
atio
n2,
139
13,4
8611
,306
6,12
93,
736
ii) P
ublic
Ord
er &
Saf
ety
672
794
114
420
359
2.D
EF
EN
SE
247
685
3917
917
43.
ED
UC
AT
ION
3,00
05,
013
2,58
83,
319
1,40
44.
HE
ALT
H2,
563
1,17
176
164
156
5.S
OC
IAL
BE
NE
FIT
S &
SE
RV
ICE
S--
----
----
i
) G
ener
al A
dmin
. Reg
. Res
earc
h--
----
----
i
i) O
ld A
ge, D
isab
ility
& S
ervi
ces
----
----
--
iii)
Oth
er P
ublic
Ass
ista
nce
----
----
--
iv)
Col
lect
ive
Soc
ial S
ervi
ces
----
----
--6.
HO
US
ING
469
645
148
552
377
7.O
TH
ER
CO
MM
UN
ITY
& S
OC
IAL
SE
RV
ICE
S37
456
6--
331
263
8.E
CO
NO
MIC
SE
RV
ICE
S23
,749
20,7
8022
,593
35,2
4340
,206
i
) A
gric
ultu
re &
Fis
herie
s58
142
924
175
494
i
i) L
and
Sur
vey
& M
eter
olog
ical
----
----
--
iii)
Tra
nspo
rtat
ion
789
905
583
591
782
a)
Roa
d T
rans
port
atio
n D
ivis
ion
----
----
--
b
) A
ir T
rans
port
atio
n70
582
958
359
178
2
c
)
Wat
er T
rans
port
atio
n84
76--
----
i
v) P
ost O
ffice
----
----
--
v)
Lab
our
Em
ploy
men
t Ser
vice
s--
----
----
v
i) C
omm
unic
atio
ns--
----
----
v
ii) H
otel
Affa
irs &
Ser
vice
s--
----
----
v
iii)
Tou
rism
----
----
--
ix)
Pub
lic W
orks
& W
ater
Sup
ply
22,3
7919
,446
21,9
8634
,477
38,9
30
x)
Oth
er--
----
----
9.U
NA
LLO
CA
BLE
----
----
--
i)
Pub
lic D
ebt (
Inte
rest
)--
----
----
1.In
tern
al--
----
----
a
) B
aham
ian
Dol
lar
----
----
--
b)
For
eign
Cur
renc
y--
----
----
2.E
xter
nal
----
----
--
ii)
Oth
er
--
----
----
CA
PIT
AL
EX
PE
ND
ITU
RE
33,2
1543
,140
36,8
6246
,336
46,6
75
SO
UR
CE
: T
reas
ury
Acc
oun
ts a
nd T
reas
ury
Sta
tistic
al S
umm
ary
Prin
tout
s.1
See
not
es
to ta
ble
Tab
le 5
.6 C
entr
al G
over
nm
ent:
Exp
end
itu
re b
y F
un
ctio
nal
Cla
ssif
icat
ion
(C
apit
al)
1
F U
N C
T I
O N
57
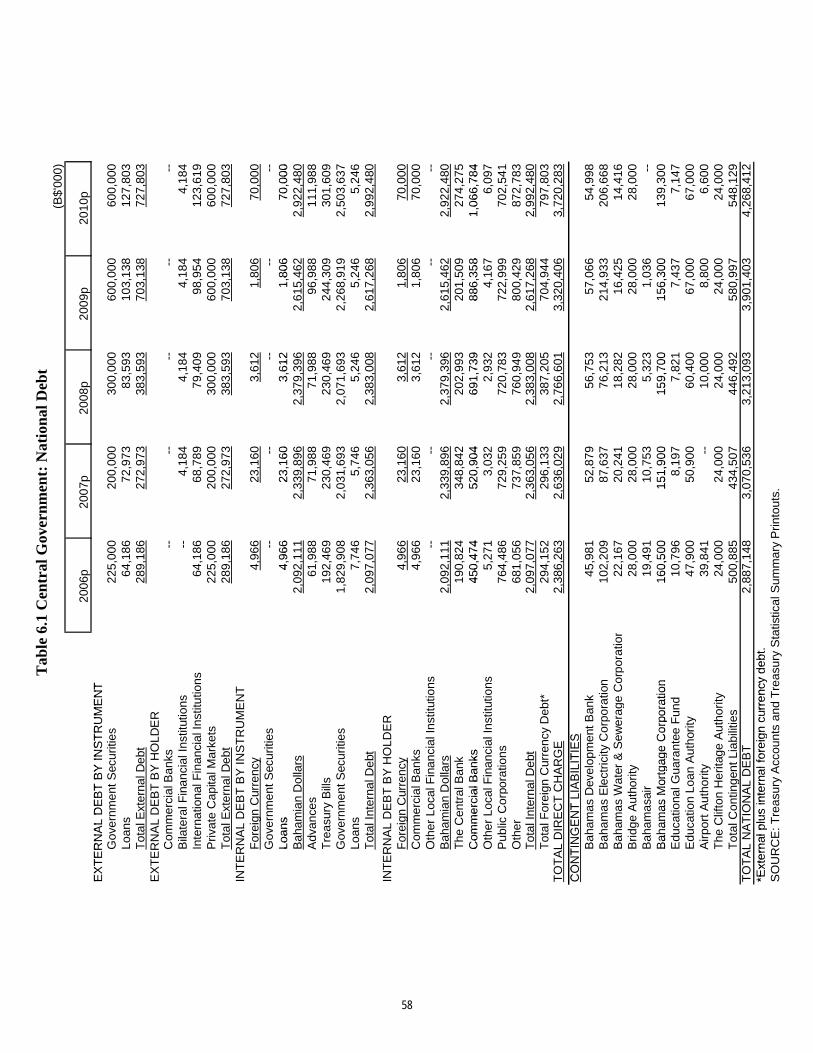
(B$'
000)
2006
p 20
07p
2008
p 20
09p
2010
pE
XT
ER
NA
L D
EB
T B
Y IN
ST
RU
ME
NT
Tab
le 6
.1 C
entr
al G
over
nm
ent:
Nat
ion
al D
ebt
EX
TE
RN
AL
DE
BT
BY
INS
TR
UM
EN
TG
over
nmen
t Sec
uriti
es22
5,00
020
0,00
030
0,00
060
0,00
060
0,00
0Lo
ans
64,1
8672
,973
83,5
9310
3,13
812
7,80
3T
otal
Ext
erna
l Deb
t28
9,18
627
2,97
338
3,59
370
3,13
872
7,80
3E
XT
ER
NA
L D
EB
T B
Y H
OLD
ER
Com
mer
cial
Ban
ks--
----
----
Bila
tera
l Fin
anci
al In
stitu
tions
--4,
184
4,18
44,
184
4,18
4In
tern
atio
nal F
inan
cial
Inst
itutio
ns64
,186
68,7
8979
,409
98,9
5412
3,61
9B
ilate
ral F
inan
cial
Inst
itutio
ns--
4,18
44,
184
4,18
44,
184
Inte
rnat
iona
l Fin
anci
al In
stitu
tions
64,1
8668
,789
79,4
0998
,954
123,
619
Priv
ate
Cap
ital M
arke
ts22
5,00
020
0,00
030
0,00
060
0,00
060
0,00
0T
otal
Ext
erna
l Deb
t28
9,18
627
2,97
338
3,59
370
3,13
872
7,80
3IN
TE
RN
AL
DE
BT
BY
INS
TR
UM
EN
TF
orei
gn C
urre
ncy
4,96
623
,160
3,61
21,
806
70,0
00G
over
nmen
t Sec
uriti
es--
----
----
Loan
s4,
966
23,1
603,
612
1,80
670
,000
Loan
s4,
966
23,1
603,
612
1,80
670
,000
Bah
amia
n D
olla
rs2,
092,
111
2,33
9,89
62,
379,
396
2,61
5,46
22,
922,
480
Adv
ance
s61
,988
71,9
8871
,988
96,9
8811
1,98
8T
reas
ury
Bill
s19
2,46
923
0,46
923
0,46
924
4,30
930
1,60
9G
over
nmen
t Sec
uriti
es1,
829,
908
2,03
1,69
32,
071,
693
2,26
8,91
92,
503,
637
Loan
s7,
746
5,74
65,
246
5,24
65,
246
Tot
al In
tern
al D
ebt
2,09
7,07
72,
363,
056
2,38
3,00
82,
617,
268
2,99
2,48
0
INT
ER
NA
L D
EB
T B
Y H
OLD
ER
INT
ER
NA
L D
EB
T B
Y H
OLD
ER
For
eign
Cur
renc
y4,
966
23,1
603,
612
1,80
670
,000
Com
mer
cial
Ban
ks4,
966
23,1
603,
612
1,80
670
,000
Oth
er L
ocal
Fin
anci
al In
stitu
tions
----
----
--B
aham
ian
Dol
lars
2,09
2,11
12,
339,
896
2,37
9,39
62,
615,
462
2,92
2,48
0T
he C
entr
al B
ank
190,
824
348,
842
202,
993
201,
509
274,
275
Com
mer
cial
Ban
ks45
0,47
452
0,90
469
1,73
988
6,35
81,
066,
784
Com
mer
cial
Ban
ks45
0,47
452
0,90
469
1,73
988
6,35
81,
066,
784
Oth
er L
ocal
Fin
anci
al In
stitu
tions
5,27
13,
032
2,93
24,
167
6,09
7P
ublic
Cor
pora
tions
764,
486
729,
259
720,
783
722,
999
702,
541
Oth
er68
1,05
673
7,85
976
0,94
980
0,42
987
2,78
3T
otal
Inte
rnal
Deb
t2,
097,
077
2,36
3,05
62,
383,
008
2,61
7,26
82,
992,
480
Tot
al F
orei
gn C
urre
ncy
Deb
t*29
4,15
229
6,13
338
7,20
570
4,94
479
7,80
3T
OT
AL
DIR
EC
T C
HA
RG
E2,
386,
263
2,63
6,02
92,
766,
601
3,32
0,40
63,
720,
283
CO
NT
ING
EN
T L
IAB
ILIT
IES
CO
NT
ING
EN
T L
IAB
ILIT
IES
Bah
amas
Dev
elop
men
t Ban
k45
,981
52,8
7956
,753
57,0
6654
,998
Bah
amas
Ele
ctric
ity C
orpo
ratio
n10
2,20
987
,637
76,2
1321
4,93
320
6,66
8B
aham
as W
ater
& S
ewer
age
Cor
pora
tion
22,1
6720
,241
18,2
8216
,425
14,4
16B
ridge
Aut
horit
y28
,000
28,0
0028
,000
28,0
0028
,000
Bah
amas
air
19,4
9110
,753
5,32
31,
036
--B
aham
as M
ortg
age
Cor
pora
tion
160,
500
151,
900
159,
700
156,
300
139,
300
Bah
amas
Mor
tgag
e C
orpo
ratio
n16
0,50
015
1,90
015
9,70
015
6,30
013
9,30
0E
duca
tiona
l Gua
rant
ee F
und
10,7
968,
197
7,82
17,
437
7,14
7E
duca
tion
Loan
Aut
horit
y47
,900
50,9
0060
,400
67,0
0067
,000
Airp
ort A
utho
rity
39,8
41--
10,0
008,
800
6,60
0T
he C
lifto
n H
erita
ge A
utho
rity
24,0
0024
,000
24,0
0024
,000
24,0
00T
otal
Con
tinge
nt L
iabi
litie
s50
0,88
543
4,50
744
6,49
258
0,99
754
8,12
9T
OT
AL
NA
TIO
NA
L D
EB
T2,
887,
148
3,07
0,53
63,
213,
093
3,90
1,40
34,
268,
412
*Ext
erna
l plu
s in
tern
al fo
reig
n cu
rren
cy d
ebt.
*Ext
erna
l plu
s in
tern
al fo
reig
n cu
rren
cy d
ebt.
SO
UR
CE
: Tre
asur
y A
ccou
nts
and
Tre
asur
y S
tatis
tical
Sum
mar
y P
rinto
uts.
58
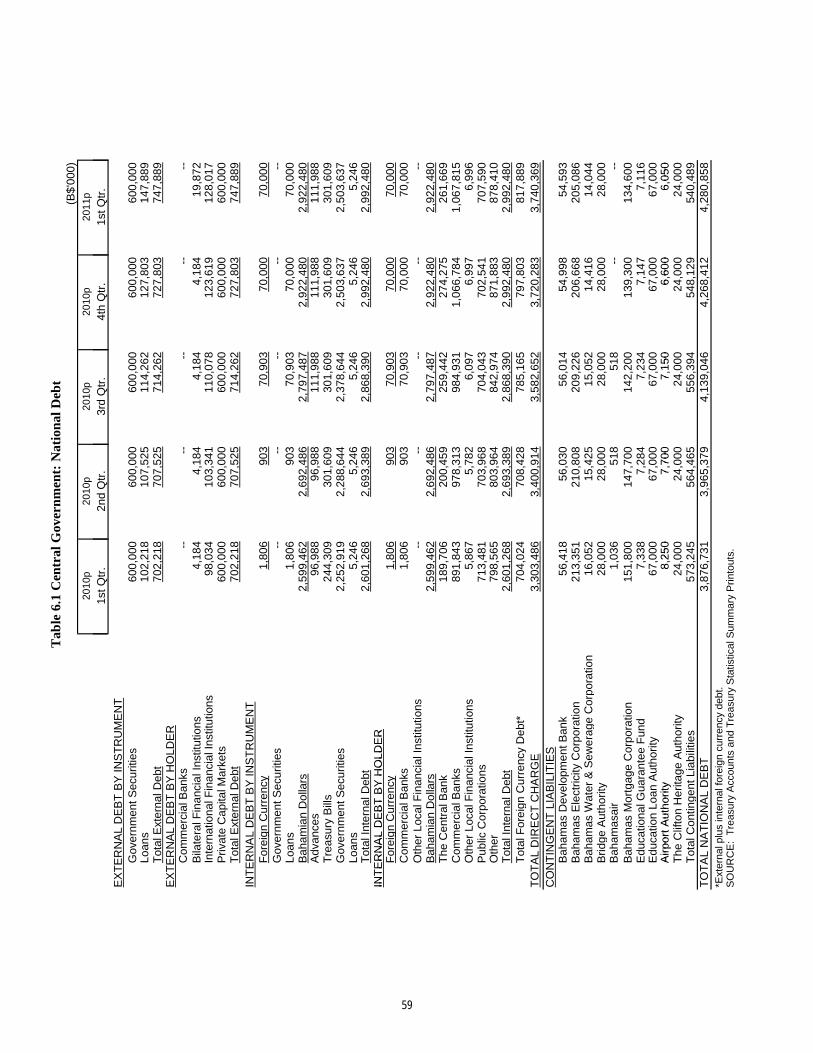
(B$'
000)
2010
p20
10p
2010
p20
10p
2011
p
1st Q
tr.
2nd
Qtr
.3r
d Q
tr.
4th
Qtr
.1s
t Qtr
.
Tab
le 6
.1 C
entr
al G
over
nm
ent:
Nat
ion
al D
ebt
1st Q
tr.
2nd
Qtr
.3r
d Q
tr.
4th
Qtr
.1s
t Qtr
.
EX
TE
RN
AL
DE
BT
BY
INS
TR
UM
EN
TG
over
nmen
t Sec
uriti
es60
0,00
060
0,00
060
0,00
060
0,00
060
0,00
0Lo
ans
102,
218
107,
525
114,
262
127,
803
147,
889
Tot
al E
xter
nal D
ebt
702,
218
707,
525
714,
262
727,
803
747,
889
EX
TE
RN
AL
DE
BT
BY
HO
LDE
RC
omm
erci
al B
anks
----
----
--B
ilate
ral F
inan
cia
l Ins
titut
ions
4,18
44,
184
4,18
44,
184
19,8
72C
omm
erci
al B
anks
----
----
--B
ilate
ral F
inan
cia
l Ins
titut
ions
4,18
44,
184
4,18
44,
184
19,8
72In
tern
atio
nal F
inan
cial
Inst
itutio
ns98
,034
103,
341
110,
078
123,
619
128,
017
Priv
ate
Cap
ital M
arke
ts60
0,00
060
0,00
060
0,00
060
0,00
060
0,00
0T
otal
Ext
erna
l Deb
t70
2,21
870
7,52
571
4,26
272
7,80
374
7,88
9IN
TE
RN
AL
DE
BT
BY
INS
TR
UM
EN
TF
orei
gn C
urre
ncy
1,80
690
370
,903
70,0
0070
,000
Gov
ernm
ent S
ecur
ities
----
----
--Lo
ans
1,80
690
370
,903
70,0
0070
,000
Loan
s1,
806
903
70,9
0370
,000
70,0
00B
aham
ian
Dol
lars
2,59
9,46
22,
692,
486
2,79
7,48
72,
922,
480
2,92
2,48
0A
dvan
ces
96,9
8896
,988
111,
988
111,
988
111,
988
Tre
asur
y B
ills
244,
309
301,
609
301,
609
301,
609
301,
609
Gov
ernm
ent S
ecur
ities
2,25
2,91
92,
288,
644
2,37
8,64
42,
503,
637
2,50
3,63
7Lo
ans
5,24
65,
246
5,24
65,
246
5,24
6T
otal
Inte
rnal
Deb
t2,
601,
268
2,69
3,38
92,
868,
390
2,99
2,48
02,
992,
480
INT
ER
NA
L D
EB
T B
Y H
OLD
ER
INT
ER
NA
L D
EB
T B
Y H
OLD
ER
For
eign
Cur
renc
y1,
806
903
70,9
0370
,000
70,0
00C
omm
erci
al B
anks
1,80
690
370
,903
70,0
0070
,000
Oth
er L
ocal
Fin
anci
al In
stitu
tions
----
----
--B
aham
ian
Dol
lars
2,59
9,46
22,
692,
486
2,79
7,48
72,
922,
480
2,92
2,48
0T
he C
entr
al B
ank
189,
706
200,
459
259,
442
274,
275
261,
669
Com
mer
cial
Ban
ks89
1,84
397
8,31
398
4,93
11,
066,
784
1,06
7,81
5O
ther
Loc
al F
inan
cial
Inst
itutio
ns5,
867
5,78
26,
097
6,99
76,
996
Oth
er L
ocal
Fin
anci
al In
stitu
tions
5,86
75,
782
6,09
76,
997
6,99
6P
ublic
Cor
pora
tions
713,
481
703,
968
704,
043
702,
541
707,
590
Oth
er79
8,56
580
3,96
484
2,97
487
1,88
387
8,41
0T
otal
Inte
rnal
Deb
t2,
601,
268
2,69
3,38
92,
868,
390
2,99
2,48
02,
992,
480
Tot
al F
orei
gn C
urre
ncy
Deb
t*70
4,02
470
8,42
878
5,16
579
7,80
381
7,88
9T
OT
AL
DIR
EC
T C
HA
RG
E3,
303,
486
3,40
0,91
43,
582,
652
3,72
0,28
33,
740,
369
CO
NT
ING
EN
T L
IAB
ILIT
IES
Bah
amas
Dev
elop
men
t Ban
k56
,418
56,0
3056
,014
54,9
9854
,593
Bah
amas
Ele
ctric
ity C
orpo
ratio
n21
3,35
121
0,80
820
9,22
620
6,66
820
5,08
6B
aham
as E
lect
ricity
Cor
pora
tion
213,
351
210,
808
209,
226
206,
668
205,
086
Bah
amas
Wat
er &
Sew
erag
e C
orpo
ratio
n16
,052
15,4
2515
,052
14,4
1614
,044
Brid
ge A
utho
rity
28,0
0028
,000
28,0
0028
,000
28,0
00B
aham
asai
r1,
036
518
518
----
Bah
amas
Mor
tgag
e C
orpo
ratio
n15
1,80
014
7,70
014
2,20
013
9,30
013
4,60
0E
duca
tiona
l Gua
rant
ee F
und
7,33
87,
284
7,23
47,
147
7,11
6E
duca
tion
Loan
Aut
horit
y67
,000
67,0
0067
,000
67,0
0067
,000
Airp
ort A
utho
rity
8,25
07,
700
7,15
06,
600
6,05
0A
irpor
t Aut
horit
y8,
250
7,70
07,
150
6,60
06,
050
The
Clif
ton
Her
itage
Aut
horit
y 24
,000
24,0
0024
,000
24,0
0024
,000
Tot
al C
ontin
gent
Lia
bilit
ies
573,
245
564,
465
556,
394
548,
129
540,
489
TO
TA
L N
AT
ION
AL
DE
BT
3,87
6,73
13,
965,
379
4,13
9,04
64,
268,
412
4,28
0,85
8*E
xter
nal p
lus
inte
rnal
fore
ign
curr
ency
deb
t.S
OU
RC
E:
Tre
asur
y A
ccou
nts
and
Tre
asur
y S
tatis
tical
Sum
mar
y P
rinto
uts.
59
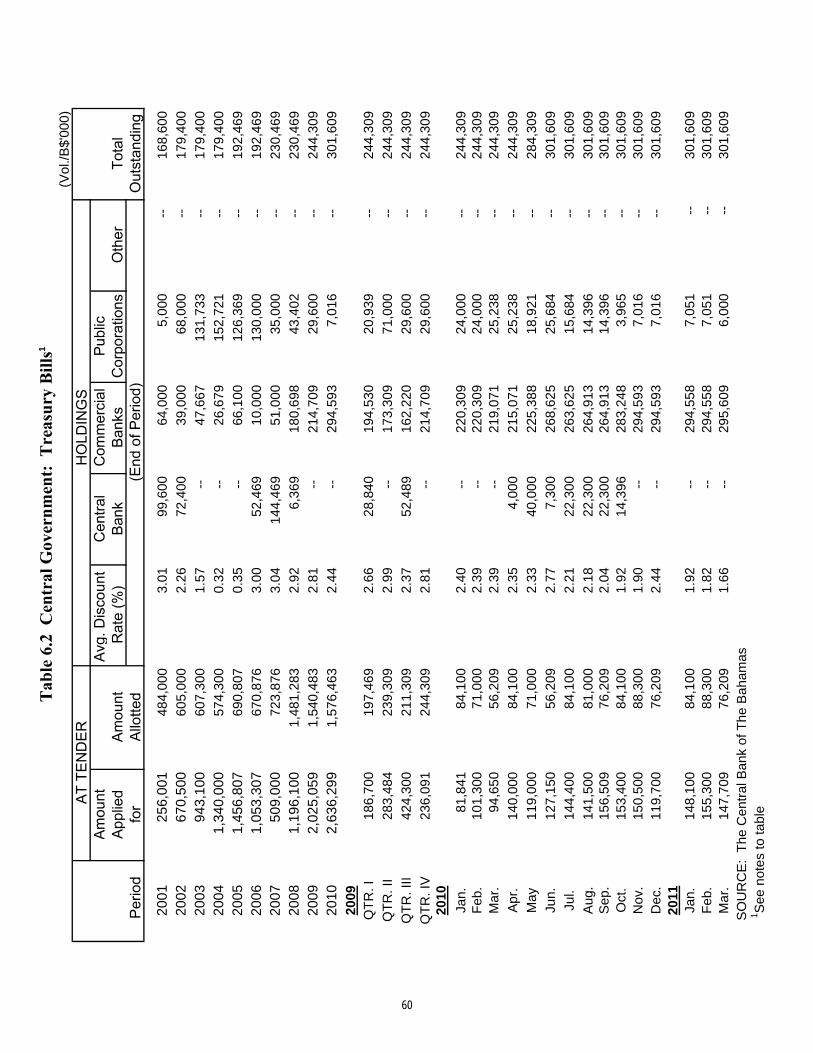
(Vol
./B$'
000)
2001
256,
001
484,
000
3.01
99,6
0064
,000
5,00
0--
168,
600
2002
670,
500
605,
000
2.26
72,4
0039
,000
68,0
00--
179,
400
2003
943,
100
607,
300
1.57
--47
,667
131,
733
--17
9,40
0
2004
1,34
0,00
057
4,30
00.
32--
26,6
7915
2,72
1--
179,
400
2005
1,45
6,80
769
0,80
70.
35--
66,1
0012
6,36
9--
192,
469
2006
1,05
3,30
767
0,87
63.
0052
,469
10,0
0013
0,00
0--
192,
469
2007
509,
000
723,
876
3.04
144,
469
51,0
0035
,000
--23
0,46
9
2008
1,19
6,10
01,
481,
283
2.92
6,36
918
0,69
843
,402
--23
0,46
9
2009
2,02
5,05
91,
540,
483
2.81
--21
4,70
929
,600
--24
4,30
9
2010
2,63
6,29
91,
576,
463
2.44
--29
4,59
37,
016
--30
1,60
9
2009
QT
R.I
186,
700
197,
469
2.66
28,8
4019
4,53
020
,939
--24
4,30
9
QT
R.I
I28
3,48
423
9,30
92.
99--
173,
309
71,0
00--
244,
309
QT
R.I
II42
4,30
021
1,30
92.
3752
,489
162,
220
29,6
00--
244,
309
QT
R.I
V23
6,09
124
4,30
92.
81--
214,
709
29,6
00--
244,
309
2010
Jan.
81,8
4184
,100
2.40
--22
0,30
924
,000
--24
4,30
9F
eb.
101,
300
71,0
002.
39--
220,
309
24,0
00--
244,
309
Mar
.94
,650
56,2
092.
39--
219,
071
25,2
38--
244,
309
Apr
.14
0,00
084
,100
2.35
4,00
021
5,07
125
,238
--24
4,30
9
May
119,
000
71,0
002.
3340
,000
225,
388
18,9
21--
284,
309
Jun.
127,
150
56,2
092.
777,
300
268,
625
25,6
84--
301,
609
Jul.
144,
400
84,1
002.
2122
,300
263,
625
15,6
84--
301,
609
Aug
.14
1,50
081
,000
2.18
22,3
0026
4,91
314
,396
--30
1,60
9S
ep.
156,
509
76,2
092.
0422
,300
264,
913
14,3
96--
301,
609
Oct
.15
3,40
084
,100
1.92
14,3
9628
3,24
83,
965
--30
1,60
9N
ov.
150,
500
88,3
001.
90--
294,
593
7,01
6--
301,
609
Dec
.11
9,70
076
,209
2.44
--29
4,59
37,
016
--30
1,60
920
11Ja
n.14
8,10
084
,100
1.92
--29
4,55
87,
051
--30
1,60
9F
eb.
155,
300
88,3
001.
82--
294,
558
7,05
1--
301,
609
Mar
.14
7,70
976
,209
1.66
--29
5,60
96,
000
--30
1,60
9S
OU
RC
E:
The
Cen
tral
Ban
kof
The
Bah
amas
1 See
note
sto
tabl
e
1
60
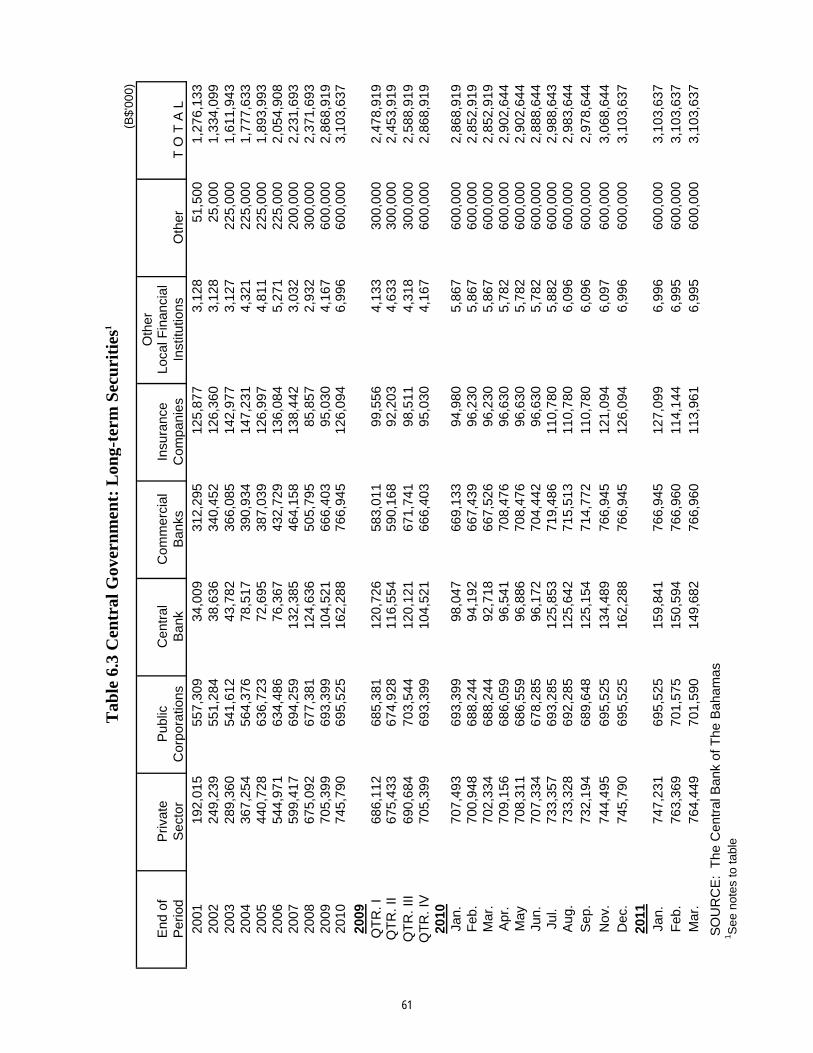
(B$'
000)
Oth
erE
nd o
fP
rivat
eP
ublic
Cen
tral
Com
mer
cial
Insu
ranc
eLo
cal F
inan
cial
Per
iod
Sec
tor
Cor
pora
tions
Ban
kB
anks
Com
pani
esIn
stitu
tions
Oth
erT
O T
A L
2001
192,
015
557,
309
34,0
0931
2,29
512
5,87
73,
128
51,5
001,
276,
133
2002
249,
239
551,
284
38,6
3634
0,45
212
6,36
03,
128
25,0
001,
334,
099
2003
289,
360
541,
612
43,7
8236
6,08
514
2,97
73,
127
225,
000
1,61
1,94
320
0436
7,25
456
4,37
678
,517
390,
934
147,
231
4,32
122
5,00
01,
777,
633
2005
440,
728
636,
723
72,6
9538
7,03
912
6,99
74,
811
225,
000
1,89
3,99
320
0654
4,97
163
4,48
676
,367
432,
729
136,
084
5,27
122
5,00
02,
054,
908
2007
599,
417
694,
259
132,
385
464,
158
138,
442
3,03
220
0,00
02,
231,
693
2008
675,
092
677,
381
124,
636
505,
795
85,8
572,
932
300,
000
2,37
1,69
320
0970
5,39
969
3,39
910
4,52
166
6,40
395
,030
4,16
760
0,00
02,
868,
919
2010
745,
790
695,
525
162,
288
766,
945
126,
094
6,99
660
0,00
03,
103,
637
2009
QT
R. I
686,
112
685,
381
120,
726
583,
011
99,5
564,
133
300,
000
2,47
8,91
9Q
TR
. II
675,
433
674,
928
116,
554
590,
168
92,2
034,
633
300,
000
2,45
3,91
9Q
TR
. III
690,
684
703,
544
120,
121
671,
741
98,5
114,
318
300,
000
2,58
8,91
9Q
TR
. IV
705,
399
693,
399
104,
521
666,
403
95,0
304,
167
600,
000
2,86
8,91
920
10Ja
n.70
7,49
369
3,39
998
,047
669,
133
94,9
805,
867
600,
000
2,86
8,91
9F
eb.
700,
948
688,
244
94,1
9266
7,43
996
,230
5,86
760
0,00
02,
852,
919
Mar
.70
2,33
468
8,24
492
,718
667,
526
96,2
305,
867
600,
000
2,85
2,91
9A
pr.
709,
156
686,
059
96,5
4170
8,47
696
,630
5,78
260
0,00
02,
902,
644
May
708,
311
686,
559
96,8
8670
8,47
696
,630
5,78
260
0,00
02,
902,
644
Jun.
707,
334
678,
285
96,1
7270
4,44
296
,630
5,78
260
0,00
02,
888,
644
Jul.
733,
357
693,
285
125,
853
719,
486
110,
780
5,88
260
0,00
02,
988,
643
Aug
.73
3,32
869
2,28
512
5,64
271
5,51
311
0,78
06,
096
600,
000
2,98
3,64
4S
ep.
732,
194
689,
648
125,
154
714,
772
110,
780
6,09
660
0,00
02,
978,
644
Nov
.74
4,49
569
5,52
513
4,48
976
6,94
512
1,09
46,
097
600,
000
3,06
8,64
4D
ec.
745,
790
695,
525
162,
288
766,
945
126,
094
6,99
660
0,00
03,
103,
637
2011
Jan.
747,
231
695,
525
159,
841
766,
945
127,
099
6,99
660
0,00
03,
103,
637
Feb
.76
3,36
970
1,57
515
0,59
476
6,96
011
4,14
46,
995
600,
000
3,10
3,63
7M
ar.
764,
449
701,
590
149,
682
766,
960
113,
961
6,99
560
0,00
03,
103,
637
SO
UR
CE
: T
he C
entr
al B
ank
of T
he B
aham
as
1S
ee n
otes
to ta
ble
Tab
le 6
.3 C
entr
al G
over
nm
ent:
Lon
g-te
rm S
ecu
riti
es1
61
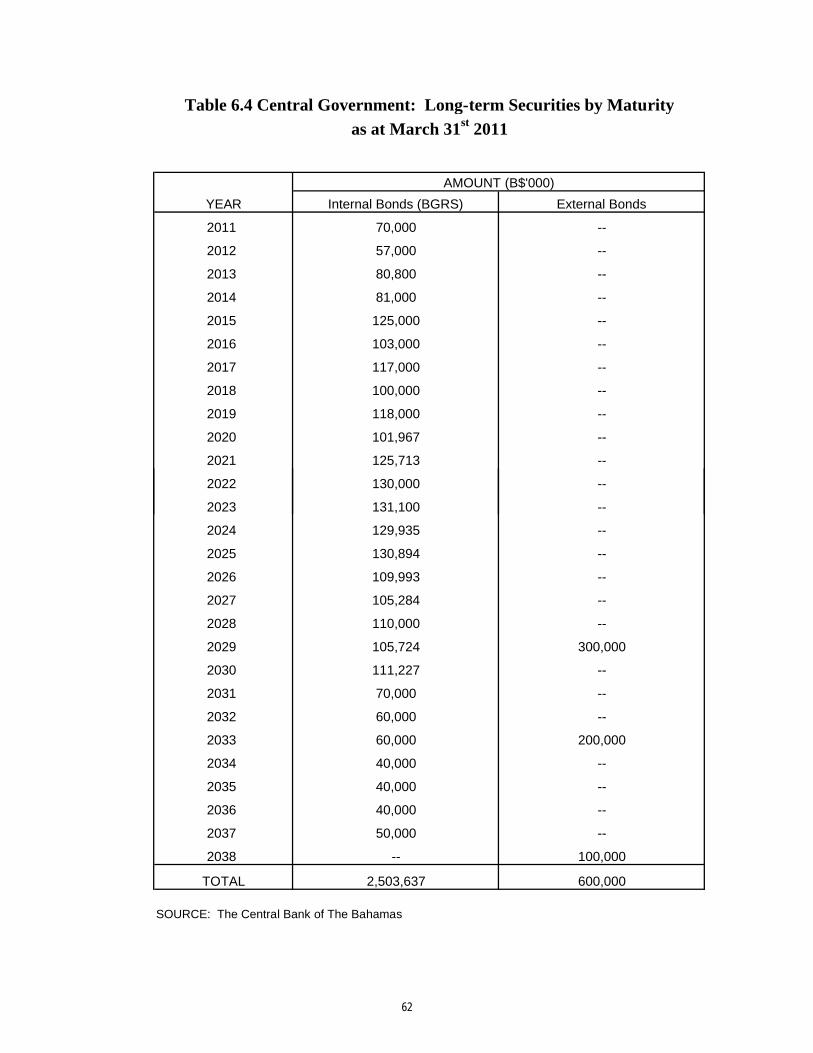
YEAR Internal Bonds (BGRS) External Bonds
2011 70,000 --
2012 57,000 --
2013 80,800 --
2014 81,000 --
2015 125,000 --
2016 103,000 --
2017 117,000 --
2018 100,000 --
2019 118,000 --
2020 101,967 --
2021 125,713 --
2022 130,000 --
Table 6.4 Central Government: Long-term Securities by Maturity
as at March 31st 2011
AMOUNT (B$'000)
2022 130,000 --
2023 131,100 --
2024 129,935 --
2025 130,894 --
2026 109,993 --
2027 105,284 --
2028 110,000 --
2029 105,724 300,000
2030 111,227 --
2031 70,000 --
2032 60,000 --
2033 60,000 200,000
2034 40,000 --
2035 40,000 --
2036 40,000 --
2037 50,000 --
2038 -- 100,000
TOTAL 2,503,637 600,000
SOURCE: The Central Bank of The Bahamas
62
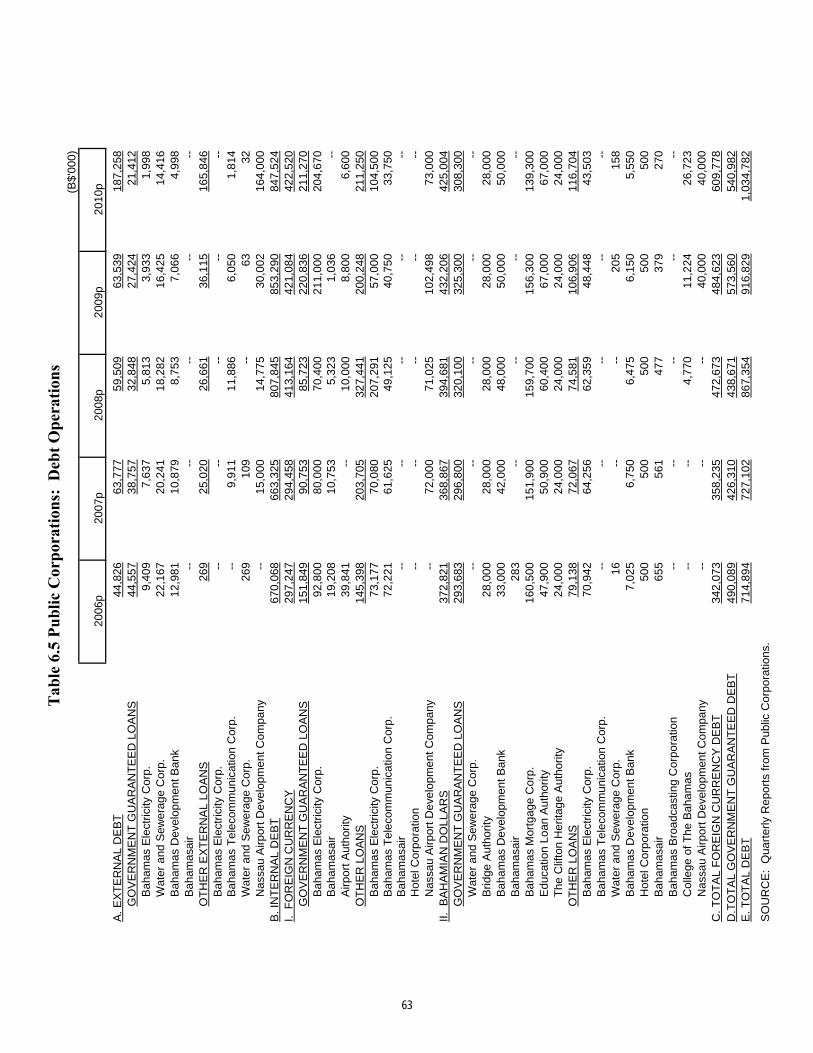
(B$'
000)
2006
p20
07p
2008
p20
09p
2010
p
A.E
XT
ER
NA
LD
EB
T44
,826
63,7
7759
,509
63,5
3918
7,25
8G
OV
ER
NM
EN
TG
UA
RA
NT
EE
DLO
AN
S44
,557
38,7
5732
,848
27,4
2421
,412
Bah
amas
Ele
ctric
ityC
orp.
9,40
97,
637
5,81
33,
933
1,99
8W
ater
and
Sew
erag
eC
orp.
22,1
6720
,241
18,2
8216
,425
14,4
16B
aham
asD
evel
opm
entB
ank
12,9
8110
,879
8,75
37,
066
4,99
8B
aham
asai
r--
----
----
OT
HE
RE
XT
ER
NA
LLO
AN
S26
925
,020
26,6
6136
,115
165,
846
Bah
amas
Ele
ctric
ityC
orp.
----
----
--B
aham
asT
elec
omm
unic
atio
nC
orp.
--9,
911
11,8
866,
050
1,81
4W
ater
and
Sew
erag
eC
orp.
269
109
--63
32N
assa
uA
irpor
tDev
elop
men
tCom
pany
--15
,000
14,7
7530
,002
164,
000
B.I
NT
ER
NA
LD
EB
T67
0,06
866
3,32
580
7,84
585
3,29
084
7,52
4I.
FO
RE
IGN
CU
RR
EN
CY
297,
247
294,
458
413,
164
421,
084
422,
520
GO
VE
RN
ME
NT
GU
AR
AN
TE
ED
LOA
NS
151,
849
90,7
5385
,723
220,
836
211,
270
Bah
amas
Ele
ctric
ityC
orp.
92,8
0080
,000
70,4
0021
1,00
020
4,67
0B
aham
asai
r19
,208
10,7
535,
323
1,03
6--
Airp
ortA
utho
rity
39,8
41--
10,0
008,
800
6,60
0O
TH
ER
LOA
NS
145,
398
203,
705
327,
441
200,
248
211,
250
Bah
amas
Ele
ctric
ityC
orp.
73,1
7770
,080
207,
291
57,0
0010
4,50
0B
aham
asT
elec
omm
unic
atio
nC
orp.
72,2
2161
,625
49,1
2540
,750
33,7
50B
aham
asai
r--
----
----
Hot
elC
orpo
ratio
n--
----
----
Nas
sau
Airp
ortD
evel
opm
entC
ompa
ny--
72,0
0071
,025
102,
498
73,0
00II.
BA
HA
MIA
ND
OLL
AR
S37
2,82
136
8,86
739
4,68
143
2,20
642
5,00
4G
OV
ER
NM
EN
TG
UA
RA
NT
EE
DLO
AN
S29
3,68
329
6,80
032
0,10
032
5,30
030
8,30
0W
ater
and
Sew
erag
eC
orp.
----
----
--B
ridge
Aut
horit
y28
,000
28,0
0028
,000
28,0
0028
,000
Bah
amas
Dev
elop
men
tBan
k33
,000
42,0
0048
,000
50,0
0050
,000
Bah
amas
air
283
----
----
Bah
amas
Mor
tgag
eC
orp.
160,
500
151,
900
159,
700
156,
300
139,
300
Edu
catio
nLo
anA
utho
rity
47,9
0050
,900
60,4
0067
,000
67,0
00T
heC
lifto
nH
erita
geA
utho
rity
24,0
0024
,000
24,0
0024
,000
24,0
00O
TH
ER
LOA
NS
79,1
3872
,067
74,5
8110
6,90
611
6,70
4B
aham
asE
lect
ricity
Cor
p.70
,942
64,2
5662
,359
48,4
4843
,503
Bah
amas
Tel
ecom
mun
icat
ion
Cor
p.--
----
----
Wat
eran
dS
ewer
age
Cor
p.16
----
205
158
Bah
amas
Dev
elop
men
tBan
k7,
025
6,75
06,
475
6,15
05,
550
Hot
elC
orpo
ratio
n50
050
050
050
050
0B
aham
asai
r65
556
147
737
927
0B
aham
asB
road
cast
ing
Cor
pora
tion
----
----
--C
olle
geof
The
Bah
amas
----
4,77
011
,224
26,7
23N
assa
uA
irpor
tDev
elop
men
tCom
pany
----
--40
,000
40,0
00C
.TO
TA
LF
OR
EIG
NC
UR
RE
NC
YD
EB
T34
2,07
335
8,23
547
2,67
348
4,62
360
9,77
8D
.TO
TA
LG
OV
ER
NM
EN
TG
UA
RA
NT
EE
DD
EB
T49
0,08
942
6,31
043
8,67
157
3,56
054
0,98
2E
.TO
TA
LD
EB
T71
4,89
472
7,10
286
7,35
491
6,82
91,
034,
782
SO
UR
CE
:Q
uart
erly
Rep
orts
from
Pub
licC
orpo
ratio
ns.
63
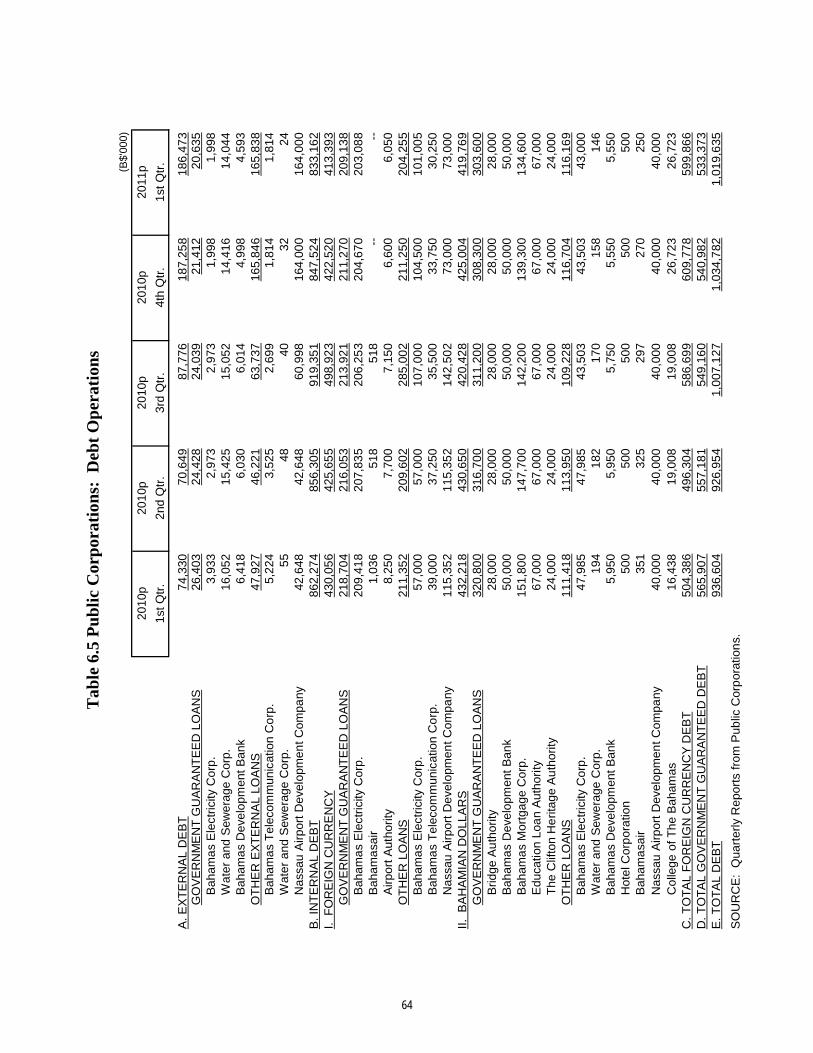
(B$'
000)
2010
p20
10p
2010
p20
10p
2011
p
1st Q
tr.
2nd
Qtr
.3r
d Q
tr.
4th
Qtr
.1s
t Qtr
.
A. E
XT
ER
NA
L D
EB
T74
,330
70,6
4987
,776
187,
258
186,
473
GO
VE
RN
ME
NT
GU
AR
AN
TE
ED
LO
AN
S26
,403
24,4
2824
,039
21,4
1220
,635
Bah
ama
s E
lect
ricity
Cor
p.
3,93
32,
973
2,97
31,
998
1,99
8W
ater
and
Sew
erag
e C
orp.
16,0
5215
,425
15,0
5214
,416
14,0
44B
aham
as
Dev
elop
men
t Ban
k6,
418
6,03
06,
014
4,99
84,
593
OT
HE
R E
XT
ER
NA
L LO
AN
S47
,927
46,2
2163
,737
165,
846
165,
838
Bah
ama
s T
elec
omm
unic
atio
n C
orp
.5,
224
3,52
52,
699
1,81
41,
814
Wat
er a
nd S
ewer
age
Cor
p.55
4840
3224
Nas
sau
Airp
ort D
evel
opm
ent C
ompa
ny42
,648
42,6
4860
,998
164,
000
164,
000
B. I
NT
ER
NA
L D
EB
T86
2,27
485
6,30
591
9,35
184
7,52
483
3,16
2I.
FO
RE
IGN
CU
RR
EN
CY
430,
056
425,
655
498,
923
422,
520
413,
393
GO
VE
RN
ME
NT
GU
AR
AN
TE
ED
LO
AN
S21
8,70
421
6,05
321
3,92
121
1,27
020
9,13
8B
aham
as
Ele
ctric
ity C
orp
.20
9,41
820
7,83
520
6,25
320
4,67
020
3,08
8B
aham
asa
ir1,
036
518
518
----
Airp
ort A
utho
rity
8,25
07,
700
7,15
06,
600
6,05
0O
TH
ER
LO
AN
S21
1,35
220
9,60
228
5,00
221
1,25
020
4,25
5B
aham
as
Ele
ctric
ity C
orp
.57
,000
57,0
0010
7,00
010
4,50
010
1,00
5B
aham
as
Tel
ecom
mun
icat
ion
Co
rp.
39,0
0037
,250
35,5
0033
,750
30,2
50N
assa
u A
irpor
t Dev
elop
men
t Com
pany
115,
352
115,
352
142,
502
73,0
0073
,000
II. B
AH
AM
IAN
DO
LLA
RS
432,
218
430,
650
420,
428
425,
004
419,
769
GO
VE
RN
ME
NT
GU
AR
AN
TE
ED
LO
AN
S32
0,80
031
6,70
031
1,20
030
8,30
030
3,60
0B
ridge
Au
thor
ity28
,000
28,0
0028
,000
28,0
0028
,000
Bah
ama
s D
evel
opm
ent B
ank
50,0
0050
,000
50,0
0050
,000
50,0
00B
aham
as
Mor
tgag
e C
orp.
151,
800
147,
700
142,
200
139,
300
134,
600
Edu
catio
n Lo
an
Aut
hori
ty67
,000
67,0
0067
,000
67,0
0067
,000
The
Clif
ton
He
ritag
e A
uth
ority
24
,000
24,0
0024
,000
24,0
0024
,000
OT
HE
R L
OA
NS
111,
418
113,
950
109,
228
116,
704
116,
169
Bah
ama
s E
lect
ricity
Cor
p.
47,9
8547
,985
43,5
0343
,503
43,0
00W
ater
and
Sew
erag
e C
orp.
194
182
170
158
146
Bah
ama
s D
evel
opm
ent B
ank
5,95
05,
950
5,75
05,
550
5,55
0H
otel
Cor
por
atio
n50
050
050
050
050
0B
aham
asa
ir35
132
529
727
025
0N
assa
u A
irpor
t Dev
elop
men
t Com
pany
40,0
0040
,000
40,0
0040
,000
40,0
00C
olle
ge o
f The
Bah
amas
16,4
3819
,008
19,0
0826
,723
26,7
23C
. TO
TA
L F
OR
EIG
N C
UR
RE
NC
Y D
EB
T50
4,38
649
6,30
458
6,69
960
9,77
859
9,86
6D
. TO
TA
L G
OV
ER
NM
EN
T G
UA
RA
NT
EE
D D
EB
T56
5,90
755
7,18
154
9,16
054
0,98
253
3,37
3E
. TO
TA
L D
EB
T93
6,60
492
6,95
41,
007,
127
1,03
4,7
821,
019,
635
SO
UR
CE
: Q
uart
erly
Rep
orts
from
Pub
lic C
orp
orat
ion
s.
Tab
le 6
.5 P
ub
lic
Cor
por
atio
ns:
Deb
t O
per
atio
ns
64
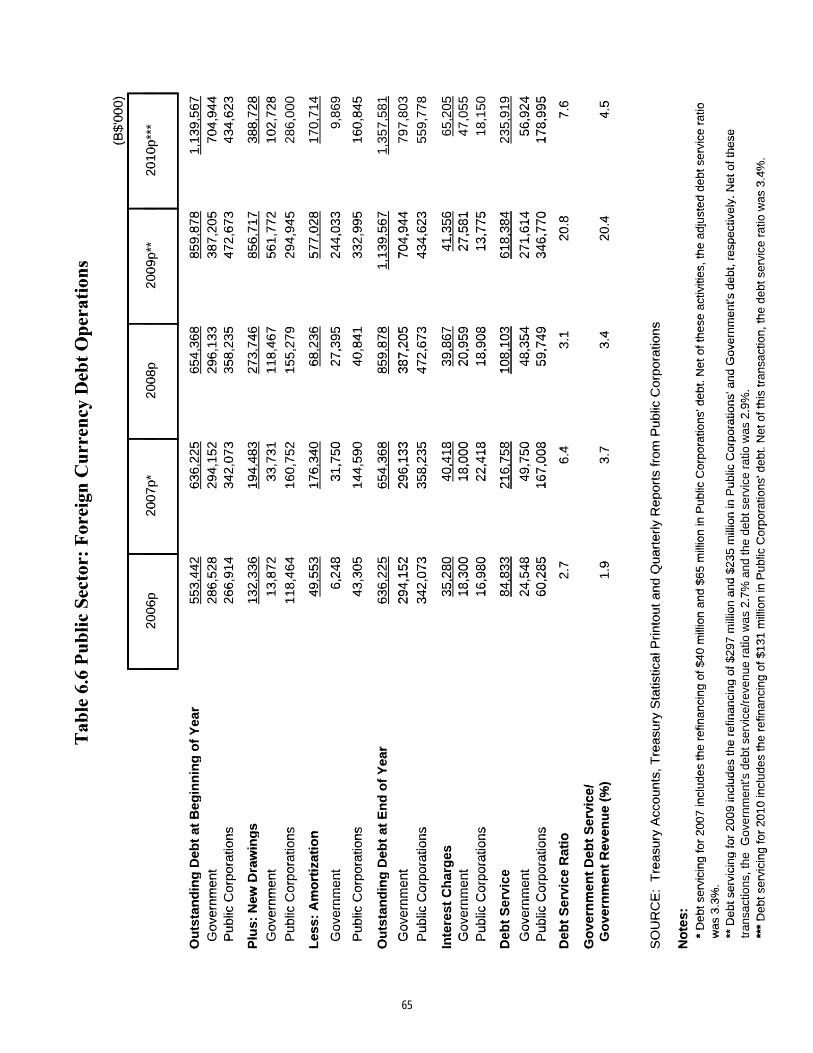
(B$'
000)
(B$'
000)
(B$'
000)
2006
p20
07p*
2008
p20
09p*
*20
10p*
**20
06p
2007
p*20
08p
2009
p**
2010
p***
2006
p20
07p*
2008
p20
09p*
*20
10p*
**
Ou
tsta
nd
ing
Deb
tat
Beg
inn
ing
of
Yea
r55
3,44
263
6,22
565
4,36
885
9,87
81,
139,
567
Ou
tsta
nd
ing
Deb
tat
Beg
inn
ing
of
Yea
r55
3,44
263
6,22
565
4,36
885
9,87
81,
139,
567
Ou
tsta
nd
ing
Deb
tat
Beg
inn
ing
of
Yea
r55
3,44
263
6,22
565
4,36
885
9,87
81,
139,
567
Ou
tsta
nd
ing
Deb
tat
Beg
inn
ing
of
Yea
r55
3,44
263
6,22
565
4,36
885
9,87
81,
139,
567
Gov
ernm
ent
286,
528
294,
152
296,
133
387,
205
704,
944
Gov
ernm
ent
286,
528
294,
152
296,
133
387,
205
704,
944
Pub
licC
orpo
ratio
ns26
6,91
434
2,07
335
8,23
547
2,67
343
4,62
3G
over
nmen
t28
6,52
829
4,15
229
6,13
338
7,20
570
4,94
4P
ublic
Cor
pora
tions
266,
914
342,
073
358,
235
472,
673
434,
623
Pub
licC
orpo
ratio
ns26
6,91
434
2,07
335
8,23
547
2,67
343
4,62
3P
ublic
Cor
pora
tions
266,
914
342,
073
358,
235
472,
673
434,
623
Plu
s:N
ewD
raw
ing
s13
2,33
619
4,48
327
3,74
685
6,71
738
8,72
8P
lus:
New
Dra
win
gs
132,
336
194,
483
273,
746
856,
717
388,
728
Plu
s:N
ewD
raw
ing
s13
2,33
619
4,48
327
3,74
685
6,71
738
8,72
8
Gov
ernm
ent
13,8
7233
,731
118,
467
561,
772
102,
728
Gov
ernm
ent
13,8
7233
,731
118,
467
561,
772
102,
728
Gov
ernm
ent
13,8
7233
,731
118,
467
561,
772
102,
728
Gov
ernm
ent
13,8
7233
,731
118,
467
561,
772
102,
728
Pub
licC
orpo
ratio
ns11
8,46
416
0,75
215
5,27
929
4,94
528
6,00
0P
ublic
Cor
pora
tions
118,
464
160,
752
155,
279
294,
945
286,
000
Pub
licC
orpo
ratio
ns11
8,46
416
0,75
215
5,27
929
4,94
528
6,00
0
Les
s:A
mo
rtiz
atio
n49
,553
176,
340
68,2
3657
7,02
817
0,71
4L
ess:
Am
ort
izat
ion
49,5
5317
6,34
068
,236
577,
028
170,
714
Les
s:A
mo
rtiz
atio
n49
,553
176,
340
68,2
3657
7,02
817
0,71
4
Gov
ernm
ent
6,24
831
,750
27,3
9524
4,03
39,
869
Gov
ernm
ent
6,24
831
,750
27,3
9524
4,03
39,
869
Gov
ernm
ent
6,24
831
,750
27,3
9524
4,03
39,
869
Pub
licC
orpo
ratio
ns43
,305
144,
590
40,8
4133
2,99
516
0,84
5P
ublic
Cor
pora
tions
43,3
0514
4,59
040
,841
332,
995
160,
845
Pub
licC
orpo
ratio
ns43
,305
144,
590
40,8
4133
2,99
516
0,84
5
Ou
tsta
nd
ing
Deb
tat
En
do
fY
ear
636,
225
654,
368
859,
878
1,13
9,56
71,
357,
581
Ou
tsta
nd
ing
Deb
tat
En
do
fY
ear
636,
225
654,
368
859,
878
1,13
9,56
71,
357,
581
Ou
tsta
nd
ing
Deb
tat
En
do
fY
ear
636,
225
654,
368
859,
878
1,13
9,56
71,
357,
581
Ou
tsta
nd
ing
Deb
tat
En
do
fY
ear
636,
225
654,
368
859,
878
1,13
9,56
71,
357,
581
Gov
ernm
ent
294,
152
296,
133
387,
205
704,
944
797,
803
Gov
ernm
ent
294,
152
296,
133
387,
205
704,
944
797,
803
Gov
ernm
ent
294,
152
296,
133
387,
205
704,
944
797,
803
Pub
licC
orpo
ratio
ns34
2,07
335
8,23
547
2,67
343
4,62
355
9,77
8P
ublic
Cor
pora
tions
342,
073
358,
235
472,
673
434,
623
559,
778
Pub
licC
orpo
ratio
ns34
2,07
335
8,23
547
2,67
343
4,62
355
9,77
8
Inte
rest
Ch
arg
es35
,280
40,4
1839
,867
41,3
5665
,205
Inte
rest
Ch
arg
es35
,280
40,4
1839
,867
41,3
5665
,205
Inte
rest
Ch
arg
es35
,280
40,4
1839
,867
41,3
5665
,205
Gov
ernm
ent
18,3
0018
,000
20,9
5927
,581
47,0
55G
over
nmen
t18
,300
18,0
0020
,959
27,5
8147
,055
Gov
ernm
ent
18,3
0018
,000
20,9
5927
,581
47,0
55P
ublic
Cor
pora
tions
16,9
8022
,418
18,9
0813
,775
18,1
50P
ublic
Cor
pora
tions
16,9
8022
,418
18,9
0813
,775
18,1
50P
ublic
Cor
pora
tions
16,9
8022
,418
18,9
0813
,775
18,1
50
Deb
tS
ervi
ce84
,833
216,
758
108,
103
618,
384
235,
919
Deb
tS
ervi
ce84
,833
216,
758
108,
103
618,
384
235,
919
Deb
tS
ervi
ce84
,833
216,
758
108,
103
618,
384
235,
919
Gov
ernm
ent
24,5
4849
,750
48,3
5427
1,61
456
,924
Gov
ernm
ent
24,5
4849
,750
48,3
5427
1,61
456
,924
Gov
ernm
ent
24,5
4849
,750
48,3
5427
1,61
456
,924
Pub
licC
orpo
ratio
ns60
,285
167,
008
59,7
4934
6,77
017
8,99
5P
ublic
Cor
pora
tions
60,2
8516
7,00
859
,749
346,
770
178,
995
Pub
licC
orpo
ratio
ns60
,285
167,
008
59,7
4934
6,77
017
8,99
5
Deb
tS
ervi
ceR
atio
2.7
6.4
3.1
20.8
7.6
Deb
tS
ervi
ceR
atio
2.7
6.4
3.1
20.8
7.6
Deb
tS
ervi
ceR
atio
2.7
6.4
3.1
20.8
7.6
Go
vern
men
tD
ebt
Ser
vice
/G
ove
rnm
ent
Deb
tS
ervi
ce/
Go
vern
men
tD
ebt
Ser
vice
/G
ove
rnm
ent
Rev
enu
e(%
)1.
93.
73.
420
.44.
5G
ove
rnm
ent
Rev
enu
e(%
)1.
93.
73.
420
.44.
5G
ove
rnm
ent
Rev
enu
e(%
)1.
93.
73.
420
.44.
5
SO
UR
CE
:T
reas
ury
Acc
ount
s,T
reas
ury
Sta
tistic
alP
rinto
utan
dQ
uart
erly
Rep
orts
from
Pub
licC
orpo
ratio
nsS
OU
RC
E:
Tre
asur
yA
ccou
nts,
Tre
asur
yS
tatis
tical
Prin
tout
and
Qua
rter
lyR
epor
tsfr
omP
ublic
Cor
pora
tions
No
tes:
No
tes:
No
tes:
*D
ebts
ervi
cing
for
2007
incl
udes
the
refin
anci
ngof
$40
mill
ion
and
$65
mill
ion
inP
ublic
Cor
pora
tions
'deb
t.N
etof
thes
eac
tiviti
es,t
head
just
edde
btse
rvic
era
tio*
Deb
tser
vici
ngfo
r20
07in
clud
esth
ere
finan
cing
of$4
0m
illio
nan
d$6
5m
illio
nin
Pub
licC
orpo
ratio
ns'd
ebt.
Net
ofth
ese
activ
ities
,the
adju
sted
debt
serv
ice
ratio
was
3.3%
.*
Deb
tser
vici
ngfo
r20
07in
clud
esth
ere
finan
cing
of$4
0m
illio
nan
d$6
5m
illio
nin
Pub
licC
orpo
ratio
ns'd
ebt.
Net
ofth
ese
activ
ities
,the
adju
sted
debt
serv
ice
ratio
was
3.3%
.**
Deb
tser
vici
ngfo
r20
09in
clud
esth
ere
finan
cing
of$2
97m
illio
nan
d$2
35m
illio
nin
Pub
licC
orpo
ratio
ns'a
ndG
over
nmen
t'sde
bt,r
espe
ctiv
ely.
Net
ofth
ese
was
3.3%
.**
Deb
tser
vici
ngfo
r20
09in
clud
esth
ere
finan
cing
of$2
97m
illio
nan
d$2
35m
illio
nin
Pub
licC
orpo
ratio
ns'a
ndG
over
nmen
t'sde
bt,r
espe
ctiv
ely.
Net
ofth
ese
**D
ebts
ervi
cing
for
2009
incl
udes
the
refin
anci
ngof
$297
mill
ion
and
$235
mill
ion
inP
ublic
Cor
pora
tions
'and
Gov
ernm
ent's
debt
,res
pect
ivel
y.N
etof
thes
etr
ansa
ctio
ns,t
heG
over
nmen
t'sde
btse
rvic
e/re
venu
era
tiow
as2.
7%an
dth
ede
btse
rvic
era
tiow
as2.
9%.
tran
sact
ions
,the
Gov
ernm
ent's
debt
serv
ice/
reve
nue
ratio
was
2.7%
and
the
debt
serv
ice
ratio
was
2.9%
.tr
ansa
ctio
ns,t
heG
over
nmen
t'sde
btse
rvic
e/re
venu
era
tiow
as2.
7%an
dth
ede
btse
rvic
era
tiow
as2.
9%.
***
Deb
tser
vici
ngfo
r20
10in
clud
esth
ere
finan
cing
of$1
31m
illio
nin
Pub
licC
orpo
ratio
ns'd
ebt.
Net
ofth
istr
ansa
ctio
n,th
ede
btse
rvic
era
tiow
as3.
4%.
***
Deb
tser
vici
ngfo
r20
10in
clud
esth
ere
finan
cing
of$1
31m
illio
nin
Pub
licC
orpo
ratio
ns'd
ebt.
Net
ofth
istr
ansa
ctio
n,th
ede
btse
rvic
era
tiow
as3.
4%.
***
Deb
tser
vici
ngfo
r20
10in
clud
esth
ere
finan
cing
of$1
31m
illio
nin
Pub
licC
orpo
ratio
ns'd
ebt.
Net
ofth
istr
ansa
ctio
n,th
ede
btse
rvic
era
tiow
as3.
4%.
65
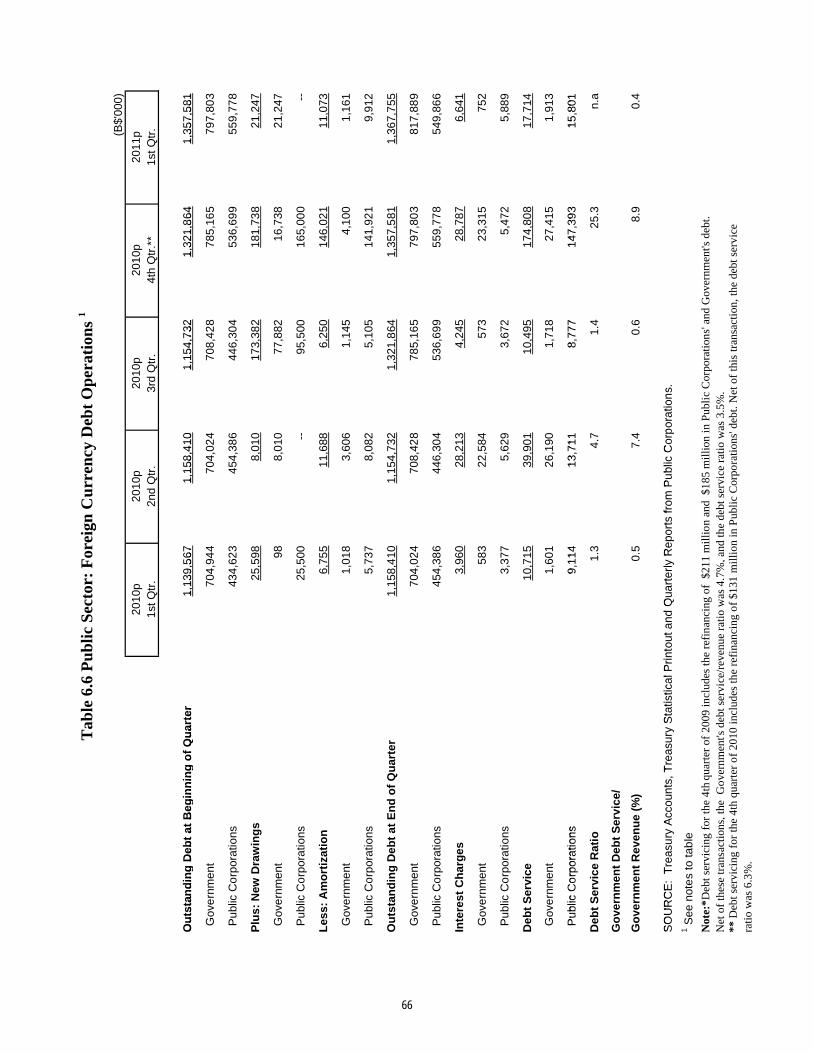
Tab
le 6
.6 P
ub
lic
Sec
tor:
For
eign
Cu
rren
cy D
ebt
Op
erat
ion
s 1
(B$'
000)
2010
p20
10p
2010
p20
10p
2011
p1s
t Qtr
.2n
d Q
tr.
3rd
Qtr
.4t
h Q
tr.*
*1s
t Qtr
.
Ou
tsta
nd
ing
Deb
t at
Beg
inn
ing
of
Qu
arte
r1,
139,
567
1,15
8,4
101,
154,
732
1,32
1,8
641,
357,
581
Tab
le 6
.6 P
ub
lic
Sec
tor:
For
eign
Cu
rren
cy D
ebt
Op
erat
ion
s
Ou
tsta
nd
ing
Deb
t at
Beg
inn
ing
of
Qu
arte
r1,
139,
567
1,15
8,4
101,
154,
732
1,32
1,8
641,
357,
581
Gov
ern
men
t70
4,94
470
4,02
470
8,42
878
5,16
579
7,80
3
Pub
lic C
orp
orat
ions
434,
623
454,
386
446,
304
536,
699
559,
778
Plu
s: N
ew D
raw
ing
s25
,598
8,01
017
3,38
218
1,73
821
,247
Gov
ern
men
t98
8,01
077
,882
16,7
3821
,247
Gov
ern
men
t98
8,01
077
,882
16,7
3821
,247
Pub
lic C
orp
orat
ions
25,5
00--
95,5
0016
5,00
0--
Les
s: A
mo
rtiz
atio
n6,
755
11,6
886,
250
146,
021
11,0
73
Gov
ern
men
t1,
018
3,60
61,
145
4,10
01,
161
Pub
lic C
orp
orat
ions
5,73
78,
082
5,10
514
1,92
19,
912
Ou
tsta
nd
ing
Deb
t at
En
d o
f Q
uar
ter
1,15
8,4
101,
154,
732
1,32
1,8
641,
357,
581
1,36
7,7
55
Gov
ern
men
t70
4,02
470
8,42
878
5,16
579
7,80
381
7,88
9
Pub
lic C
orp
orat
ions
454,
386
446,
304
536,
699
559,
778
549,
866
Inte
rest
Ch
arg
es3,
960
28,2
134,
245
28,7
876,
641
Gov
ern
men
t58
322
,584
573
23,3
1575
2 G
ove
rnm
ent
583
22,5
8457
323
,315
752
Pub
lic C
orp
orat
ions
3,37
75,
629
3,67
25,
472
5,88
9
Deb
t S
ervi
ce10
,715
39,9
0110
,495
174,
808
17,7
14
Gov
ern
men
t1,
601
26,1
901,
718
27,4
151,
913
Pub
lic C
orp
orat
ions
9,11
413
,711
8,77
714
7,39
315
,801
Pub
lic C
orp
orat
ions
9,11
413
,711
8,77
714
7,39
315
,801
Deb
t S
ervi
ce R
atio
1.3
4.7
1.4
25.3
n.a
Go
vern
men
t D
ebt
Ser
vice
/
Go
vern
men
t R
even
ue
(%)
0.5
7.4
0.6
8.9
0.4
SO
UR
CE
: T
reas
ury
Acc
ount
s, T
reas
ury
Sta
tistic
al P
rinto
ut a
nd Q
uart
erly
Rep
orts
from
Pu
blic
Cor
por
atio
ns.
SO
UR
CE
: T
reas
ury
Acc
ount
s, T
reas
ury
Sta
tistic
al P
rinto
ut a
nd Q
uart
erly
Rep
orts
from
Pu
blic
Cor
por
atio
ns.
1 See
not
es
to ta
ble
Not
e:*D
ebt s
ervi
cing
for
the
4th
quar
ter
of 2
009
incl
udes
the
refi
nanc
ing
of $
211
mil
lion
and
$18
5 m
illi
on in
Pub
lic
Cor
pora
tion
s' a
nd G
over
nmen
t's d
ebt.
N
et o
f th
ese
tran
sact
ions
, the
Gov
ernm
ent's
deb
t ser
vice
/rev
enue
rat
io w
as 4
.7%
, and
the
debt
ser
vice
rat
io w
as 3
.5%
.**
Deb
t ser
vici
ng f
or th
e 4t
h qu
arte
r of
201
0 in
clud
es th
e re
fina
ncin
g of
$13
1 m
illi
on in
Pub
lic
Cor
pora
tion
s' d
ebt.
Net
of
this
tran
sact
ion,
the
debt
ser
vice
ra
tio
was
6.3
%.
66
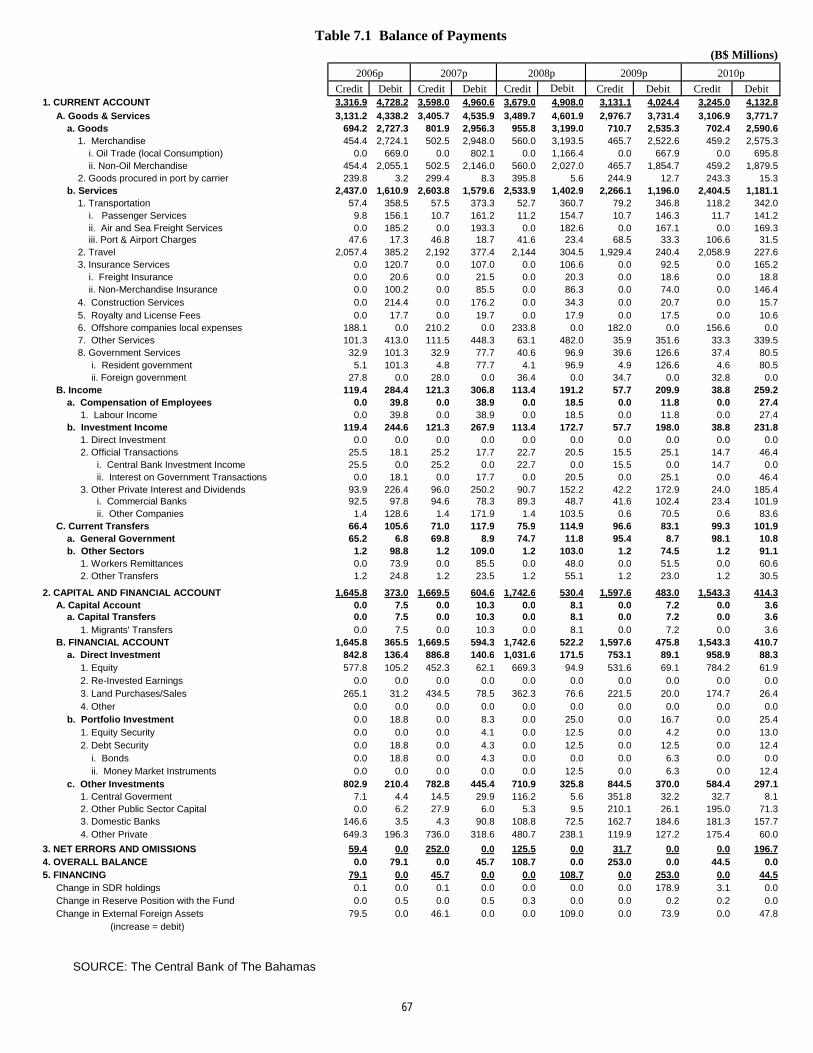
(B$ Millions)
2006p 2007p 2010p
Credit Debit Credit Debit Credit Debit Credit Debit Credit Debit1. CURRENT ACCOUNT 3,316.9 4,728.2 3,598.0 4,960.6 3,679.0 4,908.0 3,131.1 4,024.4 3,245.0 4,132.8
A. Goods & Services 3,131.2 4,338.2 3,405.7 4,535.9 3,489.7 4,601.9 2,976.7 3,731.4 3,106.9 3,771.7 a. Goods 694.2 2,727.3 801.9 2,956.3 955.8 3,199.0 710.7 2,535.3 702.4 2,590.6 1. Merchandise 454.4 2,724.1 502.5 2,948.0 560.0 3,193.5 465.7 2,522.6 459.2 2,575.3 i. Oil Trade (local Consumption) 0.0 669.0 0.0 802.1 0.0 1,166.4 0.0 667.9 0.0 695.8 ii. Non-Oil Merchandise 454.4 2,055.1 502.5 2,146.0 560.0 2,027.0 465.7 1,854.7 459.2 1,879.5 2. Goods procured in port by carrier 239.8 3.2 299.4 8.3 395.8 5.6 244.9 12.7 243.3 15.3 b. Services 2,437.0 1,610.9 2,603.8 1,579.6 2,533.9 1,402.9 2,266.1 1,196.0 2,404.5 1,181.1 1. Transportation 57.4 358.5 57.5 373.3 52.7 360.7 79.2 346.8 118.2 342.0 i. Passenger Services 9.8 156.1 10.7 161.2 11.2 154.7 10.7 146.3 11.7 141.2 ii. Air and Sea Freight Services 0.0 185.2 0.0 193.3 0.0 182.6 0.0 167.1 0.0 169.3 iii. Port & Airport Charges 47.6 17.3 46.8 18.7 41.6 23.4 68.5 33.3 106.6 31.5 2. Travel 2,057.4 385.2 2,192 377.4 2,144 304.5 1,929.4 240.4 2,058.9 227.6 3. Insurance Services 0.0 120.7 0.0 107.0 0.0 106.6 0.0 92.5 0.0 165.2 i. Freight Insurance 0.0 20.6 0.0 21.5 0.0 20.3 0.0 18.6 0.0 18.8 ii. Non-Merchandise Insurance 0.0 100.2 0.0 85.5 0.0 86.3 0.0 74.0 0.0 146.4 4. Construction Services 0.0 214.4 0.0 176.2 0.0 34.3 0.0 20.7 0.0 15.7 5. Royalty and License Fees 0.0 17.7 0.0 19.7 0.0 17.9 0.0 17.5 0.0 10.6 6. Offshore companies local expenses 188.1 0.0 210.2 0.0 233.8 0.0 182.0 0.0 156.6 0.0 7. Other Services 101.3 413.0 111.5 448.3 63.1 482.0 35.9 351.6 33.3 339.5 8. Government Services 32.9 101.3 32.9 77.7 40.6 96.9 39.6 126.6 37.4 80.5 i. Resident government 5.1 101.3 4.8 77.7 4.1 96.9 4.9 126.6 4.6 80.5 ii. Foreign government 27.8 0.0 28.0 0.0 36.4 0.0 34.7 0.0 32.8 0.0 B. Income 119.4 284.4 121.3 306.8 113.4 191.2 57.7 209.9 38.8 259.2 a. Compensation of Employees 0.0 39.8 0.0 38.9 0.0 18.5 0.0 11.8 0.0 27.4 1. Labour Income 0.0 39.8 0.0 38.9 0.0 18.5 0.0 11.8 0.0 27.4 b. Investment Income 119.4 244.6 121.3 267.9 113.4 172.7 57.7 198.0 38.8 231.8 1. Direct Investment 0.0 0.0 0.0 0.0 0.0 0.0 0.0 0.0 0.0 0.0 2. Official Transactions 25.5 18.1 25.2 17.7 22.7 20.5 15.5 25.1 14.7 46.4 i. Central Bank Investment Income 25.5 0.0 25.2 0.0 22.7 0.0 15.5 0.0 14.7 0.0 ii. Interest on Government Transactions 0.0 18.1 0.0 17.7 0.0 20.5 0.0 25.1 0.0 46.4 3. Other Private Interest and Dividends 93.9 226.4 96.0 250.2 90.7 152.2 42.2 172.9 24.0 185.4 i. Commercial Banks 92.5 97.8 94.6 78.3 89.3 48.7 41.6 102.4 23.4 101.9 ii. Other Companies 1.4 128.6 1.4 171.9 1.4 103.5 0.6 70.5 0.6 83.6 C. Current Transfers 66.4 105.6 71.0 117.9 75.9 114.9 96.6 83.1 99.3 101.9 a. General Government 65.2 6.8 69.8 8.9 74.7 11.8 95.4 8.7 98.1 10.8 b. Other Sectors 1.2 98.8 1.2 109.0 1.2 103.0 1.2 74.5 1.2 91.1 1. Workers Remittances 0.0 73.9 0.0 85.5 0.0 48.0 0.0 51.5 0.0 60.6 2. Other Transfers 1.2 24.8 1.2 23.5 1.2 55.1 1.2 23.0 1.2 30.5
2. CAPITAL AND FINANCIAL ACCOUNT 1,645.8 373.0 1,669.5 604.6 1,742.6 530.4 1,597.6 483.0 1,543.3 414.3 A. Capital Account 0.0 7.5 0.0 10.3 0.0 8.1 0.0 7.2 0.0 3.6 a. Capital Transfers 0.0 7.5 0.0 10.3 0.0 8.1 0.0 7.2 0.0 3.6 1. Migrants' Transfers 0.0 7.5 0.0 10.3 0.0 8.1 0.0 7.2 0.0 3.6 B. FINANCIAL ACCOUNT 1,645.8 365.5 1,669.5 594.3 1,742.6 522.2 1,597.6 475.8 1,543.3 410.7 a. Direct Investment 842.8 136.4 886.8 140.6 1,031.6 171.5 753.1 89.1 958.9 88.3 1. Equity 577.8 105.2 452.3 62.1 669.3 94.9 531.6 69.1 784.2 61.9 2. Re-Invested Earnings 0.0 0.0 0.0 0.0 0.0 0.0 0.0 0.0 0.0 0.0 3. Land Purchases/Sales 265.1 31.2 434.5 78.5 362.3 76.6 221.5 20.0 174.7 26.4 4. Other 0.0 0.0 0.0 0.0 0.0 0.0 0.0 0.0 0.0 0.0 b. Portfolio Investment 0.0 18.8 0.0 8.3 0.0 25.0 0.0 16.7 0.0 25.4 1. Equity Security 0.0 0.0 0.0 4.1 0.0 12.5 0.0 4.2 0.0 13.0 2. Debt Security 0.0 18.8 0.0 4.3 0.0 12.5 0.0 12.5 0.0 12.4 i. Bonds 0.0 18.8 0.0 4.3 0.0 0.0 0.0 6.3 0.0 0.0 ii. Money Market Instruments 0.0 0.0 0.0 0.0 0.0 12.5 0.0 6.3 0.0 12.4 c. Other Investments 802.9 210.4 782.8 445.4 710.9 325.8 844.5 370.0 584.4 297.1 1. Central Goverment 7.1 4.4 14.5 29.9 116.2 5.6 351.8 32.2 32.7 8.1 2. Other Public Sector Capital 0.0 6.2 27.9 6.0 5.3 9.5 210.1 26.1 195.0 71.3 3. Domestic Banks 146.6 3.5 4.3 90.8 108.8 72.5 162.7 184.6 181.3 157.7 4. Other Private 649.3 196.3 736.0 318.6 480.7 238.1 119.9 127.2 175.4 60.0
3. NET ERRORS AND OMISSIONS 59.4 0.0 252.0 0.0 125.5 0.0 31.7 0.0 0.0 196.74. OVERALL BALANCE 0.0 79.1 0.0 45.7 108.7 0.0 253.0 0.0 44.5 0.05. FINANCING 79.1 0.0 45.7 0.0 0.0 108.7 0.0 253.0 0.0 44.5 Change in SDR holdings 0.1 0.0 0.1 0.0 0.0 0.0 0.0 178.9 3.1 0.0 Change in Reserve Position with the Fund 0.0 0.5 0.0 0.5 0.3 0.0 0.0 0.2 0.2 0.0 Change in External Foreign Assets 79.5 0.0 46.1 0.0 0.0 109.0 0.0 73.9 0.0 47.8 (increase = debit)
2008p 2009p
Table 7.1 Balance of Payments
SOURCE: The Central Bank of The Bahamas
67
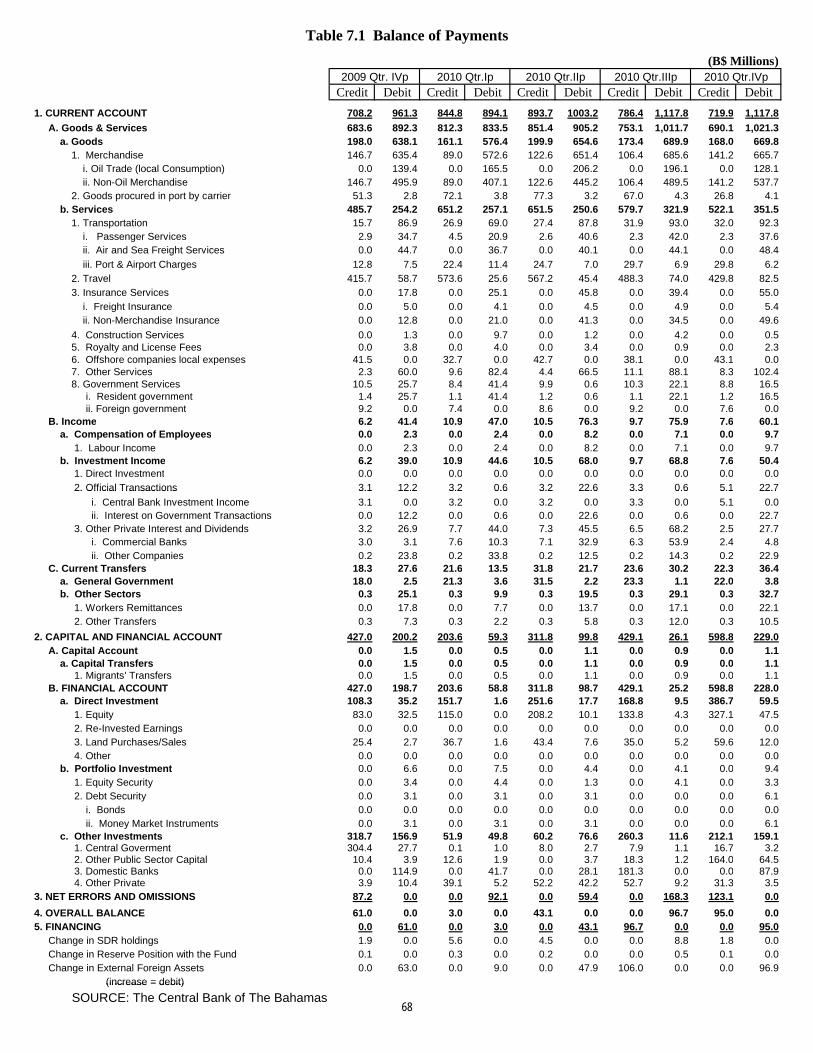
(B$ Millions)
Credit Debit Credit Debit Credit Debit Credit Debit Credit Debit
1. CURRENT ACCOUNT 708.2 961.3 844.8 894.1 893.7 1003.2 786.4 1,117.8 719.9 1,117.8
A. Goods & Services 683.6 892.3 812.3 833.5 851.4 905.2 753.1 1,011.7 690.1 1,021.3 a. Goods 198.0 638.1 161.1 576.4 199.9 654.6 173.4 689.9 168.0 669.8 1. Merchandise 146.7 635.4 89.0 572.6 122.6 651.4 106.4 685.6 141.2 665.7 i. Oil Trade (local Consumption) 0.0 139.4 0.0 165.5 0.0 206.2 0.0 196.1 0.0 128.1 ii. Non-Oil Merchandise 146.7 495.9 89.0 407.1 122.6 445.2 106.4 489.5 141.2 537.7 2. Goods procured in port by carrier 51.3 2.8 72.1 3.8 77.3 3.2 67.0 4.3 26.8 4.1 b. Services 485.7 254.2 651.2 257.1 651.5 250.6 579.7 321.9 522.1 351.5 1. Transportation 15.7 86.9 26.9 69.0 27.4 87.8 31.9 93.0 32.0 92.3 i. Passenger Services 2.9 34.7 4.5 20.9 2.6 40.6 2.3 42.0 2.3 37.6 ii. Air and Sea Freight Services 0.0 44.7 0.0 36.7 0.0 40.1 0.0 44.1 0.0 48.4
iii. Port & Airport Charges 12.8 7.5 22.4 11.4 24.7 7.0 29.7 6.9 29.8 6.2
2. Travel 415.7 58.7 573.6 25.6 567.2 45.4 488.3 74.0 429.8 82.5
3. Insurance Services 0.0 17.8 0.0 25.1 0.0 45.8 0.0 39.4 0.0 55.0
i. Freight Insurance 0.0 5.0 0.0 4.1 0.0 4.5 0.0 4.9 0.0 5.4 ii. Non-Merchandise Insurance 0.0 12.8 0.0 21.0 0.0 41.3 0.0 34.5 0.0 49.6
4. Construction Services 0.0 1.3 0.0 9.7 0.0 1.2 0.0 4.2 0.0 0.5 5. Royalty and License Fees 0.0 3.8 0.0 4.0 0.0 3.4 0.0 0.9 0.0 2.3 6. Offshore companies local expenses 41.5 0.0 32.7 0.0 42.7 0.0 38.1 0.0 43.1 0.0 7. Other Services 2.3 60.0 9.6 82.4 4.4 66.5 11.1 88.1 8.3 102.4 8. Government Services 10.5 25.7 8.4 41.4 9.9 0.6 10.3 22.1 8.8 16.5 i. Resident government 1.4 25.7 1.1 41.4 1.2 0.6 1.1 22.1 1.2 16.5 ii. Foreign government 9.2 0.0 7.4 0.0 8.6 0.0 9.2 0.0 7.6 0.0 B. Income 6.2 41.4 10.9 47.0 10.5 76.3 9.7 75.9 7.6 60.1 a. Compensation of Employees 0.0 2.3 0.0 2.4 0.0 8.2 0.0 7.1 0.0 9.7 1. Labour Income 0.0 2.3 0.0 2.4 0.0 8.2 0.0 7.1 0.0 9.7 b. Investment Income 6.2 39.0 10.9 44.6 10.5 68.0 9.7 68.8 7.6 50.4 1. Direct Investment 0.0 0.0 0.0 0.0 0.0 0.0 0.0 0.0 0.0 0.0
2. Official Transactions 3.1 12.2 3.2 0.6 3.2 22.6 3.3 0.6 5.1 22.7
2010 Qtr.IVp
Table 7.1 Balance of Payments
2010 Qtr.IIp2009 Qtr. IVp 2010 Qtr.IIIp2010 Qtr.Ip
2. Official Transactions 3.1 12.2 3.2 0.6 3.2 22.6 3.3 0.6 5.1 22.7
i. Central Bank Investment Income 3.1 0.0 3.2 0.0 3.2 0.0 3.3 0.0 5.1 0.0 ii. Interest on Government Transactions 0.0 12.2 0.0 0.6 0.0 22.6 0.0 0.6 0.0 22.7 3. Other Private Interest and Dividends 3.2 26.9 7.7 44.0 7.3 45.5 6.5 68.2 2.5 27.7 i. Commercial Banks 3.0 3.1 7.6 10.3 7.1 32.9 6.3 53.9 2.4 4.8 ii. Other Companies 0.2 23.8 0.2 33.8 0.2 12.5 0.2 14.3 0.2 22.9 C. Current Transfers 18.3 27.6 21.6 13.5 31.8 21.7 23.6 30.2 22.3 36.4 a. General Government 18.0 2.5 21.3 3.6 31.5 2.2 23.3 1.1 22.0 3.8 b. Other Sectors 0.3 25.1 0.3 9.9 0.3 19.5 0.3 29.1 0.3 32.7 1. Workers Remittances 0.0 17.8 0.0 7.7 0.0 13.7 0.0 17.1 0.0 22.1 2. Other Transfers 0.3 7.3 0.3 2.2 0.3 5.8 0.3 12.0 0.3 10.5
2. CAPITAL AND FINANCIAL ACCOUNT 427.0 200.2 203.6 59.3 311.8 99.8 429.1 26.1 598.8 229.0 A. Capital Account 0.0 1.5 0.0 0.5 0.0 1.1 0.0 0.9 0.0 1.1 a. Capital Transfers 0.0 1.5 0.0 0.5 0.0 1.1 0.0 0.9 0.0 1.1 1. Migrants' Transfers 0.0 1.5 0.0 0.5 0.0 1.1 0.0 0.9 0.0 1.1 B. FINANCIAL ACCOUNT 427.0 198.7 203.6 58.8 311.8 98.7 429.1 25.2 598.8 228.0 a. Direct Investment 108.3 35.2 151.7 1.6 251.6 17.7 168.8 9.5 386.7 59.5 1. Equity 83.0 32.5 115.0 0.0 208.2 10.1 133.8 4.3 327.1 47.5 2. Re-Invested Earnings 0.0 0.0 0.0 0.0 0.0 0.0 0.0 0.0 0.0 0.0 3. Land Purchases/Sales 25.4 2.7 36.7 1.6 43.4 7.6 35.0 5.2 59.6 12.0 4. Other 0.0 0.0 0.0 0.0 0.0 0.0 0.0 0.0 0.0 0.0 b. Portfolio Investment 0.0 6.6 0.0 7.5 0.0 4.4 0.0 4.1 0.0 9.4 1. Equity Security 0.0 3.4 0.0 4.4 0.0 1.3 0.0 4.1 0.0 3.3 2. Debt Security 0.0 3.1 0.0 3.1 0.0 3.1 0.0 0.0 0.0 6.1 i. Bonds 0.0 0.0 0.0 0.0 0.0 0.0 0.0 0.0 0.0 0.0 ii. Money Market Instruments 0.0 3.1 0.0 3.1 0.0 3.1 0.0 0.0 0.0 6.1 c. Other Investments 318.7 156.9 51.9 49.8 60.2 76.6 260.3 11.6 212.1 159.1 1. Central Goverment 304.4 27.7 0.1 1.0 8.0 2.7 7.9 1.1 16.7 3.2 2. Other Public Sector Capital 10.4 3.9 12.6 1.9 0.0 3.7 18.3 1.2 164.0 64.5 3. Domestic Banks 0.0 114.9 0.0 41.7 0.0 28.1 181.3 0.0 0.0 87.9 4. Other Private 3.9 10.4 39.1 5.2 52.2 42.2 52.7 9.2 31.3 3.53. NET ERRORS AND OMISSIONS 87.2 0.0 0.0 92.1 0.0 59.4 0.0 168.3 123.1 0.0
4. OVERALL BALANCE 61.0 0.0 3.0 0.0 43.1 0.0 0.0 96.7 95.0 0.05. FINANCING 0.0 61.0 0.0 3.0 0.0 43.1 96.7 0.0 0.0 95.0 Change in SDR holdings 1.9 0.0 5.6 0.0 4.5 0.0 0.0 8.8 1.8 0.0 Change in Reserve Position with the Fund 0.1 0.0 0.3 0.0 0.2 0.0 0.0 0.5 0.1 0.0 Change in External Foreign Assets 0.0 63.0 0.0 9.0 0.0 47.9 106.0 0.0 0.0 96.9 (increase = debit) (increase = debit)
SOURCE: The Central Bank of The Bahamas 68
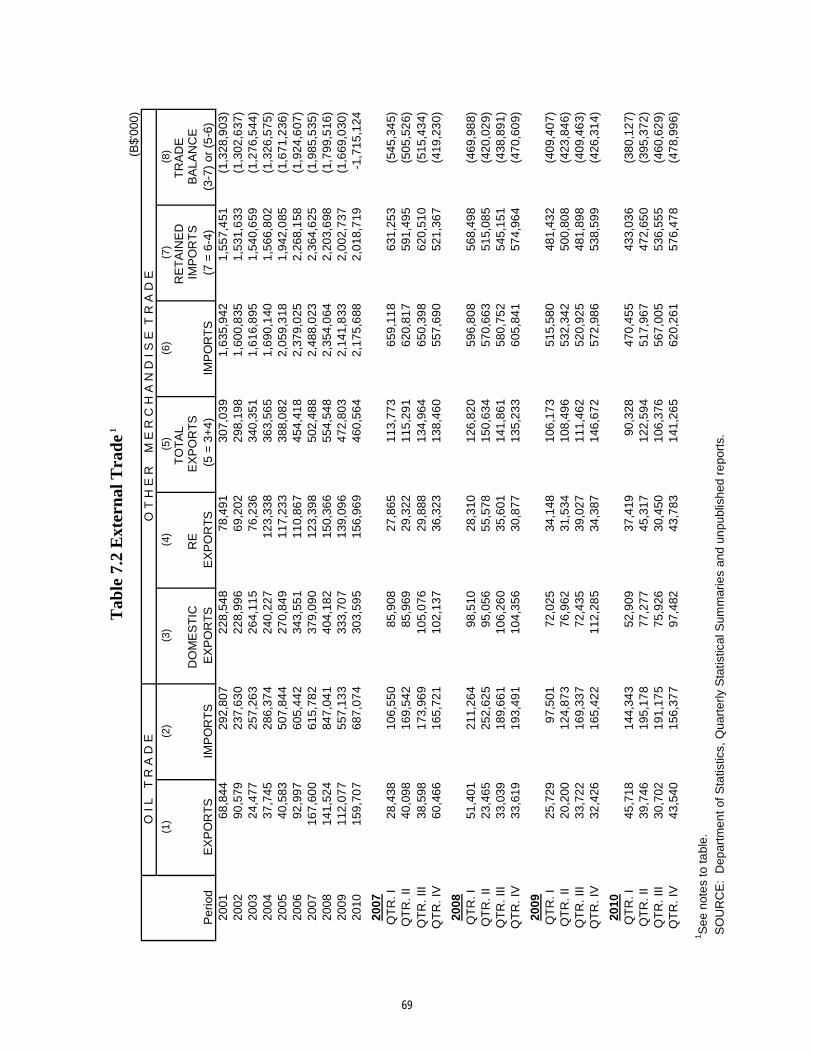
(B$'
000)
(1)
(2)
(3)
(4)
(5)
(6)
(7)
(8)
TO
TA
L R
ET
AIN
ED
T
RA
DE
D
OM
ES
TIC
R
E
EX
PO
RT
SIM
PO
RT
SB
ALA
NC
EP
erio
dE
XP
OR
TS
IMP
OR
TS
EX
PO
RT
SE
XP
OR
TS
(5
= 3
+4
)IM
PO
RT
S(7
= 6
-4)
(3-7
) or
(5
-6)
2001
68,8
4429
2,80
722
8,54
878
,491
307,
039
1,63
5,9
421,
557,
451
(1,3
28,9
03)
20
0290
,579
237,
630
228,
996
69,2
0229
8,19
81,
600,
835
1,53
1,6
33(1
,302
,637
)
2003
24,4
7725
7,26
326
4,11
576
,236
340,
351
1,61
6,8
951,
540,
659
(1,2
76,5
44)
20
0437
,745
286,
374
240,
227
123,
338
363,
565
1,69
0,1
401,
566,
802
(1,3
26,5
75)
20
0540
,583
507,
844
270,
849
117,
233
388,
082
2,05
9,3
181,
942,
085
(1,6
71,2
36)
20
0692
,997
605,
442
343,
551
110,
867
454,
418
2,37
9,0
252,
268,
158
(1,9
24,6
07)
20
0716
7,60
061
5,78
237
9,09
012
3,39
850
2,48
82,
488,
023
2,36
4,6
25(1
,985
,535
)
2008
141,
524
847,
041
404,
182
150,
366
554,
548
2,35
4,0
642,
203,
698
(1,7
99,5
16)
20
0911
2,07
755
7,13
333
3,70
713
9,09
647
2,80
32,
141,
833
2,00
2,7
37(1
,669
,030
)
2010
159,
707
687,
074
303,
595
156,
969
460,
564
2,17
5,6
882,
018,
719
-1,7
15,1
24
2007
QT
R. I
28,4
3810
6,55
085
,908
27,8
6511
3,77
365
9,11
863
1,25
3(5
45,3
45)
QT
R. I
I40
,098
169,
542
85,9
6929
,322
115,
291
620,
817
591,
495
(505
,52
6)
Q
TR
. III
38,5
9817
3,96
910
5,07
629
,888
134,
964
650,
398
620,
510
(515
,43
4)
Q
TR
. IV
60,4
6616
5,72
110
2,13
736
,323
138,
460
557,
690
521,
367
(419
,23
0)
2008
QT
R. I
51,4
0121
1,26
498
,510
28,3
1012
6,82
059
6,80
856
8,49
8(4
69,9
88)
QT
R. I
I23
,465
252,
625
95,0
5655
,578
150,
634
570,
663
515,
085
(420
,02
9)
Q
TR
. III
33,0
3918
9,66
110
6,26
035
,601
141,
861
580,
752
545,
151
(438
,89
1)
Q
TR
. IV
33,6
1919
3,49
110
4,35
630
,877
135,
233
605,
841
574,
964
(470
,60
9)
2009
QT
R. I
25,7
2997
,501
72,0
2534
,148
106,
173
515,
580
481,
432
(409
,40
7)
Q
TR
. II
20,2
0012
4,87
376
,962
31,5
3410
8,49
653
2,34
250
0,80
8(4
23,8
46)
QT
R. I
II33
,722
169,
337
72,4
3539
,027
111,
462
520,
925
481,
898
(409
,46
3)
Q
TR
. IV
32,4
2616
5,42
211
2,28
534
,387
146,
672
572,
986
538,
599
(426
,31
4)
2010
QT
R. I
45,7
1814
4,34
352
,909
37,4
1990
,328
470,
455
433,
036
(380
,12
7)
Q
TR
. II
39,7
4619
5,17
877
,277
45,3
1712
2,59
451
7,96
747
2,65
0(3
95,3
72)
QT
R. I
II30
,702
191,
175
75,9
2630
,450
106,
376
567,
005
536,
555
(460
,62
9)
Q
TR
. IV
43,5
4015
6,37
797
,482
43,7
8314
1,26
562
0,26
157
6,47
8(4
78,9
96)
1S
ee n
ote
s to
tabl
e.
SO
UR
CE
: D
epar
tmen
t of S
tatis
tics,
Qua
rter
ly S
tatis
tical
Sum
mar
ies
and
unpu
blis
hed
repo
rts.
Tab
le 7
.2 E
xter
nal
Tra
de 1
O T
H E
R
M E
R C
H A
N D
I S
E T
R A
D E
O I
L T
R A
D E
69
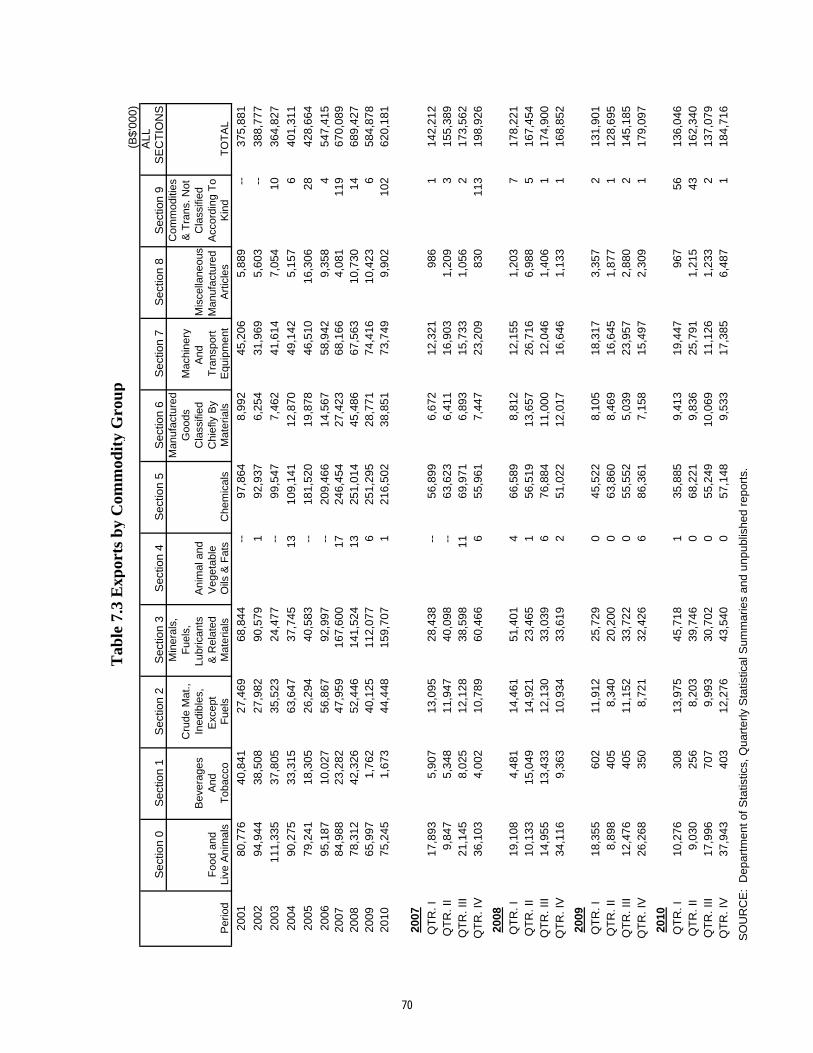
(B$'
000)
ALL
Sec
tion
0S
ectio
n 1
Sec
tion
2S
ectio
n 3
Sec
tion
4S
ectio
n 5
Sec
tion
6S
ectio
n 7
Sec
tion
8S
ectio
n 9
SE
CT
ION
SM
iner
als,
Man
ufac
ture
dC
omm
oditi
esC
rude
Mat
.,F
uels
,G
oods
Mac
hine
ry&
Tra
ns. N
otB
ever
ages
Ined
ible
s,Lu
bric
ants
A
nim
al a
ndC
lass
ified
And
M
isce
llane
ous
Cla
ssifi
edF
ood
and
And
Exc
ept
& R
elat
edV
eget
able
C
hief
ly B
yT
rans
port
Man
ufac
ture
d A
ccor
ding
To
Per
iod
Live
Ani
mal
sT
obac
coF
uels
Mat
eria
lsO
ils &
Fat
sC
hem
ical
sM
ater
ials
Equ
ipm
ent
Art
icle
sK
ind
TO
TA
L
2001
80,7
7640
,841
27,4
6968
,844
--
97,8
648,
992
45,2
065,
889
--
375,
881
2002
94,9
4438
,508
27,9
8290
,579
192
,937
6,25
431
,969
5,60
3
-
-38
8,77
7
2003
111,
335
37,8
0535
,523
24,4
77
-
-99
,547
7,46
241
,614
7,05
410
364,
827
2004
90,2
7533
,315
63,6
4737
,745
1310
9,14
112
,870
49,1
425,
157
640
1,31
1
2005
79,2
4118
,305
26,2
9440
,583
--
181,
520
19,8
7846
,510
16,3
0628
428,
664
2006
95,1
8710
,027
56,8
6792
,997
--
209,
466
14,5
6758
,942
9,35
84
547,
415
2007
84,9
8823
,282
47,9
5916
7,60
017
246,
454
27,4
2368
,166
4,08
111
967
0,08
920
0878
,312
42,3
2652
,446
141,
524
1325
1,01
445
,486
67,5
6310
,730
1468
9,42
720
0965
,997
1,76
240
,125
112,
077
625
1,29
528
,771
74,4
1610
,423
658
4,87
820
1075
,245
1,67
344
,448
159,
707
121
6,50
238
,851
73,7
499,
902
102
620,
181
2007
QT
R. I
17,8
935,
907
13,0
9528
,438
--
56,8
996,
672
12,3
2198
61
142,
212
QT
R. I
I9,
847
5,34
811
,947
40,0
98
-
-63
,623
6,41
116
,903
1,20
93
155,
389
QT
R. I
II21
,145
8,02
512
,128
38,5
9811
69,9
716,
893
15,7
331,
056
217
3,56
2Q
TR
. IV
36,1
034,
002
10,7
8960
,466
655
,961
7,44
723
,209
830
113
198,
926
2008
QT
R. I
19,1
084,
481
14,4
6151
,401
466
,589
8,81
212
,155
1,20
37
178,
221
QT
R. I
I10
,133
15,0
4914
,921
23,4
651
56,5
1913
,657
26,7
166,
988
516
7,45
4Q
TR
. III
14,9
5513
,433
12,1
3033
,039
676
,884
11,0
0012
,046
1,40
61
174,
900
QT
R. I
V34
,116
9,36
310
,934
33,6
192
51,0
2212
,017
16,6
461,
133
116
8,85
2
2009
QT
R. I
18,3
5560
211
,912
25,7
290
45,5
228,
105
18,3
173,
357
213
1,90
1Q
TR
. II
8,89
840
58,
340
20,2
000
63,8
608,
469
16,6
451,
877
112
8,69
5Q
TR
. III
12,4
7640
511
,152
33,7
220
55,5
525,
039
23,9
572,
880
214
5,18
5Q
TR
. IV
26,2
6835
08,
721
32,4
266
86,3
617,
158
15,4
972,
309
117
9,09
7
2010
QT
R. I
10,2
7630
813
,975
45,7
181
35,8
859,
413
19,4
4796
756
136,
046
QT
R. I
I9,
030
256
8,20
339
,746
068
,221
9,83
625
,791
1,21
543
162,
340
QT
R. I
II17
,996
707
9,99
330
,702
055
,249
10,0
6911
,126
1,23
32
137,
079
QT
R. I
V37
,943
403
12,2
7643
,540
057
,148
9,53
317
,385
6,48
71
184,
716
SO
UR
CE
: D
epar
tmen
t of S
tatis
tics,
Qua
rter
ly S
tatis
tical
Sum
mar
ies
and
unp
ublis
hed
repo
rts.
Tab
le7.
3E
xpor
tsb
yC
omm
odit
yG
rou
p
70
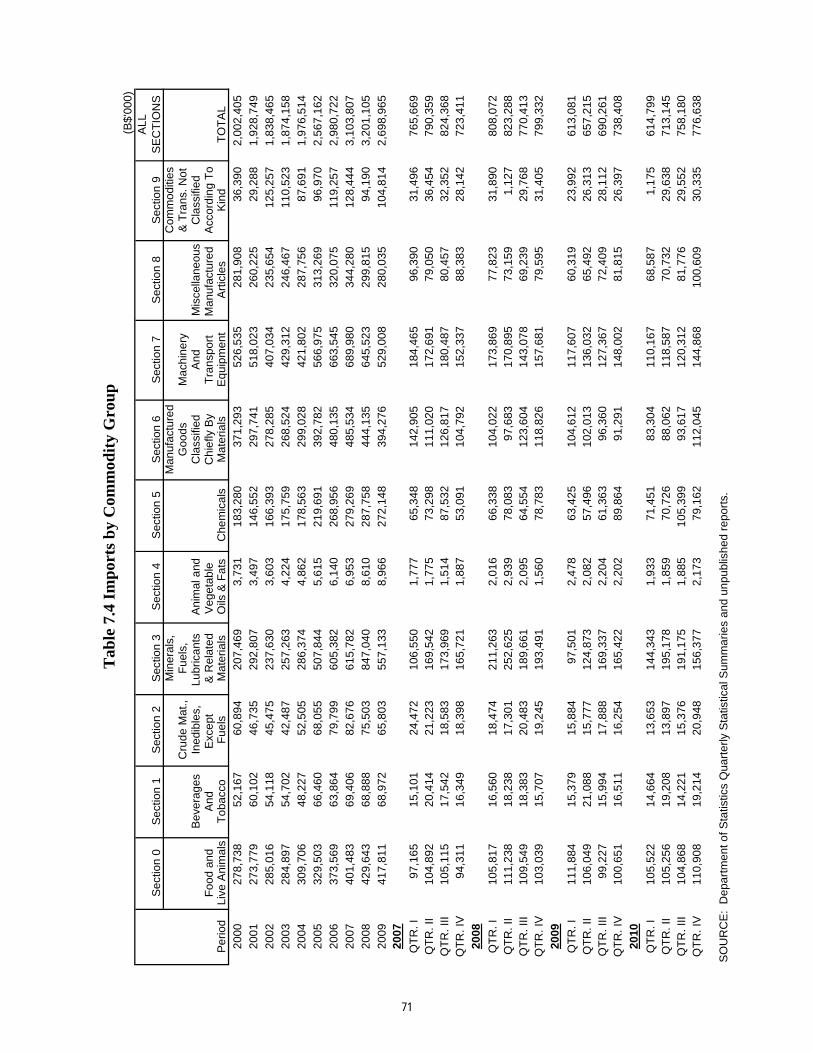
(B$
'00
0)
AL
L
Se
ctio
n 0
Se
ctio
n 1
Se
ctio
n 2
Se
ctio
n 3
Se
ctio
n 4
Se
ctio
n 5
Se
ctio
n 6
Se
ctio
n 7
Se
ctio
n 8
Se
ctio
n 9
SE
CT
ION
SM
ine
rals
,M
an
ufa
ctu
red
Co
mm
od
itie
sC
rud
e M
at.,
Fu
els
,G
oo
ds
Ma
ch
ine
ry&
Tra
ns. N
ot
Be
ve
rag
es
Ine
dib
les,
Lu
brica
nts
A
nim
al a
nd
Cla
ssifie
dA
nd
Mis
ce
llan
eo
us
Cla
ssifie
dF
oo
d a
nd
An
dE
xce
pt
& R
ela
ted
Ve
ge
tab
le
Ch
iefly B
yT
ran
sp
ort
Ma
nu
factu
red
A
cco
rdin
g T
oP
erio
dL
ive
An
ima
lsT
ob
acco
Fu
els
Ma
teria
lsO
ils &
Fa
tsC
he
mic
als
Ma
teria
lsE
qu
ipm
en
tA
rtic
les
Kin
dT
OT
AL
20
00
27
8,7
38
52
,16
76
0,8
94
20
7,4
69
3,7
31
18
3,2
80
37
1,2
93
52
6,5
35
28
1,9
08
36
,39
02
,00
2,4
05
20
01
27
3,7
79
60
,10
24
6,7
35
29
2,8
07
3,4
97
14
6,5
52
29
7,7
41
51
8,0
23
26
0,2
25
29
,28
81
,92
8,7
49
20
02
28
5,0
16
54
,11
84
5,4
75
23
7,6
30
3,6
03
16
6,3
93
27
8,2
85
40
7,0
34
23
5,6
54
12
5,2
57
1,8
38
,46
5
20
03
28
4,8
97
54
,70
24
2,4
87
25
7,2
63
4,2
24
17
5,7
59
26
8,5
24
42
9,3
12
24
6,4
67
11
0,5
23
1,8
74
,15
8
20
04
30
9,7
06
48
,22
75
2,5
05
28
6,3
74
4,8
62
17
8,5
63
29
9,0
28
42
1,8
02
28
7,7
56
87
,69
11
,97
6,5
14
20
05
32
9,5
03
66
,46
06
8,0
55
50
7,8
44
5,6
15
21
9,6
91
39
2,7
82
56
6,9
75
31
3,2
69
96
,97
02
,56
7,1
62
20
06
37
3,5
69
63
,86
47
9,7
99
60
5,3
82
6,1
40
26
8,9
56
48
0,1
35
66
3,5
45
32
0,0
75
11
9,2
57
2,9
80
,72
2
20
07
40
1,4
83
69
,40
68
2,6
76
61
5,7
82
6,9
53
27
9,2
69
48
5,5
34
68
9,9
80
34
4,2
80
12
8,4
44
3,1
03
,80
7
20
08
42
9,6
43
68
,88
87
5,5
03
84
7,0
40
8,6
10
28
7,7
58
44
4,1
35
64
5,5
23
29
9,8
15
94
,19
03
,20
1,1
05
20
09
41
7,8
11
68
,97
26
5,8
03
55
7,1
33
8,9
66
27
2,1
48
39
4,2
76
52
9,0
08
28
0,0
35
10
4,8
14
2,6
98
,96
5
20
07
QT
R. I
97
,16
51
5,1
01
24
,47
21
06
,55
01
,77
76
5,3
48
14
2,9
05
18
4,4
65
96
,39
03
1,4
96
76
5,6
69
QT
R. II
10
4,8
92
20
,41
42
1,2
23
16
9,5
42
1,7
75
73
,29
81
11
,02
01
72
,69
17
9,0
50
36
,45
47
90
,35
9
QT
R. III
10
5,1
15
17
,54
21
8,5
83
17
3,9
69
1,5
14
87
,53
21
26
,81
71
80
,48
78
0,4
57
32
,35
28
24
,36
8
QT
R. IV
94
,31
11
6,3
49
18
,39
81
65
,72
11
,88
75
3,0
91
10
4,7
92
15
2,3
37
88
,38
32
8,1
42
72
3,4
11
20
08
QT
R. I
10
5,8
17
16
,56
01
8,4
74
21
1,2
63
2,0
16
66
,33
81
04
,02
21
73
,86
97
7,8
23
31
,89
08
08
,07
2
QT
R. II
11
1,2
38
18
,23
81
7,3
01
25
2,6
25
2,9
39
78
,08
39
7,6
83
17
0,8
95
73
,15
91
,12
78
23
,28
8
QT
R. III
10
9,5
49
18
,38
32
0,4
83
18
9,6
61
2,0
95
64
,55
41
23
,60
41
43
,07
86
9,2
39
29
,76
87
70
,41
3
QT
R. IV
10
3,0
39
15
,70
71
9,2
45
19
3,4
91
1,5
60
78
,78
31
18
,82
61
57
,68
17
9,5
95
31
,40
57
99
,33
2
20
09
QT
R. I
11
1,8
84
15
,37
91
5,8
84
97
,50
12
,47
86
3,4
25
10
4,6
12
11
7,6
07
60
,31
92
3,9
92
61
3,0
81
QT
R. II
10
6,0
49
21
,08
81
5,7
77
12
4,8
73
2,0
82
57
,49
61
02
,01
31
36
,03
26
5,4
92
26
,31
36
57
,21
5
QT
R. III
99
,22
71
5,9
94
17
,88
81
69
,33
72
,20
46
1,3
63
96
,36
01
27
,36
77
2,4
09
28
,11
26
90
,26
1
QT
R. IV
10
0,6
51
16
,51
11
6,2
54
16
5,4
22
2,2
02
89
,86
49
1,2
91
14
8,0
02
81
,81
52
6,3
97
73
8,4
08
20
10
QT
R. I
10
5,5
22
14
,66
41
3,6
53
14
4,3
43
1,9
33
71
,45
18
3,3
04
11
0,1
67
68
,58
71
,17
56
14
,79
9
QT
R. II
10
5,2
56
19
,20
81
3,8
97
19
5,1
78
1,8
59
70
,72
68
8,0
62
11
8,5
87
70
,73
22
9,6
38
71
3,1
45
QT
R. III
10
4,8
68
14
,22
11
5,3
76
19
1,1
75
1,8
85
10
5,3
99
93
,61
71
20
,31
28
1,7
76
29
,55
27
58
,18
0
QT
R. IV
11
0,9
08
19
,21
42
0,9
48
15
6,3
77
2,1
73
79
,16
21
12
,04
51
44
,86
81
00
,60
93
0,3
35
77
6,6
38
SO
UR
CE
: D
ep
art
me
nt o
f S
tatistics Q
ua
rte
rly S
tatistica
l S
um
ma
rie
s a
nd
un
pu
blis
he
d r
ep
ort
s.
Ta
ble
7.4
Im
po
rts
by
Co
mm
od
ity
Gro
up
71
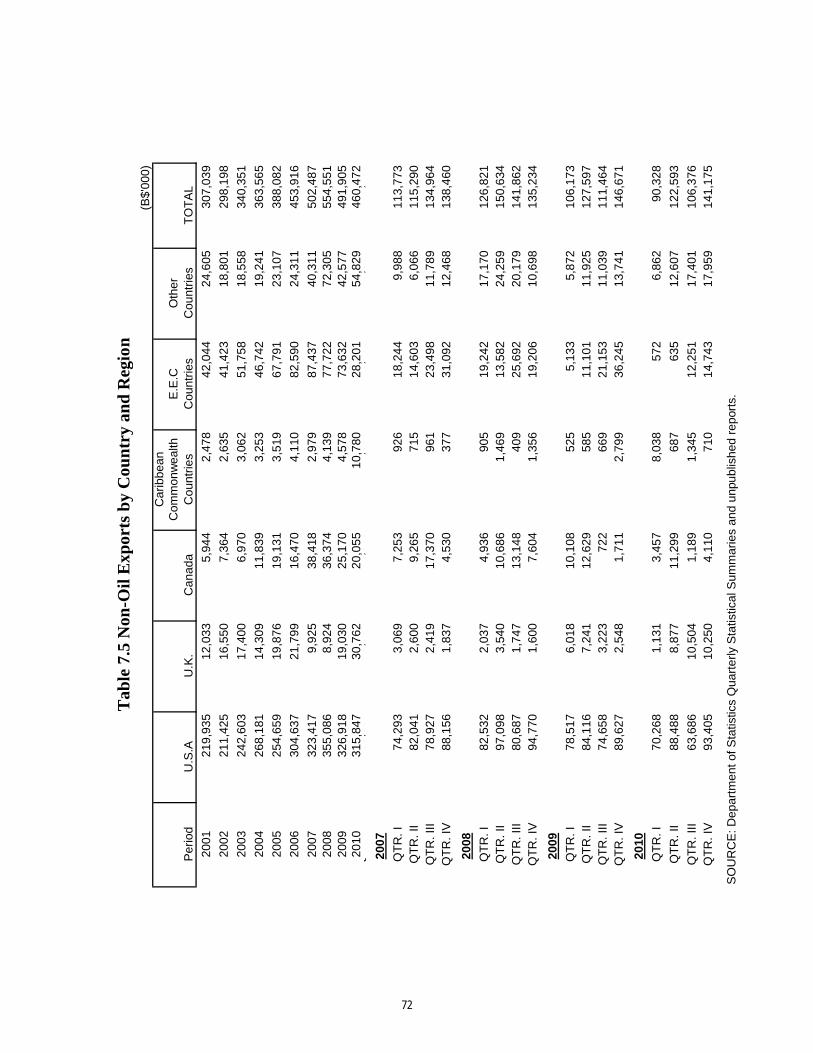
(B$'
000)
Car
ibbe
anC
omm
onw
ealth
E.E
.CO
ther
Per
iod
U.S
.AU
.K.
Can
ada
Cou
ntrie
sC
ount
ries
Cou
ntrie
sT
OT
AL
2001
219,
935
12,0
335,
944
2,47
842
,044
24,6
0530
7,03
9
2002
211,
425
16,5
507,
364
2,63
541
,423
18,8
0129
8,19
8
2003
242,
603
17,4
006,
970
3,06
251
,758
18,5
5834
0,35
1
2004
268,
181
14,3
0911
,839
3,25
346
,742
19,2
4136
3,56
5
2005
254,
659
19,8
7619
,131
3,51
967
,791
23,1
0738
8,08
2
2006
304,
637
21,7
9916
,470
4,11
082
,590
24,3
1145
3,91
6
2007
323,
417
9,92
538
,418
2,97
987
,437
40,3
1150
2,48
720
0835
5,08
68,
924
36,3
744,
139
77,7
2272
,305
554,
551
2009
326,
918
19,0
3025
,170
4,57
873
,632
42,5
7749
1,90
520
1031
5,84
730
,762
20,0
5510
,780
28,2
0154
,829
460,
472
QT
R. I
V88
,556
3,90
42,
593
1,39
628
,209
4,83
712
9,49
5
2007
QT
R. I
74,2
933,
069
7,25
392
618
,244
9,98
811
3,77
3Q
TR
. II
82,0
412,
600
9,26
571
514
,603
6,06
611
5,29
0Q
TR
. III
78,9
272,
419
17,3
7096
123
,498
11,7
8913
4,96
4Q
TR
. IV
88,1
561,
837
4,53
037
731
,092
12,4
6813
8,46
0
2008
QT
R. I
82,5
322,
037
4,93
690
519
,242
17,1
7012
6,82
1Q
TR
. II
97,0
983,
540
10,6
861,
469
13,5
8224
,259
150,
634
QT
R. I
II80
,687
1,74
713
,148
409
25,6
9220
,179
141,
862
QT
R. I
V94
,770
1,60
07,
604
1,35
619
,206
10,6
9813
5,23
4
2009
QT
R. I
78,5
176,
018
10,1
0852
55,
133
5,87
210
6,17
3Q
TR
. II
84,1
167,
241
12,6
2958
511
,101
11,9
2512
7,59
7Q
TR
. III
74,6
583,
223
722
669
21,1
5311
,039
111,
464
QT
R. I
V89
,627
2,54
81,
711
2,79
936
,245
13,7
4114
6,67
1
2010
QT
R. I
70,2
681,
131
3,45
78,
038
572
6,86
290
,328
QT
R. I
I88
,488
8,87
711
,299
687
635
12,6
0712
2,59
3
QT
R. I
II63
,686
10,5
041,
189
1,34
512
,251
17,4
0110
6,37
6Q
TR
. IV
93,4
0510
,250
4,11
071
014
,743
17,9
5914
1,17
5
SO
UR
CE
: Dep
artm
ent o
f Sta
tistic
s Q
uart
erly
Sta
tistic
al S
umm
arie
s an
d un
publ
ishe
d re
port
s.
Tab
le 7
.5 N
on-O
il E
xpor
ts b
y C
oun
try
and
Reg
ion
72
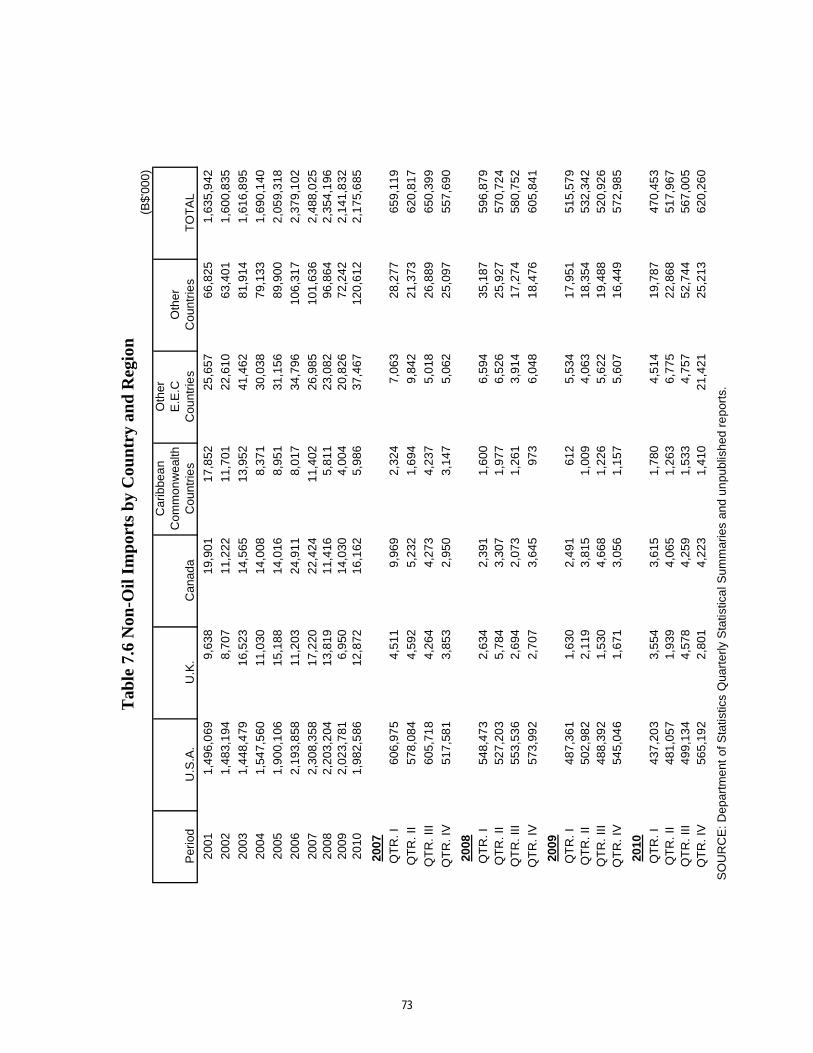
(B$'
000)
Car
ibbe
an
Oth
erC
omm
onw
ealth
E.E
.CO
ther
Per
iod
U.S
.A.
U.K
.C
anad
aC
ount
ries
Cou
ntrie
sC
ount
ries
TO
TA
L
2001
1,49
6,0
699,
638
19,9
0117
,852
25,6
5766
,825
1,63
5,9
42
2002
1,48
3,1
948,
707
11,2
2211
,701
22,6
1063
,401
1,60
0,8
35
2003
1,44
8,4
7916
,523
14,5
6513
,952
41,4
6281
,914
1,61
6,8
95
2004
1,54
7,5
6011
,030
14,0
088,
371
30,0
3879
,133
1,69
0,1
40
2005
1,90
0,1
0615
,188
14,0
168,
951
31,1
5689
,900
2,05
9,3
18
2006
2,19
3,8
5811
,203
24,9
118,
017
34,7
9610
6,31
72,
379,
102
2007
2,30
8,3
5817
,220
22,4
2411
,402
26,9
8510
1,63
62,
488,
025
2008
2,20
3,2
0413
,819
11,4
165,
811
23,0
8296
,864
2,35
4,1
9620
092,
023,
781
6,95
014
,030
4,00
420
,826
72,2
422,
141,
832
2010
1,98
2,5
8612
,872
16,1
625,
986
37,4
6712
0,61
22,
175,
685
2007
QT
R. I
606,
975
4,51
19,
969
2,32
47,
063
28,2
7765
9,11
9
QT
R. I
I57
8,08
44,
592
5,23
21,
694
9,84
221
,373
620,
817
QT
R. I
II60
5,71
84,
264
4,27
34,
237
5,01
826
,889
650,
399
QT
R. I
V51
7,58
13,
853
2,95
03,
147
5,06
225
,097
557,
690
2008
QT
R. I
548,
473
2,63
42,
391
1,60
06,
594
35,1
8759
6,87
9Q
TR
. II
527,
203
5,78
43,
307
1,97
76,
526
25,9
2757
0,72
4Q
TR
. III
553,
536
2,69
42,
073
1,26
13,
914
17,2
7458
0,75
2
QT
R. I
V57
3,99
22,
707
3,64
597
36,
048
18,4
7660
5,84
1
2009
QT
R. I
487,
361
1,63
02,
491
612
5,53
417
,951
515,
579
QT
R. I
I50
2,98
22,
119
3,81
51,
009
4,06
318
,354
532,
342
QT
R. I
II48
8,39
21,
530
4,66
81,
226
5,62
219
,488
520,
926
QT
R. I
V54
5,04
61,
671
3,05
61,
157
5,60
716
,449
572,
985
2010
QT
R. I
437,
203
3,55
43,
615
1,78
04,
514
19,7
8747
0,45
3Q
TR
. II
481,
057
1,93
94,
065
1,26
36,
775
22,8
6851
7,96
7Q
TR
. III
499,
134
4,57
84,
259
1,53
34,
757
52,7
4456
7,00
5Q
TR
. IV
565,
192
2,80
14,
223
1,41
021
,421
25,2
1362
0,26
0
SO
UR
CE
: Dep
artm
ent
of S
tatis
tics
Qua
rter
ly S
tatis
tica
l Sum
mar
ies
and
unpu
blis
hed
repo
rts.
Tab
le 7
.6 N
on-O
il I
mp
orts
by
Cou
ntr
y an
d R
egio
n
73
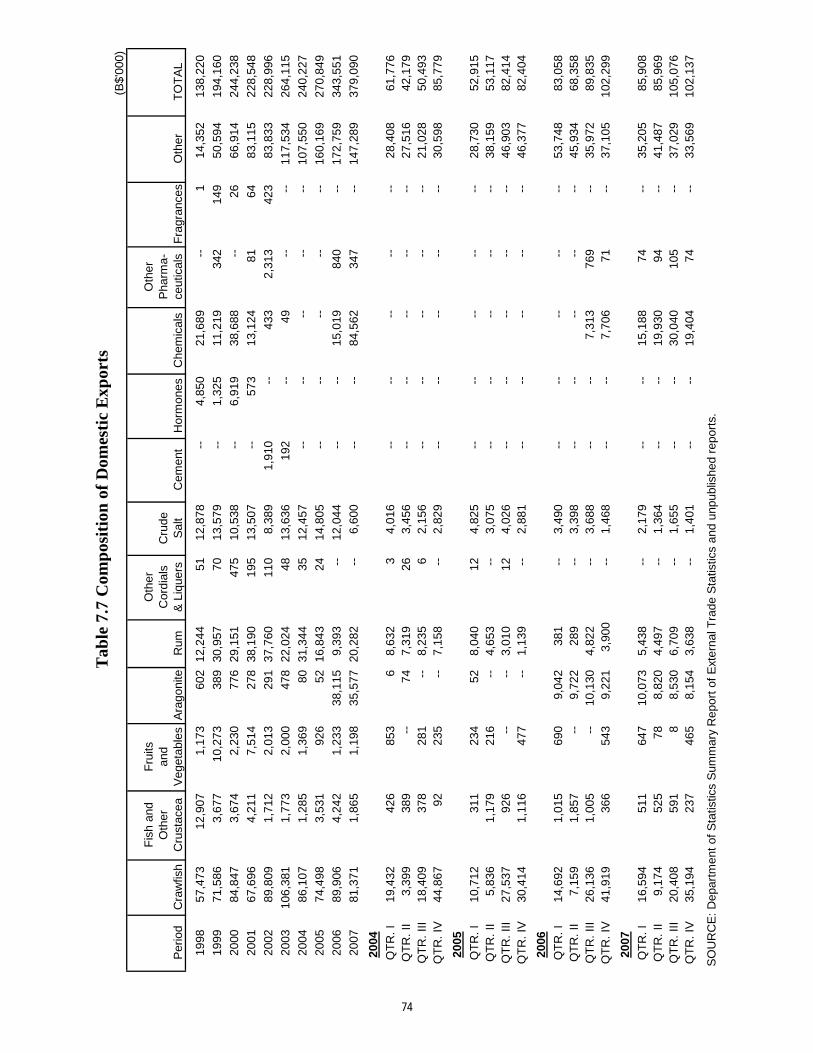
(B$'0
00)
Fis
h a
nd
Fru
its
Oth
er
Oth
er
Oth
er
and
Cord
ials
Cru
de
Pharm
a-
Period
Cra
wfish
Cru
sta
cea
Vegeta
ble
sA
ragonite
Rum
& L
iquers
Salt
Cem
ent
Horm
ones
Chem
icals
ceuticals
Fra
gra
nces
Oth
er
TO
TA
L
1998
57,4
73
12,9
07
1,1
73
602
12,2
44
51
12,8
78
-
-4,8
50
21,6
89
-
-1
14,3
52
138,2
20
1999
71,5
86
3,6
77
10,2
73
389
30,9
57
70
13,5
79
-
-1,3
25
11,2
19
342
149
50,5
94
194,1
60
2000
84,8
47
3,6
74
2,2
30
776
29,1
51
475
10,5
38
-
-6,9
19
38,6
88
-
-26
66,9
14
244,2
38
2001
67,6
96
4,2
11
7,5
14
278
38,1
90
195
13,5
07
-
-573
13,1
24
81
64
83,1
15
228,5
48
2002
89,8
09
1,7
12
2,0
13
291
37,7
60
110
8,3
89
1,9
10
--433
2,3
13
423
83,8
33
228,9
96
2003
106,3
81
1,7
73
2,0
00
478
22,0
24
48
13,6
36
192
--49
-
-
--
117,5
34
264,1
15
2004
86,1
07
1,2
85
1,3
69
80
31,3
44
35
12,4
57
-
-
--
--
--
--107,5
50
240,2
27
2005
74,4
98
3,5
31
926
52
16,8
43
24
14,8
05
-
-
--
--
--
--160,1
69
270,8
49
2006
89,9
06
4,2
42
1,2
33
38,1
15
9,3
93
--
12,0
44
-
-
--
15,0
19
840
-
-172,7
59
343,5
51
2007
81,3
71
1,8
65
1,1
98
35,5
77
20,2
82
--
6,6
00
-
-
--
84,5
62
347
-
-147,2
89
379,0
90
2004
QT
R.
I19,4
32
426
853
68,6
32
34,0
16
-
-
--
--
--
--28,4
08
61,7
76
QT
R.
II3,3
99
389
--74
7,3
19
26
3,4
56
-
-
--
--
--
--27,5
16
42,1
79
QT
R.
III
18,4
09
378
281
--8,2
35
62,1
56
-
-
--
--
--
--21,0
28
50,4
93
QT
R.
IV44,8
67
92
235
--7,1
58
--
2,8
29
-
-
--
--
--
--30,5
98
85,7
79
2005
QT
R.
I10,7
12
311
234
52
8,0
40
12
4,8
25
-
-
--
--
--
--28,7
30
52,9
15
QT
R.
II5,8
36
1,1
79
216
--4,6
53
--
3,0
75
-
-
--
--
--
--38,1
59
53,1
17
QT
R.
III
27,5
37
926
-
-
--
3,0
10
12
4,0
26
-
-
--
--
--
--46,9
03
82,4
14
QT
R.
IV30,4
14
1,1
16
477
--1,1
39
--
2,8
81
-
-
--
--
--
--46,3
77
82,4
04
2006
QT
R.
I14,6
92
1,0
15
690
9,0
42
381
--
3,4
90
-
-
--
--
--
--53,7
48
83,0
58
QT
R.
II7,1
59
1,8
57
-
-9,7
22
289
--
3,3
98
-
-
--
--
--
--45,9
34
68,3
58
QT
R.
III
26,1
36
1,0
05
-
-10,1
30
4,8
22
--
3,6
88
-
-
--
7,3
13
769
-
-35,9
72
89,8
35
QT
R.
IV41,9
19
366
543
9,2
21
3,9
00
--
1,4
68
-
-
--
7,7
06
71
-
-37,1
05
102,2
99
2007
QT
R.
I16,5
94
511
647
10,0
73
5,4
38
-
-2,1
79
-
-
--
15,1
88
74
-
-35,2
05
85,9
08
QT
R.
II9,1
74
525
78
8,8
20
4,4
97
-
-1,3
64
-
-
--
19,9
30
94
-
-41,4
87
85,9
69
QT
R.
III
20,4
08
591
88,5
30
6,7
09
-
-1,6
55
-
-
--
30,0
40
105
-
-37,0
29
105,0
76
QT
R.
IV35,1
94
237
465
8,1
54
3,6
38
-
-1,4
01
-
-
--
19,4
04
74
-
-33,5
69
102,1
37
S
OU
RC
E:
Depart
ment
of
Sta
tistics S
um
mary
Report
of
Ext
ern
al T
rade S
tatistics a
nd u
npublis
hed r
eport
s.
Ta
ble
7.7
Co
mp
osi
tio
n o
f D
om
esti
c E
xp
ort
s
74
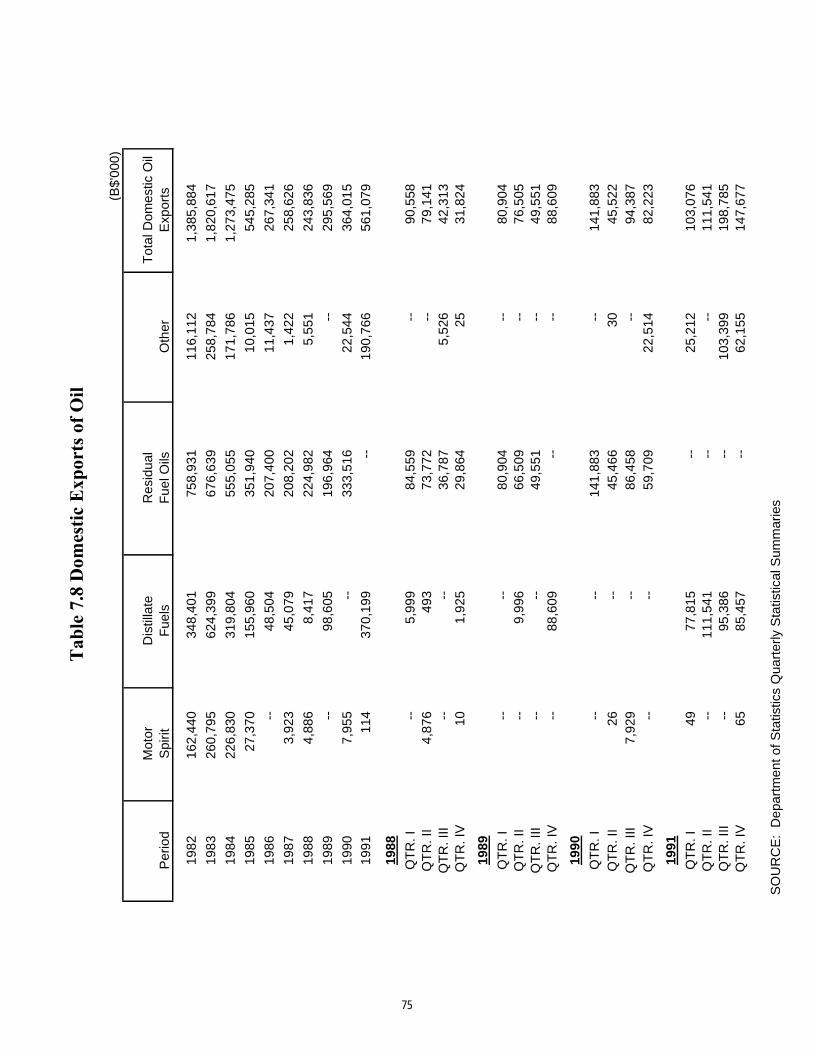
(B$'
000)
Mot
orD
istil
late
Res
idua
lT
otal
Dom
estic
Oil
Per
iod
Spi
ritF
uels
Fue
lOils
Oth
erE
xpor
ts
1982
162,
440
348,
401
758,
931
116,
112
1,38
5,88
4
1983
260,
795
624,
399
676,
639
258,
784
1,82
0,61
7
1984
226,
830
319,
804
555,
055
171,
786
1,27
3,47
5
1985
27,3
7015
5,96
035
1,94
010
,015
545,
285
1986
--48
,504
207,
400
11,4
3726
7,34
1
1987
3,92
345
,079
208,
202
1,42
225
8,62
6
1988
4,88
68,
417
224,
982
5,55
124
3,83
6
1989
--98
,605
196,
964
--29
5,56
9
1990
7,95
5--
333,
516
22,5
4436
4,01
5
1991
114
370,
199
--19
0,76
656
1,07
9
1988
QT
R.I
--5,
999
84,5
59--
90,5
58Q
TR
.II
4,87
649
373
,772
--79
,141
QT
R.I
II--
--36
,787
5,52
642
,313
QT
R.I
V10
1,92
529
,864
2531
,824
1989
QT
R.I
----
80,9
04--
80,9
04Q
TR
.II
--9,
996
66,5
09--
76,5
05Q
TR
.III
----
49,5
51--
49,5
51Q
TR
.IV
--88
,609
----
88,6
09
1990
QT
R.I
----
141,
883
--14
1,88
3Q
TR
.II
26--
45,4
6630
45,5
22Q
TR
.III
7,92
9--
86,4
58--
94,3
87Q
TR
.IV
----
59,7
0922
,514
82,2
23
1991
QT
R.I
4977
,815
--25
,212
103,
076
QT
R.I
I--
111,
541
----
111,
541
QT
R.I
II--
95,3
86--
103,
399
198,
785
QT
R.I
V65
85,4
57--
62,1
5514
7,67
7
SO
UR
CE
:D
epar
tmen
tofS
tatis
tics
Qua
rter
lyS
tatis
tical
Sum
mar
ies
75
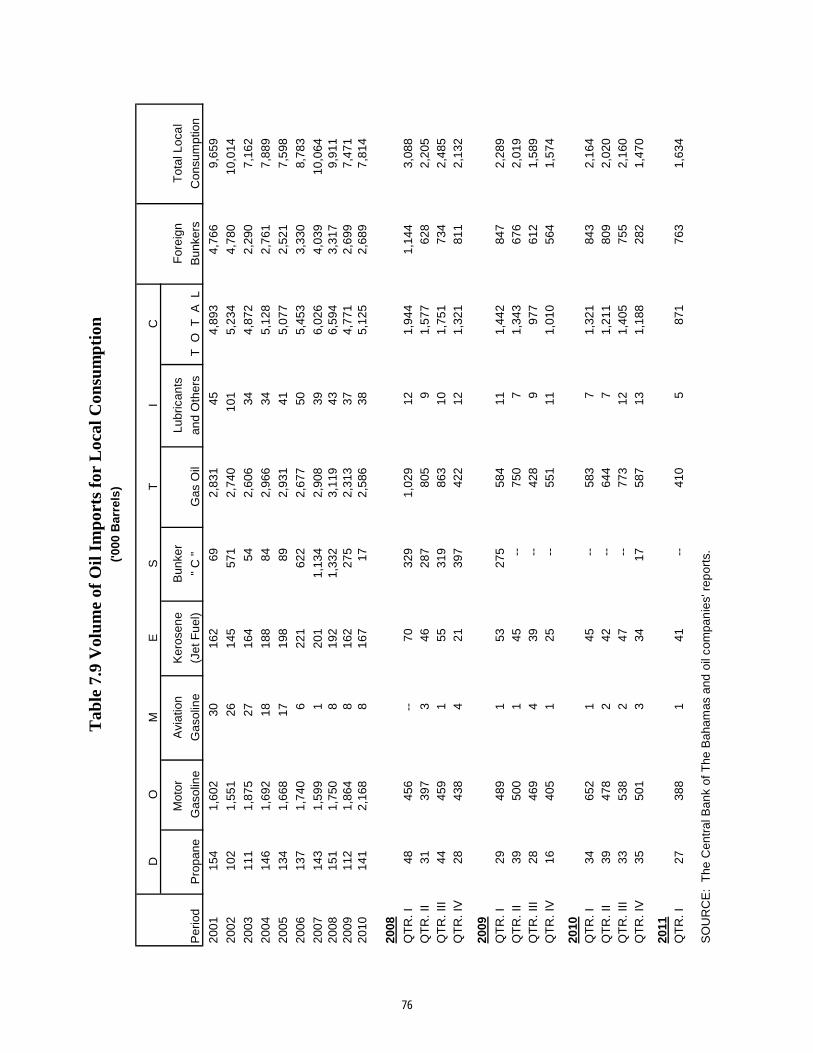
DO
ME
ST
IC
Mot
or
Avi
atio
nK
eros
ene
Bun
ker
Lubr
ican
tsF
orei
gnT
otal
Loc
al
Per
iod
Pro
pane
Gas
olin
eG
asol
ine
(Jet
Fu
el)
" C
"G
as O
ilan
d O
ther
sT
O T
A L
Bun
kers
Con
sum
ptio
n
2001
154
1,60
230
162
692,
831
454,
893
4,76
69,
659
2002
102
1,55
126
145
571
2,74
010
15,
234
4,78
010
,014
2003
111
1,87
527
164
542,
606
344,
872
2,29
07,
162
2004
146
1,69
218
188
842,
966
345,
128
2,76
17,
889
2005
134
1,66
817
198
892,
931
415,
077
2,52
17,
598
2006
137
1,74
06
221
622
2,67
750
5,45
33,
330
8,78
3
2007
143
1,59
91
201
1,13
42,
908
396,
026
4,03
910
,064
2008
151
1,75
08
192
1,33
23,
119
436,
594
3,31
79,
911
2009
112
1,86
48
162
275
2,31
337
4,77
12,
699
7,47
120
1014
12,
168
816
717
2,58
638
5,12
52,
689
7,81
4
2008
QT
R. I
4845
6--
7032
91,
029
121,
944
1,14
43,
088
QT
R. I
I31
397
346
287
805
91,
577
628
2,20
5Q
TR
. III
4445
91
5531
986
310
1,75
173
42,
485
QT
R. I
V28
438
421
397
422
121,
321
811
2,13
2
2009
QT
R. I
2948
91
5327
558
411
1,44
284
72,
289
QT
R. I
I39
500
145
--75
07
1,34
367
62,
019
QT
R. I
II28
469
439
--42
89
977
612
1,58
9Q
TR
. IV
1640
51
25--
551
111,
010
564
1,57
4
2010
QT
R. I
3465
21
45--
583
71,
321
843
2,16
4Q
TR
. II
3947
82
42--
644
71,
211
809
2,02
0Q
TR
. III
3353
82
47--
773
121,
405
755
2,16
0Q
TR
. IV
3550
13
3417
587
131,
188
282
1,47
0
2011
QT
R. I
2738
81
41--
410
587
176
31,
634
SO
UR
CE
: T
he C
entr
al B
ank
of T
he B
aham
as a
nd o
il co
mpa
nie
s' r
epor
ts.
Tab
le 7
.9 V
olu
me
of O
il I
mp
orts
for
Loc
al C
onsu
mp
tion
('00
0 B
arre
ls)
76
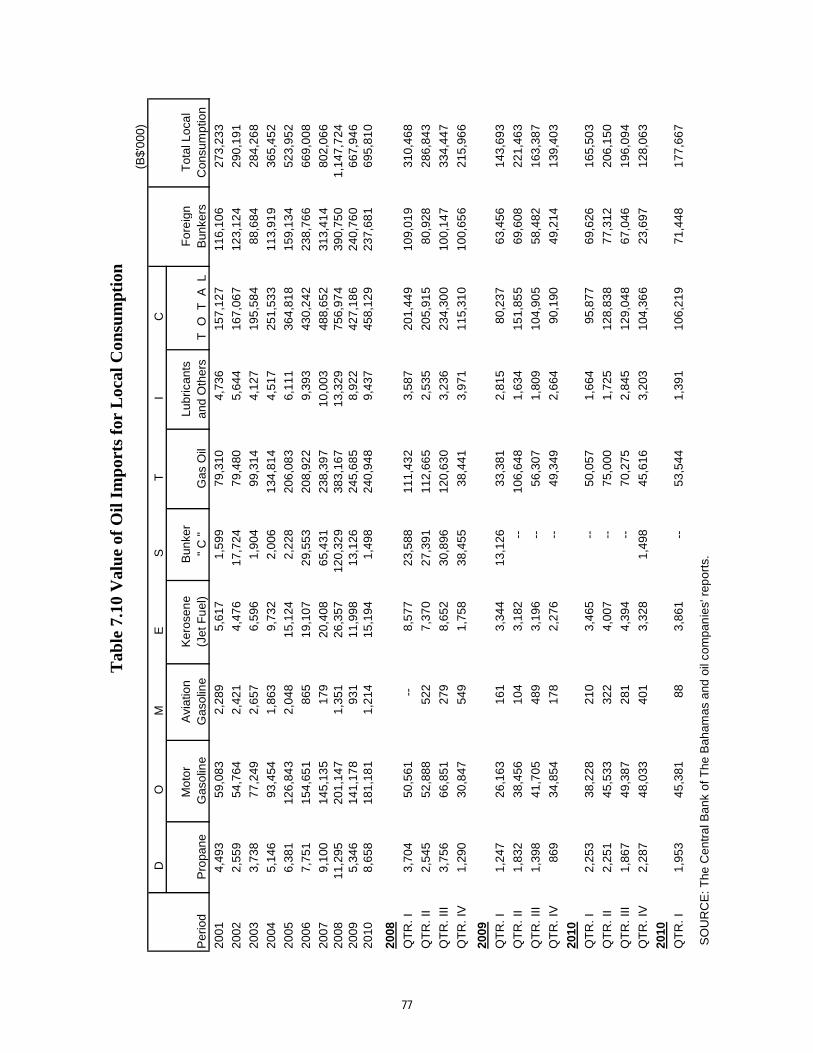
(B$'
000)
DO
ME
ST
IC
Mot
or
Avi
atio
nK
eros
ene
Bun
ker
Lubr
ican
tsF
orei
gnT
otal
Loc
al
Per
iod
Pro
pane
Gas
olin
eG
asol
ine
(Jet
Fu
el)
" C
"G
as O
ilan
d O
ther
sT
O T
A L
Bun
kers
Con
sum
ptio
n
2001
4,49
359
,083
2,28
95,
617
1,59
979
,310
4,73
615
7,12
711
6,10
627
3,23
3
2002
2,55
954
,764
2,42
14,
476
17,7
2479
,480
5,64
416
7,06
712
3,12
429
0,19
1
2003
3,73
877
,249
2,65
76,
596
1,90
499
,314
4,12
719
5,58
488
,684
284,
268
2004
5,14
693
,454
1,86
39,
732
2,00
613
4,81
44,
517
251,
533
113,
919
365,
452
2005
6,38
112
6,84
32,
048
15,1
242,
228
206,
083
6,11
136
4,81
815
9,13
452
3,95
2
2006
7,75
115
4,65
186
519
,107
29,5
5320
8,92
29,
393
430,
242
238,
766
669,
008
2007
9,10
014
5,13
517
920
,408
65,4
3123
8,39
710
,003
488,
652
313,
414
802,
066
2008
11,2
9520
1,14
71,
351
26,3
5712
0,32
938
3,16
713
,329
756,
974
390,
750
1,14
7,7
2420
095,
346
141,
178
931
11,9
9813
,126
245,
685
8,92
242
7,18
624
0,76
066
7,94
620
108,
658
181,
181
1,21
415
,194
1,49
824
0,94
89,
437
458,
129
237,
681
695,
810
2008
QT
R. I
3,70
450
,561
--8,
577
23,5
8811
1,43
23,
587
201,
449
109,
019
310,
468
QT
R. I
I2,
545
52,8
8852
27,
370
27,3
9111
2,66
52,
535
205,
915
80,9
2828
6,84
3
QT
R. I
II3,
756
66,8
5127
98,
652
30,8
9612
0,63
03,
236
234,
300
100,
147
334,
447
QT
R. I
V1,
290
30,8
4754
91,
758
38,4
5538
,441
3,97
111
5,31
010
0,65
621
5,96
6
2009
QT
R. I
1,24
726
,163
161
3,34
413
,126
33,3
812,
815
80,2
3763
,456
143,
693
QT
R. I
I1,
832
38,4
5610
43,
182
--10
6,64
81,
634
151,
855
69,6
0822
1,46
3
QT
R. I
II1,
398
41,7
0548
93,
196
--56
,307
1,80
910
4,90
558
,482
163,
387
QT
R. I
V86
934
,854
178
2,27
6
--
49,3
492,
664
90,1
9049
,214
139,
403
2010
QT
R. I
2,25
338
,228
210
3,46
5
--
50,0
571,
664
95,8
7769
,626
165,
503
QT
R. I
I2,
251
45,5
3332
24,
007
--75
,000
1,72
512
8,83
877
,312
206,
150
QT
R. I
II1,
867
49,3
8728
14,
394
--70
,275
2,84
512
9,04
867
,046
196,
094
QT
R. I
V2,
287
48,0
3340
13,
328
1,49
845
,616
3,20
310
4,36
623
,697
128,
063
2010
QT
R. I
1,95
345
,381
883,
861
--53
,544
1,39
110
6,21
971
,448
177,
667
SO
UR
CE
: The
Cen
tral
Ban
k of
The
Bah
amas
and
oil
com
pan
ies'
rep
orts
.
Tab
le 7
.10
Val
ue
of O
il I
mp
orts
for
Loc
al C
onsu
mpt
ion
77
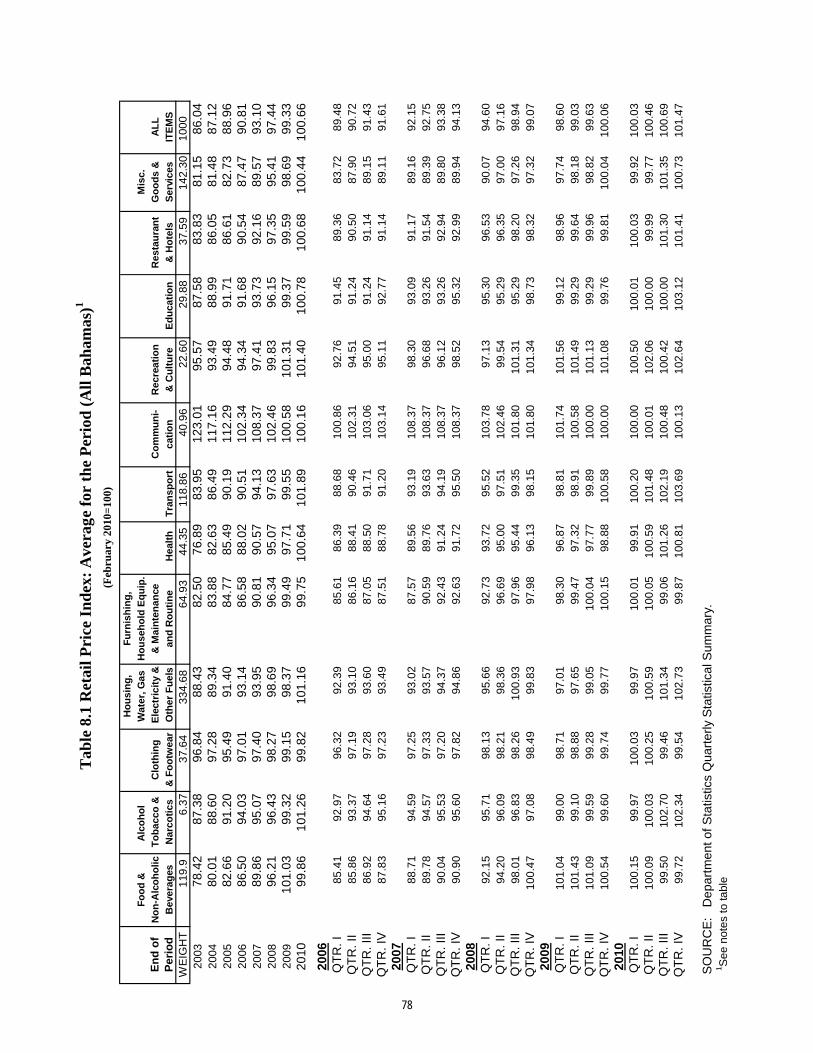
Ho
usi
ng
,F
urn
ish
ing
,
Fo
od
&A
lco
ho
l W
ater
, Gas
Ho
use
ho
ld E
qu
ip.
Mis
c.
En
d o
fN
on
-Alc
oh
olic
To
bac
co &
Clo
thin
g E
lect
rici
ty &
& M
ain
ten
ance
Co
mm
un
i-R
ecre
atio
nR
esta
ura
nt
Go
od
s &
AL
L
Per
iod
Bev
erag
esN
arco
tics
& F
oo
twea
r O
ther
Fu
els
and
Ro
uti
ne
Hea
lth
Tra
nsp
ort
cati
on
& C
ult
ure
Ed
uca
tio
n&
Ho
tels
Ser
vice
sIT
EM
S
WE
IGH
T11
9.9
6.37
37.6
433
4.68
64.9
344
.35
118.
8640
.96
22.6
029
.88
37.5
914
2.30
1000
2003
78.4
287
.38
96.8
488
.43
82.5
076
.89
83.9
512
3.01
95.5
787
.58
83.8
381
.15
86.0
420
0480
.01
88.6
097
.28
89.3
483
.88
82.6
386
.49
117.
1693
.49
88.9
986
.05
81.4
887
.12
2005
82.6
691
.20
95.4
991
.40
84.7
785
.49
90.1
911
2.29
94.4
891
.71
86.6
182
.73
88.9
620
0686
.50
94.0
397
.01
93.1
486
.58
88.0
290
.51
102.
3494
.34
91.6
890
.54
87.4
790
.81
2007
89.8
695
.07
97.4
093
.95
90.8
190
.57
94.1
310
8.37
97.4
193
.73
92.1
689
.57
93.1
020
0896
.21
96.4
398
.27
98.6
996
.34
95.0
797
.63
102.
4699
.83
96.1
597
.35
95.4
197
.44
2009
101.
0399
.32
99.1
598
.37
99.4
997
.71
99.5
510
0.58
101.
3199
.37
99.5
998
.69
99.3
320
1099
.86
101.
2699
.82
101.
1699
.75
100.
6410
1.89
100.
1610
1.40
100.
7810
0.68
100.
4410
0.66
2006
QT
R. I
85.4
192
.97
96.3
292
.39
85.6
186
.39
88.6
810
0.86
92.7
691
.45
89.3
683
.72
89.4
8Q
TR
. II
85.8
693
.37
97.1
993
.10
86.1
688
.41
90.4
610
2.31
94.5
191
.24
90.5
087
.90
90.7
2Q
TR
. III
86.9
294
.64
97.2
893
.60
87.0
588
.50
91.7
110
3.06
95.0
091
.24
91.1
489
.15
91.4
3Q
TR
. IV
87.8
395
.16
97.2
393
.49
87.5
188
.78
91.2
010
3.14
95.1
192
.77
91.1
489
.11
91.6
120
07Q
TR
. I88
.71
94.5
997
.25
93.0
287
.57
89.5
693
.19
108.
3798
.30
93.0
991
.17
89.1
692
.15
QT
R. I
I89
.78
94.5
797
.33
93.5
790
.59
89.7
693
.63
108.
3796
.68
93.2
691
.54
89.3
992
.75
QT
R. I
II90
.04
95.5
397
.20
94.3
792
.43
91.2
494
.19
108.
3796
.12
93.2
692
.94
89.8
093
.38
QT
R. I
V90
.90
95.6
097
.82
94.8
692
.63
91.7
295
.50
108.
3798
.52
95.3
292
.99
89.9
494
.13
2008
QT
R. I
92.1
595
.71
98.1
395
.66
92.7
393
.72
95.5
210
3.78
97.1
395
.30
96.5
390
.07
94.6
0Q
TR
. II
94.2
096
.09
98.2
198
.36
96.6
995
.00
97.5
110
2.46
99.5
495
.29
96.3
597
.00
97.1
6Q
TR
. III
98.0
196
.83
98.2
610
0.93
97.9
695
.44
99.3
510
1.80
101.
3195
.29
98.2
097
.26
98.9
4Q
TR
. IV
100.
4797
.08
98.4
999
.83
97.9
896
.13
98.1
510
1.80
101.
3498
.73
98.3
297
.32
99.0
720
09Q
TR
. I10
1.04
99.0
098
.71
97.0
198
.30
96.8
798
.81
101.
7410
1.56
99.1
298
.96
97.7
498
.60
QT
R. I
I10
1.43
99.1
098
.88
97.6
599
.47
97.3
298
.91
100.
5810
1.49
99.2
999
.64
98.1
899
.03
QT
R. I
II10
1.09
99.5
999
.28
99.0
510
0.04
97.7
799
.89
100.
0010
1.13
99.2
999
.96
98.8
299
.63
QT
R. I
V10
0.54
99.6
099
.74
99.7
710
0.15
98.8
810
0.58
100.
0010
1.08
99.7
699
.81
100.
0410
0.06
2010
QT
R. I
100.
1599
.97
100.
0399
.97
100.
0199
.91
100.
2010
0.00
100.
5010
0.01
100.
0399
.92
100.
03Q
TR
. II
100.
0910
0.03
100.
2510
0.59
100.
0510
0.59
101.
4810
0.01
102.
0610
0.00
99.9
999
.77
100.
46Q
TR
. III
99.5
010
2.70
99.4
610
1.34
99.0
610
1.26
102.
1910
0.48
100.
4210
0.00
101.
3010
1.35
100.
69Q
TR
. IV
99.7
210
2.34
99.5
410
2.73
99.8
710
0.81
103.
6910
0.13
102.
6410
3.12
101.
4110
0.73
101.
47
SO
UR
CE
: D
epar
tmen
t of S
tatis
tics
Qua
rter
ly S
tatis
tical
Sum
mar
y. 1
See
not
es to
tabl
e
T
able
8.1
Ret
ail P
rice
In
dex
: A
vera
ge f
or t
he
Per
iod
(A
ll B
aham
as)1
(F
ebru
ary
2010
=10
0)
78
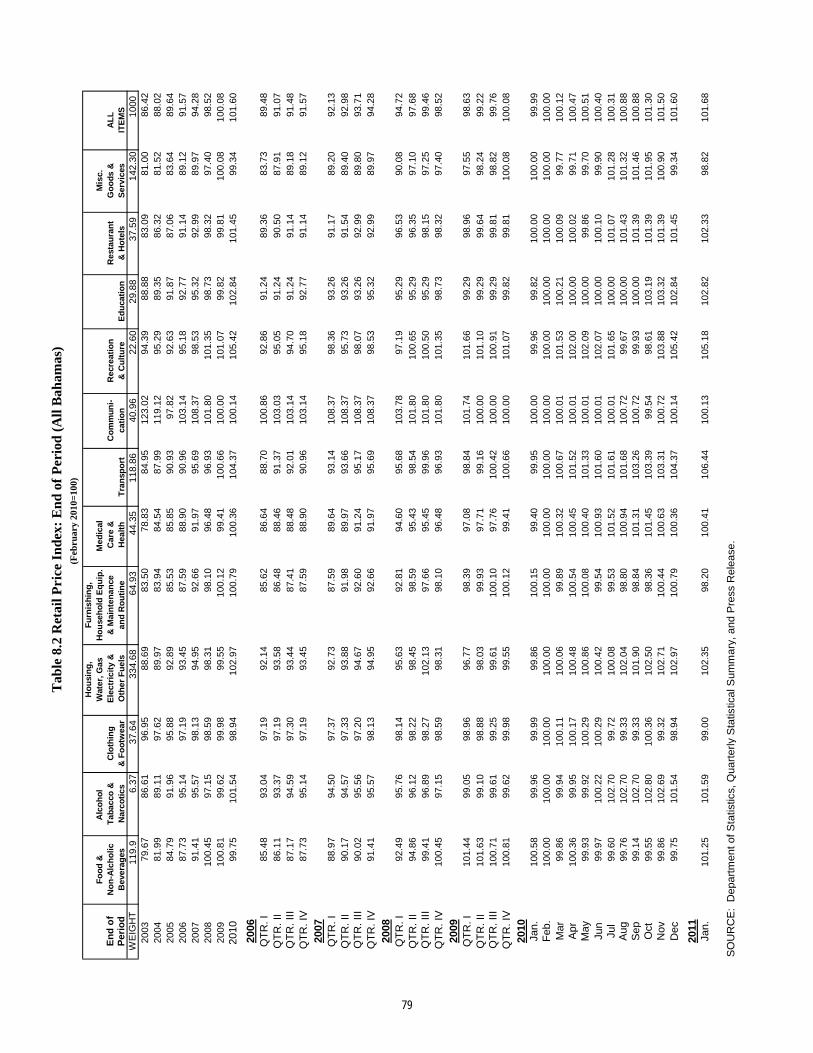
Ho
usi
ng
,F
urn
ish
ing
,F
oo
d &
Alc
oh
ol
Wat
er, G
asH
ou
seh
old
Eq
uip
.M
edic
alM
isc.
En
d o
fN
on
-Alc
ho
licT
abac
co &
Clo
thin
g E
lect
rici
ty &
& M
ain
ten
ance
Car
e &
Co
mm
un
i-R
ecre
atio
nR
esta
ura
nt
Go
od
s &
AL
LP
erio
dB
ever
ages
Nar
coti
cs&
Fo
otw
ear
Oth
er F
uel
san
d R
ou
tin
e H
ealt
hT
ran
spo
rtca
tio
n&
Cu
ltu
reE
du
cati
on
& H
ote
lsS
ervi
ces
ITE
MS
WE
IGH
T11
9.9
6.37
37.6
433
4.68
64.9
344
.35
118.
8640
.96
22.6
029
.88
37.5
914
2.30
1000
2003
79.6
786
.61
96.9
588
.69
83.5
078
.83
84.9
512
3.02
94.3
988
.88
83.0
981
.00
86.4
220
0481
.99
89.1
197
.62
89.9
783
.94
84.5
487
.99
119.
1295
.29
89.3
586
.32
81.5
288
.02
2005
84.7
991
.96
95.8
892
.89
85.5
385
.85
90.9
397
.82
92.6
391
.87
87.0
683
.64
89.6
420
0687
.73
95.1
497
.19
93.4
587
.59
88.9
090
.96
103.
1495
.18
92.7
791
.14
89.1
291
.57
2007
91.4
195
.57
98.1
394
.95
92.6
691
.97
95.6
910
8.37
98.5
395
.32
92.9
989
.97
94.2
820
0810
0.45
97.1
598
.59
98.3
198
.10
96.4
896
.93
101.
8010
1.35
98.7
398
.32
97.4
098
.52
2009
100.
8199
.62
99.9
899
.55
100.
1299
.41
100.
6610
0.00
101.
0799
.82
99.8
110
0.08
100.
0820
1099
.75
101.
5498
.94
102.
9710
0.79
100.
3610
4.37
100.
1410
5.42
102.
8410
1.45
99.3
410
1.60
2006
QT
R. I
85.4
893
.04
97.1
992
.14
85.6
286
.64
88.7
010
0.86
92.8
691
.24
89.3
683
.73
89.4
8
QT
R. I
I86
.11
93.3
797
.19
93.5
886
.48
88.4
691
.37
103.
0395
.05
91.2
490
.50
87.9
191
.07
QT
R. I
II87
.17
94.5
997
.30
93.4
487
.41
88.4
892
.01
103.
1494
.70
91.2
491
.14
89.1
891
.48
QT
R. I
V87
.73
95.1
497
.19
93.4
587
.59
88.9
090
.96
103.
1495
.18
92.7
791
.14
89.1
291
.57
2007
QT
R. I
88.9
794
.50
97.3
792
.73
87.5
989
.64
93.1
410
8.37
98.3
693
.26
91.1
789
.20
92.1
3
QT
R. I
I90
.17
94.5
797
.33
93.8
891
.98
89.9
793
.66
108.
3795
.73
93.2
691
.54
89.4
092
.98
QT
R. I
II90
.02
95.5
697
.20
94.6
792
.60
91.2
495
.17
108.
3798
.07
93.2
692
.99
89.8
093
.71
QT
R. I
V91
.41
95.5
798
.13
94.9
592
.66
91.9
795
.69
108.
3798
.53
95.3
292
.99
89.9
794
.28
2008
QT
R. I
92.4
995
.76
98.1
495
.63
92.8
194
.60
95.6
810
3.78
97.1
995
.29
96.5
390
.08
94.7
2
QT
R. I
I94
.86
96.1
298
.22
98.4
598
.59
95.4
398
.54
101.
8010
0.65
95.2
996
.35
97.1
097
.68
QT
R. I
II99
.41
96.8
998
.27
102.
1397
.66
95.4
599
.96
101.
8010
0.50
95.2
998
.15
97.2
599
.46
QT
R. I
V10
0.45
97.1
598
.59
98.3
198
.10
96.4
896
.93
101.
8010
1.35
98.7
398
.32
97.4
098
.52
2009
QT
R. I
101.
4499
.05
98.9
696
.77
98.3
997
.08
98.8
410
1.74
101.
6699
.29
98.9
697
.55
98.6
3
QT
R. I
I10
1.63
99.1
098
.88
98.0
399
.93
97.7
199
.16
100.
0010
1.10
99.2
999
.64
98.2
499
.22
QT
R. I
II10
0.71
99.6
199
.25
99.6
110
0.10
97.7
610
0.42
100.
0010
0.91
99.2
999
.81
98.8
299
.76
QT
R. I
V10
0.81
99.6
299
.98
99.5
510
0.12
99.4
110
0.66
100.
0010
1.07
99.8
299
.81
100.
0810
0.08
2010
Jan.
100.
5899
.96
99.9
999
.86
100.
1599
.40
99.9
510
0.00
99.9
699
.82
100.
0010
0.00
99.9
9F
eb.
100.
0010
0.00
100.
0010
0.00
100.
0010
0.00
100.
0010
0.00
100.
0010
0.00
100.
0010
0.00
100.
00
Mar
99.8
699
.94
100.
1110
0.06
99.8
910
0.32
100.
6710
0.01
101.
5310
0.21
100.
0999
.77
100.
12A
pr10
0.36
99.9
510
0.17
100.
4810
0.54
100.
4510
1.52
100.
0110
2.00
100.
0010
0.02
99.7
110
0.47
May
99.9
399
.92
100.
2910
0.86
100.
0810
0.40
101.
3310
0.01
102.
0910
0.00
99.8
699
.70
100.
51
Jun
99.9
710
0.22
100.
2910
0.42
99.5
410
0.93
101.
6010
0.01
102.
0710
0.00
100.
1099
.90
100.
40Ju
l99
.60
102.
7099
.72
100.
0899
.53
101.
5210
1.61
100.
0110
1.65
100.
0010
1.07
101.
2810
0.31
Aug
99.7
610
2.70
99.3
310
2.04
98.8
010
0.94
101.
6810
0.72
99.6
710
0.00
101.
4310
1.32
100.
88S
ep99
.14
102.
7099
.33
101.
9098
.84
101.
3110
3.26
100.
7299
.93
100.
0010
1.39
101.
4610
0.88
Oct
99.5
510
2.80
100.
3610
2.50
98.3
610
1.45
103.
3999
.54
98.6
110
3.19
101.
3910
1.95
101.
30N
ov99
.86
102.
6999
.32
102.
7110
0.44
100.
6310
3.31
100.
7210
3.88
103.
3210
1.39
100.
9010
1.50
Dec
99.7
510
1.54
98.9
410
2.97
100.
7910
0.36
104.
3710
0.14
105.
4210
2.84
101.
4599
.34
101.
60
2011
Jan.
101.
2510
1.59
99.0
010
2.35
98.2
010
0.41
106.
4410
0.13
105.
1810
2.82
102.
3398
.82
101.
68
SO
UR
CE
:D
epar
tmen
t of S
tatis
tics,
Qua
rter
ly S
tatis
tical
Sum
mar
y, a
nd P
ress
Rel
ease
.
T
able
8.2
Ret
ail P
rice
In
dex
: E
nd
of
Per
iod
(A
ll B
aham
as)
(F
ebru
ary
2010
=10
0)
79
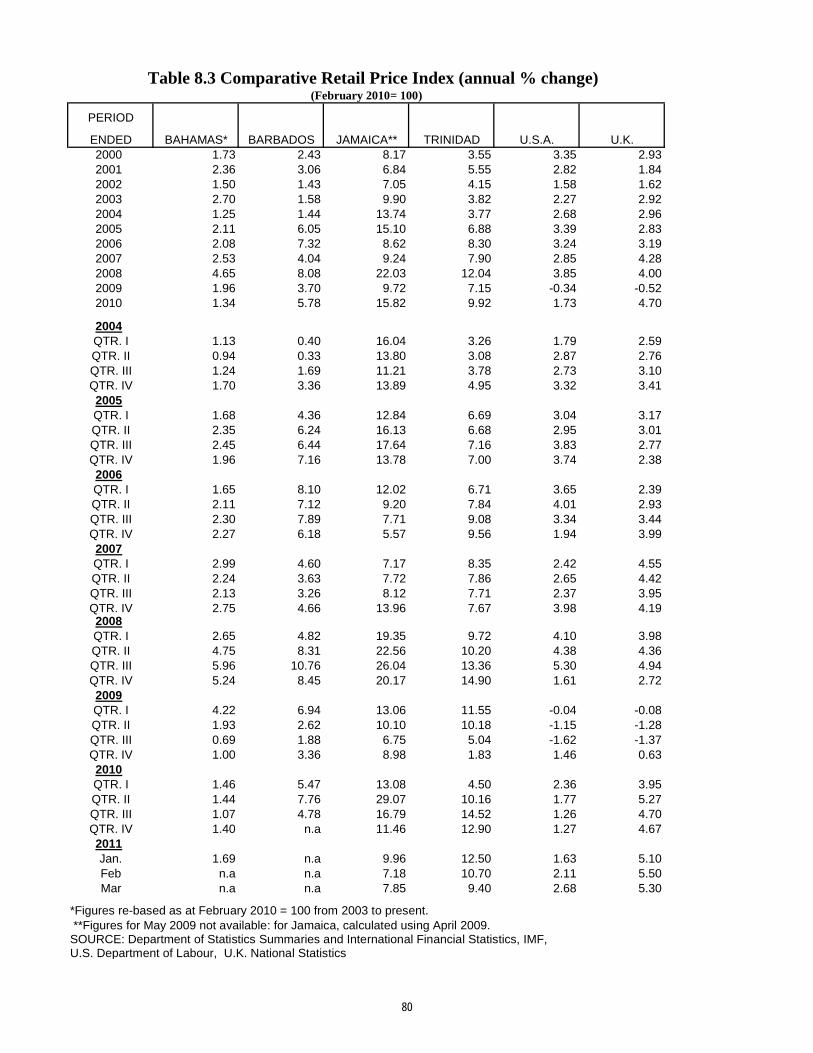
PERIOD
ENDED BAHAMAS* BARBADOS JAMAICA** TRINIDAD U.S.A. U.K.2000 1.73 2.43 8.17 3.55 3.35 2.932001 2.36 3.06 6.84 5.55 2.82 1.842002 1.50 1.43 7.05 4.15 1.58 1.622003 2.70 1.58 9.90 3.82 2.27 2.922004 1.25 1.44 13.74 3.77 2.68 2.962005 2.11 6.05 15.10 6.88 3.39 2.832006 2.08 7.32 8.62 8.30 3.24 3.192007 2.53 4.04 9.24 7.90 2.85 4.282008 4.65 8.08 22.03 12.04 3.85 4.002009 1.96 3.70 9.72 7.15 -0.34 -0.522010 1.34 5.78 15.82 9.92 1.73 4.70
2004QTR. I 1.13 0.40 16.04 3.26 1.79 2.59QTR. II 0.94 0.33 13.80 3.08 2.87 2.76QTR. III 1.24 1.69 11.21 3.78 2.73 3.10QTR. IV 1.70 3.36 13.89 4.95 3.32 3.412005QTR. I 1.68 4.36 12.84 6.69 3.04 3.17QTR. II 2.35 6.24 16.13 6.68 2.95 3.01QTR. III 2.45 6.44 17.64 7.16 3.83 2.77QTR. IV 1.96 7.16 13.78 7.00 3.74 2.382006QTR. I 1.65 8.10 12.02 6.71 3.65 2.39QTR. II 2.11 7.12 9.20 7.84 4.01 2.93QTR. III 2.30 7.89 7.71 9.08 3.34 3.44QTR. IV 2.27 6.18 5.57 9.56 1.94 3.992007QTR. I 2.99 4.60 7.17 8.35 2.42 4.55QTR. II 2.24 3.63 7.72 7.86 2.65 4.42QTR. III 2.13 3.26 8.12 7.71 2.37 3.95QTR. IV 2.75 4.66 13.96 7.67 3.98 4.192008QTR. I 2.65 4.82 19.35 9.72 4.10 3.98QTR. II 4.75 8.31 22.56 10.20 4.38 4.36QTR. III 5.96 10.76 26.04 13.36 5.30 4.94QTR. IV 5.24 8.45 20.17 14.90 1.61 2.722009QTR. I 4.22 6.94 13.06 11.55 -0.04 -0.08QTR. II 1.93 2.62 10.10 10.18 -1.15 -1.28QTR. III 0.69 1.88 6.75 5.04 -1.62 -1.37QTR. IV 1.00 3.36 8.98 1.83 1.46 0.632010QTR. I 1.46 5.47 13.08 4.50 2.36 3.95QTR. II 1.44 7.76 29.07 10.16 1.77 5.27QTR. III 1.07 4.78 16.79 14.52 1.26 4.70QTR. IV 1.40 n.a 11.46 12.90 1.27 4.672011Jan. 1.69 n.a 9.96 12.50 1.63 5.10Feb n.a n.a 7.18 10.70 2.11 5.50Mar n.a n.a 7.85 9.40 2.68 5.30
*Figures re-based as at February 2010 = 100 from 2003 to present. **Figures for May 2009 not available: for Jamaica, calculated using April 2009.
U.S. Department of Labour, U.K. National Statistics
Table 8.3 Comparative Retail Price Index (annual % change)(February 2010= 100)
SOURCE: Department of Statistics Summaries and International Financial Statistics, IMF,
80
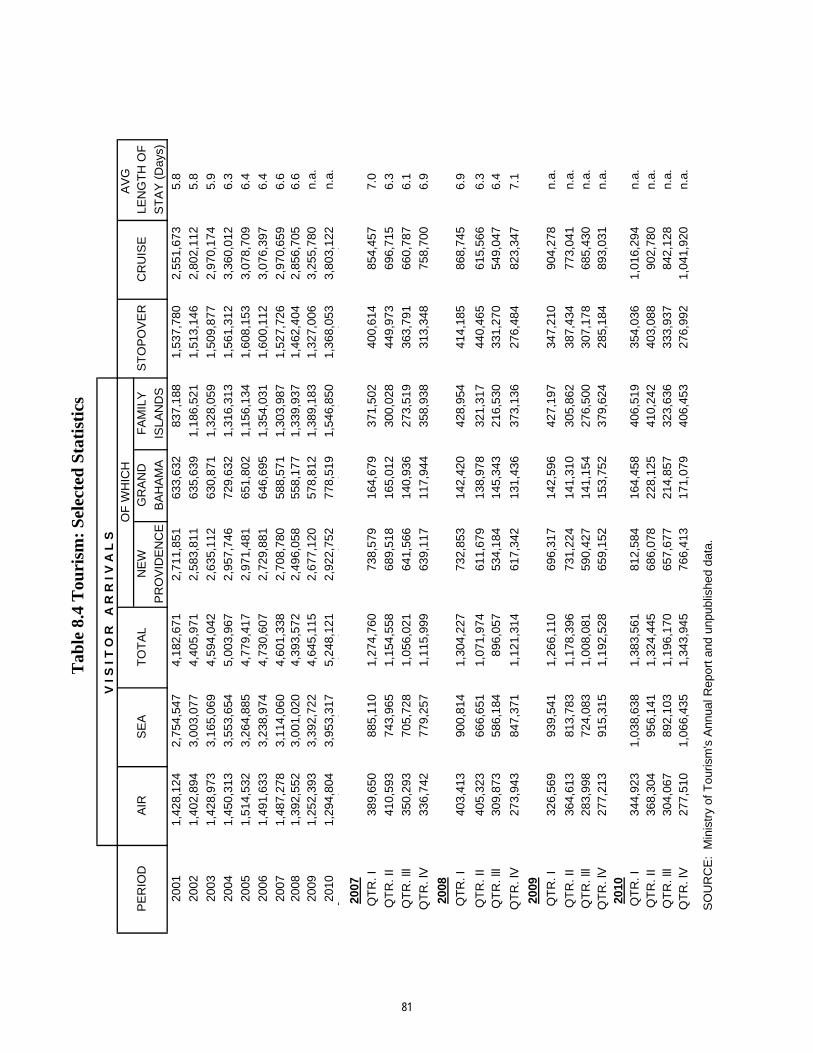
A
VG
PE
RIO
DA
IRS
EA
TO
TA
LN
EW
GR
AN
DF
AM
ILY
ST
OP
OV
ER
CR
UIS
ELE
NG
TH
OF
PR
OV
IDE
NC
EB
AH
AM
AIS
LA
ND
SS
TA
Y (
Days)
2001
1,4
28,1
24
2,7
54,5
47
4,1
82,6
71
2,7
11,8
51
633,6
32
837,1
88
1,5
37,7
80
2,5
51,6
73
5.8
2002
1,4
02,8
94
3,0
03,0
77
4,4
05,9
71
2,5
83,8
11
635,6
39
1,1
86,5
21
1,5
13,1
46
2,8
02,1
12
5.8
2003
1,4
28,9
73
3,1
65,0
69
4,5
94,0
42
2,6
35,1
12
630,8
71
1,3
28,0
59
1,5
09,8
77
2,9
70,1
74
5.9
2004
1,4
50,3
13
3,5
53,6
54
5,0
03,9
67
2,9
57,7
46
729,6
32
1,3
16,3
13
1,5
61,3
12
3,3
60,0
12
6.3
2005
1,5
14,5
32
3,2
64,8
85
4,7
79,4
17
2,9
71,4
81
651,8
02
1,1
56,1
34
1,6
08,1
53
3,0
78,7
09
6.4
2006
1,4
91,6
33
3,2
38,9
74
4,7
30,6
07
2,7
29,8
81
646,6
95
1,3
54,0
31
1,6
00,1
12
3,0
76,3
97
6.4
2007
1,4
87,2
78
3,1
14,0
60
4,6
01,3
38
2,7
08,7
80
588,5
71
1,3
03,9
87
1,5
27,7
26
2,9
70,6
59
6.6
2008
1,3
92,5
52
3,0
01,0
20
4,3
93,5
72
2,4
96,0
58
558,1
77
1,3
39,9
37
1,4
62,4
04
2,8
56,7
05
6.6
2009
1,2
52,3
93
3,3
92,7
22
4,6
45,1
15
2,6
77,1
20
578,8
12
1,3
89,1
83
1,3
27,0
06
3,2
55,7
80
n.a
.
2010
1,2
94,8
04
3,9
53,3
17
5,2
48,1
21
2,9
22,7
52
778,5
19
1,5
46,8
50
1,3
68,0
53
3,8
03,1
22
n.a
.Q
TR
. lV
297,4
71
800,5
06
1,0
97,9
77
595,2
08
149,5
56
353,2
13
323,0
50
776,7
72
6.7
2007
QT
R.
I389,6
50
885,1
10
1,2
74,7
60
738,5
79
164,6
79
371,5
02
400,6
14
854,4
57
7.0
QT
R.
II410,5
93
743,9
65
1,1
54,5
58
689,5
18
165,0
12
300,0
28
449,9
73
696,7
15
6.3
QT
R.
lll350,2
93
705,7
28
1,0
56,0
21
641,5
66
140,9
36
273,5
19
363,7
91
660,7
87
6.1
QT
R.
lV336,7
42
779,2
57
1,1
15,9
99
639,1
17
117,9
44
358,9
38
313,3
48
758,7
00
6.9
2008
QT
R.
I403,4
13
900,8
14
1,3
04,2
27
732,8
53
142,4
20
428,9
54
414,1
85
868,7
45
6.9
QT
R.
II405,3
23
666,6
51
1,0
71,9
74
611,6
79
138,9
78
321,3
17
440,4
65
615,5
66
6.3
QT
R.
lll309,8
73
586,1
84
896,0
57
534,1
84
145,3
43
216,5
30
331,2
70
549,0
47
6.4
QT
R.
lV273,9
43
847,3
71
1,1
21,3
14
617,3
42
131,4
36
373,1
36
276,4
84
823,3
47
7.1
2009
QT
R.
I326,5
69
939,5
41
1,2
66,1
10
696,3
17
142,5
96
427,1
97
347,2
10
904,2
78
n.a
.
QT
R.
II364,6
13
813,7
83
1,1
78,3
96
731,2
24
141,3
10
305,8
62
387,4
34
773,0
41
n.a
.
QT
R.
lll283,9
98
724,0
83
1,0
08,0
81
590,4
27
141,1
54
276,5
00
307,1
78
685,4
30
n.a
.
QT
R.
lV277,2
13
915,3
15
1,1
92,5
28
659,1
52
153,7
52
379,6
24
285,1
84
893,0
31
n.a
.
2010
QT
R.
I344,9
23
1,0
38,6
38
1,3
83,5
61
812,5
84
164,4
58
406,5
19
354,0
36
1,0
16,2
94
n.a
.
QT
R.
II368,3
04
956,1
41
1,3
24,4
45
686,0
78
228,1
25
410,2
42
403,0
88
902,7
80
n.a
.
QT
R.
lll304,0
67
892,1
03
1,1
96,1
70
657,6
77
214,8
57
323,6
36
333,9
37
842,1
28
n.a
.
QT
R.
lV277,5
10
1,0
66,4
35
1,3
43,9
45
766,4
13
171,0
79
406,4
53
276,9
92
1,0
41,9
20
n.a
.
S
OU
RC
E:
Min
istr
y o
f T
ourism
's A
nnual R
eport
and u
npublis
hed d
ata
.
Ta
ble
8.4
To
uris
m:
Sele
cte
d S
tati
sti
cs
V I
S I
T O
R
A R
R I
V A
L S
OF
WH
ICH
81
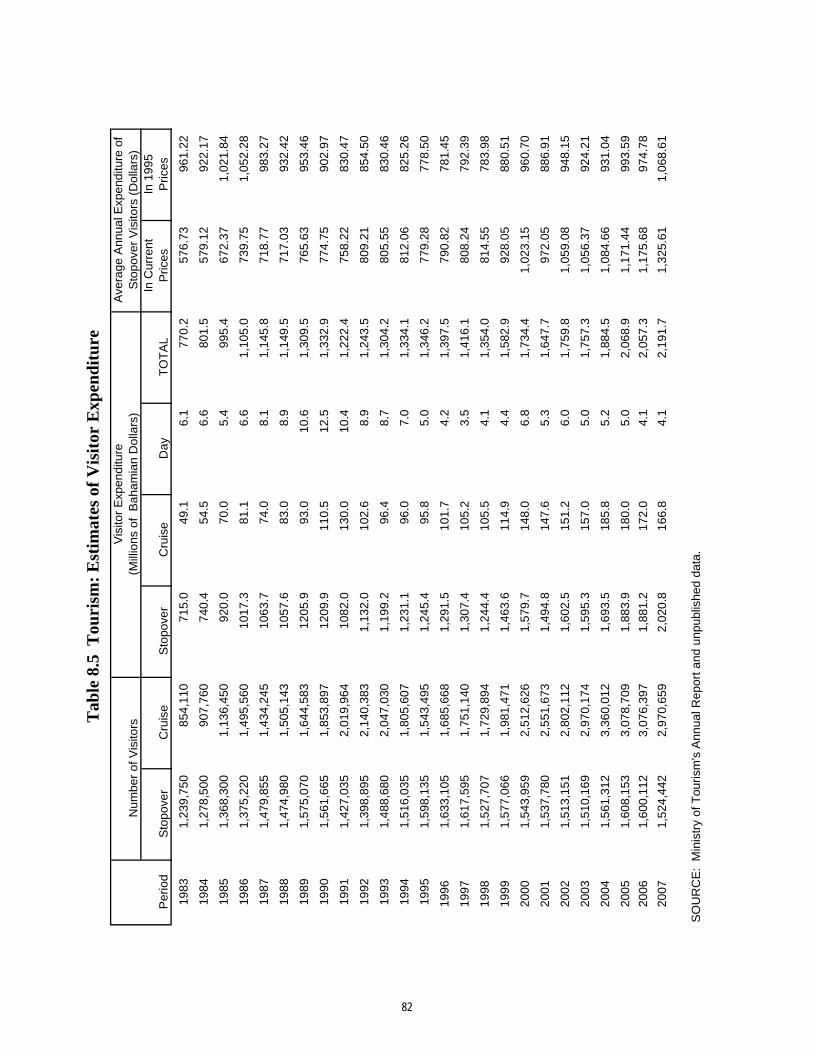
In
Curr
ent
In 1
995
Sto
pover
Cru
ise
Sto
pover
Cru
ise
Day
TO
TA
LP
rices
Prices
1983
1,2
39,7
50
854,1
10
715.0
49.1
6.1
770.2
576.7
3961.2
2
1984
1,2
78,5
00
907,7
60
740.4
54.5
6.6
801.5
579.1
2922.1
7
1985
1,3
68,3
00
1,1
36,4
50
920.0
70.0
5.4
995.4
672.3
71,0
21.8
4
1986
1,3
75,2
20
1,4
95,5
60
1017.3
81.1
6.6
1,1
05.0
739.7
51,0
52.2
8
1987
1,4
79,8
55
1,4
34,2
45
1063.7
74.0
8.1
1,1
45.8
718.7
7983.2
7
1988
1,4
74,9
80
1,5
05,1
43
1057.6
83.0
8.9
1,1
49.5
717.0
3932.4
2
1989
1,5
75,0
70
1,6
44,5
83
1205.9
93.0
10.6
1,3
09.5
765.6
3953.4
6
1990
1,5
61,6
65
1,8
53,8
97
1209.9
110.5
12.5
1,3
32.9
774.7
5902.9
7
1991
1,4
27,0
35
2,0
19,9
64
1082.0
130.0
10.4
1,2
22.4
758.2
2830.4
7
1992
1,3
98,8
95
2,1
40,3
83
1,1
32.0
102.6
8.9
1,2
43.5
809.2
1854.5
0
1993
1,4
88,6
80
2,0
47,0
30
1,1
99.2
96.4
8.7
1,3
04.2
805.5
5830.4
6
1994
1,5
16,0
35
1,8
05,6
07
1,2
31.1
96.0
7.0
1,3
34.1
812.0
6825.2
6
1995
1,5
98,1
35
1,5
43,4
95
1,2
45.4
95.8
5.0
1,3
46.2
779.2
8778.5
0
1996
1,6
33,1
05
1,6
85,6
68
1,2
91.5
101.7
4.2
1,3
97.5
790.8
2781.4
5
1997
1,6
17,5
95
1,7
51,1
40
1,3
07.4
105.2
3.5
1,4
16.1
808.2
4792.3
9
1998
1,5
27,7
07
1,7
29,8
94
1,2
44.4
105.5
4.1
1,3
54.0
814.5
5783.9
8
1999
1,5
77,0
66
1,9
81,4
71
1,4
63.6
114.9
4.4
1,5
82.9
928.0
5880.5
1
2000
1,5
43,9
59
2,5
12,6
26
1,5
79.7
148.0
6.8
1,7
34.4
1,0
23.1
5960.7
0
2001
1,5
37,7
80
2,5
51,6
73
1,4
94.8
147.6
5.3
1,6
47.7
972.0
5886.9
1
2002
1,5
13,1
51
2,8
02,1
12
1,6
02.5
151.2
6.0
1,7
59.8
1,0
59.0
8948.1
5
2003
1,5
10,1
69
2,9
70,1
74
1,5
95.3
157.0
5.0
1,7
57.3
1,0
56.3
7924.2
1
2004
1,5
61,3
12
3,3
60,0
12
1,6
93.5
185.8
5.2
1,8
84.5
1,0
84.6
6931.0
4
2005
1,6
08,1
53
3,0
78,7
09
1,8
83.9
180.0
5.0
2,0
68.9
1,1
71.4
4993.5
9
2006
1,6
00,1
12
3,0
76,3
97
1,8
81.2
172.0
4.1
2,0
57.3
1,1
75.6
8974.7
8
2007
1,5
24,4
42
2,9
70,6
59
2,0
20.8
166.8
4.1
2,1
91.7
1,3
25.6
11,0
68.6
1
SO
UR
CE
: M
inis
try o
f T
ourism
's A
nnual R
eport
and u
npublis
hed d
ata
.
Ta
ble
8.5
T
ou
rism
: E
stim
ate
s o
f V
isit
or
Ex
pen
dit
ure
Avera
ge A
nnual E
xpenditure
of
Sto
pover
Vis
itors
(D
olla
rs)
Period
Vis
itor
Expenditure
(Mill
ions o
f B
aham
ian D
olla
rs)
Num
ber
of V
isitors
82
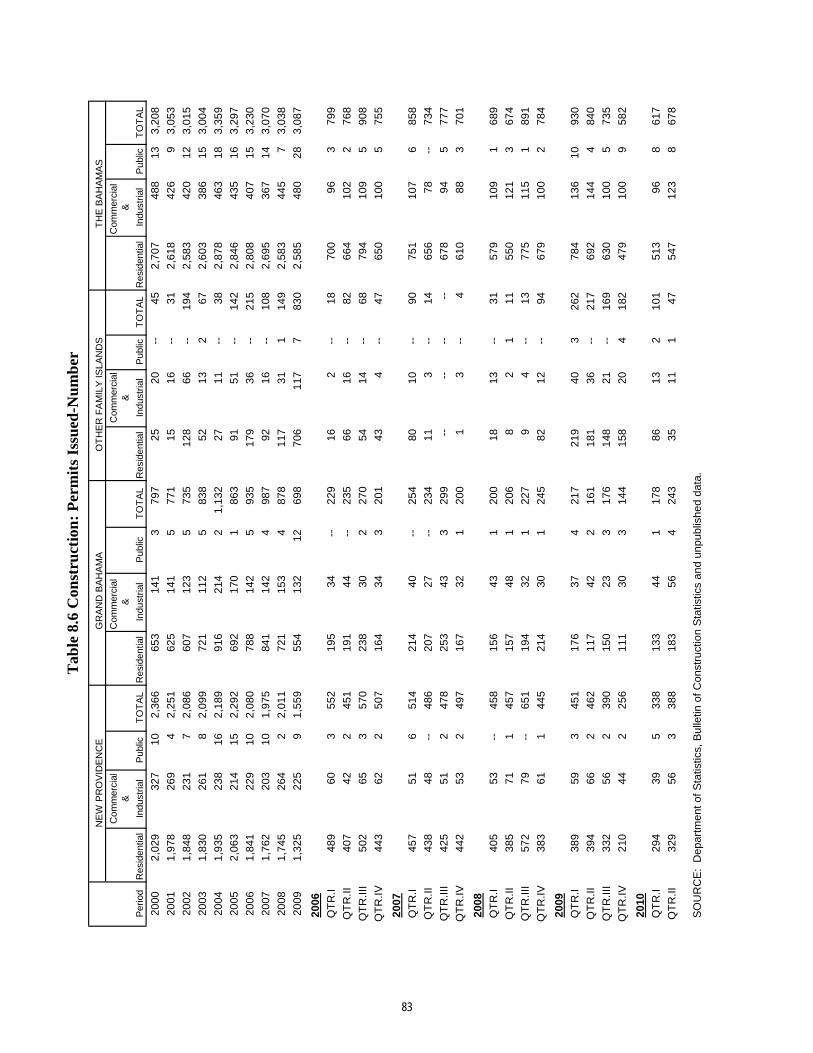
NE
W P
RO
VID
EN
CE
GR
AN
D B
AH
AM
A
OT
HE
R F
AM
ILY
IS
LA
ND
S
C
om
merc
ial
Com
merc
ial
C
om
merc
ial
C
om
merc
ial
&
&
&
&
Period
Resid
ential
Industr
ial
Public
TO
TA
LR
esid
ential
Industr
ial
Public
TO
TA
LR
esid
ential
Industr
ial
Public
TO
TA
LR
esid
ential
Industr
ial
Public
TO
TA
L
20
00
2,0
29
32
71
02
,36
66
53
14
13
79
72
52
0--
45
2,7
07
48
81
33
,20
8
20
01
1,9
78
26
94
2,2
51
62
51
41
57
71
15
16
--3
12
,61
84
26
93
,05
3
20
02
1,8
48
23
17
2,0
86
60
71
23
57
35
12
86
6--
19
42
,58
34
20
12
3,0
15
20
03
1,8
30
26
18
2,0
99
72
11
12
58
38
52
13
26
72
,60
33
86
15
3,0
04
20
04
1,9
35
23
81
62
,18
99
16
21
42
1,1
32
27
11
--3
82
,87
84
63
18
3,3
59
20
05
2,0
63
21
41
52
,29
26
92
17
01
86
39
15
1--
14
22
,84
64
35
16
3,2
97
20
06
1,8
41
22
91
02
,08
07
88
14
25
93
51
79
36
--2
15
2,8
08
40
71
53
,23
0
20
07
1,7
62
20
31
01
,97
58
41
14
24
98
79
21
6--
10
82
,69
53
67
14
3,0
70
20
08
1,7
45
26
42
2,0
11
72
11
53
48
78
11
73
11
14
92
,58
34
45
73
,03
8
20
09
1,3
25
22
59
1,5
59
55
41
32
12
69
87
06
11
77
83
02
,58
54
80
28
3,0
87
20
06
QT
R.I
48
96
03
55
21
95
34
--2
29
16
2--
18
70
09
63
79
9
QT
R.I
I4
07
42
24
51
19
14
4--
23
56
61
6--
82
66
41
02
27
68
QT
R.I
II5
02
65
35
70
23
83
02
27
05
41
4--
68
79
41
09
59
08
QT
R.I
V4
43
62
25
07
16
43
43
20
14
34
--4
76
50
10
05
75
5
20
07
QT
R.I
45
75
16
51
42
14
40
--2
54
80
10
--9
07
51
10
76
85
8
QT
R.I
I4
38
48
--4
86
20
72
7--
23
41
13
--1
46
56
78
--7
34
QT
R.I
II4
25
51
24
78
25
34
33
29
9--
----
--6
78
94
57
77
QT
R.I
V4
42
53
24
97
16
73
21
20
01
3--
46
10
88
37
01
20
08
QT
R.I
40
55
3--
45
81
56
43
12
00
18
13
--3
15
79
10
91
68
9
QT
R.I
I3
85
71
14
57
15
74
81
20
68
21
11
55
01
21
36
74
QT
R.I
II5
72
79
--6
51
19
43
21
22
79
4--
13
77
51
15
18
91
QT
R.I
V3
83
61
14
45
21
43
01
24
58
21
2--
94
67
91
00
27
84
20
09
QT
R.I
38
95
93
45
11
76
37
42
17
21
94
03
26
27
84
13
61
09
30
QT
R.I
I3
94
66
24
62
11
74
22
16
11
81
36
--2
17
69
21
44
48
40
QT
R.I
II3
32
56
23
90
15
02
33
17
61
48
21
--1
69
63
01
00
57
35
QT
R.I
V2
10
44
22
56
11
13
03
14
41
58
20
41
82
47
91
00
95
82
20
10
QT
R.I
29
43
95
33
81
33
44
11
78
86
13
21
01
51
39
68
61
7
QT
R.I
I3
29
56
33
88
18
35
64
24
33
51
11
47
54
71
23
86
78
S
OU
RC
E:
De
pa
rtm
en
t o
f S
tatistics,
Bu
lletin
of
Co
nstr
uctio
n S
tatistics a
nd
un
pu
blis
he
d d
ata
.
Tab
le 8
.6 C
on
str
ucti
on
: P
erm
its I
ssu
ed
-Nu
mb
er
TH
E B
AH
AM
AS
83
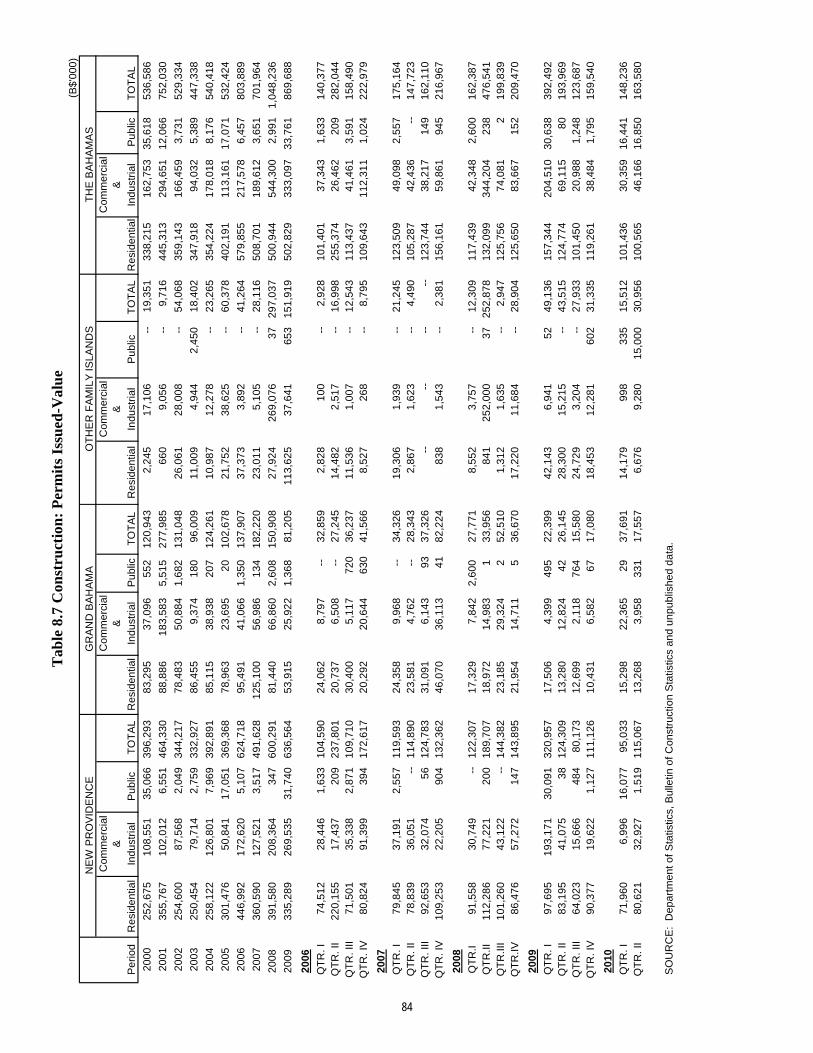
(B$
'00
0)
NE
W P
RO
VID
EN
CE
GR
AN
D B
AH
AM
AO
TH
ER
FA
MIL
Y IS
LA
ND
ST
HE
BA
HA
MA
S
C
om
me
rcia
l
C
om
me
rcia
l
C
om
me
rcia
l
C
om
me
rcia
l
&
&
&
&
Pe
rio
dR
esid
en
tia
lIn
du
str
ial
Pu
blic
TO
TA
LR
esid
en
tia
lIn
du
str
ial
Pu
blic
TO
TA
LR
esid
en
tia
lIn
du
str
ial
Pu
blic
TO
TA
LR
esid
en
tia
lIn
du
str
ial
Pu
blic
TO
TA
L
20
00
25
2,6
75
10
8,5
51
35
,06
63
96
,29
38
3,2
95
37
,09
65
52
12
0,9
43
2,2
45
17
,10
6--
1
9,3
51
33
8,2
15
16
2,7
53
35
,61
85
36
,58
6
20
01
35
5,7
67
10
2,0
12
6,5
51
46
4,3
30
88
,88
61
83
,58
35
,51
52
77
,98
56
60
9,0
56
--
9,7
16
44
5,3
13
29
4,6
51
12
,06
67
52
,03
0
20
02
25
4,6
00
87
,56
82
,04
93
44
,21
77
8,4
83
50
,88
41
,68
21
31
,04
82
6,0
61
28
,00
8--
5
4,0
68
35
9,1
43
16
6,4
59
3,7
31
52
9,3
34
20
03
25
0,4
54
79
,71
42
,75
93
32
,92
78
6,4
55
9,3
74
18
09
6,0
09
11
,00
94
,94
42
,45
01
8,4
02
34
7,9
18
94
,03
25
,38
94
47
,33
8
20
04
25
8,1
22
12
6,8
01
7,9
69
39
2,8
91
85
,11
53
8,9
38
20
71
24
,26
11
0,9
87
12
,27
8--
2
3,2
65
35
4,2
24
17
8,0
18
8,1
76
54
0,4
18
20
05
30
1,4
76
50
,84
11
7,0
51
36
9,3
68
78
,96
32
3,6
95
20
10
2,6
78
21
,75
23
8,6
25
--
60
,37
84
02
,19
11
13
,16
11
7,0
71
53
2,4
24
20
06
44
6,9
92
17
2,6
20
5,1
07
62
4,7
18
95
,49
14
1,0
66
1,3
50
13
7,9
07
37
,37
33
,89
2--
4
1,2
64
57
9,8
55
21
7,5
78
6,4
57
80
3,8
89
20
07
36
0,5
90
12
7,5
21
3,5
17
49
1,6
28
12
5,1
00
56
,98
61
34
18
2,2
20
23
,01
15
,10
5--
2
8,1
16
50
8,7
01
18
9,6
12
3,6
51
70
1,9
64
20
08
39
1,5
80
20
8,3
64
34
76
00
,29
18
1,4
40
66
,86
02
,60
81
50
,90
82
7,9
24
26
9,0
76
37
29
7,0
37
50
0,9
44
54
4,3
00
2,9
91
1,0
48
,23
6
20
09
33
5,2
89
26
9,5
35
31
,74
06
36
,56
45
3,9
15
25
,92
21
,36
88
1,2
05
11
3,6
25
37
,64
16
53
15
1,9
19
50
2,8
29
33
3,0
97
33
,76
18
69
,68
8
20
06
QT
R. I
74
,51
22
8,4
46
1,6
33
10
4,5
90
24
,06
28
,79
7--
3
2,8
59
2,8
28
10
0--
2
,92
81
01
,40
13
7,3
43
1,6
33
14
0,3
77
QT
R. II
22
0,1
55
17
,43
72
09
23
7,8
01
20
,73
76
,50
8--
2
7,2
45
14
,48
22
,51
7--
1
6,9
98
25
5,3
74
26
,46
22
09
28
2,0
44
QT
R. III
71
,50
13
5,3
38
2,8
71
10
9,7
10
30
,40
05
,11
77
20
36
,23
71
1,5
36
1,0
07
--
12
,54
31
13
,43
74
1,4
61
3,5
91
15
8,4
90
QT
R. IV
80
,82
49
1,3
99
39
41
72
,61
72
0,2
92
20
,64
46
30
41
,56
68
,52
72
68
--
8,7
95
10
9,6
43
11
2,3
11
1,0
24
22
2,9
79
20
07
QT
R. I
79
,84
53
7,1
91
2,5
57
11
9,5
93
24
,35
89
,96
8--
3
4,3
26
19
,30
61
,93
9--
2
1,2
45
12
3,5
09
49
,09
82
,55
71
75
,16
4
QT
R. II
78
,83
93
6,0
51
--
11
4,8
90
23
,58
14
,76
2--
2
8,3
43
2,8
67
1,6
23
--
4,4
90
10
5,2
87
42
,43
6--
1
47
,72
3
QT
R. III
92
,65
33
2,0
74
56
12
4,7
83
31
,09
16
,14
39
33
7,3
26
--
--
--
--
12
3,7
44
38
,21
71
49
16
2,1
10
QT
R. IV
10
9,2
53
22
,20
59
04
13
2,3
62
46
,07
03
6,1
13
41
82
,22
48
38
1,5
43
--
2,3
81
15
6,1
61
59
,86
19
45
21
6,9
67
20
08
QT
R.I
91
,55
83
0,7
49
--
12
2,3
07
17
,32
9
7,8
42
2,6
00
2
7,7
71
8,5
52
3,7
57
--
12
,30
91
17
,43
94
2,3
48
2,6
00
16
2,3
87
QT
R.II
11
2,2
86
77
,22
12
00
18
9,7
07
18
,97
2
14
,98
3
1
33
,95
68
41
25
2,0
00
37
25
2,8
78
13
2,0
99
34
4,2
04
23
84
76
,54
1
QT
R.III
10
1,2
60
43
,12
2--
1
44
,38
22
3,1
85
29
,32
4
2
52
,51
01
,31
2
1,6
35
--
2,9
47
12
5,7
56
74
,08
12
19
9,8
39
QT
R.IV
86
,47
65
7,2
72
14
71
43
,89
52
1,9
54
14
,71
1
5
36
,67
01
7,2
20
11
,68
4
--
28
,90
41
25
,65
08
3,6
67
15
22
09
,47
0
20
09
QT
R. I
97
,69
5
19
3,1
71
30
,09
1
32
0,9
57
17
,50
6
4,3
99
49
5
22
,39
94
2,1
43
6,9
41
52
49
,13
61
57
,34
42
04
,51
03
0,6
38
39
2,4
92
QT
R. II
83
,19
5
41
,07
5
38
12
4,3
09
13
,28
0
12
,82
4
42
26
,14
52
8,3
00
15
,21
5
--
43
,51
51
24
,77
46
9,1
15
80
19
3,9
69
QT
R. III
64
,02
3
15
,66
6
48
4
80
,17
31
2,6
99
2,1
18
76
4
15
,58
02
4,7
29
3,2
04
--
27
,93
31
01
,45
02
0,9
88
1,2
48
12
3,6
87
QT
R. IV
90
,37
7
19
,62
2
1,1
27
11
1,1
26
10
,43
1
6,5
82
67
17
,08
01
8,4
53
12
,28
1
60
2
31
,33
51
19
,26
13
8,4
84
1,7
95
15
9,5
40
20
10
QT
R. I
71
,96
06
,99
61
6,0
77
95
,03
31
5,2
98
22
,36
5
29
37
,69
11
4,1
79
99
8
33
51
5,5
12
10
1,4
36
30
,35
91
6,4
41
14
8,2
36
QT
R. II
80
,62
13
2,9
27
1,5
19
11
5,0
67
13
,26
8
3,9
58
33
11
7,5
57
6,6
76
9,2
80
15
,00
03
0,9
56
10
0,5
65
46
,16
61
6,8
50
16
3,5
80
S
OU
RC
E: D
ep
art
me
nt o
f S
tatistics, B
ulle
tin
of
Co
nstr
uctio
n S
tatistics a
nd
un
pu
blis
he
d d
ata
.
Ta
ble
8.7
Co
nstr
ucti
on
: P
erm
its I
ssu
ed
-Va
lue
84
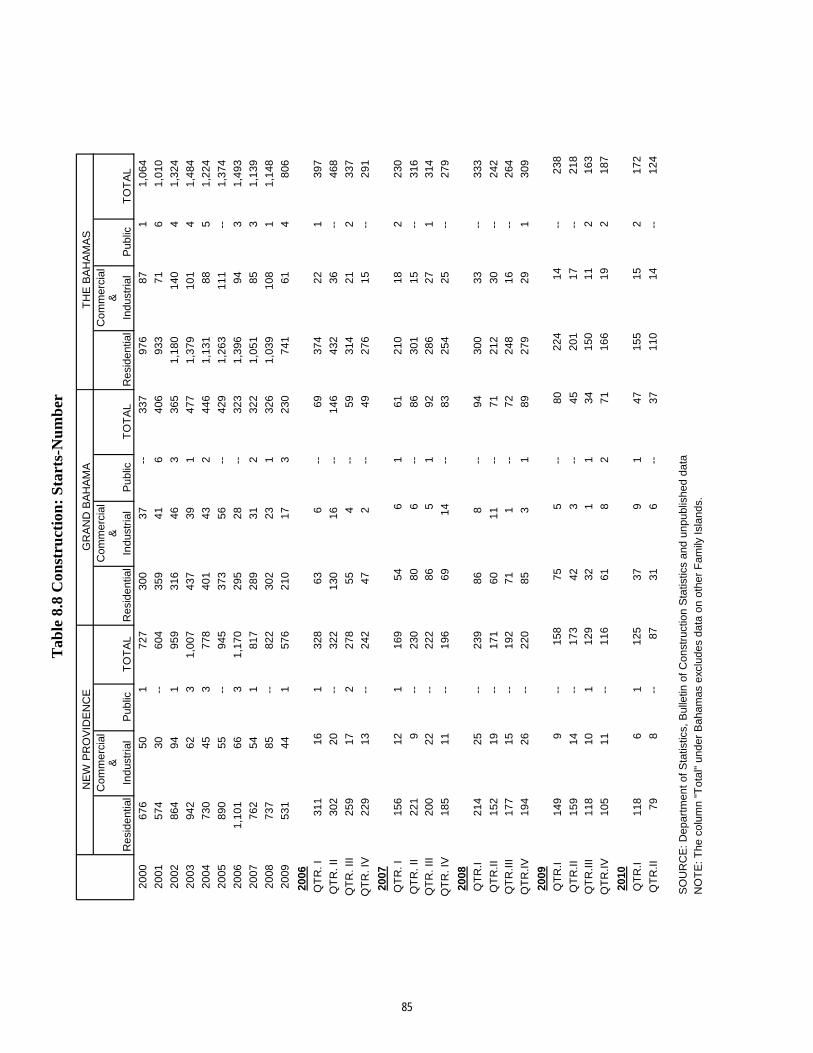
C
om
me
rcia
l
C
om
me
rcia
l
C
om
me
rcia
l
&
&
&
R
esid
en
tia
lIn
du
str
ial
Pu
blic
TO
TA
LR
esid
en
tia
lIn
du
str
ial
Pu
blic
TO
TA
LR
esid
en
tia
lIn
du
str
ial
Pu
blic
TO
TA
L
20
00
67
65
01
72
73
00
37
-
-3
37
97
68
71
1,0
64
20
01
57
43
0
--
60
43
59
41
64
06
93
37
16
1,0
10
20
02
86
49
41
95
93
16
46
33
65
1,1
80
14
04
1,3
24
20
03
94
26
23
1,0
07
43
73
91
47
71
,37
91
01
41
,48
4
20
04
73
04
53
77
84
01
43
24
46
1,1
31
88
51
,22
4
20
05
89
05
5
--
94
53
73
56
-
-4
29
1,2
63
11
1
--
1,3
74
20
06
1,1
01
66
31
,17
02
95
28
-
-3
23
1,3
96
94
31
,49
3
20
07
76
25
41
81
72
89
31
23
22
1,0
51
85
31
,13
9
20
08
73
78
5
--
82
23
02
23
13
26
1,0
39
10
81
1,1
48
20
09
53
14
41
57
62
10
17
32
30
74
16
14
80
6
20
06
QT
R.
I3
11
16
13
28
63
6
--
69
37
42
21
39
7
QT
R.
II3
02
20
-
-3
22
13
01
6
--
14
64
32
36
-
-4
68
QT
R.
III
25
91
72
27
85
54
-
-5
93
14
21
23
37
QT
R.
IV2
29
13
-
-2
42
47
2
--
49
27
61
5
--
29
1
20
07
QT
R.
I1
56
12
11
69
54
61
61
21
01
82
23
0
QT
R.
II2
21
9
--
23
08
06
-
-8
63
01
15
-
-3
16
QT
R.
III
20
02
2
--
22
28
65
19
22
86
27
13
14
QT
R.
IV1
85
11
-
-1
96
69
14
-
-8
32
54
25
-
-2
79
20
08
QT
R.I
21
42
5
--
23
98
68
--9
43
00
33
-
-3
33
QT
R.I
I1
52
19
-
-1
71
60
11
-
-7
12
12
30
-
-2
42
QT
R.I
II1
77
15
-
-1
92
71
1
--
72
24
81
6
--
26
4
QT
R.I
V1
94
26
-
-2
20
85
31
89
27
92
91
30
9
20
09
QT
R.I
14
99
-
-1
58
75
5
--
80
22
41
4
--
23
8
QT
R.I
I1
59
14
-
-1
73
42
3
--
45
20
11
7
--
21
8
QT
R.I
II1
18
10
11
29
32
11
34
15
01
12
16
3
QT
R.I
V1
05
11
-
-1
16
61
82
71
16
61
92
18
7
20
10
QT
R.I
11
86
11
25
37
91
47
15
51
52
17
2
QT
R.I
I7
98
-
-8
73
16
-
-3
71
10
14
-
-1
24
NO
TE
: T
he
co
lum
n "
To
tal"
un
de
r B
ah
am
as e
xclu
de
s d
ata
on
oth
er
Fa
mily
Isla
nd
s.
SO
UR
CE
: D
ep
art
me
nt
of
Sta
tistics,
Bu
lletin
of
Co
nstr
uctio
n S
tatistics a
nd
un
pu
blis
he
d d
ata
.
Tab
le 8
.8 C
on
str
ucti
on
: S
tarts
-Nu
mb
er
TH
E B
AH
AM
AS
GR
AN
D B
AH
AM
AN
EW
PR
OV
IDE
NC
E
85
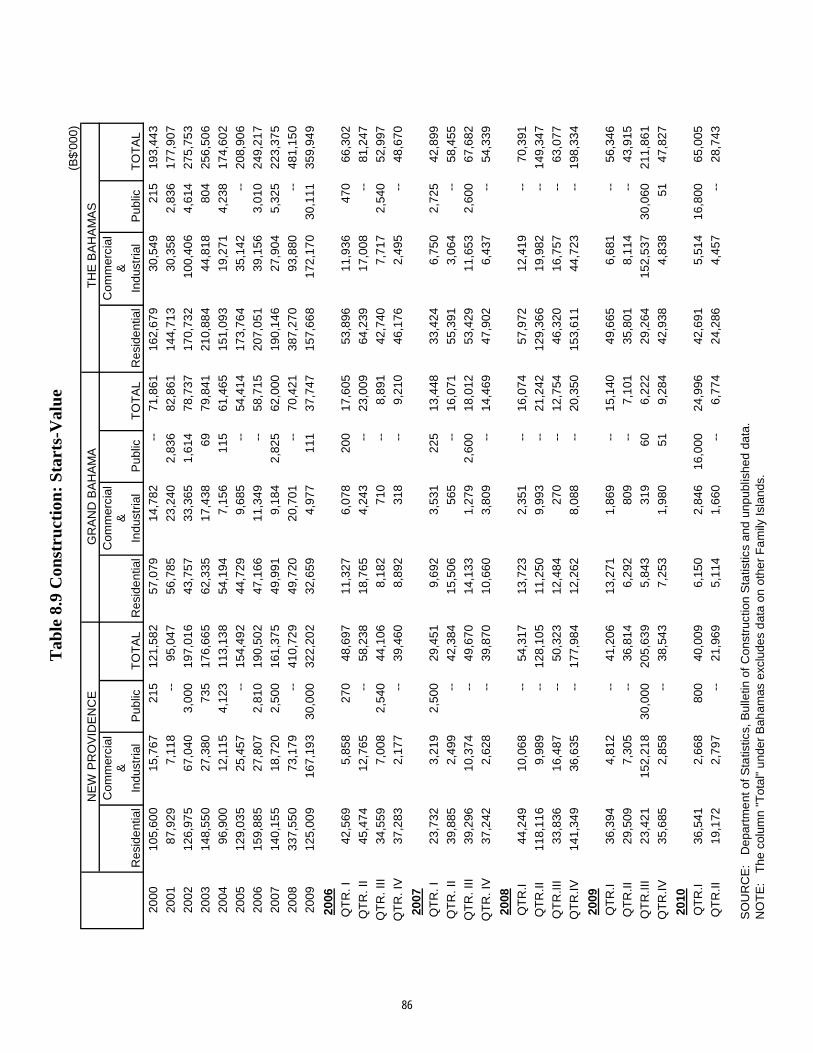
(B$'
000)
NE
W P
RO
VID
EN
CE
GR
AN
D B
AH
AM
AC
omm
erci
alC
omm
erci
alC
omm
erci
al&
&&
Res
ide
ntia
lIn
dust
rial
Pub
licT
OT
AL
Res
ide
ntia
lIn
dust
rial
Pub
licT
OT
AL
Res
ide
ntia
lIn
dust
rial
Pub
licT
OT
AL
2000
105,
600
15,7
6721
512
1,58
257
,079
14,7
82--
71,8
6116
2,67
930
,549
215
193,
443
2001
87,9
297,
118
--
95,0
4756
,785
23,2
402,
836
82,8
6114
4,71
330
,358
2,83
617
7,90
7
2002
126,
975
67,0
403,
000
197,
016
43,7
5733
,365
1,61
478
,737
170,
732
100,
406
4,61
427
5,75
3
2003
148,
550
27,3
8073
517
6,66
562
,335
17,4
3869
79,8
4121
0,88
444
,818
804
256,
506
2004
96,9
0012
,115
4,12
311
3,13
854
,194
7,15
611
561
,465
151,
093
19,2
714,
238
174,
602
2005
129,
035
25,4
57--
154,
492
44,7
299,
685
--54
,414
173,
764
35,1
42--
208,
906
2006
159,
885
27,8
072,
810
190,
502
47,1
6611
,349
--58
,715
207,
051
39,1
563,
010
249,
217
2007
140,
155
18,7
202,
500
161,
375
49,9
919,
184
2,82
562
,000
190,
146
27,9
045,
325
223,
375
2008
337,
550
73,1
79--
410,
729
49,7
2020
,701
--70
,421
387,
270
93,8
80--
481,
150
2009
125,
009
167,
193
30,0
0032
2,20
232
,659
4,97
711
137
,747
157,
668
172,
170
30,1
1135
9,94
9
2006
QT
R. I
42,5
695,
858
270
48,6
9711
,327
6,07
820
017
,605
53,8
9611
,936
470
66,3
02
QT
R. I
I45
,474
12,7
65--
58,2
3818
,765
4,24
3--
23,0
0964
,239
17,0
08--
81,2
47
QT
R. I
II34
,559
7,00
82,
540
44,1
068,
182
710
--8,
891
42,7
407,
717
2,54
052
,997
QT
R. I
V37
,283
2,17
7--
39,4
608,
892
318
--9,
210
46,1
762,
495
--48
,670
2007
QT
R. I
23,7
323,
219
2,50
029
,451
9,69
23,
531
225
13,4
4833
,424
6,75
02,
725
42,8
99
QT
R. I
I39
,885
2,49
9--
42,3
8415
,506
565
--16
,071
55,3
913,
064
--58
,455
QT
R. I
II39
,296
10,3
74--
49,6
7014
,133
1,27
92,
600
18,0
1253
,429
11,6
532,
600
67,6
82
QT
R. I
V37
,242
2,62
8--
39,8
7010
,660
3,80
9--
14,4
6947
,902
6,43
7--
54,3
39
2008
QT
R.I
44,2
4910
,068
--54
,317
13,7
232,
351
--16
,074
57,9
7212
,419
--70
,391
QT
R.II
118,
116
9,98
9--
128,
105
11,2
509,
993
--21
,242
129,
366
19,9
82--
149,
347
QT
R.II
I33
,836
16,4
87--
50,3
2312
,484
270
--12
,754
46,3
2016
,757
--63
,077
QT
R.IV
141,
349
36,6
35--
177,
984
12,2
628,
088
--20
,350
153,
611
44,7
23--
198,
334
2009
QT
R.I
36,3
944,
812
--41
,206
13,2
711,
869
--15
,140
49,6
656,
681
--56
,346
QT
R.II
29,5
097,
305
--36
,814
6,29
280
9--
7,10
135
,801
8,11
4--
43,9
15
QT
R.II
I23
,421
152,
218
30,0
0020
5,63
95,
843
319
606,
222
29,2
6415
2,53
730
,060
211,
861
QT
R.IV
35,6
852,
858
--38
,543
7,25
31,
980
519,
284
42,9
384,
838
5147
,827
2010
QT
R.I
36,5
412,
668
800
40,0
096,
150
2,84
616
,000
24,9
9642
,691
5,51
416
,800
65,0
05
QT
R.II
19,1
722,
797
--21
,969
5,11
41,
660
--6,
774
24,2
864,
457
--28
,743
SO
UR
CE
: D
epar
tme
nt o
f Sta
tistic
s, B
ulle
tin o
f C
onst
ruct
ion
Sta
tistic
s an
d un
publ
ishe
d d
ata.
NO
TE
: T
he c
olum
n "
Tot
al"
und
er B
aham
as e
xclu
des
dat
a on
oth
er F
am
ily Is
land
s.
Tab
le 8
.9 C
onst
ruct
ion
: S
tart
s-V
alu
e
TH
E B
AH
AM
AS
86
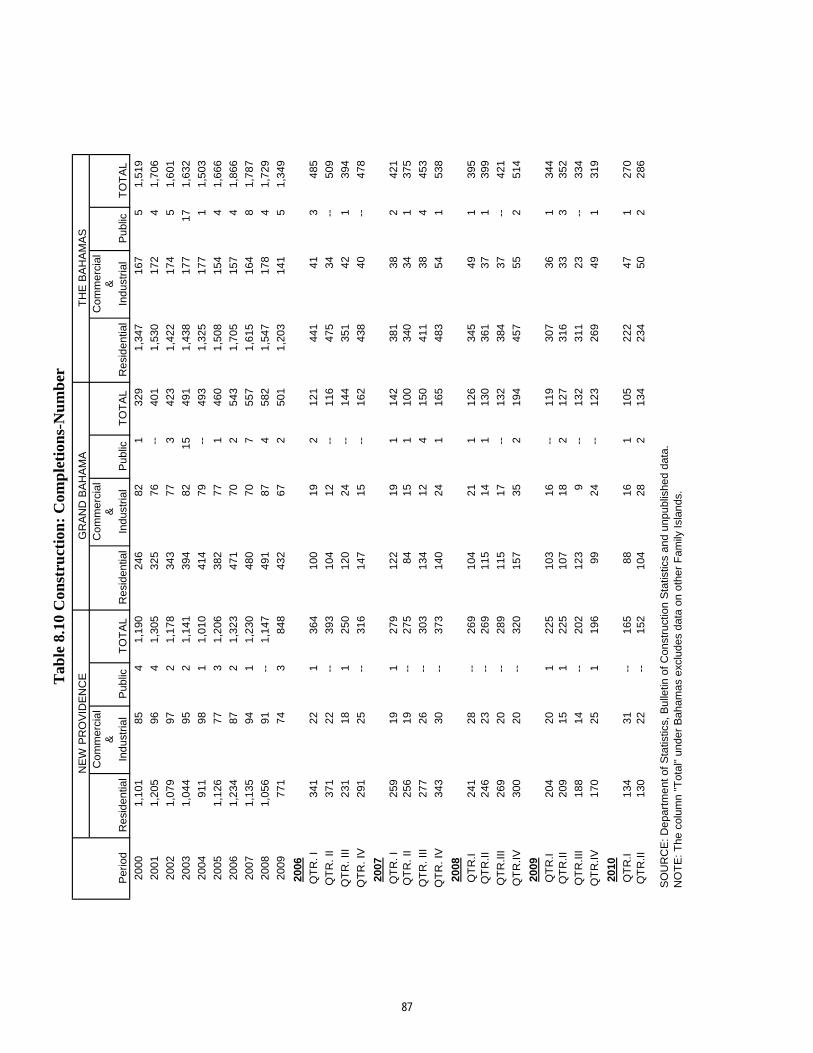
NE
W P
RO
VID
EN
CE
GR
AN
D B
AH
AM
A
C
om
me
rcia
l
C
om
me
rcia
l
Co
mm
erc
ial
&
&
&
Pe
rio
dR
esid
en
tia
lIn
du
str
ial
Pu
blic
TO
TA
LR
esid
en
tia
lIn
du
str
ial
Pu
blic
TO
TA
LR
esid
en
tia
lIn
du
str
ial
Pu
blic
TO
TA
L
20
00
1,1
01
85
41
,19
02
46
82
13
29
1,3
47
16
75
1,5
19
20
01
1,2
05
96
41
,30
53
25
76
--4
01
1,5
30
17
24
1,7
06
20
02
1,0
79
97
21
,17
83
43
77
34
23
1,4
22
17
45
1,6
01
20
03
1,0
44
95
21
,14
13
94
82
15
49
11
,43
81
77
17
1,6
32
20
04
91
19
81
1,0
10
41
47
9
--
49
31
,32
51
77
11
,50
3
20
05
1,1
26
77
31
,20
63
82
77
14
60
1,5
08
15
44
1,6
66
20
06
1,2
34
87
21
,32
34
71
70
25
43
1,7
05
15
74
1,8
66
20
07
1,1
35
94
11
,23
04
80
70
75
57
1,6
15
16
48
1,7
87
20
08
1,0
56
91
--1
,14
74
91
87
45
82
1,5
47
17
84
1,7
29
20
09
77
17
43
84
84
32
67
25
01
1,2
03
14
15
1,3
49
20
06
QT
R.
I3
41
22
13
64
10
01
92
12
14
41
41
34
85
QT
R.
II3
71
22
--3
93
10
41
2
--
11
64
75
34
--5
09
QT
R.
III
23
11
81
25
01
20
24
--1
44
35
14
21
39
4
QT
R.
IV2
91
25
--3
16
14
71
5
--
16
24
38
40
--4
78
20
07
Tab
le 8
.10 C
on
stru
ctio
n:
Com
ple
tion
s-N
um
ber
TH
E B
AH
AM
AS
20
07
QT
R.
I2
59
19
12
79
12
21
91
14
23
81
38
24
21
QT
R.
II2
56
19
--2
75
84
15
11
00
34
03
41
37
5
QT
R.
III
27
72
6
--
30
31
34
12
41
50
41
13
84
45
3
QT
R.
IV3
43
30
--3
73
14
02
41
16
54
83
54
15
38
20
08
QT
R.I
24
12
8--
26
91
04
21
11
26
34
54
91
39
5
QT
R.I
I2
46
23
--2
69
11
51
41
13
03
61
37
13
99
QT
R.I
II2
69
20
--2
89
11
51
7--
13
23
84
37
--4
21
QT
R.I
V3
00
20
--3
20
15
73
52
19
44
57
55
25
14
20
09
QT
R.I
20
42
01
22
51
03
16
--1
19
30
73
61
34
4
QT
R.I
I2
09
15
12
25
10
71
82
12
73
16
33
33
52
QT
R.I
II1
88
14
--2
02
12
39
--1
32
31
12
3
--
33
4
QT
R.I
V1
70
25
11
96
99
24
--1
23
26
94
91
31
9
20
10
QT
R.I
13
43
1--
16
58
81
61
10
52
22
47
12
70
QT
R.I
I1
30
22
--1
52
10
42
82
13
42
34
50
22
86
S
OU
RC
E:
De
pa
rtm
en
t o
f S
tatistics,
Bu
lletin
of
Co
nstr
uctio
n S
tatistics a
nd
un
pu
blis
he
d d
ata
.
N
OT
E:
Th
e c
olu
mn
"T
ota
l" u
nd
er
Ba
ha
ma
s e
xclu
de
s d
ata
on
oth
er
Fa
mily
Isla
nd
s.
87
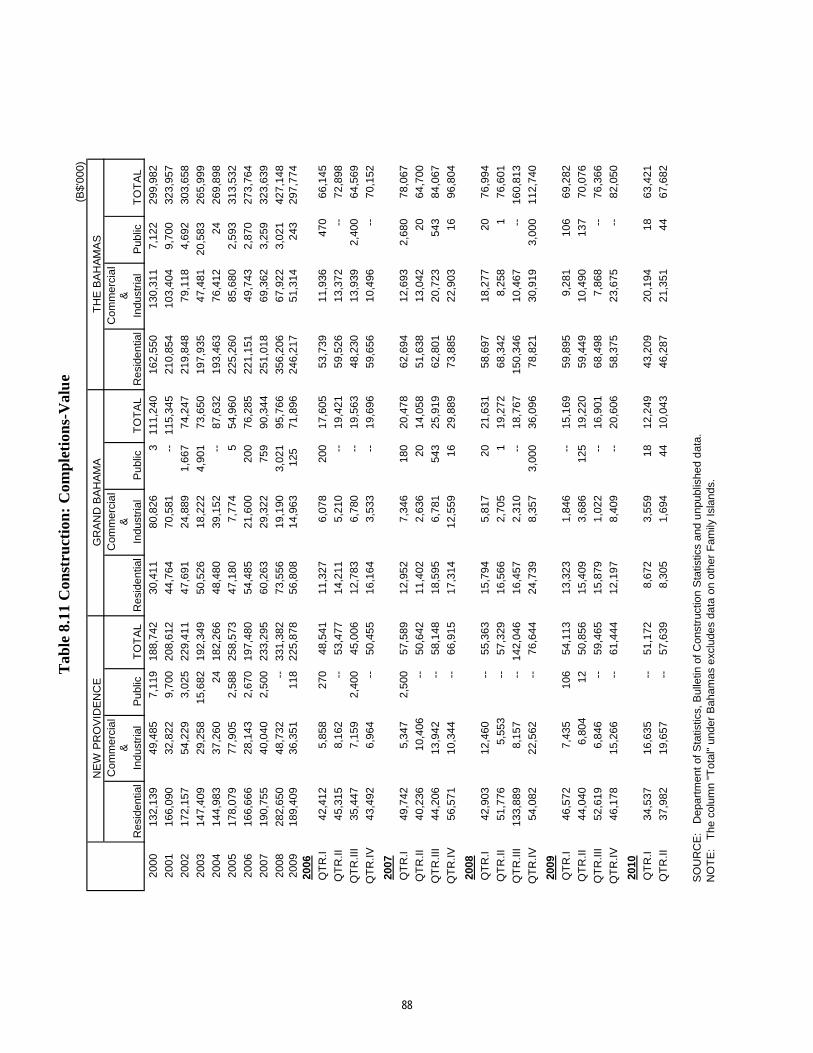
(B$'
000)
NE
W P
RO
VID
EN
CE
GR
AN
D B
AH
AM
AC
omm
erci
al
Com
mer
cia
lC
omm
erci
al
&&
&R
esid
entia
lIn
dust
rial
Pub
licT
OT
AL
Res
iden
tial
Indu
stria
lP
ublic
TO
TA
LR
esid
entia
lIn
dust
rial
Pub
licT
OT
AL
2000
132,
139
49,4
857,
119
188,
742
30,4
1180
,826
311
1,24
016
2,55
013
0,31
17,
122
299,
982
2001
166,
090
32,8
229,
700
208,
612
44,7
6470
,581
--
115,
345
210,
854
103,
404
9,70
032
3,95
7
2002
172,
157
54,2
293,
025
229,
411
47,6
9124
,889
1,66
774
,247
219,
848
79,1
184,
692
303,
658
2003
147,
409
29,2
5815
,682
192,
349
50,5
2618
,222
4,90
173
,650
197,
935
47,4
8120
,583
265,
999
2004
144,
983
37,2
6024
182,
266
48,4
8039
,152
--
87,6
3219
3,46
376
,412
2426
9,89
8
2005
178,
079
77,9
052,
588
258,
573
47,1
807,
774
554
,960
225,
260
85,6
802,
593
313,
532
2006
166,
666
28,1
432,
670
197,
480
54,4
8521
,600
200
76,2
8522
1,15
149
,743
2,87
027
3,76
4
2007
190,
755
40,0
402,
500
233,
295
60,2
6329
,322
759
90,3
4425
1,01
869
,362
3,25
932
3,63
9
2008
282,
650
48,7
32
--
331,
382
73,5
5619
,190
3,02
195
,766
356,
206
67,9
223,
021
427,
148
2009
189,
409
36,3
5111
822
5,87
856
,808
14,9
6312
571
,896
246,
217
51,3
1424
329
7,77
420
06
QT
R.I
42,4
125,
858
270
48,5
4111
,327
6,07
820
017
,605
53,7
3911
,936
470
66,1
45
QT
R.II
45,3
158,
162
--
53,4
7714
,211
5,21
0
-
-19
,421
59,5
2613
,372
--
72,8
98
QT
R.II
I35
,447
7,15
92,
400
45,0
0612
,783
6,78
0
-
-19
,563
48,2
3013
,939
2,40
064
,569
QT
R.IV
43,4
926,
964
--
50,4
5516
,164
3,53
3
-
-19
,696
59,6
5610
,496
--
70,1
52
2007
QT
R.I
49,7
425,
347
2,50
057
,589
12,9
527,
346
180
20,4
7862
,694
12,6
932,
680
78,0
67
QT
R.II
40,2
3610
,406
--50
,642
11,4
022,
636
2014
,058
51,6
3813
,042
2064
,700
QT
R.II
I44
,206
13,9
42
--
58,1
4818
,595
6,78
154
325
,919
62,8
0120
,723
543
84,0
67
QT
R.IV
56,5
7110
,344
--
66,9
1517
,314
12,5
5916
29,8
8973
,885
22,9
0316
96,8
04
2008
QT
R.I
42,9
0312
,460
--55
,363
15,7
945,
817
2021
,631
58,6
9718
,277
2076
,994
QT
R.II
51,7
765,
553
--57
,329
16,5
662,
705
119
,272
68,3
428,
258
176
,601
QT
R.II
I13
3,88
98,
157
--
142,
046
16,4
572,
310
--
18,7
6715
0,34
610
,467
--
160,
813
QT
R.IV
54,0
8222
,562
--
76,6
4424
,739
8,35
73,
000
36,0
9678
,821
30,9
193,
000
112,
740
2009
QT
R.I
46,5
727,
435
106
54,1
1313
,323
1,84
6
-
-15
,169
59,8
959,
281
106
69,2
82
QT
R.II
44,0
406,
804
1250
,856
15,4
093,
686
125
19,2
2059
,449
10,4
9013
770
,076
QT
R.II
I52
,619
6,84
6
-
-59
,465
15,8
791,
022
--
16,9
0168
,498
7,86
8
-
-76
,366
QT
R.IV
46,1
7815
,266
--
61,4
4412
,197
8,40
9
-
-20
,606
58,3
7523
,675
--
82,0
50
2010
QT
R.I
34,5
3716
,635
--51
,172
8,67
23,
559
1812
,249
43,2
0920
,194
1863
,421
QT
R.II
37,9
8219
,657
--57
,639
8,30
51,
694
4410
,043
46,2
8721
,351
4467
,682
SO
UR
CE
: D
epar
tmen
t of
Sta
tistic
s, B
ulle
tin o
f Con
stru
ctio
n S
tatis
tics
and
unp
ublis
hed
dat
a. N
OT
E:
The
col
umn
"Tot
al"
unde
r B
aham
as e
xclu
des
data
on
othe
r F
amily
Isla
nds.
Tab
le 8
.11
Con
stru
ctio
n:
Com
ple
tion
s-V
alu
e
TH
E B
AH
AM
AS
88
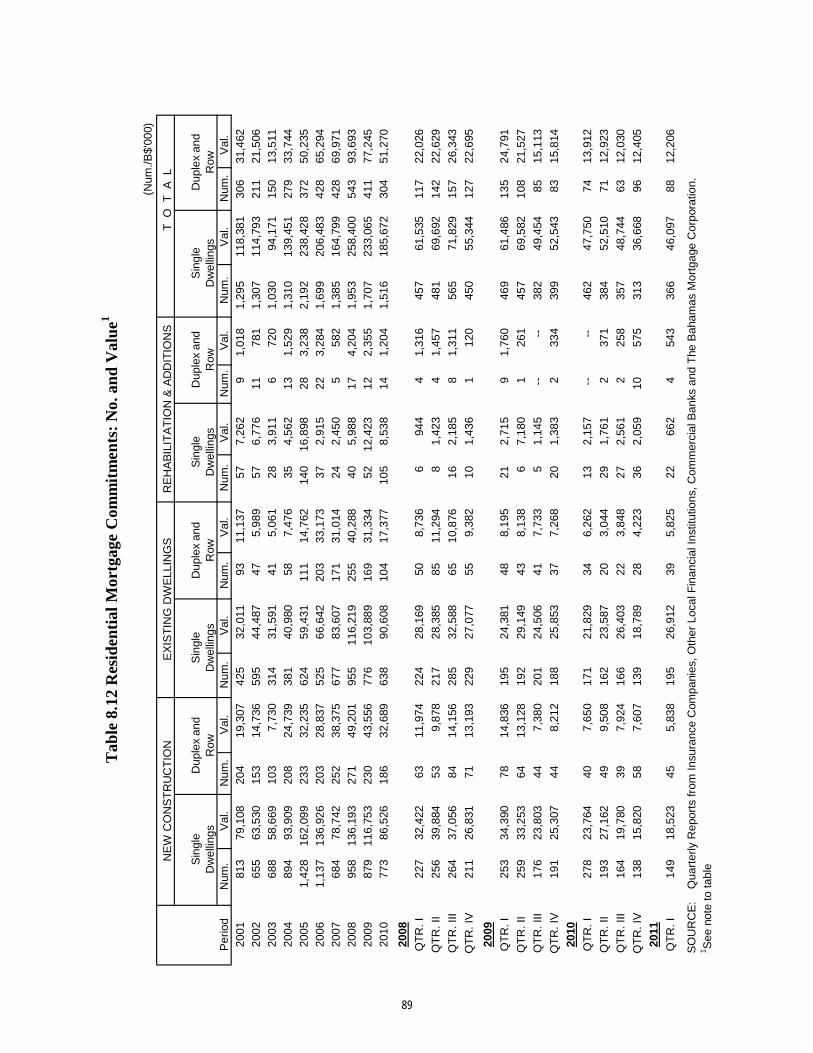
(Num
./B$'
000)
NE
W C
ON
ST
RU
CT
ION
EX
IST
ING
DW
ELL
ING
SR
EH
AB
ILIT
AT
ION
& A
DD
ITIO
NS
T
O
T A
L
Sin
gle
Dup
lex
and
Sin
gle
Dup
lex
and
Sin
gle
Dup
lex
and
Sin
gle
Dup
lex
and
Dw
ellin
gsR
owD
wel
lings
Row
Dw
ellin
gsR
owD
wel
lings
Row
Per
iod
Num
.V
al.
Num
.V
al.
Num
.V
al.
Num
.V
al.
Num
.V
al.
Num
.V
al.
Num
.V
al.
Num
.V
al.
2001
813
79,1
0820
419
,307
425
32,0
1193
11,1
3757
7,26
29
1,01
81,
295
118,
381
306
31,4
62
2002
655
63,5
3015
314
,736
595
44,4
8747
5,98
957
6,77
611
781
1,30
711
4,79
321
121
,506
2003
688
58,6
6910
37,
730
314
31,5
9141
5,06
128
3,91
16
720
1,03
094
,171
150
13,5
11
2004
894
93,9
0920
824
,739
381
40,9
8058
7,47
635
4,56
213
1,52
91,
310
139,
451
279
33,7
44
2005
1,42
816
2,09
923
332
,235
624
59,4
3111
114
,762
140
16,8
9828
3,23
82,
192
238,
428
372
50,2
35
2006
1,13
713
6,92
620
328
,837
525
66,6
4220
333
,173
372,
915
223,
284
1,69
920
6,48
342
865
,294
2007
684
78,7
4225
238
,375
677
83,6
0717
131
,014
242,
450
558
21,
385
164,
799
428
69,9
71
2008
958
136,
193
271
49,2
0195
511
6,21
925
540
,288
405,
988
174,
204
1,95
325
8,40
054
393
,693
2009
879
116,
753
230
43,5
5677
610
3,88
916
931
,334
5212
,423
122,
355
1,70
723
3,06
541
177
,245
2010
773
86,5
2618
632
,689
638
90,6
0810
417
,377
105
8,53
814
1,20
41,
516
185,
672
304
51,2
70
2008
QT
R. I
227
32,4
2263
11,9
7422
428
,169
508,
736
694
44
1,31
645
761
,535
117
22,0
26
QT
R. I
I25
639
,884
539,
878
217
28,3
8585
11,2
948
1,42
34
1,45
748
169
,692
142
22,6
29
QT
R. I
II26
437
,056
8414
,156
285
32,5
8865
10,8
7616
2,18
58
1,31
156
571
,829
157
26,3
43
QT
R. I
V21
126
,831
7113
,193
229
27,0
7755
9,38
210
1,43
61
120
450
55,3
4412
722
,695
2009
QT
R. I
253
34,3
9078
14,8
3619
524
,381
488,
195
212,
715
91,
760
469
61,4
8613
524
,791
QT
R. I
I25
933
,253
6413
,128
192
29,1
4943
8,13
86
7,18
01
261
457
69,5
8210
821
,527
QT
R. I
II17
623
,803
447,
380
201
24,5
0641
7,73
35
1,14
5
--
--
382
49,4
5485
15,1
13
QT
R. I
V19
125
,307
448,
212
188
25,8
5337
7,26
820
1,38
32
334
399
52,5
4383
15,8
14
2010
QT
R. I
278
23,7
6440
7,65
017
121
,829
346,
262
132,
157
-
-
-
-46
247
,750
7413
,912
QT
R. I
I19
327
,162
499,
508
162
23,5
8720
3,04
429
1,76
12
371
384
52,5
1071
12,9
23
QT
R. I
II16
419
,780
397,
924
166
26,4
0322
3,84
827
2,56
12
258
357
48,7
4463
12,0
30
QT
R. I
V13
815
,820
587,
607
139
18,7
8928
4,22
336
2,05
910
575
313
36,6
6896
12,4
05
2011
QT
R. I
149
18,5
2345
5,83
819
526
,912
395,
825
2266
24
543
366
46,0
9788
12,2
06
S
OU
RC
E:
Qua
rter
ly R
epor
ts fr
om In
sura
nce
Com
pani
es, O
ther
Loc
al F
inan
cial
Inst
itutio
ns, C
omm
erci
al B
anks
and
The
Bah
amas
Mor
tgag
e C
orpo
ratio
n.
1 See
not
e to
tabl
e
Tab
le 8
.12
Res
iden
tial
Mor
tgag
e C
omm
itm
ents
: N
o. a
nd
Val
ue1
89
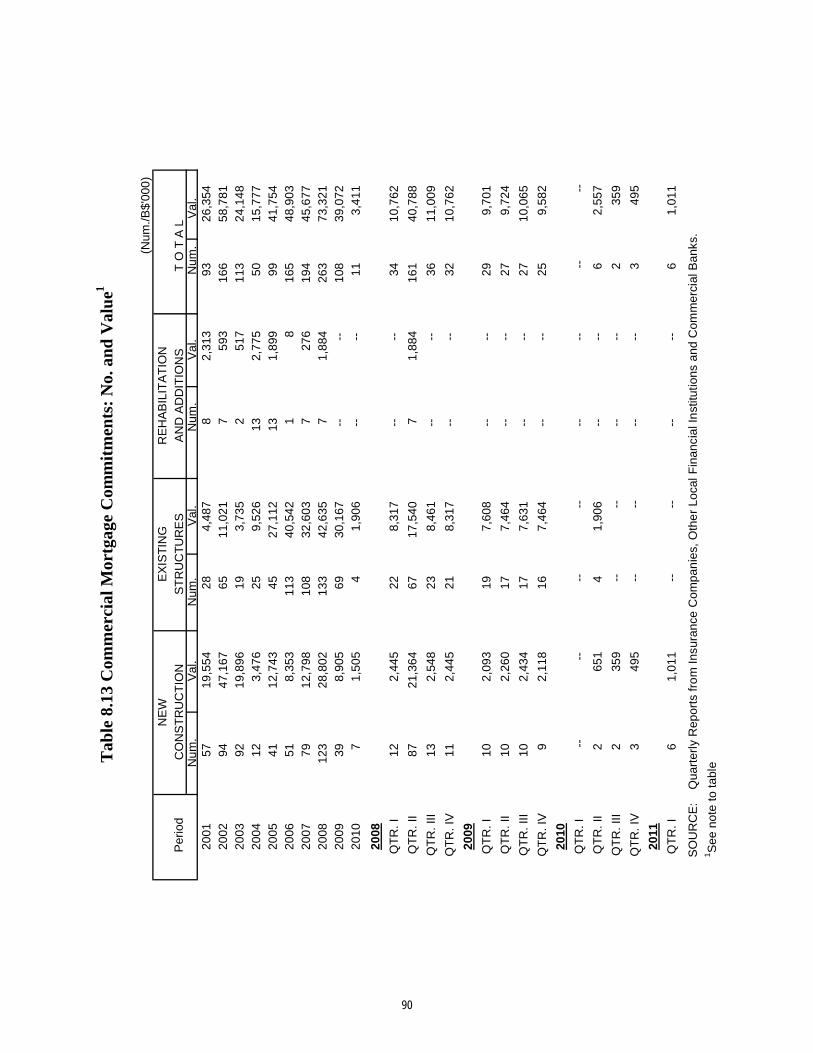
(Num
./B$'
000
)
NE
WE
XIS
TIN
GR
EH
AB
ILIT
AT
ION
Per
iod
CO
NS
TR
UC
TIO
NS
TR
UC
TU
RE
SA
ND
AD
DIT
ION
ST
O T
A L
Num
.V
al.
Num
.V
al.
N
um.
Val
.
N
um.
Val
.20
0157
19,5
5428
4,48
78
2,31
393
26,3
5420
0294
47,1
6765
11,0
217
593
166
58,7
8120
0392
19,8
9619
3,73
52
517
113
24,1
4820
0412
3,47
625
9,52
613
2,77
550
15,7
7720
0541
12,7
4345
27,1
1213
1,89
999
41,7
5420
0651
8,35
311
340
,542
18
165
48,9
0320
0779
12,7
9810
832
,603
727
619
445
,677
2008
123
28,8
0213
342
,635
71,
884
263
73,3
2120
0939
8,90
569
30,1
67
-
-
-
-10
839
,072
2010
71,
505
41,
906
--
--
113,
411
2008
QT
R. I
122,
445
228,
317
--
--
3410
,762
QT
R. I
I87
21,3
6467
17,5
407
1,88
416
140
,788
QT
R. I
II13
2,54
823
8,46
1
-
-
-
-36
11,0
09
QT
R. I
V11
2,44
521
8,31
7
-
-
-
-32
10,7
62
2009
QT
R. I
102,
093
197,
608
--
--
299,
701
QT
R. I
I10
2,26
017
7,46
4
-
-
-
-27
9,72
4
QT
R. I
II10
2,43
417
7,63
1
-
-
-
-27
10,0
65
QT
R. I
V9
2,11
816
7,46
4
-
-
-
-25
9,58
2
2010
QT
R. I
--
--
--
--
--
--
--
--
QT
R. I
I2
651
41,
906
--
--
62,
557
QT
R. I
II2
359
--
--
--
--
235
9
QT
R. I
V3
495
--
--
--
--
349
5
2011
QT
R. I
61,
011
--
--
--
--
61,
011
SO
UR
CE
: Q
uart
erly
Rep
orts
fro
m In
sura
nce
Com
pan
ies,
Oth
er
Loca
l Fin
anci
al In
stitu
tions
and
Com
mer
cial
Ban
ks.
1S
ee n
ote
to ta
bleT
able
8.1
3 C
omm
erci
al M
ortg
age
Com
mit
men
ts:
No.
an
d V
alu
e1
90
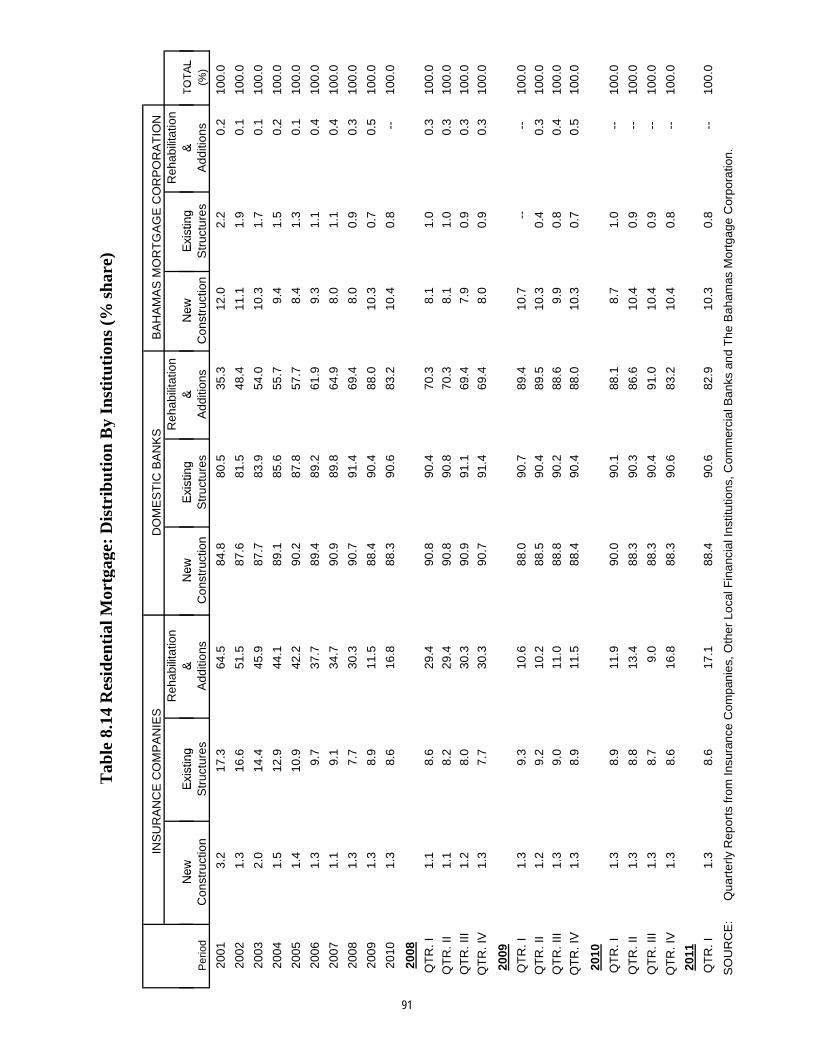
BA
HA
MA
S M
OR
TG
AG
E C
OR
PO
RA
TIO
NR
ehab
ilita
tion
Reh
abili
tatio
nR
ehab
ilita
tion
New
Exi
stin
g&
New
Exi
stin
g&
New
Exi
stin
g&
TO
TA
L
Tab
le 8
.14
Res
iden
tial
Mor
tgag
e: D
istr
ibu
tion
By
Inst
itu
tion
s (%
sh
are)
INS
UR
AN
CE
CO
MP
AN
IES
DO
ME
ST
IC B
AN
KS
New
Exi
stin
g&
New
Exi
stin
g&
New
Exi
stin
g&
TO
TA
L
Per
iod
Con
stru
ctio
nS
truc
ture
sA
dditi
ons
Con
stru
ctio
nS
truc
ture
sA
dditi
ons
Con
stru
ctio
nS
truc
ture
sA
dditi
ons
(%)
2001
3.2
17.3
64.5
84.8
80.5
35.3
12.0
2.2
0.2
100.
0
2002
1.3
16.6
51.5
87.6
81.5
48.4
11.1
1.9
0.1
100.
0
2003
2.0
14.4
45.9
87.7
83.9
54.0
10.3
1.7
0.1
100.
0
2004
1.5
12.9
44.1
89.1
85.6
55.7
9.4
1.5
0.2
100.
0
2005
1.4
10.9
42.2
90.2
87.8
57.7
8.4
1.3
0.1
100.
0
2006
1.3
9.7
37.7
89.4
89.2
61.9
9.3
1.1
0.4
100.
0
2007
1.1
9.1
34.7
90.9
89.8
64.9
8.0
1.1
0.4
100.
0
2008
1.3
7.7
30.3
90.7
91.4
69.4
8.0
0.9
0.3
100.
0
2009
1.3
8.9
11.5
88.4
90.4
88.0
10.3
0.7
0.5
100.
0
2010
1.3
8.6
16.8
88.3
90.6
83.2
10.4
0.8
--10
0.0
2008
QT
R. I
1.1
8.6
29.4
90.8
90.4
70.3
8.1
1.0
0.3
100.
0
QT
R. I
I1.
18.
229
.490
.890
.870
.38.
11.
00.
310
0.0
QT
R. I
II1.
28.
030
.390
.991
.169
.47.
90.
90.
310
0.0
QT
R. I
V1.
37.
730
.390
.791
.469
.48.
00.
90.
310
0.0
QT
R. I
V1.
37.
730
.390
.791
.469
.48.
00.
90.
310
0.0
2009
QT
R. I
1.3
9.3
10.6
88.0
90.7
89.4
10.7
--
--10
0.0
QT
R. I
I1.
29.
210
.288
.590
.489
.510
.30.
40.
310
0.0
QT
R. I
II1.
39.
011
.088
.890
.288
.69.
90.
80.
410
0.0
QT
R. I
V1.
38.
911
.588
.490
.488
.010
.30.
70.
510
0.0
QT
R. I
V1.
38.
911
.588
.490
.488
.010
.30.
70.
510
0.0
2010
QT
R. I
1.3
8.9
11.9
90.0
90.1
88.1
8.7
1.0
--10
0.0
QT
R. I
I1.
38.
813
.488
.390
.386
.610
.40.
9
--
100.
0
QT
R. I
II1.
38.
79.
088
.390
.491
.010
.40.
9
--
100.
0
QT
R. I
V1.
38.
616
.888
.390
.683
.210
.40.
8
--
100.
0 Q
TR
. IV
1.3
8.6
16.8
88.3
90.6
83.2
10.4
0.8
--10
0.0
2011
QT
R. I
1.3
8.6
17.1
88.4
90.6
82.9
10.3
0.8
--10
0.0
S
OU
RC
E:
Q
uart
erly
Rep
orts
from
Insu
ranc
e C
ompa
nies
, Oth
er L
ocal
Fin
anci
al In
stitu
tions
, Com
mer
cial
Ban
ks a
nd T
he B
aham
as M
ortg
age
Cor
pora
tion.
91
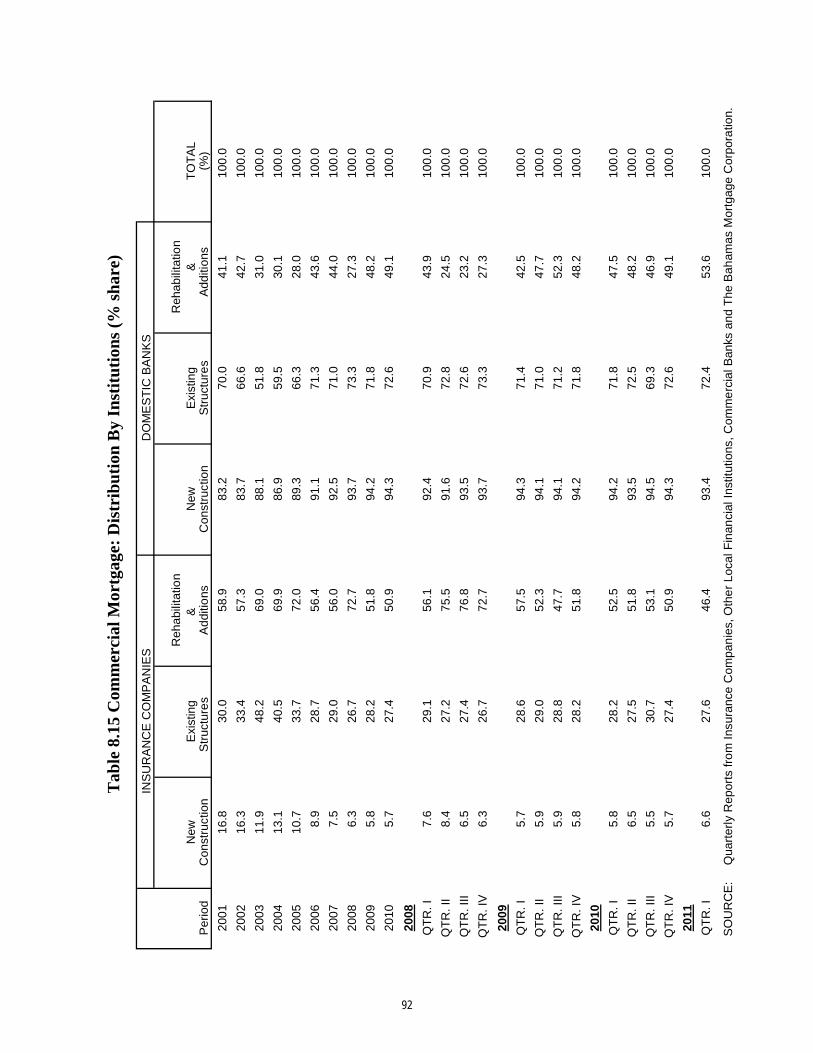
INS
UR
AN
CE
CO
MP
AN
IES
DO
ME
ST
IC B
AN
KS
Reh
abili
tatio
nR
ehab
ilita
tion
New
Exi
stin
g&
N
ewE
xist
ing
&
TO
TA
LP
erio
dC
onst
ruct
ion
Str
uctu
res
A
dditi
ons
Con
stru
ctio
nS
truc
ture
s
Add
ition
s(%
)
2001
16.8
30.0
58.9
83.2
70.0
41.1
100.
0
2002
16.3
33.4
57.3
83.7
66.6
42.7
100.
0
2003
11.9
48.2
69.0
88.1
51.8
31.0
100.
0
2004
13.1
40.5
69.9
86.9
59.5
30.1
100.
0
2005
10.7
33.7
72.0
89.3
66.3
28.0
100.
0
2006
8.9
28.7
56.4
91.1
71.3
43.6
100.
0
2007
7.5
29.0
56.0
92.5
71.0
44.0
100.
0
2008
6.3
26.7
72.7
93.7
73.3
27.3
100.
0
2009
5.8
28.2
51.8
94.2
71.8
48.2
100.
0
2010
5.7
27.4
50.9
94.3
72.6
49.1
100.
0
2008
QT
R. I
7.6
29.1
56.1
92.4
70.9
43.9
100.
0
QT
R. I
I8.
427
.275
.591
.672
.824
.510
0.0
QT
R. I
II6.
527
.476
.893
.572
.623
.210
0.0
QT
R. I
V6.
326
.772
.793
.773
.327
.310
0.0
2009
QT
R. I
5.7
28.6
57.5
94.3
71.4
42.5
100.
0
QT
R. I
I5.
929
.052
.394
.171
.047
.710
0.0
QT
R. I
II5.
928
.847
.794
.171
.252
.310
0.0
QT
R. I
V5.
828
.251
.894
.271
.848
.210
0.0
2010
QT
R. I
5.8
28.2
52.5
94.2
71.8
47.5
100.
0
QT
R. I
I6.
527
.551
.893
.572
.548
.210
0.0
QT
R. I
II5.
530
.753
.194
.569
.346
.910
0.0
QT
R. I
V5.
727
.450
.994
.372
.649
.110
0.0
2011
QT
R. I
6.6
27.6
46.4
93.4
72.4
53.6
100.
0
S
OU
RC
E:
Q
uart
erly
Rep
orts
fro
m In
sura
nce
Com
pan
ies,
Oth
er
Loca
l Fin
anci
al I
nstit
utio
ns, C
omm
erc
ial B
anks
and
The
Bah
amas
Mor
tgag
e C
orpo
ratio
n.
Tab
le 8
.15
Com
mer
cial
Mor
tgag
e: D
istr
ibu
tion
By
Inst
itu
tion
s (%
sh
are)
92
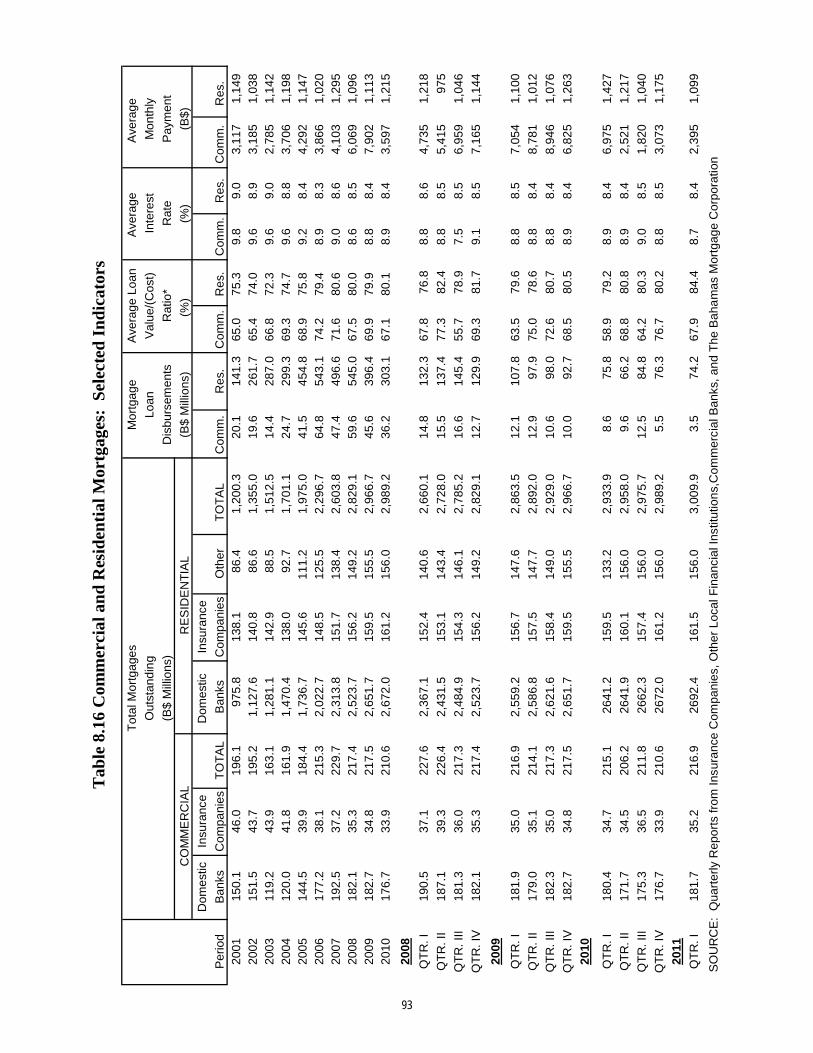
Tot
al M
ortg
ages
Mor
tgag
eA
vera
ge L
oan
Ave
rage
Out
stan
din
gLo
anV
alue
/(C
ost)
Inte
rest
(B$
Mill
ions
)D
isbu
rsem
ents
Rat
io*
Rat
e
RE
SID
EN
TIA
L(B
$ M
illio
ns)
(%)
(%)
Insu
ranc
eIn
sura
nce
Per
iod
Com
pani
esT
OT
AL
Com
pani
esT
OT
AL
Com
m.
Res
.C
omm
.R
es.
Com
m.
Res
.C
omm
.R
es.
2001
150.
146
.019
6.1
975.
813
8.1
86.4
1,20
0.3
20.1
141.
365
.075
.39.
89.
03,
117
1,14
920
0215
1.5
43.7
195.
21,
127.
614
0.8
86.6
1,35
5.0
19.6
261.
765
.474
.09.
68.
93,
185
1,03
820
0311
9.2
43.9
163.
11,
281.
114
2.9
88.5
1,51
2.5
14.4
287.
066
.872
.39.
69.
02,
785
1,14
220
0412
0.0
41.8
161.
91,
470.
413
8.0
92.7
1,70
1.1
24.7
299.
369
.374
.79.
68.
83,
706
1,19
820
0514
4.5
39.9
184.
41,
736.
714
5.6
111.
21,
975.
041
.545
4.8
68.9
75.8
9.2
8.4
4,29
21,
147
2006
177.
238
.121
5.3
2,02
2.7
148.
512
5.5
2,29
6.7
64.8
543.
174
.279
.48.
98.
33,
866
1,02
020
0719
2.5
37.2
229.
72,
313.
815
1.7
138.
42,
603.
847
.449
6.6
71.6
80.6
9.0
8.6
4,10
31,
295
2008
182.
135
.321
7.4
2,52
3.7
156.
214
9.2
2,82
9.1
59.6
545.
067
.580
.08.
68.
56,
069
1,09
620
0918
2.7
34.8
217.
52,
651.
715
9.5
155.
52,
966.
745
.639
6.4
69.9
79.9
8.8
8.4
7,90
21,
113
2010
176.
733
.921
0.6
2,67
2.0
161.
215
6.0
2,98
9.2
36.2
303.
167
.180
.18.
98.
43,
597
1,21
5
Tab
le 8
.16
Com
mer
cial
an
d R
esid
enti
al M
ortg
ages
: S
elec
ted
In
dic
ator
s
CO
MM
ER
CIA
L
Dom
estic
Ban
ks
Dom
estic
Ban
ksO
ther
Ave
rage
Mon
thly
Pay
men
t
(B$)
2010
176.
733
.921
0.6
2,67
2.0
161.
215
6.0
2,98
9.2
36.2
303.
167
.180
.18.
98.
43,
597
1,21
5
2008
QT
R. I
190.
537
.122
7.6
2,36
7.1
152.
414
0.6
2,66
0.1
14.8
132.
367
.876
.88.
88.
64,
735
1,21
8
QT
R. I
I18
7.1
39.3
226.
42,
431.
515
3.1
143.
42,
728.
015
.513
7.4
77.3
82.4
8.8
8.5
5,41
597
5
QT
R. I
II18
1.3
36.0
217.
32,
484.
915
4.3
146.
12,
785.
216
.614
5.4
55.7
78.9
7.5
8.5
6,95
91,
046
QT
R. I
V18
2.1
35.3
217.
42,
523.
715
6.2
149.
22,
829.
112
.712
9.9
69.3
81.7
9.1
8.5
7,16
51,
144
2009
QT
R. I
181.
935
.021
6.9
2,55
9.2
156.
714
7.6
2,86
3.5
12.1
107.
863
.579
.68.
88.
57,
054
1,10
0
QT
R. I
I17
9.0
35.1
214.
12,
586.
815
7.5
147.
72,
892.
012
.997
.975
.078
.68.
88.
48,
781
1,01
2
QT
R. I
II18
2.3
35.0
217.
32,
621.
615
8.4
149.
02,
929.
010
.698
.072
.680
.78.
88.
48,
946
1,07
6
QT
R. I
V18
2.7
34.8
217.
52,
651.
715
9.5
155.
52,
966.
710
.092
.768
.580
.58.
98.
46,
825
1,26
3
2010
QT
R. I
180.
434
.721
5.1
2641
.215
9.5
133.
22,
933.
98.
675
.858
.979
.28.
98.
46,
975
1,42
7
QT
R. I
I17
1.7
34.5
206.
226
41.9
160.
115
6.0
2,95
8.0
9.6
66.2
68.8
80.8
8.9
8.4
2,52
11,
217
QT
R. I
II17
5.3
36.5
211.
826
62.3
157.
415
6.0
2,97
5.7
12.5
84.8
64.2
80.3
9.0
8.5
1,82
01,
040
QT
R. I
V17
6.7
33.9
210.
626
72.0
161.
215
6.0
2,98
9.2
5.5
76.3
76.7
80.2
8.8
8.5
3,07
31,
175
2011
QT
R. I
181.
735
.221
6.9
2692
.416
1.5
156.
03,
009.
93.
574
.267
.984
.48.
78.
42,
395
1,09
9
S
OU
RC
E:
Qua
rter
ly R
epor
ts fr
om In
sura
nce
Com
pani
es, O
ther
Loc
al F
inan
cial
Inst
itutio
ns,
Com
mer
cial
Ban
ks, a
nd T
he B
aha
mas
Mor
tgag
e C
orpo
ratio
n
93
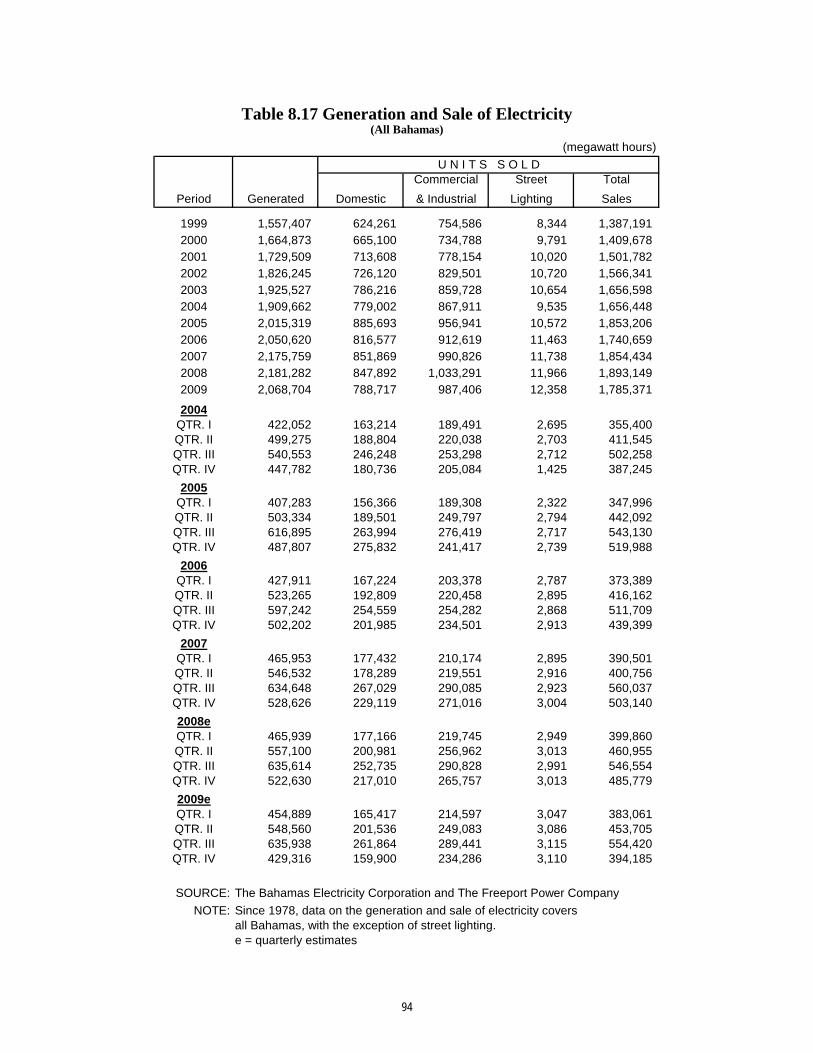
Commercial Street Total
Period Generated Domestic & Industrial Lighting Sales
1999 1,557,407 624,261 754,586 8,344 1,387,191
2000 1,664,873 665,100 734,788 9,791 1,409,678
2001 1,729,509 713,608 778,154 10,020 1,501,782
2002 1,826,245 726,120 829,501 10,720 1,566,341
2003 1,925,527 786,216 859,728 10,654 1,656,598
2004 1,909,662 779,002 867,911 9,535 1,656,448
2005 2,015,319 885,693 956,941 10,572 1,853,206
2006 2,050,620 816,577 912,619 11,463 1,740,659
2007 2,175,759 851,869 990,826 11,738 1,854,434
2008 2,181,282 847,892 1,033,291 11,966 1,893,149
2009 2,068,704 788,717 987,406 12,358 1,785,371
2004
QTR. I 422,052 163,214 189,491 2,695 355,400
QTR. II 499,275 188,804 220,038 2,703 411,545
QTR. III 540,553 246,248 253,298 2,712 502,258
QTR. IV 447,782 180,736 205,084 1,425 387,245
2005
QTR. I 407,283 156,366 189,308 2,322 347,996
QTR. II 503,334 189,501 249,797 2,794 442,092
QTR. III 616,895 263,994 276,419 2,717 543,130
QTR. IV 487,807 275,832 241,417 2,739 519,988
2006
QTR. I 427,911 167,224 203,378 2,787 373,389
QTR. II 523,265 192,809 220,458 2,895 416,162
QTR. III 597,242 254,559 254,282 2,868 511,709
QTR. IV 502,202 201,985 234,501 2,913 439,399
2007
QTR. I 465,953 177,432 210,174 2,895 390,501
QTR. II 546,532 178,289 219,551 2,916 400,756
QTR. III 634,648 267,029 290,085 2,923 560,037
QTR. IV 528,626 229,119 271,016 3,004 503,140
2008e
QTR. I 465,939 177,166 219,745 2,949 399,860
QTR. II 557,100 200,981 256,962 3,013 460,955
QTR. III 635,614 252,735 290,828 2,991 546,554
QTR. IV 522,630 217,010 265,757 3,013 485,779
2009e
QTR. I 454,889 165,417 214,597 3,047 383,061
QTR. II 548,560 201,536 249,083 3,086 453,705
QTR. III 635,938 261,864 289,441 3,115 554,420
QTR. IV 429,316 159,900 234,286 3,110 394,185
SOURCE: The Bahamas Electricity Corporation and The Freeport Power Company
NOTE: Since 1978, data on the generation and sale of electricity covers
all Bahamas, with the exception of street lighting.
e = quarterly estimates
U N I T S S O L D
Table 8.17 Generation and Sale of Electricity(All Bahamas)
(megawatt hours)
94
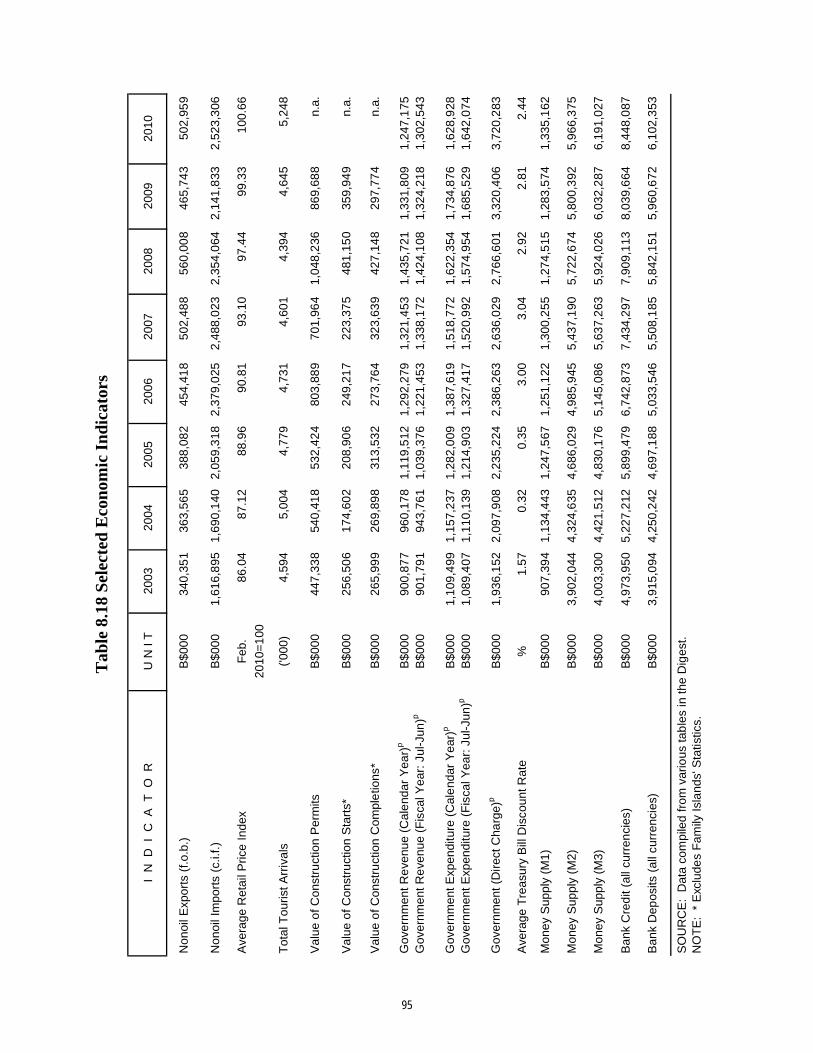
I N
D I
C A
T
O R
U N
I T
2003
2004
2005
2006
2007
2008
2009
2010
Non
oil E
xpor
ts (
f.o.b
.)B
$000
340,
351
363,
565
388,
082
454,
418
502,
488
560,
008
465,
743
502,
959
Non
oil I
mpo
rts
(c.i.
f.)
B$0
001,
616,
895
1,69
0,1
402,
059,
318
2,37
9,0
252,
488,
023
2,35
4,0
642,
141,
833
2,52
3,3
06
Ave
rage
Ret
ail P
rice
Inde
xF
eb.
86.0
487
.12
88.9
690
.81
93.1
097
.44
99.3
310
0.66
2010
=1
00
Tot
al T
ouris
t Arr
ival
s('0
00)
4,59
45,
004
4,77
94,
731
4,60
14,
394
4,64
55,
248
Val
ue o
f Con
stru
ctio
n P
erm
itsB
$000
447,
338
540,
418
532,
424
803,
889
701,
964
1,04
8,2
3686
9,68
8n.
a.
Val
ue o
f Con
stru
ctio
n S
tart
s*B
$000
256,
506
174,
602
208,
906
249,
217
223,
375
481,
150
359,
949
n.a.
Val
ue o
f Con
stru
ctio
n C
ompl
etio
ns*
B$0
0026
5,99
926
9,89
831
3,53
227
3,76
432
3,63
942
7,14
829
7,77
4n.
a.
Gov
ernm
ent R
eve
nue
(Cal
end
ar Y
ear)
pB
$000
900,
877
960,
178
1,11
9,5
121,
292,
279
1,32
1,4
531,
435,
721
1,33
1,8
091,
247,
175
Gov
ernm
ent R
eve
nue
(Fis
cal Y
ear:
Jul
-Jun
)pB
$000
901,
791
943,
761
1,03
9,3
761,
221,
453
1,33
8,1
721,
424,
108
1,32
4,2
181,
302,
543
Gov
ernm
ent E
xpen
ditu
re (
Cal
end
ar Y
ear)
pB
$000
1,10
9,4
991,
157,
237
1,28
2,0
091,
387,
619
1,51
8,7
721,
622,
354
1,73
4,8
761,
628,
928
Gov
ernm
ent E
xpen
ditu
re (
Fis
cal Y
ear:
Jul
-Jun
)pB
$000
1,08
9,4
071,
110,
139
1,21
4,9
031,
327,
417
1,52
0,9
921,
574,
954
1,68
5,5
291,
642,
074
Gov
ernm
ent (
Dir
ect C
harg
e)p
B$0
001,
936,
152
2,09
7,9
082,
235,
224
2,38
6,2
632,
636,
029
2,76
6,6
013,
320,
406
3,72
0,2
83
Ave
rage
Tre
asur
y B
ill D
isco
unt R
ate
%1.
570.
320.
353.
003.
042.
922.
812.
44
Mon
ey S
uppl
y (M
1)B
$000
907,
394
1,13
4,4
431,
247,
567
1,25
1,1
221,
300,
255
1,27
4,5
151,
283,
574
1,33
5,1
62
Mon
ey S
uppl
y (M
2)B
$000
3,90
2,0
444,
324,
635
4,68
6,0
294,
985,
945
5,43
7,1
905,
722,
674
5,80
0,3
925,
966,
375
Mon
ey S
uppl
y (M
3)B
$000
4,00
3,3
004,
421,
512
4,83
0,1
765,
145,
086
5,63
7,2
635,
924,
026
6,03
2,2
876,
191,
027
Ban
k C
red
it (a
ll cu
rren
cies
)B
$000
4,97
3,9
505,
227,
212
5,89
9,4
796,
742,
873
7,43
4,2
977,
909,
113
8,03
9,6
648,
448,
087
Ban
k D
epos
its (
all c
urre
ncie
s)B
$000
3,91
5,0
944,
250,
242
4,69
7,1
885,
033,
546
5,50
8,1
855,
842,
151
5,96
0,6
726,
102,
353
SO
UR
CE
: D
ata
com
pile
d fr
om v
ario
us ta
ble
s in
the
Dig
est.
NO
TE
: *
Exc
lude
s F
amily
Isla
nds'
Sta
tistic
s.
Tab
le 8
.18
Sel
ecte
d E
con
omic
In
dic
ator
s
95
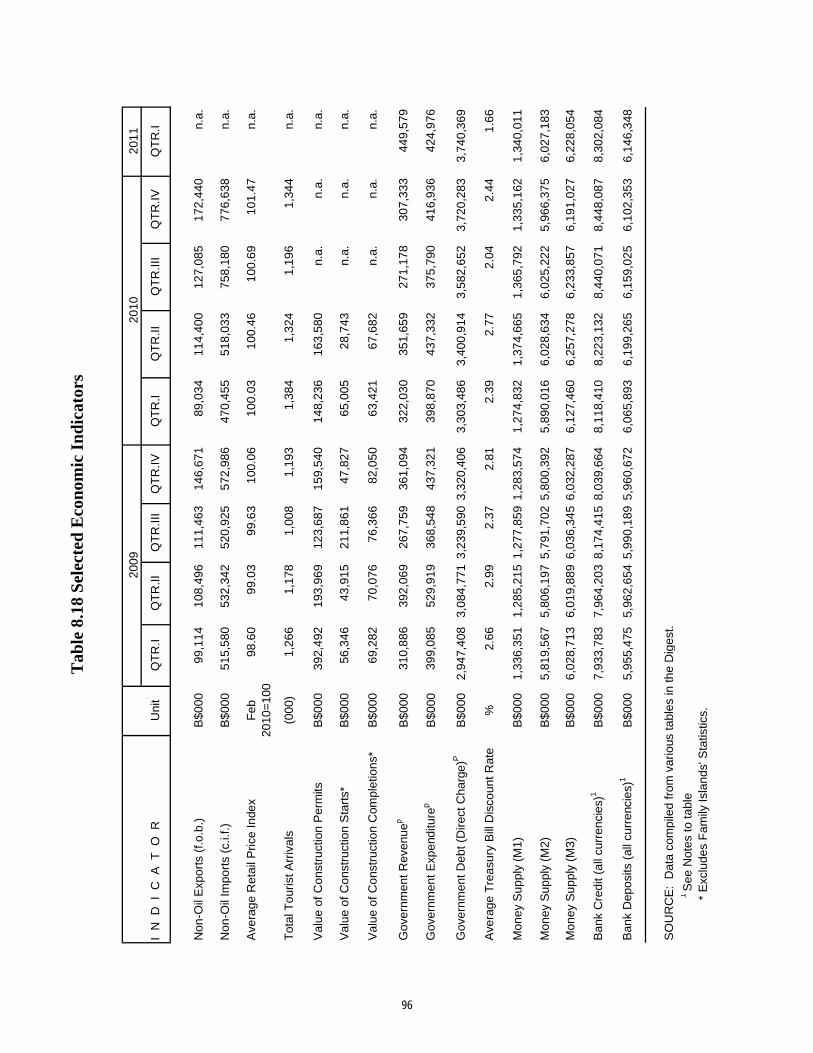
2011
I N
D I
C A
T
O R
Uni
tQ
TR
.IQ
TR
.IIQ
TR
.III
QT
R.IV
QT
R.I
QT
R.II
QT
R.II
IQ
TR
.IVQ
TR
.I
Non
-Oil
Exp
orts
(f.o
.b.)
B$0
0099
,114
108,
496
111,
463
146,
671
89,0
3411
4,40
012
7,08
517
2,44
0n.
a.
Non
-Oil
Impo
rts
(c.i.
f.)B
$000
515,
580
532,
342
520,
925
572,
986
470,
455
518,
033
758,
180
776,
638
n.a.
Ave
rage
Ret
ail P
rice
Inde
xF
eb98
.60
99.0
399
.63
100.
0610
0.03
100.
4610
0.69
101.
47n.
a.20
10=
100
n.a.
Tot
al T
ouris
t Arr
ival
s(0
00)
1,26
61,
178
1,00
81,
193
1,38
41,
324
1,19
61,
344
n.a.
Val
ue o
f Con
stru
ctio
n P
erm
itsB
$000
392,
492
193,
969
123,
687
159,
540
148,
236
163,
580
n.a.
n.a.
n.a.
Val
ue o
f Con
stru
ctio
n S
tart
s*B
$000
56,3
4643
,915
211,
861
47,8
2765
,005
28,7
43n.
a.n.
a.n.
a.
Val
ue o
f Con
stru
ctio
n C
ompl
etio
ns*
B$0
0069
,282
70,0
7676
,366
82,0
5063
,421
67,6
82n.
a.n.
a.n.
a.
Gov
ernm
ent R
even
uep
B$0
0031
0,88
639
2,06
926
7,75
936
1,09
432
2,03
035
1,65
927
1,17
830
7,33
344
9,57
9
Gov
ernm
ent E
xpen
ditu
rep
B$0
0039
9,08
552
9,91
936
8,54
843
7,32
139
8,87
043
7,33
237
5,79
041
6,93
642
4,97
6
Gov
ernm
ent D
ebt (
Dire
ct C
harg
e)P
B$0
002,
947,
408
3,08
4,77
13,
239,
590
3,32
0,40
63,
303,
486
3,40
0,91
43,
582,
652
3,72
0,28
33,
740,
369
Ave
rage
Tre
asur
y B
ill D
isco
unt R
ate
%2.
662.
992.
372.
812.
392.
772.
042.
441.
66
Mon
ey S
uppl
y (M
1)B
$000
1,33
6,35
11,
285,
215
1,27
7,85
91,
283,
574
1,27
4,83
21,
374,
665
1,36
5,79
21,
335,
162
1,34
0,01
1
Mon
ey S
uppl
y (M
2)B
$000
5,81
9,56
75,
806,
197
5,79
1,70
25,
800,
392
5,89
0,01
66,
028,
634
6,02
5,22
25,
966,
375
6,02
7,18
3
Mon
ey S
uppl
y (M
3)B
$000
6,02
8,71
36,
019,
889
6,03
6,34
56,
032,
287
6,12
7,46
06,
257,
278
6,23
3,85
76,
191,
027
6,22
8,05
4
Ban
k C
redi
t (al
l cur
renc
ies)
1B
$000
7,93
3,78
37,
964,
203
8,17
4,41
58,
039,
664
8,11
8,41
08,
223,
132
8,44
0,07
18,
448,
087
8,30
2,08
4
Ban
k D
epos
its (
all c
urre
ncie
s)1
B$0
005,
955,
475
5,96
2,65
45,
990,
189
5,96
0,67
26,
065,
893
6,19
9,26
56,
159,
025
6,10
2,35
36,
146,
348
SO
UR
CE
: D
ata
com
pile
d fr
om v
ario
us ta
bles
in th
e D
iges
t. 1
See
Not
es to
tabl
e*
Exc
lude
s F
amily
Isla
nds'
Sta
tistic
s.
2009
2010
Tab
le 8
.18
Sel
ecte
d E
con
omic
In
dic
ator
s
96
97
NOTES TO TABLES SECTION 1 MONETARY AUTHORITY
Table 1.1 Central Bank of The Bahamas: Assets
Balances With Foreign Banks: are deposits of the Central Bank held with foreign banks. Foreign Securities: are holdings of short and long term debt instruments of foreign governments and supranational organizations which are reported at cost. IMF Reserve Tranche: represents that part of The Bahamas' quota in the IMF which must be paid up in SDRs. Fluctuations may reflect valuation changes. Special Drawing Rights (SDRs): are the unused portion of SDRs allocated by the IMF to its members in proportion to their quota. Members are free to convert these amounts into other currencies or they may hold them as part of their reserves. Claims on Central Government: comprise holdings of the Central Government's treasury bills, bonds and advances from the Central Bank. These are recorded at cost. According to The Central Bank of The Bahamas Act, the Bank's advances to the Government cannot exceed ten percent of the Government's average ordinary revenue or ten percent of the estimated ordinary revenue, whichever is less. The average ordinary revenue is the annual average of the ordinary revenue over the last three years for which audited accounts of revenue and expenditure of the Government have been laid before Parliament.
Table 1.2 Central Bank of The Bahamas: Liabilities
Currency in Circulation: is the total value of Bahamian dollar notes and coins issued to the public which are the liabilities of the Central Bank. Demand Liabilities to Bankers: comprise the balances for commercial banks and other local financial institutions, part of which is held to satisfy the statutory reserve requirements vis-à-vis Bahamian dollar deposit liabilities and to facilitate cheque clearing requirements. These deposits are non interest bearing. Deposit Liabilities to Others: include total balances held for the public corporations and international organizations such as the IMF.
Table 1.4 Central Bank of The Bahamas: Notes in Circulation Sterling notes: were in circulation prior to the issuance of the Bahamian dollar in 1967. These are still redeemable at a rate of B£1 = B$2.85714.
Table 1.5 Central Bank of The Bahamas: Coins in Circulation Gold Coins: in circulation were placed into general circulation in the late 1960s by way of commercial banks and coin dealers. These are redeemable at face value.
98
SECTION 2 BANKING SYSTEM
As at November 2005, the Commercial Banks and the Other Local Financial Institutions' (OLFIs) data sets have been combined for reporting as the banking system.
Table 2.1 Financial Survey
This table is compiled from the combined balance sheets of the Central Bank, commercial banks, and other local financial institutions. Data coverage is in respect of all resident
Net Foreign Assets: are foreign assets held by the banking system and the Central Bank less short term foreign liabilities of the banking system. Domestic Credit to Government (net): is all claims on Central Government net of deposit liabilities held for Government. Domestic Credit to Rest of Public Sector: represents all claims on public non-financial corporations and public financial institutions. Currency in Active Circulation: is Bahamian dollar currency in the hands of the public i.e., the total currency liabilities of the Central Bank less banks' till cash and gold coins and sterling notes. Demand Deposits for Commercial Banks and Other Local Financial Institutions: are adjusted to exclude nonresident demand deposits which are included in the net foreign assets positions of banks. Government's demand deposits are also excluded from the total. Central Bank Demand Deposits: only include balances owing to the public corporations. Deposits of international agencies are included in other items (net). Savings and Fixed Deposits: exclude amounts held to the account of nonresidents. It should also be noted that all deposits are adjusted for foreign currency balances which are included in the calculation of quasi money. Foreign Currency Deposits: comprise all foreign currency deposits (demand, savings and fixed) of residents. Other Items (net): include non-monetary liabilities less the non-monetary assets of the Central Bank and banks. The capital and reserves positions are a component of this category. As at 1984, unearned interest is excluded from private sector credit and is included in other items (net).
Table 2.4 Factors Affecting Money Supply
This table is based on the Financial Survey, as it includes data for Central Bank, commercial banks and other local financial institutions. Brackets denote a contractionary impact on Money Supply (M1).
Table 2.5 Summary of Domestic Assets of the Banking System
Till Cash: is holdings of Bahamian dollar notes and coins in vault. Treasury Bills: are recorded at cost. Balance with Central Bank: See notes to Table 1.2.
transactions, i.e., both Bahamian dollar and foreign currency transactions.
99
Other Assets: include fixed assets such as land and building, furniture and other miscellaneous assets in Bahamian dollars only.
Table 2.6 Summary of Domestic Liabilities of the Banking System Resident Deposits: include balances in both Bahamian dollars and foreign currency. Other Demand, Savings and Fixed Deposits: include accounts of individuals, companies and public corporations. Also included are any demand and fixed deposits held for Central Government. Due to Central Bank: represents Central Bank advances to and Bahamian dollar deposits held with commercial banks. Capital and Surplus Accounts: include only paid-up capital, reserves, provisions and profit and loss accounts in Bahamian dollars. Other Liabilities: include bills payable in The Bahamas, debentures issued in The Bahamas and other miscellaneous liabilities in Bahamian dollars. Net Foreign Assets: are derived by netting out total domestic assets (in Bahamian dollars and foreign currencies) against total domestic liabilities (Bahamian dollars and foreign currencies). A negative figure, showing an excess of liabilities over assets, represents an inflow of foreign capital into the economy to finance a portion of the banks' domestic assets.
Table 2.7 Summary of Foreign Assets of the Banking System Table 2.8 Summary of Foreign Liabilities of the Banking System
Included in external assets and liabilities are both Bahamian dollar and foreign currency claims on and liabilities due to the nonresident financial and nonfinancial sectors. The significant decline in commercial banks claims on offshore financial institutions in 1989 reflects the departure of a bank from the system. As at November 2006, the tables reflect a consolidation of the commercial banks and OLFIs data.
Table 2.9 Bank Deposits by Depositors (All Currencies)
Amounts represent non-financial deposits of the commercial banks and the other local financial institutions only. Collection of this data series, according to the existing seven categories, commenced in 1982 for the commercial banks and in 1988 for the other local financial institutions. Other: includes deposits of charitable and non-profit organizations and pension funds.
Table 2.15 Commercial Banks: Overdrafts and Loans by Maturity
See notes to Table 2.16.
Table 2.16 Distribution of Bank Credit: All Currencies
Loans and advances are classified according to the main economic activity of the borrower. The report form for loans and advances was revised with effect from January 1982 in accordance with the U.N. International Standard Industrial Classification. Modifications were made to highlight certain sectors and to maintain conformity with the previous data set. There
100
are now fifteen categories compared with the previous eight, with the miscellaneous, tourism, manufacturing, and agriculture sectors as separate categories. There is a break in the series on loans and advances to building and construction, real estate, the personal and miscellaneous categories and quarrying and manufacturing owing to numerous reclassifications that were made to ensure consistency between the past and existing series. The totals on these tables differ from those on the banks' balance sheets due to the inclusion of unearned interest in the former. As at October 1994, unearned interest is no longer calculated for loans granted by banks.
Table 2.19 Summary of Bank Consumer Credit
These loans are of a personal nature and are repaid on an installment basis. The category home improvement includes land purchases for the years 1982-1987, and miscellaneous, commercial bank credit card debt. Also, see notes to Table 4.2. Beginning October 1994, banks have disaggregated loans previously granted on a demand basis from 'add-on' loans. These amounts were also new consumer loans granted subsequent to the directive of the Central Bank's guideline that all loans, after October 1, 1994, be extended using the simple interest method of interest calculation. Demand and add-on loans which were previously reported separately has as of August 2006 been combined to provide more concise information on consumer lending for various categories.
Table 2.23 Summary of Bank Liquidity
A. Primary Reserves Under Section 19 of The Central Bank of The Bahamas Act 2000, banks are required to maintain a reserve called a 'Statutory Reserve" against their Bahamian dollar deposit liabilities. Since coming into effect in June, 1974, the ratio has been unchanged at 5%; however, the Bank has the power to raise the ratio up to 20%. The determination of required reserves is based on the average of the weekly positions of Bahamian dollar deposit liabilities for four preceding weeks prior to the month for which the statutory reserves are applicable. Section 20(5) of The Act provides for a fine to be applied not exceeding twice the annual discount rate for every day that a deficit occurs. Required Deposit Balance: is derived from the required reserves less the average till cash or 1% of average deposits, whichever is smaller. The balance is computed using the average deposits of banks for the week-ending Wednesday during the month. Average Till Cash: is the average of banks' Bahamian dollar cash in vault and is calculated using the average of the previous month-end figures. The data are obtained from the monthly balance sheets of the banks. Average Balance with the Central Bank: is the average of the daily balances for the month. B. Liquid Assets Under Section 20 of The Central Bank of The Bahamas Act, all banks are required to maintain an average ratio of liquid assets in relation to their Bahamian dollar deposit liabilities, taking one calendar month with another. For the purposes of calculation, weekly positions as reported for the week ending Wednesday are averaged to arrive at the position for a calendar month. Section 20 (5) of the Act also provides for a fine not exceeding twice the annual discount rate for every day that a deficit occurs.
101
Minimum Required Liquid Assets: represent 20% of the banks demand deposits, 15% of savings and fixed deposits and 15% of borrowings due to/from the central bank and inter bank. Eligible Liquid Assets: include notes and coins, government securities, and other specified assets. Notes and Coins: are the total Bahamian dollar cash held by the banks and up to $250,000 in foreign currency cash. Government Registered Stocks: include Bahamian dollar registered stock, foreign currency stock for the years 1979-1981. Specified Assets: are those which can be statutorily prescribed by the Central Bank and currently comprise Government guaranteed low cost housing loans and public financial institutions bonds. Net Interbank Demand/Call Deposit: is the net of demand/call deposit placements between commercial banks and the other local financial institutions.
Table 2.24 Profit and Loss Accounts of Banks in The Bahamas This table presents data on domestic banks (Commercial Banks and Savings & Loans) profit and loss in respect of resident transactions only (i.e., all Bahamian dollar and foreign currency operations of residents). It excludes those banks which are principally offshore in nature, although designated as Authorized Agents. In several instances, fluctuations in the data set for Commercial Banks and Savings & Loans reflect reclassification of banks from the former category to the latter. Savings and Loans: are a subset of Other Local Financial Institutions (OLFIs) and include institutions which deal only in resident Bahamian dollar transactions. See notes to Table 2.28. Commercial Banks: See notes to Table 2.28. The collecting of profitability data commenced with annual surveys for the years 1985-1989 and 1992. Quarterly reporting was instituted beginning first quarter 1993. Although presented using the standard quarters, the data reflect fiscal quarter-ends of individual institutions; the Canadian institutions are on the April, July, October and January quarter-end system. Average Domestic Assets: represent balance sheet totals of Bahamian Dollar and foreign currency claims on residents, averaged for the respective quarterly/annual period. Return on Assets Ratio: is calculated by taking the ratio of net income to average domestic assets. It measures a bank's efficiency in utilizing assets to generate profits. Net Interest Margin: represents the difference between a bank's interest income and interest expense. A measure of net interest income divided by average level of interest earnings assets indicates how well a bank is able to acquire funds and reinvest them. Gross Earnings Margin: represents the net interest margin in addition to income received from foreign exchange transactions and other commission sales. Net Income: represents the difference between gross income and gross expense. Effective Bahamian Dollar Interest Rate Spread: measures the difference between the interest yield on average loans and interest cost on deposit liabilities.
102
Table 2.25 Banking System: Foreign Exchange Transactions
Table shows foreign exchange purchases and sales between commercial banks, the public and the Central Bank.
Table 2.26 Banking System: Clearings Table shows data on the total monthly cheques exchanged between banks in the Clearing Banks Association each month.
Table 2.27 Real Time Gross Settlement (RTGS) Transactions
The RTGS system was implemented in May 2004, to enable all clearing banks to settle Bahamian dollar payments electronically, on a transaction-by-transaction basis in real time – among each other and the Central Bank of The Bahamas. Customer Payments: payments made by clearing banks on behalf of their customers. Interbank Payments - Gross Settlements: total payments made by clearing banks among themselves. Interbank Payments - Retail Cheque Clearing (net): net settlement of retail cheques conducted via the Central Bank of The Bahamas. Interbank Payments – Central Bank: transfers made from one bank to another via the Central Bank of The Bahamas upon instruction from the bank. Other Credits: Central Bank transfers to clearing banks on behalf of its customers. Other Debits: Debits made by Central Bank to its customers’ accounts.
Table 2.28 Banks and Trust Companies Licensed in The Bahamas
Table shows the total number of banks and trust companies licenced in The Bahamas along with data on revoked licences. The definitions of 'bank and trust companies' licences are outlined below. Authorized Dealer: is a bank which has been authorized by the Central Bank to deal in gold and all foreign currencies, and for this purpose can open and maintain accounts in such currencies within the limits laid down in Exchange Control Notices issued by the Bank. Under authority delegated by the Central Bank, an authorized dealer can approve certain applications for foreign currency within specified limits. Authorized Agent: is a bank or trust company authorized by the Central Bank to deal in Bahamian and foreign securities and to receive securities into deposit (i.e. to act as custodian) in accordance with the terms of Exchange Control Regulations Act, 1965 and Exchange Control Notices issued by the Bank. Public Licensee: is an entity permitted to carry on banking and/or trust business with members of the public. The institution's exchange control designation determines whether the licensee is 'resident' or 'nonresident' Resident: status allows a bank or trust company to deal only in Bahamian dollars and all operations in foreign currencies require Exchange Control's authorization. Trust companies with resident status are allowed to deal in foreign securities on behalf of nonresident customers. Nonresident: designation permits a bank and/or trust company to operate freely in foreign currencies, however, Exchange Control approval is necessary to operate a Bahamian dollar account to pay local expenses.
103
Restricted: banks and/or trust companies carry on business for certain specified persons which are usually named in the licence. Nonactive: companies are those which are either in voluntary liquidation or wish to keep the word bank or trust in the company's name even though they are not carrying on any banking or trust business. Nominee Trust Licensee: A Nominee Trust licence restricts the services that may be offered by a licensee to the provision of nominee services only. Such services are defined to include the holding of securities and other assets in the licensee’s name and the provision of corporate directors and officers on behalf of its parent company’s clients. Commercial Banks: are deposit money banks operating demand, savings and fixed deposits and making loans through a number of branches. These banks also provide services for the exchange of foreign currency. At end-September, 2005, the following banks were classified as commercial banks: Bank of The Bahamas, Citibank, N.A., Commonwealth Bank Ltd., Fidelity Bank Bahamas Ltd, Finance Corporation of The Bahamas Ltd., FirstCaribbean International
Other Local Financial Institutions: are primarily banks and trusts which opt to deal mainly with non-residents and savings and loans institutions which deal only in Bahamian dollars. At
SECTION 3 OTHER FINANCIAL INSTITUTIONS Table 3.1 Bahamas Development Bank: Assets
Due from Commercial Banks: Bahamian dollar balances held as demand and fixed deposits in the local commercial banks. Other Assets: include fixed assets such as land and building, and other miscellaneous assets in Bahamian dollars only.
Table 3.2 Bahamas Development Bank: Liabilities
Due to National Insurance Board: represents the National Insurance Board’s advances to and Bahamian dollar deposits held with Bahamas Development Bank. Due to Central Bank: represents Central Bank advances to and Bahamian dollar deposits held with Bahamas Development Bank. Due to Caribbean Development Bank: represents the Caribbean Development Bank advances to and Bahamian dollar deposits held with Bahamas Development Bank. Due to Other Financial Institutions Outside The Bahamas: represents Other Financial Institutions advances to and Bahamian dollar deposits held with Bahamas Development Bank. These institutions are located outside the Bahamas. Capital and Surplus Accounts: include only paid-up capital, reserves, provisions and profit and loss accounts in Bahamian dollars.
Bank (Bahamas) Limited, Royal Bank of Canada and Scotiabank (Bahamas) Limited.
end-December, 2008, the domestic OLFIs comprised the following: Ansbacher (Bahamas) Limited, Bank of Nova Scotia Trust, Canadian Imperial Bank of Commerce Trust, Cititrust
Bank & Trust (Bahamas) Limited and UBS Trustees (Bahamas)Limited.
(Bahamas) Ltd., Fidelity Merchant Bank & Trust Limited, JP Morgan Chase, Latin American Investment Bank, Pictet Overseas Trust Corp.Ltd., Royal Bank of Canada Trust, S.G. Hambros
104
Other Liabilities: include bills payable in The Bahamas, debentures issued in The Bahamas and other miscellaneous liabilities in Bahamian dollars.
Table 3.3 Bahamas Development Bank: Sectoral Distribution of Credit Loans are classified in accordance with the U.N. International Standard Industrial Classification. There are eight categories of loans for the broad based lending of the bank. These include loans for agriculture, fisheries, manufacturing, transportation, tourism and other industries.
SECTION 4 INTEREST RATES Table 4.1 Selected Interest Rates
Bank Rate: is the interest rate at which banks borrow from the Central Bank. Average Tender Rate (ATR): is the rate determined during a tender by dividing the principal (amount actually paid for bills) by the amount on offer. Average Treasury Bill Discount Rate (ADR): represents the annual yield to the investor or cost to the Government. It is calculated on the basis of the following formula: ADR = 100 % less ATR × 4.
Table 4.2 Loan Rates of the Banking System
Data for the years 1982 through 1984 are average rates; however, as of January 1985, a range is given for lending rates. Average rates calculations were resumed in 1996. The weighted average rate of interest is calculated using total loans and advances. Beginning October 1, 1994, the Central Bank directed banks to discontinue utilizing the add-on rate method for calculating interest rates on consumer loans, and instead stipulated that the simple interest rate method be used.
Table 4.3 Deposit Rates of the Banking System
For the years 1982 through 1984, the respective rates shown represent the average rates offered by commercial banks and the Other Local Financial Institutions on their deposit liabilities. As of January 1985, the data represent ranges. Average rates calculations were resumed in 1996. The weighted average rate of interest is calculated using total deposits.
Table 4.4 Comparative Treasury Bill Rates and Bank Rates
Treasury bill rates for the United Kingdom, United States and Canada are the average discount rates on three-month Treasury Bills at the last tender in each month. The rates for The Bahamas, Barbados, Jamaica and Trinidad and Tobago are the average rates quoted on the date of issue of three-month bills for the appropriate month. The distinction arises because in the former case there are several tenders per month whereas for CARICOM territories and The Bahamas there is usually only one tender.
105
Bank rates (minimum lending rate in the case of the United Kingdom) are those obtaining at the end of the month. The lending rate for Jamaica represents the Certificate of Deposit rate for 1989-1996; thereafter the rate reflects the 30 day reverse repurchase rate.
SECTION 5 GOVERNMENT FINANCE
The Government Finance Statistics are compiled from the monthly summary printouts of the Public Treasury accounts and the Central Bank records. The totals under these headings although consistent with Government's expenditures/revenue and overall balances, will not agree with those found in the Government's audited accounts as amounts have been reclassified according to the International Monetary Fund's compilation methodology. In particular, the Post Office, Port and Aviation Departments are treated as non-financial public enterprises. Whenever revenues exceed expenditures, the surplus is included under the revenue category ‘Income: Public Enterprises'. On the other hand, deficits are included in the capital expenditure under the heading: 'Capital Transfers to Non-financial Public Enterprises'. Furthermore, the presentation is consistent with the financing data found in the monetary accounts. Pending the completion of audited accounts the annual data should be regarded as very provisional and may change between reporting periods to reflect revised positions. In cases where Government Accounts have been audited, provisional data shown in Tables 5.1 through 5.6 reflect those audited positions. The Treasury Accounts cease to become provisional once the audited accounts have been tabled in the House of Assembly. In the Government's Budget presentation to Parliament on November 25, 1992, approval was sought and received to change the commencement of the fiscal year to July 1. As a consequence, an interim budget was presented for the period January-June 1993. In December of 1992, the Government tabled a supplementary budget of approximately $74 million, of which $25.1 million and $7.9 million in recurrent and capital expenditures, respectively was outlayed in 1993. The data for 1993 is presented on a calendar year basis and is inclusive of these amounts.
Table 5.1 Central Government: Operations and Financing Net Lending: consists of the changes in Government loans to public corporations net of any repayments. Minus indicates repayment and a decline in these outstanding advances for the period. Deficit/Surplus: is calculated by subtracting total expenditure and net lending from revenue. The remaining items show how the deficit was financed or surplus allocated. Domestic Borrowing: comprises loans and advances from resident sources in all currencies extended during the reporting period. Decreases in outstanding Treasury Bills are shown as a negative item. Foreign Borrowing: comprises borrowing from nonresident sources in foreign currencies. Other Financing: is inclusive of Government's short-term borrowing from the banking system. Debt Repayment: comprises amortization of all debt items except Treasury Bills. In accordance with the IMF's treatment, debt repayment is not considered to be an expenditure but a negative financing item. Cash Balance Change: shows the increase or decrease in Government's deposits with the domestic banking system.
106
Changes in Short-term advances: shows the increases and decreases in Government's short-term obligations to the banking system, excluding the Central Bank. Other: reflects the net of changes in float of cheques outstanding and a residual financing item.
Table 5.2 Central Government: Current Revenue
Tax Revenue Selective Taxes on Services: include casino, hotel occupancy, and security taxes. Business and Professional Licence: includes fees for insurance companies, banks/trust companies and the business licence fees. Other taxes: include casino application fees, insurance premium taxes, and immovable property fees. Non tax Revenue Other Sources: include revenue from rental of government properties and interest dividends and profits. Fines, forfeits and Administrative Fees: include driver licence fees and other service charges. Other: includes proceeds of sale from services of a commercial nature such as livestock; and fees relating to education.
SECTION 6 PUBLIC DEBT
All data are in respect of disbursed debt only. Table 6.1 Central Government: National Debt
Direct Charge: is that amount which is direct claim on Central Government by foreign and local holders of the Public Debt. External Debt: comprises that portion of the debt owed to nonresidents in foreign currencies. Internal Debt: comprises debt owed to residents in foreign currencies and Bahamian dollars. Total Foreign Currency Debt: includes all external and foreign currency internal debt. Contingent Liabilities: are both Bahamian and foreign currency claims on the public corporations guaranteed by Government. As such, these are potential liabilities to Central Government in the event of a default.
Table 6.2 Central Government: Treasury Bill
Treasury bills are compiled from the results of the monthly tenders conducted by the Central Bank and are reported at face value. Amounts differ from those shown in banks’ balance sheets and where they are reported at cost.
107
The statutory ceiling on Treasury Bills which may be outstanding was increased in December 1990 to 25% from 20%. This is computed on the basis of government’s average ordinary revenue for the most recent three years.
Table 6.3 Central Government: Long-term Securities Table 6.4 Central Government: Long-term Securities by Maturity
Beginning in April 1992, data also include holdings of bonds issued under the Development Bond Act, 1990 together with the traditional registered stocks issued under the Registered Stock Act 1973.
Table 6.5 Public Corporations: Debt Operations
In some cases, the data may differ slightly from that published in the audited accounts of the public corporations. The foreign currency loan balances shown in the audited accounts are usually adjusted to reflect year-end exchange rate values.
Table 6.6 Public Sector: Foreign Currency Debt Operations
This table shows the changes in the foreign currency debt of Government and public
Debt Service Ratio: is calculated as total debt service as a percentage of exports of goods and non-factor services.
SECTION 7 INTERNATIONAL TRADE AND PAYMENTS Table 7.1 Balance of Payments
The table format is based on the IMF's standard format for reporting balance of payments statistics. The information on oil trade is supplied by oil companies and is desegregated into oil imported for domestic consumption and that for bunkering of foreign ships and aircraft. Oil that is imported for trans-shipment or refining and subsequently re-exported is excluded from the trade account since no change of ownership occurs. Interest, Dividends and Profits: data for banks exclude transactions relative to offshore activities. Import and Export: data differ from those published by the Department of Statistics owing, inter alia, to some erratic movement in the series compiled by this department. For the years 1978-1987:3, the Central Bank's estimates for imports were based on import duties to which a multiplier of 3.75 was applied. Since 1987:4 - 1989, imports have been compiled as a percentage of tourism expenditure. Exports have been estimated from the data supplied by offshore exporting companies and applying a multiplier of 2.22. Thereafter, the Bank has reverted to using imports and exports data from the Department of Statistics. In the absence of timely data, the Bank estimates exports from previous years’ information and imports are obtained from The Bahamas Customs Department. Travel: debit is based on Exchange Control approvals for purchases of foreign currency.
corporations. Data are reported net of intra-public sector financing activities.
108
For a detailed exposition of the components of the table, please see the article, 'An overview of Bahamas Balance of Payments 1973-1979', Quarterly Review, March 1977. The non-oil imports data for 1985 have been revised upwards to reflect the impact of the sharp upward adjustment in tourist expenditure, as reported by the Ministry of Tourism. The revisions by the ministry reflect the new methodology employed in calculating tourist expenditure by using an average per visit measurement instead of a per diem concept. The adjustments to non-oil imports were designed to maintain the historical relationship which exits between tourism receipts and imports. Accordingly, the freight and insurance data were also revised.
Table 7.2 External Trade Other Merchandise Imports: exclude bullion and specie and include parcel mail, insurance and freight.
Table 7.3 Export by Commodity Group
Exports: are reported f.o.b., i.e. the value includes the expenses up to the time of delivery on board the exporting carrier, and any related export duties. Although not shown separately, exports consist of domestic exports and re-exports. The former is comprised of domestic goods exported directly and imports which have been transformed in The Bahamas. The latter consists of foreign goods re-exported without transformation. The low figure of $339,000, which represents exports 'beverages and tobacco' for the fourth quarter 1977 is due to the non-processing of a number of customs entry forms during that period. The differences between the annual and quarterly series through 1984 are due to the lack of the relevant breakdowns for the quarters. Where the annual and quarterly totals differ, the annual figure should be used. Adjustments to the quarters are not available.
The commodity classification used is The Standard International Trade Classification. Table 7.4 Imports by Commodity Group
Imports: are reported c.i.f., i.e., the value includes the cost of imports, freight and insurance and any other expenses relating to the delivery at the port.
Table 7.5 Non-oil Exports by Country and Region Table 7.6 Non-oil Imports by Country and Region
The quarterly totals for 1976-1984 differ from the respective annual totals because adjustments were only made to the annual data.
Table 7.7 Composition of Domestic Exports
Table shows those products which are produced locally and exported. SECTION 8 GENERAL STATISTICS Table 8.1 Retail Price Index: Average for the Period
The arithmetic average is used. These tables begin a new series based on the revised retail
expansion in the number of categories to twelve from the previous nine categories the series was based on the index for New Providence only. The revised index also includes an price index as prepared by the Department of Statistics in 2011 for 'All Bahamas'. Previously,
109
Table 8.3 Comparative Retail Price Index
Table 8.4 Tourism: Selected Statistics Average Length of Stay: is derived from the immigration cards which recorded the intended length of stay. The average length of stay is reported in days which is derived by adding 0.5 to the average length of stay (nights). Since 1977, excursionists (one day visitors) have been excluded from stopover visitors. Stopover: is a visitor who stays in excess of 24 hours and requires accommodations.
Table 8.5 Tourism: Estimates of Visitor Expenditure
Average Expenditure Per Visit: is based on information received on The Ministry of Tourism's exit surveys. This figure is then expressed in 1987 dollars by using the formula: Average Expenditure Per Visit ÷ [(current year average price index) × (1987 average price index)] Total visitor expenditure: is inclusive of spending by day visitors.
Table 8.6 Construction thru 8.11
Since 1975, the data for the 'Rest of Grand Bahama' were classified with Freeport to provide a complete picture for Grand Bahama. Starts and completions: Only include data for New Providence and Grand Bahama.
Table 8.12 Residential Mortgage Commitments: No. and Value Table is based on information received from banks, insurance companies and the Bahamas Mortgage Corporation. The data refer to the number and value of loans committed during the reporting period only. In 1986: Qtr. IV, the reporting format was revised to standardize reporting procedures across institutions. Based on this new format data were published beginning 1987: Qtr. IV. Row: buildings refer to owner-occupied property consisting of no more than four units.
Table 8.13 Commercial Mortgage Commitments: No. and Value
See notes to Table 8.12. Commercial Mortgage Loan Commitments: are those for non-owner occupied single dwellings, duplex and row; owner occupied apartments exceeding four units; new and existing structures, and rehabilitation and additions for commercial use.
Table 8.16 Commercial and Residential Mortgages: Selected Indicators
In the case of The Bahamas, the quarterly and annual comparisons were previously calculated using the Average Retail Price Index for New Providence. These figures are now based on the
rebased to 2010. The monthly index changes are based on the actual Retail Price Index and have been likewise Average Retail Price Index for 'All Bahamas' and have been rebased to February 2010 = 100.
110
See notes to Table 8.12.
is the percentage of the loan value financed divided by the total cost of the structure.
Table 8.17 Generation and Sale of Electricity
Data since 1978 cover all Bahamas, with the exception of street lighting.
Table 8.18 Selected Economic Indicators Bank Credit (All Currencies): comprises banks holdings of treasury bills, government securities, other local securities and loans and advances to Government, rest of public sector and the private sector. Bank Deposits (All Currencies): comprise the deposits held by residents including Government, rest of public sector and banks. Beginning with third quarter 1993, data on Government Revenue and Expenditure reflect the changes in the commencement of the Fiscal Year to July 1. Therefore third quarter represents the initial quarter of Fiscal Year 1993/94.
Average Loan Value/Cost Ratio: is calculated for new and existing single dwellings only and


![CSR Report 2015 [Digest]](https://img.pdfslide.net/doc/110x75/63257519cedd78c2b50c99c4/csr-report-2015-digest.jpg)
