Embed Size (px)
Citation preview
REPORT ON ACTION
PLAN FOR CLEAN-UP OF
POLLUTED STRETCH OF
MULA-MUTHA RIVER March, 2019
1
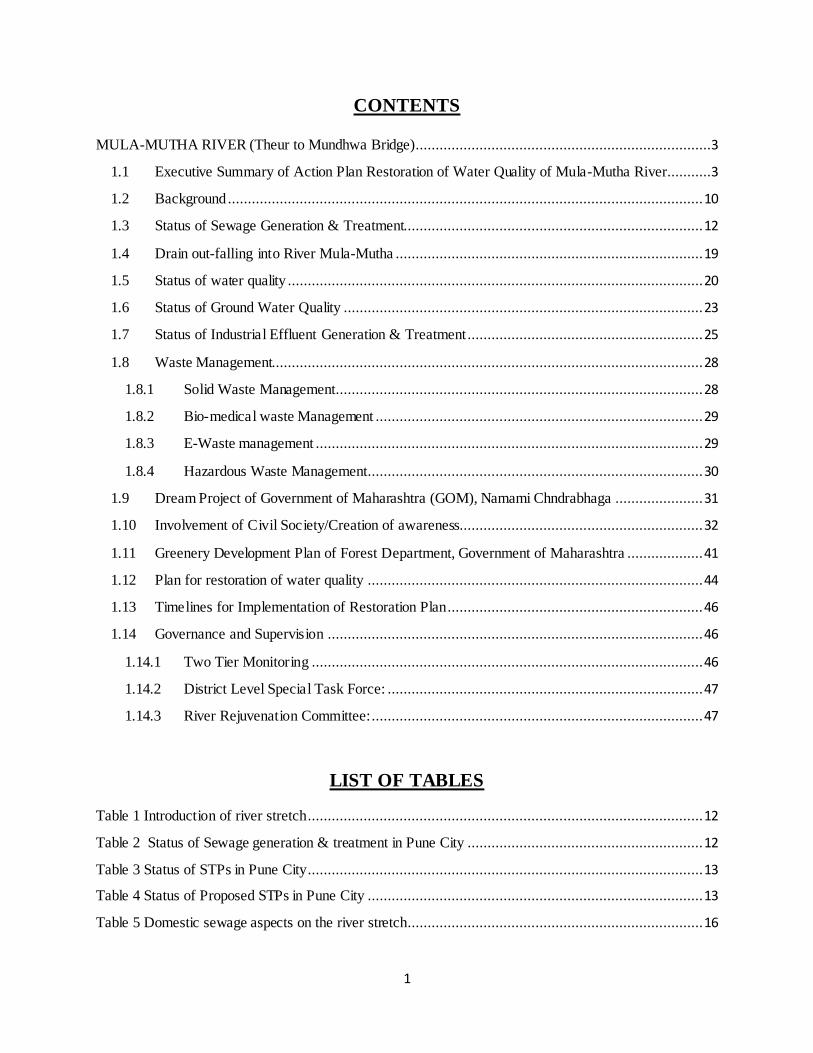
CONTENTS
MULA-MUTHA RIVER (Theur to Mundhwa Bridge)..........................................................................3
1.1 Executive Summary of Action Plan Restoration of Water Quality of Mula-Mutha River...........3
1.2 Background ....................................................................................................................... 10
1.3 Status of Sewage Generation & Treatment........................................................................... 12
1.4 Drain out-falling into River Mula-Mutha ............................................................................. 19
1.5 Status of water quality ........................................................................................................ 20
1.6 Status of Ground Water Quality .......................................................................................... 23
1.7 Status of Industrial Effluent Generation & Treatment ........................................................... 25
1.8 Waste Management............................................................................................................ 28
1.8.1 Solid Waste Management............................................................................................ 28
1.8.2 Bio-medical waste Management .................................................................................. 29
1.8.3 E-Waste management ................................................................................................. 29
1.8.4 Hazardous Waste Management .................................................................................... 30
1.9 Dream Project of Government of Maharashtra (GOM), Namami Chndrabhaga ...................... 31
1.10 Involvement of Civil Society/Creation of awareness............................................................. 32
1.11 Greenery Development Plan of Forest Department, Government of Maharashtra ................... 41
1.12 Plan for restoration of water quality .................................................................................... 44
1.13 Timelines for Implementation of Restoration Plan................................................................ 46
1.14 Governance and Supervision .............................................................................................. 46
1.14.1 Two Tier Monitoring .................................................................................................. 46
1.14.2 District Level Special Task Force: ............................................................................... 47
1.14.3 River Rejuvenation Committee: ................................................................................... 47
LIST OF TABLES
Table 1 Introduction of river stretch ................................................................................................... 12
Table 2 Status of Sewage generation & treatment in Pune City ........................................................... 12
Table 3 Status of STPs in Pune City................................................................................................... 13
Table 4 Status of Proposed STPs in Pune City .................................................................................... 13
Table 5 Domestic sewage aspects on the river stretch .......................................................................... 16
2
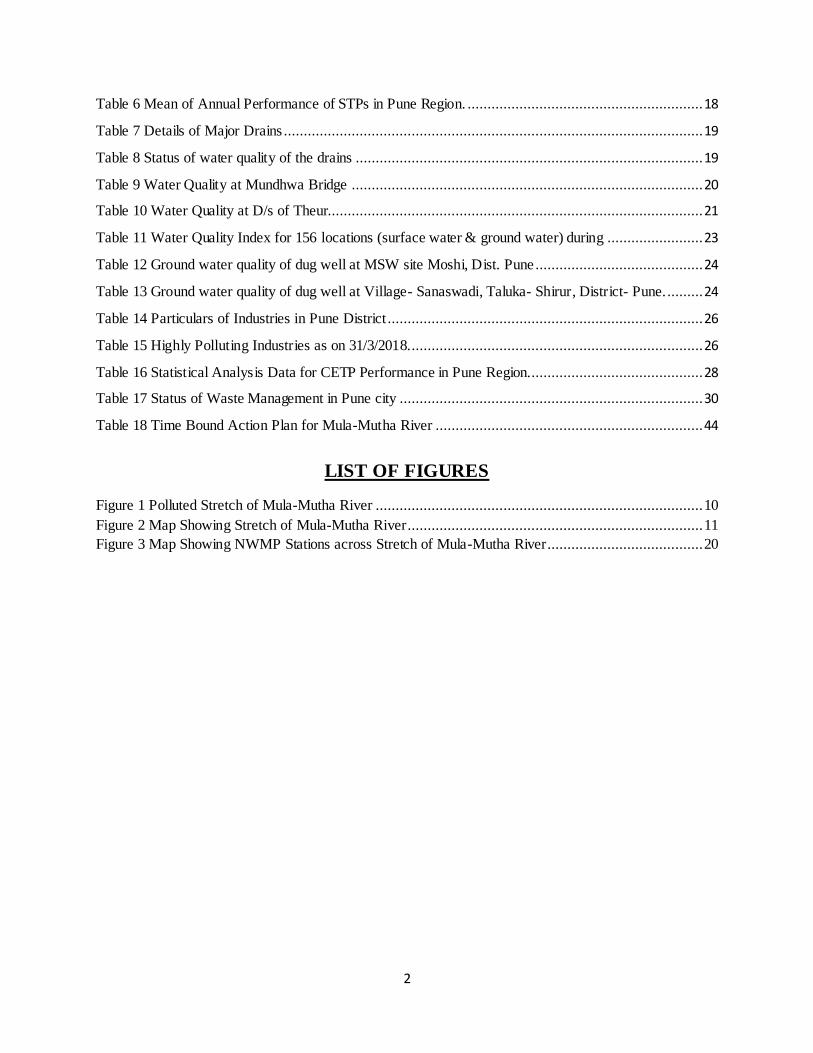
Table 6 Mean of Annual Performance of STPs in Pune Region. ........................................................... 18
Table 7 Details of Major Drains ......................................................................................................... 19
Table 8 Status of water quality of the drains ....................................................................................... 19
Table 9 Water Quality at Mundhwa Bridge ........................................................................................ 20
Table 10 Water Quality at D/s of Theur.............................................................................................. 21
Table 11 Water Quality Index for 156 locations (surface water & ground water) during ........................ 23
Table 12 Ground water quality of dug well at MSW site Moshi, Dist. Pune .......................................... 24
Table 13 Ground water quality of dug well at Village- Sanaswadi, Taluka- Shirur, District- Pune. ......... 24
Table 14 Particulars of Industries in Pune District ............................................................................... 26
Table 15 Highly Polluting Industries as on 31/3/2018.......................................................................... 26
Table 16 Statistical Analysis Data for CETP Performance in Pune Region............................................ 28
Table 17 Status of Waste Management in Pune city ............................................................................ 30
Table 18 Time Bound Action Plan for Mula-Mutha River ................................................................... 44
LIST OF FIGURES
Figure 1 Polluted Stretch of Mula-Mutha River .................................................................................. 10
Figure 2 Map Showing Stretch of Mula-Mutha River .......................................................................... 11
Figure 3 Map Showing NWMP Stations across Stretch of Mula-Mutha River....................................... 20
3
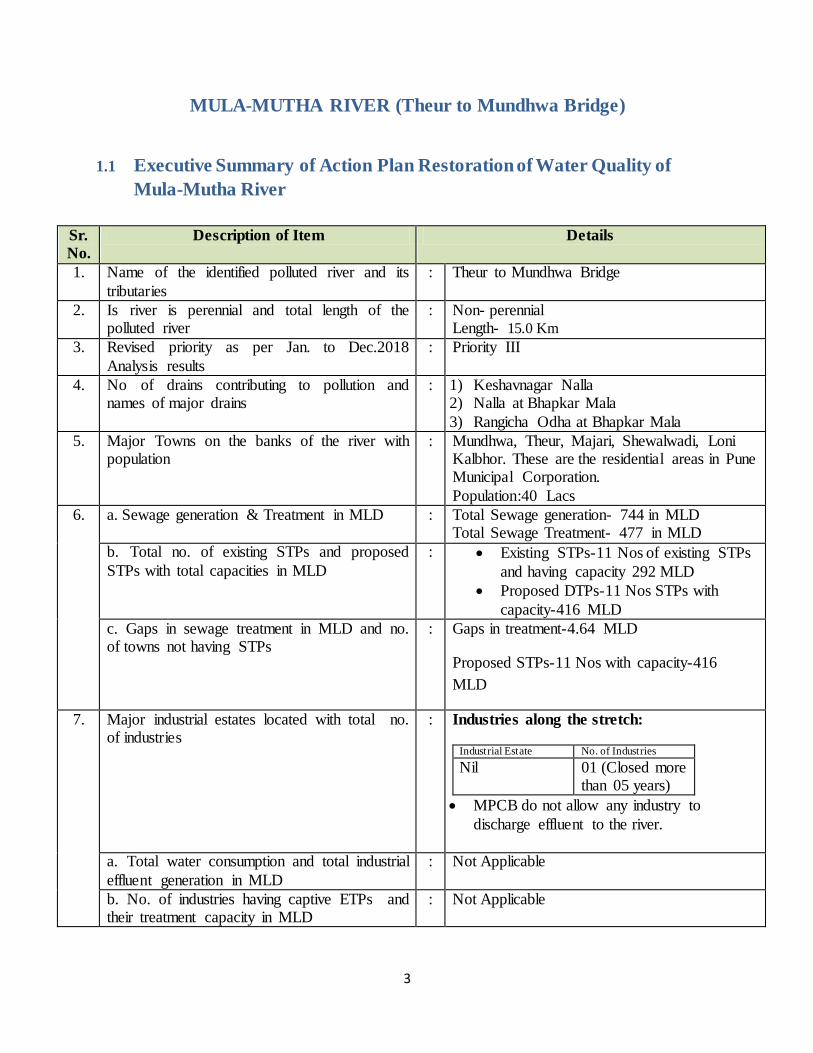
MULA-MUTHA RIVER (Theur to Mundhwa Bridge)
1.1 Executive Summary of Action Plan Restoration of Water Quality of
Mula-Mutha River
Sr.
No.
Description of Item Details
1. Name of the identified polluted river and its
tributaries
: Theur to Mundhwa Bridge
2. Is river is perennial and total length of the polluted river
: Non- perennial Length- 15.0 Km
3. Revised priority as per Jan. to Dec.2018
Analysis results
: Priority III
4. No of drains contributing to pollution and names of major drains
: 1) Keshavnagar Nalla 2) Nalla at Bhapkar Mala
3) Rangicha Odha at Bhapkar Mala
5. Major Towns on the banks of the river with population
: Mundhwa, Theur, Majari, Shewalwadi, Loni Kalbhor. These are the residential areas in Pune Municipal Corporation.
Population:40 Lacs
6. a. Sewage generation & Treatment in MLD : Total Sewage generation- 744 in MLD Total Sewage Treatment- 477 in MLD
b. Total no. of existing STPs and proposed
STPs with total capacities in MLD
: Existing STPs-11 Nos of existing STPs
and having capacity 292 MLD
Proposed DTPs-11 Nos STPs with
capacity-416 MLD
c. Gaps in sewage treatment in MLD and no. of towns not having STPs
: Gaps in treatment-4.64 MLD
Proposed STPs-11 Nos with capacity-416
MLD
7.
Major industrial estates located with total no. of industries
: Industries along the stretch:
Industrial Estate No. of Industries
Nil 01 (Closed more than 05 years)
MPCB do not allow any industry to
discharge effluent to the river.
a. Total water consumption and total industrial
effluent generation in MLD
: Not Applicable
b. No. of industries having captive ETPs and their treatment capacity in MLD
: Not Applicable
4
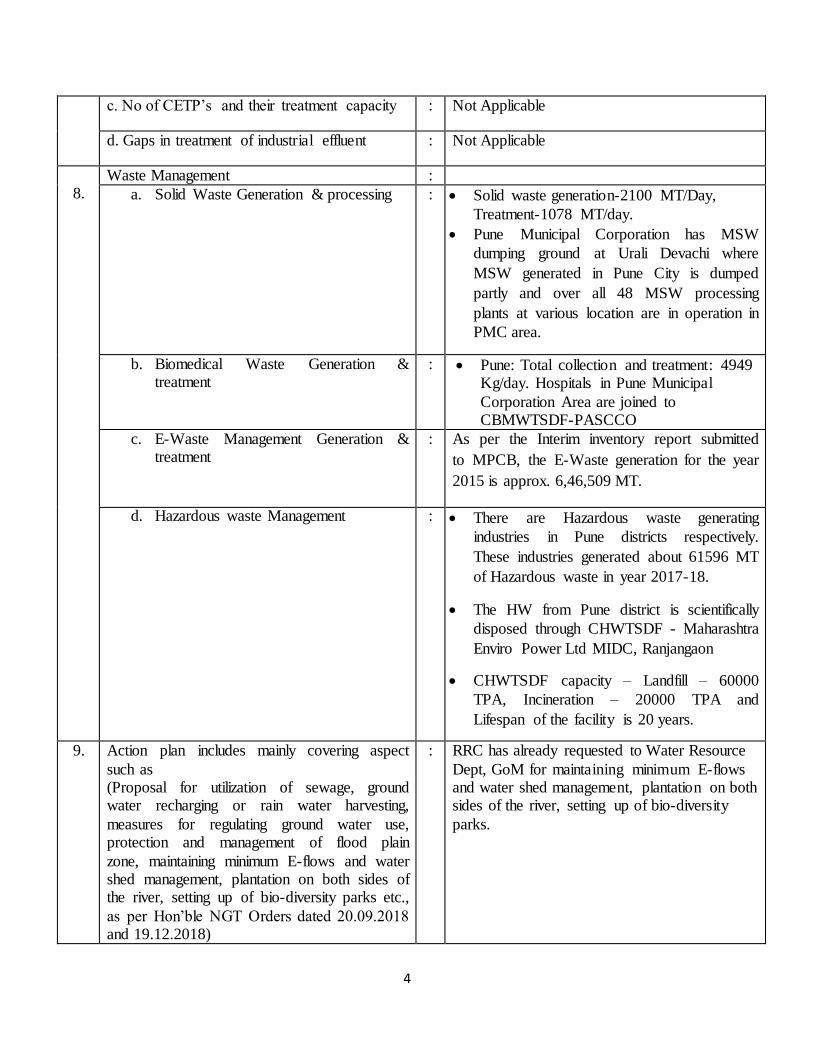
c. No of CETP‟s and their treatment capacity : Not Applicable
d. Gaps in treatment of industrial effluent : Not Applicable
8.
Waste Management :
a. Solid Waste Generation & processing : Solid waste generation-2100 MT/Day,
Treatment-1078 MT/day.
Pune Municipal Corporation has MSW
dumping ground at Urali Devachi where
MSW generated in Pune City is dumped
partly and over all 48 MSW processing
plants at various location are in operation in
PMC area.
b. Biomedical Waste Generation & treatment
: Pune: Total collection and treatment: 4949 Kg/day. Hospitals in Pune Municipal
Corporation Area are joined to CBMWTSDF-PASCCO
c. E-Waste Management Generation & treatment
: As per the Interim inventory report submitted
to MPCB, the E-Waste generation for the year
2015 is approx. 6,46,509 MT.
d. Hazardous waste Management : There are Hazardous waste generating
industries in Pune districts respectively.
These industries generated about 61596 MT
of Hazardous waste in year 2017-18.
The HW from Pune district is scientifically
disposed through CHWTSDF - Maharashtra
Enviro Power Ltd MIDC, Ranjangaon
CHWTSDF capacity – Landfill – 60000
TPA, Incineration – 20000 TPA and
Lifespan of the facility is 20 years.
9. Action plan includes mainly covering aspect
such as (Proposal for utilization of sewage, ground water recharging or rain water harvesting,
measures for regulating ground water use, protection and management of flood plain
zone, maintaining minimum E-flows and water shed management, plantation on both sides of the river, setting up of bio-diversity parks etc.,
as per Hon‟ble NGT Orders dated 20.09.2018 and 19.12.2018)
: RRC has already requested to Water Resource
Dept, GoM for maintaining minimum E-flows and water shed management, plantation on both sides of the river, setting up of bio-diversity
parks.
5
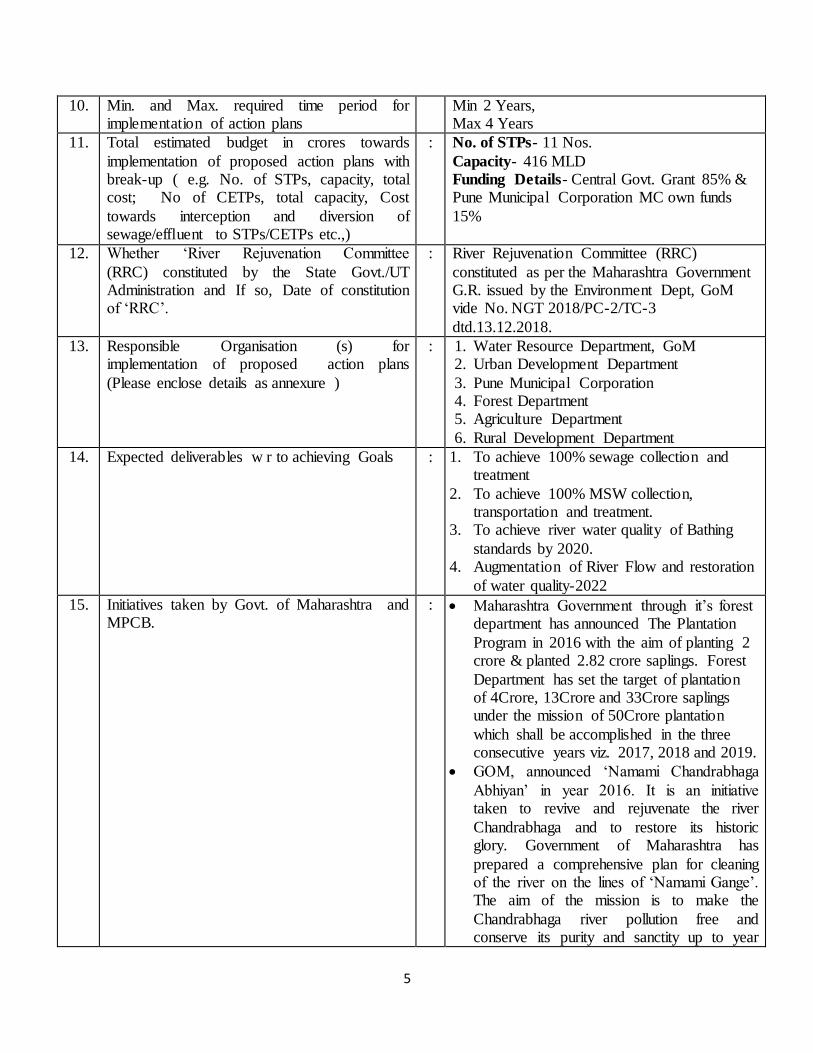
10. Min. and Max. required time period for implementation of action plans
Min 2 Years, Max 4 Years
11. Total estimated budget in crores towards
implementation of proposed action plans with break-up ( e.g. No. of STPs, capacity, total cost; No of CETPs, total capacity, Cost
towards interception and diversion of sewage/effluent to STPs/CETPs etc.,)
: No. of STPs- 11 Nos.
Capacity- 416 MLD Funding Details- Central Govt. Grant 85% & Pune Municipal Corporation MC own funds
15%
12. Whether „River Rejuvenation Committee
(RRC) constituted by the State Govt./UT Administration and If so, Date of constitution of „RRC‟.
: River Rejuvenation Committee (RRC)
constituted as per the Maharashtra Government G.R. issued by the Environment Dept, GoM vide No. NGT 2018/PC-2/TC-3
dtd.13.12.2018.
13. Responsible Organisation (s) for implementation of proposed action plans
(Please enclose details as annexure )
: 1. Water Resource Department, GoM 2. Urban Development Department
3. Pune Municipal Corporation 4. Forest Department 5. Agriculture Department
6. Rural Development Department
14. Expected deliverables w r to achieving Goals
: 1. To achieve 100% sewage collection and treatment
2. To achieve 100% MSW collection, transportation and treatment.
3. To achieve river water quality of Bathing
standards by 2020. 4. Augmentation of River Flow and restoration
of water quality-2022
15. Initiatives taken by Govt. of Maharashtra and MPCB.
: Maharashtra Government through it‟s forest department has announced The Plantation
Program in 2016 with the aim of planting 2 crore & planted 2.82 crore saplings. Forest
Department has set the target of plantation of 4Crore, 13Crore and 33Crore saplings under the mission of 50Crore plantation
which shall be accomplished in the three consecutive years viz. 2017, 2018 and 2019.
GOM, announced „Namami Chandrabhaga
Abhiyan‟ in year 2016. It is an initiative taken to revive and rejuvenate the river
Chandrabhaga and to restore its historic glory. Government of Maharashtra has
prepared a comprehensive plan for cleaning of the river on the lines of „Namami Gange‟. The aim of the mission is to make the
Chandrabhaga river pollution free and conserve its purity and sanctity up to year
6
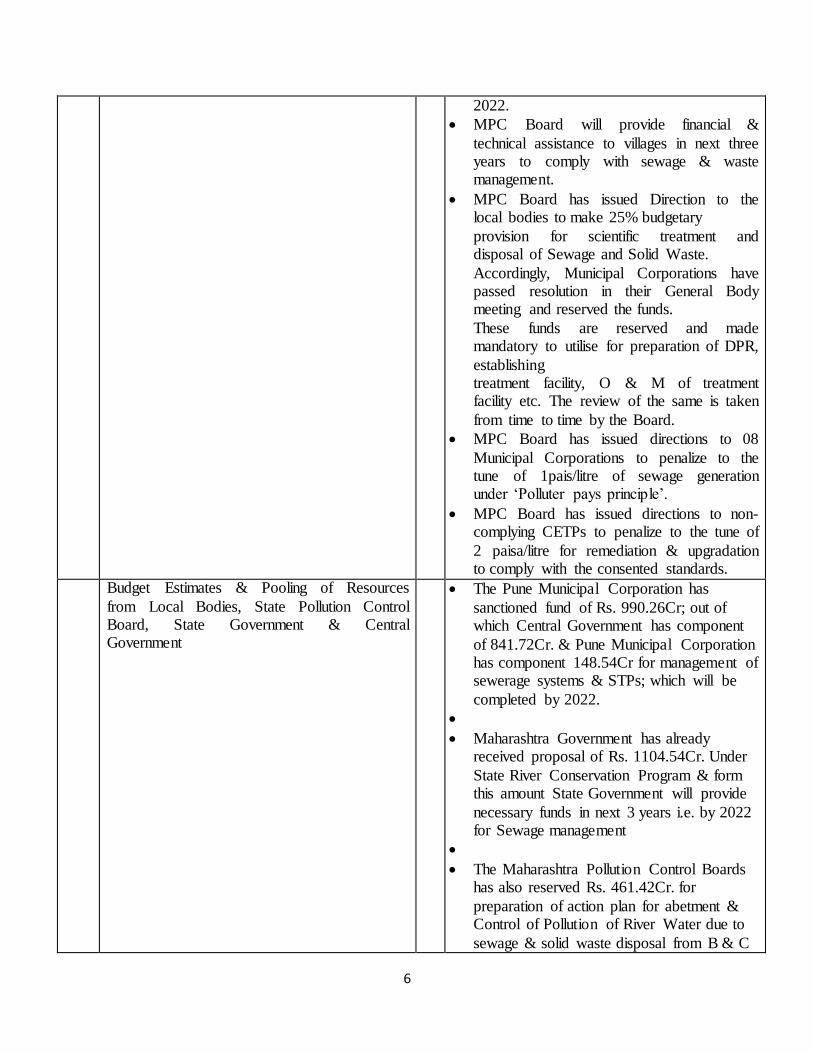
2022.
MPC Board will provide financial &
technical assistance to villages in next three years to comply with sewage & waste management.
MPC Board has issued Direction to the local bodies to make 25% budgetary
provision for scientific treatment and disposal of Sewage and Solid Waste.
Accordingly, Municipal Corporations have passed resolution in their General Body meeting and reserved the funds.
These funds are reserved and made mandatory to utilise for preparation of DPR,
establishing treatment facility, O & M of treatment facility etc. The review of the same is taken
from time to time by the Board.
MPC Board has issued directions to 08
Municipal Corporations to penalize to the tune of 1pais/litre of sewage generation under „Polluter pays principle‟.
MPC Board has issued directions to non-complying CETPs to penalize to the tune of
2 paisa/litre for remediation & upgradation to comply with the consented standards.
Budget Estimates & Pooling of Resources
from Local Bodies, State Pollution Control Board, State Government & Central Government
The Pune Municipal Corporation has
sanctioned fund of Rs. 990.26Cr; out of which Central Government has component
of 841.72Cr. & Pune Municipal Corporation has component 148.54Cr for management of sewerage systems & STPs; which will be
completed by 2022.
Maharashtra Government has already received proposal of Rs. 1104.54Cr. Under
State River Conservation Program & form this amount State Government will provide
necessary funds in next 3 years i.e. by 2022 for Sewage management
The Maharashtra Pollution Control Boards has also reserved Rs. 461.42Cr. for
preparation of action plan for abetment & Control of Pollution of River Water due to
sewage & solid waste disposal from B & C
7
Municipal Councils (342Nos of Urban Local Bodies.), Nagar Panchyat & Gram Panchayat for reducing polluted stretches in
compliance with Hon‟ble NGT, principal bench directions w.r.t. “More River
Stretches are now Critically Polluted”. The said funds will be used for DPR preparation, development of infrastructure for sewage
collection & treatment & development of infrastructure for Solid Waste Management.
The DPR preparation & implementation of the same will be completed by year 2022 (i.e in next 3 years).
The Maharashtra Government through
Urban Development Department has approved DPR of all 388 Urban Local
Bodies for Solid Waste Management. The funds for the same amounting to Rs.
2560.0Cr has been already approved by Government & the said DPRs will be implemented & Solid Waste Management
issues will be resolved by December‟2019.
8
Preamble -
In the matter of OA No. 673 of 2018-"More river stretches are critically polluted now: CPCB",
the Hon'ble NGT has passed order dated 20.09.2018 for constitution of River Rejuvenation
Committee (RRC) and Special Environment Surveillance Task Force (SESTF). The report
comprises 351 polluted river stretches in India out of which 53 polluted river stretches are in
Maharashtra. In the state, 9 polluted stretches in priority I & 6 polluted stretches in priority II. It
has been mandated to prepare Action Plan for River Stretches and make them pollution free. In
compliance of the orders of the Hon'ble NGT, the State Government has constituted RRC.
River Rejuvenation Committee (RRC) constituted as per the Maharashtra Government G.R.
issued by the Environment Dept, GoM vide No. NGT 2018/PC-2/TC-3 dtd.13.12.2018 with 5
members under the guidance of Principal Secretary for preparation of action plans and to monitor
the implementation of these action plans. The members of RRC are as mentioned under:
1. Commissioner / Director, Directorate of Municipal Administration 2. Chief Executive Officer – Maharashtra Industrial Development Corporation
3. Director (Environment) 4. Director (Industries)
5. Member Secretary – Maharashtra Pollution Control Boards- Member & Co-ordinator of RRC
Further State Government also constituted District Level Special Task Force comprising of the following:
1. Representative of District Collector 2. Representative of District Superintendent of Police
3. Representative of Regional Officer, MPCB 4. Representative of the District Judge of the concerned District
Meetings of the RRC Committee:
1st Meeting of River Rejuvenation Committee (RRC) convened on 14.12.2018.
RRC reviewed draft action plans of polluted river stretches of Priority I prepared by
Maharashtra PCB. It was decided by the all the committee members, to take review of
local bodies and accordingly to communicate the outcomes of the meeting to the
Hon‟ble NGT, Principal Bench. Maharashtra PCB submitted nine draft action plans of
polluted river stretches of Priority I to CPCB along with minutes of 1st meeting of RRC
and submitted progress report of polluted river stretches to Hon‟ble NGT on 15.12.2018
9
2nd Meeting of River Rejuvenation Committee (RRC) convened on 09.01.2019.
RRC reviewed draft action plans of polluted river stretches of Priority II prepared by
Maharashtra PCB. It was decided in the meeting to add in the draft action plans funding
details like source, name of scheme, timeline etc for proposed STPs by concern local
bodies.
3rd Meeting of River Rejuvenation Committee (RRC) convened on 23.01.2019.
RRC reviewed and finalised draft action plans of polluted river stretches of Priority I, II,
III, IV and V prepared by Maharashtra PCB. RRC also decided to call the local bodies
and review the timelines proposed in action plans from time to time.
Maharashtra PCB submitted 53 draft action plans of polluted river stretches of Priority I,
II, III, IV and V to CPCB along with minutes of 2nd & 3rd meeting of RRC and submitted
progress report of polluted river stretches to Hon‟ble NGT on 31.01.2019.
CPCB Task Team on Polluted River Stretches called MPCB to give presentation on
Action Plan for Priority-I & II polluted river stretches on 12.02.2019. Accordingly, the
presentations were reviewed by Task team & few improvements in the action plan were
suggested.
4th Meeting of River Rejuvenation Committee (RRC) held on 16/02/2019 & it was
decided to communicate with Water Resource Department to maintain e-flow in the
rivers of Maharashtra adopting good irrigation practices, protection & management of
flood plain zone (FPZ), rain water harvesting, ground water charging, planation on both
sides of river, Setting up of biodiversity parks on flood plains by removing
encroachments and Urban Development department communicated to take necessary
steps to provide adequate funds to urban local bodies for installation of sewage treatment
& MSW processing facilities in a time bound manner so as to comply with the Hon‟ble
NGT.
Achievable goal:
The objective/goal of the action plan is that the quality of river water should meet with the
required value as given under:-
Quality Parameter Standard to be achieved
BOD 3.0 mg/l.
Dissolved Oxygen (DO) More than 5.0 mg/l.
Faecal Coliform Less than 500 MPN/100ml.
10
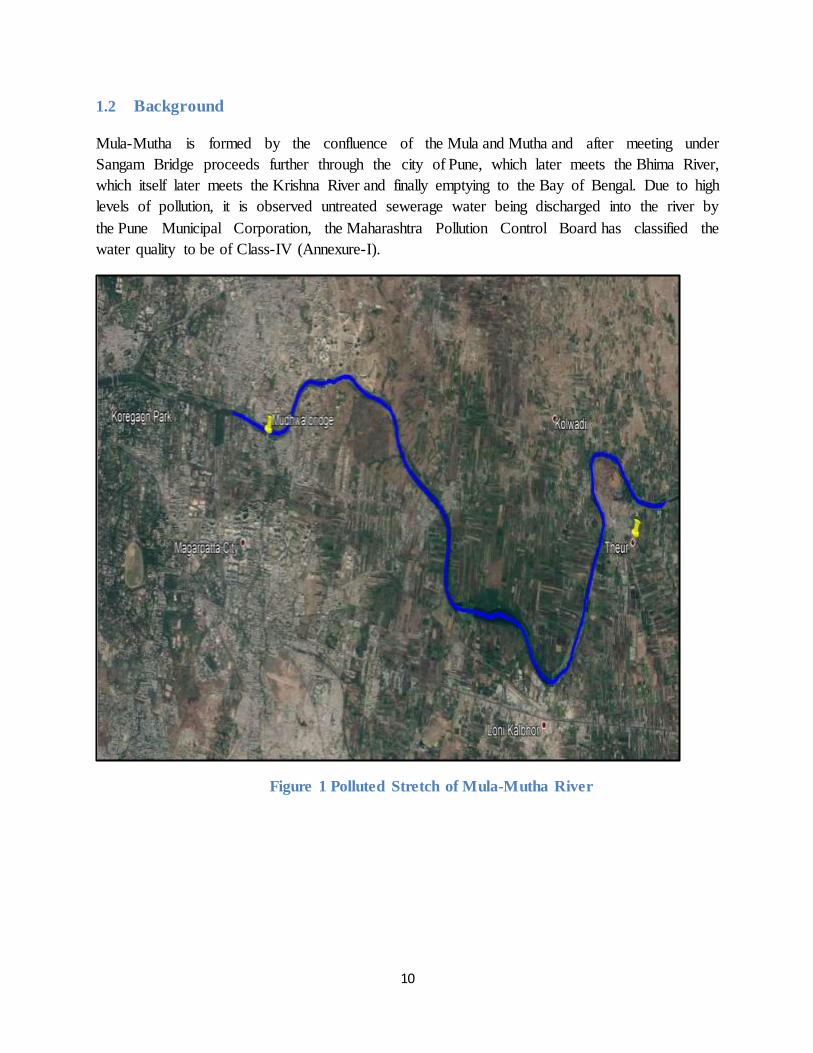
1.2 Background
Mula-Mutha is formed by the confluence of the Mula and Mutha and after meeting under
Sangam Bridge proceeds further through the city of Pune, which later meets the Bhima River,
which itself later meets the Krishna River and finally emptying to the Bay of Bengal. Due to high
levels of pollution, it is observed untreated sewerage water being discharged into the river by
the Pune Municipal Corporation, the Maharashtra Pollution Control Board has classified the
water quality to be of Class-IV (Annexure-I).
Figure 1 Polluted Stretch of Mula-Mutha River
11
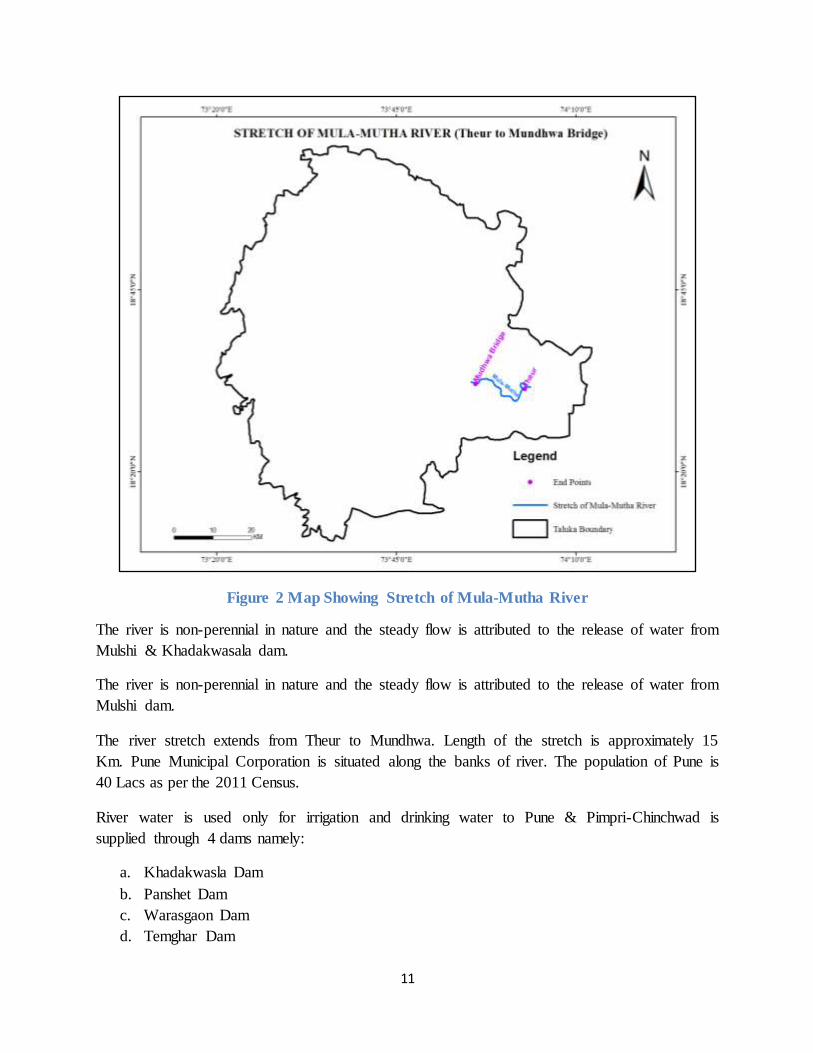
Figure 2 Map Showing Stretch of Mula-Mutha River
The river is non-perennial in nature and the steady flow is attributed to the release of water from
Mulshi & Khadakwasala dam.
The river is non-perennial in nature and the steady flow is attributed to the release of water from
Mulshi dam.
The river stretch extends from Theur to Mundhwa. Length of the stretch is approximately 15
Km. Pune Municipal Corporation is situated along the banks of river. The population of Pune is
40 Lacs as per the 2011 Census.
River water is used only for irrigation and drinking water to Pune & Pimpri-Chinchwad is
supplied through 4 dams namely:
a. Khadakwasla Dam
b. Panshet Dam
c. Warasgaon Dam
d. Temghar Dam
12
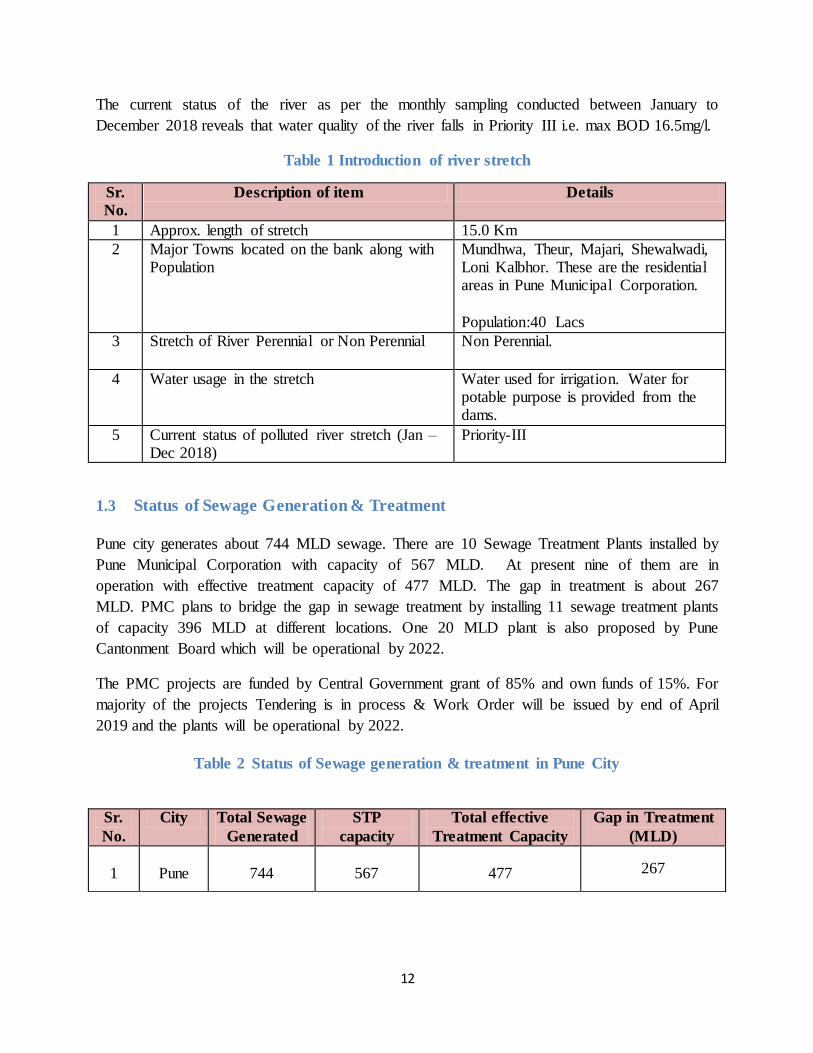
The current status of the river as per the monthly sampling conducted between January to
December 2018 reveals that water quality of the river falls in Priority III i.e. max BOD 16.5mg/l.
Table 1 Introduction of river stretch
Sr.
No. Description of item Details
1 Approx. length of stretch 15.0 Km
2 Major Towns located on the bank along with Population
Mundhwa, Theur, Majari, Shewalwadi, Loni Kalbhor. These are the residential areas in Pune Municipal Corporation.
Population:40 Lacs
3 Stretch of River Perennial or Non Perennial Non Perennial.
4 Water usage in the stretch Water used for irrigation. Water for potable purpose is provided from the dams.
5 Current status of polluted river stretch (Jan – Dec 2018)
Priority-III
1.3 Status of Sewage Generation & Treatment
Pune city generates about 744 MLD sewage. There are 10 Sewage Treatment Plants installed by
Pune Municipal Corporation with capacity of 567 MLD. At present nine of them are in
operation with effective treatment capacity of 477 MLD. The gap in treatment is about 267
MLD. PMC plans to bridge the gap in sewage treatment by installing 11 sewage treatment plants
of capacity 396 MLD at different locations. One 20 MLD plant is also proposed by Pune
Cantonment Board which will be operational by 2022.
The PMC projects are funded by Central Government grant of 85% and own funds of 15%. For
majority of the projects Tendering is in process & Work Order will be issued by end of April
2019 and the plants will be operational by 2022.
Table 2 Status of Sewage generation & treatment in Pune City
Sr.
No.
City Total Sewage
Generated
STP
capacity
Total effective
Treatment Capacity
Gap in Treatment
(MLD)
1
Pune
744
567
477 267
13
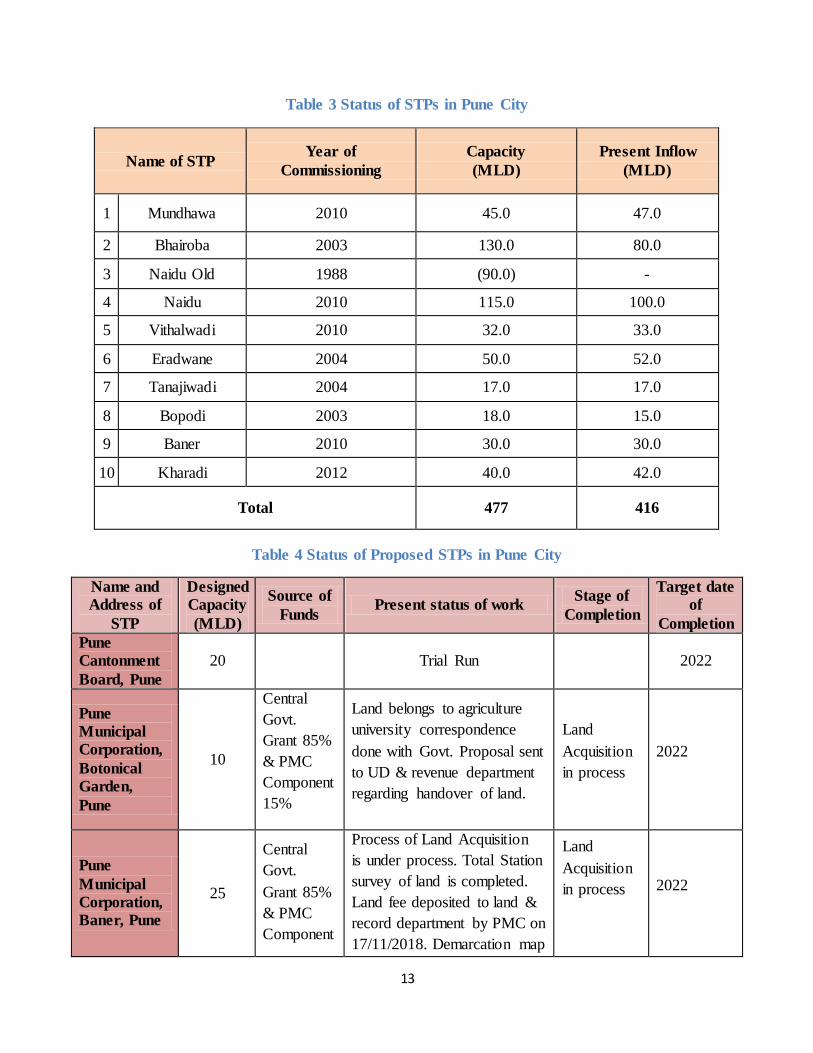
Table 3 Status of STPs in Pune City
Name of STP Year of
Commissioning
Capacity
(MLD)
Present Inflow
(MLD)
1 Mundhawa 2010 45.0 47.0
2 Bhairoba 2003 130.0 80.0
3 Naidu Old 1988 (90.0) -
4 Naidu 2010 115.0 100.0
5 Vithalwadi 2010 32.0 33.0
6 Eradwane 2004 50.0 52.0
7 Tanajiwadi 2004 17.0 17.0
8 Bopodi 2003 18.0 15.0
9 Baner 2010 30.0 30.0
10 Kharadi 2012 40.0 42.0
Total 477 416
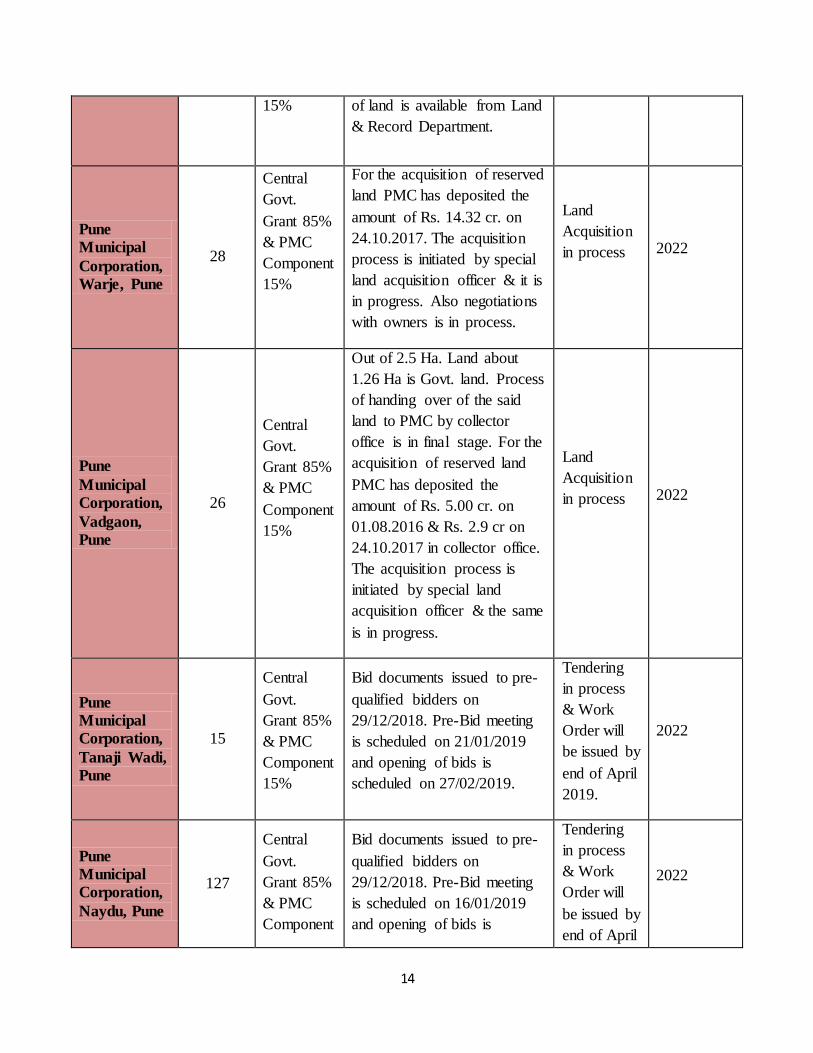
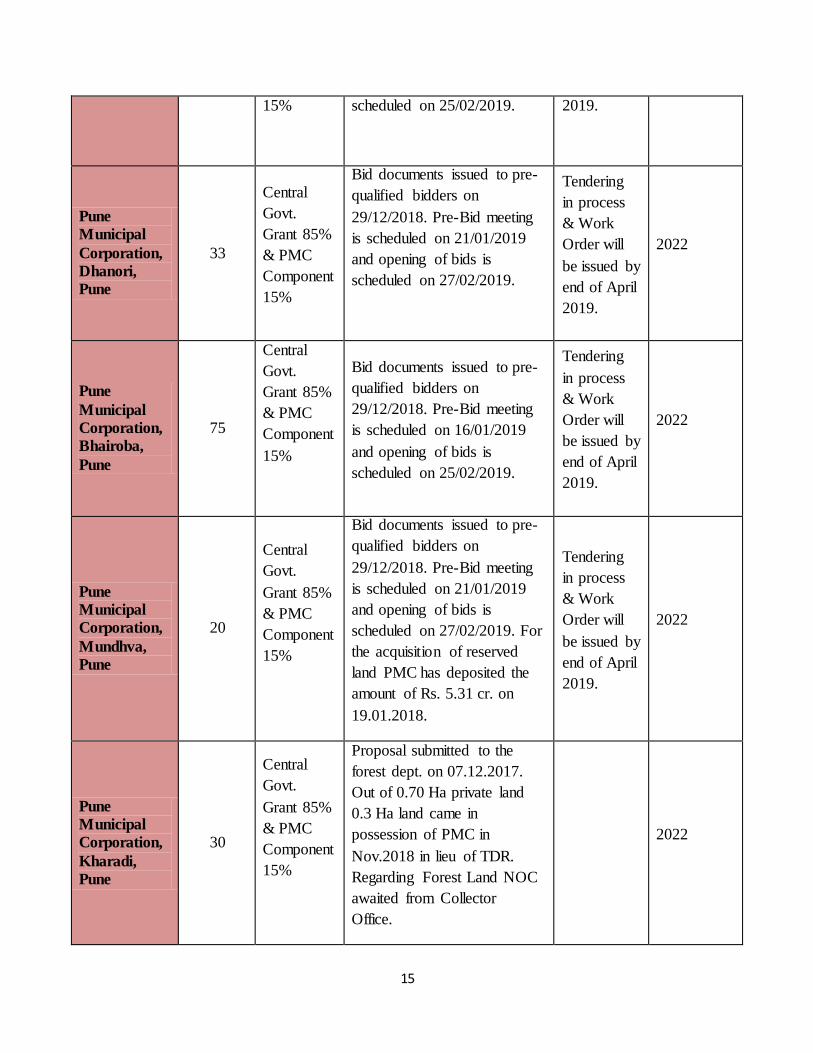
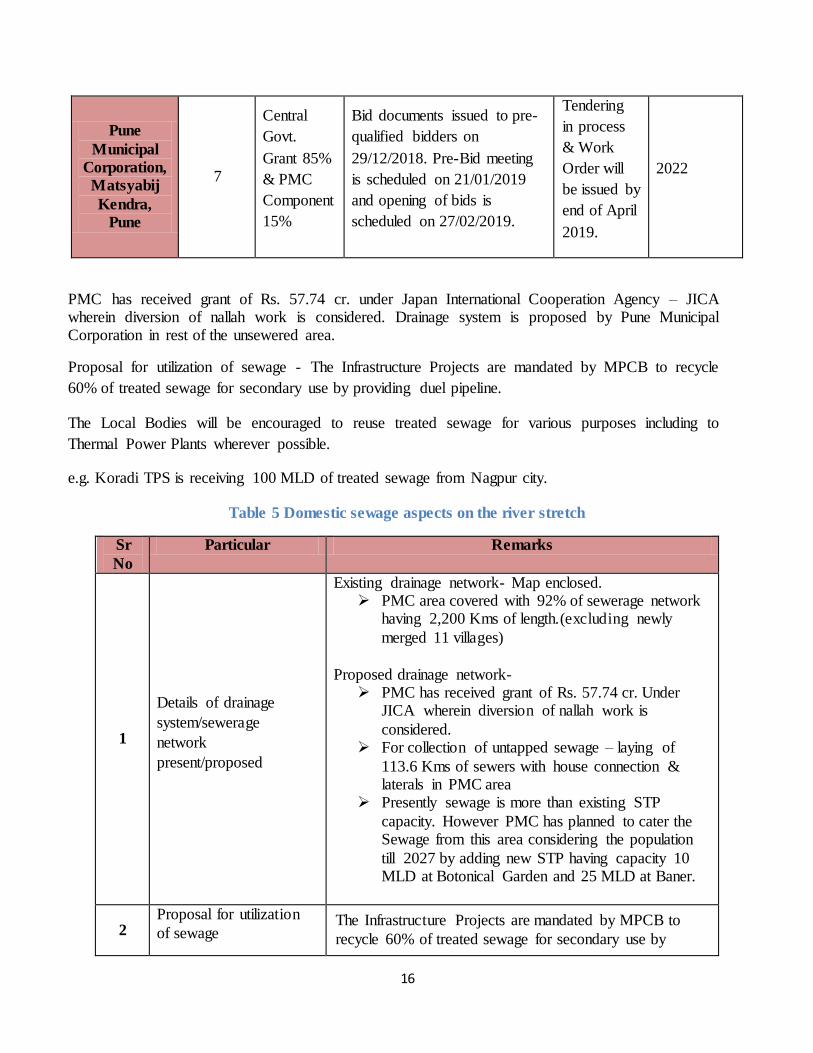
Table 4 Status of Proposed STPs in Pune City
Name and
Address of
STP
Designed
Capacity
(MLD)
Source of
Funds Present status of work
Stage of
Completion
Target date
of
Completion
Pune
Cantonment
Board, Pune
20 Trial Run 2022
Pune
Municipal
Corporation,
Botonical
Garden,
Pune
10
Central
Govt.
Grant 85%
& PMC
Component
15%
Land belongs to agriculture
university correspondence
done with Govt. Proposal sent
to UD & revenue department
regarding handover of land.
Land
Acquisition
in process
2022
Pune
Municipal
Corporation,
Baner, Pune
25
Central
Govt.
Grant 85%
& PMC
Component
Process of Land Acquisition
is under process. Total Station
survey of land is completed.
Land fee deposited to land &
record department by PMC on
17/11/2018. Demarcation map
Land
Acquisition
in process
2022
14
15%
of land is available from Land
& Record Department.
Pune
Municipal
Corporation,
Warje, Pune
28
Central
Govt.
Grant 85%
& PMC
Component
15%
For the acquisition of reserved
land PMC has deposited the
amount of Rs. 14.32 cr. on
24.10.2017. The acquisition
process is initiated by special
land acquisition officer & it is
in progress. Also negotiations
with owners is in process.
Land
Acquisition
in process
2022
Pune
Municipal
Corporation,
Vadgaon,
Pune
26
Central
Govt.
Grant 85%
& PMC
Component
15%
Out of 2.5 Ha. Land about
1.26 Ha is Govt. land. Process
of handing over of the said
land to PMC by collector
office is in final stage. For the
acquisition of reserved land
PMC has deposited the
amount of Rs. 5.00 cr. on
01.08.2016 & Rs. 2.9 cr on
24.10.2017 in collector office.
The acquisition process is
initiated by special land
acquisition officer & the same
is in progress.
Land
Acquisition
in process
2022
Pune
Municipal
Corporation,
Tanaji Wadi,
Pune
15
Central
Govt.
Grant 85%
& PMC
Component
15%
Bid documents issued to pre-
qualified bidders on
29/12/2018. Pre-Bid meeting
is scheduled on 21/01/2019
and opening of bids is
scheduled on 27/02/2019.
Tendering
in process
& Work
Order will
be issued by
end of April
2019.
2022
Pune
Municipal
Corporation,
Naydu, Pune
127
Central
Govt.
Grant 85%
& PMC
Component
Bid documents issued to pre-
qualified bidders on
29/12/2018. Pre-Bid meeting
is scheduled on 16/01/2019
and opening of bids is
Tendering
in process
& Work
Order will
be issued by
end of April
2022
15
15% scheduled on 25/02/2019.
2019.
Pune
Municipal
Corporation,
Dhanori,
Pune
33
Central
Govt.
Grant 85%
& PMC
Component
15%
Bid documents issued to pre-
qualified bidders on
29/12/2018. Pre-Bid meeting
is scheduled on 21/01/2019
and opening of bids is
scheduled on 27/02/2019.
Tendering
in process
& Work
Order will
be issued by
end of April
2019.
2022
Pune
Municipal
Corporation,
Bhairoba,
Pune
75
Central
Govt.
Grant 85%
& PMC
Component
15%
Bid documents issued to pre-
qualified bidders on
29/12/2018. Pre-Bid meeting
is scheduled on 16/01/2019
and opening of bids is
scheduled on 25/02/2019.
Tendering
in process
& Work
Order will
be issued by
end of April
2019.
2022
Pune
Municipal
Corporation,
Mundhva,
Pune
20
Central
Govt.
Grant 85%
& PMC
Component
15%
Bid documents issued to pre-
qualified bidders on
29/12/2018. Pre-Bid meeting
is scheduled on 21/01/2019
and opening of bids is
scheduled on 27/02/2019. For
the acquisition of reserved
land PMC has deposited the
amount of Rs. 5.31 cr. on
19.01.2018.
Tendering
in process
& Work
Order will
be issued by
end of April
2019.
2022
Pune
Municipal
Corporation,
Kharadi,
Pune
30
Central
Govt.
Grant 85%
& PMC
Component
15%
Proposal submitted to the
forest dept. on 07.12.2017.
Out of 0.70 Ha private land
0.3 Ha land came in
possession of PMC in
Nov.2018 in lieu of TDR.
Regarding Forest Land NOC
awaited from Collector
Office.
2022
16
Pune
Municipal
Corporation,
Matsyabij
Kendra,
Pune
7
Central
Govt.
Grant 85%
& PMC
Component
15%
Bid documents issued to pre-
qualified bidders on
29/12/2018. Pre-Bid meeting
is scheduled on 21/01/2019
and opening of bids is
scheduled on 27/02/2019.
Tendering
in process
& Work
Order will
be issued by
end of April
2019.
2022
PMC has received grant of Rs. 57.74 cr. under Japan International Cooperation Agency – JICA wherein diversion of nallah work is considered. Drainage system is proposed by Pune Municipal Corporation in rest of the unsewered area.
Proposal for utilization of sewage - The Infrastructure Projects are mandated by MPCB to recycle
60% of treated sewage for secondary use by providing duel pipeline.
The Local Bodies will be encouraged to reuse treated sewage for various purposes including to
Thermal Power Plants wherever possible.
e.g. Koradi TPS is receiving 100 MLD of treated sewage from Nagpur city.
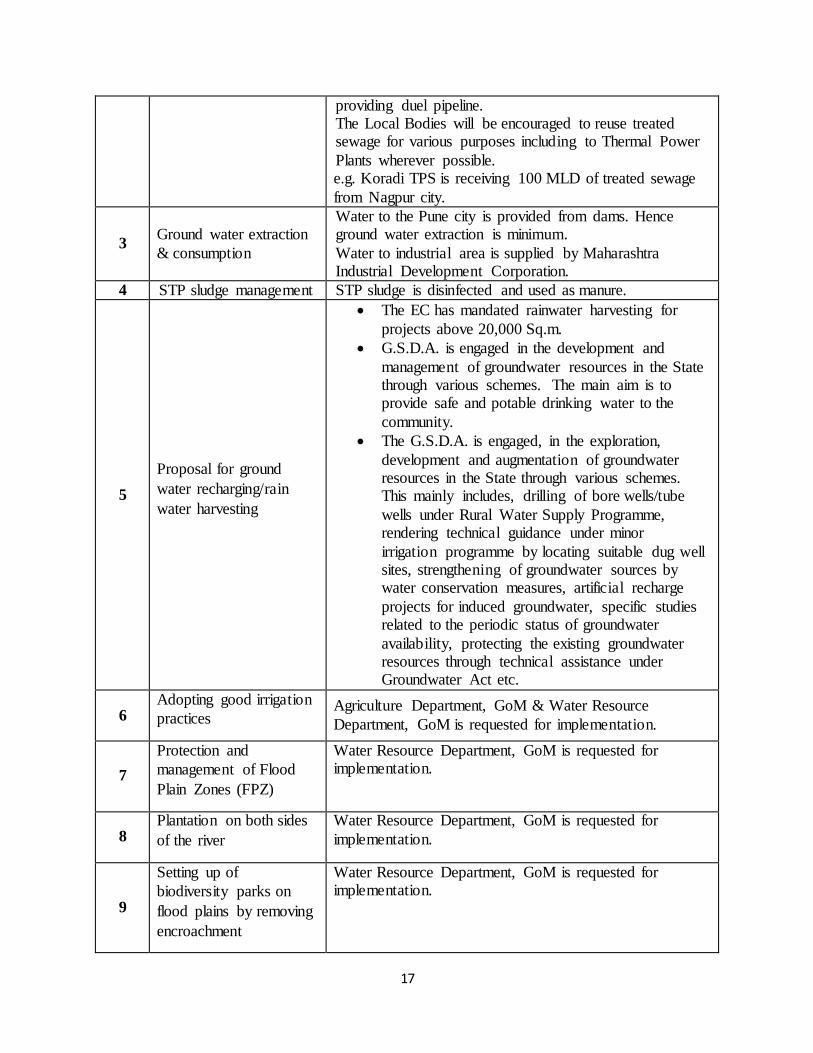
Table 5 Domestic sewage aspects on the river stretch
Sr
No
Particular Remarks
1
Details of drainage
system/sewerage
network
present/proposed
Existing drainage network- Map enclosed. PMC area covered with 92% of sewerage network
having 2,200 Kms of length.(excluding newly
merged 11 villages)
Proposed drainage network- PMC has received grant of Rs. 57.74 cr. Under
JICA wherein diversion of nallah work is
considered. For collection of untapped sewage – laying of
113.6 Kms of sewers with house connection & laterals in PMC area
Presently sewage is more than existing STP
capacity. However PMC has planned to cater the Sewage from this area considering the population
till 2027 by adding new STP having capacity 10 MLD at Botonical Garden and 25 MLD at Baner.
2 Proposal for utilization
of sewage The Infrastructure Projects are mandated by MPCB to
recycle 60% of treated sewage for secondary use by
17
providing duel pipeline. The Local Bodies will be encouraged to reuse treated sewage for various purposes including to Thermal Power
Plants wherever possible. e.g. Koradi TPS is receiving 100 MLD of treated sewage
from Nagpur city.
3 Ground water extraction
& consumption
Water to the Pune city is provided from dams. Hence ground water extraction is minimum.
Water to industrial area is supplied by Maharashtra Industrial Development Corporation.
4 STP sludge management STP sludge is disinfected and used as manure.
5
Proposal for ground
water recharging/rain
water harvesting
The EC has mandated rainwater harvesting for
projects above 20,000 Sq.m.
G.S.D.A. is engaged in the development and
management of groundwater resources in the State through various schemes. The main aim is to provide safe and potable drinking water to the
community.
The G.S.D.A. is engaged, in the exploration,
development and augmentation of groundwater resources in the State through various schemes. This mainly includes, drilling of bore wells/tube
wells under Rural Water Supply Programme, rendering technical guidance under minor
irrigation programme by locating suitable dug well sites, strengthening of groundwater sources by water conservation measures, artificial recharge
projects for induced groundwater, specific studies related to the periodic status of groundwater
availability, protecting the existing groundwater resources through technical assistance under Groundwater Act etc.
6 Adopting good irrigation
practices Agriculture Department, GoM & Water Resource
Department, GoM is requested for implementation.
7
Protection and
management of Flood
Plain Zones (FPZ)
Water Resource Department, GoM is requested for implementation.
8 Plantation on both sides
of the river
Water Resource Department, GoM is requested for
implementation.
9
Setting up of
biodiversity parks on
flood plains by removing
encroachment
Water Resource Department, GoM is requested for implementation.
18
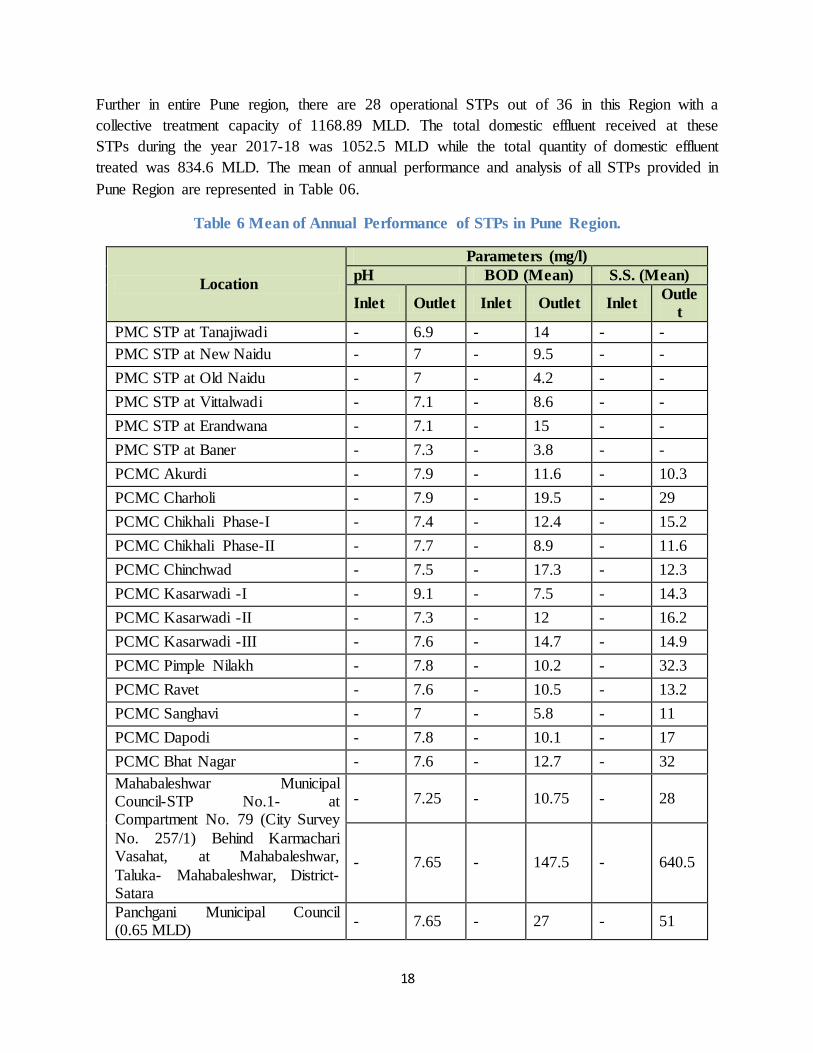
Further in entire Pune region, there are 28 operational STPs out of 36 in this Region with a
collective treatment capacity of 1168.89 MLD. The total domestic effluent received at these
STPs during the year 2017-18 was 1052.5 MLD while the total quantity of domestic effluent
treated was 834.6 MLD. The mean of annual performance and analysis of all STPs provided in
Pune Region are represented in Table 06.
Table 6 Mean of Annual Performance of STPs in Pune Region.
Location
Parameters (mg/l)
pH BOD (Mean) S.S. (Mean)
Inlet Outlet Inlet Outlet Inlet Outle
t
PMC STP at Tanajiwadi - 6.9 - 14 - -
PMC STP at New Naidu - 7 - 9.5 - -
PMC STP at Old Naidu - 7 - 4.2 - -
PMC STP at Vittalwadi - 7.1 - 8.6 - -
PMC STP at Erandwana - 7.1 - 15 - -
PMC STP at Baner - 7.3 - 3.8 - -
PCMC Akurdi - 7.9 - 11.6 - 10.3
PCMC Charholi - 7.9 - 19.5 - 29
PCMC Chikhali Phase-I - 7.4 - 12.4 - 15.2
PCMC Chikhali Phase-II - 7.7 - 8.9 - 11.6
PCMC Chinchwad - 7.5 - 17.3 - 12.3
PCMC Kasarwadi -I - 9.1 - 7.5 - 14.3
PCMC Kasarwadi -II - 7.3 - 12 - 16.2
PCMC Kasarwadi -III - 7.6 - 14.7 - 14.9
PCMC Pimple Nilakh - 7.8 - 10.2 - 32.3
PCMC Ravet - 7.6 - 10.5 - 13.2
PCMC Sanghavi - 7 - 5.8 - 11
PCMC Dapodi - 7.8 - 10.1 - 17
PCMC Bhat Nagar - 7.6 - 12.7 - 32
Mahabaleshwar Municipal Council-STP No.1- at Compartment No. 79 (City Survey
No. 257/1) Behind Karmachari Vasahat, at Mahabaleshwar,
Taluka- Mahabaleshwar, District-Satara
- 7.25 - 10.75 - 28
- 7.65 - 147.5 - 640.5
Panchgani Municipal Council (0.65 MLD)
- 7.65 - 27 - 51
19
Panchgani Municipal Council (0.35 MLD)
- 7.5 - 8.55 - 27.5
Panchgani Municipal Council (1.5
MLD) - 7.6 - 78 123
Karad Municipal Council - 7.3 - 32.83 31.33
Malkapur City - 8.5 - 7 - 24
Solapur Municipal Corporation, Solapur Kumathe STP
- 8.1 - 4.95 - 13
Solapur Municipal Corporation, Solapur Degaon STP
- 8.1 - 5.5 - 12
Solapur Municipal Corporation, Solapur Pratap Nagar STP
- 8.2 - 4.05 - 11.5
Pandharpur Municipal Corporation,
Solapur Pandharpur STP
7.8 7.4 - 85 - 21.25
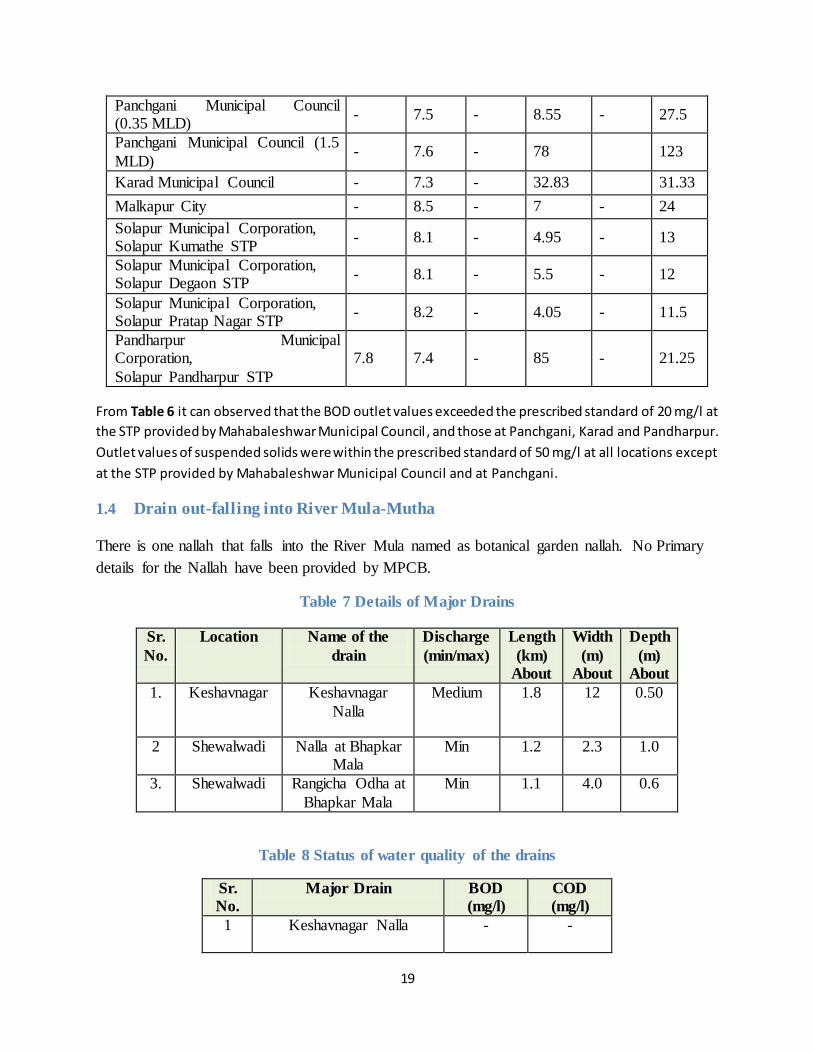
From Table 6 it can observed that the BOD outlet values exceeded the prescribed standard of 20 mg/l at
the STP provided by Mahabaleshwar Municipal Council , and those at Panchgani, Karad and Pandharpur.
Outlet values of suspended solids were within the prescribed standard of 50 mg/l at all locations except
at the STP provided by Mahabaleshwar Municipal Council and at Panchgani.
1.4 Drain out-falling into River Mula-Mutha
There is one nallah that falls into the River Mula named as botanical garden nallah. No Primary
details for the Nallah have been provided by MPCB.
Table 7 Details of Major Drains
Sr.
No.
Location Name of the
drain
Discharge
(min/max)
Length
(km)
About
Width
(m)
About
Depth
(m)
About
1. Keshavnagar Keshavnagar
Nalla
Medium 1.8 12 0.50
2 Shewalwadi Nalla at Bhapkar Mala
Min 1.2 2.3 1.0
3. Shewalwadi Rangicha Odha at
Bhapkar Mala
Min 1.1 4.0 0.6
Table 8 Status of water quality of the drains
Sr.
No.
Major Drain BOD
(mg/l)
COD
(mg/l)
1 Keshavnagar Nalla - -
20
2 Shewalwadi Nalla at Bhapkar Mala
92.0 284.0
3 Rangicha Odha at Bhapkar
Mala
54.0 168.0
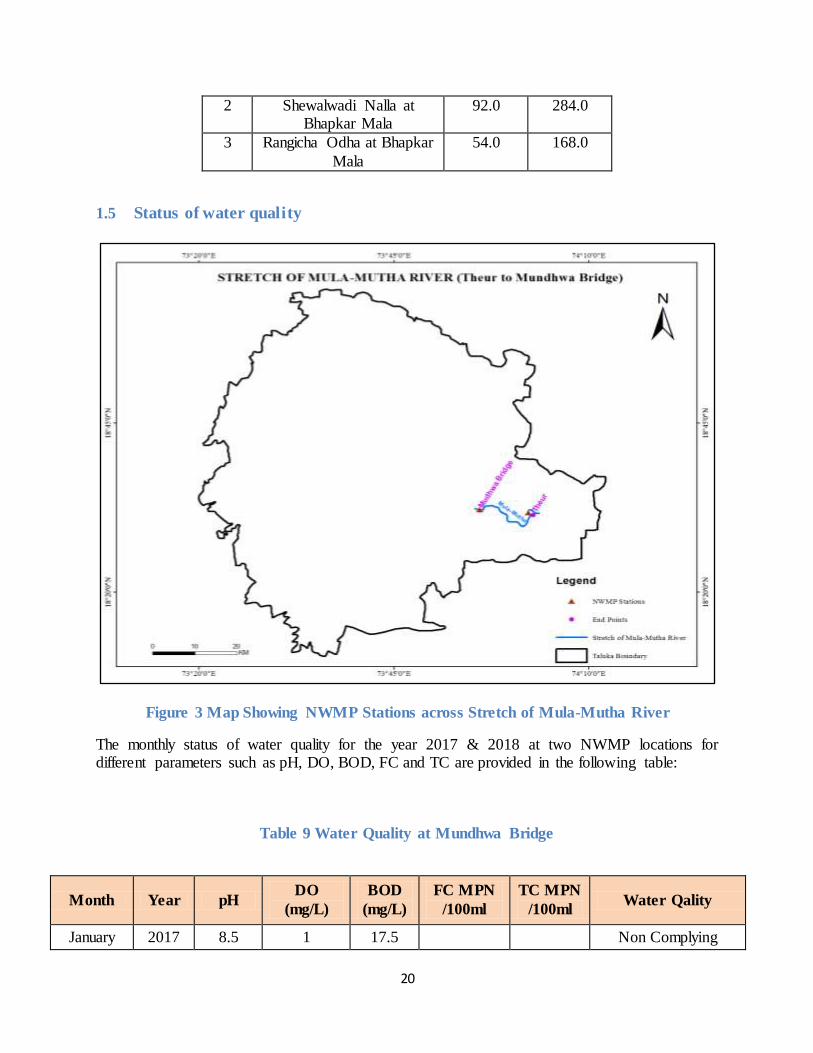
1.5 Status of water quality
Figure 3 Map Showing NWMP Stations across Stretch of Mula-Mutha River
The monthly status of water quality for the year 2017 & 2018 at two NWMP locations for different parameters such as pH, DO, BOD, FC and TC are provided in the following table:
Table 9 Water Quality at Mundhwa Bridge
Month Year pH DO
(mg/L)
BOD
(mg/L)
FC MPN
/100ml
TC MPN
/100ml Water Qality
January 2017 8.5 1 17.5 Non Complying
21
2018 8.1 4.5 10 200 1600 Non Complying
February 2017 7.4 1.8 19 225 1800+ Non Complying
2018 8.2 4.3 11.5 200 1600 Non Complying
March 2017 8.8 1.7 15 Non Complying
2018 8.1 4.5 11 140 900 Non Complying
April 2017 7.3 1.5 21 70 550 Non Complying
2018 7.8 4.8 11.5 200 1600 Non Complying
May 2017 8.1 0.5 19 40 140 Non Complying
2018 8.52 4.4 13 170 900 Non Complying
June 2017 8.2 1.2 16 200 1600 Non Complying
2018 7.9 5.2 10 225 1600 Non Complying
July 2017 8.2 5.6 7 140 900 Non Complying
2018 7.5 3.3 14.5 200 1600 Non Complying
August 2017 8.1 6.0 7.2 225 1600 Non Complying
2018 8 3.8 8.5 350 1800+ Non Complying
September 2017 7.1 4.0 15 225 1800 Non Complying
2018 7.2 1.0 15.5 1600 1800+ Non Complying
October 2017 7.5 4.3 10.5 250 1600 Non Complying
2018 7.6 2.3 16.5 250 1800+ Non Complying
November 2017 8.4 4.0 13 225 1600 Non Complying
2018 7.3 1.2 13.5 250 1800+ Non Complying
December 2017 8.1 3.4 16 250 1600 Non Complying
2018 7.75 1.4 9.5 200 1600 Non Complying
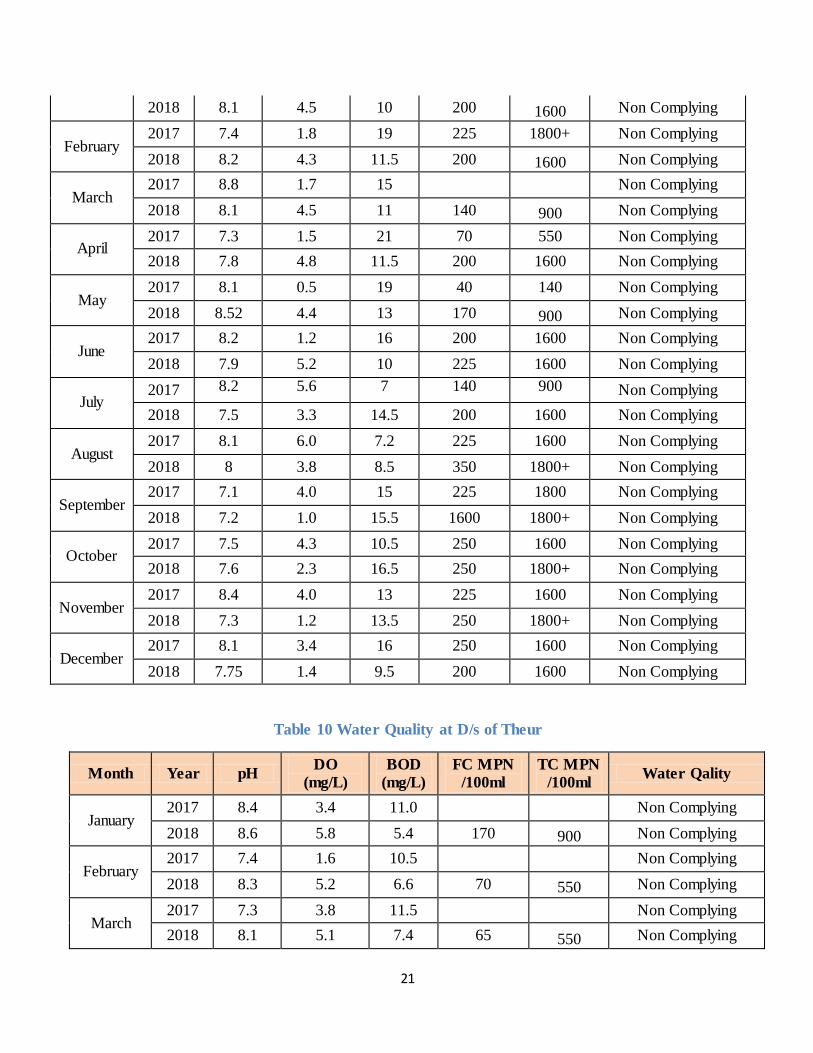
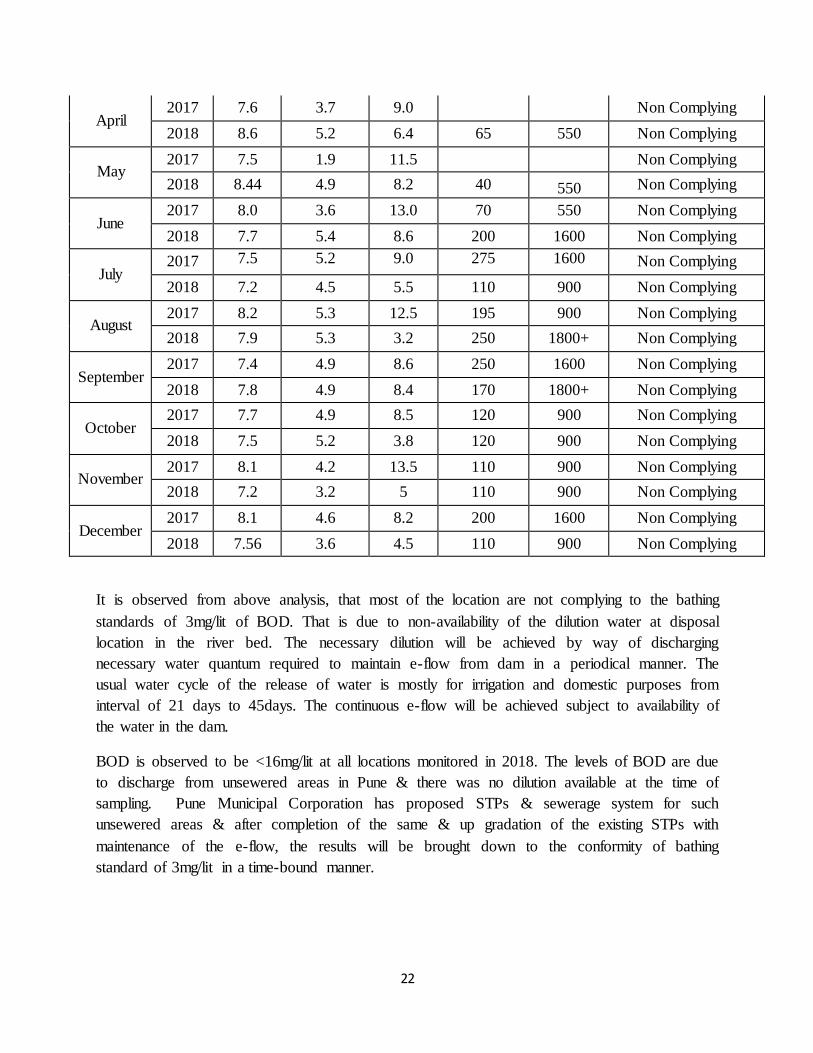
Table 10 Water Quality at D/s of Theur
Month Year pH DO
(mg/L)
BOD
(mg/L)
FC MPN
/100ml
TC MPN
/100ml Water Qality
January 2017 8.4 3.4 11.0 Non Complying
2018 8.6 5.8 5.4 170 900 Non Complying
February 2017 7.4 1.6 10.5 Non Complying
2018 8.3 5.2 6.6 70 550 Non Complying
March 2017 7.3 3.8 11.5 Non Complying
2018 8.1 5.1 7.4 65 550 Non Complying
22
April 2017 7.6 3.7 9.0 Non Complying
2018 8.6 5.2 6.4 65 550 Non Complying
May 2017 7.5 1.9 11.5 Non Complying
2018 8.44 4.9 8.2 40 550 Non Complying
June 2017 8.0 3.6 13.0 70 550 Non Complying
2018 7.7 5.4 8.6 200 1600 Non Complying
July 2017 7.5 5.2 9.0 275 1600 Non Complying
2018 7.2 4.5 5.5 110 900 Non Complying
August 2017 8.2 5.3 12.5 195 900 Non Complying
2018 7.9 5.3 3.2 250 1800+ Non Complying
September 2017 7.4 4.9 8.6 250 1600 Non Complying
2018 7.8 4.9 8.4 170 1800+ Non Complying
October 2017 7.7 4.9 8.5 120 900 Non Complying
2018 7.5 5.2 3.8 120 900 Non Complying
November 2017 8.1 4.2 13.5 110 900 Non Complying
2018 7.2 3.2 5 110 900 Non Complying
December 2017 8.1 4.6 8.2 200 1600 Non Complying
2018 7.56 3.6 4.5 110 900 Non Complying
It is observed from above analysis, that most of the location are not complying to the bathing
standards of 3mg/lit of BOD. That is due to non-availability of the dilution water at disposal
location in the river bed. The necessary dilution will be achieved by way of discharging
necessary water quantum required to maintain e-flow from dam in a periodical manner. The
usual water cycle of the release of water is mostly for irrigation and domestic purposes from
interval of 21 days to 45days. The continuous e-flow will be achieved subject to availability of
the water in the dam.
BOD is observed to be <16mg/lit at all locations monitored in 2018. The levels of BOD are due
to discharge from unsewered areas in Pune & there was no dilution available at the time of
sampling. Pune Municipal Corporation has proposed STPs & sewerage system for such
unsewered areas & after completion of the same & up gradation of the existing STPs with
maintenance of the e-flow, the results will be brought down to the conformity of bathing
standard of 3mg/lit in a time-bound manner.
23
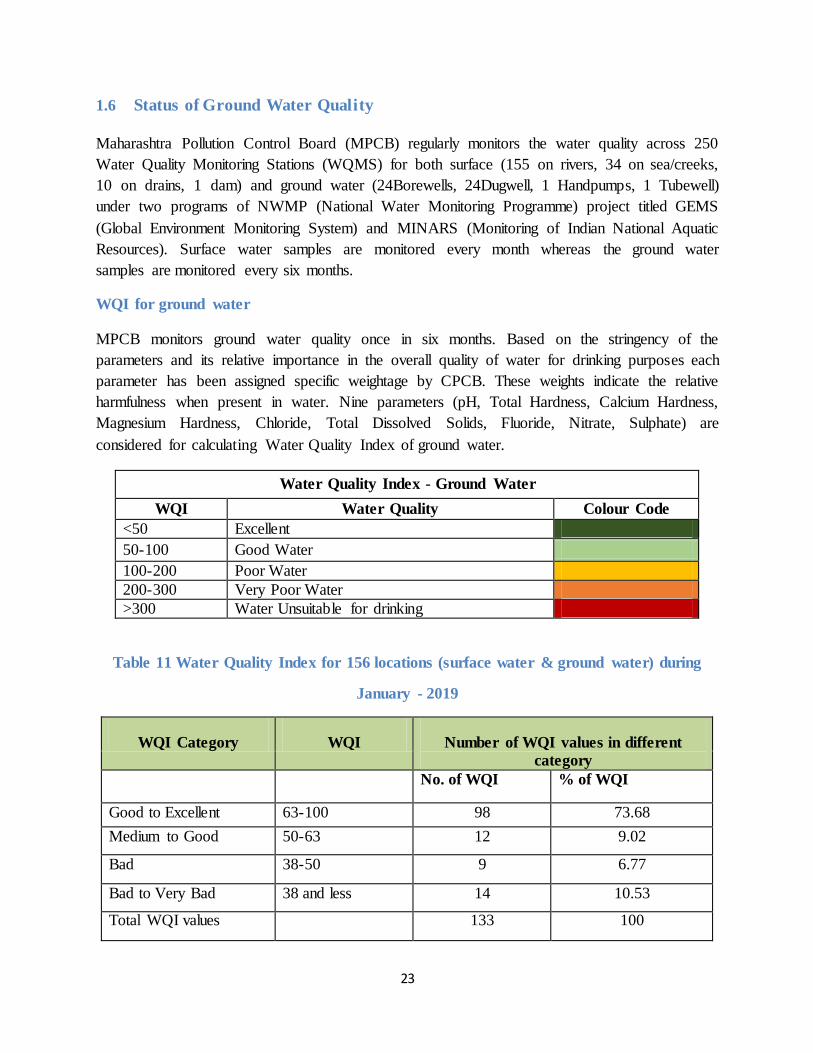
1.6 Status of Ground Water Quality
Maharashtra Pollution Control Board (MPCB) regularly monitors the water quality across 250
Water Quality Monitoring Stations (WQMS) for both surface (155 on rivers, 34 on sea/creeks,
10 on drains, 1 dam) and ground water (24Borewells, 24Dugwell, 1 Handpumps, 1 Tubewell)
under two programs of NWMP (National Water Monitoring Programme) project titled GEMS
(Global Environment Monitoring System) and MINARS (Monitoring of Indian National Aquatic
Resources). Surface water samples are monitored every month whereas the ground water
samples are monitored every six months.
WQI for ground water
MPCB monitors ground water quality once in six months. Based on the stringency of the
parameters and its relative importance in the overall quality of water for drinking purposes each
parameter has been assigned specific weightage by CPCB. These weights indicate the relative
harmfulness when present in water. Nine parameters (pH, Total Hardness, Calcium Hardness,
Magnesium Hardness, Chloride, Total Dissolved Solids, Fluoride, Nitrate, Sulphate) are
considered for calculating Water Quality Index of ground water.
Water Quality Index - Ground Water
WQI Water Quality Colour Code
<50 Excellent
50-100 Good Water
100-200 Poor Water
200-300 Very Poor Water
>300 Water Unsuitable for drinking
Table 11 Water Quality Index for 156 locations (surface water & ground water) during
January - 2019
WQI Category WQI Number of WQI values in different
category
No. of WQI % of WQI
Good to Excellent 63-100 98 73.68
Medium to Good 50-63 12 9.02
Bad 38-50 9 6.77
Bad to Very Bad 38 and less 14 10.53
Total WQI values 133 100
24
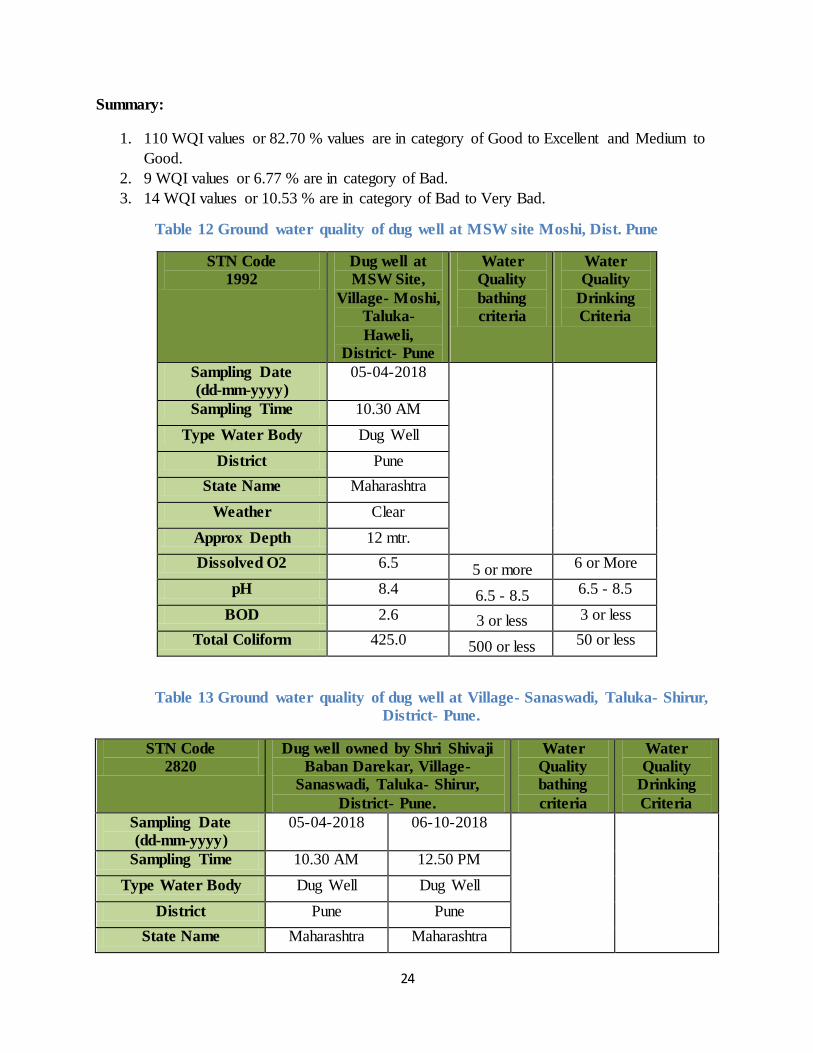
Summary:
1. 110 WQI values or 82.70 % values are in category of Good to Excellent and Medium to
Good.
2. 9 WQI values or 6.77 % are in category of Bad.
3. 14 WQI values or 10.53 % are in category of Bad to Very Bad.
Table 12 Ground water quality of dug well at MSW site Moshi, Dist. Pune
STN Code
1992 Dug well at
MSW Site,
Village- Moshi,
Taluka-
Haweli,
District- Pune
Water
Quality
bathing
criteria
Water
Quality
Drinking
Criteria
Sampling Date
(dd-mm-yyyy)
05-04-2018
Sampling Time 10.30 AM
Type Water Body Dug Well
District Pune
State Name Maharashtra
Weather Clear
Approx Depth 12 mtr.
Dissolved O2 6.5 5 or more 6 or More
pH 8.4 6.5 - 8.5 6.5 - 8.5
BOD 2.6 3 or less 3 or less
Total Coliform 425.0 500 or less 50 or less
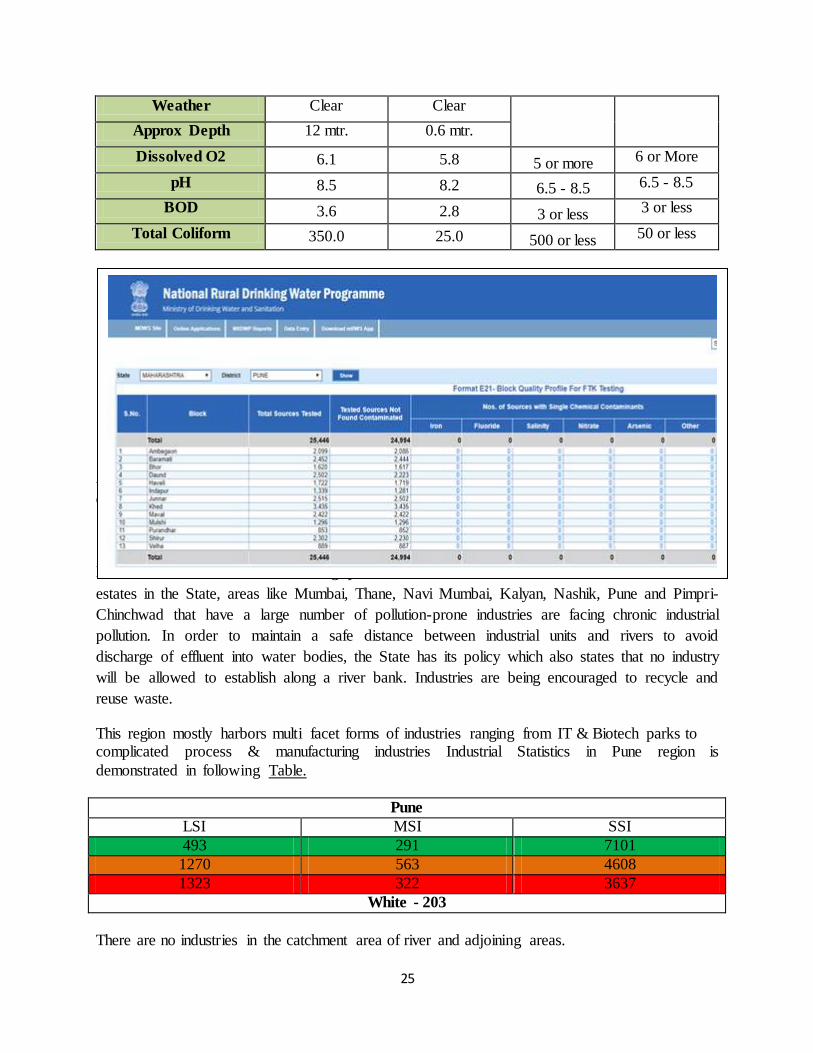
Table 13 Ground water quality of dug well at Village- Sanaswadi, Taluka- Shirur,
District- Pune.
STN Code
2820 Dug well owned by Shri Shivaji
Baban Darekar, Village-
Sanaswadi, Taluka- Shirur,
District- Pune.
Water
Quality
bathing
criteria
Water
Quality
Drinking
Criteria
Sampling Date
(dd-mm-yyyy)
05-04-2018 06-10-2018
Sampling Time 10.30 AM 12.50 PM
Type Water Body Dug Well Dug Well
District Pune Pune
State Name Maharashtra Maharashtra
25
Weather Clear Clear
Approx Depth 12 mtr. 0.6 mtr.
Dissolved O2 6.1 5.8 5 or more 6 or More
pH 8.5 8.2 6.5 - 8.5 6.5 - 8.5
BOD 3.6 2.8 3 or less 3 or less
Total Coliform 350.0 25.0 500 or less 50 or less
4.
5.
6.
7.
8.
9.
10.
Above Figure shows there is no contamination of metals in above mentioned blocks in Pune
district as per the published data of NRDWP, Ministry of drinking water and sanitation.
1.7 Status of Industrial Effluent Generation & Treatment
Maharashtra is one of the most highly industrialized states in India. With a rise in industrial
estates in the State, areas like Mumbai, Thane, Navi Mumbai, Kalyan, Nashik, Pune and Pimpri-
Chinchwad that have a large number of pollution-prone industries are facing chronic industrial
pollution. In order to maintain a safe distance between industrial units and rivers to avoid
discharge of effluent into water bodies, the State has its policy which also states that no industry
will be allowed to establish along a river bank. Industries are being encouraged to recycle and
reuse waste.
This region mostly harbors multi facet forms of industries ranging from IT & Biotech parks to complicated process & manufacturing industries Industrial Statistics in Pune region is
demonstrated in following Table.
Pune
LSI MSI SSI
493 291 7101
1270 563 4608
1323 322 3637
White - 203
There are no industries in the catchment area of river and adjoining areas.
26
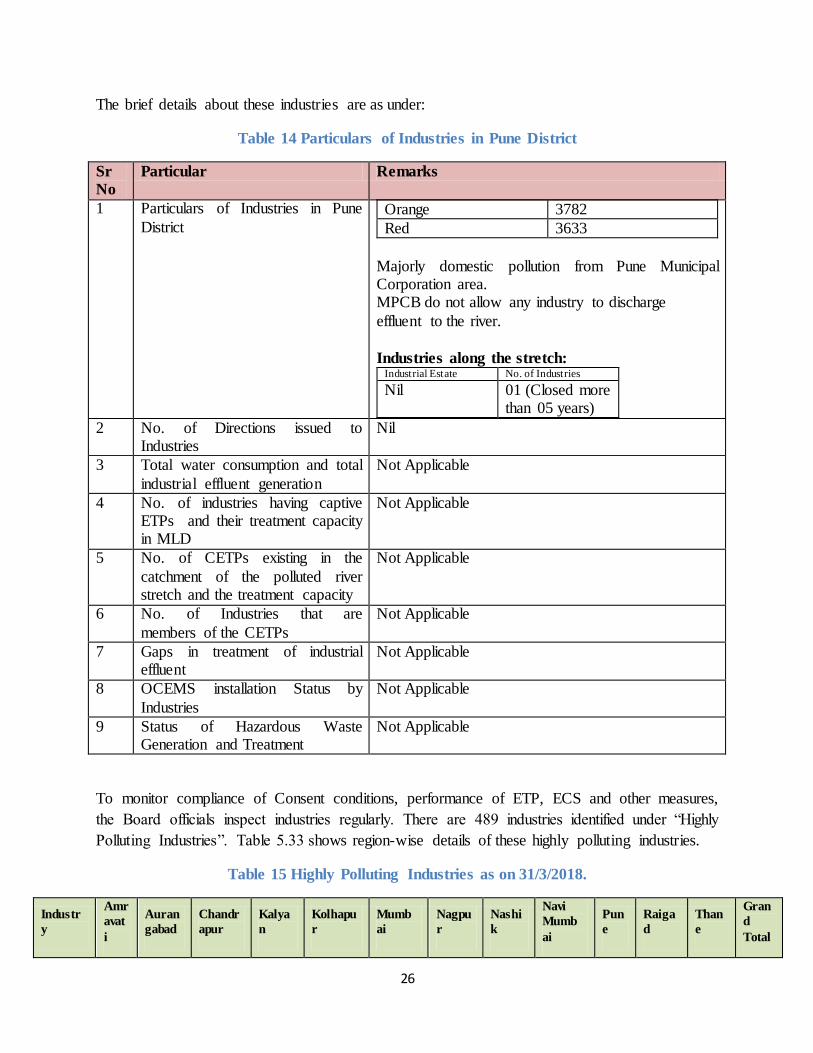
The brief details about these industries are as under:
Table 14 Particulars of Industries in Pune District
Sr
No
Particular Remarks
1 Particulars of Industries in Pune
District Orange 3782
Red 3633
Majorly domestic pollution from Pune Municipal Corporation area. MPCB do not allow any industry to discharge
effluent to the river.
Industries along the stretch: Industrial Estate No. of Industries
Nil 01 (Closed more than 05 years)
2 No. of Directions issued to Industries
Nil
3 Total water consumption and total
industrial effluent generation
Not Applicable
4 No. of industries having captive ETPs and their treatment capacity in MLD
Not Applicable
5 No. of CETPs existing in the
catchment of the polluted river stretch and the treatment capacity
Not Applicable
6 No. of Industries that are
members of the CETPs
Not Applicable
7 Gaps in treatment of industrial effluent
Not Applicable
8 OCEMS installation Status by
Industries
Not Applicable
9 Status of Hazardous Waste Generation and Treatment
Not Applicable
To monitor compliance of Consent conditions, performance of ETP, ECS and other measures,
the Board officials inspect industries regularly. There are 489 industries identified under “Highly
Polluting Industries”. Table 5.33 shows region-wise details of these highly polluting industries.
Table 15 Highly Polluting Industries as on 31/3/2018.
Industr
y
Amr
avat
i
Auran
gabad
Chandr
apur
Kalya
n
Kolhapu
r
Mumb
ai
Nagpu
r
Nashi
k
Navi
Mumb
ai
Pun
e
Raiga
d
Than
e
Gran
d
Total
27
Cement - - 5 - 1 - 1 - - - - - 7
Distiller
y 1 15
- 17 - 1 22 - 36 - - 92
Dyes
and
Dye-
intermed
iates
- - 2 3 2 - 1 - 1 - 7 2 18
Fertilize
r 1 2 - - - 1 1 4 - 1 3 - 13
Integrate
d Iron
and
Steel
- - 1 - 1 - 4 - - 1 2 - 9
Oil
Refinery - - - - - 2 - - - - - - 2
Pesticid
e - - - 1 5 - - 1 3 - 3 3 16
Pharmac
euticals - 13 - 12 4 - - 2 15 9 14 23 92
Pulp &
Paper - - 1 - - - - - - 1 - - 2
Sugar 1 55 2 - 41 - 5 35 - 63 - - 202
Tannery 1 - - - -
- - - - - 1
Thermal
Power
Plant
2 1 7 - 2 1 12 3 - - - 1 29
Petro-
chemica
l
- - - - - - - - 1 - 5 - 6
Grand
Total 5 87 18 16 73 4 25 67 20 111 34 29 489
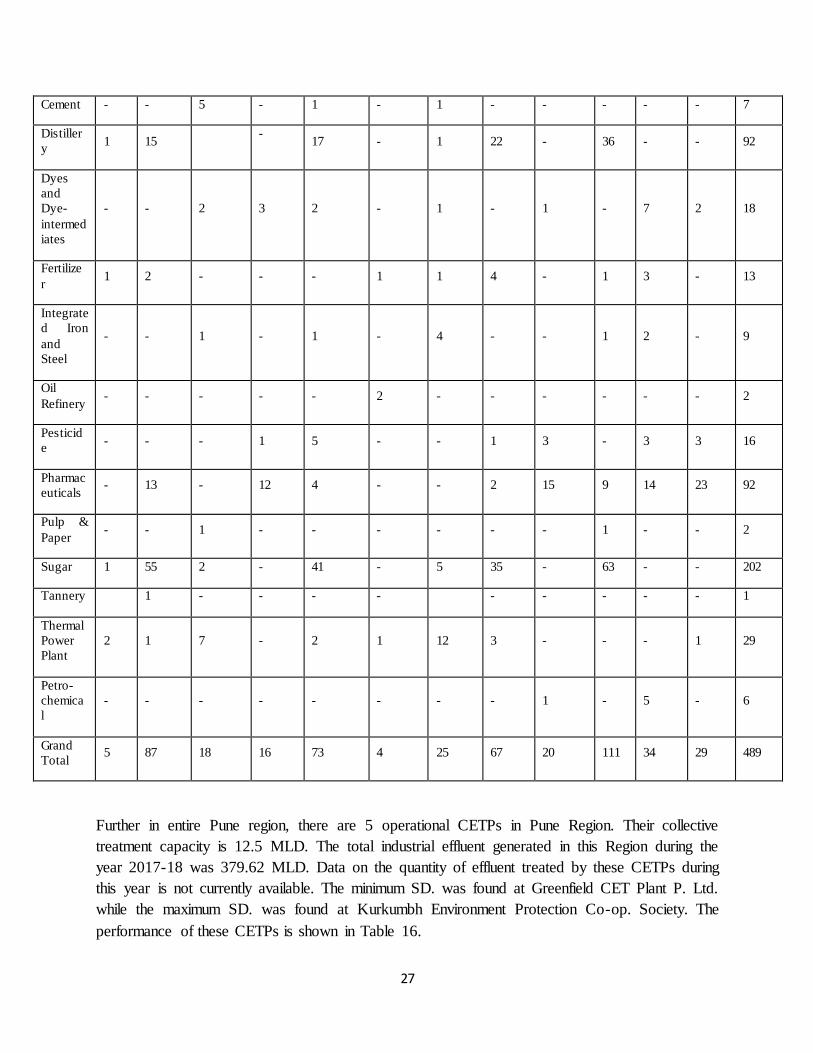
Further in entire Pune region, there are 5 operational CETPs in Pune Region. Their collective
treatment capacity is 12.5 MLD. The total industrial effluent generated in this Region during the
year 2017-18 was 379.62 MLD. Data on the quantity of effluent treated by these CETPs during
this year is not currently available. The minimum SD. was found at Greenfield CET Plant P. Ltd.
while the maximum SD. was found at Kurkumbh Environment Protection Co-op. Society. The
performance of these CETPs is shown in Table 16.
28
Table 16 Statistical Analysis Data for CETP Performance in Pune Region.
Parameters (mg/l)
Location
Kurkumbh
Environment
Protection Co-
op. Society
Ranjangaon
CETP
Greenfield
CET Plant
P. Ltd
Hydro
Air
Tectonics
(PCD)
Akkalkot
CETP
Inlet
BOD
(mg/l)
Min. 52 2 70 11 88
Max. 1200 2650 490 1550 865
Mean 660 475 138 135 335
SD. 341 321 68 92 151
COD
(mg/l)
Min. 504 44 132 32 264
Max. 3520 8240 1488 620 2592
Mean 2067 1416 392 378 967
SD. 1370 941 202 275 431
Outlet
BOD
(mg/l)
Min. 17 13 11 32 38
Max. 80 775 130 450 320
Mean 54 111 32 159 95
SD. 30 71 26 68 65
COD
(mg/l)
Min. 56 36 40 100 116
Max. 272 2192 328 1360 952
Mean 163 250 101 465 282
SD. 88 229 80 187 189
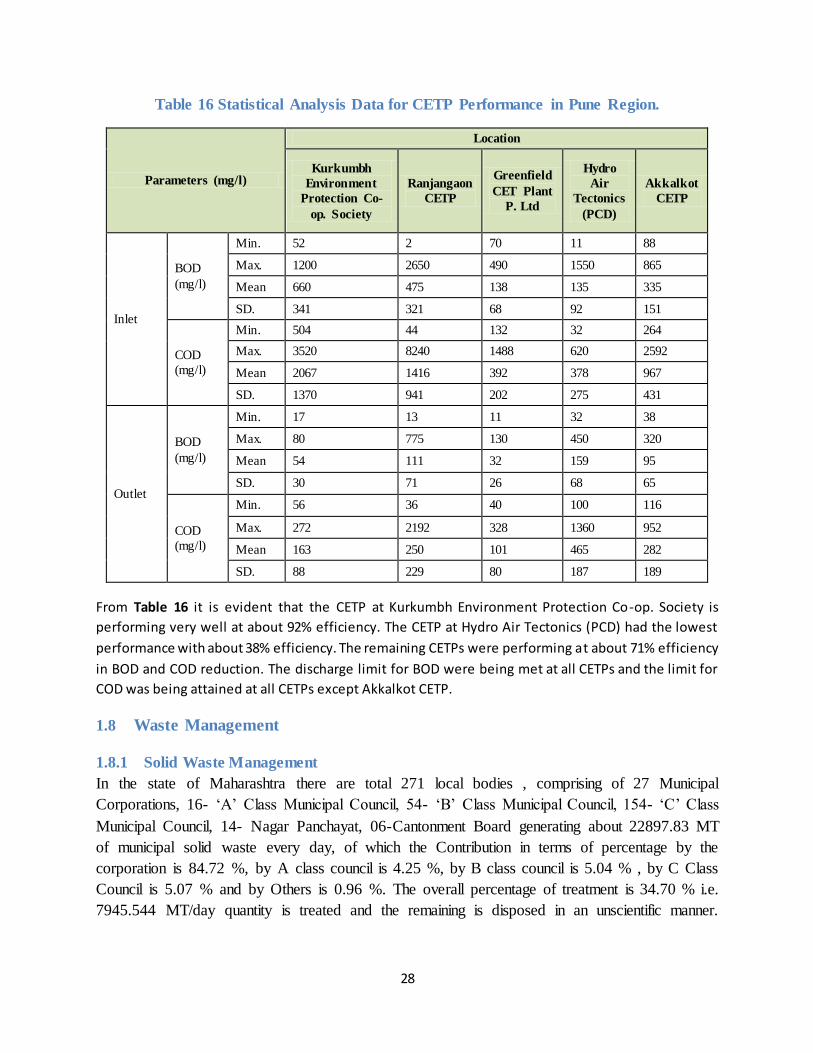
From Table 16 it is evident that the CETP at Kurkumbh Environment Protection Co-op. Society is
performing very well at about 92% efficiency. The CETP at Hydro Air Tectonics (PCD) had the lowest
performance with about 38% efficiency. The remaining CETPs were performing at about 71% efficiency
in BOD and COD reduction. The discharge limit for BOD were being met at all CETPs and the limit for
COD was being attained at all CETPs except Akkalkot CETP.
1.8 Waste Management
1.8.1 Solid Waste Management
In the state of Maharashtra there are total 271 local bodies , comprising of 27 Municipal
Corporations, 16- „A‟ Class Municipal Council, 54- „B‟ Class Municipal Council, 154- „C‟ Class
Municipal Council, 14- Nagar Panchayat, 06-Cantonment Board generating about 22897.83 MT
of municipal solid waste every day, of which the Contribution in terms of percentage by the
corporation is 84.72 %, by A class council is 4.25 %, by B class council is 5.04 % , by C Class
Council is 5.07 % and by Others is 0.96 %. The overall percentage of treatment is 34.70 % i.e.
7945.544 MT/day quantity is treated and the remaining is disposed in an unscientific manner.
29
Out of 27 Municipal corporations, 24 Corporations have obtained Authorization from MPCB for
22 Nos of approved sites having processing & disposal facilities and same are in operations. 109
Nos. of Municipal Councils having partially processing & disposal facilities.
Total generation of MSW from Pune city is about 2100 MT/Day. Out of which 1078 MT/day
waste is treated through Composting, Vermicomposting, RDF, Bio-Methanation plants & Waste
to Energy.
Pune Municipal Corporation has MSW dumping ground at Urali Devachi where MSW generated
in Pune City is dumped partly and over all 48 MSW processing plants at various location are in
operation in PMC area.
1.8.2 Bio-medical waste Management
Total Bio-medical waste generation in Pune is 4948.5 Kg/day. 100% waste is collected,
transported and treated at CBMWTSDF-PASCCO located at Sangamwadi, Pune. The
CBMWTSDF has installed capacity of Incinerator 150 Kg/Hr and Autoclave 200 litre/cycle
1.8.3 E-Waste management
Maharashtra Pollution Control Board awarded work order to M/s. IRG Systems South
Asia Pvt. Ltd. to carry out inventorisation of E-Waste generation in the State of
Maharashtra.
Interim inventorisation report is submitted to MPCB and final report will be ready within
one month.
As per the Interim inventory report submitted to MPCB, the E-Waste generation for the
year 2015 is approx. 6,46,509 MT.
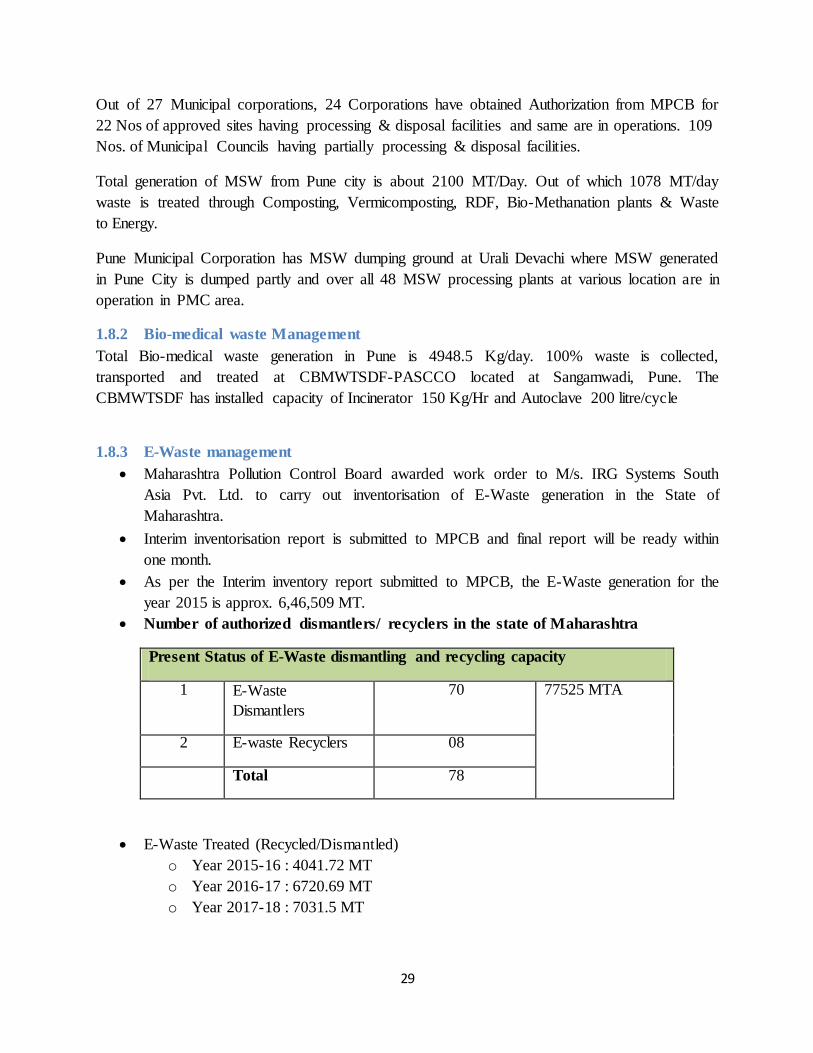
Number of authorized dismantlers/ recyclers in the state of Maharashtra
Present Status of E-Waste dismantling and recycling capacity
1 E-Waste
Dismantlers
70 77525 MTA
2 E-waste Recyclers 08
Total 78
E-Waste Treated (Recycled/Dismantled)
o Year 2015-16 : 4041.72 MT
o Year 2016-17 : 6720.69 MT
o Year 2017-18 : 7031.5 MT
30
CPCB has approved EPR of 261 producers for Maharashtra. The list of the producers is
enclosed here.
Annual report for the year 2017-18 is submitted.
Action Taken by MPCB
MPCB is undertaking regular monitoring of EPR Authorization conditions and regular
inspection of the collection points/ centers mentioned in EPR Plan.
MPCB has issued Directions u/s 5 of the Environment (Protection) Act, 1986 read with
E-waste (Management) Rules, 2016 to all Municipal Corporations in Maharashtra on
06/12/2018 for provision of collection centres.
Co-ordination with Various State Government Departments
Co-ordination with Urban Local Bodies (Municipal Committee /Council /Corporation).
Awareness through Public Notice
Constraints:
Channelization E-waste from informal sector to formal sector.
Awareness about impact of E-waste on Environment and Rules of E-waste is required.
Authorized collections and Segregation centers are required to be established by Local
Bodies.
1.8.4 Hazardous Waste Management
The state of Maharashtra has four Common Hazardous Waste Treatment, Storage and Disposal
Facilities. These facilities are located at MIDC Taloja, Trans-Thane Creek Industrial Area,
MIDC Ranjangaon, Pune and MIDC Butibori, Nagpur. These facilities collectively handle
340,847 MT of Hazardous waste per annum.
There are 993 Hazardous waste generating industries in Pune district. These industries generated
about 61596 MT of Hazardous waste in year 2017-18. The HW from Pune district is
scientifically disposed through CHWTSDF - Maharashtra Enviro Power Ltd MIDC, Ranjangaon,
Dist. Pune having capacity – Landfill – 60000 TPA, Incinerable – 20000 TPA and Lifespan of
the facility is 20 years.
Out of the 61596 MT generation in 2017-18, 32873 MT was Landfillable, 11428 MT was
Incinerable, 10670 was Recyclable and 6625 was utilizable.
Table 17 Status of Waste Management in Pune city
Sr.
No
Particular Remarks
1 Total MSW Generation Total generation of MSW – 2100 MT/Day.
31
The composition of waste is as follows. 1. Wet Waste :- 523 MT/day
2. In organic / Mixed Waste :- 600 MT/day
3. Untreated :- 750 MT/day
2 Existing MSW treatment and
disposal facilities
MSW Treatment – 1078 MT/day through
Composting, Vermicomposting, RDF,25 Bio-Methanation plant, Waste to Energy.
Pune Municipal Corporation has MSW dumping ground
at Urali Devachi – Fursungi where generated MSW is dumped partly and over all 48 MSW processing plants at various location are in operation in PMC area.
PMC has proposed 10 New plants for processing of Mixed Waste. The waste quantity will be treated in
these new plant to tone of 1600 MT/day.
3 Bio-medical waste Management
Hospitals are joined to CBMWTSDF-PASCCO Environmental Solution ltd.
Total collection and treatment: 4948.5 Kg/day
4 E-Waste management E-waste generated by industries is sent to MPCB authorized E-waste reprocessor.
5 Hazardous Waste Management HW generated from industry is disposed through CHWTSDF, Taloja.
1.9 Dream Project of Government of Maharashtra (GOM), Namami
Chndrabhaga
GOM, has announced Namami Chandrabhaga Abhiyan on 18/03/2016 in the Budgetary
Assembly Session of 2016-17. Namami Chandrabhaga is an initiative taken to revive and
rejuvenate the river Chandrabhaga and to restore its historic glory. Considering the religious,
social and economic importance of the river Chandrabhaga, the Government of Maharashtra has
decided to prepare a comprehensive plan for cleaning of the river on the lines of
„NamamiGange‟. Hon‟ble Finance Minister, GOM, directed to issue the GR about finalization
of working System of the Abhiyan, vide letter dt. 07/04/2016. The aim of the Namami
Chandrabhaga Abhiyan is to make the Chandrabhaga river pollution free and conserve its purity
and sanctity up to year 2022 and others are as mentioned below:
To maintain the permanent minimum continuous flow of water in the river bed.
To construct weirs in the river bed for maintaining water level.
To maintain & keep minimum environmental flow of water.
32
To make available sufficient public bathrooms & toilets as well as mobile bio-toilets to
the publics during Pandharpur yatras.
To install STP‟s for treatment of domestic wastes and scientific disposal facilities for
solid waste generated from the villages & cities located on the bank of Chandrabhaga
river.
To carry out the beautification & forestation of river banks.
To make reuse/recycle of treated industrial water generated from the industries and
industrial estates located in the catchment area of chandrabhaga river.
As per the local need to work for public participation and development of pilgrimage
area.
“Namami Chandrabhaga Pradhikaran”
Established under the Chairmanship of Hon‟ble Chief Minister, GoM & Co-Chairmanship of
Hon‟ble Finance Minister, GoM, having Divisional Commissioner, Pune as Member Secretary.
“High Power Committee”
Established under the Chairmanship of Hon‟ble Chief Secretary, GoM of Maharashtra having
Divisional Commissioner, Pune as Member Secretary.
In this context, the Government has identified CSIR National Environmental Engineering
Research Institute (CSIR-NEERI) as „Nodal Technical Expert Agency‟ the project. Bhimariver
originates in Bhimashankar in Pune district. But when it reaches Pandharpur, it appears like a
crescent moon, thus deriving the name Chandrabhaga. It flows in a 370-km stretch between Pune
and Solapur districts. CSIR-NEERI was already involved by the Maharashtra Government to
provide technological solutions for sanitation and sewage treatment at important cities and
pilgrim centers like Nashik and Pandharpur. Furthermore, is retained CSIR-NEERI for
technological interventions during the execution of the Project „Namami Chandrabhaga‟. The
Maharashtra Government intends to cleanse and make the holy river Chandrabhaga pollution
free by the year 2022.
Similarly, on the line of Namami Chandrabhaga Maharashtra Government is in process of
undertaking various projects for clean-up of other rivers in the State.
1.10 Involvement of Civil Society/Creation of awareness
For sustainable development it is necessary to promote and create environmental awareness
among communities, businesses and governments. Therefore the Board organizes various
environmental awareness programs across the State of Maharashtra. During the year 2017-18 the
following programs on environmental awareness were conducted by the Board.
Month Subject Details
33
22nd April
2017
World Earth Day Public awareness messages published in leading newspapers
namely Dainik Samna, Sakaal, Divya Marathi, Loksatta, Indian
Express, Lokmat, Maharashtra Times of India, DNS,
Hindustan Times and Midday on the occasion of World Earth
Day.
5th June
2017
World Environment
Day celebration
The main event was organized at the Yashwantrao Chavan
Auditorium, Mumbai on 5th June, 2017 on occasion of World
Environment Day. Hon‟ble Chief Minister of Maharashtra,
Shri Devendra Fadnavis, Hon‟ble Minister of Environment,
Shri Ramdas Kadam and Member Secretary of MPCB, Dr. P.
Anbalagan attended this event. During this event, award
ceremony for Vasundhara Award competition organized for
industries, municipal corporations and CETPs was carried out.
On the occasion of World Environment Day, Vasundhara Short
Film Competition based on the environment was announced by
Hon‟ble Chief Minister of Maharashtra at the main event. This
competition will be organized for professionals as well as
amateurs.
During this event, the award ceremony for Photothon 2017
took place. This ceremony was presented by Member Secretary
of MPCB, Dr. P. Anbalagan. Villages which had participated
in the water conservation activity „Jalsanvardhan Panchayat –
Ek Lok Chalwal‟ organized by Maharashtra Pollution Control
Board, Vanrai Pune and Zee 24 Taas were awarded at the
hands of Hon‟ble Chief Minister of Maharashtra for their
exceptional performance. During this event, a short film
festival related to the environment was organized for three
days at Yashwantrao Chavan Centre, Mumbai with assistance
from Enviro-Vigil and as a joint effort by MPCB and
Environment Department, Government of Maharashtra. A
large number of environmentalists attended this festival. At
this time, discussion sessions with directors, producers,
environment experts and analysts were also organized.
34
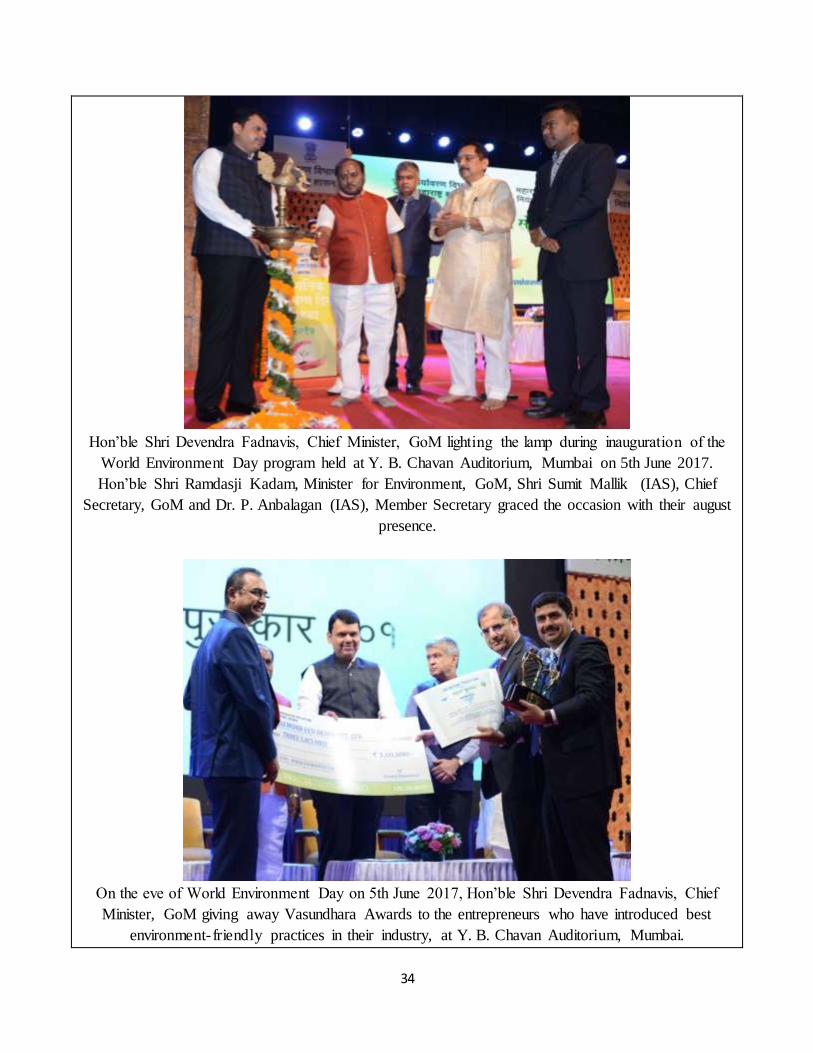
Hon‟ble Shri Devendra Fadnavis, Chief Minister, GoM lighting the lamp during inauguration of the
World Environment Day program held at Y. B. Chavan Auditorium, Mumbai on 5th June 2017.
Hon‟ble Shri Ramdasji Kadam, Minister for Environment, GoM, Shri Sumit Mallik (IAS), Chief
Secretary, GoM and Dr. P. Anbalagan (IAS), Member Secretary graced the occasion with their august
presence.
On the eve of World Environment Day on 5th June 2017, Hon‟ble Shri Devendra Fadnavis, Chief
Minister, GoM giving away Vasundhara Awards to the entrepreneurs who have introduced best
environment-friendly practices in their industry, at Y. B. Chavan Auditorium, Mumbai.
35
5th June
2017
World Environment
Day
On the occasion of World Environment Day (5th June, 2017)
public awareness messages were published in Maharashtra
Times, Time of India, Loksatta, Indian Express, DNA,
Hindustan Times, Midday (Gujarati, Urdu and English),
Lokmat, Dainik Sakaal, Samna, Divya Marathi and in other
leading newspapers. Information about various control
measures adopted for pollution control was published in this
section on behalf of MPCB.
5th June
2017
World Environment
Day
On the occasion of World Environment Day (5th June, 2017)
public awareness programs related to the environment, canvas
paintings with messages about the environment, brainstorming
on public awareness and various other activities were
organized by We Love India on 5th June, 2017 at Bandra.
Famous movie artists, sportspersons and Hon‟ble Environment
Minister for State were present during these activities.
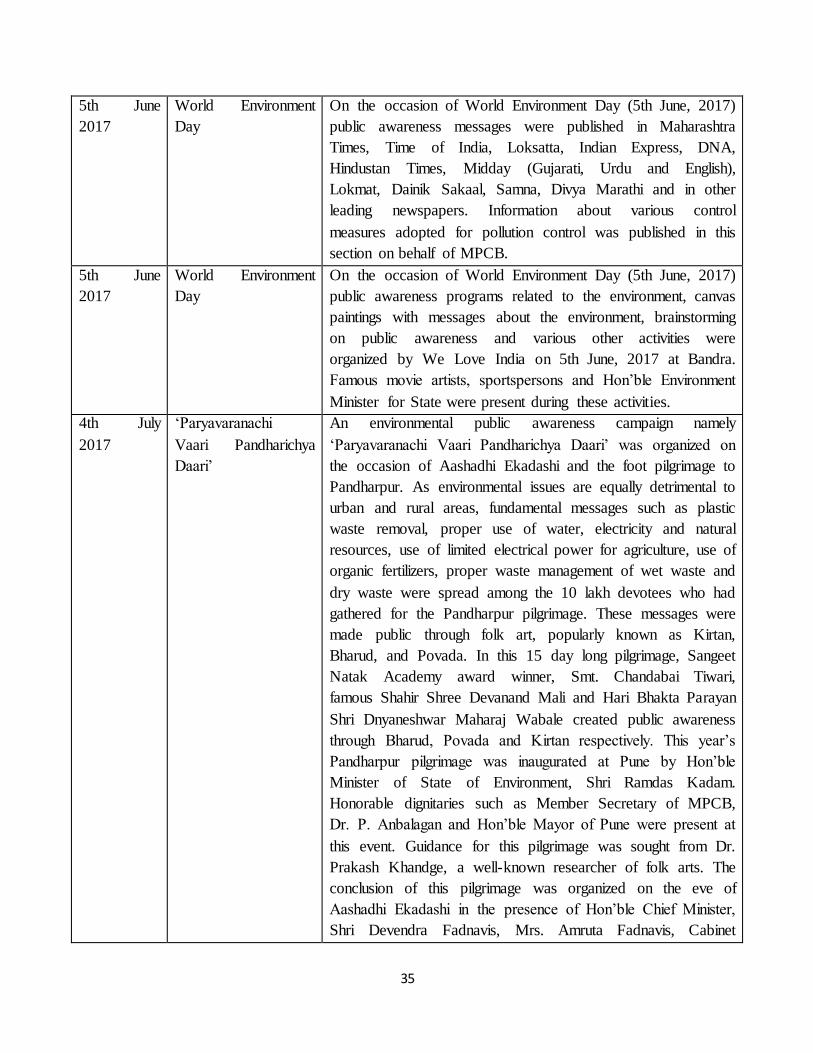
4th July
2017
„Paryavaranachi
Vaari Pandharichya
Daari‟
An environmental public awareness campaign namely
„Paryavaranachi Vaari Pandharichya Daari‟ was organized on
the occasion of Aashadhi Ekadashi and the foot pilgrimage to
Pandharpur. As environmental issues are equally detrimental to
urban and rural areas, fundamental messages such as plastic
waste removal, proper use of water, electricity and natural
resources, use of limited electrical power for agriculture, use of
organic fertilizers, proper waste management of wet waste and
dry waste were spread among the 10 lakh devotees who had
gathered for the Pandharpur pilgrimage. These messages were
made public through folk art, popularly known as Kirtan,
Bharud, and Povada. In this 15 day long pilgrimage, Sangeet
Natak Academy award winner, Smt. Chandabai Tiwari,
famous Shahir Shree Devanand Mali and Hari Bhakta Parayan
Shri Dnyaneshwar Maharaj Wabale created public awareness
through Bharud, Povada and Kirtan respectively. This year‟s
Pandharpur pilgrimage was inaugurated at Pune by Hon‟ble
Minister of State of Environment, Shri Ramdas Kadam.
Honorable dignitaries such as Member Secretary of MPCB,
Dr. P. Anbalagan and Hon‟ble Mayor of Pune were present at
this event. Guidance for this pilgrimage was sought from Dr.
Prakash Khandge, a well-known researcher of folk arts. The
conclusion of this pilgrimage was organized on the eve of
Aashadhi Ekadashi in the presence of Hon‟ble Chief Minister,
Shri Devendra Fadnavis, Mrs. Amruta Fadnavis, Cabinet
36
Minister (Solapur), Shri Vijay Deshmukh, Minister of Water
and Sanitation, Shri Babanrao Lonikar, Senior Cabinet
Minister, Shri Mahadev Jankar, Member Secretary of MPCB,
Dr. P. Anbalagan and other honorable dignitaries.
Hon‟ble Shri Devendra Fadnavis, Chief Minister addressing pilgrims on the eve of environment
public awareness campaign at Pandharpur on 4th July 2017, in the presence of Dr. P. Anbalagan
(IAS), Member Secretary, GoM.
August
2017
92.7 Big FM Big
Green Ganesha
The Big Green Ganesha activity was co-organized by 92.7 Big
FM and MPCB in the city of Mumbai. During this activity, the
Big Green Ganesha van encouraged citizens at various
locations to celebrate an eco-friendly Ganesh festival and to
donate newspaper scrap for the even. During Ganesh festival a
special studio was set up at Lalbaghcha Raja in Mumbai city
for 10 days. At this time, Hon‟ble Chief Minister of
Maharashtra, Hon‟ble Minister for Environment, Hon‟ble State
Minister for Environment and film celebrities spread messages
for public awareness.
August
2017
Zee 24 Taas Eco-
Friendly Household
Ganesh Festival
Competition
The Household Eco-friendly Ganesh Festival Competition was
organized at the state level as a joint venture by MPCB and
Zee 24 Taas. This competition has a large number of
participants. Citizens celebrating household in a unique way
had participated in this competition from all over the state.
Response to this competition has been increasing over the
years.
August
2017
ABP Maza Eco-
Friendly Ganesh
Festival Competition
A special public awareness campaign regarding celebrating an
eco-friendly Ganesh festival in housing societies in major
cities in the State was organized by MPCB and ABP Maza, a
news channel. News about eco-friendly Ganesh festival
37
celebrated in housing societies at cities such as Mumbai, Pune,
Nashik and Nagpur was broadcast through the channel. Special
programs on eco-friendly Ganesh festival celebrations at
housing societies were also broadcast on the ABP Maza
television channel. Well-known celebrities from Marathi film
industry, Sayali Sanjeev and Rushi Saxema advertised the
competition organized for celebrating an eco-friendly Ganesh
festival through promos. Winners in this competition were
awarded certificates by MPCB and Prasad. Public relations
officer of MPCB was present at this time. These celebrities
visited MPCB‟s Mantralaya. Special news regarding the event
was broadcast by ABP Maza television channel.
August
2017
Household Eco-
Friendly Ganesh
Festival Competition
2017 organized by
Loksatta and MPCB.
Eco-friendly household Ganesh festival decoration competition
was organized jointly by MPCB and Loksatta at 6 divisions of
Loksatta newspaper at Mumbai, Pune, Nashik, Nagpur,
Ahmednagar and Aurangabad. More than 2000 people
competed in this event. Prize distribution of this competition
took place at Yashwantrao Chavan Pratishthan at the hands of
Hon‟ble Minister for Environment, Shri Ramdas Kadam, State
Minister for Environment, Shri Pravin Pote-Patil and Member
Secretary of MPCB, Dr. P. Anbalagan. A special column
regarding this event was published in all editions of Loksatta
newspaper.
August
2017
Eco-Friendly Ganesh
Festival UFO Digital
Movies financial
assistance.
Public awareness messages by celebrities from Marathi and
Hindi film industry were publicized at 205 digital theatres by
UFO Digital Movies for two weeks to promote an eco-friendly
Ganesh festival.
August
2017
Financial assistance
for DNA Eco
Ganesha public
awareness campaign
organized by DNA
and MPCB.
To celebrate an environment friendly Ganesh festival, eco-
friendly Ganesh idols based on the five natural elements were
installed in selected malls in Mumbai city on behalf of the
MPCB and DNA. MPCB played the role of co-convener in this
campaign organized by DNA. Prominent celebrities from the
Hindi film industry participated in this campaign.
August
2017
Financial assistance
for public awareness
activity, Times Green
Ganesha.
Eco-Green Ganesha competition was organized jointly by
Environment Department of MPCB, Government of
Maharashtra and Times of India group for public Ganesh
festival organizations and housing societies in Mumbai and
Pune. During this campaign, public awareness activities were
conducted in various malls, movie theatres and colleges. Eco-
friendly Ganesh festival workshops were conducted for school
38
students. Various activities and cleanliness campaigns were
conducted by college students for the eco-friendly Ganesh
ambassador during Ganesh idol immersion at Girgaon
Chowpati, Juhu beach and Versova beach at Mumbai. This
campaign was launched by popular actor, Vidyut Jammwal and
Hollywood Director, Chuck Russel at Lala Lajpat Rai College.
A special film for public awareness had been created by Times
group for this campaign. A dedicated column for this campaign
was published for 10 consecutive days in the newspaper,
Times of India.
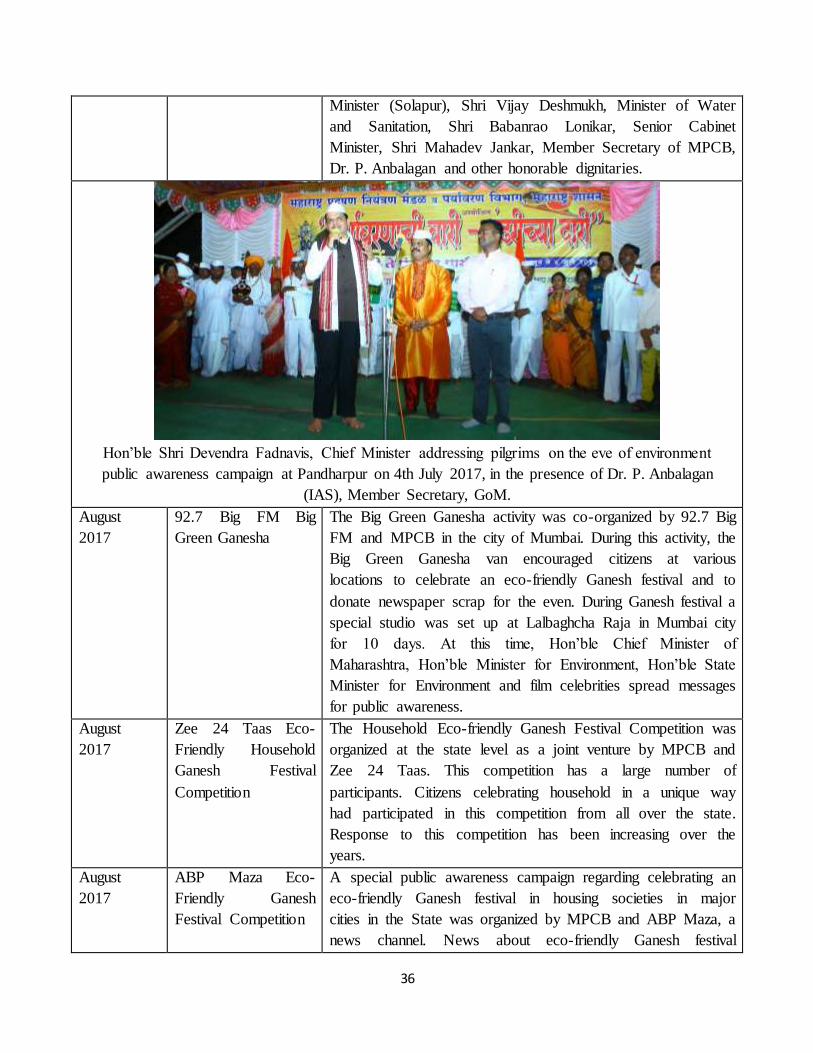
August
2017
Eco-Ganesha Public
awareness campaign
organized by Dainik
Samna and MPCB.
Eco-friendly public Ganesh festival was organized at Mumbai,
Pune and Aurangabad with assistance from the newspaper,
Dainik Samna. The prize distribution event was conducted in
the presence of Hon‟ble Minister for Environment, Shri
Ramdasbhai Kadam and Member Secretary, MPCB, Dr. P.
Anbalagan.
Hon‟ble Shri Ramdasji Kadam, Minister for Environment, GoM giving away prizes to the participants
on the eve of Eco-friendly Ganesha Public awareness campaign in the presence of Dr. P. Anbalagan
(IAS), Member Secretary, MPCB
August
2017
Public awareness
messages about eco-
friendly Ganesh
festival displayed on
Times OOH BEST
bus stop shelters.
Public awareness message of „Celebrate a pollution-free
Diwali‟ by Hon‟ble Chief Minister, Hon‟ble Minister for
Environment and Hon‟ble State Minister for Environment were
displayed on bus stops in Mumbai city for a period of 15 days.
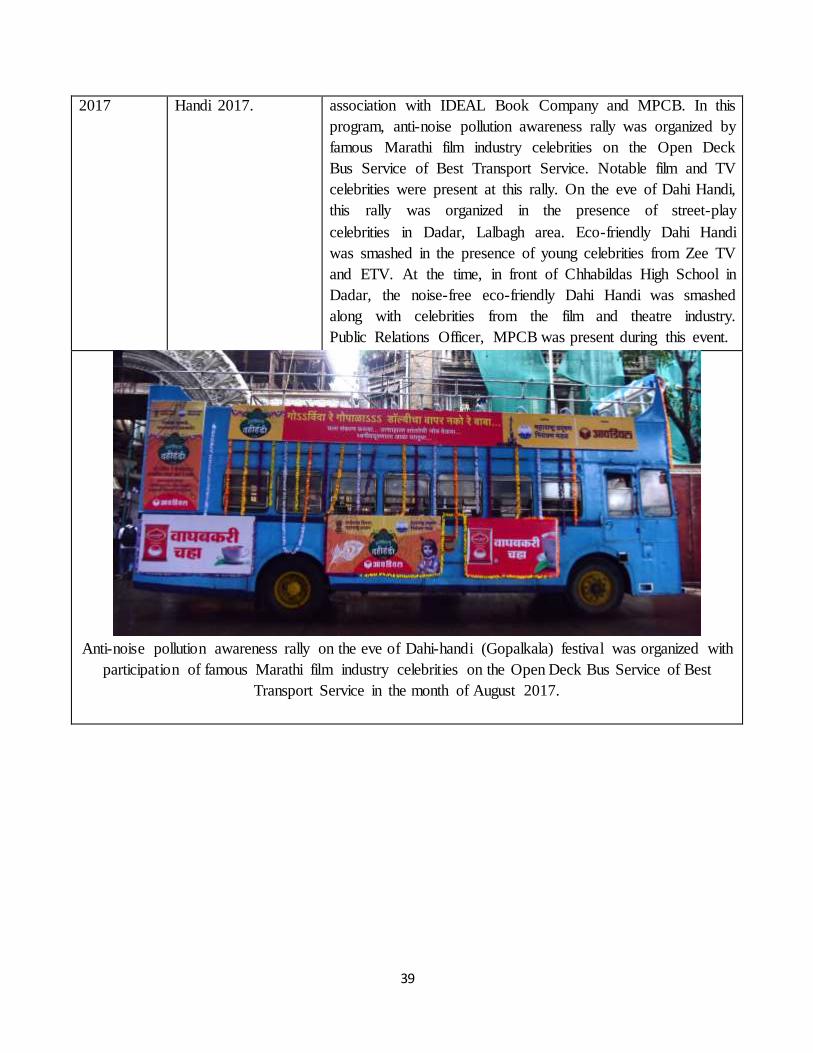
August Eco-friendly Dahi Eco Friendly Dahi Handi Festival 2017 was organized in
39
2017 Handi 2017. association with IDEAL Book Company and MPCB. In this
program, anti-noise pollution awareness rally was organized by
famous Marathi film industry celebrities on the Open Deck
Bus Service of Best Transport Service. Notable film and TV
celebrities were present at this rally. On the eve of Dahi Handi,
this rally was organized in the presence of street-play
celebrities in Dadar, Lalbagh area. Eco-friendly Dahi Handi
was smashed in the presence of young celebrities from Zee TV
and ETV. At the time, in front of Chhabildas High School in
Dadar, the noise-free eco-friendly Dahi Handi was smashed
along with celebrities from the film and theatre industry.
Public Relations Officer, MPCB was present during this event.
Anti-noise pollution awareness rally on the eve of Dahi-handi (Gopalkala) festival was organized with
participation of famous Marathi film industry celebrities on the Open Deck Bus Service of Best
Transport Service in the month of August 2017.
40
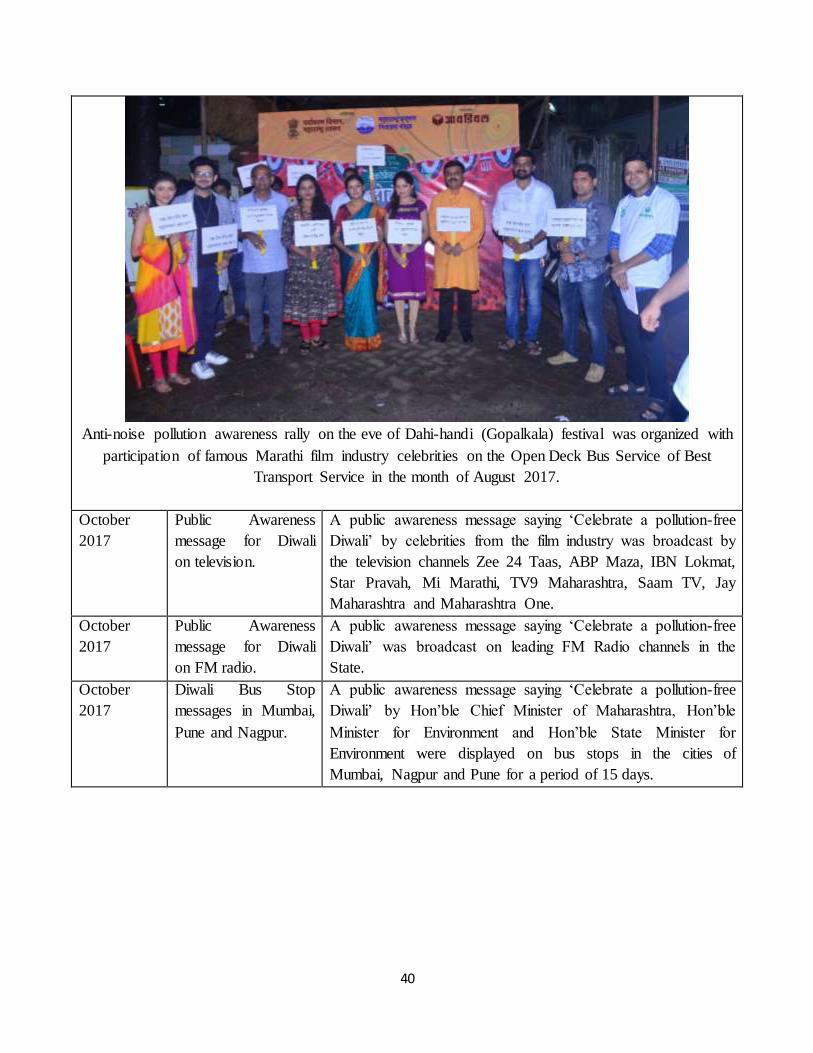
Anti-noise pollution awareness rally on the eve of Dahi-handi (Gopalkala) festival was organized with
participation of famous Marathi film industry celebrities on the Open Deck Bus Service of Best
Transport Service in the month of August 2017.
October
2017
Public Awareness
message for Diwali
on television.
A public awareness message saying „Celebrate a pollution-free
Diwali‟ by celebrities from the film industry was broadcast by
the television channels Zee 24 Taas, ABP Maza, IBN Lokmat,
Star Pravah, Mi Marathi, TV9 Maharashtra, Saam TV, Jay
Maharashtra and Maharashtra One.
October
2017
Public Awareness
message for Diwali
on FM radio.
A public awareness message saying „Celebrate a pollution-free
Diwali‟ was broadcast on leading FM Radio channels in the
State.
October
2017
Diwali Bus Stop
messages in Mumbai,
Pune and Nagpur.
A public awareness message saying „Celebrate a pollution-free
Diwali‟ by Hon‟ble Chief Minister of Maharashtra, Hon‟ble
Minister for Environment and Hon‟ble State Minister for
Environment were displayed on bus stops in the cities of
Mumbai, Nagpur and Pune for a period of 15 days.
41
October
2017
Pollution-free Diwali
Resolution Campaign
Pledge 2017.
Pollution-free Diwali Resolution Campaign Pledge 2017 was
organized at Mantralaya to promote celebration of a pollution-
free Diwali. A pollution-free Diwali was pledged by students
from schools and colleges from the entire State in the presence
of Hon‟ble Chief Minister of Maharashtra, Shri Devendra
Fadnavis. Hon‟ble Minister for Environment, Shri Ramdas
Kadam, Hon‟ble Minister of Water Resources & Irrigation,
Shri Girish Mahajan, Hon‟ble State Tourism Minister, Shri
Jaykumar Rawal, Hon‟ble Additional Chief Secretary of
Environment Department, Shri Satish Gavai, Hon‟ble
Chairman of Maharashtra Pollution Control Board, Shri Milind
Mhaiskar and Hon‟ble Member Secretary of MPCB, Dr. P.
Anbalagan attended this event. Students from various colleges
in Mumbai also attended this event. Live telecast of this event
was broadcast on leading news channels in the State. News
about this event was published in leading newspapers in the
State.
March 2018 Eco-Friendly Holi. From the last few years, the widespread public awareness
campaigns organized by Maharashtra Pollution Control Board
to promote the celebration of an eco-friendly Holi have been
receiving an increasing response. This year on behalf of the
MPCB, eco-friendly colours were distributed for free to
employees and officers from MPCB, Hon‟ble Ministers from
Mantralaya, Hon‟ble Secretaries, Hon‟ble Chairman, Hon‟ble
Speaker and Members of Legislative Assembly and Legislative
Councils. Messages to promote the celebration of an eco-
friendly Holi were broadcast on television and radio channels.
1.11 Greenery Development Plan of Forest Department, Government of
Maharashtra
Government of Maharashtra has been instrumental in increasing tree and forest cover all over the
State. GOM through it‟s Forest Department has announced The Plantation Program in 2016 with
the aim of planting 2Crore trees on 1st July 2016 was a resounding success with the final total
reported figure of 2.82Crore saplings planted on a single day. After the successful
implementation of 2Crore plantation program on 1st July, 20 16, the Government of Maharashtra
has designed the 50Crore plantation program for 3 consecutive years viz. 4Crore, 13Crore and
33Crore for 2017, 2018 and 2019 respectively. 10% Bamboo, mangrove and medicinal
plantation is also incorporated in this plantation drive.
In the Second Phase, though the target was of 4Crore plantation from 1st to 7th July, 2017,
actually 5.43Crore seedlings were planted due to overwhelming response of Government
42
employees and people at large. These saplings programs are driven with the involvement of 33
Government Departments along with Students of Schools and Colleges, NSS, NCC, CSR,
NGOs, Railways, National Highways, Defense, NABARD and other stakeholders of Society.
"Limca Book of World Records" has taken cognizance of these remarkable achievements of
Forest Department relating to plantation in 2016 and 2017 and felicitated with certificates. Thus
Maharashtra is the first State in India who acquired the place three years consequently in "Limca
Book of Records".
In the Third Phase, against the target of 13Crore plantation in 2018 between the period from 1st
to 31st July 2018 we could plant 15.88Crore trees, again exceeding the said target. The response
of the public was overwhelming.
GoM continued this good work for the protection, enrichment and secure environment through
various Schemes and Programs. In the Fourth Phase, the year 2019 represents the most
significant and important step in completing this Mission of 50 crore plantation. In this year it
was intended to plant 33Crore saplings throughout Maharashtra. Preparation and Planning for the
success of this year's target have been initiated from 3rd August, 2018 i.e. immediately after
completion of 13Crore Plantation Program. Forest Officials along with Revenue machinery and
all administrative departments are working extremely hard with the active support of all sections
of the society. The details of this 2 Crore, 4Crore, 13Crore & 33Crore plantation program are
attached as Annexure I, II, III & IV respectively.
In an attempt to boost conservation and protection of forests and wild life in Maharashtra, the
State Forest Department has launched a drive aimed at roping in citizens to help the department
in their massive 50Crore trees plantation drive. A dedicated website
greenarmy.mahaforest.gov.in has been developed for registration of individuals and
organizations as member of Green Army. I am happy to say that up-till now around 60 lakh
members have been registered and we hope we could cross the 1Crore membership in near
Future.
For maintaining the transparency, accountability and credibility, all the data relating to site
selection for plantation with Geo-Tagging, development of Nurseries, digging of pits, availability
43
of manpower, actual plantation and survival of the trees planted etc. is uploaded on the Digital
Platform of Forest Department so that people can access the· data at any given point of time.
This has helped to build confidence amongst the people and their ever increasing participation in
the plantation programme.
For the registration of plantation by the individuals, private NGOs and other stakeholders of
society the mobile application called "My Plants" has been developed. Similarly, the programs
like "Saplings at the Door Step", "Digital visibility on social media", "publicity campaign" are
being implemented for greater public participation.
In Marathwada region of the State having low forest cover, a dedicated "Eco-Battalion" has been
established at Aurangabad for tree plantation and its protection under the Defense Ministry of
GIO considering establishing two more companies of this force at Beed & Latur.
The Forest Department is trying it‟s level its level best to increase the Forest and Tree cover in
the State by various innovative ideas by involvement of people in the plantation & its protection
especially on Non-Forest areas as forest area is limited. Massive tree plantation program in urban
& rural areas under the scheme "Nurturing Trees is Worshiping Nature” has been launched by
the Govt. in line with Ranmala Village in Khed Taluka of Pune District.
The Tree based Agriculture under Mahatma Gandhi National rural Employment Guarantee
Scheme (MG-NREGS) Kanya Van Samruddhi Yojana, Bhausaheb Phundkar Horticulture
Plantation Programme in co-ordination with Agriculture Department, Sericulture Plantation in
coordination with Textile Department, Riverside Plantation are some of scheme initiated for
increasing green cover in the Non- Forest areas.
Status report on Forest for 2017 at all India level has been published by “ Forest survey
of India” in February 2018 vis-a-vis status of forest & related sectors in 2015. As far as
Maharashtra is concerned the findings are as follows:
Tree cover on non-forest area has increased by 273Km.sq – Maharashtra is a leading state
Mangrove cover has increased by 82Km.sq - Maharashtra is a leading state
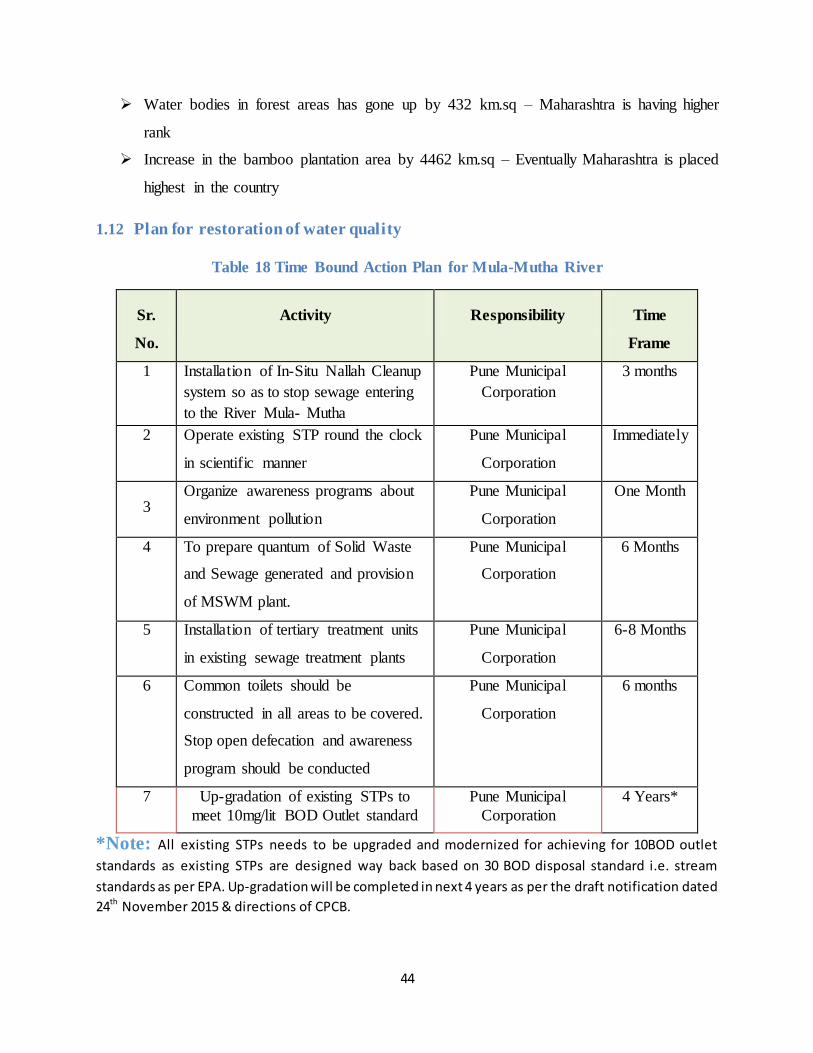
44
Water bodies in forest areas has gone up by 432 km.sq – Maharashtra is having higher
rank
Increase in the bamboo plantation area by 4462 km.sq – Eventually Maharashtra is placed
highest in the country
1.12 Plan for restoration of water quality
Table 18 Time Bound Action Plan for Mula-Mutha River
Sr.
No.
Activity Responsibility Time
Frame
1 Installation of In-Situ Nallah Cleanup
system so as to stop sewage entering
to the River Mula- Mutha
Pune Municipal
Corporation
3 months
2 Operate existing STP round the clock
in scientific manner
Pune Municipal
Corporation
Immediately
3 Organize awareness programs about
environment pollution
Pune Municipal
Corporation
One Month
4 To prepare quantum of Solid Waste
and Sewage generated and provision
of MSWM plant.
Pune Municipal
Corporation
6 Months
5 Installation of tertiary treatment units
in existing sewage treatment plants
Pune Municipal
Corporation
6-8 Months
6 Common toilets should be
constructed in all areas to be covered.
Stop open defecation and awareness
program should be conducted
Pune Municipal
Corporation
6 months
7 Up-gradation of existing STPs to
meet 10mg/lit BOD Outlet standard
Pune Municipal
Corporation
4 Years*
*Note: All existing STPs needs to be upgraded and modernized for achieving for 10BOD outlet
standards as existing STPs are designed way back based on 30 BOD disposal standard i.e. stream
standards as per EPA. Up-gradation will be completed in next 4 years as per the draft notification dated
24th November 2015 & directions of CPCB.
45
1.13 Budget Estimates & Pooling of Resources from Local Bodies, State Pollution
Control Board, State Government & Central Government
The Pune Municipal Corporation has sanctioned fund of Rs. 990.26Cr; out of which
Central Government has component of 841.72Cr. & Pune Municipal Corporation has component 148.54Cr for management of sewerage systems & STPs; which will be completed by 2022.
Maharashtra Government has already received proposal of Rs. 1104.54Cr. Under State
River Conservation Program & form this amount State Government will provide necessary funds in next 3 years i.e. by 2022 for Sewage management
The Maharashtra Pollution Control Boards has also reserved Rs. 461.42Cr. for preparation of action plan for abetment & Control of Pollution of River Water due to
sewage & solid waste disposal from B & C Municipal Councils (342Nos of Urban Local Bodies.), Nagar Panchyat & Gram Panchayat for reducing polluted stretches in compliance with Hon‟ble NGT, principal bench directions w.r.t. “More River Stretches
are now Critically Polluted”. The said funds will be used for DPR preparation, development of infrastructure for sewage collection & treatment & development of
infrastructure for Solid Waste Management. The DPR preparation & implementation of the same will be completed by year 2022 (i.e in next 3 years).
For Solid Waste Management, Maharashtra Government has approved DPR of all 388
Urban Local Bodies. The funds for the same amounting to Rs. 2560.0Cr has been already
sanctioned by Government & the said DPRs will be implemented & SWM issues will be
resolved by December‟2019.
Proposed plans for maintaining e-flow: River flows only in Monsoon season &
whenever dam water is released. The amount water released from dam is such that, will not over
flow form next weir at the downstream
Recommendations
1. In channel treatment for all nallahs leading in to the river so as to avoid sewage entering
into the river.
2. Treated water should be subjected to Tertiary treatment which includes Disinfection,
physico-chemical treatment followed by gravity sand filters.
3. Restoration of the river by pumping in oxygen. Aeration system shall be provided so as to
maintain aquatic environment.
4. Maintaining continuous flow in the river & compulsory application of water meter.
5. Setting up of GIS platform for creating & maintaining database within Municipal
Corporations & Municipal Councils.
6. Recycle and reuse of treated water from sewage treatment plant.
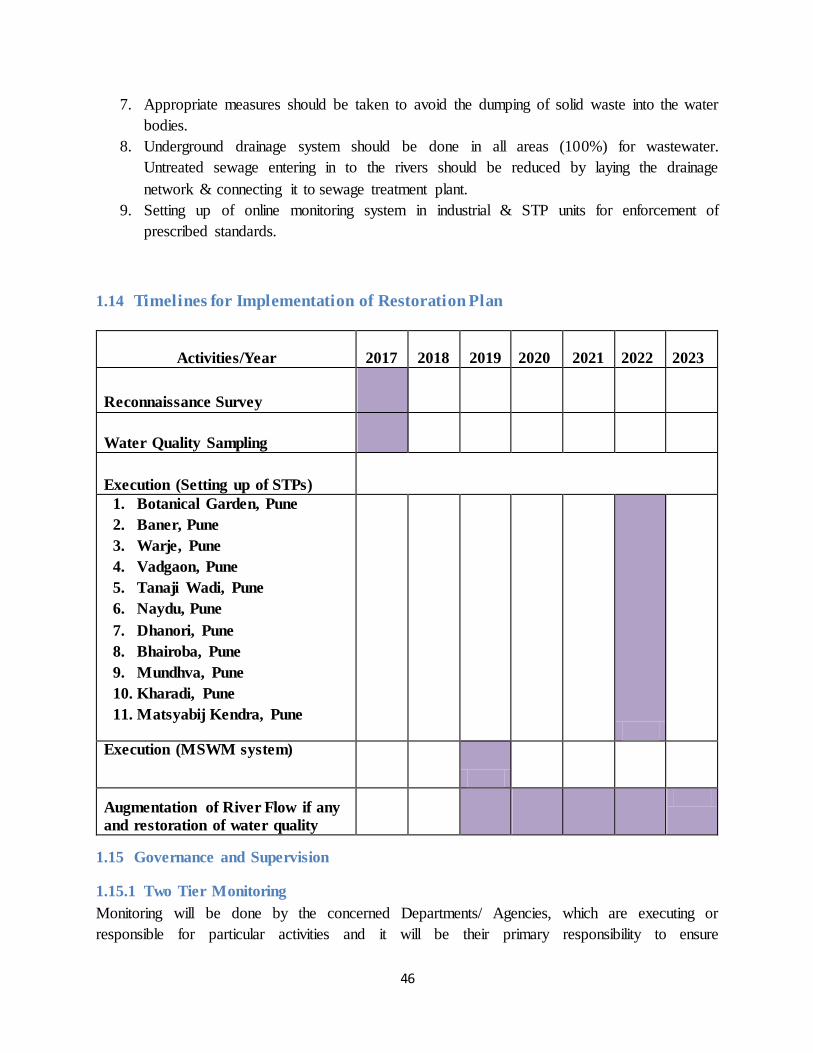
46
7. Appropriate measures should be taken to avoid the dumping of solid waste into the water
bodies.
8. Underground drainage system should be done in all areas (100%) for wastewater.
Untreated sewage entering in to the rivers should be reduced by laying the drainage
network & connecting it to sewage treatment plant.
9. Setting up of online monitoring system in industrial & STP units for enforcement of
prescribed standards.
1.14 Timelines for Implementation of Restoration Plan
Activities/Year 2017 2018 2019 2020 2021 2022
2023
Reconnaissance Survey
Water Quality Sampling
Execution (Setting up of STPs)
1. Botanical Garden, Pune
2. Baner, Pune
3. Warje, Pune
4. Vadgaon, Pune
5. Tanaji Wadi, Pune
6. Naydu, Pune
7. Dhanori, Pune
8. Bhairoba, Pune
9. Mundhva, Pune
10. Kharadi, Pune
11. Matsyabij Kendra, Pune
Execution (MSWM system)
Augmentation of River Flow if any
and restoration of water quality
1.15 Governance and Supervision
1.15.1 Two Tier Monitoring
Monitoring will be done by the concerned Departments/ Agencies, which are executing or
responsible for particular activities and it will be their primary responsibility to ensure
47
compliance of the Action Plan. In addition, there will be two level of Committees to review and
monitor the status: (i) District Level Task Force (ii) River Rejuvenation Committee
1.15.2 District Level Special Task Force:
The District Level Special Task force will monitor the Status of implementation of the Action
Plan at the district Level.
1.15.3 River Rejuvenation Committee:
The River Rejuvenation Committee will monitor the Status of implementation of the Action Plan
at the State Level.
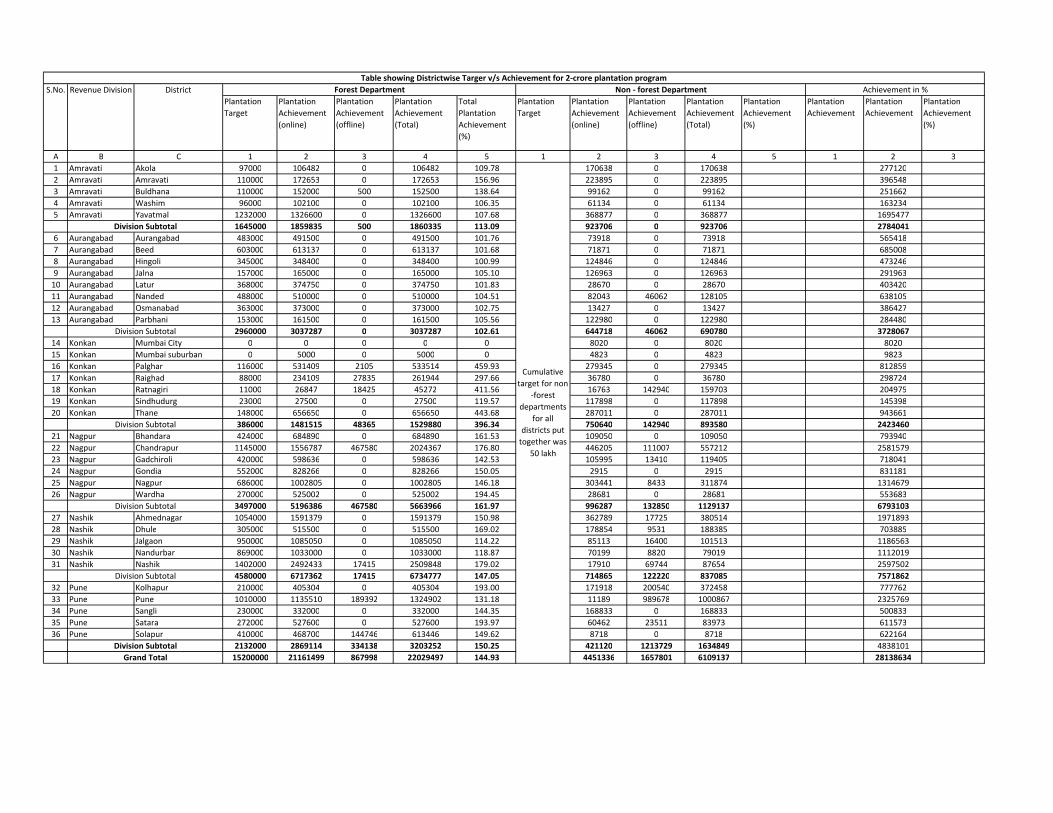
Plantation
Target
Plantation
Achievement
(online)
Plantation
Achievement
(offline)
Plantation
Achievement
(Total)
Total
Plantation
Achievement
(%)
Plantation
Target
Plantation
Achievement
(online)
Plantation
Achievement
(offline)
Plantation
Achievement
(Total)
Plantation
Achievement
(%)
Plantation
Achievement
Plantation
Achievement
Plantation
Achievement
(%)
A B C 1 2 3 4 5 1 2 3 4 5 1 2 3
1 Amravati Akola 97000 106482 0 106482 109.78 170638 0 170638 277120
2 Amravati Amravati 110000 172653 0 172653 156.96 223895 0 223895 396548
3 Amravati Buldhana 110000 152000 500 152500 138.64 99162 0 99162 251662
4 Amravati Washim 96000 102100 0 102100 106.35 61134 0 61134 163234
5 Amravati Yavatmal 1232000 1326600 0 1326600 107.68 368877 0 368877 1695477
1645000 1859835 500 1860335 113.09 923706 0 923706 2784041
6 Aurangabad Aurangabad 483000 491500 0 491500 101.76 73918 0 73918 565418
7 Aurangabad Beed 603000 613137 0 613137 101.68 71871 0 71871 685008
8 Aurangabad Hingoli 345000 348400 0 348400 100.99 124846 0 124846 473246
9 Aurangabad Jalna 157000 165000 0 165000 105.10 126963 0 126963 291963
10 Aurangabad Latur 368000 374750 0 374750 101.83 28670 0 28670 403420
11 Aurangabad Nanded 488000 510000 0 510000 104.51 82043 46062 128105 638105
12 Aurangabad Osmanabad 363000 373000 0 373000 102.75 13427 0 13427 386427
13 Aurangabad Parbhani 153000 161500 0 161500 105.56 122980 0 122980 284480
2960000 3037287 0 3037287 102.61 644718 46062 690780 3728067
14 Konkan Mumbai City 0 0 0 0 0 8020 0 8020 8020
15 Konkan Mumbai suburban 0 5000 0 5000 0 4823 0 4823 9823
16 Konkan Palghar 116000 531409 2105 533514 459.93 279345 0 279345 812859
17 Konkan Raighad 88000 234109 27835 261944 297.66 36780 0 36780 298724
18 Konkan Ratnagiri 11000 26847 18425 45272 411.56 16763 142940 159703 204975
19 Konkan Sindhudurg 23000 27500 0 27500 119.57 117898 0 117898 145398
20 Konkan Thane 148000 656650 0 656650 443.68 287011 0 287011 943661
386000 1481515 48365 1529880 396.34 750640 142940 893580 2423460
21 Nagpur Bhandara 424000 684890 0 684890 161.53 109050 0 109050 793940
22 Nagpur Chandrapur 1145000 1556787 467580 2024367 176.80 446205 111007 557212 2581579
23 Nagpur Gadchiroli 420000 598636 0 598636 142.53 105995 13410 119405 718041
24 Nagpur Gondia 552000 828266 0 828266 150.05 2915 0 2915 831181
25 Nagpur Nagpur 686000 1002805 0 1002805 146.18 303441 8433 311874 1314679
26 Nagpur Wardha 270000 525002 0 525002 194.45 28681 0 28681 553683
3497000 5196386 467580 5663966 161.97 996287 132850 1129137 6793103
27 Nashik Ahmednagar 1054000 1591379 0 1591379 150.98 362789 17725 380514 1971893
28 Nashik Dhule 305000 515500 0 515500 169.02 178854 9531 188385 703885
29 Nashik Jalgaon 950000 1085050 0 1085050 114.22 85113 16400 101513 1186563
30 Nashik Nandurbar 869000 1033000 0 1033000 118.87 70199 8820 79019 1112019
31 Nashik Nashik 1402000 2492433 17415 2509848 179.02 17910 69744 87654 2597502
4580000 6717362 17415 6734777 147.05 714865 122220 837085 7571862
32 Pune Kolhapur 210000 405304 0 405304 193.00 171918 200540 372458 777762
33 Pune Pune 1010000 1135510 189392 1324902 131.18 11189 989678 1000867 2325769
34 Pune Sangli 230000 332000 0 332000 144.35 168833 0 168833 500833
35 Pune Satara 272000 527600 0 527600 193.97 60462 23511 83973 611573
36 Pune Solapur 410000 468700 144746 613446 149.62 8718 0 8718 622164
2132000 2869114 334138 3203252 150.25 421120 1213729 1634849 4838101
15200000 21161499 867998 22029497 144.93 4451336 1657801 6109137 28138634
Table showing Districtwise Targer v/s Achievement for 2-crore plantation program
S.No. Revenue Division District Forest Department Non - forest Department Achievement in %
Cumulative
target for non
-forest
departments
for all
districts put
together was
50 lakh
Division Subtotal
Division Subtotal
Division Subtotal
Division Subtotal
Division Subtotal
Division Subtotal
Grand Total
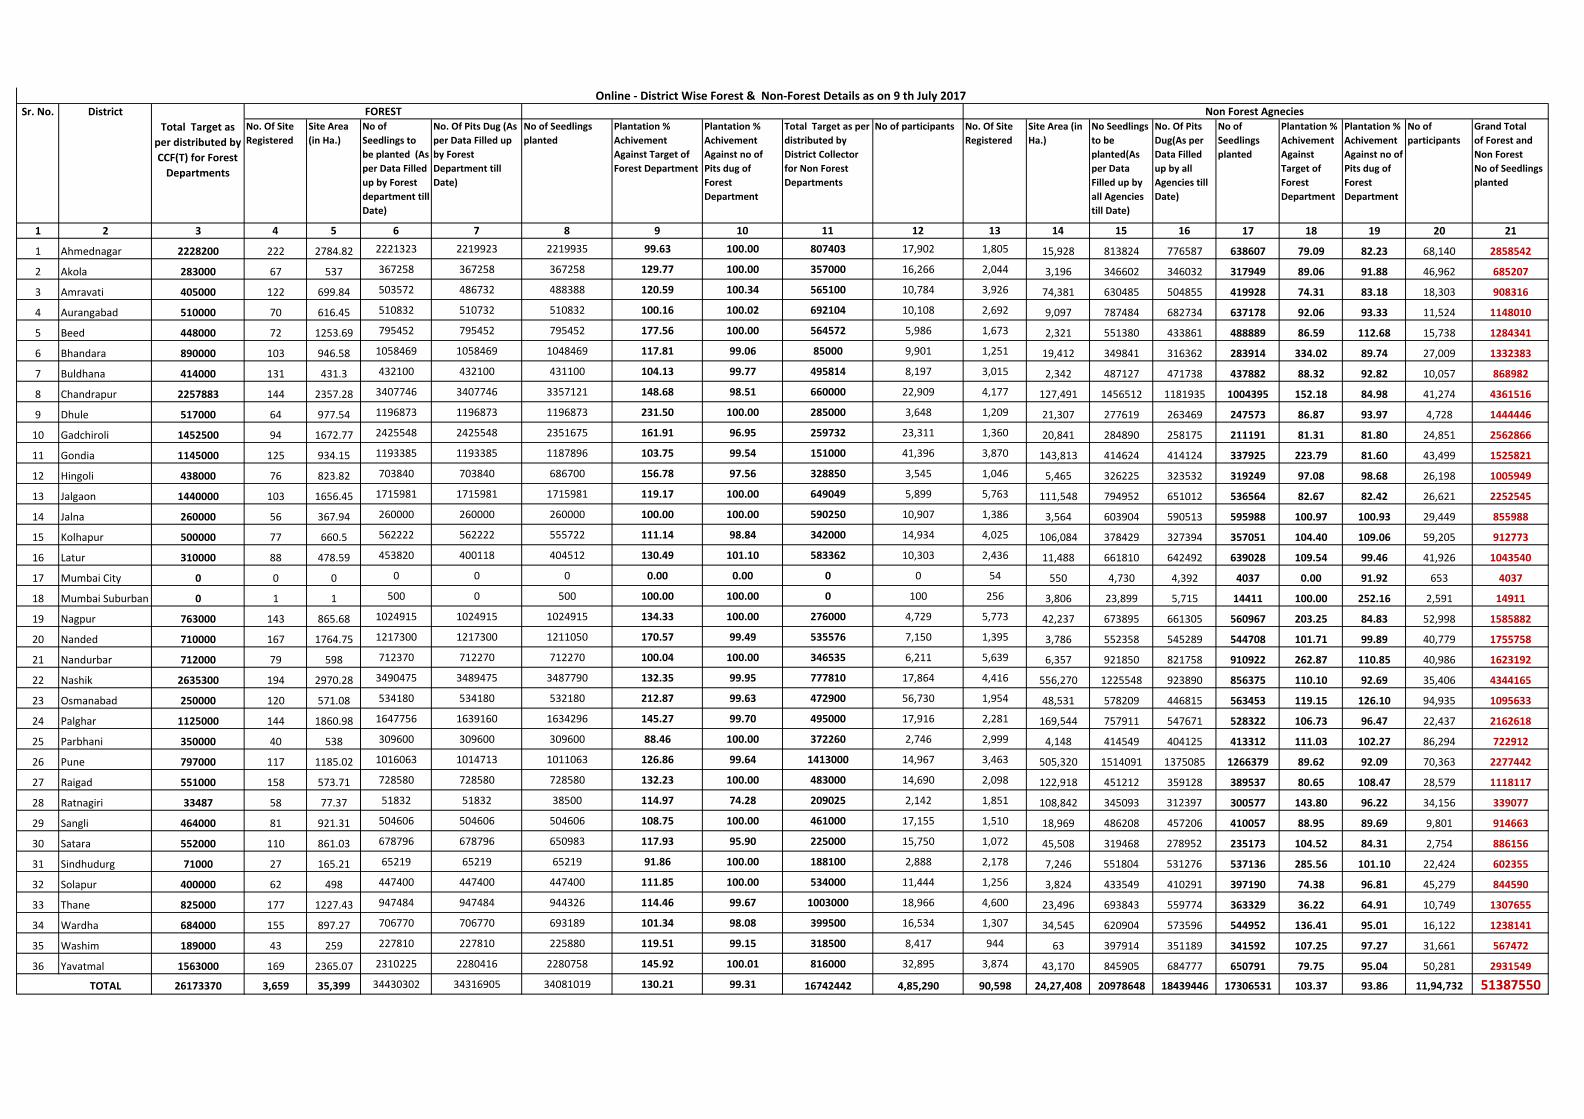
Total Target as
per distributed by
CCF(T) for Forest
Departments
No. Of Site
Registered
Site Area
(in Ha.)
No of
Seedlings to
be planted (As
per Data Filled
up by Forest
department till
Date)
No. Of Pits Dug (As
per Data Filled up
by Forest
Department till
Date)
No of Seedlings
planted
Plantation %
Achivement
Against Target of
Forest Department
Plantation %
Achivement
Against no of
Pits dug of
Forest
Department
Total Target as per
distributed by
District Collector
for Non Forest
Departments
No of participants No. Of Site
Registered
Site Area (in
Ha.)
No Seedlings
to be
planted(As
per Data
Filled up by
all Agencies
till Date)
No. Of Pits
Dug(As per
Data Filled
up by all
Agencies till
Date)
No of
Seedlings
planted
Plantation %
Achivement
Against
Target of
Forest
Department
Plantation %
Achivement
Against no of
Pits dug of
Forest
Department
No of
participants
Grand Total
of Forest and
Non Forest
No of Seedlings
planted
1 2 3 4 5 6 7 8 9 10 11 12 13 14 15 16 17 18 19 20 21
1 Ahmednagar 2228200 222 2784.82 2221323 2219923 2219935 99.63 100.00 807403 17,902 1,805 15,928 813824 776587 638607 79.09 82.23 68,140 2858542
2 Akola 283000 67 537 367258 367258 367258 129.77 100.00 357000 16,266 2,044 3,196 346602 346032 317949 89.06 91.88 46,962 685207
3 Amravati 405000 122 699.84 503572 486732 488388 120.59 100.34 565100 10,784 3,926 74,381 630485 504855 419928 74.31 83.18 18,303 908316
4 Aurangabad 510000 70 616.45 510832 510732 510832 100.16 100.02 692104 10,108 2,692 9,097 787484 682734 637178 92.06 93.33 11,524 1148010
5 Beed 448000 72 1253.69 795452 795452 795452 177.56 100.00 564572 5,986 1,673 2,321 551380 433861 488889 86.59 112.68 15,738 1284341
6 Bhandara 890000 103 946.58 1058469 1058469 1048469 117.81 99.06 85000 9,901 1,251 19,412 349841 316362 283914 334.02 89.74 27,009 1332383
7 Buldhana 414000 131 431.3 432100 432100 431100 104.13 99.77 495814 8,197 3,015 2,342 487127 471738 437882 88.32 92.82 10,057 868982
8 Chandrapur 2257883 144 2357.28 3407746 3407746 3357121 148.68 98.51 660000 22,909 4,177 127,491 1456512 1181935 1004395 152.18 84.98 41,274 4361516
9 Dhule 517000 64 977.54 1196873 1196873 1196873 231.50 100.00 285000 3,648 1,209 21,307 277619 263469 247573 86.87 93.97 4,728 1444446
10 Gadchiroli 1452500 94 1672.77 2425548 2425548 2351675 161.91 96.95 259732 23,311 1,360 20,841 284890 258175 211191 81.31 81.80 24,851 2562866
11 Gondia 1145000 125 934.15 1193385 1193385 1187896 103.75 99.54 151000 41,396 3,870 143,813 414624 414124 337925 223.79 81.60 43,499 1525821
12 Hingoli 438000 76 823.82 703840 703840 686700 156.78 97.56 328850 3,545 1,046 5,465 326225 323532 319249 97.08 98.68 26,198 1005949
13 Jalgaon 1440000 103 1656.45 1715981 1715981 1715981 119.17 100.00 649049 5,899 5,763 111,548 794952 651012 536564 82.67 82.42 26,621 2252545
14 Jalna 260000 56 367.94 260000 260000 260000 100.00 100.00 590250 10,907 1,386 3,564 603904 590513 595988 100.97 100.93 29,449 855988
15 Kolhapur 500000 77 660.5 562222 562222 555722 111.14 98.84 342000 14,934 4,025 106,084 378429 327394 357051 104.40 109.06 59,205 912773
16 Latur 310000 88 478.59 453820 400118 404512 130.49 101.10 583362 10,303 2,436 11,488 661810 642492 639028 109.54 99.46 41,926 1043540
17 Mumbai City 0 0 0 0 0 0 0.00 0.00 0 0 54 550 4,730 4,392 4037 0.00 91.92 653 4037
18 Mumbai Suburban 0 1 1 500 0 500 100.00 100.00 0 100 256 3,806 23,899 5,715 14411 100.00 252.16 2,591 14911
19 Nagpur 763000 143 865.68 1024915 1024915 1024915 134.33 100.00 276000 4,729 5,773 42,237 673895 661305 560967 203.25 84.83 52,998 1585882
20 Nanded 710000 167 1764.75 1217300 1217300 1211050 170.57 99.49 535576 7,150 1,395 3,786 552358 545289 544708 101.71 99.89 40,779 1755758
21 Nandurbar 712000 79 598 712370 712270 712270 100.04 100.00 346535 6,211 5,639 6,357 921850 821758 910922 262.87 110.85 40,986 1623192
22 Nashik 2635300 194 2970.28 3490475 3489475 3487790 132.35 99.95 777810 17,864 4,416 556,270 1225548 923890 856375 110.10 92.69 35,406 4344165
23 Osmanabad 250000 120 571.08 534180 534180 532180 212.87 99.63 472900 56,730 1,954 48,531 578209 446815 563453 119.15 126.10 94,935 1095633
24 Palghar 1125000 144 1860.98 1647756 1639160 1634296 145.27 99.70 495000 17,916 2,281 169,544 757911 547671 528322 106.73 96.47 22,437 2162618
25 Parbhani 350000 40 538 309600 309600 309600 88.46 100.00 372260 2,746 2,999 4,148 414549 404125 413312 111.03 102.27 86,294 722912
26 Pune 797000 117 1185.02 1016063 1014713 1011063 126.86 99.64 1413000 14,967 3,463 505,320 1514091 1375085 1266379 89.62 92.09 70,363 2277442
27 Raigad 551000 158 573.71 728580 728580 728580 132.23 100.00 483000 14,690 2,098 122,918 451212 359128 389537 80.65 108.47 28,579 1118117
28 Ratnagiri 33487 58 77.37 51832 51832 38500 114.97 74.28 209025 2,142 1,851 108,842 345093 312397 300577 143.80 96.22 34,156 339077
29 Sangli 464000 81 921.31 504606 504606 504606 108.75 100.00 461000 17,155 1,510 18,969 486208 457206 410057 88.95 89.69 9,801 914663
30 Satara 552000 110 861.03 678796 678796 650983 117.93 95.90 225000 15,750 1,072 45,508 319468 278952 235173 104.52 84.31 2,754 886156
31 Sindhudurg 71000 27 165.21 65219 65219 65219 91.86 100.00 188100 2,888 2,178 7,246 551804 531276 537136 285.56 101.10 22,424 602355
32 Solapur 400000 62 498 447400 447400 447400 111.85 100.00 534000 11,444 1,256 3,824 433549 410291 397190 74.38 96.81 45,279 844590
33 Thane 825000 177 1227.43 947484 947484 944326 114.46 99.67 1003000 18,966 4,600 23,496 693843 559774 363329 36.22 64.91 10,749 1307655
34 Wardha 684000 155 897.27 706770 706770 693189 101.34 98.08 399500 16,534 1,307 34,545 620904 573596 544952 136.41 95.01 16,122 1238141
35 Washim 189000 43 259 227810 227810 225880 119.51 99.15 318500 8,417 944 63 397914 351189 341592 107.25 97.27 31,661 567472
36 Yavatmal 1563000 169 2365.07 2310225 2280416 2280758 145.92 100.01 816000 32,895 3,874 43,170 845905 684777 650791 79.75 95.04 50,281 2931549
TOTAL 26173370 3,659 35,399 34430302 34316905 34081019 130.21 99.31 16742442 4,85,290 90,598 24,27,408 20978648 18439446 17306531 103.37 93.86 11,94,732 51387550
FORESTDistrictSr. No.
Online - District Wise Forest & Non-Forest Details as on 9 th July 2017
Non Forest Agnecies
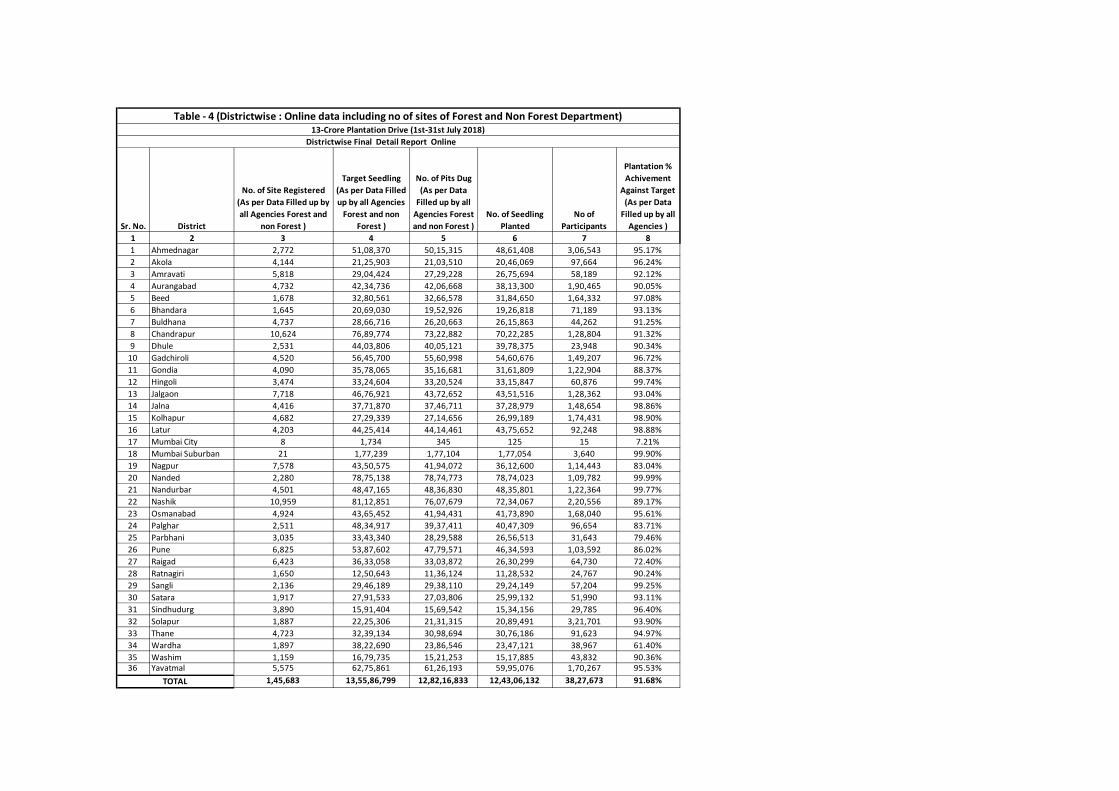
Sr. No. District
No. of Site Registered
(As per Data Filled up by
all Agencies Forest and
non Forest )
Target Seedling
(As per Data Filled
up by all Agencies
Forest and non
Forest )
No. of Pits Dug
(As per Data
Filled up by all
Agencies Forest
and non Forest )
No. of Seedling
Planted
No of
Participants
Plantation %
Achivement
Against Target
(As per Data
Filled up by all
Agencies )
1 2 3 4 5 6 7 8
1 Ahmednagar 2,772 51,08,370 50,15,315 48,61,408 3,06,543 95.17%
2 Akola 4,144 21,25,903 21,03,510 20,46,069 97,664 96.24%
3 Amravati 5,818 29,04,424 27,29,228 26,75,694 58,189 92.12%
4 Aurangabad 4,732 42,34,736 42,06,668 38,13,300 1,90,465 90.05%
5 Beed 1,678 32,80,561 32,66,578 31,84,650 1,64,332 97.08%
6 Bhandara 1,645 20,69,030 19,52,926 19,26,818 71,189 93.13%
7 Buldhana 4,737 28,66,716 26,20,663 26,15,863 44,262 91.25%
8 Chandrapur 10,624 76,89,774 73,22,882 70,22,285 1,28,804 91.32%
9 Dhule 2,531 44,03,806 40,05,121 39,78,375 23,948 90.34%
10 Gadchiroli 4,520 56,45,700 55,60,998 54,60,676 1,49,207 96.72%
11 Gondia 4,090 35,78,065 35,16,681 31,61,809 1,22,904 88.37%
12 Hingoli 3,474 33,24,604 33,20,524 33,15,847 60,876 99.74%
13 Jalgaon 7,718 46,76,921 43,72,652 43,51,516 1,28,362 93.04%
14 Jalna 4,416 37,71,870 37,46,711 37,28,979 1,48,654 98.86%
15 Kolhapur 4,682 27,29,339 27,14,656 26,99,189 1,74,431 98.90%
16 Latur 4,203 44,25,414 44,14,461 43,75,652 92,248 98.88%
17 Mumbai City 8 1,734 345 125 15 7.21%
18 Mumbai Suburban 21 1,77,239 1,77,104 1,77,054 3,640 99.90%
19 Nagpur 7,578 43,50,575 41,94,072 36,12,600 1,14,443 83.04%
20 Nanded 2,280 78,75,138 78,74,773 78,74,023 1,09,782 99.99%
21 Nandurbar 4,501 48,47,165 48,36,830 48,35,801 1,22,364 99.77%
22 Nashik 10,959 81,12,851 76,07,679 72,34,067 2,20,556 89.17%
23 Osmanabad 4,924 43,65,452 41,94,431 41,73,890 1,68,040 95.61%
24 Palghar 2,511 48,34,917 39,37,411 40,47,309 96,654 83.71%
25 Parbhani 3,035 33,43,340 28,29,588 26,56,513 31,643 79.46%
26 Pune 6,825 53,87,602 47,79,571 46,34,593 1,03,592 86.02%
27 Raigad 6,423 36,33,058 33,03,872 26,30,299 64,730 72.40%
28 Ratnagiri 1,650 12,50,643 11,36,124 11,28,532 24,767 90.24%
29 Sangli 2,136 29,46,189 29,38,110 29,24,149 57,204 99.25%
30 Satara 1,917 27,91,533 27,03,806 25,99,132 51,990 93.11%
31 Sindhudurg 3,890 15,91,404 15,69,542 15,34,156 29,785 96.40%
32 Solapur 1,887 22,25,306 21,31,315 20,89,491 3,21,701 93.90%
33 Thane 4,723 32,39,134 30,98,694 30,76,186 91,623 94.97%
34 Wardha 1,897 38,22,690 23,86,546 23,47,121 38,967 61.40%
35 Washim 1,159 16,79,735 15,21,253 15,17,885 43,832 90.36%36 Yavatmal 5,575 62,75,861 61,26,193 59,95,076 1,70,267 95.53%
1,45,683 13,55,86,799 12,82,16,833 12,43,06,132 38,27,673 91.68%
Districtwise Final Detail Report Online
Table - 4 (Districtwise : Online data including no of sites of Forest and Non Forest Department)
TOTAL
13-Crore Plantation Drive (1st-31st July 2018)
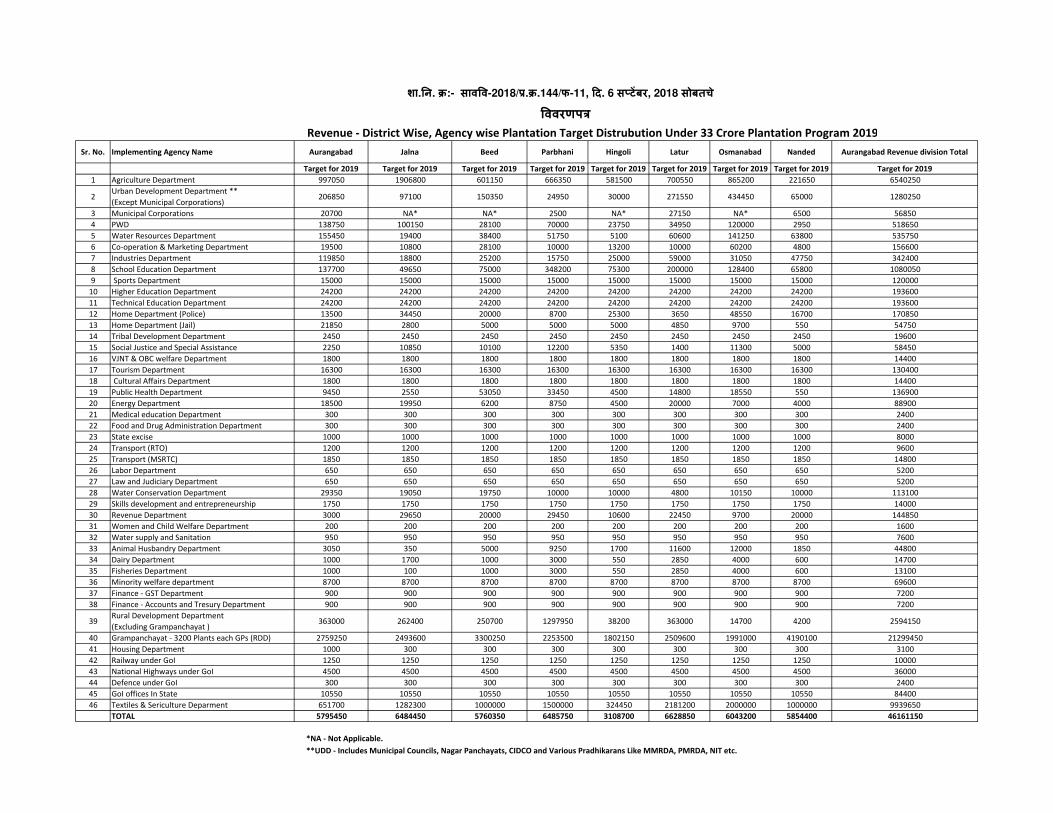
Sr. No. Implementing Agency Name Aurangabad Jalna Beed Parbhani Hingoli Latur Osmanabad Nanded Aurangabad Revenue division Total
Target for 2019 Target for 2019 Target for 2019 Target for 2019 Target for 2019 Target for 2019 Target for 2019 Target for 2019 Target for 2019
1 Agriculture Department 997050 1906800 601150 666350 581500 700550 865200 221650 6540250
2Urban Development Department **
(Except Municipal Corporations)206850 97100 150350 24950 30000 271550 434450 65000 1280250
3 Municipal Corporations 20700 NA* NA* 2500 NA* 27150 NA* 6500 56850
4 PWD 138750 100150 28100 70000 23750 34950 120000 2950 518650
5 Water Resources Department 155450 19400 38400 51750 5100 60600 141250 63800 535750
6 Co-operation & Marketing Department 19500 10800 28100 10000 13200 10000 60200 4800 156600
7 Industries Department 119850 18800 25200 15750 25000 59000 31050 47750 342400
8 School Education Department 137700 49650 75000 348200 75300 200000 128400 65800 1080050
9 Sports Department 15000 15000 15000 15000 15000 15000 15000 15000 120000
10 Higher Education Department 24200 24200 24200 24200 24200 24200 24200 24200 193600
11 Technical Education Department 24200 24200 24200 24200 24200 24200 24200 24200 193600
12 Home Department (Police) 13500 34450 20000 8700 25300 3650 48550 16700 170850
13 Home Department (Jail) 21850 2800 5000 5000 5000 4850 9700 550 54750
14 Tribal Development Department 2450 2450 2450 2450 2450 2450 2450 2450 19600
15 Social Justice and Special Assistance 2250 10850 10100 12200 5350 1400 11300 5000 58450
16 VJNT & OBC welfare Department 1800 1800 1800 1800 1800 1800 1800 1800 14400
17 Tourism Department 16300 16300 16300 16300 16300 16300 16300 16300 130400
18 Cultural Affairs Department 1800 1800 1800 1800 1800 1800 1800 1800 14400
19 Public Health Department 9450 2550 53050 33450 4500 14800 18550 550 136900
20 Energy Department 18500 19950 6200 8750 4500 20000 7000 4000 88900
21 Medical education Department 300 300 300 300 300 300 300 300 2400
22 Food and Drug Administration Department 300 300 300 300 300 300 300 300 2400
23 State excise 1000 1000 1000 1000 1000 1000 1000 1000 8000
24 Transport (RTO) 1200 1200 1200 1200 1200 1200 1200 1200 9600
25 Transport (MSRTC) 1850 1850 1850 1850 1850 1850 1850 1850 14800
26 Labor Department 650 650 650 650 650 650 650 650 5200
27 Law and Judiciary Department 650 650 650 650 650 650 650 650 5200
28 Water Conservation Department 29350 19050 19750 10000 10000 4800 10150 10000 113100
29 Skills development and entrepreneurship 1750 1750 1750 1750 1750 1750 1750 1750 14000
30 Revenue Department 3000 29650 20000 29450 10600 22450 9700 20000 144850
31 Women and Child Welfare Department 200 200 200 200 200 200 200 200 1600
32 Water supply and Sanitation 950 950 950 950 950 950 950 950 7600
33 Animal Husbandry Department 3050 350 5000 9250 1700 11600 12000 1850 44800
34 Dairy Department 1000 1700 1000 3000 550 2850 4000 600 14700
35 Fisheries Department 1000 100 1000 3000 550 2850 4000 600 13100
36 Minority welfare department 8700 8700 8700 8700 8700 8700 8700 8700 69600
37 Finance - GST Department 900 900 900 900 900 900 900 900 7200
38 Finance - Accounts and Tresury Department 900 900 900 900 900 900 900 900 7200
39Rural Development Department
(Excluding Grampanchayat )363000 262400 250700 1297950 38200 363000 14700 4200 2594150
40 Grampanchayat - 3200 Plants each GPs (RDD) 2759250 2493600 3300250 2253500 1802150 2509600 1991000 4190100 21299450
41 Housing Department 1000 300 300 300 300 300 300 300 3100
42 Railway under GoI 1250 1250 1250 1250 1250 1250 1250 1250 10000
43 National Highways under GoI 4500 4500 4500 4500 4500 4500 4500 4500 36000
44 Defence under GoI 300 300 300 300 300 300 300 300 2400
45 GoI offices In State 10550 10550 10550 10550 10550 10550 10550 10550 84400
46 Textiles & Sericulture Deparment 651700 1282300 1000000 1500000 324450 2181200 2000000 1000000 9939650
TOTAL 5795450 6484450 5760350 6485750 3108700 6628850 6043200 5854400 46161150
शा.�न. �:- साव�व-2018/.�.144/फ-11, �द. 6 स ट�बर, 2018 सोबतचे
�ववरणप�
Revenue - District Wise, Agency wise Plantation Target Distrubution Under 33 Crore Plantation Program 2019
*NA - Not Applicable.
**UDD - Includes Municipal Councils, Nagar Panchayats, CIDCO and Various Pradhikarans Like MMRDA, PMRDA, NIT etc.
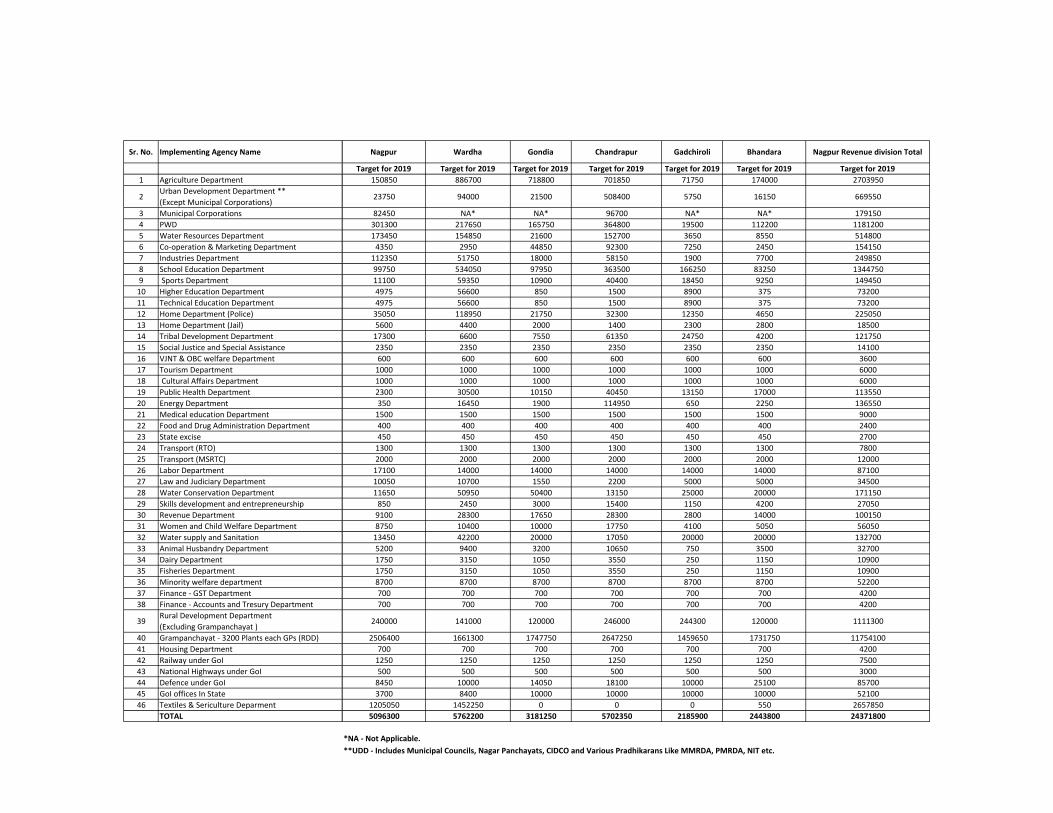
Sr. No. Implementing Agency Name
1 Agriculture Department
2Urban Development Department **
(Except Municipal Corporations)
3 Municipal Corporations
4 PWD
5 Water Resources Department
6 Co-operation & Marketing Department
7 Industries Department
8 School Education Department
9 Sports Department
10 Higher Education Department
11 Technical Education Department
12 Home Department (Police)
13 Home Department (Jail)
14 Tribal Development Department
15 Social Justice and Special Assistance
16 VJNT & OBC welfare Department
17 Tourism Department
18 Cultural Affairs Department
19 Public Health Department
20 Energy Department
21 Medical education Department
22 Food and Drug Administration Department
23 State excise
24 Transport (RTO)
25 Transport (MSRTC)
26 Labor Department
27 Law and Judiciary Department
28 Water Conservation Department
29 Skills development and entrepreneurship
30 Revenue Department
31 Women and Child Welfare Department
32 Water supply and Sanitation
33 Animal Husbandry Department
34 Dairy Department
35 Fisheries Department
36 Minority welfare department
37 Finance - GST Department
38 Finance - Accounts and Tresury Department
39Rural Development Department
(Excluding Grampanchayat )
40 Grampanchayat - 3200 Plants each GPs (RDD)
41 Housing Department
42 Railway under GoI
43 National Highways under GoI
44 Defence under GoI
45 GoI offices In State
46 Textiles & Sericulture Deparment
TOTAL
Revenue - District Wise, Agency wise Plantation Target Distrubution Under 33 Crore Plantation Program 2019
*NA - Not Applicable.
**UDD - Includes Municipal Councils, Nagar Panchayats, CIDCO and Various Pradhikarans Like MMRDA, PMRDA, NIT etc.
Nagpur Wardha Gondia Chandrapur Gadchiroli Bhandara Nagpur Revenue division Total
Target for 2019 Target for 2019 Target for 2019 Target for 2019 Target for 2019 Target for 2019 Target for 2019
150850 886700 718800 701850 71750 174000 2703950
23750 94000 21500 508400 5750 16150 669550
82450 NA* NA* 96700 NA* NA* 179150
301300 217650 165750 364800 19500 112200 1181200
173450 154850 21600 152700 3650 8550 514800
4350 2950 44850 92300 7250 2450 154150
112350 51750 18000 58150 1900 7700 249850
99750 534050 97950 363500 166250 83250 1344750
11100 59350 10900 40400 18450 9250 149450
4975 56600 850 1500 8900 375 73200
4975 56600 850 1500 8900 375 73200
35050 118950 21750 32300 12350 4650 225050
5600 4400 2000 1400 2300 2800 18500
17300 6600 7550 61350 24750 4200 121750
2350 2350 2350 2350 2350 2350 14100
600 600 600 600 600 600 3600
1000 1000 1000 1000 1000 1000 6000
1000 1000 1000 1000 1000 1000 6000
2300 30500 10150 40450 13150 17000 113550
350 16450 1900 114950 650 2250 136550
1500 1500 1500 1500 1500 1500 9000
400 400 400 400 400 400 2400
450 450 450 450 450 450 2700
1300 1300 1300 1300 1300 1300 7800
2000 2000 2000 2000 2000 2000 12000
17100 14000 14000 14000 14000 14000 87100
10050 10700 1550 2200 5000 5000 34500
11650 50950 50400 13150 25000 20000 171150
850 2450 3000 15400 1150 4200 27050
9100 28300 17650 28300 2800 14000 100150
8750 10400 10000 17750 4100 5050 56050
13450 42200 20000 17050 20000 20000 132700
5200 9400 3200 10650 750 3500 32700
1750 3150 1050 3550 250 1150 10900
1750 3150 1050 3550 250 1150 10900
8700 8700 8700 8700 8700 8700 52200
700 700 700 700 700 700 4200
700 700 700 700 700 700 4200
240000 141000 120000 246000 244300 120000 1111300
2506400 1661300 1747750 2647250 1459650 1731750 11754100
700 700 700 700 700 700 4200
1250 1250 1250 1250 1250 1250 7500
500 500 500 500 500 500 3000
8450 10000 14050 18100 10000 25100 85700
3700 8400 10000 10000 10000 10000 52100
1205050 1452250 0 0 0 550 2657850
5096300 5762200 3181250 5702350 2185900 2443800 24371800
*NA - Not Applicable.
**UDD - Includes Municipal Councils, Nagar Panchayats, CIDCO and Various Pradhikarans Like MMRDA, PMRDA, NIT etc.
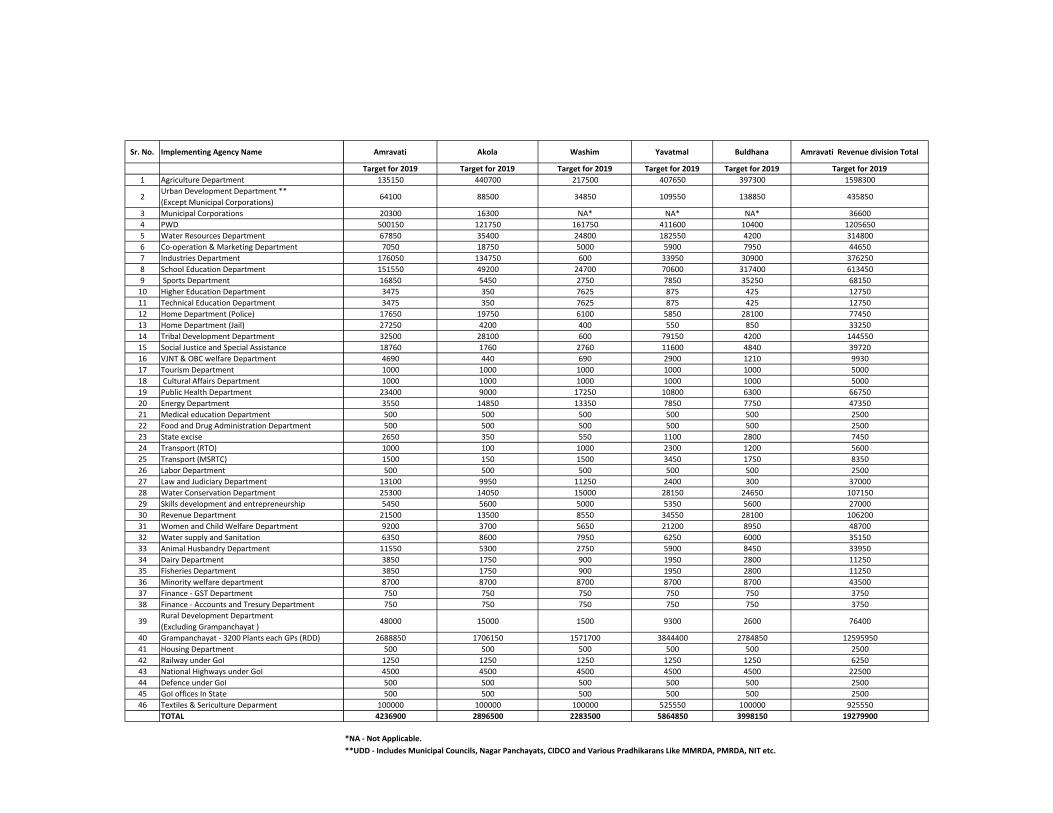
Sr. No. Implementing Agency Name
1 Agriculture Department
2Urban Development Department **
(Except Municipal Corporations)
3 Municipal Corporations
4 PWD
5 Water Resources Department
6 Co-operation & Marketing Department
7 Industries Department
8 School Education Department
9 Sports Department
10 Higher Education Department
11 Technical Education Department
12 Home Department (Police)
13 Home Department (Jail)
14 Tribal Development Department
15 Social Justice and Special Assistance
16 VJNT & OBC welfare Department
17 Tourism Department
18 Cultural Affairs Department
19 Public Health Department
20 Energy Department
21 Medical education Department
22 Food and Drug Administration Department
23 State excise
24 Transport (RTO)
25 Transport (MSRTC)
26 Labor Department
27 Law and Judiciary Department
28 Water Conservation Department
29 Skills development and entrepreneurship
30 Revenue Department
31 Women and Child Welfare Department
32 Water supply and Sanitation
33 Animal Husbandry Department
34 Dairy Department
35 Fisheries Department
36 Minority welfare department
37 Finance - GST Department
38 Finance - Accounts and Tresury Department
39Rural Development Department
(Excluding Grampanchayat )
40 Grampanchayat - 3200 Plants each GPs (RDD)
41 Housing Department
42 Railway under GoI
43 National Highways under GoI
44 Defence under GoI
45 GoI offices In State
46 Textiles & Sericulture Deparment
TOTAL
Revenue - District Wise, Agency wise Plantation Target Distrubution Under 33 Crore Plantation Program 2019
*NA - Not Applicable.
**UDD - Includes Municipal Councils, Nagar Panchayats, CIDCO and Various Pradhikarans Like MMRDA, PMRDA, NIT etc.
Amravati Akola Washim Yavatmal Buldhana Amravati Revenue division Total
Target for 2019 Target for 2019 Target for 2019 Target for 2019 Target for 2019 Target for 2019
135150 440700 217500 407650 397300 1598300
64100 88500 34850 109550 138850 435850
20300 16300 NA* NA* NA* 36600
500150 121750 161750 411600 10400 1205650
67850 35400 24800 182550 4200 314800
7050 18750 5000 5900 7950 44650
176050 134750 600 33950 30900 376250
151550 49200 24700 70600 317400 613450
16850 5450 2750 7850 35250 68150
3475 350 7625 875 425 12750
3475 350 7625 875 425 12750
17650 19750 6100 5850 28100 77450
27250 4200 400 550 850 33250
32500 28100 600 79150 4200 144550
18760 1760 2760 11600 4840 39720
4690 440 690 2900 1210 9930
1000 1000 1000 1000 1000 5000
1000 1000 1000 1000 1000 5000
23400 9000 17250 10800 6300 66750
3550 14850 13350 7850 7750 47350
500 500 500 500 500 2500
500 500 500 500 500 2500
2650 350 550 1100 2800 7450
1000 100 1000 2300 1200 5600
1500 150 1500 3450 1750 8350
500 500 500 500 500 2500
13100 9950 11250 2400 300 37000
25300 14050 15000 28150 24650 107150
5450 5600 5000 5350 5600 27000
21500 13500 8550 34550 28100 106200
9200 3700 5650 21200 8950 48700
6350 8600 7950 6250 6000 35150
11550 5300 2750 5900 8450 33950
3850 1750 900 1950 2800 11250
3850 1750 900 1950 2800 11250
8700 8700 8700 8700 8700 43500
750 750 750 750 750 3750
750 750 750 750 750 3750
48000 15000 1500 9300 2600 76400
2688850 1706150 1571700 3844400 2784850 12595950
500 500 500 500 500 2500
1250 1250 1250 1250 1250 6250
4500 4500 4500 4500 4500 22500
500 500 500 500 500 2500
500 500 500 500 500 2500
100000 100000 100000 525550 100000 925550
4236900 2896500 2283500 5864850 3998150 19279900
**UDD - Includes Municipal Councils, Nagar Panchayats, CIDCO and Various Pradhikarans Like MMRDA, PMRDA, NIT etc.
*NA - Not Applicable.
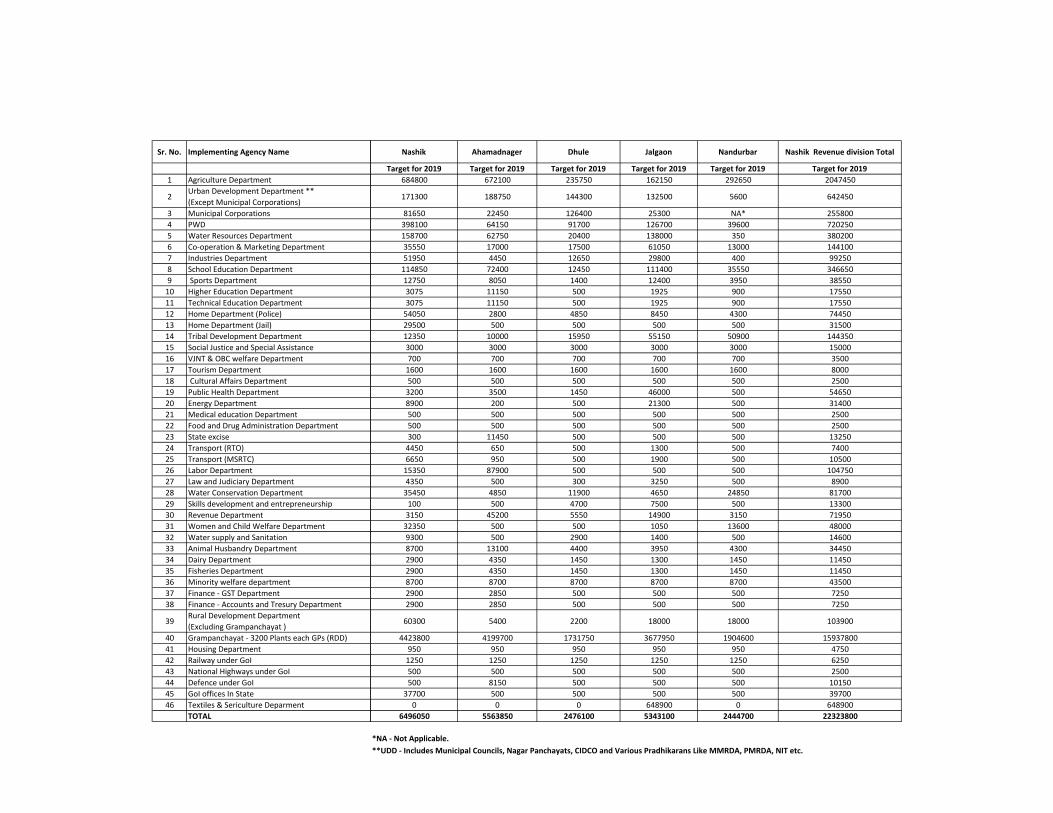
Sr. No. Implementing Agency Name
1 Agriculture Department
2Urban Development Department **
(Except Municipal Corporations)
3 Municipal Corporations
4 PWD
5 Water Resources Department
6 Co-operation & Marketing Department
7 Industries Department
8 School Education Department
9 Sports Department
10 Higher Education Department
11 Technical Education Department
12 Home Department (Police)
13 Home Department (Jail)
14 Tribal Development Department
15 Social Justice and Special Assistance
16 VJNT & OBC welfare Department
17 Tourism Department
18 Cultural Affairs Department
19 Public Health Department
20 Energy Department
21 Medical education Department
22 Food and Drug Administration Department
23 State excise
24 Transport (RTO)
25 Transport (MSRTC)
26 Labor Department
27 Law and Judiciary Department
28 Water Conservation Department
29 Skills development and entrepreneurship
30 Revenue Department
31 Women and Child Welfare Department
32 Water supply and Sanitation
33 Animal Husbandry Department
34 Dairy Department
35 Fisheries Department
36 Minority welfare department
37 Finance - GST Department
38 Finance - Accounts and Tresury Department
39Rural Development Department
(Excluding Grampanchayat )
40 Grampanchayat - 3200 Plants each GPs (RDD)
41 Housing Department
42 Railway under GoI
43 National Highways under GoI
44 Defence under GoI
45 GoI offices In State
46 Textiles & Sericulture Deparment
TOTAL
Revenue - District Wise, Agency wise Plantation Target Distrubution Under 33 Crore Plantation Program 2019
*NA - Not Applicable.
**UDD - Includes Municipal Councils, Nagar Panchayats, CIDCO and Various Pradhikarans Like MMRDA, PMRDA, NIT etc.
Nashik Ahamadnager Dhule Jalgaon Nandurbar Nashik Revenue division Total
Target for 2019 Target for 2019 Target for 2019 Target for 2019 Target for 2019 Target for 2019
684800 672100 235750 162150 292650 2047450
171300 188750 144300 132500 5600 642450
81650 22450 126400 25300 NA* 255800
398100 64150 91700 126700 39600 720250
158700 62750 20400 138000 350 380200
35550 17000 17500 61050 13000 144100
51950 4450 12650 29800 400 99250
114850 72400 12450 111400 35550 346650
12750 8050 1400 12400 3950 38550
3075 11150 500 1925 900 17550
3075 11150 500 1925 900 17550
54050 2800 4850 8450 4300 74450
29500 500 500 500 500 31500
12350 10000 15950 55150 50900 144350
3000 3000 3000 3000 3000 15000
700 700 700 700 700 3500
1600 1600 1600 1600 1600 8000
500 500 500 500 500 2500
3200 3500 1450 46000 500 54650
8900 200 500 21300 500 31400
500 500 500 500 500 2500
500 500 500 500 500 2500
300 11450 500 500 500 13250
4450 650 500 1300 500 7400
6650 950 500 1900 500 10500
15350 87900 500 500 500 104750
4350 500 300 3250 500 8900
35450 4850 11900 4650 24850 81700
100 500 4700 7500 500 13300
3150 45200 5550 14900 3150 71950
32350 500 500 1050 13600 48000
9300 500 2900 1400 500 14600
8700 13100 4400 3950 4300 34450
2900 4350 1450 1300 1450 11450
2900 4350 1450 1300 1450 11450
8700 8700 8700 8700 8700 43500
2900 2850 500 500 500 7250
2900 2850 500 500 500 7250
60300 5400 2200 18000 18000 103900
4423800 4199700 1731750 3677950 1904600 15937800
950 950 950 950 950 4750
1250 1250 1250 1250 1250 6250
500 500 500 500 500 2500
500 8150 500 500 500 10150
37700 500 500 500 500 39700
0 0 0 648900 0 648900
6496050 5563850 2476100 5343100 2444700 22323800
**UDD - Includes Municipal Councils, Nagar Panchayats, CIDCO and Various Pradhikarans Like MMRDA, PMRDA, NIT etc.
*NA - Not Applicable.
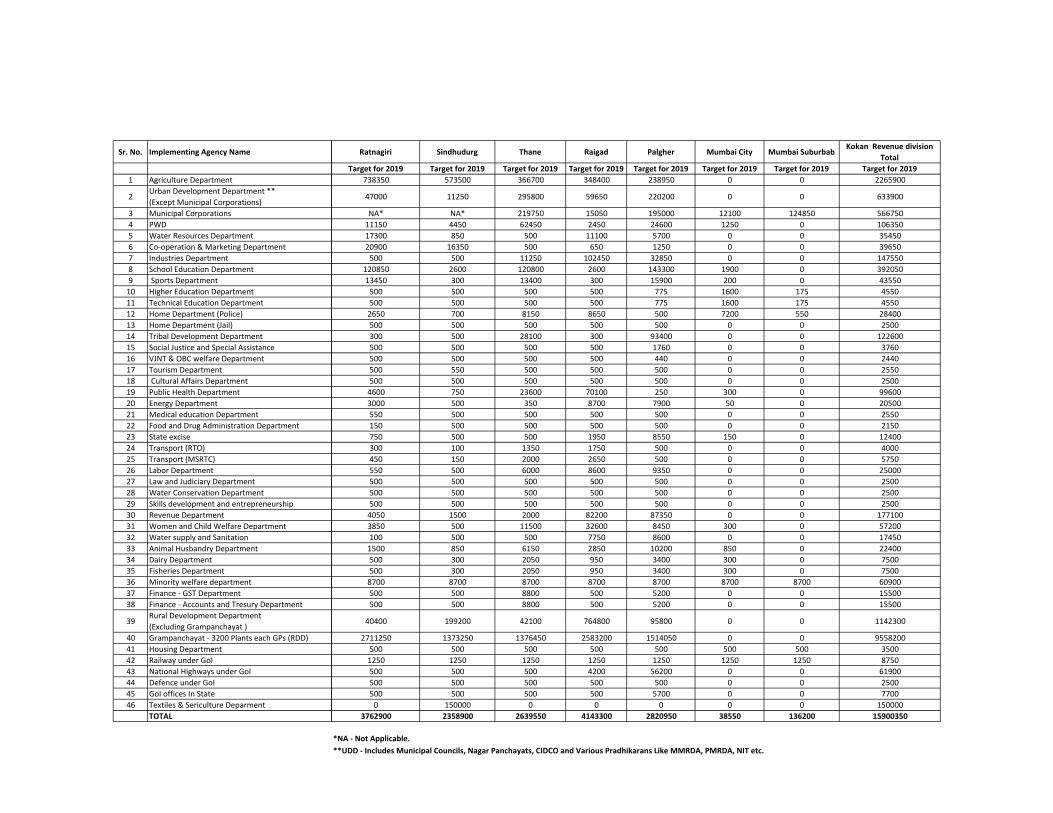
Sr. No. Implementing Agency Name
1 Agriculture Department
2Urban Development Department **
(Except Municipal Corporations)
3 Municipal Corporations
4 PWD
5 Water Resources Department
6 Co-operation & Marketing Department
7 Industries Department
8 School Education Department
9 Sports Department
10 Higher Education Department
11 Technical Education Department
12 Home Department (Police)
13 Home Department (Jail)
14 Tribal Development Department
15 Social Justice and Special Assistance
16 VJNT & OBC welfare Department
17 Tourism Department
18 Cultural Affairs Department
19 Public Health Department
20 Energy Department
21 Medical education Department
22 Food and Drug Administration Department
23 State excise
24 Transport (RTO)
25 Transport (MSRTC)
26 Labor Department
27 Law and Judiciary Department
28 Water Conservation Department
29 Skills development and entrepreneurship
30 Revenue Department
31 Women and Child Welfare Department
32 Water supply and Sanitation
33 Animal Husbandry Department
34 Dairy Department
35 Fisheries Department
36 Minority welfare department
37 Finance - GST Department
38 Finance - Accounts and Tresury Department
39Rural Development Department
(Excluding Grampanchayat )
40 Grampanchayat - 3200 Plants each GPs (RDD)
41 Housing Department
42 Railway under GoI
43 National Highways under GoI
44 Defence under GoI
45 GoI offices In State
46 Textiles & Sericulture Deparment
TOTAL
Revenue - District Wise, Agency wise Plantation Target Distrubution Under 33 Crore Plantation Program 2019
*NA - Not Applicable.
**UDD - Includes Municipal Councils, Nagar Panchayats, CIDCO and Various Pradhikarans Like MMRDA, PMRDA, NIT etc.
Ratnagiri Sindhudurg Thane Raigad Palgher Mumbai City Mumbai SuburbabKokan Revenue division
Total
Target for 2019 Target for 2019 Target for 2019 Target for 2019 Target for 2019 Target for 2019 Target for 2019 Target for 2019
738350 573500 366700 348400 238950 0 0 2265900
47000 11250 295800 59650 220200 0 0 633900
NA* NA* 219750 15050 195000 12100 124850 566750
11150 4450 62450 2450 24600 1250 0 106350
17300 850 500 11100 5700 0 0 35450
20900 16350 500 650 1250 0 0 39650
500 500 11250 102450 32850 0 0 147550
120850 2600 120800 2600 143300 1900 0 392050
13450 300 13400 300 15900 200 0 43550
500 500 500 500 775 1600 175 4550
500 500 500 500 775 1600 175 4550
2650 700 8150 8650 500 7200 550 28400
500 500 500 500 500 0 0 2500
300 500 28100 300 93400 0 0 122600
500 500 500 500 1760 0 0 3760
500 500 500 500 440 0 0 2440
500 550 500 500 500 0 0 2550
500 500 500 500 500 0 0 2500
4600 750 23600 70100 250 300 0 99600
3000 500 350 8700 7900 50 0 20500
550 500 500 500 500 0 0 2550
150 500 500 500 500 0 0 2150
750 500 500 1950 8550 150 0 12400
300 100 1350 1750 500 0 0 4000
450 150 2000 2650 500 0 0 5750
550 500 6000 8600 9350 0 0 25000
500 500 500 500 500 0 0 2500
500 500 500 500 500 0 0 2500
500 500 500 500 500 0 0 2500
4050 1500 2000 82200 87350 0 0 177100
3850 500 11500 32600 8450 300 0 57200
100 500 500 7750 8600 0 0 17450
1500 850 6150 2850 10200 850 0 22400
500 300 2050 950 3400 300 0 7500
500 300 2050 950 3400 300 0 7500
8700 8700 8700 8700 8700 8700 8700 60900
500 500 8800 500 5200 0 0 15500
500 500 8800 500 5200 0 0 15500
40400 199200 42100 764800 95800 0 0 1142300
2711250 1373250 1376450 2583200 1514050 0 0 9558200
500 500 500 500 500 500 500 3500
1250 1250 1250 1250 1250 1250 1250 8750
500 500 500 4200 56200 0 0 61900
500 500 500 500 500 0 0 2500
500 500 500 500 5700 0 0 7700
0 150000 0 0 0 0 0 150000
3762900 2358900 2639550 4143300 2820950 38550 136200 15900350
*NA - Not Applicable.
**UDD - Includes Municipal Councils, Nagar Panchayats, CIDCO and Various Pradhikarans Like MMRDA, PMRDA, NIT etc.
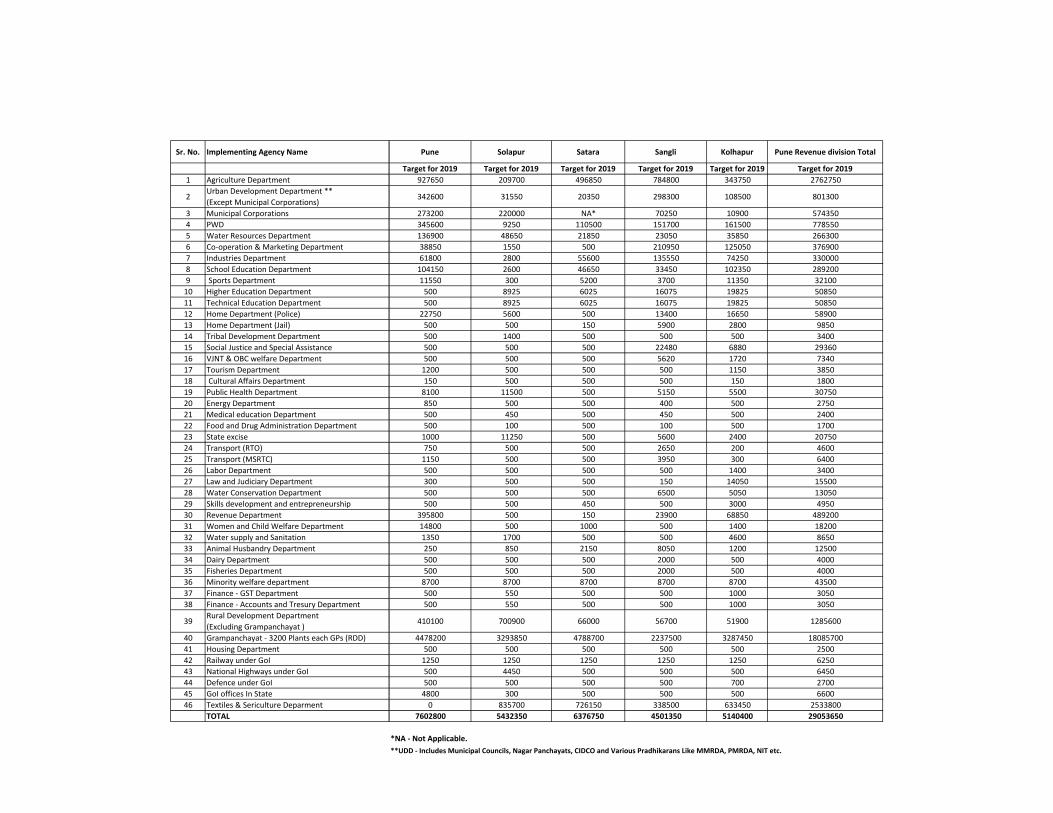
Sr. No. Implementing Agency Name
1 Agriculture Department
2Urban Development Department **
(Except Municipal Corporations)
3 Municipal Corporations
4 PWD
5 Water Resources Department
6 Co-operation & Marketing Department
7 Industries Department
8 School Education Department
9 Sports Department
10 Higher Education Department
11 Technical Education Department
12 Home Department (Police)
13 Home Department (Jail)
14 Tribal Development Department
15 Social Justice and Special Assistance
16 VJNT & OBC welfare Department
17 Tourism Department
18 Cultural Affairs Department
19 Public Health Department
20 Energy Department
21 Medical education Department
22 Food and Drug Administration Department
23 State excise
24 Transport (RTO)
25 Transport (MSRTC)
26 Labor Department
27 Law and Judiciary Department
28 Water Conservation Department
29 Skills development and entrepreneurship
30 Revenue Department
31 Women and Child Welfare Department
32 Water supply and Sanitation
33 Animal Husbandry Department
34 Dairy Department
35 Fisheries Department
36 Minority welfare department
37 Finance - GST Department
38 Finance - Accounts and Tresury Department
39Rural Development Department
(Excluding Grampanchayat )
40 Grampanchayat - 3200 Plants each GPs (RDD)
41 Housing Department
42 Railway under GoI
43 National Highways under GoI
44 Defence under GoI
45 GoI offices In State
46 Textiles & Sericulture Deparment
TOTAL
Revenue - District Wise, Agency wise Plantation Target Distrubution Under 33 Crore Plantation Program 2019
*NA - Not Applicable.
**UDD - Includes Municipal Councils, Nagar Panchayats, CIDCO and Various Pradhikarans Like MMRDA, PMRDA, NIT etc.
Pune Solapur Satara Sangli Kolhapur Pune Revenue division Total
Target for 2019 Target for 2019 Target for 2019 Target for 2019 Target for 2019 Target for 2019
927650 209700 496850 784800 343750 2762750
342600 31550 20350 298300 108500 801300
273200 220000 NA* 70250 10900 574350
345600 9250 110500 151700 161500 778550
136900 48650 21850 23050 35850 266300
38850 1550 500 210950 125050 376900
61800 2800 55600 135550 74250 330000
104150 2600 46650 33450 102350 289200
11550 300 5200 3700 11350 32100
500 8925 6025 16075 19825 50850
500 8925 6025 16075 19825 50850
22750 5600 500 13400 16650 58900
500 500 150 5900 2800 9850
500 1400 500 500 500 3400
500 500 500 22480 6880 29360
500 500 500 5620 1720 7340
1200 500 500 500 1150 3850
150 500 500 500 150 1800
8100 11500 500 5150 5500 30750
850 500 500 400 500 2750
500 450 500 450 500 2400
500 100 500 100 500 1700
1000 11250 500 5600 2400 20750
750 500 500 2650 200 4600
1150 500 500 3950 300 6400
500 500 500 500 1400 3400
300 500 500 150 14050 15500
500 500 500 6500 5050 13050
500 500 450 500 3000 4950
395800 500 150 23900 68850 489200
14800 500 1000 500 1400 18200
1350 1700 500 500 4600 8650
250 850 2150 8050 1200 12500
500 500 500 2000 500 4000
500 500 500 2000 500 4000
8700 8700 8700 8700 8700 43500
500 550 500 500 1000 3050
500 550 500 500 1000 3050
410100 700900 66000 56700 51900 1285600
4478200 3293850 4788700 2237500 3287450 18085700
500 500 500 500 500 2500
1250 1250 1250 1250 1250 6250
500 4450 500 500 500 6450
500 500 500 500 700 2700
4800 300 500 500 500 6600
0 835700 726150 338500 633450 2533800
7602800 5432350 6376750 4501350 5140400 29053650
**UDD - Includes Municipal Councils, Nagar Panchayats, CIDCO and Various Pradhikarans Like MMRDA, PMRDA, NIT etc.
*NA - Not Applicable.
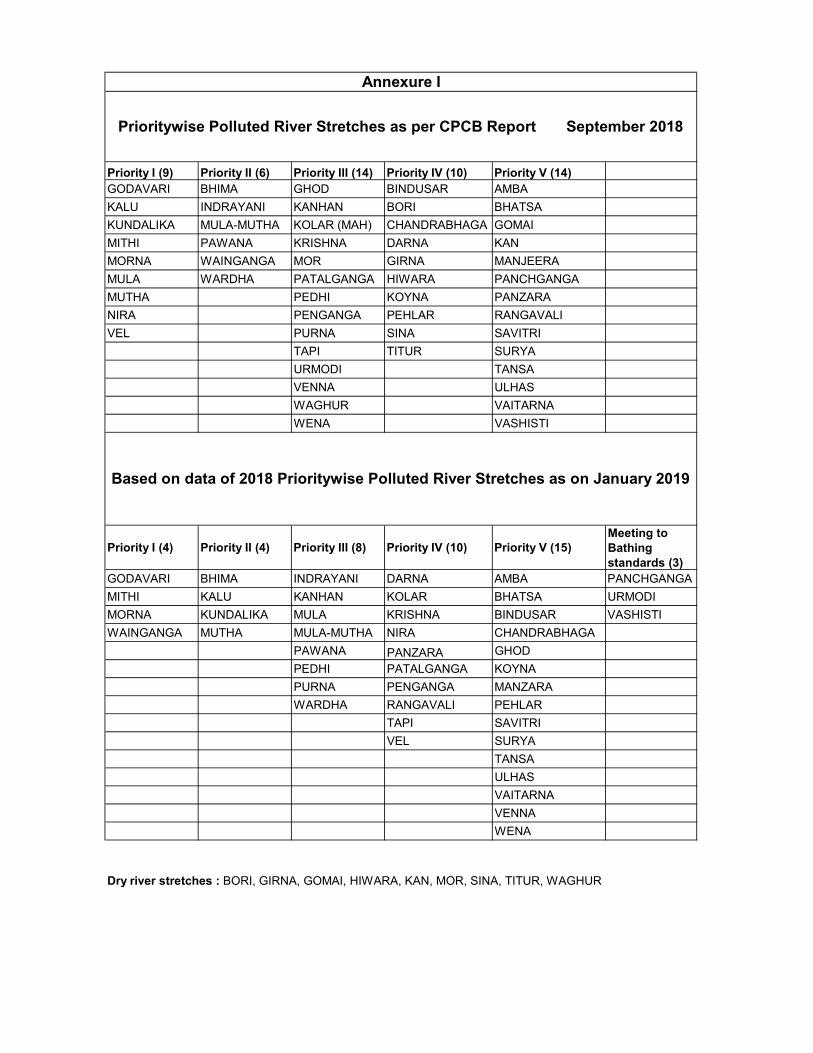
Priority I (9) Priority II (6) Priority III (14) Priority IV (10) Priority V (14)GODAVARI BHIMA GHOD BINDUSAR AMBA
KALU INDRAYANI KANHAN BORI BHATSA
KUNDALIKA MULA-MUTHA KOLAR (MAH) CHANDRABHAGA GOMAI
MITHI PAWANA KRISHNA DARNA KAN
MORNA WAINGANGA MOR GIRNA MANJEERA
MULA WARDHA PATALGANGA HIWARA PANCHGANGA
MUTHA PEDHI KOYNA PANZARA
NIRA PENGANGA PEHLAR RANGAVALI
VEL PURNA SINA SAVITRI
TAPI TITUR SURYA
URMODI TANSA
VENNA ULHAS
WAGHUR VAITARNA
WENA VASHISTI
Priority I (4) Priority II (4) Priority III (8) Priority IV (10) Priority V (15)Meeting to Bathing standards (3)
GODAVARI BHIMA INDRAYANI DARNA AMBA PANCHGANGA
MITHI KALU KANHAN KOLAR BHATSA URMODI
MORNA KUNDALIKA MULA KRISHNA BINDUSAR VASHISTI
WAINGANGA MUTHA MULA-MUTHA NIRA CHANDRABHAGA
PAWANA PANZARA GHOD
PEDHI PATALGANGA KOYNA
PURNA PENGANGA MANZARA
WARDHA RANGAVALI PEHLAR
TAPI SAVITRI
VEL SURYA
TANSA
ULHAS
VAITARNA
VENNA
WENA
Dry river stretches : BORI, GIRNA, GOMAI, HIWARA, KAN, MOR, SINA, TITUR, WAGHUR
Prioritywise Polluted River Stretches as per CPCB Report September 2018
Based on data of 2018 Prioritywise Polluted River Stretches as on January 2019
Annexure I
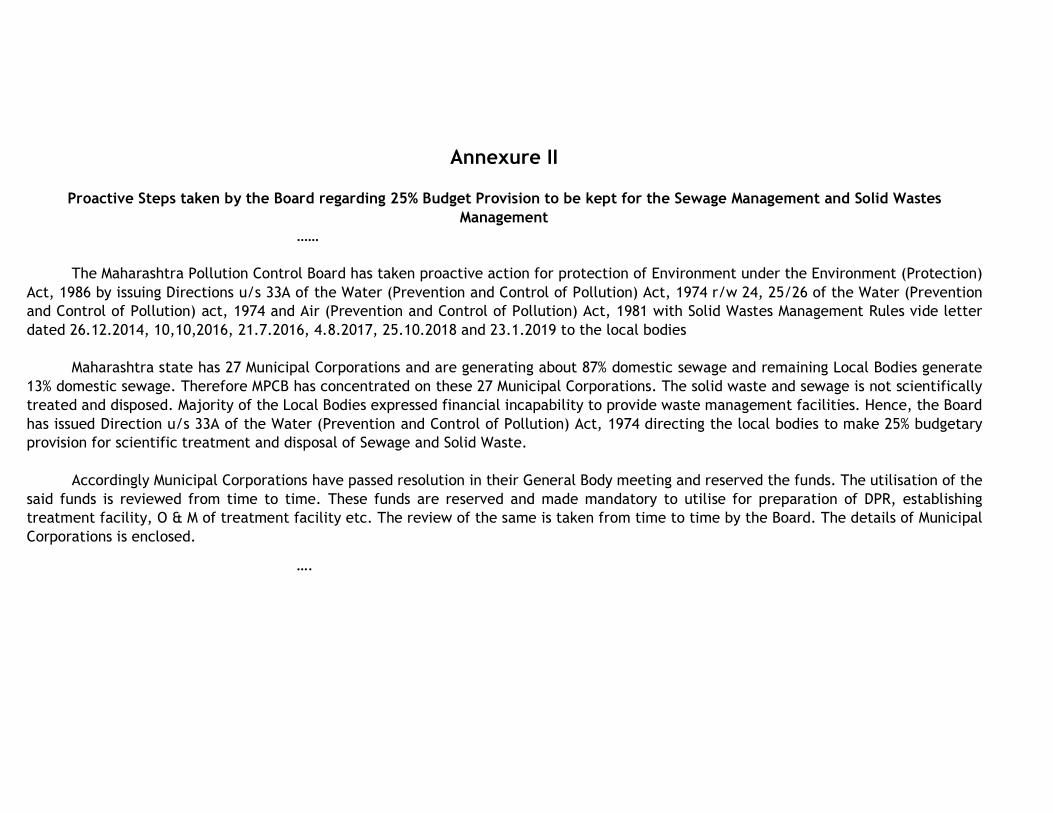
Annexure II
Proactive Steps taken by the Board regarding 25% Budget Provision to be kept for the Sewage Management and Solid Wastes Management
……
The Maharashtra Pollution Control Board has taken proactive action for protection of Environment under the Environment (Protection) Act, 1986 by issuing Directions u/s 33A of the Water (Prevention and Control of Pollution) Act, 1974 r/w 24, 25/26 of the Water (Prevention and Control of Pollution) act, 1974 and Air (Prevention and Control of Pollution) Act, 1981 with Solid Wastes Management Rules vide letter dated 26.12.2014, 10,10,2016, 21.7.2016, 4.8.2017, 25.10.2018 and 23.1.2019 to the local bodies
Maharashtra state has 27 Municipal Corporations and are generating about 87% domestic sewage and remaining Local Bodies generate
13% domestic sewage. Therefore MPCB has concentrated on these 27 Municipal Corporations. The solid waste and sewage is not scientifically treated and disposed. Majority of the Local Bodies expressed financial incapability to provide waste management facilities. Hence, the Board has issued Direction u/s 33A of the Water (Prevention and Control of Pollution) Act, 1974 directing the local bodies to make 25% budgetary provision for scientific treatment and disposal of Sewage and Solid Waste.
Accordingly Municipal Corporations have passed resolution in their General Body meeting and reserved the funds. The utilisation of the
said funds is reviewed from time to time. These funds are reserved and made mandatory to utilise for preparation of DPR, establishing treatment facility, O & M of treatment facility etc. The review of the same is taken from time to time by the Board. The details of Municipal Corporations is enclosed.
….
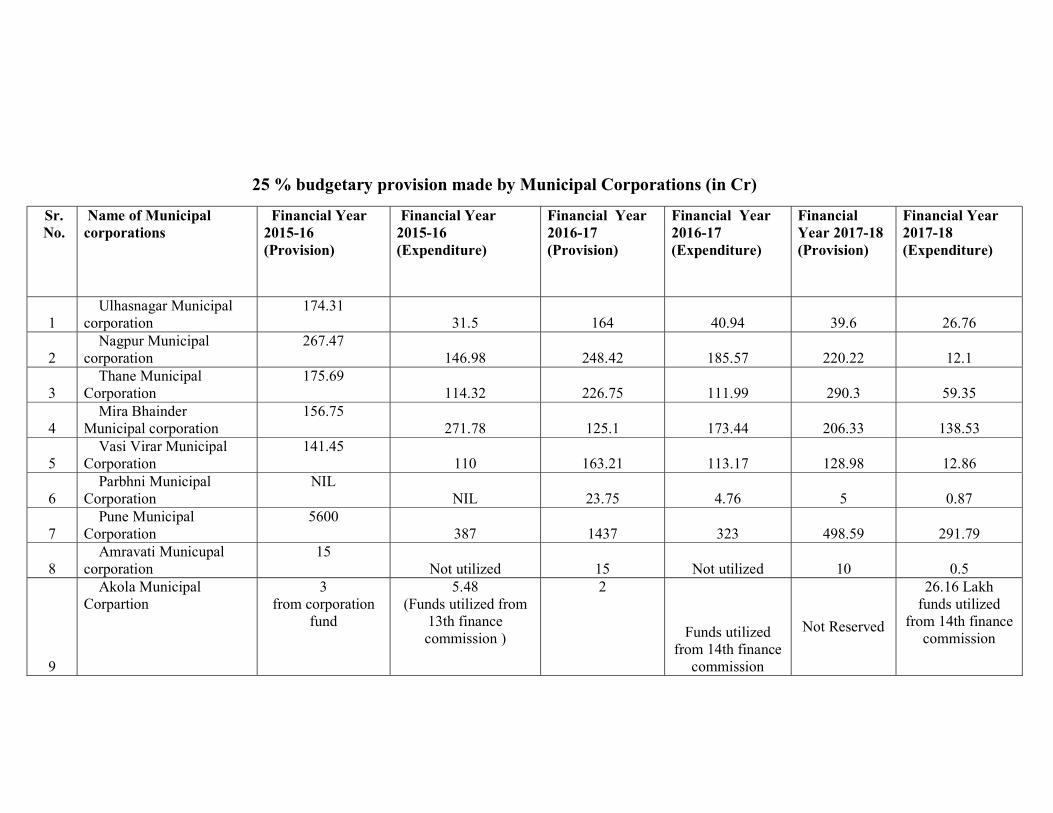
25 % budgetary provision made by Municipal Corporations (in Cr)
Sr. No.
Name of Municipal corporations
Financial Year 2015-16 (Provision)
Financial Year 2015-16 (Expenditure)
Financial Year 2016-17 (Provision)
Financial Year 2016-17 (Expenditure)
Financial Year 2017-18 (Provision)
Financial Year 2017-18 (Expenditure)
1 Ulhasnagar Municipal
corporation 174.31
31.5 164 40.94 39.6 26.76
2 Nagpur Municipal
corporation 267.47
146.98 248.42 185.57 220.22 12.1
3 Thane Municipal
Corporation 175.69
114.32 226.75 111.99 290.3 59.35
4 Mira Bhainder
Municipal corporation 156.75
271.78 125.1 173.44 206.33 138.53
5 Vasi Virar Municipal
Corporation 141.45
110 163.21 113.17 128.98 12.86
6 Parbhni Municipal
Corporation NIL
NIL 23.75 4.76 5 0.87
7 Pune Municipal
Corporation 5600
387 1437 323 498.59 291.79
8 Amravati Municupal
corporation 15
Not utilized 15 Not utilized 10 0.5
9
Akola Municipal Corpartion
3 from corporation
fund
5.48 (Funds utilized from
13th finance commission )
2
Funds utilized from 14th finance
commission
Not Reserved
26.16 Lakh funds utilized
from 14th finance commission
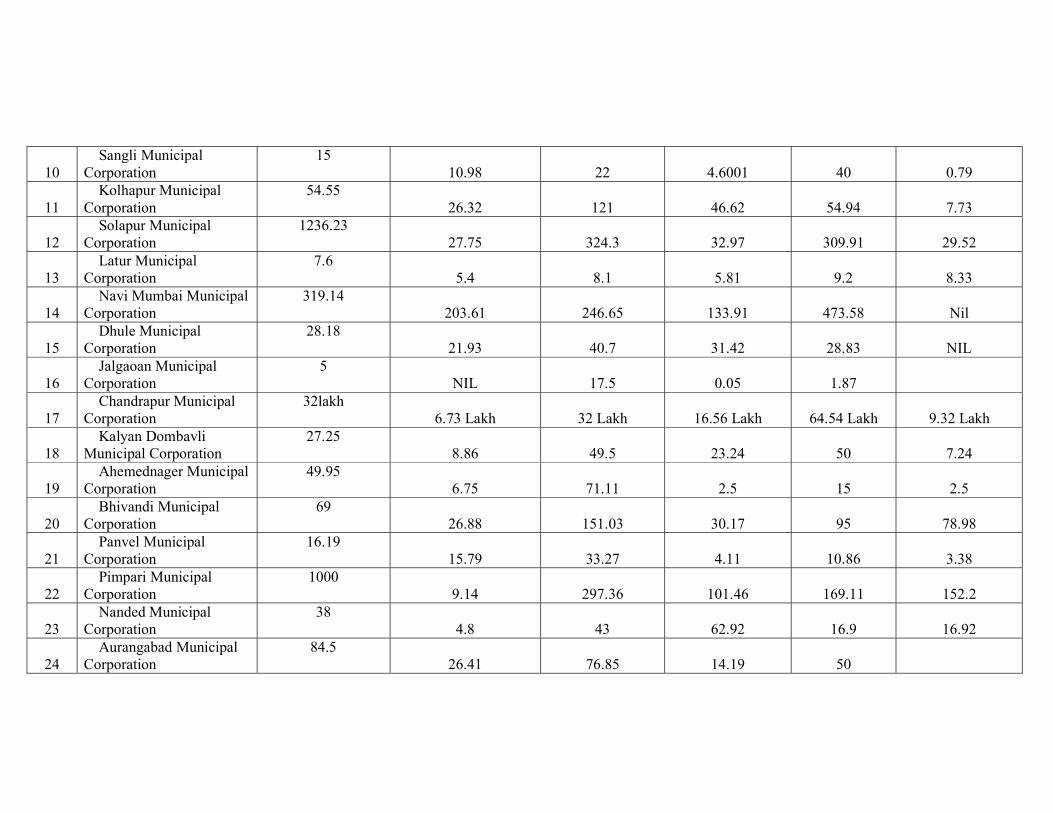
10 Sangli Municipal
Corporation 15
10.98 22 4.6001 40 0.79
11 Kolhapur Municipal
Corporation 54.55
26.32 121 46.62 54.94 7.73
12 Solapur Municipal
Corporation 1236.23
27.75 324.3 32.97 309.91 29.52
13 Latur Municipal
Corporation 7.6
5.4 8.1 5.81 9.2 8.33
14 Navi Mumbai Municipal
Corporation 319.14
203.61 246.65 133.91 473.58 Nil
15 Dhule Municipal
Corporation 28.18
21.93 40.7 31.42 28.83 NIL
16 Jalgaoan Municipal
Corporation 5
NIL 17.5 0.05 1.87
17 Chandrapur Municipal
Corporation 32lakh
6.73 Lakh 32 Lakh 16.56 Lakh 64.54 Lakh 9.32 Lakh
18 Kalyan Dombavli
Municipal Corporation 27.25
8.86 49.5 23.24 50 7.24
19 Ahemednager Municipal
Corporation 49.95
6.75 71.11 2.5 15 2.5
20 Bhivandi Municipal
Corporation 69
26.88 151.03 30.17 95 78.98
21 Panvel Municipal
Corporation 16.19
15.79 33.27 4.11 10.86 3.38
22 Pimpari Municipal
Corporation 1000
9.14 297.36 101.46 169.11 152.2
23 Nanded Municipal
Corporation 38
4.8 43 62.92 16.9 16.92
24 Aurangabad Municipal
Corporation 84.5
26.41 76.85 14.19 50
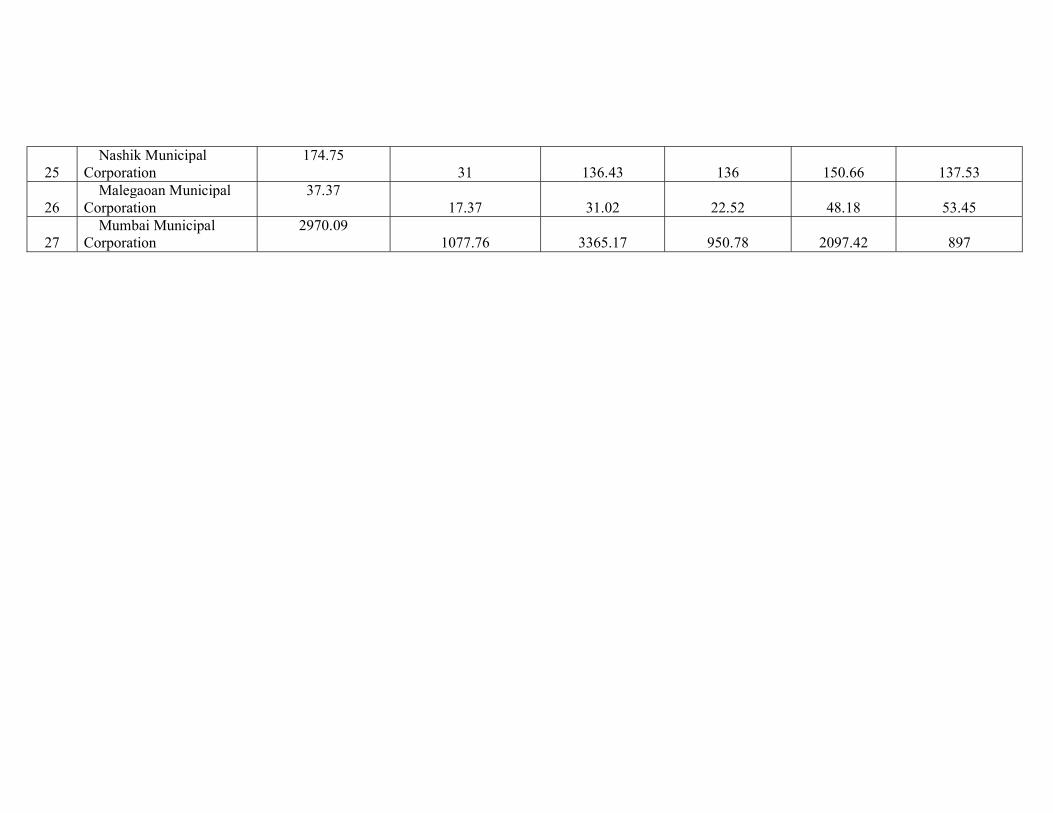
25 Nashik Municipal
Corporation 174.75
31 136.43 136 150.66 137.53
26 Malegaoan Municipal
Corporation 37.37
17.37 31.02 22.52 48.18 53.45
27 Mumbai Municipal
Corporation 2970.09
1077.76 3365.17 950.78 2097.42 897
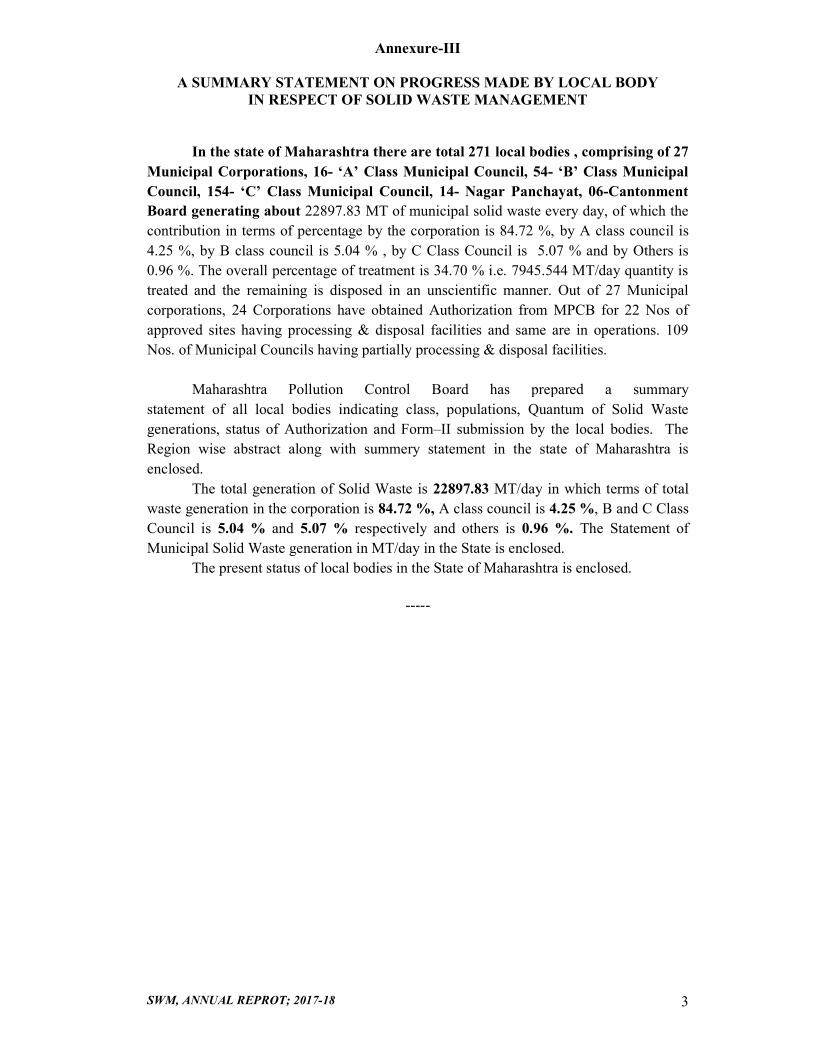
SWM, ANNUAL REPROT; 2017-18 3
Annexure-III
A SUMMARY STATEMENT ON PROGRESS MADE BY LOCAL BODY IN RESPECT OF SOLID WASTE MANAGEMENT
In the state of Maharashtra there are total 271 local bodies , comprising of 27 Municipal Corporations, 16- ‘A’ Class Municipal Council, 54- ‘B’ Class Municipal Council, 154- ‘C’ Class Municipal Council, 14- Nagar Panchayat, 06-Cantonment Board generating about 22897.83 MT of municipal solid waste every day, of which the contribution in terms of percentage by the corporation is 84.72 %, by A class council is 4.25 %, by B class council is 5.04 % , by C Class Council is 5.07 % and by Others is 0.96 %. The overall percentage of treatment is 34.70 % i.e. 7945.544 MT/day quantity is treated and the remaining is disposed in an unscientific manner. Out of 27 Municipal corporations, 24 Corporations have obtained Authorization from MPCB for 22 Nos of approved sites having processing & disposal facilities and same are in operations. 109 Nos. of Municipal Councils having partially processing & disposal facilities.
Maharashtra Pollution Control Board has prepared a summary statement of all local bodies indicating class, populations, Quantum of Solid Waste generations, status of Authorization and Form–II submission by the local bodies. The Region wise abstract along with summery statement in the state of Maharashtra is enclosed.
The total generation of Solid Waste is 22897.83 MT/day in which terms of total waste generation in the corporation is 84.72 %, A class council is 4.25 %, B and C Class Council is 5.04 % and 5.07 % respectively and others is 0.96 %. The Statement of Municipal Solid Waste generation in MT/day in the State is enclosed.
The present status of local bodies in the State of Maharashtra is enclosed.
-----
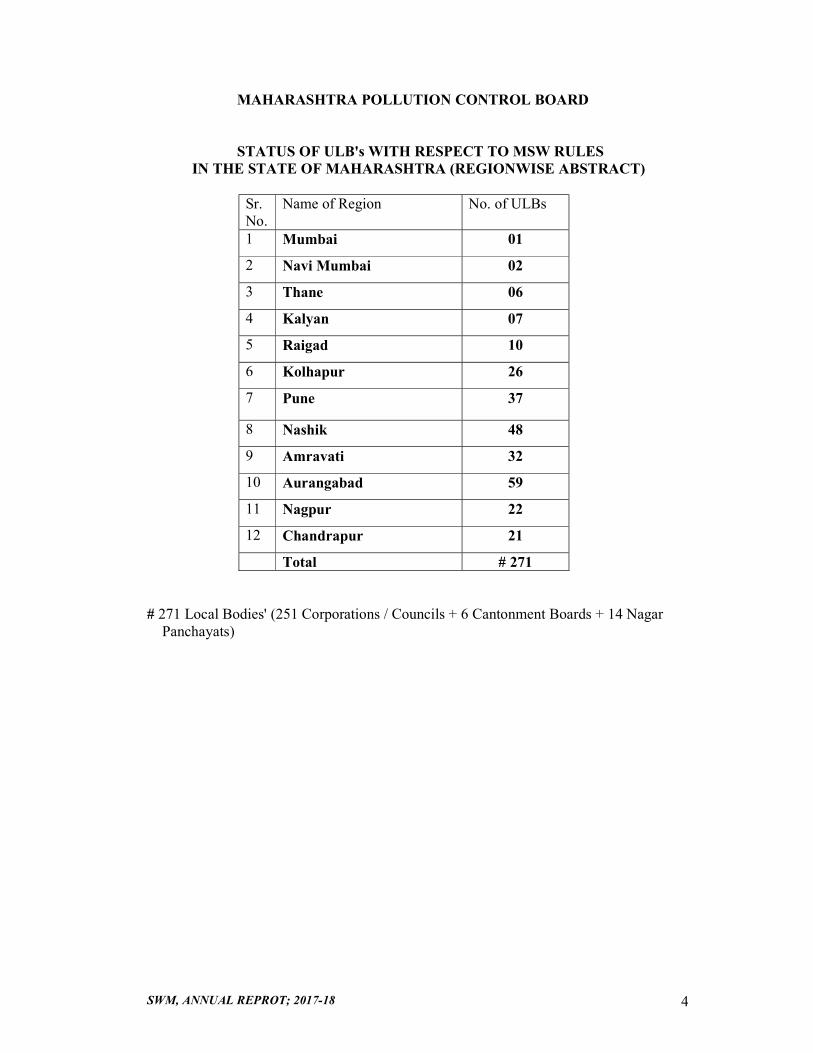
SWM, ANNUAL REPROT; 2017-18 4
MAHARASHTRA POLLUTION CONTROL BOARD
STATUS OF ULB's WITH RESPECT TO MSW RULES IN THE STATE OF MAHARASHTRA (REGIONWISE ABSTRACT)
Sr. No.
Name of Region No. of ULBs
1 Mumbai 01
2 Navi Mumbai 02
3 Thane 06
4 Kalyan 07
5 Raigad 10
6 Kolhapur 26
7 Pune 37
8 Nashik 48
9 Amravati 32
10 Aurangabad 59
11 Nagpur 22
12 Chandrapur 21
Total # 271 # 271 Local Bodies' (251 Corporations / Councils + 6 Cantonment Boards + 14 Nagar Panchayats)
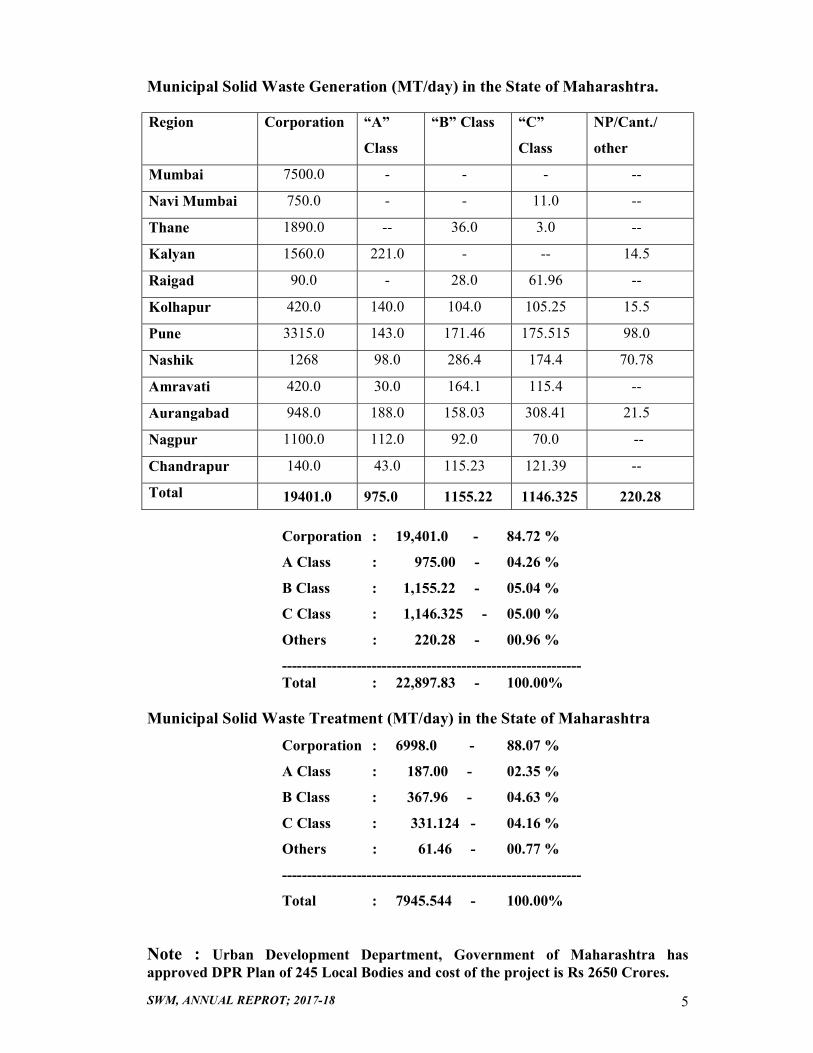
SWM, ANNUAL REPROT; 2017-18 5
Municipal Solid Waste Generation (MT/day) in the State of Maharashtra. Region Corporation “A”
Class
“B” Class “C”
Class
NP/Cant./
other
Mumbai 7500.0 - - - --
Navi Mumbai 750.0 - - 11.0 --
Thane 1890.0 -- 36.0 3.0 --
Kalyan 1560.0 221.0 - -- 14.5
Raigad 90.0 - 28.0 61.96 --
Kolhapur 420.0 140.0 104.0 105.25 15.5
Pune 3315.0 143.0 171.46 175.515 98.0
Nashik 1268 98.0 286.4 174.4 70.78
Amravati 420.0 30.0 164.1 115.4 --
Aurangabad 948.0 188.0 158.03 308.41 21.5
Nagpur 1100.0 112.0 92.0 70.0 --
Chandrapur 140.0 43.0 115.23 121.39 --
Total 19401.0 975.0 1155.22 1146.325 220.28
Corporation : 19,401.0 - 84.72 %
A Class : 975.00 - 04.26 %
B Class : 1,155.22 - 05.04 %
C Class : 1,146.325 - 05.00 %
Others : 220.28 - 00.96 %
------------------------------------------------------------ Total : 22,897.83 - 100.00%
Municipal Solid Waste Treatment (MT/day) in the State of Maharashtra
Corporation : 6998.0 - 88.07 %
A Class : 187.00 - 02.35 %
B Class : 367.96 - 04.63 %
C Class : 331.124 - 04.16 %
Others : 61.46 - 00.77 %
------------------------------------------------------------
Total : 7945.544 - 100.00%
Note : Urban Development Department, Government of Maharashtra has approved DPR Plan of 245 Local Bodies and cost of the project is Rs 2650 Crores.
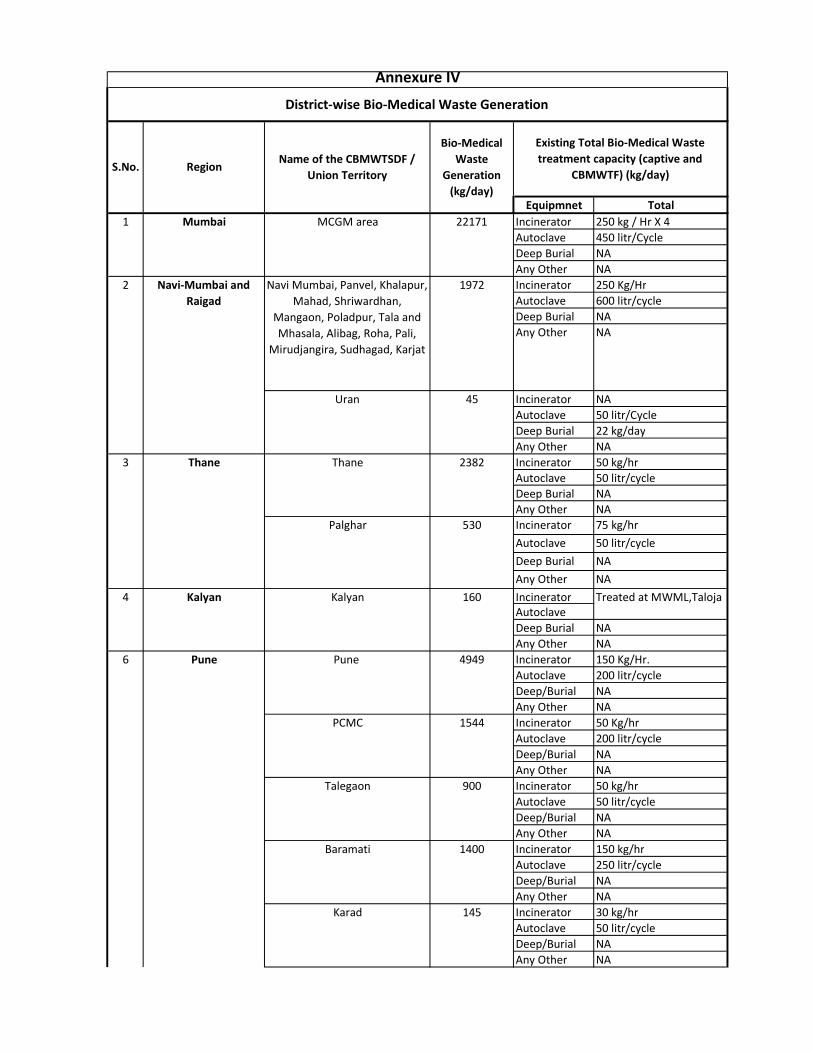
Equipmnet TotalIncinerator 250 kg / Hr X 4Autoclave 450 litr/CycleDeep Burial NAAny Other NAIncinerator 250 Kg/HrAutoclave 600 litr/cycleDeep Burial NAAny Other NA
Incinerator NAAutoclave 50 litr/CycleDeep Burial 22 kg/dayAny Other NAIncinerator 50 kg/hrAutoclave 50 litr/cycleDeep Burial NAAny Other NAIncinerator 75 kg/hrAutoclave 50 litr/cycleDeep Burial NAAny Other NAIncineratorAutoclaveDeep Burial NAAny Other NAIncinerator 150 Kg/Hr.Autoclave 200 litr/cycleDeep/Burial NAAny Other NAIncinerator 50 Kg/hrAutoclave 200 litr/cycleDeep/Burial NAAny Other NAIncinerator 50 kg/hrAutoclave 50 litr/cycleDeep/Burial NAAny Other NAIncinerator 150 kg/hrAutoclave 250 litr/cycleDeep/Burial NAAny Other NAIncinerator 30 kg/hrAutoclave 50 litr/cycleDeep/Burial NAAny Other NA
Annexure IV
District-wise Bio-Medical Waste Generation
Thane3
Palghar 530
PCMC 1544
Talegaon 900
2382
Existing Total Bio-Medical Waste treatment capacity (captive and
CBMWTF) (kg/day)
MCGM area 22171
Kalyan 160
S.No.
Treated at MWML,Taloja
Bio-Medical Waste
Generation (kg/day)
Name of the CBMWTSDF / Union Territory
Region
Mumbai1
2 Navi-Mumbai and Raigad
Kalyan4
6 Pune
Navi Mumbai, Panvel, Khalapur, Mahad, Shriwardhan,
Mangaon, Poladpur, Tala and Mhasala, Alibag, Roha, Pali,
Mirudjangira, Sudhagad, Karjat
1972
Uran 45
Thane
1400Baramati
Pune 4949
Karad 145
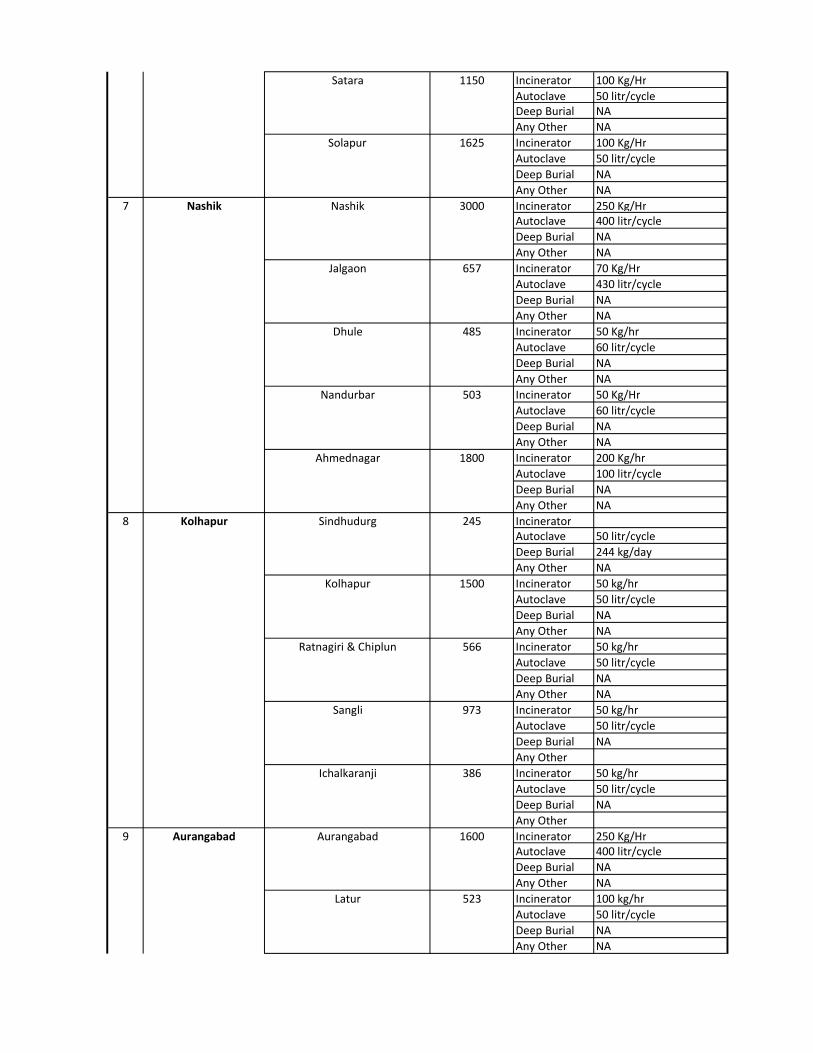
Incinerator 100 Kg/HrAutoclave 50 litr/cycleDeep Burial NAAny Other NAIncinerator 100 Kg/HrAutoclave 50 litr/cycleDeep Burial NAAny Other NAIncinerator 250 Kg/HrAutoclave 400 litr/cycleDeep Burial NAAny Other NAIncinerator 70 Kg/HrAutoclave 430 litr/cycleDeep Burial NAAny Other NAIncinerator 50 Kg/hrAutoclave 60 litr/cycleDeep Burial NAAny Other NAIncinerator 50 Kg/HrAutoclave 60 litr/cycleDeep Burial NAAny Other NAIncinerator 200 Kg/hrAutoclave 100 litr/cycleDeep Burial NAAny Other NAIncineratorAutoclave 50 litr/cycleDeep Burial 244 kg/dayAny Other NAIncinerator 50 kg/hrAutoclave 50 litr/cycleDeep Burial NAAny Other NAIncinerator 50 kg/hrAutoclave 50 litr/cycleDeep Burial NAAny Other NAIncinerator 50 kg/hrAutoclave 50 litr/cycleDeep Burial NAAny OtherIncinerator 50 kg/hrAutoclave 50 litr/cycleDeep Burial NAAny OtherIncinerator 250 Kg/HrAutoclave 400 litr/cycleDeep Burial NAAny Other NAIncinerator 100 kg/hrAutoclave 50 litr/cycleDeep Burial NAAny Other NA
9 Aurangabad Aurangabad
Latur
1600
523
Kolhapur
7 Nashik
8
657Jalgaon
3000
485Dhule
Nashik
Satara 1150
Solapur 1625
Sindhudurg
Kolhapur
Ratnagiri & Chiplun
245
1500
566
Sangli 973
Ichalkaranji 386
1800
503Nandurbar
Ahmednagar
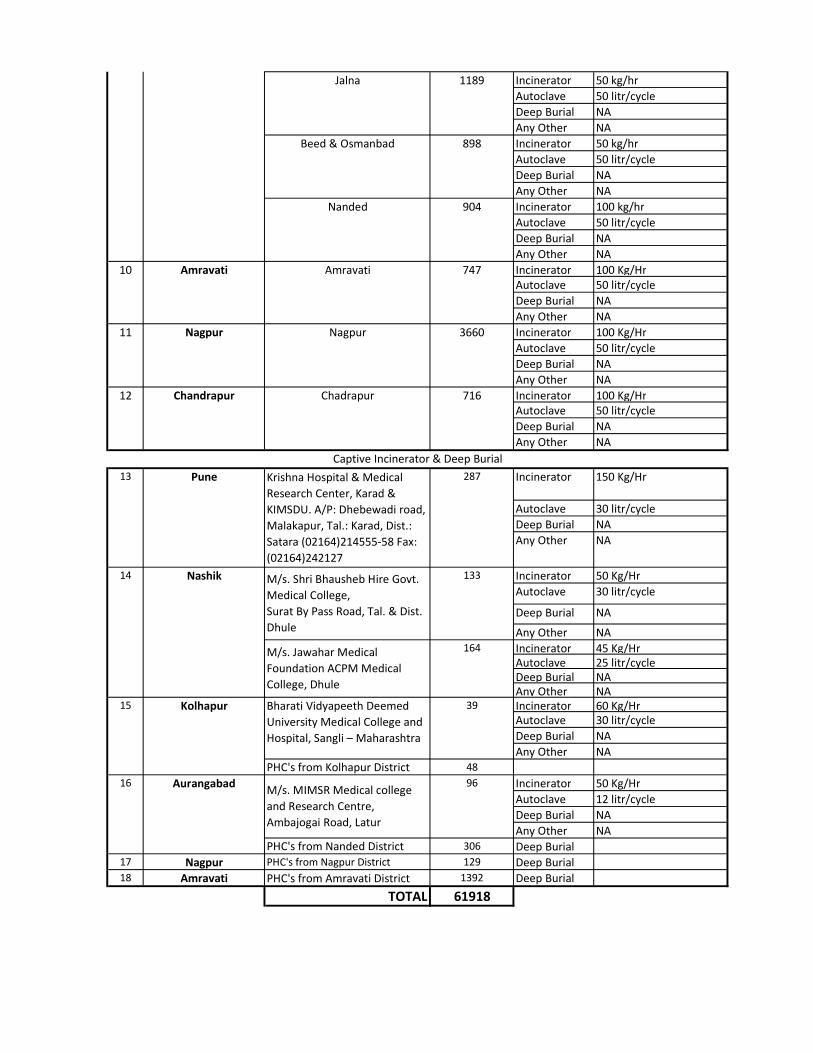
Incinerator 50 kg/hrAutoclave 50 litr/cycleDeep Burial NAAny Other NAIncinerator 50 kg/hrAutoclave 50 litr/cycleDeep Burial NAAny Other NAIncinerator 100 kg/hrAutoclave 50 litr/cycleDeep Burial NAAny Other NAIncinerator 100 Kg/HrAutoclave 50 litr/cycleDeep Burial NAAny Other NAIncinerator 100 Kg/HrAutoclave 50 litr/cycleDeep Burial NAAny Other NAIncinerator 100 Kg/HrAutoclave 50 litr/cycleDeep Burial NAAny Other NA
Incinerator 150 Kg/Hr
Autoclave 30 litr/cycleDeep Burial NAAny Other NA
Incinerator 50 Kg/HrAutoclave 30 litr/cycle
Deep Burial NA
Any Other NAIncinerator 45 Kg/HrAutoclave 25 litr/cycleDeep Burial NAAny Other NAIncinerator 60 Kg/HrAutoclave 30 litr/cycleDeep Burial NAAny Other NA
PHC's from Kolhapur District 48Incinerator 50 Kg/HrAutoclave 12 litr/cycleDeep Burial NAAny Other NA
PHC's from Nanded District 306 Deep Burial17 Nagpur PHC's from Nagpur District 129 Deep Burial18 Amravati PHC's from Amravati District 1392 Deep Burial
TOTAL 61918
Captive Incinerator & Deep Burial
96
14
15
16
133
13
Nashik
Kolhapur
287
164
39
Aurangabad M/s. MIMSR Medical college and Research Centre, Ambajogai Road, Latur
Pune Krishna Hospital & Medical Research Center, Karad & KIMSDU. A/P: Dhebewadi road, Malakapur, Tal.: Karad, Dist.: Satara (02164)214555-58 Fax: (02164)242127
M/s. Shri Bhausheb Hire Govt. Medical College,Surat By Pass Road, Tal. & Dist. Dhule
M/s. Jawahar Medical Foundation ACPM Medical College, Dhule
Bharati Vidyapeeth Deemed University Medical College and Hospital, Sangli – Maharashtra
716Chandrapur
10
11
12 Chadrapur
Nagpur 3660Nagpur
Amravati 747Amravati
Jalna
Beed & Osmanbad
Nanded
1189
898
904