Embed Size (px)
Citation preview

1
Research Methodology
Lesion 1-7
M. Com. 3rd Semester Course: MC-3.5
By: Prof. O.P. Verma
Research Methodology
Lesson 1 to 7
International Centre for Distance Education and Open Learning (ICDEOL) Himachal Pradesh University Summer Hill, Shimla, 171005

2
CONTENTS
LESSON TITLE PAGE NO.
1. INTRODUCTION TO RESEARCH
METHODOLOGY
5-21
2. RESEARCH PROBLEM AND
RESEARCH DESIGN
22-38
3. MEASERMENT AND SCALING
TECHNIQUES
39-55
4. DATA COLLECTION 56-70
5. SAMPLING DESIGN 71-85
6. ANALYSIS OF DATA AND
HYPOTHESIS TESTING
86-113
7. INTERPRETATION AND REPORT
WRITING
114-128
ASSIGENMENTS 129

3
Syllabus
MC 3.5 RESEARCH METHODOLOGY
Max Marks 80 Internal Assessment 20 Note: There will be nine (9) questions in
all. The first question is compulsory and consists of ten (10) short-questions having two (2)
marks each. The candidate will be required to attempt one question from each unit and each
question carries fifteen (15) marks
Course Contents:
Unit I:
Introduction of Research: Meaning, characteristics, objectives, nature, scope, significance,
limitations, role of research in decisions making, types, criteria of good research and ethics in
research; The research process -- steps in research process; Defining the research problem—
problem defining process, consideration in selecting a research problem; Research design—
definition, Types, components and significance.
Unit II:
Data collection and processing: Meaning of data, types of data; secondary data--advantages,
disadvantages, criteria for evaluating secondary data, secondary in Indian context; Primary
data—meaning, methods of collection of primary data- survey, observation, case study and
experiment; Questionnaire—types, guidelines for preparing questionnaire, steps in designing
the questionnaire, essential of good questionnaire and difference between schedule and
questionnaire; Processing of data—editing, coding, classification, tabulation, and
presentation by way of diagrams and graphs.
Unit III:
Sampling and Attitude measurement: Sampling—meaning of sampling, census Vs
sampling; Sampling merits, demerits and suitability of census method; Principles of
sampling, merits, demerits, Characteristics of good sampling, key term in sampling, methods
of sampling—probability and non-probability, determination of sample size, sampling errors
and non-sampling errors: Concept of attitude, measurement and scaling; Types of scales-
nominal, ordinal, interval and ratio scales, various types of scaling techniques, reliability and
validity of scales.
Unit IV:
Hypothesis, Data analysis and Report writing: Hypothesis- meaning, characteristic, sources,
hypothesis testing procedure, Type-I and Type- II errors, Application of mean, dispersion,
skewness, kurtosis, Correlation and regression in research; Application of Z-test, t-test, F-test,
Chi-square test and ANOVA; Introduction to SPSS-- data entry and descriptive statistics,
Report writing; Significance of Report-Writing; Steps in Report Writing, Layout of the

4
Research Report; Types of Report, Mechanics of Writing a Research Report; Precautions for
writing Research Report.
Books Recommended:
Business Research Methods, Cooper, Schindler, TMH
Research Methodology, C.R. Kothari, Newage Publication
Research Methodology for Management with SPSS, Majhi & Khatua, HPH
Management Research Methodology, Krishnaswamy, Sirakumar, Pearson
Research Methodology, Zeikmund, Cengage
Research Methodology, Paneer Selvam, PHI
Research Methodology, Prasanta Sarangi, Taxmann A Text Book of Research Methodology,
AKPC Swain, Kalyani Research Methodology, Das, Vrinda Business Research Methods –
Donald Cooper & Pamela Schindler, TMGH, 9th edition. Business Research Methods – Alan
Bryman & Emma Bell, Oxford University Press. Research Methodology – C.R.Kothari

5
LESSON-I
INTRODUCTION TO RESEARCH METHODOLOGY
Structure:
Objectives
Introduction
Objectives of Research
Features of a Good Research Study
Characteristics of Business Research
Scope of Business Research
Types of Research
Approaches to Research
Research Methods
Need for Research
Research Process
Self Assessment
Summary
Glossary
Answers of Self Assessment Questions
Terminal Questions
Suggested Readings
OBJECTIVES:
After studying this lesson, student will be able to:
• define research and know about the feature of a good research,

6
• know about the objectives, need and scope of research,
• explain different types of research,
• know about the various approaches to research, and
• clarify various stages involved in research process.
INTRODUCTION:
Research is an intellectual activity which promotes advancement of knowledge which
in turn helps to modernize the society. Research comprises "creative work undertaken on a
systematic basis in order to increase the stock of knowledge, including knowledge of man,
culture and society, and the use of this stock of knowledge to devise new applications."
Research is any such activity which helps to gain fresh insight into something. It is used to
establish or confirm facts, reaffirm the results of previous work, solve new or existing
problems. Research is not merely an enquiry, it is actually a scientific enquiry. It is carried
out scientifically or systematically or critically. It aims at seeking knowledge and endeavours
to discover new facts or principles. It is continuous search for truth.
The term research has different connotations in different contexts. It is, therefore
essential to study and examine various definitions of research given by different authorities.
The Webster’s International Dictionary defines research as “a careful critical enquiry or
examination in seeking facts for principles, diligent investigation in order to ascertain
something.” Research is an academic activity and as such the term should be used in a
technical sense. According to Clifford Woody research comprises defining and redefining
problems, formulating hypothesis or suggested solutions; collecting, organising and
evaluating data; making deductions and reaching conclusions; and at last carefully testing the
conclusions to determine whether they fit the formulating hypothesis. Encyclopaedia of
Social Sciences define research as “the manipulation of things, concepts or symbols for the
purpose of generalising to extend, correct or verify knowledge, whether that knowledge aids
in construction of theory or in the practice of an art.” P.M cook outlines the term “Research
“in a popular way. To him, “research” is an honest, exhaustive intelligent searching for facts
and their meanings or implications, with reference to a problem. In an easy to remember
method, he lists the attributes of research” taking the clue from each initial alphabet of the
word:
R - Rational way of thinking

7
E - Expert and exhaustive treatment
S - Search for solution
E - Exactness
A - Analysis
R - Relationship of facts
C - Critical observation, careful recording, constructive attitude and condensed
generalization
H - Honesty and hardworking
Research is, thus, an original addition to the available knowledge which contributes to
the further advancement. It is an attempt to pursue truth through the methods of study,
observation, comparison and experiment.
OBJECTIVES OF RESEARCH:
The objective of research is to find out answers to questions through the application of
systematic and scientific way.
• To gain familiarity with the present status of a phenomenon.
• To measure the frequency of occurrences of various parameters/indicators.
• To determine the characteristics of an individual or a group of activities.
• To determine the association or independence of an activity.
• To test the significance and validity and reliability of the results.
FEATURES OF A GOOD RESEARCH STUDY:
• Objectivity
A good research is objective in the sense that it must answer the research questions.
This necessitates the formulation of a proper hypothesis, otherwise there may be a lack of
congruence between the research questions and the hypothesis.
• Control

8
A good research must be able to control all the variables. This requires randomization
at all stages, e.g., in selecting the subjects, the sample size and the experimental treatments.
This shall ensure an adequate control over the independent variables.
• Generaliability
We should be able to have almost the same results by using an identical methodology
so that we can apply the results to similar situations.
• Free from personal biases
A good research should be free from the researcher’s personal biases and must be
based on objectivity and not subjectivity.
• Systematic
A good research study must have various well planned steps, i.e., all steps must be
interrelated and one step should lead to another step.
Business research assists decision maker’s shift from intuitive information gathering
to organized and objective study. Even though researchers in different functional fields may
examine different phenomena, they are comparable to each other simply because they make
use of similar research techniques. Research is the fountain of knowledge for the sake of
knowledge and it is a crucial source of providing guidelines for solving various business
issues. Thus, we can say that the scope of research is enormous.
CHARACTERISTICS OF BUSINESS RESEARCH:
Business research has four unique characteristics:
• Business research is almost always applied research. This means that it is problem-
oriented with the objective of obtaining information to help solve a specific business
problem or make a decision.
• Business research tends to have a time limit. It makes little sense to gather
information about a decision that was made three weeks ago or to get information
next week that we need today. Information is highly perishable. It gets old and useless
very quickly. Like fish, if you don’t consume it when fresh, it loses a lot of its flavour—
and starts to smell bad!

9
• Business research is done in an environment in which conditions change rapidly. The
answers to research questions asked today may very well differ from the answers to
the same questions obtained yesterday. In those areas where the manager needs to
“stay in tune” with the changing landscape, the same research questions might need to
be asked repeatedly. Successful organizations develop a culture where constant
research is an integral part of their operation.
• Business is a for-profit enterprise, so research must have some cost limits applied.
Research can be expensive and time consuming (although many economical
approaches can be used). If faced with a $10 problem, don’t waste $1,000 on research.
Likewise, a million-dollar decision must have a bigger budget for research than a
$100 decision.
SCOPE OF BUSINESS RESEARCH:
Scope of business research includes the following areas:
Production Management
The research performs an important function in product development, diversification,
introducing a new product, product improvement, process technologies, choosing a site, new
investment etc.
Personnel Management
Research works well for job redesign, organization restructuring, development of
motivational strategies and organizational development.
Marketing Management
Research performs an important part in choice and size of target market, the consumer
behaviour with regards to attitudes, life style, and influences of the target market. It is the
primary tool in determining price policy, selection of channel of distribution and
development of sales strategies, product mix, promotional strategies, etc.
Financial Management
Research can be useful for portfolio management, distribution of dividend, capital
raising, hedging and looking after fluctuations in foreign currency and product cycles.
Materials Management

10
It is utilized in choosing the supplier, making the decisions relevant to make or buy as
well as in selecting negotiation strategies.
General Management
It contributes greatly in developing the standards, objectives, long-term goals, and
growth strategies.
TYPES OF RESEARCH:
Basic types of research are as follows:
Fundamental or basic Research
Basic or pure research is conducted solely for the purpose of gathering information. In
basic research, general theories, ideas, and questions are explored and tested. It is a type of
research that involves investigating theoretical issues to add to the scientific knowledge base.
While this type of research contributes to our understanding of the human mind and
behaviour, it does not necessarily help to solve immediate practical problems
Applied Research
Applied research refers to scientific study and research that seeks to solve practical
problems. Applied research is used to find solutions to everyday problems, cure illness, and
develop innovative technologies. Psychologists working in human factors or industrial/
organizational fields often do this type of research.
Descriptive Research
Descriptive research is usually a fact finding approach generalizing a cross-sectional
study of the present situation. The descriptive research attempts to describe, explain and
interpret conditions of the present i.e. “what is’. The purpose of a descriptive research is to
examine a phenomenon that is occurring at a specific place(s) and time. A descriptive
research is concerned with conditions, practices, structures, differences or relationships that
exist, opinions held processes that are going on or trends that are evident.
Historical Research
Historical research is the type of research that examines past events or combinations
of events to arrive at an account of what has happened in the past. It is the research on past
social forces which have shaped the present. For example to study the present state of Indian
labour we may research on past historical forces.

11
Formulative or Exploratory Research
Exploratory research is an initial research which analyzes the data and explores the
possibility of obtain ing as many relationships as possible between different variables without
knowing their end-applications. This means that a general study will be conducted without
having any specific end-objective except to establish as many relationships as possible
between the variables of the study. Exploratory research helps us to investigate any problem
with suitable hypothesis. This research on social science is particularly important for
clarification of any concept and throwing new light for further research on principles of
developing hypothesis and it’s testing with statistical tools.
Experimental Research
An experiment research is used to study the effect of a set of factors on the response
variable of a system of study. This research is conducted in a controlled environment.
Although experimental research is primarily possible in areas of physical science, with the
help of hypothesis, may also be carried out in social science if such research enables us to
quantify the findings, to apply the statistical and mathematical tools and to measure the
results thus quantified.
Ex-Post-Facto Research
Ex-Post-Facto Research is an empirical enquiry for situations that have already
occurred. For example, market failure for any company’s product if studied or researched
later may be categorized as ex-post-facto-research.
APPROACHES TO RESEARCH:
In the world of research, there are two general approaches to gathering and reporting
information: qualitative and quantitative approaches. The qualitative approach to research is
focused on understanding a phenomenon from a closer perspective. The quantitative
approach tends to approximate phenomena from a larger number of individuals using survey
methods. Each approach has its benefits and demerits, and is more suitable to answering
certain kinds of questions.
Qualitative Approach
The qualitative approach to gathering information focuses on describing a
phenomenon in a deep comprehensive manner. This is generally done in interviews, open-
ended questions, or focus groups. In most cases, a small number of participants participate in

12
this type of research, because to carry out such a research endeavor requires many resources
and much time. Interviews can vary from being highly structured and guided by open-ended
questions, or be less structured and take the form of a conversational interview. Because of
the investment in this type of research and the relatively few number of participants, findings
from qualitative research cannot be generalized to the whole population. However, such
research serves as a spring board for larger studies and deeper understanding that can inform
theory, practice, and specific situations.
Benefits of the qualitative Approach
Using open-ended questions and interviews allows researchers and practitioners to
understand how individuals are doing, what their experiences are, and recognize important
antecedents and outcomes of interest that might not surface when surveyed with pre-
determined questions. Although qualitative research can be thought of as anecdotal, when
pooled across a number of participants it provides a conceptual understanding and evidence
that certain phenomena are occurring with particular groups or individuals.
• Allows identification of new and untouched phenomena
• Can provide a deeper understanding of mechanisms
• Gives a one-on-one and anecdotal information
• Provides verbal information that may sometimes be converted to numerical form
• May reveal information that would not be identified through pre-determined survey
questions
Limitations
• Cannot generalize to the general population
• Challenges in applying statistical methods
• Difficulty in assessing relations between characteristics
Quantitative Approach
The quantitative approach to gathering information focuses on describing a
phenomenon across a larger number of participants thereby providing the possibility of
summarizing characteristics across groups or relationships. This approach surveys a large
number of individuals and applies statistical techniques to recognize overall patterns in the
relations of processes. Importantly, the use of surveys can be done across groups. For
13
example, the same survey can be used with a group of mentors that is receiving training
(often called the intervention or experimental groups) and a group of mentors who does not
receive such a training (a control group). It is then possible to compare these two groups on
outcomes of interest, and determine what influence the training had. It is also relatively easy
to survey people a number of times, thereby allowing the conclusion that a certain features
(like matching) influence specific outcomes (well-being or achievement later in life).
Benefits of the quantitative approach
Using survey methods across a large group of individuals enables generalization. For
example, if policy makers wanted to instantiate a policy about mentor training, they would
likely require some evidence that this training actually works. Interviewing a few individuals,
or conducting a focus group with forty matches, might be reflective of specific cases in which
the mentoring training worked, however, it would not provide strong evidence that such
training is beneficial overall. Stronger support for successful training would be evident if
using quantitative methods.
• Enables gathering information from a relatively large number of participant
• Can conduct in a number of groups, allowing for comparison
• Allows generalizing to broader population
• Provides numerical or rating information
• Informative for instantiating policy or guidelines
• Lends to statistical techniques that allow determining relations between variables
(think of better word)
Limitations
• Difficulty in recognizing new and untouched phenomena
• Caution in interpretation without a control group
In summary, the qualitative and quantitative approaches to research allow a different
perspective of situations or phenomena. These two main approaches to research are highly
informative, especially if used in combination. Each approach has its benefits and demerits,
and being aware of the methods used to gather information can help practitioners and policy-
makers understand the extent to which research findings can be applied.

14
RESEARCH METHODS AND RESEARCH
METHODOLOGY:
• Research methods are the methods or techniques employed by researchers in
conducting research operations.
• Research methodology is scientific and systematic way to solve research problems. A
researcher has to design his methodology, i.e., in addition to the knowledge of
methods or techniques, he has to apply the methodology as well . The methodology
may differ from problem to problem. Thus the scope of research methodology is
wider than research methods. In a way, research methodology deals with the research
methods and takes into consideration the logic behind the methods, we use.
NEED FOR RESEARCH:
In the present context research has occupied a prominent place in all sectors.
Government department, industrial establishments and business organisations have started
giving priority to the research and at the same time lot of concerns is shown to establish the
research and developments wings in these institutions to evaluate the programmes and to find
out the solutions to the new problems and further initiating to make new discoveries. With the
changing environment the societal problems are getting more and more complicated. As a
problem solving method the research will adopt multipronged approach to solve the problems
posed. Therefore research is considered as basic ingredient for development and serves as
means for rapid socio-economic development of the country.
The role of research in several fields of applied economics, whether related to
business or to the economy as a whole, has greatly increased in modern times. The increasing
complex nature of business and government has focused attention on the use of research in
solving operational problems. Research assumes significant role in the formulation of
economic policy, both for business and government. It provides the base for almost all the
government policies of an economic system. Government budget formulation, for example,
depends particularly on analysis of needs and desire of people, and the availability of
revenue, which requires research. Research also facilitates the decision making of the policy
makers, although in itself it is not a part of research. In the process, research also helps in the
proper allocation of a country’s scare resources. Research is also necessary for collecting
information on the social and economic structure of an economy to understand the process of

15
change occurring in the country. Research assumes a significant role in solving various
operational and planning problems associated with business and industry. In several ways,
operations research, market research, and motivational research are vital and their results
assist in taking business decisions.
Research is equally important to the social scientist for analyzing social relationships
and seeking explanation to various social problems. It gives intellectual satisfaction of
knowing things for the sake of knowledge. It also possesses practical utility for the social
scientist to gain knowledge so as to be able to do something better or in a more efficient
manner.
RESEARCH PROCESS:
Research process comprises a series of steps or actions required for effectively
conducting research and for the sequencing of these steps. The following are the various steps
that provide useful procedural guideline regarding the conduct of research.
(1) Problem Definition
(2) Review the Literature
(3) Development of working hypothesis
(4) Research Design
(5) Data Collection
(6) Data Analysis
(7) Hypothesis-testing
(8) Data Interpretation
(9) Preparation of the Report
They are now explained.
Problem Definition
The first and foremost step in the research process consists of problem or opportunity
identification. The research problem must be identified and defined without any ambiguity.
There are two types of research problems, viz., those which relate to state of nature and those
which relate to relationships between variables. At the very outset the researcher must single

16
out the problem he wants to study, i.e., he/she must decide the general area of interest or
aspect of a subject- matter that he/she would like to inquire into.
There may be situation in which the researcher is fully aware of the symptoms
relating to certain deficiency in achieving an organizational goal. But, he/she may not be in a
position to clearly spell out the problem which is causing such deficiency. Unless it is clearly
identified, it will not be possible to proceed further to carry out the project. If a researcher
proceeds with ill-defined problems, he/she may end up with misleading conclusions or
aborting the research project in the middle due to poor pay-off identified through interim
evaluation of the research. Hence, the research problem should be clearly defined.
Review the Literature
Now that the problem has been identified, the researcher must learn more about the
topic under investigation. To do this, the researcher must review the literature related to the
research problem. This step provides foundational knowledge about the problem area. The
review of literature also educates the researcher about what studies have been conducted in
the past, how these studies were conducted, and the conclusions in the problem area. For this
purpose, the abstracting and indexing journals and published or unpublished bibliographies
are the first place to go to. In this process, it should be remembered that one source will lead
to another. The earlier studies, if any, which are similar to the study in hand, should be
carefully studied.
Development of working Hypothesis
After extensive literature survey, researcher should state in clear terms the working
hypothesis or hypotheses. A hypothesis is an assumption or suggested explanation about how
two or more variables are related. It is a crucial step in the scientific method and, therefore, a
vital aspect of all scientific research. Working hypothesis is tentative assumption made in
order to draw out and test its logical or empirical consequences. As such the manner in which
research hypotheses are developed is particularly important since they provide the focal point
for research. Hypothesis should be very specific and limited to the piece of research in hand
because it has to be tested. The role of the hypothesis is to guide the researcher by delimiting
the area of research and to keep him on the right track.
Research Design
The next step in research process is to design research. The research design provides a
complete guideline for data collection. It is the plan, structure and strategy of investigation

17
conceived so as to obtain answers to research questions and to control variance. Following
are the essence of research design:
• Design of sampling plan
• Design of experiment
• Design of questionnaire
Design of Sampling Plan
A sampling plan is mechanism by which the sampling units of a study are selected
from the sampling frame of the population. The selection of the sampling plan in a study in
turn affects the cost and time to conduct the study, and the reliability of interference of the
study. Hence, it should be selected with utmost care. The sampling plan can be classified into
probability sampling plans and non-probability sampling plans. Different sampling plans in
each of these categories are listed as follows:
Probability Sampling Plans:
• Simple Random Sampling
• Systematic sampling
• Stratified random sampling
• Cluster sampling
• Multi-stage sampling
Non-probability Sampling plans:
• Convenience sampling
• Judgment sampling
• Quota sampling
Design of experiment
A study involves different response variables. Each response variable may be
affected by several factors. To test the effect of these factors on a response variable, a suitable
experiment is to be designed such that the necessary data for testing the significance of the
effects of the factors on the response variable are collected and the interference of the test are
highly reliable. There are two main steps of designing the experiment:

18
• Identify the response variables of the study.
• For each response variable, repeat the following steps.
• Identify the factors affecting the response variable.
• Decide on the type of each of the factors (a factor may be either fixed factor or
random factor).
• Fix the number of levels (treatments) of each factor.
Design of questionnaire
The data can be classified into primary and secondary data. The data which is
collected for the first time by direct observation is primary data. The data which is obtained
from existing records, publications, etc., is known as secondary one. The different methods of
primary data collection are observation method, personal interview, telephone interview and
mail survey. The success of survey methods depends on the strength of the questionnaire
used. A questionnaire consists of a set of well-formulated questions to probe and obtain
responses from respondents. The questionnaire must contain provisions to collect all the data
items which are required for testing different hypotheses of the experiment as well as for
testing the hypotheses of other tests relating to various research issues.
Data Collection
Data is the basic input to any decision making process. The collection of data is a
critical step in providing the information needed to answer the research question. Every study
includes the collection of some type of data—whether it is from the literature or from
subjects—to answer the research question. Data can be collected in the form of words on a
survey, with a questionnaire, through observations, or from the literature.
The different methods which are used for primary data collection are observation
method, personal interview, telephone interview and mail survey. In an observation method,
the investigator will collect data through personal observations. Personal interview can be
classified into door-to-door interview, executive interview, mail intercept surveys, self-
administered questionnaires and purchase intercept technique. Telephonic interview is
considered to be a cost effective and dominant data collection method. Mail survey is a data
collection method in which questionnaires are mailed to potential respondents who in turn fill
and return them at their convenience.

19
The secondary data can be obtained from internal sources and external sources. The
internal sources of secondary data for marketing applications are sales records, cost
information, distributor reports and customer feedback. The different external sources of
secondary data are government publications, journals, books, magazines, newspapers, annual
reports, etc.
Data Analysis
After the data has been collected, the researcher turns to the task of analyzing them.
Proper tools and techniques should be used for classification and analysis of data.
The tools of classification of data are frequency distribution, cumulative frequency
distribution, relative distribution and charts. Charts are graphical representation of data.
Different types of charts are pie chart, bar chart, histogram, frequency polygon and ogive
curves. The classification tools serve as data presentation techniques for clear interpretation.
Hypothesis-Testing
After analysing the data as stated above, the researcher is in a position to test the
hypotheses, if any, he had formulated earlier. Do this facts support the hypotheses or they
happen to be contrary? This is the usual question which should be answered while testing
hypotheses. Various tests, such as Chi square test, t-test, F-test, have been developed by
statisticians for the purpose. Hypothesis-testing will result in either accepting the hypothesis
or in rejecting it. If the researcher had no hypotheses to start with, generalisations established
on the basis of data may be stated as hypotheses to be tested by subsequent researches in time
to come.
Data Interpretation
The researcher must infer the results of the original research issues from the results
obtained through data analysis. if a hypothesis is tested and upheld several times, it may be
possible for the researcher to arrive at generalisation. The real value of research lies in its
ability to arrive at certain generalizations. If the researcher had no hypothesis to start with, he
might seek to explain his findings on the basis of some theory. It is known as interpretation.
The process of interpretation may quite often trigger off new questions which in turn may
lead to further researches
Preparation of the Report

20
Research task remains incomplete till the report has been presented and/ or written.
Preparation of report is the last step in a research process and requires a set of skills
somewhat different from those called for in respect of the earlier stages of research. This task
should be accomplished by utmost care, researcher may seek the assistance and guidance of
experts for the purpose.
SELF ASSESSMENT:
Fill in the blanks:
1. Research process begins with ………………..
2. Research is a ................................... of information.
3. The research design provides a ..................... for data collection.
4. Descriptive research is usually a ………. generalizing a cross-sectional study of the
present situation.
5 ......................... type of research also known as pure research.
SUMMARY:
Research is a scientific enquiry which is carried out scientifically or systematically or critically. It
aims at seeking knowledge and endeavours to discover new facts or principles. A good research study
should possess objectivity, control, generalizability, free from personal biases and systematic
approach as its basic features. Business research mainly covers production, personnel, marketing,
financial, material and general management areas. Research can be fundamental or basic research,
applied research, descriptive research, historical research, formulative or exploratory research,
experimental research and ex-post-facto research. These researches can be carried out by adopting
qualitative as well as approaches. The qualitative approach to research is focused on understanding a
phenomenon from a closer perspective. The approach tends to approximate phenomena from a larger
number of individuals issuing survey methods. Problem definition, review of literature, development
of working hypothesis, research design, data collection, data analysis, hypothesis testing, data
interpretation and preparation of the report are that various steps involved to carry out a research in
desired manner.
GLOSSARY
Observation – is a systematic data collection approach. Researchers use all of their sense to
examine people in natural settings or naturally occurring situations.

21
Parameters – is a descriptive summary of a characteristics of set of data or summary
statistics of the relationship between two sets of data.
Variables – defined as anything that has a quantity or quality that varies or a variable is any
factor, trait, or condition that can exist in different amount or types.
Jon design – is the process of work arrangement aimed at reducing or overcoming job
dissatisfaction and employees alienation arising from repetitive and mechanistic tasks.
ANSWERS OF SELF ASSESSMENT QUESTIONS:
1. Problem formulation 2. Sub system 3. Complete guideline 4. Fact finding
approach 5. Fundamental research.
TERMINAL QUESTIONS:
• What is Research? Highlight the characteristics of a good Research.
• Discuss the scope of Business Research.
• Define the Research. Discuss the various types of Research.
• Explain the various steps involved in Research Process.
SUGGESTED READINGS:
• Bhandarkar, P.L. and Wilkinson, T.S. Methodology and Techniques of Social Research.
• Dubin, Robert, Theory Building New York; MacMillan Publishing Co., Quoted in W Emory,
Business Research Methods.
• Gupta, S.P. Statistical Method, Sultan Chand and Sons, New Delhi.
• Kothari, C.R. Research Methodology-Methods and Techniques, Whishwa Prakashan,
New Delhi.
• Panneerselvam, R. Research Methodology, Prentice-Hall of India Pvt. Ltd., New Delhi.
• Panneerselvam, R. X. and Stephens, J. Theory and Problems of Statistics, Tata Mc-
Graw Hill Publishing Company, New Delhi.

22
LESSON-II
RESEARCH PROBLEM AND RESEARCH DESIGN
Structure:
Objectives
Introduction
Research Problem.
Components of Research Problem
Sources of Research Problem
Criteria of a Good Research Problem
Technique Involved in Defining a Problem
Research Design
Features of Research Design
Concept Relating to Research Design.
Types of Research Design
Self Assessment
Summary
Glossary
Answers of Self Assessment Questions
Terminal Questions:
Suggested Readings:
OBJECTIVES:
After studying this lesson, student will be able to :
• identifying and define the research problem,

23
• explain the sources and criteria of a good research problem,
• understand the concepts of research design, and
• understand the different types of research design used for conducting different types of
researches.
INTRODUCTION :
The identification of research problem is the first and foremost step that every
researcher has to undertake. At times, it becomes rather difficult for an inexperienced
researcher or a novice/beginner in research to conceptualize a research problem. In general, a
research problem should be understood as some difficulty, unclear situation which a
researcher experiences in practical or theoretical context and wants to obtain a tangible
explanation, clarification or offer solution to it. For students, this problem may be as a result
of theoretical encounter in the area of specialization. As such, before embarking on any
research, you should identify the major research area of your interest, mostly the area of your
specialization. For instance from: Education, Social sciences, Humanities, Business
administration among others.
The problem defines the goal of the researcher in clear terms. Thus, without a problem,
research cannot proceed because there is nothing to processed from and proceed toward.
RESEARCH PROBLEM :
A research problem, or phenomenon as it might be called in many forms of qualitative
research, is the topic you would like to address, investigate, or study, whether descriptively or
experimentally. It is the focus or reason for engaging in your research. It is typically a topic,
phenomenon, or challenge that you are interested in and with which you are at least
somewhat familiar.
COMPONENTS OF A RESEARCH PROBLEM:
For a research problem to exist, there are a number of core elements that have to be
inherent. There must be:
1. An individual or community or an organization/institution to whom the problem could
be attributed
2. There must be some objectives pursuing the problem, otherwise it would be repugnant
to reason and common understanding to undertake the research.

24
3. There must be at least two lines of action to be taken to attain the objective. This
means that there must be at least two mean variable to a researcher for if he has no
choice of means, he cannot have a problem.
4. There must remain some doubt in the mind of a researcher with regard to the selection
of alternatives.
5. There must be some environment to which the difficulty pertains.
SOUCRES OF RESEARCH PROBLEM:
The research problem may be selected from the following sources:
• theory of one’s own interest
• daily problems
• technological changes
• un explored areas
• discussions with other people
A research may select a problem for investigation from a given theory in which he has
considerable interest. In such situations the researcher must have thorough knowledge of that
theory and should be sufficiently inquisitive to explore some unexplained aspects or
assumptions of that theory.
Research problem can also be selected on the basis of daily experience of a
researcher. Everyday problems constantly present something new and worthy of investigation
and it depends on the worthy of investigation and it depends on the sharpness of the
researcher intellect to knit his daily experiences into a research problem.
Technological changes in a fast changing society are constantly brought forth new
problems and new opportunities for research. What is the impact of a changed technology on
the existing socio economic set up, always interests the researcher and tempts him to
undertake such studies as are revealing regarding the impact of new technology on the
existing system.
Research problems can be both abstract and of applied interest. These may also be
selected from those areas which have not been explored so far. Such area may be theoretical
or empirical in nature.

25
Sometimes the researcher while discussing the interest with some other people may
come across a problem that can be researched by the investigator. The problem may relate to
any source as discussed above. In the same way reading assignments in text books, special
assignments, research reports and term papers may also suggest some additional areas of
needed research. Many research articles suggest some additional areas of needed research.
Many research articles suggest problem for further investigation that may prove fruitful.
CRITERIA OF A GOOD RESEARCH PROBLEM:
The detailed list of criteria for the choice of research problem is as follows:
Novelty
It should be sufficiently original so that it does not involve objectionable duplication.
Ignorance of prior studies may lead a student to spend time a problem already investigated.
The study should also employ the most recent data. Although originality is an important
consideration, there is also a constant need for verification of the findings of the previous
investigations, using newer and better devices and procedures. There is also a need for the
testing of former findings under changed conditions.
Interesting
The problem should be interesting for the investigator himself. If he is not interested
in to, he will be able to face and overcome the obstacles which come at every step in
research. His interest should be purely intellectual and should not be there only for a reward,
material benefit, advancement in position, increased authority, etc.
Importance
If it is not worthwhile, if adds to neither knowledge nor lead to any improvements in
the current practices, it would be in vain set up as a discipline and to previous research
findings in any way.
Immediate Application
The investigator should ask himself question, will my research help in solving an
urgent problem
Feasibility or Amenability
The suitability of the problem for a particular research worker is the matter of its
feasibility. The investigator should be able to carry it to a successful conclusion. He should
26
possess the required competence, knowledge and understanding. He should be skilful enough
to develop, administer, and interpret the necessary data gathering devices and procedures etc.
Feasibility issue of research includes the following
• Availability of data
• Availability of guidance
• Availability of other facilitates
• Experience and creativity
• Coverage and confidence
TECHNIQUE INVOLVED IN DEFINING A PROBLEM:
Defining a research problem properly and clearly is a crucial part of a research study
and must in no case be accomplished hurriedly. However, in practice this is frequently
overlooked which causes a lot of problems later on. Hence, the research problem should be
defined in a systematic manner, giving due weightage to all relating points. The technique for
the purpose involves the undertaking of the following steps generally one after the other:
(i) statement of the problem in a general way;
(ii) understanding the nature of the problem;
(iii) surveying the available literature;
(iv) developing the ideas through discussions; and
(v) rephrasing the research problem into a working proposition.
A brief description of all these points is given below:
Statement of the problem in a general way
First of all the problem should be stated in a broad general way, keeping in view
either some practical concern or some scientific or intellectual interest. For this purpose, the
researcher must immerse himself thoroughly in the subject matter concerning which he
wishes to pose a problem. In case of social research, it is considered advisable to do some
field observation and as such the researcher may undertake some sort of preliminary survey
or what is often called pilot survey. Then the researcher can himself state the problem or he
can seek the guidance of the guide or the subject expert in accomplishing this task.
27
Understanding the nature of the problem
The next step in defining the problem is to understand its origin and nature clearly.
The best way of understanding the problem is to discuss’ it with those who first raised it in
order to find out how the problem originally came about and with what objectives in view. If
the researcher has stated the problem himself, he should consider once again all those points
that induced him to make a general statement concerning the problem. For a better
understanding of the nature of the problem involved, he can enter into discussion with those
who have a good knowledge of the problem concerned or similar other problems.
Surveying the available literature
All available literature concerning the problem at hand must necessarily be surveyed
and examined before a definition of the research problem is given. This means that the
researcher must be well-conversant with relevant theories in the field, reports and records as
also all other relevant literature.
Developing the ideas through discussions
Discussion concerning a problem often produces useful information. Various new
ideas can be developed through such an exercise. Hence, a researcher must discuss his
problem with his colleagues and others who have enough experience in the same area or in
working on similar problems. This is quite often known as an experience survey. People with
rich experience are in a position to enlighten the researcher on different aspects of his
proposed study and their advice and comments are usually invaluable to the researcher.
Rephrasing the research problem
Finally, the researcher must sit to rephrase the research problem into a working
proposition. Once the nature of the problem has been clearly understood, the environment
(within which the problem has got to be studied) has been defined, discussions over the
problem have taken place and the available literature has been surveyed and examined,
rephrasing the problem into analytical or operational terms is not a difficult task. Through
rephrasing, the researcher puts the research problem in as specific terms as possible so that it
may become operationally viable and may help in the development of working hypotheses.
RESEARCH DESIGN:
The most important problem after defining the research problem is preparing the
design of the research, which is popularly known as the research design. A research design

28
helps to decide upon issues like what, when, where, how much, by what mean etc. with
regard to an enquiry or a research study. A research design is the framework or plan for a
study used as a guide in collecting and analyzing data. It is a blueprint for conducting a study
with maximum control over factors that may interfere with the validity of the findings. Thus,
research design provide an outline of what the researcher is going to do in terms of framing
the hypothesis, its operational implications, and the final data analysis
FEATURES OF RESEARCH DESIGN:
The important features of research design may be outlined as follows:
• It constitute a plan that defines the type and sources of information required for the
research problem;
• It constitutes a strategy that specifies the methods of data collection and analysis
which would be adopted;
• It also specifies the time period of research and monetary budget involved in
conducting the study, which comprise the two major constraints of undertaking any
research.
CONCEPT RELATING TO RESEARCH DESIGN:
It is important to familiar with the important concepts relating to research design.
Some of them are discussed here.
• Dependent and independent variables
A magnitude that varies is known as a variable. The concept may assume different
quantitative values like height, weight, income etc. Quantitative variables are not quantifiable
in the strictest sense or objectively. However, the qualitative phenomena may also be
quantified in terms of the presence or absence of the attributes considered. Phenomena that
assumes different values quantitatively even in decimal points are known as ‘continuous
variable’. But all variables need not be continuous. Values that can be expressed only in
integer values are called ‘non- continuous variable’. When changes in one variable depends
upon the changes in one or more other variables, it is known as dependent or endogenous
variable, and the variables that cause the changes in the dependent variable are independent
or explanatory variables
• Extraneous variable

29
The independent variables which are not directly related to the purpose of the study
but affect the dependent variable are known as extraneous variables. For instance, assume
that a researcher wants to test the hypothesis that there is a relationship between children’s
school performance and their self-concepts, in which case the latter is an independent
variable and the former the dependent variable. In this context, intelligence may also
influence the school performance. However, since it is not directly related to the purpose of
the study undertaken by the researcher, it would be known as extraneous variable.
• Control
The term ‘control’ is used when a researcher designs the study in such a manner that it
minimizes the effects of extraneous independent variables.
• Confounded relationship
The relationship between the dependent and independent variables is said to be
confounded by an extraneous variable, when the dependent variable is not free from its
effects.
• Research hypothesis
When a prediction or a hypothesized relationship is tested by adopting scientific
methods, it is known as research hypothesis. Generally, hypothesis must consist of at least
one dependent variable and one independent variable.
• Experimental and non-experimental hypothesis
A research in which the independent variable is manipulated is known as
‘experimental hypothesis-testing research’. Whereas a research in which the independent
variable is not manipulated is termed as ‘non-experimental hypothesis-testing research’.
• Experimental and control group
When a group is exposed to usual conditions in an experimental hypothesis-testing
research, it is known as control group. On the other hand, when the group is exposed to
certain new or special condition, it is known as experimental group.
• Treatments
Treatments are referred to as the different conditions to which the experimental and
control groups are subject to. For example, if we want to determine through an experiment
the comparative impact of three varieties of fertilizers on the yield of wheat, in that case the
three varieties of fertilizers will be treated as three treatments.
• Experiment

30
An experiment refers to the process of verifying the truth of a statistical hypothesis
relating to a given research problem. Experiments may be categorized into two types, namely
absolute experiment and comparative experiment. If a researcher wishes to determine the
impact of a chemical fertilizer on the yield of a particular variety of rice crop, then it is
known as absolute experiment. Meanwhile, if the researcher wishes to determine the impact
of chemical fertilizer as compare to the impact of bio-fertilizer, then the experiment is known
as a comparative experiment.
(10) Experiment unit(s)
Experiment units refer to the pre-determined plots characteristics or the blocks, to
which the different treatments are applied. It is worth mentioned here that such experimental
units must be selected with great caution.
TYPES OF RESEARCH DESIGN:
There are different types of research designs. They may be broadly categorized
as:
• Exploratory research design
• Descriptive and diagnostic research design
• Hypothesis-testing research design
Exploratory Research Design
Exploratory research design is known as formulative research design. Exploratory
research is conducted to provide a better understanding of a situation. It isn’t designed to
come up with final answers or decisions. Through exploratory research, researchers hope to
produce hypotheses about what is going on in a situation. Exploratory research is defined as
the initial research into a hypothetical or theoretical idea. This is where a researcher has an
idea or has observed something and seeks to understand more about it. An exploratory
research project is an attempt to lay the groundwork that will lead to future studies, or to
determine if what is being observed might be explained by a currently existing theory. Most
often, exploratory research lays the initial groundwork for future research.
Exploratory research shouldn’t be expected to provide answers to the decision
problem that you are attempting to solve. It can provide very rich, meaningful information—
or even definitive explanations—for particular individuals, but exploratory research doesn’t
provide definitive answers for the overall population. There are two reasons for this: (1)

31
Exploratory research usually involves only a relatively small group of people, and (2) these
people are almost never randomly selected to participate.
Types of Exploratory Design
Some of the more popular methods of exploratory research include literature searches,
depth interviews, analysis of ‘insight-stimulating’ examples.
Literature search
One of the quickest and least costly ways to discover hypotheses is to conduct a
literature search. Almost all research projects should start here. There is an incredible amount
of information available in libraries, through online sources, in commercial data bases, and so
on. The literature search may involve popular press (newspapers, magazines, etc.), trade
literature, academic literature, or published statistics from research firms or governmental
agencies.
Depth interviews
Depth interviews are used to tap the knowledge and experience of those with
information relevant to the problem or opportunity at hand. Anyone with relevant information
is a potential candidate for a depth interview, including current customers, members of the
target market, executives and managers of the client organization, sales representatives,
wholesalers, retailers, and so on. The object of such an interview is to obtain insight into the
relationship between variables and new ideas relating to the research problem. For such an
interview people who are competent and can contribute new ideas may be carefully selected
as respondents to ensure a representation of different type experience. It may enable the
researcher to find the problem more concisely and help in the formulation of the research
hypothesis.
Analysis of ‘insight-stimulating’ examples is also a fruitful method for suggesting
hypotheses for research. It is particularly suitable in areas where there is little experience to
serve as a guide. This method consists of the intensive study of selected instances of the
phenomenon in which one is interested. For this purpose the existing records, if any may be
examined, the unstructured interviewing may take place, or some other approach may be
adopted.
Descriptive and Diagnostic Research Design

32
Descriptive research design is a scientific method which involves observing and
describing the behaviour of a subject without influencing it in any way. The descriptive
research attempts to describe, explain and interpret conditions of the present i.e. “what is’.
The purpose of a descriptive research is to examine a phenomenon that is occurring at a
specific place(s) and time. A descriptive research is concerned with conditions, practices,
structures, differences or relationships that exist, opinions held, processes that are going on or
trends that are evident. Whereas, diagnostic research studies determine the frequency with
which something occurs or its association with something else. As a research design both
descriptive and diagnostic studies share common requirements, hence they may grouped
together. The research design must make appropriate provision for protection against bias and
thus maximize reliability, with due regard to the completion of research study in as
economical manner as possible. The research design in such studies should be rigid and not
flexible.
A descriptive study establishes a baseline regarding certain subjects before a specific
experiment that actually involves the manipulation of the subjects or their environment is
initiated. Descriptive studies generally come in one of two forms. First, a cross-sectional
descriptive study involves a one-time observation involving a specific group or groups of
people. Second, a longitudinal descriptive study involves watching a specific group or groups
of people over an established period of time. A longitudinal study can be rather short in
duration or extend over the course of many years.
Hypothesis-testing Research Studies
In hypothesis-testing research studies, also known as experimental studies, the
researcher generally tests the hypotheses of causal relationships among variables. Besides,
such type of studies needs those kinds of procedures, which will not only reduce the bias and
increase reliability, but will also approve the drawing inferences about causality. Hence,
when we discuss about the research design in such studies, we usually mean the experimental
designs.
Basic Principles of Experimental Designs
Professor Fisher has enumerated three principles of experimental designs:
• The Principle of Replication;
• The Principle of Randomization;
33
• Principle of Local Control.
According to the Principle of Replication, the experiment should be repeated more
than once. Thus, each treatment is applied in many experimental units instead of one. By
doing so the statistical accuracy of the experiment is increased. For example, suppose we are
to examine the effect of two varieties of rice. For this purpose we may divide the field into
two parts and grow one variety in one part and the other variety in the other part. We can then
compare the yield of the two parts and draw conclusion on that basis. But if we are to apply
the principle of replication to this experiment, then we first divide the field into several parts,
grow one variety in half of these parts and the other variety in the remaining parts. We can
then collect the data of yield of the two varieties and conclusion can be drawn by comparing
the same. The result so obtained will be more reliable in comparison to the conclusion drawn
without applying the principle of replication. Sometimes the entire experiment can be
repeated several times for better results. Conceptually replication does not present any
difficulty, but coincidentally it does. For example, if an experiment requiring a two-way
analysis of variance is replicated, it will then require a three-way analysis of variance since
replication itself may be a source of variation in the data. However, it should be remembered
that replication is introduced in order to increase the precision of a study; that is to say, to
increase the accuracy with which the main effects and interactions can be estimated.
The Principle of Randomization provides protection, when we conduct an experiment,
against the effects of extraneous factors by randomization. In other words, this principle
indicates that we should design or plan the experiment in such a way that the variations
caused by extraneous factors can all be combined under the general heading of “chance”. For
instance, if we grow one variety of rice, say, in the first half of the parts of a field and the
other variety is grown in the other half, then it is just possible that the soil fertility may be
different in the first half in comparison to the other half. If this is so, our results would not be
realistic. In such a situation, we may assign the variety of rice to be grown in different parts
of the field on the basis of some random sampling technique i.e., we may apply
randomization principle and protect ourselves against the effects of the extraneous factors
(soil fertility differences in the given case). As such, through the application of the principle
of randomization, we can have a better estimate of the well-known experimental error.
The Principle of Local Control is another important principle of experimental designs.
Under it the extraneous factor, the known source of variability, is made to very deliberately
over as wide a range as necessary and these needs to be done in such a way that the

34
variability it causes can be measured and hence eliminated from the experimental error. This
means that we should plan the experiment in a manner that we can perform a two-way
analysis of variance, in which the total variability of the data is divided into three components
attributed to treatments (varieties of rice in our case), the extraneous factor (soil fertility in
our case) and experimental error.* In other words, according to the principle of local control,
we first divide the field into several homogeneous parts, known as blocks, and then each such
block is divided into parts equal to the number of treatments. Then the treatments arc
randomly assigned to these parts of a block. This activity is known as ‘blocking’. In general,
blocks are the levels at which we hold an extraneous factor fixed, so that we can measure its
contribution to the total variability of the data by means of a two-way analysis of variance. In
brief, through the principle of local control we can eliminate the variability due to extraneous
factor(s) from the experimental error.
Important Experimental Designs
Experimental design refers to the framework or structure of an experiment and as
such there are several experimental designs. We can classify experimental designs into two
broad categories like informal experimental designs and formal experimental designs.
Informal experimental designs are those designs that normally use a less sophisticated form
of analysis based on differences in magnitudes, whereas formal experimental designs offer
relatively more control and use precise statistical procedures for analysis work, important
experimental designs are as follows:
• Informal experimental designs
• Before-and-after without control design.
• After-only with control design.
• Before-and-after with control design.
• Formal experimental designs
• Completely randomized design (C. R. design).
• Randomized block design (R. B. design).
• Latin square design (L. S. design).
We may briefly deal with each of the above stated informal as well as formal
experimental designs.

35
• Before and after without control design: In such a design a single test group or area
is selected and the dependent variable is measured before the introduction of the
treatment. The treatment is then introduced and the dependent variable is measured
again after the treatment has been introduced. The effect of the treatment would be
equal to the level of the phenomenon after the treatment minus the level of the
phenomenon before the treatment. The main difficulty of such a design is that with
the passage of time considerable extraneous variations may be there in its treatment
effect.
• After-only with control design: In this design two groups or areas (test area and
control area) are selected and the treatment is introduced into the test area only. The
dependent variable is then measured in both the areas at the same time. Treatment
impact is assessed by subtracting the value of the dependent variable in the control
area from its value in the test area. The basic assumption in such a design is that the
two areas are identical with respect to their behaviour towards the phenomenon
considered. If this assumption is not true, there is the possibility of extraneous
variation entering into the treatment effect. However, data can be collected in such a
design without the introduction of problems with the passage of time. In this respect
this design is superior to before-and-after without control design.
• Before and-after with control design: In this design two areas are selected and the
dependent variable is measured in both the areas for an identical time-period before
the treatment. The treatment is then introduced into the test area only, and the
dependent variable is measured in both for an identical time-period after the
introduction of the treatment. The treatment effect is determined by subtracting the
change in the dependent variable in the control area from the change in the dependent
variable in test area. This design is superior to the above two designs for the simple
reason that it avoids extraneous variation resulting both from the passage of time and
from non comparable test and control areas. But at times, due to lack of historical
data, time or a comparable control area, we should prefer to select one of the first two
informal designs stated above.
• Completely Randomized Design (C. R. design): involves only two principles viz.,
the principle of replication and the principle of randomization of experimental
designs. The essential characteristic of this designs that subjects are randomly
assigned to experiment treatments (or vice-versa). For instance, if we have 10 subjects

36
and if we wish to test 5 under treatment A and 5 under treatment B, the randomization
process gives every possible group of 5 subjects selected from a set of 10 an equal
opportunity of being assigned to treatment A and treatment B. One-way analysis of
variance (or one-way ANOVA) is used to analyze such a design. Even unequal
replications can also work in this design. It provides maximum number of degrees of
freedom to the error. Such a design is generally used when experimental areas happen
to be homogenous. Technically, when all the variations due to the uncontrolled
extraneous factors are included under the heading of chance variation, we refer to the
design of experiment as C. R. design.
• Randomized block design: is an improvement over the C.R design In the
randomized block design, subjects are first divided into groups, known as blocks,
such that within each group the subjects are relatively homogeneous in respect to
some selected variable. The number of subjects in a given block would be equal to the
number of treatments and one subject in each block would be randomly assigned to
each treatment. In general, blocks are the levels at which we hold the extraneous
factor fixed, so that its contribution to the total variability of data can be measured.
The main feature of the randomized block design is that in this each treatment appears
the same number of time in each block.
• Latin square Design: is used in experimental designs in which one wishes to
compare treatments and to control for two other known sources of variation. To use a
Latin square for an experiment comparing n treatments we will need to have n levels
for each of the two sources of variation for which we wish to control. Latin squares
were first used in agricultural experiments. It was recognized that within a field there
would be fertility trends running both across the field and up and down the field. So in
an experiment to test, say, four different fertilizers, A, B, C and D, the field would be
divided into four horizontal strips and four vertical strips, thus producing 16 smaller
plots. A Latin square design will give a random allocation of fertilizer type to a plot in
such a way that each fertilizer type is used once in each horizontal strip (row) and
once in each vertical strip (column).
SELF ASSESSMENT:
State whether the followings statements are true or false:

37
1. Research project can involve both identification and problem-solving research.
2. Depth interviews are used to tap the knowledge and experience of those with
information relevant to the problem or opportunity at hand.
Fill in the blanks:
3. An experiment refers to the process of verifying the truth of a ................ relating to a
given research problem.
4. The most important problem after defining the research problem is preparing
the…...............
5 ......................... is known as formulative research design.
2.12 SUMMARY:
Research problem is a topic, phenomenon or challenge that one is interested in and which one is at
least somewhat familiar. The research problem may be selected from the theory of one’s own interest,
daily problems, technical changes, unexplored area and discussion with other people. Novelty,
interest, importance, immediate application and feasibility should be considered at the time of
selecting a research problem. Research problem should be defined in a systematic manner, giving due
weightage to all related points. The following steps should be followed one after the other: 1)
statement of the problem in a general way; II) understand the nature of the problem, II) surveying the
available literature IV) developing the idea through discussions, and v) rephrasing the research
problem in a working position.
The most important task after defining the research problem is preparing the design of the research
which is known as the research design. A research design is the framework or plan for a study used as
a guide in collecting and analyzing data. It is a blueprint for conducting a study with maximum
control over factors that may interfere with the validity of the findings. There are different types of
research designs for different types of researches which are explained in detail in the lesson.
2.13. GLOSSARY
Conceptualisation of research problems – is the process of not only selecting a topic, but
formulating a defensible and researchable research problem.
Preliminary survey – consists of fieldwork and gathering data from a variety of sources to
identify all issues in the project development process early enough to allow time to address.

38
Insight stimulating – the method consist of intensive study of selected instances of the
phenomenon in which one is interested.
ANSWERS OF SELF ASSESSMENT QUESTIONS:
1. True 2. True 3. Statistical hypothesis 4. Design of the research 5.
Exploratory research design.
TERMINAL QUESTIONS:
• What is Research Problem? Discuss the various sources of Research Problem.
• What should be the criteria of a good Research Problem?
• Discuss the technique involved in defining a Research Problem.
• What is a Research Design? Discuss the different types of Research Designs
SUGGESTED READINGS:
• Bhandarkar, P.L. and Wilkinson, T.S. Methodology and Techniques of Social Research.
• Dubin, Robert, Theory Building New York; MacMillan Publishing Co., Quoted in W
Emory, Business Research Methods.
• Gupta, S.P. Statistical Method, Sultan Chand and Sons, New Delhi.
• Kothari, C.R. Research Methodology-Methods and Techniques, Whishwa
Prakashan, New Delhi.
• Panneerselvam, R. Research Methodology, Prentice-Hall of India Pvt. Ltd., New
Delhi.
• Panneerselvam, R. X. and Stephens, J. Theory and Problems of Statistics, Tata Mc-
Graw Hill Publishing

39
LESSON-III
MEASUREMENT AND SCALING TECHNIQUES
Structure:
Objectives
Meaning of Measurement
Levels of Measurement
Source of Error in Measurement
Test of Sound Measurement
Techniques of Developing Measurement Tools
Scaling
Scale Classification Bases
Scaling Techniques
Different Scales for Measuring Attitude of People
Self Assessment
Summary
Glossary
Answers of Self Assessment Questions
Terminal Questions:
Suggested Readings:
OBJECTIVES:
After going through this lesson, you will be able to:
• define Measurement,
• know about different level of measurement,

40
• explore the source of error in measurement and know about the test of sound measurement,
• understand scaling techniques, and
• use different scales for measuring attitude of people.
MEANING OF MEASUREMENT:
Measurement is at the core of doing research. Measurement is the assignment of
numbers to things. In almost all research, everything has to be reduced to numbers
eventually. Precision and exactness in measurement are vitally important. The measures are
what are actually used to test the hypotheses. A researcher needs good measures for both
independent and dependent variables.
Measurement consists of two basic processes called conceptualization and
operationalization, then an advanced process called determining the levels of measurement,
and then even more advanced methods of measuring reliability and validity.
The characteristics/attributes of objects, persons, events, concepts or states are to be
represented using some notations help researchers make inferences based on statistical
analysis or comparative analysis. The way of defining such notations for the characteristics/
attributes is known as measurement. Alternatively, measurement can be defined as the
assignment of a number to an object which reflects the degree of possession of a
characteristic by that object.
LEVELS OF MEASUREMENT:
A level of measurement is the precision by which a variable is measured. The four
levels of measurement, from lowest to highest, are:
• Nominal
• Ordinal
• Interval
• Ratio
The nominal level of measurement describes variables that are categorical in nature.
The characteristics of the data researcher collecting fall into distinct categories. If there are a
limited number of distinct categories (usually only two), then you're dealing with a discrete

41
variable. If there are an unlimited or infinite number of distinct categories, then you're
dealing with a continuous variable. Nominal variables include demographic characteristics
like sex, race, and religion.
The ordinal level of measurement describes variables that can be ordered or ranked in
some order of importance. It describes most judgments about things, such as big or little,
strong or weak. Most opinion and attitude scales or indexes in the social sciences are ordinal
in nature.
The interval level of measurement describes variables that have more or less equal
intervals, or meaningful distances between their ranks. For example, if you were to ask
somebody if they were first, second, or third generation immigrant, the assumption is that the
distance or number of years, between each generation is the same. All crime rates in criminal
justice are interval level measures, as is any kind of rate.
The ratio level of measurement describes variables that have equal intervals and a
fixed zero (or reference) point. It is possible to have zero income, zero education, and no
involvement in crime, but rarely do we see ratio level variables in social science since it's
almost impossible to have zero attitudes on things, although "not at all", "often", and "twice
as often" might qualify as ratio level measurement.
Advanced statistics require at least interval level measurement, so the researcher
always strives for this level, accepting ordinal level (which is the most common) only when
they have to. Variables should be conceptually and operationally defined with levels of
measurement in mind since it's going to affect how well you can analyze your data later on.
SOURCES OF ERROR IN MEASUREMENT:
Measurement should be precise and unambiguous in an ideal research study.
However, this objective is often not met with in entirety. As such, the researcher must be
aware about the sources of error in measurement. Following are listed the possible sources of
error in measurement.
a) Respondent
At times the respondent may be reluctant to express strong negative feelings or it is
just possible that he may have very little knowledge, but may not admit his ignorance. All
this reluctance is likely to result in an interview of ‘guesses.’ Transient factors like fatigue,
boredom, anxiety, etc. may limit the ability of the respondent to respond accurately and fully.

42
b) Situation
Situational factors may also come in the way of correct measurement. Any condition
which places a strain on interview can have serious effects on the interviewer-respondent
rapport e.g, if someone else is present, he can distort responses by joining in or merely by
being present. If the respondent feels that anonymity is not assured, he may be reluctant to
express certain feelings.
c) Measurer
The interviewer can distort responses by rewording or reordering questions. His
behaviour, style and looks may encourage or discourage certain replies from respondents.
Careless mechanical processing may distort the findings. Errors may also creep in because of
incorrect coding, faulty tabulation and/or statistical calculations, particularly in the data-
analysis stage.
d) Instrument
Error may arise because of the defective measuring instrument. The use of complex
words, beyond the comprehension of the respondent, ambiguous meanings, poor printing,
inadequate space for replies, response choice omissions, etc. are few things that make the
measuring instrument defective and may result in measurement errors.
Hence, researcher must know that correct measurement depends on successfully
meeting all of the issues mentioned above. He must, as far as possible, try to eliminate,
neutralize or otherwise deal with all the possible sources of error so that the final results may
not be contaminated.
TEST OF SOUND MEASUREMENT:
Sound measurement must meet the test of validity, reliability and practicality. In fact,
these are three major considerations one should use in evaluating a measurement tool.
“Validity refers to the extent to which a test measures what we actually wish to measure.
Reliability has to do with the accuracy and precision of a measurement procedure.
Practicality is concerned with a wide range of factors of economy, convenience, and
interpretability”. We briefly take up the relevant details concerning these tests of sound
measurement.
Test of Validity
43
Validity is the extent to which differences found with a measuring instrument reflect
true differences among those being tested. But the question arises: how can one determine
validity without direct confirming knowledge? The answer may be that we seek other
relevant evidence that confirms the answers we have found with our measurement tool. What
is relevant, evidence often depends upon the nature of the research problem and the judgment
of the researcher.
Methods of Measuring Validity
There are four good methods of estimating validity:
• face
• content
• criterion
• construct
Face validity is the least statistical estimate (validity overall is not as easily quantified
as reliability) as it's simply an assertion on the researcher's part claiming that they've
reasonably measured what they intended to measure. It's essentially a "take my word for it"
kind of validity. Usually, a researcher asks a colleague or expert in the field to vouch for the
items measuring what they were intended to measure.
Content validity goes back to the ideas of conceptualization and operationalization. If
the researcher has focused in too closely on only one type or narrow dimension of a construct
or concept, then it's conceivable that other indicators were overlooked. In such a case, the
study lacks content validity. Content validity is making sure you've covered all the
conceptual space. There are different ways to estimate it, but one of the most common is a
reliability approach where you correlate scores on one domain or dimension of a concept on
your pretest with scores on that domain or dimension with the actual test. Another way is to
simply look over your inter-item correlations.
Criterion validity is using some standard or benchmark that is known to be a good
indicator. There are different forms of criterion validity: concurrent validity is how well
something estimates actual day-by-day behaviour; predictive validity is how well something
estimates some future event or manifestation that has not happened yet. The latter type is
commonly found in criminology. Suppose you are creating a scale that predicts how and
when juveniles become mass murderers. To establish predictive validity, you would have to

44
find at least one mass murderer, and investigate if the predictive factors on your scale,
retrospectively, affected them earlier in life. With criterion validity, you're concerned with
how well your items are determining your dependent variable.
Construct validity is the extent to which your items are tapping into the underlying
theory or model of behaviour. It's how well the items hang together (convergent validty) or
distinguish different people on certain traits or behaviours (discriminant validity). It's the
most difficult validity to achieve. You have to either do years and years of research or find a
group of people to test that have the exact opposite traits or behaviours you're interested in
measuring.
Test of Reliability
The test of reliability is another important test of sound measurement. A measuring
instrument is reliable if it provides consistent results. Reliable measuring instrument does
contribute to validity, but a reliable instrument need not be a valid instrument. For instance, a
scale that consistently overweighs objects by five kgs., a valid instrument is always reliable.
Accordingly reliability is not as valuable as validity, but it is easier to assess reliability in
comparison to validity. If the quality of reliability is satisfied by an instrument, then while
using it we can be confident that the transient and situational factors are not interfering.
Methods of Measuring Reliability
There are four good methods of measuring reliability:
• test-retest
• multiple forms
• inter-rater
• split-half
The test-retest technique is to administer your test, instrument, survey, or measure to
the same group of people at different points in time. Most researchers administer what is
called a pretest for this, and to troubleshoot bugs at the same time. All reliability estimates
are usually in the form of a correlation coefficient, so here, all you do is calculate the
correlation coefficient between the two scores on the same group and report it as your
reliability coefficient.

45
The multiple forms technique has other names, such as parallel forms and disguised
test-retest, but it's simply the scrambling or mixing up of questions on your survey, for
example, and giving it to the same group twice. The idea is that it's a more rigorous test of
reliability.
Inter-rater reliability is most appropriate when you use assistants to do interviewing or
content analysis for you. To calculate this kind of reliability, all you do is report the
percentage of agreement on the same subject between your raters, or assistants.
Split-half reliability is estimated by taking half of your test, instrument, or survey, and
analyzing that half as if it were the whole thing. Then, you compare the results of this
analysis with your overall analysis. There are different variations of this technique, one of the
most common being called Cronbach's alpha (a frequently reported reliability statistic)
which correlates performance on each item with overall score. Another technique, closer to
the split-half method, is the Kuder-Richardson coefficient, or KR-20. Statistical packages on
most computers will calculate these for you, although in graduate school, you'll have to do
them by hand and understand that all test statistics are derived from the formula that all
observed scores consist of a true score and error score.
Test of Practicality
The practicality characteristic of a measuring instrument can be judged in terms of
economy, convenience and interpretability. From the operational point of view, the
measuring instrument ought to be practical i.e. it should be economical, convenient and
interpretable. Economy consideration suggests that some trade-off is needed between the
ideal research project and that which a budget can afford. Convenience test suggests that the
measuring instrument should be easy to administer. For this purpose one should give due
attention to the proper layout of the measuring instrument. Interpretability consideration is
specially important when persons other than the designers of the test are to interpret the
results. The measuring instrument, in order to be interpretable, must be supplemented by (a)
detailed instructions for administering the test; (b) scoring keys; (c) evidence about the
reliability and (d) guides for using the test and for interpreting result.
Technique of Developing Measurement Tools:
The technique of developing measurement tools involves a four-stage process,
consisting of the following:

46
a) Concept development
This is the first step. In this case, the researcher should have a complete understanding
of all the important concepts relevant to his study. This step is more applicable to theoretical
studies compared to practical studies where the basic concepts are already established
beforehand.
b) Specification of concept dimensions
Here, the researcher is required to specify the dimensions of the concepts, which were
developed in the first stage. This is achieved either by adopting an intuitive approach or by an
empirical correlation of the individual dimensions with that concept and/or other concepts.
c) Indicator selection
In this step, the researcher has to develop the indicators that help in measuring the
elements of the concept. These indicators include questionnaires, scales, and other devices,
which help to measure the respondents opinion, mindset, knowledge, etc. Using more than
one indicator lands stability and improves the validity of the scores.
d) Index formation
Here, the researcher combines the different indicators into an index. In case, there are
several dimensions of a concept the researcher needs to combine them.
SCALING
During research especially when the concepts we want to measure are complex and
abstract and there are no standardized measurement tools available, we face problems of
measurement. Alternatively, when we are measuring something which can lead to subject
bias like attitudes and opinions, there is a problem of their valid measurement. A similar
problem may be faced in a lesser degree while measuring physical or institutional concepts.
Therefore, knowledge of some such procedures which may enable accurate measurement of
abstract concepts is extremely essential. This brings us to the study of scaling techniques.
Scaling is the process of assigning numbers to various degrees of attitudes,
preferences, opinion, and other concepts. Scaling is defined as a procedure for the assignment
of numbers (or other symbols) to a property of objects in order to impart some of the
characteristics of numbers to the properties in question.

47
Scaling can be done in two ways: (i) making a judgement about an individuals
characteristics and then placing him on a scale which is defined in terms of that characteristic,
and (ii) constructing questionnaires where individual’s responses score assign them a place
on a scale. A scale is a continuum, consisting of the highest point and the lowest point along
with several intermediate points between these two extremities. These scale-point positions
are hierarchically related to each other. Numbers for measuring the degree of differences in
the attitudes or opinions are assigned to individuals corresponding to their positions in a
scale. Therefore, the term ‘scaling’ implies procedures for determination of quantitative
measures of subjective abstract concepts.
SCALE CLASSIFICATION BASES:
The scale classification bases can be categorized on the following bases.
• Subject orientation
In this, a scale is designed to measure the characteristics of the respondent who
completes it or to estimate the stimulus object that is presented to the respondent.
• Response form
In this, the scales can be classified as categorical or comparative. Categorical scales
(rating scales) are used when a respondent scores some object without direct reference to
other objects. Comparative scales (ranking scales) are used when the respondent is asked to
compare two or more objects.
• Degree of subjectivity
In this, the scale data is based on whether we measure subjective personal preferences
or just make non-preference judgements. In the former case, the respondent is asked to select
which person or solution he favors to be employed, whereas in the latter case he is simply
asked to judge which person or solution will be more effective without reflecting any
personal preference.
• Scale properties
In this, the scales can be classified as nominal, ordinal, interval and ratio scales.
Nominal scales merely classify without indicating order, distance or unique origin. Ordinal
scales indicate magnitude relationships of ‘more than’ or ‘less than’, but indicate no distance

48
or unique origin. Interval scales have both order and distance values, but no unique origin.
Whereas, ratio scales possess all these features.
• Number of dimensions
In this, the scales are classified as ‘uni-dimensional’ or ‘multi-dimensional’. In the
former, only one attribute of the respondent or object is measured, whereas multi-dimensional
scaling recognizes that an object might be described better by using the concept of an
attribute space of ‘n’ dimensions, rather than a single-dimension continuum.
• Scale construction techniques:
This can be developed by the following five techniques.
• Arbitrary approach: In this, the scales are developed on ad hoc basis. It is the
most widely used approach.
• Consensus approach: In this, a panel of judges evaluates the items chosen for
inclusion in the instrument regarding whether they are relevant to the topic area
and unambiguous in implication.
• Item analysis approach: In this, a number of individual items are developed into
a test that is given to a group of respondents. Post administering the test, total
scores are evaluated, and the individual items are analyzed to determine which
items discriminate between persons or objects with high and low total scores.
• Cumulative scales: These are chosen on the basis of their conforming to some
ranking of items with ascending and descending discriminating power.
• Factor scales: This can be constructed on the basis of inter-correlations of items
indicating a common factor accounts for the relationship between items.
SCALING RECHNIQUES:
We know take up of the important scaling techniques often used in the context of
research specially in context of social or business research. Scaling techniques are of two
types i.e. rating scale and ranking scale.
Rating Scales
The rating scale involves qualitative description of a limited number of aspects of a
thing or of traits of a person. When we use rating scale, we judge an object in absolute terms

49
against some specified criteria i.e. we judge properties of objects without reference to the
similar objects. These rating may be in such forms as “like-dislike, “above average, average,
below average”, or other classifications with more categories such as “likely very much-like
somewhat-neutral-dislike somewhat- dislike very much” and so on. There is no specific rule
whether to use a two point scale, three point scale or scale with still more points. Rating scale
may be either a graphic rating scale or an itemized rating scale.
• The graphic rating scale: is quite simple and is commonly used in practice. Under it
the various points are usually put along the line to form a continuum and the rater
indicates his rating by simply making a mark at the appropriate point on a line that
runs from one extreme to the other. Scale points with brief descriptions may be
indicated along the line, their function being to assist the rater in performing his job.
• The itemized rating scale: presents a series of statements from which a respondent
selects one as best reflecting his evaluation. These statements are ordered
progressively in terms of more or less of some property.
Ranking Scales: Under ranking scales we make relative judgements against other
similar objects. The respondents under this method directly compare two or more objects and
make choices among them. There are two generally used approaches of ranking scale viz.
• Method of paired comparisons: Under it the respondents can express his attitude by
making a choice between a new flavor of soft drink and an established brand of drink.
But when there is more than two stimuli to judge, the number of judgements required
in a paired comparison is given by the formula:
N= n(n-1)/2
• Method of Rank order: Under this method of comparative scaling, the respondents
are asked to rank their choice. This method is easier and faster than the method of
paired comparisons stated above. The problem of transitivity is also not there in case
we adopt method of rank order.
DIFFERENT SCALES FOR MEASURING ATTITUDES OF
PEOPLE:
Likert type Scale

50
A “Likert scale” is actually the sum of responses to several Likert items. These items
are usually displayed with a visual aid, such as a series of radio buttons or a horizontal bar
representing a simple scale. It is a five (or seven) point scale which is used to allow the
individual to express how much they agree or disagree with a particular statement. Likert-
type or frequency scales use fixed choice response formats and are designed to measure
attitudes or opinions. These ordinal scales measure levels of agreement/disagreement. A Likert-
type scale assumes that the strength/intensity of experience is linear, i.e. on a continuum from
strongly agree to strongly disagree, and makes the assumption that attitudes can be measured.
Respondents may be offered a choice of five to seven or even nine pre- coded responses with
the neutral point being neither agree nor disagree.
The procedure for developing Likert-type-scale is as follows:
• As a first step, the researcher collects a large number of statements which are relevant
to the attitude being studied and each of the statements expresses definite
favourableness or unfavourableness to a particular point of view.
• After the statements have been gathered, a trial test should be administered to a
number of subjects.
• The response to various statements are scored in such a way that a response indicative
of the most favourable attitude is given the highest score of 5 and that with the most
unfavourable attitude is given the lowest score, say, of 1.
• Then the total score of each respondent is obtained by adding his scores that he
received for separate statements.
• The next step is to array these total scores and find out those statements which have a
high discriminatory power.
• Only those statements that correlate with the total test should be retained in the final
instrument and all others must be discarded from it.
Semantic Differential (SD) Scale
Semantic differential scale is an attempt to measure the psychological meanings of an
object to an individual. This scale is based on the presumption that an object can have
different dimensions of connotative meanings which can be located in multidimensional
property space, or what can be called the semantic space in the context of semantic
differential scale. This scaling consists of a set of bipolar rating scales, usually of 7 points, by

51
which one or more respondents’ rate one or more concepts on each scale item. Various steps
involved in developing semantic differential scale are as follows:
• First of all the concept to be studied are selected. The concepts are usually chosen by
personal judgement, keeping in view the nature of the problem.
• The next step is to select the scales bearing in mind the criterion of factor composition
and the criterion of scale’s relevance to the concepts being judged. One more criterion
to be kept in view is that scales should be stable across subjects and concepts.
• Then a panel of judges are used to rate the various stimuli on the various selected
scales and the responses of all judges would then be combined to determine the
composite scaling
Constant Sum Scale
It is the simplest among all the data methods. In this method, each respondent is given
a number of points, say 10,100 or 200. Then he or she allocates these points to different
stimuli according to some attitudinal characteristic. The sum of all the points allocated to all
the stimuli should be equal to the total number of points given to the respondents. Before
allocating points to different stimuli, the respondent should compare the relative importance
of the stimuli with respect to the assumed attitudinal characteristics.
Differential Scales
Under such an approach, the selection of items is made by a panel of judge who
evaluate the items in terms of whether they are relevant to the topic area and unambiguous in
implication. The detailed procedure is as follows:
• The researcher gathers a large number of statements, usually twenty or more, that
express various points of view toward a group, institution, idea, or practice.
• These statements are then submitted to a panel of judges, each of whom arranges
them in eleven groups or piles ranging from one extreme to another in position. Each
of the judges is requested to place generally in the first pile the statement which he
thinks are most unfavourable to the issue, in the second pile to place those statements
which he thinks are next most unfavourable and he goes on doing so in this manner
till in the eleventh pile he puts the statements which he considers to be the most
favourable.

52
• This sorting by each judge yields a composite position for each of the items. In case
of disagreement between the judges in assigning a position to an item, that item is
discarded.
• For items that are retained, each is given its median scale value between one and
eleven as established by the panel.
• A final selection of statements is then made. For this purpose a sample of statement,
whose median scores are spread evenly from one extreme to the other is taken.
Cumulative scale (Guttman Scale)
The cumulative scale or Guttman scale measures to what degree a person has a
positive or negative attitude to something. It makes use of a series of statements that are
growing or descending in how positive or negative a person is towards the subject. If for
instance on a scale with seven statements the respondent agrees with the fifth statement, it
implies that he or she also agrees with the first four statements, but not with statement
number six and seven. To create a Guttman scale, you need to:
• Determine the focus: what concept are you going to measure (see what people's
attitudes are toward it)?
• Ask a group of people (or a person) to write down different statements about this
concept, reflecting different opinions or attitudes about the subject. Make sure you
have a large number of statements, making sure that people can either degree or
disagree with them (no - open - questions for instance).
• Rating the scale items: the next step is to have your judges rate each statement,
indicating whether the statement expresses a positive (favourable) or negative
(unfavourable) attitude towards the concept. The members of the group must not
express their own opinion about the concept; they must only indicate whether the
statement is favourable or unfavourable.
• Developing the scale: construct a matrix or table that shows the responses of all the
respondents on all of the items. Then sort this matrix so that respondents who agree
with more statements are listed at the top and those agreeing with fewer are at the
bottom. For respondents with the same number of agreements, sort the statements
from left to right from those that most agreed to those that fewest agreed to.

53
• If there are lots of items, you need to use a data analysis called scalogram analysis to
determine the subsets of items from our pool that best approximate the cumulative
property. Then review these items and select the final scale elements. There are
several statistical techniques for examining the table to find a cumulative scale.
• Because there is seldom a perfectly cumulative scale you usually have to test how
good it is. These statistics also estimate a scale score value for each item. This scale
score is used in the final calculation of a respondent's score.
Multidimensional Scaling: Multidimensional scaling is relatively more complicated
scaling device, but with this sort of scaling one can scale objects, individuals or both with a
minimum of information. It can be characterized as a set of procedures for portraying
perceptual or affective dimensions of substantive interest. It “provides useful methodology
for portraying subjective judgements of diverse kinds. MDS is used when all the variables in
a study are to be analyzed simultaneously and all such variables happen to be independent.
The underlying assumption in MDS is that people “perceive a set of objects as being more or
less similar to one another on a number of dimensions instead of only one. Through MDS
techniques one can represent geometrically the locations and interrelationships among a set of
points.
Two approaches, viz., the metric approach and the non-metric approach, are usually
talked about in the context of MDS. The metric approach to MDS treats the input data as
interval scale data and solves applying statistical methods for the additive constant which
minimize the dimensionality of the solution space. The non-metric approach first gathers the
non-metric similarities by asking respondents to rank order all possible pairs that can be
obtained from a set of objects. Such non-metric data is then transformed into some arbitrary
metric space and then the solution is obtained by reducing the dimensionality.
SELF ASSESSMENT
Fill in the blanks:
1. Rating scales can be ……………and .......................... rating scales.
2. In testing the validity of a scale, the researcher should use…………..
3. Under ranking scale, respondents can compare ........................... number of scales.
4. Likert scale are ................................scale.

54
5. The most sophisticated statistical analysis can be made if data is collected
by…………
3.11 SUMMARY:
Measurement can be defined as the assignment of a number to an object which reflects the degree of
possession of a characteristic by that object. There are four levels of measurement namely nominal,
ordinal, interval and ratio. The nominal level of measurement describes variables that are categorical
in nature.
The ordinal level of measurement describes variables that can be ordered or ranked in some order of
importance. The interval level of measurement describes variables that have more or less equal
intervals, or meaningful distance between their ranks. The ratio level of measurement describes
variables that have equal interval and a fixed zero. Test of validity, test of reliability and test of
practicality are the test of sound measurement.
Scaling is a process of assigning numbers to various degrees of attitudes, preferences, opinion and
other concepts. Scaling techniques are of two types namely rating scale and ranking scale. The most
commonly used scale for measuring attitudes of people are Likert type scale, semantic differential
scale, constant sum scale, differential scales, cumulative scale and multidimensional scale.
3.12. GLOSSARY
Respondents – are those persons who have been invited to participate in a particulat study
and have actually taken part in the study.
Empirical correlation – is a relationship or correlation that is supported by experiment and
observation but not necessarily supported by theory.
Questionnaire – is a research instrument consisting of a series of questions for the purpose
of gathering information from respondents.
ANSWERS OF SELF ASSESSMENT QUESTIONS:
1. Graphic, numerical 2. Content validity 3. Any number of scales 4. Rating scales
5. Ratio scale.
TERMINAL QUESTIONS:
• What is measurement? What are the primary scales of measurement?

55
• Describes the test for sound measurement.
• What do you mean by Scaling? Describe the important scaling techniques.
• How would you proceed to construct a Likert scale ? Give its advantages and
disadvantages.
SUGGESTED READINGS:
• Bhandarkar, P.L. and Wilkinson, T.S. Methodology and Techniques of Social Research.
• Dubin, Robert, Theory Building New York; MacMillan Publishing Co., Quoted in W
Emory, Business Research Methods.
• Gupta, S.P. Statistical Method, Sultan Chand and Sons, New Delhi.
• Kothari, C.R. Research Methodology-Methods and Techniques, Whishwa
Prakashan, New Delhi.
• Panneerselvam, R. Research Methodology, Prentice-Hall of India Pvt. Ltd., New
Delhi.

56
Lesson –IV
DATA COLLECTION
STRUCTURE
Objectives
Introduction
Primary Data
Advantages of Primary Data
Disadvantages of Primary Data
Methods of Primary Data Collection
Secondary Data
Merits of Primary Data
Demerits of Primary Data
Selection of Appropriate Method for Data Collection
Sources of Secondary Data
Self Assessment
Summary
Glossary
Answers of Self Assessment of Questions
Terminal Question:
Suggested Readings:
OBJECTIVES:
After studying this lesson, students will be able to:
• define primary and secondary data,

57
• know about the various methods of primary data collection,
• explore the different sources of secondary data, and
• apply the appropriate method for data collection.
INTRODUCTION:
Once the researcher has decided the research design, the next job is of data collection.
Data collection starts with determining what kind of data required followed by the selection
of a sample from a certain population. The reliability of managerial decisions depends on the
quality of data. The quality of data can be expressed in terms of its representative feature of
the reality which can be ensured by the usage of a fitting data collection methods. Depending
upon the source utilized, whether the data has come from actual observations or from records
that are kept for normal purposes, statistical data can be classified into two categories i.e
primary and secondary:
PRIMARY DATA:
Primary data is a type of information that is obtained directly from first-hand sources
by means of surveys, observation or experimentation. It is data that has not been previously
published and is derived from a new or original research study and collected at the source
such as in marketing.
ADVANTAGES OF PRIMARY DATA:
Advantages of primary data are as follows:
• The primary data are original and relevant to the topic of the research study so the
degree of accuracy is very high.
• Primary data is that it can be collected from a number of ways like interviews,
telephone surveys, focus groups etc. It can be also collected across the national
borders through emails and posts. It can include a large population and wide
geographical coverage.
• Moreover, primary data is current and it can better give a realistic view to the
researcher about the topic under consideration.

58
• Reliability of primary data is very high because these are collected by the concerned
and reliable party.
DISADVANTAGES OF PRIMARY DATA:
Following are the disadvantages of primary data:
• For collection of primary data where interview is to be conducted the coverage is
limited and for wider coverage a more number of researchers are required.
• A lot of time and efforts are required for data collection. By the time the data
collected, analysed and report is ready the problem of the research becomes very
serious or out dated. So the purpose of the research may be defeated.
• It has design problems like how to design the surveys. The questions must be simple
to understand and respond.
• Some respondents do not give timely responses. Sometimes, the respondents may
give fake, socially acceptable and sweet answers and try to cover up the realities.
With more people, time and efforts involvement the cost of the data collection goes
high. The importance of the research may go down.
• In some primary data collection methods there is no control over the data collection.
Incomplete questionnaire always give a negative impact on research.
METHODS OF PRIMARY DATA COLLECTION:
Observation Method
In the observation method, the investigator will collect data through personal
observations. In this method the investigator will observe the behaviour of the respondents in
disguise. Under observation method information is sought by way of investigators own direct
observation without asking from the respondents.
Advantages of Observation
1. Very direct method for collecting data or information – best for the study of human
behaviour.
2. Data collected is very accurate in nature and also very reliable.
3. Improves precision of the research results.
4. Problem of depending on respondents is decreased.

59
5. Helps in understanding the verbal response more efficiently.
6. Observation is less demanding in nature, which makes it less bias in working abilities.
Disadvantages of Observation
• Problems of the past cannot be studied by means of observation.
• Having no other option one has to depend on the documents available.
• Observations like the controlled observations require some especial instruments or
tools for effective working, which are very much costly.
• Attitudes cannot be studied with the help of observations.
• Complete answer to any problem or any issue cannot be obtained by observation
alone.
Questionnaire Method
The questionnaire is most frequently a very concise, preplanned set of questions
designed to yield specific information to meet a particular need for research information
about a pertinent topic. The research information is attained from respondents normally from
a related interest area. A questionnaire is a written or printed form used in gathering
information on some subject or subjects consisting of a list of questions to be submitted to
one or more persons. As a data collecting instrument, it could be structured, unstructured or
semi- structured questionnaire.
A structured questionnaire, is one in which the questions asked are precisely
decided in advance. When used as an interviewing method, the questions are asked exactly as
they are written, in the same sequence, using the same style, for all interviews. Nonetheless,
the structured questionnaire can sometimes be left a bit open for the interviewer to amend to
suit a specific context.
An unstructured questionnaire on the other hand, is an instrument or guide used by
an interviewer who asks questions about a particular topic or issue. Although a question
guide is provided for the interviewer to direct the interview, the specific questions and the
sequence in which they are asked are not precisely determined in advance.
A semi- structured questionnaire is a mix of unstructured and structured
questionnaires. Some of the questions and their sequence are determined in advance, while
others evolve as the interview proceeds.

60
Advantages of Questionnaires
• It is free from the bias of the interviewer; answers are in respondents own words.
• Respondents have adequate time to give well thought out answer.
• There is low cost even when the universe is large and is widely spread geographically.
• Respondents, who are not easily approachable, can also be reachable conveniently.
• Large samples can be made use of and thus the results can be made more dependable
and reliable.
Disadvantage of Questionnaire
• It can be used only when respondents are educated and cooperative.
• The control over questionnaire may be lost once it is sent.
• There is inbuilt inflexibility because of the difficulty of amending the approach once
questionnaire have been dispatched.
• It is difficult to know whether willing respondents are truly representative.
• This method is likely to be the slowest of all.
Interview Method
In this method the interviewer personally meets the informants and asks necessary
questions to them regarding the subject of enquiry. Usually a set of questions or a
questionnaire is carried by him and questions are also asked according to that. The
interviewer efficiently collects the data from the informants by cross examining them. The
interviewer must be very efficient and tactful to get the accurate and relevant data from the
informants. Interviews like personal interview/depth interview or telephone interview can be
conducted as per the need of the study.
This method acts as a very vital tool for the collection of the data in the social
research as it is all about the direct systematic conversation between an interviewer and the
respondent. By this the interviewer is able to get relevant information for a particular research
problem.
Personal interviews
Under this method there is face to face contact between the interviewer and the
interviewee. This sort of interview may be in the form of direct personal investigation or it

61
may be indirect oral investigation. In the case of direct personal investigation the interviewer
has to collect the information personally from the sources concerned. He has to be on the spot
and has to meet people from whom data have to be collected. This method is particularly
suitable for intensive investigations.
Telephone interview
Telephone interview involves trained interviewers phoning people to collect
questionnaire data. This method is quicker and less expensive than face-to-face interviewing.
However, only people with telephones can be interviewed, and the respondent can end the
interview very easily
Advantages of the Interview Method
• Very good technique for getting the information about the complex, emotionally laden
subjects.
• Can be easily adapted to the ability of the person being interviewed.
• Yields a good percentage of returns
• Yields perfect sample of the general population.
• Data collected by this method is likely to be more correct compared to the other
methods that are used for the data collection.
Disadvantages of the Interview Method
• Time consuming process.
• Involves high cost.
• Requires highly skilled interviewer.
• Requires more energy
• More confusing and a very complicated method.
Mail Survey
It is a common method of conducting surveys. It is a relatively inexpensive method of
collecting data, and one that can distribute large numbers of questionnaires in a short time. It
provides the opportunity to contact hard-to-reach people, and respondents are able to
complete the questionnaire in their own time. Mail surveys do require an up-to-date list of
names and addresses. In addition, there is also the need to keep the questionnaire simple and

62
straightforward. A major disadvantage of a mail survey is that it usually has lower response
rates than other data collection methods. This may lead to problems with data quality.
Collection of Data through Schedule
This method of data collection is very much like the collection of data through
questionnaire, with little difference which lies in the fact that schedules are being filled by the
enumerators who are specially appointed for the purpose. These enumerators along with
schedules go to respondents, put to them the questions from the proforma in the order the
questions are listed and record the replies in the space meant for the same in the proforma.
Enumerators explain the aims and objects of the investigation and also remove the difficulties
which any respondent may feel in understanding the implications of a particular question.
This method of data collection is very useful in extensive enquiries and can lead to
fairly reliable results. It is, however, very expensive and is usually adopted in investigations
conducted by governmental agencies or by some big organizations.
Difference between Schedule and Questionnaire
S.
No
Questionnaire Schedule
1. Questionnaire is generally sent through
mail to informants to be answered as
specified in a covering letter, but
otherwise without further assistance
from the sender.
A schedule is generally filled by the
research worker or enumerator, who
can interpret the questions when
necessary.
2. Data collection is cheap and
economical as the money is spent in
preparation of questionnaire and in
mailing the same to respondents.
Data collection is more expensive as
money is spent on enumerators and
in imparting trainings to them.
Money is also spent in preparing
schedules.
3. Non response is usually high as
many people do not respond and many
return the questionnaire without
answering all questions. Bias due to
non-response often remains
indeterminate.
Non response is very low because
this is filled by enumerators who are
able to get answers to all questions.
But even in this, there remains the
danger of interviewer bias and
cheating.
4. It is not clear that who replies. Identity of respondent is known.

63
5. The questionnaire method is likely
to be very slow since many respondents
do not return the questionnaire.
Information is collected well in time
as they are filled by enumerators.
6. No personal contact is possible in case
of questionnaire as the questionnaires
are sent to respondents by post who
also in turn returns the same by post.
Direct personal contact is established
7. This method can be used only when
respondents are literate and
cooperative.
The information can be gathered
even when the respondents happen to
be illiterate.
8. Wider and more representative
distribution of sample is possible.
There remains the difficulty in
sending enumerators over a relatively
wider area.
9. Risk of collecting incomplete and
wrong information is relatively more
under the questionnaire method, when
people are unable to understand
questions properly.
The information collected is
generally complete and accurate as
enumerators can remove difficulties
if any faced by respondents in
correctly understanding the
questions. As a result the information
collected through schedule is
relatively more accurate than that
obtained through questionnaires.
10. The success of questionnaire methods
lies more on the quality of the
questionnaire itself.
It depends upon the honesty and
competence of enumerators
11. The physical appearance of
questionnaire must be quite attractive.
This may not be the case as
schedules are to be filled in by
enumerators and not by respondents.
12. Observation method is not possible
when collecting data through
questionnaire.
Along with schedule observation
method can also be used.

64
SECONDARY DATA:
Secondary data is the data that have been already collected by and readily available
from other sources. Such data are cheaper and more quickly obtainable than the primary data
and also may be available when primary data cannot be obtained at all.
Researcher must be very careful in using secondary data. He must make a minute
scrutiny because it is just possible that the secondary data may be unsuitable or may be
inadequate in the context of the problem which the researcher wants to study. By way of
caution, the researcher, before using secondary data, must see that they posses following
characteristics:
• Reliability of data
The reliability can be tested by finding out such things about the said data: (a) Who
collected the data (b) What were the sources of data? (c) Were data collected by using proper
methods? (d) At what time were they collected? (e) Was there any bias of the compiler? (f)
What level of accuracy was desired? Was it achieved?
• Suitability of data
The data that are suitable for one enquiry may not be necessarily be found suitable in
another enquiry. Hence, if the available data are found to be unsuitable, they should not be
used by the researcher. In this context, researcher must very carefully scrutinize the definition
of various terms and units of collection used at the time of collecting the data from the
primary source originally. Similarly, the object, scope and nature of the original enquiry must
also be studied. If the researcher finds differences in these, the data will remain unsuitable for
the present enquiry and should not be used.
• Adequacy of data
If the level of accuracy achieved in data is found inadequate for the purpose of the
present enquiry, they will be considered as inadequate and should not be used by the
researcher. The data will be considered inadequate if they are related to an area which may be
either narrow or wider than the area of the present enquiry.
MERITS OF SECONDARY DATA:
• Use of secondary data is very convenient.

65
• It saves time and finance.
• In some enquiries primary data cannot be collected.
• Reliable secondary data are generally available for many investigations.
DEMERITS OF SECONDARY DATA:
• It is very difficult to find sufficiently accurate secondary data.
• It is very difficult to find secondary data which exactly fulfils the need of present
investigation.
• Extra caution is required to use secondary data.
• These are not available for all types of enquiries.
SELECTION OF APPROPRIATE METHOD FOR
DATA COLLECTION:
As there are many methods for collection of data, it is important that we should
choose the most appropriate according to the situation provided. So the following factors
have to be kept in mind while selecting a particular method:
• Nature, scope and object of enquiry
The nature, the scope as well as the object of the enquiry are very important as they
affect the choice of the method. The method selected should be such that it suits the type of
enquiry that is to be conducted by the researcher. This factor is also important in deciding
whether the data already available (secondary data) are to be used or the data not yet
available (primary data) are to be collected.
• Availability of funds
When a method is chosen, it's important to check whether there is adequate amount of
funds to make it work. If the method is too expensive, it will be very hard to do the
experiment.
• Time factor
Time is an important factor as decided when the experiment has to end. Some
methods take relatively more time, whereas with others the data can be collected in a

66
comparatively shorter duration. The time at the disposal of the researcher, thus, affects the
selection of the method by which the data are to be collected.
• Precision required
Precision required is yet another important factor to be considered at the time of
selecting the method of collection of data.
SOURCES OF SECONDARY DATA:
The sources of secondary data can be classified as internal sources and external
sources.
Internal Sources of Secondary Data
If available, internal secondary data may be obtained with less time, effort and money
than the external secondary data. In addition, they may also be more pertinent to the situation
at hand since they are from within the organization. The internal sources include
• Accounting resources
This gives so much information which can be used by the marketing researcher.
They give information about internal factors.
• Sales Force Report
It gives information about the sale of a product. The information provided is of
outside the organization.
• Internal Experts
These are people who are heading the various departments. They can give an idea of
how a particular thing is working
• Miscellaneous Reports
These are what information you are getting from operational reports.
External Sources of Secondary Data
External Sources are sources which are outside the company in a larger environment.
Collection of external data is more difficult because the data have much greater variety and
the sources are much more numerous. External data can be divided into following classes:

67
• Govt. Publications
Government sources provide an extremely rich pool of data for the researchers. In
addition, many of these data are available free of cost on internet websites. The
Central Statistical Organization (CSO) and various state govt. collect, compile and
publish data on regular basis.
• International Bodies
All foreign governments and international agencies publish regular reports of
international significance. These reports are regularly published by the agencies like;
United Nations Organization, International Labour Organization, World
Meteorological Organization etc.
• Semi Govt. Publications
Semi govt. organizations municipalities, District Boards and others also publish
reports in respect of birth, death and education, sanitation and many other related
fields.
• Reports of Committee and Commissions
Central govt. or State govt. sometimes appoints committees and commissions on
matters of great importance. Reports of such committees are of great significance as
they provide invaluable data. These reports are like, Shah Commission Report,
Sarkaria Commission Report and Finance Commission Reports etc.
• Private Publications
Some commercial and research institutes publish reports regularly. They are like
Institutes of Economic Growth, Stock Exchanges, National Council of Education
Research and Training (NCERT), National Council of Applied Economic Research
(NCAER) etc.
• Newspapers and Magazines
Various newspapers as well as magazines also do collect data in respect of many
social and economic aspects.
• Research Scholars
Individual research scholars collect data to complete their research work which
further is published with their research papers.

68
SELF ASSESSMENT
State whether the following statements are true and false:
1. Secondary data can be published and unpublished.
2. A schedule is generally filled by the research worker or enumerator, who can interpret
the questions when necessary.
Fill in the blanks:
3. The data which is primary in the hands of one become/remain .............................. in the
hands of another.
4. The requirement of primary and secondary data depends upon…………………..
5. Data is reliable when it is collected from……………………
SUMMARY:
The reliability of managerial decision depends on the quality of data. The quality of data can be
expressed in terms of its representative feature of the reality which can be ensured by the usage of
fitting data collection methods. Statistical data can be classified in two categories viz primary and
secondary.
Primary data is a type of information that is obtained directly from first hand information by means of
surveys, observations of experimentation. Primary data can be collected by observation method,
questionnaire methods, interview method and interview schedule method.
On the other hand, secondary data is the data that have been already collected by the others and
readily available from other sources, however, researcher must be very careful in using secondary
data. Thus, before using secondary data, researcher must check the reliability , suitability and
adequacy of such data. As there are many methods for collection of data and it is important to
consider the following factors while selecting a particular method
• Nature scope and object of enquiry
• Availability of funds
• Time factor
• Decision required

69
Secondary data can be collected from internal sources as well as external sources. The internal
sources include accounting resources, sales reports, internal experts and miscellaneous reports.
External sources include government publications, international bodies, semi-government
publications, newspapers and magazines and research scholars.
GLOSSARY
Sample – is a group of people, objects, or items that are taken from a larger population for
measurement.
Sales report – describes the record of all the calls which have been made and products that
have been sold during a particular time frame by a salesperson or the management.
Personal observation- is a subset of observational approaches in which the researcher is the
primary instrument for monitoring participants.
ANSWERS OF SELF ASSESSMENT QUESTIONS:
1. True 2. True 3. Secondary 4. Objective of the study 5. The universe of the
interest.
TERMINAL QUESTIONS:
• What is primary data? Discuss the various methods of collecting primary data?
• What are the merits and limitations of secondary data? Explain various sources of secondary
data.
• What do you mean by questionnaire? What is the difference between questionnaire and
schedule?
• Discuss the advantages and disadvantages of observation methods of data collection.
SUGGESTED READINGS:
• Bhandarkar, P.L. and Wilkinson, T.S. Methodology and Techniques of Social Research.
• Dubin, Robert, Theory Building New York; MacMillan Publishing Co., Quoted in W
Emory, Business Research Methods.
• Gupta, S.P. Statistical Method, Sultan Chand and Sons, New Delhi.

70
• Kothari, C.R. Research Methodology-Methods and Techniques, Whishwa
Prakashan, New Delhi.
• Panneerselvam, R. Research Methodology, Prentice-Hall of India Pvt. Ltd., New
Delhi.

71
LESSON-V
SAMPLING DESIGN
Structure
Objectives
Introduction
Essentials of Good Sampling
Need of Sampling
Steps in Sampling Process
Methods of Sampling
Merits of Sampling Method
Limitations of Sampling
Sampling and Non Sampling Errors
Self Assessment
Summary
Glossary
Answers of Self Assessment Questions
Terminal questions
Suggestive reading
OBJECTIVES:
After studying this lesson students will be able to:
• know the meaning of sampling,
• know the need of sampling and essentials of good sampling,
• frame a sample,

72
• understand the various methods of sampling and selection of a suitable method under the
given situation,
• know about the merits and limitations of sampling method, and
• acquire knowledge about the sampling and non sampling errors.
INTRODUCTION:
Successful statistical practice is based on focused problem definition. In sampling,
this includes defining the population from which the sample is drawn. Population is also
known as a well-defined collection of individuals or objects known to have similar
characteristics. It is the aggregate of all elements, usually defined prior to the selection of the
sample. The population is said to be completely defined if at least the element, sampling
units, extent and time are specified.
A complete enumeration of all items in the ‘population’ is known as a census inquiry.
It is the process of obtaining responses from/about each of the members of the population. It
can be presumed that in such an inquiry when all items are covered, no element of chance is
left and highest accuracy is obtained, but in practice this may not be true. Even the slightest
element of bias in such an inquiry will larger and larger as the number of observation
increases. Moreover, there is no way of checking the element of bias or its extent except
through a resurvey or use of sample checks.
A Sample is a subset of a population that is used to represent the entire group as a
whole. Sample is the selection of a part of the universe for the purpose of drawing conclusion
or inference about the entire universe from the study of these parts. In certain circumstances
the sampling may represent the only possible or practicable method to obtain desired
information. For example if the universe is infinite or very large or complex. The sample is
only way to study. It is said that a carefully designed sample may better than a poorly planned
and executed census. In case of sampling, the cost of data collection is much less than census.
Sample: The sample is a part or a small section of the population selected for study.
Sampling: It is the procedure of selecting a sample from the population.
Sampling Frame: A set of information used to identify a sample population for statistical
treatment. A sampling frame includes a numerical identifier for each individual, plus other
identifying information about characteristics of the individuals, to aid in analysis and allow
for division into further frames for more in-depth analysis.

73
ESSENTIALS OF GOOD SAMPLING:
In order to reach at right conclusions, a sample must possess the following essential
characteristics.
1. Representative
The sample should truly represent the characteristics of the universe. For this
investigator should be free from bias and the method of collection should be appropriate.
2. Adequacy
The size of the sample should be adequate i.e., neither too large nor small but
commensurate with the size of the population.
3. Homogeneity
There should be homogeneity in the nature of all the units selected for the sample. If
the units of the sample are of heterogeneous character it will be impossible to make a
comparative study with them.
4. Independentability
The method of selection of the sample should be such that the items of the sample are
selected in an independent manner. This means that selection of one item should not
influence the selection of another item in any manner and that each item should be selected
on the basis of its own merit.
NEED OF SAMPLING:
Sampling is necessary because of the following reasons
• It is not technically or economically feasible to take the entire population into
consideration.
• Due to dynamic changes in business, industrial and social environment, it is necessary
to make quick decision, so sample is necessary to save time.
• If data collection takes a long time, then value of some characteristics may change
over the period of time thus, defeating the very purpose of data analysis. Thus, due to
importance of time element sample is required.
• Sample, if representative, may yield more accurate results than the total census
because sample can be more accurately supervised.
74
• Quality of some product is tested by destroying the products.
STEPS IN SAMPLING PROCESS:
An operational sampling process can be divided into seven steps as given below:
• Defining the target population.
• Specifying the sampling frame.
• Specifying the sampling unit.
• Selection of the sampling method.
• Determination of sample size.
• Specifying the sampling plan.
• Selecting the sample.
1. Defining the Target Population
Defining the population of interest, for business research, is the first step in sampling
process. In general, target population is defined in terms of element, sampling unit, extent,
and time frame. The definition should be in line with the objectives of the research study. For
example, if a kitchen appliances firm wants to conduct a survey to ascertain the demand for
its micro ovens, it may define the population as ‘all women above the age of 20 who cook
(assuming that very few men cook)’. However this definition is too broad and will include
every household in the country, in the population that is to be covered by the survey.
Therefore the definition can be further refined and defined at the sampling unit level, that, all
women above the age 20, who cook and whose monthly household income exceeds
Rs.20,000. This reduces the target population size and makes the research more focused. The
population definition can be refined further by specifying the area from where the researcher
has to draw his sample, that is, households located in Hyderabad.
A well-defined population reduces the probability of including the respondents who
do not fit the research objective of the company. For example, if the population is defined as
all women above the age of 20, the researcher may end up taking the opinions of a large
number of women who cannot afford to buy a micro oven.
2. Specifying the Sampling Frame

75
Once the definition of the population is clear a researcher should decide on the
sampling frame. A sampling frame is the list of elements from which the sample may be
drawn. Continuing with the micro oven example, an ideal sampling frame would be a
database that contains all the households that have a monthly income above Rs.20,000.
However, in practice it is difficult to get an exhaustive sampling frame that exactly fits the
requirements of a particular research. In general, researchers use easily available sampling
frames like telephone directories and lists of credit card and mobile phone users. Various
private players provide databases developed along various demographic and economic
variables. Sometimes, maps and aerial pictures are also used as sampling frames. Whatever
may be the case, an ideal sampling frame is one that entire population and lists the names of
its elements only once.
A sampling frame errorcpopsup when the sampling frame does not accurately
represent the total population or when some elements of the population are missing another
drawback in the sampling frame is over –representation. A telephone directory can be over
represented by names/household that have two or more connections.
3. Specifying the Sampling Unit
A sampling unit is a basic unit that contains a single element or a group of elements of
the population to be sampled. In this case, a household becomes a sampling unit and all
women above the age of 20 years living in that particular house become the sampling
elements. If it is possible to identify the exact target audience of the business research, every
individual element would be a sampling unit. This would present a case of primary sampling
unit. However, a convenient and better means of sampling would be to select households as
the sampling unit and interview all females above 20 years, who cook. This would present a
case of secondary sampling unit.
4. Selection of the Sampling Method
The sampling method outlines the way in which the sample units are to be selected.
The choice of the sampling method is influenced by the objectives of the business research,
availability of financial resources, time constraints, and the nature of the problem to be
investigated. All sampling methods can be grouped under two distinct heads, that is,
probability and non-probability sampling.
5. Determination of Sample Size

76
The sample size plays a crucial role in the sampling process. There are various ways
of classifying the techniques used in determining the sample size. A couple of those hold
primary importance and are worth mentioning are whether the technique deals with fixed or
sequential sampling and whether its logic is based on traditional or Bayesian methods. In non-
probability sampling procedures, the allocation of budget, thumb rules and number of sub-
groups to be analyzed, importance of the decision, number of variables, nature of analysis,
incidence rates, and completion rates play a major role in sample size determination. In the case
of probability sampling, however, formulas are used to calculate the sample size after the levels
of acceptable error and level of confidence are specified. The details of the various techniques
used to determine the sample size will be explained at the end of the chapter.
6. Specifying the Sampling Plan
In this step, the specifications and decisions regarding the implementation of the
research process are outlined. Suppose, blocks in a city are the sampling units and the
households are the sampling elements. This step outlines the modus operandi of the sampling
plan in identifying houses based on specified characteristics. It includes issues like how is the
interviewer going to take a systematic sample of the houses. What should the interviewer do
when a house is vacant? What is the recontact procedure for respondents who were
unavailable? All these and many other questions need to be answered for the smooth
functioning of the research process. These are guidelines that would help the researcher in
every step of the process. As the interviewers and their co-workers will be on field duty of
most of the time, a proper specification of the sampling plans would make their work easy
and they would not have to revert to their seniors when faced with operational problems.
7. Selecting the Sample
This is the final step in the sampling process, where the actual selection of the sample
elements is carried out. At this stage, it is necessary that the interviewers stick to the rules
outlined for the smooth implementation of the business research. This step involves
implementing the sampling plan to select the sampling plan to select a sample required for
the survey.
METHODS OF SAMPLING:

77
When a sample is required to be reflected from a population, it is necessary to decide
which method should be applied. Basically, there are two different types of sample designs,
namely, probability sampling and non-probability sampling. Each of the two is described
below.
• Random or Probability sampling
This type of sampling is also known as random sampling or chance sampling. This
sampling procedure gives each element in the population an equal chance of getting selected
for the sample; besides, all choices are independent of one another. The obtained results of
probability sampling can be assured in terms of probability. In other words, we can measure
the errors of estimation or the significance of obtained results from a random sample. In fact,
due to this very reason probability sampling design is superior to the deliberate sampling
design. Probability sampling ensures the law of Statistical Regularity, which states that if the
sample chosen is a random one, the sample will have the same composition and
characteristics as the universe. Hence, probability sampling is more or less the best technique
to select a representative sample
• Non-Random or Non-probability sampling
This type of sampling is also known as deliberate sampling, purposive sampling, or
judgment sampling. In this sampling procedure, the organizers of the inquiry deliberately
choose the particular units of the universe to compose a sample on the basis that the small
mass selected out of a large one would represent the whole. For example, if economic
conditions of the population living in a state are to be studied, a few cities and towns can be
deliberately selected for intensive study on the principle that they can represent the entire
state. Besides, the investigator may select a sample yielding results favourable to his point of
view. In case that happens, the entire inquiry may get vitiated. Thus, there exists the danger
of bias entering into this type of sampling technique. However, if the investigators are
impartial, work without bias and have the necessary experience so as to take sound judgment,
the obtained results of an analysis of deliberately selected sample may be tolerably reliable.
We shall now discuss some of the various sampling methods under two separate
headings as follows:
• Random Sampling Methods:
• Simple Random Sampling

78
• Stratified Sampling
• Systematic Sampling
• Cluster Sampling
• Multi Stage Sampling
• Non-Random Sampling Methods:
• Judgment Sampling
• Quota Sampling
• Convenience Sampling
• Snowball Sampling
• Random Sampling Methods
Simple Random Sampling
A simple random sample is one in which every member of the target population has
the same probability of being included in the sample. The selection is thus free from personal
bias because the investigator does not exercise his discretion of preference in the choice of
items. Since selection of items in the sample depends entirely on chance, this method is also
known as the method of chance selection. There are a variety of ways of selecting a random
sample from a population list. One way is to use a random number generator to assign a
random number to each member of the target population, order the members on the list
according to the random number and choose the first n members on the list, where n is the
required sample size.
Stratified Sampling
If a population from which a sample is to be drawn does not constitute a
homogeneous group, stratified sampling technique is generally applied in order to obtain a
representative sample. Under stratified sampling the population is divided into several sub-
populations that are individually more homogeneous than the total population (the different sub-
population is called ‘strata’) and then we select items from each stratum to constitute a sample.
Since each stratum is more homogeneous than the total population, we are able to get more
precise estimates for each stratum and by estimating more accurately each of the

79
component parts; we get a better estimate of the whole. In brief, stratified sampling results is
more reliable and detailed information.
Systematic Sampling
Systematic sampling involves selecting every nth member from a population list. If
the list is random, then selecting every nth member is another method of obtaining a simple
random sample. However, if the list is not random, this procedure can introduce bias. Non-
random order would include alphabetical order or date of birth order.
Cluster Sampling
In cluster sampling, the population is divided into well-defined groups or clusters.
Then, few of these clusters are selected based on the assumptions that they represent the
entire universe. All the units of selected cluster are studied to arrive at a conclusion. The
selection of these clusters is done by using anyone of the above discussed sampling methods.
Cluster sampling is used primarily because it allows for great economies in data collection
costs.
Multistage Sampling
As the name implies, this method refers to a sampling procedure which is carried out
in several stages. The material is regarded as made up of a number of first stage sampling
units, each of which is made of a number of second stage units, etc. At first, the first stage
units are sampled by some suitable method, such as random sampling. Then, a sample of
second stage unit is selected from each of the selected first stage units again by some suitable
method which may be the same or different from the method employed for the first stage
units. Further stages may be added as required.
• Non-Random Sampling Methods
Judgment Sampling
In judgment sampling, the selection of the sample is based on the judgment of the
investigator, who is studying a situation. In other word, the investigator exercises his
judgment in the choice of sample items and includes those items in the sample which he
thinks are most typical of the population with regard to the characteristics under
investigation. This method is also known as ‘purpose sampling’ or ‘deliberate sampling’.
This sampling method should be carried out by an expert in the field as his judgment will
influence the final outcome of the study.

80
Quota Sampling
Quota sampling is the non-probabilistic version of stratified random sampling. The
target population is spill into appropriate strata based on known subgroups (e.g. sex,
educational achievement, company size etc.). Each stratum is sampled (using convenience or
snowball techniques) so that number of respondents in each subgroup is proportional to the
proportion in the population.
Convenience Sampling
This method is based on the convenience of the researcher. The researcher uses the
sources available to him to come to the conclusion.
Snowball Sampling
This involves asking people who have participated in a survey to nominate other
people they believe would be willing to take part. Sampling continues until the required
number of responses is obtained. This technique is often used when the population is difficult
for the researchers to identify. For example, we might expect software hackers to be known
to one another, so if we found one to take part in our survey, we could ask him/her to identify
other possible participants.
MERITS OF SAMPLING METHOD:
The sampling method has the following merits over the complete enumeration survey
method:
• Less time: since the sample is a study of part of the population, considerable time and
labour are saved when a sample survey is carried out. Time is saved not only in
collecting data but also in processing it. For these reasons, a sample provides more
timely data in practice than a census.
• More reliable results: Although the sampling technique involves certain inaccuracies
owing to sampling errors, the result obtained is generally more reliable than that
obtained from a complete count. There are several reasons for it. First, it is always
possible to determine the extent of sampling errors. Secondly, other types of errors to
which a survey is subjected, such as inaccuracy of information, incompleteness of
returns, etc. are likely to be more serious in a complete census than in a sample
survey.

81
• More detailed information: since the sampling technique save time and money, it is
possible to collect more detailed information in a sample survey.
• Less cost: The amount of effort and expenses involved in collecting information is
always greater per unit of the sample than a complete census. The total financial
burden of a sample survey is generally less than that of a complete census.
LIMITATIONS OF SAMPLING:
• A sample survey must be carefully planned and executed, otherwise, the results
obtained may be inaccurate and misleading.
• Sampling generally requires the services of experts, if only for consultation purposes.
In the absence of qualified and experienced persons, the information obtained from
sample survey cannot be relied upon.
• At times, the sampling plan may be so complicated that it requires more time, labour
and money than a complete count. This is so if the size of the sample is a large
proportion of the total population and if complicated weighted procedures are used.
• If the information is required for each and every unit in the domain of study, a
complete enumeration survey is necessary.
SAMPLING AND NON-SAMPLING ERRORS:
Sampling error is the deviation of the selected sample from the true characteristics,
traits, behaviours, qualities or figures of the entire population. Various forces combine to
produce deviations of sample statistic from population parameters, and errors, in accordance
with the different cause, are classified into sampling and non-sampling error.
Sampling Errors
The sampling errors arise due to drawing faulty interference about the population
based upon the results of the samples. The sampling error would be less, if the sample size is
large relative to the population and vice-versa. The reason is that the estimate is based on a
part and not on the whole.
Even if utmost care has been taken in selecting a sample, the results derived from the
sample may not be representative of the population from which it is drawn, because samples
are seldom, if ever, perfect miniatures of the population. This gives rise to sampling errors.
Sampling error are of two types- biased and unbiased.

82
1. Biased Errors
These errors arise from any bias in selection, estimation etc. For example if in place
of simple random sampling, deliberate sampling has been used in particular case some bias is
introduced in the result and hence, such errors are called biased sampling errors.
2. Unbiased Sampling Errors
These errors arise due to chance differences between the members of population
included in the sample and those not included. An error in statistics is the difference between
the value of a statistic and that of the corresponding parameter.
Causes of Sampling Errors
Some of the causes of sampling errors are
• Error in the selection of the sample.
• Bias in reporting of data.
• Diversity of population.
• Substitution of sample units for convenience.
• Faulty demarcation of sampling universe.
Non-Sampling Errors
Non sampling-error occurs at the time of observation, approximation and processing
of data. This error is common to both the sampling and census survey. Non-sampling error
can arise at any stage of the planning and execution of complete enumeration or sample
survey.
As regards non-sampling errors, they are likely to be more in case of complete
enumeration survey than in the case of a sample survey, since it is possible to reduce the non-
sampling errors to a great extent by using better organisation and suitably trained personnel at
the field and tabulation stages. The behaviour of non-sampling errors with increase in sample
size is likely to be opposite of that of sampling error, that is, non-sampling error is likely to
increase with increase in sample size. Non-sampling errors can occur at every stage of
planning and execution of the census or survey. Such errors can arise due to a number of
causes such as defective methods of data collection and tabulation, faulty definition,
incomplete coverage of the population or sample etc.

83
Causes of Non- Sampling Errors
Non - sampling errors may arise from one or more of the following factors:
• Data specification being inadequate and inconsistent with respect to the objectives of
the census or survey.
• Lack of trained and experienced investigators.
• Lack of adequate inspection and supervision of primary staff.
• Errors due to non-response, i.e. incomplete coverage in respect of unit.
• Errors in data processing operations such as coding, punching, certification, tabulation
etc.
• Omission or duplication of units due to imprecise definition or boundaries of area
units, incomplete or wrong identification of units or faulty method of enumerations.
• Inaccurate or inappropriate methods of interview, observation or measurement with
inadequate or ambiguous schedules, definitions or instructions.
SELF ASSESSMENT
Fill in the blanks:
1. A part of population is known as ………..
2. The list of sampling units from which a sample is taken is called…………….
3. Quota sampling is a .............................. sampling.
4. Select cluster and then select elements from each selected cluster is an
example of……………..
5 .............................is known as accidential sampling.
SUMMARY:
A complete enumeration of all items in the population is known as census inquiry. A sample is a
subset of a population that is used to represent the entire group as a whole. Thus, sample is the
selection of part of the universe for the purpose of drawing conclusion or inference about the entire
universe from the study of these parts. In order to reach at right conclusions, a sample must possess
the following essential characteristics.
• Representativeness
• Adequacy

84
• Homogeneity
• Independentability
Further, various steps are to be followed in sampling. These include defining the target population,
specifying the sampling frame, specifying the sampling and selection of a sampling method,
determination of sample size, specifying the sampling plan and selecting the sample.
Sampling can be done either by probability sampling method or by non probability sampling method.
Probability sampling means where each and every unit of the population has equal chance to be
selected in the sample. Non probability is that when the organisations of the inquiry deliberately
choose the particular units of the universe to compose a sample on the basis that the small mass
selected out of a large would represent the whole. Probability sampling methods include simple
random sampling, stratified sampling, systematic sampling, cluster sampling and multistage sampling.
On the other hand, non –probability sampling methods include judgment sampling, convenience
sampling, quota sampling. In the data collection process, some scope for errors still remains Inspite of
taking all precautions. These errors can be sampling and non sampling errors. Sampling error is the
deviation of the selected sample from the true characteristics, traits, behaviours and qualities of the
entire population. Non sampling errors occur at the time of observation approximation and processing
of data.
5.11. GLOSSARY
Coding – is a process of identifying a passage in the text or other data items,
searching and identifying concept and finding relationship between them.
Credit card – is a payment card issued to users to enable the cardholder to pay a
merchant for goods and services based on the cardholder’s promise to the card
issuer to pay them for the amounts plus the other agreed charges.
Tabulation – is the systematical arrangement of the statistical data in columns or
rows.
ANSWERS OF SELF ASSESSMENT QUESTIONS:
1. Sample 2. Sampling frame 3. Non probability sampling 4. Two stage
sampling 5. Convenience sampling.
TERMINAL QUESTIONS:
• Define the term sampling? What should be the qualities of good sampling?
• Discuss the various steps involved in sampling?

85
• Discuss in brief probability and non probability methods of sampling?
• Explain various sampling and non sampling errors?
SUGGESTED READINGS:
• Bhandarkar, P.L. and Wilkinson, T.S. Methodology and Techniques of Social Research.
• Dubin, Robert, Theory Building New York; MacMillan Publishing Co., Quoted in W
Emory, Business Research Methods.
• Gupta, S.P. Statistical Method, Sultan Chand and Sons.
• Kothari, C.R. Research Methodology-Methods and Techniques, Whishwa
Prakashan.
• Panneerselvam, R. Research Methodology, Prentice-Hall of India Pvt. Ltd., New
Delhi.
86
LESSON –VI
ANALYSIS OF DATA AND HYPOTHESIS TESTING
Structure:
Objectives.
Introduction
Importance of Data Analysis
Consideration / Issues in Data Analysis
Types of Analysis
dispersion meaning
Measures of the dispersion
Skewness meaning
Measures of skewness
Kurtosis
Correlation meaning
Types of correlation
Method of correlation
Regression analysis
Regression equations
Regression coefficients
Hypothesis Testing
Characteristics of Hypothesis
Steps in Hypothesis Testing
Two-Tailed and One Tailed Test of Hypothesis

87
Student t-Test
ANOVA Analysis
Z-Test
Chi-Square Test
Self Assessment
Summary
Glossary
Answers of Self Assessment Questions
Terminal Questions:
Suggested Readings:
OBJECTIVES:
After studying this lesson, students will be able to:
• understand the importance of data analysis,
• acquire knowledge regarding the consideration to be taken into account while analyzing data,
• understanding the meaning and procedure to be adopted in testing hypothesis,
• know about the two tailed and one tailed test of hypothesis ,and
• apply Z-test, t-test and chi-square-test in their research.
INTRODUCTION:
The data, after collection, has to be analysed in accordance with the outline laid down
for the purpose at the time of developing the research plan. This is essential for a scientific
study and for ensuring that we have all relevant data for making contemplated comparisons
and analysis. The term analysis refers to the computation of certain measures along with
searching for patterns of relationship that exists among data-groups. Thus, in the process of
analysis, relationships or differences supporting or conflicting with original or new

88
hypotheses should be subjected to statistical tests of significance to determine with what
validity data can be said to indicate any conclusions.
IMPORTANCE OF DATA ANALYSIS :
Data analysis is a process used to transform, remodel and revise certain data with a
view to reach to a certain conclusion for a given situation or problem. Data analysis can be
done by different methods as according to the needs and requirements of different domains
like science, business, social science etc. Data analysis, in a research supports the researcher
to reach to a conclusion. Therefore, simply stating that data analysis is important for a
research will be an understatement rather no research can survive without data analysis.
There are many benefits of data analysis however; the most important ones are as
follows:
Data analysis helps in structuring the findings from different sources of data
collection like survey research. It is again very helpful in breaking a macro problem into
micro parts. Data analysis acts like a filter when it comes to acquiring meaningful insights out
of huge data-set. Every researcher has sort out huge pile of data that he/she has collected,
before reaching to a conclusion of the research question. Mere data collection is of no use to
the researcher. Data analysis proves to be crucial in this process. It provides a meaningful
base to critical decisions.
One of the most important uses of data analysis is that it helps in keeping human bias
away from research conclusion with the help of proper statistical treatment. With the help of
data analysis a researcher can filter both qualitative and quantitative data for an assignment
writing projects. Thus, it can be said that data analysis is of utmost importance for both the
research and the researcher. Or to put in another words data analysis is as important to a
research as it is important for a doctor to diagnose the problem of the patient before giving
him any treatment.
CONSIDERATIONS/ISSUES IN DATA ANALYSIS:
Having Necessary Skills to Analyze
A tacit assumption of investigators is that they have received training sufficient to
demonstrate a high standard of research practice. Unintentional ‘scientific misconduct' is
likely the result of poor instruction and follow-up. A common practice of investigators is to
defer the selection of analytic procedure to a research team ‘statistician’. Ideally,

89
investigators should have substantially more than a basic understanding of the rationale for
selecting one method of analysis over another. This can allow investigators to better
supervise staff who conduct the data analyses process and make informed decisions.
Concurrently Selecting Data Collection Methods and Appropriate Analysis
While methods of analysis may differ by scientific discipline, the optimal stage for
determining appropriate analytic procedures occurs early in the research process and should
not be an afterthought. Statistical advice should be obtained at the stage of initial planning of
an investigation so that, for example, the method of sampling and design of questionnaire are
appropriate.
Drawing Unbiased Inference
The chief aim of analysis is to distinguish between an event occurring as either
reflecting a true effect versus a false one. Any bias occurring in the collection of the data, or
selection of method of analysis, will increase the likelihood of drawing a biased inference.
Bias can occur when recruitment of study participants falls below minimum number required
to demonstrate statistical power or failure to maintain a sufficient follow-up period needed to
demonstrate an effect.
Inappropriate Subgroup Analysis
When failing to demonstrate statistically different levels between treatment groups,
investigators may resort to breaking down the analysis to smaller and smaller subgroups in
order to find a difference. Although this practice may not inherently be unethical, these
analyses should be proposed before beginning the study even if the intent is exploratory in
nature. If the study is exploratory in nature, the investigator should make this explicit so that
readers understand that the research is more of a hunting expedition rather than being
primarily theory driven. Although a researcher may not have a theory-based hypothesis for
testing relationships between previously untested variables, a theory will have to be
developed to explain an unanticipated finding.
Environmental/Contextual issues
The integrity of data analysis can be compromised by the environment or context in
which data was collected i.e., face-to face interviews vs. focused group.
The interaction occurring within a dyadic relationship (interviewer-interviewee) differs from
the group dynamic occurring within a focus group because of the number of participants, and
90
how they react to each other’s responses. Since the data collection process could be
influenced by the environment/context, researchers should take this into account when
conducting data analysis.
Reliability and Validity
Researchers performing analysis on either quantitative or qualitative analyses should
be aware of challenges to reliability and validity. The potential for compromising data
integrity arises when researchers cannot consistently demonstrate stability, reproducibility, or
accuracy of data analysis.
TYPES OF ANALYSIS:
As stated earlier, by analysis we mean the computation of certain indices or measures
along with searching for patterns of relationship that exist among the data groups. Analysis,
particularly in case of survey or experimental data, involves estimating the values of
unknown parameters of the population and testing of hypotheses for drawing inferences.
Analysis may, therefore be categorized as descriptive analysis and inferential analysis.
“Descriptive analysis is largely the study of distributions of one variable. This study provides
us with profiles of companies, work groups, persons and other subjects on any of a multiple
of characteristics such as size, composition, efficiency, preferences etc.” this sort of analysis
may be in respect of one variables (described as univariate analysis), or in respect of two
variables (described as bivariate analysis) or in respect of more than two variables (described
as multivariate analysis).
Univariate analysis explores each variable in a data set. It looks at the range of values,
as well as the central tendency of the value. It describes the pattern of response to the
variable. it describes each variable on its own.
Descriptive statistics describe and summarize data. Univariate descriptive statistics
describe individual variables.
How to Analyze One Variable
1) Raw Data
Obtain a printout of the raw data for all the variables. Raw data resembles a matrix,
with the variable name heading the columns, and the information for each case or record
displayed across the rows.

91
Example: Raw data for a study of injuries among county workers (first 10 cases).
Injury Report No. County Name Cause of Injury Severity of Injury
1 County A Fall 3
2 County B Auto 4
3 County C Fall 6
4 County C Fall 4
5 County B Fall 5
6 County A Violence 9
7 County A Auto 3
8 County A Violence 2
9 County A Violence 9
10 County B Auto 3
It is difficult to tell what is going on with each variable in this data set. Raw data is
difficult to grasp, especially with large number of cases or records. Univariate descriptive
statistics can summarize large quantities of numerical data and reveal patterns in the raw data.
In order to present the information in a more organized format, start with univariate
descriptive statistics for each variable. For example, the variable severity of injury.
Severity of Injury
3
4
6
4
5
9
3
2
9
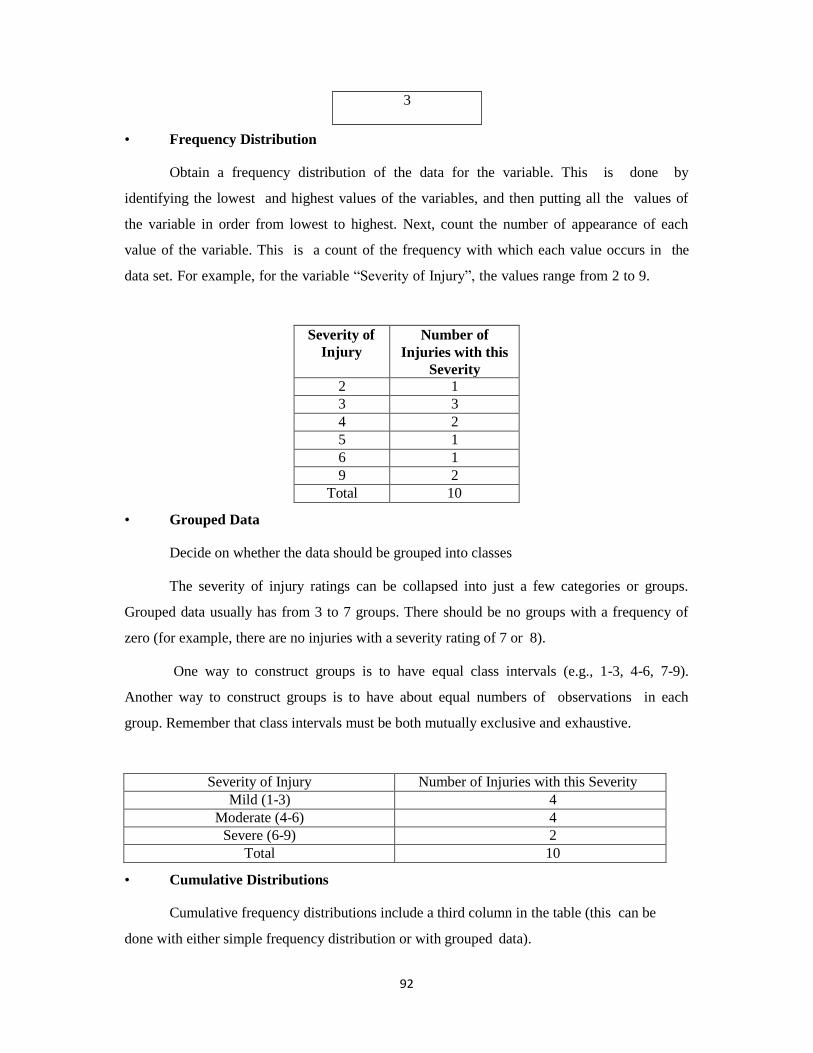
92
• Frequency Distribution
Obtain a frequency distribution of the data for the variable. This is done by
identifying the lowest and highest values of the variables, and then putting all the values of
the variable in order from lowest to highest. Next, count the number of appearance of each
value of the variable. This is a count of the frequency with which each value occurs in the
data set. For example, for the variable “Severity of Injury”, the values range from 2 to 9.
Severity of
Injury
Number of
Injuries with this
Severity
2 1
3 3
4 2
5 1
6 1
9 2
Total 10
• Grouped Data
Decide on whether the data should be grouped into classes
The severity of injury ratings can be collapsed into just a few categories or groups.
Grouped data usually has from 3 to 7 groups. There should be no groups with a frequency of
zero (for example, there are no injuries with a severity rating of 7 or 8).
One way to construct groups is to have equal class intervals (e.g., 1-3, 4-6, 7-9).
Another way to construct groups is to have about equal numbers of observations in each
group. Remember that class intervals must be both mutually exclusive and exhaustive.
Severity of Injury Number of Injuries with this Severity
Mild (1-3) 4
Moderate (4-6) 4
Severe (6-9) 2
Total 10
• Cumulative Distributions
Cumulative frequency distributions include a third column in the table (this can be
done with either simple frequency distribution or with grouped data).
3

93
Severity of Injury Number of Injuries with
this Severity
Cumulative frequency
2 1 1
3 3 4
4 2 6
5 1 7
6 1 8
9 2 10
A cumulative frequency distribution can answer questions such as, how many of the
injuries were at level 5 or lower? Answer= 7.
• Percentage Distributions
Frequencies can also be presented in the form of percentage distributions and
cumulative percentages.
Severity of Injury Percent of injuries Cumulative percentages
2 10 10
3 30 40
4 20 50
5 10 70
6 10 80
9 20 100
Graphing the Single Variable
Graphing is a way of visually presenting the data. Many people can grasp the
information presented in a graph better than in a text format. The purpose of graphing is to:
-present the data
-summarize the data
-enhance textual descriptions
-describe and explore the data
-make comparisons easy
-avoid distortion
-provoke thought about the data

94
Bar Graphs
Bar graphs are used to display the frequency distributions for variables measured at
the nominal and ordinal levels. But graphs use the same width for all the bars on the graph,
and there is space between the bars. Label the parts of the graph, including the title, the left
(Y) or vertical axis, the right (x) or horizontal axis, and the bar labels.
HISTOGRAM
A histogram is a chart that is similar to a bar chart, but it is used for interval and ratio
level variables. With a histogram, the width of the bar is important, since it is the total area
under the bar that represents the proportion of the phenomenon accounted for by each
category. The bars convey the relationship of one group or class of the variable to the
other(s).
For example, in the case of the counties and employee injuries, we might have
information on the rate of injury according to the number of workers in each county in State
X.
County Name Rate of Injury per 1,000 workers
County A 5.5
County B 4.2
County C 3.8
County D 3.6
County E 3.4
County F 3.1
County G 1.8
County H 1.7

95
County I 1.6
County J 1.0
County K 0.9
County L 0.4
If we group the injury rates into three groups, then a low rate of injury would be 0.0-
1.9 injuries per 1,000 workers; moderate would be 2.0-3.9; and high would be 4.0 and above
(in this case, up to 5.9). This could be graphed as follows:
FREQUENCY POLYGON
A frequency polygon is another way of displaying information for an interval or ratio
level variable. A frequency polygon displays the area under the curve that is represented by
the values of the variable. This type of chart is also used to show time series graphs, or the
changes in rates over time.
For example, the following table shows the average injury rate per 1,000 employees
for counties in State X for the years 1980 to 1990.
Year 1980 1981 1982 1983 1984 1985 1986 1987 1988 1988 1990
Rate 3.6 4.2 3.4 5.5 3.8 3.1 1.7 1.8 1.0 1.6 0.9

96
A cumulative frequency polygon is used to display the cumulative distribution of
values for a variable
PIE CHART
Another way to show the relationships between classes or categories of a variable is in
a pie or circle chart. In a pie chart, each “slice” represents the proportion of the total
phenomenon that is due to each of the classes or groups.

97
Rates and Ratios
Other way to look at the sub-groups or classes within one variable is by the relation of
each sub-group or class to the whole. This can be calculated with a proportion. A proportion
is obtained by dividing the frequency of observations counted for one group or class (written
as f ) by the total number of observations counted for the variable (written as N).
This can be expressed as f / N
A percentage is the same as a proportion, multiplied by 100.
This can be expressed as f / N x 100
A rate is the relationship between two different numbers, for example, the number of
injuries among county workers and the population of the county. This can be calculated as the
first number (N1, or injuries) divided by the second number (N2, or population).
This can be expressed as N1 / N2
Many health statistics are expressed as rates, for example, the birth rate is the number
of births per some population, such as number of births per 1,000 women.
DISPERSION
An average can represent a series only as best as a single figure can, but it certainly cannot
reveal the entire story of any phenomenon under study. Specially, the averages cannot alone
describe adequately a set of observations, unless all the observations are the same. It is
necessary to describe the variability or dispersion of the observation. In two or more
distributions the central value may be the same but still there can be wide disparities in the
formation of the distribution. Measures of the dispersion help us in studying this important
characteristics’ of a distribution.
MEASURES OF DISPERSION
• Range - it is the simplest method of measuring dispersion and is defined as the
difference between the values of the smallest item and the value of the largest item
included in the distribution. It is calculated as under:

98
Range = L-S
Where, L = Largest item
S = Smallest item
The relative measure corresponding to range, called the co-efficient of range, is obtained by
applying the following formula:
Co-efficient of Range = L-S/ L+S
• Interquartile Range or Quartile Deviation – the interquartile range is the difference
between the 75th and 25th percentile or 3rd quartile and 1st quartile. Thus, the range
which includes the middle 50 percent of the distribution is called the interquartile
range. This is one quarter of the item at the lower end and another quarter of the item
at the upper end of the distribution is excluded in computing the interquartile range. It
is obtained as under:
• Mean deviation – the method discussed earlier, namely range and quartile deviation,
are not measures of dispersion in the strict sense of the term because they do not show
the scatterness around as average. Mean deviation is the average of difference of the
values of items from some average of the series. Such a difference is technically
called deviation.
Where, M.D = Mean Deviation
M. D. = ∑|D|
N
|D| is the absolute value of the deviation ignoring plus and minus signs.
N is the total number of items.
The relative measure corresponding to the mean deviation, called the co-efficient of
mean deviation, is obtained by dividing mean deviation by particular average used in
computing mean deviation.
Co − efficient M. D. = M. D
Mean

99
• Standard deviation – it is the most widely used measure of dispersion of a series and
is denoted by the ′σ′ symbol pronounced as sigma. Its significant lies in the fact that it
is free from those defects from which the earlier method suffer and satisfies most of
the properties of a good measure of dispersion. Standard deviation for the values of
individual items in a series is obtained from the arithmetic average.
SKEWNESS
Skewness means lack of symmetry in a frequency distribution. Skewness denotes the
degree of departure of a distribution from symmetry and reveals the direction of scatterness
of the items. It gives us an idea about the shape of frequency distribution is not symmetrical,
it is called skewed distribution. Skewness tells us about the asymmetry of the frequency
distribution. Skewness can be positive or negative. The measures of skewness can either be
relative or absolute. The measures which expresses the values of the series are expressed are
called absolute measures of skewness. The measures which express skewness in the form of
ratios or percentage are called relative measures of skewness. Relative measures of skewness
are also known as coefficient of skewness and are useful to compare the skewness of two or
more of a series.
skewness tells the direction and extent of skewness/ asymmetry in a series. Mean, median and
mode are identical in a symmetrical distribution. Asymmetry or skewness is larger if mean
moves away from the mode. In the present study, skewness will be calculated by means of
Karl Pearson’s Coefficient of Skewness as it is an important characteristic for defining the
precise pattern of a distribution. Skewness is defined as a measure of asymmetry. In a
symmetrical distribution, the values of mean, median and mode coincide. If skewness is
positive than mode< median < mean and in case of negative skewness mean < median <
mode. It has been used to study the direction (either towards the lower side or mean score or
towards the higher side of the mean score).
MEASURES OF SKEWNESS
The followings are the important measures of skewness .
1. Karl pearson’s co-efficient of skewness.
2. Bowley’s coefficient of skewness.
3. Kelly’s coefficient of skewness.

100
1. Karl pearson’s co-efficient of skewness – this is method of measuring skewness is based
upon the difference between mean and mode. The difference is divided by standard deviation
to give a relative measure. Symbolically,
Absolue S.K. = Mean – mode
SKp = Mean – Mode / Standard deviation
SKp = Karl pearson’s coefficient of skewnwss
2. Bowley’s coefficient of skewness – bowley’s measures is based on quartiles. In
asymmetrical distribution first and third quartiles are equidistant from the median whereas in
a asymmetrical distribution first and third quartiles are not equidistant from the median.
Absolute S.K = Q3+Q1 – 2 Median
SKB = Q3 + Q1 – 2 Median / Q3 – Q1
SKB = Bowley’s Co-efficient of Skewnwss.
3. Kelly’s coefficient of skewness – Kelly’s measure is based on deciles or percentiles. In a
symmetrical distribution first and ninth deciles or 10th and 90th percentiles are equidistant
from median. On the other hand, in an asymmetrical distribution first and ninth or 10th and
90th percentiles are not equidistant from median.
Absolute SK = P10 + P90 – 2 Median
Or
Absolute SK = D1 + D9 – 2 Median
SKk = P10 + P 90 – 2 Median / P90 – P10
SKk = P1 + P 9 – 2 Median / P9 – P1
SKk = Kelly’s Coeffcient of Skewness.
Co-efficient of Skewness
The co- efficient of skewness, as a statistical tool, helps in the study of the degree and
direction of variation from the centre value. It also shows that a particular distribution is
positively or negatively skewed. This method is useful in studying the concentration of
responses of the respondents either on the higher side or lower side of mean score with

11
2
respect to their opinion on different statements. In the case of normal distribution, the value
of skewness will be zero. The positive skewness is denoted by Mode<Median<Mean and in
case of the negative skewness we find Mean<Median<Mode it has been calculated with the
help of following formula:
SKp =
X̄ − Z
σ
KURTOSIS
Kurtosis is also a characteristic of a frequency distribution which tells about the shape
of the frequency distribution. In statistics Kurtosis refers, whether a frequency distribution is
more flat-topped or more peaked than the normal distribution. Kurtosis is a measure of
weather the data are heavy-tailed or light-tailed relative to a normal distribution. The value of
the coefficient 𝛽2 is the most important measure of kurtosis. It is calculated as:
𝛽2 = 𝜇4
𝜇2
For a normal curve, the value of 𝛽2=3. The curve is more peaked than the normal curve
when the value of 𝛽2 is greater than 3, i.e., leptokurtic. When the value of 𝛽2 is less than 3 then
the curve is less pleaded than the normal curve i.e., platykutic. And if 𝛽3=3, then it called
mesokurtic.
CORREALTION
Correlation is measure of association between two variables. The variables are not designed
as dependents or independent. The most popular correlation coefficients are: Spearman’s
correlation coefficient and Pearson’s product moment correlation coefficient. When
calculating a correlation coefficient for ordinal data, select Spearman’s techniques. For
interval or ratio type data, use Pearson’s techniques. The value of a correlation coefficient can
vary from minus one to plus one. A minus one indicates a perfect negative correlation, while
a plus one indicates a perfect positive correlation. A correlation of zero means there is no
relationship between two variables. When there is negative correlation between two
variables, as value of one variable increase, the value of the other variable decrease, and vice
versa.

12
TYPES OF CORRELATION
1. Positive correlation: if two variables X & Y moves in the same direction, i.e. if one
rises, other rises too & vice versa it is called positive correlation. Examples;
relationship between price and supply.
2. Negative correlation: if two variable X and Y move in opposite directions, i.e. if one
rise other falls & if one falls, other rises, then it is called as negative correlation.
Examples: relationship between demand & price.
3. Linear correlation: the ratio of change of two variables X& Y remain constant
throughout, then they are said to be linearly correlated, like as when every time supply
of commodity rises by 20% as often as its price by 10%, then such two variables have
linear relationship.
4. Non linear correlation: if the ratio between the two variables is not constant but
changing, correlation is said to be curvi-linear, like as when every time price of a
commodity rises by 10%, then sometimes supply rises by 20%, sometimes by 10% &
sometimes by 40%.
5. Simple correlation: when we study the relationship between the two variables only,
then it is called simple correlation. Example, relationship between price and demand.
6. Partial correlation: when three or more variables are taken but relationship between
any two of the variables is studied, assuming other variables as constant, then it is
called partial relationship. Suppose, under constant temperature, we study the
relationship between amount of rainfall and wheat yield, then this will be called as
partial correlation.
7. Multiple correlation: when we study the relationship among three or more variables,
then it is called multiple correlation. For example, if we study the relationship
between rainfall, temperature and yield of wheat, then it is called multiple correlation.
METHODS OF CORREALTION
1. Scatter Diagram Method
2. Graphic Method
3. Karl Pearson’s Co-efficient of Correlation
4. Rank Correlation Coefficient
5. Concurrent Deviation Method

13
Scatter Diagram – Scatter diagram is a graphic method of finding out correlation between
two variables. By this method, direction of correlation can be ascertained. For constructing a
scatter diagram, X-variable is represented on X-axis and the Y-variable on Y-axis. Each pair
of values of X and Y series is plotted in two dimensional space of X-Y. Thus we get a scatter
diagram by plotting all the pair of values.
Graphic Method – this method is very simple. The data pertaining to two series X and Y are
plotted on a graph sheet. A visual observation of graph will give a broad idea of the direction
of movement and closeness of two curves. If the curves move in the same direction, then
correction is positive. If they move in the opposite direction, then the correlation is negative.
Karl Pearson’s Co-efficient of Correlation – it is most widely used method of measuring
the degree of relationship between two variables. The Pearson’s coefficient of correlation is
denoted by the symbol r. this method is based on the following assumption.
1. There is linear relationship between the two variables.
2. There is cause and effect relationship between two variables which means one of the
variables is independent and the other one is dependent.
3. The two variables under study are affected by a large number of independent causes
so as to form a normal distribution.
Rank Correlation Coefficient – the Karl Pearson method discussed above is based on the
assumption that the population being studied is normally distributed. When it is known that
the population is not normal or when the shape of the distribution is not kwon, there is need
for a measure of correlation that involves no assumptions about the parameter of the
populations. It is possible to avoid making any assumption about the population being the
studied by ranking the observations according to size and basing the calculation or the ranks
rather than upon the original observations. This method is finding out co variability or the
lack of it between two variables was developed by the British psychologist Charles Edward
Spearman in 1904. The main objective of this coefficient is to determine the extent to which
the two sets of ranking are similar r dissimilar.
REGRESSION ANALYSIS
The study of regression has special importance in statistical analyses. We know that the
mutual relationship between two series is measured with the help of correlation. Under

14
correlation, the direction and magnitude of the relationship between two variables is
measured. But it is not possible to make the best estimate of the value of a dependents
variables is measured. But it is not possible to make the best estimate of the value of
dependent variables on the basis of the given values of the independent variable by
correlation analysis. Therefore, to make the best estimates and future estimation, the study of
regression analysis is very useful and important. According to Oxford English Dictionary, the
word ‘Regression’ analysis means “Stepping back” or “Returning to average value”. The
term was first of all used by a famous Biological Scientist in 19th century, Sir Francis Galton
relating to a study of hereditary characteristics’. In statistical analyses, the term ‘Regression’
is taken in wider sense. Regression is the study of nature of relationship between the variables
so that one may be able to predict the unknown value of one variable for a known value of
another variable. In regression, one variable is considered as an independent variable and
other is independent variable.
Simple linear regression
In simple regression analysis, we study only two variables at a time, in which one variable is
dependent and other is independent. The functional relationship between income and
expenditure is an example of simple regression. On the contrary, we study more than two
variables at a time in multiple regression analysis (i.e. at least three variables) in which one is
dependent variable and other are independent variable. The study of fact of rain and irrigation
on yield of wheat is an example of multiple regression.
REGRESSION EQUATIONS
Simple linear regression is a statistical device with the help of which we are in a position to
estimate the unknown values of one variable from known values of another variable. The
variable which is used to predict the variable of interest is called the independent variable or
explanatory variable and the variable we want to predict is called the dependent variable or
explained variables. The independent variable is denoted by X and dependent by Y. The
analysis used is called the simple linear regression analysis-simple because there is only one
independent variable, and linear regression analysis simple because there is only one
independent variable, and linear because of the assumed linear relationship between the
dependent and the independent variables. The basic relationship between X and Y variables is
given by

15
Yc = a + bX
Regression equations are the algebraic formulation of regression lines. Regression equation
represents regression lines. Just as there are two regression lines, similarly there are two
regression equations, which are as follows:
1. Regression Equations of X on Y : this equation is used to estimate the probable
values of Y on the basis of the given values of X. this equation is expressed in the
following way:
Y = a +bX
Here, a and b are constants.
2. Regression Equations of Y on X : this equation is used to estimate the probable
values of X on the basis of the given values of Y. this equation is expressed in the
following way:
X = a0 + b0 Y
Here, a0 and b0 are constants.
REGRESSION COEFFICIENTS
There are two regression equations; similarly there are two regression coefficients.
Regression coefficient measures the average change in the value of one variable for a unit
change in the value of another variable. For two variables X and Y, there are two regression
coefficients, which are given as follows:
1. Regression coefficient of Y on X: This coefficient shows that with a unit change in
the values of X variable, what will be the average change in the value of Y variable.
This is represented by byx. Its formula is as follows:
σy byx = r.
σx
The value of byx can also be found out by other formulae.
2. Regression coefficient of X on Y: This coefficient shows that with a unit change in
the values of Y variable, what will be the average change in the value of X variable.
This is represented by bxy. Its formula is as follows:

16
σx bxy = r.
σy
The value of bxy can also be found out by other formulae.
HYPOTHESIS TESTING:
A hypothesis is a tentative statement about the relationship between two or more
variables. A hypothesis is a specific, testable prediction about what researcher expects to
happen in his study. Hypothesis requires as convenient mathematical approach for
simplifying cumbersome calculation. Setting-up and testing hypothesis is an integral art of
statistical inference.
The testing of hypothesis starts with an assumption or guess, termed as hypothesis
that is made about a population parameter. The testing of hypothesis is a process of testing
the significance of a parameter of the population on the basis of sample.
CHARACTERISTICS OF HYPOTHESIS:
i) Hypothesis is an attempt explanation of certain puzzled facts. It is the attempt to find
out the possibility of the occurrence of such a fact. Sometimes it is framed to explain
certain scientific truth or to explain a law.
ii) It is a probable explanation or presupposition of a cause. If the cause of an event is not
known, the investigation starts with a probable cause. For example, if we perceive the
effect of an accident and the cause is not witnessed, then the possible reasons of the
accident are thought of for investigations.
iii) No hypothesis is certain or definite at the stage of assumption. It is merely probable. It
may be framed without evidence or evidence avowedly insufficient. So it requires
verification for confirmation.
iv) Through hypothesis facts are organized in a systematic manner. The aim of
hypothesis is to reach at the real explanation and to remove the puzzlement
concerning the event.
v) Formation of hypothesis is keenly connected with the verification of it. Hypothesis is
found in the form of a conclusion.

17
Null Hypothesis
A hypothesis stated in the hope of being rejected is called a null hypothesis and is
denoted by H0.
Alternative Hypothesis
If H0 is rejected. It may lead to acceptance of an alternative hypothesis denoted by H1.
In other words, if sample results fail to support the null hypothesis, we must conclude that
something else is true which is termed as alternative hypothesis.
STEPS IN HYPOTHESIS TESTING:
• The first step in hypothesis testing is to specify the null hypothesis (H0) and the
alternative hypothesis (H1). If the research concerns whether one method of
presenting pictorial stimuli leads to better recognition than another, the null
hypothesis would most likely be that there is no difference between methods (H0: μ1 -
μ2 = 0). The alternative hypothesis would be H1: μ1 ≠ μ2. If the research concerned the
correlation between grades and SAT scores, the null hypothesis would most likely be
that there is no correlation (H0: ρ= 0). The alternative hypothesis would be H1: ρ ≠ 0.
• The next step is to select a significance level. Typically the 0.05 or the 0.01 level is
used.
• The third step is to calculate a statistic analogous to the parameter specified by the
null hypothesis.
• The fourth step is to calculate the probability value (often called the p value). The p
value is the probability of obtaining a statistic as different or more different from the
parameter specified in the null hypothesis as the statistic computed from the data. The
calculations are made assuming that the null hypothesis is true.
• The probability value computed in Step 4 is compared with the significance level
chosen in Step 2. If the probability is less than or equal to the significance level, then
the null hypothesis is rejected; if the probability is greater than the significance level
then the null hypothesis is not rejected. When the null hypothesis is rejected, the
outcome is said to be "statistically significant" when the null hypothesis is not
rejected then the outcome is said be "not statistically significant."

18
• If the outcome is statistically significant, then the null hypothesis is rejected in favor
of the alternative hypothesis. If the rejected null hypothesis were that μ1- μ2 = 0, then
the alternative hypothesis would be that μ1≠ μ2. If M1 were greater than M2 then the
researcher would naturally conclude that μ1 ≥ μ2.
• The final step is to describe the result and the statistical conclusion in an
understandable way.
TWO TAILED AND ONE TAILED TEST OF
HYPOTHESIS:
A two tailed test rejects the null hypothesis, if the sample mean is either more or less
than the hypothesized value of the mean of the population. It is considered to be apt, when
null hypothesis is of some specific value whereas alternative hypothesis is not equal to the
value of null hypothesis.
When the population mean is either lower or higher than some hypothesized value,
one tailed test is considered to be appropriate.
Suppose that you suspect that a particular class's performance on a proficiency test is
not representative of those people who have taken the test. The national mean score on the
test is 74.
The research hypothesis is:
The mean score of the class on the test is not 74.
Or in notation: H a : μ ≠ 74
The null hypothesis is:
The mean score of the class on the test is 74.
In notation: H 0: μ = 74
As you decide 5 percent probability level for the test. Both tests have a region of
rejection, then, of 5 percent, or 0.05. In this example, however, the rejection region must be
split between both tails of the distribution—0.025 in the upper tail and 0.025 in the lower tail—
because your hypothesis specifies only a difference, not a direction, as shown in Figure 1(a).
You will reject the null hypotheses of no difference if the class sample mean is either much
higher or much lower than the population mean of 74.

19
Figure 1.Comparison of (a) a two‐tailed test and (b) a one‐tailed test, at the same
probability level (95 percent).
The decision of whether to use a one or a two‐tailed test is important because a test
statistic that falls in the region of rejection in a one‐tailed test may not do so in a two‐tailed
test, even though both tests use the same probability level.
STUDENT T-TEST:
The Student t-test is probably the most widely used parametric test. It was developed
by a statistician working at the Guinness brewery and is called the Student t-test because of
proprietary rights. A single sample t-test is used to determine whether the mean of a sample is
different from a known average. A two-sample t-test is used to establish whether a difference
occurs between the means of two similar data sets. The t-test uses the mean, standard
deviation, and number of samples to calculate the test statistic. .
As an example, given 1000 men measured for height in China and Japan, are the
mean heights different? China’s mean is 169.1 cm with a standard deviation of 6.21 cm, and
Japan’s mean height is 168.6 cm with a standard deviation of 5.7 6cm. The t-value is 1.88;
therefore, the mean heights are not statistically different.
ANOVA
An analysis of variance partitions the overall variation between the observation Y into
variation which has been accounted for by the regression on X and residual or unexplained
variation. Analysis of variance (ANOVA) is a procedure for testing the differences among the
means of populations by examining the amount of variation within each of these samples,

110
relative to the amount of variation between the samples. The essence of ANOVA is that the
total amount of variation in a set of data is broken down into two types, that amount which
can be attributed to chance and that amount which can be attributed to specified causes. There
may be variation between samples and also within sample items. ANOVA consists in
splitting the variance for analytical purposes. Hence, it is a method of analyzing the variance
to which a response is subject into its various components corresponding to various sources
of variation. In its simplest form, ANOVA provides a statistical test of whether or not the
means of several groups are equal
Analysis of variance (ANOVA) splits the variance of the variable into two components. One
component is the variability among group means. It is computed by summing square of the
differences between every group mean and overall mean of the distribution. This value is
divided by the degree of freedom k-1 where k number of groups to obtain Mean Sum of
squares between groups (MSB) The other component is the variability within the groups (also
called residual variation). It is quantified as the sum of squares of the differences between
each observation and its respective group mean. This value is divided by degrees of freedom n-
k where n is total number of observations and k is number of groups, to find Mean Sum of
squares within groups (MSW). The ratio of the MSB and MSW is called the F ratio. The
calculated F ratio values are compared to the standardized table value of F from the F-
distribution. If the calculated F-ratio value is greater than the table value at an acceptable
level of significance, we will reject the null hypothesis of equality of means and conclude that
the means of the groups are significantly different. In other words, large F ratios signify that
the variation among group means is more than it would we if this variation were simply
outcome of chance.
Z -TEST:
The next test, which is very similar to the Student t-test, is the z-test. However, with
the z-test, the variance of the standard population, rather than the standard deviation of the
study groups, is used to obtain the z-test statistic. Using the z-chart, like the t-table, we see
what percentage of the standard population is outside the mean of the sample population. If,
like the t-test, greater than 95% of the standard population is on one side of the mean, the p-
value is less than 0.05 and statistical significance is achieved. As some assumption of sample
size exists in the calculation of the z-test, it should not be used if sample size is less than 30.
If both the n and the standard deviation of both groups are known, a two sample t-test is best.

111
CHI-SQUARE TEST:
The chi-square test is used to determine whether there is a significant difference
between the expected frequencies and the observed frequencies in one or more categories.
Hence, it is non-parametric test of statistical significance, which compares observed
data with expected data and testing the null hypothesis, which states that there is no
significant difference between the expected and the observed result.
The Chi-square is computed by using the following formula.
Whether or not a calculated value of chi-square is significant, can be ascertained by
looking at the tabulated values of chi-square for given degree of freedom at a certain level of
significance (generally 5% level is taken). If calculated value of chi-square exceeds the table
value, the difference between the observed and expected frequencies is taken as significant
but if the table value is more than the calculated value, then the difference is considered as
insignificant. Insignificant value is considered to have arisen as a result of chance and as such
can be ignored.
SELF ASSESSEMENT
Fill in the blanks:
1 of measuring average is least affected by sampling fluctuation.
2 method of measuring average is most suited for open-end distribution.
3. In case of positively skewed distribution, the relationship between mean, median and
mode will be ……………………
4. In case of small sample ...................... statistical techniques is most appropriate.
5. The probability of type one error is called…………………….
SUMMARY:
Analysis refers to the computation of certain measures along with searching for pattern of relationship
that exist among data groups. Data analysis helps in structuring the findings from different sources of
data collection like survey research. It is also helpful in breaking a macro problem into micro parts.
Data analysis acts like filter when it comes to acquiring meaning insight out of huge data set. It
provides a meaningful base to critical decisions. Data analysis can be done by way of frequency

112
distribution, diagrams and graphs. The averages cannot alone describe adequately a set of
observations, unless all the observations are the same. It is necessary to describe the
variability or dispersion of the observation. In statistics Kurtosis refers, whether a frequency
distribution is more flat-topped or more peaked than the normal distribution.
Correlation is measure of association between two variables. The variables are not designed
as dependents or independent. Regression is a statistical device with the help of which we are
in a position to estimate the unknown values of one variable from known values of another
variable. The testing of hypothesis is a process of testing the significance of a parameter of the
population on the basis of sample. T-test, ANOVA, z-test, chi-square test etc. are used to test the
hypothesis.
GLOSSARY
Statistics – it can be defined as a collection of methods for planning experiments, obtaining
data, and then organizing, summarizing, presenting, analysing, interpreting and drawing
conclusions based on the data.
Parameters – it is characteristics of population based on all the units of the population or a
numerical measurement describing some characteristics of a population.
Probability – probability is a measure quantifying the likelihood that events will occurs.
Probability quantifies as a number between 0 and 1, where, roughly speaking, 0 indicates
impossibility and 1 indicates certainty.
ANSWERS OF SELF ASSESSMENT QUESTIONS:
1. Mean 2. Median 3. Mean >Median>Mode 4. T. Distribution 5.level of
significant.
TERMINAL QUESTIONS:
• What do you mean by Data Analysis? What considerations are taken into account while
analyzing data?
• Discuss the different methods of Data Analysis.
• What is Hypothesis? Discuss the procedure for testing Hypothesis.

113
• Explain the concept of correlation and regression? Discuss the difference between correlation
and regression.
• Discuss the application of t-test, z-test and chi-square test.
• Define the term ‘Measure of dispersion’. What are various methods of measuring dispersion?
SUGGESTED READINGS:
• Bhandarkar, P.L. and Wilkinson, T.S. Methodology and Techniques of Social
Research.
• Dubin, Robert, Theory Building New York; MacMillan Publishing Co., Quoted in W
Emory, Business Research Methods.
• Gupta, S.P. Statistical Method, Sultan Chand and Sons, New Delhi.
• Kothari, C.R. Research Methodology-Methods and Techniques, Whishwa
Prakashan, New Delhi.
• Panneerselvam, R. Research Methodology, Prentice-Hall of India Pvt. Ltd., New
Delhi.

114
LESSON-VII
INTERPRETATION AND REPORT WRITING
Structure
Objectives
Introduction
Interpretation
Need of Interpretation
Technique of Interpretation
Precautions in Interpretation
Report Writing
Types of Reports
Guidelines for Writing a Report
Layout of the Research Report
Different Steps in Writing Report
Significance of Report Writing
Mechanics of Writing a Research Report
Self Assessment
Summary
Glossary
Answers of Self Assessment Questions
Terminal Questions:
Suggested Readings:
OBJECTIVES:
After studying this lesson, students will be able to
115
• interpret the results of analysis,
• know the technique of interpretation and precaution to be taken at the time of interpretation,
• know how report is written,
• know about the guidelines for writing a report and layout of the research report,
• understand the significance of report writing, and
• mechanics of writing a research report.
INTRODUCTION:
Interpretation is the process of making sense of numerical data that has been
collected, analyzed, and presented. A common method of assessing numerical data is known
as statistical analysis, and the activity of analyzing and interpreting data in order to
make predictions is known as inferential statistics. After collecting and analyzing the data,
the researcher has to accomplish the task of drawing inferences followed by report writing.
Only through interpretation that the researcher can expose relations and processes that
underlie his findings. All this analytical information and consequential inference(s) may well
be communicated, preferably through research report, to the consult of research results who
may be either an individual or a group of individuals or some public private organization.
INTERPRETATION:
Interpretation refers to the task of drawing inferences from the collected facts after an
analytical and or experimental study. In fact, it is a search for broader meaning of research
findings. The task of interpretation has two major aspects viz., the effort to establish
continuity in research through linking the results of a given study with those of another, and
the establishment of some explanatory concepts. “In one sense, interpretation is concerned
with relationships within the collected data, partially overlapping analysis. Interpretation also
extends beyond the data of the study to inch the results of other research, theory and
hypotheses. ” Thus interpretation is the device through which the factors that seem to explain
what has been observed by researcher in the course of the study can be better understood and
it also provides a theoretical conception which can serve as a guide for further researches.
NEED OF INTERPRETATION:

116
Interpretation is essential for the simple reason that the usefulness and utility of
research findings lies in proper interpretation. It is being considered a basic component of
research process because of the followings reasons:
• Interpretation leads to the establishment of explanatory concepts that can serve as a
guide for future research studies; it opens new avenues of intellectual adventure and
stimulates the quest for more knowledge.
• Researcher can better appreciate only through interpretation why his findings are what
they are and can make others to understand the real significance of his research
findings.
• It is through interpretation that the researcher can well understand the abstract
principle that works beneath his findings. Through this ha can link up his findings
with those of other studies, having the same abstract principle, and they can predict
about the concrete world of events. Fresh inquiries can test these predictions later on.
This way the continuity in research can be maintained.
• The interpretation of the findings of exploratory research study often results into
hypotheses for experimental research and as such interpretation is involved in the
transition from exploratory to experimental research. Since an exploratory study does
not have a hypothesis to start with, the findings of such a study have to be interpreted
on a post-factum basis in which case the interpretation is technically described as ‘post-
factum’ interpretation.
TECHNIQUE OF INTERPRETATION:
Technique of Interpretation often involves the following steps:
(i) Researcher must give reasonable explanations of the relations which he has found and
he must interpret the lines of relationship in terms of the underlying processes and
must try to find out the thread of uniformity that lies under the surface layer of his
diversified research findings. In fact this is the technique of how generalization should
be done and concepts to be formulated. In fact this is the technique of how
generalization should be done and concepts to be formulated.
(ii) Extraneous information, if collected during the study, must be considered while
interpreting the final results of research study, for it may prove to be a key factor in
understanding the problem under consideration.

117
(iii) It is advisable, before embarking upon final interpretation, to consult someone having
insight into the study and who is frank and honest and will not hesitate to point out
omissions and errors in logical argumentation. Such a consultation will result in
correct interpretation and, thus, will enhance the utility of research results.
(iv) Researcher must accomplish the task of interpretation only after considering all
relevant factors affecting the problem to avoid false generalization. He must be in no
hurry while interpreting results, for quite often the conclusions, which appear to be all
right at the beginning, may not at all be accurate.
PRECAUTIONS IN INTERPRETATION:
One should always remember that even if the data are properly collected and
analyzed, wrong interpretation would lead to inaccurate conclusions. It is therefore;
absolutely essential that the task of interpretation be accomplished with patience in an
impartial manner and also in correct perspective. Researcher must pay attention to the
following points for correct interpretation:
• (a) the data are appropriate, trustworthy and adequate for drawing inferences; (b) the
data reflect good homogeneity; and that (c) proper analysis has been done through
statistical methods.
• The researcher must remain cautious about the errors that can possibly arise in the
process of interpreting results. He should be well equipped with and must know the
correct use of statistical measures for drawing inferences concerning his study.
• Interpretation is intertwined with analysis and cannot be distinctly separated.
• He must never lose sight of the fact that his task is not only to make sensitive
observations of relevant occurrences, but also to identify and disengage the factors
that are initially hidden to the eye. This will enable him to do his job of interpretation
on proper lines. Broad generalization should be avoided as most research is not amen-
able to it because the coverage may be restricted to a particular time, a particular area
and particular conditions. Such restrictions, if any, must invariably be specified and
the results must be framed within their limits.
• The researcher must remember that “ideally in the course of a research study, there
should be constant interaction between initial hypothesis, empirical observation and
theoretical conceptions. It is exactly in this area of interaction between theoretical

118
orientation and empirical observation that opportunities for originality and creativity
lie.” He must pay special attention to this aspect while engaged in the task of
interpretation.
REPORT WRITING:
A Report may be defined as a document in which a given problem is examined for the
purpose of conveying information, reporting findings, putting forward ideas and, sometimes,
making recommendations.
The purpose of conducting a research is to come out with inferences and suggestions.
Generally, a research involves utilization of different types of resources and results in
significant cost of conducting it. Hence, the outcome of research should be well documented
in the form of a research report for implementation and future use. The design and
presentation of the research report involves a pre-specified sequence of steps.
TYPES OF REPORTS:
Research reports vary greatly in length and type. In each individual case, both the
length and the form are largely dictated by the problems at hand. For instance, business firms
prefer reports in the letter form, just one or two pages in length. Banks, insurance
organisations and financial institutions are generally fond of the short balance-sheet type of
tabulation for their annual reports to their customers and shareholders. Mathematicians prefer
to write the results of their investigations in the form of algebraic notations. Students of
literature usually writs long reports presenting the critical analysis of some writer or period or
the like with a liberal use of quotations from the works of the author under discussion. A
research report can be classified into decision-oriented (technical) report and popular report
Decision-oriented (Technical) Report
The technical report is generally intended for other researchers, or for research
managers. The report should enable another researcher to critique methodology, check
calculations and accuracy and to follow everything which is done on a step-by-step basis. In
the technical report the main emphasis is on (i) the methods employed (ii) assumptions made
in the course of study, (iii) the detailed presentations of the findings including their
limitations and supporting data.
The steps of preparing technical report are presented below:

119
• Identification of the problem
• Establishment objectives
• Generation of decision alternatives
• Evaluation of decision alternatives
• Selection of the best decision alternative
• Development of action plan
• Provision for correct plan after implementation of the decision.
Problem identification is the process of selecting a problem which will give very good
pay-off in terms of value addition to the organization. The objectives or criteria of the
decision problem should be listed and finally a meaningful combination of the objective is to
be selected by taking the ground realities of the decision environment into account. The
objective / criteria of the decision problem can be fulfilled/ achieved by many ways. The
researcher should list all the meaningful decision alternatives of achieving the set of criteria
for the decision problem. Then, the best combination of the decision alternatives is to be
selected such that the value/ pay-off of the decision is maximized. The next step is to draw an
action plan to implement the selected set of decision alternatives to achieve the objectives of
the decision problem. Sometimes, there is deviation from the action plan while implementing
the decision alternatives. So, the decision maker should be proved with contingency plan of
tackling such a situation.
The Popular Report
The popular report is intended for a more general audience, one that is not that
conversant with the detail of research methods and terminology. Compared to the technical
report, the presentation will be a bit more lively with increased attention to headlines, flow
diagrams, charts, tables and occasional summaries for the purpose of stressing major points.
GUIDELINES FOR WRITING A REPORT:
Researcher who are affective in report writing agree that there are a series of
guidelines which should be followed. Such guidelines can be enumerated as under:
• Consider the Audience: Make the report clear, use only words familiar to the readers
and defined all technical terms. To make the comparison of figures easier, use

120
percentages, rounded off figures, ranks or ratios; put the exact data in a table within
the text or in the appendix.
• Address the information Needs: Remember the research report is designed to
communicate information to decision makers. Make sure that it clearly relates the
research findings to the objectives of the management.
• Be Concise, Yet Complete: Most managers will not want to read about the details of
a research report. Knowing what to include and what to leave out is a difficult task. It
is up to you, the researcher, to take into account the information needs of the decision
maker when writing your report.
• Be Objective: You will probably face at least one situation in which you know that
the client will not easily accept the results. The findings may be conflict with the
decision makers experience and judgment or they may reflect unfavorable on the
wisdom of previous decisions. In these circumstances, there is a strong temptation to
start the report by making the result more acceptable to the management. A
professional researcher, however, will present the research findings in an objective
manner and will present the research findings in an objective manner and will defend
their validity if they are challenged by the client.
• Style: The style of writing a research report is important because it shows a way of
presentation. Here are a few a tips to help you write a report that is easy to read.
• Use short words and sentences.
• Be concise.
• Use the active voice
• Consider appearance-space makes a long report easier to read.
• Avoid clichés.
• Write in present tense.
LAYOUT OF THE RESEARCH REPORT:
There is scientific method for the layout of research report. The layout of research
report means as to what the research report should contain. The contents of the research
report are noted below:

121
• Preliminary Page
• Main Text
• End Matter
(1) Preliminary Pages
These must be title of the research topic and data. There must be preface of foreword
to the research work. It should be followed by table of contents. The list of tables, maps
should be given.
(2) Main Text
It provides the complete outline of research report along with all details. The title
page is reported in the main text. Details of text are given continuously as divided in different
chapters.
(a) Introduction
(b) Statement of the problem
(c) The analysis of data
(d) The implications drawn from the results
(e) The summary
Introduction
Its purpose is to introduce the research topic to readers. It must cover statement of the
research problem, hypotheses, objectives of study, review of literature, and the methodology
to cover primary and secondary data, limitations of study and chapter scheme. Some may
give in brief in the first chapter the introduction of the research project highlighting the
importance of study. This is followed by research methodology in separate chapter.
The methodology should point out the method of study, the research design and
method of data collection.
Statement of the problem
This is crux of his research. It highlights main theme of his study. It must be in
nontechnical language. It should be in simple manner so ordinary reader may follow it. The
social research must be made available to common man. The research in agricultural
problems must be easy for farmers to read it.

122
Analysis of data
Data so collected should be presented in systematic manner and with its help,
conclusions can be drawn. This helps to test the hypothesis. Data analysis must be made to
confirm the objectives of the study.
Implications of Data
The results based on the analysis of data must be valid. This is the main body of
research. It contains statistical summaries and analysis of data. There should be logical
sequence in the analysis of data. The primary data may lead to establish the results. He must
have separate chapter on conclusions and recommendations. The conclusions must be based
on data analysis. The conclusions must be such which may lead to generalization and its
applicability in similar circumstances. The conditions of research work limiting its scope for
generalization must be made clear by the researcher.
Summary
This is conclusive part of study. It makes the reader to understand by reading
summary the knowledge of the research work. This is also a synopsis of study.
End Matter
It covers relevant appendices covering general information, the concepts and
bibliography. The index may also be added to the report.
DIFFERENT STEPS IN WRITING REPORT:
The usual steps involved in writing report are:
• Logical analysis of the subject matter.
• Preparation of the final outline.
• Preparation of the rough draft.
• Rewriting and polishing.
• Preparation of the final bibliography.
• Writing the final draft.
Logical analysis of the subject matter

123
It is the first step which is primarily concerned with the development of a subject.
There are two ways in which to develop a subject (a) logically and (b) chronologically. The
logical development is made on the basis of mental connections and associations between the
one thing and another by means of analysis. Chronological development is based on a
connection or sequence in time or occurrence. The directions for doing or making something
usually follow the chronological order.
Preparation of the final outline
It is next step in writing the research report “Outlines are the framework upon which
long written works are constructed. They are an aid to the logical organization of the material
and a reminder of the points to be stressed in the report.
Preparation of the rough draft
This follows the logical analysis of the subject and the preparation of the final
outlines. Such a step is of utmost importance for the researchers now sit to write down what
he has done in the context of his research study. He will write down the procedure adopted by
him in collecting the material for his study along with various limitations faced by him, the
technique of analysis adopted by him, the broad findings and generalizations and the various
suggestions he wants to offer regarding the problem concerned.
Rewriting and polishing of the rough draft
This step happens to be most difficult part of all formal writing. Usually this step
require more time than the writing of the rough draft. The careful revision makes the
difference between a mediocre and a good piece of writing. While rewriting and polishing,
one should check the report for weaknesses in logical development or presentation. The
researcher should also “see whether or not the material, as it is presented, has unity and
cohesion; does the report stand upright and firm and exhibit a definite pattern, like a marble
arch? Or does it resemble an old wall of moldering cement and loose brick.” In addition the
researcher should give due attention to the fact that in his rough draft he has been consistent
or not. He should check the mechanics of writing – grammar, spelling and usage.
Preparation of the final bibliography
Next in order comes the task of the preparation of the final bibliography. The
bibliography, which is generally appended to the research report, is a list of books in some
way pertinent to the research which has been done. It should contain all those works which

124
the researcher has consulted. The bibliography should be arranged alphabetically and may be
divided into two parts; the first part may contain the names of books and pamphlets, and the
second part may contain the names of magazine and newspaper articles.
Writing the final draft
This constitutes the last step. The final draft should be written in a concise and
objective style and in simple language, avoiding vague expressions such as “it seems”, “there
may be” and like ones. While writing the final draft, the researcher must avoid abstract
terminology and technical jargon. Illustrations and examples based on common experiences
must be incorporated in the final draft as they happen to be most effective in communicating
the research findings to others. A research report should not be dull, but must enthuse people
and maintain interest and must show originality. It must be remembered that every report
should be an attempt to solve some intellectual problem and must contribute to the solution of
a problem and must add to the knowledge of both the researcher and the research.
SIGNIFICANCE OF REPORT WRITING:
Research report is considered a major component of the research study for the
research task remains incomplete till the report has been presented and /or written. As a
matter of fact even the most brilliant hypothesis, highly well designed and conducted research
study, and the most striking generalizations and findings are of little value unless they are
effectively communicated to others. The purpose of research is not well served unless the
findings are made known to others. Research results must invariably enter the general store of
knowledge. All this explains the significance of writing research report. There are people
who do not consider writing of report as an integral part of the research process. But the
general opinion is in favour of treating the presentation of research results or the writing of
report as part and parcel of the research project. Writing of report is the last step in a research
study and requires a set of skills somewhat different from those called for in respect of the
earlier stages of research. This task should be accomplished by the researcher with utmost
care; he may seek the assistance and guidance of experts for the purpose.
MECHANICS OF WRITING A RESEARCH REPORT:
There are very definite and set rules which should be followed in the actual
preparation of the research report or paper. Once the techniques are finally decided, they
should be scrupulously adhered to, and no deviation permitted. The criteria of format should

125
be decided as soon as the materials for the research paper have been assembled. The
following points deserve mention so far as the mechanics of writing a report are concerned:
Size and physical design
The manuscript should be written on unruled paper 8 ½’’ × 11’’ in size.
A margin of at least one and one-half inches should be allowed at the left hand and of at least
half an inch at the right hand of the paper. There should also be one-inch margins, top and
bottom.
Treatment of Quotations
Quotations should be placed in quotation marks and double spaced, forming an
immediate part of the text. But if a quotation is of a considerable length (more than four or
five type written lines) then it should be single-spaced and indented at least half an inch to the
right of the normal text margin.
The Footnotes
Regarding footnotes one should keep in view the followings:
The footnotes serve two purposes viz., the identification of materials used in
quotations in the report and the notice of materials not immediately necessary to the body of
the research text but still of supplemental value. Footnotes are placed at the bottom of the
page on which the reference or quotation which they identify or supplement ends. Footnotes
should be numbered consecutively, usually beginning with in each chapter separately
Use of statistics, charts and graphs
Statistics are usually presented in the form of tables, charts, bars and line-graphs and
pictograms.
It should be suitable and appropriate looking to the problem at hand.
The final draft
Revising and rewriting the rough draft of the report should be done with great care
before writing the final draft. For the purpose, the researcher should put to himself questions
like:
Are the sentences written in the report clear? Are they grammatically correct?
Do the various points incorporated in the report fit together logically?
Preparation of the index

126
At the end of the report, an index should invariably be given, the value of which lies
in the fact that it acts as a good guide, to the reader. Index may be prepared both as subject
index and as author index. The index should always be arranged alphabetically.
SELF ASSESSMENT
State whether the following statements are true or false:
1. Interpretation is the process of making sense of numerical data that has been
collected, analyzed, and presented.
2. Logical analysis of the subject matter is the first step in report writing.
3. The layout of research report means as to what the research report should contain.
Fill in the blanks:
4 ............................. constitutes the last step in report writing.
5. Interpretation leads to the establishment of ......................... concepts that can serve as a
guide for future research studies.
SUMMARY:
Interpretation refers to the task of drawing inferences from the collected facts after an analytical and
or experimental study. The task of interpretation has two major aspects viz. the effort. It establish
continuity in research through linking the results of given study with those of another and the
establishment of some explanatory concepts. At the time of interpretation, the researcher must take
certain precautions.
A report is prepared after interpretation of data. It is defined as a document in which a given problem
is examined for the purpose of conveying information, report findings, putting forward ideas and
sometimes making recommendations. A research report can be classified into decision oriented report
and popular report. In the popular report, the main emphasis is on the methods employed, assumptions
made in the course of study and the detailed presentation of the findings including their limitations
and supporting data. The popular report is intended detail of research methods and terminology.
The contests of the research report must include preliminary pages, main text and the end matter.
Different steps involved in report writing are:
• Logical analysis of the subject matter
• Preparation of the final outline
• Preparation of the rough draft

127
• Rewriting and polishing
• Preparation of the final bibliography
• Writing the final draft
The following points deserve mention as for as the mechanics of writing a report are concerned.
• Size and physical design
• Treatment of quotations
• The footnotes
• Use of statistics, charts and graphs
• The final draft
Preparation of the index
7.15. GLOSSARY
Post factum – means occurring after the fact, or ex post facto design is a quasi-experimental
study examining how an independent variable, present prior to the study in the participants,
affects a dependent variable.
Quotation- quoting means repeating the author’s exact words. In some disciplines, such as
literary studies and history, quoting is used frequently to support the argument.
Generalisation – which is an act of reasoning that involves drawing broad inferences from
particular observations, is widely-acknowledged as a quality standard in quantitative research
but more controversial in qualitative research.
ANSWERS OF SELF ASSESSMENT QUESTIONS:
1. True 2.True 3.True 4.Final draft 5.Explanatory.
TERMINAL QUESTIONS:
1. Define the term interpretation? Discuss the technique of interpretation.
2. What is report writing? Discuss the different types of reports.
3. Discuss the guidelines to be taken in to account for writing a report.

128
4. Explain the layout of the research report.
SUGGESTED READINGS:
• Bhandarkar, P.L. and Wilkinson, T.S. Methodology and Techniques of Social
Research.
• Dubin, Robert, Theory Building New York; MacMillan Publishing Co., Quoted in W
Emory, Business Research Methods.
• Gupta, S.P. Statistical Method, Sultan Chand and Sons.
• Kothari, C.R. Research Methodology-Methods and Techniques, Whishwa
Prakashan.
• Panneerselvam, R. Research Methodology, Prentice-Hall of India Pvt. Ltd., New
Delhi.

129
ASSIGENMENTS –
Attempt any four-
1. What is Research? Explain the various steps in the research process?
2. Explain the Research Design? Discuss the different types of Research Designs?
3. How would you proceed to construct a Likert scale? Give its advantages and disadvantages?
4. What do you mean by questionnaire? What is the difference between questionnaire and
schedule?
5. Define the term sampling? Discuss in brief probability and non probability methods of
sampling? Also explain various sampling and non sampling errors?
6. Discuss the application of t-test, z-test and chi-square test?
7. Explain the concept of correlation and regression? Discuss the difference between correlation
and regression?
8. What is report writing? Discuss the guidelines to be taken in to account for writing a report?


![jkti=] fgekpy izns'k - Rajpatra of Himachal Pradesh](https://img.pdfslide.net/doc/110x75/6333bca53108fad7760f316e/jkti-fgekpy-iznsk-rajpatra-of-himachal-pradesh-1682140886.jpg)