Embed Size (px)
Citation preview
Scottish Natural Heritage Research Report No. 1069
Lowland deer management: assessing the delivery of public interests
R E S E A R C H R E P O R T
Research Report No. 1069
Lowland deer management: assessing the
delivery of public interests
For further information on this report please contact:
Paul Roberts Scottish Natural Heritage Strathallan House Castle Business Park STIRLING FK9 4TZ Telephone: 01738 458839 E-mail: [email protected]
This report should be quoted as: McMorran, R., Gibson-Poole, S. & Hamilton, A. 2019. Lowland deer management: assessing the delivery of public interests. Scottish Natural Heritage Research Report No. 1069.
This report, or any part of it, should not be reproduced without the permission of Scottish Natural Heritage. This permission will not be withheld unreasonably. The views expressed by the author(s) of this report should not be taken as the views and policies of Scottish Natural Heritage.
© Scottish Natural Heritage 2019.
i
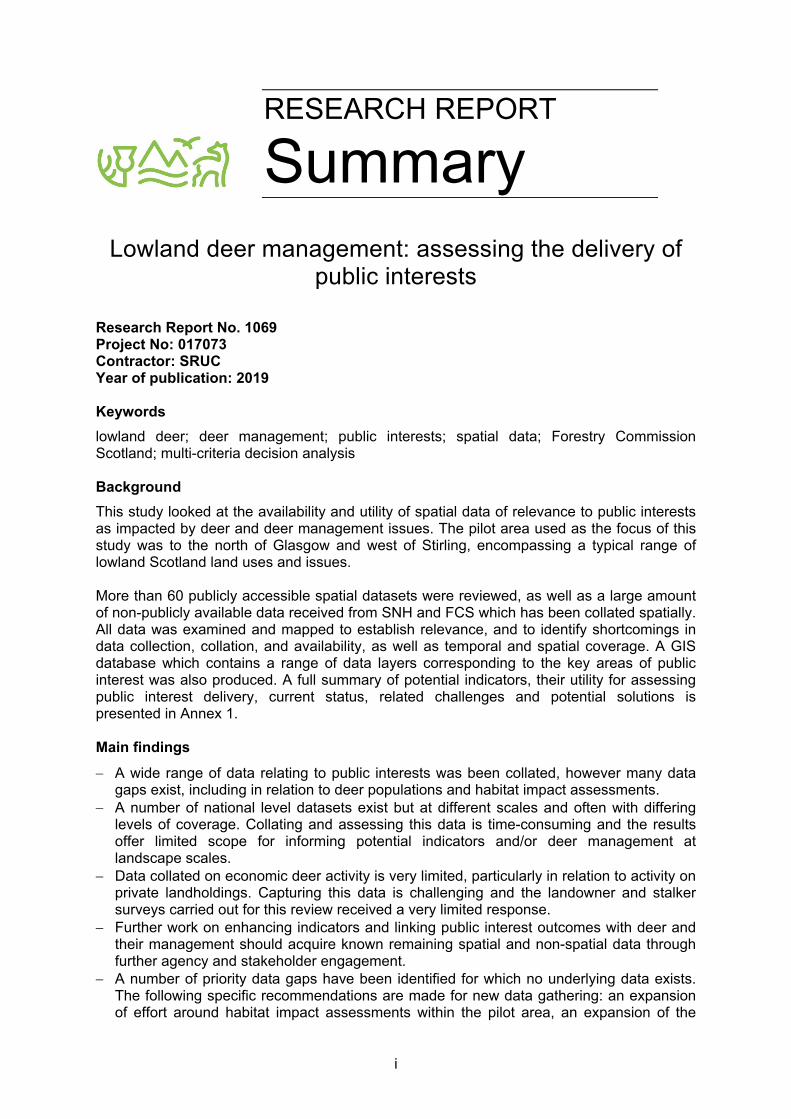
Lowland deer management: assessing the delivery of public interests
Research Report No. 1069 Project No: 017073 Contractor: SRUC Year of publication: 2019 Keywords
lowland deer; deer management; public interests; spatial data; Forestry Commission Scotland; multi-criteria decision analysis Background
This study looked at the availability and utility of spatial data of relevance to public interests as impacted by deer and deer management issues. The pilot area used as the focus of this study was to the north of Glasgow and west of Stirling, encompassing a typical range of lowland Scotland land uses and issues. More than 60 publicly accessible spatial datasets were reviewed, as well as a large amount of non-publicly available data received from SNH and FCS which has been collated spatially. All data was examined and mapped to establish relevance, and to identify shortcomings in data collection, collation, and availability, as well as temporal and spatial coverage. A GIS database which contains a range of data layers corresponding to the key areas of public interest was also produced. A full summary of potential indicators, their utility for assessing public interest delivery, current status, related challenges and potential solutions is presented in Annex 1. Main findings
A wide range of data relating to public interests was been collated, however many data gaps exist, including in relation to deer populations and habitat impact assessments.
A number of national level datasets exist but at different scales and often with differing levels of coverage. Collating and assessing this data is time-consuming and the results offer limited scope for informing potential indicators and/or deer management at landscape scales.
Data collated on economic deer activity is very limited, particularly in relation to activity on private landholdings. Capturing this data is challenging and the landowner and stalker surveys carried out for this review received a very limited response.
Further work on enhancing indicators and linking public interest outcomes with deer and their management should acquire known remaining spatial and non-spatial data through further agency and stakeholder engagement.
A number of priority data gaps have been identified for which no underlying data exists. The following specific recommendations are made for new data gathering: an expansion of effort around habitat impact assessments within the pilot area, an expansion of the
RESEARCH REPORT
Summary
ii
requirements (questions) within the Deerline system and adding a question to the June Agricultural Census on deer management and or/deer impacts.
Engaging stakeholders is a key way to capture new data and a stakeholder workshop and a revised landowner survey is recommended in any second phase of this work. The role of citizen science as a potential mechanism for recording information relating to deer should be considered.
The development of modelling approaches to support decision making for deer management is challenging, in particular due to the data gaps. However spatial Multi-Criteria Decision Analysis (MCDA) could be used to identify areas of susceptibility to deer impacts.
For further information on this project contact: Paul Roberts, Scottish Natural Heritage,Strathallan House, Castle Business Park, Stirling, FK9 4TZ.
Tel: 01738 458839 or [email protected] For further information on the SNH Research & Technical Support Programme contact:
Research Coordinator, Scottish Natural Heritage, Great Glen House, Leachkin Road, Inverness, IV3 8NW. Tel: 01463 725000 or [email protected]
iii
Table of Contents Page
1. INTRODUCTION, AIMS AND OBJECTIVES 1 1.1 Project aim and objectives 2
2. METHODOLOGY – DATA COLLATION AND IDENTIFYING INDICATORS 3
3. THE PILOT AREA 5
4. POTENTIAL INDICATORS OF KEY PUBLIC INTERESTS 6 4.1 Designated sites 6 4.2 Woodland expansion 9 4.3 Native woodland condition and herbivore impact 12 4.4 Peatland extent (carbon storage) 15 4.5 Economic activity (costs and benefits) relating to deer management 18 4.5.1 Deer vehicle collisions 18 4.5.2 Deer impacts on forestry and agriculture 22 4.5.3 Deer management (culling) effort and stalking activity 25 4.5.4 The venison supply chain 30 4.6 Deer population: direct counts 33
5. CONCLUSIONS AND RECOMMENDATIONS 36 5.1 Key conclusions - methodological critique and key data gaps 36 5.2 Capture of remaining existing spatial and non-spatial data 37 5.2.1 Inter-agency working and direct engagement with GIS teams 37 5.3 Future data gathering priorities 38 5.3.1 Stakeholder engagement and citizen science 38 5.3.2 Modelling to support future decision making on deer management
priorities 39
6. REFERENCES 41
ANNEX 1: POTENTIAL INDICATORS FOR ASSESSING THE DELIVERY OF PUBLIC INTERESTS WITHIN THE PILOT SITE OF RELEVANCE TO DEER MANAGEMENT 43
ANNEX 2: PART 1 - DATA LAYER INVESTIGATION OVERVIEW 47
ANNEX 2: PART 2 - DATA LAYER CREATION PROCESSING STEPS 58
ANNEX 3: PART 1 - MODELLING SPECIFIC CONSIDERATIONS 70
ANNEX 4: PART 1 - LANDOWNER SURVEY 71
ANNEX 4: PART 2 - STALKER SURVEY 74

iv
Acknowledgements The authors would like to thank all the individuals and organisations (listed in Annex 1) that kindly provided data or advice regarding this project, as well as advice from the project steering group.
1
1. INTRODUCTION, AIMS AND OBJECTIVES
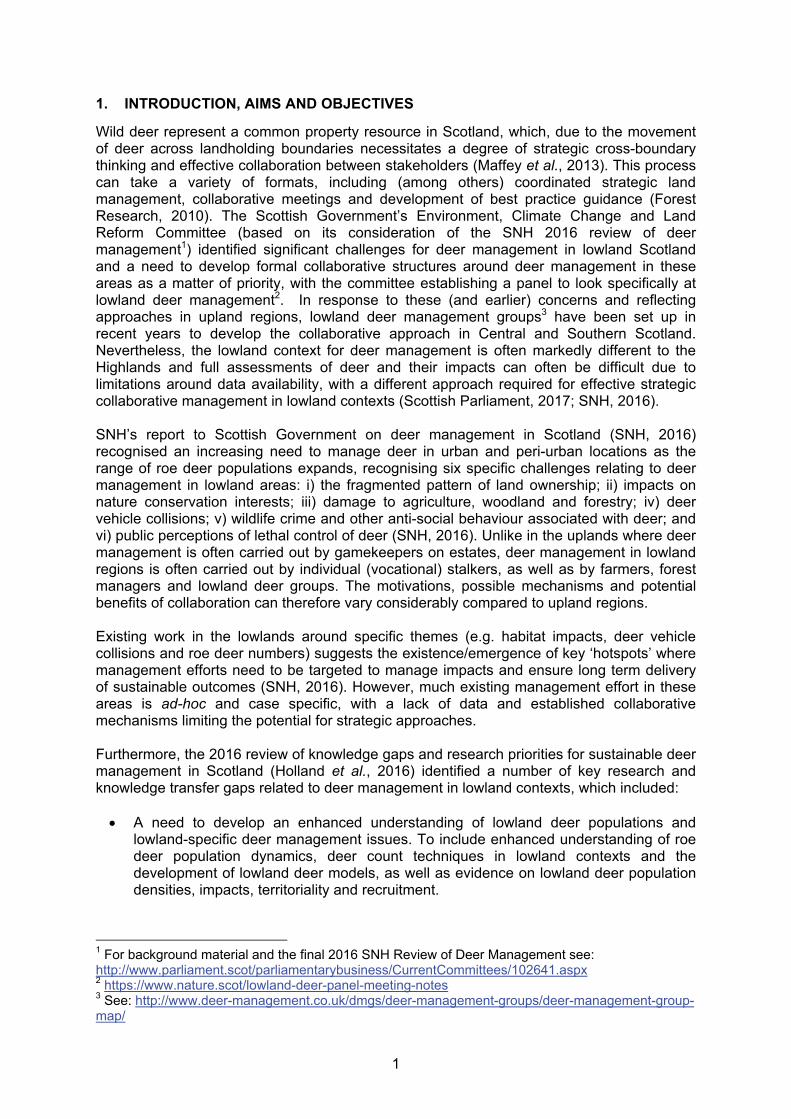
Wild deer represent a common property resource in Scotland, which, due to the movement of deer across landholding boundaries necessitates a degree of strategic cross-boundary thinking and effective collaboration between stakeholders (Maffey et al., 2013). This process can take a variety of formats, including (among others) coordinated strategic land management, collaborative meetings and development of best practice guidance (Forest Research, 2010). The Scottish Government’s Environment, Climate Change and Land Reform Committee (based on its consideration of the SNH 2016 review of deer management1) identified significant challenges for deer management in lowland Scotland and a need to develop formal collaborative structures around deer management in these areas as a matter of priority, with the committee establishing a panel to look specifically at lowland deer management2. In response to these (and earlier) concerns and reflecting approaches in upland regions, lowland deer management groups3 have been set up in recent years to develop the collaborative approach in Central and Southern Scotland. Nevertheless, the lowland context for deer management is often markedly different to the Highlands and full assessments of deer and their impacts can often be difficult due to limitations around data availability, with a different approach required for effective strategic collaborative management in lowland contexts (Scottish Parliament, 2017; SNH, 2016). SNH’s report to Scottish Government on deer management in Scotland (SNH, 2016) recognised an increasing need to manage deer in urban and peri-urban locations as the range of roe deer populations expands, recognising six specific challenges relating to deer management in lowland areas: i) the fragmented pattern of land ownership; ii) impacts on nature conservation interests; iii) damage to agriculture, woodland and forestry; iv) deer vehicle collisions; v) wildlife crime and other anti-social behaviour associated with deer; and vi) public perceptions of lethal control of deer (SNH, 2016). Unlike in the uplands where deer management is often carried out by gamekeepers on estates, deer management in lowland regions is often carried out by individual (vocational) stalkers, as well as by farmers, forest managers and lowland deer groups. The motivations, possible mechanisms and potential benefits of collaboration can therefore vary considerably compared to upland regions. Existing work in the lowlands around specific themes (e.g. habitat impacts, deer vehicle collisions and roe deer numbers) suggests the existence/emergence of key ‘hotspots’ where management efforts need to be targeted to manage impacts and ensure long term delivery of sustainable outcomes (SNH, 2016). However, much existing management effort in these areas is ad-hoc and case specific, with a lack of data and established collaborative mechanisms limiting the potential for strategic approaches. Furthermore, the 2016 review of knowledge gaps and research priorities for sustainable deer management in Scotland (Holland et al., 2016) identified a number of key research and knowledge transfer gaps related to deer management in lowland contexts, which included: A need to develop an enhanced understanding of lowland deer populations and
lowland-specific deer management issues. To include enhanced understanding of roe deer population dynamics, deer count techniques in lowland contexts and the development of lowland deer models, as well as evidence on lowland deer population densities, impacts, territoriality and recruitment.
1 For background material and the final 2016 SNH Review of Deer Management see: http://www.parliament.scot/parliamentarybusiness/CurrentCommittees/102641.aspx 2 https://www.nature.scot/lowland-deer-panel-meeting-notes 3 See: http://www.deer-management.co.uk/dmgs/deer-management-groups/deer-management-group-map/
2
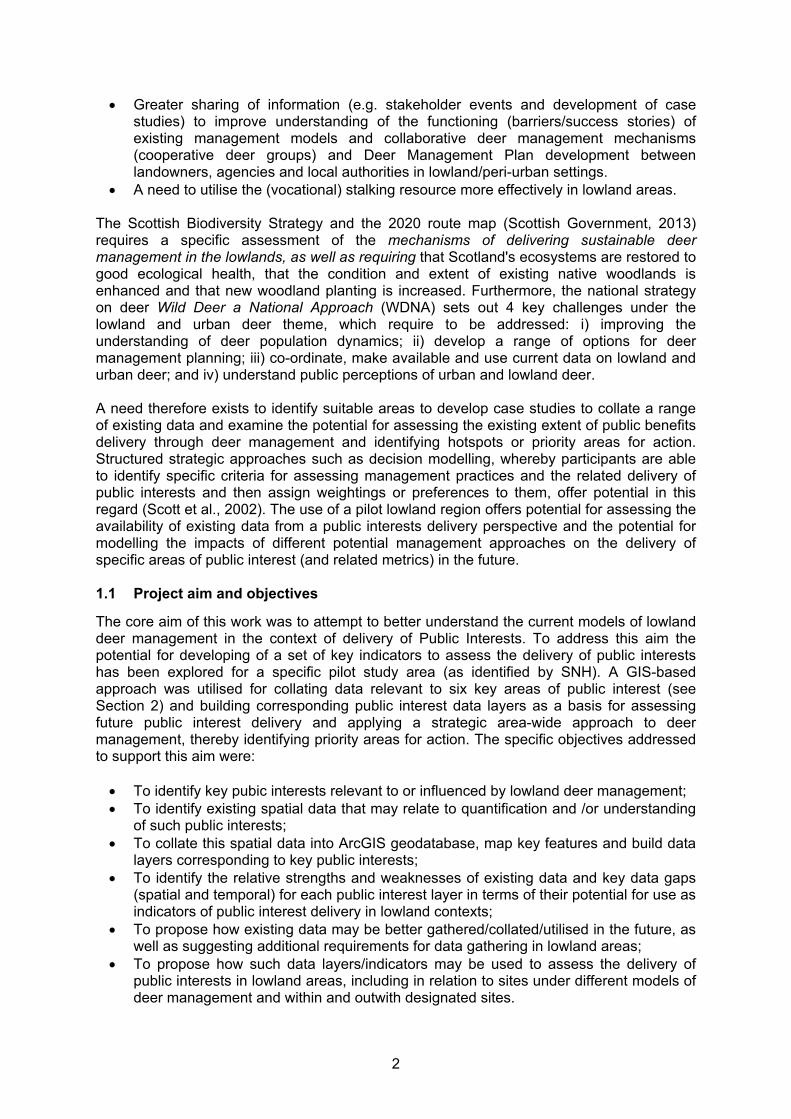
Greater sharing of information (e.g. stakeholder events and development of case studies) to improve understanding of the functioning (barriers/success stories) of existing management models and collaborative deer management mechanisms (cooperative deer groups) and Deer Management Plan development between landowners, agencies and local authorities in lowland/peri-urban settings.
A need to utilise the (vocational) stalking resource more effectively in lowland areas. The Scottish Biodiversity Strategy and the 2020 route map (Scottish Government, 2013) requires a specific assessment of the mechanisms of delivering sustainable deer management in the lowlands, as well as requiring that Scotland's ecosystems are restored to good ecological health, that the condition and extent of existing native woodlands is enhanced and that new woodland planting is increased. Furthermore, the national strategy on deer Wild Deer a National Approach (WDNA) sets out 4 key challenges under the lowland and urban deer theme, which require to be addressed: i) improving the understanding of deer population dynamics; ii) develop a range of options for deer management planning; iii) co-ordinate, make available and use current data on lowland and urban deer; and iv) understand public perceptions of urban and lowland deer. A need therefore exists to identify suitable areas to develop case studies to collate a range of existing data and examine the potential for assessing the existing extent of public benefits delivery through deer management and identifying hotspots or priority areas for action. Structured strategic approaches such as decision modelling, whereby participants are able to identify specific criteria for assessing management practices and the related delivery of public interests and then assign weightings or preferences to them, offer potential in this regard (Scott et al., 2002). The use of a pilot lowland region offers potential for assessing the availability of existing data from a public interests delivery perspective and the potential for modelling the impacts of different potential management approaches on the delivery of specific areas of public interest (and related metrics) in the future. 1.1 Project aim and objectives
The core aim of this work was to attempt to better understand the current models of lowland deer management in the context of delivery of Public Interests. To address this aim the potential for developing of a set of key indicators to assess the delivery of public interests has been explored for a specific pilot study area (as identified by SNH). A GIS-based approach was utilised for collating data relevant to six key areas of public interest (see Section 2) and building corresponding public interest data layers as a basis for assessing future public interest delivery and applying a strategic area-wide approach to deer management, thereby identifying priority areas for action. The specific objectives addressed to support this aim were: To identify key pubic interests relevant to or influenced by lowland deer management; To identify existing spatial data that may relate to quantification and /or understanding
of such public interests; To collate this spatial data into ArcGIS geodatabase, map key features and build data
layers corresponding to key public interests; To identify the relative strengths and weaknesses of existing data and key data gaps
(spatial and temporal) for each public interest layer in terms of their potential for use as indicators of public interest delivery in lowland contexts;
To propose how existing data may be better gathered/collated/utilised in the future, as well as suggesting additional requirements for data gathering in lowland areas;
To propose how such data layers/indicators may be used to assess the delivery of public interests in lowland areas, including in relation to sites under different models of deer management and within and outwith designated sites.
3
2. METHODOLOGY – DATA COLLATION AND IDENTIFYING INDICATORS
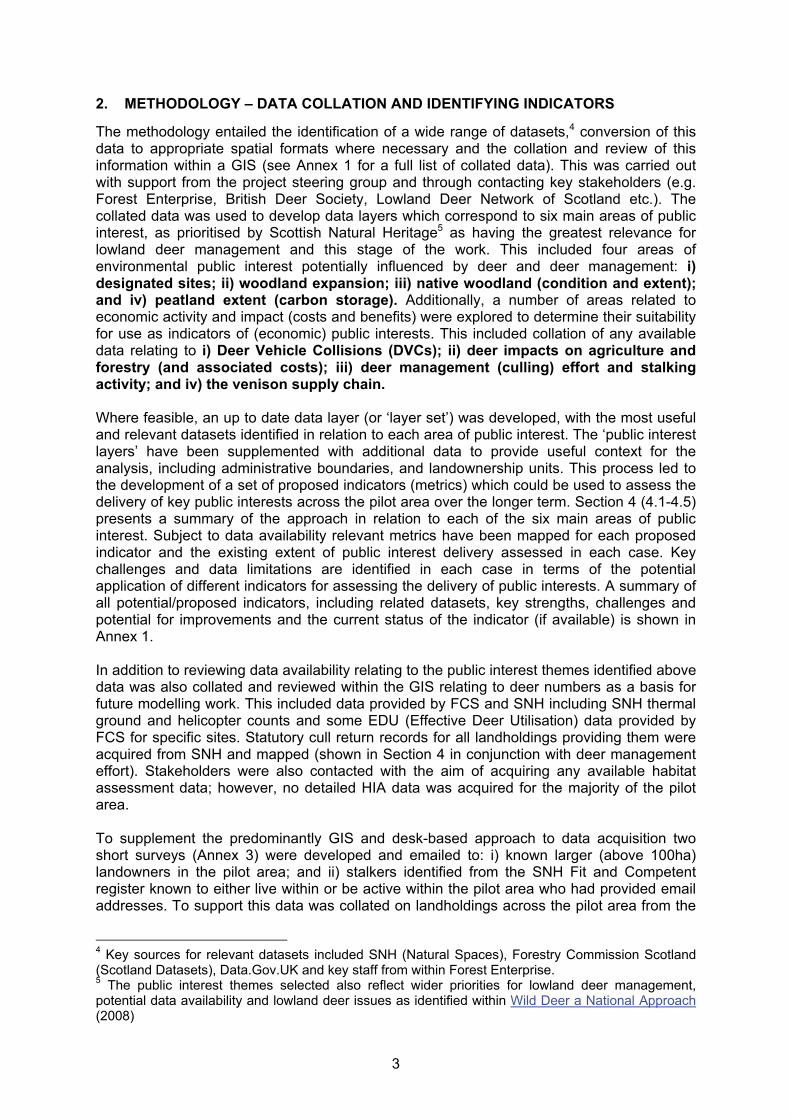
The methodology entailed the identification of a wide range of datasets,4 conversion of this data to appropriate spatial formats where necessary and the collation and review of this information within a GIS (see Annex 1 for a full list of collated data). This was carried out with support from the project steering group and through contacting key stakeholders (e.g. Forest Enterprise, British Deer Society, Lowland Deer Network of Scotland etc.). The collated data was used to develop data layers which correspond to six main areas of public interest, as prioritised by Scottish Natural Heritage5 as having the greatest relevance for lowland deer management and this stage of the work. This included four areas of environmental public interest potentially influenced by deer and deer management: i) designated sites; ii) woodland expansion; iii) native woodland (condition and extent); and iv) peatland extent (carbon storage). Additionally, a number of areas related to economic activity and impact (costs and benefits) were explored to determine their suitability for use as indicators of (economic) public interests. This included collation of any available data relating to i) Deer Vehicle Collisions (DVCs); ii) deer impacts on agriculture and forestry (and associated costs); iii) deer management (culling) effort and stalking activity; and iv) the venison supply chain. Where feasible, an up to date data layer (or ‘layer set’) was developed, with the most useful and relevant datasets identified in relation to each area of public interest. The ‘public interest layers’ have been supplemented with additional data to provide useful context for the analysis, including administrative boundaries, and landownership units. This process led to the development of a set of proposed indicators (metrics) which could be used to assess the delivery of key public interests across the pilot area over the longer term. Section 4 (4.1-4.5) presents a summary of the approach in relation to each of the six main areas of public interest. Subject to data availability relevant metrics have been mapped for each proposed indicator and the existing extent of public interest delivery assessed in each case. Key challenges and data limitations are identified in each case in terms of the potential application of different indicators for assessing the delivery of public interests. A summary of all potential/proposed indicators, including related datasets, key strengths, challenges and potential for improvements and the current status of the indicator (if available) is shown in Annex 1. In addition to reviewing data availability relating to the public interest themes identified above data was also collated and reviewed within the GIS relating to deer numbers as a basis for future modelling work. This included data provided by FCS and SNH including SNH thermal ground and helicopter counts and some EDU (Effective Deer Utilisation) data provided by FCS for specific sites. Statutory cull return records for all landholdings providing them were acquired from SNH and mapped (shown in Section 4 in conjunction with deer management effort). Stakeholders were also contacted with the aim of acquiring any available habitat assessment data; however, no detailed HIA data was acquired for the majority of the pilot area. To supplement the predominantly GIS and desk-based approach to data acquisition two short surveys (Annex 3) were developed and emailed to: i) known larger (above 100ha) landowners in the pilot area; and ii) stalkers identified from the SNH Fit and Competent register known to either live within or be active within the pilot area who had provided email addresses. To support this data was collated on landholdings across the pilot area from the
4 Key sources for relevant datasets included SNH (Natural Spaces), Forestry Commission Scotland (Scotland Datasets), Data.Gov.UK and key staff from within Forest Enterprise. 5 The public interest themes selected also reflect wider priorities for lowland deer management, potential data availability and lowland deer issues as identified within Wild Deer a National Approach (2008)
4
Who Owns Scotland website and SNH’s Deer Management Units dataset. These surveys were carried out with the aim of generating additional data in relation to the areas of public interest relating to socio-economic factors, including employment relating to deer, costs and income related to deer management and the existing levels of activity relating to deer management (commercial or otherwise) on landholdings. The return rates for both surveys were low (particularly for the landowner survey), with limited additional information provided, particularly via the landowners survey. Where any additional relevant data was provided this has been incorporated within Section 4.5. The cull returns data (see Section 4.5.4) was acquired from SNH at a late stage in the project (after the surveys had ended); however, this dataset provides a more useful starting point for contacting and surveying landowners actively involved in deer management in the future. A final aspect of the project involved assessing the data and proposed indicators in relation to the potential for future modelling (e.g. multi-criteria decision analysis) of key indicators in relation to deer populations. In particular the potential for identifying potential ‘hotspots’ where multiple public interest factors may be threatened (e.g. impact on native woodlands, woodland expansion potential and designated sites) is explored. The limitations of the collated data for future modelling are identified and potential for improvements identified, together with a review of the potential application of the proposed indicators in relation to assessing how outcomes vary across different deer management models (e.g. FCS rangers, commercial sporting, private syndicates/recreational etc.) in the future.
5
3. THE PILOT AREA
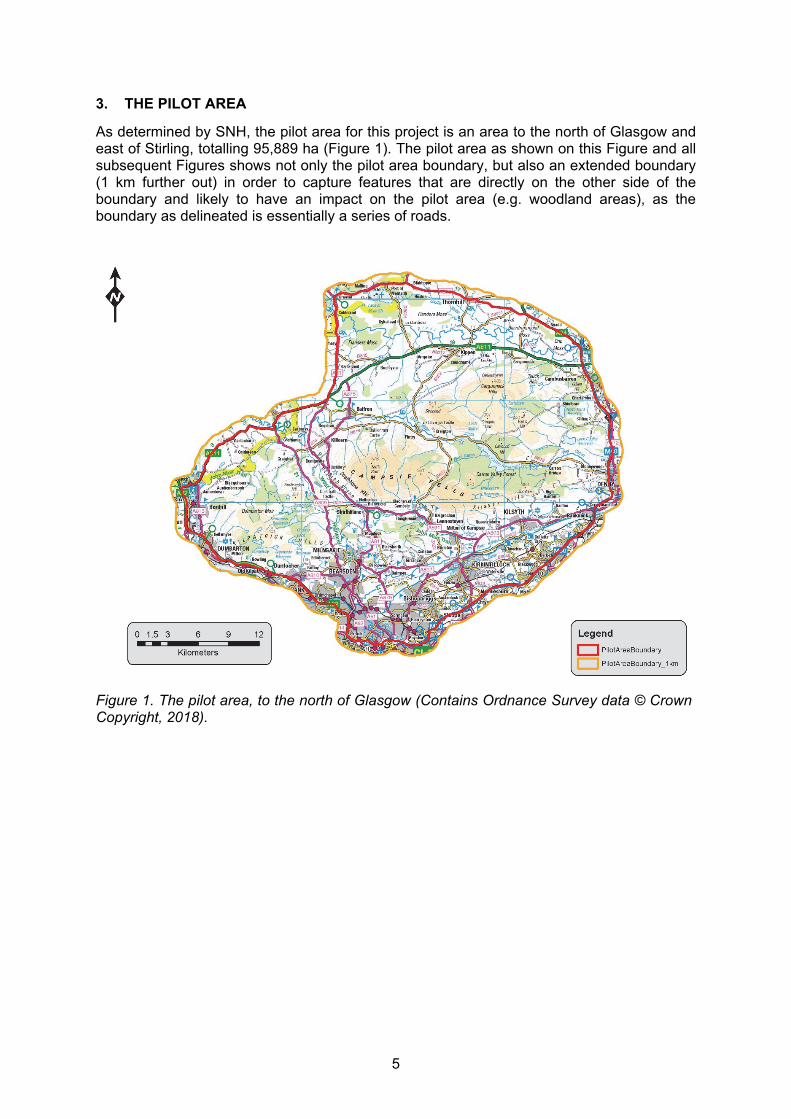
As determined by SNH, the pilot area for this project is an area to the north of Glasgow and east of Stirling, totalling 95,889 ha (Figure 1). The pilot area as shown on this Figure and all subsequent Figures shows not only the pilot area boundary, but also an extended boundary (1 km further out) in order to capture features that are directly on the other side of the boundary and likely to have an impact on the pilot area (e.g. woodland areas), as the boundary as delineated is essentially a series of roads.
Figure 1. The pilot area, to the north of Glasgow (Contains Ordnance Survey data © Crown Copyright, 2018).
6
4. POTENTIAL INDICATORS OF KEY PUBLIC INTERESTS
This section presents a summary of the findings for each selected area of public interest and the related ‘public interest layer’. The findings contained here should were also submitted to SNH as a GIS database. In total over sixty publicly accessible spatial datasets were reviewed, as well as a large amount of non-publicly available data received from SNH and FCS which has been collated spatially. Annex 2 provides a comprehensive list of reviewed data and further background on the collation and the GIS-based processes. All data was examined and mapped to establish relevance, and to identify shortcomings in data collection, collation, and availability, as well as temporal and spatial coverage. The most relevant datasets and information sources for each proposed indicator has been identified. In a number of cases the underlying reviewed data was particularly limited, including in relation to habitat impact assessments and the economic costs of deer management at the level of the pilot area. 4.1 Designated sites
Designated sites condition monitoring represents an established national-level mechanism for assessing change in Scotland’s natural heritage over time.6 To collate and map all relevant designated sites and local nature reserves the layers shown in Table 1 were processed and joined. Sites where deer are recorded as a pressure (on at least one site feature) are indicated7 (Figure 2), with information on all pressures on all site features and their condition (favourable/unfavourable) incorporated within the pilot database.
Table 1. Designated sites and nature reserves in the pilot area.
Dataset name & abbreviation Notes NS SSSI Scotland (NSSSSI)
Spatial extent of areas designated as Sites of Special Scientific Interest (SSSI).
NS SPA Scotland (NSSPA)
Spatial extent of areas designated as Special Protection Areas (SPA).
NS SAC Scotland (NSSAC)
Spatial extent of areas designated as Special Areas of Conservation (SAC).
NS RAMSAR Scotland (NSRAMSAR)
Spatial extent of wetlands designated as Ramsar (RAMSAR) sites.
NS NNR Scotland (NSNNR)
Spatial extent of National Nature reserves (NNR).
NS LNR Scotland (NSLNR)
Spatial extent of Local Nature reserves (LNR).
NGO Woodland Trust Sites (NGOWT)
Spatial extent of Woodland Trust reserves.
NGO SWT Reserves (NGOSWT)
Spatial extent of Scottish Wildlife Trust (SWT) reserves.
NGO RSPB Reserves Scotland (NGORSPB)
Spatial extent of Royal Society for the Protection of Birds (RSPB) reserves.
NGO NTS Property (NGONTS)
Spatial extent of land managed by the National Trust for Scotland (NTS).
NS SNH Land Scotland (NSSNHOL)
Spatial extent of land owned by SNH.
The current spatial extent of designated sites within the pilot area along with indications of pressure from deer browsing are show in the PROJECT_ DesignatedSites layer within the GIS database. Additionally, the extent of local nature reserves are shown in the
6 See: https://www.nature.scot/professional-advice/safeguarding-protected-areas-and-species/protected-areas/site-condition-monitoring 7 As acquired from SNH’s Sitelink website: https://gateway.snh.gov.uk/sitelink/
7
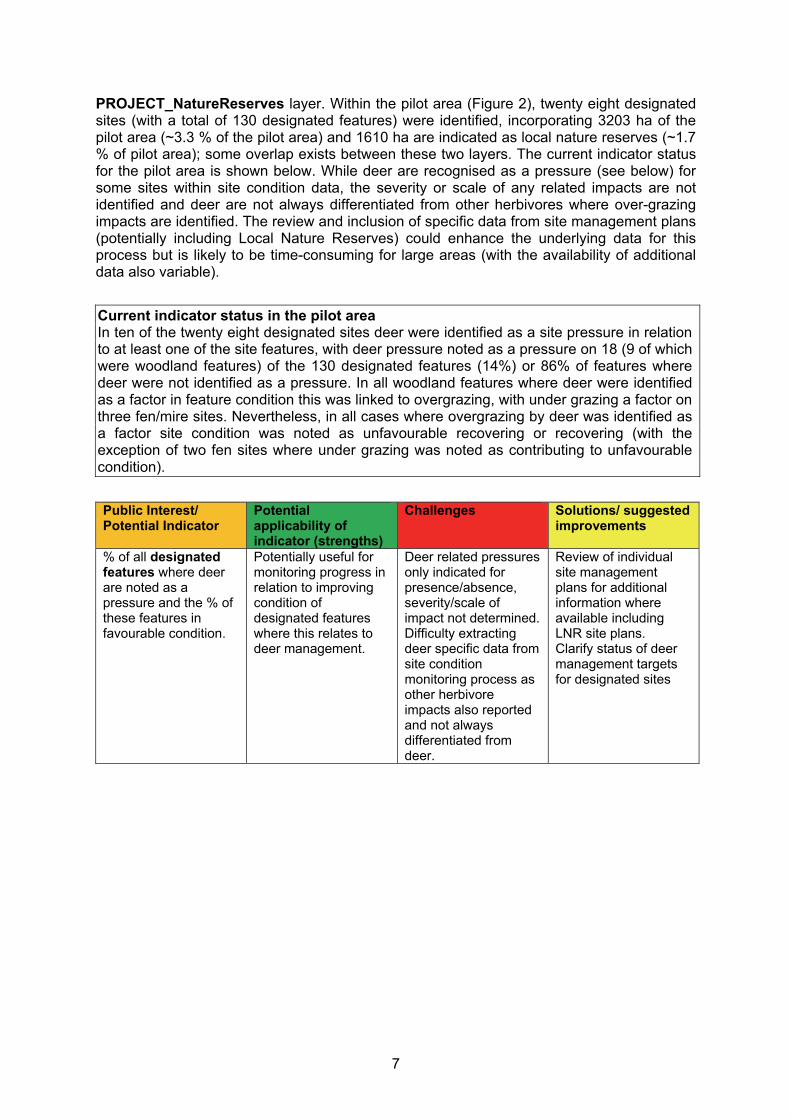
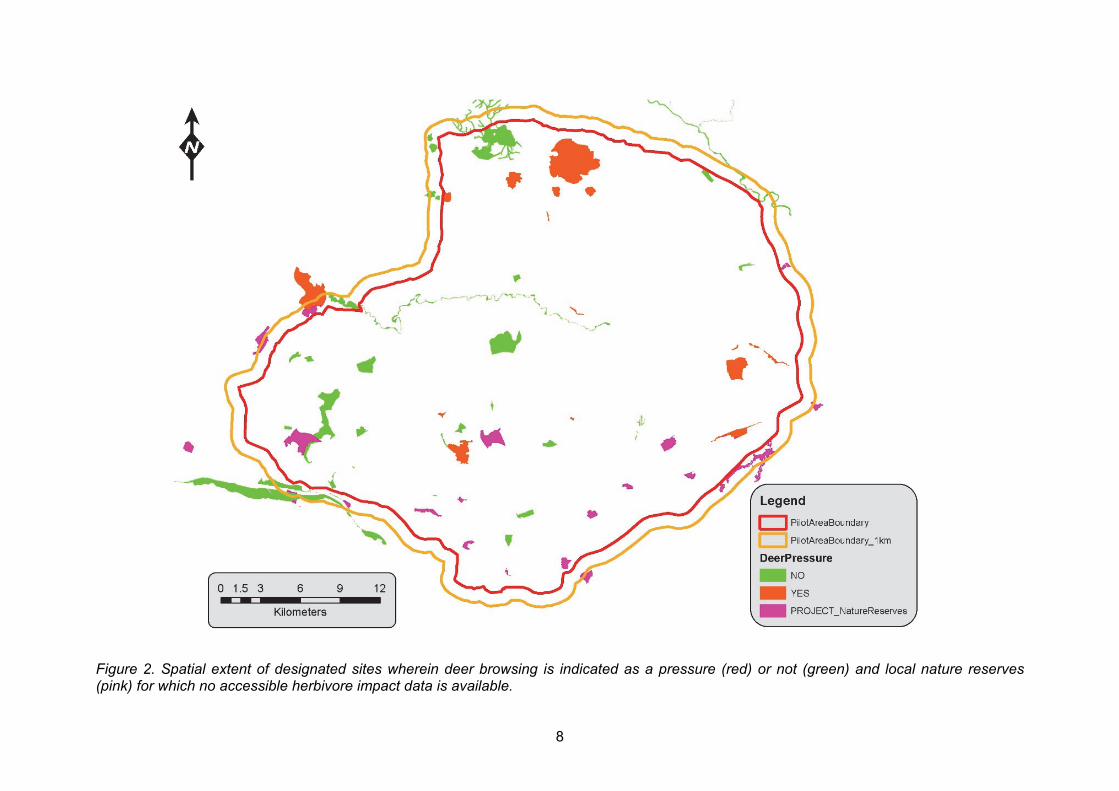
PROJECT_NatureReserves layer. Within the pilot area (Figure 2), twenty eight designated sites (with a total of 130 designated features) were identified, incorporating 3203 ha of the pilot area (~3.3 % of the pilot area) and 1610 ha are indicated as local nature reserves (~1.7 % of pilot area); some overlap exists between these two layers. The current indicator status for the pilot area is shown below. While deer are recognised as a pressure (see below) for some sites within site condition data, the severity or scale of any related impacts are not identified and deer are not always differentiated from other herbivores where over-grazing impacts are identified. The review and inclusion of specific data from site management plans (potentially including Local Nature Reserves) could enhance the underlying data for this process but is likely to be time-consuming for large areas (with the availability of additional data also variable).
Current indicator status in the pilot area In ten of the twenty eight designated sites deer were identified as a site pressure in relation to at least one of the site features, with deer pressure noted as a pressure on 18 (9 of which were woodland features) of the 130 designated features (14%) or 86% of features where deer were not identified as a pressure. In all woodland features where deer were identified as a factor in feature condition this was linked to overgrazing, with under grazing a factor on three fen/mire sites. Nevertheless, in all cases where overgrazing by deer was identified as a factor site condition was noted as unfavourable recovering or recovering (with the exception of two fen sites where under grazing was noted as contributing to unfavourable condition).
Public Interest/ Potential Indicator
Potential applicability of indicator (strengths)
Challenges Solutions/ suggested improvements
% of all designated features where deer are noted as a pressure and the % of these features in favourable condition.
Potentially useful for monitoring progress in relation to improving condition of designated features where this relates to deer management.
Deer related pressures only indicated for presence/absence, severity/scale of impact not determined. Difficulty extracting deer specific data from site condition monitoring process as other herbivore impacts also reported and not always differentiated from deer.
Review of individual site management plans for additional information where available including LNR site plans. Clarify status of deer management targets for designated sites
8
Figure 2. Spatial extent of designated sites wherein deer browsing is indicated as a pressure (red) or not (green) and local nature reserves (pink) for which no accessible herbivore impact data is available.
9
4.2 Woodland expansion
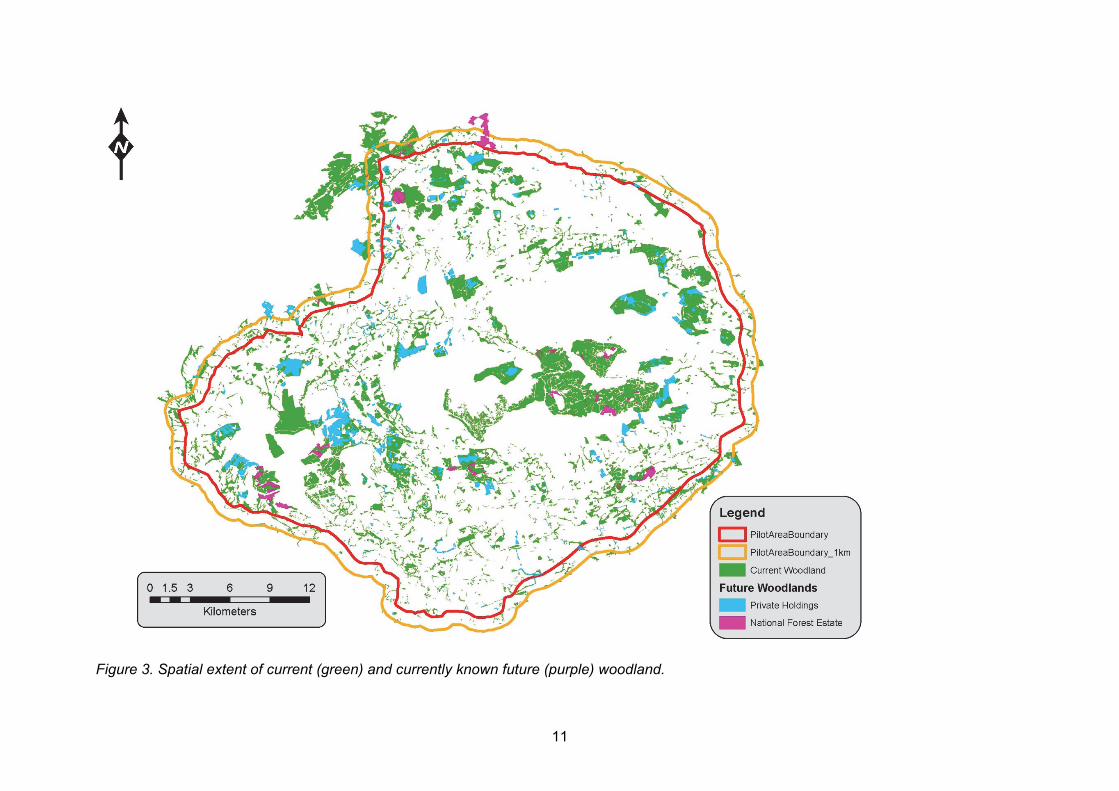
Continuing woodland expansion is an important Scottish Government objective for land use in Scotland8. Considerable potential exists for private landowners and land managers to contribute to this target through uptake of options for woodland establishment through the forestry establishment grants available under the Scottish Rural Development Programme. Woodland expansion represents an important area of public interest (including in relation to carbon sequestration but also wider multi-purpose benefits), which can be directly affected and inhibited by deer. Deer management is generally required as a component of woodland establishment (new planting, restocking and regeneration). However, a lack of woodland establishment and/or low rates of uptake of woodland creation options under the SRDP do not directly infer high deer densities or a lack of sustainable deer management in these areas. Nevertheless, successful recent expansion and natural regeneration is indicative of a sufficient level of deer management (or exclusion) in these areas (at least during the establishment phase) to facilitate woodland establishment. Additionally, knowledge of potential future woodland expansion can allow for identification of future pressure points for deer management. Furthermore, woodland represents a key habitat for deer, for cover when transitioning from one area to another and to rest in during the day, as well as a food resource. Scott & Palmer (2000) indicate that distance from woodland can affect the likely impact deer will have on agricultural crops. Likewise, the age and species that make up each parcel of woodland are key in understanding what effects any deer present are likely to have on woodland regeneration (Armstrong et al., 2003). The size of patches and their distribution in the landscape (including the habitat/crop type between patches) also influences deer behaviour. As such, as well as the potential for assessing woodland expansion as a public interest factor, mapping and quantifying recent and potential woodland expansion is an important part of developing an information base for modelling changes in deer movements and impacts over time. Five specific woodland datasets were identified as most relevant to determining the existing extent and composition of woodland and all recent and potential future woodland restocking and expansion in the pilot area (Table 2). These datasets were processed and joined (see Annex 2) to create two layers, one showing the current (including recently established woodlands) spatial extent of woodland (PROJECT_CurrentWoodland) and the other showing the spatial extent of currently known future or potential future woodland areas (PROJECT_FutureWoodlands)9 (see Figure 3). Where possible the species present and tree maturity is also shown. Importantly, the Woodland Creation Options dataset (used to determine potential future areas of expansion) consists of areas approved for woodland grants under the SRDP; however, in practice any actual resulting woodland expansion is subject to grant uptake by the relevant landowner and therefore uncertain. Additionally, woodland/species type related to woodland creation options and the potential for woodland creation options to contribute to a forest habitat network are not always clear.
8 The Scottish Forestry Strategy contains a specific aim to expand woodland cover in Scotland from the current level (17-18%) to 25% by 2050 (Scottish Government 2006). To achieve this a further 10,000 ha of woodland per year is required. 9 Areas identified as potential future woodlands include those from the woodland creation and regeneration datasets, areas from the NFI and NFE data identified as felled, low density etc. and areas from NWSS that are felled or low density. Ideally the FCS felling license application data (FCSFLA) should also have been added to the future woodlands dataset, however it contained multiple overlapping polygons for different license applications covering similar spatial extents. Therefore, this dataset would need to be cleaned and processed before the restock date information it contains would be useful.
10
Table 2. Woodland related data sets.
Dataset name & abbreviation Notes FCS National Forest Estate Woodland Scotland 2017 (FCSNFE)
National Forest Estate (updated yearly). Contains species and year of planting for each polygon and includes felled areas that could indicate areas of future planting.
FCS FGS1420 Woodland creation claims (FCSWCC)
Details of grant claims that have been planted (updated yearly), includes species and year of planting for each polygon.
FCS FGS1420 WIG Restoration Regeneration Claims (FCSWRRC)
Details of grant claims that have been planted (updated yearly), includes species and year of planting for each polygon.
FCS NWSS (FCSNWSS) Native Woodland Scotland Survey. A 2014 survey of native woodlands that contains detailed species and maturity information, as well as indications of browsing pressure.
FCS National Forest Inventory Scotland 2016 FCSNFI)
A Remotely sensed dataset (updated yearly) that indicates broad species information for each polygon, as well as indicating potential areas of new planting or felling that could indicate areas of future planting.
FCS Woodland Creation Options RDC (FCSWCO)
Details of areas identified as suitable for grant support under woodland grant schemes (areas identified as suitable for further expansion etc.). Dataset includes an indication of the woodland type (the FCSWCC is directly related to this dataset and details areas that have already been planted).
FCS FGS1420 WIG Restructuring Regeneration Options (FCSWRRO)
Details of areas identified as suitable for grant support for restructuring/regeneration (the FCSWRRC is directly related to this dataset and details areas that have already been planted).
Public Interest/ Potential Indicator
Potential applicability of indicator (strengths)
Challenges Solutions/ suggested improvements
Woodland expansion: Area (ha) of recent (5yrs) new (native and non-native) woodland establishment; Total area (ha) identified as woodland creation options and uptake of this over time.
Clear indication of recently woodland establishment and uptake of woodland creation options over time (past/future). Broadly indicative of possible future hotspot areas for deer management.
Not a direct indicator of sustainable deer management (lack of establishment/ low uptake does not infer unsustainable deer management; Uncertainty of uptake (or comparability) of woodland creation options; Lack of differentiation of woodland expansion by species or by potential for contributing to FHNs.
Assessment of new woodland creation in relation to FHN contribution (FCS Integrated Habitat Networks data); Assessment of uptake of woodland creation options against national levels;
Current indicator status in pilot area Within the pilot area (Figure 3), 15,368 ha are currently wooded (~16 % of pilot area) 3,379 ha are indicated as having potential to become woodlands (~3.5 % of pilot area) 15% (510 ha) of which is on FCS land and 85% of which is on non-FCS land. New planting in 2012-2017 confirmed as planted (from the NFE of woodland creation/regeneration claims data) accounts for 702 ha of woodland. The majority of this (65%) was on National Forest Estate land, with 35% on non-FCS land. The planting on the National Forest estate was dominated by conifer species (85%), with a more even split on non-FCS land of 56% conifer and 44% broadleaved species.
11
Figure 3. Spatial extent of current (green) and currently known future (purple) woodland.
12
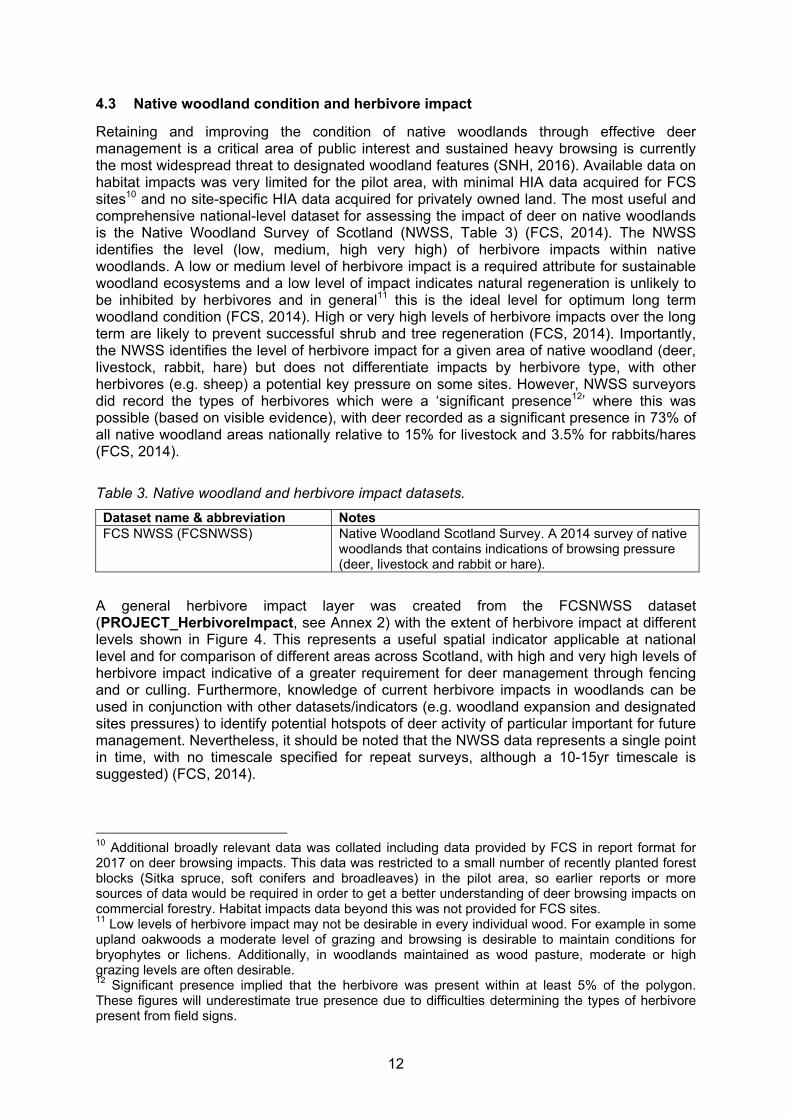
4.3 Native woodland condition and herbivore impact
Retaining and improving the condition of native woodlands through effective deer management is a critical area of public interest and sustained heavy browsing is currently the most widespread threat to designated woodland features (SNH, 2016). Available data on habitat impacts was very limited for the pilot area, with minimal HIA data acquired for FCS sites10 and no site-specific HIA data acquired for privately owned land. The most useful and comprehensive national-level dataset for assessing the impact of deer on native woodlands is the Native Woodland Survey of Scotland (NWSS, Table 3) (FCS, 2014). The NWSS identifies the level (low, medium, high very high) of herbivore impacts within native woodlands. A low or medium level of herbivore impact is a required attribute for sustainable woodland ecosystems and a low level of impact indicates natural regeneration is unlikely to be inhibited by herbivores and in general11 this is the ideal level for optimum long term woodland condition (FCS, 2014). High or very high levels of herbivore impacts over the long term are likely to prevent successful shrub and tree regeneration (FCS, 2014). Importantly, the NWSS identifies the level of herbivore impact for a given area of native woodland (deer, livestock, rabbit, hare) but does not differentiate impacts by herbivore type, with other herbivores (e.g. sheep) a potential key pressure on some sites. However, NWSS surveyors did record the types of herbivores which were a ‘significant presence12’ where this was possible (based on visible evidence), with deer recorded as a significant presence in 73% of all native woodland areas nationally relative to 15% for livestock and 3.5% for rabbits/hares (FCS, 2014).
Table 3. Native woodland and herbivore impact datasets.
Dataset name & abbreviation Notes FCS NWSS (FCSNWSS) Native Woodland Scotland Survey. A 2014 survey of native
woodlands that contains indications of browsing pressure (deer, livestock and rabbit or hare).
A general herbivore impact layer was created from the FCSNWSS dataset (PROJECT_HerbivoreImpact, see Annex 2) with the extent of herbivore impact at different levels shown in Figure 4. This represents a useful spatial indicator applicable at national level and for comparison of different areas across Scotland, with high and very high levels of herbivore impact indicative of a greater requirement for deer management through fencing and or culling. Furthermore, knowledge of current herbivore impacts in woodlands can be used in conjunction with other datasets/indicators (e.g. woodland expansion and designated sites pressures) to identify potential hotspots of deer activity of particular important for future management. Nevertheless, it should be noted that the NWSS data represents a single point in time, with no timescale specified for repeat surveys, although a 10-15yr timescale is suggested) (FCS, 2014).
10 Additional broadly relevant data was collated including data provided by FCS in report format for 2017 on deer browsing impacts. This data was restricted to a small number of recently planted forest blocks (Sitka spruce, soft conifers and broadleaves) in the pilot area, so earlier reports or more sources of data would be required in order to get a better understanding of deer browsing impacts on commercial forestry. Habitat impacts data beyond this was not provided for FCS sites. 11 Low levels of herbivore impact may not be desirable in every individual wood. For example in some upland oakwoods a moderate level of grazing and browsing is desirable to maintain conditions for bryophytes or lichens. Additionally, in woodlands maintained as wood pasture, moderate or high grazing levels are often desirable. 12 Significant presence implied that the herbivore was present within at least 5% of the polygon. These figures will underestimate true presence due to difficulties determining the types of herbivore present from field signs.
13
Public Interest/ Potential Indicator
Potential applicability of indicator (strengths)
Challenges Solutions/ suggested improvements
Native woodland condition and herbivore impacts: Area of native woodland (ha) affected by herbivore impacts (low-severe) and % of woodland where deer were a significant presence.
Useful spatial indicator of herbivore impact which can be used to identify area requiring further future deer management. Potential linkage with woodland expansion/ designated sites to map hotspots.
Impacts not linked to specific herbivore types. NWSS is time specific/limited. No coverage of herbivore impacts in non-native woodlands.
Repeat surveys for NWSS in shorter (5-7yr) timescale. Acquire site-specific data on habitat impacts (in native and non-native woodlands) and incorporate within indicator assessment.
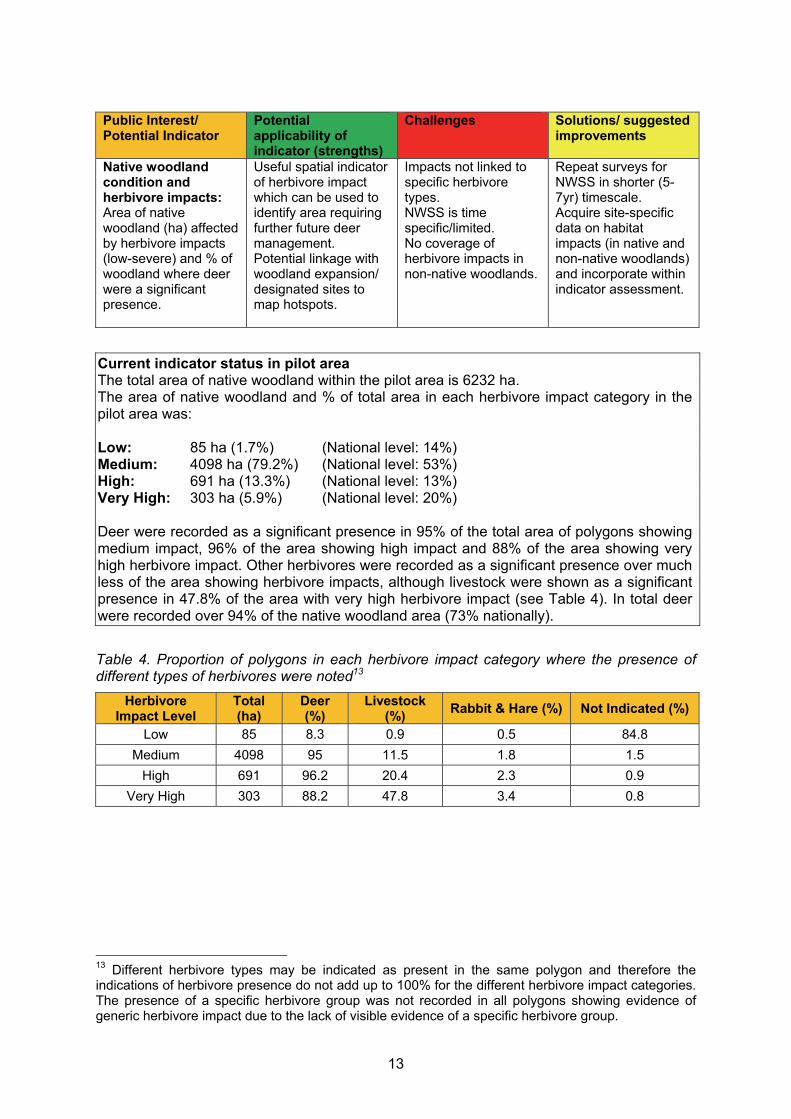
Current indicator status in pilot area The total area of native woodland within the pilot area is 6232 ha. The area of native woodland and % of total area in each herbivore impact category in the pilot area was: Low: 85 ha (1.7%) (National level: 14%) Medium: 4098 ha (79.2%) (National level: 53%) High: 691 ha (13.3%) (National level: 13%) Very High: 303 ha (5.9%) (National level: 20%) Deer were recorded as a significant presence in 95% of the total area of polygons showing medium impact, 96% of the area showing high impact and 88% of the area showing very high herbivore impact. Other herbivores were recorded as a significant presence over much less of the area showing herbivore impacts, although livestock were shown as a significant presence in 47.8% of the area with very high herbivore impact (see Table 4). In total deer were recorded over 94% of the native woodland area (73% nationally).
Table 4. Proportion of polygons in each herbivore impact category where the presence of different types of herbivores were noted13
Herbivore Impact Level
Total (ha)
Deer (%)
Livestock (%)
Rabbit & Hare (%) Not Indicated (%)
Low 85 8.3 0.9 0.5 84.8
Medium 4098 95 11.5 1.8 1.5
High 691 96.2 20.4 2.3 0.9
Very High 303 88.2 47.8 3.4 0.8
13 Different herbivore types may be indicated as present in the same polygon and therefore the indications of herbivore presence do not add up to 100% for the different herbivore impact categories. The presence of a specific herbivore group was not recorded in all polygons showing evidence of generic herbivore impact due to the lack of visible evidence of a specific herbivore group.
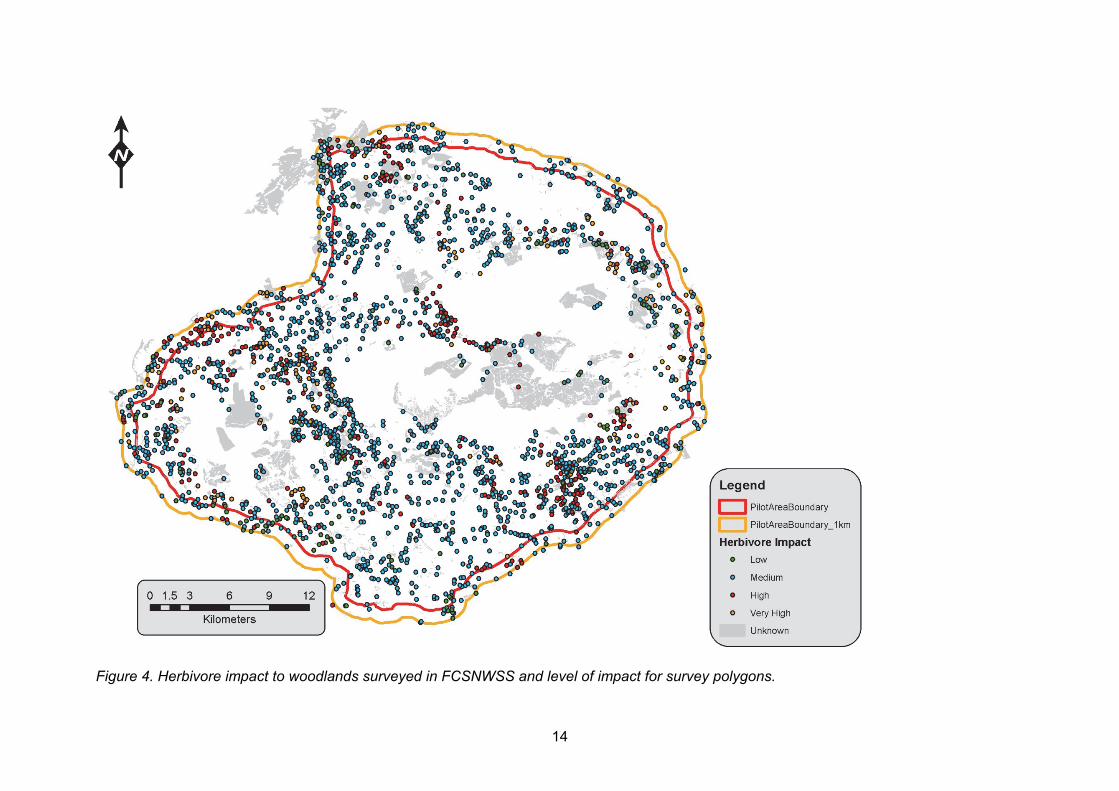
14
Figure 4. Herbivore impact to woodlands surveyed in FCSNWSS and level of impact for survey polygons.
15
4.4 Peatland extent (carbon storage)
Peatlands and peaty soils (and the resultant semi-natural vegetation) are acknowledged as not only a conservation priority, but increasingly as being important for carbon sequestration and storage at a national level14. However, the ability of a peat or peaty-soil habitat to fulfil these priorities depends on a variety of factors, including historical management, current management, and climate change. In terms of deer impact, where excessive browsing occurs this can be to the detriment of key plant species, and can alter the composition of the vegetation community. Alternatively, appropriate browsing pressure can help maintain habitat condition and prevent tree colonisation of vulnerable (particularly historically drained) sites. In addition, the impacts of deer movement can impact particularly on peat, and increase erosion potential. Both of these impacts can alter the ability of the overall ecosystem to either sequester carbon, or continue to store carbon already sequestered. Deer management therefore has the potential for impacting on peat habitats and carbon storage over the long term.
Table 5. Peatland related datasets.
Dataset name & abbreviation Notes NS Peat Scotland Shows spatial extent of peatland, classified into blanket bog,
heather moorland etc. heavily based on the Land Cover Scotland 1988 dataset.
NS Peat Wind Scotland Shows spatial extent of Class 1 and 2 peatland areas (national important carbon rich soils).
NS Peat Depth Scotland Point data on peat depth, limited application here. Designated sites feature pressures (PROJECT_DesignatedSites)
Amalgamated dataset detailing spatial extent of all SSSI, SAC, SPA and RAMSAR sites.
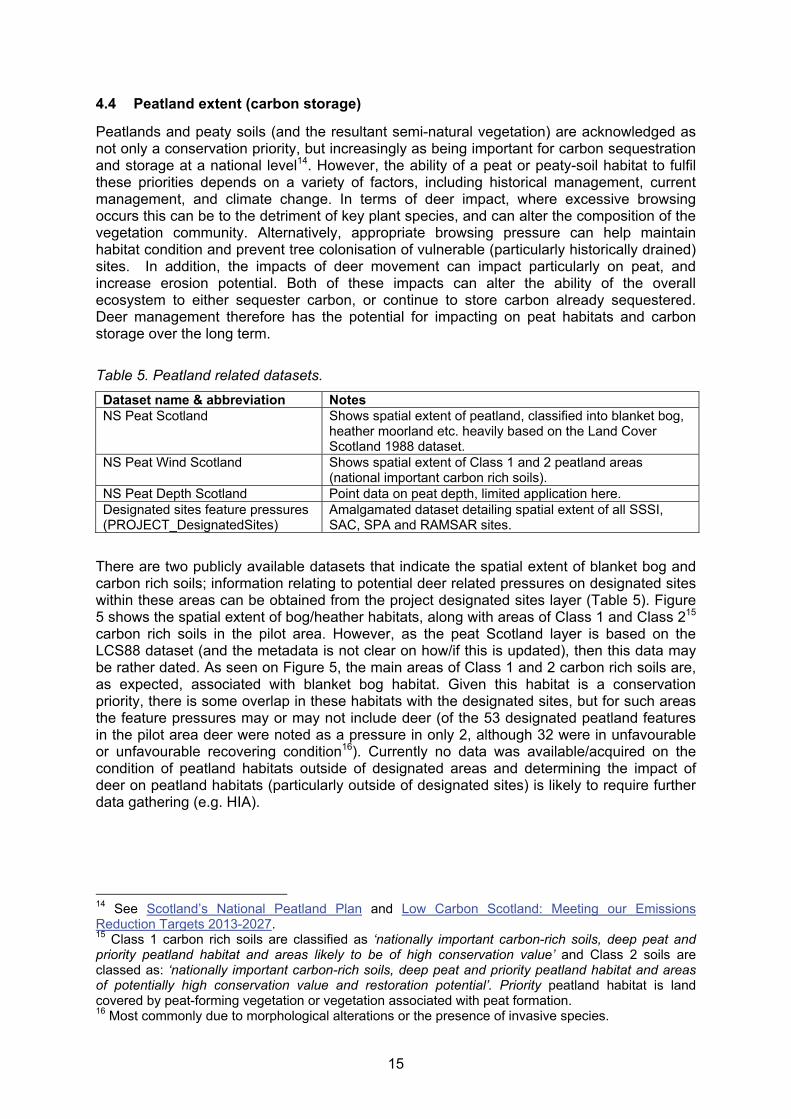
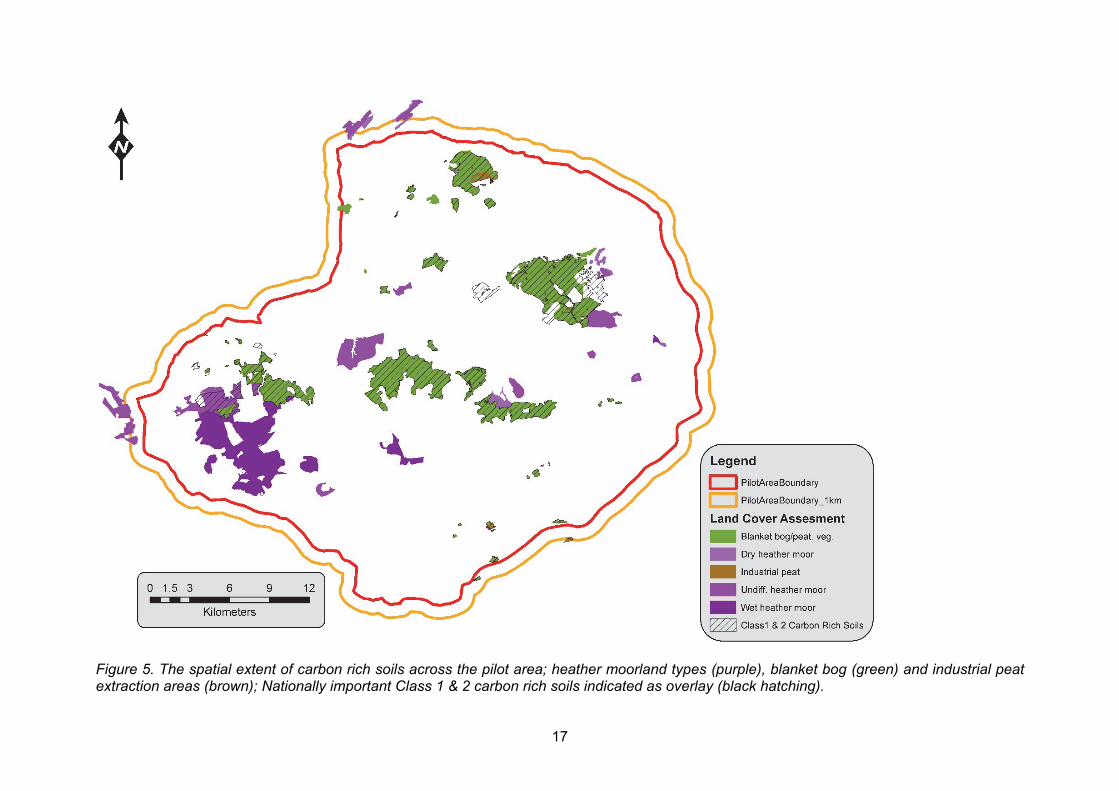
There are two publicly available datasets that indicate the spatial extent of blanket bog and carbon rich soils; information relating to potential deer related pressures on designated sites within these areas can be obtained from the project designated sites layer (Table 5). Figure 5 shows the spatial extent of bog/heather habitats, along with areas of Class 1 and Class 215 carbon rich soils in the pilot area. However, as the peat Scotland layer is based on the LCS88 dataset (and the metadata is not clear on how/if this is updated), then this data may be rather dated. As seen on Figure 5, the main areas of Class 1 and 2 carbon rich soils are, as expected, associated with blanket bog habitat. Given this habitat is a conservation priority, there is some overlap in these habitats with the designated sites, but for such areas the feature pressures may or may not include deer (of the 53 designated peatland features in the pilot area deer were noted as a pressure in only 2, although 32 were in unfavourable or unfavourable recovering condition16). Currently no data was available/acquired on the condition of peatland habitats outside of designated areas and determining the impact of deer on peatland habitats (particularly outside of designated sites) is likely to require further data gathering (e.g. HIA).
14 See Scotland’s National Peatland Plan and Low Carbon Scotland: Meeting our Emissions Reduction Targets 2013-2027. 15 Class 1 carbon rich soils are classified as ‘nationally important carbon-rich soils, deep peat and priority peatland habitat and areas likely to be of high conservation value’ and Class 2 soils are classed as: ‘nationally important carbon-rich soils, deep peat and priority peatland habitat and areas of potentially high conservation value and restoration potential’. Priority peatland habitat is land covered by peat-forming vegetation or vegetation associated with peat formation. 16 Most commonly due to morphological alterations or the presence of invasive species.
16
Public Interest/ Potential Indicator
Potential applicability of indicator (strengths)
Challenges Solutions/ suggested improvements
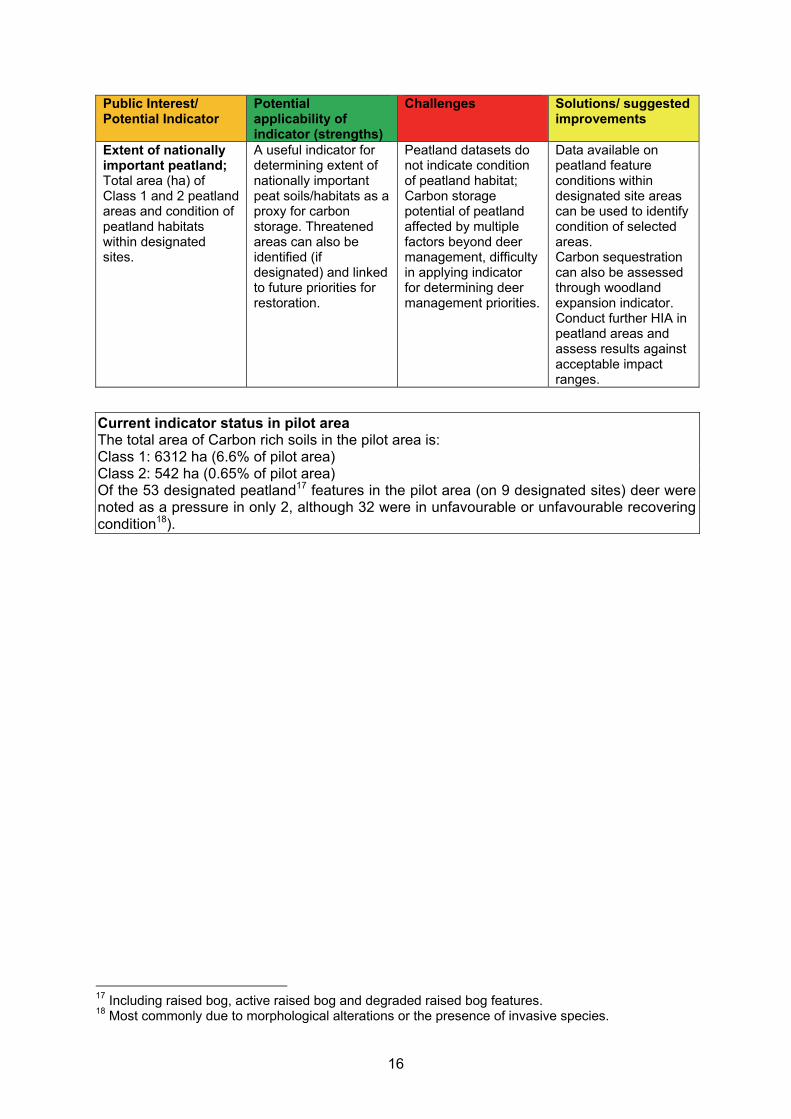
Extent of nationally important peatland; Total area (ha) of Class 1 and 2 peatland areas and condition of peatland habitats within designated sites.
A useful indicator for determining extent of nationally important peat soils/habitats as a proxy for carbon storage. Threatened areas can also be identified (if designated) and linked to future priorities for restoration.
Peatland datasets do not indicate condition of peatland habitat; Carbon storage potential of peatland affected by multiple factors beyond deer management, difficulty in applying indicator for determining deer management priorities.
Data available on peatland feature conditions within designated site areas can be used to identify condition of selected areas. Carbon sequestration can also be assessed through woodland expansion indicator. Conduct further HIA in peatland areas and assess results against acceptable impact ranges.
Current indicator status in pilot area The total area of Carbon rich soils in the pilot area is: Class 1: 6312 ha (6.6% of pilot area) Class 2: 542 ha (0.65% of pilot area) Of the 53 designated peatland17 features in the pilot area (on 9 designated sites) deer were noted as a pressure in only 2, although 32 were in unfavourable or unfavourable recovering condition18).
17 Including raised bog, active raised bog and degraded raised bog features. 18 Most commonly due to morphological alterations or the presence of invasive species.
17
Figure 5. The spatial extent of carbon rich soils across the pilot area; heather moorland types (purple), blanket bog (green) and industrial peat extraction areas (brown); Nationally important Class 1 & 2 carbon rich soils indicated as overlay (black hatching).
18
4.5 Economic activity (costs and benefits) relating to deer management
Deer and their management can generate both economic benefits (e.g. sporting and venison revenues, capital investment and job creation) and costs (e.g. linked to damage to crops and trees or as a result of Deer Vehicle Collisions) and management actions to mitigate deer impacts resulting in costs and maximise benefits are important components of sustainable deer management and public interest delivery. A key aspect of this is identifying where deer are having an economic cost or delivering economic benefits and this section reviews some potential indicators related to economic costs and benefits related to deer. As both the landowner and stalker surveys received low return rates this approach, at this stage, has not resulted in sufficient data to identify many of the economic costs and benefits of deer management – which require data at landholding level to determine key figures (e.g. total deer related employment. Wider datasets can be used in certain cases (e.g. DVCs and cull returns) as indicators of economic impact or as proxies for deer management activity. Nevertheless, the application of economic indicators for demonstrating the delivery of public interests is challenging and limited by the current availability of accessible relevant data. 4.5.1 Deer vehicle collisions
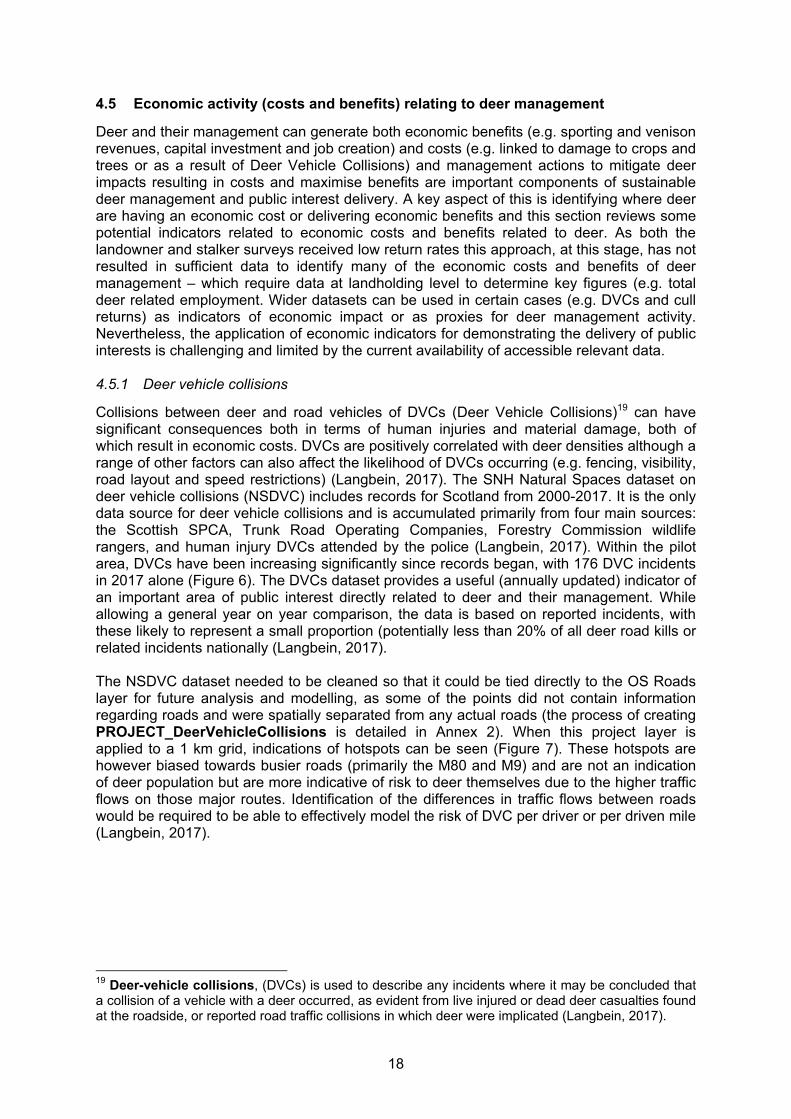
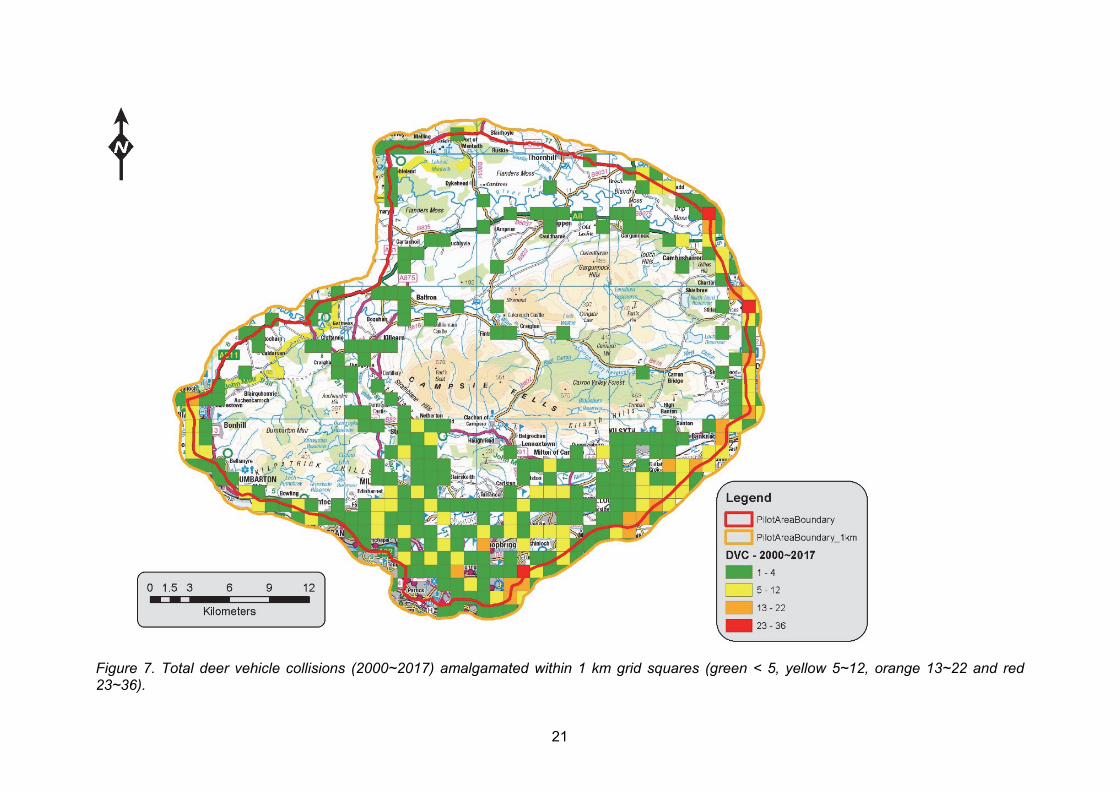
Collisions between deer and road vehicles of DVCs (Deer Vehicle Collisions)19 can have significant consequences both in terms of human injuries and material damage, both of which result in economic costs. DVCs are positively correlated with deer densities although a range of other factors can also affect the likelihood of DVCs occurring (e.g. fencing, visibility, road layout and speed restrictions) (Langbein, 2017). The SNH Natural Spaces dataset on deer vehicle collisions (NSDVC) includes records for Scotland from 2000-2017. It is the only data source for deer vehicle collisions and is accumulated primarily from four main sources: the Scottish SPCA, Trunk Road Operating Companies, Forestry Commission wildlife rangers, and human injury DVCs attended by the police (Langbein, 2017). Within the pilot area, DVCs have been increasing significantly since records began, with 176 DVC incidents in 2017 alone (Figure 6). The DVCs dataset provides a useful (annually updated) indicator of an important area of public interest directly related to deer and their management. While allowing a general year on year comparison, the data is based on reported incidents, with these likely to represent a small proportion (potentially less than 20% of all deer road kills or related incidents nationally (Langbein, 2017). The NSDVC dataset needed to be cleaned so that it could be tied directly to the OS Roads layer for future analysis and modelling, as some of the points did not contain information regarding roads and were spatially separated from any actual roads (the process of creating PROJECT_DeerVehicleCollisions is detailed in Annex 2). When this project layer is applied to a 1 km grid, indications of hotspots can be seen (Figure 7). These hotspots are however biased towards busier roads (primarily the M80 and M9) and are not an indication of deer population but are more indicative of risk to deer themselves due to the higher traffic flows on those major routes. Identification of the differences in traffic flows between roads would be required to be able to effectively model the risk of DVC per driver or per driven mile (Langbein, 2017).
19 Deer-vehicle collisions, (DVCs) is used to describe any incidents where it may be concluded that a collision of a vehicle with a deer occurred, as evident from live injured or dead deer casualties found at the roadside, or reported road traffic collisions in which deer were implicated (Langbein, 2017).
19
Figure 6. Total number of DVC per year (since 2000) within pilot area (P<0.05).20 Note: this does not account for traffic flow and changes in data recording over the time period.
Based on UK DVC data and cost estimates linked to the resulting material damage and medical treatment costs (in cases which resulted in human injuries) and assuming the ratio of collisions in Scotland (19%) compared to the whole of the UK remains similar, Putman (2012) estimated DVCs as resulting in a minimum economic cost (adjusted to 2016 prices) of £13.8M. As 176 DVCs were recorded in the pilot area in 2017 and this equates to 9% of the number recorded nationally for the same period this can be estimated as resulting in material and medical costs of £1.24M. Notably this does not include additional indirect costs such as road closures.21
Public Interest/ Potential Indicator
Potential applicability of indicator (strengths)
Challenges Solutions/ suggested improvements
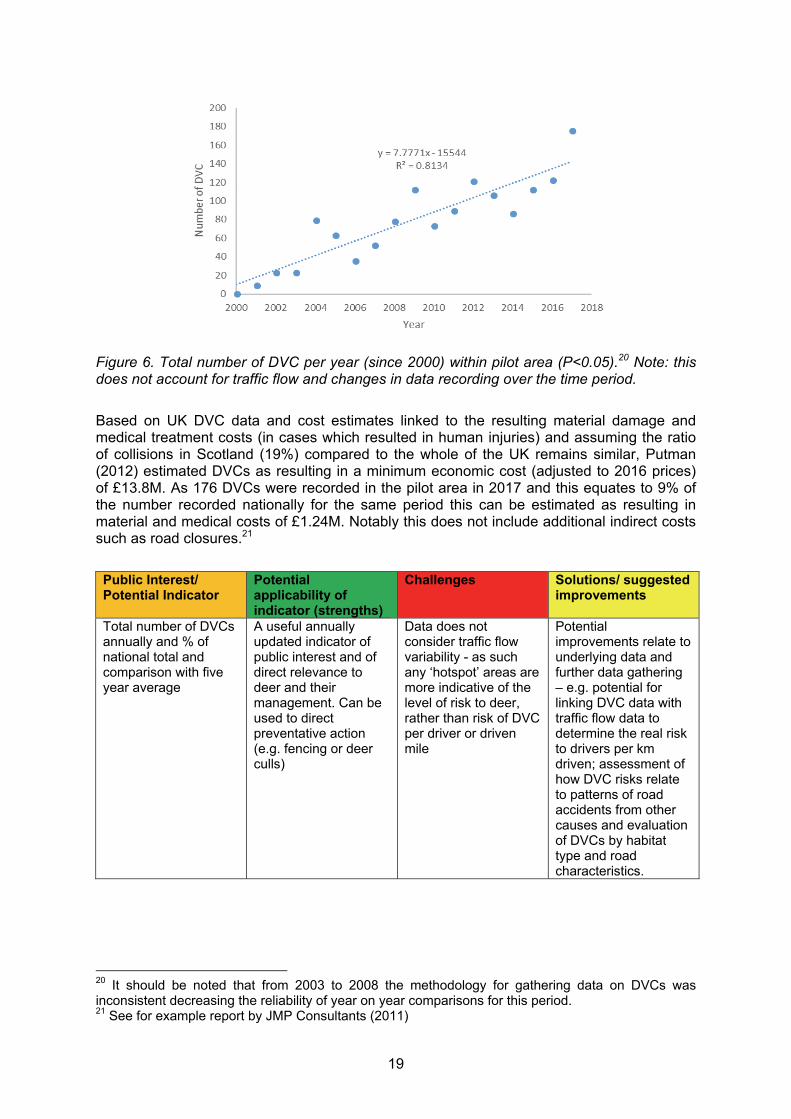
Total number of DVCs annually and % of national total and comparison with five year average
A useful annually updated indicator of public interest and of direct relevance to deer and their management. Can be used to direct preventative action (e.g. fencing or deer culls)
Data does not consider traffic flow variability - as such any ‘hotspot’ areas are more indicative of the level of risk to deer, rather than risk of DVC per driver or driven mile
Potential improvements relate to underlying data and further data gathering – e.g. potential for linking DVC data with traffic flow data to determine the real risk to drivers per km driven; assessment of how DVC risks relate to patterns of road accidents from other causes and evaluation of DVCs by habitat type and road characteristics.
20 It should be noted that from 2003 to 2008 the methodology for gathering data on DVCs was inconsistent decreasing the reliability of year on year comparisons for this period. 21 See for example report by JMP Consultants (2011)
20
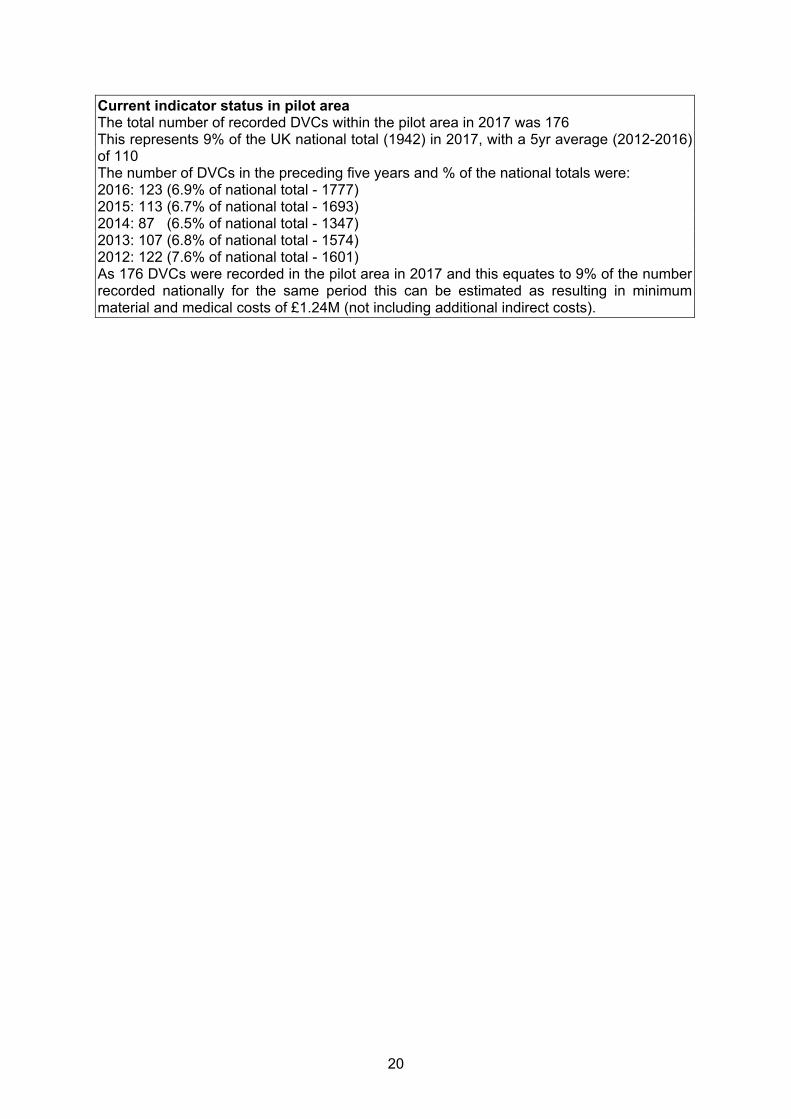
Current indicator status in pilot area The total number of recorded DVCs within the pilot area in 2017 was 176 This represents 9% of the UK national total (1942) in 2017, with a 5yr average (2012-2016) of 110 The number of DVCs in the preceding five years and % of the national totals were: 2016: 123 (6.9% of national total - 1777) 2015: 113 (6.7% of national total - 1693) 2014: 87 (6.5% of national total - 1347) 2013: 107 (6.8% of national total - 1574) 2012: 122 (7.6% of national total - 1601) As 176 DVCs were recorded in the pilot area in 2017 and this equates to 9% of the number recorded nationally for the same period this can be estimated as resulting in minimum material and medical costs of £1.24M (not including additional indirect costs).
21
Figure 7. Total deer vehicle collisions (2000~2017) amalgamated within 1 km grid squares (green < 5, yellow 5~12, orange 13~22 and red 23~36).
22
4.5.2 Deer impacts on forestry and agriculture
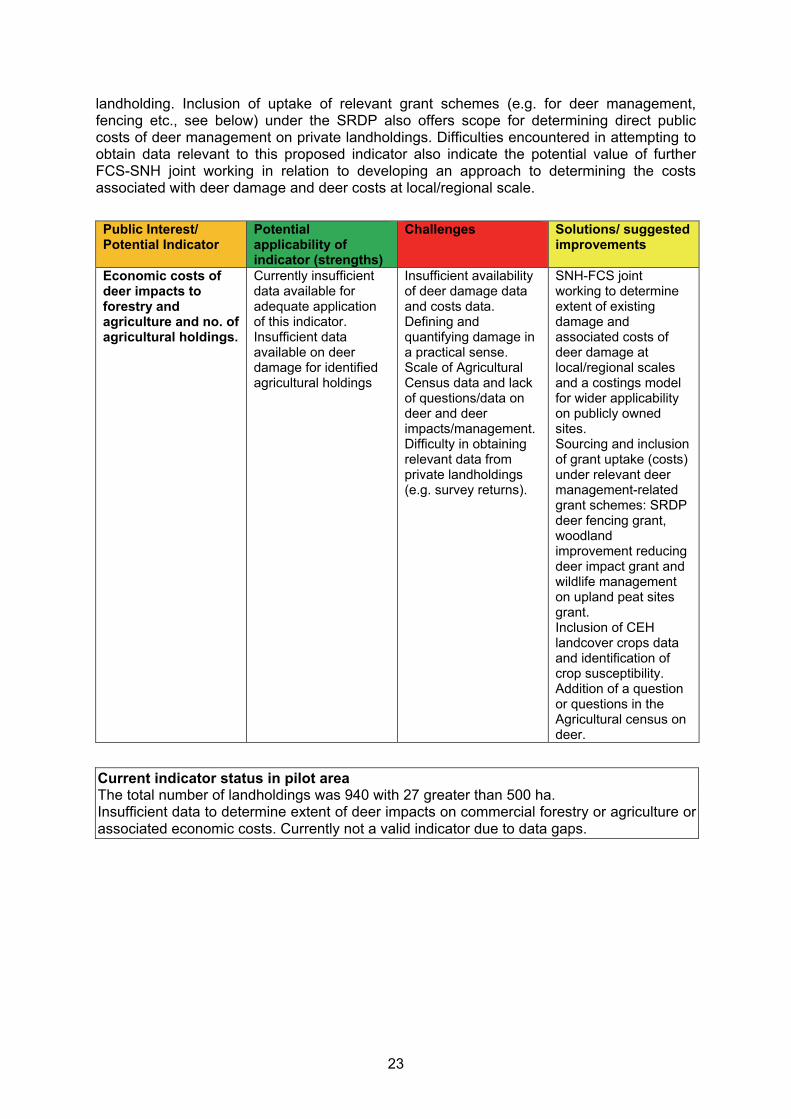
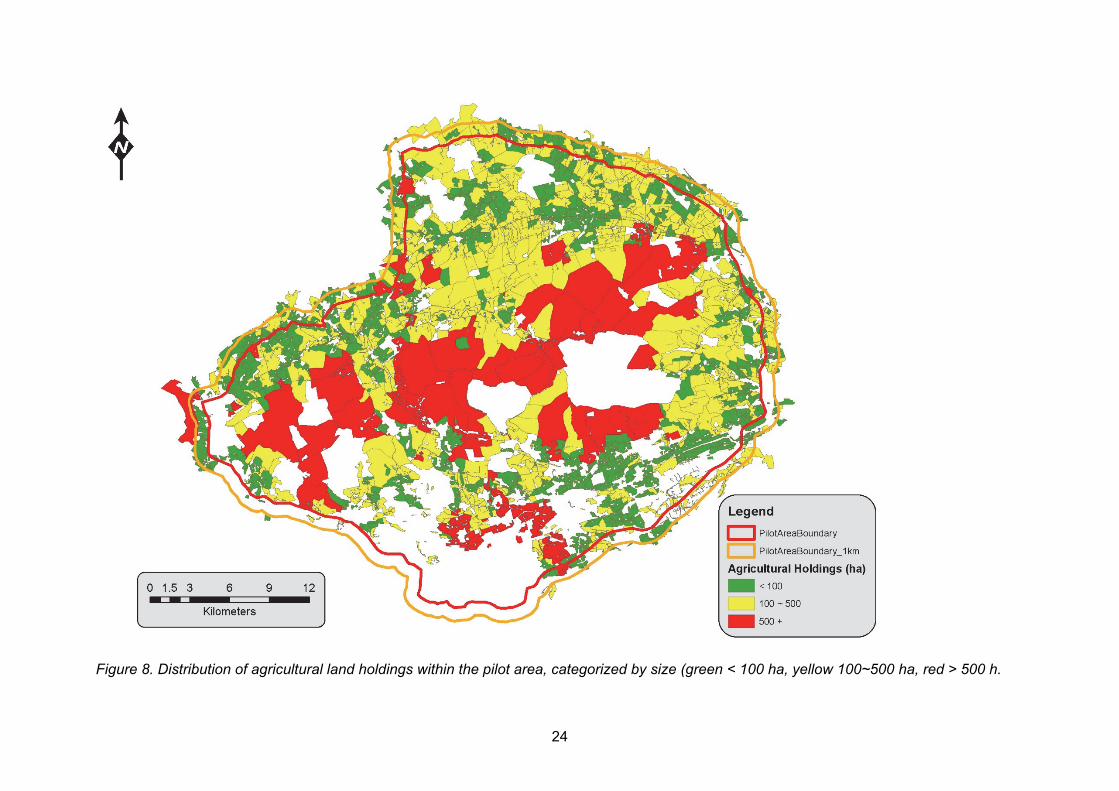
Deer are associated with specific impacts to forestry and commercial silviculture which can result in losses (public and private costs) in revenue through loss of shoots, delays to tree growth, stem damage and bark stripping (Gill et al., 2000, SNH, 2016). Additionally, deer can damage arable, root and grass crops, as well as orchards and market gardens, although impacts are generally localised (e.g. close to woodland cover) and are unlikely to be economically significant at a regional or national scale (Putman, 2012), although damage may be significant at local levels at specific time of year (Scott & Palmer, 2000). Managing impacts can result in significant costs, with PACEC (2014) estimating that operational and capital expenditure on deer management equates to annual costs of £42.6M22 in Scotland. The economic costs of deer damage represent an important indicator of public interest; however, it was not possible to acquire to sufficient data to determine these costs for the pilot area due to: i) insufficient availability of costings data from FCS; ii) the limited response to the landowner survey, with only one full response returned; and iii) insufficient wider availability of relevant data from national datasets (e.g. the agricultural census). Additionally, management of the National Forest Estate is carried out administratively at Forest District level, complicating the transferability of Forest District data (e.g. on employment) to the scale of the pilot area (which incorporated parts of multiple Forest Districts. As a result, the extent of damage to commercial forestry and agriculture was not determined for the pilot area and due to current data gaps it was not possible to determine the related economic costs or develop a related indicator. To determine the extent of agricultural activity in the pilot area and determine any scope for identifying agricultural impacts data from the Scottish Integrated Administration and Control Systems (SIACS) was obtained through SNH (Table 6). The data obtained from SNH did not include information relating to crop type; however, it was processed to show the spatial extent of individual land holdings within the pilot area (PROJECT_SIACS_LandHoldings). In total there are 940 different agricultural land holdings present within the pilot area, with 27 greater than 500 ha, 170 between 100~500 ha and 743 < 100 ha (Figure 8). This shows the importance of agriculture in deer management, as the largest overall land-use by area. However, this also gives an indication of the numbers of stakeholders potentially involved in deer issues in this area, and can be contrasted to the few (but large) holdings typically involved in upland deer issues, within a Deer Management Unit (see Figure 12). Currently the agricultural census data does not include data on deer presence, management or impacts and there is no publicly available data showing crop type in Scotland. Additionally the June Agricultural Census is mapped at Parish level (not holding level).
Table 6. Agriculture related datasets.
Dataset name & abbreviation Notes Scottish Integrated Administration and Control Systems (PROJECT_SIACS_LandHoldings)
Details on farm holdings and the crop types being grown on them (at the field and farm holding level).
Opportunities exist in the future for enhancing the underlying knowledge base for determining (to an extent) the economic costs associated with deer damage and deer management. The Centre for Ecology and Hydrology Land Cover® plus: Crops dataset offers some potential for mapping crop types and potential susceptibility to deer damage. Additionally, future agricultural census surveys could incorporate a question or questions on the presence of deer impacts and extent of active deer management on the surveyed
22 Including operational expenditure of £36.4M (including £17.1M staff costs and £4.8M on property rent and maintenance) and £5.8M of public expenditure (PACEC, 2014).
23
landholding. Inclusion of uptake of relevant grant schemes (e.g. for deer management, fencing etc., see below) under the SRDP also offers scope for determining direct public costs of deer management on private landholdings. Difficulties encountered in attempting to obtain data relevant to this proposed indicator also indicate the potential value of further FCS-SNH joint working in relation to developing an approach to determining the costs associated with deer damage and deer costs at local/regional scale.
Public Interest/ Potential Indicator
Potential applicability of indicator (strengths)
Challenges Solutions/ suggested improvements
Economic costs of deer impacts to forestry and agriculture and no. of agricultural holdings.
Currently insufficient data available for adequate application of this indicator. Insufficient data available on deer damage for identified agricultural holdings
Insufficient availability of deer damage data and costs data. Defining and quantifying damage in a practical sense. Scale of Agricultural Census data and lack of questions/data on deer and deer impacts/management. Difficulty in obtaining relevant data from private landholdings (e.g. survey returns).
SNH-FCS joint working to determine extent of existing damage and associated costs of deer damage at local/regional scales and a costings model for wider applicability on publicly owned sites. Sourcing and inclusion of grant uptake (costs) under relevant deer management-related grant schemes: SRDP deer fencing grant, woodland improvement reducing deer impact grant and wildlife management on upland peat sites grant. Inclusion of CEH landcover crops data and identification of crop susceptibility. Addition of a question or questions in the Agricultural census on deer.
Current indicator status in pilot area The total number of landholdings was 940 with 27 greater than 500 ha. Insufficient data to determine extent of deer impacts on commercial forestry or agriculture or associated economic costs. Currently not a valid indicator due to data gaps.
24
Figure 8. Distribution of agricultural land holdings within the pilot area, categorized by size (green < 100 ha, yellow 100~500 ha, red > 500 h.
25
4.5.3 Deer management (culling) effort and stalking activity
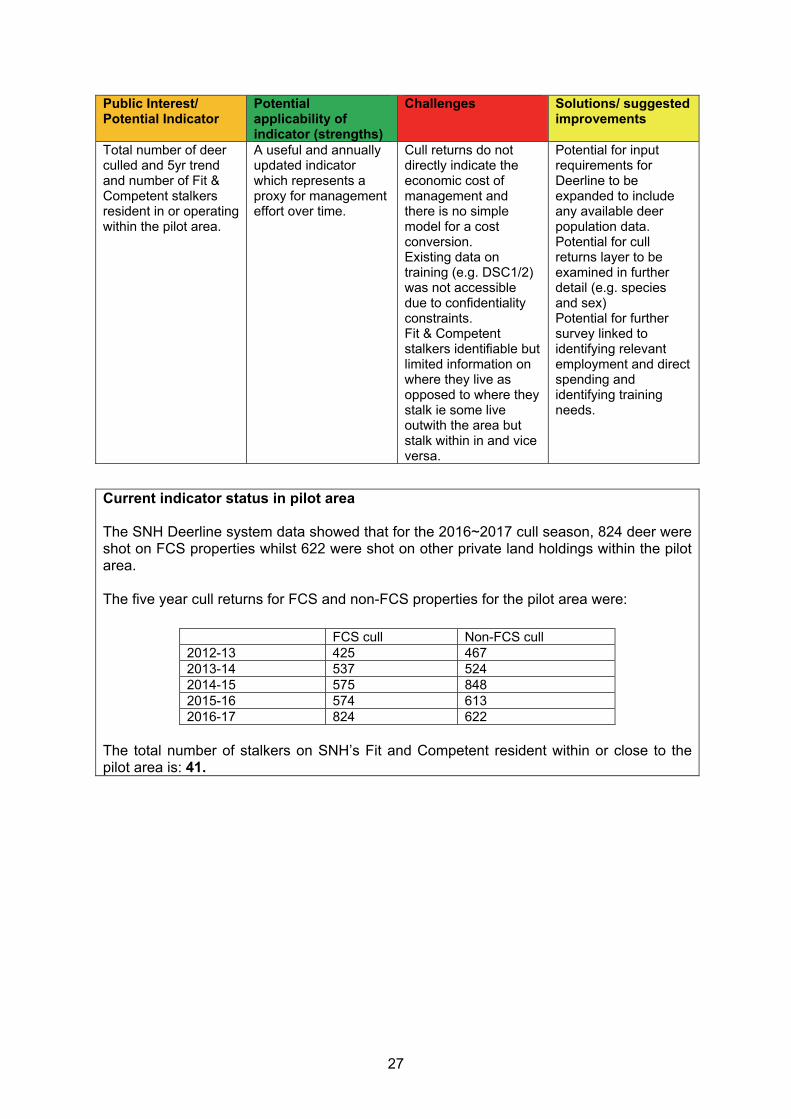
Deer cull data can be useful as an indicator of current economic activity related to deer management (Putman, 2012) and can also be useful as part of a population model, especially if the sex and age of the species culled is recorded (Mayle & Armstrong, 2001) as this is not always possible to define with population counts from thermal imagers. Deer culling effort relates to both management costs (e.g. staff costs) and economic benefits (e.g. employment creation, investment), although there is no simple way of converting cull return numbers to management costs, as the relative ‘cost’ of deer management will vary between properties. Additionally, higher or lower cull returns are not directly attributable to increasing or decreasing public interest, as the potential impact of management will be site specific and linked to the size and density of deer populations. Nevertheless, cull returns can be taken as a proxy for management effort over time and represent an important wider element of the knowledge base for informing long term deer management. As no public database of cull returns exists, all cull return data used to create this layer was received direct from SNH and FCS (Table 7). Unfortunately, the three datasets are not easily combinable, as one is non-spatial with limited location information, and the other two spatial datasets differ in both the data available and how it is distributed spatially.
Table 7. Deer cull related datasets.
Dataset name & abbreviation Notes SNH Deerline cull returns (PROJECT_SNH_CullReturns)
Point data from SNH (via their Deerline cull returns system) detailing cull returns for each registered property from 2012~2017.
FCS Lowland Forest District cull returns (PROJECT_FCS_DeerCullReturns)
Point data received from FCS for 2014~2016, detailing the location of each deer cull on national forest estate land within the forest district.
FCS Cowal and Trossachs Forest District cull returns (CowellAndTrossachsFDCullReturns_2016_2018)
A non-spatial dataset received direct from FCS indicating cull returns dated 2016~2018. Loaded to the database as textual data as spatial information limited.
NS DMU Scotland (NSDMU)
Spatial extent of deer management units (DMU).
FCS DMU Zones (FCS_DMU_Zones_LowlansFD)
Spatial extent of DMU zones for the Lowlands Forest District.
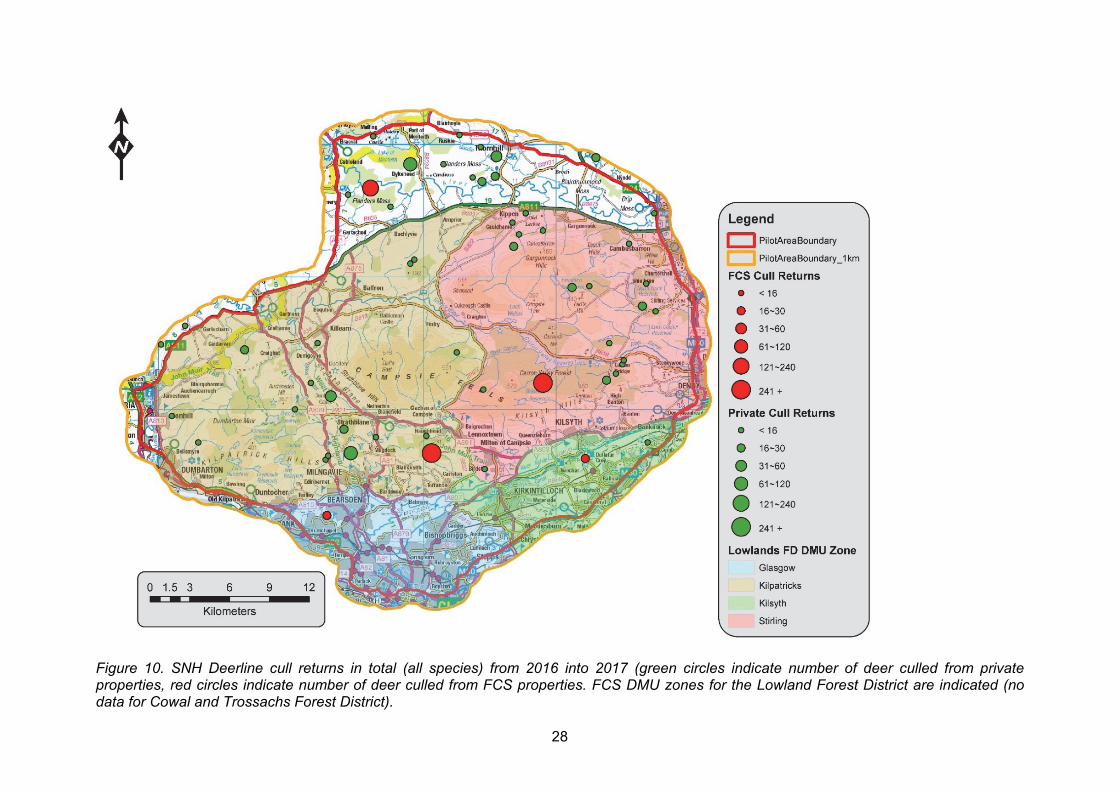
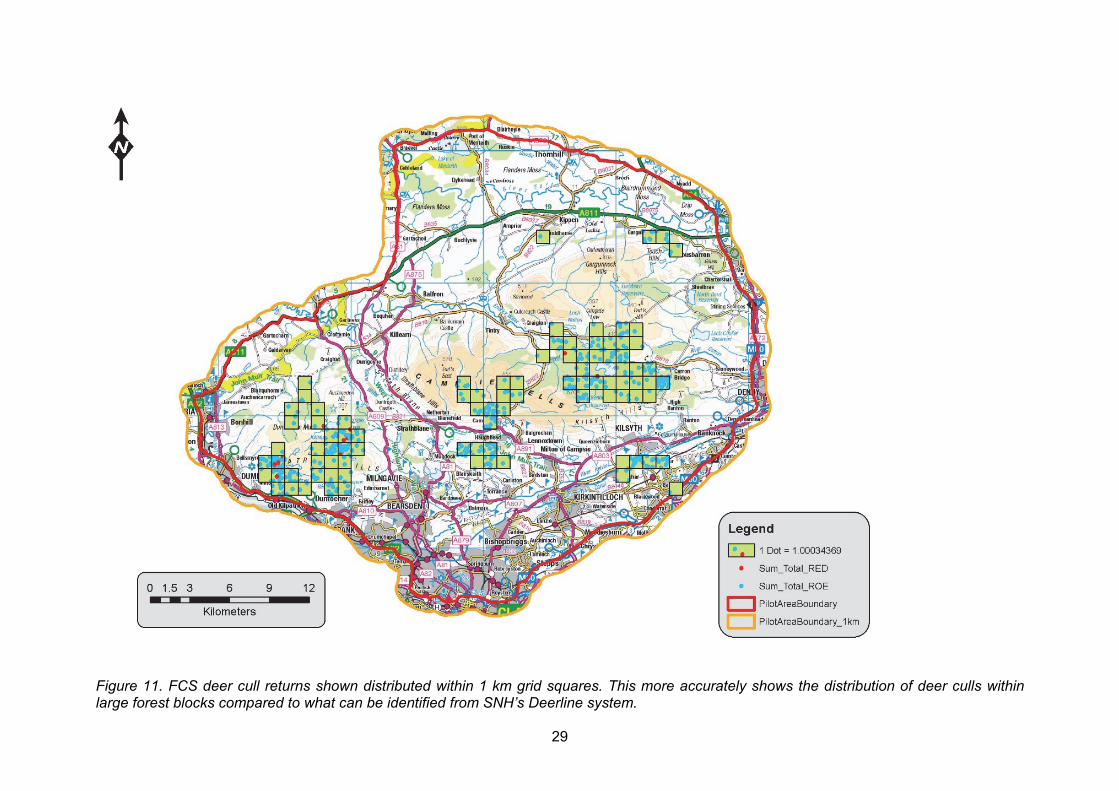
The SNH cull data shows all cull returns for a single property with all of the culls being spatially represented at a single point for that property, but it does give full information for species, sex and age (see PROJECT_SNH_DeerCullReturns, Figures 9 and 10). The FCS data shows one point for each cull in the approximate position that the cull was made, but it only specifies the species and not the sex or age (PROJECT_FCS_DeerCullReturns and Figure 11); however, the carcass tag number is likely to give further information if available. The different spatial representations of the data makes combining it into a single layer challenging, as some particularly large culls might be being represented at a single property point that does not truly reflect the distribution across that property. This is more of a problem when considering larger estates compared to smaller farm holdings and in particular some of the FCS forest areas, which appear to have cull data from multiple forest blocks applied to a single property located within enlarged DMU zones (Figure 10). It also cannot be confirmed if the SNH Deerline system contains all of the FCS data, as differences were found between the two, but this could simply be due to the way the year of the cull is represented between the two datasets (simply year for FCS, but cull season for SNH Deerline).
26
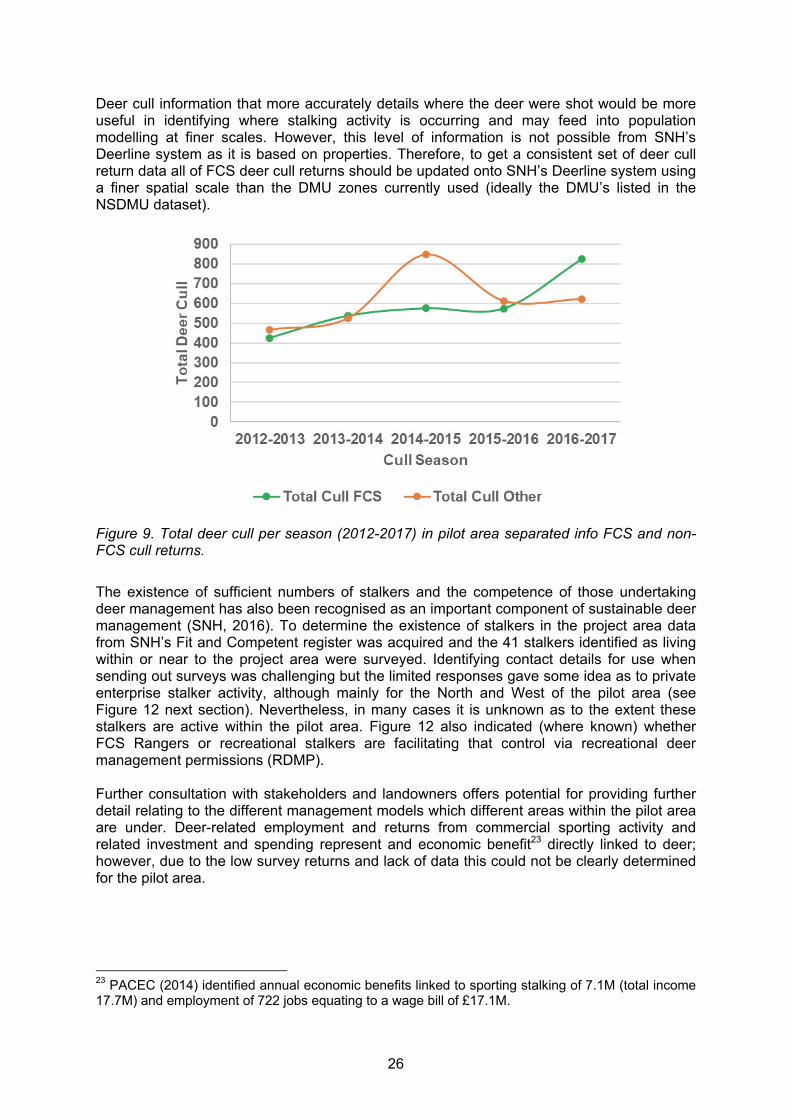
Deer cull information that more accurately details where the deer were shot would be more useful in identifying where stalking activity is occurring and may feed into population modelling at finer scales. However, this level of information is not possible from SNH’s Deerline system as it is based on properties. Therefore, to get a consistent set of deer cull return data all of FCS deer cull returns should be updated onto SNH’s Deerline system using a finer spatial scale than the DMU zones currently used (ideally the DMU’s listed in the NSDMU dataset).
Figure 9. Total deer cull per season (2012-2017) in pilot area separated info FCS and non-FCS cull returns.
The existence of sufficient numbers of stalkers and the competence of those undertaking deer management has also been recognised as an important component of sustainable deer management (SNH, 2016). To determine the existence of stalkers in the project area data from SNH’s Fit and Competent register was acquired and the 41 stalkers identified as living within or near to the project area were surveyed. Identifying contact details for use when sending out surveys was challenging but the limited responses gave some idea as to private enterprise stalker activity, although mainly for the North and West of the pilot area (see Figure 12 next section). Nevertheless, in many cases it is unknown as to the extent these stalkers are active within the pilot area. Figure 12 also indicated (where known) whether FCS Rangers or recreational stalkers are facilitating that control via recreational deer management permissions (RDMP). Further consultation with stakeholders and landowners offers potential for providing further detail relating to the different management models which different areas within the pilot area are under. Deer-related employment and returns from commercial sporting activity and related investment and spending represent and economic benefit23 directly linked to deer; however, due to the low survey returns and lack of data this could not be clearly determined for the pilot area.
23 PACEC (2014) identified annual economic benefits linked to sporting stalking of 7.1M (total income 17.7M) and employment of 722 jobs equating to a wage bill of £17.1M.
27
Public Interest/ Potential Indicator
Potential applicability of indicator (strengths)
Challenges Solutions/ suggested improvements
Total number of deer culled and 5yr trend and number of Fit & Competent stalkers resident in or operating within the pilot area.
A useful and annually updated indicator which represents a proxy for management effort over time.
Cull returns do not directly indicate the economic cost of management and there is no simple model for a cost conversion. Existing data on training (e.g. DSC1/2) was not accessible due to confidentiality constraints. Fit & Competent stalkers identifiable but limited information on where they live as opposed to where they stalk ie some live outwith the area but stalk within in and vice versa.
Potential for input requirements for Deerline to be expanded to include any available deer population data. Potential for cull returns layer to be examined in further detail (e.g. species and sex) Potential for further survey linked to identifying relevant employment and direct spending and identifying training needs.
Current indicator status in pilot area The SNH Deerline system data showed that for the 2016~2017 cull season, 824 deer were shot on FCS properties whilst 622 were shot on other private land holdings within the pilot area. The five year cull returns for FCS and non-FCS properties for the pilot area were: The total number of stalkers on SNH’s Fit and Competent resident within or close to the pilot area is: 41.
FCS cull Non-FCS cull 2012-13 425 467 2013-14 537 524 2014-15 575 848 2015-16 574 613 2016-17 824 622
28
Figure 10. SNH Deerline cull returns in total (all species) from 2016 into 2017 (green circles indicate number of deer culled from private properties, red circles indicate number of deer culled from FCS properties. FCS DMU zones for the Lowland Forest District are indicated (no data for Cowal and Trossachs Forest District).
29
Figure 11. FCS deer cull returns shown distributed within 1 km grid squares. This more accurately shows the distribution of deer culls within large forest blocks compared to what can be identified from SNH’s Deerline system.
30
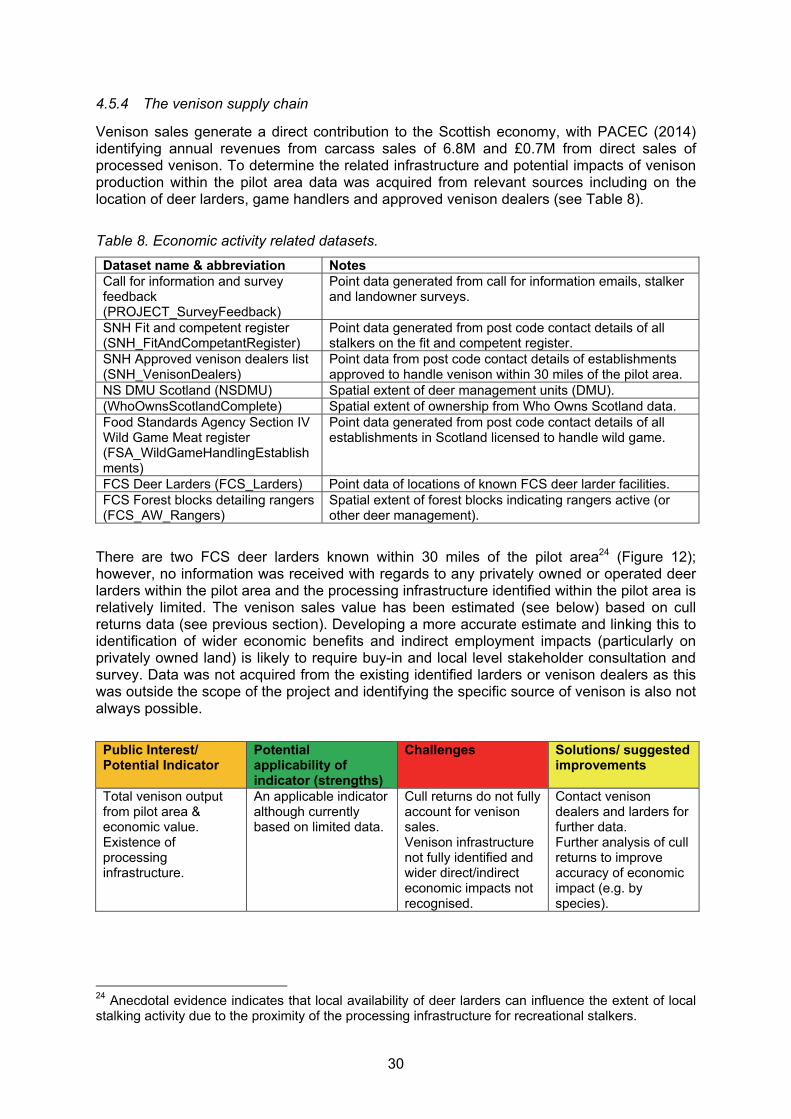
4.5.4 The venison supply chain
Venison sales generate a direct contribution to the Scottish economy, with PACEC (2014) identifying annual revenues from carcass sales of 6.8M and £0.7M from direct sales of processed venison. To determine the related infrastructure and potential impacts of venison production within the pilot area data was acquired from relevant sources including on the location of deer larders, game handlers and approved venison dealers (see Table 8).
Table 8. Economic activity related datasets.
Dataset name & abbreviation Notes Call for information and survey feedback (PROJECT_SurveyFeedback)
Point data generated from call for information emails, stalker and landowner surveys.
SNH Fit and competent register (SNH_FitAndCompetantRegister)
Point data generated from post code contact details of all stalkers on the fit and competent register.
SNH Approved venison dealers list (SNH_VenisonDealers)
Point data from post code contact details of establishments approved to handle venison within 30 miles of the pilot area.
NS DMU Scotland (NSDMU) Spatial extent of deer management units (DMU). (WhoOwnsScotlandComplete) Spatial extent of ownership from Who Owns Scotland data. Food Standards Agency Section IV Wild Game Meat register (FSA_WildGameHandlingEstablishments)
Point data generated from post code contact details of all establishments in Scotland licensed to handle wild game.
FCS Deer Larders (FCS_Larders) Point data of locations of known FCS deer larder facilities. FCS Forest blocks detailing rangers (FCS_AW_Rangers)
Spatial extent of forest blocks indicating rangers active (or other deer management).
There are two FCS deer larders known within 30 miles of the pilot area24 (Figure 12); however, no information was received with regards to any privately owned or operated deer larders within the pilot area and the processing infrastructure identified within the pilot area is relatively limited. The venison sales value has been estimated (see below) based on cull returns data (see previous section). Developing a more accurate estimate and linking this to identification of wider economic benefits and indirect employment impacts (particularly on privately owned land) is likely to require buy-in and local level stakeholder consultation and survey. Data was not acquired from the existing identified larders or venison dealers as this was outside the scope of the project and identifying the specific source of venison is also not always possible.
Public Interest/ Potential Indicator
Potential applicability of indicator (strengths)
Challenges Solutions/ suggested improvements
Total venison output from pilot area & economic value. Existence of processing infrastructure.
An applicable indicator although currently based on limited data.
Cull returns do not fully account for venison sales. Venison infrastructure not fully identified and wider direct/indirect economic impacts not recognised.
Contact venison dealers and larders for further data. Further analysis of cull returns to improve accuracy of economic impact (e.g. by species).
24 Anecdotal evidence indicates that local availability of deer larders can influence the extent of local stalking activity due to the proximity of the processing infrastructure for recreational stalkers.
31
Current indicator status in pilot area In 2016-2017 based on Cull return data 1446 deer were culled in the pilot area (see Section 4.5.4). Based on an average price per kg of £3 and an average carcass weight of 12kg this equates to a total direct sale value of £52,056.25 The existence of venison processing infrastructure within and around the pilot area is identified but due to limited data availability on private infrastructure this is likely to require further work to identify fully (e.g. identifying gaps in processing infrastructure).
25 Likely to be an underestimate due to average carcass weight based on Roe deer while average red deer carcass weight may be as much as four times as much. Venison costs based on figures from Scottish Venision.
32
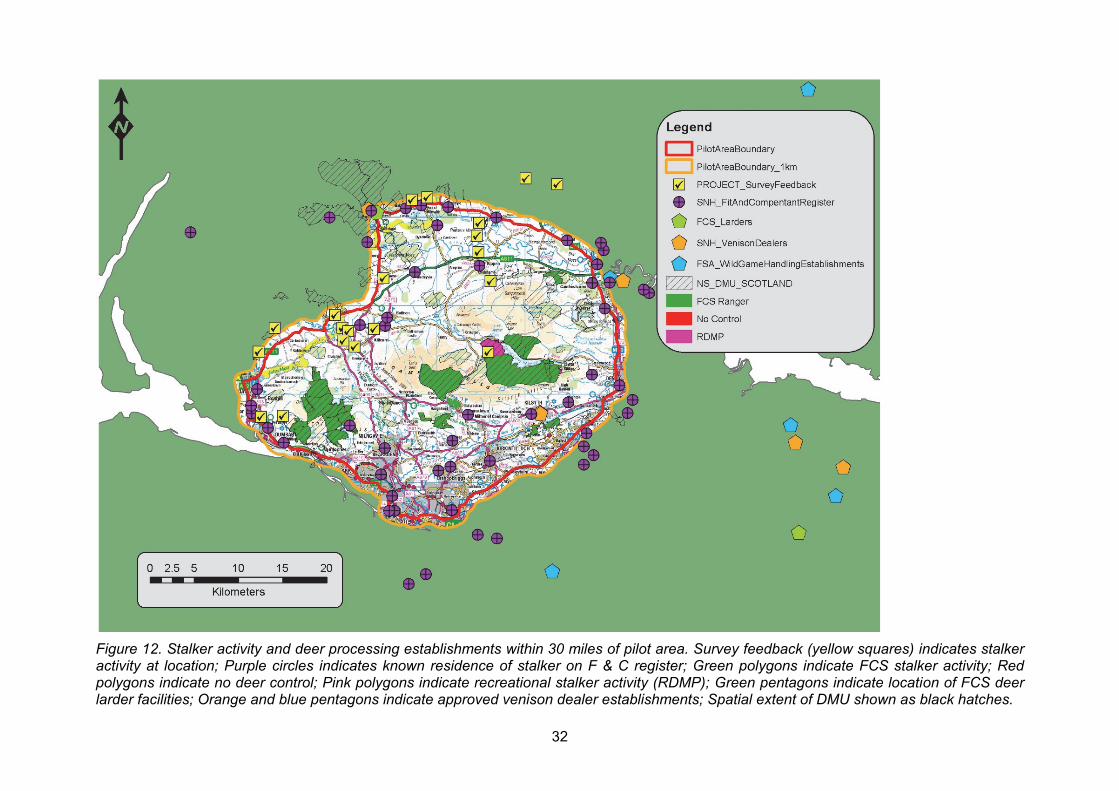
Figure 12. Stalker activity and deer processing establishments within 30 miles of pilot area. Survey feedback (yellow squares) indicates stalker activity at location; Purple circles indicates known residence of stalker on F & C register; Green polygons indicate FCS stalker activity; Red polygons indicate no deer control; Pink polygons indicate recreational stalker activity (RDMP); Green pentagons indicate location of FCS deer larder facilities; Orange and blue pentagons indicate approved venison dealer establishments; Spatial extent of DMU shown as black hatches.
33
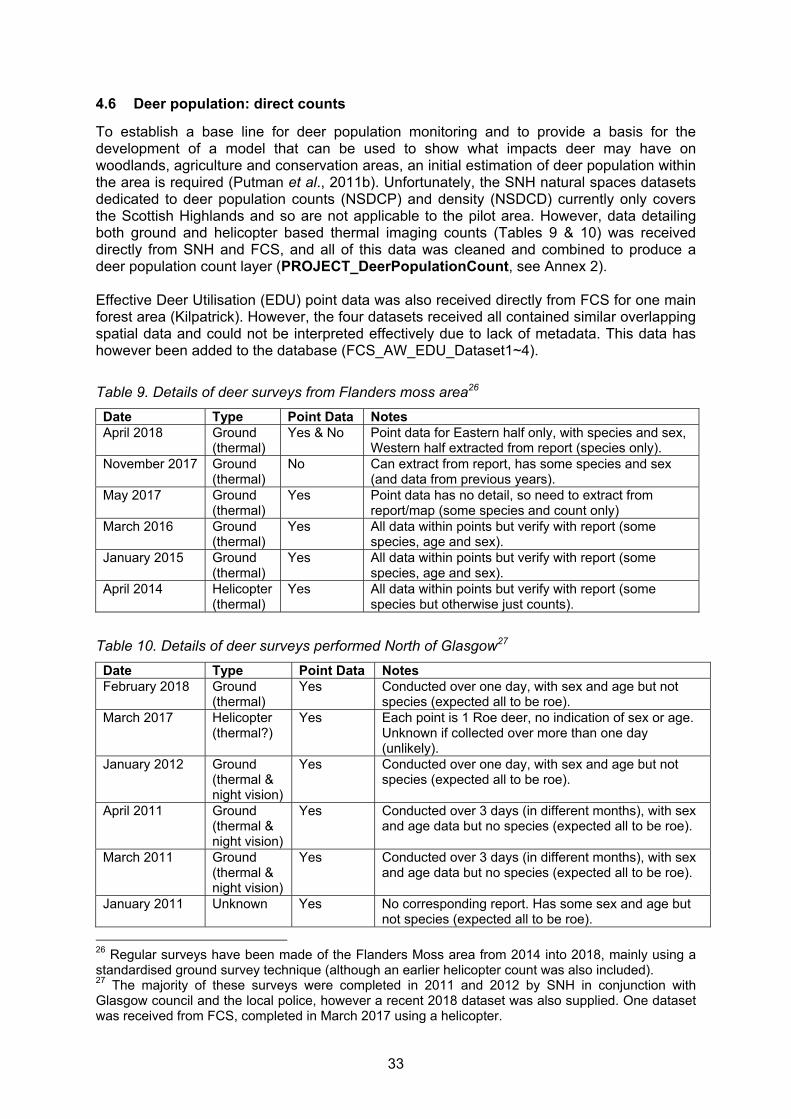
4.6 Deer population: direct counts
To establish a base line for deer population monitoring and to provide a basis for the development of a model that can be used to show what impacts deer may have on woodlands, agriculture and conservation areas, an initial estimation of deer population within the area is required (Putman et al., 2011b). Unfortunately, the SNH natural spaces datasets dedicated to deer population counts (NSDCP) and density (NSDCD) currently only covers the Scottish Highlands and so are not applicable to the pilot area. However, data detailing both ground and helicopter based thermal imaging counts (Tables 9 & 10) was received directly from SNH and FCS, and all of this data was cleaned and combined to produce a deer population count layer (PROJECT_DeerPopulationCount, see Annex 2). Effective Deer Utilisation (EDU) point data was also received directly from FCS for one main forest area (Kilpatrick). However, the four datasets received all contained similar overlapping spatial data and could not be interpreted effectively due to lack of metadata. This data has however been added to the database (FCS_AW_EDU_Dataset1~4).
Table 9. Details of deer surveys from Flanders moss area26
Date Type Point Data Notes April 2018 Ground
(thermal) Yes & No Point data for Eastern half only, with species and sex,
Western half extracted from report (species only). November 2017 Ground
(thermal) No Can extract from report, has some species and sex
(and data from previous years). May 2017 Ground
(thermal) Yes Point data has no detail, so need to extract from
report/map (some species and count only) March 2016 Ground
(thermal) Yes All data within points but verify with report (some
species, age and sex). January 2015 Ground
(thermal) Yes All data within points but verify with report (some
species, age and sex). April 2014 Helicopter
(thermal) Yes All data within points but verify with report (some
species but otherwise just counts).
Table 10. Details of deer surveys performed North of Glasgow27
Date Type Point Data Notes February 2018 Ground
(thermal) Yes Conducted over one day, with sex and age but not
species (expected all to be roe). March 2017 Helicopter
(thermal?) Yes Each point is 1 Roe deer, no indication of sex or age.
Unknown if collected over more than one day (unlikely).
January 2012 Ground (thermal & night vision)
Yes Conducted over one day, with sex and age but not species (expected all to be roe).
April 2011 Ground (thermal & night vision)
Yes Conducted over 3 days (in different months), with sex and age data but no species (expected all to be roe).
March 2011 Ground (thermal & night vision)
Yes Conducted over 3 days (in different months), with sex and age data but no species (expected all to be roe).
January 2011 Unknown Yes No corresponding report. Has some sex and age but not species (expected all to be roe).
26 Regular surveys have been made of the Flanders Moss area from 2014 into 2018, mainly using a standardised ground survey technique (although an earlier helicopter count was also included). 27 The majority of these surveys were completed in 2011 and 2012 by SNH in conjunction with Glasgow council and the local police, however a recent 2018 dataset was also supplied. One dataset was received from FCS, completed in March 2017 using a helicopter.
34
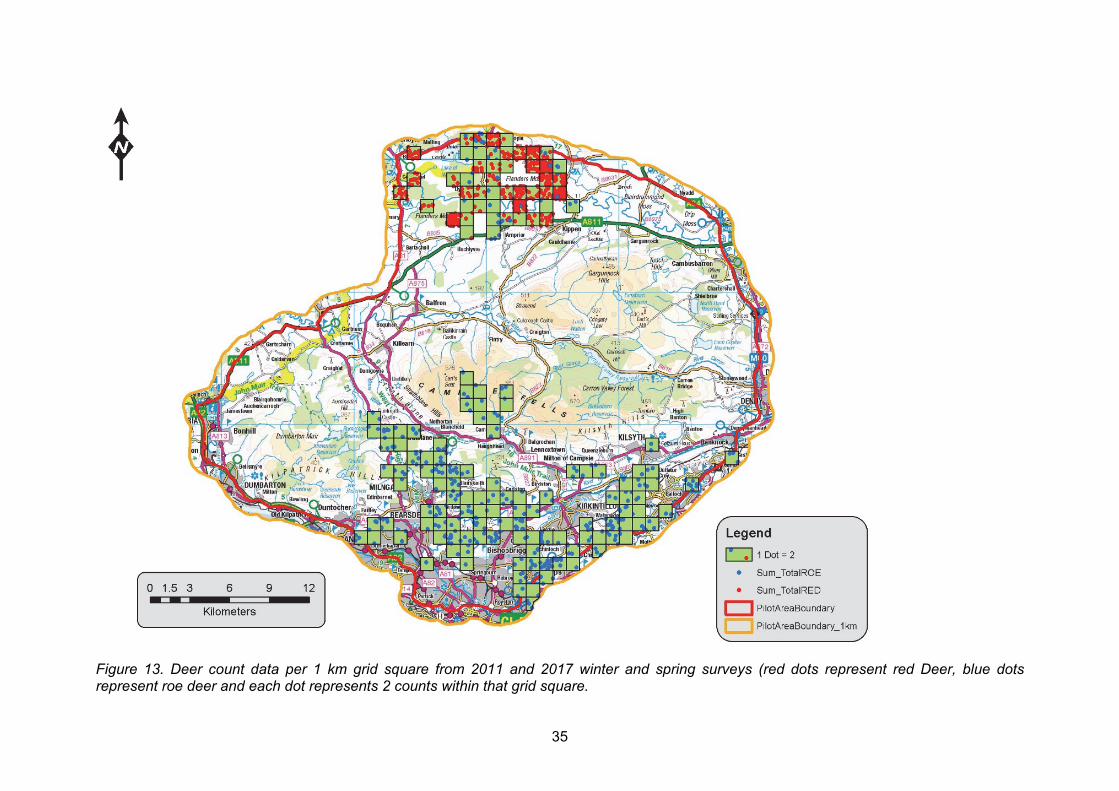
Only red deer (primarily in the north) and roe deer were reported, but the surveys do not fully encompass the entire pilot area (Figure 13), with only the very north (around Flanders Moss) central and the very south (essentially just north of Glasgow) being covered, leaving ~85% of the pilot area having no specific population count information. Some modelling of deer abundance across Scotland has also been attempted by the British Trust for Ornithology (Massimino & Calladine, 2017). This data could be obtained but it would be difficult to correlate BTO derived data with locally derived data to give an indication of abundance. The existing data availability on deer counts is insufficient to be utilised as the basis for an indicator of public interest for the pilot area. Conducting further deer counts and habitat impact assessments in the pilot area offers specific potential for the development longer term of a more effective baseline for deer management and assessing the delivery of public interest directly as it relates to the management of deer over time.
Public Interest/ Potential Indicator
Potential applicability of indicator (strengths)
Challenges Solutions/ suggested improvements
Total number of deer in pilot area and average deer density.
Currently insufficient data available to determine this for the pilot area.
Insufficient availability of data
Further deer counts including in non-designated and non-wooded areas. Sourcing of any further information from FCS and SNH. Creation of additional questions in Deerline for landowners when submitting cull returns (on deer populations).
Current indicator status in pilot area Insufficient data to determine indicator status
35
Figure 13. Deer count data per 1 km grid square from 2011 and 2017 winter and spring surveys (red dots represent red Deer, blue dots represent roe deer and each dot represents 2 counts within that grid square.
36
5. CONCLUSIONS AND RECOMMENDATIONS
5.1 Key conclusions - methodological critique and key data gaps
A wide range of data relating to public interests is currently available and has been collated for this pilot and a full summary of the applicability, challenges and data gaps for different potential indicators of public interests relevant to deer management is shown in Annex 1. Relatively high quality data is available in particular for indicators relating to designated sites condition, woodland expansion and herbivore impacts on native woodlands (including browsing damage). Determining the delivery of climate change mitigation is more challenging although both woodland expansion and the extent of carbon rich soils can be used as indicators of carbon sequestration, particularly if linked with future HIA assessments in related habitats. In relation to economic indicators DVC data represents a useful basis for long term assessment and cull returns data can be used as a proxy for management effort over time and as a potential basis for calculating estimated returns from venison sales. Nevertheless, a wide range of data gaps exist, critically this includes in relation to deer populations (counts) and habitat impact assessments (HIA data), particularly for non-wooded areas, limiting the potential for wider indicators relating to habitat quality. The data collated on habitat/browsing impacts on commercial and native woodlands is also limited, with the exception of NWSS data. Currently, data collated on browsing impacts from all sources is relatively limited, not always spatial and time-limited; further data is required to develop a coherent picture of the level of impacts across the entire pilot area over time. This includes HIA data and potentially a wider set of deer presence/absence data (EDU plots or other relevant data) for previous years from both relevant forest districts. Furthermore, only very limited data is currently available on the location and extent of deer fences. The collated deer count information is currently insufficient to calculate reliable deer density estimates for the pilot area over time. Additionally, deer counts have been carried out for different sites at different times, using different techniques (dung counts, ground/aerial thermal counts); it is unclear how well these different methods correlate together in their estimates of deer numbers. Furthermore, within specific count methodologies data is sometimes presented differently making comparison and interpretation challenging without some standardisation. Where provided, deer count data has also only been made available for specific years and usually for localised/specific sites. Notably, culling records are also available in different formats (e.g. as generalised point data from the Deerline system and as finer scale (point of kill) data from FE data. Furthermore, based on a comparison of cull returns data and landowners identified across the pilot area not all landowners are providing cull returns. As a result, while certain public interests of relevance to deer can be assessed over time, the limitations in deer count data indicate that directly linking impacts or benefits with deer numbers in different areas will be challenging. Acquiring spatial data throughout this review has been relatively slow and challenging. A number of national level datasets have provided relevant data, albeit at different scales and often with differing levels of coverage. Collating and assessing this data is time-consuming, with the resulting data often offering limited scope for informing potential indicators and/or deer management at landscape scales due to the original datasets having being developed for different purposes. Data collated on economic deer activity (stalker effort, related employment and income) is very limited, particularly in relation to activity on private landholdings. Capturing this data is challenging and the landowner and stalker surveys carried out for this review received a very limited response. This may be partly due to the lack of scope within this review for more extensive (early)
37
stakeholder engagement. Additionally, the cull returns data (which includes contact information for landowners) was received relatively late in this process; the contacts database created for the landowner survey was therefore incomplete and based on landholding size and availability of contact information online (rather than accurate information on where deer management was occurring). This sparsity of data from private landowners has resulted in a lack of information on the extent of stalking syndicates in the area and the resulting income, as well as any potential costs incurred from contract stalking. Going forward, identifying further information related to the extent of private (commercial and recreational) and contracted stalking within the pilot area (and related income) is critical. Capturing this data will facilitate better understanding of how deer are being managed across the area and by whom (and the relative balance between different models) and allow for a direct comparison of cull levels/stalking effort and outcomes from different management models (see section on Stakeholder engagement below). 5.2 Capture of remaining existing spatial and non-spatial data
There remain a number of areas for which further relevant spatial and non-spatial data may exist but which has not been acquired due to various issues, including licencing, difficulties accessing some of the data within agencies, a lack of metadata (clarification on data origins, formats etc.) and limited engagement with landowners. Any further work on enhancing indicators and linking public interest outcomes with deer and their management should, at an early stage, seek to acquire this remaining data through further agency and stakeholder engagement. In particular this includes (potentially) data relating to habitat impact assessments (e.g. for FE forests and private owners), data on crop type (on licence from CEH), additional deer count data (e.g. from private landowners), location and throughput of deer larders, further information on stalker activity and any further information which can be linked to specific designated sites on the severity of deer related impacts (e.g. from review of site-specific material). Additional further options to explore as potential sources of relevant data include: i) information collated by Scottish Government (RPID) relating to assessment of sporting rates by landowners as an indicator of sporting activity (note this would include other types of sporting activity eg pheasant shooting) ; ii) data from relevant grant spend (e.g. deer management grants); iii) information on licencing requests/licences granted for closed season, night shooting etc. as an indicator of culling activity (and potentially deer impacts); iv) wider and more effective stakeholder engagement (see below) to assess any data collection occurring on non-publicly owned sites in relation to deer counts, HIAs and venison sales. 5.2.1 Inter-agency working and direct engagement with GIS teams
There is a requirement during any second phase of work for direct engagement with agency GIS teams (and other staff relevant to data collection process), to ensure buy-in and an understanding of what has been collated up to now to ensure acquisition of any remaining relevant data. The acquisition (or creation) of accurate and up to date metadata (currently often absent) for datasets is also important to facilitate a fuller understanding of data origins, formats and acronyms. This process offers potential for learning additional wider lessons relating to developing consistent approaches, timescales and standards for data collection, recording and pooling of data. Aligning data collection and recording in combination with specific measures relating to private landholdings offers the potential for developing a sufficient shared pool of data to facilitate deer density calculations and estimates of deer damage in lowland regions. The differing context for deer management in the lowlands (smaller landholdings, less established structures), places a greater reliance on national level (often more generic) datasets and agency-led data collection for informing deer management, relative to upland DMG contexts. As such, enhancing the underlying knowledge base for informing deer management is likely to require novel approaches and an
38
emphasis on revising existing agency and national-level datasets and data recording processes (see below). 5.3 Future data gathering priorities
A number of priority data gaps have been identified, for which no underlying data exists. In particular, there is a sparsity of deer count and habitat impacts information for non-forested areas. There is also a lack of data on the location of deer fencing across the pilot area, with the exception of some FE sites. A potential requirement exists for further deer counts in the future, using a consistent approach (aligning count techniques), to allow for rigorous estimates of deer densities across the pilot area. However, this is likely to be difficult and costly in practice, particularly in terms of replicating counts on a regular basis. Critically, the additional data required depends in part on what specific questions/trends are viewed as being of greatest importance for informing management (e.g. deer populations, habitat impacts or both) and over what timescales or regularity of monitoring (e.g. 1-5yrs). The approaches taken to expanding the knowledge base to inform deer management in the pilot area requires a consistent and realistic approach that is transferable to other lowland areas. This may require modifications to existing national datasets (e.g. expansion of information relating to deer damage and tree maturity in the National Forest Inventory) or recording of new data (e.g. on deer fencing). Reflecting this emphasis on a pragmatic approach and the specificity of the lowland context the following specific recommendations are made for new data gathering: An expansion of effort around habitat impact assessments within the pilot area,
both on publicly owned land and on privately owned land through enhanced promotion (including of incentives) and engagement with private landowners over a longer-term period (2-3yrs). This should be linked to wider stakeholder engagement (see below) to ensure consistency in data collection and the development of a centralised process for recording HIA results.
The statutory cull returns data (71 specific returns for the pilot area) is useful: i) as a basis for assessing the extent of culling effort; ii) for providing a list of properties where deer management is occurring; and iii) for assessing stalking effort between landholdings and in relation to outcomes such as habitat impacts (subject to sufficient future data availability). It is recommended that an expansion of the requirements (questions) within the Deerline system be considered to enhance this system as a basic data collation route (e.g. to collate further information on deer populations and connected to the expansion of HIA effort recommended above). Additionally, all FE returns should be input using the property related to each cull, rather than the amalgamated Deer Management Unit (to standardise cull returns between FCS and SNH data and avoid loss of data specificity).
To further collection of wider relevant information on deer impacts on crops/agricultural land it is recommended that the potential for adding a question to the June Agricultural Census on deer management and or/deer impacts be assessed. This offers some potential for assessing variability in the levels of deer management and deer impacts on smaller landholdings across Scotland.
5.3.1 Stakeholder engagement and citizen science
The low levels of engagement with stakeholders (particularly landowners) during this project, as evidenced by the low survey response rates, suggest that engaging stakeholders with the pilot initiative represents a key component of capturing new data and should be an important element of any further phases of work. It is recommended that a longer-term phased approach be taken to stakeholder engagement across the pilot area to gain trust and build momentum. Three specific recommendations are made:

39
A stakeholder workshop or workshops should be run early in any second phase of this work. This process should include larger landowners, those actively involved in deer stalking (recreational and professional) and wider stakeholders (e.g. FCS, SNH, BDS, BASC etc.) and forest management companies operating within the pilot area. This process should be used to engage key stakeholders and achieve buy-in, as well as providing the basis for agreeing on-going data collection from landowners and stalkers and promoting adoption of HIA processes.
A revised landowner survey should be conducted in conjunction with the workshop(s) and based on the revised contacts database28. This should include an early meeting with wider stakeholders (BASC, SLE, BDS etc.), promotion through these channels and greater survey follow-up.
Consideration of the role of citizen science as a potential mechanism for recording information relating to deer within the pilot area. The BTO bird survey currently records deer presence and NBN data also provides map-outputs related to deer at national scale. Some potential may exist for refining of these data recording processes and/or the use of technology (Aps).
5.3.2 Modelling to support future decision making on deer management priorities
The assessment of key public interest factors can be undertaken using the proposed indicators outlined here (see Annex 1). However, the development of modelling approaches to support decision making for deer management is challenging at this stage, in particular due to the data gaps outlined above. One approach worth exploring is the use of spatial Multi-Criteria Decision Analysis (MCDA) to identify areas of susceptibility to deer impacts (Ozturk and Batuk, 2011). This would involve use of spatial information across the area regarding the pressures, impacts and features of interest, such as Deer habitat suitability; Conservation impacts (for example on habitats of conservation concern); Economic impacts (for example impacts on commercial forestry); Social impacts (for example deer-vehicle collisions).
These layers are then weighted according to ‘importance’, with the weightings determined by consultation with stakeholders (including the wider community in the area, not just those involved in deer management). These weighted layers are then combined in a GIS, with outputs showing impact susceptibility across the study area. However, a key aspect of this modelling approach is that it could be used to explore different scenarios, such as changing the weighting of the different layers to explore possible future changes in economic context, government priorities, or social desires. This approach can also be used to propose future spatial changes, for example if the government policy of afforestation resulted in more young forestry areas in the study area, then how such forestry may be impacted can be explored, or the options for placement of new forestry to reduce impacts. A key aspect to increasing the reliability and robustness of any modelling approach is the availability of key data, both as model input and to use in model validation. Datasets that we consider key to future model development include: Deer count or estimate data; HIA data; Forestry data (species, age/maturity, fencing); Agricultural land data at appropriate scale.
28 The cull returns data represents a useful course of contact details for landowners currently providing cull returns which could be used to inform any potential future workshops or landowner surveys and cross-checked against the landowners and stalkers database already developed for this review.
40
Finally, all of the above must be temporally appropriate for the modelling approach adopted, which is likely to require consistent/repeat data gathering. One possibility for modelling which incorporates a MCDA approach and recognises the strengths and limitations of the existing datasets and the lowland context, is that of modelling the susceptibility of land use to deer damage in conjunction with stalking effort over time. Long term (5-10yr) cull returns data can be mapped and assessed (in terms of change) to identify trends and highlight specific areas which may be susceptible to damage and wherein culling effort is low or declining. An expansion of HIA data recording over time and linking this to a central database offers greater potential for expanding this approach and linking it directly to variability in impacts over time for at least parts of the pilot area. This approach also offers potential for assessing the variability of stalking/culling effort between sites of similar landcover and susceptibility but under different models of management (e.g. FE rangers, private stalking, contracted, recreational syndicates etc.) and within and outwith designated sites (subject to sufficient data being made available). It should be noted however that while landcover susceptibility can be mapped in broad terms, the susceptibility of habitats and crops is dependent on a wide range of factors, including the maturity of trees, deer density, distance to cover, crop type, time of year and the existence or not of fencing. As data availability varies across the pilot area, this approach could initially be trialled within a specific case study site for which data availability is currently greater.
41
6. REFERENCES
Armstrong, H., Gill, R. Mayle, B. & Trout, R. 2003. Protecting trees from deer: an overview of current knowledge and future work. In Forest Research Annual Report and Accounts 2001-2002. Forest Research, Edinburgh, 28-39. Ferris, R. & Carter, C. 2000. Managing rides, roadsides and edge habitats in lowland forests. Forestry Commission Bulletin 123. Forestry Commission, Edinburgh. Forest Research, 2010. Key Ingredients of Collaborative Management. Research Summary. http://www.forestry.gov.uk/fr/infd-7h3amj Forestry Commission Scotland, 2014. Scotland’s Native Woodlands; Results from the Native Woodland Survey of Scotland. Holland, J., Mc Morran, R., Morgan-Davies, C., Bryce, R., Glass, J., Pollock, M., McCracken, D., Glass, R., Woolvin, A. & Thomson, S. 2016. Meeting the challenge of wild deer research to support delivery of sustainable deer management in Scotland. Report for Scottish Government, Scottish Natural heritage and Forestry Commission Scotland. Project No. SCL/025/15. JMP Consultants, 2011. The Indirect Costs of Deer Vehicle Collisions. Report to Scottish Natural Heritage. Mayle, B. A. & Armstrong, H. M. 2001. Deer population dynamics, pp. 1–7 in Laker, J. P. and Milne, J. A. (eds.), Future Perspectives for Woodland Deer in Scotland (1st Conference on Woodland Deer Management, September 2001). Coylumbridge: Macaulay Institute. Massimino, D. & Calladine, J. 2017. Modelled abundance and change in abundance of Red Deer and Roe Deer in Scotland from Breeding Bird Survey data. BTO, Thetford. Langbein, J. 2017. Deer-vehicle collisions in Scotland: data collection and collation to end of 2015. Scottish Natural Heritage Commissioned Report No. 950. Maffey, G., Reed, M., Irvine, R.J. & van der Wal, R. 2013. Habitat monitoring in the wider countryside: A case study on the pursuit of innovation in red deer management. Journal of Environmental Management, 128, 779-786. Putman, R., Langbein, J., Green, P. & Watson, P. 2011a. Identifying threshold densities for wild deer in the UK above which negative impacts may occur. Mammal Review, 41(3), 175-196. Putman, R., Watson, P. & Langbein, J. 2011b. Assessing deer densities and impacts at the appropriate level for management: a review of methodologies for use beyond the site scale. Mammal Review, 41(3), 197-219. Putman, R. 2012. Scoping the economic benefits and costs of wild deer and their management in Scotland. Scottish Natural Heritage Commissioned Report No. 526. Scott, D., Bacon, P. & Irvine, J. 2002. Management of deer in woodlands: literature review of decision-making and report on decision modelling workshop. Centre for Ecology and Hydrology, Report to Deer Commission Scotland, March 2002. http://nora.nerc.ac.uk/4552/1/N004552CR.pdf

42
Scott, D. & Palmer, S.C.F. 2000. Damage by deer to agriculture and forestry. Report to Deer Commission for Scotland. Institute of Terrestrial Ecology, Banchory Research Station. Scottish Government, 2013. 2020 Challenge for Scotland’s Biodiversity – A Strategy for the conservation and enhancement of biodiversity in Scotland. June 2013. Scottish Natural Heritage, 2016. Deer Management in Scotland: Report to the Scottish Government from Scottish Natural Heritage 2016. October 2016. Scottish Parliament, 2017. Environment Climate Change and Land Reform Committee. SP Paper 117, 5th Report (Session 5). Report on Deer management in Scotland: Report to the Scottish Government from Scottish Natural Heritage. Published 3 April 2017.
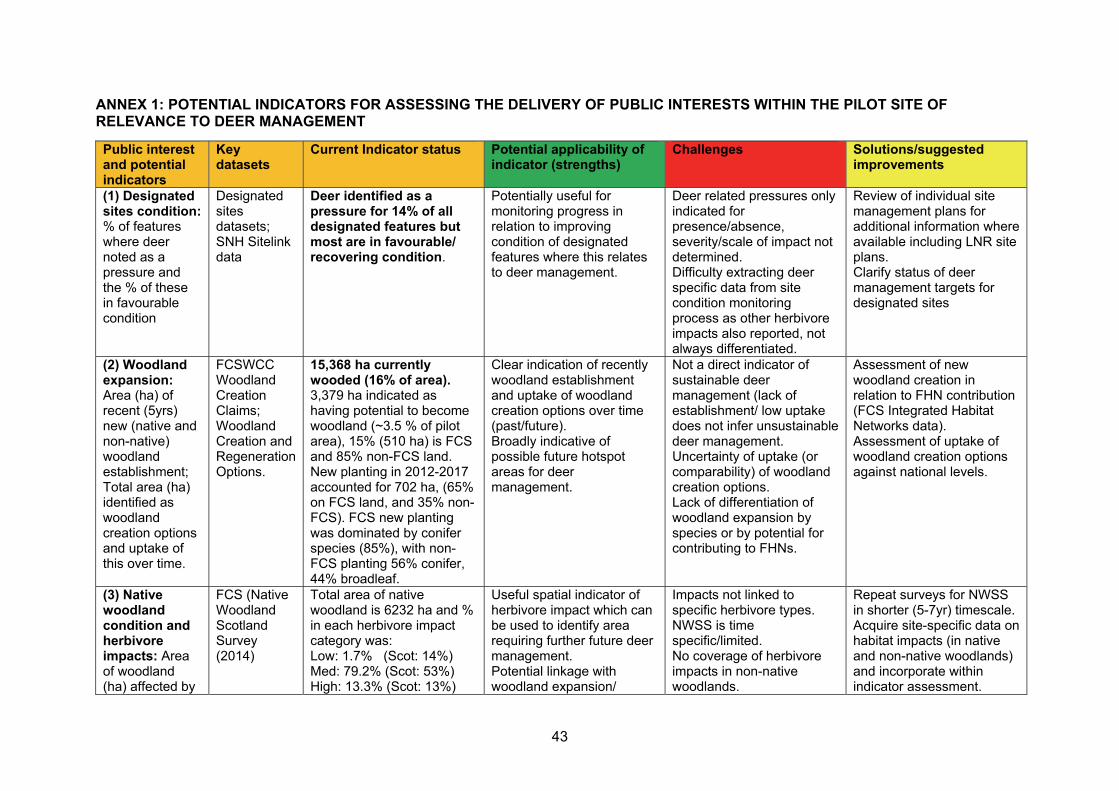
43
ANNEX 1: POTENTIAL INDICATORS FOR ASSESSING THE DELIVERY OF PUBLIC INTERESTS WITHIN THE PILOT SITE OF RELEVANCE TO DEER MANAGEMENT
Public interest and potential indicators
Key datasets
Current Indicator status Potential applicability of indicator (strengths)
Challenges Solutions/suggested improvements
(1) Designated sites condition: % of features where deer noted as a pressure and the % of these in favourable condition
Designated sites datasets; SNH Sitelink data
Deer identified as a pressure for 14% of all designated features but most are in favourable/ recovering condition.
Potentially useful for monitoring progress in relation to improving condition of designated features where this relates to deer management.
Deer related pressures only indicated for presence/absence, severity/scale of impact not determined. Difficulty extracting deer specific data from site condition monitoring process as other herbivore impacts also reported, not always differentiated.
Review of individual site management plans for additional information where available including LNR site plans. Clarify status of deer management targets for designated sites
(2) Woodland expansion: Area (ha) of recent (5yrs) new (native and non-native) woodland establishment; Total area (ha) identified as woodland creation options and uptake of this over time.
FCSWCC Woodland Creation Claims; Woodland Creation and Regeneration Options.
15,368 ha currently wooded (16% of area). 3,379 ha indicated as having potential to become woodland (~3.5 % of pilot area), 15% (510 ha) is FCS and 85% non-FCS land. New planting in 2012-2017 accounted for 702 ha, (65% on FCS land, and 35% non-FCS). FCS new planting was dominated by conifer species (85%), with non-FCS planting 56% conifer, 44% broadleaf.
Clear indication of recently woodland establishment and uptake of woodland creation options over time (past/future). Broadly indicative of possible future hotspot areas for deer management.
Not a direct indicator of sustainable deer management (lack of establishment/ low uptake does not infer unsustainable deer management. Uncertainty of uptake (or comparability) of woodland creation options. Lack of differentiation of woodland expansion by species or by potential for contributing to FHNs.
Assessment of new woodland creation in relation to FHN contribution (FCS Integrated Habitat Networks data). Assessment of uptake of woodland creation options against national levels.
(3) Native woodland condition and herbivore impacts: Area of woodland (ha) affected by
FCS (Native Woodland Scotland Survey (2014)
Total area of native woodland is 6232 ha and % in each herbivore impact category was: Low: 1.7% (Scot: 14%) Med: 79.2% (Scot: 53%) High: 13.3% (Scot: 13%)
Useful spatial indicator of herbivore impact which can be used to identify area requiring further future deer management. Potential linkage with woodland expansion/
Impacts not linked to specific herbivore types. NWSS is time specific/limited. No coverage of herbivore impacts in non-native woodlands.
Repeat surveys for NWSS in shorter (5-7yr) timescale. Acquire site-specific data on habitat impacts (in native and non-native woodlands) and incorporate within indicator assessment.
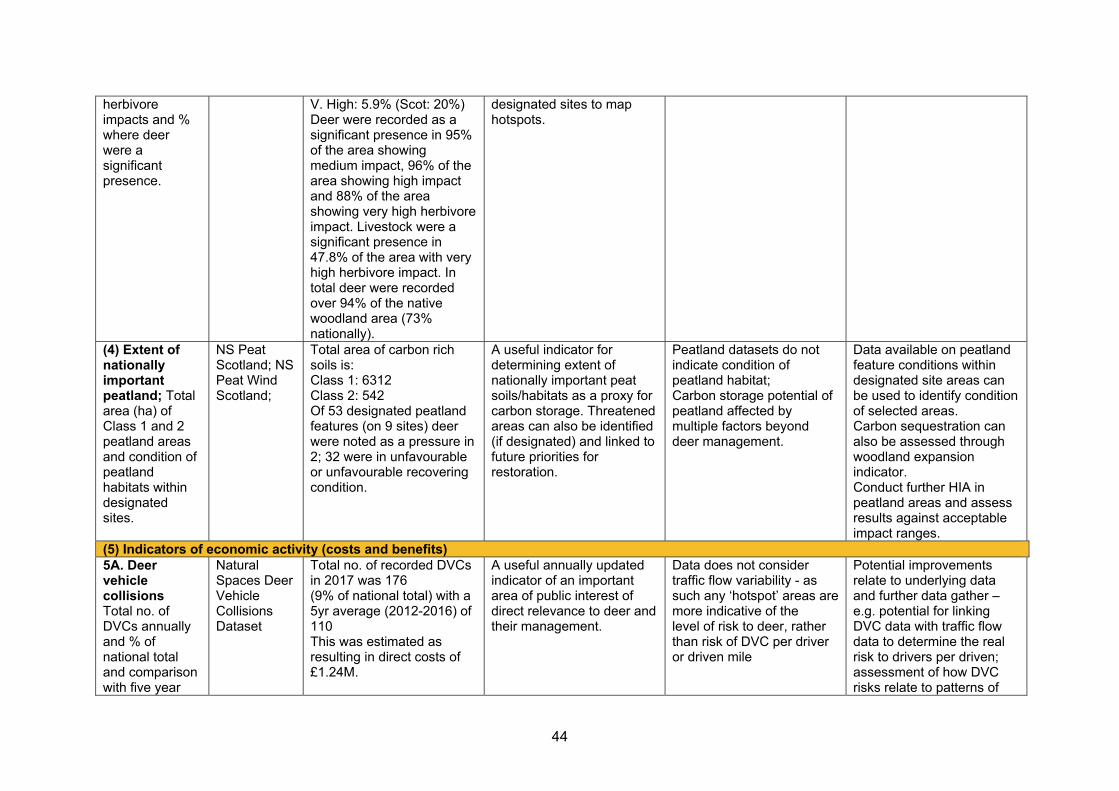
44
herbivore impacts and % where deer were a significant presence.
V. High: 5.9% (Scot: 20%) Deer were recorded as a significant presence in 95% of the area showing medium impact, 96% of the area showing high impact and 88% of the area showing very high herbivore impact. Livestock were a significant presence in 47.8% of the area with very high herbivore impact. In total deer were recorded over 94% of the native woodland area (73% nationally).
designated sites to map hotspots.
(4) Extent of nationally important peatland; Total area (ha) of Class 1 and 2 peatland areas and condition of peatland habitats within designated sites.
NS Peat Scotland; NS Peat Wind Scotland;
Total area of carbon rich soils is: Class 1: 6312 Class 2: 542 Of 53 designated peatland features (on 9 sites) deer were noted as a pressure in 2; 32 were in unfavourable or unfavourable recovering condition.
A useful indicator for determining extent of nationally important peat soils/habitats as a proxy for carbon storage. Threatened areas can also be identified (if designated) and linked to future priorities for restoration.
Peatland datasets do not indicate condition of peatland habitat; Carbon storage potential of peatland affected by multiple factors beyond deer management.
Data available on peatland feature conditions within designated site areas can be used to identify condition of selected areas. Carbon sequestration can also be assessed through woodland expansion indicator. Conduct further HIA in peatland areas and assess results against acceptable impact ranges.
(5) Indicators of economic activity (costs and benefits) 5A. Deer vehicle collisions Total no. of DVCs annually and % of national total and comparison with five year
Natural Spaces Deer Vehicle Collisions Dataset
Total no. of recorded DVCs in 2017 was 176 (9% of national total) with a 5yr average (2012-2016) of 110 This was estimated as resulting in direct costs of £1.24M.
A useful annually updated indicator of an important area of public interest of direct relevance to deer and their management.
Data does not consider traffic flow variability - as such any ‘hotspot’ areas are more indicative of the level of risk to deer, rather than risk of DVC per driver or driven mile
Potential improvements relate to underlying data and further data gather – e.g. potential for linking DVC data with traffic flow data to determine the real risk to drivers per driven; assessment of how DVC risks relate to patterns of
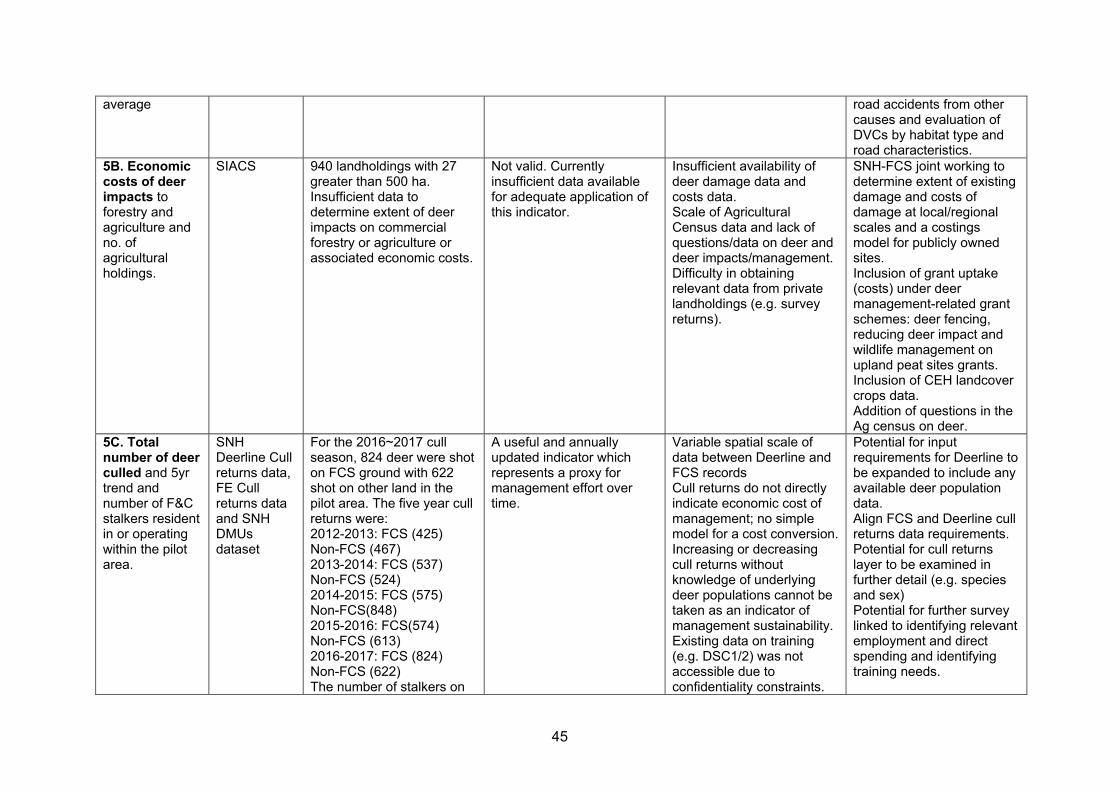
45
average
road accidents from other causes and evaluation of DVCs by habitat type and road characteristics.
5B. Economic costs of deer impacts to forestry and agriculture and no. of agricultural holdings.
SIACS 940 landholdings with 27 greater than 500 ha. Insufficient data to determine extent of deer impacts on commercial forestry or agriculture or associated economic costs.
Not valid. Currently insufficient data available for adequate application of this indicator.
Insufficient availability of deer damage data and costs data. Scale of Agricultural Census data and lack of questions/data on deer and deer impacts/management. Difficulty in obtaining relevant data from private landholdings (e.g. survey returns).
SNH-FCS joint working to determine extent of existing damage and costs of damage at local/regional scales and a costings model for publicly owned sites. Inclusion of grant uptake (costs) under deer management-related grant schemes: deer fencing, reducing deer impact and wildlife management on upland peat sites grants. Inclusion of CEH landcover crops data. Addition of questions in the Ag census on deer.
5C. Total number of deer culled and 5yr trend and number of F&C stalkers resident in or operating within the pilot area.
SNH Deerline Cull returns data, FE Cull returns data and SNH DMUs dataset
For the 2016~2017 cull season, 824 deer were shot on FCS ground with 622 shot on other land in the pilot area. The five year cull returns were: 2012-2013: FCS (425) Non-FCS (467) 2013-2014: FCS (537) Non-FCS (524) 2014-2015: FCS (575) Non-FCS(848) 2015-2016: FCS(574) Non-FCS (613) 2016-2017: FCS (824) Non-FCS (622) The number of stalkers on
A useful and annually updated indicator which represents a proxy for management effort over time.
Variable spatial scale of data between Deerline and FCS records Cull returns do not directly indicate economic cost of management; no simple model for a cost conversion. Increasing or decreasing cull returns without knowledge of underlying deer populations cannot be taken as an indicator of management sustainability. Existing data on training (e.g. DSC1/2) was not accessible due to confidentiality constraints.
Potential for input requirements for Deerline to be expanded to include any available deer population data. Align FCS and Deerline cull returns data requirements. Potential for cull returns layer to be examined in further detail (e.g. species and sex) Potential for further survey linked to identifying relevant employment and direct spending and identifying training needs.
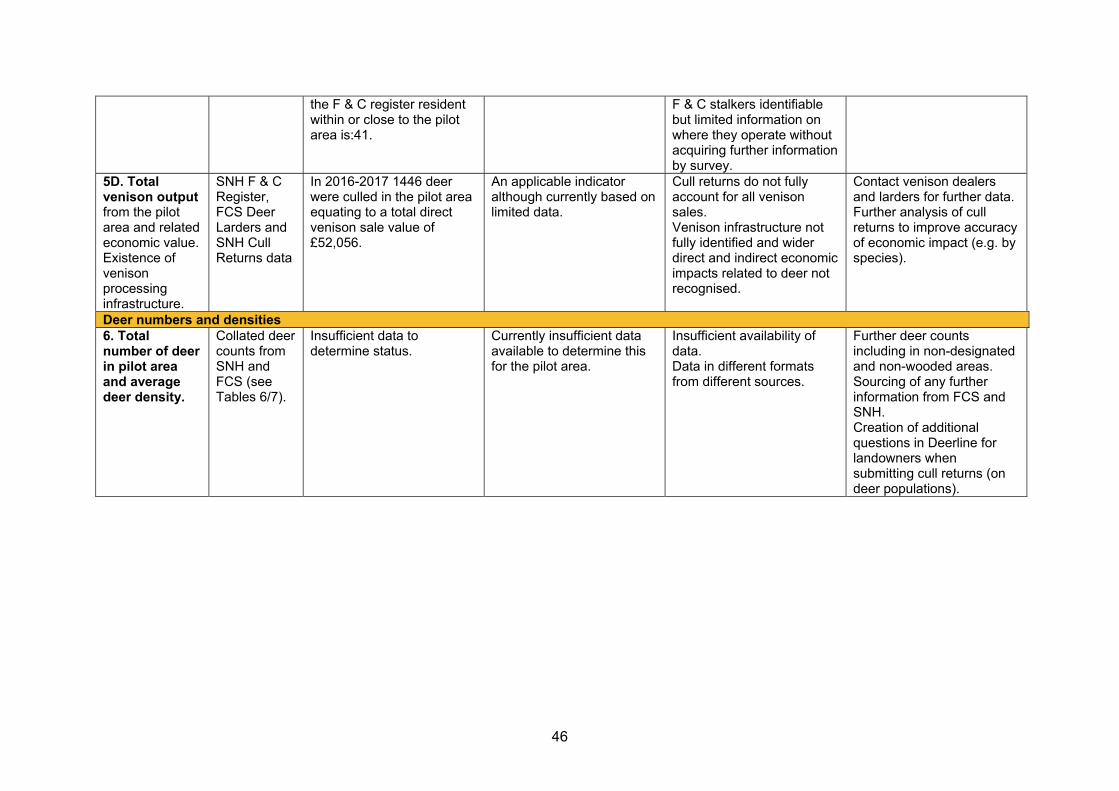
46
the F & C register resident within or close to the pilot area is:41.
F & C stalkers identifiable but limited information on where they operate without acquiring further information by survey.
5D. Total venison output from the pilot area and related economic value. Existence of venison processing infrastructure.
SNH F & C Register, FCS Deer Larders and SNH Cull Returns data
In 2016-2017 1446 deer were culled in the pilot area equating to a total direct venison sale value of £52,056.
An applicable indicator although currently based on limited data.
Cull returns do not fully account for all venison sales. Venison infrastructure not fully identified and wider direct and indirect economic impacts related to deer not recognised.
Contact venison dealers and larders for further data. Further analysis of cull returns to improve accuracy of economic impact (e.g. by species).
Deer numbers and densities 6. Total number of deer in pilot area and average deer density.
Collated deer counts from SNH and FCS (see Tables 6/7).
Insufficient data to determine status.
Currently insufficient data available to determine this for the pilot area.
Insufficient availability of data. Data in different formats from different sources.
Further deer counts including in non-designated and non-wooded areas. Sourcing of any further information from FCS and SNH. Creation of additional questions in Deerline for landowners when submitting cull returns (on deer populations).
47
ANNEX 2: PART 1 - DATA LAYER INVESTIGATION OVERVIEW
Forestry Commission Scotland datasets FCS National Forest Estate (FCSNWSS) Has primary, secondary and tertiary information on tree species type, area covered, land use type, habitat type and year of planting. Has very detailed small-scale polygons (some less than 0.1 ha) as well as larger scale but does also contain some areas of noise (edge effects and polygon slivers). This dataset is from 2017 so is the most accurate and up to date dataset on woodland available. Does also include non-woodland areas (open, urban etc.) indicated by the land use type fields. Most detailed and up to date list of woodland in the pilot area, but only for the national
forestry estate. This is a key element of the base layer and must override other datasets in its priority.
Contains detailed species information but also some broader classes. Maturity needs to be identified via year of planting, related to the species present. Does not contain information on deer numbers or browsing impacts. Land use info could also be used to inform on disturbance (car parks etc).
FCS Woodland Creation Options (FCSWCO) and Claims (FCSWCC) These are forestry grant scheme (FGS) related datasets. There is some overlap to each other as the claims need to be removed from the options (claims are claimed options). In the pilot area all of the claims are from 2016/17 so can be counted as young trees that have been planted and they have detailed species information. Options range in date from 2009~2016 and do not specify species but do have broad categories. Class all claims as young stands and add them into the woodland base layer. Again, a
higher priority for this dataset. Options can be used to indicate where planting is to occur in the future (claims need to
be deleted from this layer). FCS WIG Restructuring Regenerations Options (FCSWRRO) and Claims (FCSWRRC) These are forestry grant scheme (FGS) related datasets and have some overlap to each other as these follow the same pattern as the woodland creation options and claims. All claims dated 2016/17 and options are similar (going into 2018). Options have less specific indication of what the woodland type might be. Class all claims as young stands and add them into the woodland base layer. Again,
higher priority for this dataset. Options can be used to indicate where planting is to occur in the future (claims need to
be deleted from this layer). FCS Native Woodland Survey of Scotland (FCSNWSS) From a survey in 2014, specifically of more native woodland types and also indicates plantations on ancient wood sites (PAWS). This dataset has type classification (native etc.), broad dominate habitat types and very specific species types (in a separate table). Native/semi native percent scores, maturity information (not date of planting), canopy cover information, structure information, herbivore impact scores (and tabled data detailing what species and percentage effect). Also has other accompanying tables that further detail structure/maturity/regeneration, habitat/nvc types and other traits (including possible disturbance factors). This is a key part of the woodland base layer and has a good table layout to use as a
basis for modelling, but the detail could make it difficult to use effectively.
48
Has less priority than the forestry estate information due to its age, but more priority than the national forestry inventory due to the species information (areas of windblow and felling will need to be identified).
The herbivore impact information can be used as a weighting layer and possibly to improve population scoring.
Use other traits linked to disturbance as a weighting layer. FCS National Forest Inventory (FCSNFI) Currently a 2016 dataset that is based off of yearly remotely sensed data (2017 update not due to later part of 2018) and includes other information from woodland grants and felling license information. Includes broad tree types and information on non-wooded areas and indicates if areas might have been clear felled, cleared for planting or windblown. This is also a primary part of the woodland base layer, but it is of lesser priority due to
its lack of species and maturity (apart from young trees) information. Use the windblow/felled information to amend the older FCSNWSS layer. Mature stands assumptions are as follows, however they should all be classed as
mixed maturity as true maturity is not known: o Broadleaved o Conifer o Mixed mainly broadleaved o Mixed mainly conifer
Young stands assumptions are as follows: o Young trees o Low density (possibility of regeneration occurring here) o Shrub (possibility of regeneration occurring here) o Felled (possibility of regeneration/replanting occurring here) o Ground Prep (possibility replanting occurring here) o Assumed Woodland (some of this area is covered by the woodland grant
scheme options/claims, but other areas could indicate forestry commission areas of new or expected planting).
Types to be discounted as woodland include: o Failed… unlikely to be natural regen according to documentation so ignore. o Windblown … unlikely to be natural regen according to documentation so ignore.
Could use information on non-woodland areas (urban etc.) to indicate possible disturbance for weighting.
FCS Felling License Applications (FCSFLA) A regularly updated dataset of felling activity since 2012, including area, type of felling (clear fell or thinning), the expiry date (when it should have occurred by) and a restock date. This dataset could have been used for the below weighting activities, however it contains multiple overlapping polygons for license applications for the same area and therefore requires considerably cleaning before being useful. Could use as weighting for new planted woodlands based off of restock dates (which
go into the 2020’s). Could be used as weighting for disturbance based off of license expiry date. Could be used to assign maturity but overlay to other woodland layers is not that
accurate (rather broad polygons in places). FCS Felling License Applications (FCSFLA1998-2011) An older dataset on all felling license applications before 2012. The last restock date for this dataset within the pilot area is 2017, so any area of restocking due to this should now be within other FCS layers.
49
FCS Fence 2003-2016, only covering a small area, and in line shape file format. Can be used as a weighting to say likelihood of deer impact is minimal for the
woodland it encloses. FCS National Forest Estate Roads Shows larger roads/tracks that go through national forest estate woodland. Some are already included in the OS Open roads layer. This could be used as a weighting for deer disturbance and/or show accessibility for
stalkers operating within an area. FCS Native Woodland Integrated Habitat Network (FCSNWIHN) A 2015-2016 dataset of core, primary and secondary zones for integrated habitat network of native woodlands. Core is the main zone to use, other zones are more economic in nature (termed least-cost distance 500m and 2000m) and seem to indicate the dispersal ability of the core. Could be used as part of a weighting factor of the woodlands importance (the CORE)
and is used when assessing forestry grant schemes under SRDP. FCS Woodland in and Around Town (FCSWIAT) Priority and secondary areas for woodland in and around towns (WIAT). Use as a weighting for importance of woodland to populace.
FCS WIG WIAT URBAN MP (FCSWIATUMP) Shows extent of dedicated Woodland in and around town woodlands, but very small number in area. Use as a weighting for importance of woodland to populace.
FCS Pinewood Zone (FCSPZ) Dated 2013, this shows the extent of to where Caledonian pinewood is classed as native. It intersects the pilot area to the NW a little bit. Could be used for weighting Caledonian pinewood species as could have higher
priority if within this area. FCS National Forest Estate Boundary (FCSNFB) This shows the extent of all lands that are part of the national forest estate. Useful for data processing/cleaning. FCS Woodland Grant Scheme 1 (FCSWGS1) Old grant data (up to 1991) that is by now included in the other woodland layers. No species information so of no major use. FCS Woodland Grant Scheme 2 (FCSWGS2) Old grant data (up to 1994) that is by now covered by other woodland layers. Has some broad species information but otherwise of no major use.
50
FCS Woodland Grant Scheme 3 (FCSWGS3) Old grant data (up to 2003) that is by now covered by other woodland layers. Has some broad species information but otherwise of no major use. FCS Dedicated woods Woodland areas that have been dedicated as woodland under Basis I, II or III grant scheme (up to 1981), no species information, so no particular use for this dataset. FCS FGS Agro Forestry Forestry grant scheme information related to planting small woodlands on agricultural land. Seems to be an empty data set at the moment so not much use. FCS FGS Deer Fence High Cost Shows areas where the cost of deer fencing is higher due to the terrain. All outside of the pilot area but this could be used as an economic cost weighting for erecting deer fences. FCS SMF Species Conservation Shows woodland areas where protection is being provided (via grants) to help conserve a species. Grants can relate to reducing deer impact, however only one area within the pilot area and this is related to grey squirrel control FCS Caledonian Pinewoods Shows the boundaries of native Caledonian pinewoods, however there are none in the pilot are. Could be useful for highlighting species and weighting of native forest. FCS WIG WIAT Footpaths Line features of footpaths created with grants within WIAT woodland areas. None within the pilot area but could be used as weighting for disturbance in woodlands. FCS WIG WOODLAND GRAZING Shows boundaries for woodland that have a grazing management plan in place. There are none within the pilot area. Could be used for weighting of woodlands that are already under grazing pressure. Scottish Natural Heritage - Natural Spaces datasets NS HABMOS Created in 2015 and revised 2017, this contains NVC and EUNIS data combined (along with FCSNFI and FCSNWSS but converted to use EUNIS codes). A fair amount of overlap with the other woodland layers because of this but also includes some new areas and things like hedgerows, gardens etc. Lists habitat types (broad tree species), some of which are not related to woodland, and it could be useful for separating out woodlands into species where FCS data is not present and only broad types can be seen from the inventory. Can be sorted by survey date (from 1990s to 2017). Unfortunately, this dataset is not clean at all, as it has multiple overlapping polygons
for the woodland and other areas, so one area could be more than one type (and could be counted twice). Needs a lot of cleaning before it is useful.
NS National Vegetation Classification Dataset dated as 2017 but unsure if all valid at that date (likely many in there are older as well but not indicated). Covers small areas of woodland base (and some extra non-woodland areas). Has NVC codes for those areas so could be used to split woodland into types if not already in national forest inventory or other FCS datasets.
51
Unfortunately, this dataset also has multiple overlapping polygons within it so it would require cleaning/processing before use to avoid incorrect spatial distribution. Needs a lot of cleaning before being useful.
NS European Nature Information System raster Dataset dated as 2014 and includes broad habitat types using EUNIS habitat codes that could be used as a catch all for woodland layer, also might influence weightings on deer movement etc. Also has information on its sources of data, some of which is quite old (Land cover map 2000 for instance). This layer could be useful for a catch all for any woodland areas where only broad tree
species are known. However, this would require conversion of EUNIS codes to species types so may still end up being quite broad.
This layer could be used for disturbance weighting, however there are other sources that would do this better.
Potential for using this to identify peat bog areas, although dedicated layers for this are likely to be more recent.
NS Ancient Woodland Inventory Scotland (NSAWI) Ancient woodland inventory (2000-2010) Overlaps some but not all other woodland layers (plus some excluded). Could be useful for weighting as lists ancient woodland areas which may have more
priority. NS Scottish Semi-Natural Woodland Inventory A rather old dataset from 2001 that has naturalness, planting state, broad tree species, categories (e.g. parkland etc.) and canopy cover. It could be used to assign classes and maturity but is rather old. Could be used as a weighting for woodland importance but other newer datasets are
more valid this. NS CSGN Integrated Habitat Networks (NSCSGNIHN) Dated 2012 General buffers around core areas of woodland (not all overlapping other woodland areas). Also cover wetland and peatland areas and shows hotspots and core areas that could be used as weightings. Could be of use when weighting woodland susceptibility as core woodland areas could
have a higher priority. Similarly, could be used as a weighting for peatland susceptibility.
NS Sites of Special Scientific Interest (NSSSSI) Shows the special extent of areas of scientific interest. PA_CODE links to SNH Sitelink where features and pressure on those features can be reviewed (including grazing deer pressure). Use as a weighting for importance of area for conservation. Use to indicate presence of deer.
NS Special Areas of Conservation (NSSAC) Shows the special extent of areas of special conservation. PA_CODE links to SNH Sitelink where features and pressure on those features can be reviewed (including grazing deer pressure).
52
Use as a weighting for importance of area for conservation. Use to indicate presence of deer.
NS Special Protection Areas (NSSPA) Shows the special extent of areas of special protection. PA_CODE links to SNH Sitelink where features and pressure on those features can be reviewed (including grazing deer pressure). Use as a weighting for importance of area for conservation. Use to indicate presence of deer.
NS RAMSAR Wetland Conservation Areas (NSRAMSAR) Shows the special extent of areas for the protection of wetlands. PA_CODE links to SNH Sitelink where features and pressure on those features can be reviewed (including grazing deer pressure). Use as a weighting for importance of area for conservation. Use to indicate presence of deer.
NS National Nature Reserves (NSNNR) Shows the special extent of areas that are classified as National nature reserves. Use as a weighting for importance of area for conservation. Further details of deer pressure might be available from management plans.
NS Local Nature Reserves (NSLNR) Shows the special extent of areas that are classified as local nature reserves. Use as a weighting for importance of area for conservation. Further details of deer pressure might be available from management plans.
NS Scottish Natural Heritage Owned Land (NSSNHOL) Shows the spatial extent of land owned by SNH. Further details of deer pressure might be available from management plans if there are
any. NS Land Character Assessment (NSLCA) Land character assessment (from 1994~2002) that has broad land classification types and other features of the landscape, including possible disturbance indicators and pressures information (further analysis of the codes required to understand their meaning). Could be useful for weighting woodland disturbance and economic activity but it is very
broad. NS Scotland Wildness Composite (NSWC) This raster layer (dated 2014) indicates the relative wildness of areas across Scotland. It has values from 1 to 256, with higher pixel values indicating wilder land. Could be useful for weighting woodland disturbance.
NS Deer Count Density Scotland This vector data details deer count density polygons, however there are none for the pilot area (all in the highlands).
53
NS Deer Count Groups This point data details deer count group points, however there are none for the pilot area (all in the highlands). NS Deer vehicle collision (NSDVC) Has details from 2000 to 2016, some mention species type but most do not. Each point represents a single impact. Data is not that clean and needs work as many points (more of the older ones) are not fixed or even close to the road network. Can be used to add to deer population model or to identify deer movement routes. 2017 data update will be available.
NS DMU Scotland Spatial extent of deer management units across Scotland, includes links to corresponding deer management groups. Can be used to identify properties/areas where deer management is occurring. Could be used as basis of deer cull property locations.
NS DMG Scotland Spatial data of deer management groups across Scotland. Only a limited number of lowland DMGs exist, with only two in the pilot area. Can provide basis for collaboration of deer management for multiple landholdings.
Datasets from other public sources NGO Woodland Trust Sites (NGOWT) Shows the spatial extent of Woodland Trust sites. Might be able to get more tree species information/herbivore impact from management
plans. Use as weighting for importance of conservation.
NGO Scottish Wildlife Trust Reserves (NGOSWT) Shows the spatial extent of Scottish Wildlife Trust reserves. Might be able to get more tree species information/herbivore impact from management
plans. Use as weighting for importance of conservation.
NGO Royal Society for the Protection of Birds Reserves (NGORSPB) Shows the spatial extent of Royal Society for the Protection of Birds reserves. Might be able to get more tree species information/herbivore impact from management
plans. Use as weighting for importance of conservation.
NGO National Trust Scotland Property (NGONTS) Shows the spatial extent of National Trust Scotland properties. Only a very small area covered in the pilot area, both of which are buildings, but outside of the pilot area, larger areas could be apparent. Might be able to get more tree species information/herbivore impact from management
plans.
54
Use as weighting for importance of conservation. NGO Land Capability for Forestry (NGOLCF) This 1:250,000 scale dataset from the James Hutton Institute shows areas that are most and least suitable for woodland planting. Could be used as an economic weighting for importance of protection of new
woodland planting due to their location. FSA Wild game handling establishments Excel spreadsheet obtained online from the Food Standards Agency (FSA) that details all establishments licensed in Scotland to handle wild game. Converted to point data using each establishments post code (FSA_WildGameDealers_All). Can be used to identify businesses that process/sell venison. Can potentially be used within a model to identify stalker effort required to move
carcass from shooting location to venison dealer. Likely to be duplicates with the SNH Approved venison dealers dataset.
Ordnance Survey open datasets OS Open road network (OSORN) Current details of the road network including minor roads (also contains some of the FCS forest roads). Use as weighting for disturbance. Use as an indicator for accessibility to an area (for stalkers). Use to enable processing of specific data type (e.g. deer vehicle collisions).
OS Open railways (OSOR) Current details of the railway network including minor roads. Use as weighting for disturbance.
OS Open railways (OSOR) Current details of the railway network including minor roads. Use as weighting for disturbance.
OS Open buildings (OSOB) Current details of known buildings. Use as weighting for disturbance.
OS Open water courses Current details of small and large water courses. May have use in future modelling for deer movement. OS Open surface water Current details of small and large surface water (lochs etc.). May have use in future modelling for deer movement. OS Open 1 km Grid 1 km grid squares. Useful for processing and modelling at specific scales.
55
OS Open Terrain 50 DTM Digital terrain model at 50 m resolution. Useful for backdrop mapping and potentially modelling. OS Open Map Local Raster A 1:10,000 scale raster. Useful for backdrop mapping. OS Open 250k Raster A 1:250,000 scale raster. Useful for backdrop mapping. OS Open GB Greenspace A vector layer detailing areas of managed public green space (golf courses etc.). Could be used as a weighting for disturbance or as areas that may be attractive to
deer.
56
Non-publicly available datasets direct from FCS and SNH SNH Deer Count Point Data Reports from James Hammond/Roisin McLaren (SNH) and shape files from SNH GIS department as a direct download. Covers to the North of the pilot area (around Flanders moss, a more complete dataset from 2014-2018, some with underlying tables, Nov 2017 reports needs to be converted into a shape file) and towards the South all around North of Glasgow and central belt (2011-2012). Mixed amount of information, some just counts, some counts with species, sex and age. Requires cleaning and merging. To be used to estimate population within the pilot area. To be used as a weighting for browsing impact. To be used as a weighting for economic activity potential.
SNH Deer cull point data (non-spatial) Excel spreadsheet from James Hammond (SNH) that contains property information (including eastings and northings for location) and deer cull returns for those properties (includes species, sex and age). Differs from FCS cull data as all cull returns are cantered on the property they were recorded at rather than where the cull actually occurred (this is fine for small properties but might be misleading for larger estates). Requires transformation into a spatial layer Can be used to inform population model. Can be used to identify stalking effort (activity).
SNH Approved venison dealer establishments An excel spreadsheet of all venison dealers within 30 miles of the pilot area. Converted to point data and loaded to the database (SNH_VenisonDealers). Can be used to identify businesses that process/sell venison. Can potentially be used within a model to identify stalker effort required to move
carcass from shooting location to venison dealer. Likely to be duplicates with the FSA Wild game handling establishments dataset.
SNH Fit and competent register An excel spreadsheet detailing all stalkers on the fit and competent register that reside close to or within the pilot area. Converted to point data based off of each stalkers postcode as not all have full contact details (SNH_FitAndCompentantRegister). Gives indications of number of stalkers operating within the pilot area.
FCS ATV tracks (FCSATV) ATV tracks information as line data (this was received directly from Anton Watson, FCS), very small areas of coverage. This has been clipped to project area and added to project as FCS_ATV_Tracks. There is also a proposed ATV tracks layer but this was empty and so not used. Could be used for weighting on ease of removal of deer carcasses.
FCS Deer Count Point Data One small helicopter survey from 2017 over Campsie Glen, received directly from Anton Watson (FCS). Contains Roe deer counts only (not separated by age or sex). Requires processing and merging with SNH data. To be used to estimate population within the pilot area.
57
To be used as a weighting for browsing impact. To be used as a weighting for economic activity potential.
FCS DMU Zones Expanded deer management unit zones for the lowlands forest district area. Included as FCS_DMU_Zones_LowlandsFD, as this appears to be used to collate deer cull returns from multiple FCS properties. FCS Effective Deer Utilisation (EDU) plot point data Only covers the Kilpatrick forest block and a small area to the North West that is within the pilot area boundary (Achray ledard), seemingly for 2012-2013 survey season only (four datasets, FCS_AW_EDU_Datset1~4, that all appear to have similar data). Received directly from Anton Watson (FCS). Unsure on how this data can be converted to show population or presence/absence. Included as raw data only, once analysed and understood correctly could be used to
show presence/absence of deer
FCS Cull Data Obtained from FCS. Scottish Lowland forest district, cull data from 2013-2017 from 7 large forest blocks, species only, no indication of sec or age (Anton Watson, FCS). Cowal and Trossachs forest district, cull data from 2016~2018, species, sex and age information but in a non-spatial csv file format only (Richard Eadington, FCS). Can be used to inform population model. Can be used to identify stalking effort (activity). Non-spatial data needs to be made spatial somehow but limited location information. Cowal and Trossach Non-spatial dataset load to project DB and named
CowellAndTrossachsFDCullReturns_2016_2018 FCS Deer browsing impact on woodlands Tabled data obtained direct from FCS, based on a Strath Caulaidh 2017 report covering a small number of forest coupes across the pilot area that have recently been restocked (Anton Watson, FCS). Indicates broad tree species and how they have been impacted by deer and other herbivore browsing. Also includes some information on fenced areas. Can be matched with the FCSNFE dataset using sub compartment identifers, in order
to make the data spatial Can be used to help create a deer browsing impact layer if it can be normalised with
the herbivore impact data with the FCSNWSS dataset effectively. FCS Deer Larders Point data created based off of known locations of FCS deer larder facilities (FCS_Larders). Can be used for modelling stalker effort in transporting deer carcasses for processing.
FCS Forest blocks detailing rangers Spatial extent of forest blocks indicating rangers active (or other deer management) received directly from FCS (Anton Watson). (FCS_AW_Rangers) Can be used to show stalker activity type within the national forest estate as details
named FCS rangers, Recreational Deer Management Permissions (RDMP) or no control being active.
58
ANNEX 2: PART 2 - DATA LAYER CREATION PROCESSING STEPS
Creating the designated sites layer (PROJECT_DesignatedSites) There are four datasets to convert into a single layer. The NSSSSI dataset essentially covers all of the others although there are slight differences to the spatial extent of each layer (so edge effects will be created). Joining NSSSSI, NSSAC, NSSPA and NSRAMSAR Union between NSSSSI, NSSAC, NSSPA and NSRAMSAR (0 tollerance, gaps
allowed) (DesignatedSitesUnion, 173 records) o Did multipart to singlepart (DesignatedSitesUnionMpSp, 1972 records) o Eliminated all records below 1 ha (DesignatedSitesUnionMpSpElim, 93
remaining, a lot of edge effects remained) o Eliminated all records below 0.5 ha (130, DesignatedSitesUnionMpSpElim2, 72
remaining) o Deleted all records below 100 m2 (2 records, 70 remaining) o Added Deer Pressure column and set to YES for each SSSI\SAC\SPA\RAMSAR
feature that had deer impact indicated (data received direct from SNH). o Exported DesignatedSitesUnionMpSpElim2to PROJECT_DesignatedSites
PROJECT_ DesignatedSites layer is now ready to be used to indicate the spatial extent of nature reserves within the pilot area, along with those that show signs of deer browsing pressure. Creating the nature reserves layer (PROJECT_NatureReserves) There are seven datasets to convert into a single layer. Joining NSNNR, NSLNR, NGOSWT, NGOWT, NGORSPB, NGONTS and NSSNHOL Union between NSNNR, NSLNR, NGOSWT, NGOWT, NGORSPB, NGONTS and
NSSNHOL (0 tollerance, gaps allowed) (NatureReservesUnion, 38 records) o Eliminated all records below 1 ha (NatureReservesUnion Elim, 34 remaining, a
few minor edge effects) o Exported NatureReservesUnion to PROJECT_NatureReserves
PROJECT_ NatureReserves layer is now ready to be used to indicate the spatial extent of nature reserves within the pilot area. Creating the current woodland layer (PROJECT_CurrentWoodland) There is a priority order of these datasets due to their provenance. FCSNFE is given priority as it is the most recent dataset and is directly from the FCS,
with species and year of planting. FCSWRRC and FCSWCC have secondary priority as they are also recent datasets
with detailed species and year of planting information. NWSS has tertiary priority even though it is a slightly older dataset, as it contains a
large amount of detail regarding the native woodlands surveyed FCSNFI is given the least priority despite it being more recent than FCSNWSS, as it is
remotely sensed and contains the least amount of information (only broad species and currently no maturity data).
The intention of this processing is to create a single layer that details the spatial extent of current woodlands across the site, with detailed tree species information and maturity. As this will consist of more than one dataset, accessing this information after the layer is constructed will differ depending on the initial source of the data. Further processing will be
59
required in order to fully unify all five data sources into a single layer that has a standardised layout. General observation on detail of datasets FCS National Forest Inventory (FCSNFI) has no records below 0.1 ha once separated
into single parts. FCS Native Woodland Scotland Survey (FCSNWSS) had only two records below 0.1
ha (both irrelevant). FCS National Forest Estate (FCSNFE) has a large number below 0.1, with many being
relevant but with some being errors (edge effects from previous merges expected) FCS Woodland creation claims (FCSWCC) also had multiple records below 0.1 ha (all
relevant). FCS WIG Restoration Regeneration Claims (FCSWRRC) also had several records
below 0.1 ha (all relevant). Checked that FCSWCC and FCSWRRC do not overlap each other or FCSNFE,
therefore direct union and update FCSNFE can be made as all claims 2016~2017 and contain species data and year planted.
Amalgamating the FCSNFE and associated woodland creation claims layers (FCSWCC and FCSWRRC). First merge FCSNFE with FCSWCC and FCSWRRC (there was no overlap between these different layers) to create good (surveyed) data set with PRI/SEC/TERSPECIES with date of planting (FCSNFE does have some data quality issues but the other two are clean). Joining FCSNFE to FCSWCC and FCSWRRC Extracted all felled areas from the FCSNFE where PRI/SEC/TERSPECIES is blank
and PRI/SEC/TERLANDUSE = Felled (59 records) o Exported to FCSNFE_Felled (to be used for the future woodland layer) o Deleted FOREST, COMPTMENT, SUBCOMPTID,BLOCK,
CULT_CODE,CULTIVATN and SHAPE_Leng Extracted all woodland areas from FCSNFE where species data present (in
PRI/SEC/TERSPECIES). (1617 records, remaining records all invalid as imply open areas, urban etc.) o Deleted FOREST, COMPTMENT, SUBCOMPTID,BLOCK,
CULT_CODE,CULTIVATN and SHAPE_Leng o Noticed lots of small parcels, some valid some left-over shards from prior
merging etc. Multipart to single part to break up polygons (FCS_NFE_MpSp, 3341
records) A large number of records below 0.1 ha, however most are valid as small
parcels of woodland (457 records) Deleted all records less than 10 m2 (5 records) as these were just bad
data. Deleted ORIG_FID
Union between FCS_NFE_MpSp and FCSWCC (0 tollerance, gaps allowed) (FCS_Union2, 3392 records)
o Selected FCSWCC records (FID_FCS_FGS1420_WOOD_CREATION_CLAIM <> -1) (56 records). o Copied SPECIES data to PRISPECIES o Copied CLAIM_YEAR to PRI_PLYEAR o Set PRIPCTAREA to 100 (the primary species accounts for 100 %)
60
o Deleted CLAIM_YEAR, CONS_NAME, OPTIONCODE, OPTIONAME, SPECIES, SCHEMENAME, FGS_REF_NO and FID_FCS_FGS1420_WOOD_CREATION_CLAIM
Union between FCS_Union2 and FCSWRRC (0 tolerance, gaps allowed) (FCS_Union3, 3407 records) o Selected FCSWRRC records
(FID_FCS_FGS1420_WIG_REST_REGEN_CLAIM <> -1) (15 records). o Copied SPECIES data to PRISPECIES o Copied CLAIM_YEAR to PRI_PLYEAR o Set PRIPCTAREA to 100 (the primary species accounts for 100 %) o Deleted CLAIM_YEAR, DESCRIPTOR, CONS_NAME, OPTIONCODE,
OPTIONAME, SPECIES, SCHEMENAME, FGS_REF_NO and FID_FCS_FGS1420_WOOD_CREATION_CLAIM.
Cleaning the joined layers As there is PRI/SEC/TERSPECIES this does not always mean that the area in question is fully covered by trees, therefore only areas that show species greater than 20% of the entire area should be kept, with those less than 20% being either marked as low density or being ignored if windblown. Take FCS_Union3 and: Selected all where either PRILANDUSE, SECLANDUSE or TERLANDUSE was High
Forest and (PRIPCTAREA, SECPCTAREA or TERPCTAREA) >= 20% for high forest and exported to FCS_Union3_HighForest (3161) before deleting (246 remaining, no high forest primary land use records left)
Selected where PRILANDUSE = Research plantation and exported to FCS_Union3_ResearchPlantation (1 record) before deleting (245 remaining)
Selected where SECLANDUSE and TERLANDUSE were high forest and SECPCTAREA+ TERPCTAREA >= 20% and exported to FCS_Union3_HighForest_Extra (2 records) before deleting (243 remaining)
Selected where SECLANDUSE = Partially intruded broadleaf and SECPCTAREA >= 20% and exported to FCS_Union3_PIB (2 records) before deleting (241 reaming, no PIB in tertiary)
Selected where SECLANDUSE = High forest or PIB or TERLANDUSE = high forest and exported to FCSNFE_LowDensity (73 records) before deleting (168 remaining). (to be used for the future woodland layer)
Selected where SECLANDUSE= Felled and exported to FCSNFE_Felled_LD (3 records) before deleting (165 remaining, no felled in secondary or tertiary of remaining). (to be used for the future woodland layer)
Selected where PRILANDUSE = blank and exported to FCSCLAIM_YoungTrees (71 records, these were all the grants and claims, 2016/17 planting) before deleting (94 remaining).
The remaining records (94) can be ignored as they are windblow/unplantable or bare. Merged FCS_Union3_HighForest, FCS_Union3_HighForest_Extra,
FCS_Union3_ResearchPlantation, FCS_Union3_PIB and FCSCLAIM_YoungTrees to FCS_Union3_HighForest_Merge (3166 records).
FCS_Union3_HighForest_Merge is now cleaned and ready to be merged with the other current woodland layers. The FCSNFE_Felled, FCSNFE_Felled_LD and FCSNFE_Lowdensity layers ready to be merged with the other future woodland layers.
61
Clean FCSNWSS and remove FCSNFE from it and felled/windblown areas as indicated by FCSNFI First off take the FCSNWSS and add relates to its underlying tables (canopy structure, species structure etc.) and extract and save the all data from all tables where SCPTDATA_I matches the rows within FCSNWSS (the underlying tables are very large). Take FCSNWSS and: Then erase FCS_Union3_HighForest_Merge from FCSNWSS (FCS_NWSS_Erase,
2355 remaining) Then Multipart to single part (FCS_NWSS_Erase_MpSp, 2693 records) Then eliminate all records < 0.1 ha (edge effects, FCS_NWSS_Erase_MpSp_Elim,
2660 remaining) Then delete all records < 0.1 ha (edge effects, 292 deleted, 2368 remaining) Extracted Windblown and felled areas from original FCSNFI (called
FCSNFI_ALL_WindBlow_Felled, 292 records) Union between FCS_NWSS_Erase_MpSp_Elim and FCSNFI_ALL_WindBlow_Felled
(FCS_Union4, 2711 records) Deleted all records where no FCSNFI match to NWSS (269) Did multipart to singlepart (FCS_Union4_MpSp, 2542 records) Eliminated all records below 0.1 ha (130, FCS_Union4_MpSp_Elim, 2414 remaining) Deleted all records below 0.1 ha (2 records, 2412 remaining) Selected all records where IFT_IOA =Felled and extracted before deleting
(FCSNWSS_Felled, 72 records, 2340 remaining) (there were no windblown records) (to be used for the future woodland layer)
Deleted all unnecessary FCSNFI columns created during temporary union. Select all records where canopy PCT < 20 and export before deleting (predominately
open land habitat areas that could be regenerating, FCSNWSS_LowDensity, 87 records, 2253 remaining). (to be used for the future woodland layer)
FCS_Union4_MpSp_Elim is now ready to be merged with the other current woodland layers. FCSNWSS_Felled and FCSNWSS_LowDensity layers ready to be merged with the other future woodland layers. Clean FCSNFI and remove FCSNFE and FCSNWSS from it Not all IFT category types where within the pilot area for this dataset (e.g. coppice), so the below only shows the workflow the categories available. Then take FCSNFI and: Then Erase FCS_Union3_HighForest_Merge from it, and
FCS_NationalForestEstateBoundary and FCS_NWSS_Erase_MpSp_Elim (FCS_NFI_Erase3, 3400 records remaining). (this is to reduce the number of edge effects being generated).
Then multipart singlepart it (FCS_NFI_Erase3_MpSp, 10380 records) Then eliminate all records < 0.1 ha (edge effects, FCS_NFI_Erase3_MpSp_Elim, 9568
remaining) Then delete all records < 0.1 ha (edge effects, 6815 deleted, 2753 remaining) Select all rows where category = Non woodland and delete (not required, 91 records,
2662 remaining). Select all rows where IFT_IOA = Failed or Windblow and delete (unlikely to be
regeneration according to supporting docs, 19 records, 2643 remaining). Selected all rows where IFT_IOA = assumed woodland, exported them to
FCSNFI_AssumedWoodland and then deleted them (not specific in type of woodland to be used for the future woodland layer, 226 records, 2417 remaining).
62
Selected all rows where IFT_IOA = Ground Prep, exported them to FCSNFI_GroundPrep and then deleted them (not specific in type of woodland, to be used for the future woodland layer, 60 records, 2357 remaining).
Selected all rows where IFT_IOA = Young Trees, exported them to FCSNFI_YoungTrees and then deleted them (not specific in type of woodland, to be used for the future woodland layer, 192 records, 2165 remaining).
Selected all rows where IFT_IOA = Felled, exported them to FCSNFI_Felled and then deleted them (not specific in type of woodland, to be used for the future woodland layer, 158 records, 2165 remaining).
Selected all rows where IFT_IOA = Low Density, exported them to FCSNFI_LowDensity and then deleted them (not specific in type of woodland, to be used for the future woodland layer, 23 records, 1984 remaining).
Selected all rows where IFT_IOA = Shrub, exported them to FCSNFI_Shrub and then deleted them (not specific in type of woodland, to be used for the future woodland layer, 13 records, 1971 remaining).
FCS_NFI_Erase3_MpSp_Elim is now left with broad non-species specific IFT_IOA categories (broadleaf, conifer and mixed mainly broad or mixed mainly conifer) and is ready to be merged with the other current woodland layers. FCSNFI_AssumedWoodland, FCSNFI_GroundPrep, FCSNFI_YoungTrees, FCSNFI_Felled, FCSNFI_LowDensity and FCSNFI_Shrub layers ready to be merged with the other future woodland layers. Merge remaining FCSNFI with remaining FCSNWSS This is to get FCSNFI with the same table structure as FCSNWSS. Union between FCS_Union4_MpSp_Elim and FCS_NFI_Erase3_MpSp_Elim (0
tolerance, gaps allowed) (FCS_Union5, 4224 records) For all merged FCSNFI records set:
o SCPTDATA_I = 0 o PAWS_SURVEY = “NA” o TYPE = FCSNFI Category (all “Woodland” … new type) o CANOPY_PCT = (set based off of FCSNFI IFT_IOA indications)
Broadleaf or Conifer = 90 Either mixed = 80
o NATIVE_PCT = 0 o DOM_HABITA = FCSNFI IFT_IOA (Broadleaf, Confier, mixed mainly broadleaf
or mixed mainly conifer … all new types) o DOM_HB_PCT = (set based off of FCSNFI IFT_IOA indications)
Broadleaf or Conifer = 90 Either mixed = 80
o SEMINT_PCT = 0 o STRUCT_NUM = 0 o MATURITY = Mixed o DOM_STRUCT = Mixed (…new type) o HERBIVORE = Unknown (…new type) o ER_NAT_PCT = 0 o OTHR_TRIAT = No o INVASV_PCT and INVASV_NUM = 0
Once all set, all unnecessary FCSNFI columns were deleted. FCS_Union5 is now ready to be merged with the other current woodland layer.
63
Join remaining FCSNFE with remaining joined FCSNWSS & FCSNFI This is to get FCSNFE with the same table structure as FCSNWSS, however once joined in the union all of the FCSNWSS fields will be left blank or default for the joined FCSNFE records as interpolating between the two will be difficult. Union between FCS_Union5 and FCS_Union3_HighForest_Merge (0 tolerance, gaps
allowed) (CurrentWoodlandUnion, 7461 records) Exported CurrentWoodlandUnion to PROJECT_CurrentWoodland
o Deleted FID_FCS_Union5, FID_FCS_UNION4_MpSp_Elim, FID_FCS_NWSS_Erase_MpSp_Elim, HECTARES, SHAPE_LENG,AREA, LEN, FID_FCS_Union3_HighForestMerge, FID_FCS_Union2, FID_FSC_NFE_MpSp (just to tidy up).
PROJECT_CurrentWoodland layer is now ready to be used to indicate the spatial extent of woodland within the pilot area, indicating both narrow and broad species as well as age of stands for the majority of records. Creating the future woodland layer (PROJECT_FutureWoodlands) We need to create a separate layer that details areas of potential new planting that is in the planning phase (i.e. has not yet been planted). Potential information sources include: FCSWRO (need to remove claims from here). FCSWCO (need to remove claims from here). Exported FCSNFI layers not used for current woodland layer (young trees etc.) Exported felled & low-density areas from FCSNFE. Exported felled & low-density areas from FCSNWSS.
Merge all of the exported layers Merged FCSNFI_AssumedWoodland, FCSNFI_Felled, FCSNFI_Shrub,
FCSNFI_YoungTrees, FCSNFI_GroundPrep and FCSNFI_LowDensity (FCSNFI_FutureMerge, 672 records). o Deleted OBJECTID, Category, Shape_Leng, Hectares, ORIG_FID (leaving only
IFT_IOA as that is all that is required to indicate state of polygon). Merged FCSNFI_FutureMerge with FCSNWSS_Felled (FCSNFI_FutureMerge2, 744
records). Deleted all records where CANOPY_PCT = 0 from FCSNWSS_LowDensity (45
records, 42 remaining). Merged FCSNFI_FutureMerge2 with FCSNWSS_LowDensity
(FCSNFI_FutureMerge3, 786 records). o Set IFT_IOA = Low density for all records where IFT_IOA is null (42 records).
Merged FCSNFE_Felled with FCSNFE_Felled_LD (FCSNFE_FelledMerge, 62 records)
Merged FCSNFI_FutureMerge3 with FCSNFE_FelledMerge (FCSNFI_FutureMerge4, 848 records). o Set IFT_IOA = Felled for all records where IFT_IOA is null (62 records).
Merged FCSNFI_FutureMerge4 with FCSNFE_LowDensity (FCSNFI_FutureMerge5, 921 records). o Set IFT_IOA = Low density for all records where IFT_IOA is null (73 records).
Remove claims from options Erased FCSWCC from FCSWCO (FCS_WCO_Erased, 55 records remaining, 0 were
deleted).
64
Erased FCSWRRC from FCSWRRO (FCS_WRRO_Erased, 6 records remaining, 9 were deleted).
Union between FCS_WCO_Erased and FCS_WRRO_Erased (0 tollerance, gaps allowed) (FCS_OptionsUnion, 61 records) o Copied CLAIM_YEAR_1 to CLAIM_YEAR o Deleted SCHEMENAME, FGS_REF_NO, OPTIONNAME, OPTIONCODE,
CONS_NAME, DESCRIPTOR, CASE_NO, RPAC, ORGANISTN, CASE_OFFCR, TOTAL_AREA, CLAIM_YEAR_1
Multipart to single part FCS_OptionsUnion (FCS_OptionsUnionMpSp, 286 records) Erased PROJECT_WoodlandBase from FCS_OptionsUnionMpSp,
(FCS_OptionsUnionMpSp_Erase, 258 records remaining). o Manually erased options that were well outside of the pilot area (234 records
remaining). Merge exported layers and options Union between FCSNFI_FutureMerge5 and FCS_OptionsUnionMpSp_Erase (0
tollerance, gaps allowed, FutureWoodlandUnion, 1298 records). Multipart to single part FutureWoodlandUnion (FutureWoodlandUnionMpSp, 1807
records). o Eliminated all records below 0.02 ha (347, FutureWoodlandUnionMpSp_Elim,
1485 remaining) o Deleted all records below 0.02 ha (25 records, 1460 remaining).
Exported FutureWoodlandUnionMpSp_Elim to PROJECT_FutureWoodlands o Deleted FID_FCSNFI_FutureMerge5, FID_FCS_NWSS_Erase_MpSP_Elim,
HECTARES, SHAPE_LENG, AREA, LEN, ORIG_FID, FID_FCSNFI_ALL_WindBlow_Felled, OJECTID, Category, Shape_Leng, Hectares, FID_FCS_Union2, FID_FSC_NFE_MpSp, FID_FCS_OptionsUnionMpSp_Erase, FID_FCS_WRRO_Erased, FID_FCS_WCO_Erased and ORIG_FID (just to tidy up).
PROJECT_FutureWoodlands is now ready to show the extent of potential future woodlands within the pilot area. It does contain some null values and small parcels due to the options having some very small polygons within them, reducing the ability to use the eliminate function against a larger ha size. Creating the deer fence layer (PROJECT_DeerFence) The FCSFENCE dataset only covered a small area and was in line rather than polygon format. Further data was received directly from FCS (also in line format) that needed to be added to this dataset and converted into polygon format so that it could be used as a weighting layer. The FCSFENCE and extra fence line data was manually checked and edited to close
any gaps and remove duplicate records. FCSFENCE and the extra fence line data were then both converted into polygons
using the feature to polygon tool. The two polygons were then merged together (they were not overlapping) to create
PROJECT_DeerFence PROJECT_ DeerFence is now ready to show the extent of woodland that is protected by deer fencing. Creating the herbivore impact layer (PROJECT_HerbivoreImpact) For use in potential future hot spot analysis, the herbivore browsing data from the FCSNWSS dataset needs to be converted to point data and updated to include the three
65
different types of herbivore impact listed within the FCSNWSS underlying table (FCS_NWSS_HERBIVORE_IMPACT) Convert FCSNWSS to point using feature to point tool (using inside,
FCSNWSS_Points) Added three new columns (short integer) to FCSNWSS_Points, IMP_PCT_D (deer),
IMP_PCT_L (livestock), IMP_PCT_RH (rabbit or hare), all set to 0. Extracted all Deer damage records from FCS_NWSS_HERBIVORE_IMPACT to
FCSNWSS_DeerDamage o Unfortunately, this contains some duplicate values but IMPACT_PCT scores for
each duplicate were also identical. Extracted all Livestock damage records from FCS_NWSS_HERBIVORE_IMPACT to
FCSNWSS_LivestockDamage. o Unfortunately, this contains some duplicate values but IMPACT_PCT scores for
each duplicate were also identical except for one (a very small difference). Extracted all Rabbit or hare damage records from
FCS_NWSS_HERBIVORE_IMPACT to FCSNWSS_RabbitHareDamage. o No duplicates found.
Joined FCSNWSS_Points to FCSNWSS_DeerDamage using SCPTDATA_I o Set IMP_PCT_D to IMPACT_PCT and dropped join
Joined FCSNWSS_Points to FCSNWSS_LivestockDamage using SCPTDATA_I o Set IMP_PCT_L to IMPACT_PCT and dropped join
Joined FCSNWSS_Points to FCSNWSS_RabbitHareDamage using SCPTDATA_I o Set IMP_PCT_RH to IMPACT_PCT and dropped join
Exported data to PROJECT_ HerbivoreImpact PROJECT_ HerbivoreImpact is now ready to show browsing effects on native woodlands. Creating the new planting herbivore impact layer (PROJECT_NewPlantingHerbivoreImpact) For use in potential future hot spot analysis, the herbivore browsing data from the Strath Caulaidh report entitled “Deer browsing impacts on re-stock sites: Scottish Lowlands Forest District 2017” needs to be converted into point data. Extracted all of the data from the report into excel and cleaned to ensure a row for
each FES coupe code. o Created two files, fenced and unfenced.
Imported into project and joined with the FCSNFE layer (SUBCOMPTID = Fes Coupe Code) before exporting to new polygon layers. o Created FCS_DeerBrowsingImpacts_Fenced and
FCS_DeerBrowsingImpacts_Unfenced o Noticed that the fenced data (only three records) is completely overlapped by the
unfenced data. Converted FCS_DeerBrowsingImpacts_Unfenced to point using feature to point tool
(using inside, PROJECT_NewPlantingHerbivoreImpact) o FCS_DeerBrowsingImpacts_Fenced was ignored for the time being due to the
overlap. PROJECT_ NewPlantingHerbivoreImpact is now ready to show browsing effects on recently planted woodland. Creating the deer population count layer (PROJECT_DeerPopulationCount) There was no deer population count data for the pilot area from publicly accessible records, so this had to all be cleaned and amalgamated from datasets sent directly by SNH and FCS.
66
Some of the data was in point form, but some was only accessible via reports so had to be manually input. Converting into a single layer for all count data One of the point file datasets (North of Glasgow population counts), was already in an amalgamated form, so this layout will be taken and modified to add in count type and species, with the other datasets either manually entered or merged in and amended using the schema information below. The final dataset is named PROJECT_DeerPopulationCount. CentralBeltUrbanDeerCountData 2011 Group ID, count_name, Season and Date were already set in the point file. ROE_U = UNCL ROE_M = MALE ROE_F = FEMALE ROE_J = JUVENILE SurveyType = Ground
Mugdock 2012 GROUP_ = GROUP_ID Count_name = Mugdock Season = Jan 12 Date_ = 23/01/2012 ROE_U = UNCLASSIFI ROE_M = MALE ROE_F = FEMALE ROE_J = JUVENILE SurveyType = Ground
Campsie Glen 2017 (FCS) One count from March 2017, with each point being 1 Roe deer (no reds). Direct from Anton Watson as point data. Merged into main dataset. GROUP_ = 0 Count_name = CampsieGlen2017 Season = Mar 17 Date_ = 01/03/2017 ROE_U = 1 for each point TOTAL = 1 for each point SurveyType = Aerial (all other fields 0)
FlandersMoss 2014 GROUP_ = HID Count_name = FlandersMoss2014 Season = Apr 14 Date_ = 01/04/2014 UNKNOWN = TOTAL (where SPECIES not indicated) ROE_U = TOTAL (where SPECIES indicates is ROE) RED_U = TOTAL (where SPECIES indicates is RED SurveyType = Aerial
67
FlandersMoss 2015 Possible missing data as the total count is 453 but in the November 2017 report it indicates a larger number if the eastern and partial western count numbers are totalled (294 reds possibly missing from the western side). GROUP_ = Deer_Group Count_name = FlandersMoss2015 Season = Jan 15 Date_ = 20/01/2015 ROE_M = Male (where Comments indicates is ROE) ROE_F = Female (where Comments indicates is ROE) ROE_J = Kids (where Comments indicates is ROE) ROE_U = Uncl (where Comments indicates is ROE) RED_M = Male (where Comments indicates not ROE) RED_F = Female (where Comments indicates not ROE) RED_J = Kids (where Comments indicates not ROE) RED_U = Uncl (where Comments indicates not ROE, 1 row where this was only in
TOTAL but checking report revealed that they should all be RED) SurveyType = Ground
FlandersMoss 2016 There are errors in this dataset, it contains some rows with 0 count data (group ID’s 28-36). These appear to be invalid as they are located miles away from Flanders moss so have been deleted. Also group ID 23 has an incorrect total (says 2 but should be 4, this was amended). GROUP_ = Deer_Group Count_name = FlandersMoss2016 Season = Mar 16 Date_ = 15/03/2016 ROE_M = Male (where Comments indicates is ROE) ROE_F = Female (where Comments indicates is ROE) ROE_J = Kids (where Comments indicates is ROE) ROE_U = Unclass (where Comments indicates is ROE) RED_M = Male (where Comments indicates not ROE) RED_F = Female (where Comments indicates not ROE) RED_J = Kids (where Comments indicates not ROE) RED_U = Unclass (where Comments indicates not ROE, 1 row where this was only in
TOTAL but checking report revealed that they should all be RED) SurveyType = Ground
FlandersMoss 2017 May Point data was updated manually based off of the report/map. The point data has errors, multiple points at the same location and some points that are not marked on the map (deleted these three). Total once input = 546 however November 2017 report indicates total should be 562 so data missing somewhere (possibly on west side as three points on that side but no map/DCP data for it). GROUP_ = Deer_Group on map Count_name = FlandersMoss2017May Season = May 17 Date_ = 01/05/2017 SurveyType = Ground
68
FlandersMoss 2017 November Data was created manually based off of the report/maps. Could not add in the sex/age parameters as no indication on maps where these counts were based so all just as unclassified as their species. SNH reported 359 total deer in Eastern side however total came to 362 when data taken from map (1 extra roe and 2 extra red), Western side was fine at 102 total. GROUP_ = Deer_Group on map (made up for FE) Count_name = FlandersMoss2017Nov Season = Nov 17 Date_ = 07/11/2017 SurveyType = Ground
FlandersMoss 2018 April Data merged from point data using the below schema for the Eastern side (two groups had values of 0, these were left in). For the western side points were created manually based off of the report/maps. GROUP_ = Deer_Group on map (made up for FE) Count_name = FlandersMoss2018Apr Season = Apr 18 Date_ = 04/04/2018 ROE_M = MALE (where SPECIES indicates is ROE) ROE_F = FEMALE (where SPECIES indicates is ROE) ROE_J = JUVENILE (where SPECIES indicates is ROE) ROE_U = UNCLASSIFI (where SPECIES indicates is ROE) RED_M = MALE (where SPECIES indicates RED) RED_F = FEMALE (where SPECIES indicates RED) RED_J = JUVENILE (where SPECIES indicates RED) RED_U = UNCLASSIFI (where SPECIES indicates RED) SurveyType = Ground
Hogganfield 2018 Feburary Data merged from point data using the below schema (all Roe deer). GROUP_ = Deer_Group Count_name = Hogganfield 2018 Season = Feb 18 Date_ = 01/02/2018 ROE_M = MALE ROE_F = FEMALE ROE_J = JUVENILE ROE_U = UNCLASSIFI SurveyType = Ground
Creating the deer vehicle collision layer (PROJECT_DeerVehicleCollision) Data from 2000-2016, needed cleaning as many points are not above any roads as XY data seems to be poor, also some of the text for road numbers is also poor (DVC road named data needed cleaning). Requires the OS Open roads layer to be able to clean the data up. 2018 update (for 2017 data) was processed in the same way, however some schema changes were noticed. Cleaning DVC data Created new column RoadNumber Used field calculator to clean ROAD_NO data into RoadNumber

69
o Removed new line markers from road number text field using ( !RoadNumber!.replace(chr(10), "").replace(chr(13), "") ), also the character W, spaces, ? , . , “SLIP” and a bunch more.
Model to snap DVC points to roads Created model (SplitRoads) to split road network into all named roads Created model (SplitDVC) to split all DVC points using cleaned road names that
matched to split road names. Created model (SnapToRoads) to snap named road DVC points to named roads
(within 1.5 km radius). Snapped all remaining unnamed/erroneous DVC points to nearest road within 1.5 km. Merged all points back together again to create PROJECT_DeerVehcileCollision.
70
ANNEX 3: PART 1 - MODELLING SPECIFIC CONSIDERATIONS
Woodland susceptibility – current and future Current woodland dataset modelling considerations The PROJECT_CurrentWoodland layer contains species and maturity information for the majority of its polygons, however as it is formed from five sperate data sources, species and maturity information need to be accessed differently, or converted further into a more integrated single layer before attempting any modelling. For records extracted from the FCSNWSS dataset, the SCPTDATA_I column will be > 0, and this value can be used to access species, maturity and percentage of canopy cover data from the related FCS_NWSS_SPECIES_STRUCTURES table (SPECIES, STRUCTURE and SP_STR_PCT columns respectively). 79 different species are indicated within the pilot area including some broad classes, however the percentage of canopy cover can exceed 100% so this would need to be normalised. For records extracted from the FCSNFE, FCSWCC and FCSWRRC datasets, the SCPTDATA_I column will be 0 and the TYPE column will be blank. Species information can be accessed from the PRISPECIES, SECSPECIES and TERSPECIES columns, along with percentage that each species occupies within the polygon (PRIPCTAREA, SECPCTAREA and TERPCTAREA) and the year that it was planted (PRI_PLYEAR, SEC_PLYEAR and TER_PLYEAR). 63 different species are indicated within the pilot area, including some broad classes. For records extracted from the FCSNFI dataset, the SCPTDATA_I column will be 0 and the TYPE column will be “Woodland”. Species information can be accessed from the DOM_HABITA column and maturity from the MATURITY column and canopy cover from the CANOPY_PCT column. There are only four broad species types and maturity is always indicated as mixed. To identify species maturity for those records where only year of planting is indicated, a database of tree species and expected years before being classed as mature would be needed to ensure that a more consistent classification of maturity is available across the dataset. For polygons with broad species classifications and mixed maturity, weightings will need to be devised for them to fit within the menu of tree species. Future woodlands dataset modelling considerations The PROJECT_FutureWoodlands layer generally does not contain detailed species and maturity information except for records that have an IFT_IOA classification of “low density” and either have a SCPTDATA_I value > 0 (and therefore species, maturity and canopy percentage data within the underlying FCS_NWSS_SPECIES_STRUCTURES table), or have a SCPTDATA_I value = NULL and species data, percentage of area and year of planting within the FCSNFE related columns (e.g. PRISPECIES, SECSPECIES and TERSPECIES; PRIPCTAREA, SECPCTAREA and TERPCTAREA; and PRI_PLYEAR, SEC_PLYEAR and TER_PLYEAR). For all other records the species will not be known but could be inferred from records that have an IFT_IOA of “felled” but have a SCPTDATA_I value > 0, or where an RDC_OPTION code is present as this could indicate broad species type (e.g. Native woodland planting or productive conifers). Maturity for these records will also not be directly known, however they can be assumed to be immature if having an IFT_IOA of “young trees” or simply seedlings (or potentially not planted yet) for all remaining records. Records that have a non-NULL CLAIM_YEAR could potentially use this information as an indicator of date of planting, however some of these dates seem unreliable, especially as if these options had been planted they would have been present within the FCSWRRC and FCSWCC datasets.

71
ANNEX 4: PART 1 - LANDOWNER SURVEY
Assessing Public Interest Delivery in a Pilot Lowland Deer Management Area North of Glasgow Scotland’s Rural College (SRUC) is currently undertaking work for Scottish Natural Heritage to better understand current models of lowland deer management in relation to the delivery of Public Interests. We are collating relevant information to develop a deer management database for a 950 km2 pilot study site to the north of Glasgow, bounded by the main trunk roads and Loch Lomond to the West and Stirling to the east (see map). The area includes a mix of land uses and landownership types typical of lowland and peri-urban areas and includes areas of commercial forestry, farmland, amenity land, Local Authority land, development sites and small holdings. The project aims to collate information relating to deer management and key areas of public interest, including woodland expansion, protection and enhancement of native woodlands and impacts on designated sites by deer. Other areas of relevance include economic impacts associated with damage to woodland, agricultural crops and gardens and deer vehicle collisions and economic benefits derived from sporting leases and venison sales.
Figure 1. Project area boundary map
72
Landowner/deer manager call for information As part of this process SRUC are collating information from landowners and those involved in deer management, commercial or recreational stalking in the pilot area. If you are a landowner or deer manager active in the pilot area we would be very grateful if you could return the completed form below to us ([email protected]) by April 25th 2018. Please use as much space as required by typing directly into this document in the spaces below. Please note that all information provided will be treated as confidential and used only in aggregate form for the purposes of developing a deer GIS and carrying out spatial mapping of activity across the study area. If there are any specific questions which are not relevant or you are not willing to provide a response to please move on to the next question. Should you be willing to provide us with any additional data relevant to the questions below please contact us by email to send this on or if you have any specific questions about this work.
1. Your contact details and area of activity [Please provide your name, address, email and phone number below and the name of the landholding you own or stalk/manage deer on]
Response:
2. Please indicate the extent to which you stalk or manage deer on your land/the landholding you manage including any relevant information on:
a. The total area of land in the pilot study area owned or managed by you; b. Who manages deer and the number of deer managers/stalkers operating on
your landholding and extent of related employment; c. The presence/extent of any deer stalking leases on your landholding.
Responses:
3. Please provide information on deer counts and culls on your landholding/the landholding you manage/stalk on, including any available information on:
a. Cull numbers by deer type (any available information for 2013-2017) b. Any available deer count information by deer type (2013-2017)
Responses:
4. Please indicate below whether you or any other party has carried out Habitat Impact Assessments (HIA) on your land/the landholding you operate. If yes, please indicate:
a. Any key habitat impacts on your landholding related to deer; b. Any additional deer-related impacts (e.g. on crops): c. Whether you would be willing to make this HIA data available to us.
Responses:

73
5. Please provide some information on the costs and income related to deer
management on your landholding: a. Indicate total cost of deer management and deer-related activities on your
landholding in 2017 and broad cost areas; b. Indicate 2017 income from deer activity (commercial stalking, leases) c. Indicate (2017) amount of venison (number of carcasses) and income from
venison sales. Responses:
6. In relation to venison please indicate: a. Which businesses/game dealers you market you venison to; b. Whether you have a deer larder on your landholding.
Responses:
7. Please provide any other relevant information or any comments you wish to add about deer management on your landholding or in the wider pilot area:
Responses:
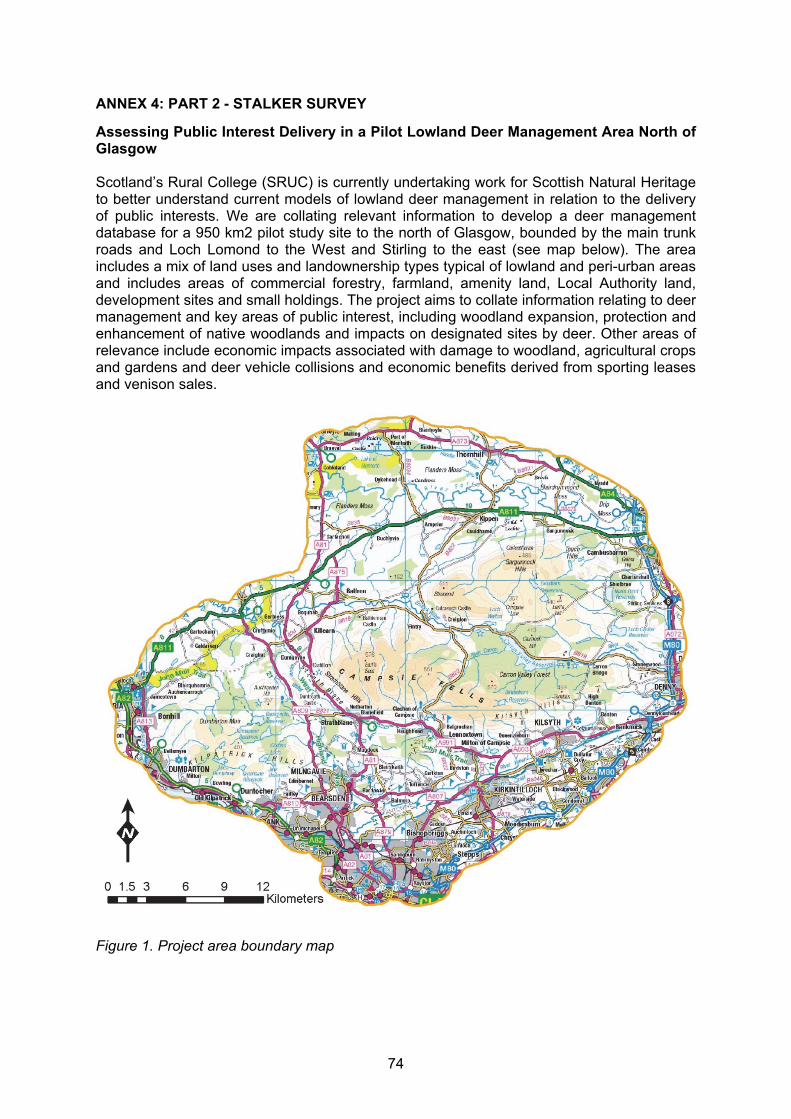
74
ANNEX 4: PART 2 - STALKER SURVEY
Assessing Public Interest Delivery in a Pilot Lowland Deer Management Area North of Glasgow Scotland’s Rural College (SRUC) is currently undertaking work for Scottish Natural Heritage to better understand current models of lowland deer management in relation to the delivery of public interests. We are collating relevant information to develop a deer management database for a 950 km2 pilot study site to the north of Glasgow, bounded by the main trunk roads and Loch Lomond to the West and Stirling to the east (see map below). The area includes a mix of land uses and landownership types typical of lowland and peri-urban areas and includes areas of commercial forestry, farmland, amenity land, Local Authority land, development sites and small holdings. The project aims to collate information relating to deer management and key areas of public interest, including woodland expansion, protection and enhancement of native woodlands and impacts on designated sites by deer. Other areas of relevance include economic impacts associated with damage to woodland, agricultural crops and gardens and deer vehicle collisions and economic benefits derived from sporting leases and venison sales.
Figure 1. Project area boundary map
75
Stalker survey As part of this process SRUC is collating information on anyone carrying out deer management, commercial or recreational stalking in the area. If you are engaged in any form of stalking or deer management in this area we would be very grateful if you could return the completed form below to us ([email protected]) by April 25th 2018. Please use as much space as required by typing directly into this document in the spaces below. Please note that all information provided will be treated as confidential. If there are any specific questions which are not relevant or you are not willing to provide a response to please move on to the next question. Should you be willing to provide us with any additional data relevant to the questions below please contact us by email to send this on or if you have any specific questions about this work.
1. Your contact details and area of activity [Please provide your name, address, email and phone number below and the name of the landholding(s) you or stalk/manage deer on]
Response:
2. The landholding(s) within or near the pilot study area (see map) where you stalk/manage deer.
Response:
3. The capacity in which you stalk/manage deer within these areas (e.g. as a professional stalker/deer manager, farmer, recreationally, as part of a syndicate etc.). If relevant please indicate
a. For whom you manage deer for on a professional basis; b. Which syndicate you are part of and on which landholding.
Response:
4. Please indicate the frequency of your stalking/deer management activity within the pilot area including an estimate of:
a. The number of times per year you are normally active in the area; b. The numbers of deer you shoot annually within the study area (and type of deer).
Responses:
5. Please indicate how you use any venison from the area including: a. Any personal/shared consumption b. Any specific game dealers used
Responses:

76
6. Please use this space to provide any other comments you may have in relation to your activity in this area.
Response:

www.nature.scot© Scottish Natural Heritage 2019 ISBN: 978-1-78391-564-4
Great Glen House, Leachkin Road, Inverness, IV3 8NWT: 01463 725000
You can download a copy of this publication from the SNH website.
nature.scot