Embed Size (px)
Citation preview
T E C H N I C A L R E P O R T 0 0 7 / 1 5
THE STATE OF THE GLOBAL CLEAN
AND IMPROVED COOKING SECTOR
ENERGY SECTOR MANAGEMENT ASSISTANCE PROGRAM
The Energy Sector Management Assistance Program (ESMAP) is a global knowledge and
technical assistance program administered by the World Bank. It provides analytical and
advisory services to low- and middle-income countries to increase their know-how and
institutional capacity to achieve environmentally sustainable energy solutions for pov-
erty reduction and economic growth. ESMAP is funded by Australia, Austria, Denmark,
Finland, France, Germany, Iceland, Lithuania, the Netherlands, Norway, Sweden, and the
United Kingdom, as well as the World Bank.
GLOBAL ALLIANCE FOR CLEAN COOKSTOVES
The Global Alliance for Clean Cookstoves (Alliance) is a public-private partnership
hosted by the UN Foundation to save lives, improve livelihoods, empower women, and
protect the environment by creating a thriving global market for clean and efficient house-
hold cooking solutions. The Alliance’s 100 by ‘20 goal calls for 100 million households
to adopt clean and efficient cookstoves and fuels by 2020. We are working with a strong
network of public, private, and non-profit partners to help overcome the market barriers
that currently impede the production, deployment, and use of clean cookstoves and fuels
in developing countries.
Copyright © May 2015The International Bank for ReconstructionAnd Development / THE WORLD BANK GROUP1818 H Street, NW | Washington DC 20433 | USA
Energy Sector Management Assistance Program (ESMAP) reports are published to communicate the results of ESMAP’s work to the development community. Some sources cited in this report may be informal documents not readily available.
The findings, interpretations, and conclusions expressed in this report are entirely those of the author(s) and should not be attributed in any manner to the World Bank, or its affiliated organizations, or to members of its board of executive directors for the countries they represent, or to ESMAP. The World Bank and ESMAP do not guarantee the accuracy of the data included in this publication and accept no responsibility whatsoever for any consequence of their use. The boundar-ies, colors, denominations, and other information shown on any map in this volume do not imply on the part of the World Bank Group any judgment on the legal status of any territory or the endorsement of acceptance of such boundaries.
The text of this publication may be reproduced in whole or in part and in any form for educational or nonprofit uses, without special permission provided ac-knowledgement of the source is made. Requests for permission to reproduce portions for resale or commercial purposes should be sent to the ESMAP Manager at the address below. ESMAP encourages dissemination of its work and normally gives permission promptly. The ESMAP Manager would appreciate receiving a copy of the publication that uses this publication for its source sent in care of the address above.
All images remain the sole property of their source and may not be used for any purpose without written permission from the source.
Written by | Venkata Ramana Putti, Michael Tsan, Sumi Mehta, Srilata KammilaEnergy Sector Management Assistance Program | Global Alliance for Clean Cookstoves | The World Bank

iii
T A B L E O F C O N T E N T S
Foreword vi
Acknowledgements ix
Abbreviations x
Terminology xi
Executive Summary 1
A. Key Findings 2
B. Recommendations 9
1 | Introduction 12
A. Typology of Improved and Clean Solutions 12
B. Report Objectives 14
C. Report Methodology 15
D. Report Scope 16
E. Report Structure 17
2 | The Case for Clean and Improved Cooking 18
A. The Impact of Cooking with Solid Fuels 18
B. Mitigation Potential of Improved and Clean Stoves 38
3 | THE Demand for Clean and Improved Cooking Energy 62
A. Overview of Global Fuel Landscape 62
B. Understanding the Consumer 71
4 | The Supply Landscape 84
A. Typology 84
B. Technology Trends 88
C. Current Market Status 94
5 | The Cooking Appliance Supply Chain 104
A. Research and Development 104
B. Production Models 104
C. Distribution 107
D. Consumer Marketing 109
E. After-Sales Service 110
F. Product Economics 110
6 | The Sector Ecosystem 116
A. Overview 116
B. Roles of Actors within the Ecosystem 118
C. Public and Donor Sector Engagement Models 119
D. Policy and Standards Landscape 122
E. The Financing Challenge 125
7 | Looking Forward and Recommendations 136
A. The Base Case for Sector Development 136
B. Barriers to More Rapid Growth 137
C. Potential for Faster Sector Development 140
D. Recommendations 142
Bibliography 147
ivT h e S t a t e o f t h e G l o b a l C l e a n a n d I m p r o v e d C o o k i n g S e c t o r
List of Boxes, Figures, and Tables
Box 3.1: Lessons from Marketing of Solar Lighting 79
Box 4.1: Emerging Fuel Technologies: Renewable Briquettes and Pellets 93
Box 7.1: Methodology: Forecasting Stove Penetration 137
Figure 1.1: Overview of Improved and Clean Cooking Technologies 13
Figure 2.1: Global Use of Solid Fuel for Cooking 19
Figure 2.2: Household Air Pollution Mortality and Morbidity, by Region 22
Figure 2.3: Global Solid-Fuel Cooking Biomass Pressure Map 27
Figure 2.4: Total Household Expenditures on Residential Cooking Fuels 29
Figure 2.5: Energy Share of Total Household Expenditures in Several Countries (%) 30
Figure 2.6: Energy Spending of Rural vs. Urban Consumers 31
Figure 2.7: Energy Spending of Top vs. Bottom Income Quintiles 32
Figure 2.8: Gender-Disaggregated Health Impacts 35
Figure 2.9: Firewood Collection and Cooking Time, by Gender 37
Figure 2.10: Field vs. Lab Performance of Rocket Stoves 41
Figure 2.11: Illustrative Examples of Baseline Cooking Technology Persistence 48
Figure 2.12: Employment Potential, by Fuel Type 50
Figure 2.13: Exposure Response Curve for Risk of Child Pneumonia from Particulate Matter 52
Figure 3.1: Solid and Modern Fuel Usage, by Region 62
Figure 3.2: Urban and Rural Fuel Use in the Developing World 64
Figure 3.3: Global Urban and Rural Fuel Use, by Region (population, millions) 65
Figure 3.4: Use of Solid and Modern Fuels, by Country 66
Figure 3.5: Forecast of Solid Fuel Users, by Region 67
Figure 3.6: Evolution of Primary Cooking Fuel Mix 68
Figure 3.7: Solid and Modern Fuel Usage, by Region 69
Figure 3.8: Nominal Average Price Trend for Key Cooking Fuels (2009–12) 70
Figure 3.9: Historical Fuel Cost for the Average Household in Sub-Saharan Africa 71
Figure 3.10: Cooking Consumer Segmentation, Rural vs. Urban 74
Figure 3.11: Consumer Fuel Segmentation, by Income and Region 75
Figure 3.12: Rural Household Willingness to Pay for Improved Cooking Solutions 76
Figure 3.13: Interest in Using Improved Cooking Solutions at any Price Point 78
Figure 3.14: Mapping Ability and Willingness to Pay, by Cooking Consumer Segments 79
Figure 3.15: Barriers to Adoption, by Consumer Segment 80
Figure 4.1: ISO Technical Committee 285 on Clean Cookstoves and Clean Cooking Solutions – Ongoing Progress 85
Figure 4.2: Thermal Efficiency and Emissions Ranges, by Stove Type 86
Figure 4.3: Indicative Health and Climate Impact, by Stove Type 87
Figure 4.4: Various Performance Metrics, by Stove Type 88
Figure 4.5: Overview of Charcoal Kiln Technologies 94
Figure 4.6: Cooking Technologies, by Regio 95
Figure 4.7: Distribution of Ceramic Jiko and Comparable Models in Sub-Saharan Africa 99
vT a b l e o f C o n t e n t s
Figure 4.8: Stoves and Organizations Tracked by the Global Alliance for Clean Cookstoves 100
Figure 4.9: Annual Sales of Industrial and Semi-Industrially Produced Stoves 101
Figure 4.10: Regional Segmentation of Modern Fuels 102
Figure 5.1: The Production and Post-Production Value Chains 105
Figure 5.2: Illustrative Production Models and Sector Actors 106
Figure 5.3: Illustrative Emerging Distribution Channels for Clean Cookstoves 108
Figure 5.4: Distribution of Costs along the Improved Stove Value Chain, by Production Process 111
Figure 5.5: Price and Annual Average Cost for Various Cooking Appliances 112
Figure 5.6: Improved Cookstove Cost Structure for Artisanal, Semi-Industrial, and Industrial Models 113
Figure 6.1: Overview of Clean and Improved Cooking Ecosystem 116
Figure 6.2: Examples of Key Players in Clean Cooking Sector 117
Figure 6.3: Illustrative List of Non-Governmental Organizations and Investors, by Fuel Type 118
Figure 6.4: Global Cookstove Programs Over Time 121
Figure 6.5: Examples of Cookstove Testing Facilities around the Globe 123
Figure 6.6: Financing Facilities from the Global Alliance for Clean Cookstoves 124
Figure 6.7: State of the Global Cookstoves Carbon Finance Market 132
Figure 7.1: Base Case Market Growth Forecast 136
Figure 7.2: Major Barriers Affecting the Clean Cooking Appliance Ecosystem 139
Figure 7.3: Barriers, by Technology Type 140
Figure 7.4: Funding for Clean and Improved Cooking Solutions 141
Table 2.1: Negative Externalities of Solid Fuel Cooking, by Impact Area 20
Table 2.2: Economic Impact of Global Solid Fuel Dependence ($, billions) 21
Table 3.1: Developing World Cooking Consumer Segmentation 72
Table 4.1: Regional Segmentation of Solid Fuel Improved Cooking Solutions 96
Table 4.2: Estimated Penetration of Renewable Cooking Technologies 102
Table 5.1: Research and Development Models 105
Table 6.1: Financing Needs, by Player 126
Table 6.2: Financing Solutions for Suppliers 127
Table 6.3: Financing Solutions for Consumers 129
viT h e S t a t e o f t h e G l o b a l C l e a n a n d I m p r o v e d C o o k i n g S e c t o r
F O R E W O R D
This is a moment of great opportunity for the clean cooking sector. While experts have been working
for decades on improving cookstoves and scaling up access to clean cooking fuels and technologies,
only recently has this issue become a major priority on the global development agenda. The world has
woken up to the serious health, environmental, and economic impacts of continued dependence on
biomass for cooking. At the same time, rapid progress in technology and new financial mechanisms to
support this sector have made real change possible.
Access to clean cooking is also central to the Sustainable Energy for All (SE4ALL) initiative, which is
backed by a large and diverse global coalition of international organizations, the private sector, and
civil society, and co-chaired by UN Secretary General Ban Ki-moon and World Bank Group President
Jim Yong Kim. The three overarching SE4ALL goals to be achieved by 2030—universal access to
modern energy services, doubling the share of renewable energy in the global energy mix, and
doubling the rate of improvement of energy efficiency—have now been broadly accepted, including
by 82 developing countries that have opted into SE4ALL. The result has been a large number of
initiatives to help achieve universal access to clean cookstoves and cooking fuels by 2030 as part of
the universal energy access goal.
At this defining moment, the Energy Sector Management Assistance Program (ESMAP) of the World
Bank is pleased to present this report on The State of the Global Clean and Improved Cooking Sector,
jointly developed with the Global Alliance for Clean Cookstoves. This report follows on a major re-
engagement by the World Bank in this sector, through interventions such as Africa Clean Cooking
Energy Solutions (ACCES), the East Asia and Pacific Clean Stove initiative (EAP CSI), and the SE4ALL
Technical Assistance Program, which is focused on helping countries meet the universal energy
access goal. Our strategic partnership with Global Alliance has informed our work in these endeavors,
which has now been further strengthened with the new joint initiative to spur the adoption of clean and
efficient cooking and heating solutions in developing countries.
We believe this report will be a key reference for sector practitioners. Beyond the comprehensive
assessment of the current state of the cookstoves sector, the report provides the first global
baseline for clean and improved cooking, including analyses of fuel and stove penetration, end-user
segmentation, and industry structure. It also proposes a common terminology to define various types
and categories of cooking devices. It offers lessons and recommendations that we hope will guide
key stakeholders—governments, private sector, and the donor community—in developing increasingly
effective interventions to help billions of people who still rely on biomass for their cooking needs.
Rohit Khanna
Manager
Energy Sector Management Assistance Program
viiF o r e w o r d
F O R E W O R D
2015 is a critically important year for international development. Events such as the Post-2015 Summit,
the Beijing+20 conference, and the 21st session of the Conference of Parties (COP) give world leaders
an unprecedented opportunity to make momentous progress on health, women’s empowerment, the
environment, and climate protection.
This year, the focus must be on implementation of proven solutions that can deliver benefits across
multiple sectors and are ready to scale up.
Consider, for a moment, the simple act of cooking. Imagine if we could change the way nearly five
hundred million families cook their food each day. It could slow climate change, drive gender equality,
and reduce poverty. The health benefits would be enormous.
Four years ago, when the Global Alliance for Clean Cookstoves (Alliance) was first launched, the issue
of household air pollution and the enormous health toll that the smoke from traditional cookstoves and
fuels took on the lives of women and their families in the developing world, received far less attention
and funding than it deserved. Hundreds of millions of women were literally risking their lives each
day to cook food for their families over inefficient cookstoves and polluting open fires, and spending
hours gathering fuel often at great personal risk. The environmental toll in terms of land degradation,
deforestation, and air pollution was poorly documented and largely ignored by the donor community.
Just a few years later, and with support from over 1,000 diverse global partners, including the World
Bank, the Alliance has made tremendous progress to develop new markets for clean cookstoves and
fuels. With growing global attention and a shift from an aid-driven approach to a market-based one that
is built on the premise of sustainability, there are now at least 20 million additional households using
cleaner and/or more efficient cookstoves and fuels around the world.
The Alliance is supporting market development in a number of ways: by strengthening capacity and
innovation within existing enterprises to ensure that high-quality cookstoves and fuels could be brought
to scale; by bringing in new manufacturers and distributors to further enhance the sector’s reach; by
creating awareness of and mobilizing capital for investment ready enterprises; by integrating women
throughout the cookstove and fuel value chains through our Women’s Empowerment Fund; and by
advocating for the advancement of policies that will enable and accelerate the clean cookstoves and
fuels market. The Alliance has also led the development of the standards process through engagement
with the International Organization for Standardization. We are now closer to achieving a set of global
standards that will help us deliver high-quality, effective, and independently tested products.
While the World Bank and Alliance have worked closely over the past few years, the Cookstove
Future Summit marked the announcement of an even closer collaboration between our organizations
to scale up adoption of cleaner and more efficient cookstoves and fuels. This new partnership offers
a chance not only to deepen the close overall working relationship we have formed to tackle the
viiiT h e S t a t e o f t h e G l o b a l C l e a n a n d I m p r o v e d C o o k i n g S e c t o r
issue of household air pollution, but also the opportunity to mobilize the financial, technical, and
policy resources needed to transform the clean cooking sector in more than a dozen focus countries.
Working together to advance many of the learnings from the past four years will allow us to leverage
our respective strengths in market development, standards and testing, investment, policy design, and
capacity building, and support the sector in an unprecedented way that will ultimately lead to wider
impact in health, gender, climate, and livelihoods.
We are pleased to work with the Bank to release this comprehensive mapping report on the clean
cooking sector and build upon the Alliance’s annual Results Report. The sector is a dynamic one and
this report should be seen less as a representation of the sector at a given point in time, but rather one
that identifies and discusses the larger trends that we are seeing and that we need to be investing in
to achieve the Alliance’s 100 by 2020 goal and the larger Sustainable Energy for All goal of universal
adoption of clean cookstoves and fuels by the year 2030.
Radha Muthiah
Chief Executive Officer
Global Alliance for Clean Cookstoves
ixA c k n o w l e d g e m e n t s
A C K N O W L E D G E M E N T S
This report was commissioned and coordinated by the Energy Sector Management Assistance
Program (ESMAP) of the World Bank. The project team was led by Venkata Ramana Putti (ESMAP) and
comprised Srilata Kammila (ESMAP) and Sumi Mehta (Global Alliance for Clean Cookstoves).
The report relied on input from a wide cross-section of World Bank staff, numerous industry experts,
manufacturers, distributors, policymakers, and non-governmental organizations, including interviews
with over 100 global players in the clean and improved cooking energy sector. Critical advisory and
technical input came from World Bank colleagues Koffi Ekouevi, Klas Sander, Masami Kojima, Laurent
Durix, Yabei Zhang, Sudeshna Ghosh Banerjee, Xiaoping Wang, Christophe de Gouvello, Sameer Akbar,
Katie Kennedy Freeman, Wendy Hughes, Alain Ouedraogo, and Dana Rysankova; Lasse Ringius and
Luiz Maurer from the International Finance Corporation; and Leslie Cordes, Ranyee Chiang, Jennifer
Tweddell, Donee Alexander, and Julie Ipe from the Global Alliance for Clean Cookstoves.
The final draft was peer reviewed by Richard Hosier (World Bank), Pepukaye Bardouille (IFC), and
Mikul Bhatia (World Bank). Rohit Khanna, ESMAP Program Manager, and Radha Muthiah, Executive
Director of the Global Alliance for Clean Cookstoves, provided valuable guidance.
Dalberg Global Development Advisors (www.dalberg.com) acted as the consultants for the report and
co-invested into the report’s development as part of their commitment to the Global Alliance for Clean
Cookstoves. The Dalberg team was led by Michael Tsan, partner and lead author, and comprised
Gaurav Gupta, Jason Wendle, Paul Collett, Fauzia Jamal, Pallavi Jayannavar, Nicholas Whalley, Kira
Intrator, Ibrahima Wade, and Kathleen Wade. The Dalberg team was also supported by a team of
external consultants, including Yaquta Kanchwala, Ethan Kay, Neha Juneja, and Ankit Mathur.
Editing and production management by Nick Keyes and Heather Austin of ESMAP is gratefully
acknowledged.
xT h e S t a t e o f t h e G l o b a l C l e a n a n d I m p r o v e d C o o k i n g S e c t o r
Regions: EA/EAP – East Asia and Pacific; LCR – Latin America and Caribbean; SA – South Asia;
SEA – Southeast Asia; SSA - Sub-Saharan Africa.
A B B R E V I A T I O N S
ACCES Africa Clean Cooking Energy Solutions
ACS advanced cookstoves
ALRI acute lower respiratory infection
BC black carbon
BoP base of the pyramid
CACCI Central America Clean Cooking Initiative
CAGR compounded annual growth rate
CDM clean development mechanism
CH4 methane
CO carbon monoxide
CO2-eq carbon dioxide equivalent
COPD chronic obstructive pulmonary disease
DALY disability-adjusted life
DFID Department for International
Development (UK)
DME dimethyl ether
EAP CSI East Asia & Pacific Clean Stove Initiative
ESMAP Energy Sector Management Assistance
Program
FAO Food and Agriculture Organisation
FD fan or “force” draft stoves
GDP gross domestic product
GEA Global Energy Assessment
GERES Group for the Environment, Renewable
Energy and Solidarity
GHG greenhouse gas
Gg gigagram (1 billion grams)
GIZ Gesellschaft für Internationale
Zusammenarbeit
HAP household air pollution
IEA International Energy Agency
ICS improved [biomass] cookstove
IFC International Finance Corporation
ISO International Organization for
Standardization
IPCC Intergovernmental Panel on Climate
Change
IWA International Workshop Agreement
LED light-emitting diode
LPG liquefied petroleum gas
M&E monitoring and evaluation
MDG Millennium Development Goals
MFI micro finance institution
MJ megajoule
MSME micro, small, and medium enterprise
MT million tons
NGO non-governmental organization
OC organic carbon
PCIA Partnership for Clean Indoor Air
PAH polycyclic aromatic hydrocarbons
PM2.5 particulate matter with diameter of
<2.5μm
ProBEC Program for Basic Energy and
Conservation
PoA Programme of Activity (under the
Clean Development Mechanism)
RBF results-based financing
RCT randomized controlled trial
R&D research and development
SACCO savings and credit cooperative
SE4ALL Sustainable Energy for All
SME small and medium enterprise
TChar combination TLUD / charcoal cookstove
TEG Thermoelectric generator
TLUD top-loading updraft cookstove
USAID United States Agency for International
Development
UNEP United Nations Environment
Programme
μg/m3 microgram per cubic meter
WB World Bank
WHO World Health Organization
All dollar amounts are United States dollars (USD or US$) unless otherwise indicated.
xiT e r m i n o l o g y
T E R M I N O L O G Y
The concept of clean cooking solutions used in this report is relatively new terminology, and the
term improved cookstoves is used by different organizations in different ways. This section defines
how these terms are used in this report, as well as progress in establishing internationally accepted
terminology.
The 2012 adoption of standards and performance tiers for stove emissions (total and indoor), fuel
efficiency, and safety via the International Workshop Agreement (IWA 11:2012) through partnership
with the International Organization for Standardization (ISO) has established a common quantitative
vocabulary. The World Bank’s energy team, in coordination with its partners the Global Alliance for
Clean Cookstoves and Sustainable Energy for All, is also refining its methodology for measuring
access to clean cooking; this will build on the IWA framework and include additional dimensions of
cooking solution quality.
In June 2013, ISO established of ISO Technical Committee 285, to continue the work begun with
the IWA to develop and approve clean cooking standards in the coming years. Kenya’s Bureau of
Standards (KEBS) and the United States’ American National Standards Institute (ANSI) serve as co-
secretariats of the Committee, which is comprised of other participating national committees, including
over 20 participant countries, 14 observer nations, and approved external liaisons. The ISO Technical
Committee held its first meeting in February 2014 in Nairobi, Kenya, in order to review gaps in the
current standards and to align on a roadmap for future action. The Committee’s subsequent meeting,
in October 2014, focused on harmonizing and updating existing test protocols for field and lab testing,
creating guidelines for social impact studies, and establishing a conceptual framework for cookstove
assessment methods.
The following terms are defined for the purposes of this report with reference, where appropriate, to the
ISO IWA tiers and standards. For more information about the ISO IWA tier classification system, please
refer to the Typology section in Chapter 4.
• Improved cooking solutions. Cooking solutions that improve, however minimally, the adverse
health, environmental, or economic outcomes from cooking with traditional solid fuel technologies.
This definition encompasses modern fuel cookstoves, renewable fuel cooking solutions, and
the entire range of improved and advanced biomass cookstoves. Clean and improved cooking
solutions reduce emissions, improving health and the environment.
• Clean cooking solutions. Cooking solutions with low particulate and carbon monoxide emissions
levels (IWA ISO Tier 3–4 for the indoor emissions indicator, within the Global Alliance’s Monitoring
and Evaluation framework). The IWA tiers for indoor emissions are consistent with the World Health
Organization indoor air quality guidelines. Cooking solutions with low total emissions (ISO Tier
3–4 for the total emissions indicator) are considered clean for the environment within the Global
Alliance’s monitoring and evaluation framework. These stoves can include advanced biomass
xiiT h e S t a t e o f t h e G l o b a l C l e a n a n d I m p r o v e d C o o k i n g S e c t o r
cookstoves, renewable fuel solutions, and modern fuel stoves—with the partial exception of
kerosene, since emerging evidence suggests that many kerosene stoves may actually create
significant negative health impacts. The monitoring and evaluation framework will be updated
when necessary to reflect emerging health and environmental research.
• Modern fuel solutions. Petro-chemical fuel (LPG, natural gas, kerosene), electric stoves, and
electromagnetic induction cookstoves.
• Renewable fuel cooking solutions. Biofuel cookstoves powered by ethanol and other plantbased
liquids, oils or gels; biogas cookstoves; solar cookers; and retained-heat cooking devices. Many
of these solutions equal or even exceed the performance of modern fuel cookstoves in terms of
environmental impact because of their very low emissions and reliance on renewable fuel sources.
For climate and environmental impacts, the lifecycle effects of the production and distribution
of renewable fuels should also be considered. Some of the renewable cooking solutions are
supplementary in nature—they can augment existing household cooking solutions as part of an
integrated cooking system but are unlikely to serve as primary stoves or fuels.
• Improved [biomass] cookstoves (ICS). Solid-fuel stoves that improve on traditional baseline
biomass technologies in terms of fuel savings via improved fuel efficiency. Some improved
cookstoves also lower particulate emissions through improved efficiency of combustion, but
the critical distinction from “clean” cooking solutions is that “improved” stoves may not reach
sufficiently low emissions levels to generate meaningful health benefits. Cookstoves covered
by this definition include basic chimney ICS, basic portable ICS (e.g., African ceramic jiko style
stoves), and intermediate ICS (e.g., rocket cookstoves, high-end charcoal cookstoves). Traditional
solid fuel cooking solutions—such as three-stone fires, unvented mud/clay “U” shaped stoves,
basic charcoal cookstoves, and poorly vented coal cookstoves—are excluded from this definition.
• Basic chimney ICS. Solid-fuel cookstoves whose chimneys feature minimal to moderate
improvements in thermal efficiency, which this report associates with ISO Tier 1 performance for
efficiency. This category includes improved chimney chulhas in South Asia, vented biomass and
coal cookstoves in China, lower efficiency planchas in Central America, and a range of chimney
mud cookstoves in Africa. Many of these cookstoves historically have been distributed as part of
national or non-governmental organization-led programs and are sometimes labeled as “legacy”
cookstoves—likely a misnomer since variants of such cookstoves are still actively promoted in
many parts of the world.
Some basic chimney ICS may be Tier 0 for thermal efficiency (<15%) and Tier 0 for total
emissions. We have included such cookstoves in our analysis because chimneys do improve
indoor emissions (Tier 1 or higher) and chimney cookstoves constitute the vast majority of
“improved” solutions in the field. Also, it is often the only cookstove segment for which end-user
uptake data are available from cross-national household surveys. Where possible, we try to
differentiate between inefficient chimney cookstoves (i.e., <15% thermal efficiency) and chimney
cookstoves with low to moderate efficiency (>15–25%). The current IWA v guidelines do not
xiiiT e r m i n o l o g y
yet include field performance, so cookstoves that have been demonstrated to have improved
performance in the lab may have different results in the field, especially over time.
• Basic portable ICS. Portable biomass cookstoves that are unvented and feature moderate
improvements in thermal efficiency. This category includes minimally improved ceramic and
clay cookstoves: such as the Anagi cookstove in Sri Lanka; simple efficient wood cookstoves
distributed by the United Nations programs in refugee camps throughout Africa; and metal
insulator-lined “Thai bucket” cookstove technologies such as the ceramic Jiko and Jambar
stoves in East and West Africa, the New Lao Stove in the Mekong region, and the Anglo Supra in
Indonesia.
• Intermediate ICS. A wide range of solid fuel cookstoves that this report broadly aligns to the ISO
ICS Tier 2 for efficiency, with significant improvements in fuel efficiency (>25% thermal efficiency
rating), but typically more limited health and environment outcomes in comparison to clean
cooking solutions such as gasifier and modern fuel cookstoves. Intermediate cookstoves utilize
rocket stove principles (i.e., an L-shaped combustion chamber design) for wood/crop or waste/
dung fuel cooking, or have other design features that promote thermal efficiency as in the case
of intermediate coal and charcoal ICS. Stoves in this category can be portable (e.g., the Envirofit
and EcoZoom charcoal and wood cookstoves), semi-portable (e.g., Ethiopia MIRT cookstoves,
China efficient coal chimney cookstoves), or built in (e.g., Uganda Rocket Lorena, Mexico Patsari,
Guatemala Onil cookstove) and may be either unvented or combined with chimneys, depending
on the design.
• Advanced [biomass] cookstoves (ACS). Fan draft or natural draft biomass gasification
cookstoves that achieve significant particulate emission reductions and approach, but not yet to
match, the performance of modern fuel cookstoves (IWA ISO Tier 3 for indoor emisions, Tier 3-4 for
efficiency). Stoves in this category include natural draft models (e.g., Awamu in Uganda, Belonio
rice husk stoves in Philippines and Indonesia), fan draft rocket style stoves like the Biolite, and top
loading fan gasifiers like the Oorja in India and the Phillips / ACE-1 fan gasifiers manufactured in
Lesotho. At peak performance and under lab conditions several model of gasifier stoves can now
exceed ISO Tier 3 emissions performance, particularly when combined with chimneys, showing
the future potential of an ISO Tier 4 low emissions biomass stove.
xivT h e S t a t e o f t h e G l o b a l C l e a n a n d I m p r o v e d C o o k i n g S e c t o r
1E x e c u t i v e S u m m a r y
E X E C U T I V E S U M M A R Y
With few exceptions, access to clean and improved cooking solutions is limited in much of the
developing world, leading to immense human costs. The share of households that cook primarily with
wood, charcoal, coal, crop waste, and dung accounts for over half of the developing world’s population
and, today, is increasing or stagnant in most regions. Dependence on solid fuels, potentially harmful
modern fuels such as kerosene, and inefficient and polluting cookstoves is one of the world’s major
public health challenges, causing more premature deaths than HIV/AIDS, malaria, and tuberculosis
combined. The use of inefficient fuels and stoves also imposes significant economic costs on societies
that can least afford them and contributes to adverse environmental and climate change effects.
While the challenges are daunting, there are now good reasons to believe that the next decade
will be a transformative period for the global clean and improved cooking sector. Broader access
to clean and improved cooking solutions is within closer reach thanks to promising new demand-
side trends, including the emergence of aspirational middle classes with disposable incomes, rapid
urbanization, and rising fuel prices that are pushing consumers worldwide to seek more efficient
fuels and stoves. On the supply side, key trends include technological innovation—most notably, the
development of clean gasifier biomass stoves—increasing investments into modern fuels such as
liquefied petroleum gas (LPG), and the growth of renewable alternatives such as biogas, ethanol,
and biomass pellet fuels. Market-orientated solutions account for much of the recent dynamism
in the cooking landscape, as manifested by increased industrial-scale production of improved
stoves, the emergence of innovative distribution and financing models, and the entry of many new
entrepreneurs and investors into the sector. Increasing policy support from national programs in
regions like Southeast and East Asia (e.g., Indonesia and China), South Asia (e.g., Nepal, Bangladesh,
and India), multiple countries in Africa (e.g., Ghana, Rwanda, Uganda, Ethiopia, Nigeria), and Latin
America (e.g., Peru, Mexico, Guatemala, Honduras). These country-level activities, combined with the
momentum generated by the UN’s Sustainable Energy for All, the work of the Global Alliance for Clean
Cookstoves, industry-led initiatives like the Global LPG Partnership, and the range of regional efforts
coordinated by the World Bank and the Energy Sector Management Assistance Program (ESMAP) like
the Africa Clean Cooking Energy Solutions (ACCES), the East Asia and Pacific Clean Stove Initiative
(EAP CSI), and the Central America Clean Cooking Initiative (CACCI) are beginning to transform the
enabling environment for clean cooking solutions.
These trends are a window of opportunity rather than the guarantee of a tipping point. Many
obstacles to the ultimate goal of universal access to clean cooking energy remain, including the lack
of affordable clean cooking solutions, low consumer awareness of and willingness to pay for the
health benefits of clean cooking, low stove quality and poorly defined performance standards, limited
technical and financial producer and distributor capacity, and a variety of policy obstacles. This
report suggests that, although a much faster transition is possible, it will require significantly higher
investment, carefully coordinated interventions, and better data to measure sector progress.
2T h e S t a t e o f t h e G l o b a l C l e a n a n d I m p r o v e d C o o k i n g S e c t o r
This report seeks to contribute to the coming transformation. Its primary objectives are to update
the impact case for clean cooking solutions, identify key cooking sector demand and supply trends,
and provide the first-ever global baseline for clean and improved cooking solutions—including analyses
of fuel and stove penetration, end-user segmentation, industry structure, and the enabling environment.
We hope in particular that the findings and lessons captured in this report will encourage private sector
actors and public sector policymakers to increase their commitment to clean cooking initiatives across
the globe.
A. KEY FINDINGS
The following section summarizes the key findings discussed fully in Chapters 1 through 7.
The Case for Clean and Improved Cooking
The global solid fuel population is large and access to clean and improved cooking solutions is
limited. Approximately 40% of developing world households use clean fuels and cookstoves as their
primary cooking solution, including modern fuels such as LPG and electricity; renewable solutions
such as biogas, ethanol, and solar; and advanced biomass gasifiers stove technologies.1 Of the more
than 2.85 billion people who rely primarily on solid fuels, less than one-third use improved cookstoves
(ICSs) and even these households predominantly rely on basic ICS that have limited health and
environmental benefits.2
Reliance on solid fuels and inefficient and polluting cookstoves costs the world dearly. The mid-
range economic value of the health, environmental, and economic effects of solid fuel dependence is a
staggering $ 123 billion annually ($ 22–224 billion), with multiple underlying effects:3
• Economic: significant spending of $ 38–40 billion annually on solid fuels for cooking and heating,
of which a significant share is avoidable; 140 million potentially productive person-years annually
wasted on biomass fuel collection and avoidable cooking time
• Health: at least 4.3 million premature deaths annually and 110 million disability-adjusted life
years (DALYs)4 resulting from household air pollution (HAP), including lower respiratory infections,
chronic obstructive pulmonary disease, lung cancers, heart disease, and cataracts; many
additional health harms not quantified include asthma, tuberculosis, adverse pregnancy outcomes,
depression, bacterial meningitis, a variety of moderate-to-severe physical injuries associated with
firewood collection, burns, widespread minor ailments from smoke inhalation such as eye irritation
and headaches, and the emerging concerns about the harms of kerosene cooking
• Environment: substantial emissions from solid fuel use and charcoal production of 0.5–1.2 billion
MT in carbon dioxide (CO2) equivalent of Kyoto Protocol greenhouse gases (up to 3% of annual
global CO2 emissions) and 25% of global black carbon emissions; consumption of ~1.36 billion
tons of woodfuel across the developing world, with contribution to forest degradation and
deforestation most likely from charcoal production in Africa and Asia
3E x e c u t i v e S u m m a r y
• Gender equity and other social impacts: disproportionate risks of negative HAP-linked
health outcomes and physical injury for women and girls, given their proximity to cooking fires
and primary responsibility for firewood collection in many cultures; decreased educational
opportunities for children involved in fuel collection; impaired nutrition because of the diversion of
resources to fuel purchases; and home environments damaged by smoke and soot
A range of technologies can mitigate these harmful effects, but only the cleanest cooking
solutions hold the potential for truly transformational impacts on health and environmental
outcomes. The potential benefits of improved and clean cooking solutions vary greatly by impact
objective, cooking technology, quality of the specific cookstove, and consumer willingness to adopt
the solution vis-à-vis baseline cooking technologies. There is no universally applicable technological
answer to addressing the harms of solid fuel cooking. A range of ICS technologies, including low-cost
basic ICS, can generate attractive fuel savings and other important economic co-benefits such as time
savings for households and job creation opportunities for basic ICS manufacturing. Health benefits are
the most difficult impact to achieve since they require the thorough replacement of traditional stoves
with clean modern fuels, such as LPG and electricity, or renewable solutions, such as biogas. For
biomass cooking, pending further evidence from the field, significant health benefits are possible only
with the highest quality fan gasifier stoves; more moderate health impacts may be realized with natural
draft gasifiers and vented intermediate ICS (e.g., Onil and Patsari stoves in Central America; Rocket
Lorena and brick rocket stoves in Africa).
The Demand for Clean and Improved Cooking Energy
Dependence on solid fuels will persist for years, serving as a long-term demand driver for
improved solid fuel stoves and cleaner fuels. Global patterns in population growth, urbanization,
and historical fuel use suggest that the number of people relying on solid fuels for cooking and heating
will persist at a level of over 3 billion by 2020.5 Growing firewood consumption and rising charcoal use
in Sub-Saharan Africa will counterbalance the declines in solid fuel use in Asia and Latin America.
Alongside primary users of solid fuels, hundreds of millions across the developing world will continue
to use wood, charcoal, and coal as a secondary cooking energy source.
Rising fossil fuel and biomass prices are also spurring long-term demand for fuel-efficient
cooking solutions. Nominal global LPG prices rose at a compounded annual growth rate (CAGR)
of 11% over the past decade,6 far above the rate of inflation, impeding LPG adoption. Retail price
growth ranged from 5% in markets such as India, where LPG remains heavily subsidized to 12–14% in
Southeast Asia and certain African markets. The elimination of lighting and cooking kerosene subsidies
in markets like Indonesia has pushed up retail kerosene prices, driving large-scale fuel-switching
down to biomass or up to modern fuel alternatives for households who can afford them. Coal prices
have been on a steady upward trajectory because of industrial coal demand in China. Charcoal costs
tripled over the past decade in Africa and Haiti (11% CAGR) and are seeing fast growth in charcoal-
dependent Asian markets like Cambodia and Myanmar. While poorly documented, cooking firewood
4T h e S t a t e o f t h e G l o b a l C l e a n a n d I m p r o v e d C o o k i n g S e c t o r
scarcity appears to be increasing in parts of Africa and Asia, though wood prices, thus far, have seen
only limited increases in most markets relative to the rate of overall inflation. These trends all point to
the increasing appeal of fuel-saving stoves globally—and, in some regions, the increased potential for
consumer adoption of cleaner modern and renewable fuels, given the relatively faster rise in costs of
alternatives like charcoal, coal, and kerosene.
The size of existing cooking fuel markets suggests that the potential demand for clean and
improved cooking solutions is large. In 2010 alone, consumers in the developing world spent $ 100
billion across all cooking fuels, with charcoal, coal, and wood, accounting for approximately one-third
of this total.7 This figure dwarfs annual developing world consumer spending on cooking appliances
across all clean or improved technologies, which this report estimates at less than $ 8 billion,8 inclusive
of government appliance subsidies. This discrepancy suggests that the fuel supply market and
integrated fuel-stove distribution business models are a major opportunity for the private sector.
End-user demand and product preferences vary significantly across customer segments. As
is expected of a global market of this scale, the potential consumer for improved and clean cooking
solutions is diverse, with variable ability and willingness to pay and a range of preferences across
fuel types, cookstove sizes, and features based on household characteristics such as income, family
size, urban or rural status, cultural practices, stove end-use (e.g., space heating or water heating),
and fuel procurement approaches.9 Approximately one-half of the households in the developing world
primarily rely on modern fuels or high-cost charcoal and coal to fulfill their cooking and heating needs.
These largely urban and middle-income consumers have the highest propensity and ability to pay
for improved biomass and clean cookstoves. Another 13% of households rely partly or exclusively on
purchased firewood and should theoretically find the fuel-saving value proposition of ICS attractive.
The remaining (~30%) of the global cooking market consists of poor to middle-income households who
collect their fuel, and often do not place a high value on the time lost for fuel collection, and, therefore,
are less motivated by the fuel-saving potential of improved stoves.
Although most consumer segments can be reached by market-based cooking solutions,
affordability is a major barrier. Household surveys and the historical experience of improved
cookstove programs suggest that the share of global cookstove customers considered “marketable”—
that is, consumers with sufficient income to afford paying $ 5 toward the cost of an improved
cookstove—likely includes more than 85% of the global population.10 Even in rural areas, the
marketable segment for basic improved cooking solutions remains significant, with evidence from
cookstove pilot and program surveys around the world indicating that only around 10–30% of the
population report being unwilling or unable to pay for even a basic ICS. Evidence from the field in
Africa and Asia, for instance, suggests that even among rural wood collectors, over two-thirds of whom
have some disposable income, there is a willingness to purchase improved cooking appliances once
they become aware of improved cookstove benefits. While consumer ability to afford low-cost basic
ICS purchases ($ 3–10) is generally high, intermediate ICS technologies costing $ 15–30 will likely be
affordable to around 60% of developing country cooking consumers in Asia and Africa. Latin America
and, in particular, Central America, is a special case with intermediate rocket plancha-style ICS prices
5E x e c u t i v e S u m m a r y
in the $ 60–250 range and corresponding affordability challenges despite higher rural incomes. Stoves
at the higher price range, such as the emerging biomass fan gasifier technology ($ 50–120), modern
fuel stoves such as LPG ($ 30–70), and renewable solutions like biogas ($ 500–1,500 for household
biogas plant and stove) will be affordable to far fewer consumers, likely under 20–30% of households
in most countries in South Asia, Southeast Asia, and Africa, with fuel costs rather than stove costs
being the biggest constraint in the case of modern fuels like LPG and electricity.
Significantly extending access to clean cooking solutions is only feasible with price reductions,
increased end-user financing and, in the case of the very poorest, non-market distribution
approaches. Across all consumer segments, expanding access to clean cooking requires continued
innovation in design and manufacturing to lower stove costs, consumer financing, and new payment
models (e.g., layaway plans, “pay-as-you-go” pricing, fuel/stove rental models, electronic payment
metering) that can minimize or even eliminate upfront product costs. Accelerated uptake of higher
cost clean cooking solutions also requires the use of carbon credits to lower prices for consumers
and, where feasible, targeted incentives (e.g., results-based grant financing credits) for those cooking
solutions that have proven benefits in livelihood and health terms that go beyond their positive
environmental impacts. While direct consumer subsidies can be unsustainable and, in some cases,
have led to counter-productive market distortion, targeted subsidies are needed for extending clean
cooking solution access in humanitarian aid contexts or to the poorest segments of the population,
where downstream financing and business model innovation alone are unlikely to meaningfully expand
market-based access to higher cost clean cooking technologies for decades to come.
The Supply Landscape
Few countries have managed to introduce clean and improved cooking solutions on a broad
scale to address the widespread pernicious impacts of solid fuel use. Clean cooking penetration
in 2010, covering access to all modern fuels (aside from kerosene), renewable fuels, and advanced
biomass solutions, is particularly low in Sub-Saharan Africa (10% of households) and South Asia
(27%), with better access in Southeast Asia (41%), East Asia (51%), and Latin America (80%).11
Improved biomass cookstove penetration is also limited. Including households that utilize minimally
improved “legacy” chimney stoves, up to 245 million developing world households in 2012 (37% of
solid fuel users) used an improved cookstove of some sort, with significant ICS penetration of solid fuel
users in East Asia (85%), moderate levels in Latin America (39%) and Southeast Asia (21%), and low
penetration in Sub-Saharan Africa (14%) and South Asia (11%).12 Improved cookstove distribution has
seen the greatest success in China, where an estimated 85% of biomass users and over 65% of coal-
burning households have access to cooking and heating stoves with at least some improved efficiency
and emission features. Even excluding legacy stoves, the vast majority of these ICS are basic
solutions which, despite their “improved” label, offer only minimal improvement on most performance
dimensions. The market penetration of intermediate ICS technologies, such as portable biomass
rocket cookstoves, rocket chimney stoves, and highly efficient charcoal and coal stoves, is a small
share of the total—20–25 million households globally in 2012—but is growing quickly, with another

6T h e S t a t e o f t h e G l o b a l C l e a n a n d I m p r o v e d C o o k i n g S e c t o r
2–5 million households added by late 2014 based on the latest Global Alliance survey and self-
reported manufacturer data. The penetration of clean advanced gasifier solutions that can approach
the performance of modern and renewable fuels is still negligible, with fewer than 1.5 million gasifier
stoves in use across the globe, the vast majority of them in China and India.
Although the market penetration of higher performing, industrially produced stoves is growing,
the ICS sector is currently dominated by artisanal and semi-industrial cooking solutions.
Analysis of the global ICS market suggests that roughly one-fifth of the ICS in use around the globe
today have been produced by artisanal methods in local workshops or on location by trained builders.
Semi-industrial stoves, featuring greater scale, some mechanization of production, pre-fabricated
standardized parts, and improved quality controls represent up to 70% of households. Industrial stoves
produced with fully mechanized methods, using precision-tooling and higher performing materials, are
being utilized by <10% of ICS-owning households (<20 million). The situation is particularly stark in
Africa where underdeveloped semi-industrial and industrial ICS markets mean that artisanal solutions
account for over 90% of improved stoves in use. In markets like China, in contrast, the vast majority of
improved stoves are industrially or semi-industrially produced.
Sales growth has been rapid across all ICS technologies and methods of production. Annual
growth in cookstove sales based on the self-reported data from Global Alliance for Clean Cookstoves
partners, and building on the legacy data of the Partnership for Clean Indoor Air (PCIA), has exceeded
50% over the past decade (2003–13), quadrupling from 3.6 million units distributed and sold in 2011
to 14.3 million units in 2013, based on the latest partner survey. Self-reported global manufacturer
and cookstove program data available to the report team suggests that sales of industrial and semi-
industrial stoves have risen much more rapidly (50–300% annually) than the artisanal sector (10–50%)
over the past five years, albeit from a much lower base. World Bank survey data shows that improved
biomass stove sales from industrial and semi-industrial manufacturers serving the Chinese market,
for instance, grew tenfold over a six-year period ending in 2011, now likely exceeding 2 million units
annually in 2014. The fast global growth of industrial ICS is reflected in the rising number of industrial
and semi-industrial manufacturers. For instance, of the 35–40 semi-industrial and industrial players
active in Sub-Saharan Africa today, one-third started their operations in the past two years, and 80%
did not exist five years ago. Globally, in 2014, there were over 10 industrial ICS manufacturers with
annual sales of over 100,000 units and over 40 with annual sales above 20,000 units—a major leap in
scale and sophistication for the sector in just a few years.
It is difficult to foresee quick adoption for clean cooking solutions without some mechanism for
reducing price. The biggest successes in scaling up access to improved biomass cooking solutions
have involved public sector or donor-driven cookstove programs with strong market-based logic. For
more expensive industrial intermediate or clean ICSs ($ 25–250), price subsidies via carbon market
credits have played an important role, typically involving a 20–50% reduction in the consumer price
via the pass-through of carbon market financing proceeds to the end user. The importance of carbon
finance markets is growing despite depressed carbon prices—of the 8.2 million stoves distributed
and sold in 2012 that were tracked by the Global Alliance, half received some support from carbon
7E x e c u t i v e S u m m a r y
finance projects, this is up from 15% in 2010–11, with carbon finance market growth continuing into
2013–15 from 2008–11 levels despite some contraction in 2013.13 Uptake of higher priced ICSs would
likely be substantially slower without such carbon subsidies, but the business models of most semi-
industrial players (typically $ 8–25 products) and all artisanal ICS producers are sustainable even in
the absence of carbon finance. Nonetheless, it is clear that faster adoption requires the continuation of
carbon revenue streams and, likely, the introduction of additional incentives to accelerate the adoption
of those stoves that create incremental health benefits for which households are unable or unwilling
to pay. Potential mechanisms for such targeted incentives include results-based financing (e.g.,
linked to measured or likely health outcomes) and other innovative mechanisms like social bonds for
cookstoves—ideas that are only beginning to be explored.
Evolution in stove technologies is a critical supply-side trend to watch. New biomass cookstove
technologies include better performing and more durable basic ICS, a growing number of intermediate
ICS rocket cookstove models with advanced materials and market-specific design adaptations, and,
critically, the emergence of semi-industrially and industrially produced advanced biomass stoves (ACSs)
that can, in some cases, approach the performance of modern fuel cooking and hold the promise of
truly transformative health and environment benefits. Though at an early stage of commercialization,
the ACS segment is experiencing the most rapid evolution in design with recent innovations, including
fan gasifier and fan jet stoves—some with integrated thermoelectric generators that power stove fans
without the need for an external power source; a growing number of more user-friendly form factors
(e.g., side-loading “rockifier” designs); and widening tolerance for a range of minimally processed or
unprocessed solid fuels. Consumer uptake of these solutions is not a foregone conclusion: several efforts
have seen less traction than hoped for because of difficulties in ensuring steady low-cost processed fuel
supply and other barriers related to consumer cooking preferences, including the need for frequent fuel
loading and potentially tedious fuel processing requirements. Many of these disadvantages have been
addressed in new products, however, and the evidence (at this stage largely anecdotal) from new ACS
pilots in Africa, India, Central America, and China suggest that the challenges could be overcome by
continuous innovation. Beyond biomass cooking, there is ongoing innovation in clean fuel technologies
with increased interest in recent years in low cost LPG stoves across a range of Asian, African, and Latin
American markets and the emergence of electric induction stoves as a popular technology for many
middle-class end users across the developing world.
Innovation in distribution and financing models is as important as the rapid evolution in
cooking technologies. The most important business model innovations in the ICS sector include the
emergence of integrated fuel/stove project designs that can dramatically improve both manufacturer
and—critically—low-income end-user economics by amortizing stove costs into fuel pricing. Other
important innovations include the creation of sustainable clean fuel supply chains (e.g., briquettes,
pellets, and ethanol), the emergence of new pay-as-you-go models with potential linkages to mobile
payments (i.e., replicated from off-grid lighting to clean cooking solutions), and growing diversification
of distribution models, including micro-franchising and large-scale institutional partnerships. Much
of the innovation does not entail the creation of entirely new ways of doing business, but represents
8T h e S t a t e o f t h e G l o b a l C l e a n a n d I m p r o v e d C o o k i n g S e c t o r
the diffusion of base of the pyramid (BoP) marketing best practices to the cookstove sector. Stove
entrepreneurs, for instance, are increasingly deploying models that prioritize proximity to the consumer
via village-level entrepreneurs or close monitoring and training of partner sales forces, free trials,
installment payment plans, and warranties that have been proven to address end users’ liquidity
constraints and enhance consumers’ willingness to pay.
Changes in the enabling ecosystem for clean and improved cooking solutions are also
transforming the potential for widespread access. Important developments include industry
convergence on ICS quality requirements with the establishment of the International Standards
Organization International Workshop Agreement (ISO IWA) 11:2012 and ISO Technical Committee
285, growth of local cooking solution testing infrastructure with over 20 testing centers established
or in development across the globe; the evolution of new cookstove monitoring and performance
measurement solutions; increased government focus on regulation of biomass fuel production;
better market intelligence resulting from new investments in consumer and market research; and
more rigorous program evaluation approaches. Most recently, platform initiatives—such as the
Global Alliance for Clean Cookstoves, subregional and country-level industry alliances, and specific
technology and fuel champions such as the Global LPG Partnership—have begun to improve
coordination across donors, governments, and the private sector, and are mobilizing significant new
funding and attention for the sector.
Looking Forward
Major challenges remain on the path to maximizing the reach of clean and improved cooking
solutions. The most important barriers are affordability of clean cooking fuels and high-quality
cookstoves, low consumer willingness to pay for the incremental benefits of clean cooking solutions,
and limited accessibility of quality, high-performing products to end users. Other important challenges
include behavior-change barriers that contribute to the persistence of baseline cooking technologies,
the limited business-management capacity and financial constraints of small- and medium-enterprises
(SMEs) active across clean and improved cooking value chains, the still limited product testing capacity
to enforce emerging quality standards and minimize market spoilage, insufficient investment into
research and development (R&D), low sustainability in biomass fuel supply markets, and a range of
regulatory constraints (i.e., taxes and poorly targeted subsidies) to foster sector development.
Finance, in particular, is a cross-cutting challenge, encompassing the need for financing for improved
biomass and clean-fuel supply chains, working capital for improved cookstove producers and
distributors, support for market transformation programs and enabling infrastructure, and—where
sensible—targeted subsidies and incentives tied to clearly defined access, health, and environment
goals. Estimates of the total funding gap vary, but they suggest that the sector is significantly under-
funded despite significant progress made by sector stakeholders in resource mobilization in recent
years, including the $ 413 million of new commitments announced at the November 2014 Global
Alliance for Clean Cookstoves Future Summit. The International Energy Agency (IEA) projects that
annual investments of $ 4.7 billion are needed globally to ensure universal access to clean cooking
9E x e c u t i v e S u m m a r y
energy through 2030. Other sources—such as the Global Energy Assessment, which is based on
assumptions of significant fuel subsidies—suggest that the need may be even higher.14 This stands in
contrast to $ 70 million of investments globally in ICS interventions by donors, as estimated by IEA in
2011, or the $ 0.5–1 billion of investments annually into both clean and improved stoves from all public
sector programs, the private sector, and carbon finance markets, as estimated in this report. From
a public health perspective, the funding gap is stark even at the high end of the range of estimates.
Total current clean and improved cookstove funding is under $ 30–250 per premature household
air pollution death vis-à-vis global funding in the range of $ 2,000–4,000 per death for diseases like
Malaria and HIV/AIDS.15
The “business-as-usual” scenario for the sector is encouraging but will fall far short of potential.
Without major new interventions, existing market dynamics will ensure that over 180 million households
globally will gain access to, at least, minimally improved cooking solutions by the end of the decade.
This is encouraging, but not sufficient. The business-as-usual scenario would still leave over one-half
(57%) of the developing world’s population without access to clean cooking in 2020, and 38% without
even minimally improved cooking solutions. The global share of consumers using modern fuels will
not shift significantly, the market penetration of advanced biomass stoves will remain at a relatively low
level, and millions will continue to die annually from exposure to HAP from solid fuels and cookstoves.
Furthermore, in the absence of interventions, historical trends suggest that any gains in clean cooking
access would be highly unequal across geographies and income tiers.
Governments, the development community, and the private sector can and must do better. While
this is a moment of great promise, it is also one of great responsibility for sector stakeholders. The clean
and improved cooking sector is the wizened veteran of development causes and has seen false dawns
in the past. To ensure that the current revival of interest in clean cooking solutions does not become
a passing fad, there is need for major new investments and interventions to accelerate the uptake of
cleaner, higher quality cooking appliances and fuels in geographies where clean cooking solutions
have already shown promise—and, alternatively, to lay the foundations for clean fuel and improved
cookstove ecosystems in those countries where current penetration of improved cooking solutions
is minimal and enabling environment antecedents are weak. Purely market-based approaches hold
significant promise for businesses focused on middle- and upper-income cooking consumers (LPG,
biomass ACS, industrial rocket ICS) and there are growing opportunities for entrepreneurs to establish
social businesses that focus on clean cooking for the BoP. At the same time, universal access to clean
cooking energy will not be feasible without public sector leadership. As in the case of other public
health crises, governments and donors must exercise leadership to ensure sufficient public awareness
and funding for clean cooking solutions that will not reach most developing world households via
private sector efforts alone.
B. RECOMMENDATIONS
Aside from a cross-cutting need for new investments, report findings suggest a number of immediate
recommendations for sector stakeholders. Summarized here, they are presented in full in Chapter 7.
10T h e S t a t e o f t h e G l o b a l C l e a n a n d I m p r o v e d C o o k i n g S e c t o r
Governments, Donors, and Non-Governmental Organizations
• Significantly increase focus on clean cooking solutions, potentially via smart and targeted
subsidies, but continue to invest in intermediate and basic ICS given the segmented nature of the
consumer and the slow pace of market transition.
• Prioritize market-based approaches wherever feasible to maximize cooking market sustainability,
but also deploy more direct incentives that can be tightly linked to resource, health, and
environmental impacts.
• Support the sustainable production of clean biomass fuels and renewable fuel alternatives alongside
the current focus on stove efficiency and emissions; demand-side solutions alone are not enough.
• Provide critical public goods to accelerate sector development, with a particular emphasis on
access to finance, consumer education, quality standards, policy reform, and market intelligence.
Private Sector Stakeholders
• Capture the opportunity—despite many challenges, the potential for the clean cooking market is
immense, with growing opportunities and a quickly rising number of new entrants.
• Reduce prices to address affordability challenges via low-cost design, local production or assembly,
and innovative distribution and financing models that lower upfront cooking appliance costs.
• Focus on performance and quality. Consumers, even the poor, are willing to pay for better design
and fuel savings; and the public sector is increasingly willing to support solutions that offer health
benefits.
• Focus on opportunities in cooking fuel, not just cookstoves, because the market for cooking fuel is
orders of magnitude larger than that for cooking appliances.
• Get close to the consumer. Although expensive, extensive marketing and the deployment of direct
and indirect sales forces that build product awareness are essential for achieving scale.
E N D N O T E S
1 Excludes 28 million users of kerosene stoves (2.4% of total) given evidence of the negative health effects of
kerosene cooking. Estimates of fuel mix are based on the WHO Global Fuels Database, national surveys, and
other publicly available data.
2 Estimates are based on a 77-country inventory of improved and clean cookstove penetration; this, in turn, is
derived from hundreds of sources globally, including self-reported program and private sector data, household
surveys, Global Alliance markets assessments, and over 100 interviews with key country stakeholders. The 2.85
billion figure reflects 98–99% of all households cooking with solid fuels globally; the total number of households
using solid fuels for either heating or cooking is larger, likely up to 3.2 billion globally.
3 Estimate based on avoidable health, environmental, and economic costs for households and economies based on
a scenario of universal migration to advanced biomass gasifier stoves for those who do not have access to modern
fuels (see Section 2A, Table 2.2, and related text). The estimate is conservative and highly sensitive to assumptions
on the share of negative effects that can be avoided by new cooking technologies. The McKinsey Global Institute
11E x e c u t i v e S u m m a r y
(2014), for instance, has estimated the global direct economic health impact of household air pollution alone at $
400 billion, or 0.5% of annual global GDP.
4 The 2010 Global Burden of Disease (GBD 2010) analysis indicated 3.5 million deaths and 110 millions DALYs
directly due to HAP and 0.5 million deaths due to ambient air pollution that can indirectly be traced to indoor-
cooking particulate emissions. More recent estimates from the WHO for 2012 (WHO 2014), relying on an
updated methodology, estimate the global mortality burden of HAP at 4.3 million people annually.
5 Solid fuel population projection based on historical (2000–10) trends for each fuel, adjusted for forecasted
urbanization. By 2020, the population reliant on solid fuel for cooking and heating is estimated in this report at
3.1 billion for the 77 tracked countries or up to 3.2 billion overall.
6 Saudi Aramco LPG benchmark (2000–12) for wholesale index; regional retail prices are based on time series
of urban market prices collected via press searches for 27 countries for LPG, 62 countries for kerosene, 30 for
charcoal, and 5 for coal.
7 Estimate based on national survey fuel mix data, standardized per-household fuel consumption figures, survey-
based estimates of share of households purchasing (rather than foraging for fuels), and retail fuel prices for
all key cooking fuels for key countries globally in 2010–12. Where possible, the data was triangulated with
aggregate fuel consumption figures for modern fuel (e.g., World LPG Association) and biomass (e.g., Food and
Agricultural Organization or FAO) markets.
8 Market estimate based on projected new-stove households, replacements based on average stove life, and
average cooking-solution prices for all major stove types globally, including the full cost of installing household
biogas digesters/plants.
9 The consumer segmentation in the report is based on a custom segmentation database that draws on a global
cooking and heating fuel mix database (2010–13), fuel mix data by income segment for representative countries,
and data for over 20 geographies on wood purchasing vs. collection rates. For more details on the global
cooking consumer segmentation, see Section 3.B.
10 For a discussion of consumer willingness to pay and estimates of marketable stove and fuel buyer segments
summarized in this paragraph, see the discussion in Section 3.B.
11 Based on aggregated national data on modern fuel penetration and country level estimates for renewable fuel
and clean biomass (advanced gasifier) solutions. See Section 4.C.
12 Total ICS household numbers are based on aggregated country level estimates for 77 countries globally using
2012 numbers, including information from country-level household surveys and producer stove production
reports.
13 http://www.ecosystemmarketplace.com/pages/dynamic/article.page.php?page_id=10629§ion=carbon_
market&eod=1.
14 The most recent Global Energy Assessment (GEA 2012) estimates that $ 36–41 billion will be needed annually
to achieve universal access to electricity and modern cooking solutions by 2030, with at least 20% of the total
being attributed to the costs of clean cooking.
15 Relative to the 4.3 million deaths due to HAP annually, funding for clean and improved cooking is estimated
in this report at $ 125 million to $ 1 billion annually, with the higher range reflecting public sector investments
into household biogas plants. Data on Malaria and HIV/AIDS is based on WHO reported funding and mortality
estimates for 2012–13.
12T h e S t a t e o f t h e G l o b a l C l e a n a n d I m p r o v e d C o o k i n g S e c t o r
I N T R O D U C T I O N
The global clean and improved cooking solutions sector has evolved significantly in recent years.
Emerging demand and supply trends suggest that the sector has the potential for rapid growth, with
life-changing benefits for the more than 3 billion people who today rely on inefficient, dangerous, and
environmentally harmful stoves and fuels. Clean and improved cooking solutions are also beginning to
generate attractive market opportunities for local and international private enterprises in the provision
of cooking appliances, fuels, and financing.
Despite this great promise, the market penetration of modern fuels, renewable cooking alternatives,
advanced biomass cookstoves (ACSs) and improved biomass cookstoves (ICSs) is still at a very low
level. Major persisting challenges include cookstove and fuel affordability for end users; low levels
of consumer awareness; behavior change obstacles to the reduced use of traditional stoves after
the adoption of new solutions; and limited consumer access to appropriately designed and durable
products. Supply-side constraints include the difficulty of cost-effective distribution to rural areas;
limited technical and management capacity for producers and distributors; a lack of access to finance;
and a variety of policy and infrastructure gaps impeding market development.
Ensuring that the growth of clean cooking in the coming years is faster, more equitable, and more
sustainable will require substantially increased investment from the private sector; the success
of market support and transformation initiatives from development institutions, non-governmental
organizations (NGOs), and foundations; greater scale and ambition in national clean cooking
programs; improved program coordination; and support from funders.
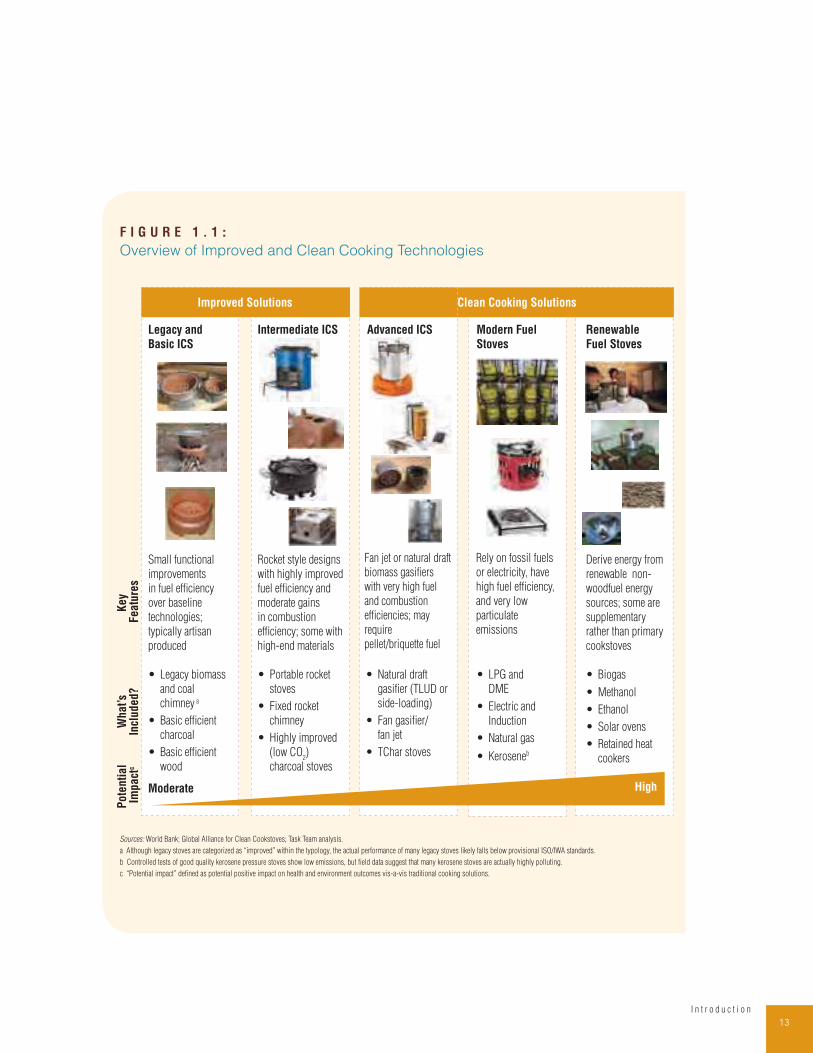
A. TYPOLOGY OF IMPROVED AND CLEAN SOLUTIONS
This report covers all clean and improved cooking solutions that can improve on the fuel
efficiency and emissions performance of traditional cooking technologies such as the three-
stone fire, open U-shaped clay or mud stoves, “metal bucket” charcoal stoves, and unvented coal
stoves.16 There is now a range of cookstoves on the market that vary widely in terms of fuel feedstock,
form factor, construction materials, methods of production, and potential for mitigating harmful effects
(Figure 1.1).
Under the definition of improved cooking solutions the report includes all cookstoves that improve fuel
efficiency without reducing particulate matter emissions to the low levels necessary for optimal health
and environmental outcomes as defined by World Health Organization (WHO) household air pollution
guidelines and the International Standards Organization International Workshop Agreement (ISO IWA)
guidelines for improved cookstoves. The basic “improved cookstove” category includes “legacy”
chimney biomass and coal stoves (e.g., South Asia chulhas, Chinese national program chimney wood
stoves from the 1990s, and Malawi mud chimney stoves) and moderately fuel-efficient “basic” wood
and charcoal portable ICS (e.g., the Kenya Ceramic Jiko). Intermediate ICS include a range of rocket-
1
13I n t r o d u c t i o n
F I G U R E 1 . 1 :
Overview of Improved and Clean Cooking Technologies
Clean Cooking SolutionsImproved Solutions
Key
Featu
res
What’
s In
cluded?
Pote
nti
al
Impact
c
Legacy and
Basic ICS
Small functional
improvements
in fuel efficiency
over baseline
technologies;
typically artisan
produced
• Legacy biomass
and coal
chimney a
• Basic efficient
charcoal
• Basic efficient
wood
Moderate
Intermediate ICS
Rocket style designs
with highly improved
fuel efficiency and
moderate gains
in combustion
efficiency; some with
high-end materials
• Portable rocket
stoves
• Fixed rocket
chimney
• Highly improved
(low CO2)
charcoal stoves
Advanced ICS
• Natural draft
gasifier (TLUD or
side-loading)
• Fan gasifier/
fan jet
• TChar stoves
Modern Fuel
Stoves
• LPG and
DME
• Electric and
Induction
Natural gas •
• Kerosene
Renewable
Fuel Stoves
Derive energy from
renewable non-
woodfuel energy
sources; some are
supplementary
rather than primary
cookstoves
• Biogas
• Ethanol
• Methanol
• Solar ovens
• Retained heat
cookers
b
Fan jet or natural draft
biomass gasifiers
with very high fuel
and combustion
efficiencies; may
require
pellet/briquette fuel
Rely on fossil fuels
or electricity, have
high fuel efficiency,
and very low
particulate
emissions
High
Sources: World Bank; Global Alliance for Clean Cookstoves; Task Team analysis.
a Although legacy stoves are categorized as “improved” within the typology, the actual performance of many legacy stoves likely falls below provisional ISO/IWA standards.
b Controlled tests of good quality kerosene pressure stoves show low emissions, but field data suggest that many kerosene stoves are actually highly polluting.
c “Potential impact” defined as potential positive impact on health and environment outcomes vis-a-vis traditional cooking solutions.
14T h e S t a t e o f t h e G l o b a l C l e a n a n d I m p r o v e d C o o k i n g S e c t o r
style cooking solutions such as the Onil cookstove in Central America; fixed mud, cement, and brick
rocket stoves in East Africa; and a variety of portable rocket-style biomass stoves across the developing
world. Clean cooking solutions include low-emission technologies such as ACSs, which use fans or
natural draft gasification principles; stoves using modern fuels such as LPG, dimethyl ether (DME),
natural gas, and electricity; a subset of kerosene stoves;17 and a variety of renewable cooking solutions
such as biogas stoves, ethanol stoves, solar cookers, and retained-heat cooking devices.
B. REPORT OBJECTIVES
The emerging clean and improved cooking opportunity is not terra incognita for researchers. Over
the years, the sector has been covered by hundreds of publications that have focused on the harmful
effects of traditional fuels, the benefits of improved cooking solutions, success factors for improved-
cookstove and clean-fuel interventions, market barriers—and, increasingly, on insights into consumer
preferences and distribution, marketing, and financing business models.
Sector overview reports, most notably Igniting Change: A Sector Strategy for Universal Adoption of
Clean Cookstoves and Fuels (Global Alliance for Clean Cookstoves 2011), Household Energy Access
for Cooking and Heating: Lessons Learned and the Way Forward (World Bank 2012), Household
Cookstoves, Environment, Health, and Climate Change: A New Look at an Old Problem (World Bank
2012), and Scaling Up Clean Cooking Solutions (IFC 2013) have summarized the overall case for clean
cooking solutions and have presented recommendations for addressing the sector’s challenges. In the
past few years, these overview reports have been supplemented by 18 country market assessment
reports prepared by the Global Alliance, detailed 2012 and 2013 surveys of the Global Alliance’s
partner base, which elucidate many key trends, and more recent in-depth reports published by the
World Bank and ESMAP on Africa and Central America regions and large national markets in Asia like
India, Indonesia, and China.18
While it builds on the existing literature, this report differs from past efforts by constructing a
comprehensive global quantitative fact base. It also situates the discussion of improved and clean
biomass stoves within the context of the broader cooking fuels landscape, including modern fuel
markets, renewable fuel alternatives, and sustainability strategies for biomass supply.
The objectives of this report are threefold:
1. Establish a common fact base for sector analysis. The report is an opportunity to build sector
consensus and start to remedy the absence of agreed-upon regional and global baselines for
basic questions on cooking solution typologies, fuel market trends, consumer segments, cookstove
penetration levels, key players, and enabling environment.
2. Build a case for increased sector focus and investment. The World Bank, the Global Alliance for
Clean Cookstoves, Sustainable Energy for All, and other global clean cooking sector players, such
as GIZ, DFID, and USAID, are working toward the increased mobilization of funding for clean cooking
solutions. The current report supports these efforts by introducing new evidence for why clean cooking
matters and a roadmap for how donors, governments, NGOs, and private enterprises can help. The

15I n t r o d u c t i o n
private sector is an important audience for this report. Much of the material herein is aimed to arm
entrepreneurs and financiers with the evidence they will need to boost their investment levels and
appropriately prioritize cookstove market entry and expansion efforts.
3. Inform intervention strategies. Although the clean cooking sector is replete with interesting new
products, distribution models, financing approaches, and program designs, many of the innovative
efforts are still at an early stage and there is little consensus on successful models or priority
intervention levers. This report is an attempt to advance the debate by highlighting existing successes,
summarizing lessons learned to date, and offering recommendations on intervention options for
donors, policymakers, and the private sector.
C. REPORT METHODOLOGY
This report is based on a multi-pronged research approach. The methodology incorporates the
systemic review of over 300 secondary sources, analysis of primary data in dozens of existing market
and household surveys, including the recent Global Alliance market assessment reports and 2012–13
member surveys, publicly available product testing result databases, impact evaluation data from
large regional and country programs, focus group discussions with sector stakeholders in Africa and
South Asia regional consultations, and interviews with more than 100 key global sector participants,
including product designers, manufacturers, distributors, financiers, program managers, and
policymakers.
Data collection efforts have included the development of several country-level databases on historical
fuel mix, energy expenditures, fuel prices over time, impact data (e.g., HAP-linked premature deaths
and DALYs, fuel collection times, deforestation rates), and cookstove market penetration. Market
models and analyses built for the report include a global cost-benefit analysis tool for evaluating
sector opportunity costs and impacts, a fuel use and expenditure forecast model, a regional
cooking consumer segmentation, a sales database of improved and advanced biomass cookstove
manufacturers, ICS market growth forecast models, and a multi-dimensional country prioritization tool.
We use 2012 as the baseline year for the stove and fuel penetration data in this report for the purposes
of cross-regional comparability, but where applicable more recent information from 2013 and 2014 is
incorporated by way of illustration and example. The resulting set of data and analyses provides the
most comprehensive picture of the clean and improved cooking solutions sector available to date, but
also has several weaknesses due to underlying data challenges. Sector technology definitions, impact
indicators, and sales tracking methodologies are inconsistently defined and variably applied. End-
user data, including information on consumer usage patterns and preferences, are of variable quality
and available for only a small proportion of markets. Finally, because private sector ICS and fuel sales
information and public sector cookstove program indicators are self-reported, they are not always
credible.
The information provided in this report constitutes a best-effort attempt to harmonize definitions and
data sources to give a comprehensive picture of the overall sector landscape, with the caveat that
16T h e S t a t e o f t h e G l o b a l C l e a n a n d I m p r o v e d C o o k i n g S e c t o r
this is likely to be somewhat imprecise in various instances because of these definitional and data
quality challenges. We have interpreted data conservatively and highlighted potentially contentious
and ambiguous areas where appropriate. Ultimately, this report should be seen as a starting point for
sector analysis and the data should be updated in future editions as the cooking sector evolves.
D. REPORT SCOPE
There are no “magic bullets” or one-size-fits-all solutions to addressing the challenges of the
household air pollution (HAP) issue. Clean cooking solutions currently span a vast and constantly
growing range of products with different objectives, usage features, and impact potentials. The
consumer base for clean fuels and improved stoves is highly diverse—straddling poor rural firewood
collectors living in remote areas and using age-old cooking techniques; middle-income farmers who
can afford to transition to modern fuels or renewable solutions but fail to do so due to the weight
of custom and tradition; urban slum dwellers desperate for alternatives to the high fuel costs that
predominate in urban environments; and a growing aspirational urban middle class that, though it has
the means for adopting cutting-edge clean fuel and advanced biomass cookstove technologies, in
many instances, continues to use traditional fuels and stoves.
This diversity of market needs and solutions has dictated an approach for this report that is agnostic
with respect to technologies and inclusive in terms of target customer segments, intervention
approaches, distribution models, and financing mechanisms. In accordance with these principles, the
scope of this report is defined within the following bounds:
• All major developing countries. This report covers 82 countries in Sub-Saharan Africa, Latin
America, the Caribbean, and developing Asia, accounting for 98% of all global users of solid fuel.
• Residential cooking. This report focuses on the cooking needs of households rather than those
of institutions or small businesses, though many of the report’s insights may hold true for the
institutional sector as well.
• Clean cooking ecosystem. While this report focuses on improved solid fuel cookstoves, it
covers the full landscape of clean cooking solutions, including modern and renewable solutions,
processed solid fuel technologies, and intervention opportunities for improving the efficiency and
sustainability of traditional biomass fuel value chains.
• Cooking uses. Although this report touches on the fact that cookstoves serve many different
purposes—including most notably space and water heating—the analysis, where possible,
focuses on cooking solutions and cooking-related aspects of more multidimensional stoves.
• Improved biomass cookstoves. This report covers the full spectrum of ICSs (see the
“Terminology” section for further detail), which includes all stoves that improve on the traditional
open fire and other baseline cooking technologies.
• Modes of production. This report covers all methods of cookstove production. These include
artisanal manufactured stoves (built-in and portable); semi-industrial cookstove production
models, involving networks of artisans or large workshops; and industrial production models,
involving precision tooling, automation, and scaled manufacturing.
17I n t r o d u c t i o n
E. REPORT STRUCTURE
Following this introduction, this report is divided into the following chapters:
Chapter 2: The Case for Clean and Improved Cooking. An overview of the case for clean cooking
solutions, including an analysis of the negative externalities of solid fuel dependence; a review of the
latest state of knowledge on key health, environment, economic, and gender impact drivers; and a
summary of the emerging evidence for the mitigation potentials of a range of clean fuel and improved
cookstove solutions.
Chapter 3: The Demand for Clean and Improved Cooking Energy. A review of the clean cooking
demand landscape, including fuel market evolution, fuel demand drivers, and a high-level market
segmentation of global cookstove users.
Chapter 4: The Supply Landscape. An overview of the clean and improved cooking solution space,
including the current status and market penetration of various fuel and cookstove technologies.
Chapter 5: The Cooking Appliance Supply Chain. A review of key elements of the supply chain for
clean and improved cookstoves, including methods of production, product economics, distribution,
and financing models.
Chapter 6: The Sector Ecosystem. An overview of public and donor sector models for reaching scale,
sector funding, and the regulatory environment.
Chapter 7: Looking Forward and Recommendations. A market forecast for the sector, an overview of
barriers to more rapid growth, and recommendations for public and private sector stakeholders.
E N D N O T E S
16 See the “Terminology” section for a clarification of terms used; also see more detailed discussion of relative
performance, features, and examples of improved and clean stove types in Chapter 4.
17 A large but unknown share of kerosene stoves likely produce significant harmful particulate emissions globally
and, consequently, should be excluded from the clean cooking definition. See Lam et al., 2012.
18 For 2011–14 country market assessment reports from the Global Alliance, see www.cleancookstoves.org;
additional market assessment reports for key markets like China are forthcoming in 2015. The Global Alliance’s
Results Report 2013: Sharing Progress on the Path to Adoption of Cleaner and More Efficient Cooking Solutions
(2014) is another important resource with survey data from over 456 Global Alliance members that is referenced
throughout this report. Key regional World Bank and ESMAP reports include Clean and Improved Cooking in
Sub-Saharan Africa: A Landscape Report (World Bank/ESMAP/ACCES, 2014), China: Accelerating Household
Access to Clean Cooking and Heating (World Bank, 2013), Cleaner Hearths, Better Homes: New Stoves for India
and the Developing World (Barnes et. al, 2012), and What We Have Learned about Household Biomass Cooking
in Central America (Wang et. al, 2013).
18T h e S t a t e o f t h e G l o b a l C l e a n a n d I m p r o v e d C o o k i n g S e c t o r
T H E C A S E F O R C L E A N A N D I M P R O V E D C O O K I N G
Worldwide, solid fuels—including wood, charcoal, coal, animal dung, and crop waste—are the primary
cooking and heating energy supply for more than 3 billion people, particularly rural poor households
in developing countries.19 Excluding “legacy” traditional stoves with chimneys, under one-third (31%) of
these solid fuel households (~200 million) have access to improved or clean cookstoves.20 Fewer than
1.5 million solid fuel households use clean, advanced gasifier stoves, and the market penetration of fuel-
efficient “intermediate” ICS technologies such as rocket stoves is similarly low (20–25 million households).
Households that use modern fuel cooking solutions as their primary stove cover 1.8 billion
people or 37% of the total in the developing world. Due to the phenomenon of fuel and stove
“stacking,” many of these households, in some markets the majority, continue to use solid fuel stoves
in parallel as secondary cooking solutions. A significant minority of modern fuel households (28 million)
cook with polluting kerosene stoves. The market penetration of clean renewable cooking alternatives
such as ethanol, biogas, solar, or retained-heat cookers is low and highly concentrated in several
countries like China and India.
This high level of dependence on traditional solid fuels and unimproved or minimally improved cookstoves
imposes immense health, environmental, economic, and social costs on developing country households
and economies. This chapter quantifies the cumulative impact of global solid fuel use, reviews the key
impact levers, and assesses the growing, though not yet unequivocal, evidence for the potential of
different clean-fuel and improved biomass solutions to mitigate the harmful effects of solid fuel cooking.
A. THE IMPACT OF COOKING WITH SOLID FUELS
The cumulative negative impact of cooking with solid fuels on developing world households,
economies, and the global environment is large. The past few decades have seen the appearance
of an extensive literature on the harmful effects of cooking with solid fuels. Although many questions
remain on the magnitude of specific impacts, there is growing academic and policymaker consensus
that negative externalities are extensive and touch on issues of health, the environment, and
poverty—as well as a host of other critical factors that are more difficult to quantify, such as gender
equity, nutritional status, and education.21
We estimate the mid-range economic value of these negative externalities globally at over $ 120
billion annually against a scenario of shifting all solid fuel users to high performing ICSs. Although
staggering, the figure is likely conservative as it quantifies only a subset of known health, economic,
and environmental effects. The largest impact driver is economic ($ 20–147 billion), stemming from the
direct financial burden on households from avoidable solid fuel purchases and the opportunity cost of
time spent on firewood collection. The estimated cost of health impacts ($ 3–57 billion) results from the
valuation of avoidable deaths and disability-adjusted life years (DALYs) currently lost to household air
pollution. There is significant uncertainty around the health externality, depending on the methodology
2
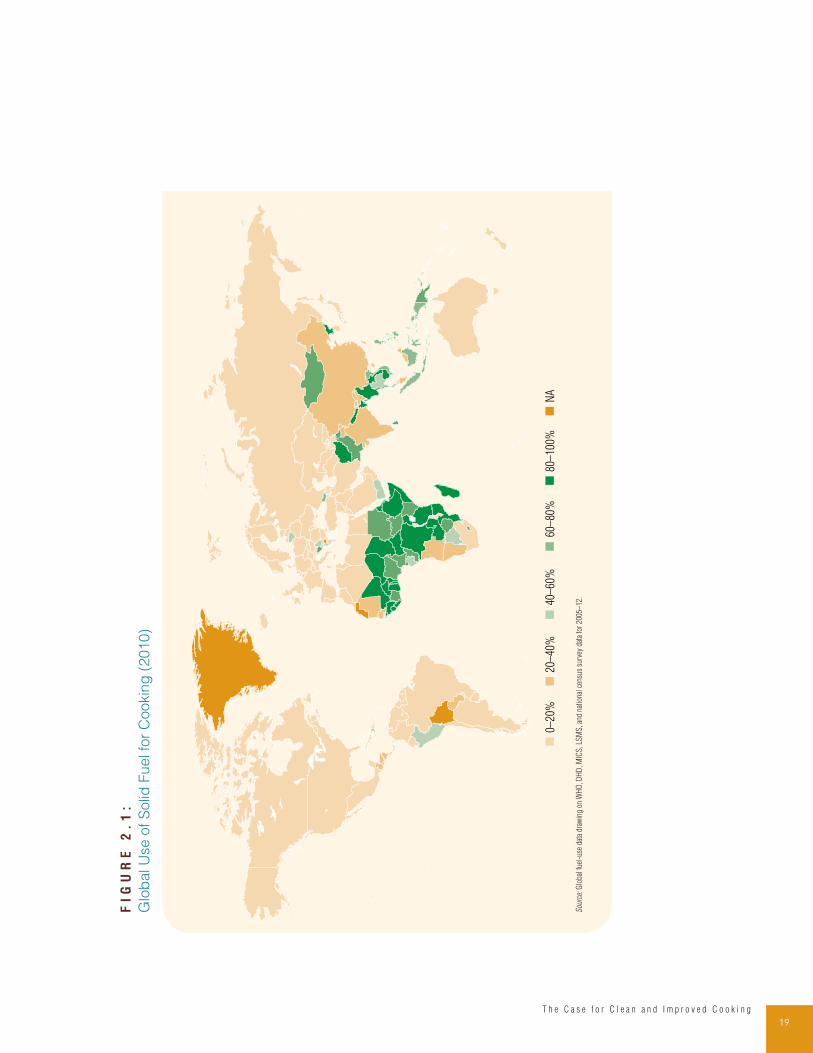
19T h e C a s e f o r C l e a n a n d I m p r o v e d C o o k i n g
FI
GU
RE
2
.1
:
Glo
bal U
se o
f S
olid
Fuel fo
r C
ookin
g (
2010)
Sour
ce: G
loba
l fue
l-us
e da
ta d
raw
ing
on W
HO
, DH
D, M
ICS
, LS
MS
, and
nat
iona
l cen
sus
surv
ey d
ata
for
2005
–12
.
0–20
%40
–60
%80
–10
0%20
–40
%60
–80
%N
A
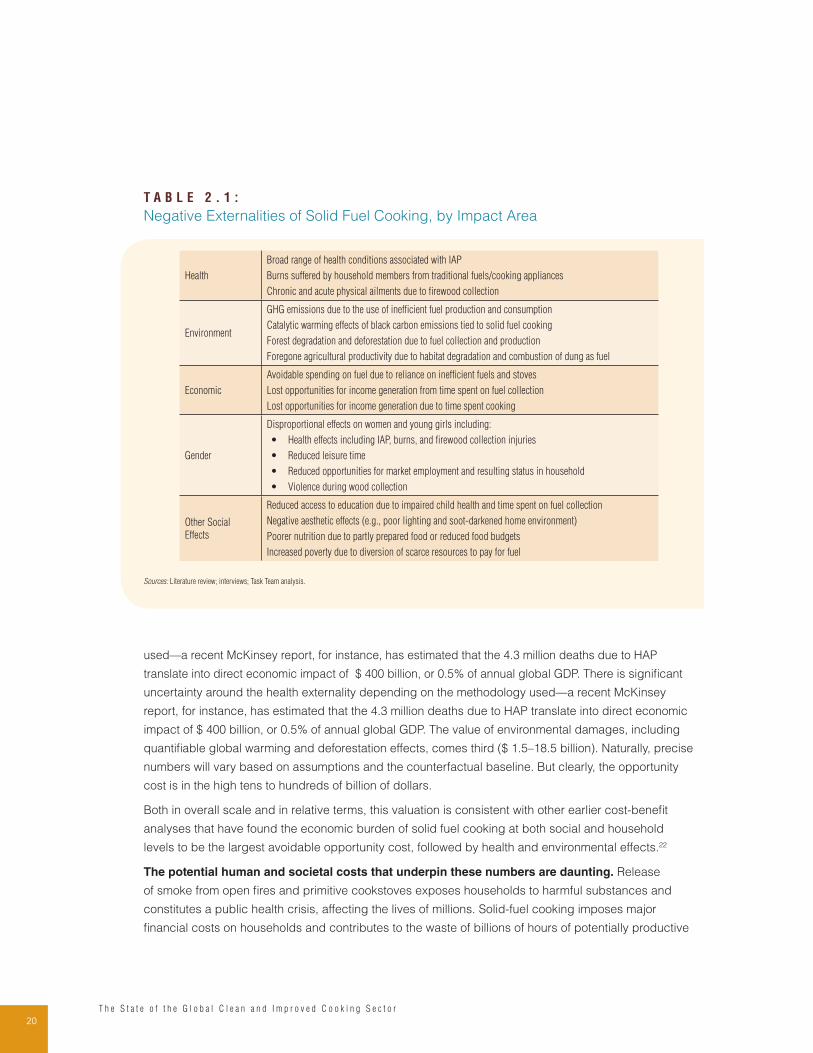
20T h e S t a t e o f t h e G l o b a l C l e a n a n d I m p r o v e d C o o k i n g S e c t o r
used—a recent McKinsey report, for instance, has estimated that the 4.3 million deaths due to HAP
translate into direct economic impact of $ 400 billion, or 0.5% of annual global GDP. There is significant
uncertainty around the health externality depending on the methodology used—a recent McKinsey
report, for instance, has estimated that the 4.3 million deaths due to HAP translate into direct economic
impact of $ 400 billion, or 0.5% of annual global GDP. The value of environmental damages, including
quantifiable global warming and deforestation effects, comes third ($ 1.5–18.5 billion). Naturally, precise
numbers will vary based on assumptions and the counterfactual baseline. But clearly, the opportunity
cost is in the high tens to hundreds of billion of dollars.
Both in overall scale and in relative terms, this valuation is consistent with other earlier cost-benefit
analyses that have found the economic burden of solid fuel cooking at both social and household
levels to be the largest avoidable opportunity cost, followed by health and environmental effects.22
The potential human and societal costs that underpin these numbers are daunting. Release
of smoke from open fires and primitive cookstoves exposes households to harmful substances and
constitutes a public health crisis, affecting the lives of millions. Solid-fuel cooking imposes major
financial costs on households and contributes to the waste of billions of hours of potentially productive
T A B L E 2 . 1 :
Negative Externalities of Solid Fuel Cooking, by Impact Area
Health
Broad range of health conditions associated with IAP
Burns suffered by household members from traditional fuels/cooking appliances
Chronic and acute physical ailments due to firewood collection
Environment
GHG emissions due to the use of inefficient fuel production and consumption
Catalytic warming effects of black carbon emissions tied to solid fuel cooking
Forest degradation and deforestation due to fuel collection and production
Foregone agricultural productivity due to habitat degradation and combustion of dung as fuel
Economic
Avoidable spending on fuel due to reliance on inefficient fuels and stoves
Lost opportunities for income generation from time spent on fuel collection
Lost opportunities for income generation due to time spent cooking
Gender
Disproportional effects on women and young girls including:
• Health effects including IAP, burns, and firewood collection injuries
• Reduced leisure time
• Reduced opportunities for market employment and resulting status in household
• Violence during wood collection
Other Social
Effects
Reduced access to education due to impaired child health and time spent on fuel collection
Negative aesthetic effects (e.g., poor lighting and soot-darkened home environment)
Poorer nutrition due to partly prepared food or reduced food budgets
Increased poverty due to diversion of scarce resources to pay for fuel
Sources: Literature review; interviews; Task Team analysis.
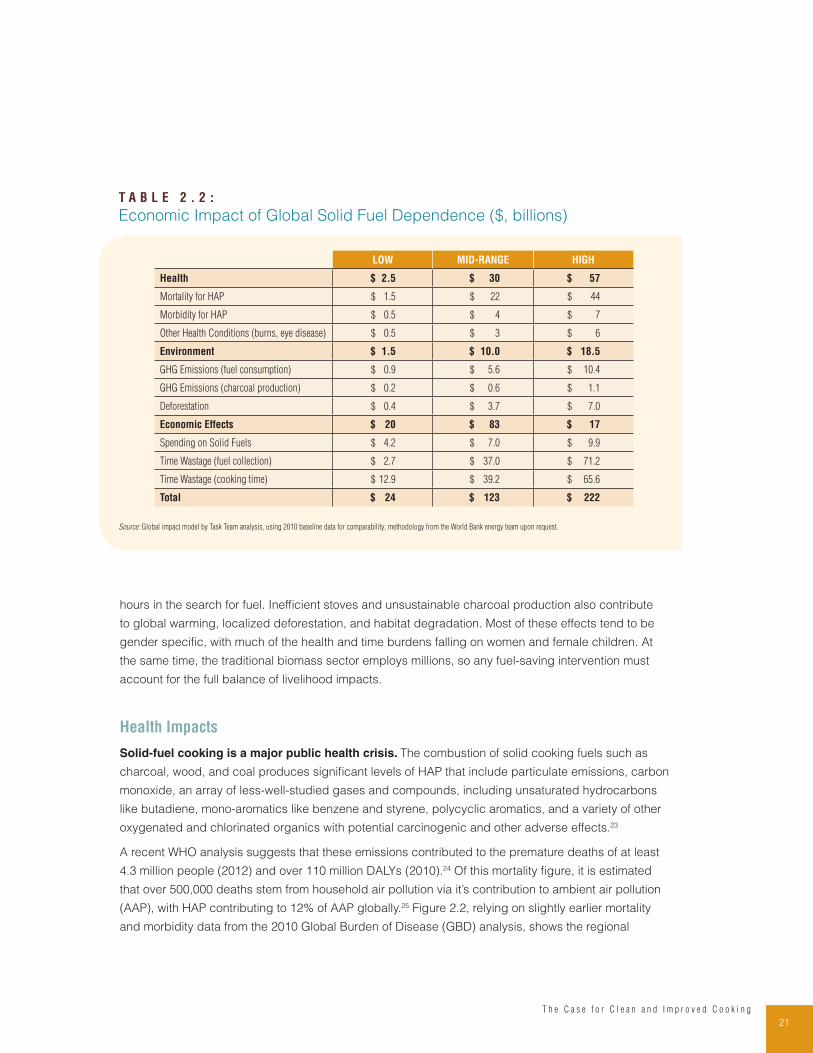
21T h e C a s e f o r C l e a n a n d I m p r o v e d C o o k i n g
hours in the search for fuel. Inefficient stoves and unsustainable charcoal production also contribute
to global warming, localized deforestation, and habitat degradation. Most of these effects tend to be
gender specific, with much of the health and time burdens falling on women and female children. At
the same time, the traditional biomass sector employs millions, so any fuel-saving intervention must
account for the full balance of livelihood impacts.
Health Impacts
Solid-fuel cooking is a major public health crisis. The combustion of solid cooking fuels such as
charcoal, wood, and coal produces significant levels of HAP that include particulate emissions, carbon
monoxide, an array of less-well-studied gases and compounds, including unsaturated hydrocarbons
like butadiene, mono-aromatics like benzene and styrene, polycyclic aromatics, and a variety of other
oxygenated and chlorinated organics with potential carcinogenic and other adverse effects.23
A recent WHO analysis suggests that these emissions contributed to the premature deaths of at least
4.3 million people (2012) and over 110 million DALYs (2010).24 Of this mortality figure, it is estimated
that over 500,000 deaths stem from household air pollution via it’s contribution to ambient air pollution
(AAP), with HAP contributing to 12% of AAP globally.25 Figure 2.2, relying on slightly earlier mortality
and morbidity data from the 2010 Global Burden of Disease (GBD) analysis, shows the regional
T A B L E 2 . 2 :
Economic Impact of Global Solid Fuel Dependence ($, billions)
LOW MID-RANGE HIGH
Health $ 2.5 $ 30 $ 57
Mortality for HAP $ 1.5 $ 22 $ 44
Morbidity for HAP $ 0.5 $ 4 $ 7
Other Health Conditions (burns, eye disease) $ 0.5 $ 3 $ 6
Environment $ 1.5 $ 10.0 $ 18.5
GHG Emissions (fuel consumption) $ 0.9 $ 5.6 $ 10.4
GHG Emissions (charcoal production) $ 0.2 $ 0.6 $ 1.1
Deforestation $ 0.4 $ 3.7 $ 7.0
Economic Effects $ 20 $ 83 $ 17
Spending on Solid Fuels $ 4.2 $ 7.0 $ 9.9
Time Wastage (fuel collection) $ 2.7 $ 37.0 $ 71.2
Time Wastage (cooking time) $ 12.9 $ 39.2 $ 65.6
Total $ 24 $ 123 $ 222
Source: Global impact model by Task Team analysis, using 2010 baseline data for comparability; methodology from the World Bank energy team upon request.
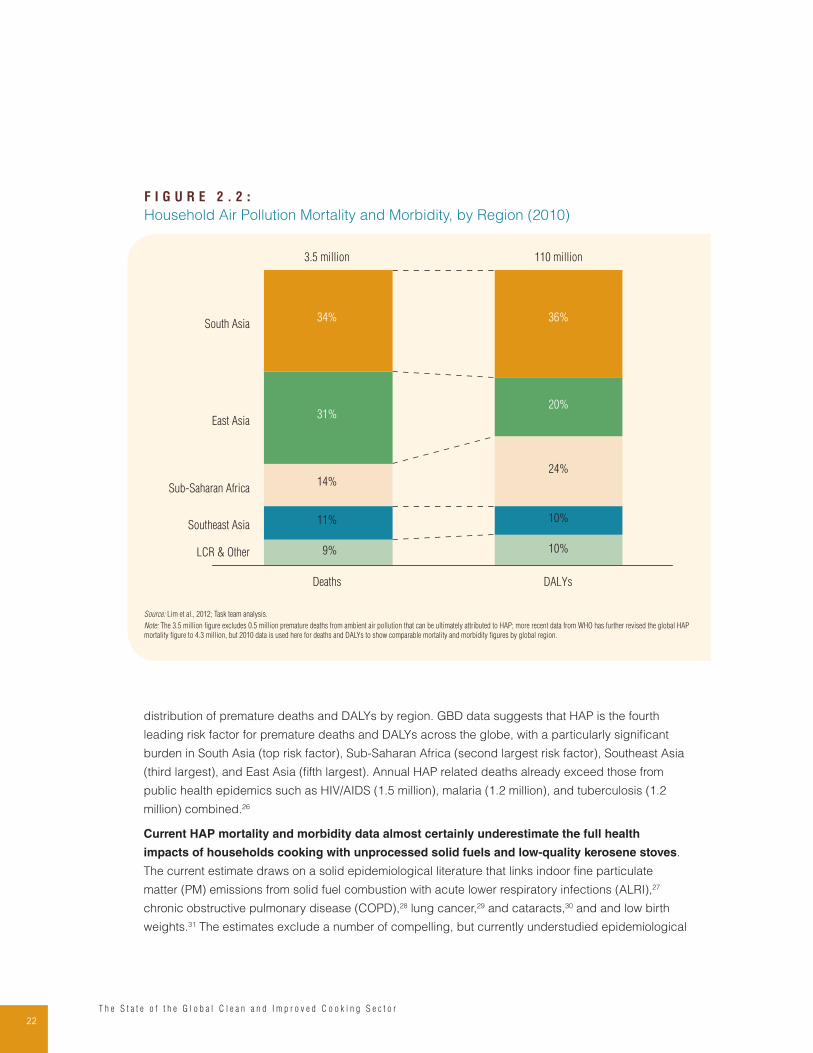
22T h e S t a t e o f t h e G l o b a l C l e a n a n d I m p r o v e d C o o k i n g S e c t o r
distribution of premature deaths and DALYs by region. GBD data suggests that HAP is the fourth
leading risk factor for premature deaths and DALYs across the globe, with a particularly significant
burden in South Asia (top risk factor), Sub-Saharan Africa (second largest risk factor), Southeast Asia
(third largest), and East Asia (fifth largest). Annual HAP related deaths already exceed those from
public health epidemics such as HIV/AIDS (1.5 million), malaria (1.2 million), and tuberculosis (1.2
million) combined.26
Current HAP mortality and morbidity data almost certainly underestimate the full health
impacts of households cooking with unprocessed solid fuels and low-quality kerosene stoves.
The current estimate draws on a solid epidemiological literature that links indoor fine particulate
matter (PM) emissions from solid fuel combustion with acute lower respiratory infections (ALRI),27
chronic obstructive pulmonary disease (COPD),28 lung cancer,29 and cataracts,30 and and low birth
weights.31 The estimates exclude a number of compelling, but currently understudied epidemiological
F I G U R E 2 . 2 :
Household Air Pollution Mortality and Morbidity, by Region (2010)
11% 10%
14%24%
10%9%
34%
31%
110 million
LCR & Other
East Asia
DALYs
South Asia
Sub-Saharan Africa
Southeast Asia
20%
36%
Deaths
3.5 million
Source: Lim et al., 2012; Task team analysis.
Note: The 3.5 million figure excludes 0.5 million premature deaths from ambient air pollution that can be ultimately attributed to HAP; more recent data from WHO has further revised the global HAP
mortality figure to 4.3 million, but 2010 data is used here for deaths and DALYs to show comparable mortality and morbidity figures by global region.
23T h e C a s e f o r C l e a n a n d I m p r o v e d C o o k i n g
linkages where research is currently under way, including asthma; tuberculosis; childhood nutritional
deficiencies, including anemia and stunted growth; blindness; maternal depression; cognitive
impairment in the young and old; upper respiratory, digestive, and cervical cancers; the exacerbation
of the effects of HIV/AIDS; and bacterial meningitis.32
The data also exclude more prosaic discomforts and physical injuries associated with HAP from solid
fuel cooking such as headaches and eye irritation, which are almost universally reported in surveys
of solid fuel users in Africa and are a particularly common complaint for households with carbon
monoxide exposure from charcoal cooking.33 Finally, the HAP disease burden estimates do not account
for the health effects of cooking with polluting kerosene stoves—an emerging area of research.34 Data
from Asia, which still needs to be corroborated by field research in large African kerosene cooking
markets like Nigeria and South Africa, suggests that many types of kerosene stoves elevate indoor
PM concentrations above WHO guideline levels and generate potentially dangerous levels of carbon
monoxide and aromatic hydrocarbons; there is also some evidence of links to impaired lung function,
asthma, cataracts, and respiratory and salivary gland cancers.35
Firewood collection injuries and cooking burns are additional underappreciated health
consequences of unimproved biomass and kerosene stoves. Though largely anecdotal, evidence
from multiple countries suggests that household members involved in wood collection suffer from
a range of maladies, including, cuts, broken bones, skin irritations, infections, and bites.36 Head-
loading and transport of heavy firewood bundles, in particular, can contribute to fatigue, headaches,
pains in the joints and chest, chronic back pains, waist pains, and spinal injuries with incidence
of some of these symptoms ranging from 15–80% of households depending on geography and
condition.37 Robust data on these conditions are limited,38 but even low incidence rates will translate
into a large disease burden since more than 360 million households regularly engage in firewood
collection across the developing world.39 Cooking with solid fuels and unimproved kerosene (i.e.,
paraffin) stoves also contributes to burns, reportedly accounting for a large share of the 300,000
global burn deaths.40
The quality of data on “minor” physical injuries from solid fuel reliance is a major gap in the
literature. Though of less interest to epidemiologists, from an end-beneficiary perspective the
avoidance of basic injuries and immediate physical discomfort is often more important than the long-
term prospects of developing deadly conditions. Strong and consistent anecdotal evidence shows
that awareness of basic injuries is high relative to long-term chronic disease potential41 and causality
is far more apparent for populations with limited medical literacy. The value of highlighting these
health effects in ICS and clean-fuel marketing and behavior-change campaigns, therefore, is likely to
be high.42
Environment and Climate Impacts
Solid-fuel cooking has a range of negative environmental and climatic effects. In 2010, solid fuel
households across the developing world used at least 720 MT of firewood and 33 MT of charcoal
24T h e S t a t e o f t h e G l o b a l C l e a n a n d I m p r o v e d C o o k i n g S e c t o r
for cooking, a total of over 1 billion MT or 1.3m3 of woodfuel annually,43 along with 150 MT of coal.44
A recent Global Alliance funded study estimates the total biomass fuel demand at 1.36 billion MT
annually.45 It is clear that such high levels of solid fuel combustion contribute to global warming, have
negative local climatic effects, and—largely because of charcoal production—are contributing factors
to localized deforestation and forest degradation. Significant methodological uncertainty remains,
however, on estimating the scale of many of these effects.
Large-scale consumption of solid fuels produces greenhouse gas emissions that contribute
to global warming. Solid-fuel cooking and related charcoal production across the developing
world generate greenhouse gas emissions of 0.5–1.2 billion MT of carbon dioxide (CO2), including
the CO2 equivalents of N2O, and CH4 emissions covered by the Kyoto Protocol.46 This represents
1.5–3.0% of global CO2 emissions. These CO2 emissions are on par with the 2010 carbon footprint
of an industrialized country like the United Kingdom at the bottom of this range and approach that
of Japan at the top of the range.47 Uncertainty around the precise greenhouse gas figure stems from
the fact that CO2 emitted from the combustion of renewably harvested wood is re-absorbed during
biomass regrowth and therefore does not qualify as a climate forcing emission. The level of woodfuel
renewability is an area of ongoing debate and research.48
Black carbon and other particles of incomplete combustion from solid fuel cooking may play a
more important role than CO2 in anthropogenic global warming. Traditional solid fuel stoves and
open cooking fires account for over 1,500 Gg of black carbon, which represents 20% of global black
carbon emissions and is consistent with earlier estimates of residential solid fuel use, equaling up
to 25% of all black carbon emissions globally.49 When the assessment includes these black carbon
emissions and other particles of incomplete combustion not listed in the Kyoto Protocol, like carbon
monoxide and non-methane hydrocarbons, the potential annual carbon footprint of global solid fuel
cooking increases to 1.3–1.7 MT CO2-equivalent.50
While CO2 remains in the atmosphere for decades, black carbon particles have an atmospheric lifetime
of only 8–10 days,51 so the reduction of black carbon emissions can theoretically lead to relatively rapid
global cooling benefits. This has led to speculation that the reduction of black carbon emissions from
traditional solid fuel stoves and open fires could be one of the “critical near-term levers” for addressing
global warming52 in addition to the various health co-benefits of removing black carbon from household
environments.
Claims about black carbon cooking impacts must at this stage be interpreted with caution.
The current climate-science consensus is that solid-fuel black carbon and products of incomplete
combustion emissions contribute to global warming over the long term. However, the magnitude of the
effect is subject to significant uncertainty and, in the short term, the climate-forcing impact of biofuel
cooking may be close to neutral due to offsetting cooling factors.53 Although the direct climate-forcing
impact of cookstove black carbon emissions is very positive, roughly 20% of the warming effect is
offset by the simultaneous release of organic aerosols from solid fuel cooking.54 Organic aerosols have
additional indirect cooling effects via still-poorly-understood liquid-cloud interactions that, in the near
term, may offset all or the majority of the warming impact of solid fuel cooking. The ratio of organic
25T h e C a s e f o r C l e a n a n d I m p r o v e d C o o k i n g
carbon to black carbon, which varies widely by cookstove type, is therefore a critical consideration in
any analysis of climatic impacts of alternatives to traditional solid fuel stoves.
Short-term local climatic effects of black carbon emissions, including from traditional biomass
cooking, are also likely to be harmful. Black carbon emissions can influence regional precipitation
and temperature patterns through albedo cooling effects and glacial melting, contributing to
anthropogenic changes in monsoon circulation and the retreat of mountain glaciers in South Asia.55
While less documented, local climactic effects of black carbon emissions are also likely to be
substantial in Africa, potentially affecting snow melt on Mount Kilimanjaro and rainfall patterns in
the mountain ecosystems of the Rwenzori Range, which serve as water catchments for a large part
of Central Africa.56 Via such local climate impacts, black carbon can also have significant negative
effects on agriculture production, most directly for mountain cash crops such as coffee and tea. The
impacts of such effects may be important, but have not yet been analyzed.
Biomass cooking is among the contributing factors to forest degradation and localized
deforestation, though the precise extent of these effects is a matter of debate. The current
consensus view is that the primary causes of deforestation are land clearing for agriculture,
exploitation of wood for lumber and road building, commercial and residential development, and other
permanent land uses rather than the collection of firewood for energy.57 There is less agreement in the
literature on forest degradation58 and the deforestation effects of charcoal production. Some analysts
suggest that charcoal may be a significant new driver of degradation and localized deforestation in
Africa and Asia, but most experts characterize charcoal production as just one forest-degradation
factor among many.
What is clear is that occasional claims of a renewed “woodfuel crisis” are not supported by the
data and, despite very real localized instances of severe pressure on forest resources, the general
renewability of wood stocks is higher than is usually assumed.59 The availability of woody biomass
outside of forests, such as in woodlots, plantations, and agroforestry systems, is often systematically
neglected. Assessments of woodfuel renewability, in the case of both firewood collection and charcoal
production, also do not consider forest developments at the micro scale. The exploitation of forests
for woodfuel often triggers a change in forest structure towards a short-rotation management system
dominated by more trees and woody plants of smaller diameters rather than fewer but larger trees.
The regrowth potential of natural forests is likewise poorly understood and often underestimated,
contributing to false assessments of physical biomass scarcity.
Firewood collection. The vast majority of firewood collected in rural areas comes not from live forest
trees but from ‘invisible trees’ such as bushes and biomass lying around roads, next to houses, and in
farm fields.60 Thus when local firewood demand exceeds the growth rates of local forests, it does not
mean that deforestation has taken or is taking place. There is somewhat more evidence that firewood
gathering may contribute to forest degradation when other contributing factors are present,61 though
it is not possible to separate and identify the precise impact of firewood collection from these other
factors. Degradation effects related to firewood collection may include path clearing in forests, the
lopping of tree branches, and the collection of dead wood and branch detritus from the forest floor.62 In
26T h e S t a t e o f t h e G l o b a l C l e a n a n d I m p r o v e d C o o k i n g S e c t o r
localized cases of excessive wood foraging, degradation can lead to the thinning of tree crowns and
ground-level plant densities, soil nutrient depletion, changes in tree species composition, and the loss
of floral and faunal biodiversity.63
Dung and crop-waste collection. The habitat-degradation effects of the collection of other traditional
biomass such as dung and crop waste are less well studied, but may also be material in some cases.
Studies in Ethiopia, for example, have suggested that dung use lowers agricultural productivity
because cooking with dung reduces its availability as a fertilizer.64 In South Asia, the evidence for the
soil erosion effects of dung and crop-residue use for fuel has been more mixed and further research is
needed for meaningful impact attribution.65
Charcoal production. Evidence for forest degradation and localized deforestation from charcoal
production is more compelling, though the scale and scope of such effects is highly dependent on
country context.66 In some countries—Tanzania, for example—there is evidence that charcoal producers
selectively focus on wood that produces a dense, slow-burning product, a characteristic of slow-
growing tree species that are more vulnerable to overexploitation.67 In other countries, such as Rwanda,
where charcoal production relies entirely on planted trees such as eucalyptus and pine, it is much less
likely to have negative environmental impacts. Unlike firewood harvesting, which focuses on dry wood
and forest remnants, the production of charcoal typically involves cutting large live trees down to stump
level. The logged trunks are then typically transformed into charcoal using kilns that require 4–12 times
the wood (by volume) for each kilogram of charcoal produced.68 Because a significant share of the
wood used for charcoal production is sourced illegally from public forest land, charcoal prices do not
reflect the scarcity of wood inputs—a strong incentive for unsustainable overharvesting.69
The overall role of charcoal in most markets, relative to other deforestation and forest-degradation
factors such as agriculture, is still likely to be secondary, though there is little consensus on the scale
of the effect.70 Charcoal production pressures are most acute in Africa and select non-African markets
like Haiti. Existing fuel-use trends and urbanization forecasts indicate that Sub-Saharan Africa charcoal
consumption for household cooking will increase 50% over the current decade, from 22 MT in 2010
to 33 MT—with some estimates showing total annual consumption, including non-household cooking
uses of charcoal, increasing to as much as 38 MT by 2020.71 The ultimate effects of charcoal-based
forest degradation are likely more severe than those of firewood foraging. Among potential impacts,
are vegetative cover and subsoil nutrient loss, reduced tree species biodiversity,72 reduced faunal
diversity and abundance,73 and—in extreme cases—the acceleration of processes that leads to the
conversion of degraded forests into agricultural land.
The scale and severity of environmental impacts of traditional biomass cooking vary greatly
across geographies. The influence of solid fuel use on biomass sustainability varies greatly by
country. Likewise, climate forcing emissions from traditional solid fuel cooking are not spread evenly.
One way of visualizing the relative environmental threat potential appears in Figure 2.3. The intensity
of woodfuel harvesting is shown on the vertical axis74 and existing deforestation pressures appear
on the horizontal axis.75 The bubble size reflects a country’s total woodfuel (charcoal and firewood)
consumption from biomass cooking. The total solid fuel population size is highly correlated with the
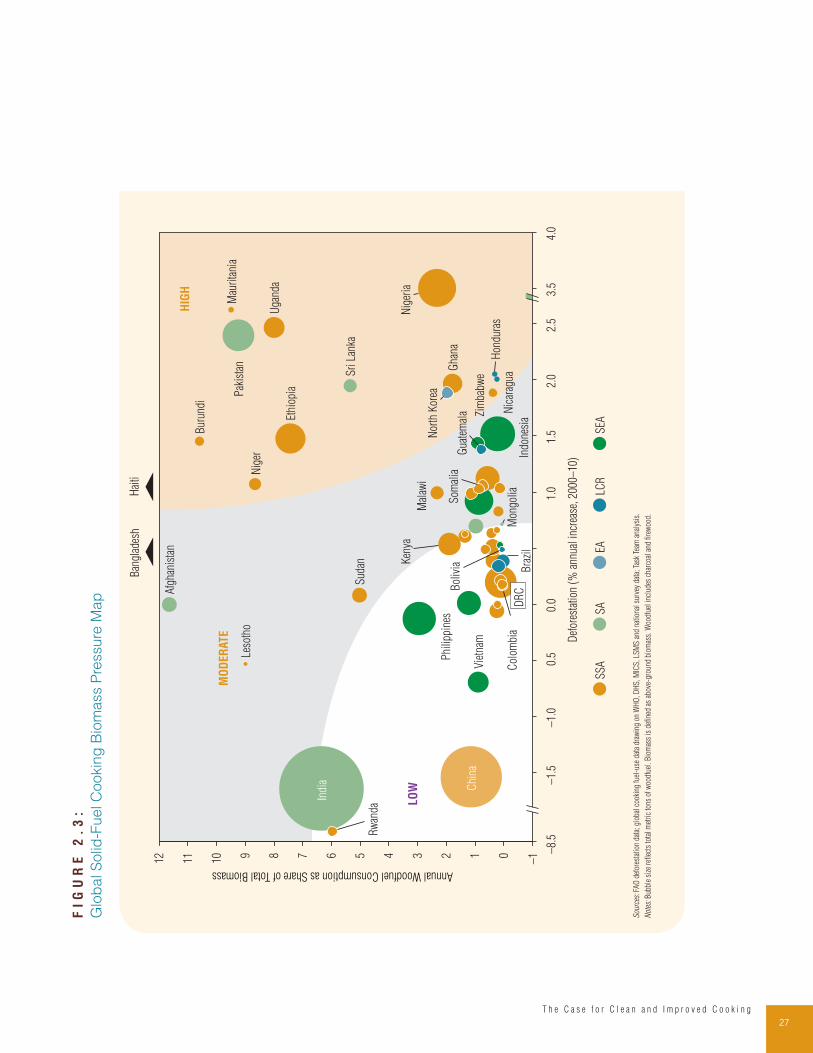
27T h e C a s e f o r C l e a n a n d I m p r o v e d C o o k i n g
FI
GU
RE
2
.3
:
Glo
ba
l S
olid
-Fuel C
ookin
g B
iom
ass P
ressure
Map
LO
W
12 2 1
–10
4.0
311 8 7 6 5 410 9
3.5
2.5
2.0
1.5
1.0
0.0
0.5
–1.
0–
1.5
–8.
5
Def
ores
tatio
n (%
ann
ual i
ncre
ase,
200
0–10
)
Annual Woodfuel Consumption as Share of Total Biomass
Ken
ya
Gha
na
Ethi
opia
DR
C
Bur
undi
Sri
Lan
ka
Pak
ista
n
Nic
arag
uaM
ongo
lia
Nor
th K
orea
Indo
nesi
a
Indi
a
Hon
dura
s
Gua
tem
ala
Col
ombi
a
Chi
na
Afg
hani
stan
Bra
zil
Bol
ivia
Zim
babw
e
Uga
nda
Sud
an
Som
alia
Nig
eria
Nig
er
Mau
rita
nia
Mal
awi
Leso
tho
Vie
tnam
Phi
lippi
nes
MO
DER
ATE
HIG
H
SEA
SA
LCR
SS
AEA
Hai
tiB
angl
ades
h
Rw
anda
Sour
ces:
FAO
def
ores
tatio
n da
ta; g
loba
l coo
king
fuel
-use
dat
a dr
awin
g on
WH
O, D
HS
, MIC
S, L
SM
S a
nd n
atio
nal s
urve
y da
ta; T
ask
Team
ana
lysi
s.
Notes
: Bub
ble
size
refl
ects
tota
l met
ric
tons
of w
oodf
uel.
Bio
mas
s is
defi
ned
as a
bove
-gro
und
biom
ass.
Woo
dfue
l inc
lude
s ch
arco
al a
nd fi
rew
ood.

28T h e S t a t e o f t h e G l o b a l C l e a n a n d I m p r o v e d C o o k i n g S e c t o r
greenhouse gas and black carbon emission potential of each country and also shows the relative
scale of the deforestation/degradation challenge across geographies.
The figure shows clearly that a number of countries—Ethiopia, Nigeria, Pakistan, Sri Lanka, and
Uganda, as well as several smaller nations—fall into the highest woodfuel biomass pressure zone. In
this zone, high rates of deforestation are accompanied by significant use of national firewood stock
for cooking activities. With high rates of deforestation, the significant population of firewood users
is likely to come under pressure if resources become too scarce. There is also a wide intermediate
zone of countries where the likelihood of forest degradation effects is significant, especially for those
countries using significant portion of their national stocks for cooking. For a number of countries in
the low pressure zone, biomass scarcity and forest degradation may still be significant issues at the
subnational level, even if the effect is not visible in aggregate because of large overall biomass stocks.
Furthermore, recent research suggests that, in countries like Rwanda, the official Food and Agriculture
Organization (FAO) forest cover data used in the deforestation pressure analysis may significantly
understate actual deforestation rates.76
Woodfuel consumption is not the only environmental challenge of solid fuel cooking: the
inefficiency and poor sustainability of woodfuel supply must also be addressed. Achieving lower
woodfuel consumption requires that demand-side efficient stove interventions be augmented by steps
to improve the sustainability of woodfuel harvesting and, specifically, by measures to improve charcoal
production efficiency and, potentially, the production of ‘green charcoal’ alternatives from sustainable
biomass sources like agricultural waste.
Even if the world moves to universal adoption of more efficient stoves, in many countries the quantity of
wood-based biomass, particularly charcoal, used to satisfy energy demand will likely grow in absolute
terms given the rapid demographically fueled increase in woodfuel consumption. For example, FAO’s
estimates suggest that charcoal use will more than double between 2010 and 2030 in most subregions
of Sub-Saharan Africa, suggesting that even the universal adoption of more efficient cookstoves (e.g.,
basic improved charcoal stoves saving 20–30% of fuel) over the next two decades would not prevent
increased consumption.77 A similar phenomenon is clear outside Africa in those areas where charcoal
is a major fuel or where firewood scarcity already presents a critical challenge, including countries
like Haiti, Myanmar, the Philippines, Cambodia, Bangladesh, Pakistan, Indonesia, and parts of Central
America. More broadly, the long-term reality of a cooking sector dominated by woodfuel suggests that
woodfuel use must be reframed as an opportunity for improving supply-side market and policy rather
than just a crisis in demand-side overconsumption.
Economics and Livelihoods
Alongside environmental and health impacts, dependence on solid fuel imposes significant
economic costs on households and societies. The most immediate and direct cost is the $ 100
billion cooking bill paid for typically inefficient and increasingly costly cooking fuels (Figure 2.4)—an
amount set to double by 2020, assuming the continuation of historical (2000–10) growth trends in fuel
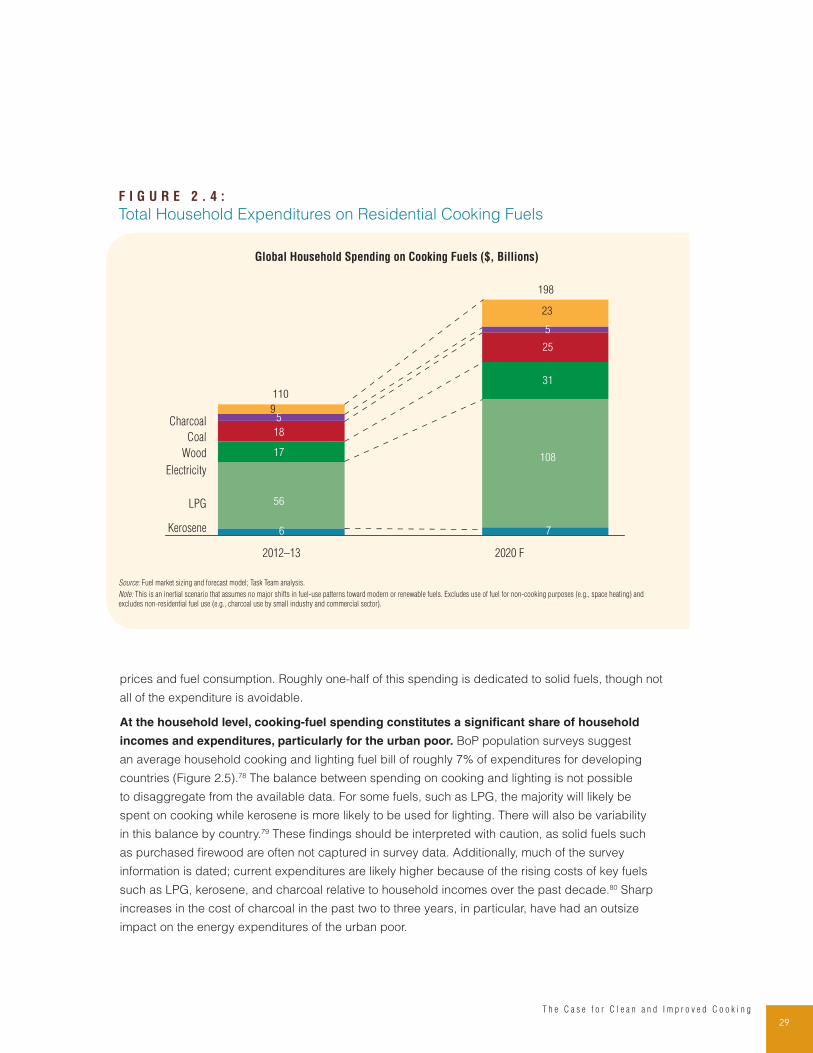
29T h e C a s e f o r C l e a n a n d I m p r o v e d C o o k i n g
prices and fuel consumption. Roughly one-half of this spending is dedicated to solid fuels, though not
all of the expenditure is avoidable.
At the household level, cooking-fuel spending constitutes a significant share of household
incomes and expenditures, particularly for the urban poor. BoP population surveys suggest
an average household cooking and lighting fuel bill of roughly 7% of expenditures for developing
countries (Figure 2.5).78 The balance between spending on cooking and lighting is not possible
to disaggregate from the available data. For some fuels, such as LPG, the majority will likely be
spent on cooking while kerosene is more likely to be used for lighting. There will also be variability
in this balance by country.79 These findings should be interpreted with caution, as solid fuels such
as purchased firewood are often not captured in survey data. Additionally, much of the survey
information is dated; current expenditures are likely higher because of the rising costs of key fuels
such as LPG, kerosene, and charcoal relative to household incomes over the past decade.80 Sharp
increases in the cost of charcoal in the past two to three years, in particular, have had an outsize
impact on the energy expenditures of the urban poor.
F I G U R E 2 . 4 :
Total Household Expenditures on Residential Cooking Fuels
7
23
LPG
Electricity
Wood
Coal
Charcoal
2020 F
198
108
25
5
2012–13
110
56
18
5
Kerosene 6
31
9
17
Global Household Spending on Cooking Fuels ($, Billions)
Source: Fuel market sizing and forecast model; Task Team analysis.
Note: This is an inertial scenario that assumes no major shifts in fuel-use patterns toward modern or renewable fuels. Excludes use of fuel for non-cooking purposes (e.g., space heating) and
excludes non-residential fuel use (e.g., charcoal use by small industry and commercial sector).
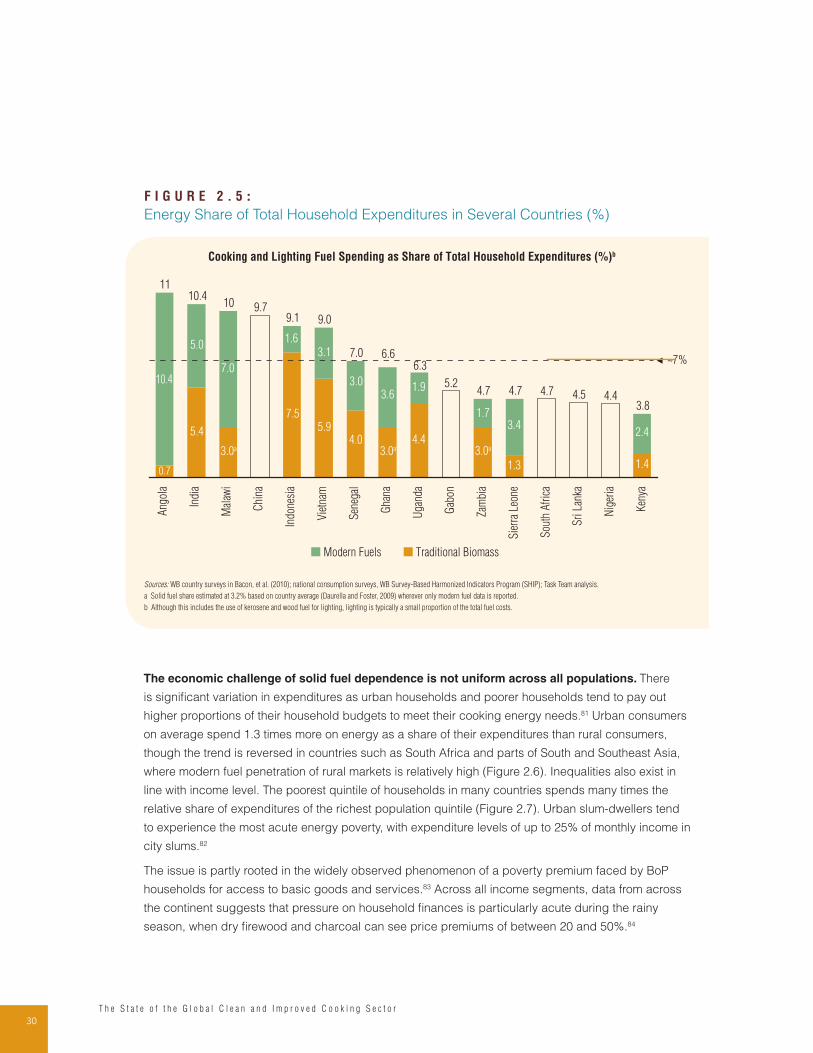
30T h e S t a t e o f t h e G l o b a l C l e a n a n d I m p r o v e d C o o k i n g S e c t o r
The economic challenge of solid fuel dependence is not uniform across all populations. There
is significant variation in expenditures as urban households and poorer households tend to pay out
higher proportions of their household budgets to meet their cooking energy needs.81 Urban consumers
on average spend 1.3 times more on energy as a share of their expenditures than rural consumers,
though the trend is reversed in countries such as South Africa and parts of South and Southeast Asia,
where modern fuel penetration of rural markets is relatively high (Figure 2.6). Inequalities also exist in
line with income level. The poorest quintile of households in many countries spends many times the
relative share of expenditures of the richest population quintile (Figure 2.7). Urban slum-dwellers tend
to experience the most acute energy poverty, with expenditure levels of up to 25% of monthly income in
city slums.82
The issue is partly rooted in the widely observed phenomenon of a poverty premium faced by BoP
households for access to basic goods and services.83 Across all income segments, data from across
the continent suggests that pressure on household finances is particularly acute during the rainy
season, when dry firewood and charcoal can see price premiums of between 20 and 50%.84
F I G U R E 2 . 5 :
Energy Share of Total Household Expenditures in Several Countries (%)
Ken
ya
Nig
eria
Sri
Lan
ka
Sou
th A
fric
a
Sie
rra
Leon
e
Zam
bia
Gab
on
Uga
nda
Gha
na
Sen
egal
Vie
tnam
Indo
nesi
a
Chi
na
Mal
awi
Indi
a
Ang
ola
Modern Fuels Traditional Biomass
Cooking and Lighting Fuel Spending as Share of Total Household Expenditures (%)b
4.44.54.75.2
9.7
3.8
~7%
4.74.7
6.36.67.0
9.09.1
1010.4
11
5.0
7.0
1.6
3.1
3.03.6
1.9
1.73.4
2.4
10.4
0.7
5.4
7.55.9
4.0 4.4
1.3 1.43.0a 3.0a3.0a
Sources: WB country surveys in Bacon, et al. (2010); national consumption surveys, WB Survey-Based Harmonized Indicators Program (SHIP); Task Team analysis.
a Solid fuel share estimated at 3.2% based on country average (Daurella and Foster, 2009) wherever only modern fuel data is reported.
b Although this includes the use of kerosene and wood fuel for lighting, lighting is typically a small proportion of the total fuel costs.
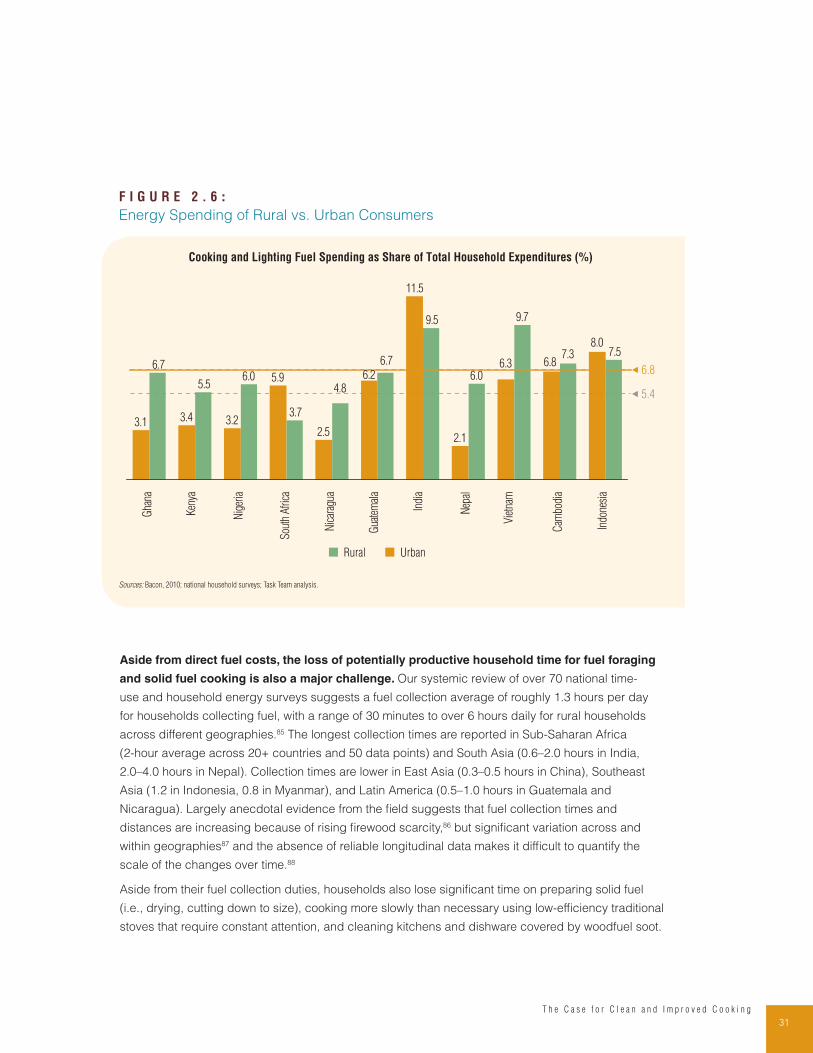
31T h e C a s e f o r C l e a n a n d I m p r o v e d C o o k i n g
Aside from direct fuel costs, the loss of potentially productive household time for fuel foraging
and solid fuel cooking is also a major challenge. Our systemic review of over 70 national time-
use and household energy surveys suggests a fuel collection average of roughly 1.3 hours per day
for households collecting fuel, with a range of 30 minutes to over 6 hours daily for rural households
across different geographies.85 The longest collection times are reported in Sub-Saharan Africa
(2-hour average across 20+ countries and 50 data points) and South Asia (0.6–2.0 hours in India,
2.0–4.0 hours in Nepal). Collection times are lower in East Asia (0.3–0.5 hours in China), Southeast
Asia (1.2 in Indonesia, 0.8 in Myanmar), and Latin America (0.5–1.0 hours in Guatemala and
Nicaragua). Largely anecdotal evidence from the field suggests that fuel collection times and
distances are increasing because of rising firewood scarcity,86 but significant variation across and
within geographies87 and the absence of reliable longitudinal data makes it difficult to quantify the
scale of the changes over time.88
Aside from their fuel collection duties, households also lose significant time on preparing solid fuel
(i.e., drying, cutting down to size), cooking more slowly than necessary using low-efficiency traditional
stoves that require constant attention, and cleaning kitchens and dishware covered by woodfuel soot.
F I G U R E 2 . 6 :
Energy Spending of Rural vs. Urban Consumers
Cam
bodi
a
Nep
al
Nic
arag
ua
Nig
eria
Indi
a
Indo
nesi
a
8.0
3.1
6.7
3.4
5.5
Ken
ya
Gha
na
7.36.8
11.5
9.5
7.5
2.1
6.06.3
9.7
Gua
tem
ala
6.2
Sou
th A
fric
a
3.7
6.7
5.9
3.2
6.0
2.5
4.8
Vie
tnam
Rural Urban
5.4
6.8
Cooking and Lighting Fuel Spending as Share of Total Household Expenditures (%)
Sources: Bacon, 2010; national household surveys; Task Team analysis.
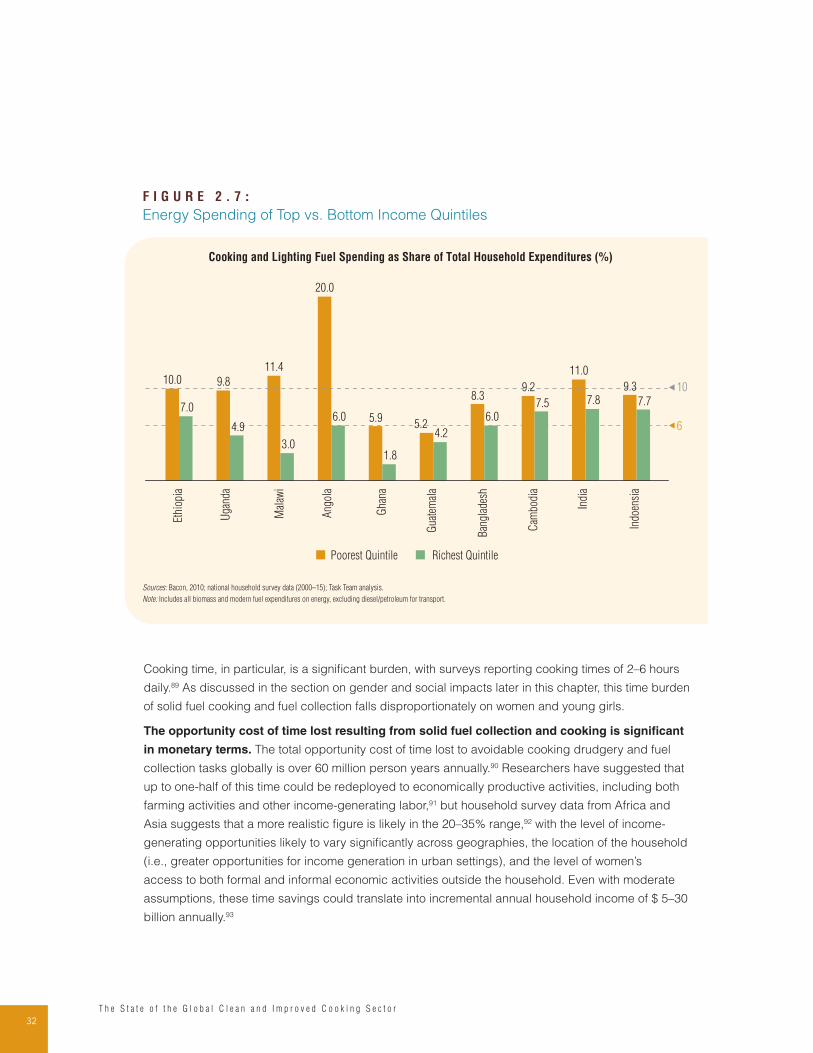
32T h e S t a t e o f t h e G l o b a l C l e a n a n d I m p r o v e d C o o k i n g S e c t o r
Cooking time, in particular, is a significant burden, with surveys reporting cooking times of 2–6 hours
daily.89 As discussed in the section on gender and social impacts later in this chapter, this time burden
of solid fuel cooking and fuel collection falls disproportionately on women and young girls.
The opportunity cost of time lost resulting from solid fuel collection and cooking is significant
in monetary terms. The total opportunity cost of time lost to avoidable cooking drudgery and fuel
collection tasks globally is over 60 million person years annually.90 Researchers have suggested that
up to one-half of this time could be redeployed to economically productive activities, including both
farming activities and other income-generating labor,91 but household survey data from Africa and
Asia suggests that a more realistic figure is likely in the 20–35% range,92 with the level of income-
generating opportunities likely to vary significantly across geographies, the location of the household
(i.e., greater opportunities for income generation in urban settings), and the level of women’s
access to both formal and informal economic activities outside the household. Even with moderate
assumptions, these time savings could translate into incremental annual household income of $ 5–30
billion annually.93
F I G U R E 2 . 7 :
Energy Spending of Top vs. Bottom Income Quintiles
9.3
7.7
5.96.0
20.0
3.0
11.4
4.9
9.8
7.0
10.0
Mal
awi
Ethi
opia
4.2
7.5
5.2
Gha
na
7.8
Ban
glad
esh
11.0
Cam
bodi
a
8.3
6.0
Gua
tem
ala
Uga
nda
9.2
Indi
a
Ang
ola
Indo
ensi
a
Poorest Quintile Richest Quintile
6
10
Cooking and Lighting Fuel Spending as Share of Total Household Expenditures (%)
1.8
Sources: Bacon, 2010; national household survey data (2000–15); Task Team analysis.
Note: Includes all biomass and modern fuel expenditures on energy, excluding diesel/petroleum for transport.

33T h e C a s e f o r C l e a n a n d I m p r o v e d C o o k i n g
Household Economics of Firewood Collection and Charcoal Production
The economic impact of solid fuel dependence is not unequivocally negative because the wood
fuel value chain employs millions of poor rural and urban households. While highly negative
from the standpoint of energy poverty, dependence on solid fuels has positive impacts in terms of
rural livelihoods and urban employment for tens of millions of small-scale wood collectors, charcoal
producers, transporters, and last-mile retailers around the globe.
Africa has some of the best data on the sector. The World Bank estimates that the Sub-Saharan Africa
charcoal sector alone employs 7 million Africans, with aggregate employment expected to reach 12
million people by 2030.94 Recent individual country studies estimate the involvement of 700,000 in
the charcoal sector in Kenya,95 around 200,000 in Uganda,96 over 100,000 in Malawi,97 and several
hundred thousand supplying the needs of Dar es Salaam in Tanzania.98 Country-level estimates for
the firewood trade are unavailable, but are likely to be on a comparable scale, particularly in West
African nations with large trade markets in urban firewood. In aggregate, employment in the informal
and formal woodfuel sectors, including part-time labor and the entire charcoal-production value
chain, could exceed 15 million individuals across the entire Sub-Saharan Africa region.99 Assuming
the employment of one family member per household, this equates to 9% of Sub-Saharan Africa
households—a scale that, at the country level, exceeds employment levels in large economic sectors,
such as tourism and industrial manufacturing, and in cash crops, such as coffee and tea.
Similarly high numbers have been reported in other regions. UN Development Programme (UNDP)
and ESMAP have estimated that about 840,000 jobs exist in the biomass/woodfuel sector in the
Philippines, touching 10% of Philippine’s rural population, 3–4 million woodfuel sector jobs in India, and
600,000 jobs in Pakistan.100 Formal and informal charcoal and woodfuel markets, while poorly studied,
also play an important role in Asian countries like Bangladesh, Bhutan, Nepal, Myanmar, Cambodia,
Lao PDR, and Vietnam. In Latin America, it is estimated that woodfuel production and collection
accounts for 200,000 jobs in Brazil, tens of thousands of jobs in Peru, and over 150,000 jobs in Haiti
in charcoal value chains alone, one of the biggest sectors of Haiti’s rural economy.101 The woodfuel
sector is likewise a significant employer in Central American countries like Honduras, Nicaragua, and
Guatemala where over half of the solid fuel using population purchase their firewood.102
There are few skill- or capital-based barriers to entry to the lowest rungs of the woodfuel value chain,
the work of fuel collection and production is typically extremely laborious, and work in the sector
generates little income.103 Many households engage in woodfuel production and/or trade in tandem
with agriculture. The sector sees great seasonality with increased participation in charcoal markets
during the rainy season when urban charcoal prices are high and there is more free time available
from agricultural activities.104 A large number of households also resort to the woodfuel sector in times
of financial stress, such as when making large payments for medical costs, funeral expenses, food
supplies in the event of poor harvests, marriage ceremonies, and other exigencies.105
Earnings from the sector are low in absolute terms, but are an important source of cash income
and a significant contributor to poverty alleviation. The most thorough data on woodfuel production
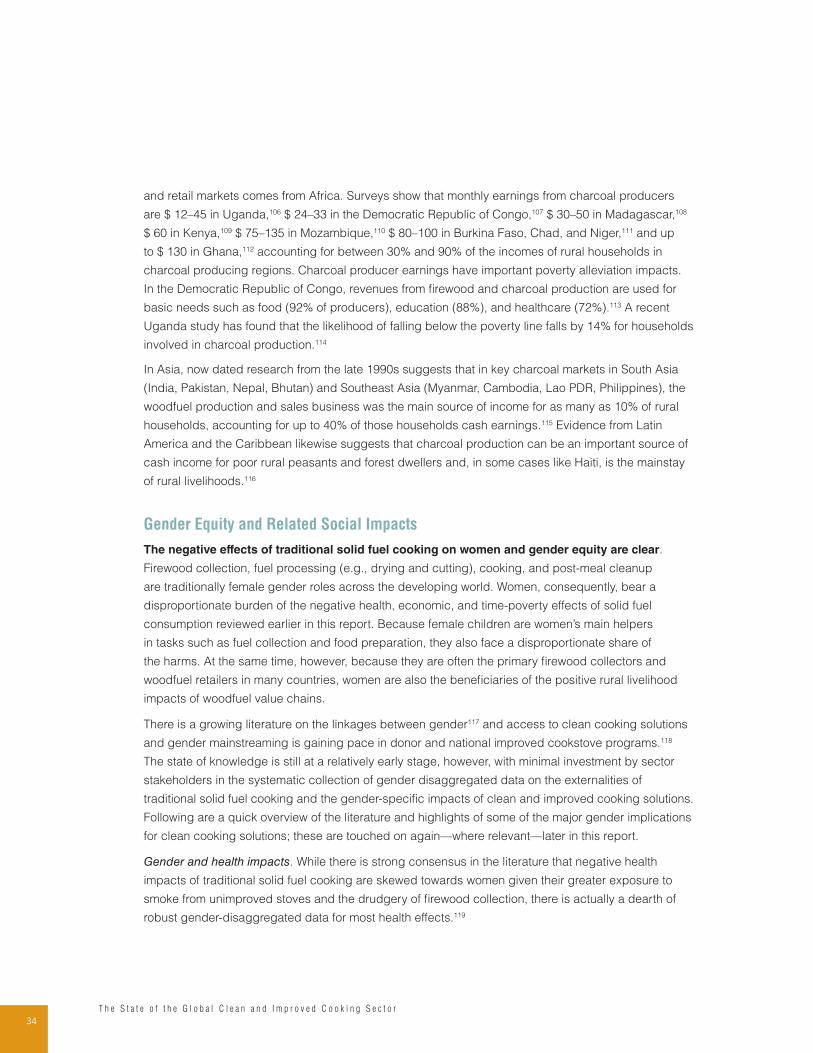
34T h e S t a t e o f t h e G l o b a l C l e a n a n d I m p r o v e d C o o k i n g S e c t o r
and retail markets comes from Africa. Surveys show that monthly earnings from charcoal producers
are $ 12–45 in Uganda,106 $ 24–33 in the Democratic Republic of Congo,107 $ 30–50 in Madagascar,108
$ 60 in Kenya,109 $ 75–135 in Mozambique,110 $ 80–100 in Burkina Faso, Chad, and Niger,111 and up
to $ 130 in Ghana,112 accounting for between 30% and 90% of the incomes of rural households in
charcoal producing regions. Charcoal producer earnings have important poverty alleviation impacts.
In the Democratic Republic of Congo, revenues from firewood and charcoal production are used for
basic needs such as food (92% of producers), education (88%), and healthcare (72%).113 A recent
Uganda study has found that the likelihood of falling below the poverty line falls by 14% for households
involved in charcoal production.114
In Asia, now dated research from the late 1990s suggests that in key charcoal markets in South Asia
(India, Pakistan, Nepal, Bhutan) and Southeast Asia (Myanmar, Cambodia, Lao PDR, Philippines), the
woodfuel production and sales business was the main source of income for as many as 10% of rural
households, accounting for up to 40% of those households cash earnings.115 Evidence from Latin
America and the Caribbean likewise suggests that charcoal production can be an important source of
cash income for poor rural peasants and forest dwellers and, in some cases like Haiti, is the mainstay
of rural livelihoods.116
Gender Equity and Related Social Impacts
The negative effects of traditional solid fuel cooking on women and gender equity are clear.
Firewood collection, fuel processing (e.g., drying and cutting), cooking, and post-meal cleanup
are traditionally female gender roles across the developing world. Women, consequently, bear a
disproportionate burden of the negative health, economic, and time-poverty effects of solid fuel
consumption reviewed earlier in this report. Because female children are women’s main helpers
in tasks such as fuel collection and food preparation, they also face a disproportionate share of
the harms. At the same time, however, because they are often the primary firewood collectors and
woodfuel retailers in many countries, women are also the beneficiaries of the positive rural livelihood
impacts of woodfuel value chains.
There is a growing literature on the linkages between gender117 and access to clean cooking solutions
and gender mainstreaming is gaining pace in donor and national improved cookstove programs.118
The state of knowledge is still at a relatively early stage, however, with minimal investment by sector
stakeholders in the systematic collection of gender disaggregated data on the externalities of
traditional solid fuel cooking and the gender-specific impacts of clean and improved cooking solutions.
Following are a quick overview of the literature and highlights of some of the major gender implications
for clean cooking solutions; these are touched on again—where relevant—later in this report.
Gender and health impacts. While there is strong consensus in the literature that negative health
impacts of traditional solid fuel cooking are skewed towards women given their greater exposure to
smoke from unimproved stoves and the drudgery of firewood collection, there is actually a dearth of
robust gender-disaggregated data for most health effects.119
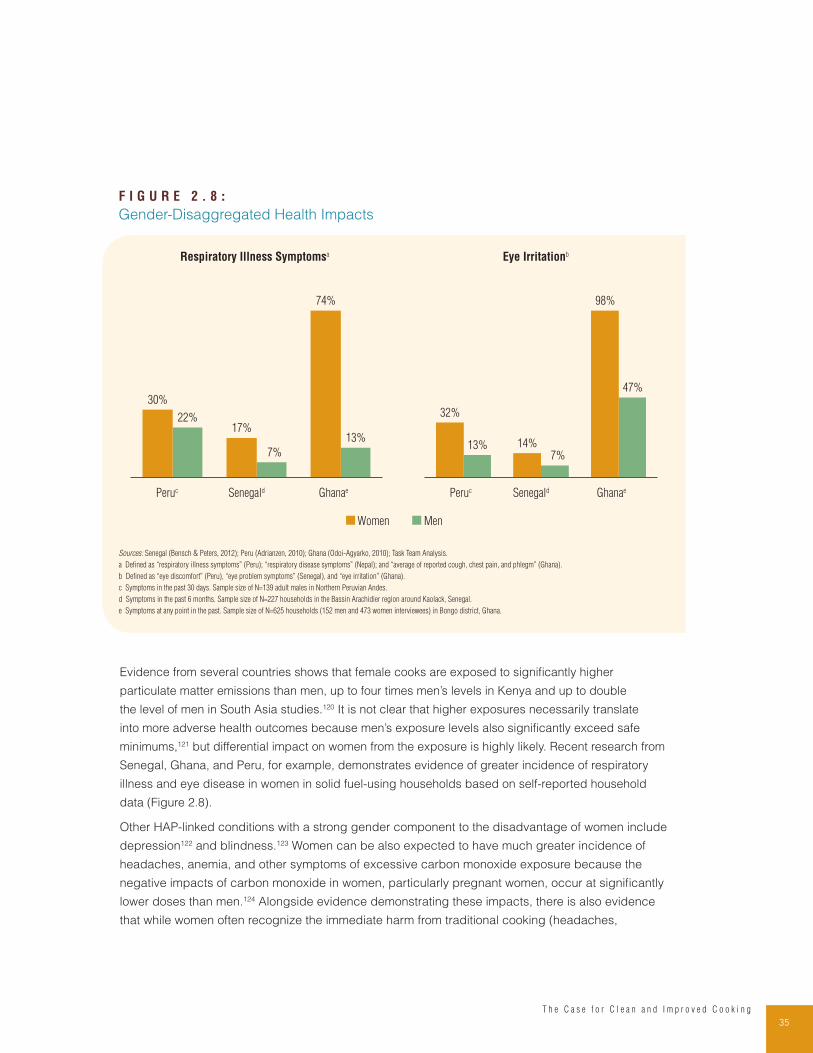
35T h e C a s e f o r C l e a n a n d I m p r o v e d C o o k i n g
Evidence from several countries shows that female cooks are exposed to significantly higher
particulate matter emissions than men, up to four times men’s levels in Kenya and up to double
the level of men in South Asia studies.120 It is not clear that higher exposures necessarily translate
into more adverse health outcomes because men’s exposure levels also significantly exceed safe
minimums,121 but differential impact on women from the exposure is highly likely. Recent research from
Senegal, Ghana, and Peru, for example, demonstrates evidence of greater incidence of respiratory
illness and eye disease in women in solid fuel-using households based on self-reported household
data (Figure 2.8).
Other HAP-linked conditions with a strong gender component to the disadvantage of women include
depression122 and blindness.123 Women can be also expected to have much greater incidence of
headaches, anemia, and other symptoms of excessive carbon monoxide exposure because the
negative impacts of carbon monoxide in women, particularly pregnant women, occur at significantly
lower doses than men.124 Alongside evidence demonstrating these impacts, there is also evidence
that while women often recognize the immediate harm from traditional cooking (headaches,
F I G U R E 2 . 8 :
Gender-Disaggregated Health Impacts
Eye IrritationbRespiratory Illness Symptomsa
7%
Ghanae
22%
30%
74%
SenegaldPeruc
13%17%
7%
Ghanae
13%
32%
98%
SenegaldPeruc
47%
14%
Women Men
Sources: Senegal (Bensch & Peters, 2012); Peru (Adrianzen, 2010); Ghana (Odoi-Agyarko, 2010); Task Team Analysis.
a Defined as “respiratory illness symptoms” (Peru); “respiratory disease symptoms” (Nepal); and “average of reported cough, chest pain, and phlegm” (Ghana).
b Defined as “eye discomfort” (Peru), “eye problem symptoms” (Senegal), and “eye irritation” (Ghana).
c Symptoms in the past 30 days. Sample size of N=139 adult males in Northern Peruvian Andes.
d Symptoms in the past 6 months. Sample size of N=227 households in the Bassin Arachidier region around Kaolack, Senegal.
e Symptoms at any point in the past. Sample size of N=625 households (152 men and 473 women interviewees) in Bongo district, Ghana.
36T h e S t a t e o f t h e G l o b a l C l e a n a n d I m p r o v e d C o o k i n g S e c t o r
coughing, eye irritation), there is much less recognition of the long-term negative health impacts
linked to HAP.
There is also evidence that injuries from firewood collection are endemic in female populations. Rural
women transport firewood loads of 10–38 kilograms, with an average of roughly 20 kilograms, and
travel between 1–10 kilometers during wood collection trips.125 There is strong anecdotal evidence
that head-loading of firewood and other physical strains related to firewood transport on foot result
in headaches and musculoskeletal damage, with attendant symptoms of back pains, neck stiffness,
and waist pains. The incidence rates for these symptoms and related physical injuries are significantly
higher in women than what is typically seen for men.126 There are also persistent anecdotal reports
of miscarriages and utero-vaginal prolapse127 linked to firewood collection—which, along with water
collection, is among the more physically arduous activities endured by rural poor women.
Despite the growing evidence base, local health workers often downplay or fail to incorporate these
dangers of firewood collection and HAP in their interactions with women across the developing
world,128 an important issue for future focus by public health practitioners and policymakers.
Gender, time-poverty, and related economic impacts. Aside from the negative health effects, women’s
involvement in firewood collection and cooking leads to significant time loss and resulting opportunity
costs. Household time-use surveys show that women on average spend more time on firewood
collection then men, though the gender differential varies across countries due to cultural and historic
factors (e.g., cultural norms with respect to hard physical labor, the acceptability of women’s work
outside of the home in conservative Muslim societies). Women are the primary wood collectors
across most of Sub-Saharan Africa and large parts of Asia, for instance in China. In cases such
as Madagascar and the Tigray region of Ethiopia in Africa, countries like Indonesia and Lao PDR
in Asia, and much of Central America (e.g., Nicaragua, Guatemala, Honduras), men are the main
wood collectors.129 In a number of other countries, like India, fuel collection tasks are a joint family
responsibility, with parity between time expanded on such tasks by men and women.130 In the case of
cooking time, however, the disproportionate burden on women is clear across all countries where data
is available (Figure 2.9).
The aggregate time loss across fuel collection, traditional biomass cookstove cooking, and related
fuel preparation and food processing activities translates into 2–8 hours of effort per day, with a likely
average of close to 5 hours daily.131 This time burden is a major contributor to women’s already highly
constrained time budgets, or “time poverty” as the phenomenon has been termed by researchers.132
Aside from the drudgery involved, the time drain of solid fuel cooking restricts women’s access to
income-generating activities, prevents women from engaging more fully in farming, and reduces time
available for childcare, education, leisure, and rest.133 By reducing opportunities for women’s self-
actualization and economic autonomy, the time impact of solid fuel cooking also reinforces existing
inequitable gender power relationships within the family unit and broader society.
Gender-based violence. Women and girls are exposed to the risks of rape and sexual harassment
during the course of firewood collection. The risks are particularly high for refugee women and female
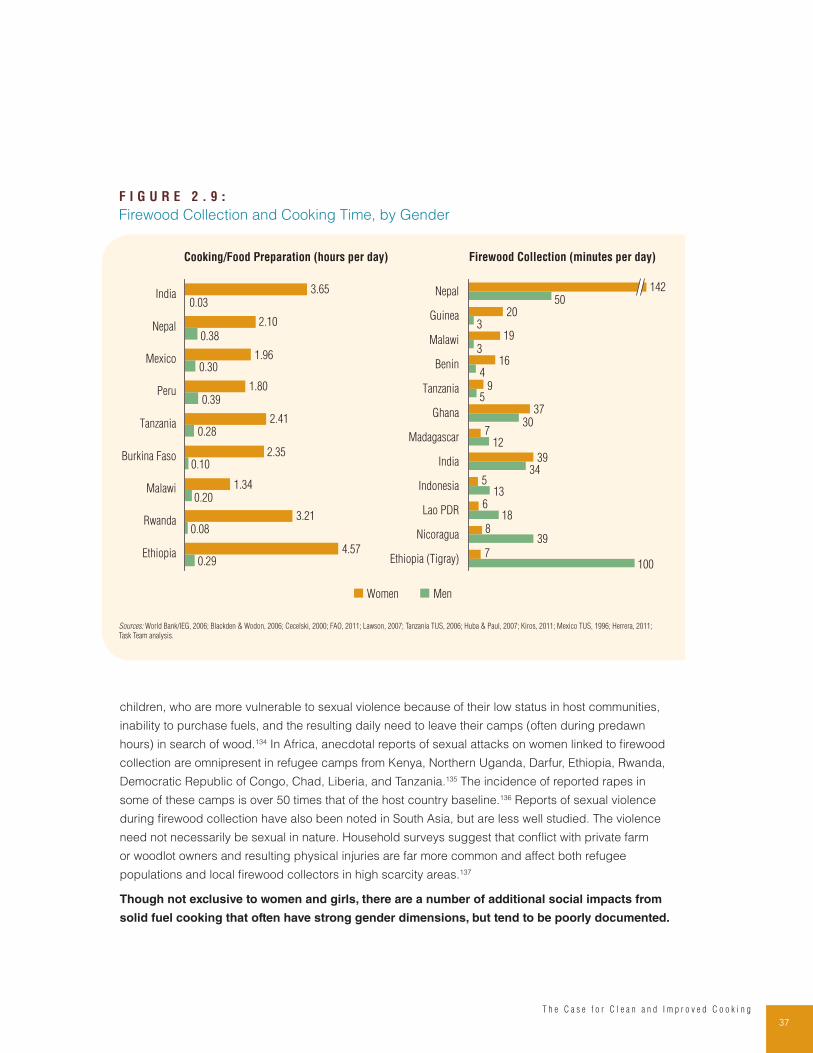
37T h e C a s e f o r C l e a n a n d I m p r o v e d C o o k i n g
children, who are more vulnerable to sexual violence because of their low status in host communities,
inability to purchase fuels, and the resulting daily need to leave their camps (often during predawn
hours) in search of wood.134 In Africa, anecdotal reports of sexual attacks on women linked to firewood
collection are omnipresent in refugee camps from Kenya, Northern Uganda, Darfur, Ethiopia, Rwanda,
Democratic Republic of Congo, Chad, Liberia, and Tanzania.135 The incidence of reported rapes in
some of these camps is over 50 times that of the host country baseline.136 Reports of sexual violence
during firewood collection have also been noted in South Asia, but are less well studied. The violence
need not necessarily be sexual in nature. Household surveys suggest that conflict with private farm
or woodlot owners and resulting physical injuries are far more common and affect both refugee
populations and local firewood collectors in high scarcity areas.137
Though not exclusive to women and girls, there are a number of additional social impacts from
solid fuel cooking that often have strong gender dimensions, but tend to be poorly documented.
F I G U R E 2 . 9 :
Firewood Collection and Cooking Time, by Gender
Cooking/Food Preparation (hours per day)
4.57
3.21
1.34
2.35
2.41
1.80
1.96
2.10
3.65
0.29
0.28
0.10
0.20
0.08
0.39
0.30
0.38
0.03
Ethiopia
Rwanda
Malawi
Burkina Faso
Tanzania
India
Nepal
Mexico
Peru
18
7
8
6
5
39
7
37
9
16
20
19
100
39
13
34
12
30
5
4
3
3
50
Ethiopia (Tigray)
Nicoragua
Lao PDR
Indonesia
India
Madagascar
Ghana
Tanzania
Benin
Malawi
Guinea
Nepal 142
Firewood Collection (minutes per day)
Women Men
Sources: World Bank/IEG, 2006; Blackden & Wodon, 2006; Cecelski, 2000; FAO, 2011; Lawson, 2007; Tanzania TUS, 2006; Huba & Paul, 2007; Kiros, 2011; Mexico TUS, 1996; Herrera, 2011;
Task Team analysis.
38T h e S t a t e o f t h e G l o b a l C l e a n a n d I m p r o v e d C o o k i n g S e c t o r
One commonly noted linkage is the negative relationship between children’s natural resource
collection and education, though the evidence from this proposition is limited beyond a handful of
studies in Africa. A Kenyan study found strong negative associations between the time girls spent on
resource collection and the likelihood of school attendance.138 A similar negative correlation between
firewood collection and school attendance has been noted in Malawi and Ethiopia, but in those
instances the fuel collection burden and its negative effects fell equally on both genders or primarily
disadvantaged boys.139
While not fully documented empirically, impaired nutrition is another possible consequence of solid fuel
cooking. The effect can stem from the diversion of scarce household resources to purchase fuels or,
alternatively, from incomplete food preparation by households when fuel becomes too expensive so
that meals are skipped or served cold.140 This issue is also not strictly linked to gender, but the burden
of supplying the family with nutritious meals typically falls on women. The literature also concludes that
women and female children are typically the last in the priority queue for the consumption of scarce food
resources when families face nutritional shortfalls.
Another important effect is the aesthetic disutility for women of kitchens, dishware, and home
environments damaged by solid fuel smoke and soot. The benefits of a clean and “modern”
home environment are consistently among the top four or five factors in user satisfaction surveys
on perceived clean and improved cookstove benefits across widely varying improved cooking
technologies and geographies, including India, Mexico, Pakistan, Tanzania, and Uganda, though this
factor is typically of secondary importance relative to household savings, time savings, observable
health discomforts (e.g., eye irritation), and convenience.141
B. MITIGATION POTENTIAL OF IMPROVED AND CLEAN STOVES
Clean and improved cooking solutions can significantly prevent much of the harm currently
created by traditional biomass dependence. The kaleidoscopic complexity of the sector can obscure
the fact that a great deal is already known about which of the new cooking solutions hold the greatest
potential for impact. There is a strong theoretical case and growing real-world evidence for the
benefits of modern fuels, renewable solutions, and—depending on intervention objectives—a range
of ICS technologies, with particular promise in the latter case for the new wave of advanced biomass
gasifier stoves. Equally important, there is now improved understanding of factors that impede cooking
solutions from maximum performance.
Defining and Measuring Impact: Challenges and Lessons to Date
The ability to assess cookstove performance and impact has increased greatly in recent years.
Cooking sector stakeholders are in the process of developing ISO standards. The ISO standards will
build on the 2012 ISO IWA, which clearly defined performance tiers based on the fuel use of each
cooking solution (via thermal efficiency and specific consumption), total and indoor emissions (PM2.5
and CO), and safety. There is increasing sophistication in performance-measurement techniques, such
39T h e C a s e f o r C l e a n a n d I m p r o v e d C o o k i n g
as stove use monitors and portable exposure monitoring devices; growing reliance on randomized
controlled trials (RCTs); and increased investment in data collection and impact research, with dozens
of impact evaluations published in the past few years.
As the evidence based on impact continues to grow, the clean cooking sector will have to
continue to focus on filling in key data gaps and gaining consensus around methodological
frameworks.142 For example, the sector still needs to harmonize definitions of impact, testing
procedures, and reach consensus on effectiveness claims (i.e., whether the technology in question
generates impacts) and measures of end-use effectiveness and efficiency (i.e., how well is the specific
technology adopted and used by households).
There are also gaps in the knowledge of real-world cooking solution performance and open questions
on the precise relationship between emissions, health outcomes, and environmental impacts
The Global Alliance is currently working to standardize some of these methodologies and further build
the evidence base by commissioning research, as well as developing frameworks for measuring and
defining impacts, including a recently launched initiative to define indicators and methodologies for
measuring social impacts.
The theoretical range of performance and relative strengths of the different cooking technologies
are already clear.143 A recently collated sector-wide cookstove performance database with over 3,500
test samples funded by the Global Alliance144 and earlier performance testing reports,145 present a
fairly comprehensive picture of the theoretical performance potential of most clean and improved
cooking technologies under laboratory and controlled field conditions. The data still have gaps with
respect to specific cookstove models (e.g., little data on TEG biomass fan gasifiers, TChar stoves, and
advanced carbon monoxide-minimizing charcoal stoves) and is subject to inconsistencies stemming
from historically poor standardization of common testing protocols such as the water boiling test, the
controlled cooking test, and the kitchen performance test.
A certain amount of confusion arises when considering the differences between combustion efficiency,
heat transfer efficiency, and thermal efficiency. Combustion efficiency reflects how much of the energy
and carbon in the fuel is converted to heat and CO2 while heat transfer efficiency reflects how much of
the heat is absorbed by the pot. The overall thermal efficiency is the product of the first two and shows
how much energy in the fuel is absorbed by the pot. Drawing such distinctions is critical in assessing
performance and is an important part of drawing up new standards.
Despite these challenges, the testing results clearly show that modern and renewable fuels along with
gasifier stoves have the greatest potential for achieving health and environmental benefits. Health
benefits appear to be fairly limited from many basic ICSs and, in the case of certain intermediate
rocket ICS solutions, poorly designed stoves can actually have adverse health effects when they
boost black carbon emissions or hard to track release of little studied small size particles.146
Renewable solutions such as biogas digesters and solar cookers and—among ICSs—rocket
cookstove technologies, and advanced biomass gasifiers, show the greatest potential for household
fuel savings.
40T h e S t a t e o f t h e G l o b a l C l e a n a n d I m p r o v e d C o o k i n g S e c t o r
Data on the performance of improved stoves and clean fuels in real household conditions
are less robust, though current evidence suggests that stove field performance approaches
laboratory results. A major complication in translating stove performance data into real-world impacts
is the gap between stove performance under controlled conditions and actual performance during
day-to-day household use. The myriad factors affecting field performance include the skill of the
person tending the fire, the size of meal and type of food being cooked, the size and shape of the pot,
the use of a pot skirt, heat intensity, cooking duration, and the type and moisture level of the fuel.147
For HAP exposures, outcomes are affected by additional variables such as the location and quality of
airflow within the cooking space, the proximity of the cook and other household members to the fire,
and characteristics of the specific fuel.148
However, recent trials have shown that the fuel-saving performance of improved stoves in the field
is often only moderately lower than the results obtained in the laboratory. Rocket stove testing has
shown a reduction from average savings of 50% under laboratory conditions to 40% in the field,149
and plancha-style stoves have better fuel savings in field tests than in laboratory conditions.150
The fuel consumption performance of popular clay or cement-lined metal “ceramic jiko” stoves
appears to be closely comparable across field and laboratory results,151 and early data from gasifier
evaluations suggest that field performance is likely close to theoretical benefits obtained in the lab.12
Emissions performance, in contrast, can be significantly degraded in the field compared to laboratory
results. This variation in performance has been particularly wide when evaluating portable rocket
stoves as shown in Figure 2.10. However, emissions from basic efficient stoves and built-in chimney
rocket cookstoves are more comparable between field and lab data. Modern-fuel and new biofuel
cooking solutions tend to produce the most consistent results across variable cooking conditions.153
Beyond gaps between theoretical and real world stove-level performance, a bigger challenge is
linking cookstove performance to household-level impacts. Ex-post household impact surveys or
“before and after” impact assessments have now been conducted for most types of cooking solutions,
though, in many cases, the analyses have not been independently validated, pre-intervention baselines
are weak, results in many studies depend on self-reported end-user data, and information on new
technologies such as advanced biomass stoves is sparse.154 Randomized controlled trials—the most
definitive sources of impact evidence—have only recently been applied to the sector and the very few
that have been completed to date have focused on minimally or moderately improved cookstoves.155
Impact by Cookstove Technology
Measurable positive economic, health, and environment impacts, while potentially very significant, can
vary greatly across cooking technologies.
“Legacy” chimney improved stoves. The advantages of these stoves are that they are designed
to be consistent with local cooking practices and are very inexpensive. On average, though, they
generate limited fuel savings compared to three-stone stoves, modest (if any) improvements in HAP,
and a negligible decrease (sometimes, an increase) in cooking time.156
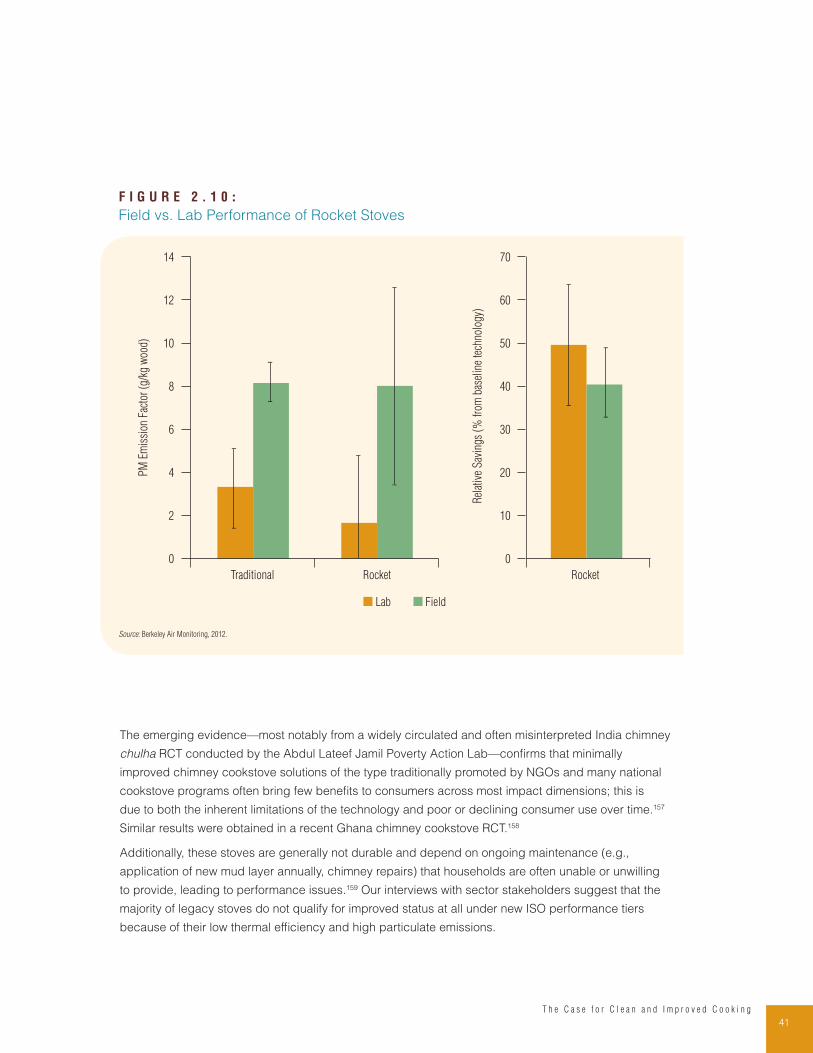
41T h e C a s e f o r C l e a n a n d I m p r o v e d C o o k i n g
The emerging evidence—most notably from a widely circulated and often misinterpreted India chimney
chulha RCT conducted by the Abdul Lateef Jamil Poverty Action Lab—confirms that minimally
improved chimney cookstove solutions of the type traditionally promoted by NGOs and many national
cookstove programs often bring few benefits to consumers across most impact dimensions; this is
due to both the inherent limitations of the technology and poor or declining consumer use over time.157
Similar results were obtained in a recent Ghana chimney cookstove RCT.158
Additionally, these stoves are generally not durable and depend on ongoing maintenance (e.g.,
application of new mud layer annually, chimney repairs) that households are often unable or unwilling
to provide, leading to performance issues.159 Our interviews with sector stakeholders suggest that the
majority of legacy stoves do not qualify for improved status at all under new ISO performance tiers
because of their low thermal efficiency and high particulate emissions.
F I G U R E 2 . 1 0 :
Field vs. Lab Performance of Rocket Stoves
PM
Em
issi
on F
acto
r (g
/kg
woo
d)
Rel
ativ
e S
avin
gs (
% fr
om b
asel
ine
tech
nolo
gy)
Lab Field
Traditional Rocket Rocket
14 70
60
50
40
30
20
10
0
12
10
8
6
4
2
0
Source: Berkeley Air Monitoring, 2012.
42T h e S t a t e o f t h e G l o b a l C l e a n a n d I m p r o v e d C o o k i n g S e c t o r
Basic ICS. Basic efficient charcoal and wood stoves (e.g., KCJ type technologies) live up to their
theoretical fuel savings potential (25–35%) under real world conditions, modestly reduce fuel collection
times (25–30%), and create moderate environmental benefits via greenhouse gas and woodfuel
consumption reductions.160 The resulting household savings are significant relative to the minimal
upfront cookstove costs, but the value proposition beyond economic impacts is limited. Basic efficient
stoves have only moderate environmental benefits (deriving from reduced biomass consumption)
and few meaningful positive health effects for severe respiratory conditions. Because of their largely
artisanal production and the absence of quality standards, the quality of many basic efficient stoves
is low, with average thermal efficiency levels in the field significantly below that of the technology’s
potential.161 Durability of such stoves is typically a challenge, with average cookstove life ranging from
a few months for low-quality products to two to three years for quality-controlled, semi-industrially
produced basic efficient stoves.
Intermediate ICS solutions. Built-in or semi-fixed chimney rocket stoves, for instance, can bring
significant fuel savings (45–65% in the case of the Patsari and Onil stoves in Latin America, MIRT
cookstove in Ethiopia, and the Rocket Lorena cookstove in Uganda) and moderate but measurable
health benefits (e.g., 25–30% reduction in severe respiratory illnesses due to a 50–60% reduction
in indoor emissions).162 Such stoves likely have more limited environmental impacts as the rocket
cookstove technology does not reduce, and may in some cases increase, net black carbon emissions.
Built-in rocket stoves are typically designed in accordance with local cooking practices. Ethiopia’s
MIRT Stove and Eritrea’s Adhanet Mogogo have special surfaces or attachments for baking the
staple injera flatbread. Such stoves can produce very significant fuel savings (45–70%) via improved
combustion and can significantly reduce indoor emissions (with strong emission reduction requiring
a chimney). Many stoves of this type are very durable, with some brick and metal models lasting as
long as a decade. However, there are drawbacks: depending on materials and location, these stoves
can be expensive; cookstove construction can be a significant home improvement project, requiring
large investments of household labor and time; performance is highly dependent on the skills of the
mason (e.g., cookstove and chimney placement relative to airflow); and most stoves require ongoing
maintenance to ensure high quality performance over time.
Portable rocket stoves, including high-end manufactured wood rocket solutions represented in the
market by stoves from companies like Envirofit, EcoZoom, Ezy Stove, Grameen Greenway, and
Burn Manufacturing, generate significant (though lower) fuel savings, have more indoor emissions
than chimney rocket stoves, and have variable black carbon emission performance. While these
portable stoves can cut fuel consumption, PM, and carbon monoxide by one-half, their reduction of
black carbon is much more limited and some designs can actually release more black carbon then
traditional open cooking fires.163 Moreover, some rocket stoves have low heat-transfer efficiency and
inadequate insulation. While some artisanal and semi-industrial variants of rocket stoves can be
inexpensive ($ 10–20), the unsubsidized end-user price of industrially manufactured rocket stoves is
often high on the ground, ranging from $ 16–20 for domestically manufactured mass produced models
to $ 80 for the Save80 cookstove with an integrated pot.
43T h e C a s e f o r C l e a n a n d I m p r o v e d C o o k i n g
Advanced biomass stoves (ACS). Field evidence for the impact of ACS solutions is encouraging,
but cannot be called definitive without further investment in field evaluations and RCTs to measure
health, economic, and environmental impacts. An evaluation from Costa Rica, for example, has shown
that biomass gasifiers can generate large end-user reported fuel savings (>40%) while significantly
reducing emissions. Recent field research from India suggests, however, that emission impacts can
vary widely based on the gasifier technology used, with a particularly wide range of performance
for natural draft stoves.164 Most natural draft stoves have the added benefit of producing bio-char as
a byproduct, which can be used for fertilizer or for charcoal cooking as part of combined gasifier/
charcoal stove (TChar) cooking systems. Other benefits include a more controllable flame to improve
the cooking experience, faster cooking times, and cleaner cookware.
As a downside, some (but not all) gasifier stoves require preprocessed fuels, which can add to
end-user inconvenience and raise barriers to behavioral change. Although the prices of industrially
produced natural draft stoves can be fairly high ($ 25–50), artisanal and semi-industrially produced
stoves in this class such as the Greentech rockifier cookstove in Gambia and the Awamu TLUD
“Mwoto” cookstove in Uganda are available at the $ 15–20 price range. Fan gasifiers can reduce fuel
consumption by over 50% compared to the open fire and also cut emissions by up to 95%, bringing
modern fuel performance levels to biomass fuel users. However, fan stoves are relatively expensive
($ 32–120 end-user price) because they have internal fans and electronic components and are made
of advanced, lightweight materials.
LPG stoves. Surprisingly few impact evaluations have focused on consumers’ use of LPG stoves.
Field research also suggests that, while theoretical benefits can be significant (i.e., elimination of most
negative health effects of solid fuel cooking), actual impacts are likely to fall far below this potential
because of the persistence of baseline cookstove technologies alongside LPG cookstove use.165 It is
important to consider this fuel stacking as impacts are evaluated.
LPG is a clean, non-toxic fuel that emits little particulate matter and burns efficiently.166 Compared
to kerosene, it delivers double the heat for the same quantity used. Additionally, LPG stoves are
typically easy to cook with. LPG is, however, a fossil fuel, with moderate release of CO2 during the
cooking process and potentially significant greenhouse gas emissions during fossil fuel production
and LPG shipping stages. Moreover, in the absence of a significant subsidy, LPG is more expensive
for BoP customers to acquire and use. There are also a fuel supply-chain challenges including
supply constraints, periodic shortages, and difficulty serving “last-mile” rural customers. Another
concern is the risks of cylinder explosions in the case when LPG distribution is not carefully
regulated; accidents are rare, but perception of LPG’s danger among consumers is strong in some
geographies.
Kerosene stoves. While often categorized as “clean,” a large but unknown share of kerosene stoves
likely do not qualify as a clean technology in light of the growing evidence on the harmful emissions
from kerosene cooking under field conditions. Well documented kerosene hazards include poisonings,
fires, and explosions. An increasing evidence base of studies now also suggests that kerosene used
for cooking or lighting may impair lung function and increase tuberculosis, asthma, and cancer risks.
44T h e S t a t e o f t h e G l o b a l C l e a n a n d I m p r o v e d C o o k i n g S e c t o r
However, there are few studies in most regions, quality is varied, and results are inconsistent.167 Aside
from the need for improved evidence, the current state of knowledge already suggests the need to
make existing kerosene solutions safer through policy advocacy, standards, and improved design.
There is also room for improved fuel efficiency for kerosene cookstove users. While kerosene cooking
is inherently more fuel efficient then traditional biomass stoves (30–40% thermal efficiency for kerosene
pressure stoves), fuel efficiency levels above 60% are possible, allowing end users to save as much as
one-third of their fuel usage. The market for kerosene cooking is not large compared to other cooking
fuels (5% of all developing market households), but still substantial in several countries. Companies
like Servals Automation from India and Arivi in South Africa have had some success deploying
innovative new kerosene stove designs that under field conditions generate significant fuel savings
(~30%), reduce the potential for spills and burns, lower carbon monoxide levels, and come near to
eliminating particulate matter emissions.168
Electric and induction stoves. The potential impacts of the transition to electric cooking have been
little studied. The technology has drawn little attention due to the assumption that the use of electric
stoves is limited to areas that have access to electricity, which typically excludes rural communities.
Furthermore, the high cost of electricity has historically restricted the technology to only the wealthiest
urban consumers in the developing world. In reality, this sector warrants more attention for those who
focus on clean cooking access in urban environments. Electric cookstoves are the primary fuel for only
5% of urban households across the developing world but are a major cooking technology in select
urban markets.169 Even in those markets where electric cooking penetration is limited, there is evidence
of growing uptake of electric and, in particular, electric induction cooking. In India, electromagnetic
induction cooking is regionally becoming an important cooking technology with large scale uptake
over the past decade in states like Kerala; there is also anecdotal evidence of rapid induction stove
sector growth in China.170
The primary reason for the growing popularity of this technology is high fuel efficiency and
convenience. Electric cooking can lead to fuel savings relative to baseline technologies in those
markets where there is reasonable access to moderately priced electricity. Induction stoves, in
particular, can reach fuel efficiency levels of 90% in comparison to 60–70% for LPG and electric hot
plates, 40% for intermediate ICS, 20% for basic improved stoves, and typically <10% for traditional
stoves.171 At the same time, electric stoves are prohibitively expensive for poor households, ranging
$ 15–80 for electric hot plates to $ 25–100 for induction stoves. From a health perspective, the impact
of adopting such technologies is likely to be significant. Electric and induction stoves are smokeless
at the point of use and do not produce any emissions within a household. From a climate change
perspective, however, the benefits of the technology are dependent on the fuel use for electricity
generation—in countries with heavily coal-based electricity generation, electric cooking can have
negative impacts on the climate. Despite this promise, the overall potential for this solution is still quite
limited based on the low rates of electricity access by most traditional stove and fuel users.
Biogas stoves. There is more field evidence for the extensive benefits of biogas digesters, including
60–80% savings in fuel expenditures and firewood collection times,172 although these savings in

45T h e C a s e f o r C l e a n a n d I m p r o v e d C o o k i n g
reality need to be adjusted for the annual maintenance costs of biogas solutions and the increased
time demands of dung collection. When used on burner-style stoves, biogas produces no smoke or
particular matter. Biogas plants are suitable for rural environments and can be used to power single-
family homes or entire communities, with the former requiring only the waste of one to two cows
or four humans per day.173 Biogas users benefit from improved indoor air quality, organic fertilizer
from the digester residue, and reduced deforestation. Evaluations show notable reductions in HAP
exposures and end-user reports of improved health outcomes, though impacts on lung function are
not conclusive.174 However, expensive startup materials, technical construction expertise, and a readily
available supply of organic waste often act as barriers to adoption. Moreover, the accidental release of
undigested waste from poorly designed plants can threaten local food and water supply and contribute
to global warming. A household biogas digester system can cost as much as $ 1,500, although prices
are beginning to decrease with low cost portable ($ 350–750) prefabricated units from innovative
companies like SimGas in Tanzania and Sintex Industries in India. Similarly, while biogas stoves typically
range from $ 50–100, Shenzhen Puxin Technology Company Ltd. (China) produces a biogas cookstove
for $ 25 and other similarly low-cost alternatives are available for mass scale deployment.
Biofuels. Field data for biofuels such as ethanol are limited. Evaluations of Project Gaia pilots suggest
that ethanol stoves can generate significant emission reductions when operated exclusively. Unlike the
laboratory results showing LPG-like levels of emissions from ethanol stoves, data from a Madagascar
pilot suggest that field performance has slightly exceeded the WHO PM2.5 emission minimum.175
Uptake of biofuel stoves relative to baseline technologies under non-pilot conditions is unclear at this
point, so the net effects on fuel savings, time savings, and health, while theoretically large, must await
verification from the field based on the evaluations of initiatives such as the NDZiLO enterprise in
Mozambique, formerly named CleanStar Novozymes.
The stoves are durable and accessible as the flame can be turned on and off with ease. However,
ethanol production is dependent upon climate and harvest conditions and patterns. Additionally, some
current cookstove designs were made for developed world contexts, and so may not be optimized for
local user cooking needs. They are also expensive, and, in some cases, require significant subsidies
linked to expected carbon or fuel revenues. Moreover, ethanol has caused a significant number of
burns through spills. One solution to bypass this is to convert ethanol into gelfuel, which has a higher
viscosity, and so is both safer and easier to use, but has seen limited success to date. Another
approach, employed in Dometic AB’s CleanCook, a design used by multiple ethanol cookstove
enterprises, is the use of fuel canisters that absorb the liquid and so do not spill, thereby significantly
mitigating burn risks.
Solar. The data on the impact of solar cookers as standalone cooking solutions are mixed. Before-
and-after program evaluations have suggested savings of 25–40% in charcoal expenditure and
firewood collection time, on the basis of solar cooker use in Bolivia, Ethiopia, and Kenya. Some
evaluations have also shown strong cookstove use over time, with over 90% of solar cookers in Bolivia
still being in use 3–5 years after distribution.176 Basic low-cost solar cookers in Africa have fared less
well. A recent mini-RCT of the CooKit solar stove in Ghana has demonstrated ongoing use by less
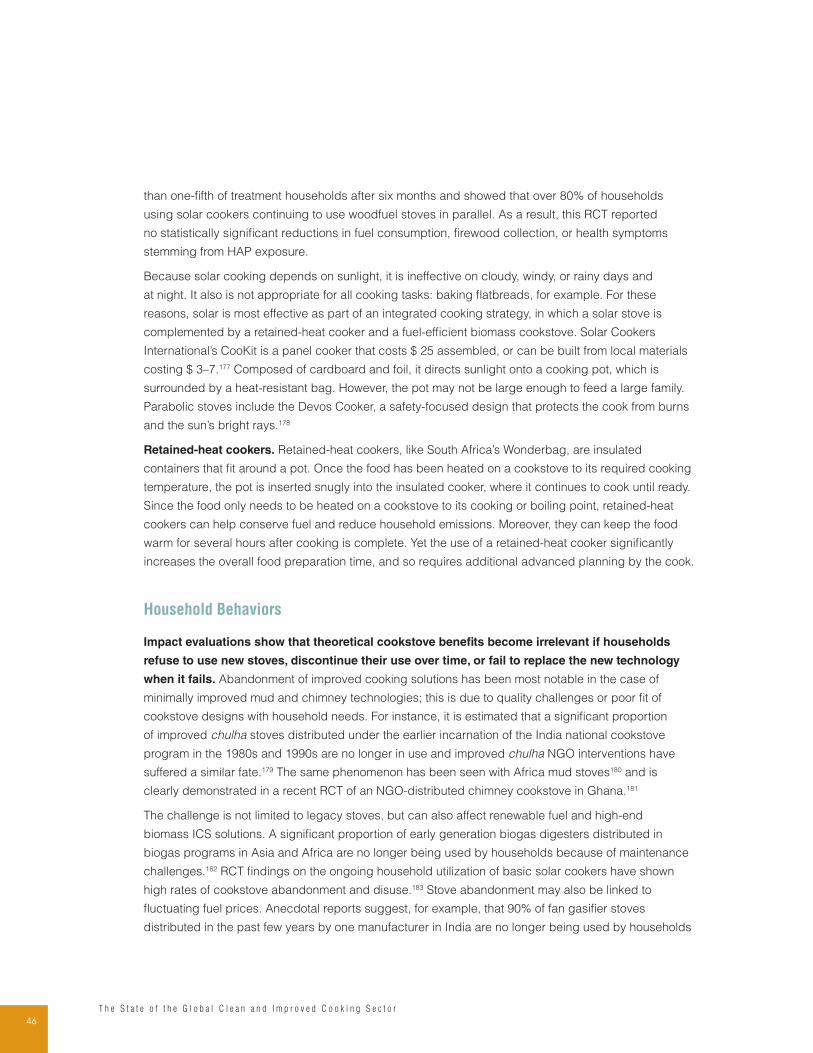
46T h e S t a t e o f t h e G l o b a l C l e a n a n d I m p r o v e d C o o k i n g S e c t o r
than one-fifth of treatment households after six months and showed that over 80% of households
using solar cookers continuing to use woodfuel stoves in parallel. As a result, this RCT reported
no statistically significant reductions in fuel consumption, firewood collection, or health symptoms
stemming from HAP exposure.
Because solar cooking depends on sunlight, it is ineffective on cloudy, windy, or rainy days and
at night. It also is not appropriate for all cooking tasks: baking flatbreads, for example. For these
reasons, solar is most effective as part of an integrated cooking strategy, in which a solar stove is
complemented by a retained-heat cooker and a fuel-efficient biomass cookstove. Solar Cookers
International’s CooKit is a panel cooker that costs $ 25 assembled, or can be built from local materials
costing $ 3–7.177 Composed of cardboard and foil, it directs sunlight onto a cooking pot, which is
surrounded by a heat-resistant bag. However, the pot may not be large enough to feed a large family.
Parabolic stoves include the Devos Cooker, a safety-focused design that protects the cook from burns
and the sun’s bright rays.178
Retained-heat cookers. Retained-heat cookers, like South Africa’s Wonderbag, are insulated
containers that fit around a pot. Once the food has been heated on a cookstove to its required cooking
temperature, the pot is inserted snugly into the insulated cooker, where it continues to cook until ready.
Since the food only needs to be heated on a cookstove to its cooking or boiling point, retained-heat
cookers can help conserve fuel and reduce household emissions. Moreover, they can keep the food
warm for several hours after cooking is complete. Yet the use of a retained-heat cooker significantly
increases the overall food preparation time, and so requires additional advanced planning by the cook.
Household Behaviors
Impact evaluations show that theoretical cookstove benefits become irrelevant if households
refuse to use new stoves, discontinue their use over time, or fail to replace the new technology
when it fails. Abandonment of improved cooking solutions has been most notable in the case of
minimally improved mud and chimney technologies; this is due to quality challenges or poor fit of
cookstove designs with household needs. For instance, it is estimated that a significant proportion
of improved chulha stoves distributed under the earlier incarnation of the India national cookstove
program in the 1980s and 1990s are no longer in use and improved chulha NGO interventions have
suffered a similar fate.179 The same phenomenon has been seen with Africa mud stoves180 and is
clearly demonstrated in a recent RCT of an NGO-distributed chimney cookstove in Ghana.181
The challenge is not limited to legacy stoves, but can also affect renewable fuel and high-end
biomass ICS solutions. A significant proportion of early generation biogas digesters distributed in
biogas programs in Asia and Africa are no longer being used by households because of maintenance
challenges.182 RCT findings on the ongoing household utilization of basic solar cookers have shown
high rates of cookstove abandonment and disuse.183 Stove abandonment may also be linked to
fluctuating fuel prices. Anecdotal reports suggest, for example, that 90% of fan gasifier stoves
distributed in the past few years by one manufacturer in India are no longer being used by households

47T h e C a s e f o r C l e a n a n d I m p r o v e d C o o k i n g
because of a significant run up in the costs of the fuel feedstock and other end-user acceptability
issues.184 A similar fate has been reported for ethanol fuel stoves in certain countries in Africa185 and
fuel price spikes are also responsible for reduced LPG and kerosene use in countries such as Ghana,
Nigeria, Senegal, and Tanzania.
Despite these challenges, in the aggregate, there is incontrovertible evidence of the long-term
household adoption and use of many types of improved cooking solutions. Longitudinal data
on the use of high-end rocket stoves and gasifiers is at this stage unavailable. Evaluation data for
basic efficient wood stoves and intermediate ICS solutions suggests, however, that in most instances
ongoing use of improved stoves is high.186 Ongoing use and sustainability is particularly strong for
basic efficient clay-lined metal cookstove technologies (e.g., the Kenya Ceramic Jiko), which face a
range of quality challenges, but are on their way to being the baseline cooking technology for urban
charcoal users in African countries such as Ghana, Kenya, Madagascar, Malawi, Mali, Rwanda,
Senegal, Tanzania, Togo, and Uganda. Such stoves are also highly popular for biomass cooking in
Asia, including large end-user populations in Lao PDR, Cambodia, Myanmar, and rural Thailand.
Global household fuel surveys likewise demonstrate that modern fuel solutions, once taken up, tend to
see continued use over the years in the absence of fuel price shocks.
Impact evaluations demonstrate that the biggest disconnect between cookstove performance
and impact is the issue of baseline technology persistence or, simply put, the continued use of less
efficient cooking solutions by households that adopt clean and improved stoves. The phenomenon,
which mirrors and is often related to household “stacking” of multiple fuels for their cooking needs,187 is
reported in nearly all impact assessments (Figure 2.11). Anecdotally, the use of traditional cookstoves
in some of the interventions shown in Figure 2.1 has declined over time as users become more
accustomed to new technologies. In many cases, the old unimproved technology may be used only
very occasionally. The fact remains, however, that baseline technology persistence is the rule rather
than the exception for nearly all improved and clean cookstove interventions. Unsurprisingly, the
ongoing use of traditional technologies alongside improved stoves can significantly degrade the
overall impact of new cooking solutions. This is particularly true with respect to health effects, given the
very high sensitivity of health impact to daily emission concentrations and the steep concave shape of
the emissions-dose response curve.188
Persistence of baseline technologies means that the distribution of improved or clean stoves
will often be insufficient to guarantee impact without investment in behavior change. Household
rationales for the continued use of traditional technologies include the availability of fuels (in the case
of modern fuel stoves), the need for multiple cookstoves and burners to provide meals for a large
household,189 the better fit of certain cookstoves with pot sizes or required heating power levels, the
perceived positive impact of smoke on flavor for certain dishes, and the poor quality or performance of
some of the improved cookstoves.
Depending on the source of the issue, solutions may range from selling multi-burner stoves or multiple
stove unit packages to displace existing technologies, cookstove trade-in programs to remove older
cooking technologies from the household when new stoves are introduced, customer education and
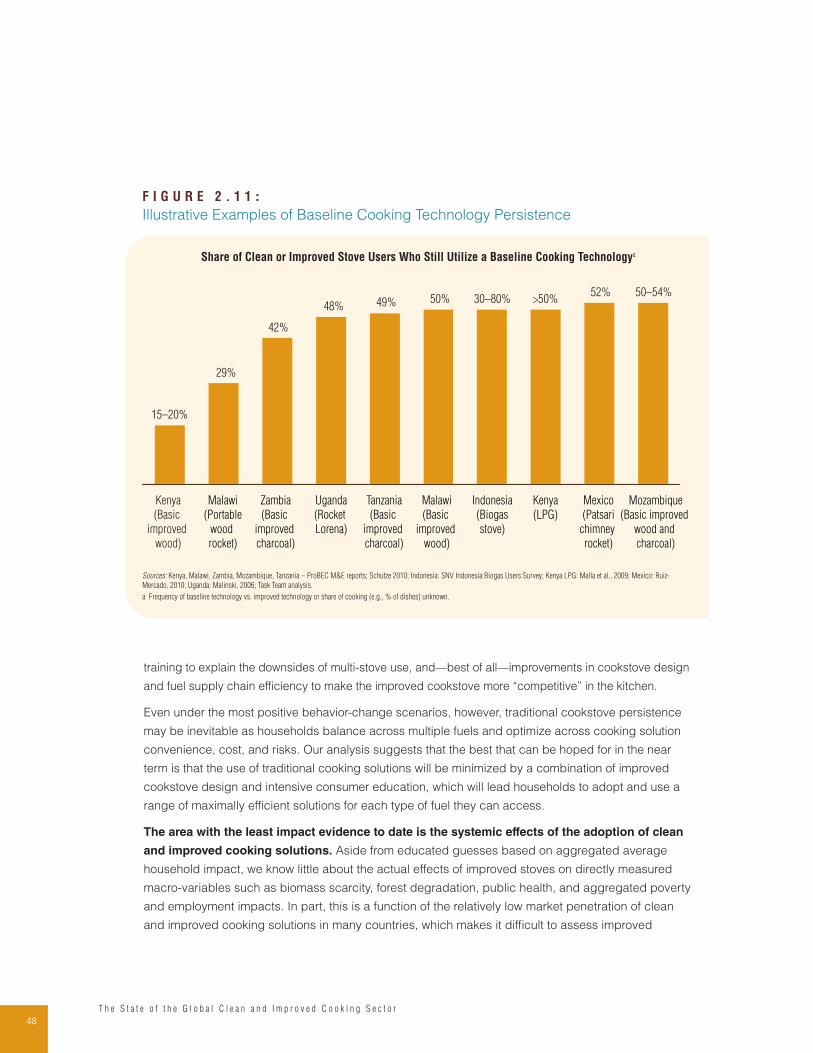
48T h e S t a t e o f t h e G l o b a l C l e a n a n d I m p r o v e d C o o k i n g S e c t o r
training to explain the downsides of multi-stove use, and—best of all—improvements in cookstove design
and fuel supply chain efficiency to make the improved cookstove more “competitive” in the kitchen.
Even under the most positive behavior-change scenarios, however, traditional cookstove persistence
may be inevitable as households balance across multiple fuels and optimize across cooking solution
convenience, cost, and risks. Our analysis suggests that the best that can be hoped for in the near
term is that the use of traditional cooking solutions will be minimized by a combination of improved
cookstove design and intensive consumer education, which will lead households to adopt and use a
range of maximally efficient solutions for each type of fuel they can access.
The area with the least impact evidence to date is the systemic effects of the adoption of clean
and improved cooking solutions. Aside from educated guesses based on aggregated average
household impact, we know little about the actual effects of improved stoves on directly measured
macro-variables such as biomass scarcity, forest degradation, public health, and aggregated poverty
and employment impacts. In part, this is a function of the relatively low market penetration of clean
and improved cooking solutions in many countries, which makes it difficult to assess improved
F I G U R E 2 . 1 1 :
Illustrative Examples of Baseline Cooking Technology Persistence
Kenya
(Basic
improved
wood)
Share of Clean or Improved Stove Users Who Still Utilize a Baseline Cooking Technologya
50–54%52%>50%30–80%50%49%48%
42%
29%
15–20%
Malawi
(Portable
wood
rocket)
Zambia
(Basic
improved
charcoal)
Uganda
(Rocket
Lorena)
Tanzania
(Basic
improved
charcoal)
Malawi
(Basic
improved
wood)
Indonesia
(Biogas
stove)
Kenya
(LPG)
Mexico
(Patsari
chimney
rocket)
Mozambique
(Basic improved
wood and
charcoal)
Sources: Kenya, Malawi, Zambia, Mozambique, Tanzania – ProBEC M&E reports; Schutze 2010; Indonesia: SNV Indonesia Biogas Users Survey; Kenya LPG: Malla et al., 2009; Mexico: Ruiz-
Mercado, 2010; Uganda: Malinski, 2006; Task Team analysis.
a Frequency of baseline technology vs. improved technology or share of cooking (e.g., % of dishes) unknown.
49T h e C a s e f o r C l e a n a n d I m p r o v e d C o o k i n g
cookstove impacts at the national or subnational levels. It is also difficult to measure some of the
important impact variables; aggregate climate impacts, for example, cannot be directly observed. In
many other cases, though, analyses have simply not been conducted because the available data are
insufficient.
Second order systemic impacts, such as the effects of widespread clean cooking adoption on biomass
fuel prices, are even less clear. Theoretically, reduced biomass prices and collection times resulting
from improved cookstove use could simply stimulate biomass fuel demand by other households,
leaving the net levels of solid fuel consumption unchanged. However, without more robust data and
larger sample sizes, any negative net impact of clean cookstoves on biomass consumption and
emissions cannot be substantiated.
Evidence of Impact for Key Impact Dimensions
Observed impacts vary widely by impact driver. Firewood expenditures and time poverty are the
harmful effects most easily addressed by improved solutions, with relatively strong evidence of impact
from the field. The livelihood impact of transitioning to clean and improved stoves is likely to be net
positive in terms of the number and quality of jobs created, but precise impact will vary by geography
and should be managed carefully to ensure sensitivity to potential near-term job displacements in
woodfuel value chains. Environmental impacts are more difficult to achieve than economic benefits and
are highly variable based on the specific features of the improved or clean cookstove. Positive health
impacts are the most difficult benefit to achieve and can only be realized in those cases where the
cleanest cooking solutions can displace traditional cooking technologies from day-to-day household use.
Fuel and time savings are the most easily realizable impacts and are the benefits that are most
accessible for poor consumers from a cost-benefit standpoint. From a household economics
and time-poverty perspective, cooking-fuel expenditures and fuel-collection times can in theory be
eliminated entirely via renewable solutions such as biogas and solar or significantly reduced by the most
thermally efficient ICS. Impact evaluations suggest that savings on firewood expenditure (or comparable
reductions in firewood collection time) of 60–80% are feasible under real-world conditions based on
technologies such as biogas digesters and built-in, multi-pot chimney rocket stoves that have a high
thermal efficiency and are also the most likely to minimize baseline technology use.190 Modern fuels such
as LPG, renewables such as biofuel and biogas, and select advanced and intermediate ICSs can also
generate incremental household time savings by as much as halving total cooking time.
In purely economic terms, the best-performing ICS solutions and biogas digesters have the potential
to generate the greatest long-term financial savings for households because modern fuel solutions,
such as LPG, electricity, and kerosene, and renewable ethanol stoves all involve ongoing expenditures
on relatively expensive fuels. Large economic savings can be generated by relatively cheap ($ 5–20)
artisanal ICS. In fact, potential fuel savings from built-in chimney rocket (45–65%) and portable wood
rocket (40–50%) stoves can often match or exceed fuel savings from expensive high-end industrial
rocket stoves (45–55%) and advanced biomass gasifiers (35–50%).
50T h e S t a t e o f t h e G l o b a l C l e a n a n d I m p r o v e d C o o k i n g S e c t o r
Although the net effects on employment and livelihood of adopting ICS and clean fuels are
most likely positive, interventions should be carefully managed to address potential job
displacement. Generally speaking, woodfuel provides the highest employment multiplier compared to
modern cooking fuels, so movement up the fuel energy ladder—switching from woodfuel to kerosene,
electricity, or LPG—should be theoretically labor saving over time (Figure 2.12).191
Theoretically, the adoption of more efficient stoves should also be labor saving. Holding fuel demand
constant, the relatively low labor intensiveness of ICS production relative to employment in woodfuel
value chains means that jobs generated by ICS adoption are likely to be limited compared to the
number of woodfuel jobs displaced.192 We estimate, for example, that for every ICS stove producer/
retailer job created (in the case of artisanal stoves) over 10 woodfuel value chain jobs are eliminated.193
The displacement ratio is likely to be significantly higher for industrial ICS manufactured at scale.
In reality, the net near-term employment and livelihood effect of ICS adoption are very unlikely to be
labor saving. For instance, in Africa, the pace of projected solid fuel demand growth (see Figure 3.5)
over the next two decades suggests that, even in the extreme case of total ICS adoption by all solid
fuel using households, the absolute level of annual woodfuel consumption volume—and consequently
F I G U R E 2 . 1 2 :
Employment Potential, by Fuel Type
CharcoalKerosene FuelwoodElectricityCoalLPG
Estimated Employment per TJ Energy Consumed (person days)
110–170
80–110
20–4010–2010
200–350
Source: Goldemberg, 2003 (drawing on FAO data).

51T h e C a s e f o r C l e a n a n d I m p r o v e d C o o k i n g
the woodfuel employment impact—is unlikely to fall much below today’s levels in the near-to-medium
term.194 The situation in South Asia is comparable. Adding new employment in the ICS sector (likely
in the tens of thousands) to the potential millions of jobs created by freeing up household time from
firewood collection195 means that the net employment impact of improved cookstove adoption is likely
to be positive for many years to come.
On the biomass fuel supply side, the net livelihood effects are less clear, but also unlikely be labor
saving. Promotion of more efficient biomass fuel production technologies such as efficient charcoal
kilns can in theory reduce woodfuel sector employment, but rapidly increasing charcoal demand
will likely cushion any potential reductions in the near term. Regulations designed to improve the
efficiency and sustainability of woodfuel value chains have uncertain employment impacts as they
may either raise or lower woodfuel prices (and resulting end-user demand, production volumes, and
sector employment), depending on design and implementation. If well designed, such interventions
should, in most cases, maintain current woodfuel price levels without effecting overall levels of market
demand or employment. Well executed traditional biomass supply interventions should improve the
quality of sector employment by creating better-paid, safer, and more sustainable formal sector jobs.196
Renewable fuel interventions should also contribute to higher quality job creation with emerging
evidence suggesting that the promotion of alternative renewable biomass (i.e., briquette and pellets),
biogas, and biofuel markets has significant potential for new job creation.197
While in most cases the near-term effects of clean and improved cooking solutions are unlikely to
displace employment, localized effects may be labor saving. Consequently, interventions should be
designed to facilitate the rehabilitation of displaced jobs—by training charcoal producers in briquette/
pellet production skills, for example, or transitioning woodfuel retailers to ICS retailing jobs.
Environmental benefits are more difficult to realize. For environmental impact, the “greenest”
technologies at the point of fuel consumption are renewable solutions such as solar and biogas,
modern fuel stoves, and ethanol stoves, followed by advanced biomass gasifiers. The net climatic
impact of modern fuel stoves is complicated by the fact that these solutions rely on potentially
unsustainable and carbon-intensive fossil fuel extraction. The environmental benefits of intermediate
ICS technologies such as rocket stoves are undermined by their black carbon emissions. Even when
they contribute to significant reductions in fuel consumption, many of these cookstove models often
do little to reduce and may increase net black carbon emissions.198 In the case of ICS, all else being
equal, the most extensive environmental benefits are possible from those solutions that use sustainable
solid fuels such as crop waste briquettes and pellets.
From a health perspective, the cleanest cooking solutions can reduce HAP to levels that
approach WHO guidelines, but achieving these benefits under real world conditions is difficult.
None of the improved or clean cooking solutions on the market today are likely to eliminate all of the
negative health effects of solid fuel cooking under normal use conditions, but adoption of the cleanest
stoves and fuels can still save hundreds of thousands of lives. Of the available solutions, the cleanest
from a health perspective are renewable technologies such as biogas and solar and modern fuel
solutions such as LPG, electricity, and (high quality) kerosene stoves, followed by biofuel solutions
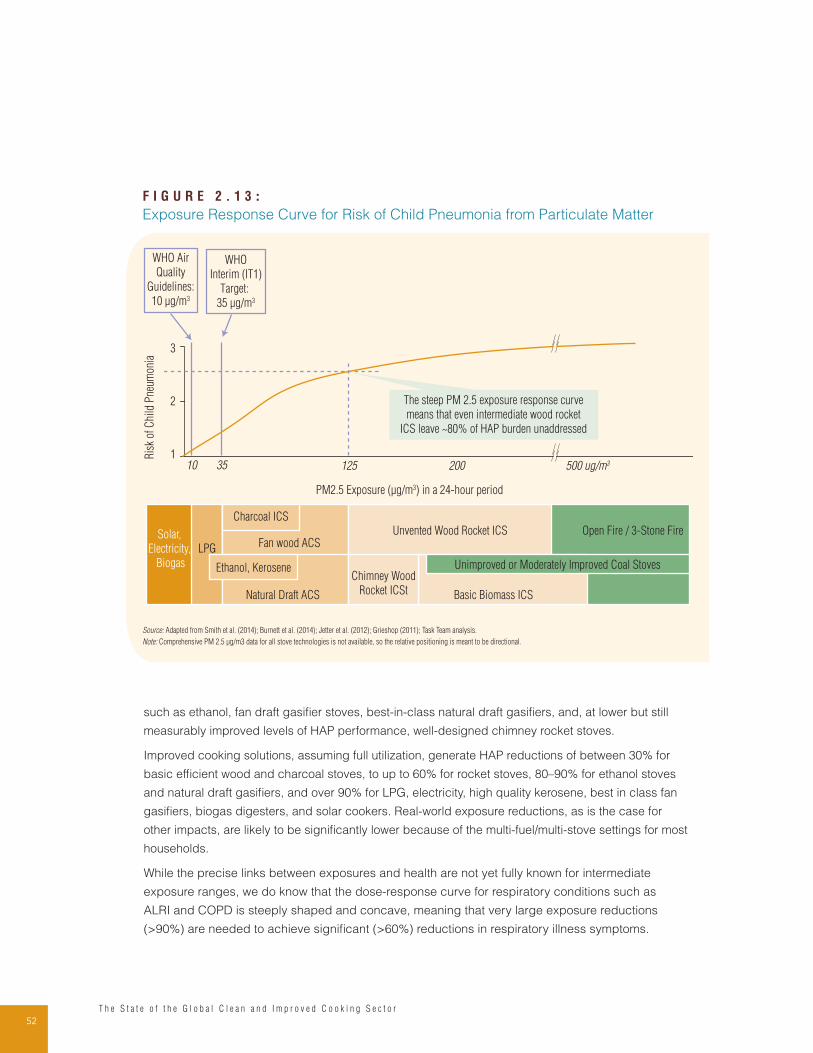
52T h e S t a t e o f t h e G l o b a l C l e a n a n d I m p r o v e d C o o k i n g S e c t o r
such as ethanol, fan draft gasifier stoves, best-in-class natural draft gasifiers, and, at lower but still
measurably improved levels of HAP performance, well-designed chimney rocket stoves.
Improved cooking solutions, assuming full utilization, generate HAP reductions of between 30% for
basic efficient wood and charcoal stoves, to up to 60% for rocket stoves, 80–90% for ethanol stoves
and natural draft gasifiers, and over 90% for LPG, electricity, high quality kerosene, best in class fan
gasifiers, biogas digesters, and solar cookers. Real-world exposure reductions, as is the case for
other impacts, are likely to be significantly lower because of the multi-fuel/multi-stove settings for most
households.
While the precise links between exposures and health are not yet fully known for intermediate
exposure ranges, we do know that the dose-response curve for respiratory conditions such as
ALRI and COPD is steeply shaped and concave, meaning that very large exposure reductions
(>90%) are needed to achieve significant (>60%) reductions in respiratory illness symptoms.
F I G U R E 2 . 1 3 :
Exposure Response Curve for Risk of Child Pneumonia from Particulate Matter
3
2
1Ris
k of
Chi
ld P
neum
onia
PM2.5 Exposure (μg/m3) in a 24-hour period
LPG
Charcoal ICS
Ethanol, Kerosene
Fan wood ACS
Natural Draft ACS
Unvented Wood Rocket ICS
Chimney Wood
Rocket ICSt Basic Biomass ICS
Unimproved or Moderately Improved Coal Stoves
Open Fire / 3-Stone FireSolar,
Electricity,
Biogas
10 35 125 200 500 ug/m3
The steep PM 2.5 exposure response curve
means that even intermediate wood rocket
ICS leave ~80% of HAP burden unaddressed
WHO
Interim (IT1)
Target:
35 μg/m3
WHO Air
Quality
Guidelines:
10 μg/m3
Source: Adapted from Smith et al. (2014); Burnett et al. (2014); Jetter et al. (2012); Grieshop (2011); Task Team analysis.
Note: Comprehensive PM 2.5 μg/m3 data for all stove technologies is not available, so the relative positioning is meant to be directional.
53T h e C a s e f o r C l e a n a n d I m p r o v e d C o o k i n g
The Guatemala RESPIRE RCT has shown that intermediate levels of exposure reductions (~60%)
lead to moderate observed health benefits (i.e., 25–30% reduction in observed and self-reported
respiratory symptoms) and no measurable improvements in actual lung function.199 Smaller emission
reductions obtained by basic efficient (30%) and portable rocket stoves (40–50%), particularly in the
case of unvented rocket stoves that increase net black carbon emissions, likely have no or minimal
respiratory health benefits.
Although much about potential health impacts is still unknown, the benefits of improved solutions are
likely to be greater than what is suggested by emerging ALRI and COPD evidence. We currently have
no dose-response data for most HAP-linked health conditions (e.g., low birth weight, heart disease,
eye disease), but widespread self-reported improvements in eye irritation and headache symptoms,
even with the use of basic ICS models, suggest that the threshold for at least some of the negative
health effects of traditional stoves and fuels may be lower than for chronic respiratory conditions.
Furthermore, while there is no direct evidence on this point, it is highly probable that basic and
intermediate ICS solutions lead to meaningful reductions in firewood collection injuries since such
health effects should be directionally proportional to a household’s fuel collection time.
E N D N O T E S
19 Smith et al., 2011; UNDP and WHO, 2009; IEA, 2011; our global fuel-use database, including coal users, tracks an
estimated 3.03 billion solid fuel users for cooking and heating and 2.85 billion solid fuel users for cooking globally.
20 See Chapter 4 for ICS penetration analysis and methodology.
21 For a good overview, see Global Alliance for Clean Cookstoves, World Bank, 2011a.
22 While not directly comparable, a WHO cost benefit analysis using 2004–05 data pointed to a $ 90 billion opportunity
cost of solid fuel cooking, assuming the potential to shift 50% of the solid fuel population to LPG (Hutton et al.,
2007). See also the CBA analyses in Jeuland and Pattanayak (2012) and Garcia-Frapolli, et al. (2010).
23 Naeher et al., 2007.
24 The most recent WHO HAP mortality estimate (retrieved from: http://www.who.int/phe/health_topics/outdoorair/
databases/en/) is a significant upward revision from 3.5–4 million annual deaths estimated in the Global Burden
of Disease survey (Lim et al., 2012) and 1.5–2 million deaths estimated in earlier analyses. The proximate causes
of these 4.3 million deaths in the latest estimates are stroke (36%), ischaemic heart disease (26%), chronic
obstuctive pulmonary disease (22%), pneumonia (12%), and lung cancer (6%).
25 Chafe et al., 2014.
26 Raw GBD data are available at http://www.healthmetricsandevaluation.org/gbd.
27 Dherani et al., 2008; Smith et al., 2004; Ezzati and Kammen, 2002; Smith et al., 2004.
28 Bruce et al., 2000; Kurmi et al., 2010.
29 Lung cancer is of particular importance to the coal-using population, which is small in Sub-Saharan Africa
(Mumford, 1987; Smith, 1993).
30 Siddiqui et al., 2005; Pokhrel et al., 2005.
31 For impacts on low birth weights and perinatal mortality, see Misra et al. (2012) and Sreeramareddy et al. (2011).
54T h e S t a t e o f t h e G l o b a l C l e a n a n d I m p r o v e d C o o k i n g S e c t o r
32 Conditions linked to HAP, but not quantified in current Global Burden of Disease data, include tuberculosis
(Sumpter & Chandramohan, 2013); childhood nutritional deficiencies, including anemia and stunted growth
(Mishra & Retherford, 2007); blindness (Siddiqui et al., 2005; West et al., 2013); asthma (Schei et al., 2004);
maternal depression (Banerjee et al., 2012); cognitive impairment in the young and old (Weuve et al., 2012;
Suglia et al., 2008; Perera et al., 2013); upper respiratory, digestive, and cervical cancers (Reid et al., 2012;
Bhargava et al., 2004); the exacerbation of the effects of HIV/AIDS (Fullerton et al., 2008); and bacterial
meningitis (http://www.nsf.gov/discoveries/disc_summ.jsp?cntn_id=126403&org=NSF&from=news).
33 Eye irritation was a consistent theme in Shell Foundation’s 2007 Breathing Space surveys in East Africa. Much
of the evidence for solid fuel linked headaches and eye irritation is qualitative, but there is also growing support
from peer-reviewed literature from other parts of Africa (Katuwal & Bohara, 2009; Diaz & Pope, 2007; Ellegard,
1997; Matinga, 2010).
34 Lam et al., 2012.
35 Ibid.
36 Wickramsinghe, 2003; Ezzati & Kammen, 2002; Ghana data in Odoi-Agyarko, 2009.
37 See Warwick & Doig (2004) and Ezzati & Kammen (2002).
38 A recent Ghana survey suggests, however, that self-reported morbidity is high, ranging from 20% to 80% for
some of these conditions (Odoi-Agyarko, 2009).
39 Derived from consumer segmentation in Section II; >1.4 billion people across the developing world 74 countries,
accounting for 98% or solid fuel households with average of 4 people per household.
40 Global Alliance for Clean Cookstoves, 2011.
41 Shell Foundation Breathing Space Surveys, 2007–08.
42 See, for example, insights from cooking consumer research in Tanzania (IDEO, 2012).
43 Total cooking woodfuel consumption is estimated using reported household fuel mix, a standard cooking diet
of 320 MJ (see Endnote 224 for details on notional cooking budget assumption), 6 kg of wood per 1 kg of
charcoal kiln efficiency, and average wood density of 720 kg/m3. The total of 1.3 billion m3 compares with FAO
2010 estimate of 1.8 billion m3 woodfuel consumption. The estimate is lower due to the exclusion of non-cooking
woodfuel and woodfuel use in developed countries.
44 Assumes 880–1,000 kg of coal per household for cooking based on average per household data in Africa and
China, and a standard cooking diet of 320 MJ per month (see Endnote 224 on notional cooking diet assumption);
the total residential consumption of coal is significantly higher, with 200 MT of coal being used annually in China
alone for residential heating in urban areas (Liu & Liu, 2011).
45 Bailis et al., 2015.
46 The top of the range is consistent with the Global Alliance’s earlier estimated total Kyoto Protocol GHG emissions
of 1 billion MT (Muthiah, 2011).
47 Assumes total global 2011 GHG emissions of 34 billion tons of CO2 based on Olivier et al. (2012).
48 The upper range of our Kyoto GHG estimate assumes a woodfuel non-renewability fNRB ratio of over 50%, the
assumption used by the Global Alliance and a number of sector studies. The bottom of the range conservatively
assumes an fNRB of 10–15% for wood in line with the IPCC Fourth Assessment position and a fNRB of 50% for
charcoal.
49 22–25% of global emissions of 7,530 Gg; total global black carbon emissions from residential solid fuel use
reported in Agency (2011) and Bond et al. (2013); these figures include residential heating.
50 Estimated by mapping black carbon emission EC/OC profiles for common Sub-Saharan Africa stove-fuel
combinations and charcoal kilns to the annual regional biomass consumption and charcoal production volumes;
does not include black carbon emissions from kerosene stoves.
55T h e C a s e f o r C l e a n a n d I m p r o v e d C o o k i n g
51 Ibid.
52 Grieshop et al., 2011; see also Agency, 2011 Agency, 2011.
53 See recent review of evidence in Bond et al. (2013); in contrast to biomass fuel cooking, there is more certainty
around the evidence of positive climate-forcing impacts from coal stoves, although these are used for heating as
well, which are not included in this report.
54 Ibid.
55 Praveen et al., 2012.
56 Kilimanjaro glacial melting (Kaser et al., 2004); Rwenzori Range glacial melting (Taylor et al., 2006).
57 European Commission, 2010; World Bank, 2011b; Union of Concerned Scientists, 2011; Hiemstra-van der Horst,
2008.
58 Degradation is here defined as the direct human-induced reduction in forest carbon stocks from the natural
carbon carrying capacity of forest ecosystems without a net reduction of forest area (Nature Conservancy, 2009).
59 World Bank, 2011b.
60 Leach & Mearns, 1989; Morton, 2007; Openshaw, 2010.
61 Arnold et al., 2005; Mwampamba, 2007; and van Beukering et al., 2007, cited in World Bank, 2011b.
62 Baland et al., 2010.
63 Kissinger et al., 2012; Baland et al., 2010.
64 Bojo & Cassells, 1995. An older Ethiopia study estimated that if dung had be left in the soil as fertilizer in the
mid-1980s instead of being used as fuel, grain production could have been increased by up to 15 million tons
(Newcombe, 1989).
65 Ravindranath and Hall (1995) suggested that impact of dung fuel use on soil productivity in South Asia has been
Marginal (see also Pimentel, 2006).
66 For localized deforestation and degradation examples in Africa due to charcoal production, see: Zambia
– Kutsch et al., 2011; Tanzania – Giliba et al., 2011, Mwampamba, 2007; Ghana – Lurimuah, 2011, Yiridoe
& Nanang, 2001; Malawi – Munthali, 2012; Kenya – Bailis, 2005; Burkina Faso – Ouedraogo, 2012, and
Madagascar – WWF, 2010. Outside of Africa, notable examples include: Haiti - Williams, 2011; Cambodia –
Wyatt, 2013, San et al., 2012.
67 Mwampamba, 2007.
68 Charcoal kiln efficiency varies widely with an average ratio of 6 kg wood to 1k charcoal (Union of Concerned
Scientists, 2011).
69 World Bank, 2011b.
70 Chdumayo & Gumbo (2012) and Bailis (2005) suggest that the contribution of charcoal production to
degradation is important, but secondary relative to other factors. One recent study has attributed up to half
of African degradation effects to charcoal production, 12% in subtropical Asia, and 8% in Latin America
(Hosonuma et al., 2012), but this interpretation does not appear to be substantiated by on the ground country-
level analysis.
71 See Broadhead et al., 2001.
72 Ghana - Oguntunde et al., 2008, Nigeria - Ogunkunle & Oladele, 2004, multi-geography - Kindt et al., 2008;
Kenya - Oyugi et al., 2007; Togo - Kouami et al., 2009.
73 The best publicized instance of such faunal biodiversity threat has been the negative effect of the charcoal trade
on the habitat of the of mountain gorilla in Democratic Republic of Congo’s Virunga National Park (Nellemann,
Redmond, and Refisch, 2010) and there have been anecdotal reports on adverse effects of charcoal production
56T h e S t a t e o f t h e G l o b a l C l e a n a n d I m p r o v e d C o o k i n g S e c t o r
on other species like the Sifaka in Madagascar, but there is little data on how widespread and representative
such effects may be.
74 The proxy used for this variable is woodfuel consumption’s share of the country’s total above-ground biomass.
75 This variable is estimated as the average annual decline in above-ground biomass from 2000 to 2010 FAO.
76 See for example Westinga et al. (2013), which compares consecutive (1990–2010) census-based FAO Forest
Resources Assessments (FRAs) of Rwanda with contemporary fine-resolution satellite images that demonstrate
significantly greater deforestation than noted in FRAs. More generally, many scholars have questioned the data
quality of FRAs which are typically not triangulated with satellite observation.
77 Broadhead et al., 2001.
78 World Resources Institute’s BoP landscape report (Hammond et al., 2007) is based on household survey data for
more than 30 developing countries globally.
79 Daurella & Foster (2009) report 7% total of household expenditures going towards LPG, kerosene, and charcoal.
80 Sub-Saharan Africa real incomes, on average, stagnated, with an anemic growth of 1% annually. In contrast, our
fuel price analysis indicates real price growth of 2–14% annually for LPG, kerosene, and charcoal over the past
decade, depending on the country.
81 Bacon et al., 2010.
82 In Luanda, the lowest urban quintile expenditures were 21% of monthly income (Bacon et al., 2010), urban
slumdwellers in Malawi spent over 11% of their incomes on charcoal alone in 2007 (Kambewa et al., 2007). In
light of recent price increases, spending on charcoal in Kibera, Nairobi, reaches up to 25% of income for the
poorest households on certain months (based on author interviews in September, 2012), though this level of
expenditure is unlikely to be sustained on a full-year basis. Asian examples show comparable results—such as a
16% expenditure share going to energy in Thai slums (Shrestha et al., 2008).
83 For a review of the literature on the poverty premium, see Mendoza (2011).
84 Press reports from Cameroon, Uganda, Zambia, Liberia, Tanzania, and Madagascar.
85 World Bank, 2011a; Blackden & Wodon, 2006.
86 See Malawi - GIZ/ProBEC, 2010; Chad - Vaccari et al., 2012; Ghana - Odoi-Agyarko, 2009; Ethiopia – Damte et
al., 2011; Kenya - Githiomi et al., 2012; Rwanda - SNV, 2007; Uganda - SNV, 2010, Uganda MOF, 2003.
87 For example, IEA (2006) World Energy Outlook reports collection distances of 1–10 km in Tanzania, depending
on the region.
88 Madubansi and Shackleton (2007) show a 14% increase in fuel collection times over 1991–2002 in a set of five
villages in South Africa. In Sudan, women’s collection times quadrupled in some areas because of increased fuel
scarcity (Sass, 2003).
89 Kohlin et al., 2011; Blackden & Wodon, 2006. See also Figure 2.9.
90 Assumes two hours per household of fuel collection time daily and a maximum estimate of 1.5 hours of cooking
time savings out of a 3-hour average cooking period per day in the case of a switch to LPG; 8-hour workdays.
91 See Habermehl, 2007 and Jeuland & Pattanayak, 2012.
92 The best data on this issue comes from household surveys in post-intervention impact reports. For instance, 34%
of time saved from improved stove interventions in Malawi was used for farming activities GIZ ProBEC 2008, 23%
of time saved via improved wood stoves in Mozambique was invested by households in their small businesses
or work in fields GIZ ProBEC 2010, 23% of time saved by switching to ethanol cooking was used for income-
generating activities in an Ethiopia refugee camp (Egziabher et al., 2006) and 25–40% of time saved by biogas
digester users was utilized for income–generating activities in countries like Bangladesh, Nepal, and Vietnam
according to periodic biogas users surveys (SNV, 2007–12).
57T h e C a s e f o r C l e a n a n d I m p r o v e d C o o k i n g
93 Assumes a 25–50% range of time being redeployed for income–generating activities; hourly labor cost of
$ 0.30–0.75 per hour equivalent to hourly equivalent of average Sub-Saharan Africa gross national income per
capita at top of range and per capita agricultural value added at bottom of range. Using official minimum wages
would yield substantially higher figures.
94 World Bank, 2011b.
95 Sepp, 2008, cited in World Bank, 2011b; earlier estimates suggested 200,000 for charcoal production out of a
total of over 500,000 (UNDP, 2012).
96 ESD, 2007, cited in World Bank, 2011b.
97 Kambewa et al., 2007 and Openshaw, 2010, cited in World Bank, 2011b.
98 Cited in World Bank, 2011b.
99 15 million people in Sub–Saharan Africa derive their primary cash income from activities like firewood collection,
charcoal making, small–scale sawmilling, and woodfuel and timber sales (Oksanen et al., 2003). We assume that
the number is likely to have grown by at least 20% in line with the general increase in woodfuel volumes over the
past decade to over 18 million jobs.
100 For Philippines, see Remedio, 2012; for India and Pakistan, see Domac et al., 2005.
101 For Brazil, see Domac et al., 2005; for Peru, see Bennet-Curry, 2013, and for Haiti, see Reduondo, 2013.
102 World Bank Central American Clean Cooking Initiative (CACCI) research (forthcoming in 2015).
103 NL Agency, 2010; UNDP, 2012.
104 Press reports from Madagascar and Uganda.
105 NL Agency, 2010.
106 Shively et al., 2010.
107 Schure, 2012.
108 Radounis 2012.
109 ESDA, 2005.
110 IIAM and INBAR 2007, cited in http://ntfp.inbar.int/wiki/index.php/Charcoal (viewed Sept. 1, 2012).
111 PREDAS, 2008.
112 Agyeman et al., 2012.
113 Schure, 2012.
114 Khundi et al., 2010.
115 Bhattarai, 1998.
116 Coomes & Burt, 2005; Bennet-Curry 2013; Reduondo, 2013.
117 For previous general overviews, see the gender sections of Global Alliance for Clean Cookstoves, 2011
and World Bank, 2011a; for in-depth analyses of improved stove and clean cooking energy gender issues,
see Kohlin et al., 2011; Clancy et al., 2003, 2011; Carr & Hartl, 2010; World Bank, 2006; and Ramani &
Heijndermans, 2003.
118 Kohlin et al., 2011.
119 ibid.
120 Huq et al., 2004 Bangladesh, Balakrishnan et al., 2004 India, Ezzati et al., 2000 Kenya; Smith et al., 2007.
121 For instance, acute respiratory infections incidence for boys is higher than that for girls in India Mishra, 2004.
58T h e S t a t e o f t h e G l o b a l C l e a n a n d I m p r o v e d C o o k i n g S e c t o r
122 Banerjee et al., 2012.
123 Fullerton et al., 2008.
124 CO exposure displaces oxygen level in blood hemoglobin and women generally have less hemoglobin in
reserve than man, with oxygen carrying capacity being a further 20–30% lower in pregnant women in particular
Mishra, 2004.
125 See Warwick and Doig, 2004 and IEA World Energy Outlook, 2006.
126 See Matinga, 2010; Odoi–Agyarko 2010 reports significantly higher incidence of backaches, headaches, and
neck pain for women from firewood collection relative to a low incidence in men. See also Wickramsinghe, 2003
for Sri Lanka data.
127 For example, see reports from Nepal Earth & Sthapit, 2002 and India Ravindran et al., 2000.
128 See Matinga, 2010 for criticism of this issue in South Africa.
129 See following note.
130 See Cooke et al., 2008 and Kohlin et al., 2011. Geographies with near parity in firewood collection include India,
Mongolia, and PNG. Men are the primary firewood collectors in Nicaragua, Guatemala, Lao PDR, and Indonesia.
131 Our review suggests 0.5 to 5 hours for fuel collection about 2 hours on average and 1.3–5 hours for cooking
2.5–3 hours on average for food preparation based on gender disaggregated data for a dozen developing
countries. It should be noted that the average fuel collection times shown in Figure 12 are significantly lower
because they benchmark all households rather than just rural poor households actively engaged in firewood
collection, for whom the time spent is larger by an order of magnitude.
132 Blackden & Wodon, 2006.
133 See Kohlin et al., 2011 Carr & Hartl, 2010, Schlag & Zuzarte, 2008. For evidence that a significant portion of time
lost could be used for income generation activities see notes 86 and 87 above and related discussion.
134 Clancy et al., 2011
135 Ward & Marsh, 2006; Patrick, 2006; Vaughan, 2011; Bizzarri & Deni, 2010; UNMIL, 2008.
136 Kenyan press reports the incidence of rape of over 100:100,000 in the Dadaab refugee camp or 358 cases June
2010 to June 2011 out of a total female refugee population of ~300,000 compared to a 2:100,000 incidence of
rape in Kenya at large in 2011.
137 In Uganda’s Bushenyi and Kabale districts, for example, 22% of firewood collectors report being beaten by the
owners, 24% report being taken to court, and 41% report conflict situations where the wood gets taken away
(Malinski, 2006).
138 Ndiritu & Nyangena, 2010.
139 Nankhuni & Findeis, 2004; Kiros, 2011.
140 Cecelski, 2004.
141 In African surveys, the priority given to the aesthetic appearance of the kitchen is relatively low. For instance, in
a Rocket Lorena stove intervention in Uganda, 7.5% of users reported that a notable benefit was that the “stove
makes the kitchen look smart” (Malinski, 2006) and 9% of users of an improved charcoal stove in Tanzania
likewise reported a “clean kitchen” as a major benefit (Evodius, 2010). The factor of kitchen cleanliness is rated
more highly in available Asia and Latin America surveys. One-quarter of users in a Pakistan biogas digester
intervention reported clean utensils and a clean household as key benefits (SNV Pakistan Biogas Users Survey,
2011); one-quarter of users reported a clean kitchen as a major benefit in the Patsari chimney rocket stove
intervention in Mexico (Masera et al., 2006); and 67% of users reported clean kitchen vessels and walls as a
positive benefit of improved chulha stoves in India (Barnes et al., 2012).
142 A general overview of methodological issues appears in Burwen (2011).
59T h e C a s e f o r C l e a n a n d I m p r o v e d C o o k i n g
143 See overview of stove performance by dimension in Chapter 4.
144 Berkeley Air Monitoring, 2012.
145 Approvecho Testing Center, 2011; Jetter & Kariher, 2009; MacCarty et al., 2008; for ACS, see Kar et al., 2011.
146 Just et al., 2013.
147 Burwen, 2011; Berkeley Air Monitoring, 2012; and multiple stakeholder interviews.
148 Interview with Kirk Smith; Kar et al., 2011.
149 See, for example, Berkeley Air Monitoring, 2012, Berkeley Air Monitoring Group, 2010, and Adkins et al., 2010.
150 Berrueta et al., 2008.
151 Bensch and Peters (2011a, 2011b) report savings comparable to theoretical 25–35% fuel savings.
152 Ternes et al., 2008.
153 For real world performance of built-in or semi-fixed chimney rocket stoves, see Berkeley Air Monitoring(2012); for
Ethiopia MIRT stove, see Megen Power Ltd. (2008); for the Uganda Lorena Rocket and RESPIRE data for Patsari
stoves, see Malinski (2006).
154 For field impact evaluations cover full spectrum of ICS, including minimally improved chimney wood stoves in India,
see Hanna et al., 2012 and in Ghana, see Burwen & Levine, 2012. For basic efficient charcoal stoves in Senegal,
see Bensch & Peters, 2011a; in Tanzania, see Schutze, 2010, and in Mozambique, see Chidamba, 2010. For basic
efficient wood stoves in Senegal, see Bensch & Peters, 2011b and in Malawi, see Schutze, 2010. For portable wood
rocket stoves in Kenya, see Berkeley Air Monitoring Group, 2010; in Malawi, see ProBEC, 2009; and in Tanzania and
Uganda, see Adkins et al., 2010. For built–in chimney rocket stoves in Peru, see Peru Adrianzen, 2012; in Mexico,
see Masera et al., 2007; in Guatemala, see Smith et al., 2010, McCracken et al., 2007, Diaz et al., 2007; in Uganda,
see Malinski, 2006; and in Ethiopia, see Megen Power Ltd., 2008. For natural draft gasifiers in Costa Rica, see Ternes
et al., 2008 and for both fan and natural draft gasifiers in India, see Kar et al., 2011. For renewable and modern
fuels key studies include evaluations of ethanol and methanol pilots in Ethiopia - Egziabher et al., 2006; Nigeria -
Obueh, 2008; and Madagascar - Practical Action, 2011; LPG stoves in Kenya and Sudan - Malla et al., 2011; biogas
digesters in Vietnam, Pakistan, Bangladesh - SNV Biogas Users Reports, and Kenya - Dooho et al., 2012; and solar
cookers in Senegal - Levine & Beltramo, 2012, and in Ethiopia, Kenya, and Bolivia - Szulczewski, 2006.
155 Completed ICS RCTs include evaluations of basic chimney wood stoves in India (Hannah 2012) and Ghana
(Burwen & Levine, 2012), a basic efficient charcoal jambar stove in Senegal (Bensch & Peters, 2011a), and
the Patsari chimney rocket stove under the RESPIRE program in Guatemala (Smith et al., 2010, McCracken
et al., 2007, Diaz et al., 2007, Diaz & Pope, 2007). RCTs of other ICS and ACS are in–progress and include an
evaluation of chimney wood stoves in Nepal (Johns Hopkins/Tribhuvan University), efficient improved stove in
India (Washington University in St. Louis), Envirofit rocket stoves in Uganda (USAID TRAction Project), BioLite fan
gasifier in Ghana (Columbia University), and the Philips fan gasifier in Malawi (CAPS/Liverpool School of Tropical
Medicine and Rwanda University of North Carolina).
156 Hanna et al., 2012; Burwen & Levine, 2012.
157 Hanna et al., 2012. For criticism, see Grimm & Peters, 2012.
158 Burwen & Levine, 2012.
159 Ibid.
160 ProBEC charcoal stove interventions; Senegal charcoal jiko RCT (Bensch & Peters, 2011a).
161 Our Kenya interviews suggest that average fuel savings of KCJ in Kenya is near 15–20%, significantly below the
potential 30–40% savings possible with well-designed metal-lined ceramic stoves.
162 Patsari data from RESPIRE evaluations (Smith-Sivertsen et al., 2009), Uganda Rocket Lorena (Malinski, 2006),
and MIRT (Megen Power Ltd., 2008).
60T h e S t a t e o f t h e G l o b a l C l e a n a n d I m p r o v e d C o o k i n g S e c t o r
163 Berkeley Air Monitoring Group, 2010.
164 For Costa Rica, see Ternes et al., 2008. For variation in gasifier performance in India field tests, see Kar et al.,
2011. More comprehensive RCT evidence for gasifiers is unlikely to be available for several years.
165 See, for example, Malla et al. (2011) which shows only moderate health and woodfuel consumption impacts in
Sudan and Kenya from LPG pilots due to the lack of displacement of baseline technologies.
166 Smith, K. R., R. Uma et al. 2000. “Greenhouse Implications of Household Stoves: An Analysis for India.” Annual
Review of Energy and the Environment 251: 741–763.
167 For the latest research on kerosene stoves, see Lam et al. 2012.
168 For the Arivi stove, see the data from an independent evaluation by Worcester Institute available at: http://
wp.wpi.edu/capetown/projects/p2009/energy/project-components/accomplishments/arivi-safe-paraffin-stove/.
The Servals stove has likewise been evaluated by several independent institutions.
169 See fuel mix data in Figure 3.2 and related text.
170 Smith 2014. For market prospects in India, a recent report on the Induction Cooktop Market in India: 2012–2016
(Infinity Research Limited, March 2013), has predicted 35% annual growth over the next few years.
171 Smith, 2014.
172 66% reduction for wood and charcoal expenditures and firewood collection time in Lao PDR (Synesis, 2011),
72% reduction in firewood expenditures in Indonesia (JRI Research, 2011), >80% fuel collection time and
woodfuel expenditure savings in Bangladesh (iDE, 2011).
173 Schlag, N. & Zuzarte, F., 2008. Market Barriers to Clean Cooking Fuels in Sub-Saharan Africa: A Review of
Literature, Stockholm: Stockholm Environment Institute.
174 See Dooho et al. (2012) for the results of a recent Kenya biogas assessment.
175 Practical Action, 2011.
176 Szulczewski, 2006.
177 http://solarcooking.wikia.com/wiki/CooKit
178 http://solarcooking.wikia.com/wiki/Devos_Solar_Cooker
179 Venkataraman et al., 2010; see also Hanna et al., 2012.
180 For example, a ProBEC baselining study found that mud stoves distributed under a national program in Malawi
in the 1990s were largely abandoned a decade later. Anecdotal evidence from our interviews and press reports
suggests a similar fate for chimney mud stoves in Madagascar, Uganda, Rwanda, Zimbabwe, and Tanzania.
181 For Ghana, see Burwen & Levine, 2012.
182 The ratio of non–functional or abandoned biogas plants has ranged from 20 to 75% for countries like Kenya,
Ethiopia, Bangladesh, Sri Lanka, and India (Bond & Templeton, 2011), though information from new biogas
digester programs such as those supported by SNV shows significantly lower abandonment rates at this stage.
183 See, for exampel, Levine & Beltramo, 2012.
184 Thurber et al., 2014
185 Practical Action, 2011.
186 Evaluations of GIZ interventions in Africa GIZ SUN, ProBEC, and EnDev programs show 70–90% persistence of
improved stoves based on ongoing use of or replacement rates across a range of artisanal and semi–industrial
ICS technologies. See Schutze, 2010; GIZ/ProBEC, 2010; Evodius, 2010; Chidamba, 2010; Megen Power Ltd.,
2008; and Malinski, 2006.
187 See Masera, 2000; Ruiz-Mercado et al., 2011.
61T h e C a s e f o r C l e a n a n d I m p r o v e d C o o k i n g
188 See, for example, the impact of partial ICS adoption (i.e., mixed use of Patsari stove and old unimproved stoves)
in comparison to full ICS adoption on health outcomes in Michoacan, Mexico (Masera et al., 2007).
189 Evidence from China, Ghana, Guatemala, Kenya, India, Mexico, Mozambique, Tanzania, and Uganda suggests
that stove users prefer to use more than one stove. See, for example, Adkins et al., 2010 for Uganda and
Tanzania, Concern Universal, 2011 for Malawi, Burwen & Levine, 2012 for Ghana, Schutze, 2010, and Ruiz-
Mercado et al., 2011 for multi-geography data.
190 45–65% savings reported from the field for rocket stoves, with the high end representing chimney rocket stoves
and 60–80% savings reported from biogas digester interventions.
191 Goldemberg & Coelho, 2003.
192 ICS job creation potential ranges from several hundred stoves per full time employee in artisanal markets
(UNDS 2012; IRENA, 2012) to thousands of stoves per job created in the case of industrial stove manufacturing
processes. Imported stoves, naturally, create the smallest number of domestic jobs.
193 For ICS jobs, we conservatively assume 500 stoves produced annually per full time artisan (including both liner
manufacturers and metal workers) and 1,000 stoves per each full time artisanal stove retailer. The full uptake of
1,000 artisanal ICS stoves would create 3 ICS jobs (1 retailer and 2 artisans) while simultaneously displacing
35 jobs in the woodfuel sector, a ratio of roughly 1:11. For job displacement, we assume that the adoption of
1,000 ICS leads to 240 tons of woodfuel savings (1,000 stoves x 800 kg of charcoal per household x 30%),
which translates into the displacement of 10 charcoal makers jobs (2 tons of charcoal or 40 bags of charcoal
production eliminated per month), and 25 retailer jobs (25 1-kg charcoal buckets sold by retailer per day).
194 See fuels section of Chapter 3. Net woodfuel consumption volumes are expected to increase 30–40% between
2010 and 2020, so an (unrealistic) reduction in woodfuel demand due to ICS of 30–50% across the board would
still mean only 10–30% less woodfuel consumption than today.
195 For example, assuming if just 10% of the time freed up from firewood collection and cooking times is converted
into income-generating employment, this would translate into 4 million jobs across Africa (assuming our estimate
of a total of 40 million of “wasted” person years on avoidable firewood collection/cooking activities).
196 World Bank, 2011b.
197 UNDP, 2012.
198 A number of common rocket stove models more than double black carbon emissions for each kg of fuel burned,
cancelling out the emissions abatement effects of improved fuel efficiency (Berkeley Air Monitoring Group,
2011b).
199 Smith et al., 2010; Smith et al., 2010; Smith et al., 2011.
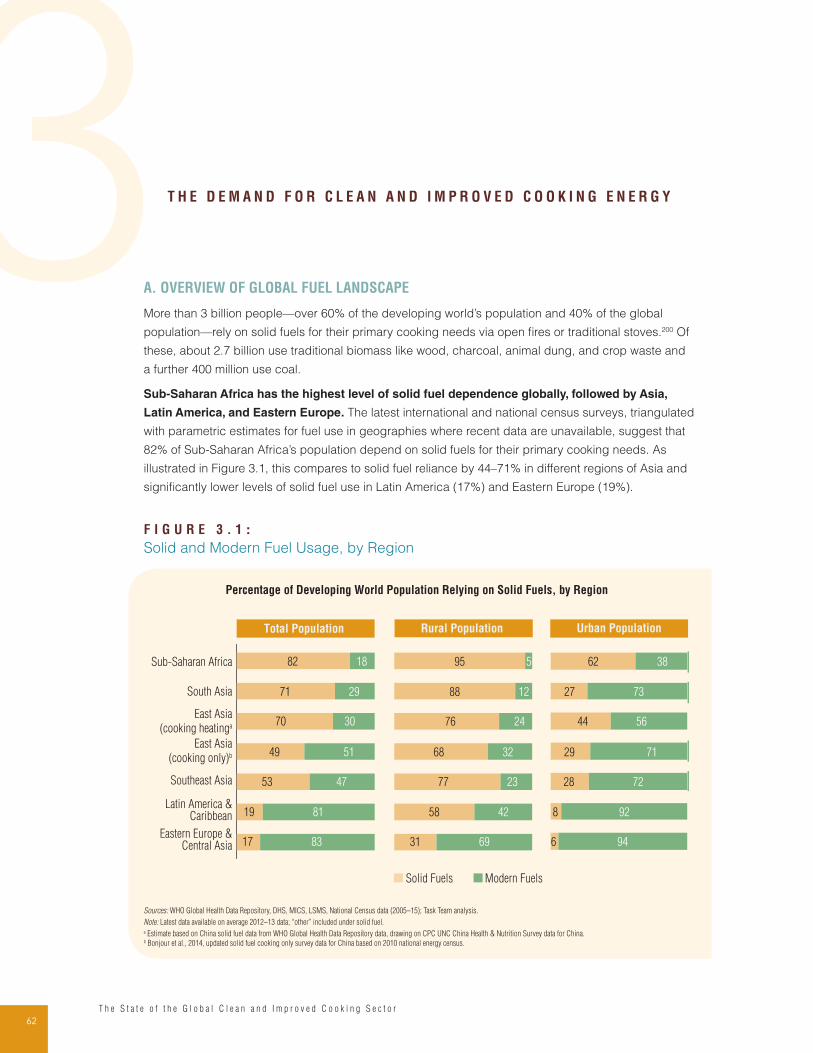
62T h e S t a t e o f t h e G l o b a l C l e a n a n d I m p r o v e d C o o k i n g S e c t o r
3 T H E D E M A N D F O R C L E A N A N D I M P R O V E D C O O K I N G E N E R G Y
A. OVERVIEW OF GLOBAL FUEL LANDSCAPE
More than 3 billion people—over 60% of the developing world’s population and 40% of the global
population—rely on solid fuels for their primary cooking needs via open fires or traditional stoves.200 Of
these, about 2.7 billion use traditional biomass like wood, charcoal, animal dung, and crop waste and
a further 400 million use coal.
Sub-Saharan Africa has the highest level of solid fuel dependence globally, followed by Asia,
Latin America, and Eastern Europe. The latest international and national census surveys, triangulated
with parametric estimates for fuel use in geographies where recent data are unavailable, suggest that
82% of Sub-Saharan Africa’s population depend on solid fuels for their primary cooking needs. As
illustrated in Figure 3.1, this compares to solid fuel reliance by 44–71% in different regions of Asia and
significantly lower levels of solid fuel use in Latin America (17%) and Eastern Europe (19%).
F I G U R E 3 . 1 :
Solid and Modern Fuel Usage, by Region
Percentage of Developing World Population Relying on Solid Fuels, by Region
94
92
72
71
73
38
69
42
23
24
12
31
58
77
76
88
95 5
Eastern Europe &Central Asia 83
Latin America &Caribbean 81
East Asia
(cooking only)b
Southeast Asia 47
49
South Asia 29
Sub-Saharan Africa 18
17
19
53
51
71
82
70 30
68 32
East Asia
(cooking heatinga
Total Population Rural Population Urban Population
Solid Fuels Modern Fuels
56
6
8
28
29
27
62
44
Sources: WHO Global Health Data Repository, DHS, MICS, LSMS, National Census data (2005–15); Task Team analysis.
Note: Latest data available on average 2012–13 data; “other” included under solid fuel.a Estimate based on China solid fuel data from WHO Global Health Data Repository data, drawing on CPC UNC China Health & Nutrition Survey data for China. b Bonjour et al., 2014, updated solid fuel cooking only survey data for China based on 2010 national energy census.
63T h e D e m a n d f o r C l e a n a n d I m p r o v e d C o o k i n g E n e r g y
The regional split for East Asia has the greatest degree of uncertainty due to variability in historical
fuel use data for China and difficulties in disaggregating the country’s solid fuel cooking and solid fuel
heating figures. We, therefore, show two data points for East Asia to bracket the likely fuel mix range
for the region.201 The more conservative data point, including both cooking and heating solid fuel use
in China, is used throughout the other exhibits and text below.
Across all regions, urban populations are far less likely to rely on solid fuel cooking than rural
populations. Urban households are wealthier and have better access to new technologies, driving
higher adoption of modern fuels. The gap between rural and urban fuel use patterns is most striking in
South Asia and Southeast Asia, which are characterized by high levels of rural solid fuel reliance (88%
and 71% respectively) and relatively low levels of urban solid fuel use (28–29%). This has important
implications for the future. As quickly urbanizing rural populations integrate into the urban environment,
the large differential between urban and rural fuel use behavior should facilitate more rapid migration for
households up the energy ladder to cleaner, more modern fuels. In contrast, in Sub-Saharan Africa, the
rates of solid fuel dependency in rural (95%) and urban (63%) areas are both extremely high. In the Latin
America region (including the Caribbean) and Eastern Europe (including Central Asia), due to varying
historical reasons, urban populations have almost fully transitioned to modern fuels. In these regions,
solid fuel dependence is a problem of rural infrastructure gaps and rural population exclusion.
Wood is the dominant solid fuel overall, with a significant charcoal segment in both rural and
urban areas. Wood is used by 58% of rural households as a cooking fuel, whereas in urban areas the
use of wood decreases to 15% (Figure 3.2). Wood’s dominance in rural areas is due to the population’s
proximity to forests, grasslands, and agricultural lands. The other major fuel across rural areas is
agricultural waste, which largely accounts for the “Other” category in Figure 3.2. In urban areas, while
wood is still the main fuel, solid fuel users rely much more heavily on charcoal and coal.
In terms of modern fuels, LPG is the primary modern fuel globally, followed by much smaller
electric and kerosene cooking segments. LPG is the fuel of choice for roughly one-third of
developing world households. It is the dominant fuel in urban areas (53%) and has a significant (12%)
footprint in rural and peri-urban markets. Electricity and kerosene account for the balance of modern
fuel use at roughly 3% each of the total fuel mix. While these usage levels may appear negligible at
the global level of aggregation, at the country level, the less common fuels can be hugely important.
In the case of electricity, for example, electric stoves serve as the primary urban cooking technology
for significant portions of the population in select markets in Africa (South Africa, 85% of urban
households, Zimbabwe, 73%, Namibia, 67%, Zambia, 39%), Asia (Mongolia, 40%, PNG, 17%, China,
9–13%, Myanmar, 10%), and Latin America (Honduras, 34%, Colombia, 12%).
Underneath these global trends, regional and country level variation is stark. Latin America and East
Asia feature large rural LPG populations whereas the fuel is less common in rural South Asia and almost
entirely absent in rural Africa (Figure 3.3). Agricultural waste in rural East Asia, captured under the “Other”
fuel category in Figure 3.3, and animal dung in rural South Asia, likewise, the major portion of the 24% in
the region’s “Other” fuel category in Figure 3.3, are mainstream fuels, but are marginal elsewhere in the
world. The use of kerosene for cooking in urban areas is somewhat common in Sub-Saharan Africa (14%
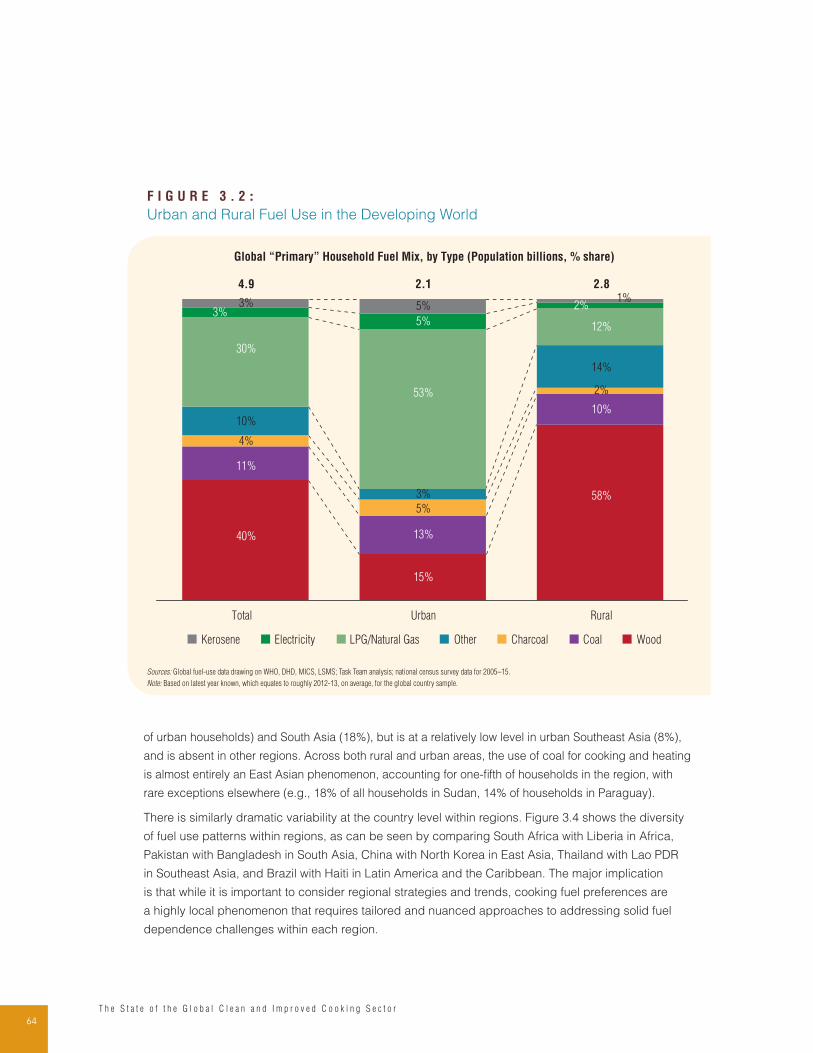
64T h e S t a t e o f t h e G l o b a l C l e a n a n d I m p r o v e d C o o k i n g S e c t o r
of urban households) and South Asia (18%), but is at a relatively low level in urban Southeast Asia (8%),
and is absent in other regions. Across both rural and urban areas, the use of coal for cooking and heating
is almost entirely an East Asian phenomenon, accounting for one-fifth of households in the region, with
rare exceptions elsewhere (e.g., 18% of all households in Sudan, 14% of households in Paraguay).
There is similarly dramatic variability at the country level within regions. Figure 3.4 shows the diversity
of fuel use patterns within regions, as can be seen by comparing South Africa with Liberia in Africa,
Pakistan with Bangladesh in South Asia, China with North Korea in East Asia, Thailand with Lao PDR
in Southeast Asia, and Brazil with Haiti in Latin America and the Caribbean. The major implication
is that while it is important to consider regional strategies and trends, cooking fuel preferences are
a highly local phenomenon that requires tailored and nuanced approaches to addressing solid fuel
dependence challenges within each region.
F I G U R E 3 . 2 :
Urban and Rural Fuel Use in the Developing World
10%
11%
30%
RuralUrbanTotal
4.9
4%
40%
3%3%
Global “Primary” Household Fuel Mix, by Type (Population billions, % share)
Kerosene Electricity LPG/Natural Gas Other Charcoal Coal Wood
15%
58%
13%
10%
14%
53%
12%
5%
5%
5%
2%
2%
2.8
1%
2.1
3%
Sources: Global fuel-use data drawing on WHO, DHD, MICS, LSMS; Task Team analysis; national census survey data for 2005–15.
Note: Based on latest year known, which equates to roughly 2012-13, on average, for the global country sample.
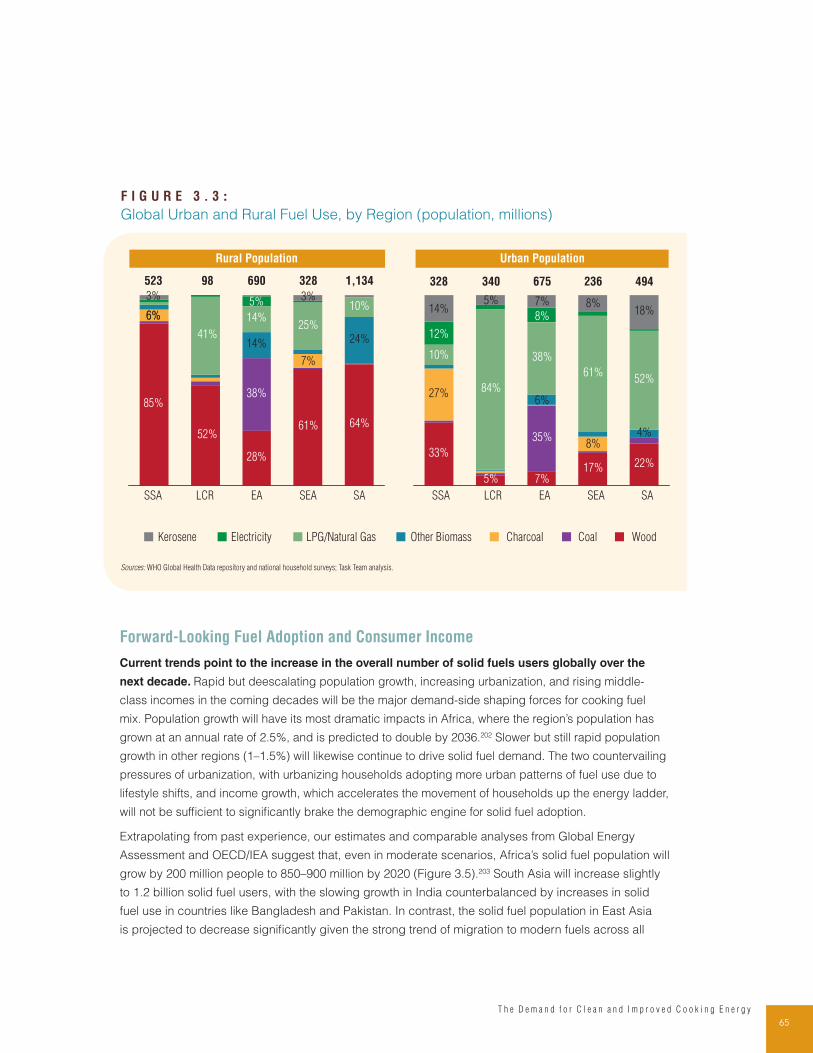
65T h e D e m a n d f o r C l e a n a n d I m p r o v e d C o o k i n g E n e r g y
Forward-Looking Fuel Adoption and Consumer Income
Current trends point to the increase in the overall number of solid fuels users globally over the
next decade. Rapid but deescalating population growth, increasing urbanization, and rising middle-
class incomes in the coming decades will be the major demand-side shaping forces for cooking fuel
mix. Population growth will have its most dramatic impacts in Africa, where the region’s population has
grown at an annual rate of 2.5%, and is predicted to double by 2036.202 Slower but still rapid population
growth in other regions (1–1.5%) will likewise continue to drive solid fuel demand. The two countervailing
pressures of urbanization, with urbanizing households adopting more urban patterns of fuel use due to
lifestyle shifts, and income growth, which accelerates the movement of households up the energy ladder,
will not be sufficient to significantly brake the demographic engine for solid fuel adoption.
Extrapolating from past experience, our estimates and comparable analyses from Global Energy
Assessment and OECD/IEA suggest that, even in moderate scenarios, Africa’s solid fuel population will
grow by 200 million people to 850–900 million by 2020 (Figure 3.5).203 South Asia will increase slightly
to 1.2 billion solid fuel users, with the slowing growth in India counterbalanced by increases in solid
fuel use in countries like Bangladesh and Pakistan. In contrast, the solid fuel population in East Asia
is projected to decrease significantly given the strong trend of migration to modern fuels across all
F I G U R E 3 . 3 :
Global Urban and Rural Fuel Use, by Region (population, millions)
33%
17%
84%
38%
61%52%
14%5% 7% 8%
18%
22%
5% 7%
35%8%
27%
4%
6%
10%
8%
12%
494236675340328
85%
52%
28%
61% 64%
41%
14%25%
10%
38%
6%6%
7%
24%14%
5%
1,134690 32898523
3%3%
Rural Population Urban Population
SAEA SEASSA LCR SAEA SEASSA LCR
Kerosene Electricity LPG/Natural Gas Other Biomass Charcoal Coal Wood
Sources: WHO Global Health Data repository and national household surveys; Task Team analysis.
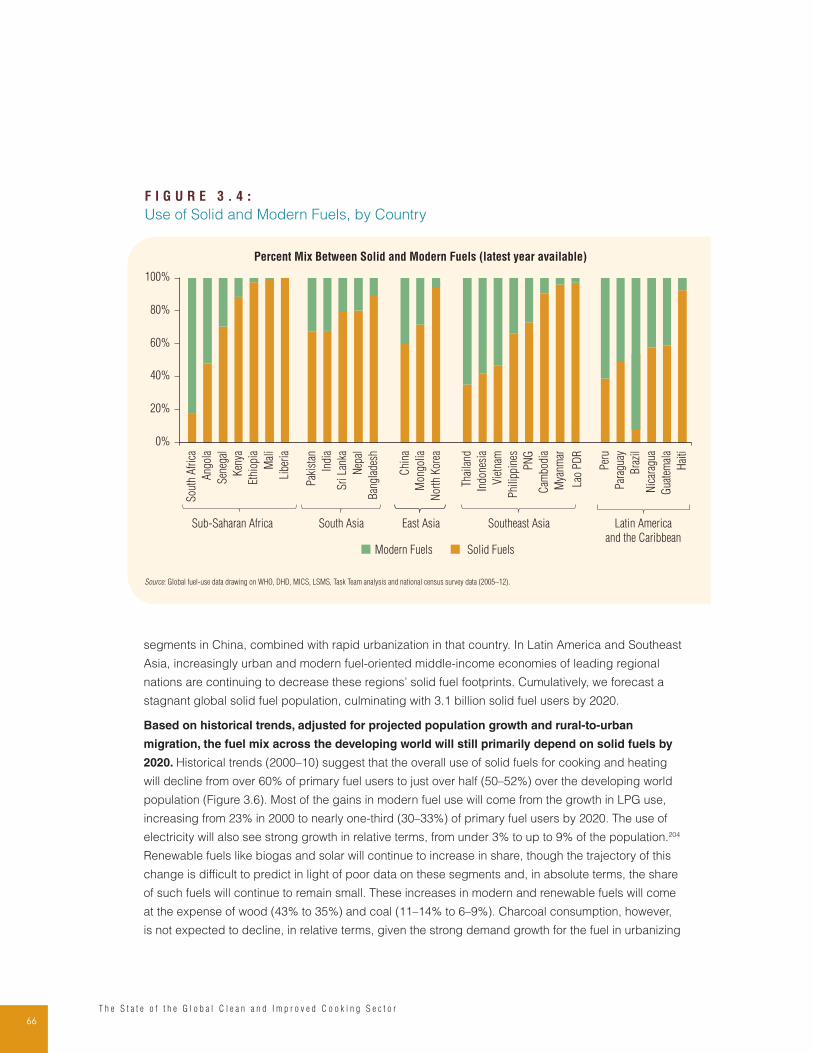
66T h e S t a t e o f t h e G l o b a l C l e a n a n d I m p r o v e d C o o k i n g S e c t o r
segments in China, combined with rapid urbanization in that country. In Latin America and Southeast
Asia, increasingly urban and modern fuel-oriented middle-income economies of leading regional
nations are continuing to decrease these regions’ solid fuel footprints. Cumulatively, we forecast a
stagnant global solid fuel population, culminating with 3.1 billion solid fuel users by 2020.
Based on historical trends, adjusted for projected population growth and rural-to-urban
migration, the fuel mix across the developing world will still primarily depend on solid fuels by
2020. Historical trends (2000–10) suggest that the overall use of solid fuels for cooking and heating
will decline from over 60% of primary fuel users to just over half (50–52%) over the developing world
population (Figure 3.6). Most of the gains in modern fuel use will come from the growth in LPG use,
increasing from 23% in 2000 to nearly one-third (30–33%) of primary fuel users by 2020. The use of
electricity will also see strong growth in relative terms, from under 3% to up to 9% of the population.204
Renewable fuels like biogas and solar will continue to increase in share, though the trajectory of this
change is difficult to predict in light of poor data on these segments and, in absolute terms, the share
of such fuels will continue to remain small. These increases in modern and renewable fuels will come
at the expense of wood (43% to 35%) and coal (11–14% to 6–9%). Charcoal consumption, however,
is not expected to decline, in relative terms, given the strong demand growth for the fuel in urbanizing
F I G U R E 3 . 4 :
Use of Solid and Modern Fuels, by Country
Percent Mix Between Solid and Modern Fuels (latest year available)
20%
0%
100%
80%
60%
40%
Phi
lippi
nes
Vie
tnam
Indo
nesi
a
Gua
tem
ala
Sou
th A
fric
a
Hai
ti
Bra
zil
Nic
arag
ua
Cam
bodi
a
PN
G
Per
u
Par
agua
y
Lao
PD
R
Mya
nmar
Thai
land
Ban
glad
esh
Libe
ria
Mon
golia
Chi
na
Nor
th K
orea
Indi
a
Sri
Lan
ka
Pak
ista
n
Ang
ola
Ken
ya
Nep
al
Sen
egal
Ethi
opia
Mal
i
East AsiaSouth AsiaSub-Saharan Africa Southeast Asia Latin America
and the Caribbean Modern Fuels Solid Fuels
Source: Global fuel-use data drawing on WHO, DHD, MICS, LSMS, Task Team analysis and national census survey data (2005–12).
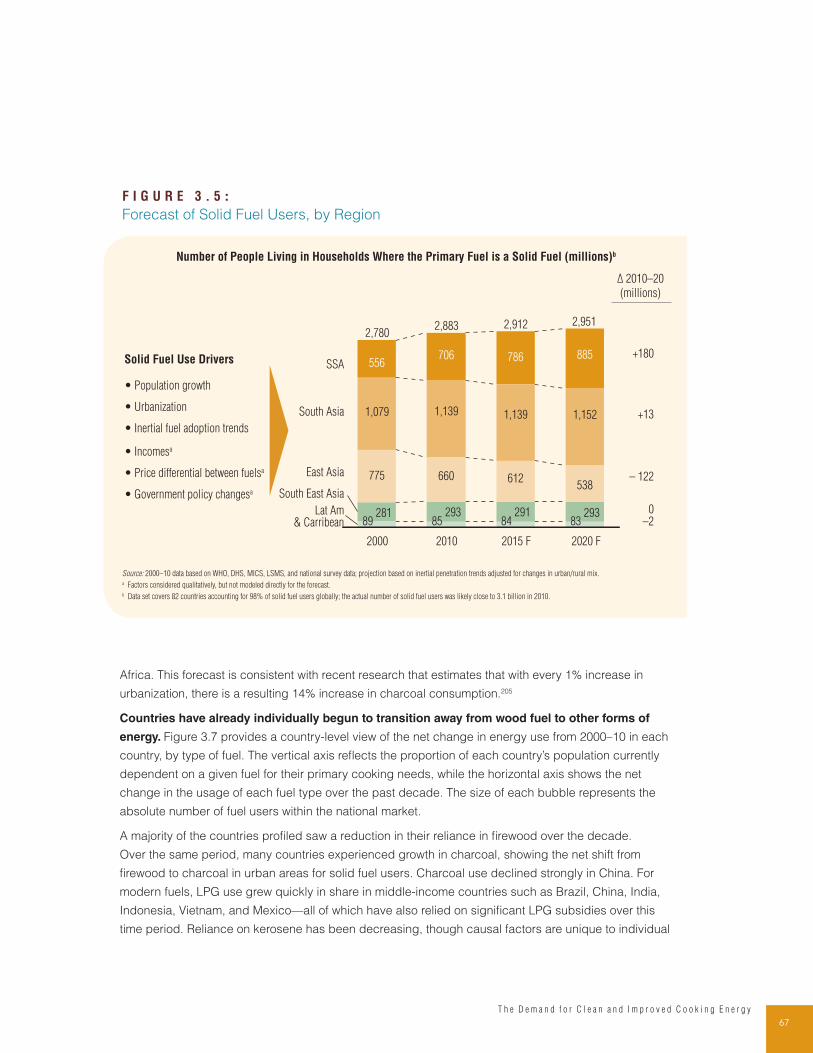
67T h e D e m a n d f o r C l e a n a n d I m p r o v e d C o o k i n g E n e r g y
Africa. This forecast is consistent with recent research that estimates that with every 1% increase in
urbanization, there is a resulting 14% increase in charcoal consumption.205
Countries have already individually begun to transition away from wood fuel to other forms of
energy. Figure 3.7 provides a country-level view of the net change in energy use from 2000–10 in each
country, by type of fuel. The vertical axis reflects the proportion of each country’s population currently
dependent on a given fuel for their primary cooking needs, while the horizontal axis shows the net
change in the usage of each fuel type over the past decade. The size of each bubble represents the
absolute number of fuel users within the national market.
A majority of the countries profiled saw a reduction in their reliance in firewood over the decade.
Over the same period, many countries experienced growth in charcoal, showing the net shift from
firewood to charcoal in urban areas for solid fuel users. Charcoal use declined strongly in China. For
modern fuels, LPG use grew quickly in share in middle-income countries such as Brazil, China, India,
Indonesia, Vietnam, and Mexico—all of which have also relied on significant LPG subsidies over this
time period. Reliance on kerosene has been decreasing, though causal factors are unique to individual
F I G U R E 3 . 5 :
Forecast of Solid Fuel Users, by Region
Number of People Living in Households Where the Primary Fuel is a Solid Fuel (millions)b
281 293 291 293
775 660 612538
1,079 1,139 1,139 1,152
556706 786 885
Lat Am& Carribean
South East Asia
2015 F
2,912
84
2010
2,883
85
2000
2,780
89
2,951
2020 F
SSA
South Asia
East Asia
83
+180
+13
– 122
0–2
Solid Fuel Use Drivers
• Population growth
• Urbanization
• Inertial fuel adoption trends
• Incomesa
• Price differential between fuelsa
• Government policy changesa
Δ 2010–20
(millions)
Source: 2000–10 data based on WHO, DHS, MICS, LSMS, and national survey data; projection based on inertial penetration trends adjusted for changes in urban/rural mix.a Factors considered qualitatively, but not modeled directly for the forecast.b Data set covers 82 countries accounting for 98% of solid fuel users globally; the actual number of solid fuel users was likely close to 3.1 billion in 2010.
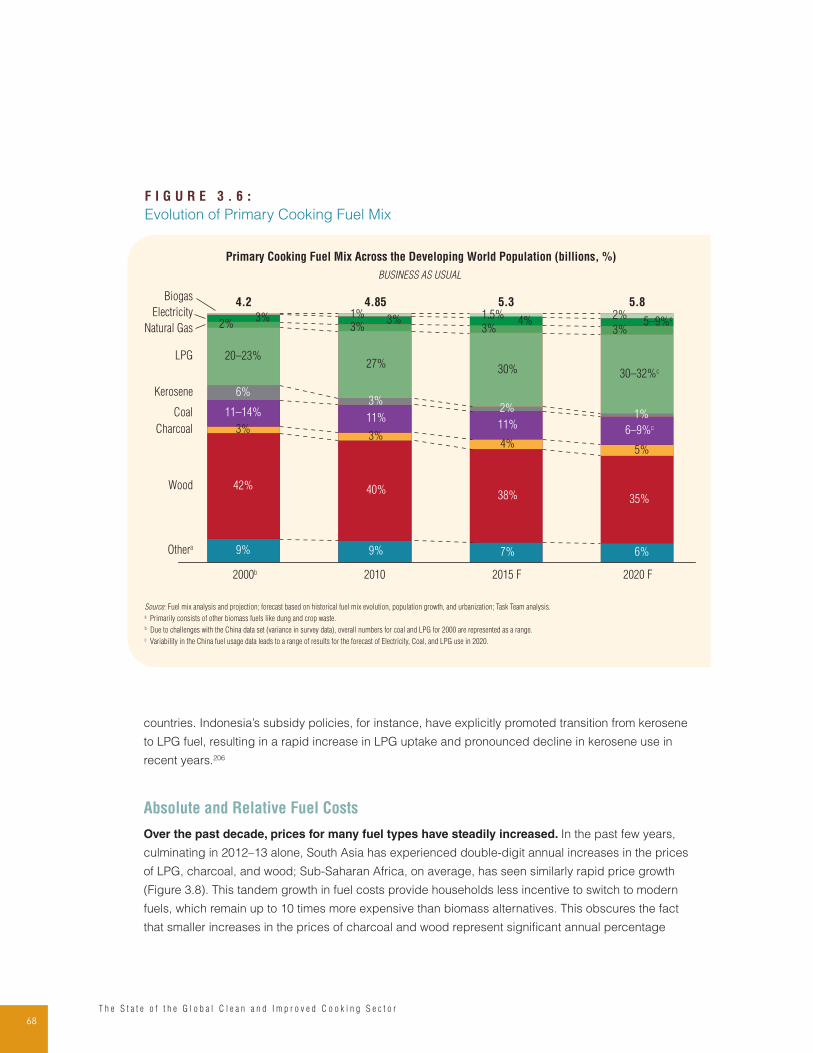
68T h e S t a t e o f t h e G l o b a l C l e a n a n d I m p r o v e d C o o k i n g S e c t o r
countries. Indonesia’s subsidy policies, for instance, have explicitly promoted transition from kerosene
to LPG fuel, resulting in a rapid increase in LPG uptake and pronounced decline in kerosene use in
recent years.206
Absolute and Relative Fuel Costs
Over the past decade, prices for many fuel types have steadily increased. In the past few years,
culminating in 2012–13 alone, South Asia has experienced double-digit annual increases in the prices
of LPG, charcoal, and wood; Sub-Saharan Africa, on average, has seen similarly rapid price growth
(Figure 3.8). This tandem growth in fuel costs provide households less incentive to switch to modern
fuels, which remain up to 10 times more expensive than biomass alternatives. This obscures the fact
that smaller increases in the prices of charcoal and wood represent significant annual percentage
F I G U R E 3 . 6 :
Evolution of Primary Cooking Fuel Mix
9% 9% 7% 6%
42% 40%38% 35%
4%5%
11–14%11%
11%6–9%c
20–23%27%
30% 30–32%c
6%
Coal
LPG
1%
5–9%c2%
2%5.3 5.8
2%
4%1.5%
4.85
3%
3%
3%1%
4.2
3%
3%3% 3% 3%
Othera
Wood
Charcoal
Kerosene
2020 F2015 F20102000b
Primary Cooking Fuel Mix Across the Developing World Population (billions, %)
BUSINESS AS USUAL
Biogas
Electricity
Natural Gas
Source: Fuel mix analysis and projection; forecast based on historical fuel mix evolution, population growth, and urbanization; Task Team analysis.a Primarily consists of other biomass fuels like dung and crop waste.b Due to challenges with the China data set (variance in survey data), overall numbers for coal and LPG for 2000 are represented as a range.c Variability in the China fuel usage data leads to a range of results for the forecast of Electricity, Coal, and LPG use in 2020.
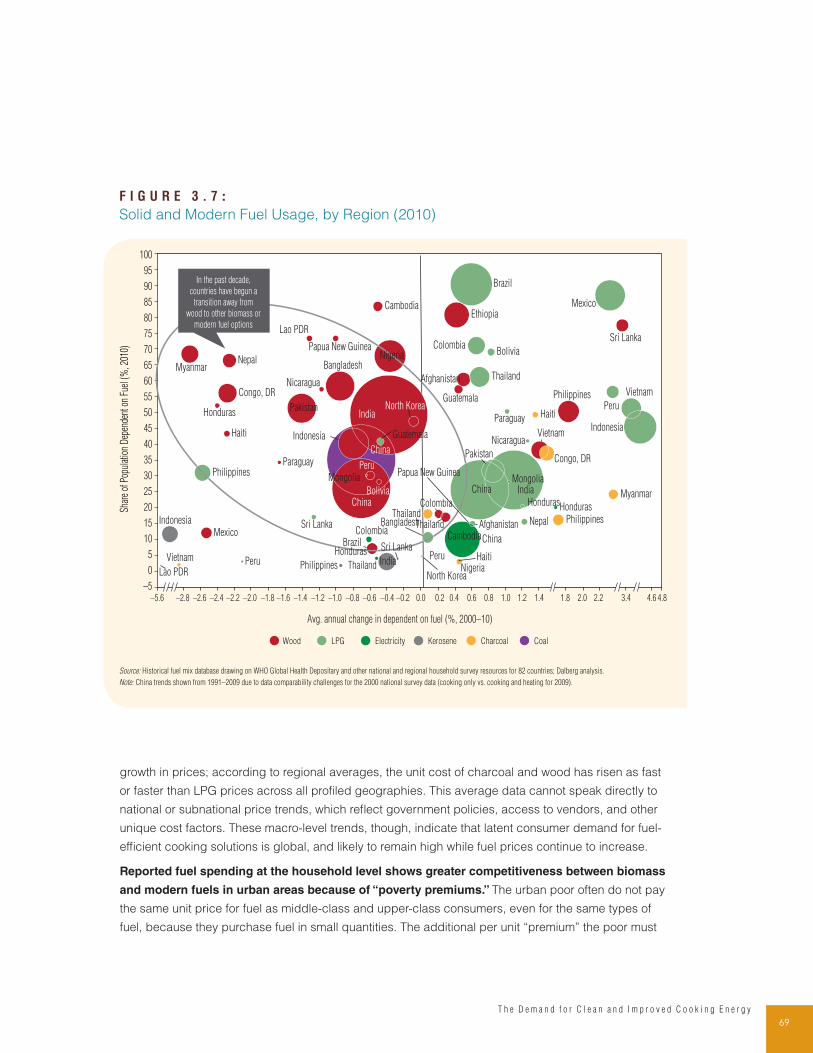
69T h e D e m a n d f o r C l e a n a n d I m p r o v e d C o o k i n g E n e r g y
growth in prices; according to regional averages, the unit cost of charcoal and wood has risen as fast
or faster than LPG prices across all profiled geographies. This average data cannot speak directly to
national or subnational price trends, which reflect government policies, access to vendors, and other
unique cost factors. These macro-level trends, though, indicate that latent consumer demand for fuel-
efficient cooking solutions is global, and likely to remain high while fuel prices continue to increase.
Reported fuel spending at the household level shows greater competitiveness between biomass
and modern fuels in urban areas because of “poverty premiums.” The urban poor often do not pay
the same unit price for fuel as middle-class and upper-class consumers, even for the same types of
fuel, because they purchase fuel in small quantities. The additional per unit “premium” the poor must
F I G U R E 3 . 7 :
Solid and Modern Fuel Usage, by Region (2010)
China
Nigeria
Nigeria
Congo, DR
Congo, DR
Ethiopia
Vietnam
ThailandPhilippines
Myanmar
Lao PDR
Haiti
Sri Lanka
PhilippinesPeru
Papua New Guinea
Indonesia
IndiaHonduras
HaitiThailand
Peru
Mongolia
Honduras
ColombiaChina
Vietnam
Thailand
Sri Lanka
Philippines
Peru
Paraguay
Pakistan
Nicaragua
Nepal
Mexico
North Korea
Indonesia
India
Honduras
Guatemala
Colombia
China
CambodiaAfghanistan
Brazil
Bolivia
Bangladesh
Vietnam
Thailand
Sri Lanka
Philippines
PeruParaguay
Papua New Guinea
Pakistan
Nicaragua
NepalMyanmar
Mongolia
Mexico
North Korea
Lao PDR
Indonesia
IndiaHonduras
Haiti
Guatemala
ColombiaChina
Cambodia
Afghanistan
Brazil
Bolivia
Bangladesh
Avg. annual change in dependent on fuel (%, 2000–10)
Charcoal CoalElectricityLPG KeroseneWood
In the past decade,
countries have begun a
transition away from
wood to other biomass or
modern fuel options
Sha
re o
f Pop
ulat
ion
Dep
ende
nt o
n Fu
el (
%, 2
010)
–5
0
5
10
15
20
25
30
35
40
45
50
55
60
65
70
75
80
85
90
95
100
0.60.40.20.0–0.2–0.4–0.6–0.8–1.0–1.2–1.6–1.8–2.0–2.2–2.4–2.6–2.8–5.6 –1.4 4.84.63.42.22.01.81.41.21.00.8
Source: Historical fuel mix database drawing on WHO Global Health Depositary and other national and regional household survey resources for 82 countries; Dalberg analysis.
Note: China trends shown from 1991–2009 due to data comparability challenges for the 2000 national survey data (cooking only vs. cooking and heating for 2009).
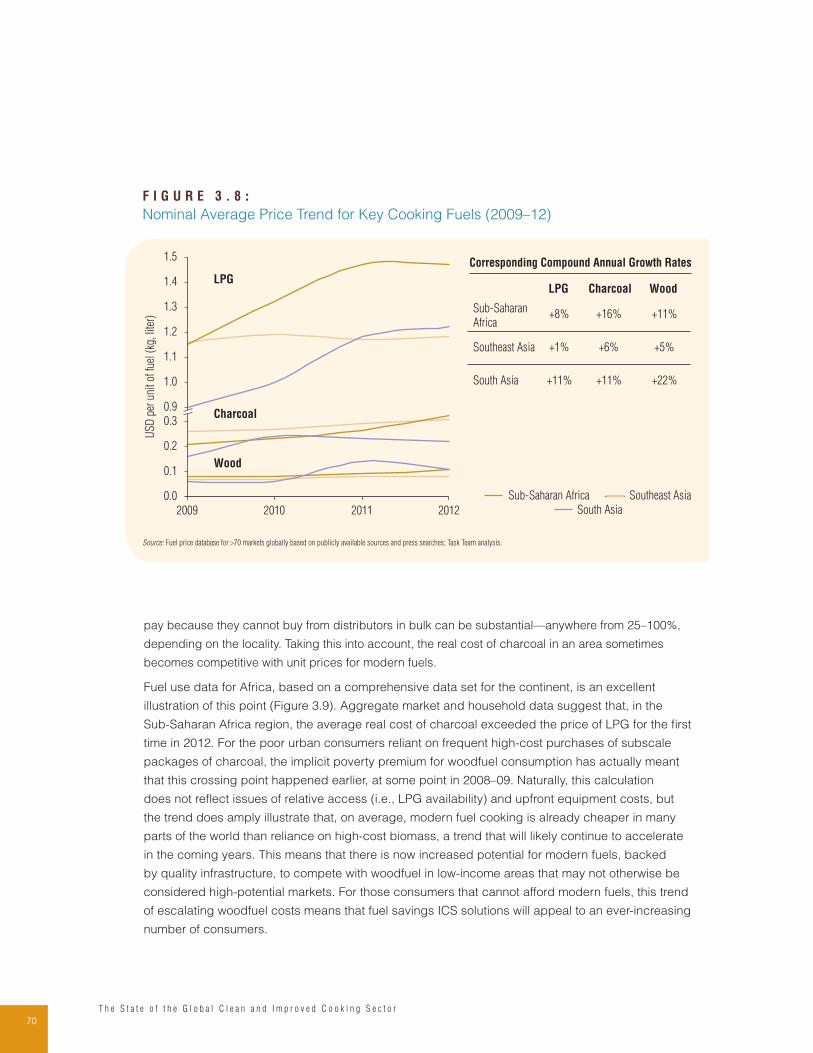
70T h e S t a t e o f t h e G l o b a l C l e a n a n d I m p r o v e d C o o k i n g S e c t o r
pay because they cannot buy from distributors in bulk can be substantial—anywhere from 25–100%,
depending on the locality. Taking this into account, the real cost of charcoal in an area sometimes
becomes competitive with unit prices for modern fuels.
Fuel use data for Africa, based on a comprehensive data set for the continent, is an excellent
illustration of this point (Figure 3.9). Aggregate market and household data suggest that, in the
Sub-Saharan Africa region, the average real cost of charcoal exceeded the price of LPG for the first
time in 2012. For the poor urban consumers reliant on frequent high-cost purchases of subscale
packages of charcoal, the implicit poverty premium for woodfuel consumption has actually meant
that this crossing point happened earlier, at some point in 2008–09. Naturally, this calculation
does not reflect issues of relative access (i.e., LPG availability) and upfront equipment costs, but
the trend does amply illustrate that, on average, modern fuel cooking is already cheaper in many
parts of the world than reliance on high-cost biomass, a trend that will likely continue to accelerate
in the coming years. This means that there is now increased potential for modern fuels, backed
by quality infrastructure, to compete with woodfuel in low-income areas that may not otherwise be
considered high-potential markets. For those consumers that cannot afford modern fuels, this trend
of escalating woodfuel costs means that fuel savings ICS solutions will appeal to an ever-increasing
number of consumers.
F I G U R E 3 . 8 :
Nominal Average Price Trend for Key Cooking Fuels (2009–12)
Sub-Saharan Africa Southeast Asia
South Asia2009 2010 2011 2012
1.2
1.0
0.3
1.4
1.3
0.1
1.1
0.0
0.9
0.2
1.5
LPG
Charcoal
Wood
LPG Charcoal Wood
Sub-Saharan
Africa +8% +16% +11%
+1% +6% +5%
South Asia +11% +11% +22%
Corresponding Compound Annual Growth Rates
Southeast Asia
US
D p
er u
nit o
f fue
l (kg
, lite
r)
Source: Fuel price database for >70 markets globally based on publicly available sources and press searches; Task Team analysis.
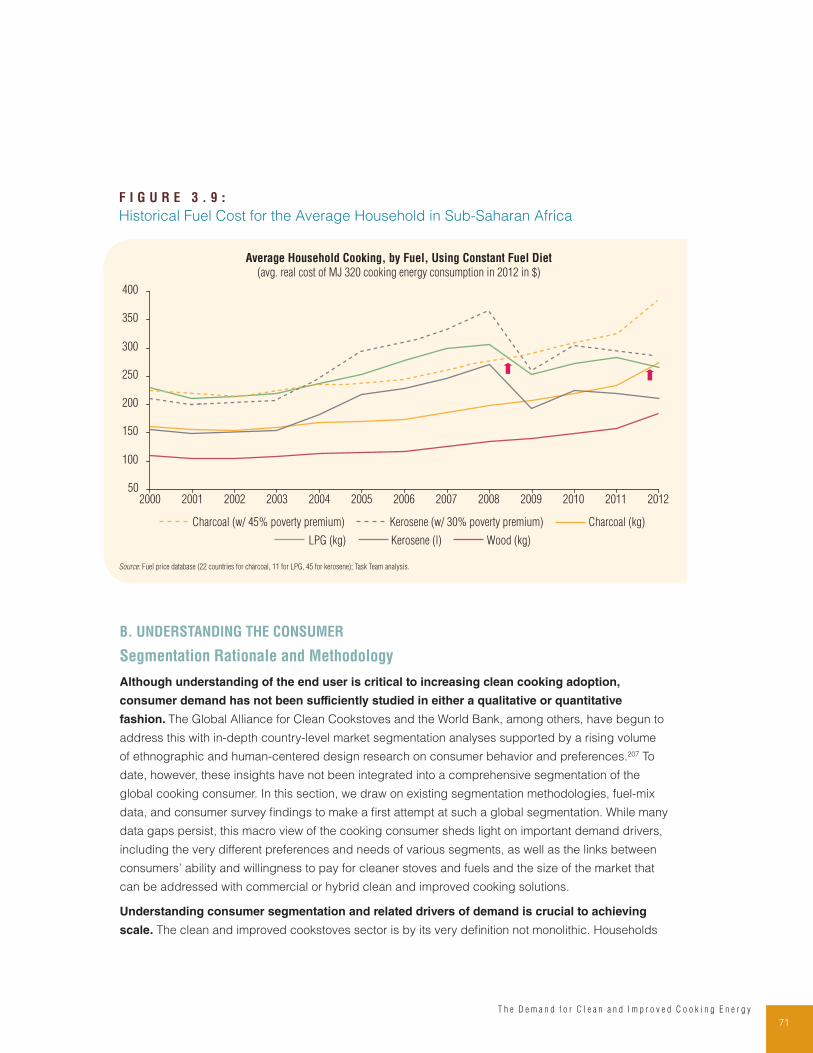
71T h e D e m a n d f o r C l e a n a n d I m p r o v e d C o o k i n g E n e r g y
B. UNDERSTANDING THE CONSUMER
Segmentation Rationale and Methodology
Although understanding of the end user is critical to increasing clean cooking adoption,
consumer demand has not been sufficiently studied in either a qualitative or quantitative
fashion. The Global Alliance for Clean Cookstoves and the World Bank, among others, have begun to
address this with in-depth country-level market segmentation analyses supported by a rising volume
of ethnographic and human-centered design research on consumer behavior and preferences.207 To
date, however, these insights have not been integrated into a comprehensive segmentation of the
global cooking consumer. In this section, we draw on existing segmentation methodologies, fuel-mix
data, and consumer survey findings to make a first attempt at such a global segmentation. While many
data gaps persist, this macro view of the cooking consumer sheds light on important demand drivers,
including the very different preferences and needs of various segments, as well as the links between
consumers’ ability and willingness to pay for cleaner stoves and fuels and the size of the market that
can be addressed with commercial or hybrid clean and improved cooking solutions.
Understanding consumer segmentation and related drivers of demand is crucial to achieving
scale. The clean and improved cookstoves sector is by its very definition not monolithic. Households
F I G U R E 3 . 9 :
Historical Fuel Cost for the Average Household in Sub-Saharan Africa
Charcoal (w/ 45% poverty premium) Kerosene (w/ 30% poverty premium) Charcoal (kg)
LPG (kg) Kerosene (l) Wood (kg)
400
350
300
250
200
150
100
502012201120102009200820072006200520042003200220012000
Average Household Cooking, by Fuel, Using Constant Fuel Diet
(avg. real cost of MJ 320 cooking energy consumption in 2012 in $)
Source: Fuel price database (22 countries for charcoal, 11 for LPG, 45 for kerosene); Task Team analysis.
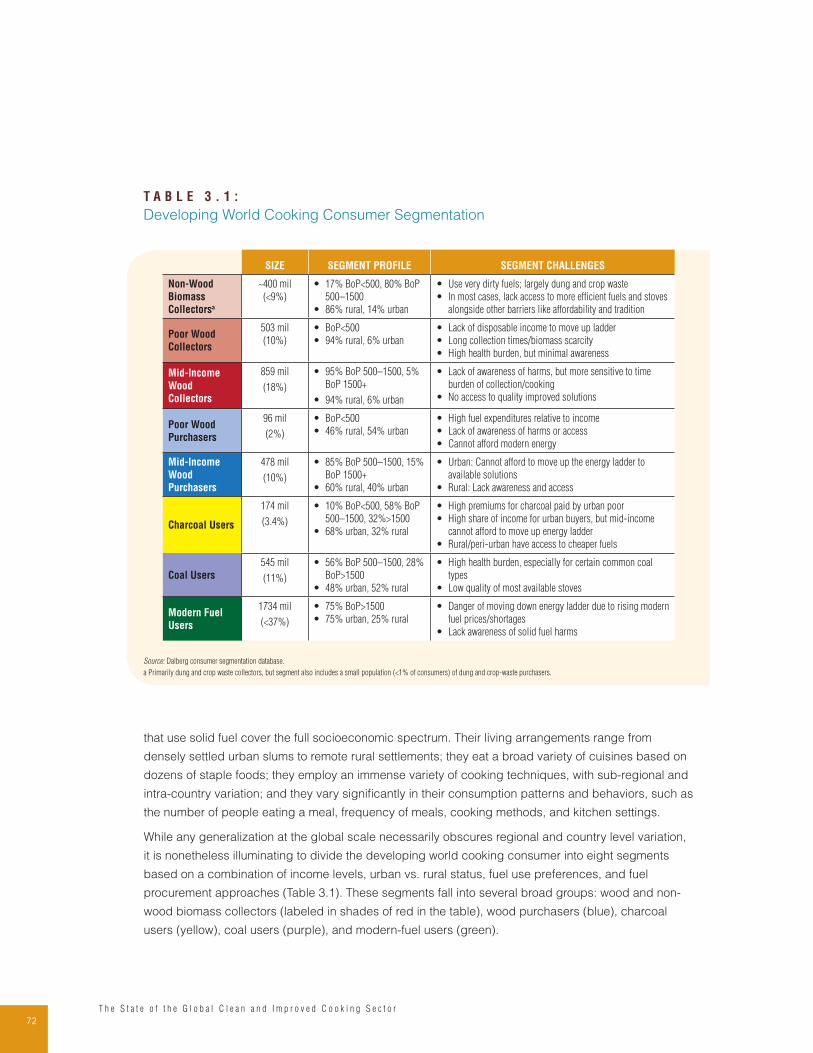
72T h e S t a t e o f t h e G l o b a l C l e a n a n d I m p r o v e d C o o k i n g S e c t o r
that use solid fuel cover the full socioeconomic spectrum. Their living arrangements range from
densely settled urban slums to remote rural settlements; they eat a broad variety of cuisines based on
dozens of staple foods; they employ an immense variety of cooking techniques, with sub-regional and
intra-country variation; and they vary significantly in their consumption patterns and behaviors, such as
the number of people eating a meal, frequency of meals, cooking methods, and kitchen settings.
While any generalization at the global scale necessarily obscures regional and country level variation,
it is nonetheless illuminating to divide the developing world cooking consumer into eight segments
based on a combination of income levels, urban vs. rural status, fuel use preferences, and fuel
procurement approaches (Table 3.1). These segments fall into several broad groups: wood and non-
wood biomass collectors (labeled in shades of red in the table), wood purchasers (blue), charcoal
users (yellow), coal users (purple), and modern-fuel users (green).
T A B L E 3 . 1 :
Developing World Cooking Consumer Segmentation
SIZE SEGMENT PROFILE SEGMENT CHALLENGES
Non-Wood
Biomass
Collectorsa
~400 mil
(<9%)
• 17% BoP<500, 80% BoP
500–1500
• 86% rural, 14% urban
• Use very dirty fuels; largely dung and crop waste
• In most cases, lack access to more efficient fuels and stoves
alongside other barriers like affordability and tradition
Poor Wood
Collectors
503 mil
(10%)
• BoP<500
• 94% rural, 6% urban
• Lack of disposable income to move up ladder
• Long collection times/biomass scarcity
• High health burden, but minimal awareness
Mid-Income
Wood
Collectors
859 mil
(18%)
• 95% BoP 500–1500, 5%
BoP 1500+
• 94% rural, 6% urban
• Lack of awareness of harms, but more sensitive to time
burden of collection/cooking
• No access to quality improved solutions
Poor Wood
Purchasers
96 mil
(2%)
• BoP<500
• 46% rural, 54% urban
• High fuel expenditures relative to income
• Lack of awareness of harms or access
• Cannot afford modern energy
Mid-Income
Wood
Purchasers
478 mil
(10%)
• 85% BoP 500–1500, 15%
BoP 1500+
• 60% rural, 40% urban
• Urban: Cannot afford to move up the energy ladder to
available solutions
• Rural: Lack awareness and access
Charcoal Users
174 mil
(3.4%)
• 10% BoP<500, 58% BoP
500–1500, 32%>1500
• 68% urban, 32% rural
• High premiums for charcoal paid by urban poor
• High share of income for urban buyers, but mid-income
cannot afford to move up energy ladder
• Rural/peri-urban have access to cheaper fuels
Coal Users
545 mil
(11%)
• 56% BoP 500–1500, 28%
BoP>1500
• 48% urban, 52% rural
• High health burden, especially for certain common coal
types
• Low quality of most available stoves
Modern Fuel
Users
1734 mil
(<37%)
• 75% BoP>1500
• 75% urban, 25% rural
• Danger of moving down energy ladder due to rising modern
fuel prices/shortages
• Lack awareness of solid fuel harms
Source: Dalberg consumer segmentation database.
a Primarily dung and crop waste collectors, but segment also includes a small population (<1% of consumers) of dung and crop-waste purchasers.
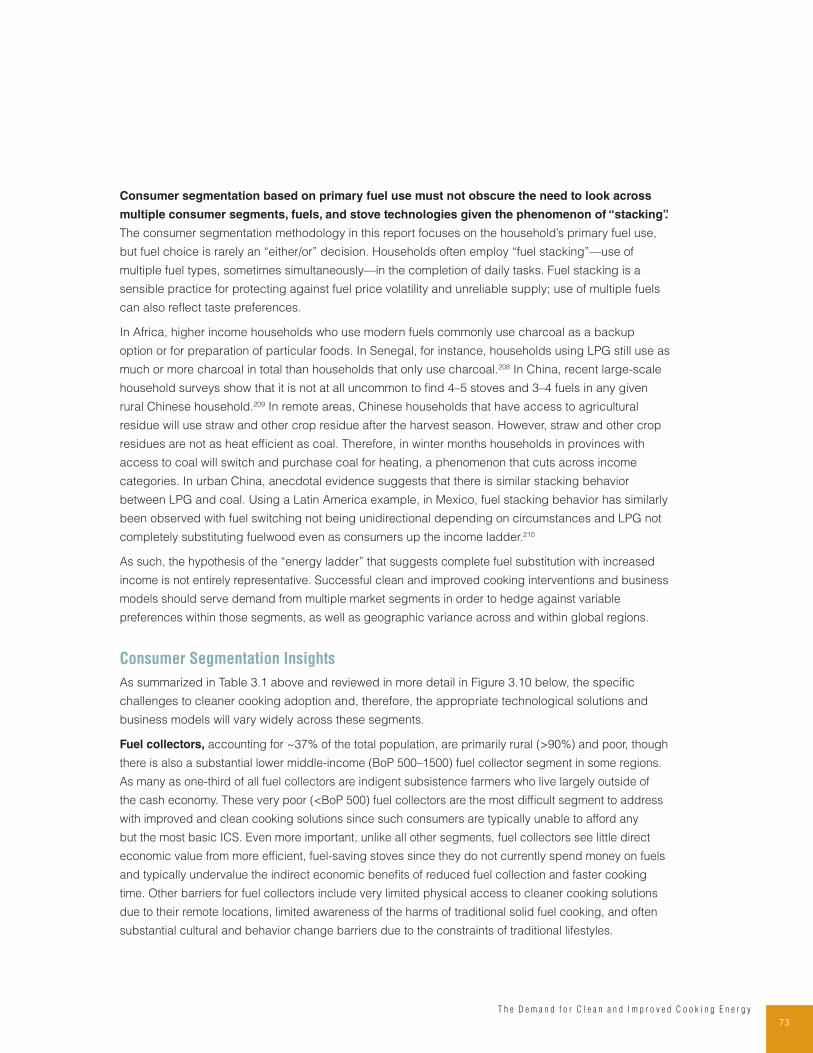
73T h e D e m a n d f o r C l e a n a n d I m p r o v e d C o o k i n g E n e r g y
Consumer segmentation based on primary fuel use must not obscure the need to look across
multiple consumer segments, fuels, and stove technologies given the phenomenon of “stacking”.
The consumer segmentation methodology in this report focuses on the household’s primary fuel use,
but fuel choice is rarely an “either/or” decision. Households often employ “fuel stacking”—use of
multiple fuel types, sometimes simultaneously—in the completion of daily tasks. Fuel stacking is a
sensible practice for protecting against fuel price volatility and unreliable supply; use of multiple fuels
can also reflect taste preferences.
In Africa, higher income households who use modern fuels commonly use charcoal as a backup
option or for preparation of particular foods. In Senegal, for instance, households using LPG still use as
much or more charcoal in total than households that only use charcoal.208 In China, recent large-scale
household surveys show that it is not at all uncommon to find 4–5 stoves and 3–4 fuels in any given
rural Chinese household.209 In remote areas, Chinese households that have access to agricultural
residue will use straw and other crop residue after the harvest season. However, straw and other crop
residues are not as heat efficient as coal. Therefore, in winter months households in provinces with
access to coal will switch and purchase coal for heating, a phenomenon that cuts across income
categories. In urban China, anecdotal evidence suggests that there is similar stacking behavior
between LPG and coal. Using a Latin America example, in Mexico, fuel stacking behavior has similarly
been observed with fuel switching not being unidirectional depending on circumstances and LPG not
completely substituting fuelwood even as consumers up the income ladder.210
As such, the hypothesis of the “energy ladder” that suggests complete fuel substitution with increased
income is not entirely representative. Successful clean and improved cooking interventions and business
models should serve demand from multiple market segments in order to hedge against variable
preferences within those segments, as well as geographic variance across and within global regions.
Consumer Segmentation Insights
As summarized in Table 3.1 above and reviewed in more detail in Figure 3.10 below, the specific
challenges to cleaner cooking adoption and, therefore, the appropriate technological solutions and
business models will vary widely across these segments.
Fuel collectors, accounting for ~37% of the total population, are primarily rural (>90%) and poor, though
there is also a substantial lower middle-income (BoP 500–1500) fuel collector segment in some regions.
As many as one-third of all fuel collectors are indigent subsistence farmers who live largely outside of
the cash economy. These very poor (<BoP 500) fuel collectors are the most difficult segment to address
with improved and clean cooking solutions since such consumers are typically unable to afford any
but the most basic ICS. Even more important, unlike all other segments, fuel collectors see little direct
economic value from more efficient, fuel-saving stoves since they do not currently spend money on fuels
and typically undervalue the indirect economic benefits of reduced fuel collection and faster cooking
time. Other barriers for fuel collectors include very limited physical access to cleaner cooking solutions
due to their remote locations, limited awareness of the harms of traditional solid fuel cooking, and often
substantial cultural and behavior change barriers due to the constraints of traditional lifestyles.
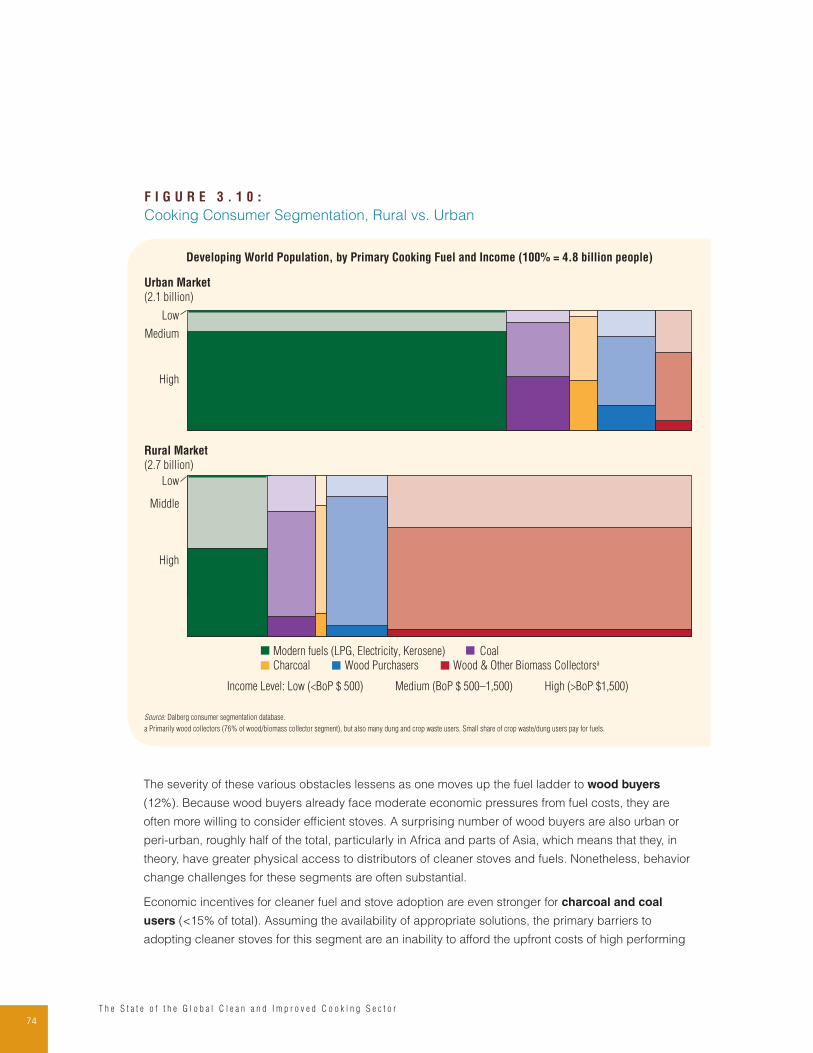
74T h e S t a t e o f t h e G l o b a l C l e a n a n d I m p r o v e d C o o k i n g S e c t o r
The severity of these various obstacles lessens as one moves up the fuel ladder to wood buyers
(12%). Because wood buyers already face moderate economic pressures from fuel costs, they are
often more willing to consider efficient stoves. A surprising number of wood buyers are also urban or
peri-urban, roughly half of the total, particularly in Africa and parts of Asia, which means that they, in
theory, have greater physical access to distributors of cleaner stoves and fuels. Nonetheless, behavior
change challenges for these segments are often substantial.
Economic incentives for cleaner fuel and stove adoption are even stronger for charcoal and coal
users (<15% of total). Assuming the availability of appropriate solutions, the primary barriers to
adopting cleaner stoves for this segment are an inability to afford the upfront costs of high performing
F I G U R E 3 . 1 0 :
Cooking Consumer Segmentation, Rural vs. Urban
Developing World Population, by Primary Cooking Fuel and Income (100% = 4.8 billion people)
High
Middle
Low
High
Medium
Low
Urban Market
(2.1 billion)
Income Level: Low (<BoP $ 500) Medium (BoP $ 500–1,500) High (>BoP $1,500)
Rural Market
(2.7 billion)
Modern fuels (LPG, Electricity, Kerosene) Coal
Charcoal Wood Purchasers Wood & Other Biomass Collectorsa
Source: Dalberg consumer segmentation database.
a Primarily wood collectors (76% of wood/biomass collector segment), but also many dung and crop waste users. Small share of crop waste/dung users pay for fuels.
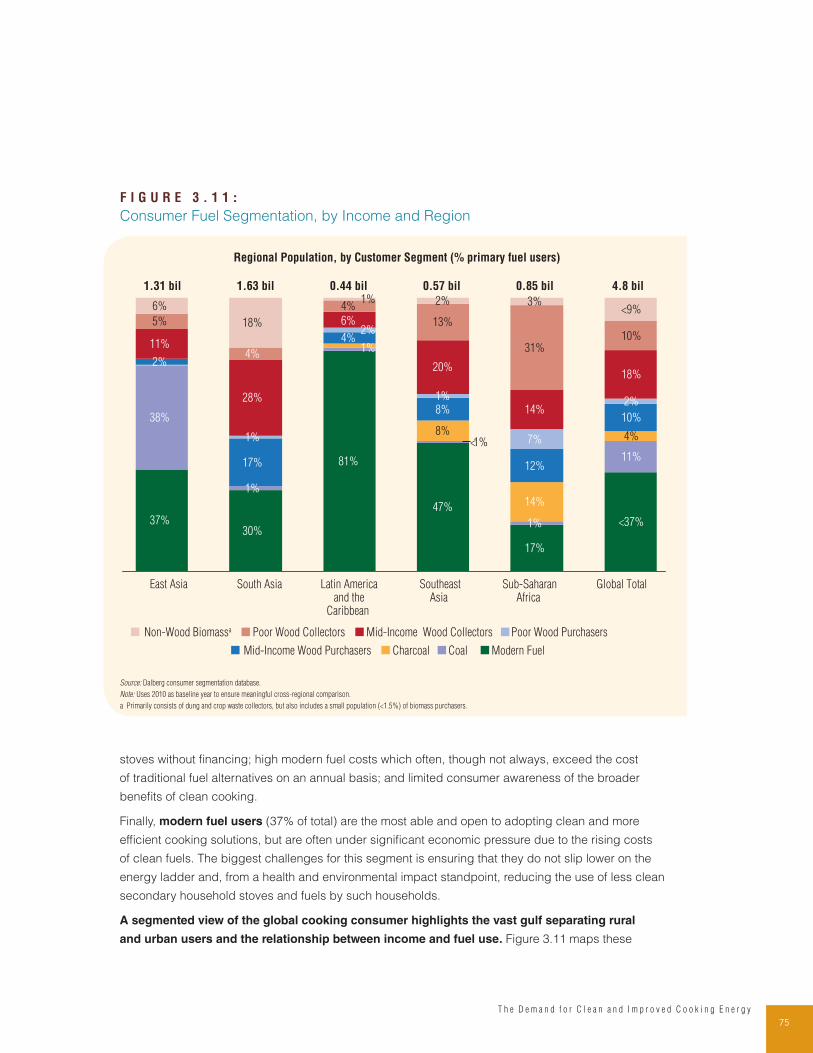
75T h e D e m a n d f o r C l e a n a n d I m p r o v e d C o o k i n g E n e r g y
stoves without financing; high modern fuel costs which often, though not always, exceed the cost
of traditional fuel alternatives on an annual basis; and limited consumer awareness of the broader
benefits of clean cooking.
Finally, modern fuel users (37% of total) are the most able and open to adopting clean and more
efficient cooking solutions, but are often under significant economic pressure due to the rising costs
of clean fuels. The biggest challenges for this segment is ensuring that they do not slip lower on the
energy ladder and, from a health and environmental impact standpoint, reducing the use of less clean
secondary household stoves and fuels by such households.
A segmented view of the global cooking consumer highlights the vast gulf separating rural
and urban users and the relationship between income and fuel use. Figure 3.11 maps these
F I G U R E 3 . 1 1 :
Consumer Fuel Segmentation, by Income and Region
Global TotalSub-SaharanAfrica
SoutheastAsia
Latin Americaand the
Caribbean
South AsiaEast Asia
Non-Wood Biomassa Poor Wood Collectors Mid-Income Wood Collectors Poor Wood Purchasers
Mid-Income Wood Purchasers Charcoal Coal Modern Fuel
Regional Population, by Customer Segment (% primary fuel users)
0.44 bil 1.63 bil 0.57 bil 0.85 bil 4.8 bil 1.31 bil
37%30%
81%
47%
17%
17%
8%
12%
10%
11%
28%
20%
14%
18%
5%
4%
13%
31%10%
6%
18%
11%
38%
14%
8%7%
6%
2%
4%
4%
<9%
1%
<1%
<37%1%
2%
1%
2%
4%
3%1%
1%
2%
1%
Source: Dalberg consumer segmentation database.
Note: Uses 2010 as baseline year to ensure meaningful cross-regional comparison.
a Primarily consists of dung and crop waste collectors, but also includes a small population (<1.5%) of biomass purchasers.
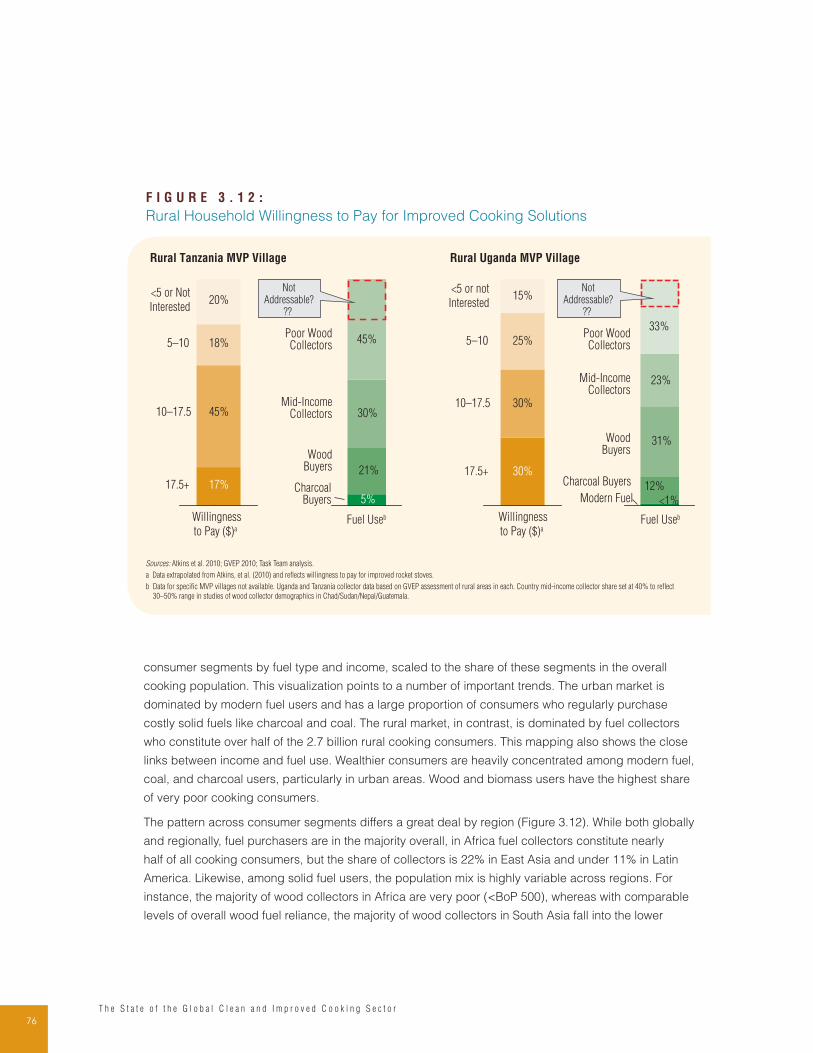
76T h e S t a t e o f t h e G l o b a l C l e a n a n d I m p r o v e d C o o k i n g S e c t o r
consumer segments by fuel type and income, scaled to the share of these segments in the overall
cooking population. This visualization points to a number of important trends. The urban market is
dominated by modern fuel users and has a large proportion of consumers who regularly purchase
costly solid fuels like charcoal and coal. The rural market, in contrast, is dominated by fuel collectors
who constitute over half of the 2.7 billion rural cooking consumers. This mapping also shows the close
links between income and fuel use. Wealthier consumers are heavily concentrated among modern fuel,
coal, and charcoal users, particularly in urban areas. Wood and biomass users have the highest share
of very poor cooking consumers.
The pattern across consumer segments differs a great deal by region (Figure 3.12). While both globally
and regionally, fuel purchasers are in the majority overall, in Africa fuel collectors constitute nearly
half of all cooking consumers, but the share of collectors is 22% in East Asia and under 11% in Latin
America. Likewise, among solid fuel users, the population mix is highly variable across regions. For
instance, the majority of wood collectors in Africa are very poor (<BoP 500), whereas with comparable
levels of overall wood fuel reliance, the majority of wood collectors in South Asia fall into the lower
F I G U R E 3 . 1 2 :
Rural Household Willingness to Pay for Improved Cooking Solutions
CharcoalBuyers
WoodBuyers
Mid-IncomeCollectors
Poor WoodCollectors
WoodBuyers
Mid-IncomeCollectors
Poor WoodCollectors
Fuel Useb
5%
21%
30%
45%
17.5+
10–17.5
5–10
<5 or Not
Interested
17.5+
10–17.5
5–10
<5 or not
Interested
Willingness
to Pay ($)a Fuel UsebWillingness
to Pay ($)a
17%
45%
18%
20%
25%
15%
30%
30%
Modern Fuel
Charcoal Buyers
<1%
12%
31%
23%
33%
Rural Tanzania MVP Village Rural Uganda MVP Village
Not
Addressable?
??
Not
Addressable?
??
Sources: Atkins et al. 2010; GVEP 2010; Task Team analysis.
a Data extrapolated from Atkins, et al. (2010) and reflects willingness to pay for improved rocket stoves.
b Data for specific MVP villages not available. Uganda and Tanzania collector data based on GVEP assessment of rural areas in each. Country mid-income collector share set at 40% to reflect
30–50% range in studies of wood collector demographics in Chad/Sudan/Nepal/Guatemala.
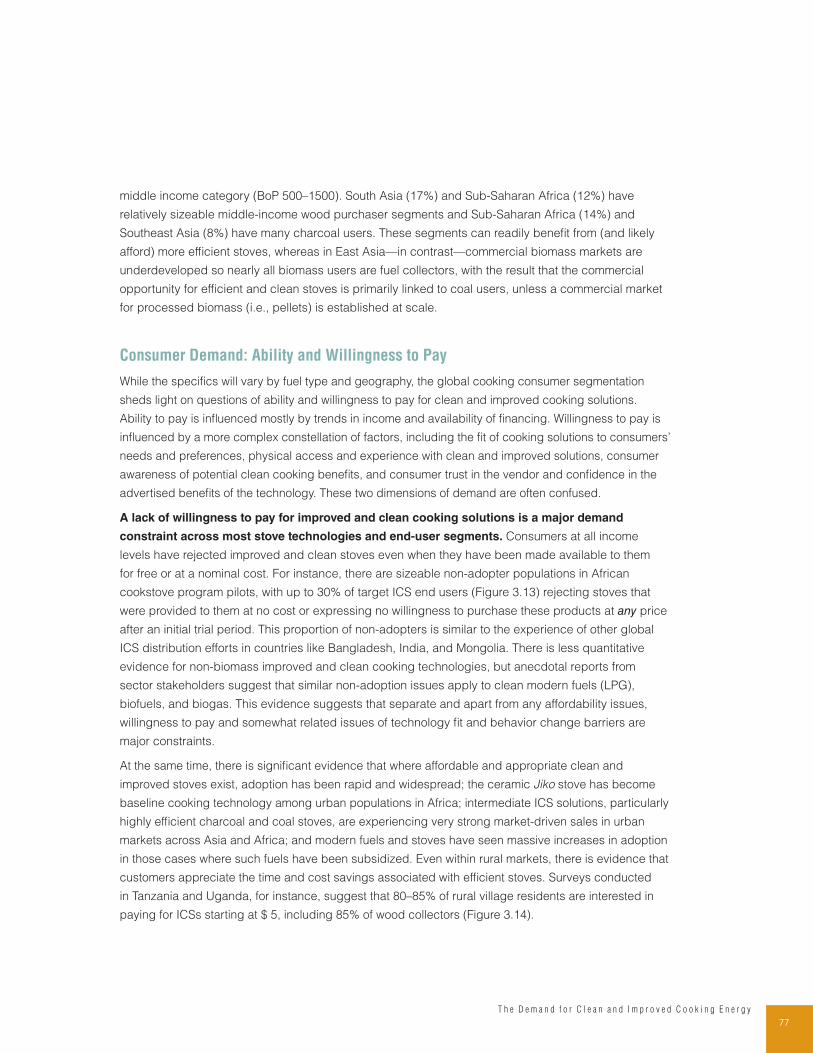
77T h e D e m a n d f o r C l e a n a n d I m p r o v e d C o o k i n g E n e r g y
middle income category (BoP 500–1500). South Asia (17%) and Sub-Saharan Africa (12%) have
relatively sizeable middle-income wood purchaser segments and Sub-Saharan Africa (14%) and
Southeast Asia (8%) have many charcoal users. These segments can readily benefit from (and likely
afford) more efficient stoves, whereas in East Asia—in contrast—commercial biomass markets are
underdeveloped so nearly all biomass users are fuel collectors, with the result that the commercial
opportunity for efficient and clean stoves is primarily linked to coal users, unless a commercial market
for processed biomass (i.e., pellets) is established at scale.
Consumer Demand: Ability and Willingness to Pay
While the specifics will vary by fuel type and geography, the global cooking consumer segmentation
sheds light on questions of ability and willingness to pay for clean and improved cooking solutions.
Ability to pay is influenced mostly by trends in income and availability of financing. Willingness to pay is
influenced by a more complex constellation of factors, including the fit of cooking solutions to consumers’
needs and preferences, physical access and experience with clean and improved solutions, consumer
awareness of potential clean cooking benefits, and consumer trust in the vendor and confidence in the
advertised benefits of the technology. These two dimensions of demand are often confused.
A lack of willingness to pay for improved and clean cooking solutions is a major demand
constraint across most stove technologies and end-user segments. Consumers at all income
levels have rejected improved and clean stoves even when they have been made available to them
for free or at a nominal cost. For instance, there are sizeable non-adopter populations in African
cookstove program pilots, with up to 30% of target ICS end users (Figure 3.13) rejecting stoves that
were provided to them at no cost or expressing no willingness to purchase these products at any price
after an initial trial period. This proportion of non-adopters is similar to the experience of other global
ICS distribution efforts in countries like Bangladesh, India, and Mongolia. There is less quantitative
evidence for non-biomass improved and clean cooking technologies, but anecdotal reports from
sector stakeholders suggest that similar non-adoption issues apply to clean modern fuels (LPG),
biofuels, and biogas. This evidence suggests that separate and apart from any affordability issues,
willingness to pay and somewhat related issues of technology fit and behavior change barriers are
major constraints.
At the same time, there is significant evidence that where affordable and appropriate clean and
improved stoves exist, adoption has been rapid and widespread; the ceramic Jiko stove has become
baseline cooking technology among urban populations in Africa; intermediate ICS solutions, particularly
highly efficient charcoal and coal stoves, are experiencing very strong market-driven sales in urban
markets across Asia and Africa; and modern fuels and stoves have seen massive increases in adoption
in those cases where such fuels have been subsidized. Even within rural markets, there is evidence that
customers appreciate the time and cost savings associated with efficient stoves. Surveys conducted
in Tanzania and Uganda, for instance, suggest that 80–85% of rural village residents are interested in
paying for ICSs starting at $ 5, including 85% of wood collectors (Figure 3.14).
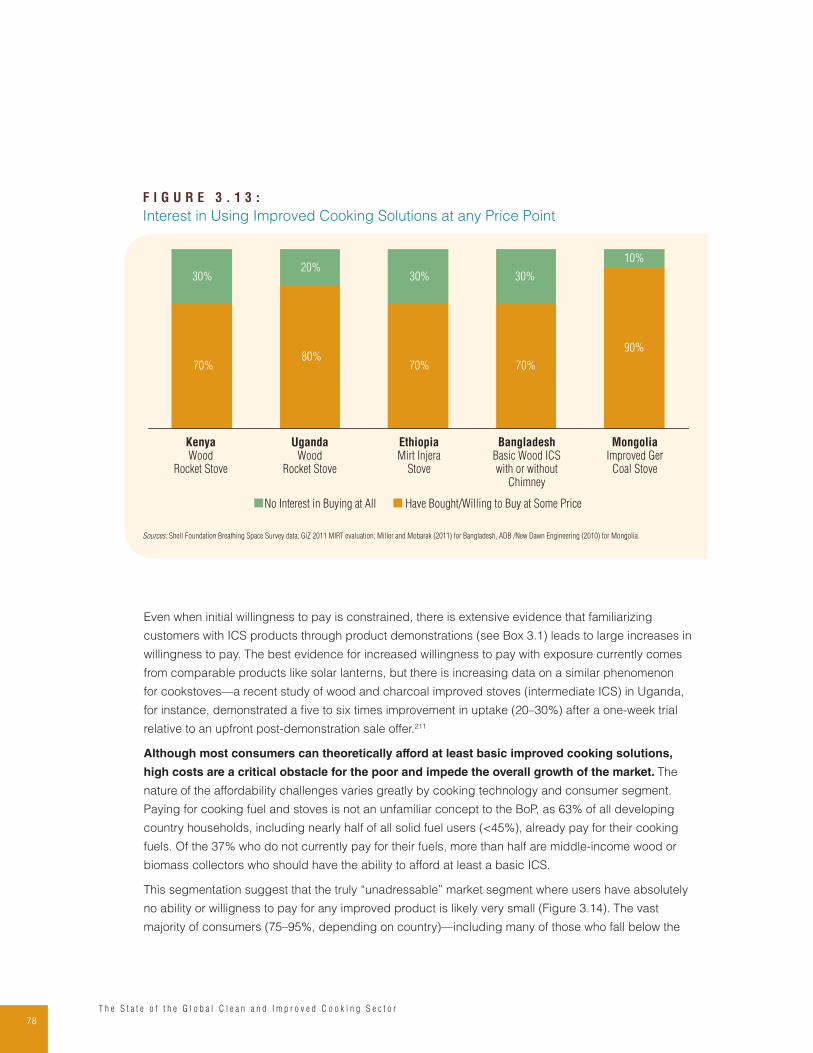
78T h e S t a t e o f t h e G l o b a l C l e a n a n d I m p r o v e d C o o k i n g S e c t o r
Even when initial willingness to pay is constrained, there is extensive evidence that familiarizing
customers with ICS products through product demonstrations (see Box 3.1) leads to large increases in
willingness to pay. The best evidence for increased willingness to pay with exposure currently comes
from comparable products like solar lanterns, but there is increasing data on a similar phenomenon
for cookstoves—a recent study of wood and charcoal improved stoves (intermediate ICS) in Uganda,
for instance, demonstrated a five to six times improvement in uptake (20–30%) after a one-week trial
relative to an upfront post-demonstration sale offer.211
Although most consumers can theoretically afford at least basic improved cooking solutions,
high costs are a critical obstacle for the poor and impede the overall growth of the market. The
nature of the affordability challenges varies greatly by cooking technology and consumer segment.
Paying for cooking fuel and stoves is not an unfamiliar concept to the BoP, as 63% of all developing
country households, including nearly half of all solid fuel users (<45%), already pay for their cooking
fuels. Of the 37% who do not currently pay for their fuels, more than half are middle-income wood or
biomass collectors who should have the ability to afford at least a basic ICS.
This segmentation suggest that the truly “unadressable” market segment where users have absolutely
no ability or willigness to pay for any improved product is likely very small (Figure 3.14). The vast
majority of consumers (75–95%, depending on country)—including many of those who fall below the
F I G U R E 3 . 1 3 :
Interest in Using Improved Cooking Solutions at any Price Point
30%20%
30% 30%
UgandaWood
Rocket Stove
MongoliaImproved Ger
Coal Stove
90%
10%
70%
EthiopiaMirt Injera
Stove
No Interest in Buying at All Have Bought/Willing to Buy at Some Price
BangladeshBasic Wood ICSwith or without
Chimney
80%70%
KenyaWood
Rocket Stove
70%
Sources: Shell Foundation Breathing Space Survey data; GiZ 2011 MIRT evaluation; Miller and Mobarak (2011) for Bangladesh, ADB /New Dawn Engineering (2010) for Mongolia.
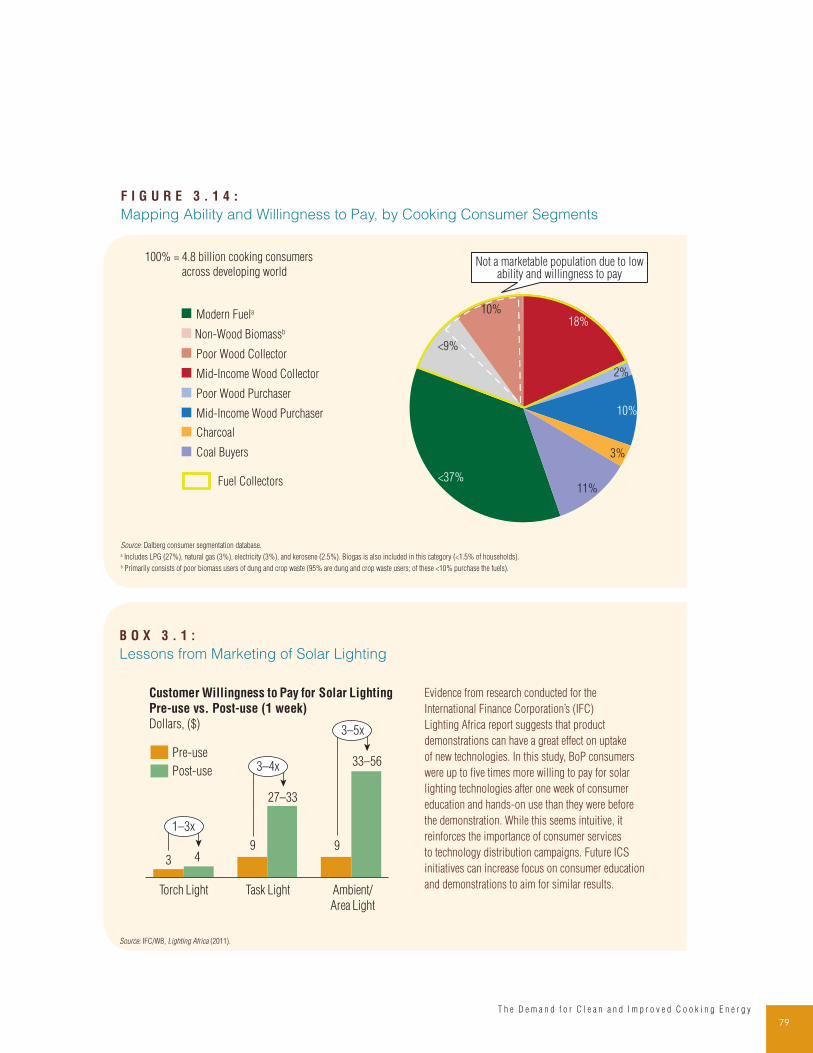
79T h e D e m a n d f o r C l e a n a n d I m p r o v e d C o o k i n g E n e r g y
B O X 3 . 1 :
Lessons from Marketing of Solar Lighting
Evidence from research conducted for the
International Finance Corporation’s (IFC)
Lighting Africa report suggests that product
demonstrations can have a great effect on uptake
of new technologies. In this study, BoP consumers
were up to five times more willing to pay for solar
lighting technologies after one week of consumer
education and hands-on use than they were before
the demonstration. While this seems intuitive, it
reinforces the importance of consumer services
to technology distribution campaigns. Future ICS
initiatives can increase focus on consumer education
and demonstrations to aim for similar results.
Customer Willingness to Pay for Solar Lighting
Pre-use vs. Post-use (1 week)
Dollars, ($)
Torch Light Task Light
3–4x
1–3x
3 49 9
3–5x
33–56
27–33
Ambient/
Area Light
Post-use
Pre-use
Source: IFC/WB, Lighting Africa (2011).
F I G U R E 3 . 1 4 :
Mapping Ability and Willingness to Pay, by Cooking Consumer Segments
2%
18%
10%
<37%
10%
<9%
11%
3%
100% = 4.8 billion cooking consumers
across developing world Not a marketable population due to low
ability and willingness to pay
Coal Buyers
Poor Wood Purchaser
Charcoal
Mid-Income Wood Collector
Poor Wood Collector
Mid-Income Wood Purchaser
Non-Wood Biomassb
Modern Fuela
Fuel Collectors
Source: Dalberg consumer segmentation database.a Includes LPG (27%), natural gas (3%), electricity (3%), and kerosene (2.5%). Biogas is also included in this category (<1.5% of households).b Primarily consists of poor biomass users of dung and crop waste (95% are dung and crop waste users; of these <10% purchase the fuels).
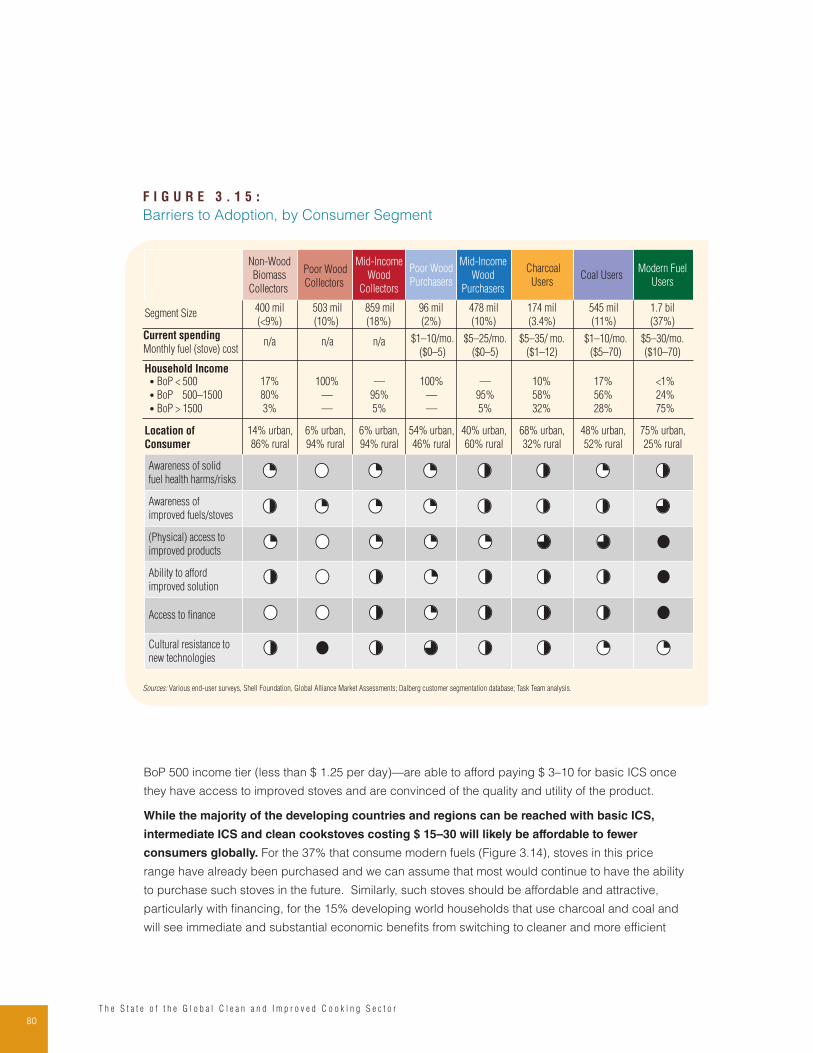
80T h e S t a t e o f t h e G l o b a l C l e a n a n d I m p r o v e d C o o k i n g S e c t o r
BoP 500 income tier (less than $ 1.25 per day)—are able to afford paying $ 3–10 for basic ICS once
they have access to improved stoves and are convinced of the quality and utility of the product.
While the majority of the developing countries and regions can be reached with basic ICS,
intermediate ICS and clean cookstoves costing $ 15–30 will likely be affordable to fewer
consumers globally. For the 37% that consume modern fuels (Figure 3.14), stoves in this price
range have already been purchased and we can assume that most would continue to have the ability
to purchase such stoves in the future. Similarly, such stoves should be affordable and attractive,
particularly with financing, for the 15% developing world households that use charcoal and coal and
will see immediate and substantial economic benefits from switching to cleaner and more efficient
F I G U R E 3 . 1 5 :
Barriers to Adoption, by Consumer Segment
Non-Wood
Biomass
Collectors
Poor Wood
Collectors
Mid-Income
Wood
Collectors
Poor Wood
Purchasers
Mid-Income
Wood
Purchasers
Charcoal
Users Coal Users
Modern Fuel
Users
Segment Size400 mil
(<9%)
503 mil
(10%)
859 mil
(18%)
96 mil
(2%)
478 mil
(10%)
174 mil
(3.4%)
545 mil
(11%)
1.7 bil
(37%)
$5–30/mo.
($10–70)
$1–10/mo.
($5–70)
$5–35/ mo.
($1–12)
$5–25/mo.
($0–5)
$1–10/mo.
($0–5)
Current spending
Monthly fuel (stove) costn/a
17%
80%
3%
n/a n/a
Household Income• BoP < 500
• BoP 500–1500
• BoP > 1500
100%
—
—
100%
—
—
—
95%
5%
—
95%
5%
10%
58%
32%
17%
56%
28%
<1%
24%
75%
Location of
Consumer
14% urban,
86% rural
6% urban,
94% rural
6% urban,
94% rural
54% urban,
46% rural
40% urban,
60% rural
68% urban,
32% rural
48% urban,
52% rural
75% urban,
25% rural
Awareness of solid
fuel health harms/risks
Awareness of
improved fuels/stoves
(Physical) access to
improved products
Ability to afford
improved solution
Access to finance
Cultural resistance to
new technologies
Sources: Various end-user surveys, Shell Foundation, Global Alliance Market Assessments; Dalberg customer segmentation database; Task Team analysis.
81T h e D e m a n d f o r C l e a n a n d I m p r o v e d C o o k i n g E n e r g y
stoves and fuels. Finally, there is evidence that improved stoves in this price range are attractive and,
with appropriate financing, affordable for a portion of the 12% of consumers who are relatively poor
wood purchasers in rural and urban areas. For instance, the number of consumers willing to pay
over $ 17 for an intermediate ICS in rural Tanzania and Uganda pilots suggests that such stoves are
appealing for as many as half of wood buyers in rural areas.
There is little empirical evidence to suggest the ability and willingness of biomass collectors to pay
more than a few dollars for improved stoves, though anecdotal reports from stove distributors in Africa,
Asia, and Latin America confirm some paying ability and demand, particularly from wealthier biomass
collector households. In sum, the global consumer segmentation suggests that intermediate ICS ($
15–30) are a viable option for at least 60% of developing world households.
The affordability challenge is especially problematic for higher-end cooking appliances and
modern fuels where high upfront costs ($ 75–100 for biomass fan gasifier stoves, $ 50–100 for LPG
and electric stove kits, $ 500–1500 for biogas) severely limit the clean cooking market’s potential for
the bottom half of the market. The challenge is not limited to upfront costs; for modern fuels like LPG
and electricity, the ongoing costs of the fuel can be 4 to 10 times more expensive on an annual basis
than purchased firewood; when compared to more expensive biomass fuels like charcoal, however,
modern fuels, in some cases, can be competitive, even when unsubsidized.
Anecdotal stove manufacturing interviews and analogous data from WB/IFC’s Lighting Africa program
for the solar lantern industry suggest that consumers are willing to spend the equivalent of one to
two month’s fuel expenditures on an improved appliance. With this as an assumption, stoves in the
$ 30–100 price range are only affordable to the highest income segment of BoP consumers (earning
more than $ 1,500 per capita), an equivalent of approximately 34% of the global population.
Historical purchasing behavior also shows the importance of this constraint. Few developing world
consumers today have spent more than $ 20–50 on their primary cookstoves. Shell Foundation surveys
in Kenya, Tanzania, and Uganda, for instance, show that only 10–20% of households in these countries
purchased any consumer durable item costing more than $ 30 over the course of a year. The adoption
of an intermediate ICS solution in the $15–30 range implies a significant re-allocation of budget
priorities for an average household. The challenge is even greater for clean cookstoves since the
average prices of clean stove appliances like LPG and biomass fan gasifiers range from $ 50 to 100.
In light of this data, it is likely that only the wealthiest one-fifth to one-third of consumers in the near
term can afford cash purchases of the highest cost clean cooking solutions ($ 50–150) without major
saving mobilization or major shifts in consumer preferences. This is a major challenge as cleaner and,
generally, more expensive solutions are needed to reach optimum health and environment benefits.
82T h e S t a t e o f t h e G l o b a l C l e a n a n d I m p r o v e d C o o k i n g S e c t o r
E N D N O T E S
200 In this report, data from 82 developing countries with a combined population of 4.9 billion has been used in
the fuel mix analysis. This represents 70% of the global population and ~98% of the 3.1 billion global solid fuel
users tracked in the WHO Global Solid Fuel data repository. The data for these 82 countries was corrected
to: (i) reconcile urban and rural fuel mix data; (ii) update fuel mix estimates with the latest Demographic and
Health Surveys (USAID), Multiple Indicator Cluster Survey (UNICEF), Living Standards Measurement Study
(World Bank), or national energy household survey data; and (iii) eliminate other data inaccuracies such as
inconsistent categorization of fuels (e.g., inclusion of natural gas in LPG category, mischaracterization of
charcoal as coal). The latest year of data available, ranging from 2007 to 2012, with an average year of mid-
2009, was used for each country to compute current aggregate and regional fuel mix totals. For most tropical
countries, solid fuel cooking and heating data is identical, but the numbers differ significantly in countries with
more temperate climates. Where possible, we use only cooking data. As an exception, for Asian countries like
China and Mongolia, we use both cooking and heating data since the two cannot be disaggregated with great
certainty across multi-year time series. Cumulative results were triangulated with an independent analysis of
2010 global fuel use (~3.1 billion solid fuel users) from Dr. Daniel Polsky and Ms. Caroline Ly, which combined
WHO’s parametric solid fuel estimates (WHO World Health Statistics Report) and the latest data available from
the World Bank’s World Development Indicators Database. The analysis was also triangulated with the Global
Energy Assessment for a Sustainable Future, a report developed and validated by a network of 300 international
researchers (GEA, 2012), which estimated a global solid fuel population of 2.9 billion.
201 Our conservative East Asia fuel mix estimate is based on national energy census data for China captured in the
WHO fuel mix database (2009–10), this data indicated a solid fuel share of households of nearly 60% in 2009,
up from 53–56% in 2000, largely due to increasing coal use. The 2009 data captured all solid fuel users without
disaggregating between households using solid fuels for cooking and heating. More recent estimates suggest
that these numbers may significantly overestimate the population relying on solid fuels for cooking. Estimates from
(Bonjour et al., 2014) show China solid fuel use for cooking declining from 53% in 2000 to 43% in 2010, with much
of the change due to a dramatic decline in coal use in urban areas. Even more recent preliminary survey data
from the CRAES, the Chinese National Environmental Related Human Activity Survey of 91,000 households across
31 Chinese provinces (cited in Zimmerman et al., 2014), suggests an even more dramatic decline of primary solid
fuel cooking households to 41% by 2013–14, with solid fuel cooking reaching a low of 61% of rural households
and 20% of urban households, down from 67% of rural households and 41% of urban households in 2000.
202 United Nations Population Division. World Population Prospects: The 2010 Revision. Retrieved from: http://www.
unescap.org/stat/data/syb2011/I-People/Population.asp.
203 Our forecast methodology uses a linear extrapolation of 2000–10 fuel-use trends, adjusted by overall population
growth and urbanization. Income effects are accounted for within the historical rural-urban migration trends and
fuel mix within urban and rural zones, but are not explicitly modeled. GEA (2012) and IEA (2011) estimates using
comparable methodologies, but based on a smaller number of country data points, reach comparable solid fuel
counts.
204 The baseline projection gives electricity a 5% share in 2020, but recent survey data from China (the 2013–14
CRAES) suggests that the country’s urban areas are undergoing a dramatic shift to electric stove use
(Zimmerman 2014) and corresponding declines in urban coal use. If this pattern holds through the end of the
decade, the overall developing world fuel mix will be much more heavily skewed to electricity (9%). The fast
growth of the electric convection oven market in urban India in recent years (30%+ annually) likewise suggests
that the electric cooking segment may be growing more quickly globally then is indicated in lagging national
survey data.
205 World Bank. Charcoal in Tanzania. Retrieved from: http://siteresources.worldbank.org/EXTCC/Resources/
PolicyNote_Charcoal_TZ_08–09.pdf.
83T h e D e m a n d f o r C l e a n a n d I m p r o v e d C o o k i n g E n e r g y
206 International Institute for Sustainable Development, 2011.
207 See Global Alliance market assessments in http://cleancookstoves.org/resources.
208 NL Agency, 2010.
209 Global Alliance for Clean Cookstoves, 2014b.
210 Masera et al., 2000.
211 Beltramo et al., 2014.
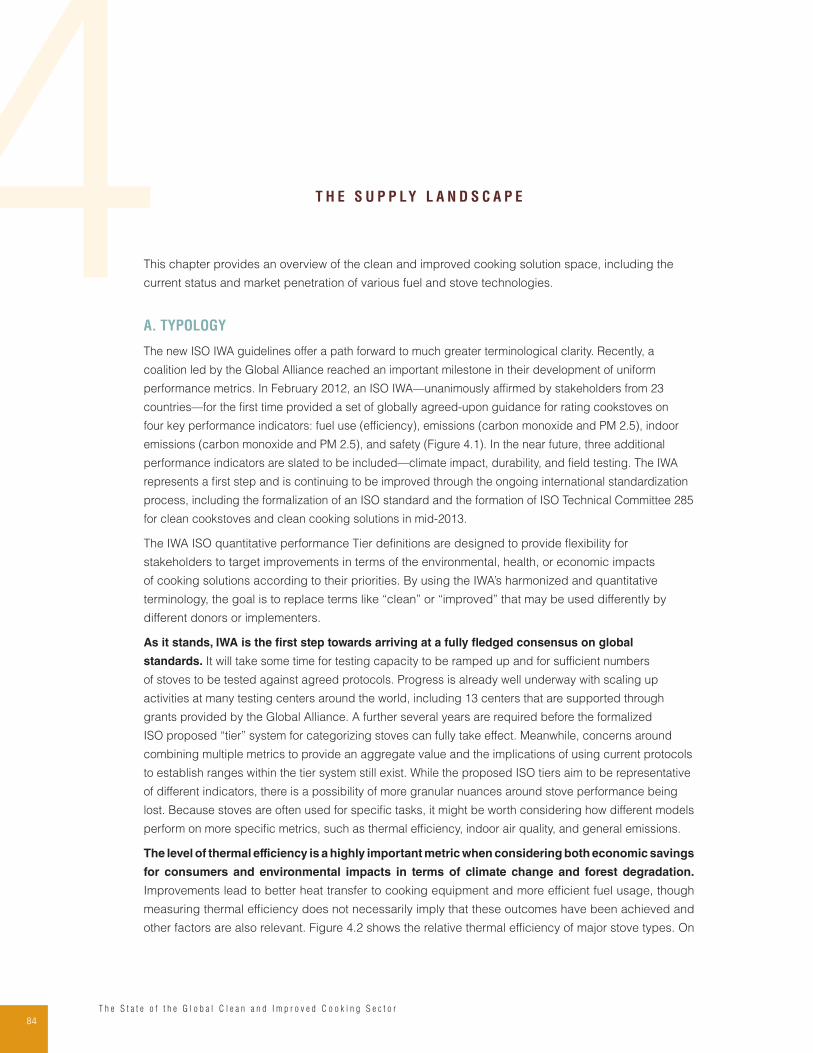
84T h e S t a t e o f t h e G l o b a l C l e a n a n d I m p r o v e d C o o k i n g S e c t o r
T H E S U P P LY L A N D S C A P E
This chapter provides an overview of the clean and improved cooking solution space, including the
current status and market penetration of various fuel and stove technologies.
A. TYPOLOGY
The new ISO IWA guidelines offer a path forward to much greater terminological clarity. Recently, a
coalition led by the Global Alliance reached an important milestone in their development of uniform
performance metrics. In February 2012, an ISO IWA—unanimously affirmed by stakeholders from 23
countries—for the first time provided a set of globally agreed-upon guidance for rating cookstoves on
four key performance indicators: fuel use (efficiency), emissions (carbon monoxide and PM 2.5), indoor
emissions (carbon monoxide and PM 2.5), and safety (Figure 4.1). In the near future, three additional
performance indicators are slated to be included—climate impact, durability, and field testing. The IWA
represents a first step and is continuing to be improved through the ongoing international standardization
process, including the formalization of an ISO standard and the formation of ISO Technical Committee 285
for clean cookstoves and clean cooking solutions in mid-2013.
The IWA ISO quantitative performance Tier definitions are designed to provide flexibility for
stakeholders to target improvements in terms of the environmental, health, or economic impacts
of cooking solutions according to their priorities. By using the IWA’s harmonized and quantitative
terminology, the goal is to replace terms like “clean” or “improved” that may be used differently by
different donors or implementers.
As it stands, IWA is the first step towards arriving at a fully fledged consensus on global
standards. It will take some time for testing capacity to be ramped up and for sufficient numbers
of stoves to be tested against agreed protocols. Progress is already well underway with scaling up
activities at many testing centers around the world, including 13 centers that are supported through
grants provided by the Global Alliance. A further several years are required before the formalized
ISO proposed “tier” system for categorizing stoves can fully take effect. Meanwhile, concerns around
combining multiple metrics to provide an aggregate value and the implications of using current protocols
to establish ranges within the tier system still exist. While the proposed ISO tiers aim to be representative
of different indicators, there is a possibility of more granular nuances around stove performance being
lost. Because stoves are often used for specific tasks, it might be worth considering how different models
perform on more specific metrics, such as thermal efficiency, indoor air quality, and general emissions.
The level of thermal efficiency is a highly important metric when considering both economic savings
for consumers and environmental impacts in terms of climate change and forest degradation.
Improvements lead to better heat transfer to cooking equipment and more efficient fuel usage, though
measuring thermal efficiency does not necessarily imply that these outcomes have been achieved and
other factors are also relevant. Figure 4.2 shows the relative thermal efficiency of major stove types. On
4
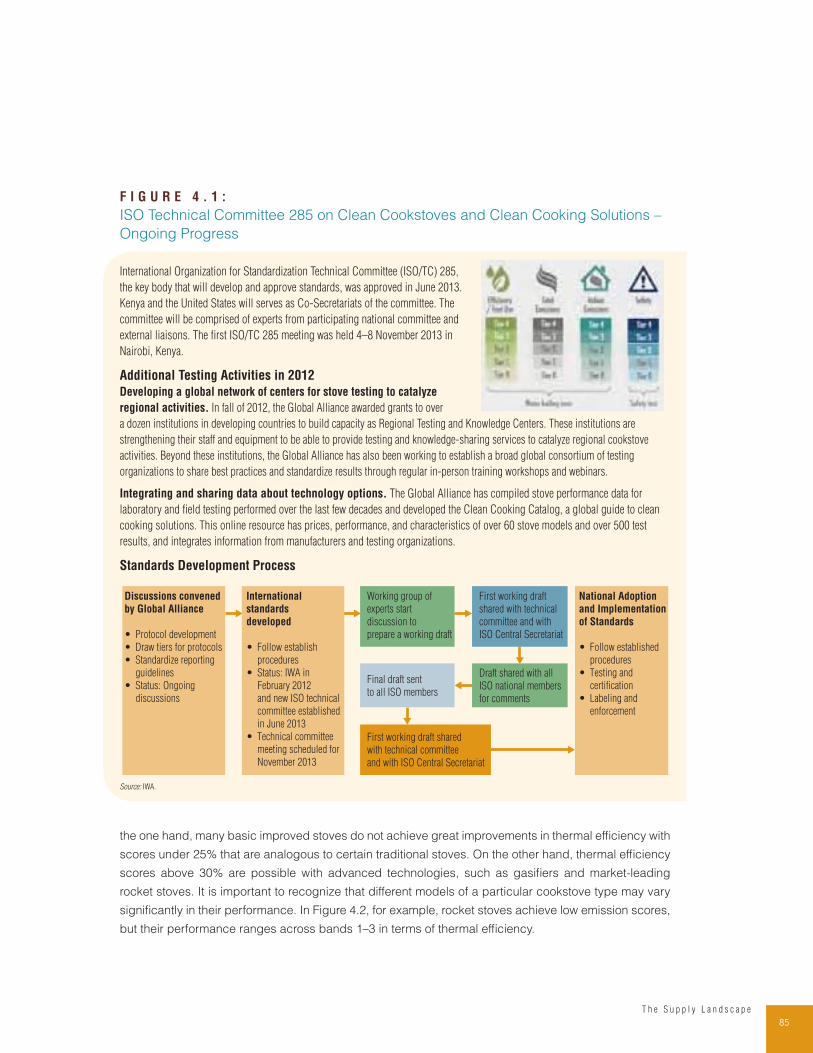
85T h e S u p p l y L a n d s c a p e
the one hand, many basic improved stoves do not achieve great improvements in thermal efficiency with
scores under 25% that are analogous to certain traditional stoves. On the other hand, thermal efficiency
scores above 30% are possible with advanced technologies, such as gasifiers and market-leading
rocket stoves. It is important to recognize that different models of a particular cookstove type may vary
significantly in their performance. In Figure 4.2, for example, rocket stoves achieve low emission scores,
but their performance ranges across bands 1–3 in terms of thermal efficiency.
F I G U R E 4 . 1 :
ISO Technical Committee 285 on Clean Cookstoves and Clean Cooking Solutions –
Ongoing Progress
Source: IWA.
International Organization for Standardization Technical Committee (ISO/TC) 285,
the key body that will develop and approve standards, was approved in June 2013.
Kenya and the United States will serves as Co-Secretariats of the committee. The
committee will be comprised of experts from participating national committee and
external liaisons. The first ISO/TC 285 meeting was held 4–8 November 2013 in
Nairobi, Kenya.
Additional Testing Activities in 2012
Developing a global network of centers for stove testing to catalyze
regional activities. In fall of 2012, the Global Alliance awarded grants to over
a dozen institutions in developing countries to build capacity as Regional Testing and Knowledge Centers. These institutions are
strengthening their staff and equipment to be able to provide testing and knowledge-sharing services to catalyze regional cookstove
activities. Beyond these institutions, the Global Alliance has also been working to establish a broad global consortium of testing
organizations to share best practices and standardize results through regular in-person training workshops and webinars.
Integrating and sharing data about technology options. The Global Alliance has compiled stove performance data for
laboratory and field testing performed over the last few decades and developed the Clean Cooking Catalog, a global guide to clean
cooking solutions. This online resource has prices, performance, and characteristics of over 60 stove models and over 500 test
results, and integrates information from manufacturers and testing organizations.
Standards Development Process
First working draft
shared with technical
committee and with
ISO Central Secretariat
Discussions convened
by Global Alliance
• Protocol development
• Draw tiers for protocols
• Standardize reporting
guidelines
• Status: Ongoing
discussions
International
standards
developed
• Follow establish
procedures
• Status: IWA in
February 2012
and new ISO technical
committee established
in June 2013
• Technical committee
meeting scheduled for
November 2013
National Adoption
and Implementation
of Standards
• Follow established
procedures
• Testing and
certification
• Labeling and
enforcement
Working group of
experts start
discussion to
prepare a working draft
First working draft shared
with technical committee
and with ISO Central Secretariat
Draft shared with all
ISO national members
for comments
Final draft sent
to all ISO members
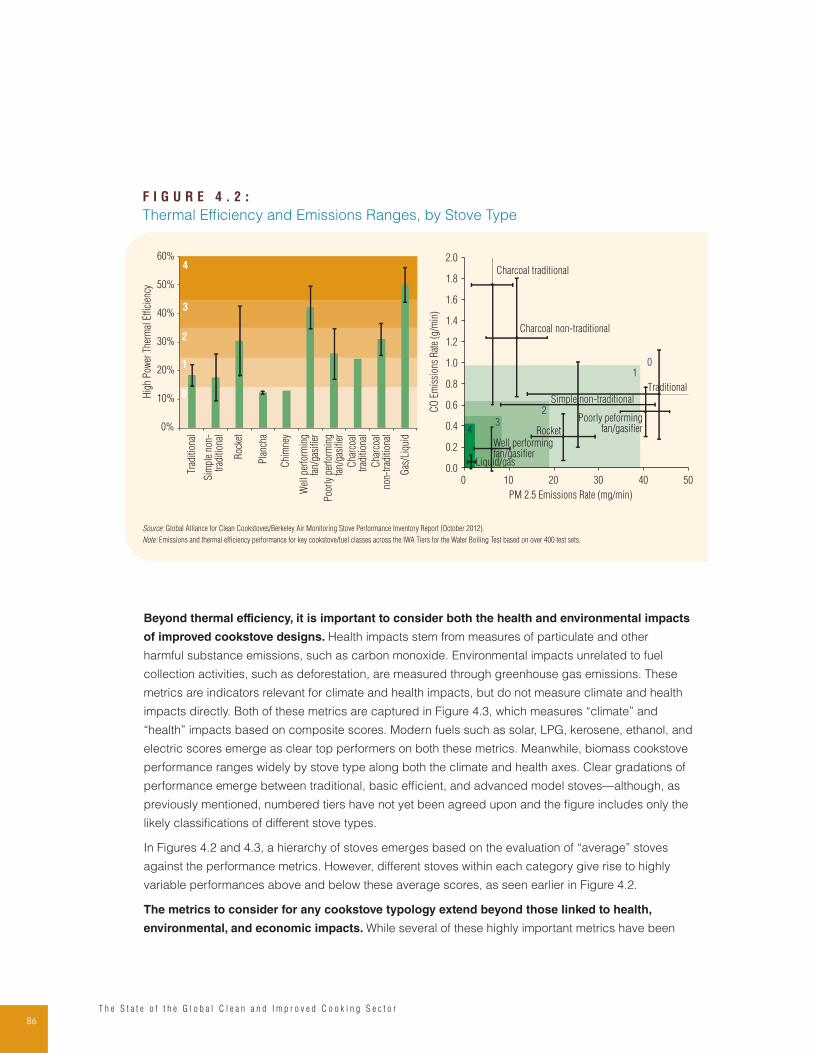
86T h e S t a t e o f t h e G l o b a l C l e a n a n d I m p r o v e d C o o k i n g S e c t o r
Beyond thermal efficiency, it is important to consider both the health and environmental impacts
of improved cookstove designs. Health impacts stem from measures of particulate and other
harmful substance emissions, such as carbon monoxide. Environmental impacts unrelated to fuel
collection activities, such as deforestation, are measured through greenhouse gas emissions. These
metrics are indicators relevant for climate and health impacts, but do not measure climate and health
impacts directly. Both of these metrics are captured in Figure 4.3, which measures “climate” and
“health” impacts based on composite scores. Modern fuels such as solar, LPG, kerosene, ethanol, and
electric scores emerge as clear top performers on both these metrics. Meanwhile, biomass cookstove
performance ranges widely by stove type along both the climate and health axes. Clear gradations of
performance emerge between traditional, basic efficient, and advanced model stoves—although, as
previously mentioned, numbered tiers have not yet been agreed upon and the figure includes only the
likely classifications of different stove types.
In Figures 4.2 and 4.3, a hierarchy of stoves emerges based on the evaluation of “average” stoves
against the performance metrics. However, different stoves within each category give rise to highly
variable performances above and below these average scores, as seen earlier in Figure 4.2.
The metrics to consider for any cookstove typology extend beyond those linked to health,
environmental, and economic impacts. While several of these highly important metrics have been
F I G U R E 4 . 2 :
Thermal Efficiency and Emissions Ranges, by Stove Type
4
3
1
0
2
0%
10%
20%
30%
40%
50%
60%
Trad
ition
al
Sim
ple
non-
trad
ition
al
Roc
ket
Pla
ncha
Chi
mne
y
Wel
l per
form
ing
fan/
gasi
fier
Hig
h P
ower
The
rmal
Effi
cien
cy
Poo
rly
perf
orm
ing
fan/
gasi
fier
Cha
rcoa
ltr
aditi
onal
Cha
rcoa
lno
n-tr
aditi
onal
Gas
/Liq
uid
CO
Em
issi
ons
Rat
e (g
/min
)
Traditional
Simple non-traditional
Rocket
Well performingfan/gasifier
Poorly peformingfan/gasifier
Charcoal traditional
Charcoal non-traditional
Liquid/gas0.0
0.2
0.4
0.6
0.8
1.0
1.2
1.4
1.6
1.8
2.0
0 10 20 30 40 50
PM 2.5 Emissions Rate (mg/min)
01
43
2
Source: Global Alliance for Clean Cookstoves/Berkeley Air Monitoring Stove Performance Inventory Report (October 2012).
Note: Emissions and thermal efficiency performance for key cookstove/fuel classes across the IWA Tiers for the Water Boiling Test based on over 400 test sets.
87T h e S u p p l y L a n d s c a p e
reviewed previously, there are many others worth considering. Potential customers will also consider
other factors such as cost, design, life span, safety, and cooking times. Publicly available information
on these factors is now available from an online resource developed and maintained by the Global
Alliance for Clean Cookstoves.212
Figure 4.4 provides a high-level evaluation of major stove types against a broader range of metrics that
include some of these other factors. This view draws important attention to some of the drawbacks of
stoves that have performed well in the previously mentioned categories. Most notably, while modern
stoves and biomass gasifiers perform very well on environmental and economic indicators, affordability
is a very important drawback.
It is evident that there is a wide range of metrics that a particular consumer or stakeholder might care
about. Moreover, a cookstove’s performance cannot be forecast based on type alone. Having provided
an overview of stove performance indicators, we now turn to a detailed description of stove types,
including their advantages and challenges.
F I G U R E 4 . 3 :
Indicative Health and Climate Impact, by Stove Type
Ethanol
Solar
Coal traditional
Biogas
Built-in rocketPortablerocket
Natural draft gasifier
Fan gasifier
Basic efficientwood
Mid-range charcoal
High-end charcoal
3 stone fire
Basic charcoal ICSVented coal stove
Kerosened
LPGc
Charcoal traditional
Electricc
Health Impactb Clean
Pol
lutin
gG
reen
Unhealthy
Directional Only
Cli
mate
Im
pact
a
43210
Source: Berkeley Air Monitoring Stove Performance Inventory Report 2012; Grieshop et al. 2011; Stove Database; Task Team analysis.
Note: The ISO tiers indicated by the dotted lines correspond roughly to the ISO IWA Tiers for emissions.
a Index on scale of 1–10 based on stove emissions of tons of GHG CO2-eq including all particles from fuel combustion and charcoal production weighted at GWC100; assumes fNRB of 0.5
b Index on scale of 1–10 of daily PM 2.5 intake per person and CO concentration, weighted 80/20 to reflect the more deleterious effects of particulate emissions relative to CO
c Climate impact of electric and LPG stoves only includes CO and particulate emissions at point of fuel consumption; production of these fuels may have significantly negative climate effects
(e.g., in the case of electricity production from coal combustion, but such climate costs vary across countries and are difficult to estimate)
d Kerosene stove results reflect measured PM and CO emissions and do not incorporate potential kerosene carcinogen effects
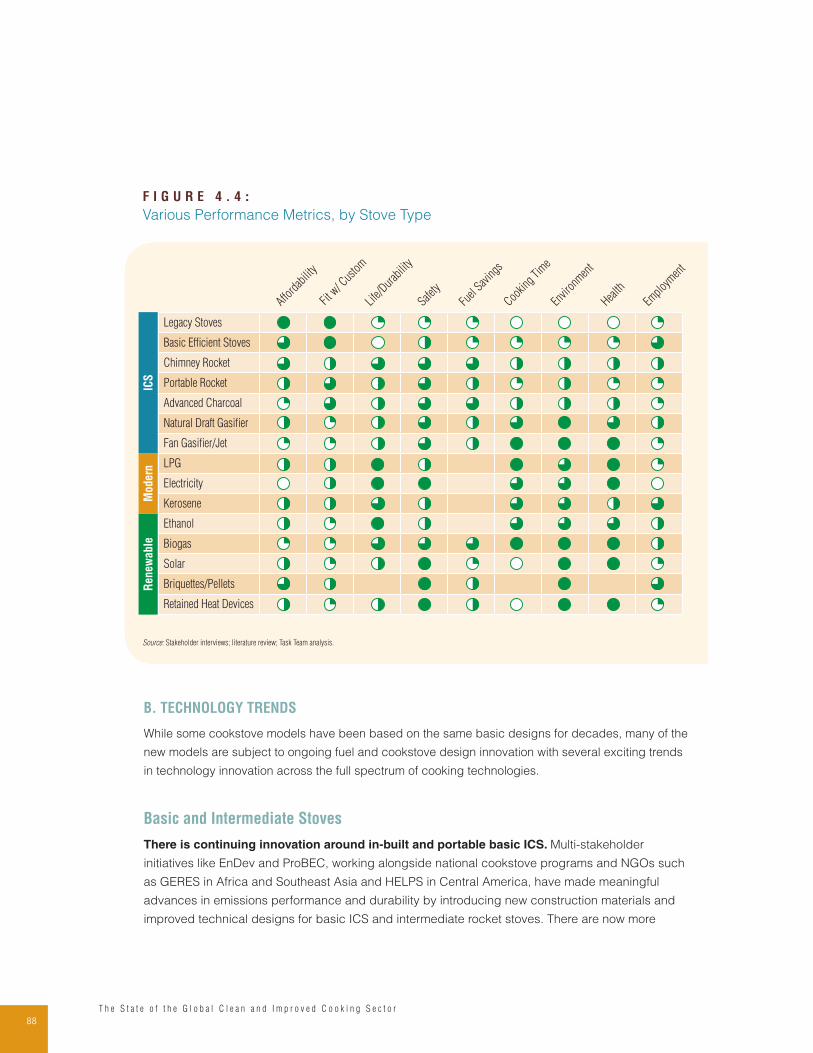
88T h e S t a t e o f t h e G l o b a l C l e a n a n d I m p r o v e d C o o k i n g S e c t o r
B. TECHNOLOGY TRENDS
While some cookstove models have been based on the same basic designs for decades, many of the
new models are subject to ongoing fuel and cookstove design innovation with several exciting trends
in technology innovation across the full spectrum of cooking technologies.
Basic and Intermediate Stoves
There is continuing innovation around in-built and portable basic ICS. Multi-stakeholder
initiatives like EnDev and ProBEC, working alongside national cookstove programs and NGOs such
as GERES in Africa and Southeast Asia and HELPS in Central America, have made meaningful
advances in emissions performance and durability by introducing new construction materials and
improved technical designs for basic ICS and intermediate rocket stoves. There are now more
F I G U R E 4 . 4 :
Various Performance Metrics, by Stove Type
Legacy Stoves
Basic Efficient Stoves
Chimney Rocket
Portable Rocket
Advanced Charcoal
Natural Draft Gasifier
Fan Gasifier/Jet
LPG
Electricity
Kerosene
Ethanol
Biogas
Solar
Briquettes/Pellets
Retained Heat Devices
Afford
abili
ty
Fit w
/ Cus
tom
Life/
Durab
ility
Fuel
Savin
gs
Cookin
g Ti
me
Envir
onm
ent
Safety
Health
Empl
oym
ent
Renew
able
Modern
ICS
Source: Stakeholder interviews; literature review; Task Team analysis.

89T h e S u p p l y L a n d s c a p e
form factors, greater standardization in quality, and—particularly important—increased design
customization.
While the latter is a long-standing trend, the past 5 to 10 years have seen a marked acceleration of design
innovations targeting basic ICS. There is, for instance, continued evolution in the design of plancha style
stoves across Central and South America, with stove models being replicated across national borders
and adapted for different patterns of tortilla production, family sizes, and secondary dish preferences.
The MIRT cookstove in Ethiopia and the Adhanet Mogogo in Eritrea, which have seen large-scale sales
in the past 5 to 10 years, offer unique, customized designs because they enable regional users to
simultaneously bake injera, a local flatbread, while cooking or boiling food without using additional fuel.
Similarly, in recent years, radical adaptations have been introduced by UN Environment Programme
(UNEP) and US Agency for International Development (USAID) for the tandoor stoves in Afghanistan,
which are designed for both bread baking and the underground heating of living quarters. Improved Ger
district stoves in Mongolia share similar principles, combining both cooking and space heating features.
The sector has also seen, in the past decade, a dramatic proliferation of basic portable stove
designs, with hundreds of stove models now on record. For example, stoves distributed in Africa and
Latin America under the EnDev program are highly customized at the regional and country levels
with dozens of models, including adjustments in materials used, stove appearance, and functional
characteristics like pot holder size and thermal properties.213 GERES, an NGO which has seen major
success at scale for basic ICS distribution, also extensively modifies its stoves (e.g., New Lao Stoves)
to local conditions. Social enterprises like ILF in Africa and Microsol in Central America likewise focus
on stove “localization” and end-user focus design.
We anticipate that this proliferation of designs will continue in the basic ICS sector in the next
decade given the ongoing demand for basic, low-cost ICSs and the immense diversity of poor rural
consumers’ needs. In markets where basic ICS have become (or are becoming) baseline cooking
technologies (e.g., Kenya), sector stakeholders report that the most important innovations in basic
ICS design will be ones that focus on scalability of production and quality control since durability is
a perennial issue. In distinction to the rural end-user segment, market experts observe increased
convergence in stove designs due to the greater commonality of needs and preferences for urban
consumers (e.g., convergence in urban portable charcoal ICS designs across East and West Africa).
The global intermediate ICS sector, dominated by industrially and semi-industrially manufactured
solutions, is an even more active point of design innovation. Leading the way in developing a
range of intermediate ICS technologies globally is Envirofit, which has a diverse selection of wood
and charcoal cookstove models (10+) designed for different cooking needs and contexts. In a
similar fashion, many of the more innovative and successful players in the intermediate ICS sector
(e.g., EcoZoom, EzyStove, Burn Design, Grameen Greenway Infra, and Prakti Design) emphasize
localization of design as an important competitive differentiator.
Aside from the general trend to customization, there are also several novel technological innovations in
design and materials for intermediate ICSs such as:
90T h e S t a t e o f t h e G l o b a l C l e a n a n d I m p r o v e d C o o k i n g S e c t o r
Low-cost design. One example, I EzyStove, designed by Swedish firm Ergonomidesign, is a very
low-cost portable wood rocket cookstove. The stove’s combustion chamber is suspended within a
wireframe exoskeleton. The stove is designed to be flat packed, and can be assembled by a local
worker with basic tools. Ergonomidesign says the stove, despite its stripped down architecture,
reduces fuel consumption by 40% and particulate emissions by 70%.214 Flatpack designs have been
utilized with some success by other ICS manufacturers like WorldStove (e.g., Lucia Stove), and is
increasingly being adapted by new players looking to adapt stoves with more advanced features (e.g.,
natural draft gasification) to artisanal manufacturing processes.
Climate appropriate design. The Berkley-Darfur cookstove, distributed by the Potential Energy NGO,
has been adapted with a tapered wind guard for the sandy and windy conditions of the Sahel. The
stove, modified from the Indian-developed Tara stove, is also redesigned for Darfur’s unique style of
cooking and food.215
Durability. Envirofit’s CH4400 Charcoal cookstove has a combustion chamber composed of a patent-
pending alloy that prevents deterioration and increases the durability and warranty of the stove’s
chamber. Highly durable materials have also been adapted by newly designed stoves like the Jiko Poa
and Jiko Koa being sold by Burn Manufactaring in Africa.
Modular cooking attachments. Envirofit offers a variety of add-on products alongside their stoves,
including a pressure cooker, a grill attachment, pot skirts, and a double pot attachment accessory with
a chimney. While the inclusion of a pot skirt, which EcoZoom also sells with their cookstove, increases
thermal efficiency and significantly reduces emissions, there is significant anecdotal evidence that
usage of a pot skirt is low among BoP households.
Non-cooking functions. The BioLite HomeStove combines electricity generation via a thermoelectric
generation unit (TEG) with cooking, and its manufacturer is planning to sell stoves with bundled LED
lighting. It also has an onboard data-logging system, enabling field recording of data on a range of
key usage metrics (such as frequency and duration of stove use, firepower, and charger usage) in a
cost-effective and non-intrusive manner. Such a technology may have important research benefits in
the context of both developing a better understanding of stove-usage and fuel-stacking strategies,
and making the carbon-monitoring methodology more accurate and less expensive.
High-Potential Newcomer: Gasifier Stoves
The most exciting technological trend in the biomass cookstove sector is the growing range of
forced draft and natural draft gasifier stoves. These stoves have shown the greatest potential to
improve health and environmental outcomes, at least under laboratory conditions. Early models were
unsuccessful because the complex construction made stoves expensive, fan draft stoves required an
external electricity supply, and users had to significantly modify their cooking habits to operate them.
For instance, many gasifier stoves required additional fuel preparation (chopping wood into small
pieces), preprocessed fuels, and potentially inconvenient top loading.
91T h e S u p p l y L a n d s c a p e
Recent technological innovations mean these traditional gasifier shortfalls are no longer characteristic
of the sector. New side-loaded designs are able to dramatically reduce emissions without tediously
requiring the user to prepare the fuel or remove the pot to add additional fuel. Moreover, these stoves
do not need to be prohibitively expensive. Thanks to low-tech “frugal design” and manufacturing
innovations, inexpensive cookstove varieties are now available. The Gambia Greenstove Rockifier
cookstove costs just $ 15, although the user needs to buy briquette feedstock fuel. Similarly, there are
now low-cost, semi-industrially manufactured natural draft stoves, including the Awamu (ABE) Mwoto
($ 16–20) and the Peko Pe.216
At the very apex of cookstove technological innovation are fan gasifiers and fan jet stoves such as
the Philips Smokeless Fan Stove manufactured in Lesotho by Africa Clean Energy and the BioLite
Homestove currently entering into commercialization in India and Africa. In the case of BioLite, as
previously mentioned, through its patented Direct Conduction Thermoelectric System, the HomeStove
converts the heat of the flame into electricity. This technology enables the stove both to autonomously
power an internal fan and to generate surplus electricity to charge mobile phones and LED lights.
There is early evidence that the bundling of a cookstove with an electricity source may increase stove
adoption, particularly among households that do not see value in purchasing a stove alone.217 Other
enterprises are exploring such TEG-linked designs, but have not yet released them on the market.
These gasifier technologies have great untapped potential. Whereas six or seven years ago gasifier
technologies were highly experimental, now there are more than a dozen existing stove models in this
category. However, the commercialization of advanced biomass stoves is still at a very early stage and
more field testing, including longitudinal randomized control trials of health outcomes, is necessary to
build on initial field testing results and prove the health and environmental benefits of these stoves.
Modern Fuels and Stoves
Among modern fuels, there generally has been less innovative activity relative to other
cookstove types, though some companies are investing in updating LPG and kerosene
cookstove design. A kerosene cookstove developed by Servals burns with about a 64% thermal
heat efficiency and includes a “toppling-safe” feature, increasing safety for the consumer.218 Arivi has
a similarly innovative product in South Africa. New LPG cookstove designs have been developed
with significantly higher fuel efficiency (about 90%) than traditional models (about 55%).219 However,
many of these models are quite expensive and not oriented to the BoP. There is, however, potential
for entrepreneurs to design new LPG, electricity, and kerosene stoves for the BoP. The one-kg stoves
promoted by Gulf Energy (Pima Gas) in Kenya and the three-kg cylinder stoves sold by Oando
(O-Gas) in Nigeria have integrated burners, eliminating the need for separate cookstove purchases.
They are also partly refillable, allowing for low-cost “top ups” that match BoP household income
streams. Reducing cylinder size is not a new innovation, but the interest of large local gas distributors
in expanding its marketing reach is an encouraging trend. GenteGas in Guatemala, for example, has
similar business model adaptations for driving LPG adoption among the poor.
92T h e S t a t e o f t h e G l o b a l C l e a n a n d I m p r o v e d C o o k i n g S e c t o r
Renewable Fuels and Stoves
For renewable fuels, the cookstove market is embryonic. These stoves are typically expensive,
including models that are designed for and manufactured in the developed world. When these
technologies have been brought to the developing world, they have not been adapted to local
conditions, and so have not yet gained significant traction in most markets. As the technology to adapt
and improve performance improves, there is a real opportunity for entrepreneurs to design renewable
fuel stoves for the BoP.
For biogas digesters, outside of the mass-scale biogas household plant program in China, there
is innovation occurring around cost reduction, quality standardization, and more kit-based models.
For example, the ‘Plastic Bag Digester’ is an inexpensive, prefabricated plastic biogas digester
designed for farmers in developing countries. The device, which is UV-resistant and composed of
recycled plastic, can be manufactured locally and installed in a day. Even more promising is the
model of SimGas Tanzania, a partnership between the Dutch SimGas BV and Silafrica Tanzania, which
manufactures and sells small-scale, environmentally sustainable manure-fed biogas digesters and
stove systems custom designed for the East African farmer. Other examples of portable modular biogas
digesters are in development; according to promoter data, these may lead to significant (50%) price
reductions in the upfront cost of biogas digester systems, with comparable levels of field performance.
In the solar cooker space, the wealth of designs has not yet translated into large-scale sales with the
exception of China. Nonetheless, important innovations are emerging, such as the recent release of
the Sol Source 3-in-1, a parabolic cooker that not only cooks food, but also serves as a heater and
electricity generator.220 While the heating and electricity generation modules are still at a nascent stage
of technology development, the concept holds promise. Other solar cooking innovations include the
CooKit low-cost solar stove ($ 20–30), which brings the potential for solar cooking within reach of many
more households as a supplement to traditional cooking solutions.
Innovation in Fuel Production
Innovations have also been occurring in technologies for processing plant oil. Project Gaia, which
runs an ethanol-for-cooking program in Ethiopia, is currently building a micro-distillery plant to make
ethanol from sugar cane. The project, with funding from the World Bank, will be able to produce 1,000
liters per day of ethanol from molasses feedstock. These micro-distillery facilities can be designed
sustainably as cogeneration plants powered by the same biomass inputs.221 Another promising
geography where pilots have been launched is Madagascar. The largest scale effort on ethanol fuel
production for cookstoves globally was in Mozambique as part of CleanStar Novozymes ethanol
cookstove project, but did not see success.
Additionally, industrial scale manufacturing of renewable solid fuel pellets and briquettes is
becoming more affordable, enabling entrepreneurs to expand their production exponentially. Biomass
pellet cooking fuel manufacturing is present at scale in India—over 250 factories—though largely
with a commercial and industrial client focus rather than a household cooking energy. China has a
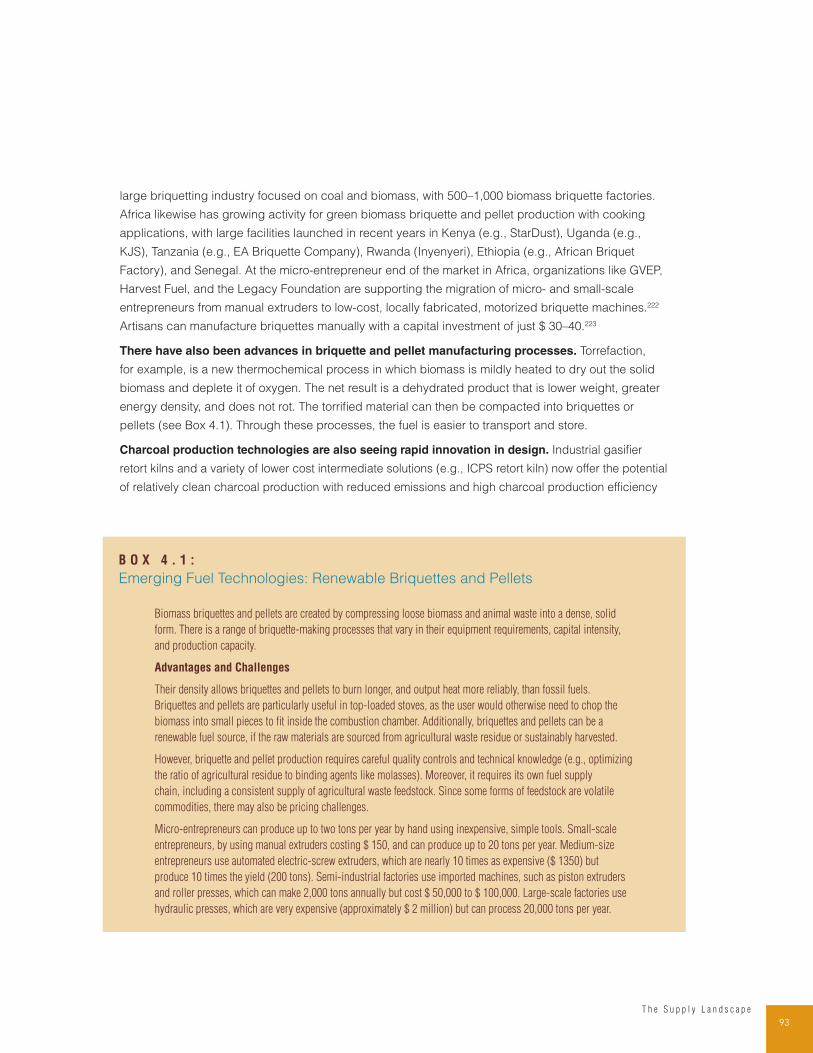
93T h e S u p p l y L a n d s c a p e
large briquetting industry focused on coal and biomass, with 500–1,000 biomass briquette factories.
Africa likewise has growing activity for green biomass briquette and pellet production with cooking
applications, with large facilities launched in recent years in Kenya (e.g., StarDust), Uganda (e.g.,
KJS), Tanzania (e.g., EA Briquette Company), Rwanda (Inyenyeri), Ethiopia (e.g., African Briquet
Factory), and Senegal. At the micro-entrepreneur end of the market in Africa, organizations like GVEP,
Harvest Fuel, and the Legacy Foundation are supporting the migration of micro- and small-scale
entrepreneurs from manual extruders to low-cost, locally fabricated, motorized briquette machines.222
Artisans can manufacture briquettes manually with a capital investment of just $ 30–40.223
There have also been advances in briquette and pellet manufacturing processes. Torrefaction,
for example, is a new thermochemical process in which biomass is mildly heated to dry out the solid
biomass and deplete it of oxygen. The net result is a dehydrated product that is lower weight, greater
energy density, and does not rot. The torrified material can then be compacted into briquettes or
pellets (see Box 4.1). Through these processes, the fuel is easier to transport and store.
Charcoal production technologies are also seeing rapid innovation in design. Industrial gasifier
retort kilns and a variety of lower cost intermediate solutions (e.g., ICPS retort kiln) now offer the potential
of relatively clean charcoal production with reduced emissions and high charcoal production efficiency
B O X 4 . 1 :
Emerging Fuel Technologies: Renewable Briquettes and Pellets
Biomass briquettes and pellets are created by compressing loose biomass and animal waste into a dense, solid
form. There is a range of briquette-making processes that vary in their equipment requirements, capital intensity,
and production capacity.
Advantages and Challenges
Their density allows briquettes and pellets to burn longer, and output heat more reliably, than fossil fuels.
Briquettes and pellets are particularly useful in top-loaded stoves, as the user would otherwise need to chop the
biomass into small pieces to fit inside the combustion chamber. Additionally, briquettes and pellets can be a
renewable fuel source, if the raw materials are sourced from agricultural waste residue or sustainably harvested.
However, briquette and pellet production requires careful quality controls and technical knowledge (e.g., optimizing
the ratio of agricultural residue to binding agents like molasses). Moreover, it requires its own fuel supply
chain, including a consistent supply of agricultural waste feedstock. Since some forms of feedstock are volatile
commodities, there may also be pricing challenges.
Micro-entrepreneurs can produce up to two tons per year by hand using inexpensive, simple tools. Small-scale
entrepreneurs, by using manual extruders costing $ 150, and can produce up to 20 tons per year. Medium-size
entrepreneurs use automated electric-screw extruders, which are nearly 10 times as expensive ($ 1350) but
produce 10 times the yield (200 tons). Semi-industrial factories use imported machines, such as piston extruders
and roller presses, which can make 2,000 tons annually but cost $ 50,000 to $ 100,000. Large-scale factories use
hydraulic presses, which are very expensive (approximately $ 2 million) but can process 20,000 tons per year.
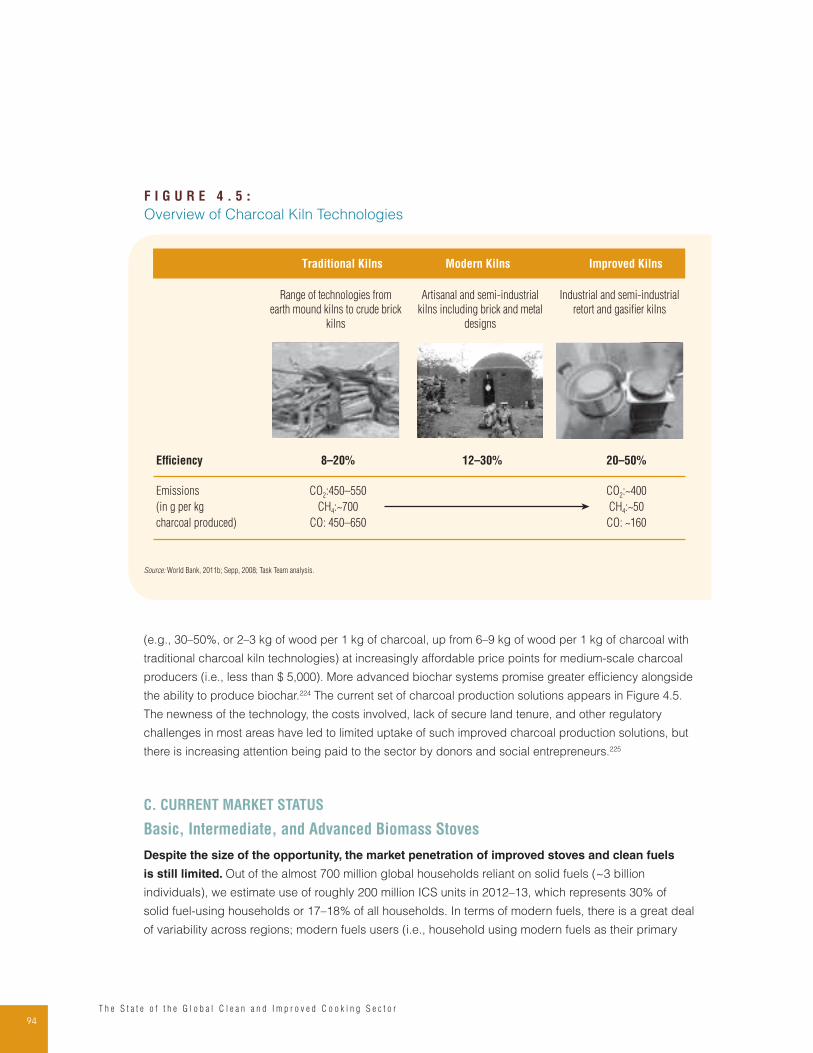
94T h e S t a t e o f t h e G l o b a l C l e a n a n d I m p r o v e d C o o k i n g S e c t o r
(e.g., 30–50%, or 2–3 kg of wood per 1 kg of charcoal, up from 6–9 kg of wood per 1 kg of charcoal with
traditional charcoal kiln technologies) at increasingly affordable price points for medium-scale charcoal
producers (i.e., less than $ 5,000). More advanced biochar systems promise greater efficiency alongside
the ability to produce biochar.224 The current set of charcoal production solutions appears in Figure 4.5.
The newness of the technology, the costs involved, lack of secure land tenure, and other regulatory
challenges in most areas have led to limited uptake of such improved charcoal production solutions, but
there is increasing attention being paid to the sector by donors and social entrepreneurs.225
C. CURRENT MARKET STATUS
Basic, Intermediate, and Advanced Biomass Stoves
Despite the size of the opportunity, the market penetration of improved stoves and clean fuels
is still limited. Out of the almost 700 million global households reliant on solid fuels (~3 billion
individuals), we estimate use of roughly 200 million ICS units in 2012–13, which represents 30% of
solid fuel-using households or 17–18% of all households. In terms of modern fuels, there is a great deal
of variability across regions; modern fuels users (i.e., household using modern fuels as their primary
F I G U R E 4 . 5 :
Overview of Charcoal Kiln Technologies
Traditional Kilns Modern Kilns Improved Kilns
Efficiency
Emissions
(in g per kg
charcoal produced)
Range of technologies from
earth mound kilns to crude brick
kilns
Artisanal and semi-industrial
kilns including brick and metal
designs
Industrial and semi-industrial
retort and gasifier kilns
8–20%
CO2:450–550
CH4:~700
CO: 450–650
CO2:~400
CH4:~50
CO: ~160
12–30% 20–50%
Source: World Bank, 2011b; Sepp, 2008; Task Team analysis.
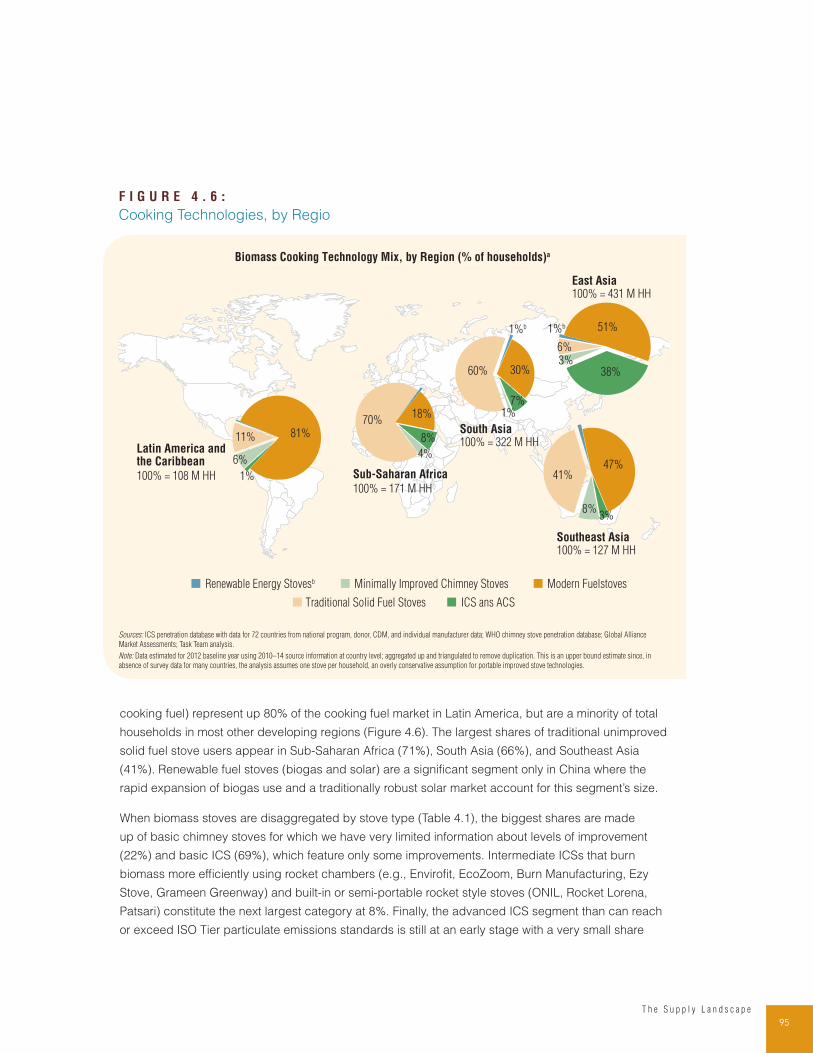
95T h e S u p p l y L a n d s c a p e
cooking fuel) represent up 80% of the cooking fuel market in Latin America, but are a minority of total
households in most other developing regions (Figure 4.6). The largest shares of traditional unimproved
solid fuel stove users appear in Sub-Saharan Africa (71%), South Asia (66%), and Southeast Asia
(41%). Renewable fuel stoves (biogas and solar) are a significant segment only in China where the
rapid expansion of biogas use and a traditionally robust solar market account for this segment’s size.
When biomass stoves are disaggregated by stove type (Table 4.1), the biggest shares are made
up of basic chimney stoves for which we have very limited information about levels of improvement
(22%) and basic ICS (69%), which feature only some improvements. Intermediate ICSs that burn
biomass more efficiently using rocket chambers (e.g., Envirofit, EcoZoom, Burn Manufacturing, Ezy
Stove, Grameen Greenway) and built-in or semi-portable rocket style stoves (ONIL, Rocket Lorena,
Patsari) constitute the next largest category at 8%. Finally, the advanced ICS segment than can reach
or exceed ISO Tier particulate emissions standards is still at an early stage with a very small share
F I G U R E 4 . 6 :
Cooking Technologies, by Regio
East Asia100% = 431 M HH
South Asia 100% = 322 M HH
Sub-Saharan Africa
100% = 171 M HH
Southeast Asia100% = 127 M HH
Latin America and the Caribbean
100% = 108 M HH
Biomass Cooking Technology Mix, by Region (% of households)a
6%
Minimally Improved Chimney Stoves
ICS ans ACSTraditional Solid Fuel Stoves
Renewable Energy Stovesb
8%
4%
60% 30%
7%1%
1%
1%b 1%b
11% 81%70%
18%
38%
47%41%
8%3%
3%6%
51%
Modern Fuelstoves
Sources: ICS penetration database with data for 72 countries from national program, donor, CDM, and individual manufacturer data; WHO chimney stove penetration database; Global Alliance
Market Assessments; Task Team analysis.
Note: Data estimated for 2012 baseline year using 2010–14 source information at country level; aggregated up and triangulated to remove duplication. This is an upper bound estimate since, in
absence of survey data for many countries, the analysis assumes one stove per household, an overly conservative assumption for portable improved stove technologies.
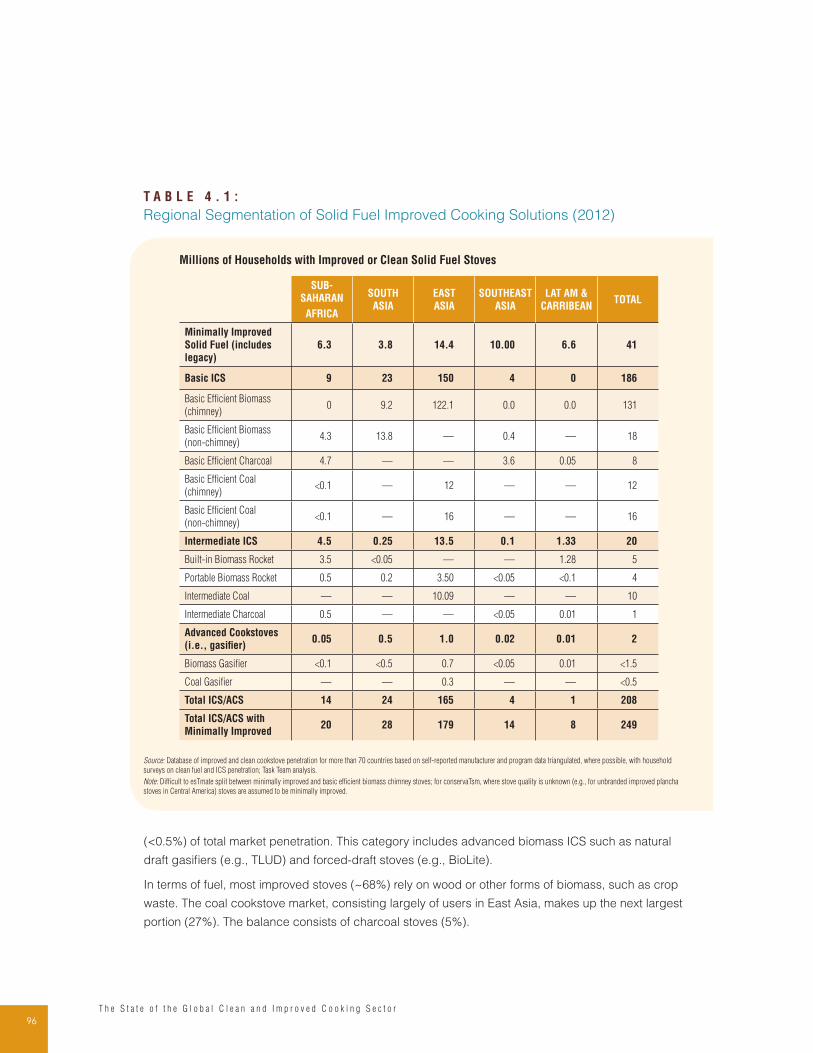
96T h e S t a t e o f t h e G l o b a l C l e a n a n d I m p r o v e d C o o k i n g S e c t o r
T A B L E 4 . 1 :
Regional Segmentation of Solid Fuel Improved Cooking Solutions (2012)
Millions of Households with Improved or Clean Solid Fuel Stoves
SUB-
SAHARAN
AFRICA
SOUTH
ASIA
EAST
ASIA
SOUTHEAST
ASIA
LAT AM &
CARRIBEANTOTAL
Minimally Improved
Solid Fuel (includes
legacy)
6.3 3.8 14.4 10.00 6.6 41
Basic ICS 9 23 150 4 0 186
Basic Efficient Biomass
(chimney)0 9.2 122.1 0.0 0.0 131
Basic Efficient Biomass
(non- chimney)4.3 13.8 — 0.4 — 18
Basic Efficient Charcoal 4.7 — — 3.6 0.05 8
Basic Efficient Coal
(chimney)<0.1 — 12 — — 12
Basic Efficient Coal
(non- chimney)<0.1 — 16 — — 16
Intermediate ICS 4.5 0.25 13.5 0.1 1.33 20
Built- in Biomass Rocket 3.5 <0.05 — — 1.28 5
Portable Biomass Rocket 0.5 0.2 3.50 <0.05 <0.1 4
Intermediate Coal — — 10.09 — — 10
Intermediate Charcoal 0.5 — — <0.05 0.01 1
Advanced Cookstoves
(i.e., gasifier)0.05 0.5 1.0 0.02 0.01 2
Biomass Gasifier <0.1 <0.5 0.7 <0.05 0.01 <1.5
Coal Gasifier — — 0.3 — — <0.5
Total ICS/ACS 14 24 165 4 1 208
Total ICS/ACS with
Minimally Improved20 28 179 14 8 249
Source: Database of improved and clean cookstove penetration for more than 70 countries based on self-reported manufacturer and program data triangulated, where possible, with household
surveys on clean fuel and ICS penetration; Task Team analysis.
Note: Difficult to esTmate split between minimally improved and basic efficient biomass chimney stoves; for conservaTsm, where stove quality is unknown (e.g., for unbranded improved plancha
stoves in Central America) stoves are assumed to be minimally improved.
(<0.5%) of total market penetration. This category includes advanced biomass ICS such as natural
draft gasifiers (e.g., TLUD) and forced-draft stoves (e.g., BioLite).
In terms of fuel, most improved stoves (~68%) rely on wood or other forms of biomass, such as crop
waste. The coal cookstove market, consisting largely of users in East Asia, makes up the next largest
portion (27%). The balance consists of charcoal stoves (5%).
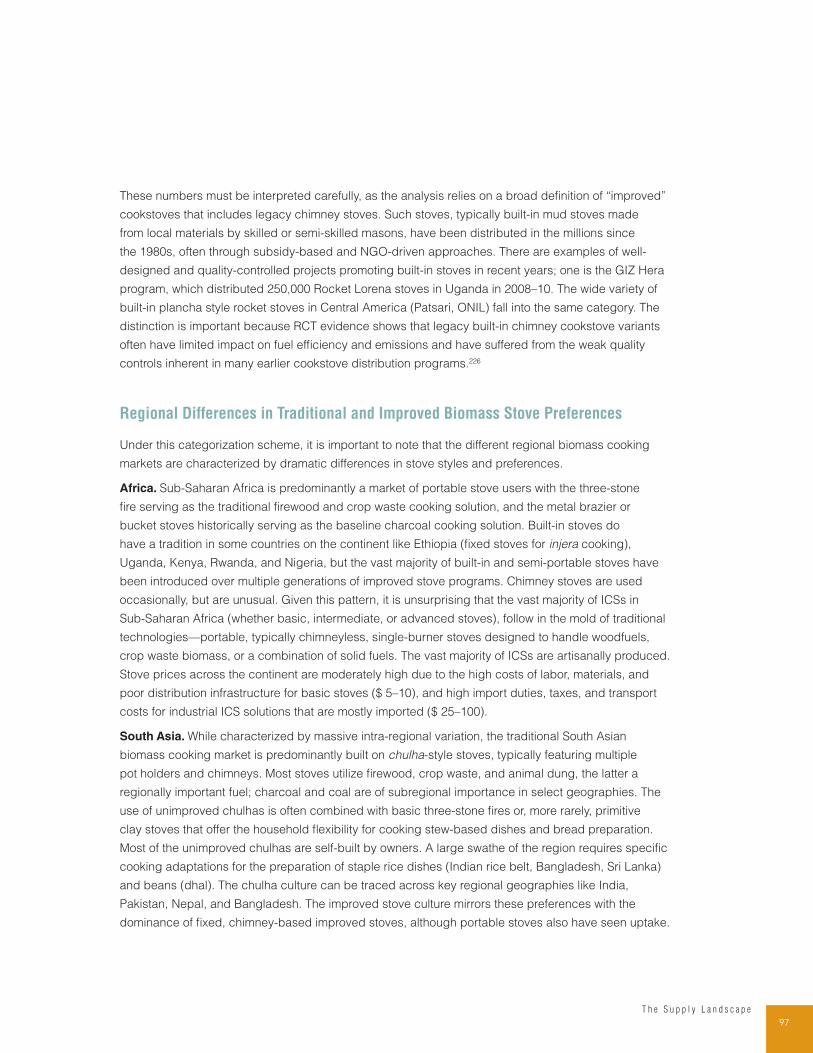
97T h e S u p p l y L a n d s c a p e
These numbers must be interpreted carefully, as the analysis relies on a broad definition of “improved”
cookstoves that includes legacy chimney stoves. Such stoves, typically built-in mud stoves made
from local materials by skilled or semi-skilled masons, have been distributed in the millions since
the 1980s, often through subsidy-based and NGO-driven approaches. There are examples of well-
designed and quality-controlled projects promoting built-in stoves in recent years; one is the GIZ Hera
program, which distributed 250,000 Rocket Lorena stoves in Uganda in 2008–10. The wide variety of
built-in plancha style rocket stoves in Central America (Patsari, ONIL) fall into the same category. The
distinction is important because RCT evidence shows that legacy built-in chimney cookstove variants
often have limited impact on fuel efficiency and emissions and have suffered from the weak quality
controls inherent in many earlier cookstove distribution programs.226
Regional Differences in Traditional and Improved Biomass Stove Preferences
Under this categorization scheme, it is important to note that the different regional biomass cooking
markets are characterized by dramatic differences in stove styles and preferences.
Africa. Sub-Saharan Africa is predominantly a market of portable stove users with the three-stone
fire serving as the traditional firewood and crop waste cooking solution, and the metal brazier or
bucket stoves historically serving as the baseline charcoal cooking solution. Built-in stoves do
have a tradition in some countries on the continent like Ethiopia (fixed stoves for injera cooking),
Uganda, Kenya, Rwanda, and Nigeria, but the vast majority of built-in and semi-portable stoves have
been introduced over multiple generations of improved stove programs. Chimney stoves are used
occasionally, but are unusual. Given this pattern, it is unsurprising that the vast majority of ICSs in
Sub-Saharan Africa (whether basic, intermediate, or advanced stoves), follow in the mold of traditional
technologies—portable, typically chimneyless, single-burner stoves designed to handle woodfuels,
crop waste biomass, or a combination of solid fuels. The vast majority of ICSs are artisanally produced.
Stove prices across the continent are moderately high due to the high costs of labor, materials, and
poor distribution infrastructure for basic stoves ($ 5–10), and high import duties, taxes, and transport
costs for industrial ICS solutions that are mostly imported ($ 25–100).
South Asia. While characterized by massive intra-regional variation, the traditional South Asian
biomass cooking market is predominantly built on chulha-style stoves, typically featuring multiple
pot holders and chimneys. Most stoves utilize firewood, crop waste, and animal dung, the latter a
regionally important fuel; charcoal and coal are of subregional importance in select geographies. The
use of unimproved chulhas is often combined with basic three-stone fires or, more rarely, primitive
clay stoves that offer the household flexibility for cooking stew-based dishes and bread preparation.
Most of the unimproved chulhas are self-built by owners. A large swathe of the region requires specific
cooking adaptations for the preparation of staple rice dishes (Indian rice belt, Bangladesh, Sri Lanka)
and beans (dhal). The chulha culture can be traced across key regional geographies like India,
Pakistan, Nepal, and Bangladesh. The improved stove culture mirrors these preferences with the
dominance of fixed, chimney-based improved stoves, although portable stoves also have seen uptake.
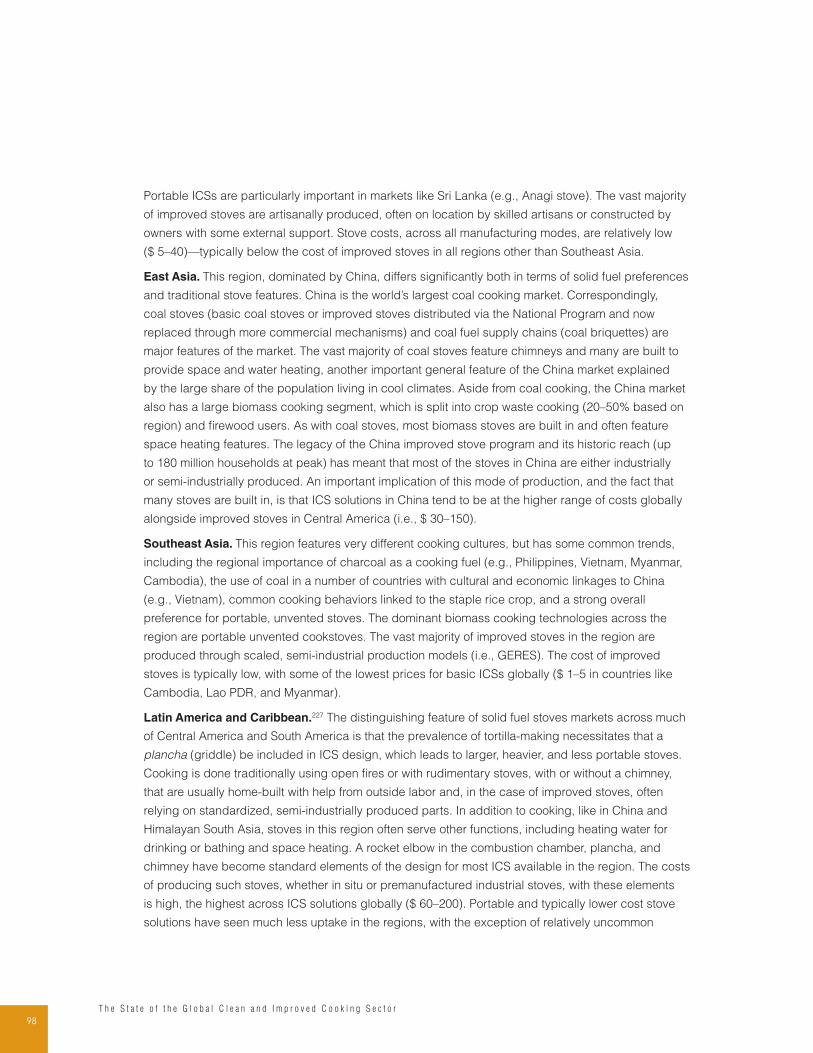
98T h e S t a t e o f t h e G l o b a l C l e a n a n d I m p r o v e d C o o k i n g S e c t o r
Portable ICSs are particularly important in markets like Sri Lanka (e.g., Anagi stove). The vast majority
of improved stoves are artisanally produced, often on location by skilled artisans or constructed by
owners with some external support. Stove costs, across all manufacturing modes, are relatively low
($ 5–40)—typically below the cost of improved stoves in all regions other than Southeast Asia.
East Asia. This region, dominated by China, differs significantly both in terms of solid fuel preferences
and traditional stove features. China is the world’s largest coal cooking market. Correspondingly,
coal stoves (basic coal stoves or improved stoves distributed via the National Program and now
replaced through more commercial mechanisms) and coal fuel supply chains (coal briquettes) are
major features of the market. The vast majority of coal stoves feature chimneys and many are built to
provide space and water heating, another important general feature of the China market explained
by the large share of the population living in cool climates. Aside from coal cooking, the China market
also has a large biomass cooking segment, which is split into crop waste cooking (20–50% based on
region) and firewood users. As with coal stoves, most biomass stoves are built in and often feature
space heating features. The legacy of the China improved stove program and its historic reach (up
to 180 million households at peak) has meant that most of the stoves in China are either industrially
or semi-industrially produced. An important implication of this mode of production, and the fact that
many stoves are built in, is that ICS solutions in China tend to be at the higher range of costs globally
alongside improved stoves in Central America (i.e., $ 30–150).
Southeast Asia. This region features very different cooking cultures, but has some common trends,
including the regional importance of charcoal as a cooking fuel (e.g., Philippines, Vietnam, Myanmar,
Cambodia), the use of coal in a number of countries with cultural and economic linkages to China
(e.g., Vietnam), common cooking behaviors linked to the staple rice crop, and a strong overall
preference for portable, unvented stoves. The dominant biomass cooking technologies across the
region are portable unvented cookstoves. The vast majority of improved stoves in the region are
produced through scaled, semi-industrial production models (i.e., GERES). The cost of improved
stoves is typically low, with some of the lowest prices for basic ICSs globally ($ 1–5 in countries like
Cambodia, Lao PDR, and Myanmar).
Latin America and Caribbean.227 The distinguishing feature of solid fuel stoves markets across much
of Central America and South America is that the prevalence of tortilla-making necessitates that a
plancha (griddle) be included in ICS design, which leads to larger, heavier, and less portable stoves.
Cooking is done traditionally using open fires or with rudimentary stoves, with or without a chimney,
that are usually home-built with help from outside labor and, in the case of improved stoves, often
relying on standardized, semi-industrially produced parts. In addition to cooking, like in China and
Himalayan South Asia, stoves in this region often serve other functions, including heating water for
drinking or bathing and space heating. A rocket elbow in the combustion chamber, plancha, and
chimney have become standard elements of the design for most ICS available in the region. The costs
of producing such stoves, whether in situ or premanufactured industrial stoves, with these elements
is high, the highest across ICS solutions globally ($ 60–200). Portable and typically lower cost stove
solutions have seen much less uptake in the regions, with the exception of relatively uncommon
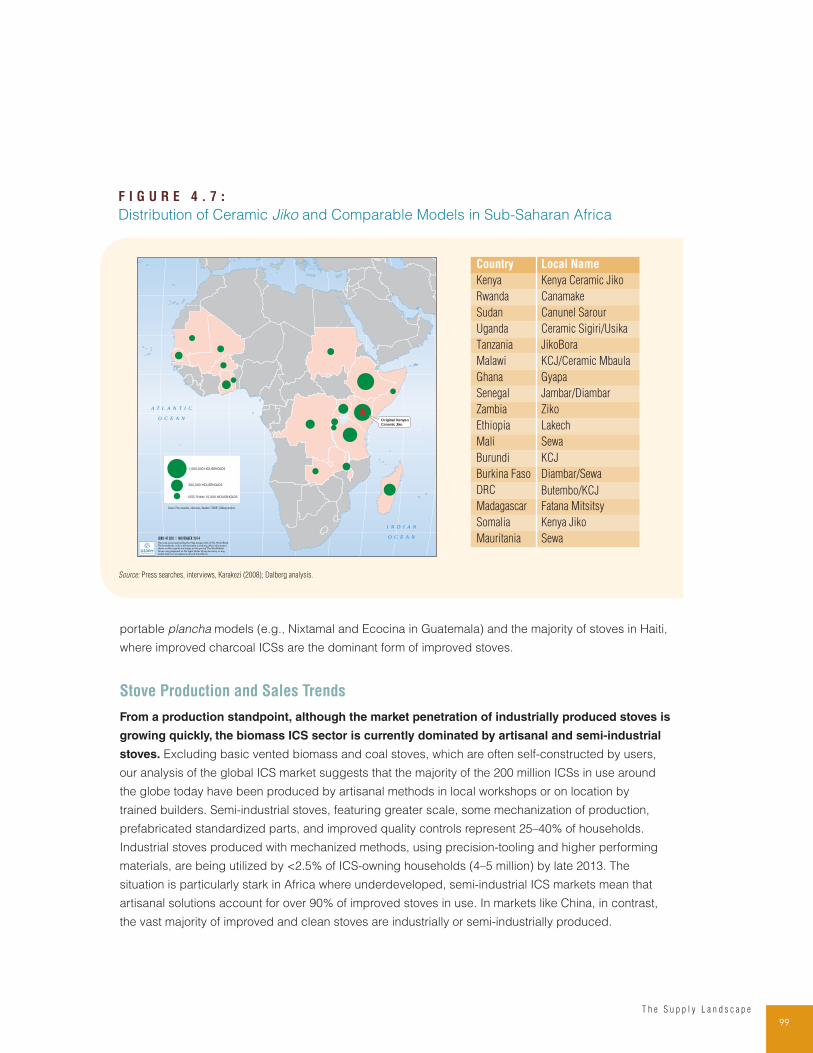
99T h e S u p p l y L a n d s c a p e
portable plancha models (e.g., Nixtamal and Ecocina in Guatemala) and the majority of stoves in Haiti,
where improved charcoal ICSs are the dominant form of improved stoves.
Stove Production and Sales Trends
From a production standpoint, although the market penetration of industrially produced stoves is
growing quickly, the biomass ICS sector is currently dominated by artisanal and semi-industrial
stoves. Excluding basic vented biomass and coal stoves, which are often self-constructed by users,
our analysis of the global ICS market suggests that the majority of the 200 million ICSs in use around
the globe today have been produced by artisanal methods in local workshops or on location by
trained builders. Semi-industrial stoves, featuring greater scale, some mechanization of production,
prefabricated standardized parts, and improved quality controls represent 25–40% of households.
Industrial stoves produced with mechanized methods, using precision-tooling and higher performing
materials, are being utilized by <2.5% of ICS-owning households (4–5 million) by late 2013. The
situation is particularly stark in Africa where underdeveloped, semi-industrial ICS markets mean that
artisanal solutions account for over 90% of improved stoves in use. In markets like China, in contrast,
the vast majority of improved and clean stoves are industrially or semi-industrially produced.
F I G U R E 4 . 7 :
Distribution of Ceramic Jiko and Comparable Models in Sub-Saharan Africa
Country Local Name
Kenya Kenya Ceramic Jiko
Rwanda Canamake
Sudan
Uganda
Tanzania
Malawi
Ghana Gyapa
KCJ/Ceramic Mbaula
JikoBora
Ceramic Sigiri/Usika
Canunel Sarour
Senegal
Zambia Ziko
Jambar/Diambar
Ethiopia Lakech
Mali Sewa
Burundi KCJ
Diambar/SewaBurkina Faso
DRC
Madagascar Fatana Mitsitsy
Somalia Kenya Jiko
Butembo/KCJ
Mauritania Sewa
Source: Press searches, interviews, Karakezi (2008); Dalberg analysis.
I N D I A N
O C E A N
A T L A N T I C
O C E A N
IBRD 41300 | NOVEMBER 2014
1,000,000 HOUSEHOLDS
500,000 HOUSEHOLDS
LESS THAN 10,000 HOUSEHOLDS
This map was produced by the Map Design Unit of The World Bank.The boundaries, colors, denominations and any other informationshown on this map do not imply, on the part of The World BankGroup, any judgment on the legal status of any territory, or anyendorsement or acceptance of such boundaries.
GSDPMMap Design Unit
Source: Press searches, interviews, Karakezi (2008); Dalberg analysis.
Original KenyanCeramic Jiko
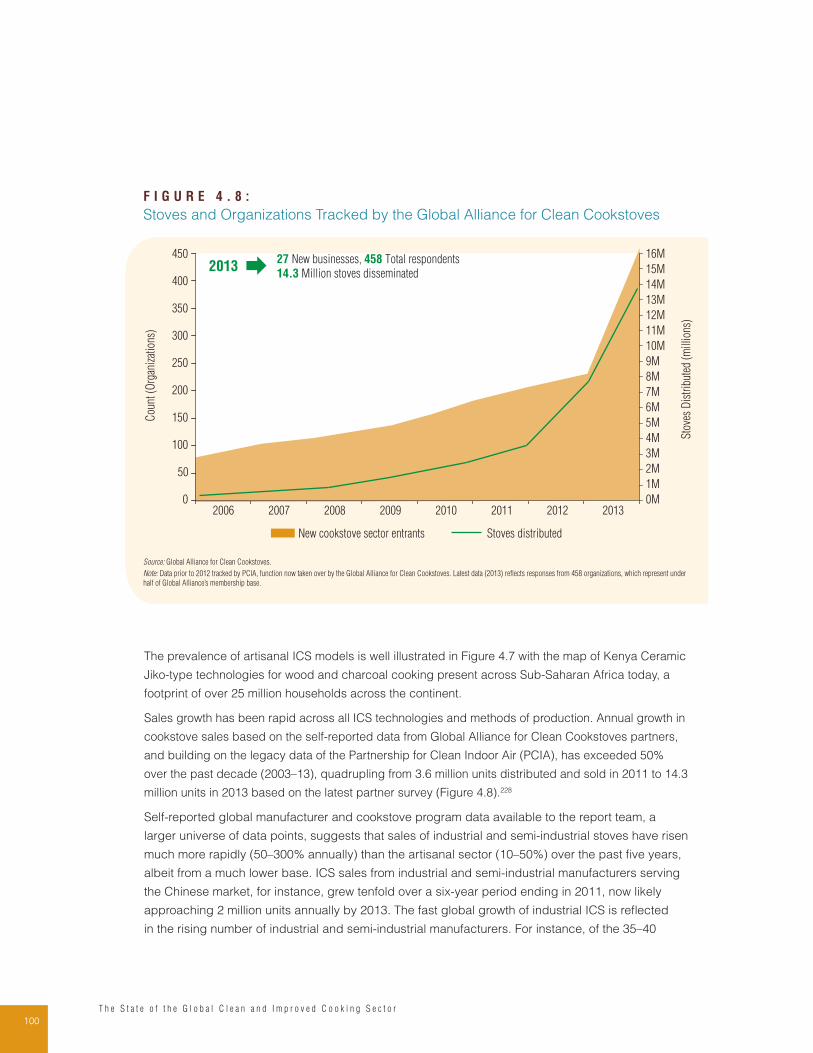
100T h e S t a t e o f t h e G l o b a l C l e a n a n d I m p r o v e d C o o k i n g S e c t o r
The prevalence of artisanal ICS models is well illustrated in Figure 4.7 with the map of Kenya Ceramic
Jiko-type technologies for wood and charcoal cooking present across Sub-Saharan Africa today, a
footprint of over 25 million households across the continent.
Sales growth has been rapid across all ICS technologies and methods of production. Annual growth in
cookstove sales based on the self-reported data from Global Alliance for Clean Cookstoves partners,
and building on the legacy data of the Partnership for Clean Indoor Air (PCIA), has exceeded 50%
over the past decade (2003–13), quadrupling from 3.6 million units distributed and sold in 2011 to 14.3
million units in 2013 based on the latest partner survey (Figure 4.8).228
Self-reported global manufacturer and cookstove program data available to the report team, a
larger universe of data points, suggests that sales of industrial and semi-industrial stoves have risen
much more rapidly (50–300% annually) than the artisanal sector (10–50%) over the past five years,
albeit from a much lower base. ICS sales from industrial and semi-industrial manufacturers serving
the Chinese market, for instance, grew tenfold over a six-year period ending in 2011, now likely
approaching 2 million units annually by 2013. The fast global growth of industrial ICS is reflected
in the rising number of industrial and semi-industrial manufacturers. For instance, of the 35–40
F I G U R E 4 . 8 :
Stoves and Organizations Tracked by the Global Alliance for Clean Cookstoves
Stoves distributedNew cookstove sector entrants
27 New businesses, 458 Total respondents
14.3 Million stoves disseminated2013
Cou
nt (
Org
aniz
atio
ns)
Sto
ves
Dis
trib
uted
(m
illio
ns)
450
250
300
350
400
200
150
100
50
0
9M
11M
10M
12M
13M
14M
15M
16M
8M
6M
7M
4M
3M
5M
2M
1M
0M20132011 201220102009200820072006
Source: Global Alliance for Clean Cookstoves.
Note: Data prior to 2012 tracked by PCIA, function now taken over by the Global Alliance for Clean Cookstoves. Latest data (2013) reflects responses from 458 organizations, which represent under
half of Global Alliance’s membership base.
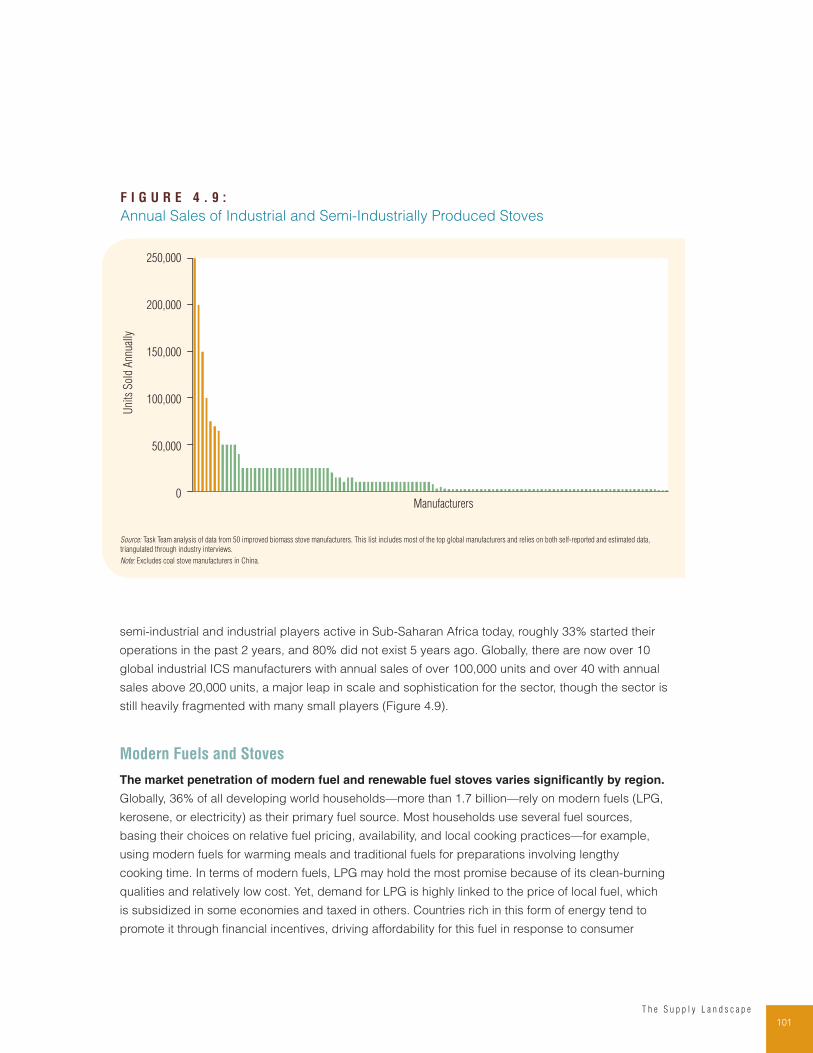
101T h e S u p p l y L a n d s c a p e
semi-industrial and industrial players active in Sub-Saharan Africa today, roughly 33% started their
operations in the past 2 years, and 80% did not exist 5 years ago. Globally, there are now over 10
global industrial ICS manufacturers with annual sales of over 100,000 units and over 40 with annual
sales above 20,000 units, a major leap in scale and sophistication for the sector, though the sector is
still heavily fragmented with many small players (Figure 4.9).
Modern Fuels and Stoves
The market penetration of modern fuel and renewable fuel stoves varies significantly by region.
Globally, 36% of all developing world households—more than 1.7 billion—rely on modern fuels (LPG,
kerosene, or electricity) as their primary fuel source. Most households use several fuel sources,
basing their choices on relative fuel pricing, availability, and local cooking practices—for example,
using modern fuels for warming meals and traditional fuels for preparations involving lengthy
cooking time. In terms of modern fuels, LPG may hold the most promise because of its clean-burning
qualities and relatively low cost. Yet, demand for LPG is highly linked to the price of local fuel, which
is subsidized in some economies and taxed in others. Countries rich in this form of energy tend to
promote it through financial incentives, driving affordability for this fuel in response to consumer
F I G U R E 4 . 9 :
Annual Sales of Industrial and Semi-Industrially Produced Stoves
0
50,000
100,000
150,000
200,000
250,000
Uni
ts S
old
Ann
ually
Manufacturers
Source: Task Team analysis of data from 50 improved biomass stove manufacturers. This list includes most of the top global manufacturers and relies on both self-reported and estimated data,
triangulated through industry interviews.
Note: Excludes coal stove manufacturers in China.
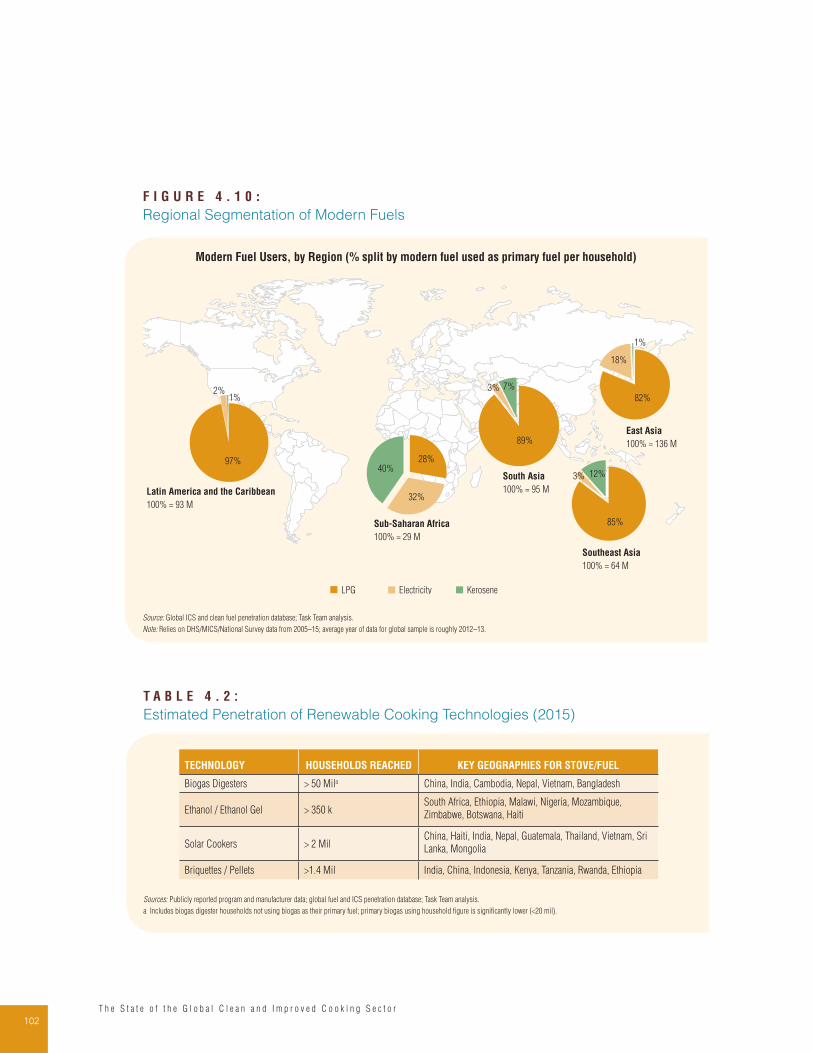
102T h e S t a t e o f t h e G l o b a l C l e a n a n d I m p r o v e d C o o k i n g S e c t o r
F I G U R E 4 . 1 0 :
Regional Segmentation of Modern Fuels
2%1%
97%40%
28%
32%
89%
18%
82%
85%
12%3%
7%3%
1%
East Asia
100% = 136 M
South Asia
100% = 95 M
Sub-Saharan Africa
100% = 29 M
Southeast Asia
100% = 64 M
Latin America and the Caribbean
100% = 93 M
Modern Fuel Users, by Region (% split by modern fuel used as primary fuel per household)
LPG Electricity Kerosene
Source: Global ICS and clean fuel penetration database; Task Team analysis.
Note: Relies on DHS/MICS/National Survey data from 2005–15; average year of data for global sample is roughly 2012–13.
T A B L E 4 . 2 :
Estimated Penetration of Renewable Cooking Technologies (2015)
TECHNOLOGY HOUSEHOLDS REACHED KEY GEOGRAPHIES FOR STOVE/FUEL
Biogas Digesters > 50 Mila China, India, Cambodia, Nepal, Vietnam, Bangladesh
Ethanol / Ethanol Gel > 350 kSouth Africa, Ethiopia, Malawi, Nigeria, Mozambique,
Zimbabwe, Botswana, Haiti
Solar Cookers > 2 MilChina, Haiti, India, Nepal, Guatemala, Thailand, Vietnam, Sri
Lanka, Mongolia
Briquettes / Pellets >1.4 Mil India, China, Indonesia, Kenya, Tanzania, Rwanda, Ethiopia
Sources: Publicly reported program and manufacturer data; global fuel and ICS penetration database; Task Team analysis.
a Includes biogas digester households not using biogas as their primary fuel; primary biogas using household figure is significantly lower (<20 mil).
103T h e S u p p l y L a n d s c a p e
demands. Multiple local distribution channels distribute cylinders to remote consumers; these
channels are difficult to regulate.229
In terms of the breakdown among modern fuels, LPG is the dominant fuel type in most regions, making
up over 70% of modern fuel use in all regions, except Sub-Saharan Africa (Figure 4.10). In some
regions, the figure is higher than 90%.
Renewable Fuels and Stoves
Relative to improved solid fuel cookstoves and modern fuel stoves, usage of renewable alternative
fuel source stoves is even more limited. As shown in Table 4.2, an estimated 45–50 million households
worldwide rely on biodigesters, with the vast majority located in China (over 40 million) and India (about
5 million). There are estimated to be over 2 million solar cookers worldwide, about 1.5 million of them in
China, and fewer than 50,000 liquid biofuel (e.g., ethanol cookstove) users.
E N D N O T E S
212 See the Clean Cooking Catalog available at: catalog.cleancookstoves.org.
213 See EnDev at http://www.endev.org. EnDev is a multi-donor program, spearheaded by GIZ, that has been the
biggest donor program in terms of improved stoves delivered globally over the past 10 years.
214 Ezy Stove: http://www.ezylife.com/shop/ezystove
215 http://cookstoves.lbl.gov/darfur.php
216 http://www.mwotostove.com/; http://www.pekope.info/stove.html
217 Mobarak and Grant, 2011.
218 http://servalsgroup.blogspot.in/2008/06/energy-efficient-kerosene-stoves.html
219 Personal interview with Alex Evans, Global LPG Partnership, New York, October 2012.
220 http://solarcooking.wikia.com/wiki/SolSource_3-in-1
221 http://www.projectgaia.com/blog/2012/10/05/new-gaia-annoucements-ethiopia-haiti-madagascar/
222 http://www.gvepinternational.org/sites/default/files/briquette_businesses_in_uganda.pdf
223 http://www.gvepinternational.org/sites/default/files/briquette_businesses_in_uganda.pdf
224 Mercer et al., 2011.
225 World Bank, 2011b.
226 Hanna et al., 2012.
227 Discussion of Central and Latin America region stoves draws on Wang et al. (2013), the Global Alliance market
assessment reports on Peru, Mexico, Guatemala, Colombia, and Brazil, regional interviews, and web searches.
228 Global Alliance for Clean Cookstoves, 2014a.
229 World Bank, 2011c.
104T h e S t a t e o f t h e G l o b a l C l e a n a n d I m p r o v e d C o o k i n g S e c t o r
T H E C O O K I N G A P P L I A N C E S U P P LY C H A I N
This chapter provides an overview of the supply chain for clean and improved cookstoves, highlighting
key trends, challenges, and opportunities across components.
The cookstove value chain is composed of a number of activities, including research and
product development, production, marketing, distribution, and after-sales service. Underpinning
the whole value chain are the financial and regulatory systems that enhance both supply and demand.
With this as the basic framework, the rest of the chapter is devoted to understanding the variation in
the actors involved at each stage and the different models employed.
A. RESEARCH AND DEVELOPMENT
Research and development is an essential component of the cooking appliance value chain,
especially as players attempt to mainstream their products in frontier markets. A wide variety of
customer segments exist for cookstoves based on characteristics and price points. While competition
and the attractiveness of the growing markets will incentivize research and development (R&D)
investment, strategic engagement in the R&D process by donors and other actors may facilitate even
greater expansion in this crucial component of the supply chain.
Although R&D in the cooking appliance sector lacks focus, three successful primary models for
product development and research have emerged. These models are based on local designs,
international designs, or hybrids. Different players in the cookstove ecosystem have opted for different
R&D approaches. These are outlined in Table 5.1, alongside some of the key players.
Each of the three models comes with unique challenges and advantages. Locally designed stoves are
created with a better view of the market in mind, but often lack the finance or capacity to develop high
quality models. By contrast, international stoves may use high-end materials and yield greater benefits
to consumers, but they are often poorly adapted to the local user, especially in terms of price. Hybrid
models seek to take advantage of the best of both worlds, but are difficult to execute in practice given
multiple remote designers.
B. PRODUCTION MODELS
As with the research and product development phase of the cooking appliance value chain, the
production process can also be broken down into several subprocesses. Each subprocess can be
organized in different ways. As illustrated in Figure 5.1, the production phase comprises raw material
purchase, labor, and manufacturing. This is followed by a post-production phase, involving shipping
(if applicable), government charges, and all costs associated with distribution and retailing. This
value chain has been generalized in order to parse out the differences between different production
processes and technologies. Although its construction is most relevant to the supply of biomass
5
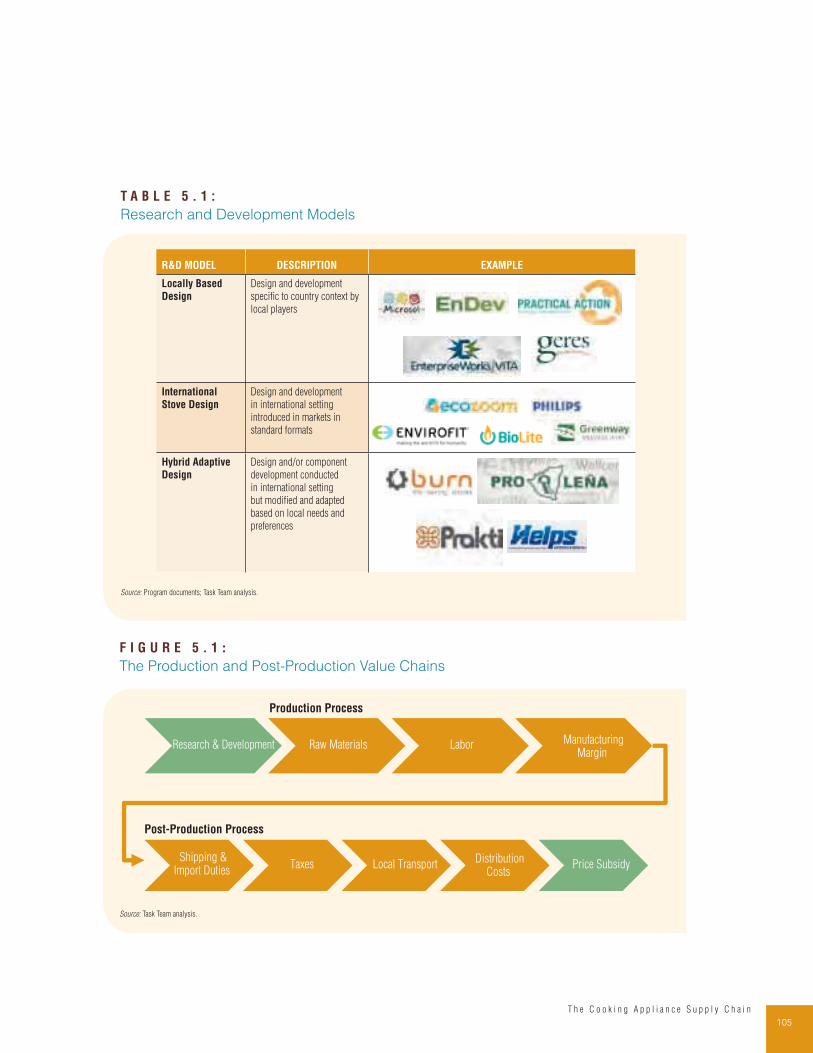
105T h e C o o k i n g A p p l i a n c e S u p p l y C h a i n
T A B L E 5 . 1 :
Research and Development Models
R&D MODEL DESCRIPTION EXAMPLE
Locally Based
Design
Design and development
specific to country context by
local players
International
Stove Design
Design and development
in international setting
introduced in markets in
standard formats
Hybrid Adaptive
Design
Design and/or component
development conducted
in international setting
but modified and adapted
based on local needs and
preferences
Source: Program documents; Task Team analysis.
F I G U R E 5 . 1 :
The Production and Post-Production Value Chains
Research & Development Raw Materials Labor ManufacturingMargin
Shipping &Import Duties
Taxes Local Transport Distribution
Costs Price Subsidy
Production Process
Post-Production Process
Source: Task Team analysis.
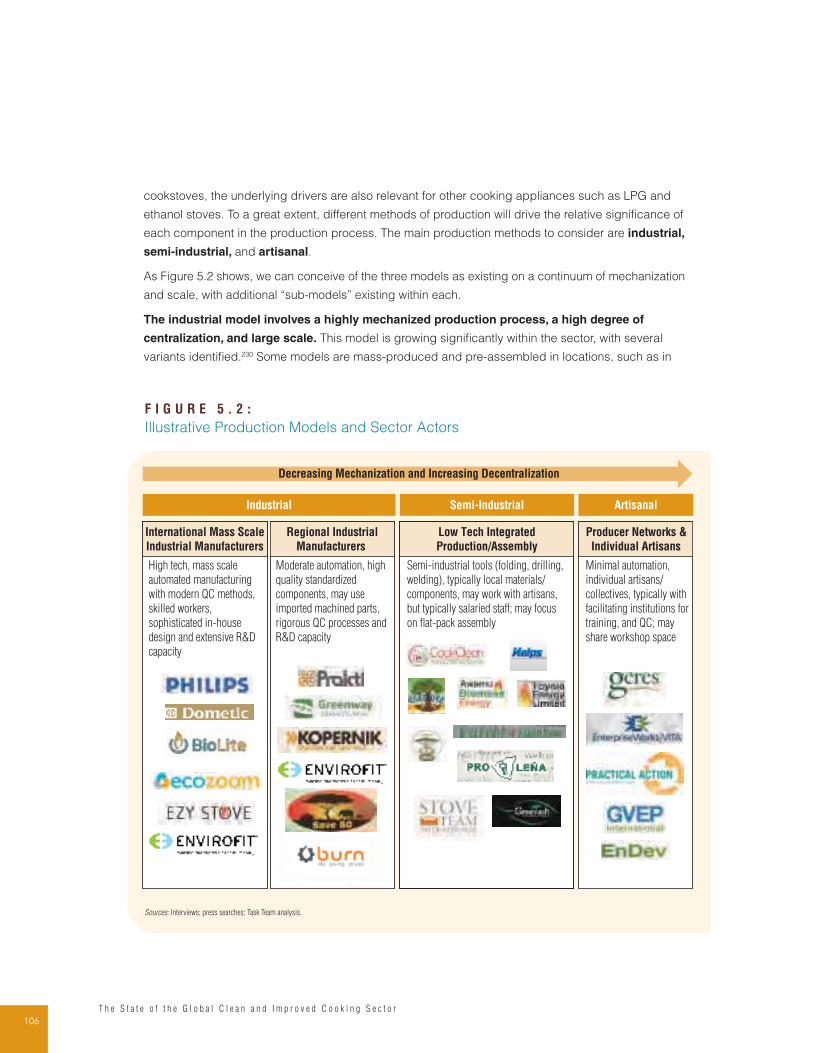
106T h e S t a t e o f t h e G l o b a l C l e a n a n d I m p r o v e d C o o k i n g S e c t o r
cookstoves, the underlying drivers are also relevant for other cooking appliances such as LPG and
ethanol stoves. To a great extent, different methods of production will drive the relative significance of
each component in the production process. The main production methods to consider are industrial,
semi-industrial, and artisanal.
As Figure 5.2 shows, we can conceive of the three models as existing on a continuum of mechanization
and scale, with additional “sub-models” existing within each.
The industrial model involves a highly mechanized production process, a high degree of
centralization, and large scale. This model is growing significantly within the sector, with several
variants identified.230 Some models are mass-produced and pre-assembled in locations, such as in
F I G U R E 5 . 2 :
Illustrative Production Models and Sector Actors
Industrial Semi-Industrial Artisanal
Producer Networks &
Individual Artisans
Decreasing Mechanization and Increasing Decentralization
Minimal automation,
individual artisans/
collectives, typically with
facilitating institutions for
training, and QC; may
share workshop space
Moderate automation, high
quality standardized
components, may use
imported machined parts,
rigorous QC processes and
R&D capacity
International Mass Scale
Industrial Manufacturers
Regional Industrial
Manufacturers
High tech, mass scale
automated manufacturing
with modern QC methods,
skilled workers,
sophisticated in-house
design and extensive R&D
capacity
Low Tech Integrated
Production/Assembly
Semi-industrial tools (folding, drilling,
welding), typically local materials/
components, may work with artisans,
but typically salaried staff; may focus
on flat-pack assembly
Sources: Interviews; press searches; Task Team analysis.
107T h e C o o k i n g A p p l i a n c e S u p p l y C h a i n
China, India, or Europe, in order to serve export markets. They meet a high standard of production
and performance. A second variant of the model involves having some or all of the core components
centrally manufactured for export and then assembled in the recipient country. The last variant
is wholly “local” industrialized production whereby factories are established within the country of
final sale. With this final model, some raw material inputs may still be imported, but the component
manufacture and final assembly are all centrally integrated.
The semi-industrialized model involves cookstove production in a centralized setting, but with
fewer mechanized tools and processes than in a factory or industrialized approach. The model
may involve workshop-based production, using molds and similar tools for standardization, and hand
assembly, or may involve a network of individuals centrally coordinated and all using similar designs,
tools, and processes. Production scale of these semi-industrial models can range from a few hundred
to a few thousand stoves per month.231
In the artisanal model, which is a further step down on the mechanization and centralization
spectrum, stoves are made locally by artisans or small enterprises. This model draws on existing
trade skills (potters, tinsmiths, blacksmiths) and is based on an existing design for both portable and
fixed/built-in stoves. Although scale is typically quite small (fewer than 5,000 stoves per year), artisans
are often well embedded in their communities, which eases distribution challenges and facilitates after-
sales support and repair. In addition, aggregation and adequate support can lead to larger scale. To
date, this production process has been far and away the most common one for manufacturing stoves
used in Sub-Saharan Africa, Southeast Asia, and South Asia.
C. DISTRIBUTION
Once the cookstove has been produced, the next phase of the value chain is the distribution. In many
contexts and for many products, including stoves, this is the key bottleneck to scaling up adoption.
The stoves must be taken from the transporter or manufacturer, cleared through customs (if they are
being imported), and then transported to wholesalers or retailers. From this point, a variety of models
exist for taking the stoves to the household level.
Although distribution models are still emerging and stand to be improved, several have
already demonstrated success, especially in the South Asian and Sub-Saharan African
markets. In each model, producers are attempting to facilitate linkages that maximize their
exposure to consumers while minimizing their costs of doing so. This is an especially tough
challenge when seeking to penetrate Africa’s thoroughly dispersed rural market, where many
traditional appliance distribution networks do not reach, and institutional distribution channels
and NGOs also frequently have limited capacity and footprint. Part of the challenge is picking
production location and achieving scale. Artisanal models are generally produced close to their
markets and none of the producers interviewed spent more than $ 3 per cookstove on distribution
and retailer margins. For industrial stoves, the costs were much higher and a great deal more
variable, ranging from $ 5–15 per cookstove, with international producers incurring the highest
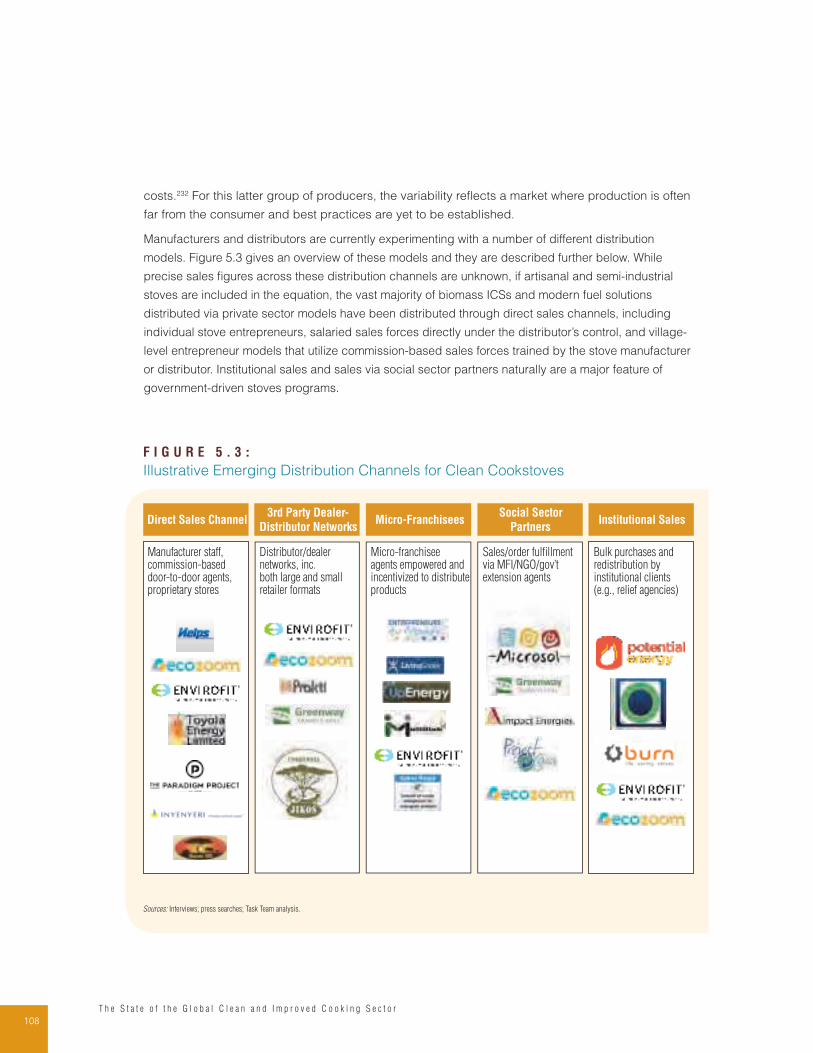
108T h e S t a t e o f t h e G l o b a l C l e a n a n d I m p r o v e d C o o k i n g S e c t o r
costs.232 For this latter group of producers, the variability reflects a market where production is often
far from the consumer and best practices are yet to be established.
Manufacturers and distributors are currently experimenting with a number of different distribution
models. Figure 5.3 gives an overview of these models and they are described further below. While
precise sales figures across these distribution channels are unknown, if artisanal and semi-industrial
stoves are included in the equation, the vast majority of biomass ICSs and modern fuel solutions
distributed via private sector models have been distributed through direct sales channels, including
individual stove entrepreneurs, salaried sales forces directly under the distributor’s control, and village-
level entrepreneur models that utilize commission-based sales forces trained by the stove manufacturer
or distributor. Institutional sales and sales via social sector partners naturally are a major feature of
government-driven stoves programs.
F I G U R E 5 . 3 :
Illustrative Emerging Distribution Channels for Clean Cookstoves
Direct Sales Channel3rd Party Dealer-
Distributor Networks Micro-Franchisees
Social Sector
PartnersInstitutional Sales
Manufacturer staff, commission-based door-to-door agents, proprietary stores
Distributor/dealer networks, inc. both large and small retailer formats
Micro-franchisee agents empowered and incentivized to distribute products
Bulk purchases and redistribution by institutional clients (e.g., relief agencies)
Sales/order fulfillment via MFI/NGO/gov’t extension agents
Sources: Interviews; press searches; Task Team analysis.

109T h e C o o k i n g A p p l i a n c e S u p p l y C h a i n
The mix between these channels differs dramatically between different markets. In Africa, the private
sector channel is likely the dominant mode for stove distribution, with most industrial stove sales
utilizing the direct distribution or third-party distribution model. In China, most stoves sales directly or
indirectly involve government involvement, though in many cases the ultimate distribution is executed
by private sector players. A recent large-scale survey of biomass ICS manufacturers in China shows
that half of all sales involve third-party distribution through wholesalers (42%) and retailers (11%),
one-fifth of sales are direct to consumers (19%), and nearly one-third are institutional sales to regional
and city governments (28%).233 Likewise, in Latin America, the picture is heavily dominated by
institutional and NGO-based distribution with a limited commercial component. In Peru, for example,
the Global Alliance’s market assessment report estimated that half of stove distribution is managed
through government channels and the balance is largely accounted for by NGO distribution (47%),
with the private sector accounting for only 3% of stoves installed annually.
D. CONSUMER MARKETING
Levels of consumer awareness of the general benefits of improved cooking appliances, as
well as of particular stove products, are key determinants of successful scale-up. In general,
consumers are largely unaware of the negative impacts associated with traditional cooking practices,
and do not highly value improved stoves. Marketing and education, thus, have an important role to
play in generating and sustaining consumer demand and can be incorporated into both distribution
channels and financing mechanisms within the cookstove value chain.
Marketing approaches (in both the development sector and the sector for commercial consumer
products) can be either “above-the-line” or “below-the-line.” Above-the-line approaches include
traditional mass media such as TV and radio advertisements. Below-the-line channels include less
traditional mechanisms such as road-shows, community theatre and folk songs, demonstrations, and
direct door-to-door marketing. Local and national government partners can also be engaged, as can
community health workers affiliated with government clinics. Such actors are well respected within
the community. They can be trained and enlisted to disseminate information about improved cooking
practices and technologies along with their other activities.
The biggest challenge in this section of the value chain has been the lack of investment in large-
scale consumer marketing. This largely results from the fact that the returns from any such investment
are largely public and not private. In this case, any company that invests in raising consumer
awareness about the benefits of improved stoves may increase the demand for these products, but
cannot be assured that consumers will buy from them rather than from a competitor. This is a classic
coordination failure around providing a public good. Many governments and agencies recognize this,
as well as the need for them to fund consumer awareness. The marketing challenge seems to be of
greater concern for the high-cost, high-performance second- and third-generation stoves—more so
than with the locally produced artisanal stoves. For these products, because the price point is so much
higher and the benefits are much less tangible, the depth of education and awareness raising required
is more costly and more difficult.
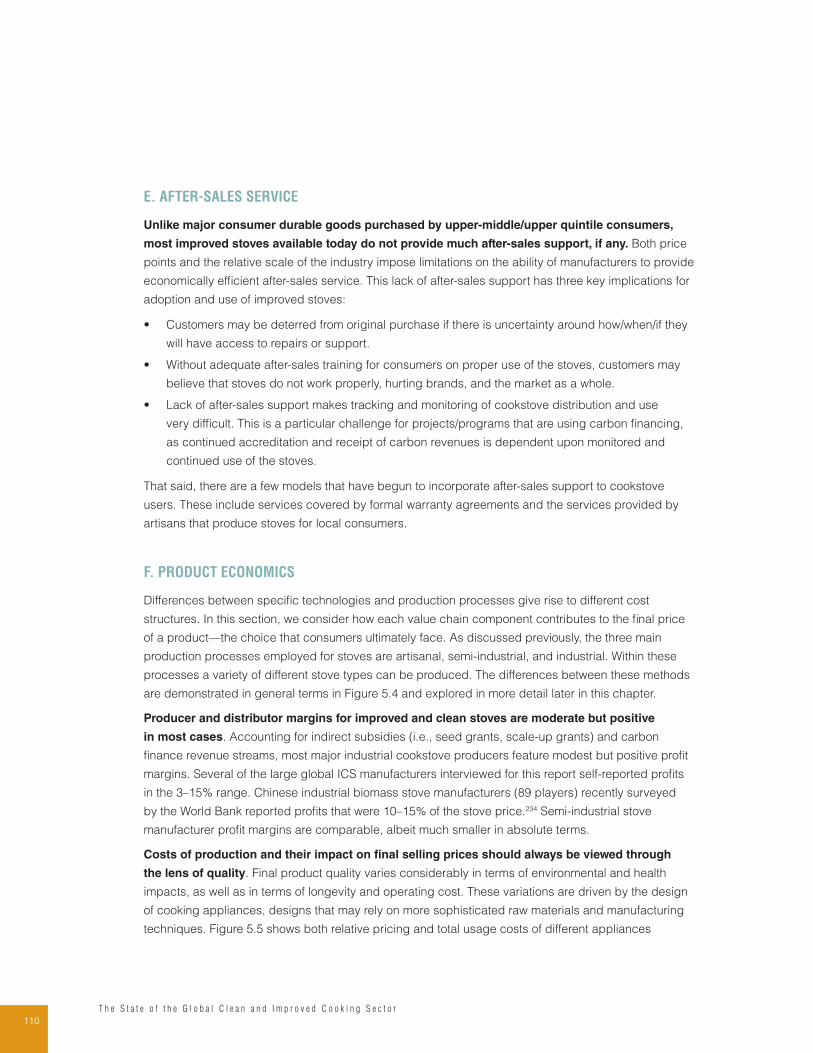
110T h e S t a t e o f t h e G l o b a l C l e a n a n d I m p r o v e d C o o k i n g S e c t o r
E. AFTER-SALES SERVICE
Unlike major consumer durable goods purchased by upper-middle/upper quintile consumers,
most improved stoves available today do not provide much after-sales support, if any. Both price
points and the relative scale of the industry impose limitations on the ability of manufacturers to provide
economically efficient after-sales service. This lack of after-sales support has three key implications for
adoption and use of improved stoves:
• Customers may be deterred from original purchase if there is uncertainty around how/when/if they
will have access to repairs or support.
• Without adequate after-sales training for consumers on proper use of the stoves, customers may
believe that stoves do not work properly, hurting brands, and the market as a whole.
• Lack of after-sales support makes tracking and monitoring of cookstove distribution and use
very difficult. This is a particular challenge for projects/programs that are using carbon financing,
as continued accreditation and receipt of carbon revenues is dependent upon monitored and
continued use of the stoves.
That said, there are a few models that have begun to incorporate after-sales support to cookstove
users. These include services covered by formal warranty agreements and the services provided by
artisans that produce stoves for local consumers.
F. PRODUCT ECONOMICS
Differences between specific technologies and production processes give rise to different cost
structures. In this section, we consider how each value chain component contributes to the final price
of a product—the choice that consumers ultimately face. As discussed previously, the three main
production processes employed for stoves are artisanal, semi-industrial, and industrial. Within these
processes a variety of different stove types can be produced. The differences between these methods
are demonstrated in general terms in Figure 5.4 and explored in more detail later in this chapter.
Producer and distributor margins for improved and clean stoves are moderate but positive
in most cases. Accounting for indirect subsidies (i.e., seed grants, scale-up grants) and carbon
finance revenue streams, most major industrial cookstove producers feature modest but positive profit
margins. Several of the large global ICS manufacturers interviewed for this report self-reported profits
in the 3–15% range. Chinese industrial biomass stove manufacturers (89 players) recently surveyed
by the World Bank reported profits that were 10–15% of the stove price.234 Semi-industrial stove
manufacturer profit margins are comparable, albeit much smaller in absolute terms.
Costs of production and their impact on final selling prices should always be viewed through
the lens of quality. Final product quality varies considerably in terms of environmental and health
impacts, as well as in terms of longevity and operating cost. These variations are driven by the design
of cooking appliances, designs that may rely on more sophisticated raw materials and manufacturing
techniques. Figure 5.5 shows both relative pricing and total usage costs of different appliances
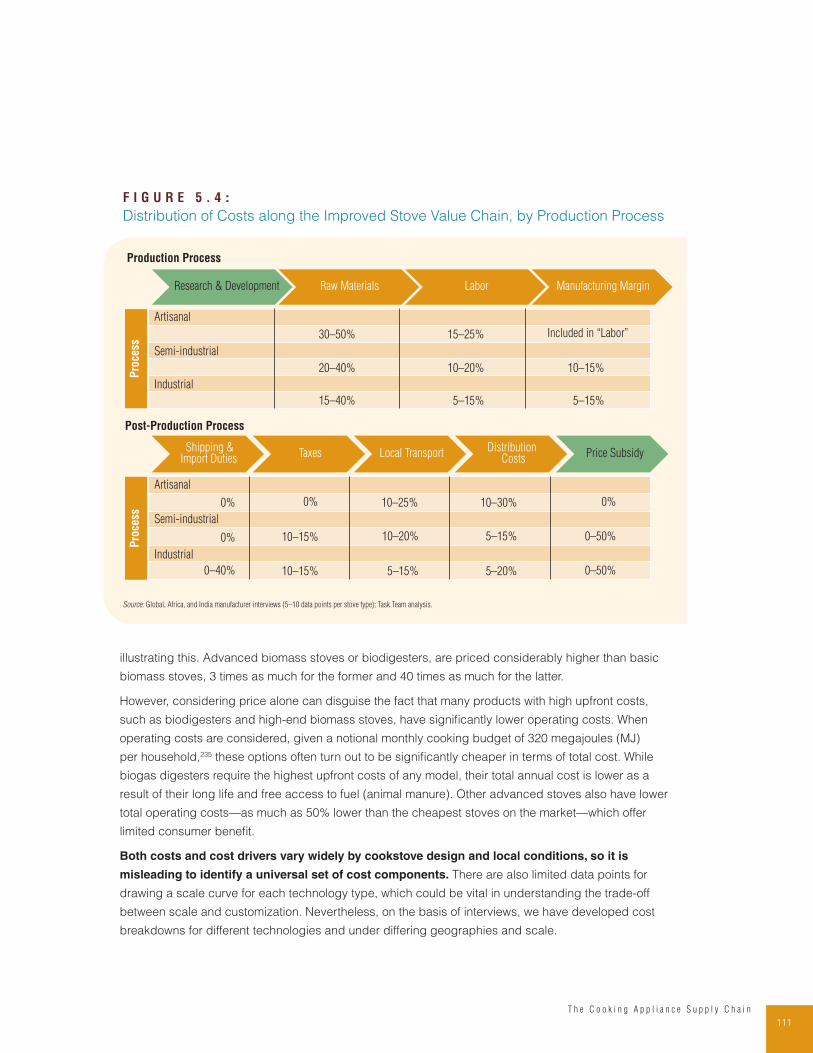
111T h e C o o k i n g A p p l i a n c e S u p p l y C h a i n
illustrating this. Advanced biomass stoves or biodigesters, are priced considerably higher than basic
biomass stoves, 3 times as much for the former and 40 times as much for the latter.
However, considering price alone can disguise the fact that many products with high upfront costs,
such as biodigesters and high-end biomass stoves, have significantly lower operating costs. When
operating costs are considered, given a notional monthly cooking budget of 320 megajoules (MJ)
per household,235 these options often turn out to be significantly cheaper in terms of total cost. While
biogas digesters require the highest upfront costs of any model, their total annual cost is lower as a
result of their long life and free access to fuel (animal manure). Other advanced stoves also have lower
total operating costs—as much as 50% lower than the cheapest stoves on the market—which offer
limited consumer benefit.
Both costs and cost drivers vary widely by cookstove design and local conditions, so it is
misleading to identify a universal set of cost components. There are also limited data points for
drawing a scale curve for each technology type, which could be vital in understanding the trade-off
between scale and customization. Nevertheless, on the basis of interviews, we have developed cost
breakdowns for different technologies and under differing geographies and scale.
F I G U R E 5 . 4 :
Distribution of Costs along the Improved Stove Value Chain, by Production Process
Research & Development Raw Materials Labor Manufacturing Margin
Artisanal
Industrial
Artisanal
Industrial
Shipping &Import Duties
Taxes Local TransportDistribution
CostsPrice Subsidy
Production Process
Post-Production Process
Semi-industrial
Semi-industrial
30–50% 15–25%
20–40% 10–20% 10–15%
5–15%
10–30%
5–15%
5–20%
0%
0–50%
0–50%
15–40% 5–15%
0% 10–25%
10–15%
10–15%
10–20%
0%
0%
0–40% 5–15%
Included in “Labor”
Pro
cess
Pro
cess
Source: Global, Africa, and India manufacturer interviews (5–10 data points per stove type); Task Team analysis.
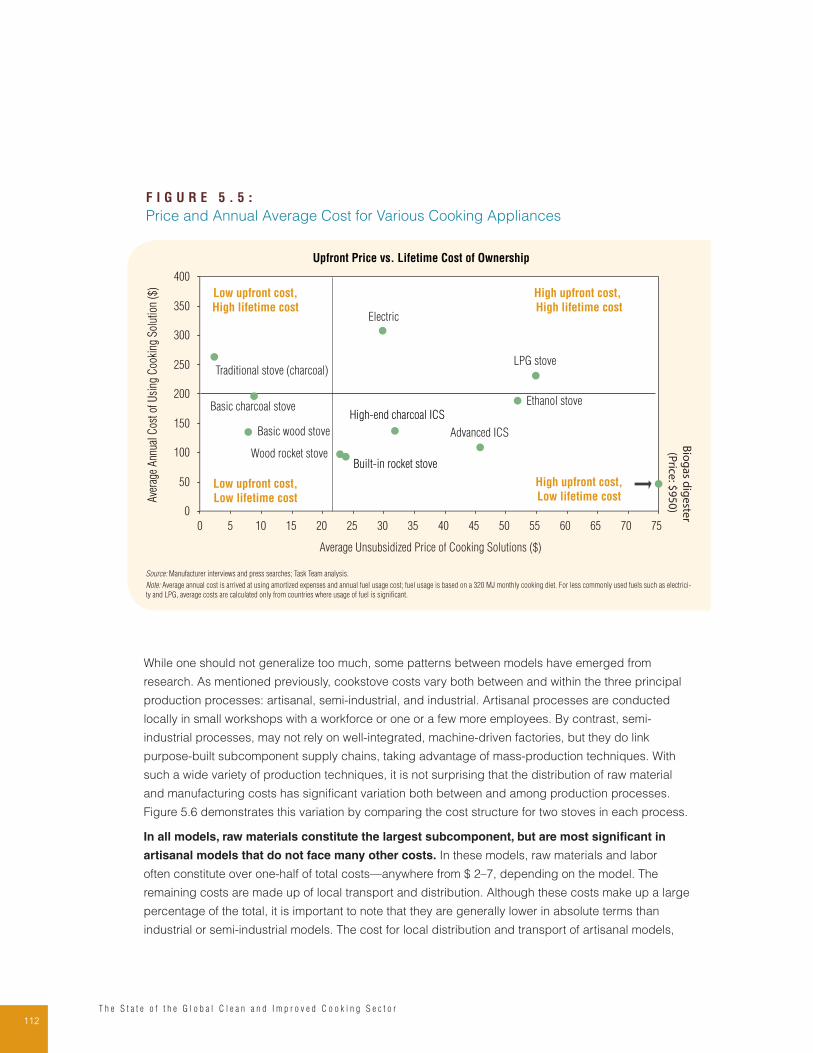
112T h e S t a t e o f t h e G l o b a l C l e a n a n d I m p r o v e d C o o k i n g S e c t o r
While one should not generalize too much, some patterns between models have emerged from
research. As mentioned previously, cookstove costs vary both between and within the three principal
production processes: artisanal, semi-industrial, and industrial. Artisanal processes are conducted
locally in small workshops with a workforce or one or a few more employees. By contrast, semi-
industrial processes, may not rely on well-integrated, machine-driven factories, but they do link
purpose-built subcomponent supply chains, taking advantage of mass-production techniques. With
such a wide variety of production techniques, it is not surprising that the distribution of raw material
and manufacturing costs has significant variation both between and among production processes.
Figure 5.6 demonstrates this variation by comparing the cost structure for two stoves in each process.
In all models, raw materials constitute the largest subcomponent, but are most significant in
artisanal models that do not face many other costs. In these models, raw materials and labor
often constitute over one-half of total costs—anywhere from $ 2–7, depending on the model. The
remaining costs are made up of local transport and distribution. Although these costs make up a large
percentage of the total, it is important to note that they are generally lower in absolute terms than
industrial or semi-industrial models. The cost for local distribution and transport of artisanal models,
F I G U R E 5 . 5 :
Price and Annual Average Cost for Various Cooking Appliances
Biogas digester(Price: $950)
60 655
LPG stove
Ethanol stove
0
Basic charcoal stove
Wood rocket stove
Advanced ICS
0
400
3025
Basic wood stove
Traditional stove (charcoal)
40 45 50 55 7570
350
150
50
100
200
35
300
10 15 20
250
Average Unsubsidized Price of Cooking Solutions ($)
Ave
rage
Ann
ual C
ost o
f Usi
ng C
ooki
ng S
olut
ion
($)
Upfront Price vs. Lifetime Cost of Ownership
Low upfront cost,
High lifetime cost
High upfront cost,
High lifetime cost
High upfront cost,
Low lifetime costLow upfront cost,
Low lifetime cost
Built-in rocket stove
High-end charcoal ICS
Electric
Source: Manufacturer interviews and press searches; Task Team analysis.
Note: Average annual cost is arrived at using amortized expenses and annual fuel usage cost; fuel usage is based on a 320 MJ monthly cooking diet. For less commonly used fuels such as electrici-
ty and LPG, average costs are calculated only from countries where usage of fuel is significant.
113T h e C o o k i n g A p p l i a n c e S u p p l y C h a i n
which are often manufactured close to the end-customer, ranged from $ 2–5 among those surveyed,
while the figure was $ 5–15 in the case of industrial stoves.
Semi-industrial and industrial models face a number of costs that artisanal stoves do not. This
starts with government charges associated with these stoves being sold in the formal sector. Given the
high price point of the stoves, taxes average $ 3 for a cookstove and import duties may add another
$ 3, these numbers can rise dramatically in certain geographies where import duties and taxes on
improved stoves can reach up to 50% of the stove’s price.
Given the need for centralized, often international, production, advanced producers also incur other
costs that accrue along longer and more complicated supply chains. These include manufacturer
margins, extra distribution costs and, in the case of imported models, shipping. Of the surveyed
producers that are importing stoves, none were spending less than $ 5 and some were spending
considerably more. These additional costs can creep up. Figure 5.6 shows a wood rocket stove example
where just less than 25% of the total price is consumed by shipping and import duties. As mentioned
previously, stoves costing about $ 20 face a much larger potential market than those costing about $ 30;
there is no doubt that these additional costs can seriously affect the marketability of advanced stoves.
F I G U R E 5 . 6 :
Improved Cookstove Cost Structure for Artisanal, Semi-Industrial, and Industrial Models
ImprovedCharcoal Stove
$ 22
18%
11%
14%
16%
14%
Wood RocketStove
$ 21
14%
15%
14%
14%
11%
Semi-Industrial Production
Fan GasifierStove (Pellet)
$ 49
11%
11%
8%6%
12%
20%
Wood RocketStove
$ 41
5%
13%
23%
9%
10%
15%
Industrial ProductionArtisanal Production
EfficientCharcoal Stove
18%
$ 11
18%
23%
EfficientCharcoal Stove
$ 5
23%
21%
26%
32%27% 26%
32%30%
40%
Local Transport Shipping and Import DutiesDistribution Costs Taxes
LaborManufacturing Margin Raw Materials
Source: Stove price database with focus on Africa and South Asia based on value chain interviews; Task Team analysis.
Note: Labor costs include manufacturing margin for basic artisanal stoves.
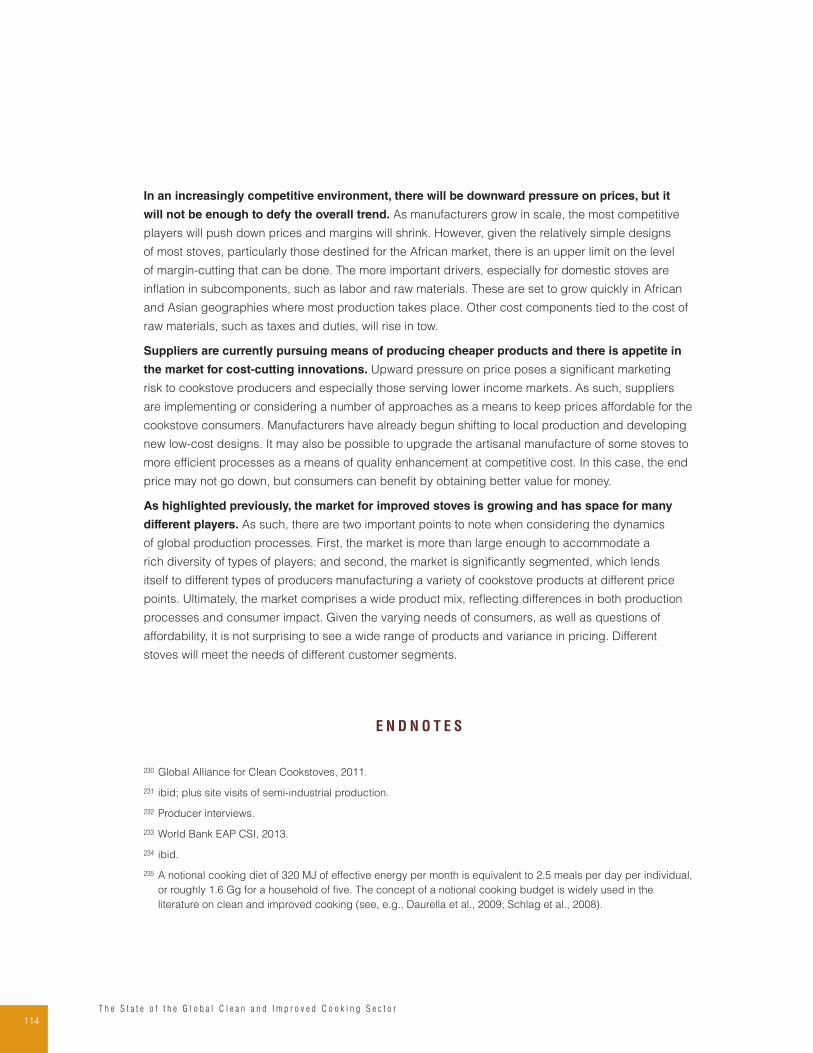
114T h e S t a t e o f t h e G l o b a l C l e a n a n d I m p r o v e d C o o k i n g S e c t o r
In an increasingly competitive environment, there will be downward pressure on prices, but it
will not be enough to defy the overall trend. As manufacturers grow in scale, the most competitive
players will push down prices and margins will shrink. However, given the relatively simple designs
of most stoves, particularly those destined for the African market, there is an upper limit on the level
of margin-cutting that can be done. The more important drivers, especially for domestic stoves are
inflation in subcomponents, such as labor and raw materials. These are set to grow quickly in African
and Asian geographies where most production takes place. Other cost components tied to the cost of
raw materials, such as taxes and duties, will rise in tow.
Suppliers are currently pursuing means of producing cheaper products and there is appetite in
the market for cost-cutting innovations. Upward pressure on price poses a significant marketing
risk to cookstove producers and especially those serving lower income markets. As such, suppliers
are implementing or considering a number of approaches as a means to keep prices affordable for the
cookstove consumers. Manufacturers have already begun shifting to local production and developing
new low-cost designs. It may also be possible to upgrade the artisanal manufacture of some stoves to
more efficient processes as a means of quality enhancement at competitive cost. In this case, the end
price may not go down, but consumers can benefit by obtaining better value for money.
As highlighted previously, the market for improved stoves is growing and has space for many
different players. As such, there are two important points to note when considering the dynamics
of global production processes. First, the market is more than large enough to accommodate a
rich diversity of types of players; and second, the market is significantly segmented, which lends
itself to different types of producers manufacturing a variety of cookstove products at different price
points. Ultimately, the market comprises a wide product mix, reflecting differences in both production
processes and consumer impact. Given the varying needs of consumers, as well as questions of
affordability, it is not surprising to see a wide range of products and variance in pricing. Different
stoves will meet the needs of different customer segments.
E N D N O T E S
230 Global Alliance for Clean Cookstoves, 2011.
231 ibid; plus site visits of semi-industrial production.
232 Producer interviews.
233 World Bank EAP CSI, 2013.
234 ibid.
235 A notional cooking diet of 320 MJ of effective energy per month is equivalent to 2.5 meals per day per individual,
or roughly 1.6 Gg for a household of five. The concept of a notional cooking budget is widely used in the
literature on clean and improved cooking (see, e.g., Daurella et al., 2009; Schlag et al., 2008).
115T h e C o o k i n g A p p l i a n c e S u p p l y C h a i n
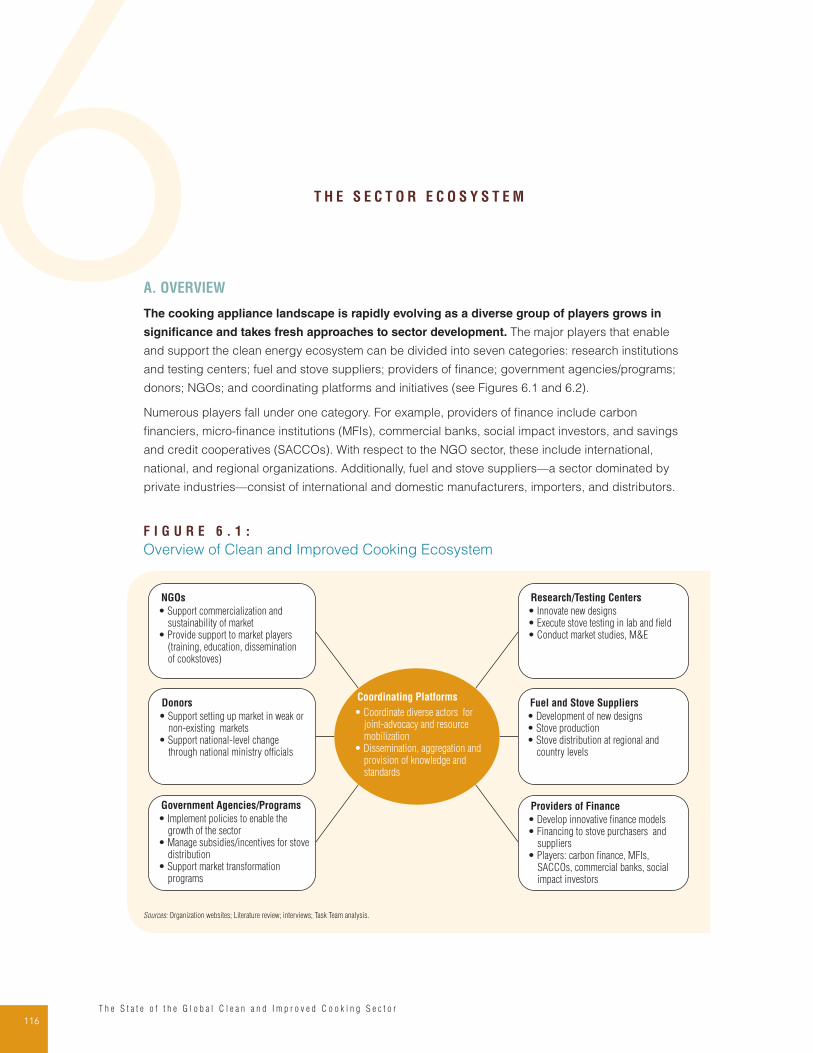
116T h e S t a t e o f t h e G l o b a l C l e a n a n d I m p r o v e d C o o k i n g S e c t o r
6 T H E S E C T O R E C O S Y S T E M
A. OVERVIEW
The cooking appliance landscape is rapidly evolving as a diverse group of players grows in
significance and takes fresh approaches to sector development. The major players that enable
and support the clean energy ecosystem can be divided into seven categories: research institutions
and testing centers; fuel and stove suppliers; providers of finance; government agencies/programs;
donors; NGOs; and coordinating platforms and initiatives (see Figures 6.1 and 6.2).
Numerous players fall under one category. For example, providers of finance include carbon
financiers, micro-finance institutions (MFIs), commercial banks, social impact investors, and savings
and credit cooperatives (SACCOs). With respect to the NGO sector, these include international,
national, and regional organizations. Additionally, fuel and stove suppliers—a sector dominated by
private industries—consist of international and domestic manufacturers, importers, and distributors.
F I G U R E 6 . 1 :
Overview of Clean and Improved Cooking Ecosystem
NGOs
• Support commercialization and
sustainability of market
• Provide support to market players
(training, education, dissemination
of cookstoves)
Donors
• Support setting up market in weak or
non-existing markets
• Support national-level change
through national ministry officials
Government Agencies/Programs
• Implement policies to enable the
growth of the sector
• Manage subsidies/incentives for stove
distribution
• Support market transformation
programs
Research/Testing Centers
• Innovate new designs
• Execute stove testing in lab and field
• Conduct market studies, M&E
Providers of Finance
• Develop innovative finance models
• Financing to stove purchasers and
suppliers
• Players: carbon finance, MFIs,
SACCOs, commercial banks, social
impact investors
Coordinating Platforms
• Coordinate diverse actors for
joint-advocacy and resource
mobilization
• Dissemination, aggregation and
provision of knowledge and
standards
Fuel and Stove Suppliers
• Development of new designs
• Stove production
• Stove distribution at regional and
country levels
Sources: Organization websites; Literature review; interviews; Task Team analysis.
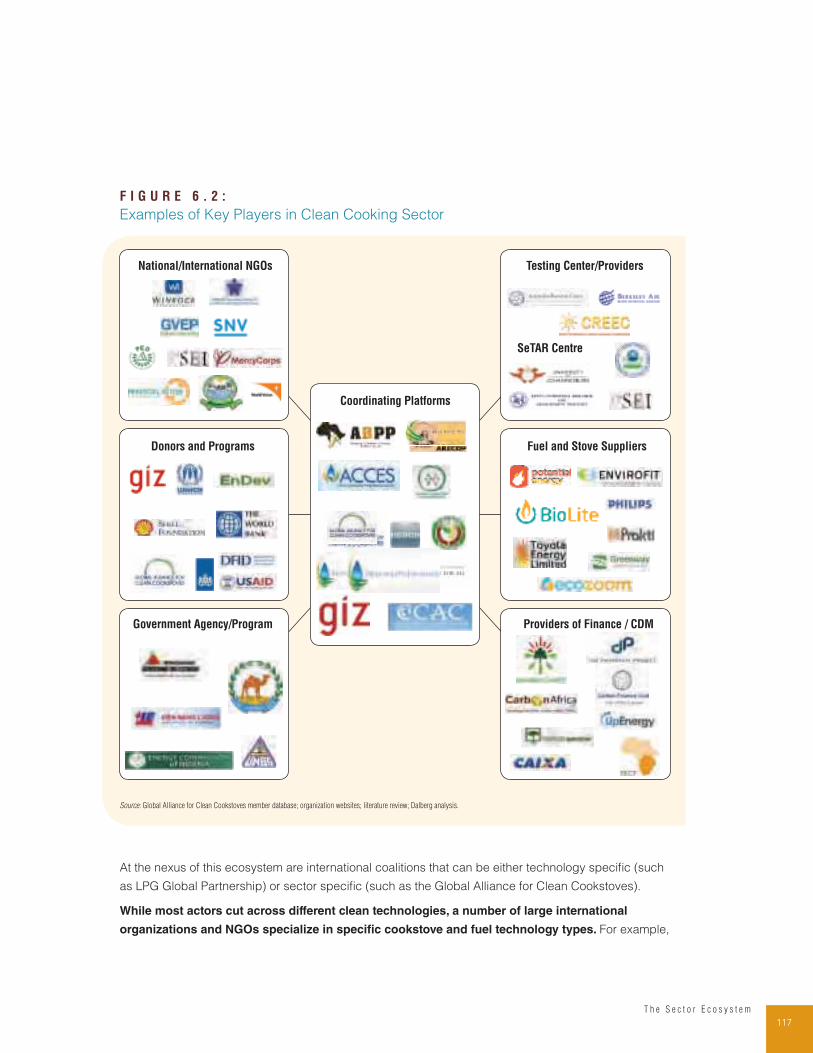
117T h e S e c t o r E c o s y s t e m
At the nexus of this ecosystem are international coalitions that can be either technology specific (such
as LPG Global Partnership) or sector specific (such as the Global Alliance for Clean Cookstoves).
While most actors cut across different clean technologies, a number of large international
organizations and NGOs specialize in specific cookstove and fuel technology types. For example,
F I G U R E 6 . 2 :
Examples of Key Players in Clean Cooking Sector
National/International NGOs
Government Agency/Program
Donors and Programs
Coordinating Platforms
Testing Center/Providers
SeTAR Centre
Fuel and Stove Suppliers
Providers of Finance / CDM
Source: Global Alliance for Clean Cookstoves member database; organization websites; literature review; Dalberg analysis.
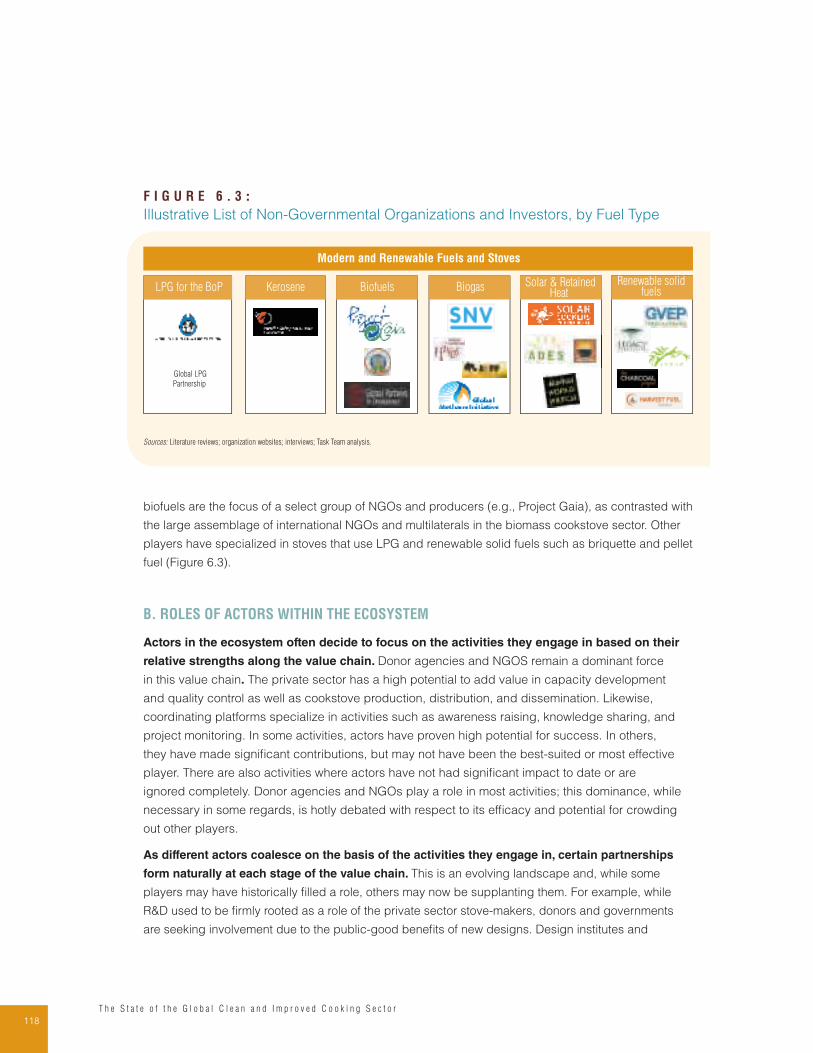
118T h e S t a t e o f t h e G l o b a l C l e a n a n d I m p r o v e d C o o k i n g S e c t o r
biofuels are the focus of a select group of NGOs and producers (e.g., Project Gaia), as contrasted with
the large assemblage of international NGOs and multilaterals in the biomass cookstove sector. Other
players have specialized in stoves that use LPG and renewable solid fuels such as briquette and pellet
fuel (Figure 6.3).
B. ROLES OF ACTORS WITHIN THE ECOSYSTEM
Actors in the ecosystem often decide to focus on the activities they engage in based on their
relative strengths along the value chain. Donor agencies and NGOS remain a dominant force
in this value chain. The private sector has a high potential to add value in capacity development
and quality control as well as cookstove production, distribution, and dissemination. Likewise,
coordinating platforms specialize in activities such as awareness raising, knowledge sharing, and
project monitoring. In some activities, actors have proven high potential for success. In others,
they have made significant contributions, but may not have been the best-suited or most effective
player. There are also activities where actors have not had significant impact to date or are
ignored completely. Donor agencies and NGOs play a role in most activities; this dominance, while
necessary in some regards, is hotly debated with respect to its efficacy and potential for crowding
out other players.
As different actors coalesce on the basis of the activities they engage in, certain partnerships
form naturally at each stage of the value chain. This is an evolving landscape and, while some
players may have historically filled a role, others may now be supplanting them. For example, while
R&D used to be firmly rooted as a role of the private sector stove-makers, donors and governments
are seeking involvement due to the public-good benefits of new designs. Design institutes and
F I G U R E 6 . 3 :
Illustrative List of Non-Governmental Organizations and Investors, by Fuel Type
Modern and Renewable Fuels and Stoves
Kerosene Biofuels BiogasRenewable solid
fuelsSolar & Retained
Heat LPG for the BoP
Global LPG
Partnership
Sources: Literature reviews; organization websites; interviews; Task Team analysis.
119T h e S e c t o r E c o s y s t e m
government-funded research have sprung up as major activities by these actors. Another notable
trend in this area is the involvement of the private sector in new activities along the value chain; this
can be seen in the areas of production, consumer marketing and distribution, and after-sales service
and monitoring.
C. PUBLIC AND DONOR SECTOR ENGAGEMENT MODELS
International actors and governments that support cookstove value chains have placed their
focus on increasing the commercialization of improved appliances and building out sustainable
markets. We have classified three major intervention types pursued by donors and NGOs:
1. Donor initiatives (e.g., the World Bank)
2. National programs (e.g., GIZ with host country government)
3. Coalitions and partnerships (e.g., Global Alliance for Clean Cookstoves)
An overview of each of these intervention types is provided below.
1. Donor Initiatives
Bilateral, multilateral, and UN development agencies have played significant roles in mobilizing
global resources for clean cooking solutions and supporting the creation of enabling
environments. Some initiatives, including the UN’s Sustainable Energy for All (SE4ALL), are
advocacy groups. SE4ALL’s efforts to elevate the issue of clean cooking at global venues, such as
UN Conference on Sustainable Development, have raised billions of dollars in commitments from
governments, private companies, and development banks. Other donors lead by funding pilot
programs to develop new cooking and fuel technologies. The World Bank’s Biomass Energy Initiative
for Africa (BEIA) has been co-financing multiple pilots to test early-stage innovations in ethanol,
briquettes, and improved biomass stoves. The World Bank and ESMAP have likewise launched
regional cooking market transformation programs in Africa (ACCES), Central America (CACCI), India,
and East Asia and Pacific (EAP CSI) to advance the clean and improved cooking agenda in the
coming years.
Finally, many organizations specialize in technical training and capacity building at the national and
local levels, without which well-designed policies and products cannot be successful. The EnDev
project—supported by the governments of Australia, Germany, the Netherlands, Norway, Switzerland,
and the United Kingdom—provides technical and business skills training to execute clean energy
projects. For example, in Peru, EnDev is providing technical assistance to suppliers and technicians
along the cookstove value chain, improving cookstove quality and sharing information on use to rural
consumers. USAID has numerous capacity-building programs focused on the stoves sector that
are delivered through USAID missions worldwide and has launched a $ 100 million guarantee fund
for stoves. DFID also has a range of programs in place for the cookstove sector, including research
programs, innovation pilots, and results based financing facilities. Many of these donor efforts are
120T h e S t a t e o f t h e G l o b a l C l e a n a n d I m p r o v e d C o o k i n g S e c t o r
coordinated via the Global Alliance for Clean Cookstoves, which, as noted below, has an important
resource mobilization, coordination, and implementation role across the global cooking sector.
Such donors are well-suited to funding advocacy, R&D, and capacity-building efforts because activities
such as these take a long time to produce tangible results, though they are critically important to
supporting ICS sector development. Donors can provide capital without expectation of monetary
returns, and they accept that some types of impact are valuable even, if it must be measured by more
qualitative methods.
2. National Programs
National cookstove programs have increased sharply, in number and quality, based on lessons
learned. The first programs began in the 1970s and have quickly spread across the globe in recent
decades. As of 2010, there are over 100 active national-level clean cookstove programs.236
Over time, cookstove programs have evolved from use of large-scale subsidies to more demand-driven
models that include indirect subsidies for market development alongside direct support for stove
producers and customers (Figure 6.4). National improved cookstove programs in China, Nepal, Peru,
and Sri Lanka, for instance, have each employed innovative, market-based methods to reach poor
consumers. Another important trend has been a greater attention to biomass fuel value chains (e.g.,
in the upcoming China program), and clean modern fuels (e.g., LPG) being integrated into program
design in countries ranging from Indonesia to Ghana and to Mexico. Despite substantive growth,
however, only 14% of programs globally have actually achieved their distribution and adoption targets.
Thus far, public programs have distributed fewer than 30 million stoves outside of China and India.
Furthermore, the quality of stoves under many past national programs has been variable. For instance,
a majority of the stoves installed under the National Programme for Improve Chulha (NPIC) in India
are no longer in use.237 Similar results were seen in programs in Asia and Africa, particularly those that
lacked a strong market component.238 Nevertheless, the future of national clean cooking programs
appears promising. China’s national program will be launching in the near future with ambitious plans
and a focus on both biomass fuel and stove markets. Other national programs in Asia have been
launched in recent years in countries like Indonesia, India, and Bangladesh.
In Africa, the Ethiopia program has reached significant scale (over one-third of rural households)
across a range of improved biomass stove technologies using national coordination and subsidy
mechanisms and market-based approaches. The Senegal national program (PROGEDE), with donor
support, has seen success in urban areas for improved charcoal stove adoption. Recently launched
programs in Nigeria (2014), Malawi (2013), and Uganda (2014), have ambitious targets and strong
market-based components.
In Latin America, there is major progress in national cooking program innovation and design.
Countries, like Mexico and Peru, have longstanding programs; and others, like Nicaragua, Guatemala,
and Honduras, are in the midst of program design, with the president of Honduras, for instance,
prominently featuring the national clean cooking program as part of his political platform.
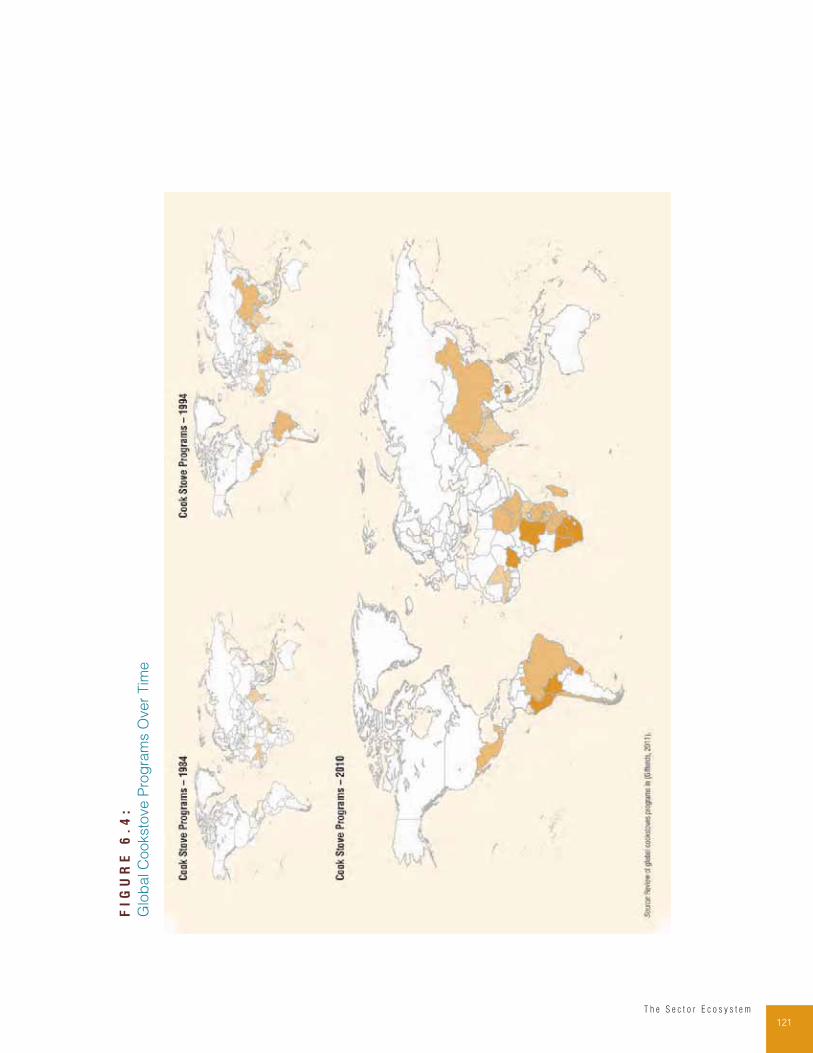
121T h e S e c t o r E c o s y s t e m
FI
GU
RE
6
.4
:
Glo
ba
l C
ooksto
ve P
rog
ram
s O
ver
Tim
e
Sour
ce: R
evie
w o
f glo
bal c
ooks
tove
s pr
ogra
ms
in (
Giff
ords
, 201
1).
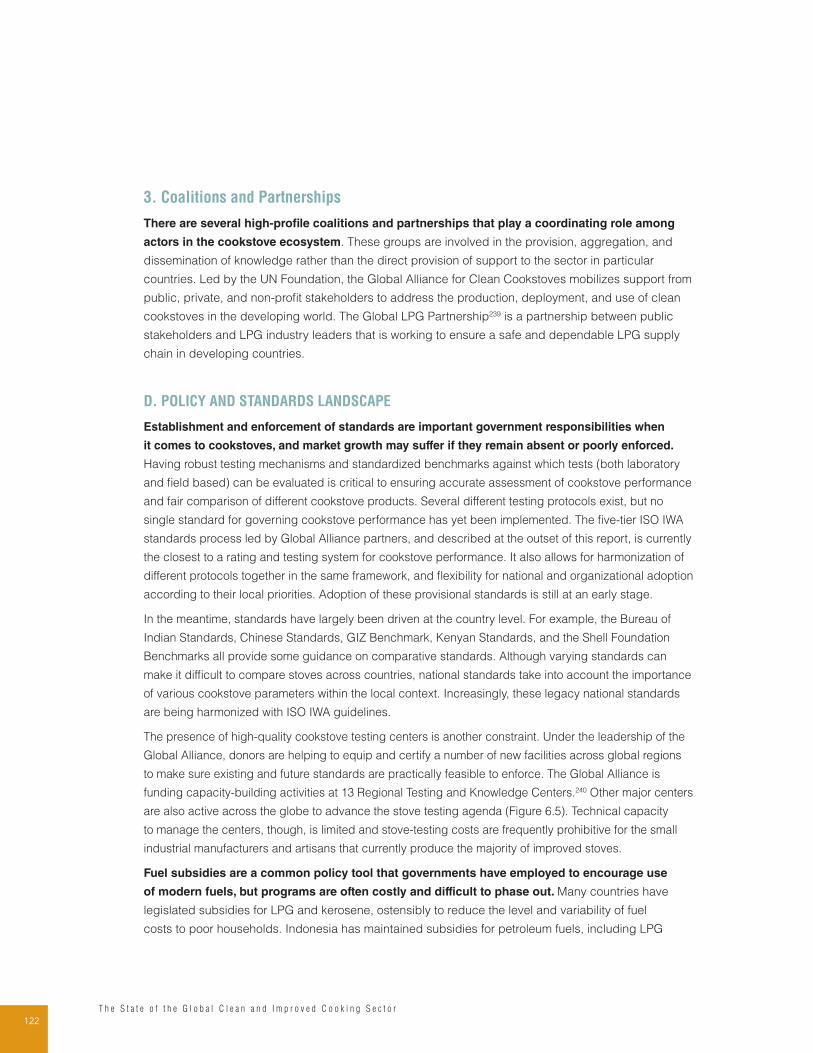
122T h e S t a t e o f t h e G l o b a l C l e a n a n d I m p r o v e d C o o k i n g S e c t o r
3. Coalitions and Partnerships
There are several high-profile coalitions and partnerships that play a coordinating role among
actors in the cookstove ecosystem. These groups are involved in the provision, aggregation, and
dissemination of knowledge rather than the direct provision of support to the sector in particular
countries. Led by the UN Foundation, the Global Alliance for Clean Cookstoves mobilizes support from
public, private, and non-profit stakeholders to address the production, deployment, and use of clean
cookstoves in the developing world. The Global LPG Partnership239 is a partnership between public
stakeholders and LPG industry leaders that is working to ensure a safe and dependable LPG supply
chain in developing countries.
D. POLICY AND STANDARDS LANDSCAPE
Establishment and enforcement of standards are important government responsibilities when
it comes to cookstoves, and market growth may suffer if they remain absent or poorly enforced.
Having robust testing mechanisms and standardized benchmarks against which tests (both laboratory
and field based) can be evaluated is critical to ensuring accurate assessment of cookstove performance
and fair comparison of different cookstove products. Several different testing protocols exist, but no
single standard for governing cookstove performance has yet been implemented. The five-tier ISO IWA
standards process led by Global Alliance partners, and described at the outset of this report, is currently
the closest to a rating and testing system for cookstove performance. It also allows for harmonization of
different protocols together in the same framework, and flexibility for national and organizational adoption
according to their local priorities. Adoption of these provisional standards is still at an early stage.
In the meantime, standards have largely been driven at the country level. For example, the Bureau of
Indian Standards, Chinese Standards, GIZ Benchmark, Kenyan Standards, and the Shell Foundation
Benchmarks all provide some guidance on comparative standards. Although varying standards can
make it difficult to compare stoves across countries, national standards take into account the importance
of various cookstove parameters within the local context. Increasingly, these legacy national standards
are being harmonized with ISO IWA guidelines.
The presence of high-quality cookstove testing centers is another constraint. Under the leadership of the
Global Alliance, donors are helping to equip and certify a number of new facilities across global regions
to make sure existing and future standards are practically feasible to enforce. The Global Alliance is
funding capacity-building activities at 13 Regional Testing and Knowledge Centers.240 Other major centers
are also active across the globe to advance the stove testing agenda (Figure 6.5). Technical capacity
to manage the centers, though, is limited and stove-testing costs are frequently prohibitive for the small
industrial manufacturers and artisans that currently produce the majority of improved stoves.
Fuel subsidies are a common policy tool that governments have employed to encourage use
of modern fuels, but programs are often costly and difficult to phase out. Many countries have
legislated subsidies for LPG and kerosene, ostensibly to reduce the level and variability of fuel
costs to poor households. Indonesia has maintained subsidies for petroleum fuels, including LPG
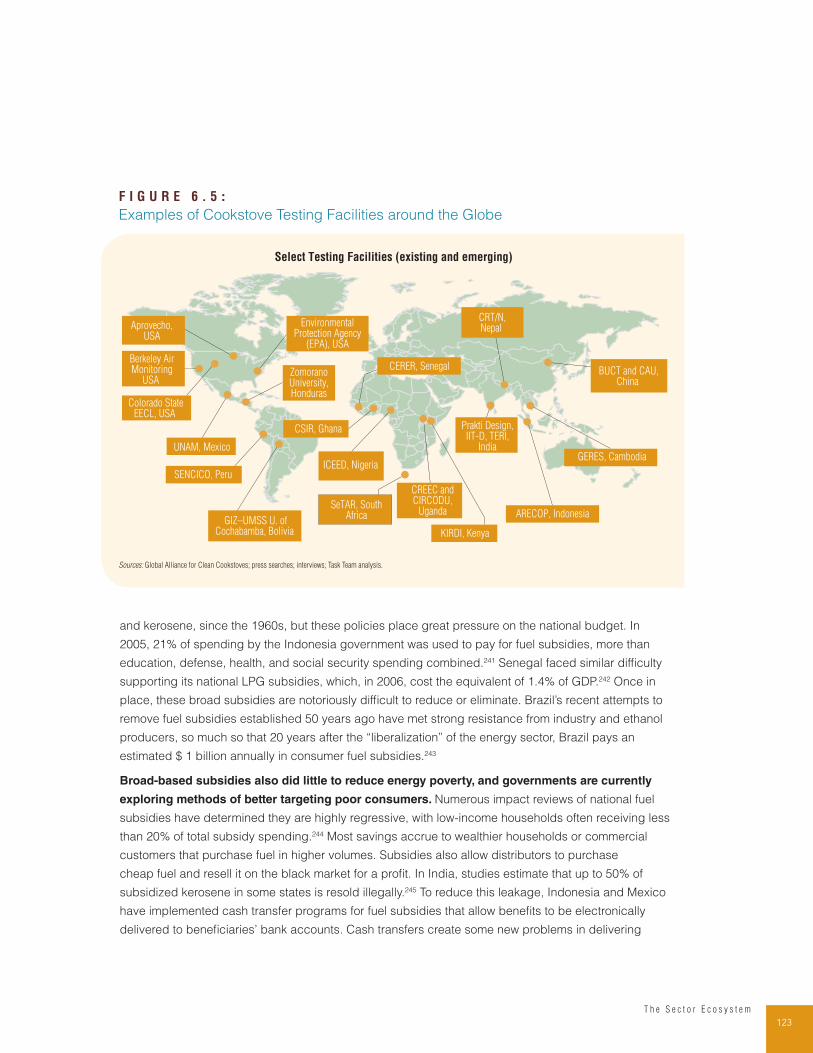
123T h e S e c t o r E c o s y s t e m
F I G U R E 6 . 5 :
Examples of Cookstove Testing Facilities around the Globe
CREEC andCIRCODU,
UgandaSeTAR, South
Africa ARECOP, Indonesia
BUCT and CAU,China
GERES, Cambodia
Prakti Design,IIT-D, TERI,
India
GIZ–UMSS U. ofCochabamba, Bolivia
SENCICO, Peru
ZomoranoUniversity,Honduras
KIRDI, Kenya
EnvironmentalProtection Agency
(EPA), USA
CERER, Senegal
ICEED, Nigeria
CSIR, Ghana
UNAM, Mexico
CRT/N,Nepal Aprovecho,
USA
Colorado StateEECL, USA
Berkeley AirMonitoring
USA
Select Testing Facilities (existing and emerging)
Sources: Global Alliance for Clean Cookstoves; press searches; interviews; Task Team analysis.
and kerosene, since the 1960s, but these policies place great pressure on the national budget. In
2005, 21% of spending by the Indonesia government was used to pay for fuel subsidies, more than
education, defense, health, and social security spending combined.241 Senegal faced similar difficulty
supporting its national LPG subsidies, which, in 2006, cost the equivalent of 1.4% of GDP.242 Once in
place, these broad subsidies are notoriously difficult to reduce or eliminate. Brazil’s recent attempts to
remove fuel subsidies established 50 years ago have met strong resistance from industry and ethanol
producers, so much so that 20 years after the “liberalization” of the energy sector, Brazil pays an
estimated $ 1 billion annually in consumer fuel subsidies.243
Broad-based subsidies also did little to reduce energy poverty, and governments are currently
exploring methods of better targeting poor consumers. Numerous impact reviews of national fuel
subsidies have determined they are highly regressive, with low-income households often receiving less
than 20% of total subsidy spending.244 Most savings accrue to wealthier households or commercial
customers that purchase fuel in higher volumes. Subsidies also allow distributors to purchase
cheap fuel and resell it on the black market for a profit. In India, studies estimate that up to 50% of
subsidized kerosene in some states is resold illegally.245 To reduce this leakage, Indonesia and Mexico
have implemented cash transfer programs for fuel subsidies that allow benefits to be electronically
delivered to beneficiaries’ bank accounts. Cash transfers create some new problems in delivering
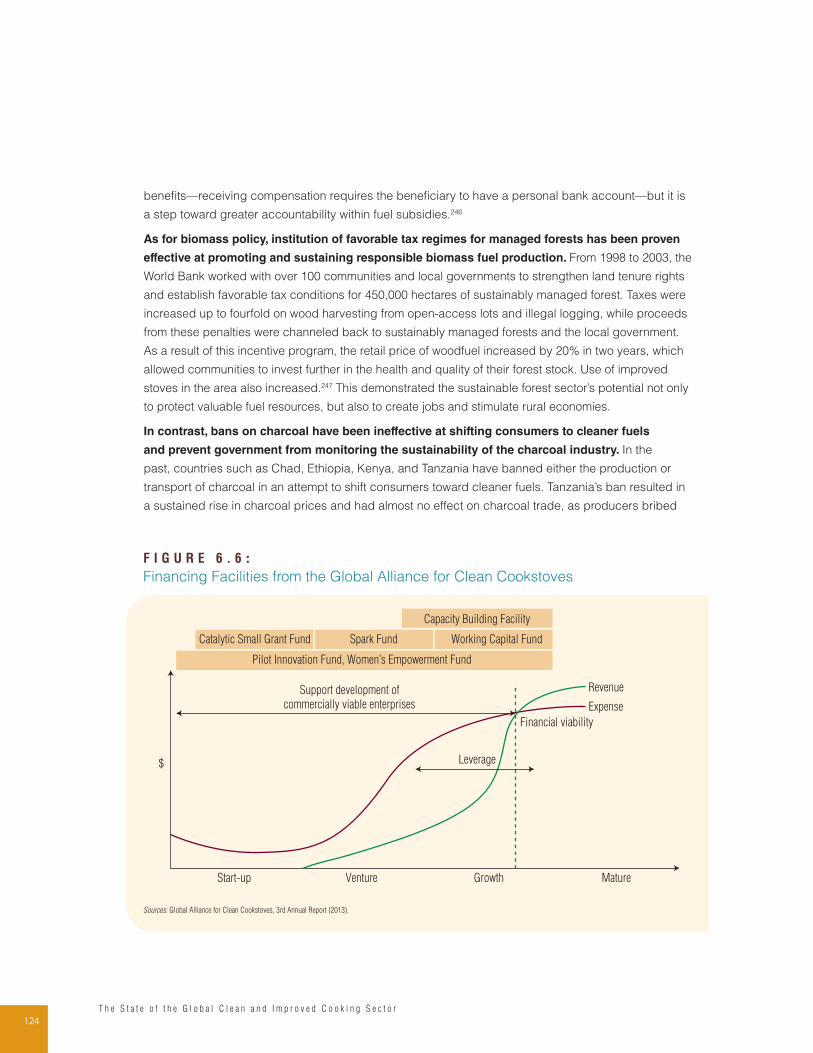
124T h e S t a t e o f t h e G l o b a l C l e a n a n d I m p r o v e d C o o k i n g S e c t o r
benefits—receiving compensation requires the beneficiary to have a personal bank account—but it is
a step toward greater accountability within fuel subsidies.246
As for biomass policy, institution of favorable tax regimes for managed forests has been proven
effective at promoting and sustaining responsible biomass fuel production. From 1998 to 2003, the
World Bank worked with over 100 communities and local governments to strengthen land tenure rights
and establish favorable tax conditions for 450,000 hectares of sustainably managed forest. Taxes were
increased up to fourfold on wood harvesting from open-access lots and illegal logging, while proceeds
from these penalties were channeled back to sustainably managed forests and the local government.
As a result of this incentive program, the retail price of woodfuel increased by 20% in two years, which
allowed communities to invest further in the health and quality of their forest stock. Use of improved
stoves in the area also increased.247 This demonstrated the sustainable forest sector’s potential not only
to protect valuable fuel resources, but also to create jobs and stimulate rural economies.
In contrast, bans on charcoal have been ineffective at shifting consumers to cleaner fuels
and prevent government from monitoring the sustainability of the charcoal industry. In the
past, countries such as Chad, Ethiopia, Kenya, and Tanzania have banned either the production or
transport of charcoal in an attempt to shift consumers toward cleaner fuels. Tanzania’s ban resulted in
a sustained rise in charcoal prices and had almost no effect on charcoal trade, as producers bribed
F I G U R E 6 . 6 :
Financing Facilities from the Global Alliance for Clean Cookstoves
MatureGrowthVenture
Catalytic Small Grant Fund Spark Fund
Support development of
commercially viable enterprises
Leverage
Financial viability
Expense
Revenue
Working Capital Fund
Capacity Building Facility
Pilot Innovation Fund, Women’s Empowerment Fund
Start-up
$
Sources: Global Alliance for Clean Cookstoves, 3rd Annual Report (2013).
125T h e S e c t o r E c o s y s t e m
government officials to continue operations. Meanwhile, the government lost all official revenue from
taxing commercial charcoal activities. The ban remained in force for only two weeks.248 Indonesia’s
Quezon province has recently introduced a ban on charcoal production, citing links to the destruction
of mangrove forests in the region; based on other nations’ experiences, it is unclear whether pushing
the local charcoal industry underground will reduce mangrove deforestation.249
With regard to modern fuels, stronger regulatory frameworks and investment are needed across
countries to ensure consumer safety. Specific protocols are required for transporting, storing, and
using liquid fuels, such as LPG and kerosene, safely. Appropriate training must extend through the
value chain to small-scale distributors to prevent accidents. Many countries lack the certification and
licensing capability required to ensure such handling, in part, because the physical infrastructure for
safely transporting liquid fuels is not in place. Pursuit of stronger standards and requirements for fuel
distributors in conjunction with joint investments in infrastructure would increase the integrity of the value
chain and effective distribution of liquid fuels. Consumer education is especially important for LPG and
kerosene because they are responsible for proper storage and operation after sale. Malfunctioning LPG
canisters can cause explosions, and improper fuel storage poses risks to the entire household. Sixty
percent of child poisoning incidents in Kenya and South Africa are a result of accidental ingestion of
kerosene.250 As fuels such as LPG become increasingly affordable, governments will need to work with
companies to disseminate safe-use knowledge and minimize public health risks.
E. THE FINANCING CHALLENGE
In future, the continuing high prices of many cooking appliances will prompt producers to invest in
cost cutting and distributors to develop financing models for consumers. This will require sources
and facilitators of finance throughout the value chain. The need for financing by players throughout
the value chain is consistently brought up as a core challenge by stakeholders across technologies,
regions, and production models.
Upstream Financing
The key finance needs on the supply side, as noted earlier, are finance for capital investment
and working capital. Startup capital is especially necessary for some of the newer technologies
that require long R&D processes, sophisticated machinery, or investment in distribution channels.
By contrast, working capital constraints are generally more relevant to lower end products. Despite
widespread need, access to finance for production and distribution is limited, especially for smaller
manufacturers and networks of artisans (Table 6.1). Key constraints include the following:
• The often small size and informality of operations make the investment seem too risky for
commercial banks.
• The low-profit nature of the business limits access to commercial capital.
• Limited financial/business literacy among small producers limits their capacity to navigate the loan
application process and to develop business plans that appeal to financiers.
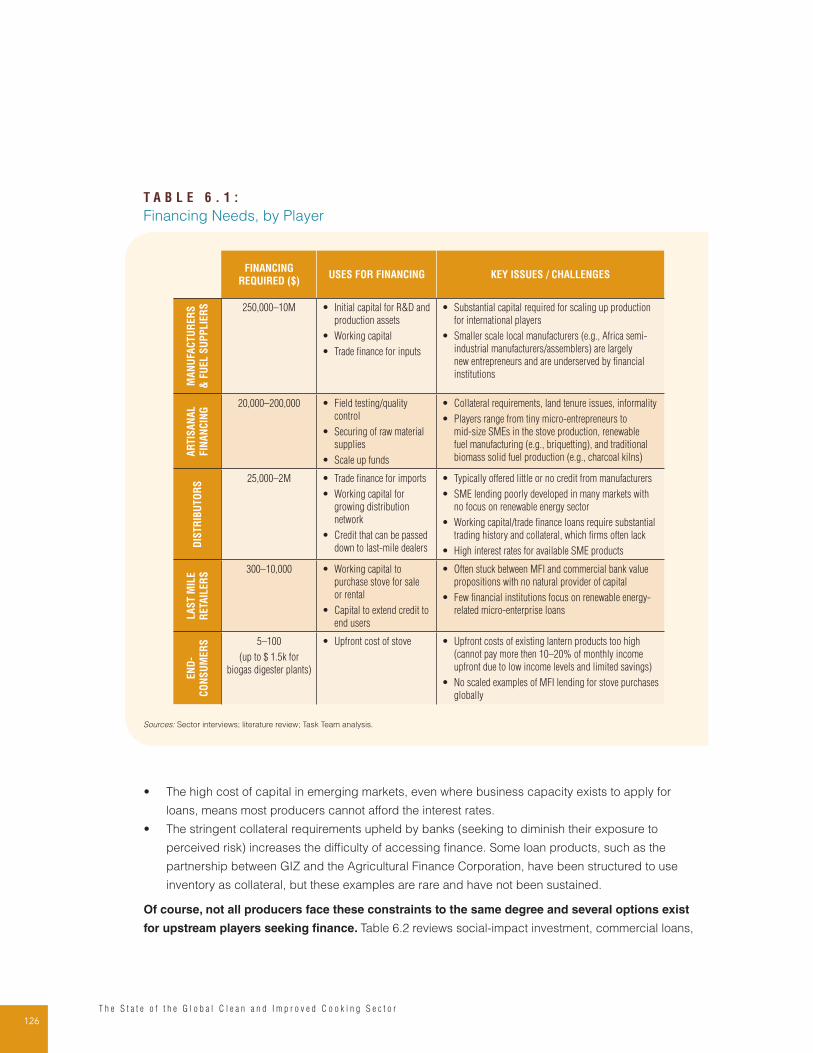
126T h e S t a t e o f t h e G l o b a l C l e a n a n d I m p r o v e d C o o k i n g S e c t o r
• The high cost of capital in emerging markets, even where business capacity exists to apply for
loans, means most producers cannot afford the interest rates.
• The stringent collateral requirements upheld by banks (seeking to diminish their exposure to
perceived risk) increases the difficulty of accessing finance. Some loan products, such as the
partnership between GIZ and the Agricultural Finance Corporation, have been structured to use
inventory as collateral, but these examples are rare and have not been sustained.
Of course, not all producers face these constraints to the same degree and several options exist
for upstream players seeking finance. Table 6.2 reviews social-impact investment, commercial loans,
T A B L E 6 . 1 :
Financing Needs, by Player
FINANCING
REQUIRED ($)USES FOR FINANCING KEY ISSUES / CHALLENGES
MA
NU
FA
CTU
RER
S
& F
UEL S
UP
PLIE
RS 250,000–10M • Initial capital for R&D and
production assets
• Working capital
• Trade finance for inputs
• Substantial capital required for scaling up production
for international players
• Smaller scale local manufacturers (e.g., Africa semi-
industrial manufacturers/assemblers) are largely
new entrepreneurs and are underserved by financial
institutions
AR
TIS
AN
AL
FIN
AN
CIN
G
20,000–200,000 • Field testing/quality
control
• Securing of raw material
supplies
• Scale up funds
• Collateral requirements, land tenure issues, informality
• Players range from tiny micro-entrepreneurs to
mid-size SMEs in the stove production, renewable
fuel manufacturing (e.g., briquetting), and traditional
biomass solid fuel production (e.g., charcoal kilns)
DIS
TR
IBU
TO
RS
25,000–2M • Trade finance for imports
• Working capital for
growing distribution
network
• Credit that can be passed
down to last-mile dealers
• Typically offered little or no credit from manufacturers
• SME lending poorly developed in many markets with
no focus on renewable energy sector
• Working capital/trade finance loans require substantial
trading history and collateral, which firms often lack
• High interest rates for available SME products
LA
ST M
ILE
RETA
ILER
S
300–10,000 • Working capital to
purchase stove for sale
or rental
• Capital to extend credit to
end users
• Often stuck between MFI and commercial bank value
propositions with no natural provider of capital
• Few financial institutions focus on renewable energy-
related micro-enterprise loans
EN
D-
CO
NS
UM
ER
S 5–100
(up to $ 1.5k for
biogas digester plants)
• Upfront cost of stove • Upfront costs of existing lantern products too high
(cannot pay more then 10–20% of monthly income
upfront due to low income levels and limited savings)
• No scaled examples of MFI lending for stove purchases
globally
Sources: Sector interviews; literature review; Task Team analysis.
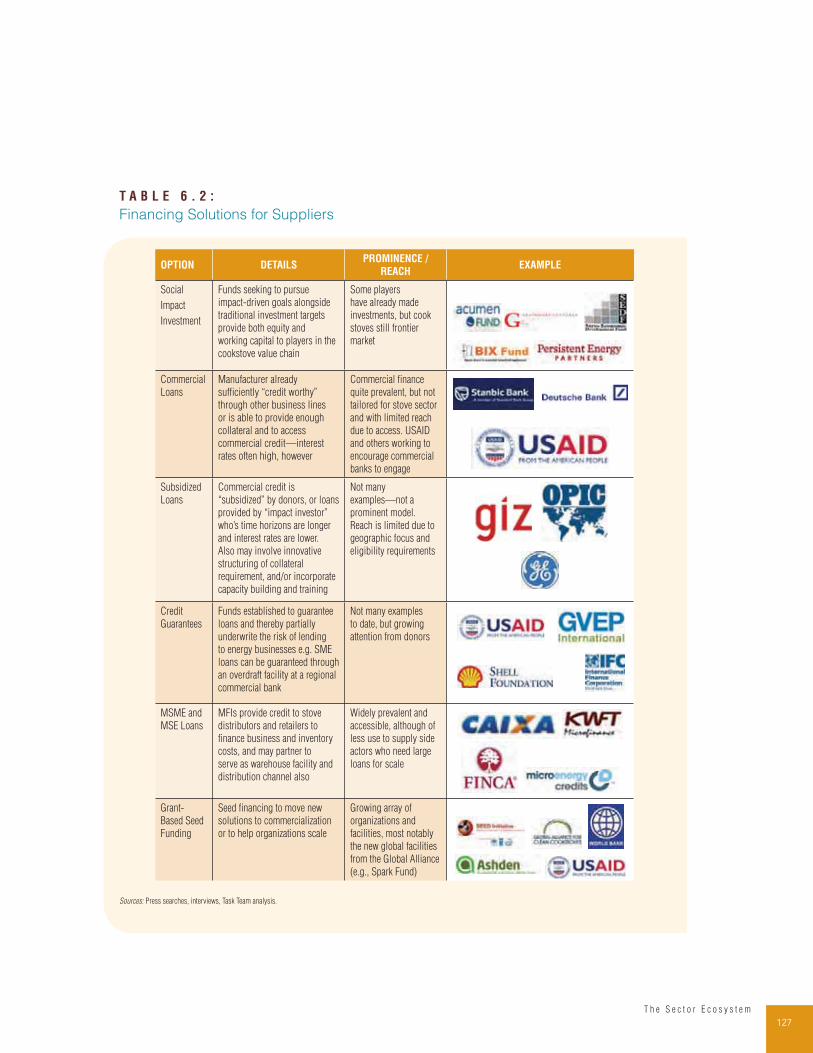
127T h e S e c t o r E c o s y s t e m
T A B L E 6 . 2 :
Financing Solutions for Suppliers
OPTION DETAILSPROMINENCE /
REACHEXAMPLE
Social
Impact
Investment
Funds seeking to pursue
impact- driven goals alongside
traditional investment targets
provide both equity and
working capital to players in the
cookstove value chain
Some players
have already made
investments, but cook
stoves still frontier
market
Commercial
Loans
Manufacturer already
sufficiently “credit worthy”
through other business lines
or is able to provide enough
collateral and to access
commercial credit—interest
rates often high, however
Commercial finance
quite prevalent, but not
tailored for stove sector
and with limited reach
due to access. USAID
and others working to
encourage commercial
banks to engage
Subsidized
Loans
Commercial credit is
“subsidized” by donors, or loans
provided by “impact investor”
who’s time horizons are longer
and interest rates are lower.
Also may involve innovative
structuring of collateral
requirement, and/or incorporate
capacity building and training
Not many
examples—not a
prominent model.
Reach is limited due to
geographic focus and
eligibility requirements
Credit
Guarantees
Funds established to guarantee
loans and thereby partially
underwrite the risk of lending
to energy businesses e.g. SME
loans can be guaranteed through
an overdraft facility at a regional
commercial bank
Not many examples
to date, but growing
attention from donors
MSME and
MSE Loans
MFIs provide credit to stove
distributors and retailers to
finance business and inventory
costs, and may partner to
serve as warehouse facility and
distribution channel also
Widely prevalent and
accessible, although of
less use to supply side
actors who need large
loans for scale
Grant-
Based Seed
Funding
Seed financing to move new
solutions to commercialization
or to help organizations scale
Growing array of
organizations and
facilities, most notably
the new global facilities
from the Global Alliance
(e.g., Spark Fund)
Sources: Press searches, interviews, Task Team analysis.
128T h e S t a t e o f t h e G l o b a l C l e a n a n d I m p r o v e d C o o k i n g S e c t o r
subsidized loans, credit guarantees, MSME/SME loans, and carbon finance. These are the financing
sources that have been underwriting the already fast growth of the cookstove sector in recent years.
In practice, subsidized loans and credit guarantees are rare and underdeveloped. As a result, carbon
finance and commercial loans are the more prevalent sources of finance for those who can afford to
take advantage of those (costly) mechanisms.
While the exact numbers are unknown, there is good evidence that the volume of financing has
increased dramatically in the past two to three years. Some of the most important activities in this
sector have been the ongoing boom of carbon finance projects for cookstoves, despite some cyclical
softening in the carbon market in the past year; increased activity from social impact investment
funds and more traditional finance players in equity investments in promising cookstove companies;
the efforts of players like USAID to encourage commercial banks to scale up their SME financing for
cookstove manufacturers and distributors; increased application of partial credit guarantees (e.g.,
$ 5 million partial credit guarantee in 2012 from IFC for SEWA in India); growing interest from MFIs,
like Faulu and FINCA, in financing cookstove micro-entrepreneurs; and the increasing importance of
guarantees, with USAID launching a $ 100 million Household Energy Guarantee program in September
2014 and the Global Alliance in the process of developing a comparable program for the clean cooking
sector.
Another important recent trend in the market is the growth of startup and scale-up grant facilities.
These facilities are aimed at helping subscale cookstove enterprises reach the size and phase of
commercialization that would enable them to access private sector financing. Important examples
include long-established, award-based programs like Ashden and SEED, alongside the suite of
financial products established by the Global Alliance from the Pilot Innovation Fund to finance
innovations across the value chain, the Spark Fund to finance the scale up of proven concepts,
and the Working Capital Fund to provide affordable working capital loans for early-growth stage
companies. The Global Alliance has also recently launched a Capacity Building Facility to provide
Global Alliance-funded capacity building coupled with growth financing from impact investors.
Figure 6.6 shows the suite of financial products the Global Alliance has designed to enable enterprises
at different stages of development to grow and leverage further investment.
Downstream Financing
In consumer finance, in general, commercial banks are unwilling to lend to low-income consumers
because of their lack of collateral, irregular incomes, and lack of formal identification. With cookstove
purchases, in particular, banks are unwilling to finance this particular asset (as compared to solar
home systems, for example) because the loan size is too small relative to the high transaction costs.
Similarly, MFIs, which would traditionally bear more of the burden of financing the BoP, are also wary of
financing loans due to high risks. The first risk is linked to cookstove portability: for example, a person
could move and take the stove with them, or give it to relatives. The second challenge is due to the
fact that stoves do not generate cash revenue for the borrower. In financing stoves, institutions are
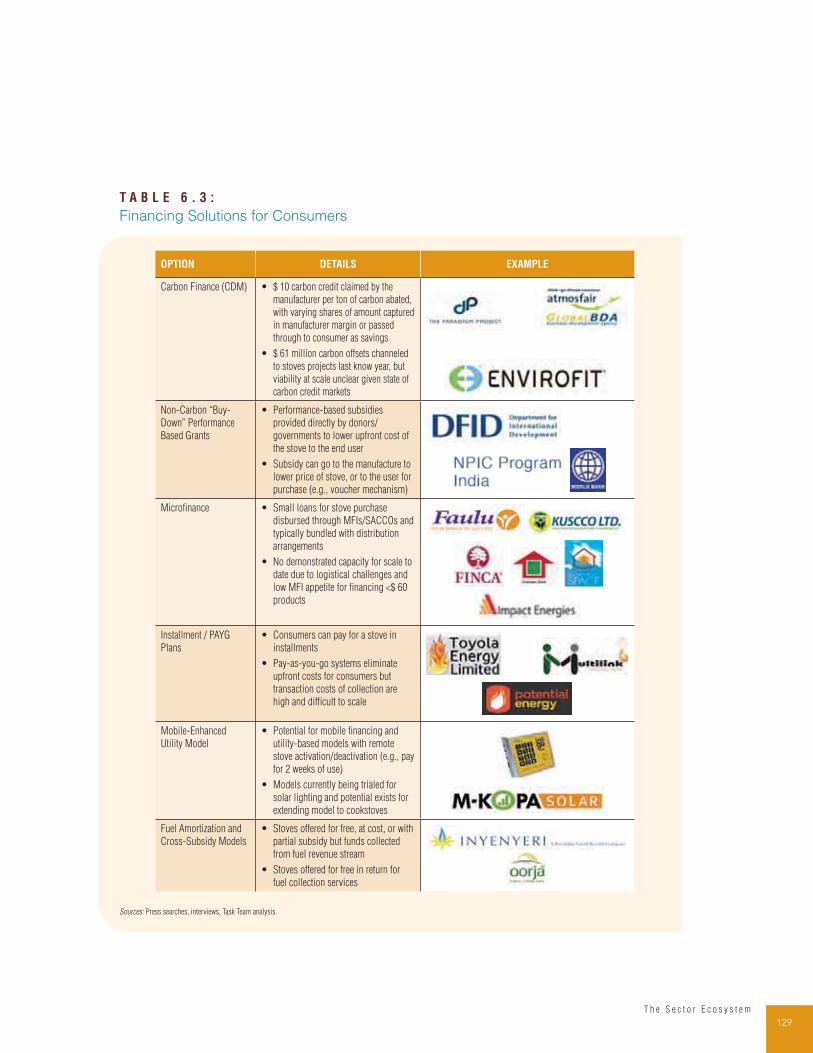
129T h e S e c t o r E c o s y s t e m
T A B L E 6 . 3 :
Financing Solutions for Consumers
OPTION DETAILS EXAMPLE
Carbon Finance (CDM) • $ 10 carbon credit claimed by the
manufacturer per ton of carbon abated,
with varying shares of amount captured
in manufacturer margin or passed
through to consumer as savings
• $ 61 million carbon offsets channeled
to stoves projects last know year, but
viability at scale unclear given state of
carbon credit markets
Non-Carbon “Buy-
Down” Performance
Based Grants
• Performance-based subsidies
provided directly by donors/
governments to lower upfront cost of
the stove to the end user
• Subsidy can go to the manufacture to
lower price of stove, or to the user for
purchase (e.g., voucher mechanism)
Microfinance • Small loans for stove purchase
disbursed through MFIs/SACCOs and
typically bundled with distribution
arrangements
• No demonstrated capacity for scale to
date due to logistical challenges and
low MFI appetite for financing <$ 60
products
Installment / PAYG
Plans
• Consumers can pay for a stove in
installments
• Pay-as-you-go systems eliminate
upfront costs for consumers but
transaction costs of collection are
high and difficult to scale
Mobile-Enhanced
Utility Model
• Potential for mobile financing and
utility-based models with remote
stove activation/deactivation (e.g., pay
for 2 weeks of use)
• Models currently being trialed for
solar lighting and potential exists for
extending model to cookstoves
Fuel Amortization and
Cross-Subsidy Models
• Stoves offered for free, at cost, or with
partial subsidy but funds collected
from fuel revenue stream
• Stoves offered for free in return for
fuel collection services
Sources: Press searches, interviews, Task Team analysis.
130T h e S t a t e o f t h e G l o b a l C l e a n a n d I m p r o v e d C o o k i n g S e c t o r
financing savings, not income. Unlike lending to a small business, where loan repayment represents a
clear future revenue stream, lending to a cookstove buyer finances a product that will generate savings
and the repayment mechanism is less clear. There is high uncertainty that the savings generated will
be used to pay down the loan rather than applied to other needs.
As noted in the “Product Economics” section (see Chapter 5), many appliances drive long-term
savings for consumers and, if financing can be provided to overcome upfront costs, consumers will
increase adoption in their own self-interest. Nonetheless, many challenges arise when considering
financing options for consumers that are often not worthy for credit on paper. Many of the solutions
shown in Table 6.3 are in early stages of development or have not scaled enough to meaningfully
address the consumer finance gap.
Creative financing and pricing schemes to address this issue are currently being rolled out either
in cookstoves or adjacent appliance markets. Some models rely on the use of new technologies,
such as pay-as-you-go services. Others rely only on creative pricing schemes and the role played by
local deal brokers:
• Technology enabled pay-as-you-go models have already been trialed in solar home systems.
M-Kopa Kenya uses a pay-as-you-go model with mobile payments and an embedded mobile control
technology enabling system shutdown if a customer does not pay. Likewise, Angaza’s Pay-As-You-
Go Management Solution likewise offers remote activation and disactivation functionality at very
low cost ($ 2/unit). Azuri Indigo uses scratch cards sold through a vendor to activate its solar panel
system via SMS. While these models have not been tried with cookstoves yet the model is possible,
particularly for advanced gasifier fan models, and is currently being pursued by market participants.251
• DFID has recently launched an initiative for Results-Based Financing (RBF) to deliver targeted
subsidies where projects deliver health and climate impacts that consumers may be unwilling
to pay for, with a RBF pilot in progress to facilitate the extension of cookstoves to 200,000 rural
households in Ethiopia.252 The feasibility of applying RBF mechanisms for clean and improved
cooking solutions in Africa is also currently being explored in World Bank-sponsored research
focused on countries like Uganda and Indonesia.253
• While there is no commercial market for financing health impacts of clean cooking technologies,
there are a number of important efforts under way to explore such approaches, with immediate
potential application to Africa. The CQuestCapital team, for instance, drawing on its carbon
finance market expertise, is exploring the potential to create a Clean Development Mechanism
(CDM)-like market for cookstove health impacts; work on piloting a potential new RBF
methodology is now in progress.254 Similarly, the newly launched BIX fund, while most immediately
focused on carbon finance revenues, is working on a methodology to package cookstove health
impacts for social impact investors.
• Cross-subsidies between urban and rural consumers can also be employed to establish markets
in hard-to-reach locations. Producers may charge full price to urban consumers and take lower
margins on rural consumers in order to lower the rural distribution cost premium. One innovative
131T h e S e c t o r E c o s y s t e m
version of this model from Inyenyeri in Rwanda involves providing stoves free of charge to rural
consumers in return for a contract for these consumers to supply Inyeyeri with fuel feedstock
(twigs for the manufacture of pellet fuel). Rural consumers have indefinite access to a free high-
end clean biomass cookstove as long as they supply fuel, whereas the fuel and cookstove are
sold at full cost to urban consumers.255
• Credit schemes are not always based on high innovation, but on well-run rural financial institutions
using traditional models. The traditional lay-away model is used by Toyola Energy in Ghana. Consumers
make a down payment and are responsible for continuing monthly payments to the distributor.256
• PIMA gas in Kenya uses a traditional BoP model to address the issue of high one-time costs
associated with fuel purchase: micro-packaging. It sells 1-kg cylinder gas stoves with refills
starting at $ 0.60 for a partial refill, as opposed to the more expensive and much more common
13-kg models.257 Similarly, Oando in Nigeria is piloting an O-Gas program to scale-up distribution
of 3.5 kg cylinders to the urban mass market.258
In the lower cost, “less advanced” cookstove market segment, the constraint to growth is usually
on the supply side. In this case, demand exists for the locally produced stoves that provide significant
fuel consumption savings, even if emissions are not reduced. The small enterprises or artisans that are
manufacturing do not have sufficient working capital to purchase the raw materials and build a stock of
inventory to keep up with the demand. In this case, financing efforts need to be focused on supporting
the growth of such suppliers—providing investment capital for increased production capacity and
working capital to enable larger scale production.
Carbon Financing
Interest from cookstove manufacturers and program designers in accessing the international
carbon markets and the supply of such financing are increasing at a rapid pace. Despite
challenges in the carbon market, carbon financing for improved and clean cookstoves is booming, with
voluntary buyers funneling $ 61 million to Gold Standard-certified offsets from projects that distribute
clean cookstoves in 2013, which is down from $ 80 million in 2012, but up from $ 42 million in 2011,
and <$ 30 million in 2010.259 CDM registrations of improved and clean cookstove projects, despite
lower volumes, are still strong—10 Programme of Activities (PoAs) registered in 2014, 10 registered in
2013, 17 registered in 2012, and 3 in 2011.260 The continued and growing importance of the carbon
market is well illustrated by the fact that—despite depressed carbon prices—of the 8.2 million stoves
distributed and sold in 2012 that were tracked by the Global Alliance, half received some support from
carbon finance projects. This is up from 15% of cookstoves tracked by the Global Alliance receiving
carbon finance support in 2010–11.261 The carbon finance market was weaker in 2013–14, but the
overall story is still one of secular growth relative to earlier periods of the clean cooking market.262
While this growth has been rapid, it is uneven. Relative to the global population without access to
clean cooking facilities, the carbon finance project footprint is heavily biased toward Africa (Figure 6.7)
and concentrated in a handful of countries. In Africa, the primary geographies are Kenya, Ethiopia,
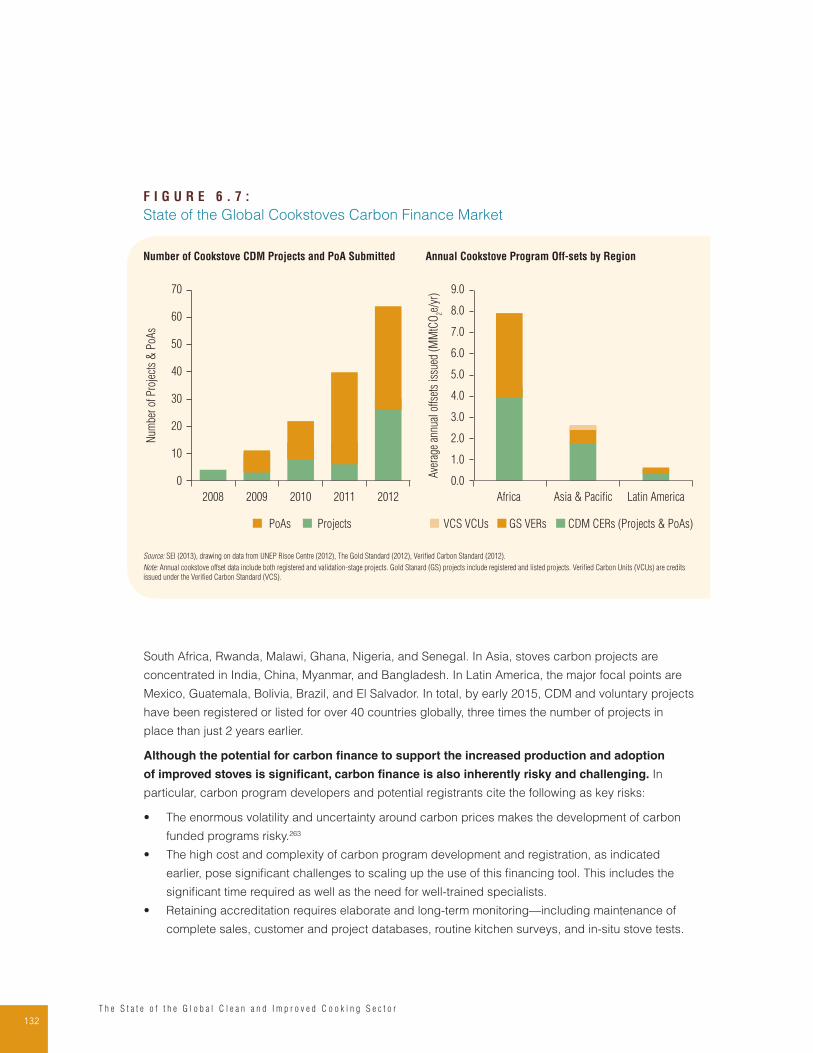
132T h e S t a t e o f t h e G l o b a l C l e a n a n d I m p r o v e d C o o k i n g S e c t o r
South Africa, Rwanda, Malawi, Ghana, Nigeria, and Senegal. In Asia, stoves carbon projects are
concentrated in India, China, Myanmar, and Bangladesh. In Latin America, the major focal points are
Mexico, Guatemala, Bolivia, Brazil, and El Salvador. In total, by early 2015, CDM and voluntary projects
have been registered or listed for over 40 countries globally, three times the number of projects in
place than just 2 years earlier.
Although the potential for carbon finance to support the increased production and adoption
of improved stoves is significant, carbon finance is also inherently risky and challenging. In
particular, carbon program developers and potential registrants cite the following as key risks:
• The enormous volatility and uncertainty around carbon prices makes the development of carbon
funded programs risky.263
• The high cost and complexity of carbon program development and registration, as indicated
earlier, pose significant challenges to scaling up the use of this financing tool. This includes the
significant time required as well as the need for well-trained specialists.
• Retaining accreditation requires elaborate and long-term monitoring—including maintenance of
complete sales, customer and project databases, routine kitchen surveys, and in-situ stove tests.
F I G U R E 6 . 7 :
State of the Global Cookstoves Carbon Finance Market
Num
ber
of P
roje
cts
& P
oAs
PoAs Projects
2008 2012201120102009
70
60
50
40
30
20
10
0
Number of Cookstove CDM Projects and PoA Submitted
Ave
rage
ann
ual o
ffset
s is
sued
(M
MtC
O2e/
yr)
VCS VCUs GS VERs
Africa Latin AmericaAsia & Pacific
9.0
8.0
7.0
6.0
5.0
4.0
3.0
2.0
1.0
0.0
CDM CERs (Projects & PoAs)
Annual Cookstove Program Off-sets by Region
Source: SEI (2013), drawing on data from UNEP Risoe Centre (2012), The Gold Standard (2012), Verified Carbon Standard (2012).
Note: Annual cookstove offset data include both registered and validation-stage projects. Gold Stanard (GS) projects include registered and listed projects. Verified Carbon Units (VCUs) are credits
issued under the Verified Carbon Standard (VCS).
133T h e S e c t o r E c o s y s t e m
All these elements become increasingly difficult with increased distance from urban centers and
can be hugely costly for the program.
The two available options for accessing carbon credit, the CDM and the Voluntary Offsets Market,
are still complicated mechanisms to access, and access often comes with a high price tag.264 If we
consider the costs to obtain financing relative to the programmatic revenue from stove sales, the
number of stoves that would have to be sold in order to pay back just the fixed costs ranges from
$5,000 to over $30,000, depending on the scale of the program. Many cookstove programs take
years to reach such high levels of market penetration and some never do. Furthermore, even where
the economics are positive, clean cookstove projects often find it challenging to fund certification
processes due to the one to two year time lag between registration and first revenues from carbon
credits. As such, carbon finance is immediately available only to scaled programs. This issue is now
being addressed by the new Clean Cooking Loan Fund recently launched by the Global Alliance in
partnership with Nexus Carbon for Development and the Gold Standard Foundation. The Clean Cooking
Loan Fund will take on the financial risk associated with the carbon certification process by offering
loans to project developers to cover certification costs.
Despite these limitations, the continued growth in the carbon voluntary market and rising number of
registered cookstove projects suggests that carbon finance will be a major driver of financing for the
clean and improved stove sector for the years to come.
E N D N O T E S
236 Gifford, 2011.
237 Venkataraman et al., 2010.
238 Urmee & Gyamfi, 2014.
239 http://www.sustainableenergyforall.org/actions-commitments/commitments/single/global-lpg-partnership
240 Global Alliance, 2013.
241 International Institute for Sustainable Development, 2011.
242 Bruvall, et al., 2011.
243 Includes spending on petroleum products other than LPG (Koplow, 2012).
244 Based on analysis of fuel subsidies in Indonesia and Mexico (Ibid).
245 Shenoy, 2010.
246 Knowledge@Wharton, 2013.
247 ESMAP, 2012.
248 NL Agency, 2010.
249 Mallari, 2012.
250 Schwebel et al., 2009.
134T h e S t a t e o f t h e G l o b a l C l e a n a n d I m p r o v e d C o o k i n g S e c t o r
251 Bloomberg, 2012.
252 For example, see https://www.gov.uk/result-based-financing-for-low-carbon-energy-access-rbf.
253 ibid.
254 For the Uganda RBF context, see IMC (2014); for Indonesia, see APEX (2013).
255 The issue has, for instance, been explored by CQuestCapital (http://www.cquestcapital.com/wp-content/
uploads/2013/05/Health_reductions_paper_4_19_2013.pdf), which is now in the process of exploring and
piloting such a mechanism.
256 New York Times, 2011; http://kristof.blogs.nytimes.com/2011/06/13/a-low-impact-stove-for-rwanda/
257 PCIA, 2012; http://www.pciaonline.org/toyola-energy-limited
258 IFC, 2012; http://www1.ifc.org/wps/wcm/connect/region__ext_content/regions/sub-saharan+africa/news/
cooking_up_an_energy_solution
259 The Nation, 2012; http://www.thenationonlineng.net/2011/index.php/feed/business/energy/38019-
associationmoves-to-deepen-lpg-consumption.txt
260 Bloomberg Renewable Energy Finance and EcoSystem Marketplace, 2014.
261 See http://cdm.unfccc.int/ProgrammeOfActivities/registered.html (accessed February 25, 2014).
262 http://www.ecosystemmarketplace.com/pages/dynamic/article.page.php?page_id=10629§ion=carbon_
market&eod=1P
263 Global Alliance for Clean Cookstoves, 2013.
264 The recent State of the Voluntary Carbon Market report indicates average prices per ton of CO2 as ranging from
$ 0.1/tCO2e (from the now defunct Chicago Climate Exchange) to more than $ 120/tCO
2e for J-VERs in Japan.
135T h e S e c t o r E c o s y s t e m
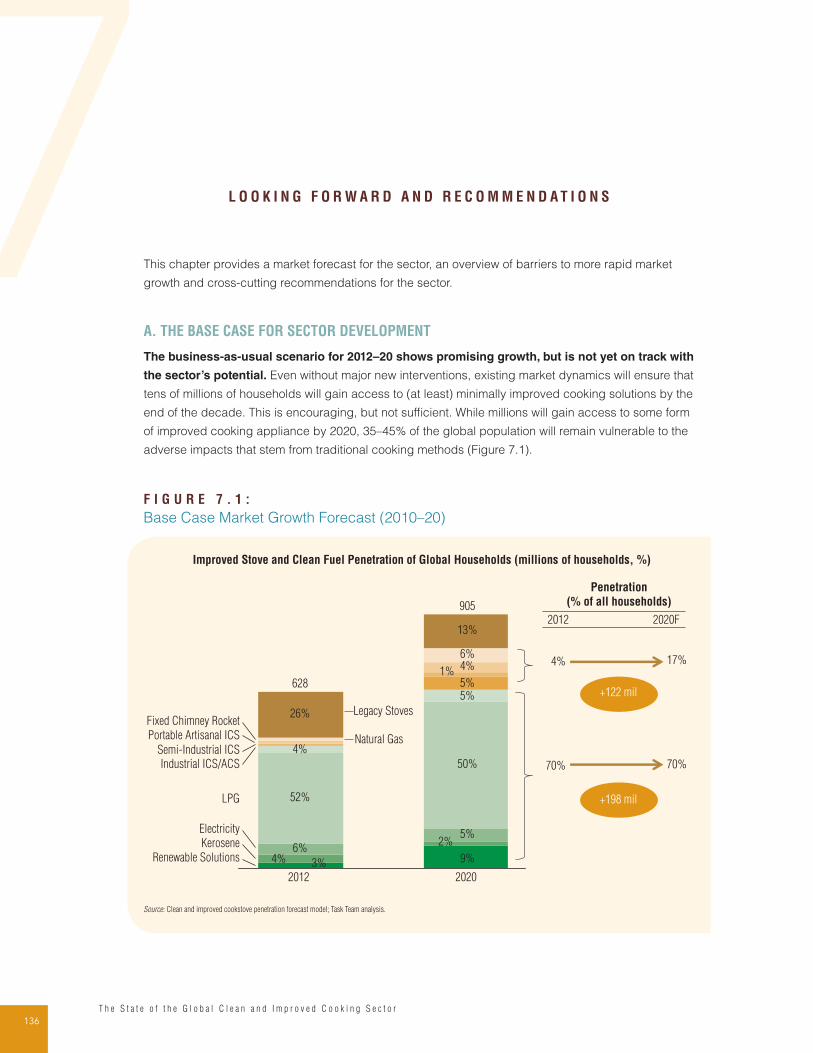
136T h e S t a t e o f t h e G l o b a l C l e a n a n d I m p r o v e d C o o k i n g S e c t o r
L O O K I N G F O R W A R D A N D R E C O M M E N D A T I O N S
This chapter provides a market forecast for the sector, an overview of barriers to more rapid market
growth and cross-cutting recommendations for the sector.
A. THE BASE CASE FOR SECTOR DEVELOPMENT
The business-as-usual scenario for 2012–20 shows promising growth, but is not yet on track with
the sector’s potential. Even without major new interventions, existing market dynamics will ensure that
tens of millions of households will gain access to (at least) minimally improved cooking solutions by the
end of the decade. This is encouraging, but not sufficient. While millions will gain access to some form
of improved cooking appliance by 2020, 35–45% of the global population will remain vulnerable to the
adverse impacts that stem from traditional cooking methods (Figure 7.1).
F I G U R E 7 . 1 :
Base Case Market Growth Forecast (2010–20)
Penetration
(% of all households)
2012 2020F
70% 70%
4% 17%
Improved Stove and Clean Fuel Penetration of Global Households (millions of households, %)
+122 mil
+198 mil
2020
905
9%
2%5%
50%
5%5%
1% 4%
Renewable Solutions
13%
2012
628
3%4%6%
52%
4%
26%
Kerosene
Electricity
LPG
Industrial ICS/ACS
Semi-Industrial ICS
Portable Artisanal ICS
Fixed Chimney Rocket
6%
Natural Gas
Legacy Stoves
Source: Clean and improved cookstove penetration forecast model; Task Team analysis.
7
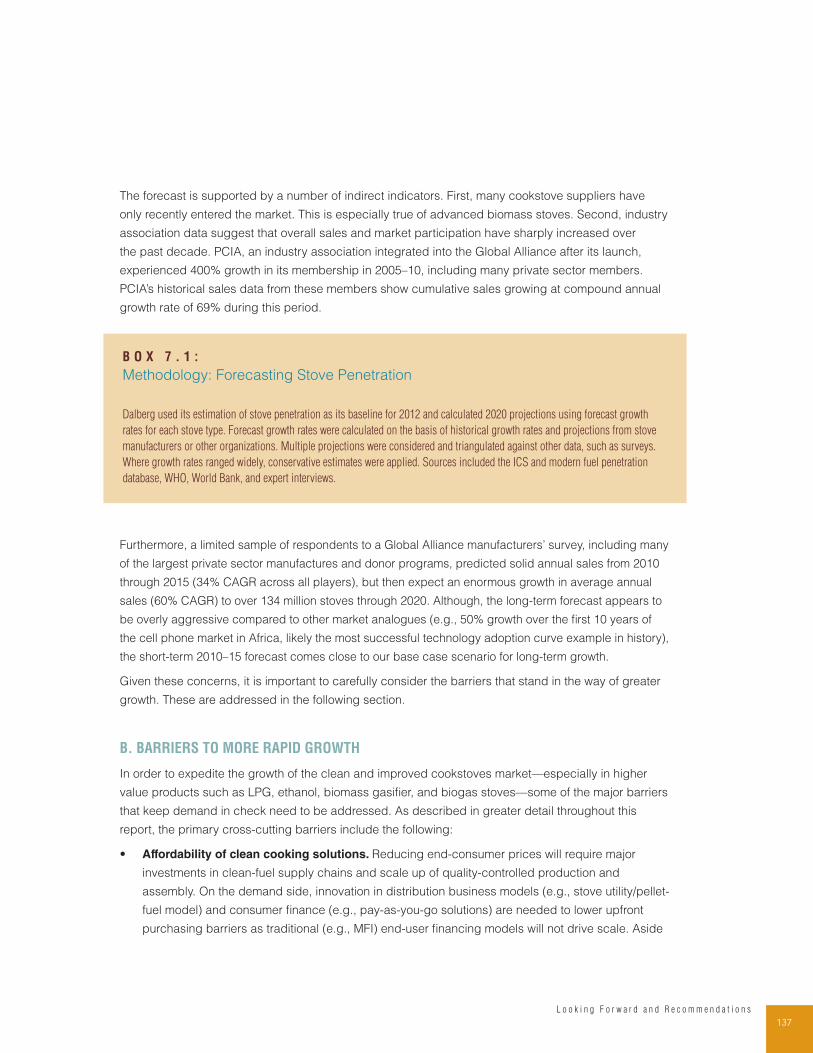
137L o o k i n g F o r w a r d a n d R e c o m m e n d a t i o n s
B O X 7 . 1 :
Methodology: Forecasting Stove Penetration
Dalberg used its estimation of stove penetration as its baseline for 2012 and calculated 2020 projections using forecast growth
rates for each stove type. Forecast growth rates were calculated on the basis of historical growth rates and projections from stove
manufacturers or other organizations. Multiple projections were considered and triangulated against other data, such as surveys.
Where growth rates ranged widely, conservative estimates were applied. Sources included the ICS and modern fuel penetration
database, WHO, World Bank, and expert interviews.
The forecast is supported by a number of indirect indicators. First, many cookstove suppliers have
only recently entered the market. This is especially true of advanced biomass stoves. Second, industry
association data suggest that overall sales and market participation have sharply increased over
the past decade. PCIA, an industry association integrated into the Global Alliance after its launch,
experienced 400% growth in its membership in 2005–10, including many private sector members.
PCIA’s historical sales data from these members show cumulative sales growing at compound annual
growth rate of 69% during this period.
Furthermore, a limited sample of respondents to a Global Alliance manufacturers’ survey, including many
of the largest private sector manufactures and donor programs, predicted solid annual sales from 2010
through 2015 (34% CAGR across all players), but then expect an enormous growth in average annual
sales (60% CAGR) to over 134 million stoves through 2020. Although, the long-term forecast appears to
be overly aggressive compared to other market analogues (e.g., 50% growth over the first 10 years of
the cell phone market in Africa, likely the most successful technology adoption curve example in history),
the short-term 2010–15 forecast comes close to our base case scenario for long-term growth.
Given these concerns, it is important to carefully consider the barriers that stand in the way of greater
growth. These are addressed in the following section.
B. BARRIERS TO MORE RAPID GROWTH
In order to expedite the growth of the clean and improved cookstoves market—especially in higher
value products such as LPG, ethanol, biomass gasifier, and biogas stoves—some of the major barriers
that keep demand in check need to be addressed. As described in greater detail throughout this
report, the primary cross-cutting barriers include the following:
• Affordability of clean cooking solutions. Reducing end-consumer prices will require major
investments in clean-fuel supply chains and scale up of quality-controlled production and
assembly. On the demand side, innovation in distribution business models (e.g., stove utility/pellet-
fuel model) and consumer finance (e.g., pay-as-you-go solutions) are needed to lower upfront
purchasing barriers as traditional (e.g., MFI) end-user financing models will not drive scale. Aside
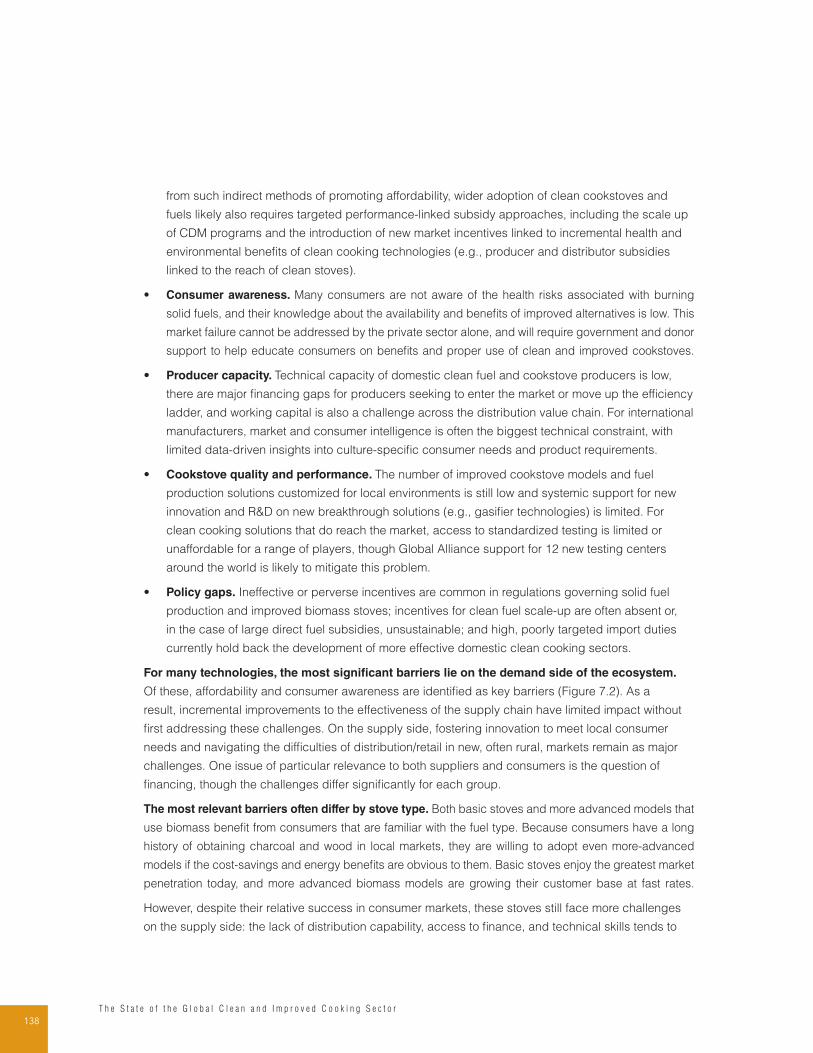
138T h e S t a t e o f t h e G l o b a l C l e a n a n d I m p r o v e d C o o k i n g S e c t o r
from such indirect methods of promoting affordability, wider adoption of clean cookstoves and
fuels likely also requires targeted performance-linked subsidy approaches, including the scale up
of CDM programs and the introduction of new market incentives linked to incremental health and
environmental benefits of clean cooking technologies (e.g., producer and distributor subsidies
linked to the reach of clean stoves).
• Consumer awareness. Many consumers are not aware of the health risks associated with burning
solid fuels, and their knowledge about the availability and benefits of improved alternatives is low. This
market failure cannot be addressed by the private sector alone, and will require government and donor
support to help educate consumers on benefits and proper use of clean and improved cookstoves.
• Producer capacity. Technical capacity of domestic clean fuel and cookstove producers is low,
there are major financing gaps for producers seeking to enter the market or move up the efficiency
ladder, and working capital is also a challenge across the distribution value chain. For international
manufacturers, market and consumer intelligence is often the biggest technical constraint, with
limited data-driven insights into culture-specific consumer needs and product requirements.
• Cookstove quality and performance. The number of improved cookstove models and fuel
production solutions customized for local environments is still low and systemic support for new
innovation and R&D on new breakthrough solutions (e.g., gasifier technologies) is limited. For
clean cooking solutions that do reach the market, access to standardized testing is limited or
unaffordable for a range of players, though Global Alliance support for 12 new testing centers
around the world is likely to mitigate this problem.
• Policy gaps. Ineffective or perverse incentives are common in regulations governing solid fuel
production and improved biomass stoves; incentives for clean fuel scale-up are often absent or,
in the case of large direct fuel subsidies, unsustainable; and high, poorly targeted import duties
currently hold back the development of more effective domestic clean cooking sectors.
For many technologies, the most significant barriers lie on the demand side of the ecosystem.
Of these, affordability and consumer awareness are identified as key barriers (Figure 7.2). As a
result, incremental improvements to the effectiveness of the supply chain have limited impact without
first addressing these challenges. On the supply side, fostering innovation to meet local consumer
needs and navigating the difficulties of distribution/retail in new, often rural, markets remain as major
challenges. One issue of particular relevance to both suppliers and consumers is the question of
financing, though the challenges differ significantly for each group.
The most relevant barriers often differ by stove type. Both basic stoves and more advanced models that
use biomass benefit from consumers that are familiar with the fuel type. Because consumers have a long
history of obtaining charcoal and wood in local markets, they are willing to adopt even more-advanced
models if the cost-savings and energy benefits are obvious to them. Basic stoves enjoy the greatest market
penetration today, and more advanced biomass models are growing their customer base at fast rates.
However, despite their relative success in consumer markets, these stoves still face more challenges
on the supply side: the lack of distribution capability, access to finance, and technical skills tends to
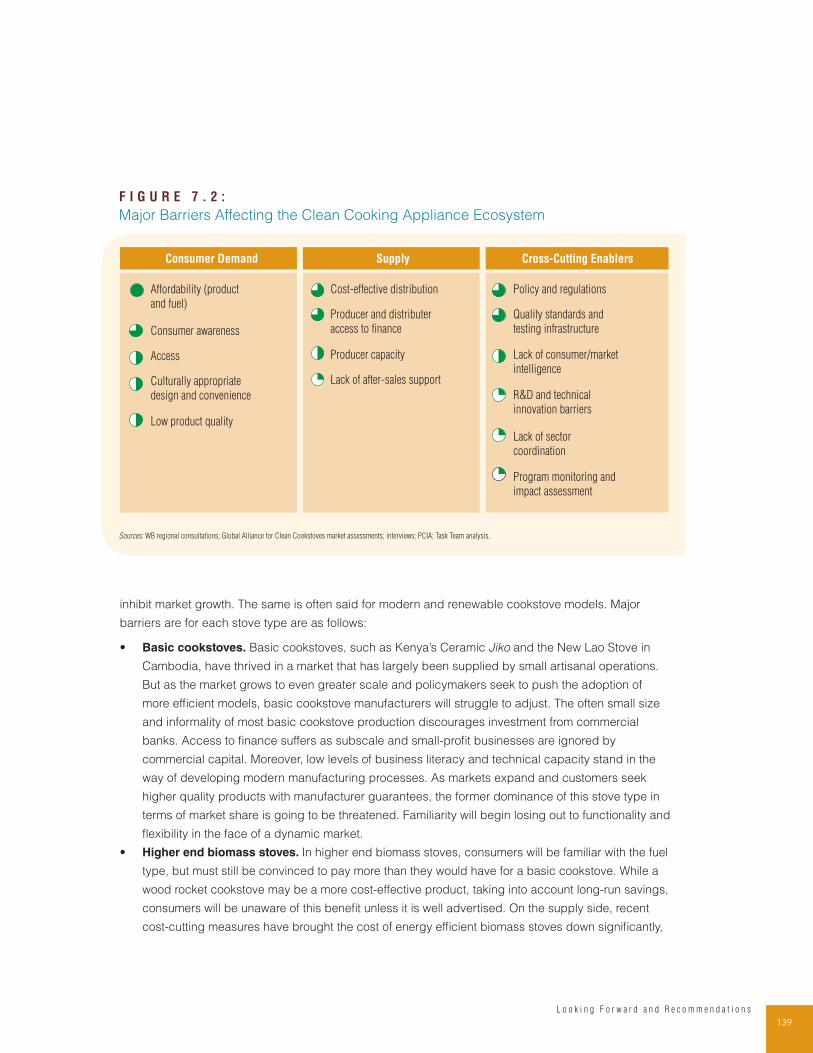
139L o o k i n g F o r w a r d a n d R e c o m m e n d a t i o n s
inhibit market growth. The same is often said for modern and renewable cookstove models. Major
barriers are for each stove type are as follows:
• Basic cookstoves. Basic cookstoves, such as Kenya’s Ceramic Jiko and the New Lao Stove in
Cambodia, have thrived in a market that has largely been supplied by small artisanal operations.
But as the market grows to even greater scale and policymakers seek to push the adoption of
more efficient models, basic cookstove manufacturers will struggle to adjust. The often small size
and informality of most basic cookstove production discourages investment from commercial
banks. Access to finance suffers as subscale and small-profit businesses are ignored by
commercial capital. Moreover, low levels of business literacy and technical capacity stand in the
way of developing modern manufacturing processes. As markets expand and customers seek
higher quality products with manufacturer guarantees, the former dominance of this stove type in
terms of market share is going to be threatened. Familiarity will begin losing out to functionality and
flexibility in the face of a dynamic market.
• Higher end biomass stoves. In higher end biomass stoves, consumers will be familiar with the fuel
type, but must still be convinced to pay more than they would have for a basic cookstove. While a
wood rocket cookstove may be a more cost-effective product, taking into account long-run savings,
consumers will be unaware of this benefit unless it is well advertised. On the supply side, recent
cost-cutting measures have brought the cost of energy efficient biomass stoves down significantly,
F I G U R E 7 . 2 :
Major Barriers Affecting the Clean Cooking Appliance Ecosystem
Consumer Demand Supply Cross-Cutting Enablers
Affordability (product
and fuel)
Consumer awareness
Access
Culturally appropriate
design and convenience
Low product quality
Cost-effective distribution
Producer and distributer
access to finance
Producer capacity
Lack of after-sales support
Policy and regulations
Quality standards and
testing infrastructure
Lack of consumer/market
intelligence
R&D and technical
innovation barriers
Lack of sector
coordination
Program monitoring and
impact assessment
Sources: WB regional consultations; Global Alliance for Clean Cookstoves market assessments; interviews; PCIA; Task Team analysis.
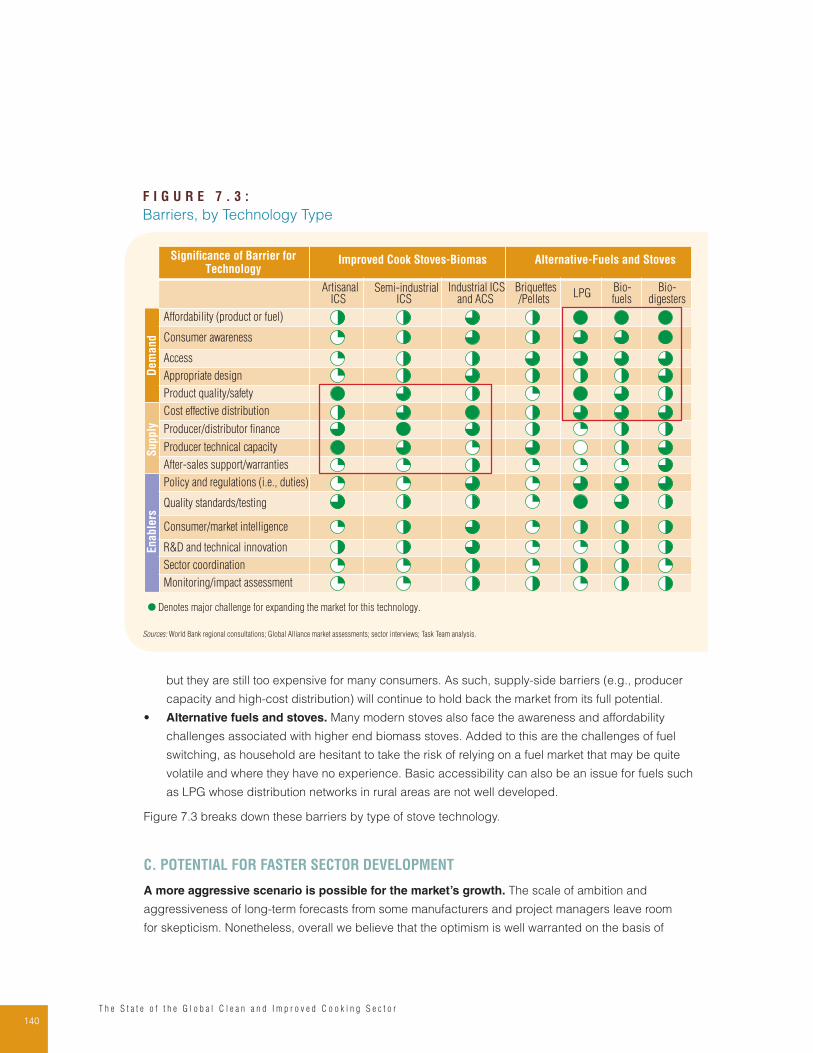
140T h e S t a t e o f t h e G l o b a l C l e a n a n d I m p r o v e d C o o k i n g S e c t o r
F I G U R E 7 . 3 :
Barriers, by Technology Type
Consumer awareness
Access
Significance of Barrier forTechnology
Affordability (product or fuel)
Appropriate design
Product quality/safety
Cost effective distribution
Producer/distributor finance
Producer technical capacity
After-sales support/warranties
Policy and regulations (i.e., duties)
Quality standards/testing
Consumer/market intelligence
R&D and technical innovation
Sector coordination
Monitoring/impact assessment
Denotes major challenge for expanding the market for this technology.
Artisanal ICS
Semi-industrialICS
Industrial ICS and ACS
Briquettes/Pellets
LPGBio-fuels
Bio-digesters
Improved Cook Stoves-Biomas Alternative-Fuels and Stoves
En
ab
lers
Su
pp
lyD
em
an
d
Sources: World Bank regional consultations; Global Alliance market assessments; sector interviews; Task Team analysis.
but they are still too expensive for many consumers. As such, supply-side barriers (e.g., producer
capacity and high-cost distribution) will continue to hold back the market from its full potential.
• Alternative fuels and stoves. Many modern stoves also face the awareness and affordability
challenges associated with higher end biomass stoves. Added to this are the challenges of fuel
switching, as household are hesitant to take the risk of relying on a fuel market that may be quite
volatile and where they have no experience. Basic accessibility can also be an issue for fuels such
as LPG whose distribution networks in rural areas are not well developed.
Figure 7.3 breaks down these barriers by type of stove technology.
C. POTENTIAL FOR FASTER SECTOR DEVELOPMENT
A more aggressive scenario is possible for the market’s growth. The scale of ambition and
aggressiveness of long-term forecasts from some manufacturers and project managers leave room
for skepticism. Nonetheless, overall we believe that the optimism is well warranted on the basis of
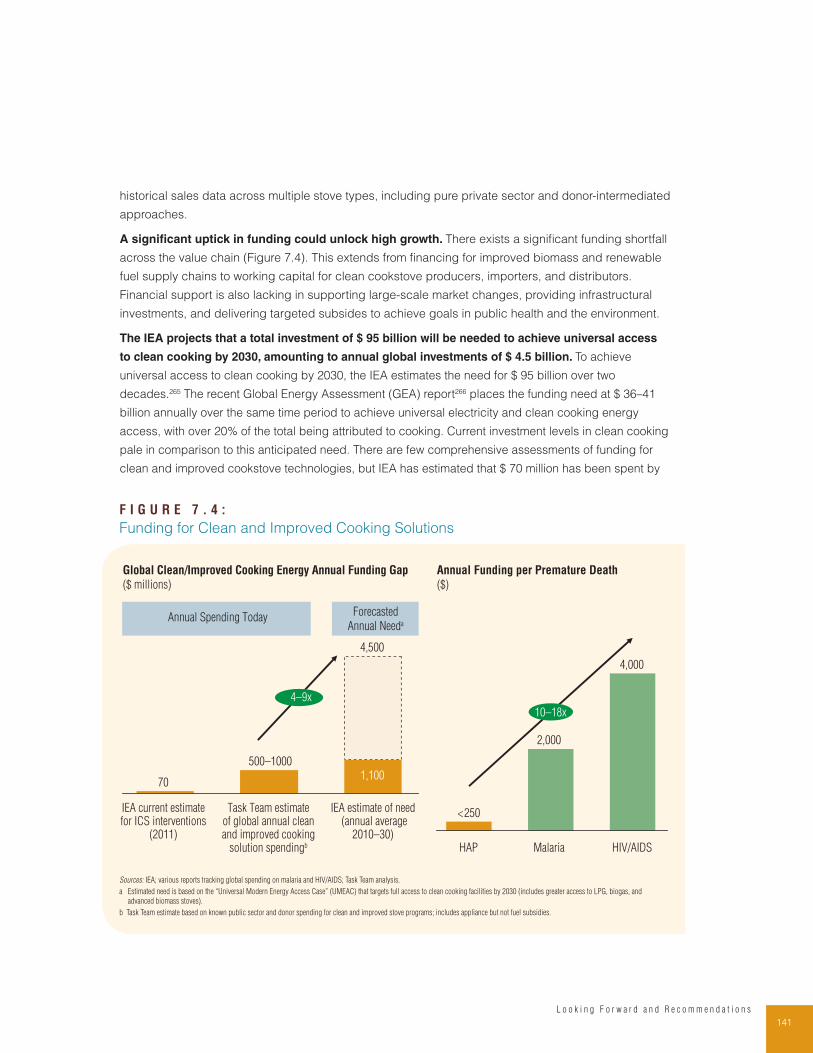
141L o o k i n g F o r w a r d a n d R e c o m m e n d a t i o n s
historical sales data across multiple stove types, including pure private sector and donor-intermediated
approaches.
A significant uptick in funding could unlock high growth. There exists a significant funding shortfall
across the value chain (Figure 7.4). This extends from financing for improved biomass and renewable
fuel supply chains to working capital for clean cookstove producers, importers, and distributors.
Financial support is also lacking in supporting large-scale market changes, providing infrastructural
investments, and delivering targeted subsides to achieve goals in public health and the environment.
The IEA projects that a total investment of $ 95 billion will be needed to achieve universal access
to clean cooking by 2030, amounting to annual global investments of $ 4.5 billion. To achieve
universal access to clean cooking by 2030, the IEA estimates the need for $ 95 billion over two
decades.265 The recent Global Energy Assessment (GEA) report266 places the funding need at $ 36–41
billion annually over the same time period to achieve universal electricity and clean cooking energy
access, with over 20% of the total being attributed to cooking. Current investment levels in clean cooking
pale in comparison to this anticipated need. There are few comprehensive assessments of funding for
clean and improved cookstove technologies, but IEA has estimated that $ 70 million has been spent by
F I G U R E 7 . 4 :
Funding for Clean and Improved Cooking Solutions
1,10070
Task Team estimateof global annual cleanand improved cooking
solution spendingb
IEA estimate of need (annual average
2010–30)
IEA current estimatefor ICS interventions
(2011)
500–1000
4,500
Global Clean/Improved Cooking Energy Annual Funding Gap
($ millions)
2,000
4,000
Malaria HIV/AIDS
<250
HAP
Annual Funding per Premature Death
($)
4–9x
10–18x
Annual Spending TodayForecasted
Annual Needa
Sources: IEA; various reports tracking global spending on malaria and HIV/AIDS; Task Team analysis.
a Estimated need is based on the “Universal Modern Energy Access Case” (UMEAC) that targets full access to clean cooking facilities by 2030 (includes greater access to LPG, biogas, and
advanced biomass stoves).
b Task Team estimate based on known public sector and donor spending for clean and improved stove programs; includes appliance but not fuel subsidies.
142T h e S t a t e o f t h e G l o b a l C l e a n a n d I m p r o v e d C o o k i n g S e c t o r
donors on improved and clean biomass cookstoves efforts globally.267 The Global Alliance has mobilized
roughly $ 50 million in the 5 years since its inception. Adding in LPG and biogas appliance investments
and subsidies, and excluding ongoing fuel subsidies, we estimate that the total global funding for clean
and improved cooking is unlikely to exceed the range of $ 500 million to $ 1 billion, suggesting that the
need exceeds available funding by four to nine times. Seen against the background of global health
expenditures, underfunding for the clean cooking sector is even more obvious: less than $ 250 in funding
per HAP death in contrast to more than $ 2,000 per malaria death and $ 4,000 per HIV death.
D. RECOMMENDATIONS
To accelerate the path to universal access to clean cooking, this report includes a number of
recommendations for various stakeholders.
Governments, NGOs, and the Donor Community
1. Significantly increase focus on clean cooking solutions, but continue to invest in intermediate
and basic ICSs given the segmented nature of the consumer and the slow pace of market
transition. Growing evidence for the negative health impacts of traditional biomass and coal cooking
suggests that full technology neutrality is not an option for donors and policymakers. Only the cleanest
modern and renewable fuels, and—pending further evidence from the field—advanced biomass
gasifier cookstoves can meaningfully mitigate the HAP-linked deaths of millions in coming years.
Sector interventions should prioritize the uptake of high-performing clean cooking solutions that—
because of their cost, early stage of commercialization, or limited consumer willingness to pay
for incremental health benefits—are unlikely to reach scale without major new investments in fuel
infrastructure, stove design, impact research (e.g., investment into RCTs and field performance studies
focused on emerging range of ACSs), distribution capacity, and end-user finance. At the global scale,
support is particularly vital for the cleanest modern and renewable solutions such as LPG and biogas,
which have seen exceptional uptake in several middle-income countries over the past decade (e.g.,
Indonesia, Vietnam, India for LPG; and China, Nepal, parts of Southeast Asia for biogas).
While a rebalancing of sector investments toward cleaner solutions is needed, the public sector should
continue to support fuel-efficient solutions such as intermediate and basic ICS, particularly in poorer, less
well-developed cooking markets and for excluded populations. Some basic and, in particular, intermediate
ICSs can generate fuel-saving benefits of clean biomass stoves at much lower price points; create moderate
health, environment, and climate benefits; and, in many cases, remain the only improved solution that is
reasonably accessible and affordable for the poor. Basic ICSs can have significant positive job creation
effects, particularly in markets across Africa, Southeast Asia (e.g., Cambodia), and South Asia (e.g., India)
where basic ICS markets are already robust. Furthermore, short payback periods for fuel-efficient ICS
and possible positive externalities of artisanal and semi-industrial markets (e.g., consumer exposure to
industrially manufactured, quality-controlled stoves) suggest that establishing an intermediate technology
baseline will not impede and may even accelerate consumer migration further up the energy ladder.
143L o o k i n g F o r w a r d a n d R e c o m m e n d a t i o n s
2. Support more sustainable production of clean biomass and renewable fuel alternatives alongside
the current focus on stove efficiency and emissions; demand-side solutions alone are not enough.
Historical trends make it clear that the rapid growth of woodfuel consumption will not be resolved via the
adoption of more efficient ICSs. Even universal adoption of basic ICSs in a region like Africa, for instance,
will only maintain the status quo of overall charcoal consumption by 2020 (i.e., it would simply cancel out
the projected 30% increase in charcoal use by volume). Mitigating the environmental and climate change
harms of biomass cooking requires supply-side interventions, including more rational biomass supply
markets (e.g., linkages to sustainable forestry), more efficient biomass fuel production technologies (e.g.,
higher efficiency charcoal kilns in Africa), renewable solid fuels from new sources (e.g., agricultural waste
and bamboo briquetting), the wider adoption of alternative fuels such as biogas and ethanol, and—where
culturally appropriate—the promotion of supplementary cooking solutions such as solar ovens (e.g., in
East and Central Asia) and retained-heat cookers (e.g., in Africa).
Fuel-side interventions, when properly executed, have high potential for sustainable market-based
approaches given the significantly larger scale of consumer spending on fuels than stoves. Furthermore,
fuel interventions have the advantage of the large labor force involved in cooking-fuel production and
distribution—which can, in theory, be co-opted into new value chains for improved and clean cooking fuel.
3. Prioritize market-based approaches wherever feasible to maximize cooking market sustainability,
but also deploy more direct subsidies when they can be tightly linked to health and environmental
impacts. Indirect subsidies for cooking market support and facilitation—consumer awareness, testing
centers, and industry associations, for example—have been an essential feature of all successful clean
fuel and cookstove programs both in Africa and globally to date. Direct subsidies for producers have
seen more mixed results, and subsidies for consumers have been the most problematic in both modern
fuel and ICS markets. There has been some evidence of slower cookstove uptake than via purely
commercial approaches, higher risks of promoting technologies that are not desired by consumers, and
serious sustainability challenges when ongoing fuel subsidies are withdrawn.
Despite these dangers, direct incentives via CDM markets and new incentives tied to health outcomes
are needed to scale up truly clean cooking technologies given their relatively high costs and the
immensity of the affordability challenge. The logic of fuel savings, combined with investments into
consumer awareness, will continue to convince consumers to adopt highly efficient, fuel-saving
appliances such as rocket stoves. Holding fuel efficiency constant, there is little evidence that
consumers are willing to pay the incremental $ 25–70 that separate high-quality industrial rocket stoves
($ 25–50) from truly clean advanced biomass gasifier solutions ($ 50–100). If CDM markets recover,
they can bridge a part of this gap (e.g., lowering the end-consumer price by $ 5–20), but additional
measures will be needed for compensating markets for introducing incremental health benefits that
are not appreciated by consumers. Potential mechanisms for structuring such producer and distributor
incentives include performance-based grants tied to proven health impacts or, perhaps, innovative
social impact bonds that can be linked to projected public health system savings. Direct consumer
subsidies can likewise be linked to impact and carefully targeted via vouchers or comparable
mechanisms drawing on lessons from malaria bed nets, biogas digesters, and existing ICS programs.
144T h e S t a t e o f t h e G l o b a l C l e a n a n d I m p r o v e d C o o k i n g S e c t o r
4. Focus on providing critical public goods to accelerate clean cooking sector development.
While the process has already launched via the coordinating efforts of the Global Alliance, there is still
a great deal of debate about the ideal role of donors and governments vis-à-vis the private sector in
the improved and clean cooking space. Report findings strongly suggest that, even with very strong
private sector leadership, there are multiple public goods that will require continued public sector
investment. Emphasis should be placed on consumer education, access to finance for producers and
distributors, quality standards, policy reform, and market intelligence.
5. Consumer education campaigns to promote awareness of the harmful effects of solid fuels, on
one hand, and the advantages of new clean cooking solutions, on the other hand, can and will be
an important complement for private sector marketing efforts. This has been seen in other market
transformation interventions focused on behavior change (e.g., solar lanterns, malaria bednets, water
filters, handwashing campaigns).
6. Access to finance is a constraint across stove and fuel value chains, but donors and governments
are uniquely well positioned to support critical upstream and mid-stream finance bottlenecks (e.g., in-
country producers, importers, and distributors) via their engagement with financial institutions and SME
promotion activities. The catalytic provision of first loss capital by donors to crowd in private investors
is an important model to think through as carbon finance markets weaken.
7. Market intelligence is a vital public good at this early stage of sector development. Major
knowledge gaps include the lack of systematized field data on the performance of new solutions like
gasifiers under real world conditions; weak base of knowledge on the systemic health, climate change,
and livelihood impacts of clean biomass and modern fuel stoves; and poor understanding of the
potential African clean energy consumer.
8. On the quality and standards front, much more still needs to be done to invest in global testing
centers since the capacity of local testing laboratories is constrained, and access to regional and
global testing facilities is cost prohibitive or impractical for many. Investment is also needed to finalize
the ongoing international standardization process, including the formalization of an ISO standard and
the formation of ISO Technical Committee and, crucially, the harmonization of global ICS standards
with local country standards bureaus and policymaker-rating approaches.
9. Policy is also a gap for many fuel and stove markets. For industrially produced cooking appliances,
taxes and duties not only exclude the best cookstove technologies from domestic markets, but often
adversely affect the potential for domestic cookstove assembly in markets such as Africa and Latin
America due to the high cost of imported components. Policy issues play an even more important role
in fuel markets. In Africa and Southeast Asia, in particular, with their large reliance on charcoal, more
rational regulation of traditional biomass supply chains is needed to bring woodfuels into the formal
sector. Across the board, in middle-income markets in particular, government support and public-
private partnerships are vital for the development of modern (e.g., LPG) and renewable (e.g., ethanol)
fuel markets infrastructure (e.g., transport routes and storage infrastructure), standards (e.g., LPG
cylinder revalidation and certification standards), and the elimination of perverse market incentives
(e.g., removal of kerosene subsidies).
145L o o k i n g F o r w a r d a n d R e c o m m e n d a t i o n s
Private Sector Stakeholders
1. Capture the first mover advantage: despite many challenges, there is an immense
underserved cooking market with growing opportunities and a rapidly rising number of new
entrants. The market has immense potential with hundreds of millions of fuel-purchasing households
(90 million in Africa alone), including a growing middle class (>15% of consumers with per capita
incomes over $ 1,500), and spending more than $ 20 billion on cooking fuel annually. Despite high
prices and affordability constraints, modern fuel use is growing at a quick pace in several markets,
clean solid biomass production and liquid biofuel enterprises are showing encouraging early results.
Industrial and semi-industrial ICS manufacturers are experiencing rapid year-on-year sales growth
(30–300%), attractive margins, particularly where carbon credits can be secured (5–20%), and,
thus far, low levels of competition. The range of products and suppliers is very small relative to the
potential consumer demand and in comparison to other analogous markets (e.g., ~10 sizeable
international manufacturers focused on improved cookstoves with >50k of sales vs. dozens of
international manufacturers focused on solar lanterns). This does not mean that the market lacks
challenges, but the opportunity for early entrants, including both multi-national corporations and
social entrepreneurs, is large.
2. Reduce prices via low-cost design, local production or assembly (where feasible), and
innovative distribution and financing models that lower upfront stove costs. Affordability, while
not the only barrier to cooking market development, is a major obstacle to the faster adoption of higher
cost improved and clean stoves and fuels in lower income geographies. The challenge may require
demand-side solutions such as consumer finance, but, in the near term, can likely best be addressed
by producers via tailored product development and distribution strategies. Anecdotal evidence from
interviews with cooking sector stakeholders suggests that even small reductions in cost can have
major uptake implications with many suggesting that a $ 15–25 price point for highly efficient and
clean stoves ($ 15–75 lower than prices in the market today) is required to ensure much broader
market volumes. The importance of price reduction strategies is also clearly evidenced by other BoP
product markets such as those for solar lanterns and mobile phones.
Drawing on lessons from other sectors, from a product design standpoint, manufacturers can lower
costs by embracing “frugal design” solutions that include the use of indigenous or recycled materials,
modular designs (e.g., ability to add on separate accessories, pot holders, plug-in TEG and fan units),
and flat-pack solutions that allow for local assembly with manageable trade-offs for product quality.
The development of low-cost intermediate ICS technologies in the $ 5–20 range (e.g., semi-industrial
metal rocket ICS in markets such as Ghana, Uganda, Kenya, and Malawi, and lower cost, fixed rocket
stove variations in Central America) and an emerging tier of $ 15–25 natural draft gasifier stoves in
multiple pilots across the globe (e.g., Awamu/Mwoto in Uganda, GreenTech stove in Gambia, and rice
gasifiers in Vietnam and Indonesia) is an important illustration of the opportunity.
Given the scale of Asia-based manufacturing, domestic production outside of large Asian
manufacturing centers, such as India and China, is not necessarily a path to lower costs, but should
be explored by manufacturers to tap into regional hubs (e.g., Kenya for East Africa). Transport,
146T h e S t a t e o f t h e G l o b a l C l e a n a n d I m p r o v e d C o o k i n g S e c t o r
insurance costs, import duties, and related expenses (warehousing, importer margins) are a large
share of the final cost of international ICS products (20–35%), so domestic production or assembly
may be the answer in those geographies that have sufficiently large markets, low labor costs, and
sufficient labor quality.
3. Focus on performance and quality: most consumers, even the poor, are willing to pay for
better design, and the public sector is increasingly willing to support solutions that can ensure
health results. While market spoilage due to consumer disappointment with low-quality products is
not yet a major concern for the cookstove sector in most countries, experience in other household
energy markets (e.g., solar home systems, solar lanterns) shows that the BoP consumer is mindful of
product quality (i.e., durability, shelf-life, safety). There is some anecdotal evidence that, in any given
technology class, better-performing cookstoves see faster sales growth than products with inferior fuel
efficiency and emissions performance. Consumer surveys also suggest that product design matters
to end users: cookstoves that are better adapted to consumer usage patterns (e.g., pot size, stove
height, cooking time) receive higher ratings from end users and are associated with higher willingness
to pay. Self-reported sales and stove project data suggest that the highest market growth today (at
least for high-end ICS solutions) is correlated with products that are perceived by the sector to have
better design features.
4. Focus on opportunities in cooking fuels, not just cookstoves, because the global fuel market
is orders-of-magnitude larger than that for cooking appliances. There is a significant opportunity
for formal sector entrepreneurs with access to capital to adopt improved production technologies
(e.g., efficient charcoal kilns) and capture attractive margins and rapid sales growth from burgeoning
charcoal markets. Renewable solid fuel briquette and pellet manufacturing is a growing opportunity
for private enterprises, ranging in size from artisanal producers to mid-sized industrial enterprises
manufacturing thousands of tons of fuel annually. The biofuels sector also has promising and
potentially profitable models on the horizon, including decentralized feedstock outgrower schemes
and micro-distillery production units that can ensure a stable, low-cost biofuel supply. For maximum
uptake, end-user impact, and (potential) profitability, clean solid biomass and renewable fuels can
be integrated into clean-cookstove business models (e.g., free or low-cost cookstove distribution
subsidized by high margins on fuel refill sales). The integrated fuel/stove model is being piloted in
several projects in Africa and India with some encouraging early results.
E N D N O T E S
265 IEA, 2011.
266 GEA, 2012.
267 Advanced biomass stoves are defined by the IEA in this report as “biomass gasifier-operated cooking stoves,
which run on solid biomass, such as wood chips and briquettes.”
147B i b l i o g r a p h y
B I B L I O G R A P H Y
Adkins, E. et al., 2010. Field testing and survey evaluation of household biomass cookstoves in rural Sub-Saharan
Africa. Energy for Sustainable Development, Volume 14, pp. 172–85.
African Development Bank Group, 2005 or earlier. Data and Model Tools (AICD). [Online]
Available at: http://www.infrastructureafrica.org/models/canned/
[Accessed 28 June 2012].
African Development Bank Group, 2011. Road Sectors. [Online]
Available at: http://www.infrastructureafrica.org/key-msg/sector/however-good-quality-roads-road-freight-will-
continue-be-costly-and-inefficient-until
[Accessed 30 June 2012].
Agbey, S., 2012. SNV Ghana [Interview] (May 2012).
Agency, U. E. P., 2011. Black Carbon Report to Congress, Washington, DC: US Environmental Protection Agency.
Agyeman, K. O., Amponsah, O., Braimah, I. & Lurumuah, S., 2012. Commercial Charcoal Production and Sustainable
Community Development of the Upper West Region, Ghana. Journal of Sustainable Development, 5(4).
Alexander, D. T., Crozier, P. & Anderson, J., 2008. Brown carbon spheres in East Asia in outflow and their optical
properties. Science, Volume 321, pp. 833–6.
Anon., 2007. Breathing Space: Smoke-free homes. Healthy Families. [Online]
Available at: http://www.enterpriseworks.org/pubs/May%2007%20Gyapa%20Summary.pdf
Anon., 2011. The Past, Present, and Future of Improved Cookstove Initiatives. [Online]
Available at: https://sites.google.com/a/ncsu.edu/khopkarworldforestry/#TOC-China---Chinese-National-
Improved-Stove-Program-CNISP-
Anon., 2012. Ministry of Coordination of Environmental Affairs [Interview] (18 May 2012).
Anon., n.d. EnDev-About. [Online]
Available at: http://endev.info/index.php/Donors_and_Partners
Anon., n.d. EnterpriseWorks Programs. [Online]
Available at: http://www.ewghana.org/programs.aspx
Anon., n.d. ProBEC’s Country Assistance across SADC. [Online]
Available at: http://www.probec.org/displaysection.php?czacc=&zSelectedSectionID=sec1192918118
Approvecho Testing Center, 2011. Test Results of Cook Stove Performance, s.l.: PCIA.
Archway Technology Management Ltd, 2008. Sunny Solutions Project Nyakach. Report on Impact Evaluation,
Kenya: Archway Technology Management Ltd.
Atsu, T., 2012. EnterpriseWorks / VITA [Interview] (14 May 2012).
Bacon, R., Bhattacharya, S. & Kojima, M., 2009. Expenditure of Low-Income Households on Energy: Evidence from
Africa and Asia, Washington, DC: World Bank.
Bacon, R., Bhattacharya, S. & Kojima, M., 2010. Expenditure of Low-Income Households on Energy – Evidence
from Asia and Africa, Washington DC: World Bank.
Bacon, R. & Kojima, M., 2006. Phasing Out Subsidies: Recent Experiences with Fuel in Developing Countries,
Washington DC: World Bank.
Bailis, R., 2005. Fuel from the Savannah: Understanding the Climate Change Impacts of Large-Scale Charcoal
Production in Kenya. s.l., Breslauer Symposium, UC Berkeley.
148T h e S t a t e o f t h e G l o b a l C l e a n a n d I m p r o v e d C o o k i n g S e c t o r
Bailis et al., 2015. “The Carbon Footprint of Traditional Fuels,” Natural Climate Change: DOI 10–38.
Balakrishnan, K. et al., 2004. Exposure Assessment for Respirable Particulates Associated with Household Fuel
Use in Rural Districts of Andhra Pradesh, India. Journal of Exposure Analysis and Environmental Epidemiology,
Volume 14, pp. S14–25.
Baland, J.-M., Das, S. & Mookherjee, D., 2010. Forest Degradation in the Himalayas: Determinants and Policy
Options, s.l.: University of Boston.
Balmer, M., 2012. GIZ-ProBEC [Interview] (28 May 2012).
Banerjee, M., Siddique, S., Dutta, A. & Mukherjee, B., 2012. Cooking with biomass increases the risk of depression
in pre-menopausal women. Social Science & Medicine, 75(3), pp. 565–72.
Barnes, D. F., Kumar, P. & Openshaw, K., 2012. Cleaner Hearths, Better Homes: New stove for India and the
developing world. s.l.:Oxford University Press.
Baumgartner, J., Smith, K. R. & Chockalingam, A., 2012. Reducing CVD Through Improvements in Household
Energy: Implications for Policy-Relevant Research. Global Heart, 7(3), pp. 243–247.
Bensch, G. & Peters, J., 2011a. Impacts of Improved Cooking Stove Dissemination – Evidence from urban Senegal,
Essen: RWI.
Bensch, G. & Peters, J., 2011b. Combating Deforestation? Impacts of Improved Stove Dissemination in Urban,
Essen: RWI.
Berkeley Air Monitoring Group, 2010. Evaluation of manufactured wood-burning stoves in Dadaab refugee camps,
Washington, DC: USAID.
Berkeley Air Monitoring, 2012. Stove Inventory Report, s.l.: Global Alliance for Clean Cookstoves.
Berrueta, V., Edwards, R. & Masera, O., 2008. Energy performance of wood-burning cookstoves in Michoacan,
Mexico. Renewable Energy, pp. 859–870.
Bhargava, A., Khanna, R. N., Bhargava, S. K. & Kumar, S., 2004. Exposure risk to carcinogenic PAHs in indoor air
during biomass combustion whilst cooking in rural India. Atmospheric Environment, 38(28), pp. 4761–7.
Biomass, N. P. S., 2010. Making Charcoal Production in Sub-Saharan Africa Sustainable, s.l.: Netherlands
Programmes Sustainable Biomass.
Biopact, 2007. Energy crisis in Zimbabwe Fuels Environmental Crisis; Bioenergy, Renewables Offer Way Out. [Online]
Available at: http://news.mongabay.com/bioenergy/2007/09/energy-crisis-in-zimbabwe-fuels.html
[Accessed 15 June 2012].
Bizzarri, M. & Deni, K., 2010. Safe access to firewood and alternative energy in Ethiopia: an appraisal report, s.l.:
World Food Program.
Blackden, M. & Wodon, Q., 2006. Gender, Time Use, and Poverty in Sub-Saharan Africa, s.l.: World Bank Group.
Bloomberg, 2012. http://www.renewableenergyworld.com/rea/news/article/2012/10/
kenyas-m-kopa-offers-cheaper-solar-power-to-off-grid-villages
Blum Center for Developing Economies, 2008. Darfur Stoves. [Online]
Available at: http://blumcenter.berkeley.edu/global-poverty-initiatives/energy-efficient-technologies/darfur-fuel-
efficient-stoves
[Accessed 15 June 2012].
Blunck, M., Griebenow, C., Rammelt, M. & Zimm, C., 2011. Carbon Markets for Improved Cooking Stoves: A GIZ
Guide for Project Operators, Eschborn: GIZ-HERA.
Bojö, J. & Cassells, D., 1995. Land Degradation and Rehabilitation in Ethiopia: A Reassessment, Washington, DC: s.n.
Bond, T. et al., 2007. Historical emissions of black and organic carbon aerosol from energy-related combustion,
1850–2000. Global Biochemical Cycles, Volume 21, p. GB2018.
149B i b l i o g r a p h y
Bond, T., Doherty, S. J. & Fahey, D. W., 2013. Bounding the role of black carbon in the climate system: A scientific
assessment. Journal of Geophysical Research: Atmospheres.
Bond, T. & Templeton, M. R., 2011. History and future of domestic biogas plants in the developing world. Energy for
Sustainable Development, Volume 15, pp. 347–354.
Bond, T., Zarzycki, C., F. M. & Koch, D., 2011. Quantifying immediate radiative forcing by black carbon and organic
matter with the Specific Forcing Pulse. Atmospheric Chemistry and Physics, Volume 11, p. 1505–25.
Boy, E., Bruce, N. & Delgado, H., 2002. Birth weight and exposure to kitchen wood smoke during pregnancy in rural
Guatemala. Environ Health Perspect., 110(1), pp. 109–14.
Brew-Hammond, P. A., 2009. Bioenergy for Accelerated Agro-Industrial Development in Ghana, s.l.: s.n.
Broadhead, J., Bahdon, J. & Whiteman, A., 2001. Woodfuel Consumption Modelling and Results.” In Past Trends
and Future Prospects for the Utilisation of Wood for EnergyWorking Paper No. GFPOS/WP/05, Global Forest
Products Outlook Study, Rome: UN FAO.
Bruce, N., Perez-Padilla, R. & Albala, R., 2000. Indoor air pollution in developing countries: a major environmental
and public health challenge, s.l.: WHO.
Bruvall, A., Skjelvik, J. M. & Vennemo, H., 2011. 6.5 Subsidies to fossil energy consumption in some low-income
countries. In: Reforming environmentally harmful subsidies. Copenhagen: Nordic Council of Ministers.
Burwen, J., 2011. From Technology to Impact Understanding and Measuring Behavior Change with Improved
Stoves, s.l.: UC Berkeley.
Burwen, J. & Levine, D. I., 2012. A rapid assessment randomized-controlled trial of improved cookstoves in rural
Ghana. Energy for Sustainable Development, 16(3), pp. 328–338.
Carr, M. & Hartl, M., 2010. Lightening the Load: Labour-saving technologies and practices for rural women, s.l.:
International Fund for Agricultural Development (IFAD) and Practical Action Publishing.
Cecelski, Elizabeth., 2004. Re-thinking gender and energy: Old and new directions, ENERGIA/EASE Discussion
Paper. ETC, The Netherlands.
Chafe et al., 2014. “Household cooking with solid fuels contributes to ambient PM 2.5 air pollution and the burden of
disease,” Environmental Perspectives Journal: http://dx.doi.org/10.1289/ehp.1206340
Chandramohan, S., 2013. Systematic review and meta-analysis of the associations between indoor air pollution and
tuberculosis. Trop Med Int Health, 18(1), pp. 101–108.
Chdumayo, E. N. & Gumbo, D. G., 2012. The environmental impacts of charcoal production in tropical ecosystems
of the world: A synthesis. Energy for Sustainable Development.
Chidamba, C. T., 2010. Report on the Impact Assessment of the POCA (POupa CArvão) Charcoal Stove in
Mozambique, s.l.: ProBEC.
Clancy, J.S. et al., 2011. Gender equity in access to and benefits from modern energy and improved energy
technologies., s.l.: Nor/Soer-konsulenterne.
Clancy, J. S., Skutsch, M. M. & Batchelor, S., 2003. The Gender – Energy – Poverty Nexus: Finding the energy to
address gender concerns in development., London: UK Department for International Development (DFID).
Colvin, J. & Vergnano, E., 2011. Cookstove Interventions in Developing Countries:Designing Tools for Effective
Program Evaluation, s.l.: PCIA.
Concern Universal, 2011. Socio-cultural acceptability of improved cookstoves (ICS) in rural Malawi., s.l.: Irish Aid.
Cooke, P., Köhlin, G. & Hyde, W. F., 2008. Fuelwood, forests and community management – evidence from
household studies. Environment and Development Economics, Volume 13, pp. 103–135.
150T h e S t a t e o f t h e G l o b a l C l e a n a n d I m p r o v e d C o o k i n g S e c t o r
Cotula, L., Dyer, N. & Vermeulen, S., 2008. Fuelling Exclusion? The Biofuels Boom and Poor People’s Access to
Land, London: International Institute for Environment and Development (IIED).
Damte, A., Koch, S. & Mekonnen, A., 2011. Coping with Fuel Wood Scarcity: Household Responses in Rural
Ethiopia, Pretoria: University of Pretoria.
Daurella, D. C. & Foster, V., 2009. What can be earned from household survesys on inequalitys in cooking fuels in
Sub-Saharan Africa., Washington, D.C.: Word Bank.
DFID, 2000. Poverty Reduction Aspects of Successful Improved Household Stoves Programmes Project 7368, s.l.:
Department for International Development KAR Project R7368.
Dherani, M., Pope, D., Mascarenhas, M. & Smith, K., 2008. Indoor air pollution from unprocessed solid fuel use
and pneumonia risk in children aged under five years: A systematic review and meta-analysis., s.l.: World Health
Organization.
Diaz, E. S.-S. T. & Pope, D., 2007. Eye discomfort, headaches, and back pain among Mayan Guatemalan women
taking part in a randomized stove intervention trial. J Epidemiol Community Health., 61(1), p. 74–79.
Domac, J., Richards, K. & Risovic, S., 2005. Socio-economic drivers in Implementing Bioenergy Projects. Biomass
& Bioenergy, 28(2), pp. 95–266.
Dooho, C., Guernsey, J. R., Critchley, K. & VanLeeuwen, J., 2012. Pilot Study on the Impact of Biogas as a Fuel
Source on Respiratory Health of Women on Rural Kenyan Smallholder Dairy Farms. Journal of Environmental and
Public Health.
Duflo, E., Greenstone, M. & Hanna, R., 2007. Indoor Air Pollution, Health and Economic Well-being, s.l.: s.n.
Duflo, E., Greenstone, M. & Hanna, R., April 2012. Up in Smoke: The Influence of Household Behavior on the Long-
run Impact of Improved Cooking stoves, Boston: MIT.
Earth, B. & Sthapit, S., 2002. Uterine prolapse in rural Nepal: Gender and human rights implications. A mandate for
development. Culture, Health, and Sexuality, 4(3), pp. 281–96.
Eberhard, A. et al., 2008. Underpowered: The State of the Power Sector in Sub-Saharan Africa, s.l.: AICD.
Egziabher, A., Murren, J. & O’Brien, C., 2006. An Ethanol-fueled Household Energy Initiative in the Shimelba Refugee
Camp, Tigray, Ethiopia: A Joint Study by the UNHCR and the Gaia Association., s.l.: UNHCR and Project Gaia.
Ekouevi, K., 2012. Senior Economist [Interview] (13 June 2012).
Ekouevi, K. & Tountivate, V., 2012. Households energy lessons for cooking and heating: Lessons learned and the
way forward., Washington DC: World Bank.
Ellegård, A., 1997. Tears while cooking: an indicator of indoor air pollution and related health effects in developing
countries. Environ Res., 75(1), pp. 12–22.
Energica, 2009. Pre-feasibility study for an improved cookstoves project in Northern Ghana, s.l.: s.n.
Engineering News, Feb 2012. Gas infrastructure: Kenya revives liquefied petroleum gas storage plan as prices
surge. [Online]
Available at: http://www.engineeringnews.co.za/article/kenya-liquefied-petroleum-gas-2012-02-10
[Accessed 11 June 2012].
Ergeneman, A., 2003. Recommendations for the Eritrea Dissemination of Improved Stoves Program, s.l.: s.n.
European Commission, 2010. Study on the evolution of some deforestation drivers and their potential impacts on
the costs of a deforestation avoiding scheme, s.l.: European Commission Directorate-General for Environment.
Evodius, R., 2010. Household Stoves Impact Assessment Report (Tanzania), s.l.: GiZ/PROBEC.
Evodius, R., 2010. Tanzania Household Impact Assessment, s.l.: ProBEC.
151B i b l i o g r a p h y
Ezzati, M. & Kammen, D. M., 2002. “The health impacts of exposure to indoor air pollution from solid fuels in developing
countries: Knowledge, gaps, and data needs. Environmental Health Perspectives, 110(11), pp. 1057–1068.
FAO [Food and Agriculture Organisation], Forestry Department 2005. East Africa: Spatial Woodfuel Production and
Consumption Analysis (WISDOM), s.l.: FAO.
FAO, n.d. Chapter 2: Forest resources and woody biomass, s.l.: s.n.
Ferguson, H., 2012. Briquette Businesses in Uganda: the potential for briquette enteprise to address the
sustainability of the Ugandan biomass fuel market, London, UK: GVEP.
Foell, W., S, P., D, S. & H, Z., 2011. Household cooking fuels and technologies in developing economies. Energy
Policy, 39(12), p. 7487–7496.
Folefack, D. P. & Abou, S., 2009. Commercialisation du bois de chauffe en zone sahélienne du Cameroun.
Sécheresse, 20(3), pp. 312–8.
FPAN, n.d. Chapter 6: Woodfuels and Forests in Tropical Africa, s.l.: s.n.
Franco Suglia, S. et al., 2008. Association of Black Carbon with Cognition among Children in a Prospective.
American Journal of Epidemiology, 167(3), pp. 280–286.
Fullerton, D. G., Bruce, N. & Gordon, S. B., 2008. Indoor air pollution from biomass fuel smoke is a major health
concern in the developing world. Trans R Soc Trop Med Hyg., 102(9), p. 843–851.
Garcia-Frapolli, E., Schilmann, A. & Berrueta, V., 2010. Beyond fuelwood savings: Valuing the economic benefits of
introducing improved biomass cookstoves in the Purépecha region of Mexico. Ecological Economics, Volume 69,
pp. 2598–2605.
Gaul, M., 2009. Subsidy schemes for the dissemination of improved stoves, s.l.: s.n.
GEA [Global Energy Assessment], 2012. Global Energy Assessment – Toward a Sustainable Future, Cambridge,
UK, New York, USA, and Laxenburg, Austria: Cambridge University Press and International Institute for Applied
Systems Analysis.
Gifford, M. L., 2011. A Global Review of Cookstove Programs, s.l.: s.n.
Giliba, R. A. et al., 2011. The Influence of Socio-economic Factors on Deforestation: A Case Study of the Bereku
Forest Reserve in Tanzania. Journal of Biodiversity, 2(1), pp. 31–9.
Girad, P., n.d. Charcoal production and use in Africa: what future?. [Online]
Available at: http://www.fao.org/docrep/005/y4450e/y4450e10.htm
[Accessed 15 June 2012].
Global Alliance [Global Alliance for Clean Cookstoves]. 2011. Igniting Change: A Strategy for Universal Adoption of
Clean Cookstoves and Fuels, s.l.: United Nations Foundation.
Global Alliance, 2013. Results Report 2012: Sharing progress on path to adoption of clean cooking solutions.
United Nations Foundation.
Global Alliance, 2014a. Results Report 2013: Sharing progress on path the adoption of clean cooking solutions.
United Nations Foundation.GmbH, G., n.d. [Online]
Available at: http://www.giz.de/en/aboutgiz/profile.html
Global Alliance, 2014b. China: Fuels and Stoves Market Assessment and Strategies for the next National Program.
Goldemberg, J. & Coelho, S. T., 2003. Renewable energy – traditional biomass vs. modern biomass. Energy Policy,
32(6), pp. 711–14.
Goldemberg, J., Johansson, T. B., Reddy, A. K. & Williams, R. H., 2004. A global clean cooking fuel initiative.
Energy for Sustainable Development, VIII(3), pp. 5–12.
152T h e S t a t e o f t h e G l o b a l C l e a n a n d I m p r o v e d C o o k i n g S e c t o r
Green Markets International, 2007. The Voluntary Carbon Market: Status & Potential to Advance Sustainable Energy
Activities. [Online]
Available at: http://www.green-markets.org/Downloads/vCarbon.pdf
[Accessed 14 June 2012].
Grimm, M. & Peters, J., 2012. Improved Cooking Stoves that End up in Smoke? A comment on Hanna, Duflo and
Greenstone, Essen: RWI.
Habermehl, H., 2007. Economic evaluation of the improved household cooking stove dissemination programme in
Uganda, s.l.: s.n.
Hakizimana, G., 2008. EAC Strategy to Scale Up Access to Modern Energy Services; Burundi Country Baseline
Report and Workplan, s.l.: East African Community (EAC).
Hamlin, A., 2012. Assesment of Social and Economic Impacts of Biogas Digesters in Rural Kenya, s.l.: s.n.
Hammond, A. L. et al., 2007. The Next 4 Billion: Market Size and Business Strategy at the Base of the Pyramid, s.l.:
World Resources Institute and International Finance Corporation.
Hanna, R., Duflo, E. & Greenstone, M., 2012. Up in Smoke: The Influence of Household Behavior on the Long-Run
Impact of Improved Cooking Stoves., Cambridge, MA.: MIT Department of Economics.
Harvard University Gazette, 2005. Harvard University Gazette Archives. [Online]
Available at: http://news.harvard.edu/gazette/2005/04.07/11-charcoal.html
[Accessed 10 June 2012].
HEDON Household Energy Network, 2009. Boiling Point. A Practitioner’s Journal on Household Energy. Stoves and
Poverty Reduction, U.K.: HEDON.
HEDON, 2009. HEDON: Fuel Wood. [Online]
[Accessed 5 May 2012].
HEDON, 2010. Charcoal Production Chain. [Online]
Available at: http://www.hedon.info/CEC:CharcoalProductionChain
[Accessed 15 June 2012].
Heltberg, R., 2003. Household Fuel and Energy Use in Developing Countries – A Multicultural Study (Draft for
Discussion), s.l.: World Bank.
Hiemstra-van der Horst, G. a. H. N., 2008. Reassessing the “Energy Ladder”. Energy Policy, Volume 36, pp.
3333–3344.
Hosier, R., Mwandosya, M. & Luhanga, M., 1993. Future energy development in Tanzania: the energy costs of
urbanization. Energy Policy, p. 524–42.
Hosonuma, N. et al., 2012. An assessment of deforestation and degradation drivers in developing countries.
Environmental Research Letters (in review), Volume (in review).
Howells, M. et al., 2005. A model of household energy services in a low-income rural African village. Energy Policy,
33(14), pp. 1833–51.
Huq, M. et al., 2004. Who Suffers from Indoor Air Pollution? Evidence from Bangladesh, Washigton DC: World Bank.
Hutton, G., Rehfuess, E. & Tediosi, F., December 2007. Evaluation of the costs and benefits of interventions to
reduce indoor air pollution. Energy for Sustainable Development.
Hystra and Asoka, 2009. Access to Energy for the Base of the Pyramid, s.l.: Hystra and Asoka.
iDE, 2011. Biogas User Survey 2010, s.l.: IDCOL.
IDEO.org, 2012. Cookstoves in Tanzania: User Insights and Opportunities, s.l.: Global Alliance For Clean
Cookstoves.
153B i b l i o g r a p h y
IEA [International Energy Agency], 2006a. Angola: Towards an Energy Strategy, Paris: IEA/OECD.
IEA, 2006b. Energy for cooking in developing countries, Paris: OECD/IEA.
IEA, 2007. Renewables in Global Energy Supply; An IEA Fact Sheet. Paris, France., Paris, France: IEA.
Ingwe-Musungu, A., 2011. Integration of Gender in EnDev — Kenya. Amsterdam, Energia.
IEA, 2008. Propects in Oil and Gas Exporting Sub-Saharan African Countries; Could their Resources Alleviate
Energy Poverty. In: World Energy Outlook 2008 — Oil and Gas Production Prospects. s.l.:International Energy
Agency (IEA).
IEA, 2010. World Energy Outlook 2010, Paris: IEA.
IEA, 2011. Energy poverty: how to make modern energy access universal?, Paris: OECD/IEA.
International Institute for Sustainable Development, 2010. Lessons Learned from Attempts to Reform India’s
Kerosene Subsidy, Geneva: Global Subsidies Initiative.
International Institute for Sustainable Development, 2011. A Citizen’s Guide to Energy Subsidies in Indonesia,
Geneva: Global Subsidies Initiative.
IRENA [International Renewable Energy Agency], 2012. Renewable Energy Jobs and Access, s.l.: International
Renewable Energy Agency.
ISAK, K., n.d. Improved Stoves Association of Kenya. [Online]
Available at: https://energypedia.info/images/6/65/ISAK_Kenya.pdf
Jetter, J. & Kariher, P., 2009. Solid-fuel household cookstoves: Characterization of performance and emissions.
Biomass and Bioenergy, Volume 33, pp. 294–305.
Jeuland, M. & Pattanayak, S. K., 2012. Benefits and Costs of Improved Cookstoves: Assessing the Implications of
Variability in Health, Forest and Climate Impacts. PLoS One, 7(2), p. e30338.
Johnsen, F. H., 1999. Burning with Enthusiasm: Fuelwood Scarcity in Tanzania in Terms of Severity, Impacts and
Remedies. Forum for Development Studies, Volume 1, pp. 107–131.
JRI Research, 2011. Biogas User Survey: Indonesia, s.l.: Hivos.
Kambewa, P., Mataya, B., Sichinga,. W. & Johnson, T., 2007. Charcoal: The Reality: A study of charcoal
consumption, trade and production in Malawi, s.l.: Community Partnerships for Sustainable Resource
Management in Malawi.
Kammen, D. & Lew, D., 2005. Review of Technologies for the Production and Use of Charcoal, Berkely, California:
Energy and Resources Group & Goldman School of Public Policy, University of California, Berkely.
Kar, A. et al., 2011. Real-Time Assessment of Black Carbon Pollution in Indian Households Due to Traditional and
Improved Biomass Cookstoves. Atmos. Chem. Phys. Discuss., Volume 11, pp. 10845–74.
Katuwal, H. & Bohara, A., 2009. Biogas: A promising renewable technology and its impact on households in Nepal.
Renewable and Sustainable Energy Reviews, Volume 13, pp. 2668–74.
Kay, E., 2012. Role of Culture and Relion in cookstove adoption [Interview] (10 May 2012).
Kees, D. M., 2012. Providing Access to Modern Cooking Energy, s.l.: s.n.
Kees, M., 2012. EnDev [Interview] (30 May 2012).
Khennas, S. & Lawali, E., 2008. Women and the supply side of energy in Sahelian countries. Energia News, 11(1).
Khonje, T., 2010. Impact Assessment of Portable Clay Stoves (Malawi), s.l.: ProBEC.
Kindt, R. et al., 2008. Species accumulation within land use and tree diameter categories in Burkina Faso, Mali,
Niger and Senegal. Biodiversity and Conservation, Volume 17, pp. 1883–1905.
Kiros, B. G., 2011. Environmental resources collection versus children’s schooling: evidence from Tigray, Northern
Ethiopia, s.l.: Addis Ababa University.
154T h e S t a t e o f t h e G l o b a l C l e a n a n d I m p r o v e d C o o k i n g S e c t o r
Kissinger, G., Herold, M. & De Sy, V., 2012. Drivers of Deforestation and Forest Degradation: A Synthesis Report for
REDD+ Policymakers, s.l.: DFID.
KITE Innovative Energy Solutions, 2005. AREED Approach to Impact Assessment. s.l., s.n.
Kituyi, E., 2001. Towards Sustainable Charcoal Production and Use: a Systems Approach, Nairobi, Kenya: African
Centre for Technology Studies.
Knowledge@Wharton, 2013. Can India’s Direct Cash Transfer Plan Work?. Knowledge@Wharton, 23 January.
Köhlin, G., Sills, E., Pattanayak, S. K. & Wilfong, C., 2011. Energy, Gender and Development: What are the
Linkages? Where is the Evidence?, s.l.: World Bank.
Kojima, M., 2009. Changes in End-User Petroleum Product Prices, Washington DC: The World Bank.
Kojima, M., Matthews, W. & Sexsmith, F., 2010. Petroleum Markets in Sub-Saharan Africa: An Analysis and
Assessment of 12 Countries, Washington DC: World Bank.
Koplow, D., 2012. Phasing Out Fossil-Fuel Subsidies in the G20, s.l.: Earth Track and Oil Change International.
Kouami, K., Yaovi, N. & Honan, A., 2009. Impact of charcoal production on woody plant species in West Africa: A
case study in Togo. Scientific Research and Essay, 4(9), pp. 881–93.
Kurmi, O. P. et al., 2012. Lung cancer risk of solid fuel smoke exposure: a systematic review and meta-analysis.
European Respiratory Journal.
Kurmi, O., Semple, S., Simkhada, P. & Smith, W., 2010. COPD and chronic bronchitis risk of indoor air pollution from
solid fuel: a systematic review and meta-analysis. Thorax, Volume 65, pp. 221–8.
Kutsch, W. L. et al., 2011. The charcoal trap: Miombo forests and the energy needs of people. Carbon Balance and
Management, pp. doi:10.1186/1750-0680-6-5.
Lam, N. L., Smith, K. R., Gauthier, A. & Bates, M. N., 2012. Kerosene: A Review of Household Uses and their
Hazards in Low and Middle Income Countries. Journal of Toxicology and Environmental Health.
Leach, G. & Mearns, R., 1989. Beyond the woodfuel crisis: People, land and trees in Africa. s.l.:Earthscan
Publications.
Lee, C., Chandler, C., Lazarus, M. & Johnson, F. X., 2013. Assessing the Climate Impacts of Cookstove Projects:
Issues in Emissions Accounting, s.l.: Stockholm Environment Institute.
Lengeler, C. & Hanson, K., 2008. The coverage and equity effects of vouchers: The Tanzania National Voucher
Scheme. [Online]
Available at: http://www.swisstph.ch/fileadmin/user_upload/Pdfs/STI_Symposium_08_Lengeler_Hanson.pdf
[Accessed 28 June 2012].
Levine, D. I. & Beltramo, T., 2012. The Effect of Solar Ovens on Fuel Use, Emissions, and Health: Results from a
Randomized Controlled Trial, Berkeley, CA, USA: UC Berkeley.
Lim, S. S., Flaxman, A. D. & Andrews, K. G., 2012. A comparative risk assessment of burden of disease and injury
attributable to 67 risk factors and risk factor clusters in 21 regions, 1990–2010: a systematic analysis. Lancet,
380(December), pp. 2224–60.
Liquefied Petroleum Gas Safety Association Of Southern Africa, June 2012. Petroleum Sources: Breakdown of
petrol, diesel and paraffin prices as on June 6, 2012. [Online]
Available at: http://www.energy.gov.za/files/esources/petroleum/June2012/Breakdown_of_Prices.pdf
[Accessed 12 June 2012].
Lurimuah, S., 2011. The economic and environmental effects of commercial charcoal production in the Upper West
region of Ghana. Kumasi: Kwame Nkrumah University of Science and Technology.
MacCarty, N. et al., 2008. A Laboratory Comparison of the Global Warming Impact of Five Major Types of Biomass
Cooking Stoves. Energy for Sustainable Development, 12(2), pp. 5–14.
155B i b l i o g r a p h y
MacQueen, D. & Korhaliller, S., 2011. Bundles of energy: The case for renewable biomass energy, London: Natural
Resource Issues No. 24. IIED.
MGI [McKinsey Global Institute], November 2014, “Overcoming Obesity: An Initial Economic Analysis” (online)
Madubansi, M. & Shackleton, C. M., 2007. Changes in fuelwood use and selection following electrification in the
Bushbuckridge lowveld, South Africa. Journal of Environmental Management, Volume 83, pp. 416–26.
Malinski, B., 2006. Impact Monitoring Study: The Rocket Lorena Stove Dissemination in Bushenyi District, s.l.: GiZ.
Malla, M. B., Bruce, N., Elizabeth Bates, E. & Rehfuess, E., 2011. Applying global cost-benefit analysis methods to
indoor air pollution mitigation interventions in Nepal, Kenya and Sudan: Insights and challenges. Energy Policy,
39(12), pp. 7518–29.
Mallari, D. T., 2012. Quezon bans charcoal production using wood products. Inquirer Southern Luzon, 6 October.
Malomba, P., 2012. ISAK [Interview] (23 May 2012).
Mantecca, P. et al., 2010. Comparative acute lung inflammation induced by atmospheric PM. Toxicology Letters,
198(2), pp. 244–254.
Manu, N., 2012. CleanCook, Ghana [Interview] (14 May 2012).
Masera, O., Diaz, R. & Berrueta, V., 2006. From cookstoves to cooking systems: the integrated program on
household energy use in Mexico. Energy for Sustainable Development, 9(1), pp. 25–36.
Masera, O. et al., 2007. Impact of Patsari improved cookstoves on indoor air quality in Michoacan, Mexico. Energy
for Sustainable Development, Volume 11, pp. 45–56.
Masera, O. R., Saatkamp, B. D., Kammen D. M. 2000. From Linear Fuel Switching to Multiple Cooking Strategies: A
Critique and Alternative to the Energy Ladder Model. World Development 28(12): 2083–2103.
Matinga, M., 2010. We Grow up with It: An Ethnographic Study of the Experiences, Perceptions and Responses to
the Health Impacts of Energy Acquisition and Use in Rural South Africa, s.l.: University of Twente, Enschede, The
Netherlands.
Megen Power Ltd., 2008. Impact Assessment of Mirt Improved Biomass Injera Stoes Commercialization in Tigray,
Amhara, and Oromyia Natinoal Regional States., s.l.: GTZ/SUN Energy Programme.
Mercer, Bernard., Jonathan Finighan, Thomas Sembres and Joshua Schaefer, 2011. Protecting and restoring forest
carbon in tropical Africa/, 2011. Forests Philanthropy Action Network, United Kingdom.
Mendoza, R., 2011. Why do the poor pay more? Exploring the poverty penalty concept. Journal of Inernational
Development, 23(1), pp. 1–28.
Miller, B. & Mubaraq, M., 2011. Intra-household externalities and low demand for a new technology: experimental
evidence on improved cookstoves., s.l.: s.n.
Mishra, V., 2004. What do we know about health effects of smoke from solid fuel combustion?, s.l.: East-West Center.
Mishra, V., Dai, X., Smith, K. & Mika, L., 2004. Maternal exposure to biomass smoke and reduced birth weight in
Zimbabwe. Annals of Epidemiology, 14(10), pp. 740–7.
Mishra, V. & Retherford, R., 2007. Does biofuel smoke contribute to anaemia and stunting in early childhood?.
International Journal of Epidemiology, 36(1), pp. 117–29.
Misra, P., Srivastava, R. & Krishnan, A., 2012. Indoor Air Pollution-related Acute Lower Respiratory Infections and
Low Birthweight: A Systematic Review. J Trop Pediatr., Volume May 2.
Mobarak, M. & Grant, M., 2011. Household Externalities And Low Demand For A New Technology: Experimental
Evidence on Improved Cookstoves, s.l.: Poverty Action Lab.
Mobarak, P. M., 2012. Yale University [Interview] (1 June 2012).
156T h e S t a t e o f t h e G l o b a l C l e a n a n d I m p r o v e d C o o k i n g S e c t o r
Morris, M., Pitt, L. & Berthon, P., 1996. Entrepreneurial activity in the Third World informal sector: The view from
Khayelitsha. International Journal of Entrepreneurial Behaviour & Research, 2(1), pp. 59–76.
Morton, J., 2007. Fuelwood consumption and woody biomass accumulation in Mali, West Africa. Ethnobotany
Research and Applications, Volume 5, pp. 37–44.
Muchiri, L., 2008. Gender and Equity in Bioenergy Access and Delivery in Kenya, s.l.: s.n.
Mugo, R. & Ong, C., 2006. Lessons from eastern Africa’s unsustainable charcoal trade, Nairobi: World Agroforestry
Centre.
Mulligan, J.-A., Yukich, J. & Hanson, K., 2008. Vouchers for scaling up insecticide-treated nets in Tanzania:
methods for monitoring and evaluation of a national health system intervention. Malaria Journal, p. 32.
Muneer, S. & Mohamed, E., 2003. Adoption of biomass improved cookstoves in a patriarchal society: an example
from Sudan. The Science of The Total Environment, Volume 307, pp. 259–66.
Munthali, K., 2012. Multi-agent simulation of farm-based decision making: a deforestation case of Dzalanyama
Forest Reserve, Malawi. Makuhari, Chiba, Japan, Japan Geoscience Union.
Muthiah, R., 2011. Arresting a Silent Killer. Powering Climate Solutions (UNEP), December.
Mwampamba, T. H., 2007. Has the woodfuel crisis returned? Urban charcoal consumption in Tanzania and its
implications to present and future forest availability. Energy Policy, Volume 35, pp. 4221–34.
Naeher, L. et al., 2007. Woodsmoke health effects: a review. Inhalation Toxicology, 19(1), pp. 67–106.
Nankhuni, F. & Findeis, J., 2004. Natural resource-collection work and children’s schooling in Malawi. Agricultural
Economics, 31(2–3), pp. 123–34.
Nature Conservancy, 2009. The Hidden Frontier of Forest Degradation A Review of the Science, Policy and Practice
of Reducing Degradation Emissions, s.l.: s.n.
Ndaghu, A. A., Taru, V. B. & Tizhe, I., 2011. Analysis of Socio-economic Characteristics of Fuel Wood Marketers in
Yola Metropolis, Adamawa State, Nigeria. Human Ecology, 36(2), pp. 153–157.
Ndegwa, G. M., 2010. Woodfuel Value Chains in Kenya and Rwanda; Economic Analysis of the Market Oriented
Woodfuel Sector, Germany: Master Thesis, Cologne University of Applied Sciences.
Ndiritu, S. & Nyangena, W., 2010. Environmental Goods Collection and Children’s Schooling: Evidence from Kenya,
s.l.: s.n.
Nelleman, C., I. Redmond, and J. Refisch, 2010. The last stand of the gorilla – Environmental crime and conflict in
the Congo Basin. A rapid response assessment, Nairobi, Kenya: United Nations Environment Program.
Newcombe, K., 1989. An economic justification for rural afforestation: the case of Ethiopia.. In: G. Schramm & J.
Warford, eds. Environmental Management and Economic Development. Baltimore: Johns Hopkins University
Press/World Bank, pp. 117–138.
Njenga, B. K., n.d. Upesi Rural Stoves Project, s.l.: s.n.
NL Agency, 2010. Making Charcoal Production in Sub-Saharan Africa Sustainable, s.l.: NL Agency, Ministry of
Economic Affairs, Agriculture and Innovation The Netherlands.
Nyoni, S., 1993. Women and Energy: Lessons from the Zimbabwe Experience, Harare: Zimbabwe Environment
Research Organisation (ZERO).
Obueh, J., 2008. Results of Project Gaia’s CleanCook Methanol Stove Pilot Study in Delta State, Nigeria, Lagos,
Nigeria: Project Gaia.
Obueh, J., 2012. Director, Project Gaia Nigeria (Household Energy Specialist) [Interview] (24 May 2012).
Odoi-Agyarko, A. O., 2009. Household energy: Coping Strategies and Health Effects in the Bongo District of Ghana.
Kumasi: Kwame Nkrumah University of Science and Technology.

157B i b l i o g r a p h y
Ogunkunle, A. T. J. & Oladele, F. A., 2004. Ethnobotanical study of fuelwood and timberwood consumption and
replenishment in Ogbomoso, Oyo State, Nigeria. Environmental Monitoring and Assessment, Volume 93, pp.
223–236.
Oguntunde, P. G., J., A. B., E., A. A. & van de Giesen, N., 2008. Effects of charcoal production on soil physical
properties in Ghana. Journal of Plant Nutrition and Soil Science, Volume 171, pp. 591–596.
Oksanen, T., Pajari, B. & Tuomasjukka, T., 2003. Forests in Poverty Reduction Strategies: Capturing the Potential,
s.l.: European Forestry Institute Proceedings.
Olivier, J. G. J., Jannsens-Maenhout, G. & Peters, J. A. H. W., 2012. Long-term trend in global CO2 emissions, s.l.:
PBL Netherlands.
Ouedraogo, B., 2012. Population et environnement: Cas de la pression anthropique sur la forêt périurbaine de
Gonsé au Burkina Faso., s.l.: GREThA.
Owsianowski, J. V. & Barry, P., n.d. Improved Cooking Stoves for Developing Countries, s.l.: s.n.
Oxfam America, 2011. What’s in a stove?. [Online]
Available at: http://www.oxfamamerica.org/articles/what2019s-in-a-stove/?searchterm=cook%20stoves
[Accessed 15 June 2012].
Patrick, E., 2006. Sexual violence and firewood collection in Darfur. Forced Migration Review, Volume 27.
Patrick, E., 2011. “We Have No Choice” – Safe Access to Firewood and Alternative Energy in Eastern Democratic
Republic of Congo, NY: Women Refugee Commission.
Patrick, E., 2012. WRC [Interview] (14 May 2012).
PCIA [Partnership for Clean Indoor Air], 2011. Test results for cookstove performance. s.l., s.n.
PCIA, n.d. Stove Performance Measures. [Online]
Available at: http://www.pciaonline.org/files/10-Performance-Measures-web.pdf
[Accessed 10 July 2012].
Penn State Biomass Energy Center and Department of Agricultural and Biomass Energy Center and Department of
Agricultural and Biological Engineering, 2009. Manufacturing Fuel Pellets from Biomass. [Online]
Available at: http://pubs.cas.psu.edu/FreePubs/pdfs/uc203.pdf
[Accessed 10 June 2012].
Perera, F. P., Tang, D. & Wang, S., 2012. Prenatal Polycyclic Aromatic Hydrocarbon (PAH) Exposure and Child
Behavior at Age 6–7 Years. Environ Health Perspect., 120(6), pp. 921–926.
Peter, C. & Sander, K., 2009. Transforming the charcoal sector in Tanzania. s.l.:World Bank.
Pimentel, D., 2006. Soil Erosion, a Food and Environmental Threat. Environment, Development, and Sustainability,
Volume 8, pp. 119–37.
PISCES, 2009. Value Chain Analysis for Biogas in Northern Tanzania, s.l.: PISCES.
Pokhrel, A., Smith, K., Khalakdina, A. & Deuja, A., 2005. Case–control study of indoor cooking smoke exposure and
cataract in Nepal and India. International Journal of Epidemiology, Volume 34, pp. 702–708.
Polsky, D. & Ly, C., 2012. The Health Consequences of Indoor Air Pollution: A Review of the Solutions and
Challenges, s.l.: University of Pennsylvania.
Portugal-Perez, A. & Wilson, J., 2008. Trade Costs in Africa: Barriers and Opportunity for Reform, s.l.: World Bank.
Practical Action, 2011. Ethanol as a Household Fuel in Madagascar:Health Benefits, Economic Assessment and
Review of African Lessons for Scaling up, s.l.: Project Gaia.
Prathoumvanh, B., 2000. Gender and Wood Energy in Lao PDR. ENERGIA News, 3(1), pp. 12–13.
Praveen, P. S. et al., 2012. Link between local scale BC emissions in the Indo-Gangetic Plains and large scale
atmospheric solar absorption. Atmospheric Chemistry and Physics, Volume 12, p. 1173–87.
158T h e S t a t e o f t h e G l o b a l C l e a n a n d I m p r o v e d C o o k i n g S e c t o r
ProBEC-Malawi_Impact, n.d. ProBEC Malawi. [Online]
Available at: http://www.probec.org/displaysection.php?czacc=&zSelectedSectionID=sec1260356001
ProBEC-Malawi_Program, n.d. ProBEC Malawi. [Online]
Available at: http://www.probec.org/displaysection.php?czacc=&zSelectedSectionID=sec1192918473
Program, A. R. E. A., 2011. Wood-Based Biomass Energy Development for Sub-Saharan Africa: Issues and
Approaches, Washington D.C.: World Bank.
Pursnani, P., 2012. Shell Foundation [Interview] (25 May 2012).
Ramanathan, V. & Carmichael, G., 2008. Global and regional climate changes due to black carbon. Nature
Geoscience, Volume 1, pp. 221–7.
Ramani, K. & Heijndermans, E., 2003. Energy, Poverty and gender – A Synthesis, Washington DC: World Bank
Group.
Ravindranath, R. H. & Hall, D., 1995. Biomass Energy and Environment: A developing country perspective from
India. New York: Oxford Publications.
Ravindran, T., Savitri, R. & Bhavani, A., 2000. Women’s experiences of utero-vaginal prolapse: a qualitative study
from Tamil Nadu, India. In: M. Berer & T. Ravindran, eds. Safe Motherhood Initiatives: Critical Issues. London:
Reproductive Health Matters.
Reid, B., Ghazarian, A. & DeMarini, D., 2012. Research Opportunities for Cancer Associated with Indoor Air
Pollution from Solid Fuel Combustion. Environ Health Perspect., 120(11), pp. 1495–98.
Remedio, E., 2012. Climate Change and the Woodfuel Nexus among Developing Countries, s.l.: UNU-WIDER.
REN21 [Renewable Energy Policy Network for the 21st Century], 2005. Energy for Development: The potential role
of renewable energy in meeting the Millennium Development Goals, Washington D.C.: Worldwatch Institute.
Research and Markets: Frost and Sullivan, 2011. Sub-Saharan Africa Electricity Pricing Analysis 2009. [Online]
Available at: http://www.researchandmarkets.com/research/7565cf/subsaharan_africa
[Accessed 28 June 2012].
Ruiz-Mercado, I., Masera, O., Zamora, H. & b, S. K., 2011. Adoption and sustained use of improved cookstoves.
Energy policy, Volume 39, pp. 7557–66.
San, V., Spoann, V., Ly, D. & Chheng, N., 2012. Fuelwood consumption patterns in Chumriey Mountain, Kampong
Chhnang Province, Cambodia. Energy.
Sass, J., 2003. Women, Men and Environmental Change: The Gender Dimensions., Washington DC, USA:
Population Reference Bureau.
Schei, M. A., Hessen, J. O., Smith, K. R. & Bruce, N., 2004. Childhood asthma and indoor woodsmoke from cooking
in Guatemala. J. of Exposure Anal. and Environ. Epidemiology, Volume 14, pp. 110–17.
Schlag, N. & Zuzarte, F., 2008. Market Barriers to Clean Cooking Fuels in Sub-Saharan Africa: A Review of
Literature, Stockholm: Stockholm Environment Institute.
Schure, J., 2012. Woodfuel and producers’ livelihoods in the Congo Basin. In: B. Arts, S. van Bommel, M. Ros-
Tonen & G. Verschoor, eds. Forest People Interfaces: Understanding Community Forestry and Biocultural
Diversity. s.l.:s.n., pp. 87–104.
Schutze, E., 2010. Lesson Learned from ProBEC’s Impact Assessment Surveys, s.l.: ProBEC.
Schwebel, David C., Dehran Swart, Siu-Kuen Azor Hui, Jennifer Simpson and Phumla Hobe., 2009. Paraffin-related
injury in low-income South African communities: knowledge, practice and perceived risk. Bulletin of the World
Health Organization, 87:700–706.
159B i b l i o g r a p h y
Shell Foundation India, 2008–2009. Room To Breathe. [Online]
Available at: http://roomtobreathecampaigns.org/default.aspx
[Accessed 15 June 2012].
Shenoy, D. B. V., 2010. Lessons Learned from Attempts to Reform India’s Kerosene Subsidy, Geneva: Global
Subsidies Initiative.
Shively, G. et al., 2010. Profits and Margins along Uganda’s Charcoal Value Chain. International Forestry Review,
12(3), pp. 270–83.
Siddiqui, A., Lee, K. & Gold, E., 2005. Eye and respiratory symptoms among women exposed to wood smoke
emitted from indoor cooking: a study from southern Pakistan. Energy for Sustainable Development, Volume 66,
pp. 958–66.
Sinton, J. E. & Sathaye, J. A., n.d. Organizations and Actors in Interventions to Improve Household Fuel Use in
Developing Countries, s.l.: s.n.
Smith, K., 2012. Impact Specialist; Professor at University of California, Berleley [Interview] (22 May 2012).
Smith, K., Bruce, N. & Mehta, S., 2010. Presentation for the Global Burden of Disease Project, Risk Factor Review
Meeting, Institute for Health Metrics and Evaluation. Seattle, University of Washington.
Smith, K. et al., 2007. Monitoring and evaluation of improved biomass cookstove programs for indoor air quality and
stove performance: conclusions from household energy and health project. Energy for Sustainable Development,
Volume 2, pp. 5–18.
Smith, K. et al., 2010. Personal Child and Mother Carbon Monoxide Exposures and Kitchen Levels: Methods
and Results from a Randomized Trial of Woodfired Chimney Cookstoves in Guatemala (RESPIRE). Journal of
Exposure Science and Environmental Epidemiology, Volume 20, pp. 406–16.
Smith, K. et al., 2011. Effect of reduction in household air pollution on childhood pneumonia in Guatemala
(RESPIRE): a randomized control trial. Lancet, Volume 378, pp. 1717–26.
Smith, K., Mehta, S. & Maeusezahl-Feuz, M., 2004. The Global Burden of Disease from Household Use of Solid
Fuels: A Source of Indoor Air Pollution. In: Comparative Quantification of Health Risks: The Global Burden of
Disease due to Selected Risk Factors. Geneva: World Health Organization.
Smith-Sivertsen, T. et al., 2009. Effect of Reducing Indoor Air Pollution on Women’s Respiratory Symptoms and Lung
Function: RESPIRE Guatemala Randomized Trial. American Journal of Epidemiology, 170(2), pp. 211–220.
Sosler, A., 2012. Potential Energy [Interview] (8 June 2012).
Sreeramareddy, C. T., Shidhaye, R. R. & Sathiakumar, N., 2011. Association between biomass fuel use and maternal
report of child size at birth – an analysis of 2005–06 India Demographic Health Survey data. BMC Public Health,
Volume 11, p. 403.
Synesis, 2011. Biogas User Survey 2011: Lao PDR, s.l.: SNV.
Szulczewski, M., 2006. Lasting Impacts of Solar Cooker Projects, s.l.: Solar Household Energy, Inc.
Takase, K., 1997. The crisis of rural energy in developing countries.Environment; Published in ‘Energy and
economy: strategies for sustainability’, Tokyo: United Nations University Press.
Tatedo, 2004. Promotion of efficient methods for production and utilization of woodfuels at Ikwiriri Township and
Mbunju-Mvuleni Village in Rufiji District, Coast Region in Tanzania, s.l.: Tatedo.
Teravaninthorn, S. & Raballand, G., 2008. Transport Prices and Costs in Africa: A Review of the Main International
Corridors, Washington D.C.: World Bank.
Ternes, T., Bolton, S. & Donnelly, A., 2008. Estufa Finca – Santos Pilot Project Results Report, s.l.: SeaChar.org.
160T h e S t a t e o f t h e G l o b a l C l e a n a n d I m p r o v e d C o o k i n g S e c t o r
Troncoso, C., Castillo, A., Masera, O. & Merino, L., 2007. Improved Cookstoves in Michoacan, Mexico: A Search for
an integrated Perspective that Promotes Local Culture, Health, and Sustainability (MS Thesis), s.l.: University of
California.
UN Data, 2008. Statistics: Crude Petroleum. [Online]
Available at: http://data.un.org/Data.aspx?q=crude+petroleum&d=EDATA&f=cmID%3aCR
[Accessed 12 June 2012].
UNDP and WHO, 2009. The Energy Access Situation in Developing Countries:, New York: UNDP and WHO (World
Health Organization).
UNDP, 2012. Integrating energy access and employment creation to accelerate progress on the MDGs in Sub-
Saharan Africa, s.l.: s.n.
Union of Concerned Scientists, 2011. What’s Driving Deforestation Today, s.l.: s.n.
University of California: Centre for Effective Global Action, 2008. Improved Cook Stoves in the Tumu Region of
Ghana. [Online]
Available at: http://cega.berkeley.edu/projects/improved-cook-stoves-tumu/
[Accessed 18 June 2012].
UNMIL [United Nations Mission in Liberia], 2008. Research on prevalence and attitudes to rape in Liberia, s.l.: UN.
Urmee, T., & Gyamfi, S., 2014. A Review of Improved Cookstove Technologies and Programs. Renewable and
Sustainable Energy Reviews. Vaughan, J., 2011. Rape another risk for Somali drought refugees. AFP, 16 August.
Venkataraman, A. S. & Fried, B. J., 2011. Effect of Worldwide Oil Price Fluctuations on Biomass Fuel Use and Child
Respiratory Health: Evidence from Guatemala. American Journal of Public Health, 101(9), pp. 1668–1675.
Venkataraman, C., Sagar, A., Habib, G., Lam, N., Smith, K.R., 2010. The Indian National Initiative for Advanced
Biomass Cookstoves: The benefits of Clean Combustion. Energy for Sustainable Development (14): 63-72.
Village Reach, 2012. Village Reach: VidaGas. [Online]
Available at: http://villagereach.org/2012/06/07/vidagas-mit/
[Accessed 14 June 2012].
Ward, J. & Marsh, M., 2006. Sexual Violence Against Women and Girls in War and Its Aftermath: Realities,
Responses, and Required Resources, s.l.: UNFPA.
Warwick, H. & Doig, A., 2004. Smoke – the Killer in the Kitchen Indoor Air Pollution in Developing Countries,
London: ITDG.
Weuve, J. et al., 2012. Exposure to Particulate Air Pollution and Cognitive Decline in Older Women. JAMA Internal
Medicine, 172(3), pp. 219–27.
Westinga, E., A. Mukashema, and H. van Gils. 2013. “A comparison of fine resolution census and image-based
national forest inventories: a case study of Rwanda.” Forestry 86(4): 453–61, doi:10.1093/forestry/cpt016.
WFP [World Food Programme], 2009. WFP Stove Initiative To Help Protect Women And Environment. [Online]
Available at: http://www.wfp.org/stories/wfp-launches-safe-stoves-initiative
[Accessed 15 June 2012].
WHO [World Health Organization], 2007. Solid fuel use for cooking, Household energy database. [Online]
Available at: http://www.who.int/indoorair/health_impacts/he_database/en/
[Accessed 29 September 2011].
WHO, Various years (1970–2008). Fuel Use Database. [Online]
Available at: http://www.who.int/indoorair/health_impacts/he_database/en/
[Accessed 15 April 2012].
161B i b l i o g r a p h y
WHO, 2011. Online fact sheet. [Online]
Available at: http://www.who.int/mediacentre/factsheets/fs292/en/index.html
[Accessed 5 April 2012].
WHO, 2014. “7 million premature deaths annually linked to air pollution.” Retrieved from: http://www.who.int/
mediacentre/news/releases/2014/air-pollution/en/.
Wickramsinghe, A., 2003. Gender and health issues in the biomass energy cycle: impediments to sustainable
development. Energy for Sustainable Development, 7(3), pp. 51–61.
Williams, V., 2011. A case study of the desertification of Haiti. Journal of Sustainable Development, 4(3), p. 20.
World Bank / IEG, 2006. Welfare impact of rural electrification: a reassessment of the costs and benefits.,
Washington DC: World Bank Group.
World Bank, 2006. Gender, Time Use, and Poverty in Sub-Saharan Africa, Washington DC: World Bank Group.
World Bank, 2011. Africa Development Indicators 2011, s.l.: World Bank.
World Bank, 2011a. Household Cookstoves, Environment, Health, and Climate Change: A new look at an old
problem, Washington DC: World Bank Group.
World Bank, 2011b. Wood-Based Biomass Energy Development for Sub-Saharan Africa: Issues and Opportunities,
Washington DC: World Bank Group.
World Bank, 2011c. The Role of Liquefied Petroleum Gas in Reducing Energy Poverty, s.l.: The World Bank.
World Bank, 2011d. Household Energy Access for Cooking and Heating: Lessons Learned and the Way Forward,
Washington D.C.: The International Bank for Reconstruction and Development/The World Bank.
World Resources Institute, 2005. World Resources Institute EarthTrends; Searchable Database Results.4. [Online]
Available at: http://earthtrends.wri.org
[Accessed 5 5 2012].
WRC [Women’s Refugee Commission], Cooking Fuel Saves Lives: A Holistic Approach To Cooking In Humanitarian
Settings. [Online]
Available at: http://womensrefugeecommission.org/programs/firewood
[Accessed 15 June 2012].
WRC, 2011. Cooking Fuel and the Humanitarian Response in the Horn of Africa, NY: WRC.
Wyatt, T., 2013. “From the Cardamom Mountains of Southwest Cambodia to the forests of the world: An exploration
of the illegal charcoal trade. International Journal of Comparative and Applied Criminal Justice, 37(1), pp. 15–29.
Yapp, J., 2006. Agricultural Engineering in Support of the Kyoto Protocol, The Clean Development Mechanism for
Biogas Technology, Beijing: APCAEM.
Yiridoe, E. K. & Nanang, D. M., 2001. An econometric analysis of the causes of tropical deforestation: Ghana.
Chicago, IL, American Agricultural Economics Association Conference.
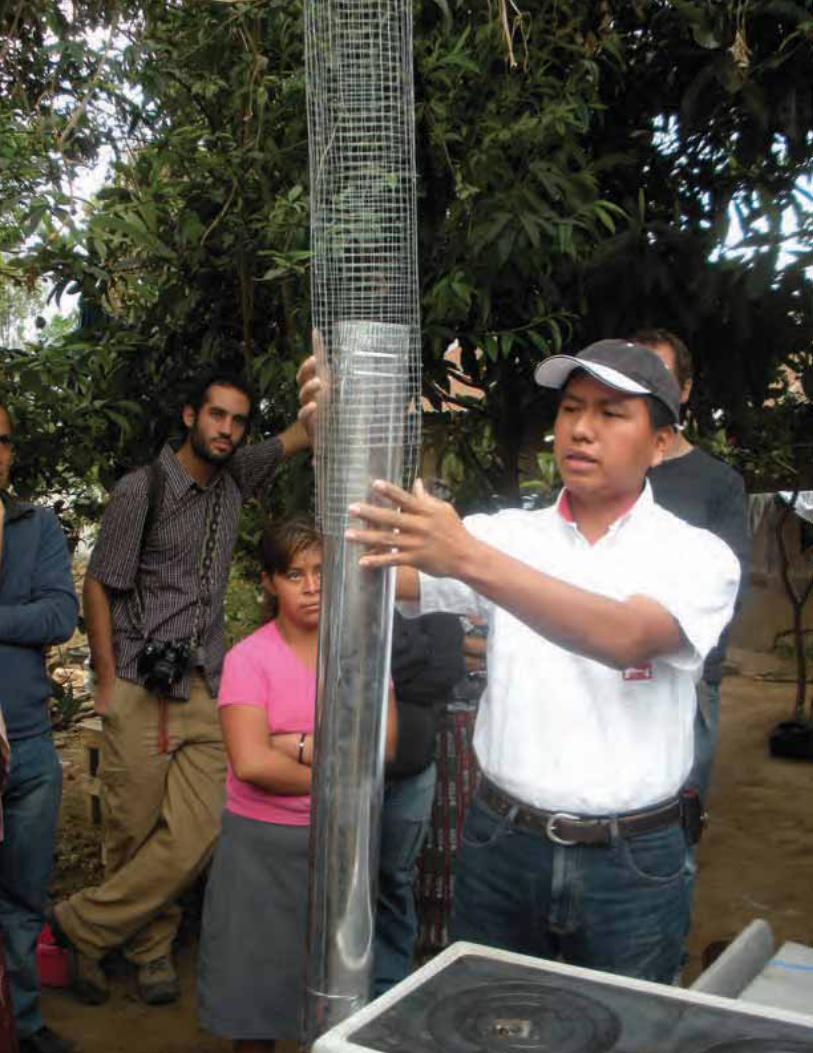
ENERGY SECTOR MANAGEMENT ASSISTANCE PROGRAM
THE WORLD BANK
1818 H STREET, NW
WASHINGTON, DC 20433 USA
EMAIL: [email protected]
WEB: WWW.ESMAP.ORG
PHOTOGRAPHY CREDITS
COVER | © SIMGAS BV VIA GLOBAL ALLIANCE FOR CLEAN
COOKSTOVES
INSIDE FRONT COVER | © GLOBAL ALLIANCE FOR CLEAN
COOKSTOVES
TABLE OF CONTENTS | © MERCY CORPS VIA GLOBAL ALLIANCE FOR
CLEAN COOKSTOVES
ALL REMAINING IMAGES | KATIE KENNEDY FREEMAN / © WORLD
BANK
PRODUCTION CREDITS
PRODUCTION EDITOR | HEATHER AUSTIN
DESIGN | THE WORD EXPRESS, INC.