Embed Size (px)
Citation preview
Xcel Energy Confidential Restricted | 1
Utility Innovation: Residential TOU Rate Design Pilot
March 29, 2018
Xcel Energy Confidential Restricted | 2
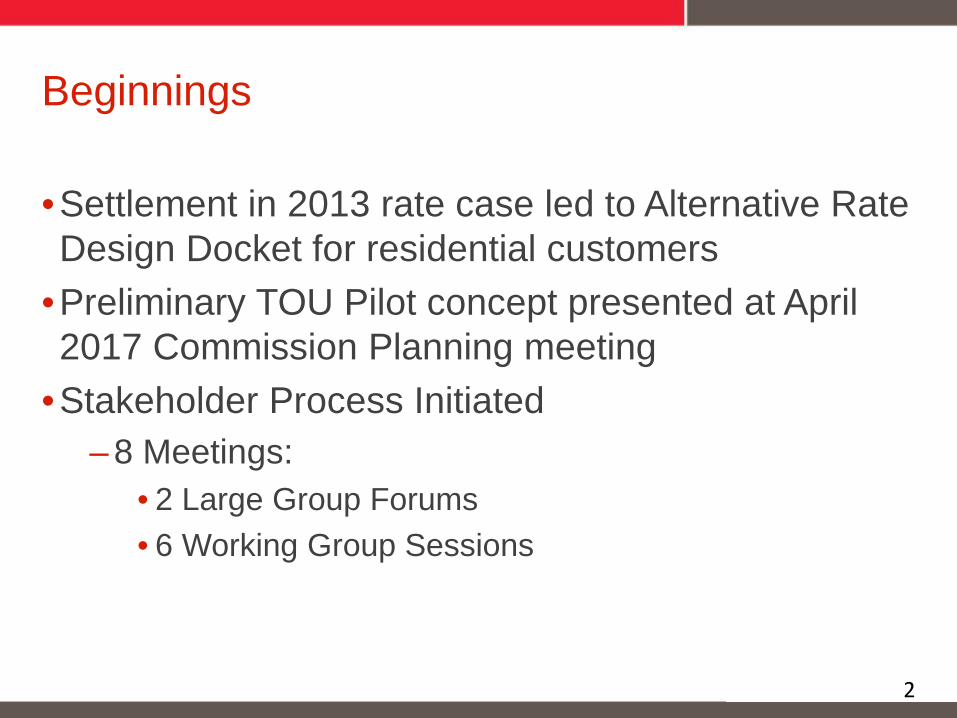
•Settlement in 2013 rate case led to Alternative Rate Design Docket for residential customers
•Preliminary TOU Pilot concept presented at April 2017 Commission Planning meeting
•Stakeholder Process Initiated– 8 Meetings:
• 2 Large Group Forums• 6 Working Group Sessions
Beginnings
2
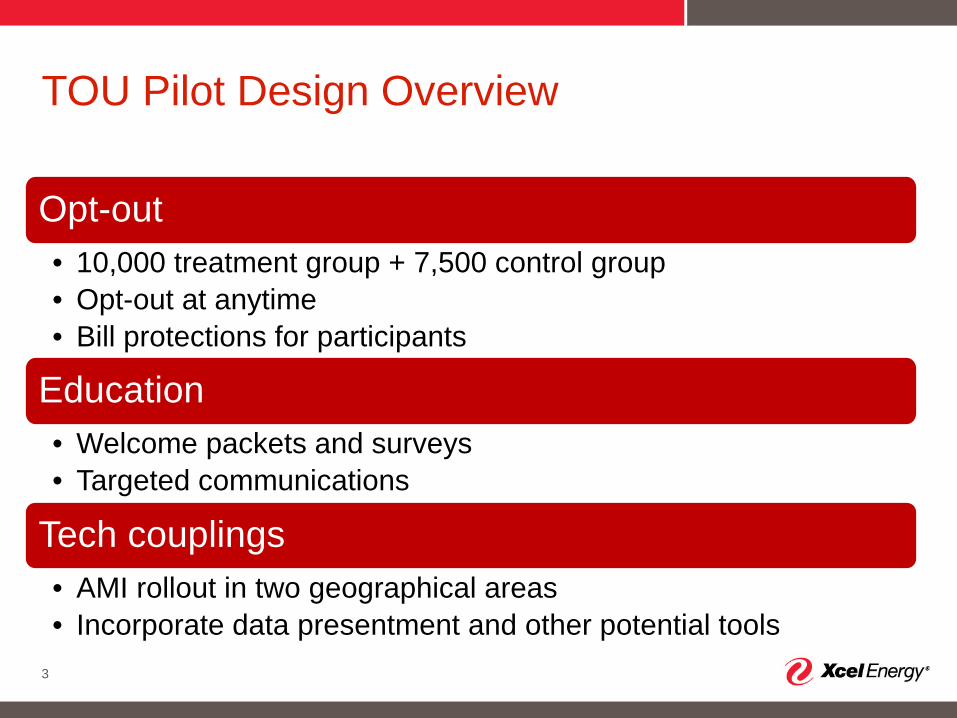
Opt-out• 10,000 treatment group + 7,500 control group• Opt-out at anytime• Bill protections for participants
Education• Welcome packets and surveys• Targeted communications
Tech couplings• AMI rollout in two geographical areas• Incorporate data presentment and other potential tools
TOU Pilot Design Overview
3
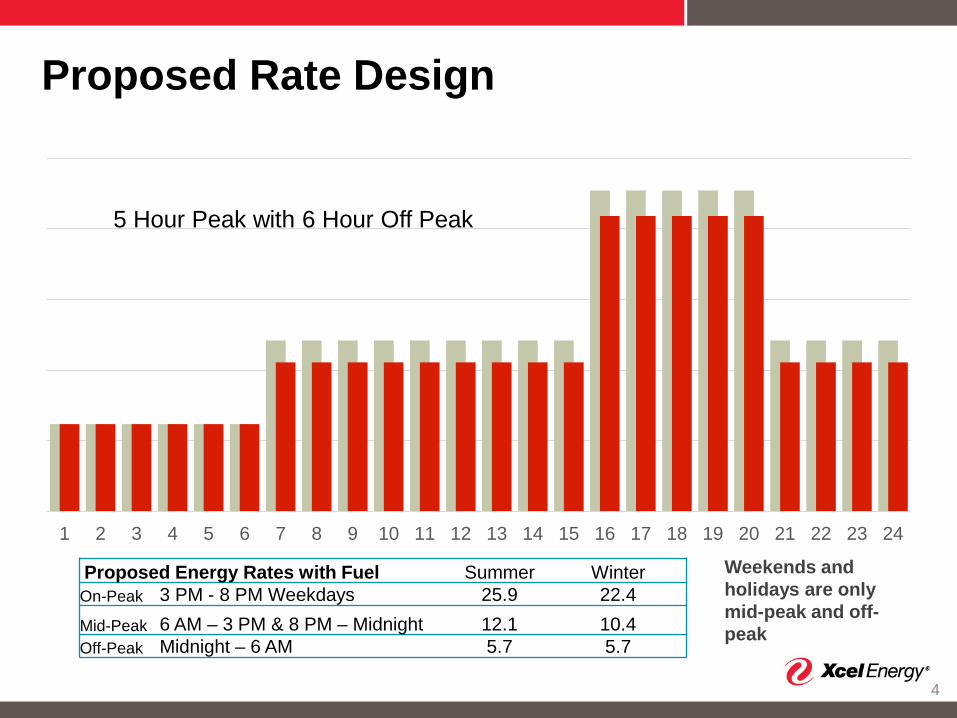
Proposed Rate Design
4
1 2 3 4 5 6 7 8 9 10 11 12 13 14 15 16 17 18 19 20 21 22 23 24
Proposed Energy Rates with Fuel Summer WinterOn-Peak 3 PM - 8 PM Weekdays 25.9 22.4Mid-Peak 6 AM – 3 PM & 8 PM – Midnight 12.1 10.4 Off-Peak Midnight – 6 AM 5.7 5.7
5 Hour Peak with 6 Hour Off Peak
Weekends and holidays are only mid-peak and off-peak
5
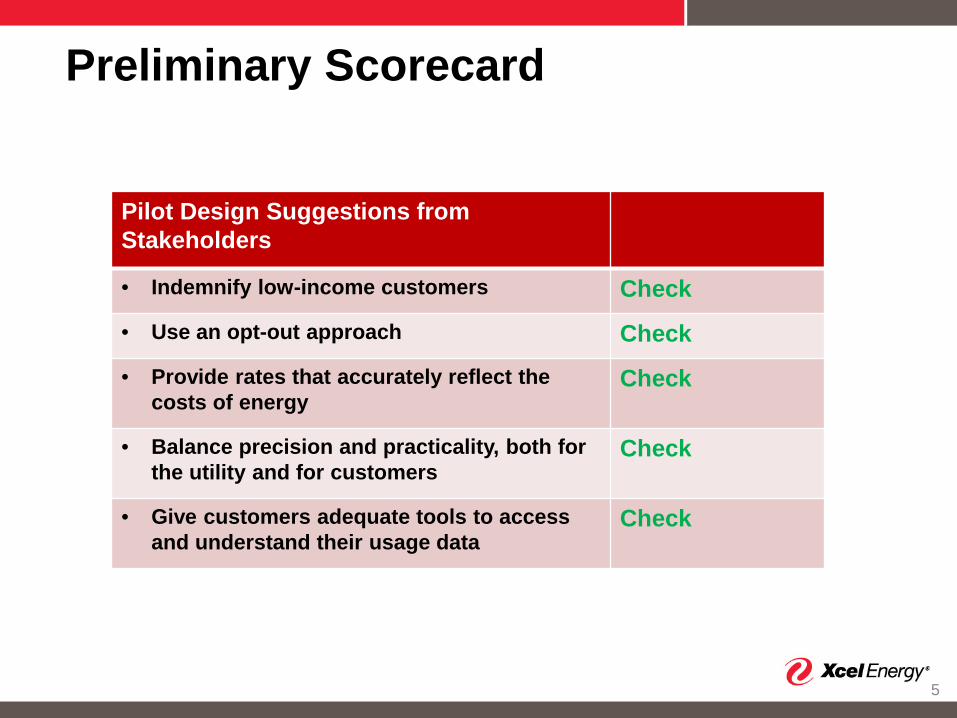
Pilot Design Suggestions from Stakeholders
• Indemnify low-income customers Check
• Use an opt-out approach Check
• Provide rates that accurately reflect the costs of energy
Check
• Balance precision and practicality, both for the utility and for customers
Check
• Give customers adequate tools to access and understand their usage data
Check
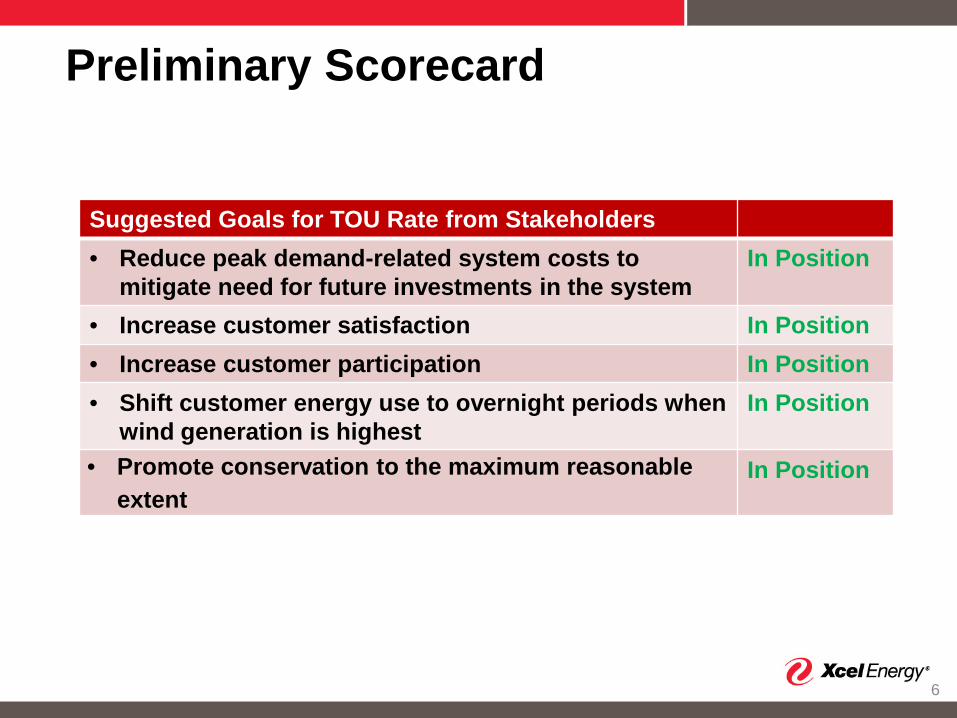
Preliminary Scorecard
6
Suggested Goals for TOU Rate from Stakeholders• Reduce peak demand-related system costs to
mitigate need for future investments in the systemIn Position
• Increase customer satisfaction In Position• Increase customer participation In Position• Shift customer energy use to overnight periods when
wind generation is highestIn Position
• Promote conservation to the maximum reasonable extent
In Position
Preliminary Scorecard
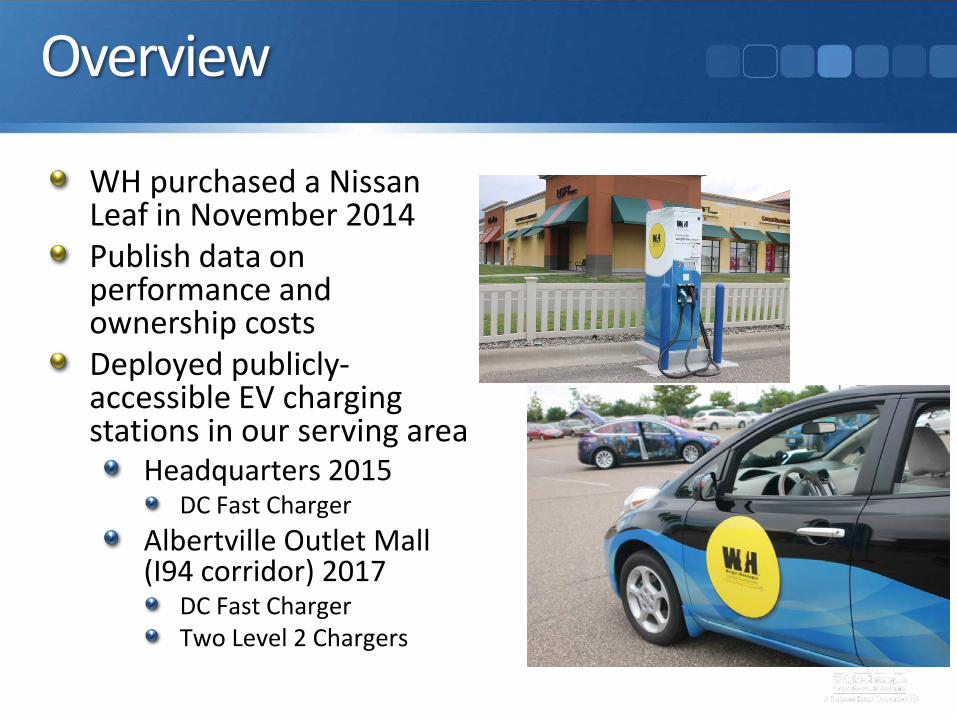
Overview
WH purchased a Nissan Leaf in November 2014Publish data on performance and ownership costsDeployed publicly-accessible EV charging stations in our serving area
Headquarters 2015DC Fast Charger
Albertville Outlet Mall (I94 corridor) 2017
DC Fast ChargerTwo Level 2 Chargers
Why make the investment?Strategic fit for long term energy sales related to EV
Research and development investmentLocated in high visibility and high traffic areas
55 corridor and 94 corridorEV saturation is poised to be upwards of 50% (?) of new car sales by 2030 (?).Over 80% of charging is done at home, 10% at work and 10% other means (public stations)Next step is deeper dive into EV technology related to our infrastructure
Slated for 2018
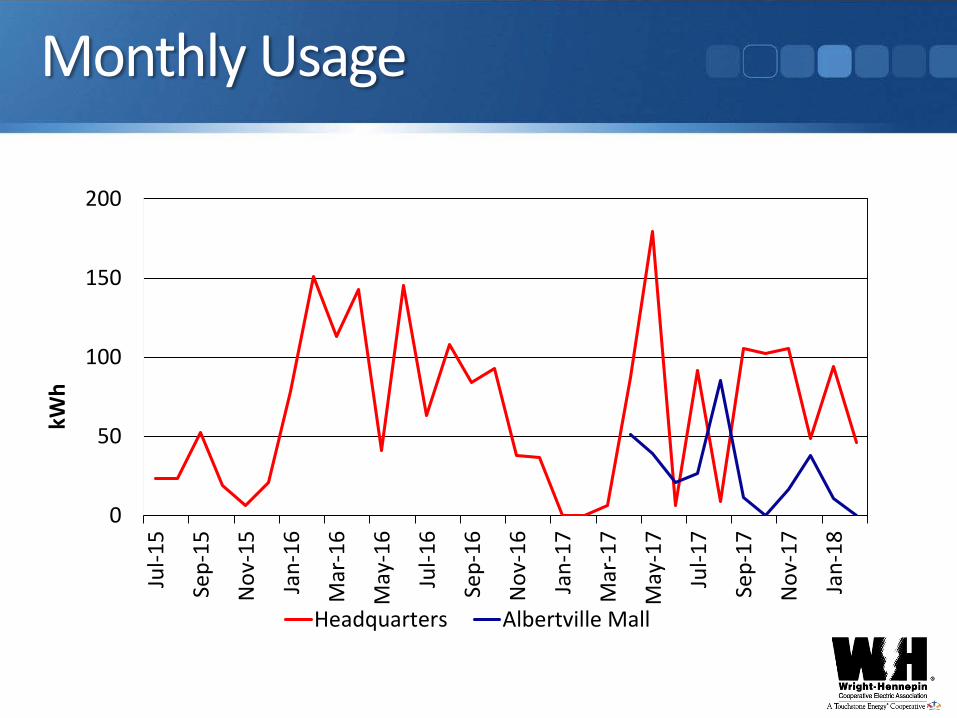
Monthly Usage
0
50
100
150
200
Jul-1
5
Sep-
15
Nov
-15
Jan-
16
Mar
-16
May
-16
Jul-1
6
Sep-
16
Nov
-16
Jan-
17
Mar
-17
May
-17
Jul-1
7
Sep-
17
Nov
-17
Jan-
18
kWh
Headquarters Albertville Mall
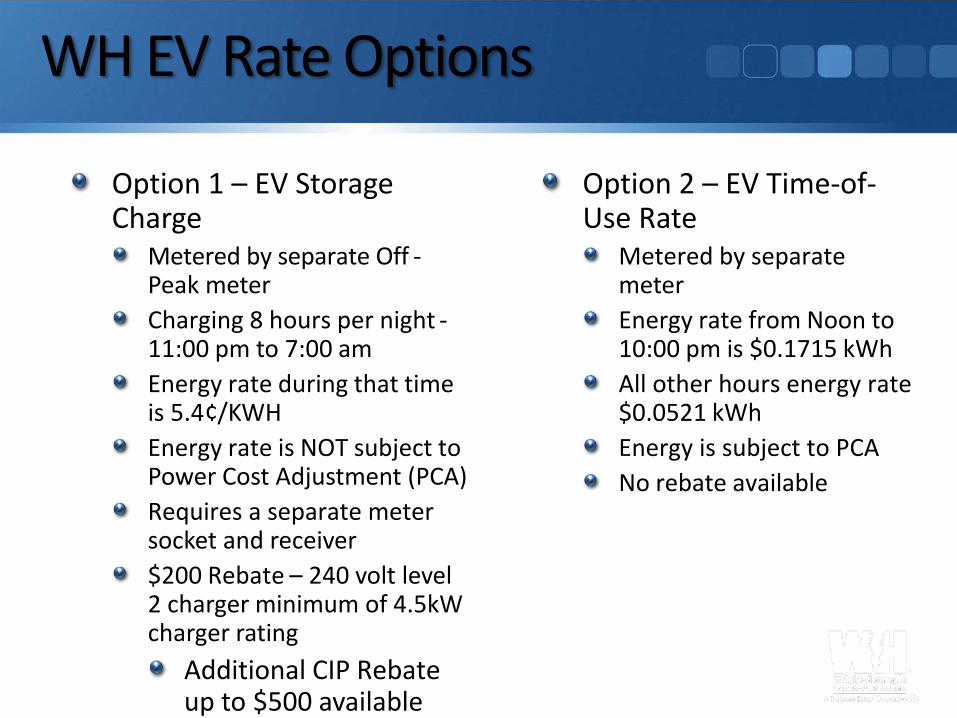
WH EV Rate Options
Option 1 – EV Storage Charge
Metered by separate Off -Peak meterCharging 8 hours per night -11:00 pm to 7:00 amEnergy rate during that time is 5.4¢/KWHEnergy rate is NOT subject to Power Cost Adjustment (PCA)Requires a separate meter socket and receiver$200 Rebate – 240 volt level 2 charger minimum of 4.5kW charger rating
Additional CIP Rebate up to $500 available
Option 2 – EV Time-of-Use Rate
Metered by separate meterEnergy rate from Noon to 10:00 pm is $0.1715 kWhAll other hours energy rate $0.0521 kWhEnergy is subject to PCANo rebate available
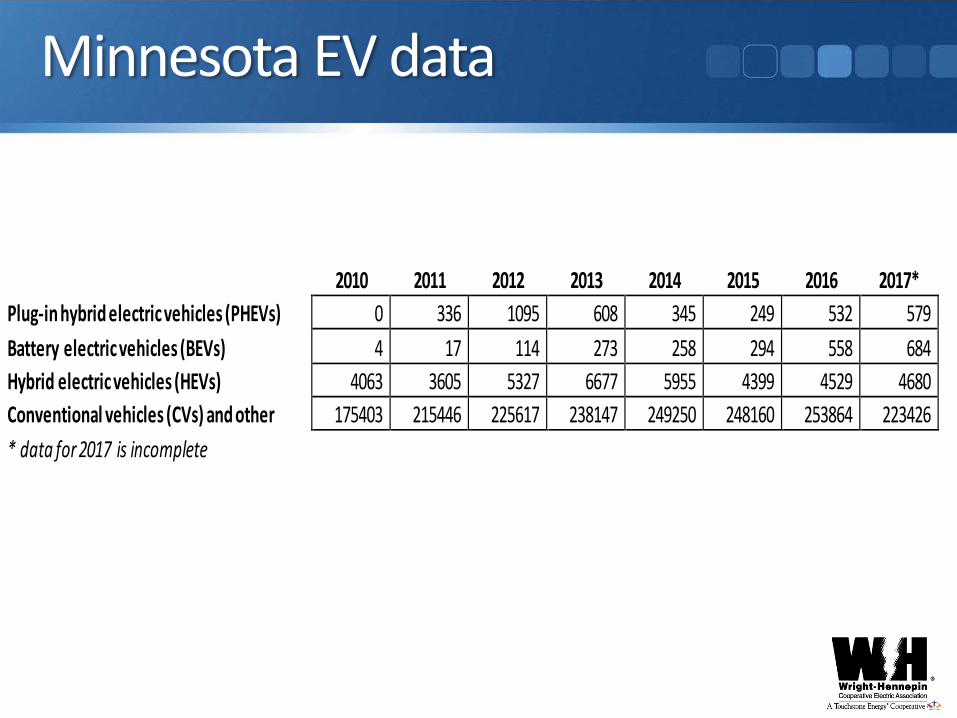
Minnesota EV data
2010 2011 2012 2013 2014 2015 2016 2017*
Plug-in hybrid electric vehicles (PHEVs) 0 336 1095 608 345 249 532 579 Battery electric vehicles (BEVs) 4 17 114 273 258 294 558 684 Hybrid electric vehicles (HEVs) 4063 3605 5327 6677 5955 4399 4529 4680 Conventional vehicles (CVs) and other 175403 215446 225617 238147 249250 248160 253864 223426 * data for 2017 is incomplete
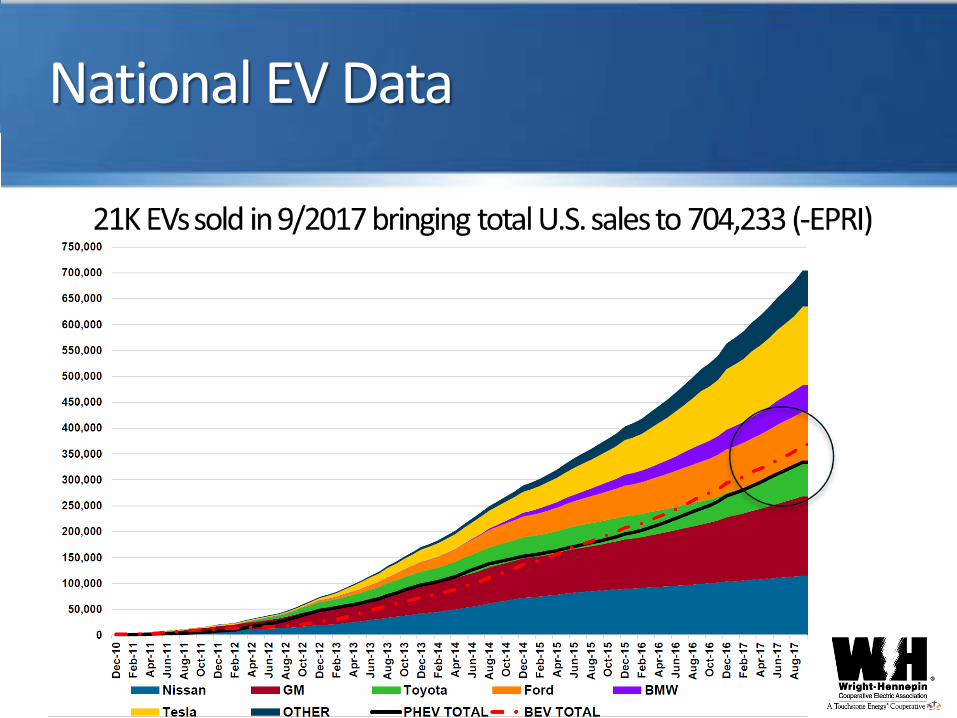
National EV Data
Next StepsEV Study
View WH service territory as ripe for future EV salesNot an engineering study but an anticipated pace-of-investment studyNeed to better understand adoption ratesWhat is the demographic profile of an EV buyer?Develop a glidepath with milestones
1-3 years, 3-7 years, 7-10 yearsFinancial investments
Prepare communications planObjective: accommodate our member needs with just-in-time investments and support!
Lake Region Electric Cooperative
WIN-WIN STRATEGIES
DAN HUSTED, VP BUSINESS DEVELOPMENT
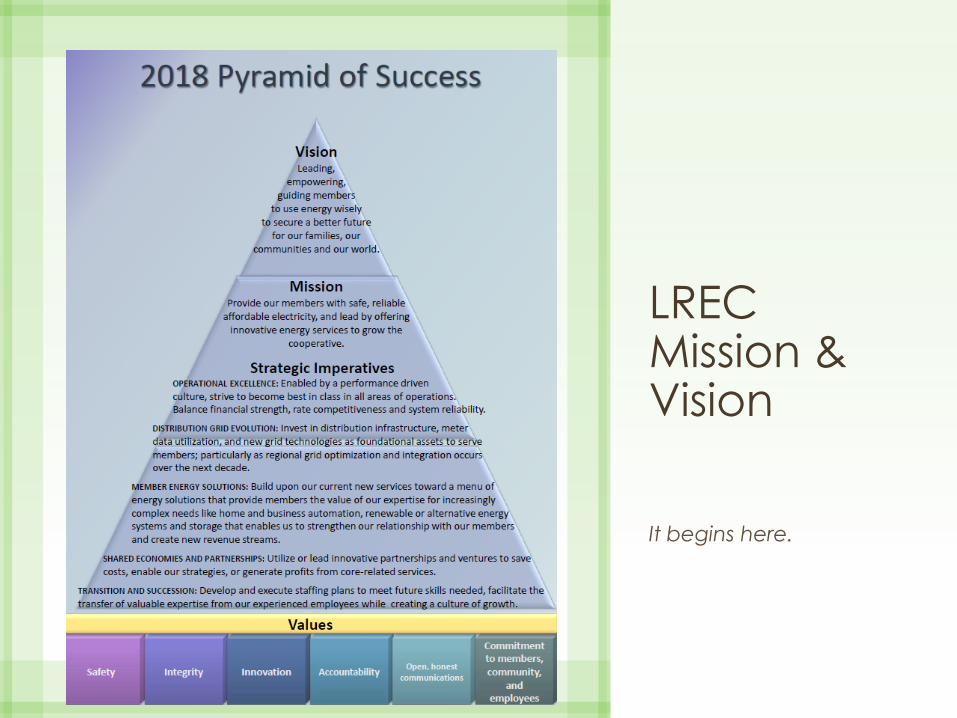
LREC Mission & Vision
It begins here.
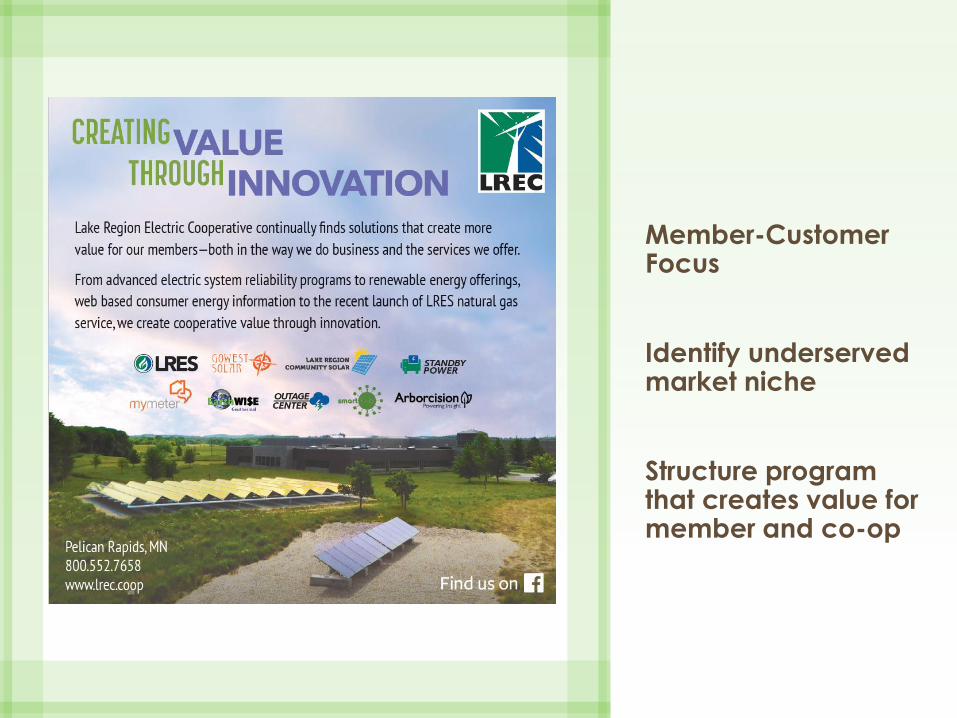
Member-Customer Focus
Identify underserved market niche
Structure program that creates value for member and co-op
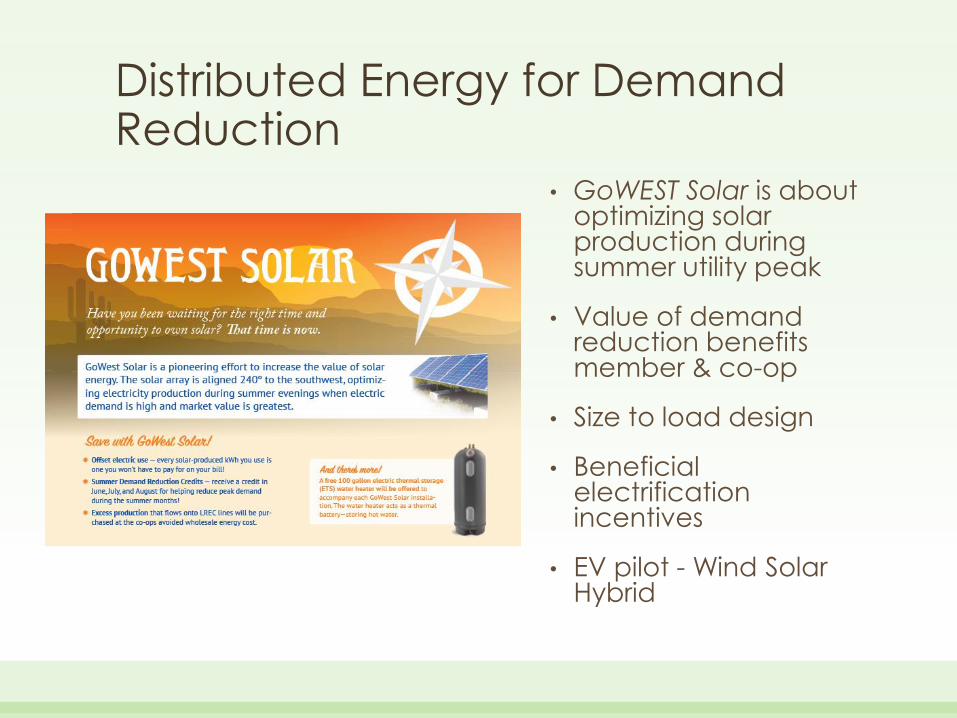
Distributed Energy for Demand Reduction
• GoWEST Solar is about optimizing solar production during summer utility peak
• Value of demand reduction benefits member & co-op
• Size to load design
• Beneficial electrification incentives
• EV pilot - Wind Solar Hybrid
1
Great River Energy Grid Interactive Water Heating
Jeff Haase
2
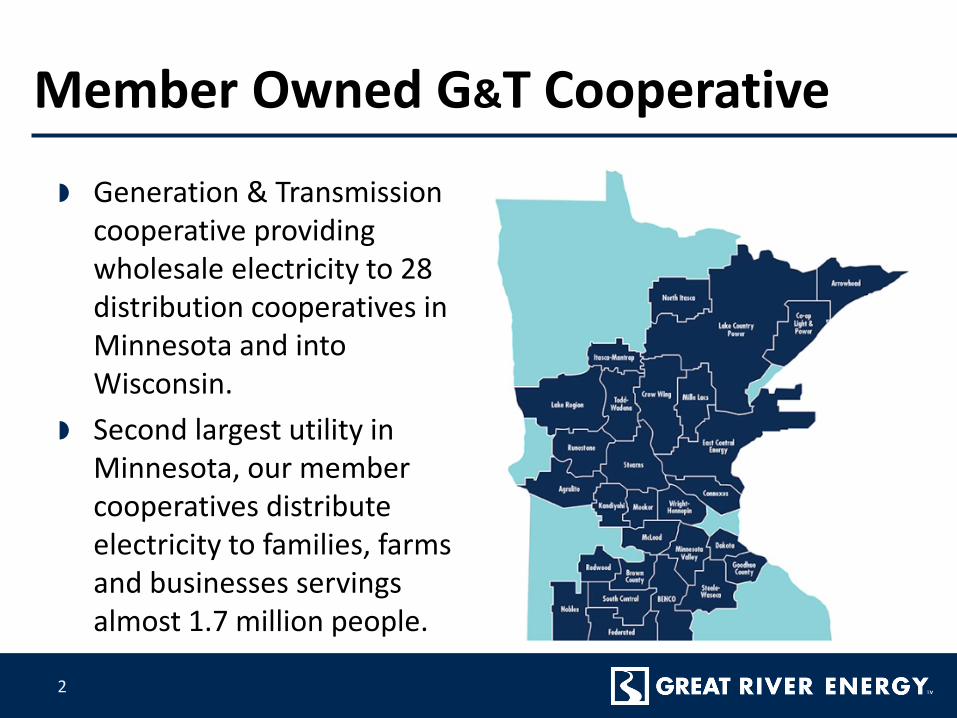
Member Owned G&T Cooperative
Generation & Transmission cooperative providing wholesale electricity to 28 distribution cooperatives in Minnesota and into Wisconsin.
Second largest utility in Minnesota, our member cooperatives distribute electricity to families, farms and businesses servings almost 1.7 million people.
3
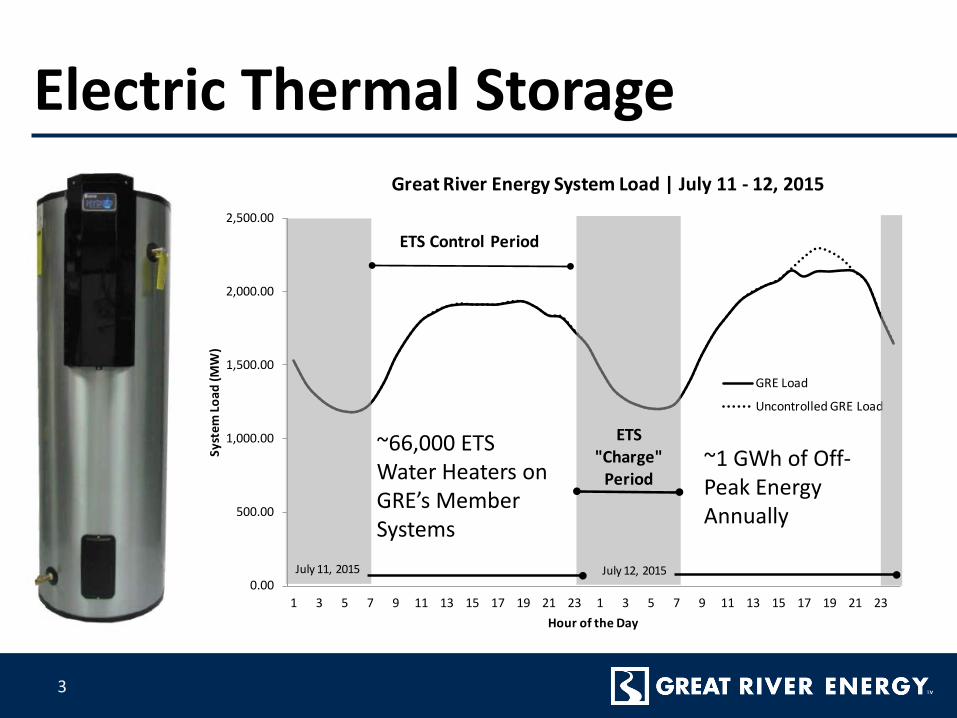
Electric Thermal Storage
0.00
500.00
1,000.00
1,500.00
2,000.00
2,500.00
1 3 5 7 9 11 13 15 17 19 21 23 1 3 5 7 9 11 13 15 17 19 21 23
Syst
em Lo
ad (M
W)
Hour of the Day
Great River Energy System Load | July 11 - 12, 2015
GRE Load
Uncontrolled GRE Load
July 11, 2015 July 12, 2015
ETS "Charge"
Period
ETS Control Period
~66,000 ETS Water Heaters on GRE’s Member Systems
~1 GWh of Off-Peak Energy Annually
4
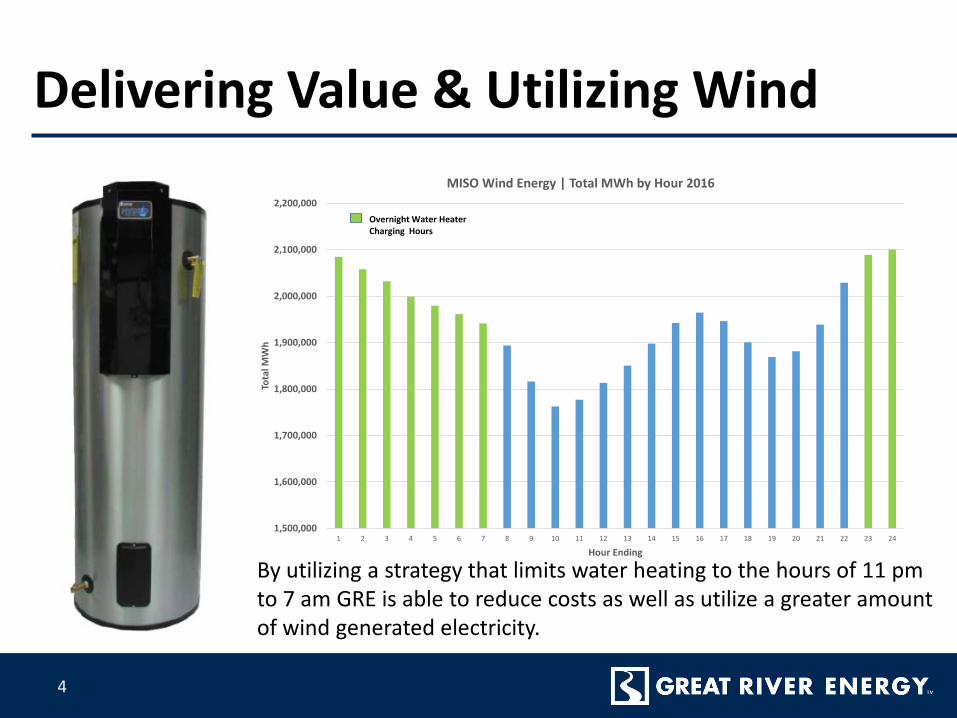
Delivering Value & Utilizing Wind
1,500,000
1,600,000
1,700,000
1,800,000
1,900,000
2,000,000
2,100,000
2,200,000
1 2 3 4 5 6 7 8 9 10 11 12 13 14 15 16 17 18 19 20 21 22 23 24
Tota
l MW
h
Hour Ending
MISO Wind Energy | Total MWh by Hour 2016
Overnight Water Heater Charging Hours
By utilizing a strategy that limits water heating to the hours of 11 pm to 7 am GRE is able to reduce costs as well as utilize a greater amount of wind generated electricity.
5
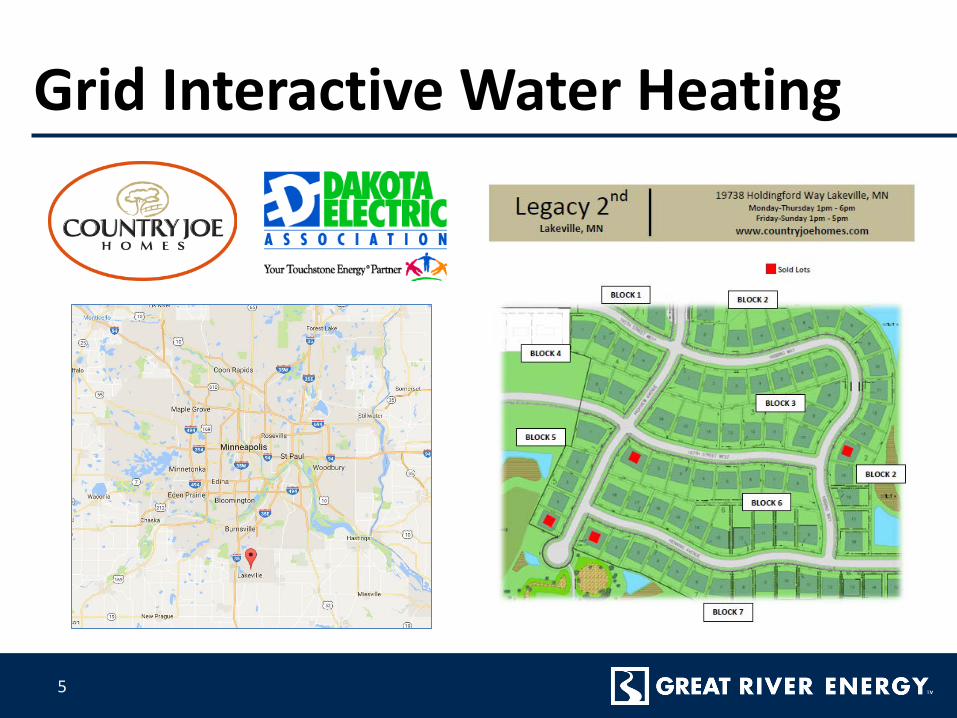
Grid Interactive Water Heating
6
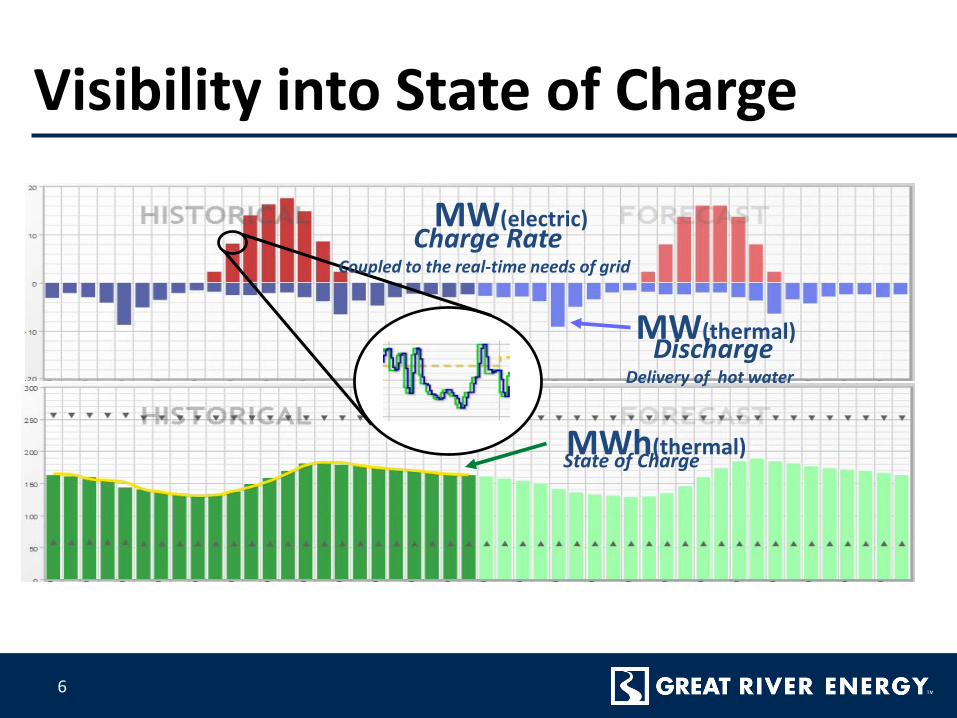
Visibility into State of Charge
MW(thermal)Discharge
Delivery of hot water
MW(electric)Charge Rate
Coupled to the real-time needs of grid
MWh(thermal)State of Charge
7
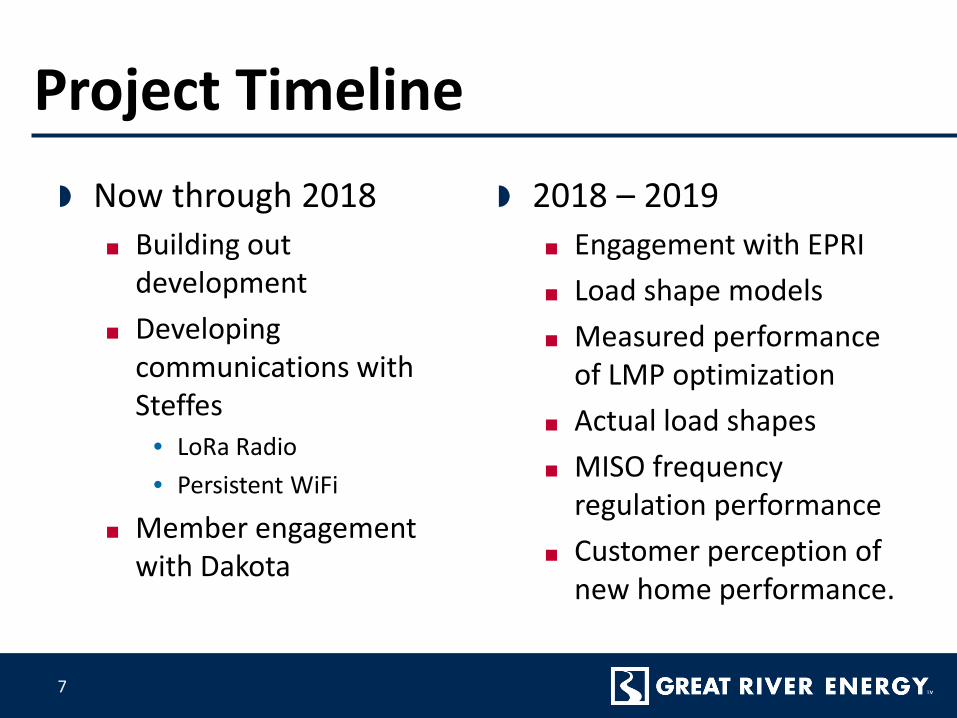
Now through 2018■ Building out
development■ Developing
communications with Steffes
• LoRa Radio• Persistent WiFi
■ Member engagement with Dakota
2018 – 2019■ Engagement with EPRI■ Load shape models■ Measured performance
of LMP optimization■ Actual load shapes■ MISO frequency
regulation performance■ Customer perception of
new home performance.
Project Timeline
9
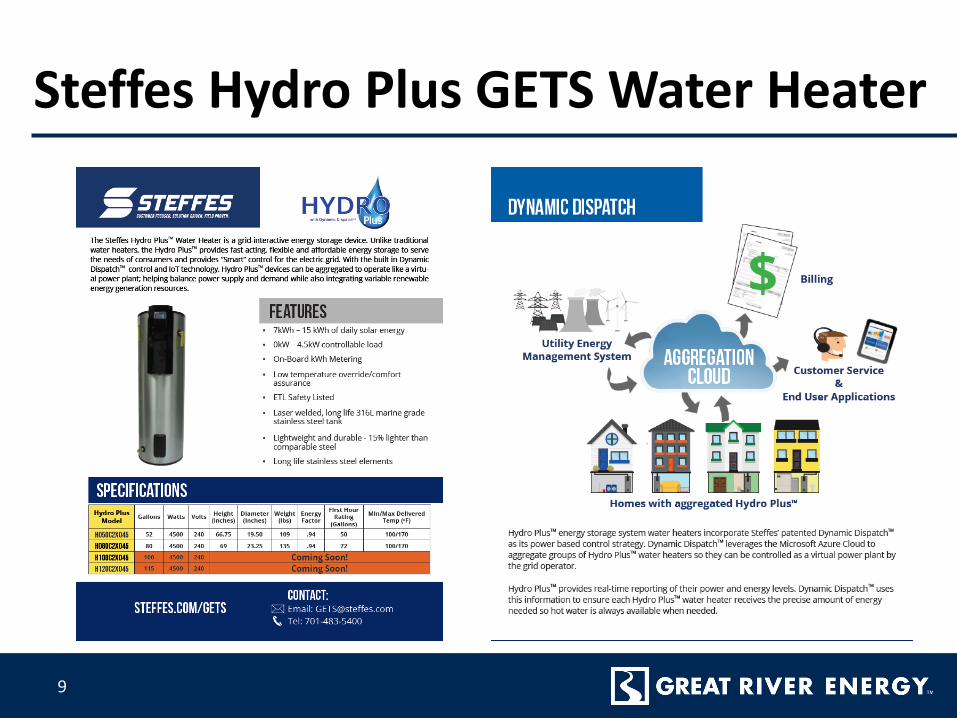
Steffes Hydro Plus GETS Water Heater
10
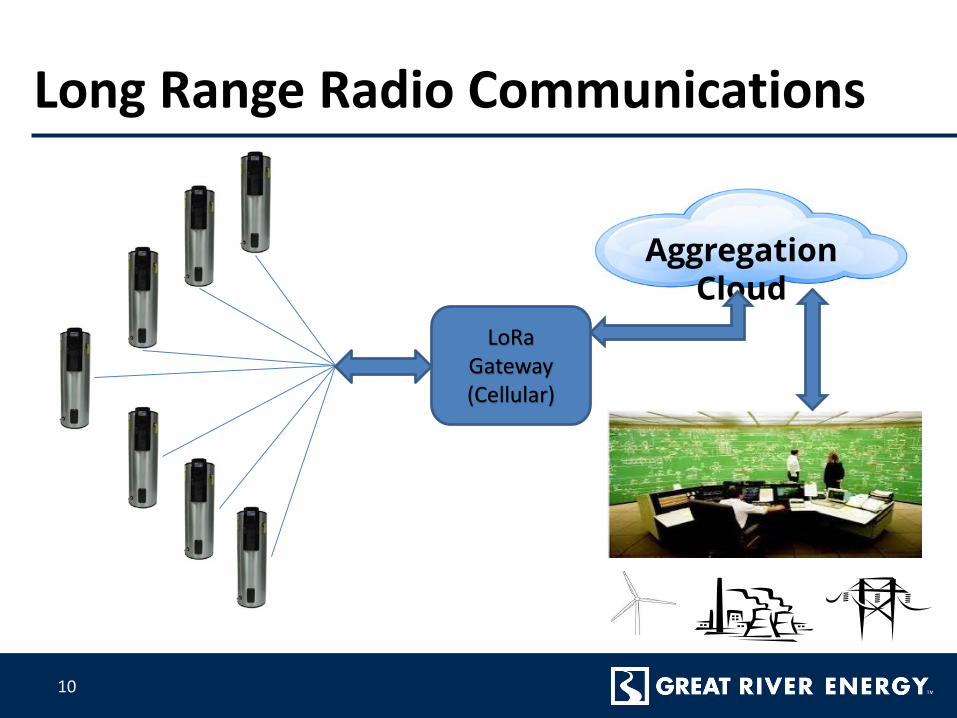
Long Range Radio Communications
LoRaGateway(Cellular)
Aggregation Cloud
11
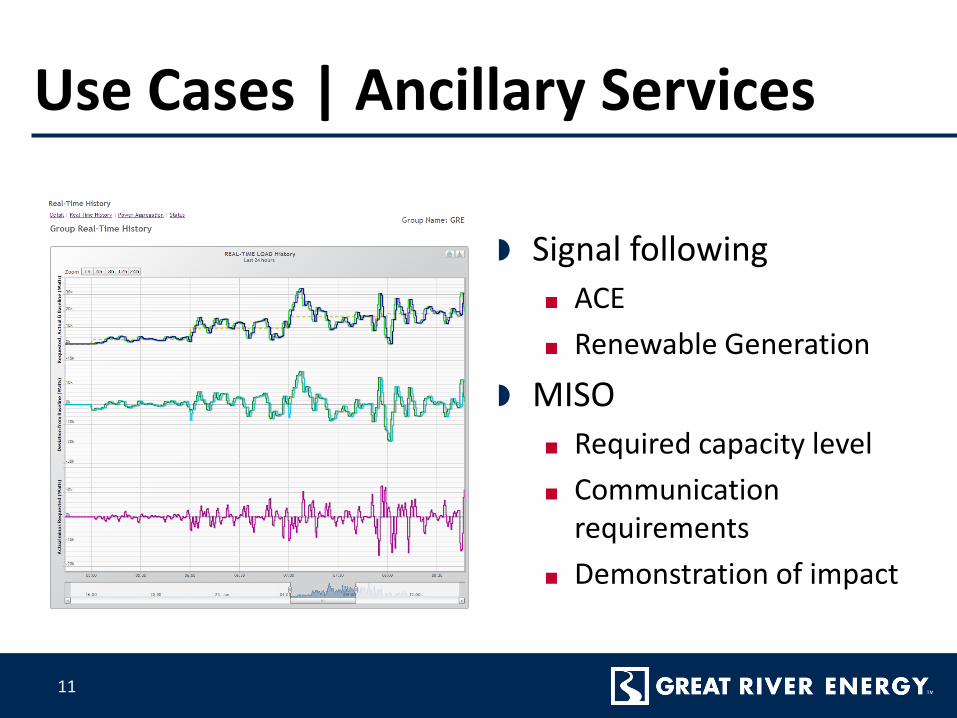
Signal following■ ACE■ Renewable Generation
MISO■ Required capacity level■ Communication
requirements■ Demonstration of impact
Use Cases | Ancillary Services
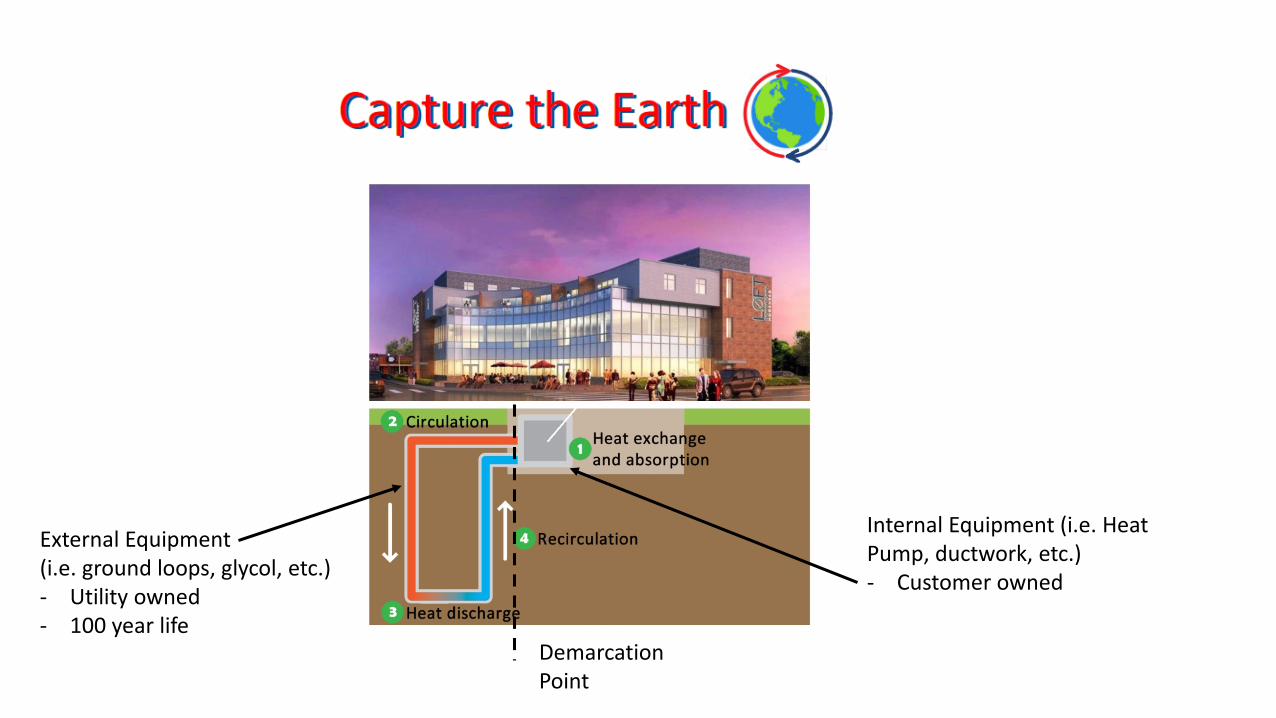
Internal Equipment (i.e. Heat Pump, ductwork, etc.)- Customer owned
External Equipment (i.e. ground loops, glycol, etc.)- Utility owned- 100 year life
Demarcation Point