Embed Size (px)
Citation preview

Manuscript submitted to: Volume 2, Issue 4, 424-442.
AIMS Energy DOI: 10.3934/energy.2014.4.424
Received date 3 October2014, Accepted date 19 November 2014, Published date 27 November 2014
Research article
Wind energy development and perceived real estate values in Ontario,
Canada
Chad Walker 1, *, Jamie Baxter 1, Sarah Mason 1, Isaac Luginaah 1, and Danielle Ouellette 2
1 Department of Geography, Western University, London, ON N6A 5C2, Canada 2 Environmental Science Program, Western University, London, ON N6A 5C2, Canada
* Correspondence: Email: [email protected], Tel: 519-661-2111 ex. 82818.
Abstract: This paper focuses on public concerns about real estate value loss in communities in the vicinity of wind turbines. There are some conflicting results in recent academic and non-academic literatures on the issue of property values in general—yet little has been studied about how residents near turbines view the value of their own properties. Using both face-to-face interviews (n = 26) and community survey results (n = 152) from two adjacent communities, this exploratory mixed-method study contextualizes perceived property value loss. Interview results suggest a potential connection between perceived property value loss and actual property value loss, whereby assumed property degradation from turbines seem to lower both asking and selling prices. This idea is reinforced by regression results which suggest that felt property value loss is predicted by health concerns, visual annoyances and community-based variables. Overall, the findings point to the need for greater attention to micro-level local, and interconnected impacts of wind energy development.
Keywords: property values; real estate values; wind turbines; renewable energy; rural geography; energy policy; facility siting
1. Introduction
Amid concerns about pollution, global climate change and the desire to increase energy sovereignty, governments are now under pressure to reduce greenhouse gas emissions and pursue renewable energy alternatives. Globally, renewable electricity capacity doubled between 2000 and 2012 and now sits at more than 23% of the total. Wind energy has played a key role in this, increasing by a factor of nearly 16 during this time [1]. In Canada the increase has been even more substantial in recent years—going from just 137 MW in 2000 to 8,517 MW in July 2014 (more than 60 times increase) [2]. Development in Canada’s leading wind-energy capacity province Ontario, has
425
AIMS Energy Volume 2, Issue 4, 424-442.
been led by the current Liberal government who has mandated that the province move away from the use of fossil fuels, particularly coal, in favour of renewable electricity generation. The provincial government has promoted renewable energy through the Green Energy Act (GEA); an initiative that aims to make Ontario a “global leader in the development of renewable energy” [3]. Wind power has increased the most as a result of Ontario’s program. For the year 2013, approximately 3.5% of the actual electricity generated in the province was through wind turbines and by 2030 it is projected that this will increase to 10% [4,5]. This rapid development has resulted in a total of 51 projects and more than 1300 turbines in the province as of December 2013 [2].
While the development of wind energy in Ontario has been successful in terms of increasing capacity, an intense debate has resulted—which is reinforced by rural/urban spatial imbalances [6-8]. Though 86% of the Ontario population lives in urban areas, wind turbines are almost entirely (> 99%) placed in rural communities [2,9]. Under Ontario’s current policy, prescribed setback distances are at least 550 metres, up from 350 metres prior to 2009 due to intense complaints by concerned citizen groups such Ontario Wind Resistance. They maintain that this 550 metre minimum is arbitrary and have called for it to be increased to 2 km [10].
A major concern of residents in the vicinity of wind turbines is threats to the value of their home and/or property [11,12]. Local homeowners are concerned that that real estate values in wind turbine communities are diminished because of a wide range of ancillary impacts including visual and acoustical disturbances, and especially in the case of Ontario, turbine-related health effects [13-16]. Yet, results from empirical research have thus far been mixed [17,18] or are based on aggregate data that may not apply to the impacts seen in more localized neighbourhoods and individual homes closest to turbines [11,19]. More importantly, they do not specify how and why actual property value forfeiture may happen as a social process of perceived loss leading to selling at a loss.
1.1. Turbines and property values
Though there are exceptions, most studies looking at turbine development and property value loss find that on average, the majority of homes do not experience a decrease in value and that the majority of local residents do not believe turbines can affect prices [20]. Yet such studies say little about specific homes near specific turbine developments.
The most commonly cited research to determine if wind turbines lower property values involves hedonic real estate price valuation modelling. Using this method for example, Jordal-Jorgensen [21], found in Denmark that homes in close proximity to turbines were valued less than surrounding areas, but the association was not statistically significant. This concept of ‘distance decay’ whereby homes further away from turbines experience lower impacts from development is a trend found in other cases of “undesirable land uses” [22,23]. In more recent years, turbine studies show that the majority of properties do not have significantly lower values in the vicinity of operating turbines [24,25,26]. One US study which used over 24,000 home sales indicated that at a national level, on average, turbines may actually have a positive effect on local property values [27]. Other studies, such as those from Poletti [28] and Sims and Dent [29], did not find evidence in either direction—and conclude that real estate values near turbines fluctuate the same as nearby areas.
The most recent research from Hoen et al. [25] is one of the most comprehensive quantitative examinations into the issue and also indicates that at an aggregate-level turbines do not have any consistent negative effect on property values. Their investigation of more than 50,000 sales across 67

426
AIMS Energy Volume 2, Issue 4, 424-442.
wind energy developments in nine states in the U.S. revealed no statistically significant effect on the value of homes either in the post-construction or post-announcement/pre-construction phase. Hoen et al. [12,25] used a large number of actual sales data and ran a variety of robustness tests; yet there are at least three limitations of hedonic price studies—whether they find negative effects [17] or do not [12,25,26]. Some of these limitations Hoen et al. [12] readily admit in their own work. First and foremost, hedonic analysis and its interpretation tends to place heavy emphasis on the majority at the expense of the minority. While this way of thinking is useful providing an overall image of the scale and scope of impacts it may downplay some impacts felt on the ground by particular people. Particular neighbourhoods or social groups placed near turbines for example, that do indeed experience property value loss, may be drowned out in this aggregate analysis—the ecological fallacy. Second, the work tends to be based on distance zones, but rarely within less than half mile (805 m). This may not provide adequate spatial resolution, particularly in places like Ontario where the minimum setback distance was once 350 m and is now 550 m. Hoen et al. [12] suggest that “subsequent research should concentrate on homes located closest to wind facilities”. Third, though Hoen et al. [12] and Lang et al. [30] find no evidence that homes near turbines sell at lower rates, it is very difficult to account for homes that are not put on the market due for fear of net financial loss. Therefore exploring the meaning and perceptions of local residents using a mixed methodology, we attempt to explain why turbines do or do not affect property values and the deeper meaning behind this.
There are a handful of studies which employ self-report surveying of expressed purchase preferences or mixed quantitative and qualitative methods [31]. Research from Australia found that 38% of respondents would pay 1–9% less for a property due to the presence of a local wind farm [32]. In Ontario, work from Baxter et al. [33] found that the majority of residents in both a control (69%) and a ‘wind turbine’ community (55%) reported concerns that turbines may lower property values. There is even less mixed-method, academic research looking at how residents living in these homes themselves perceive and value their own home in the context of wind energy. This is particularly important as they ultimately decide final asking and selling prices. Speaking with homeowners can for example, capture reasons why a home was or was not taken off of the market or how they made real estate decisions. In this case, homes that are very negatively affected by development may not be part of the data set at all. Although there are a growing number of studies suggesting that there is no negative effect of turbines on property values, more work needs to be done to tease out property value impacts in various ways and at various scales.
1.2. Non-academic literature
The non-academic literature on the issue of wind turbines and property values focuses attention on the influence of turbine developments on buyer and seller behaviours and generally comes to stronger conclusions than academic work. However whether property values have an impact tends to depend on the sponsor or source of the report. The majority of these studies use survey questionnaires whereby residents and/or real estate professionals are asked their opinions. Some studies report that residents perceive overall losses attributed to the turbines [34,35,36] while others found that real estate professionals tended to think there was no discernible effect [37,38]. Haughton et al. [34] found that 21% of locals perceived a negative impact from development whereas 79% believed it would have no or a positive impact. Behind the convictions of these non-academic reports however are questions of potential biases. The Haughton et al. [34] paper was done by a Suffolk University conservative
427
AIMS Energy Volume 2, Issue 4, 424-442.
think-tank which has received fossil fuel funding and has been labelled a climate change denial group [39, 40]. Other reports have been sponsored by county citizen [35] or economic development groups [38]. In Ontario, self-reporting surveys that tend to be supported by concerned citizen groups find that turbines affect property value negatively [13,41]—though it is a relatively minor theme of these papers focused on health and equity issues. In terms of real estate papers directly relevant to the Ontario context, Lansink’s [42] case studies looked at 12 home sales near two specific developments in Melanchthon Township and our own study area Clear Creek, Ontario and found that the sales were at losses between 23% and 59% and an average loss of about 36% based on the authors assessments of the value at which they should have sold. This differs from most hedonic modelling studies as the latter are based more on average sales than individual assessments. Nevertheless, Lansink concludes, “real or perceived nuisances resulting from wind turbines produces buyer resistance that results in price diminution”. To the contrary in the Ontario context, the Municipal Property Assessment Corporation [18] recently published their 2012 province-wide current Value Assessment report finding that for aggregate sales province-wide there is no systematic impact on sale prices of residential homes “resulting from proximity to an IWT (Industrial Wind Turbine)”. Likewise Vyn and McCullough [26] find no significant effect in their study of 7000 home sales in Melancthon the same setting as the Lansink study. Thus, upscaling to the provincial level may hide the negative effects Lansink reports. A more recent unpublished report from the London School of Economics found that in the UK the value of homes within 2 kilometres of a large wind farm (≥ 20 turbines) can decrease by as much as 12% [17].
1.3. The impact of policy and context on property value perceptions
There is good reason to believe that property value impacts are interconnected with the policy context through socially constructed risk perception processes [43,44,45]. For example, prior to the establishment of the Green Energy Act (GEA) in 2009, those opposed to wind energy in their communities could, through long-standing environmental assessment procedures, delay or cancel plans based on a wide range of suspected impacts including decline in a property’s value. The GEA has severely limited the number of arguments deemed acceptable (e.g. health impacts) by the government to reject new turbine installations and because of this, objectors may be highlighting only a small portion of impacts in their complaints about turbines [46,47]. Thus, the issue of property value impacts may get muted by policy. Yet there is good reason to believe property value is tied in with other impacts including health as well-being.
1.4. Home as Ontological Security and Attachment to Place
If we seriously consider how the subjective meaning of home and property in the context of daily life influences how people act; subjective meaning may provide important windows on how property values are constructed by homeowners near turbines—phenomena that are difficult to obtain with surveys alone [48]. Our work uses interviews and a survey and aims to be consonant with a humanist approach that values the experiences of phenomena in daily life [49,50]. In this sense, impacts feedback onto each other whereby perceived changes in quality of life impact the perception of a home’s value which in turn affects quality of life in important ways.
The concept of home as ontological security is conceptually consistent with the role suggested by

428
AIMS Energy Volume 2, Issue 4, 424-442.
subjective meaning [51,52,53] in the sense that homes allow people to feel in control, free from surveillance, at ease, and otherwise ‘free to be themselves’ [54]. From the point of view of property values, Saunders [51] suggests that while employment and investments may fluctuate considerably, home is expected to act as a place protected from socio-economic unpredictability. Further, it is well established that housing, health and wellbeing are interconnected [55-58]. Home ownership compared to renting contributes to a higher secure sense of ‘home’ which in turn positively impacts well-being [59-63]. Renters have been shown to be more vulnerable to things like psychosocial stress, but such studies do not account for situations where homeowners may fear loss of capital investment in a property. The threat of financial loss or affordability of one’s home is something that affects both renters and homeowners- particularly when those groups are lower-income [64]. This can lead to chronic insecurity [65,66] for homeowners, which may be linked negatively to health as overall well-being [67,68]. As rural areas have proportionately higher home ownership, the importance of home and constructs of ontological security seem particularly important.
The so called old-timer versus newcomer divide represents differences in how meaning may inhere in the same place according to length of residence. Newcomers tend to come to rural places to escape loud and crowded cities while old-timers view the landscape and new developments as sources of local economic stability [16,69-73]. This idea relates to Devine-Wright and Howes’ [74] work on place attachment in the context of wind turbine development. In their study, opposition arose from nature/industry contradictions—ones relating to each resident’s belief in the degree to which the ‘rural’ should be a restorative versus a productive environment. If place attachment and/or length of residence affect levels of concern and opposition, it may also be relevant to the perceived impact on property values. We do not operationalize place attachment directly but do measure length of time in the community to see if a relationship exists with the perception of property values.
Thus, property values are tied up in more than what might go into a hedonic property value assessment: the number of bathrooms, water frontage and presence of local turbines. Property values (and especially perceptions of them) are also oriented to the degree of ontological security and place attachment one feels when at “home”.
2. Methodology
As there is clearly some uncertainty surrounding property value impacts from turbines, this study focuses on perceived property value impacts according to the following specific objectives:
1) to investigate residents’ perceptions of changes in property values; 2) to explore the predictors of perceived impacts of changing property values in the context of
daily life. Guided by grounded theory, this mixed method study involved both in-depth interviews and
quantitative surveys with those living close to turbines [75,76]. Though the research began as a qualitative study in Port Burwell, the flexible nature afforded by grounded theory meant that research continued in nearby Clear Creek and then surveys were introduced in both communities [77].
2.1. Participant selection
The interview phase of the research process began in Port Burwell in the spring of 2011 and continued into 2012. In June 2011, letters were first dropped off at 205 Port Burwell area homes that
429
AIMS Energy Volume 2, Issue 4, 424-442.
were within 1 kilometre of a wind turbine. Of these, 18 local residents were interviewed. After this, we moved into Clear Creek where through media reports, we identified a key informant that was vocally against the local wind turbines. As our initial contact, we then used snowball sampling to use social networks to encourage people to participate in the study [78]. Though ‘snowballing’ has been criticized for a lack of a definable sampling frame [79] we still stayed within our 1km-of-a-turbine criterion, but in a neighbouring community. The advantage of this approach is to engage hard-to-reach subpopulations [80]—in this case, residents who felt negatively impacted. This process led us to meet and interview seven more residents, three of which were vocal opponents of the wind turbines. Interviews were conducted using an open-ended interview guide, generally lasted 60–90 minutes, and were transcribed verbatim. The interviews were analysed with the assistance of NVIVO qualitative analysis software and the survey data were analysed using SPSS. Interview coding was done in two stages. After one round of general coding into broad themes (i.e. health effects, property values), we analysed interviews for more depth. This included: 1) reading/coding to uncover sub-themes and 2) secondary review of themes by the principal investigator. The latter is a form of triangulation and was used to increase the qualitative rigour of the study.
The quantitative survey analysis (n = 152) involved bivariate, and multivariate analyses. We used the results from the qualitative component to inform and design the survey which was distributed to randomly selected homes within 2 km of a turbine. More detail regarding how survey participants were chosen can be found in a companion piece [77]. Consequently, the quantitative variables that were chosen fit well into our evolving conceptualizations of perceived property values. Bivariate t-tests compared the perceptions of real estate loss between communities (see Table 1) and across three different questions relating to housing characteristics (not shown). Bivariate correlations looked at relationships between 18 individual predictor variables and perceived property value loss as the dependent variable (see Table 2). The variables included in the correlation matrix are a mix of factors thought to be associated with perceived property value. The 18 independent variables were split into five categories (support, local impacts, policy/process, housing characteristics, and demographic characteristics). Lastly, the regression analysis is comprised of four models which add the 10 variables (as shown to be significant through bivariate correlations) as blocks: support for turbines, health effects, policy/process, and community variables (see Table 3).
3. Results
Early on in the interview process, it was apparent that real estate value and loss was important and seemed to affect each community very differently. In Port Burwell, most residents interviewed (13/16) believed turbines do not affect real estate values while two believed they declined, and one believed values actually increased. Yet how they talked about property values is also telling. “Don” was representative of the majority in Port Burwell and cited his knowledge of the local area when asked about real estate activity. When we asked if he knew of any friends or neighbours selling, he responded as follows:
“Don” (Port Burwell, supportive): Yep! There’s been different places around this area that have changed hands in the last 10 years and I haven’t heard of anybody that can’t sell their place or wouldn’t buy here due to the wind turbines….
In stark contrast to Port Burwell, residents in Clear Creek near a different turbine development,

430
AIMS Energy Volume 2, Issue 4, 424-442.
either feared or felt they had experienced real estate value loss. Of the eight interviewed, six either experienced or strongly believed the loss of real estate values in the area. For example, “George” who recently moved into the area, acknowledged that his own property was obtained at a price that was lowered:
“George” (Clear Creek, supportive): I’m actually glad that (the turbines are) here. Because the person that owned this before, he thought he was going to have issues selling the place because of the turbines so he dropped down the price. I said, thank you!
Others also discussed the negative effects of real estate value loss. “Jeff”, who is generally supportive of turbines, told us that he has seen many people come through their house and most potential buyers rejected the idea of purchasing the property because of the turbines:
“Jeff” (Clear Creek, supportive): We’ve had our (lot) for sale for about eight months. We’ve had about seven people go through and six out of the seven said that they didn’t want it because of the turbines. They don’t want to look at the turbines…I mean right there, we had a lot that we should be able to normally, be able to sell no problem. Like it would have sold like, we couldn’t have, we couldn’t have stopped it from selling, it was just insane like there’s just a huge demand. Now that demand has waned. Pretty much ‘plateaued’ if not dropped.
There are other local residents who are opposed to the local turbine development at least partially because of an inability to sell without a financial loss, including “Barbara” who has had her lakefront home on the market while the turbines have been operational:
“Barbara” (Clear Creek, Opposed): Not only have I not had an offer, nobody’s even come to see the house. And my hunch is when they drive westward… they come to that point where they see these 18 turbines and they say what is this?! And they turn around and go back home…Even a lakefront property means nothing when it’s surrounded by 18 turbines.
While it is not entirely surprising that a higher proportion of those in Clear Creek believe turbines can reduce property values, it is interesting that overall opinion of the local wind turbine development does not always depend on this perception. “George” may well enjoy and support the local wind farm because it got him a ‘better deal’; however “Jeff” and other local residents were supportive of the turbines despite their experience of financial losses. As indicated in the preceding comments, people like “Barbara” seem ‘trapped’ in their home. Without the ability to sell their current home or financial means to afford two homes, it may be very difficult for some living too close to turbines to leave.
The survey data also shows a statistically significant difference in perceptions between the two communities in terms of agreement with the statement: “The value of my property and/or dwelling has decreased due to the wind turbines”. Thirty four percent and 9% of residents in Clear Creek and Port Burwell agreed with the statement respectively (Table 1). The mean response tends towards “neutral” for Clear Creek at 3.19 while in Port Burwell it was highly skewed towards “disagree” at 4.20. There were similar results for the more general statement “Wind turbine projects lower local property values” (Table 1). Together, these results suggest that at least in terms of the perception of real estate value losses, those in the Clear Creek area think more negatively about how their property has been affected. Further, as expected there were statistically significant negative correlations (not shown) between these perceptions of real estate losses and overall support for local wind turbine

431
AIMS Energy Volume 2, Issue 4, 424-442.
development.
Table 1. Real Estate Value loss by community.
Survey Question a 1 b 2 3 4 5 Means t-test (p value) c
The value of my property and/or dwelling has decreased due to the wind turbines
Port Burwell 5 4 16 18 57 4.20
0.00 **
Clear Creek
28
6
19
13
34
3.19
OVERALL 15 5 17 16 46 3.74
Wind turbine projects lower local property values
Port Burwell 13 12 21 17 37 3.51
0.05 *
Clear Creek
27
15
18
12
29
3.03
OVERALL 19 13 19 15 33 3.29
a Responses to the survey question (1–5) represent responses of 1: strongly agree to 5: strongly disagree. b Values are percentage of overall sample and may not equate to 100% due to rounding or questions that were not
answered. c t-test of means of communities (Port Burwell and Clear Creek) show significant differences by response (* p = 0.05; **
p = 0.01).
3.1. How residents explain property value loss from turbines
That two communities next door to each other have significantly different views on property value loss begs the question, “Why”? Using a combination of interview and survey data—the latter comparing means by community—we examine the range of phenomena that residents link to property values. Following some quotations from the interviews, we use t-tests and bivariate correlations, then a more complex four-stage regression model to more precisely tease out how personal property value assessments link to other phenomena connected to turbines and turbine communities.
One of the most striking differences from the interviews in Port Burwell and Clear Creek was the perceived ‘blame game’ being played among local residents. That is to say, some we spoke with believed local residents themselves were actually influencing real estate prices. Of the majority (13/18) who did not feel real estate prices were negatively affected by local turbines, two actually blamed opposition attitudes for causing the problems that did exist. “Ann” was one of those people:
“Ann” (PB, supportive): You complain about it, so if you’re going to complain about (prices) who’s going to want to buy your house? You know if you make the real estate person, you know, proclaim all the things that you’re saying you don’t like about the wind turbine then who is going to want to buy it?
Though Ann was part of a small minority of the people we interviewed in Port Burwell who openly placed blame on the person claiming loss of property value, it also signals how blame and the potential for community conflict are part of the local context.
432
AIMS Energy Volume 2, Issue 4, 424-442.
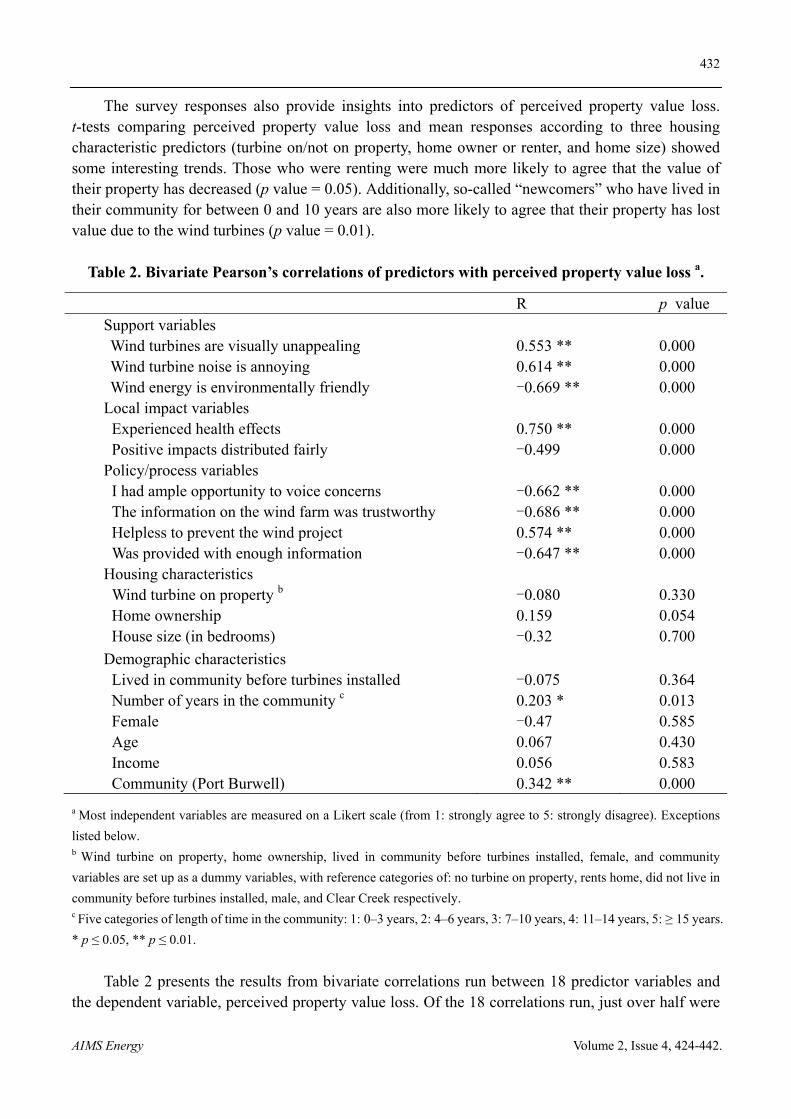
The survey responses also provide insights into predictors of perceived property value loss. t-tests comparing perceived property value loss and mean responses according to three housing characteristic predictors (turbine on/not on property, home owner or renter, and home size) showed some interesting trends. Those who were renting were much more likely to agree that the value of their property has decreased (p value = 0.05). Additionally, so-called “newcomers” who have lived in their community for between 0 and 10 years are also more likely to agree that their property has lost value due to the wind turbines (p value = 0.01).
Table 2. Bivariate Pearson’s correlations of predictors with perceived property value loss a.
R p value Support variables Wind turbines are visually unappealing Wind turbine noise is annoying Wind energy is environmentally friendly
0.553 ** 0.614 ** -0.669 **
0.000 0.000 0.000
Local impact variables Experienced health effects Positive impacts distributed fairly
0.750 ** -0.499
0.000 0.000
Policy/process variables I had ample opportunity to voice concerns The information on the wind farm was trustworthy Helpless to prevent the wind project Was provided with enough information
-0.662 ** -0.686 ** 0.574 ** -0.647 **
0.000 0.000 0.000 0.000
Housing characteristics Wind turbine on property b
Home ownership
House size (in bedrooms)
-0.080 0.159 -0.32
0.330 0.054 0.700
Demographic characteristics Lived in community before turbines installed Number of years in the community c
Female Age
Income Community (Port Burwell)
-0.075 0.203 * -0.47 0.067 0.056 0.342 **
0.364 0.013 0.585 0.430 0.583 0.000
a Most independent variables are measured on a Likert scale (from 1: strongly agree to 5: strongly disagree). Exceptions
listed below. b Wind turbine on property, home ownership, lived in community before turbines installed, female, and community
variables are set up as a dummy variables, with reference categories of: no turbine on property, rents home, did not live in
community before turbines installed, male, and Clear Creek respectively. c Five categories of length of time in the community: 1: 0–3 years, 2: 4–6 years, 3: 7–10 years, 4: 11–14 years, 5: ≥ 15 years.
* p ≤ 0.05, ** p ≤ 0.01.
Table 2 presents the results from bivariate correlations run between 18 predictor variables and the dependent variable, perceived property value loss. Of the 18 correlations run, just over half were
433
AIMS Energy Volume 2, Issue 4, 424-442.
statistically significant. According to these associations, as expected, a resident living within 2 km of a turbine is more likely to perceive a loss in their property value if: they feel turbines are visually unappealing (r = 0.56), feel turbine noise are annoying (r = 0.61), experienced health effects (r = 0.75), felt helpless to stop the wind project (r = 0.57), were new to the community (r = 0.20), or were residents of Clear Creek (r = 0.34). Negative relationships were also found—meaning that residents were more likely to perceive property value loss if they disagreed that: wind energy is environmentally friendly (r = -0.67), they had ample opportunity to stop the project (r = -0.66), felt they were not provided with trustworthy (r = -0.69) or enough (r = -0.65) information. It is somewhat surprising that none of the housing characteristics, like number of bedrooms and whether a turbine is on the property were not significant. We then moved to linear regression with all of the significant variables to further tease out the relative importance of each of the variables and whether each remains significant when controlling for other predictors.
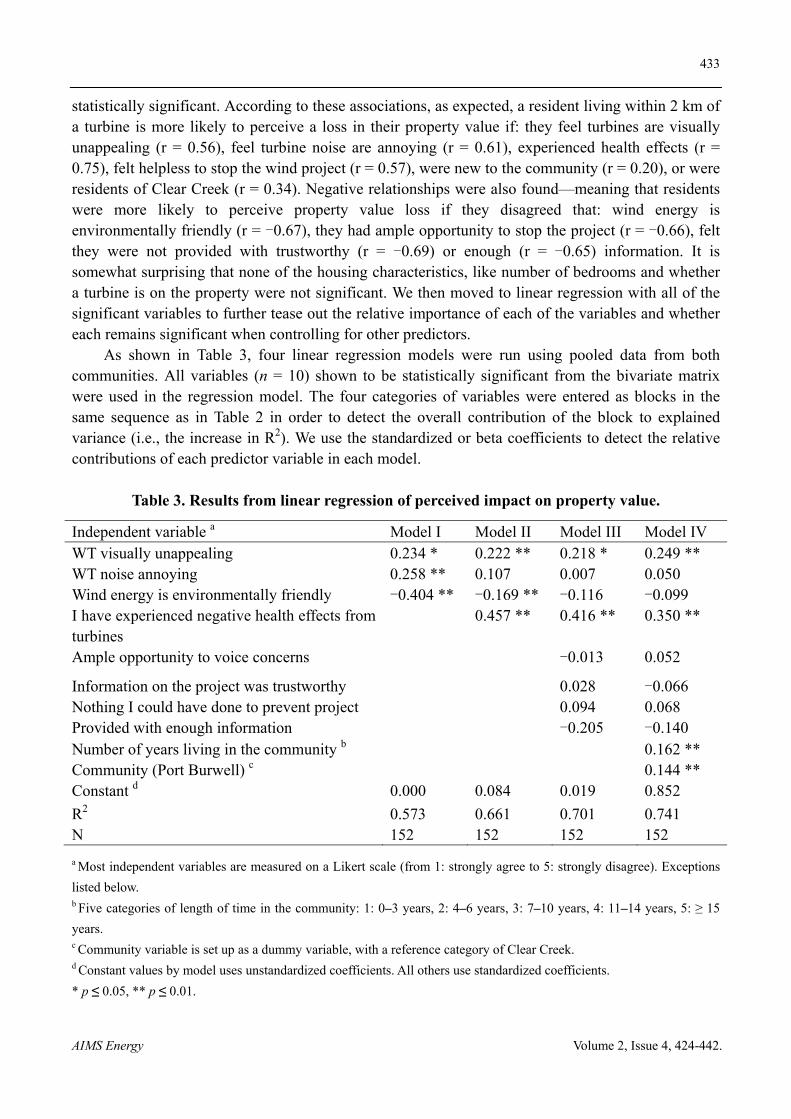
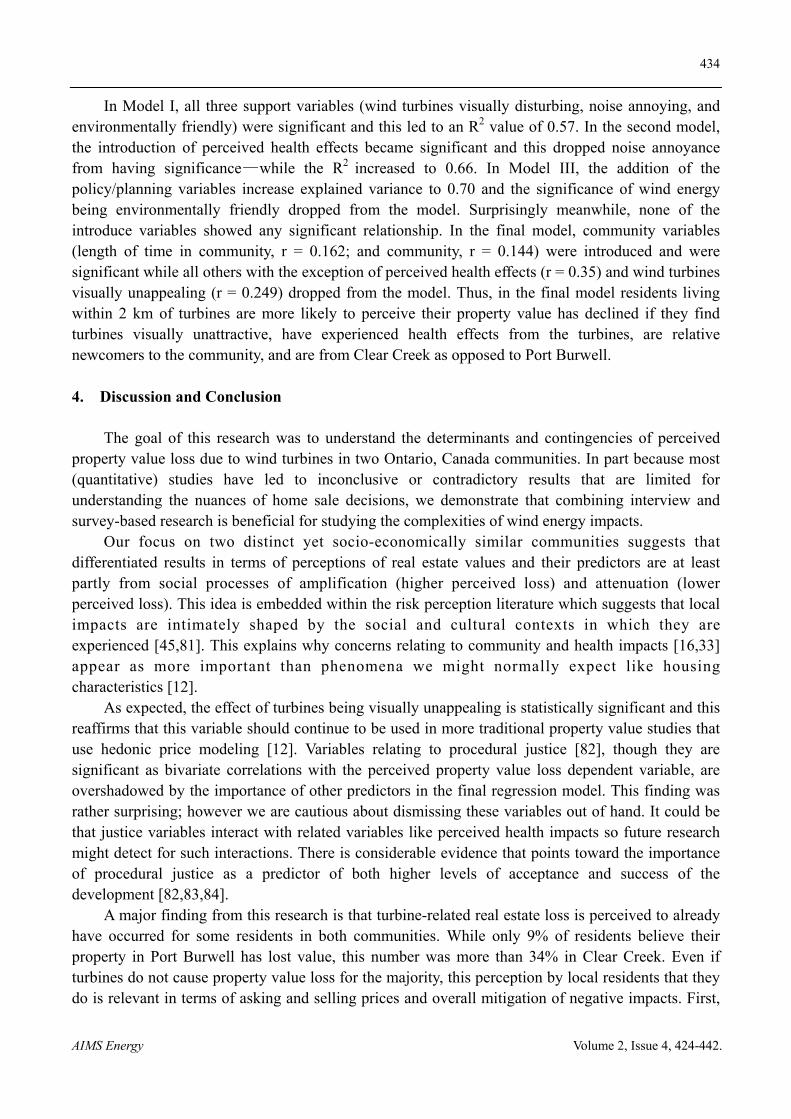
As shown in Table 3, four linear regression models were run using pooled data from both communities. All variables (n = 10) shown to be statistically significant from the bivariate matrix were used in the regression model. The four categories of variables were entered as blocks in the same sequence as in Table 2 in order to detect the overall contribution of the block to explained variance (i.e., the increase in R2). We use the standardized or beta coefficients to detect the relative contributions of each predictor variable in each model.
Table 3. Results from linear regression of perceived impact on property value.
Independent variable a Model I Model II Model III Model IV WT visually unappealing 0.234 * 0.222 ** 0.218 * 0.249 ** WT noise annoying 0.258 ** 0.107 0.007 0.050 Wind energy is environmentally friendly -0.404 ** -0.169 ** -0.116 -0.099 I have experienced negative health effects from turbines
0.457 ** 0.416 ** 0.350 **
Ample opportunity to voice concerns -0.013 0.052
Information on the project was trustworthy 0.028 -0.066 Nothing I could have done to prevent project 0.094 0.068 Provided with enough information -0.205 -0.140 Number of years living in the community b 0.162 ** Community (Port Burwell) c 0.144 ** Constant d 0.000 0.084 0.019 0.852
R2 0.573 0.661 0.701 0.741 N 152 152 152 152
a Most independent variables are measured on a Likert scale (from 1: strongly agree to 5: strongly disagree). Exceptions
listed below. b Five categories of length of time in the community: 1: 0–3 years, 2: 4–6 years, 3: 7–10 years, 4: 11–14 years, 5: ≥ 15
years. c Community variable is set up as a dummy variable, with a reference category of Clear Creek. d Constant values by model uses unstandardized coefficients. All others use standardized coefficients.
* p ≤ 0.05, ** p ≤ 0.01.
434
AIMS Energy Volume 2, Issue 4, 424-442.
In Model I, all three support variables (wind turbines visually disturbing, noise annoying, and environmentally friendly) were significant and this led to an R2 value of 0.57. In the second model, the introduction of perceived health effects became significant and this dropped noise annoyance from having significance—while the R2 increased to 0.66. In Model III, the addition of the policy/planning variables increase explained variance to 0.70 and the significance of wind energy being environmentally friendly dropped from the model. Surprisingly meanwhile, none of the introduce variables showed any significant relationship. In the final model, community variables (length of time in community, r = 0.162; and community, r = 0.144) were introduced and were significant while all others with the exception of perceived health effects (r = 0.35) and wind turbines visually unappealing (r = 0.249) dropped from the model. Thus, in the final model residents living within 2 km of turbines are more likely to perceive their property value has declined if they find turbines visually unattractive, have experienced health effects from the turbines, are relative newcomers to the community, and are from Clear Creek as opposed to Port Burwell.
4. Discussion and Conclusion
The goal of this research was to understand the determinants and contingencies of perceived property value loss due to wind turbines in two Ontario, Canada communities. In part because most (quantitative) studies have led to inconclusive or contradictory results that are limited for understanding the nuances of home sale decisions, we demonstrate that combining interview and survey-based research is beneficial for studying the complexities of wind energy impacts.
Our focus on two distinct yet socio-economically similar communities suggests that differentiated results in terms of perceptions of real estate values and their predictors are at least partly from social processes of amplification (higher perceived loss) and attenuation (lower perceived loss). This idea is embedded within the risk perception literature which suggests that local impacts are intimately shaped by the social and cultural contexts in which they are experienced [45,81]. This explains why concerns relating to community and health impacts [16,33] appear as more important than phenomena we might normally expect like housing characteristics [12].
As expected, the effect of turbines being visually unappealing is statistically significant and this reaffirms that this variable should continue to be used in more traditional property value studies that use hedonic price modeling [12]. Variables relating to procedural justice [82], though they are significant as bivariate correlations with the perceived property value loss dependent variable, are overshadowed by the importance of other predictors in the final regression model. This finding was rather surprising; however we are cautious about dismissing these variables out of hand. It could be that justice variables interact with related variables like perceived health impacts so future research might detect for such interactions. There is considerable evidence that points toward the importance of procedural justice as a predictor of both higher levels of acceptance and success of the development [82,83,84].
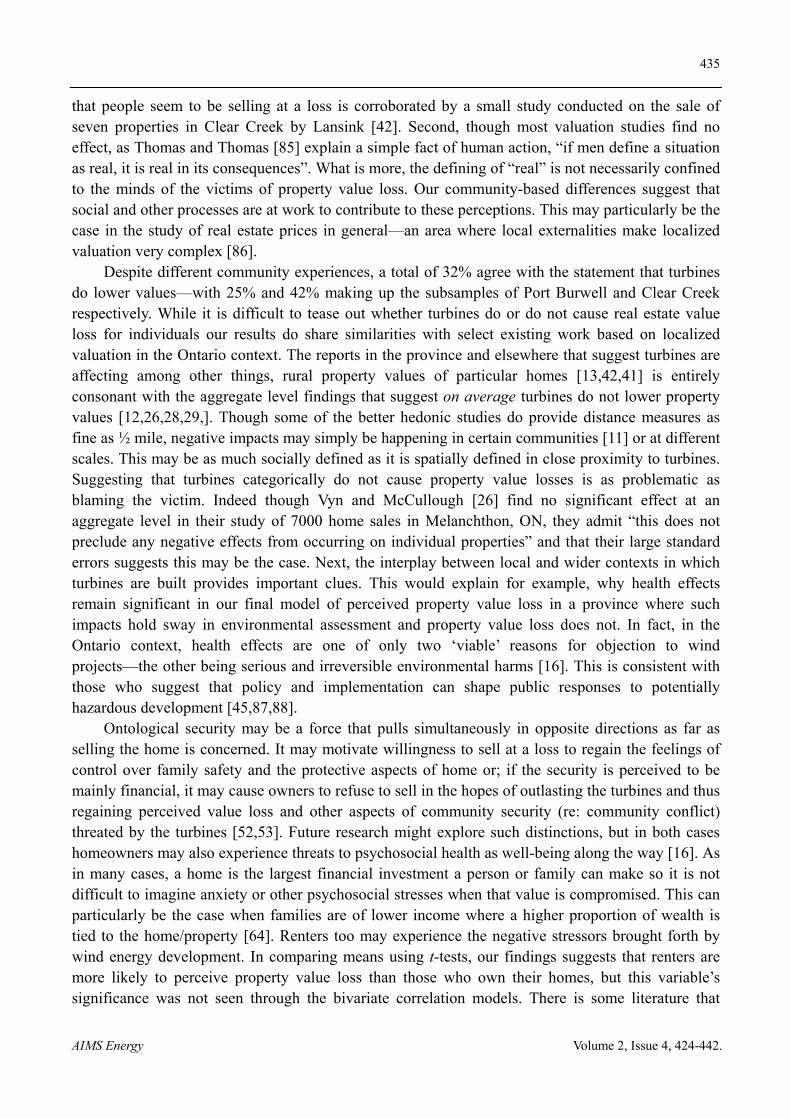
A major finding from this research is that turbine-related real estate loss is perceived to already have occurred for some residents in both communities. While only 9% of residents believe their property in Port Burwell has lost value, this number was more than 34% in Clear Creek. Even if turbines do not cause property value loss for the majority, this perception by local residents that they do is relevant in terms of asking and selling prices and overall mitigation of negative impacts. First,
435
AIMS Energy Volume 2, Issue 4, 424-442.
that people seem to be selling at a loss is corroborated by a small study conducted on the sale of seven properties in Clear Creek by Lansink [42]. Second, though most valuation studies find no effect, as Thomas and Thomas [85] explain a simple fact of human action, “if men define a situation as real, it is real in its consequences”. What is more, the defining of “real” is not necessarily confined to the minds of the victims of property value loss. Our community-based differences suggest that social and other processes are at work to contribute to these perceptions. This may particularly be the case in the study of real estate prices in general—an area where local externalities make localized valuation very complex [86].
Despite different community experiences, a total of 32% agree with the statement that turbines do lower values—with 25% and 42% making up the subsamples of Port Burwell and Clear Creek respectively. While it is difficult to tease out whether turbines do or do not cause real estate value loss for individuals our results do share similarities with select existing work based on localized valuation in the Ontario context. The reports in the province and elsewhere that suggest turbines are affecting among other things, rural property values of particular homes [13,42,41] is entirely consonant with the aggregate level findings that suggest on average turbines do not lower property values [12,26,28,29,]. Though some of the better hedonic studies do provide distance measures as fine as ½ mile, negative impacts may simply be happening in certain communities [11] or at different scales. This may be as much socially defined as it is spatially defined in close proximity to turbines. Suggesting that turbines categorically do not cause property value losses is as problematic as blaming the victim. Indeed though Vyn and McCullough [26] find no significant effect at an aggregate level in their study of 7000 home sales in Melanchthon, ON, they admit “this does not preclude any negative effects from occurring on individual properties” and that their large standard errors suggests this may be the case. Next, the interplay between local and wider contexts in which turbines are built provides important clues. This would explain for example, why health effects remain significant in our final model of perceived property value loss in a province where such impacts hold sway in environmental assessment and property value loss does not. In fact, in the Ontario context, health effects are one of only two ‘viable’ reasons for objection to wind projects—the other being serious and irreversible environmental harms [16]. This is consistent with those who suggest that policy and implementation can shape public responses to potentially hazardous development [45,87,88].
Ontological security may be a force that pulls simultaneously in opposite directions as far as selling the home is concerned. It may motivate willingness to sell at a loss to regain the feelings of control over family safety and the protective aspects of home or; if the security is perceived to be mainly financial, it may cause owners to refuse to sell in the hopes of outlasting the turbines and thus regaining perceived value loss and other aspects of community security (re: community conflict) threated by the turbines [52,53]. Future research might explore such distinctions, but in both cases homeowners may also experience threats to psychosocial health as well-being along the way [16]. As in many cases, a home is the largest financial investment a person or family can make so it is not difficult to imagine anxiety or other psychosocial stresses when that value is compromised. This can particularly be the case when families are of lower income where a higher proportion of wealth is tied to the home/property [64]. Renters too may experience the negative stressors brought forth by wind energy development. In comparing means using t-tests, our findings suggests that renters are more likely to perceive property value loss than those who own their homes, but this variable’s significance was not seen through the bivariate correlation models. There is some literature that

436
AIMS Energy Volume 2, Issue 4, 424-442.
indicates that those who rent are typically more prone to feelings of insecurity and a lack of control in their local community [61,62,63]. With relatively low numbers of renters in rural areas where turbines are found, future larger studies might be able to tease out such effects.
The significance of the length of residence variable in the final model is consistent with existing literature which says that longer term residents tend to view the landscape more as a resource while shorter term residents tend to focus on the imagine, rural idyll associated with escaping from cities [69-73]. Length of residence may also be tied to ownership in the sense that those who own homes typically also own large parcels of farmland and thus may see the landscape as a place for production and not for aesthetic or natural beauty [89,90]. This idea has relevance to the concept of place identity as described by Devine-Wright and Howes [74] wherein the value one places on home and the attachments they have to that place influence their response to and feelings towards technological developments. In order to investigate this further, future work should focus on variables like land size, occupation, and even novel ways to represent one’s perception of the landscape and/or place attachment to it.
In teasing out the conditions under which real estate prices are perceived to be lowered, our multivariate analyses suggest that a complex set of factors is likely responsible. In our final regression model, wind turbines being visually unappealing, perceived negative health effects from turbines, number of years living in the community, and community itself all increased the likelihood of someone perceiving property value loss. Comparing means using t-tests also suggest that so-called newcomers (moved to area 10 years ago or less) are more likely to perceive property value loss than those have been local residents for longer. Though this type of relationship is increasingly being seen in the facility siting literature [69,77] our findings indicate that newcomer/old-timer divide is also potentially associated with property values. This relationship merits further investigation across various developments or projects-particularly those in the rural context.
Qualitative results also provided important insight into the issue of turbines and property values. A minority of Port Burwell residents expressed that it was the act of complaining itself that was causing local real estate value losses. This finding has some resemblance to work in Australia, where researchers found that levels of activism were associated with negative health outcomes [91,92]. Their key idea is that disease (i.e. reported sickness) from turbines is ‘communicated’ through growing opposition and “florid allegations” [91]. In our work, participants seem to share this sentiment- suggesting that if people would only keep quiet, everything would be fine. We worry that interpreting such findings in this way both inappropriately blames the victim while simultaneously suggesting that turbine concerns should be summarily silenced for the good of all.
We were somewhat surprised to find that while visual aesthetics predicted property values, noise problems from wind turbines were not associated with perceived property value loss. Usually coupled alongside visual disturbances, the two factors have long been prominent in the wind turbine literature as the driving forces behind opposition [77,93,94,96]. Noise is nevertheless implied in the perceived health impacts variable and it may be that interaction effects need to be teased out.
Yet another surprise of this work is that perceived property value loss differs significantly in two communities literally next door to each other. In our related work, we outline how the spatial juxtaposition of turbines relative to the closest homes may partially explain this effect. Essentially in Clear Creek, where property value losses are more keenly felt, the turbines are closer to and more clustered around homes than in Port Burwell while at the same time the turbines are larger in Clear Creek [77].

437
AIMS Energy Volume 2, Issue 4, 424-442.
A limitation of this research is that the survey did not provide the opportunity for residents to specifically indicate if they actually believed property values have risen due to the turbines. Participants were only given the opportunity to disagree with questions relating to loss of property value—although through the interview portion of the research only one person we spoke with claimed values to have increased. Nonetheless, future work should better allow for this kind of possibility. Another limitation related to the quantitative data set is the relatively low heterogeneity for certain variables. For instance, there were only six and eight responses indicating a person had a turbine on their land or was a renter, respectively.
Our study offers some helpful suggestions for both policy-makers and developers alike. Especially in the Ontario context, our work shows that perceived health effects from turbines can affect reported property value loss. Though Health Canada’s much anticipated study recently stated that turbine noise does not affect health, many anti-wind groups do not accept the results and thus turbine–health linkages may continue to add to anxieties over property values [16,96]. We again caution that our findings not be used as an excuse to ‘blame the victim’. Our previous work suggested that those who report health effects are also more likely to perceive conflict or negative social relations to do with turbine development and this study extends that relationship to include real estate value. The direction of the relationship between the two variables is still unclear however. While it is plausible that perceived turbine-induced health problems lead to a decreased appreciation of one’s home or property, it could also be the case that lower property values may be leading to negative psychosocial health issues.
This paper suggests that rather than focus solely on large scale aggregate studies alone, developers and policy makers need to understand the micro-scale impacts of turbines and social dynamics of communities when assessing what to do about reported property value impacts. The how and why of selling at a loss is as important as knowing how many people are actually doing it. Property value losses may not simply be “perceived”, but instead rooted in very real differences in the spatial juxtaposition and cumulative impacts of local clusters of turbines. It is tempting to point to the average lack of property value loss in a large national study to dismiss what may be “real” losses worthy of mitigation attention at the local level. Since it is difficult to separate “real” from felt losses when it comes to asking and selling prices, local stakeholders might further consider ways to engage in dialogue to socially maximize property values while at the same time respecting the right of concerned citizens to express their views.
Acknowledgements
The authors would like to thank all residents of Port Burwell and Clear Creek, Ontario who took part in this research. We are also grateful for all the support we received from past and present colleagues of the Environmental Health and Hazards Lab. This research was funded by Western University.
Conflict of Interest
All authors declare no conflicts of interest in this paper.
438
AIMS Energy Volume 2, Issue 4, 424-442.
References
1. United States Department of Energy, 2012 Renewable Energy Data Book. 2013. Available from: http://www.nrel.gov/docs/fy14osti/60197.pdf.
2. CANWEA, Wind by the numbers in Ontario. Canadian Wind Energy Association, 2014. Available from: http://canwea.ca/wind-energy/ontario/.
3. OSEA, A Green Energy Act for Ontario: Executive Summary. Ontario Sustainable Energy Association, 2009. Available from: http://www.ontario-sea.org/Storage/27/1890_GEA_ExecSum_Jan-09-09_print.pdf.
4. IESO, Energy Output By Fuel Type. Independent Energy System Operator, 2014. Available from: http://ieso-public.sharepoint.com/Pages/Power-Data/Supply.aspx.
5. Government of Ontario, Electricity prices are changing. Find out why. 2011. Available from: http://www.veridian.on.ca/pdf/newsletter_energy-plan_feb-2011.pdf.
6. Deignan B, Harvey E, Hoffman-Goetz L (2013) Fright factors about wind turbines and health in Ontario newspapers before and after the Green Energy Act. Health Risk Soc 15: 234-250.
7. Knopper LD, Ollson CA (2011) Health effects and wind turbines: A review of the literature. Environ Health 10: 78.
8. Watson I, Betts S, Rapaport E (2012) Determining appropriate wind turbine setback distances: Perspectives from municipal planners in the Canadian provinces of Nova Scotia, Ontario, and Quebec. Energ Policy 41: 782-789.
9. Stats Canada, Population, urban and rural by province and territory. 2011. Available from: http://www.statcan.gc.ca/tables-tableaux/sum-som/l01/cst01/demo62g-eng.htm.
10. OWR, Setbacks. Ontario Wind Resistance. 2014. Available from: http://ontario-wind-resistance.org/setbacks/.
11. Heintzelman MD, Tuttle CM (2012) Values in the wind: A hedonic analysis of wind power facilities. Land Econ 88: 571-588.
12. Hoen B, Wiser R, Cappers P, et al. (2011) Wind energy facilities and residential properties: the effect of proximity and view on sales prices. J Real Estate Res 33: 279-316.
13. Krogh C, Gillis L, Kouwen N, et al. (2011) WindVOiCe, a self-reporting survey: adverse health effects, industrial wind turbines, and the need for vigilance monitoring. Bulletin Sci Technol Soc 31: 334-345.
14. McMurtry RY (2011) Toward a case definition of adverse health effects in the environs of industrial wind turbines: facilitating a clinical diagnosis. Bulletin Sci Technol Soc 31: 316-320.
15. Songsore E, Buzzelli M (2014) Social responses to wind energy development in Ontario: The influence of health risk perceptions and associated concerns. Energ Policy 69: 285-296.
16. Walker C, Baxter J, Ouellette D (2014) Adding insult to injury: The development of psychosocial stress in Ontario wind turbine communities. Soc Sci Med [Epub ahead of print].
17. Gibbons S, Gone with the Wind: Valuing the Visual Impacts of Wind Turbines through House Prices (No. 0159). Spatial Economics Research Centre, LSE, 2014. Available from: http://eprints.lse.ac.uk/58422/.
18. Municipal Property Assessment Corporation, Impact of Industrial Wind Turbines on Residential Property Assessment in Ontario. 2012. Available from: http://www.mpac.ca/pdf/ReportWindTurbines.pdf.
19. Hoen B, The impact of wind power projects on residential property values in the United States: A multi-site hedonic analysis. Lawrence Berkeley National Laboratory, 2010. Available from: http://emp.lbl.gov/sites/all/files/PRESENTATION%20lbnl-2829e.pdf.
439
AIMS Energy Volume 2, Issue 4, 424-442.
20. Mulvaney KK, Woodson P, Prokopy LS (2013) A tale of three counties: Understanding wind development in the rural Midwestern United States. Energ Policy 56: 322-330.
21. Jordal-Jorgensen J, Social Assessment of Wind Power: Visual Effect and Noise from Windmills-Quantifying and Valuation. AKF-Institute of Local Government Studies, Denmark, 1996. Available from: http://www.akf/dk/eng/wind0.htm.
22. Farber S (1998) Undesirable facilities and property values: a summary of empirical studies. Ecol Econ 24: 1-14.
23. Van der Horst D (2007) NIMBY or not? Exploring the relevance of location and the politics of voiced opinions in renewable energy siting controversies. Energ policy 35: 2705-2714.
24. Atkinson-Palombo C, Hoen B, Relationship between Wind Turbines and Residential Property Values in Massachusetts. University of Connecticut and Lawrence Berkeley National Laboratory, 2014. Available from: http://emp.lbl.gov/sites/all/files/lbnl-6371e_0.pdf.
25. Hoen B, Brown JP, Jackson T, et al. (2014) Spatial Hedonic Analysis of the Effects of US Wind Energy Facilities on Surrounding Property Values. J Real Estate Finan Econ 1-30.
26. Vyn RJ, McCullough RM (2014) The Effects of Wind Turbines on Property Values in Ontario: Does Public Perception Match Empirical Evidence?. Can J Agr Econ 62: 365-392.
27. Sterzinger G, The effect of wind development on local property values. Renewable Energy Policy Project, 2003. Available from: http://dekalbcounty.org/PlanningZoningBuilding/FPL/Exhibit%20F%20%28part%205%29.pdf.
28. Poletti P (2005) A Real Estate Study of the Proposed White Oak Wind Energy Center Dodge and Fond Du Lac Counties, Wisconsin. Poletti and Associates. Prepared for Invenergy Wind LLC.
29. Sims S, Dent P (2007) Property stigma wind farms are just the latest fashion, J Property Investment & Finance 25: 626-651.
30. Lang C, Opaluch JJ, Sfinarolakis G (2014) The Windy City: Property Value Impacts of Wind Turbines in an Urban Setting. Energ Econ 44: 413-421.
31. Stone A, Bachrach C, Jobe J, et al. (1999). The science of self-report: Implications for research and practice. Psychology Press.
32. Bond S (2008) Attitudes towards the development of wind farms in Australia. Environ Health 8: 19.
33. Baxter J, Morzaria R, Hirsch R (2013) A case-control study of support/opposition to wind turbines: Perceptions of health risk, economic benefits, and community conflict. Energ Policy 61: 931-943.
34. Haughton J, Giuffre D, Barrett J, et al., An Economic Analysis of a Wind Farm in Nantucket Sound. Beacon Hill Institute at Suffolk University, 2004. Available from: http://www.beaconhill.org/BHIStudies/Windmills2004/WindFarmArmyCorps.pdf.
35. Kielisch K (2009) Wind Turbine Impact Study: Dodge and Fond Du Lac Counties, WI. Appraisal Group One. Prepared for Calumet County Citizens for Responsible Energy (CCCRE), Calumet County, WI.
36. Khatri M (2004) RICS Wind Farm Research: Impact of Wind Farms on the Value of Residential Property and Agricultural Land. Prepared for Royal Institute of Chartered Surveyors. London, UK.
37. Goldman JC (2006) A Study in the Impact of Windmills on Property Values in Tucker County, West Virginia for the Proposed Beech Ridge Energy, L.L.C. project in Greenbrier County, West Virginia. Goldman Associates Inc. Prepared for Spilman Thomas & Battle, P.L.L.C., Charleston, WV. 51 pages. West Virginia Case No. 05-1590-E-CS.

440
AIMS Energy Volume 2, Issue 4, 424-442.
38. Grover D, Economic Impacts of Wind Power in Kittitas County, WA. ECONorthwest, Prepared for Phoenix Economic Development Group, 2002. Available from: http://www.efsec.wa.gov/kittitaswind/adj/prefiled/edg/80-2.pdf.
39. Eilperin J, Climate Skeptic Group Works to Reverse Renewable Energy Mandates. The Washington Post, 2012. Available from: http://www.washingtonpost.com/national/health-science/climate-skeptic-group-works-to-reverse-renewable-energy-mandates/2012/11/24/124faaa0-3517-11e2-9cfa-e41bac906cc9_story.html.
40. Mistler S, Skeptics Blast Study Making Energy Claims. The Portland Press Herald, 2012. Available from: http://www.pressherald.com/2012/11/26/skeptics-blast-study-making-energy-claims_2012-11-27/
41. Nissenbaum M, Aramini J, Hanning C (2012) Effects of industrial wind turbine noise on sleep and health. Noise Health 14: 237-243.
42. Lansink B, Case Studies: Diminution/Change in Price. Lansink Appraisals and Consulting, 2013. Availabe from: http://www.lansinkappraisals.com/downloads/CaseStudy_DiminutionInValue_InjuriousAffection_WindTurbines.pdf.
43. Baxter J (2009) A quantitative assessment of the insider/outsider dimension of the cultural theory of risk and place. J Risk Res 12: 771-791.
44. Hill SD, Knott JD (2010) Too close for comfort: Social controversies surrounding wind farm noise setback policies in Ontario. Renewable Energy Law & Policy Rev. 153.
45. Kasperson RE, Renn O, Slovic P, et al. (1988) The social amplification of risk: A conceptual framework. Risk Anal 8:177-187.
46. Bosley P, Bosley K (1988) Public acceptability of California’s wind energy developments: three studies. Wind Eng 12: 311-318.
47. Gipe P (1995) Wind energy comes of age (Vol. 4). John Wiley & Sons. 48. Sims S, Dent P, Oskrochi G (2008) Modelling the impact of wind farms on house prices in the
UK. Int J Strategic Property Manage 12: 251-269. 49. Giorgi AP, Giorgi B (2008) Phenomenological psychology. The SAGE handbook of qualitative
research in psychology, 165-179. 50. Pollio HR, Thompson CJ (1997) The phenomenology of everyday life: Empirical investigations
of human experience. Cambridge University Press. 51. Saunders P (1989) The meaning of ‘home’in contemporary English culture. Housing Stud 4:
177-192. 52. Saunders P (1986) Social Theory and the Urban Question. London: Hutchinson. 53. Saunders P (1984) Beyond housing classes: the sociological significance of private property
rights in means of consumption. Int J Urban Regional Res 8: 202-227. 54. Dupuis A, Thorns D (1998) Home, Home Ownership and the Search for Ontological Security.
Sociological Rev 46: 24-47. 55. Dunn JR (2000) Housing and health inequalities: review and prospects for research. Housing
Stud 15: 341e366. 56. Howden-Chapman P (2004) Housing standards: a glossary of housing and health. J Epidemiol
Commun H 58: 162e168. 57. Kearns A, Hiscock R, Ellaway A, et al. (2000) ‘Beyond four walls’. The psycho-social benefits of
home: evidence from West Central Scotland. Housing Stud 15: 387e410. 58. Pevalin DJ, Taylor MP, Todd J (2008) The Dynamics of unhealthy housing in the UK: a panel
data analysis. Housing Stud 23: 679e695.
441
AIMS Energy Volume 2, Issue 4, 424-442.
59. Arku G, Luginaah I, Mkandawire P, et al. (2011) Housing and health in three contrasting neighbourhoods in Accra, Ghana. Soc Sci Med 72: 1864-1872.
60. Benjamin DN, Stea D, Arén E (1995) The Home: Words, Interpretations, Meanings and Environments. Avebury.
61. Ellaway A, Macintyre S (1998) Does housing tenure predict health in the UK because it exposes people to different levels of housing related hazards in the home or its surroundings? Health Place 4: 141-150.
62. Evans GW, Wells NM, Moch A (2003) Housing and mental health: A review of the evidence and a methodological and conceptual critique. J Soc Iss 59: 475-500.
63. Leavitt J, Loukaitou-Sideris A (1995) A Decent Home and a suitable environment-dilemmas of public-housing residents in Los Angeles. J Architect Plan Res 12: 221-239.
64. Luginaah I, Arku G, Baiden P (2010) Housing and health in Ghana: The psychosocial impacts of renting a home. Int J Environ Res Public Health 7: 528-545.
65. Mueller EJ, Tighe JR (2007) Making the case for affordable housing: Connecting housing with health and education outcomes. J Plan Literature 21: 371-385.
66. Nettleton S, Burrows R (1998) Mortgage debt, insecure home ownership and health: an exploratory analysis. Sociol Health Illness 20: 731-753.
67. Dunn JR (2002) Housing and inequalities in health: a study of socioeconomic dimensions of housing and self-reported health from a survey of Vancouver residents. J Epidemiol Commun H 56: 671-681.
68. Shaw M (2004) Housing and public health. Annu Rev Public Health 25: 397-418. 69. Eser SG, Luloff AE (2003) Community controversy over a proposed limestone quarry. Soc Nat
Resour 16: 793-806. 70. Krannich RS, Schreyer R, Cadez G (1988) Recreation impacts of western energy development.
Soc Nat Resour 1: 31-43. 71. Graber EE (1974) Newcomers and oldtimers: Growth and change in a mountain town. Rural
Sociol 39: 503-513. 72. Mason SA, Dixon J, Mambulu F, et al. (2014) Management challenges of urban biosolids:
narratives around facility siting in rural Ontario. J Environ Plan Manage [ahead-of-print] 1-21. 73. Smith MD, Krannich RS (2000) “Culture Clash” Revisited: Newcomer and Longer‐Term
Residents Attitudes Toward Land Use, Development, and Environmental Issues in Rural Communities in the Rocky Mountain West. Rural Sociol 65: 396-421.
74. Devine-Wright P, Howes Y (2010) Disruption to place attachment and the protection of restorative environments: A wind energy case study. J Environ Psychol 30: 271-280.
75. Charmaz K (2003) Grounded theory: Obejectivist and constructivist methods. In: Denzin N.K., Lincoln Y.S., Strategies of qualitative inquiry, 2 Eds., London: Sage Publications, 249-291.
76. Strauss A, Corbin J (1997) Grounded theory in practice. London: Sage Publications. 77. Walker C, Baxter J, Ouellette D (2014) Beyond rhetoric to understanding determinants of wind
turbine support and conflict in two Ontario, Canada communities. Environ Plan A 46: 730-745. 78. Browne K (2005) Snowball sampling: using social networks to research non‐heterosexual
women. Int J Soc Res Meth 8: 47-60. 79. Heckathorn DD (2002) Respondent-driven sampling II: deriving valid population estimates from
chain-referral samples of hidden populations. Soc Probs 49: 11. 80. Noy C (2008) Sampling knowledge: The hermeneutics of snowball sampling in qualitative
research. Int J Soc Res Meth 11: 327-344.

442
AIMS Energy Volume 2, Issue 4, 424-442.
81. Cutter SL (1993) Living with risk: the geography of technological hazards. London: Edward Arnold, 214.
82. Gross C (2007) Community perspectives of wind energy in Australia: The application of a justice and community fairness framework to increase social acceptance. Energ Policy 35: 2727-2736.
83. Cowell R, Bristow G, Munday M (2011) Acceptance, acceptability and environmental justice: the role of community benefits in wind energy development. J Environ Plan Manage 54: 539-557.
84. Devine‐Wright P (2005) Beyond NIMBYism: towards an integrated framework for understanding public perceptions of wind energy. Wind Energ 8: 125-139.
85. Thomas W, Thomas D (1928) The Child in America: Behavior Problems and Progress. New York: Knopf.
86. Palmquist RB (1992) Valuing localized externalities. J Urban Econ 31: 59-68. 87. Fiorino DJ (1990) Citizen participation and environmental risk: A survey of institutional
mechanisms. Sci Technol Hum Value 15: 226-243. 88. Renn O (1998) Three decades of risk research: accomplishments and new challenges. J Risk Res
1: 49-71. 89. Short L (2002) Wind power and English landscape identity. In: Pasqualetti M., Gipe P., Righter
R., Wind power in view: Energy landscapes in a crowded world, New York: Academic Press, 43-58.
90. Woods M (2003) Conflicting environmental visions of the rural: windfarm development in Mid Wales. Sociologia Ruralis 43: 271-288.
91. Chapman S, George AS, Waller K, et al. (2013) The pattern of complaints about Australian wind farms does not match the establishment and distribution of turbines: Support for the psychogenic, ‘communicated disease’ hypothesis. PloS One 8: e76584.
92. Chapman S (2012) The sickening truth about wind farm syndrome. New Sci 216: 26-27. 93. Krohn S, Damborg S (1999) On public attitudes towards wind power. Renew Energ 16: 954-960. 94. Johansson M, Laike T (2007) Intention to respond to local wind turbines: the role of attitudes and
visual perception. Wind Energ 10: 435-451. 95. Jones CR, Eiser JR (2010) Understanding ‘local’ opposition to wind development in the UK:
How big is a backyard?. Energ Policy 38: 3106-3117. 96. Health Canada. Health Canada Wind Turbine Noise and Health Study Design Consultation.
Environmental and Workplace Health. Government of Canada, 2013. Available from: http://www.hc-sc.gc.ca/ewh-semt/consult/_2013/wind_turbine-eoliennes/index-eng.php.
@2014, Chad Walker, et al., licensee AIMS Press. This is an open access article distributed under the terms of the Creative Commons Attribution License (http://creativecommons.org/licenses/by/4.0)