Embed Size (px)
Citation preview
Box 534Kirkland Lake, OntanoP2N 3J5(705)567-4838 (Home) (705)568-3154 (Work)
LOCATION AND ACCESS
32D04SW2024 2.20482 BOSTON 010
2. 20482
/^of Kirkland Lake. These 9 claim ^J^^^^S of the Adams Mine They are situated approximately 1500 immediately w me highway 66
TSoeuyth Pit (iron ore) in ^j^ J^ Hwy. f west out of Kirkland Lake to h9hw^112hea ding ^ ^east to just west of the gates to a^^^ a// Or along the transmission line using a4-wheeler north f^^^^^n?^ L property and can
RECEIVED
AUG 1 1 2000
GEOSCIENCE ASSESSMENT OFFICE
PREVIOUS WORK
pre-1947-nopublicly available information; ancient trenching1947-Ontario Dept. of Mines releases "Geology of Boston Township and Part of PacaudTownship1951-Dominion Gulf Company acquires property; undertook geologic andmagnetometer surveys1964-1982-Marshall Boston Iron Mines Ltd.; preliminary mag., electro-mag, geologysurveys * stripping A trenching locally (1964-1968); geochem survey, trenching,mapping, geophysical work, and drilling earned out in 1997 on parts of the Suttonproperty; Radem VLF-EM survey * Max-Min survey carried out on neighbouring claimsto the immediate northeast with diamond drilling1979-O.G.S. Airborne Electromagnetic Survey of Boston Twp. (map P2270)
The Sutton property only had one good episode of exploration- in 1971. No modern geophysics has been carried out. Only one of the claim units had geochem done on the
.soils, (see .plan*?).Y
-1
REGIONAL S LOCAL GEOLOGY
The geology of Boston Township is described in a report by K.D.Lawton, Ont. Dept. of Mines, Vol.LXVI, Part V, 1957. The following table gives the listing of the various formations in the Kirkland Lake area, with the oldest at the bottom being the predominant formation in the Boston Township immediate area. Members of the Keewatin series of early Precambrian Archean rocks are present, consisting of lava flows, volcanic fragmental units, and sedimentary rocks, all intruded by "Algoman" syenites. The strike of the formations is east-west but the regional structural strike is northeast-southwest, with the strongest fault being the Boston Creek-Long Lake fault.
On the Sutton property, iron formation with alternating layers of siliceous magnetite, and cherty quartzite, is common, as are rhyolitic tuffs. There are cherty tuffs, quartzites, tuffaceous sediments, and everything in between. Several north-south structures are found on the property (see plan #8). Intrusives are found primarily in the north and northeast part of the claims. ^
11
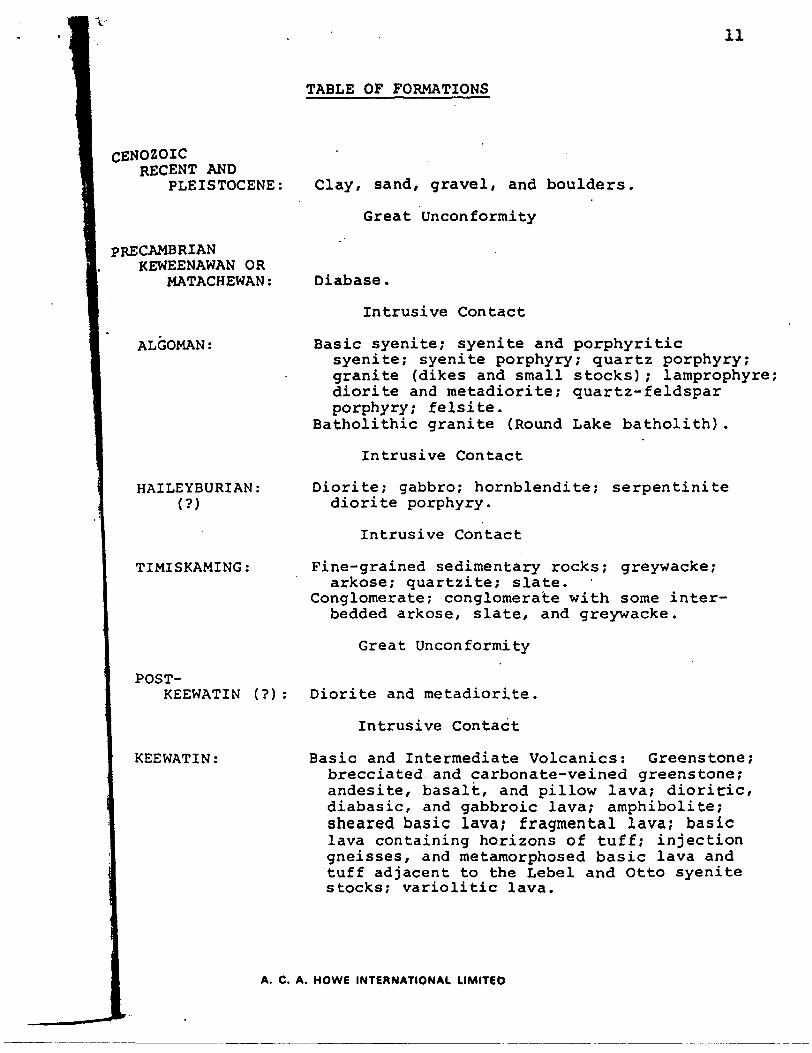
TABLE OF FORMATIONS
CENOZOICRECENT AND
PLEISTOCENE:
PRECAMBRIANKEWEENAWAN OR
MATACHEWAN:
ALGOMAN:
HAILEYBURIAN:
TIMISKAMING:
POST-KEEWATIN (?)
KEEWATIN:
Clay, sand, gravel, and boulders.
Great Unconformity
Diabase.
Intrusive Contact
Basic syenite; syenite and porphyriticsyenite; syenite porphyry; quartz porphyry;granite (dikes and small stocks); lamprophyre;diorite and metadiorite; quartz-feldsparporphyry; feIsi te.
Batholithic granite (Round Lake batholith).
Intrusive Contact
Diorite; gabbro; hornblendite; serpentinite diorite porphyry.
Intrusive Contact
Fine-grained sedimentary rocks; greywacke; arkose; quartzite; slate.
Conglomerate; conglomerate with some inter bedded arkose, slate, and greywacke.
Great Unconformity
Diorite and metadiorite.
Intrusive Contact
Basic and Intermediate Volcanics: Greenstone; brecciated and carbonate-veined greenstone; andesite, basalt, and pillow lava; dioritic, diabasic, and gabbroic lava; amphibolite; sheared basic lava; fragmental lava; basic lava containing horizons of tuff; injection gneisses, and metamorphosed basic lava and tuff adjacent to the Lebel and Otto syenite stocks; variolitic lava.
A. C. A. HOWE INTERNATIONAL LIMITED
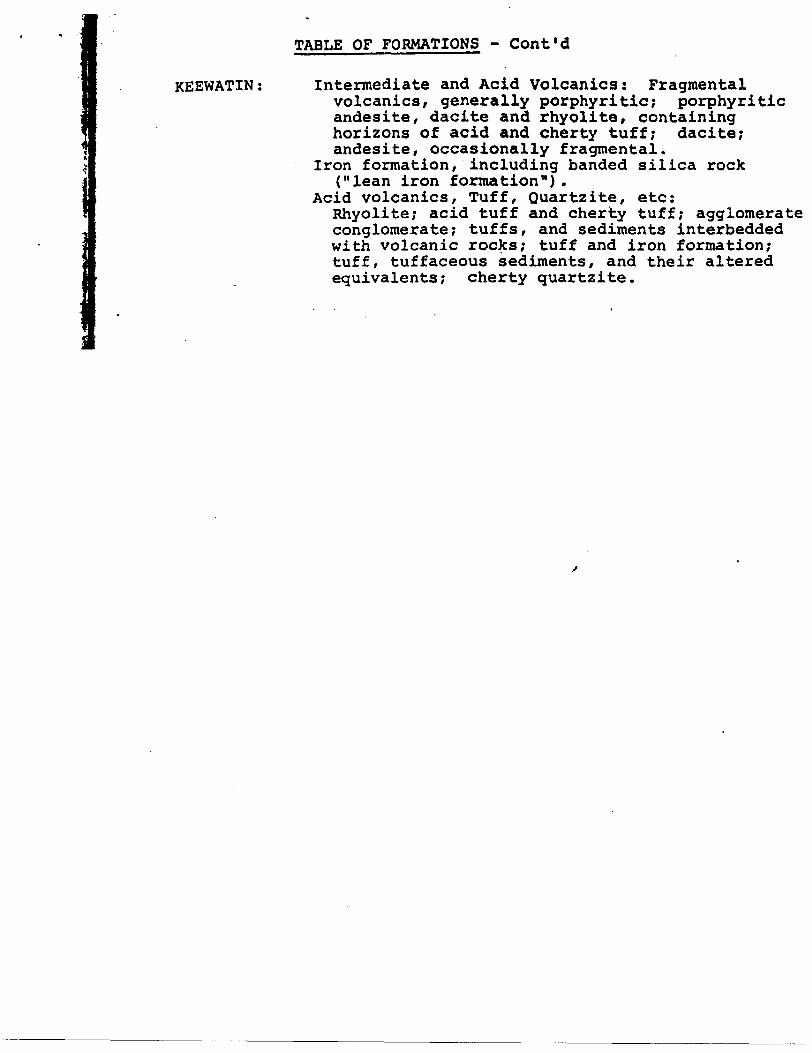
TABLE OF FORMATIONS - Cont'd
KEEWATIN: Intermediate and Acid Volcanics: Fragmental volcanics, generally porphyritic; porphyritic andesite, dacite and rhyolite, containing horizons of acid and cherty tuff; dacite; andesite, occasionally fragmental.
Iron formation, including banded silica rock ("lean iron formation").
Acid volcanics. Tuff, Quartzite, etc:Rhyolite; acid tuff and cherty tuff; agglomerate conglomerate; tuffs, and sediments interbedded with volcanic rocks; tuff and iron formation/ tuff, tuffaceous sediments, and their altered equivalents; cherty quartzite.
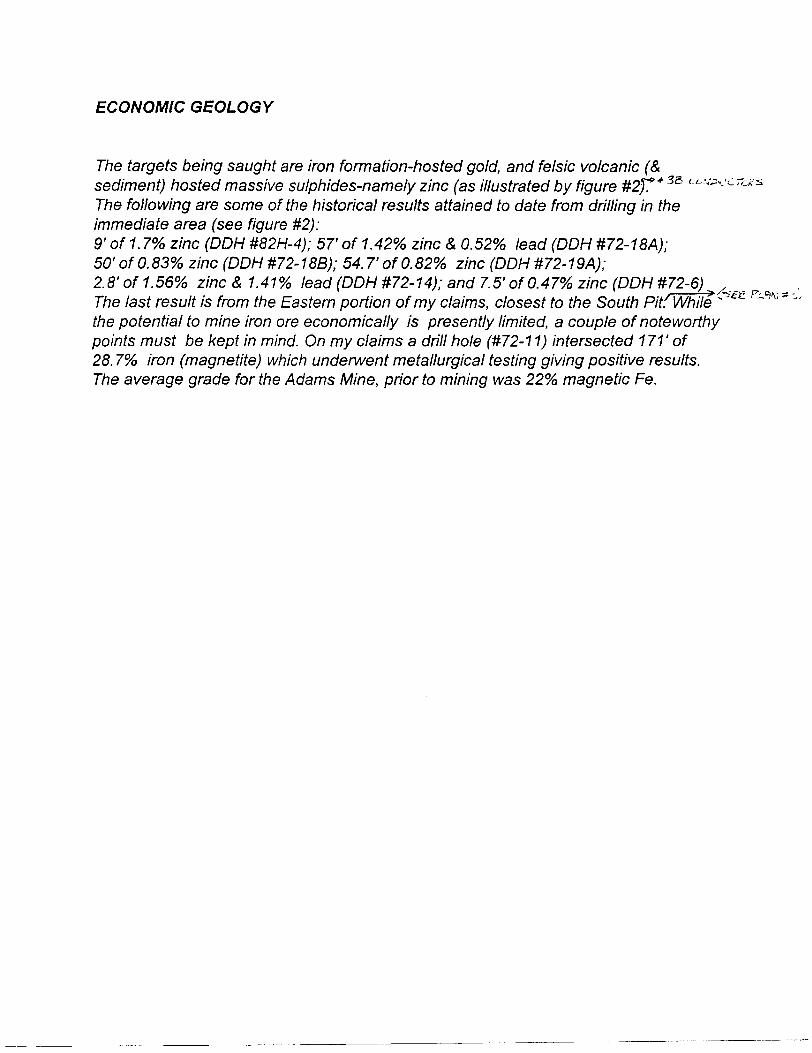
ECONOMIC GEOLOGY
The targets being saught are iron formation-hosted gold, and felsic volcanic (Stsediment) hosted massive sulphides-namely zinc (as illustrated by figure #2j** 3S l:^^-The following are some of the historical results attained to date from drilling in theimmediate area (see figure #2):9'of 1. 796 zinc (DDH #82H-4); 57'of 14296 zinc S 0.5296 lead (DDH #72-18A);SO'ofO.83% zinc (DDH#72-188); 54.7'of Q.82% zinc (DDH#72-19A);2.8' of 15696 zinc 8,1.41 07o lead (DDH #72-14); and 7.5' of Q.47% zinc (DDH #72-6)/—"-—r^'The last result is from the Eastern portion of my claims, closest to the South Pit: While " the potential to mine iron ore economically is presently limited, a couple of noteworthy points must be kept in mind. On my claims a drill hole (#72-11) intersected 171'of 28. 796 iron (magnetite) which underwent metallurgical testing giving positive results. The average grade for the Adams Mine, prior to mining was 2296 magnetic Fe.
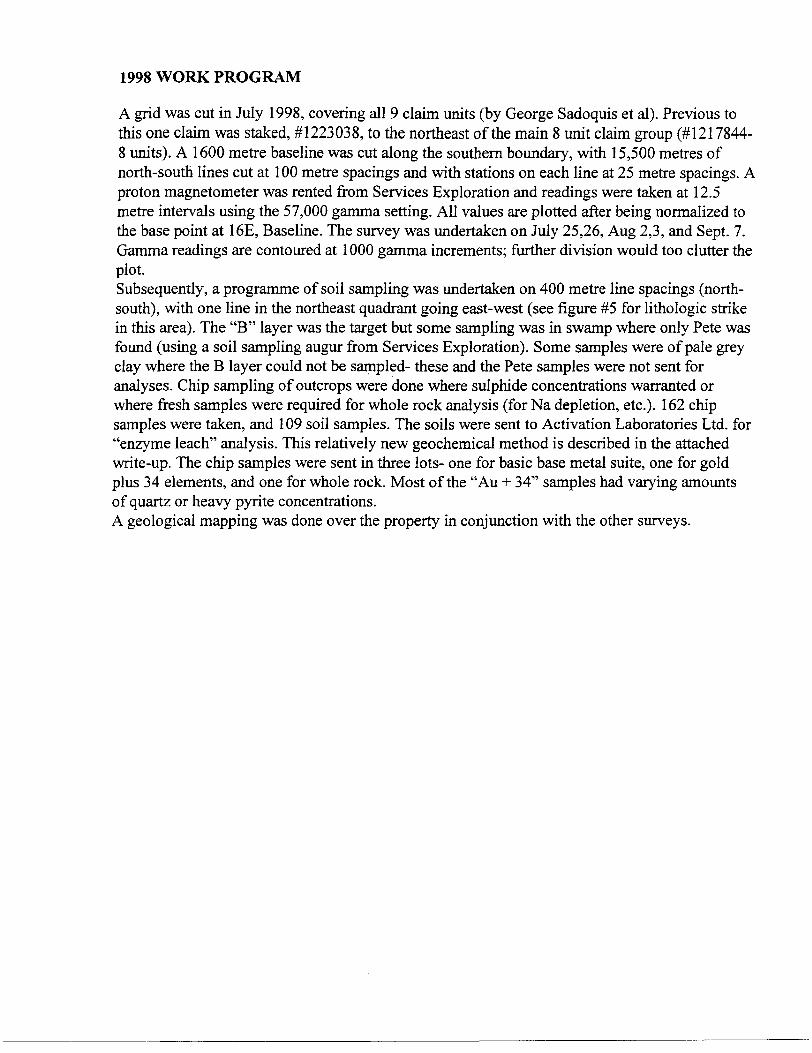
1998 WORK PROGRAM
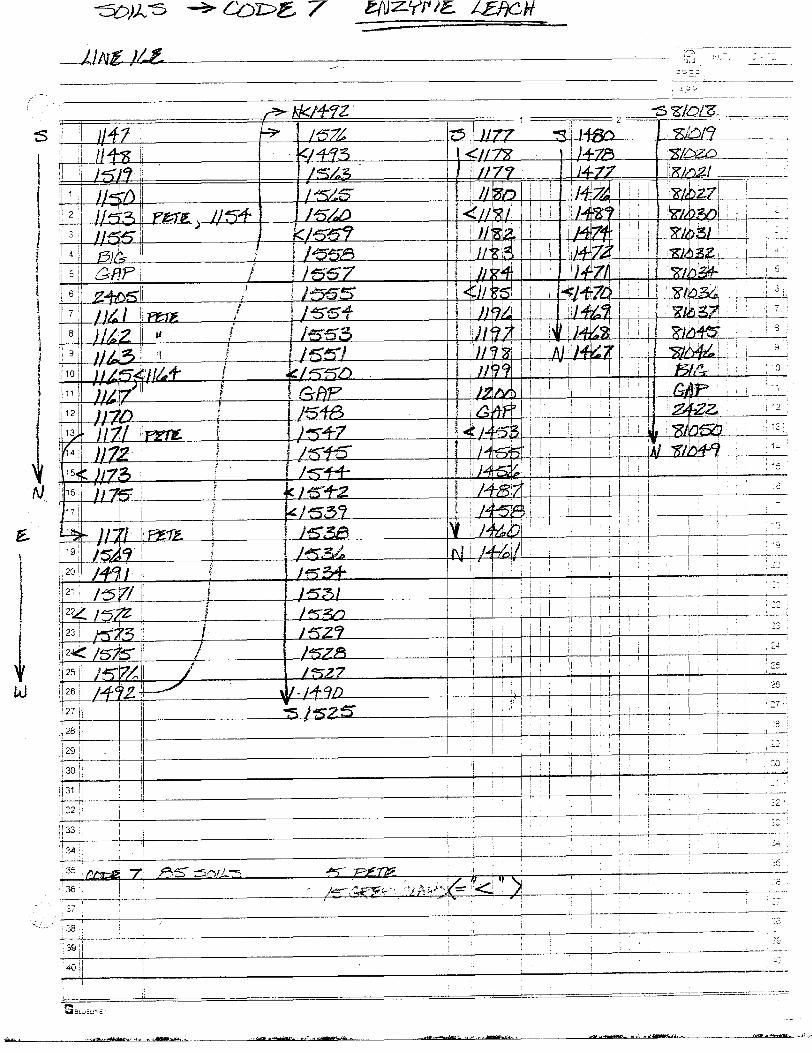
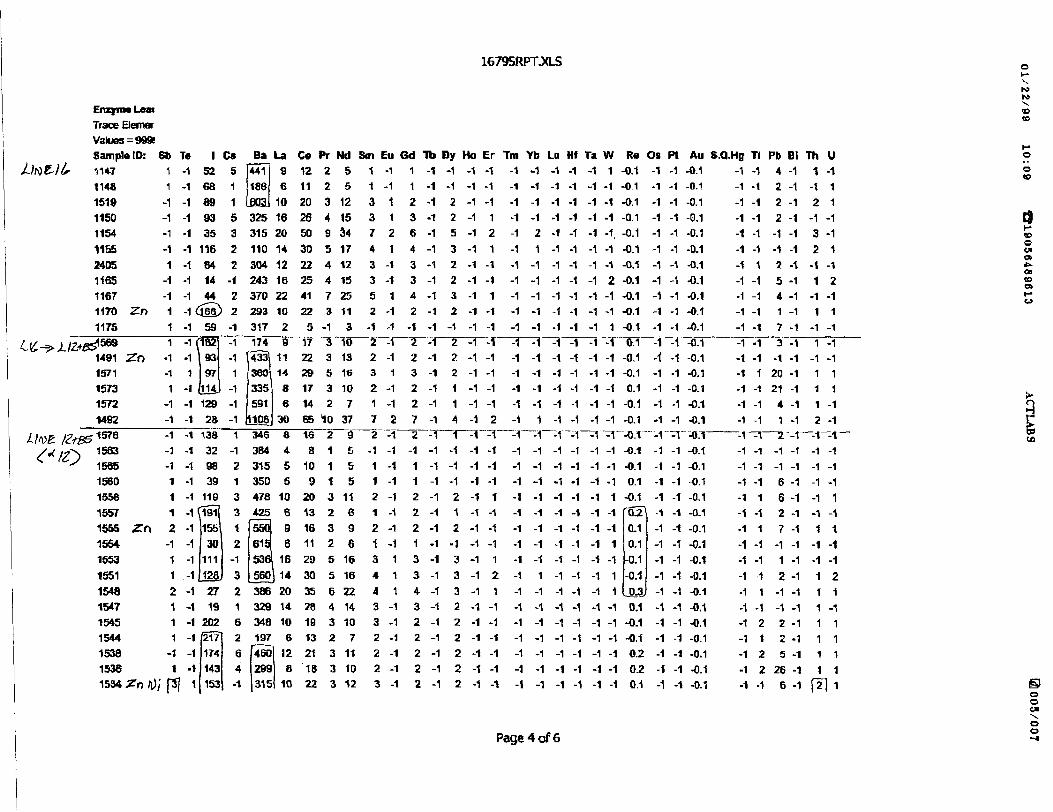
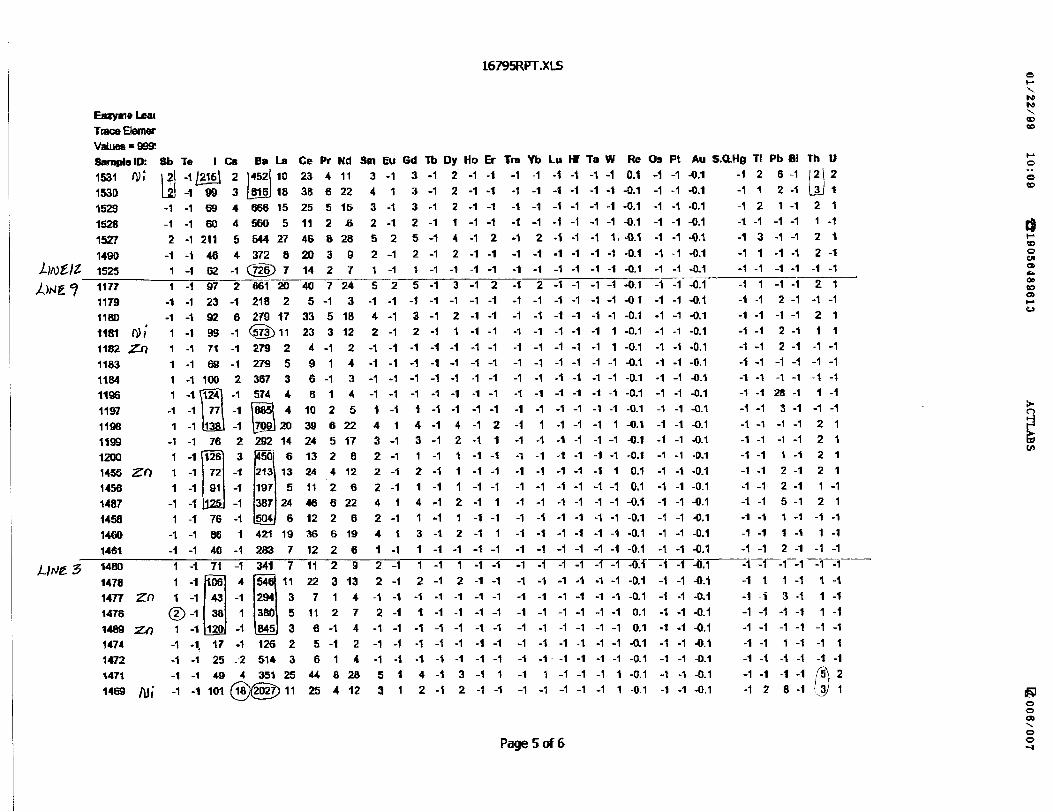
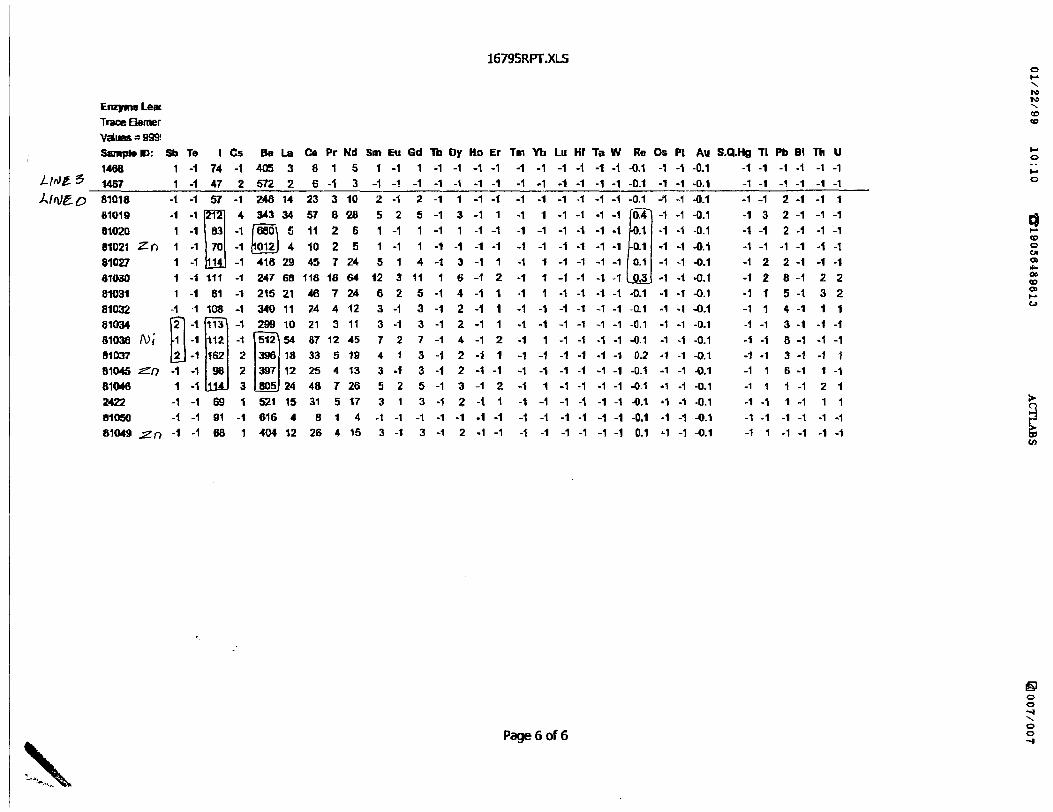
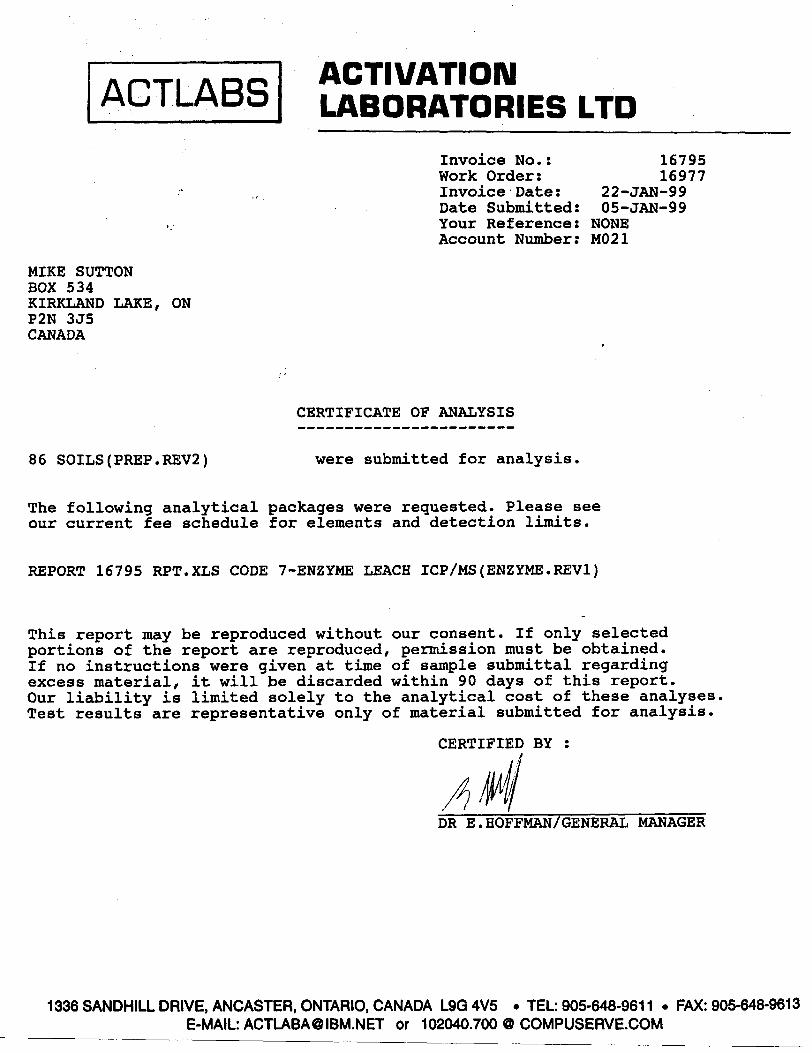
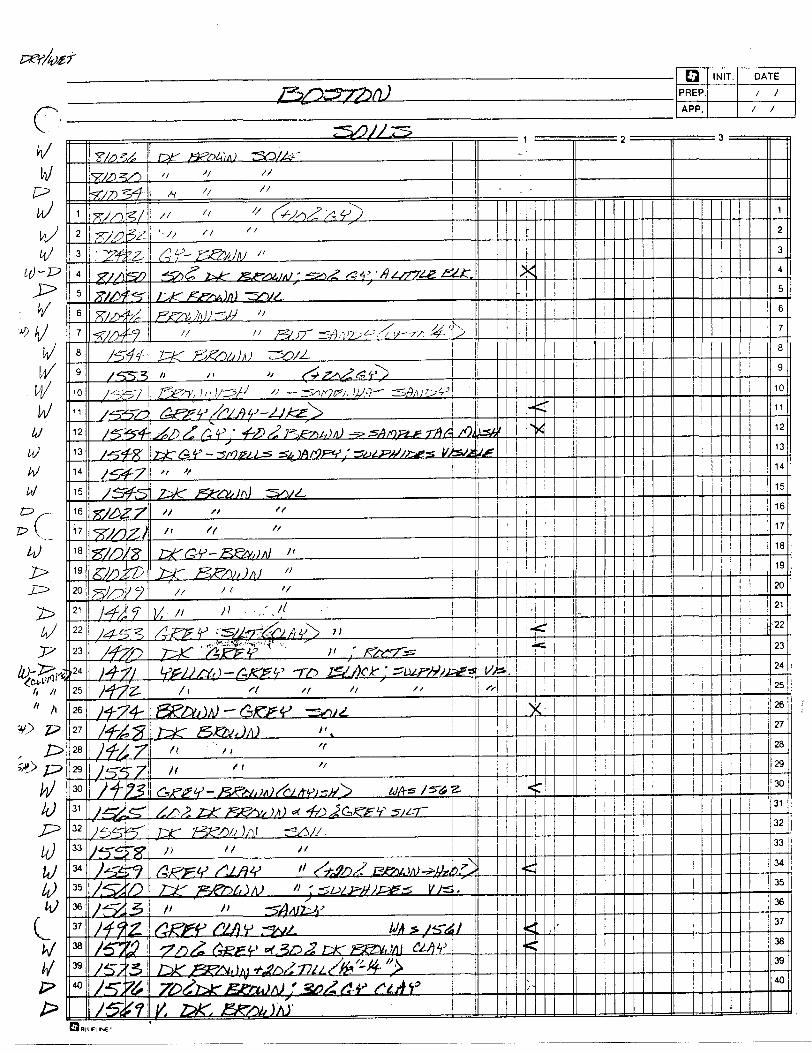
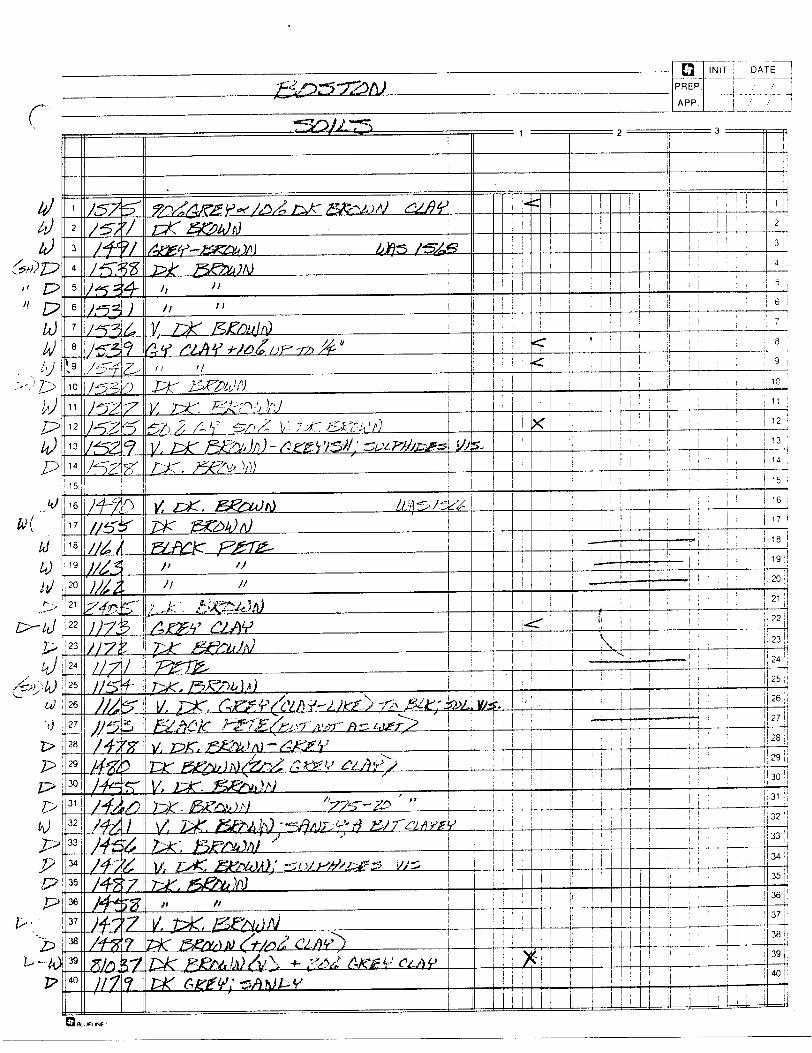
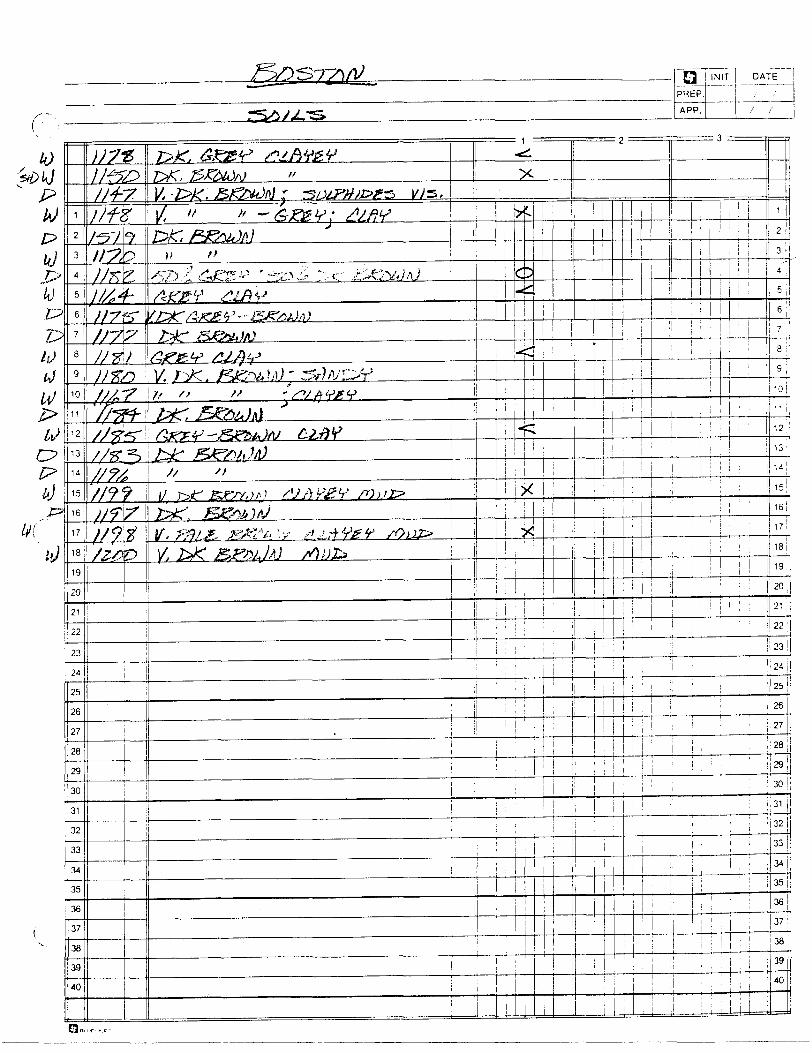
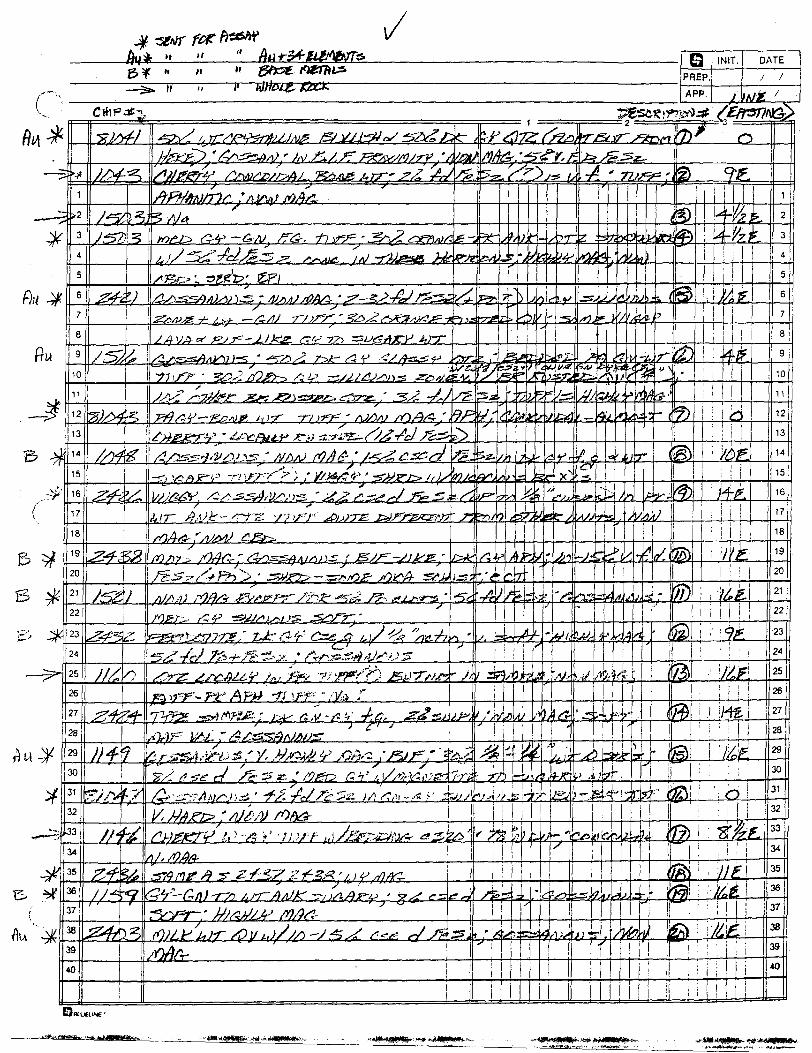
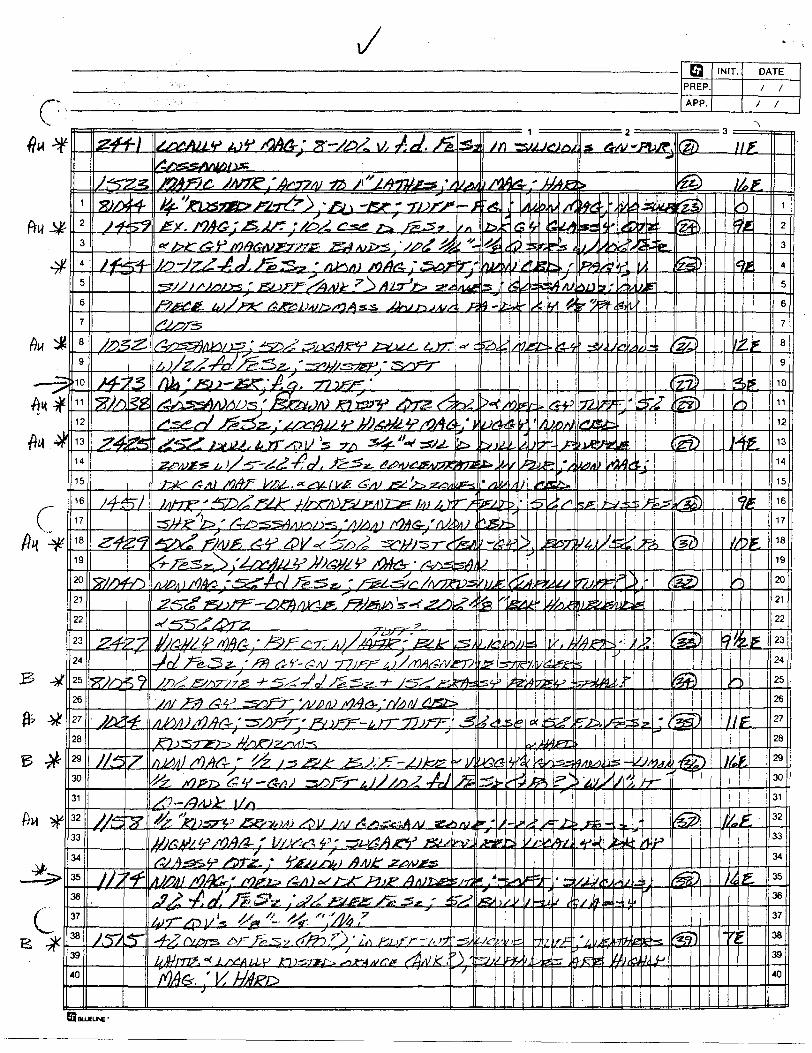
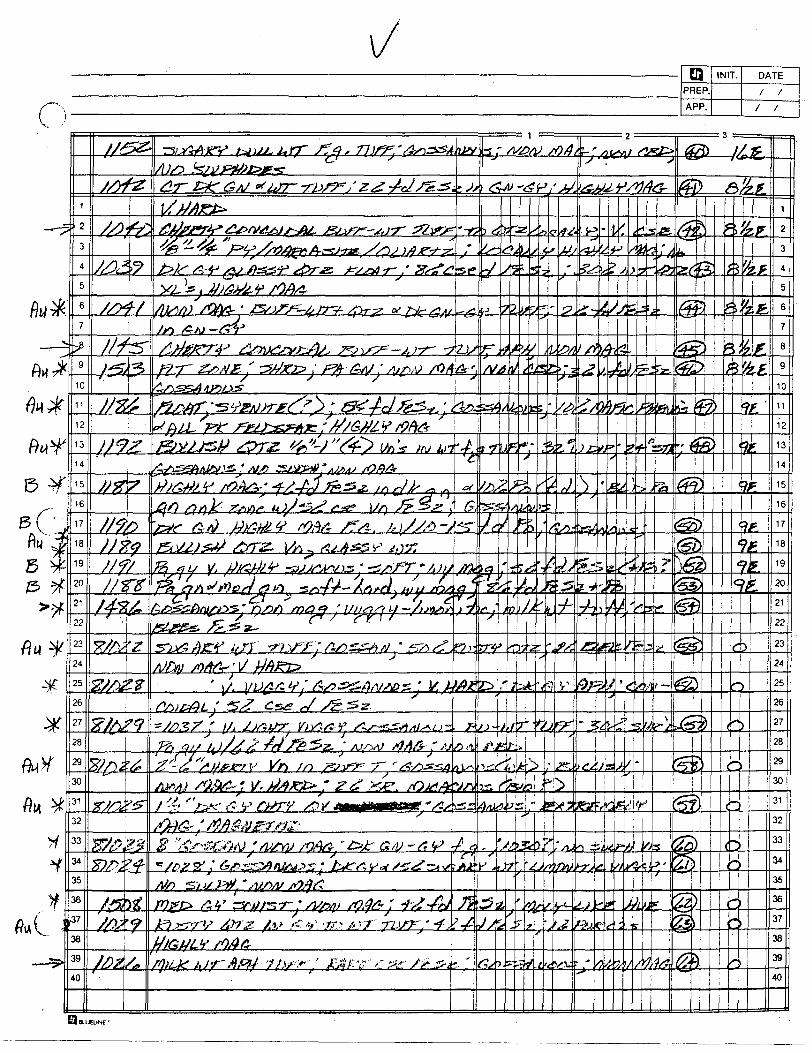
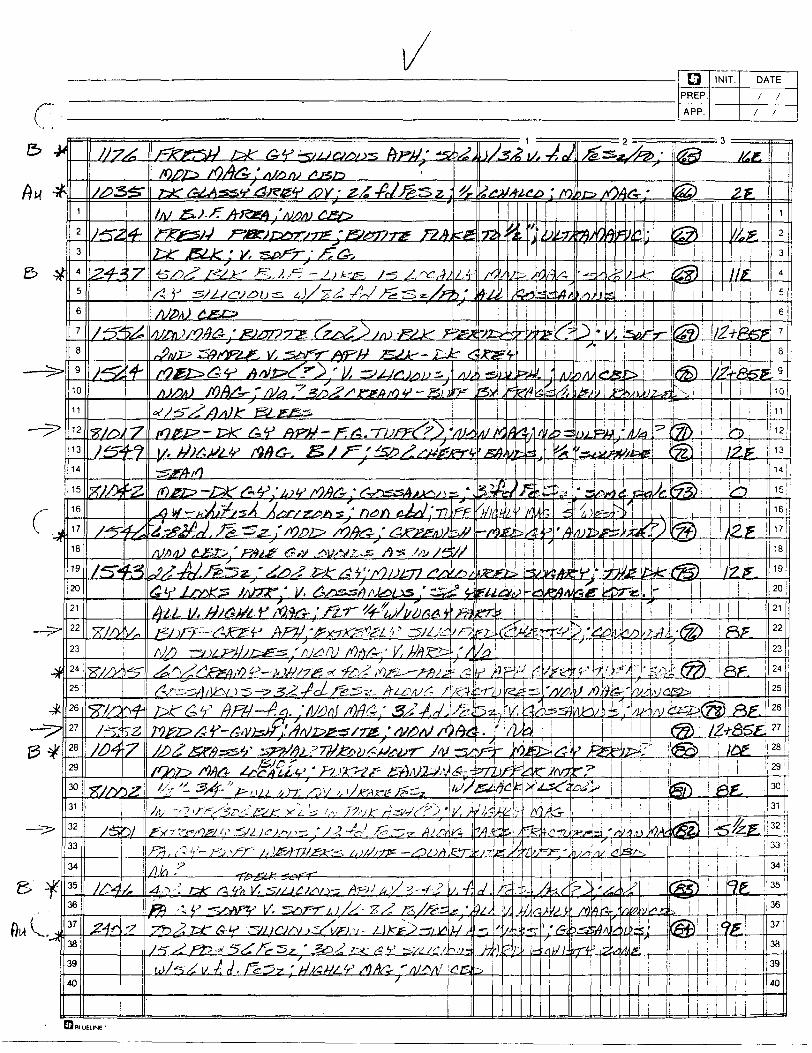
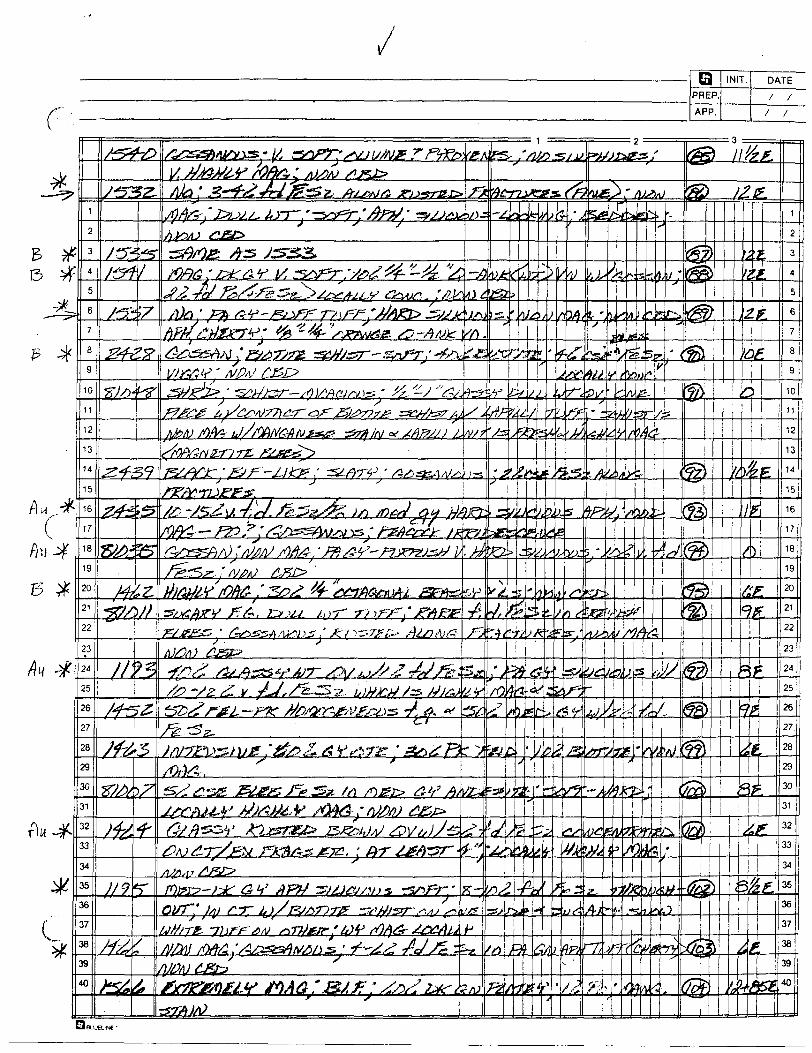
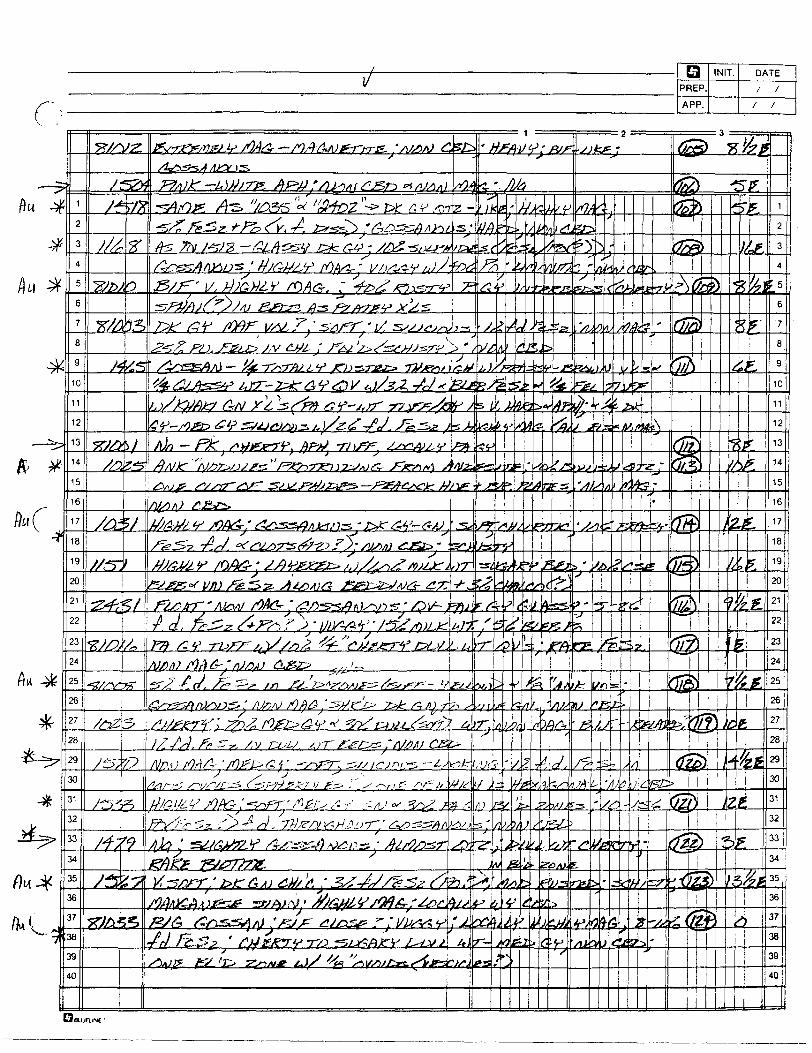
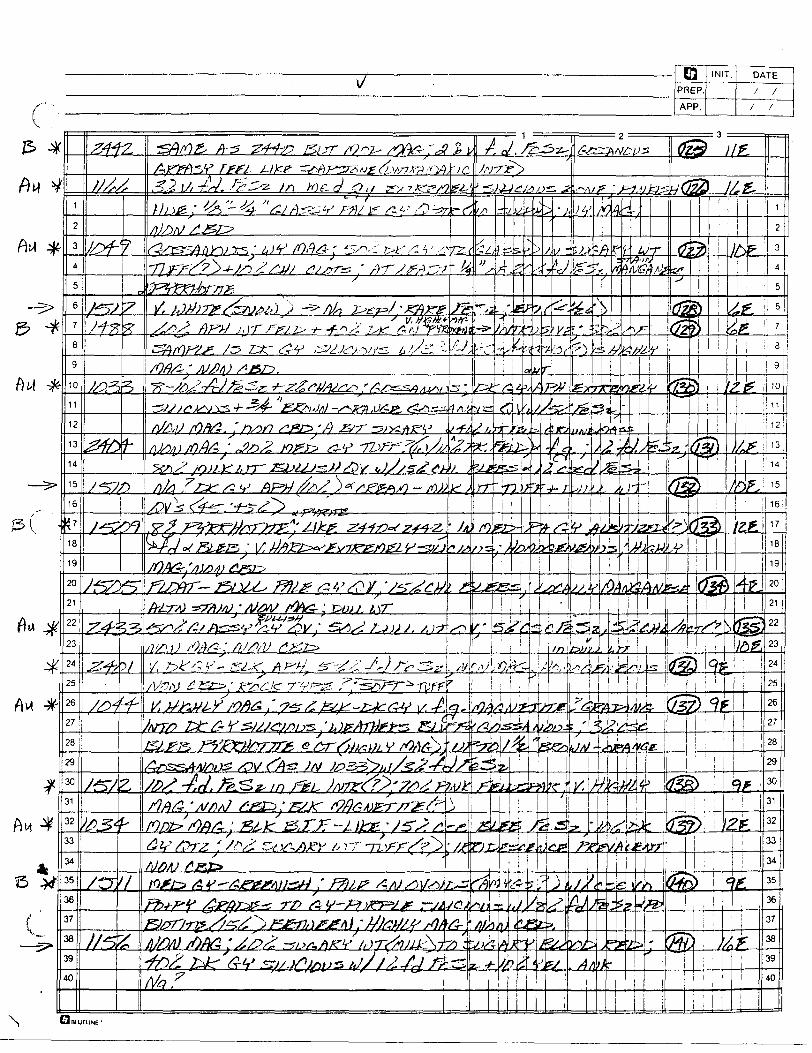
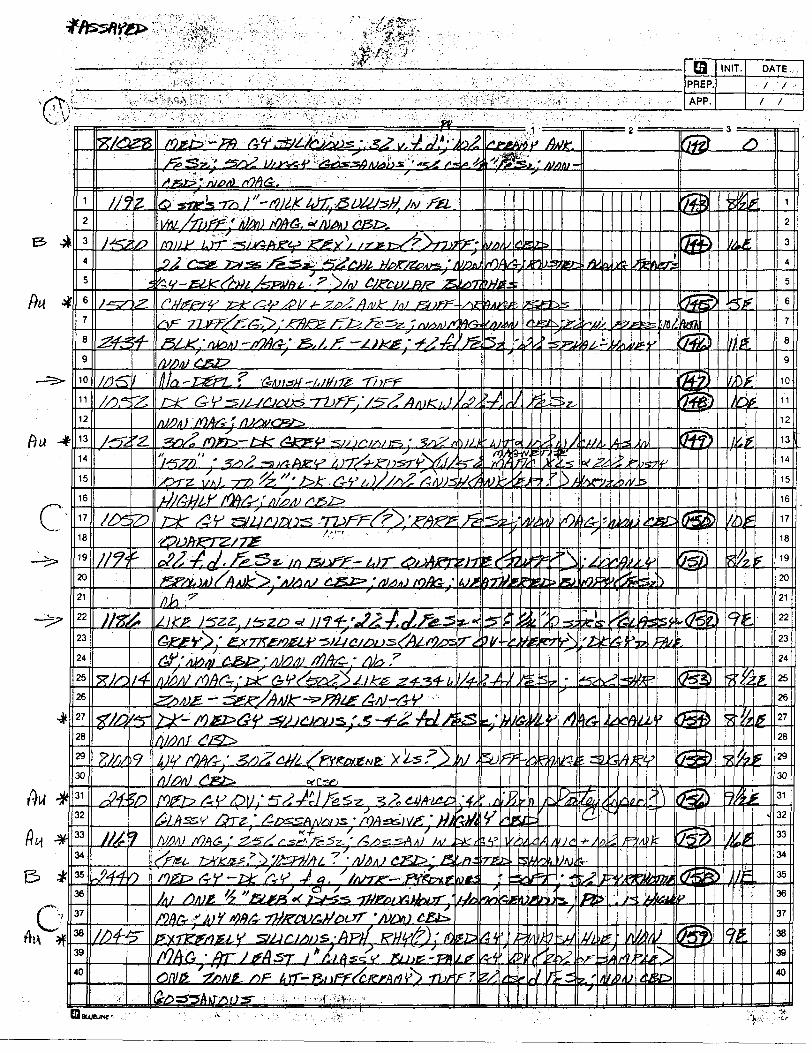
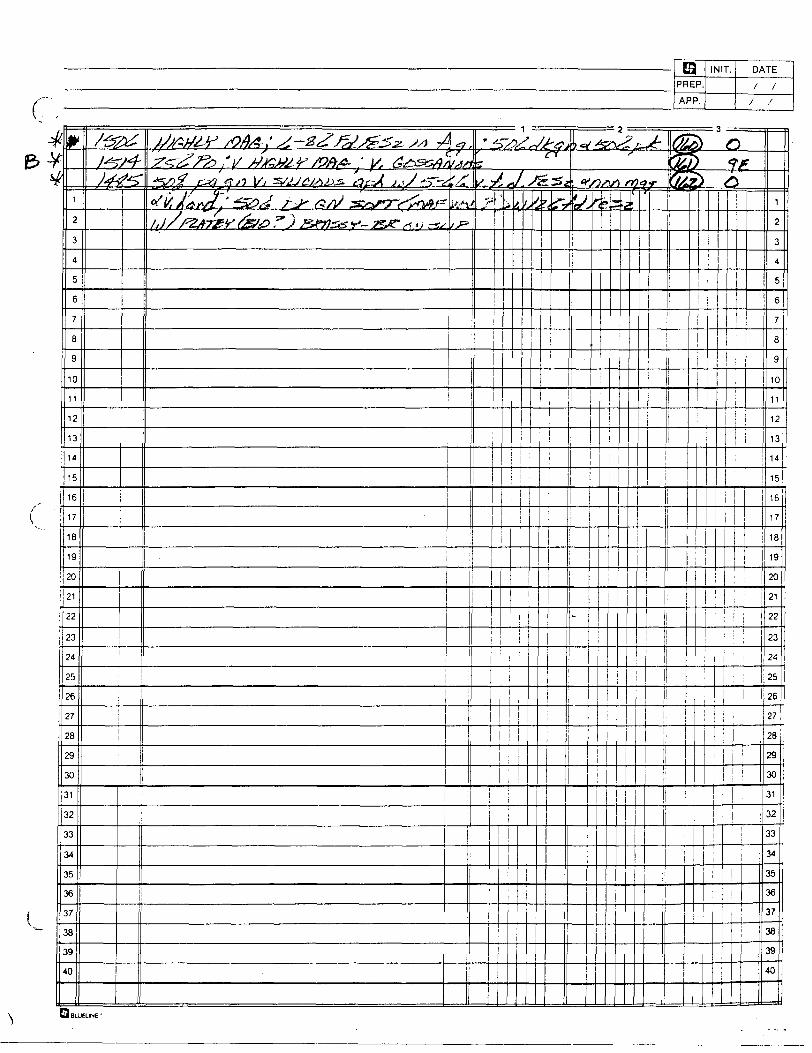
A grid was cut in July 1998, covering all 9 claim units (by George Sadoquis et al). Previous to this one claim was staked, #1223038, to the northeast of the main 8 unit claim group (#1217844- 8 units). A 1600 metre baseline was cut along the southern boundary, with 15,500 metres of north-south lines cut at 100 metre spacings and with stations on each line at 25 metre spacings. A proton magnetometer was rented from Services Exploration and readings were taken at 12.5 metre intervals using the 57,000 gamma setting. All values are plotted after being normalized to the base point at 16E, Baseline. The survey was undertaken on July 25,26, Aug 2,3, and Sept. 7. Gamma readings are contoured at 1000 gamma increments; further division would too clutter the plot.Subsequently, a programme of soil sampling was undertaken on 400 metre line spacings (north- south), with one line in the northeast quadrant going east-west (see figure #5 for lithologic strike in this area). The "B" layer was the target but some sampling was in swamp where only Pete was found (using a soil sampling augur from Services Exploration). Some samples were of pale grey clay where the B layer could not be sampled- these and the Pete samples were not sent for analyses. Chip sampling of outcrops were done where sulphide concentrations warranted or where fresh samples were required for whole rock analysis (for Na depletion, etc.). 162 chip samples were taken, and 109 soil samples. The soils were sent to Activation Laboratories Ltd. for "enzyme leach" analysis. This relatively new geochemical method is described in the attached write-up. The chip samples were sent in three lots- one for basic base metal suite, one for gold plus 34 elements, and one for whole rock. Most of the "Au + 34" samples had varying amounts of quartz or heavy pyrite concentrations. A geological mapping was done over the property in conjunction with the other surveys.
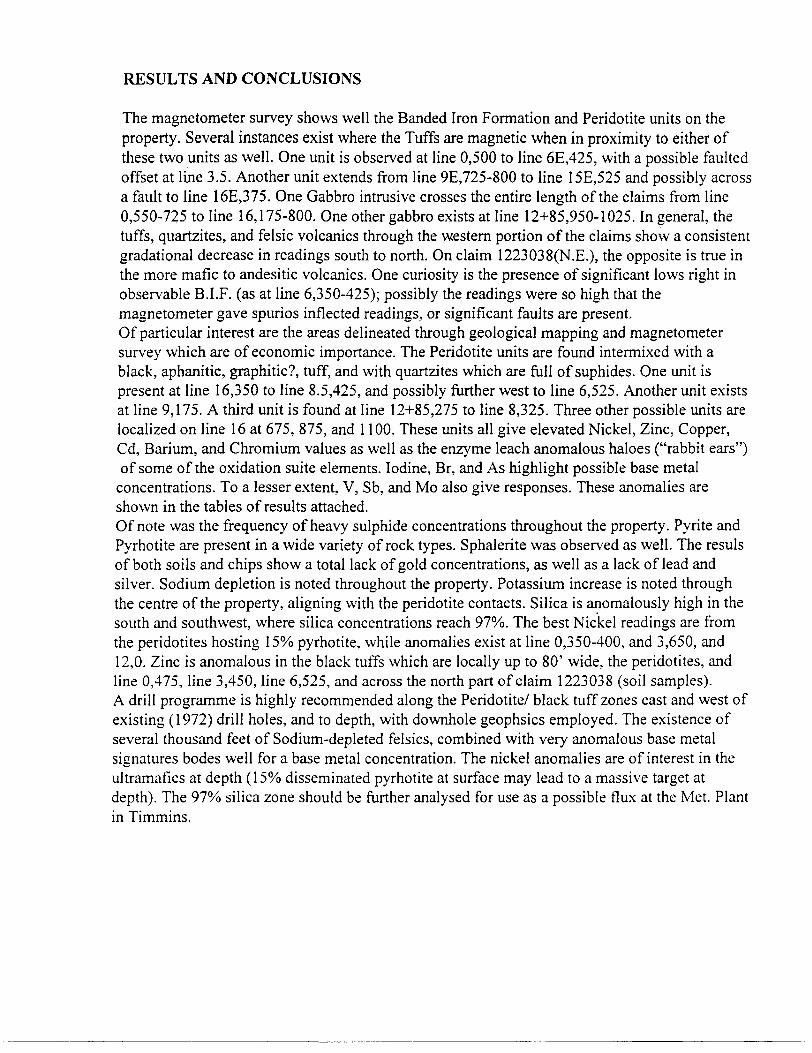
RESULTS AND CONCLUSIONS
The magnetometer survey shows well the Banded Iron Formation and Peridotite units on the property. Several instances exist where the Tuffs are magnetic when in proximity to either of these two units as well. One unit is observed at line 0,500 to line 6E,425, with a possible faulted offset at line 3.5. Another unit extends from line 9EJ25-800 to line 15E,525 and possibly across a fault to line 16E,375. One Gabbro intrusive crosses the entire length of the claims from line 0,550-725 to line 16,175-800. One other gabbro exists at line 12+85,950-1025. In general, the tuffs, quartzites, and felsic volcanics through the western portion of the claims show a consistent gradational decrease in readings south to north. On claim 1223038(N.E.), the opposite is true in the more mafic to andesitic volcanics. One curiosity is the presence of significant lows right in observable B.I.F. (as at line 6,350-425); possibly the readings were so high that the magnetometer gave spurios inflected readings, or significant faults are present. Of particular interest are the areas delineated through geological mapping and magnetometer survey which are of economic importance. The Peridotite units are found intermixed with a black, aphanitic, graphitic?, tuff, and with quartzites which are full of suphides. One unit is present at line 16,350 to line 8.5,425, and possibly further west to line 6,525. Another unit exists at line 9,175. A third unit is found at line 12+85,275 to line 8,325. Three other possible units are localized on line 16 at 675, 875, and 1100. These units all give elevated Nickel, Zinc, Copper, Cd, Barium, and Chromium values as well as the enzyme leach anomalous haloes ("rabbit ears") of some of the oxidation suite elements. Iodine, Br, and As highlight possible base metal
concentrations. To a lesser extent, V, Sb, and Mo also give responses. These anomalies are shown in the tables of results attached.Of note was the frequency of heavy sulphide concentrations throughout the property. Pyrite and Pyrhotite are present in a wide variety of rock types. Sphalerite was observed as well. The resuls of both soils and chips show a total lack of gold concentrations, as well as a lack of lead and silver. Sodium depletion is noted throughout the property. Potassium increase is noted through the centre of the property, aligning with the peridotite contacts. Silica is anomalously high in the south and southwest, where silica concentrations reach 9707o. The best Nickel readings are from the peridotites hosting IS'Xo pyrhotite, while anomalies exist at line 0,350-400, and 3,650, and 12,0. Zinc is anomalous in the black tuffs which are locally up to 80' wide, the peridotites, and line 0,475, line 3,450, line 6,525, and across the north part of claim 1223038 (soil samples). A drill programme is highly recommended along the Peridotite/ black tuff zones east and west of existing (1972) drill holes, and to depth, with downhole geophsics employed. The existence of several thousand feet of Sodium-depleted felsics, combined with very anomalous base metal signatures bodes well for a base metal concentration. The nickel anomalies are of interest in the ultramafics at depth (15^o disseminated pyrhotite at surface may lead to a massive target at depth). The 9707o silica zone should be further analysed for use as a possible flux at the Met. Plant in Timmins.
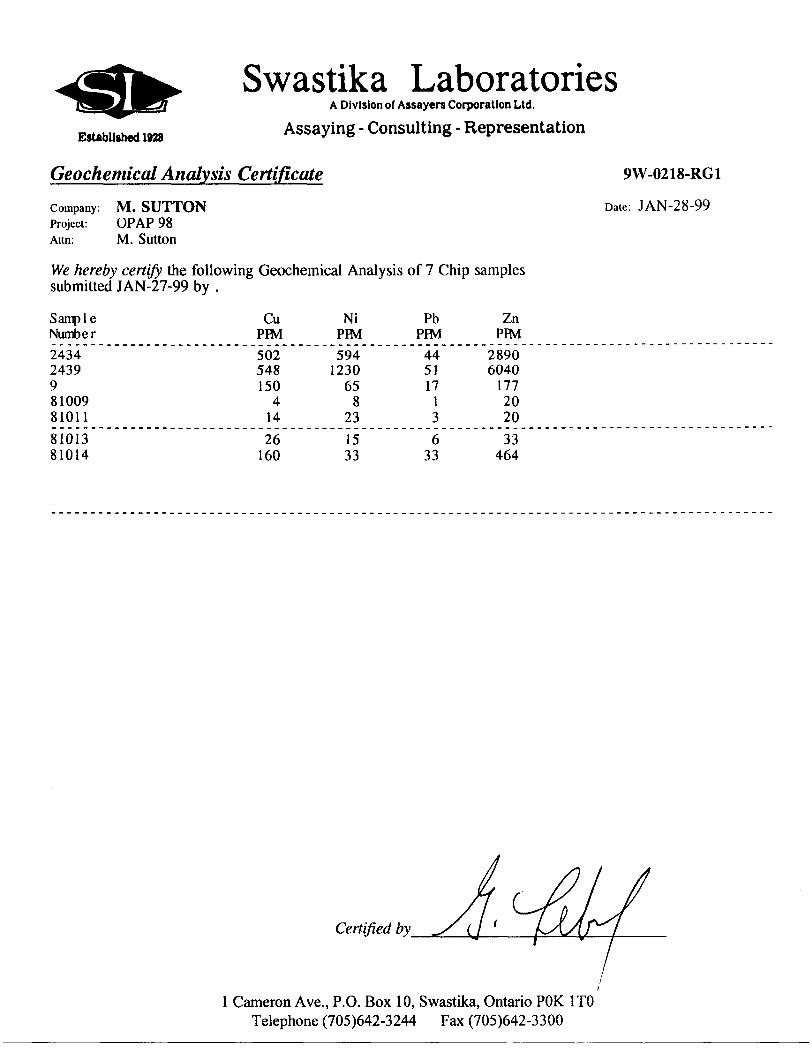
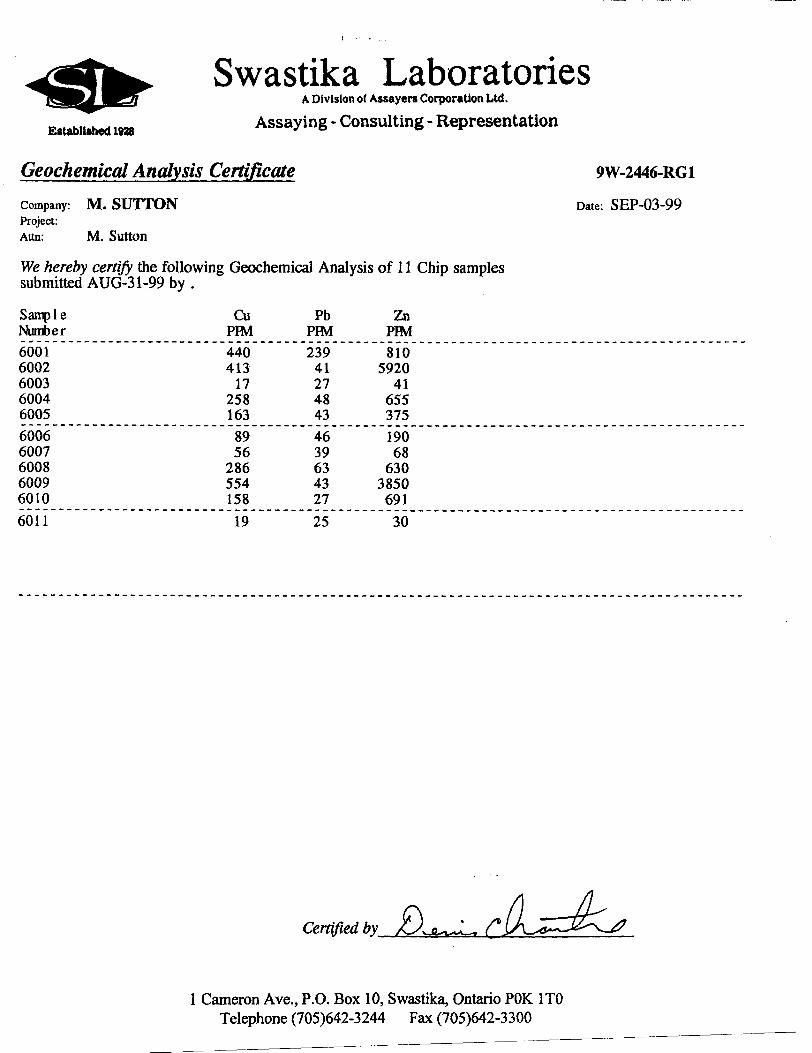
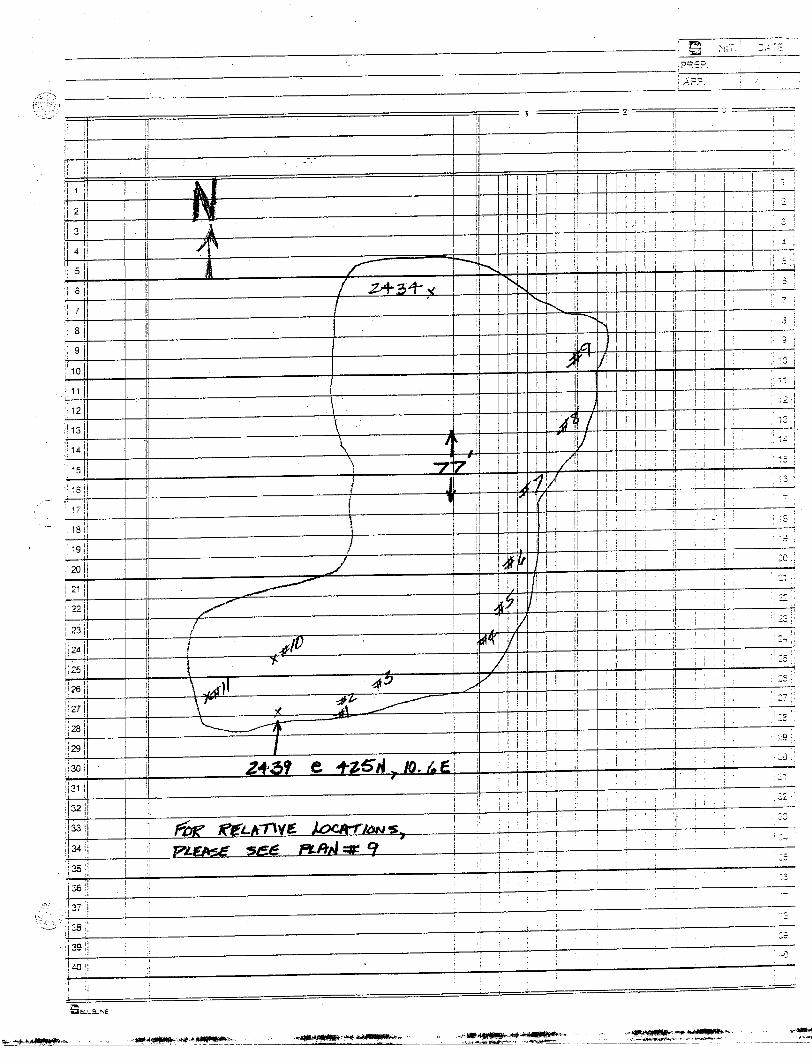
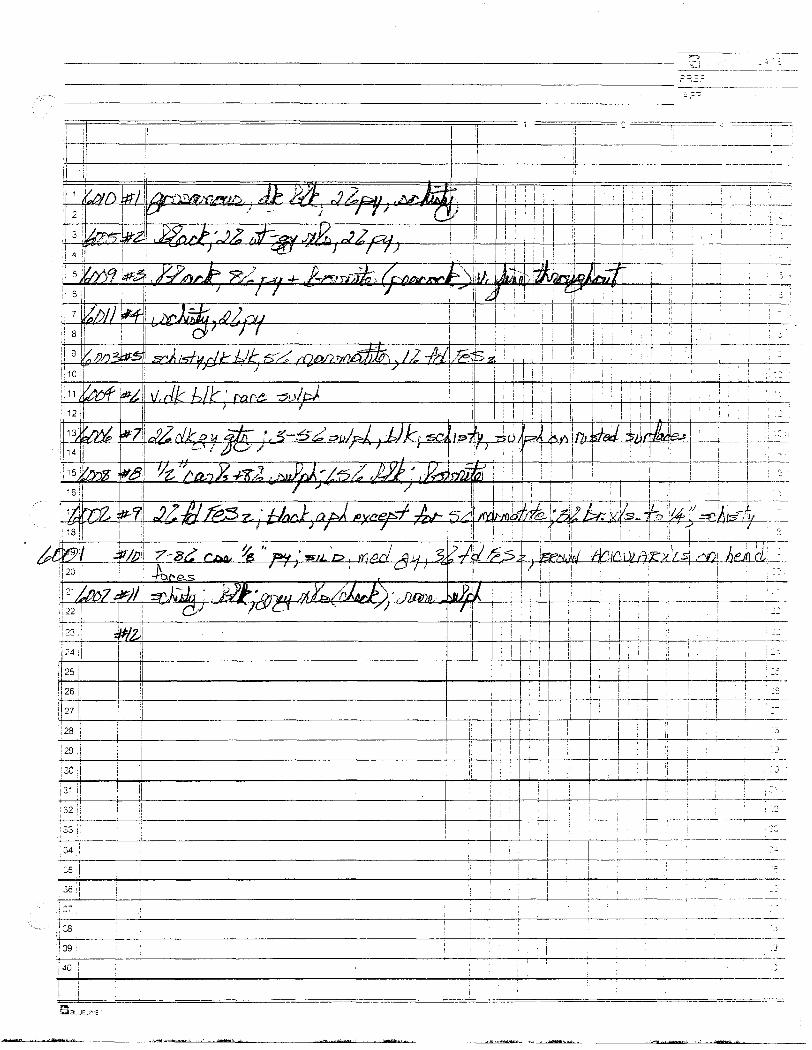
11 chip samples were taken across the exposed 77' width of the tuff unit (see assays, location sketch, S descriptions attached). All were highly anomalous, averaging 1825 ppm (with the original 6 samples included), with the highest being 6040 ppm. Best assays were where fine sulphide stringers of galena + sphalerite + pyrite was seen.
Several of the better assay horizons line up with the earlier airborne conductors of Plan #3A. More sampling in the southwest corner of the claims is strongly recommended, as the conductors here ( or in the northeast) are not related to B.l.F. Perhaps the 2000 year "Operation TreasureHunt" airbornes will give better resolution to these and the other conductive horizons identified.
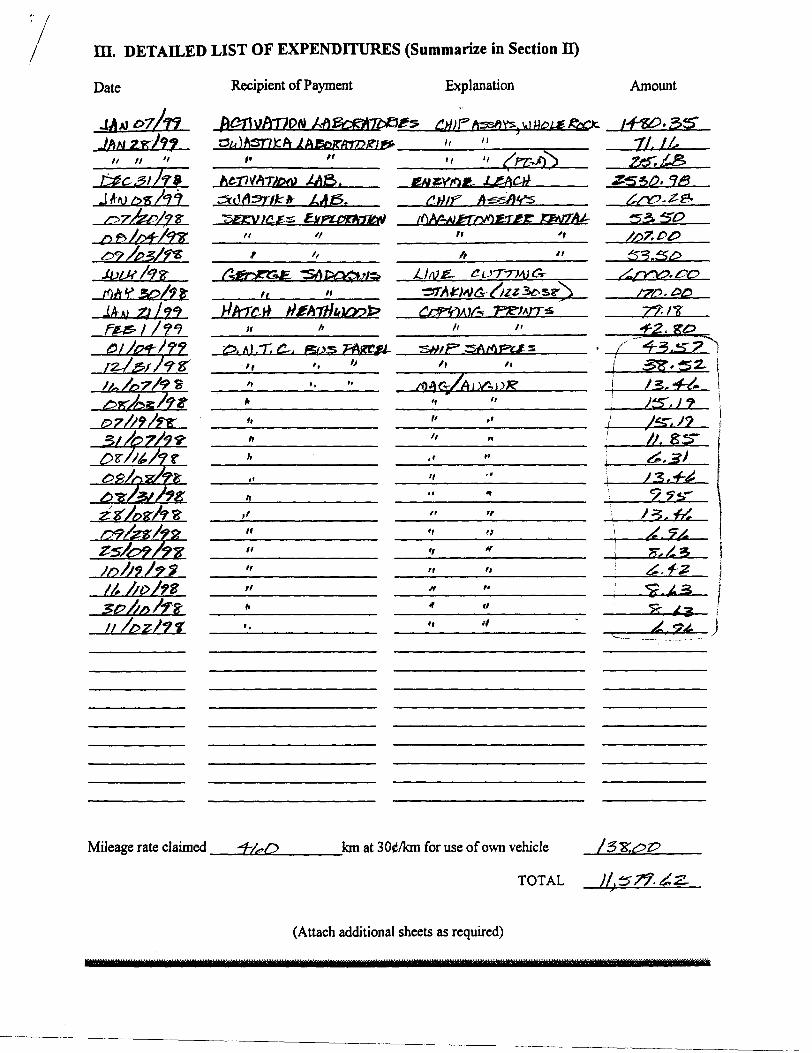
m. DETAILED LIST OF EXPENDITURES (Summarize in Section H)
Date Recipient of Payment Explanation
07/r?II tt '1
K //y?- /tt
J/,
n
Mileage rate claimed
II
If
J-A&.
'l
22*, \ .T. C~.
JLlMZ-
II
Jan at 300/km for use of own vehicle
TOTAL
Amount
. 00
/t. gs-
T?./-*,
(Attach additional sheets as required)
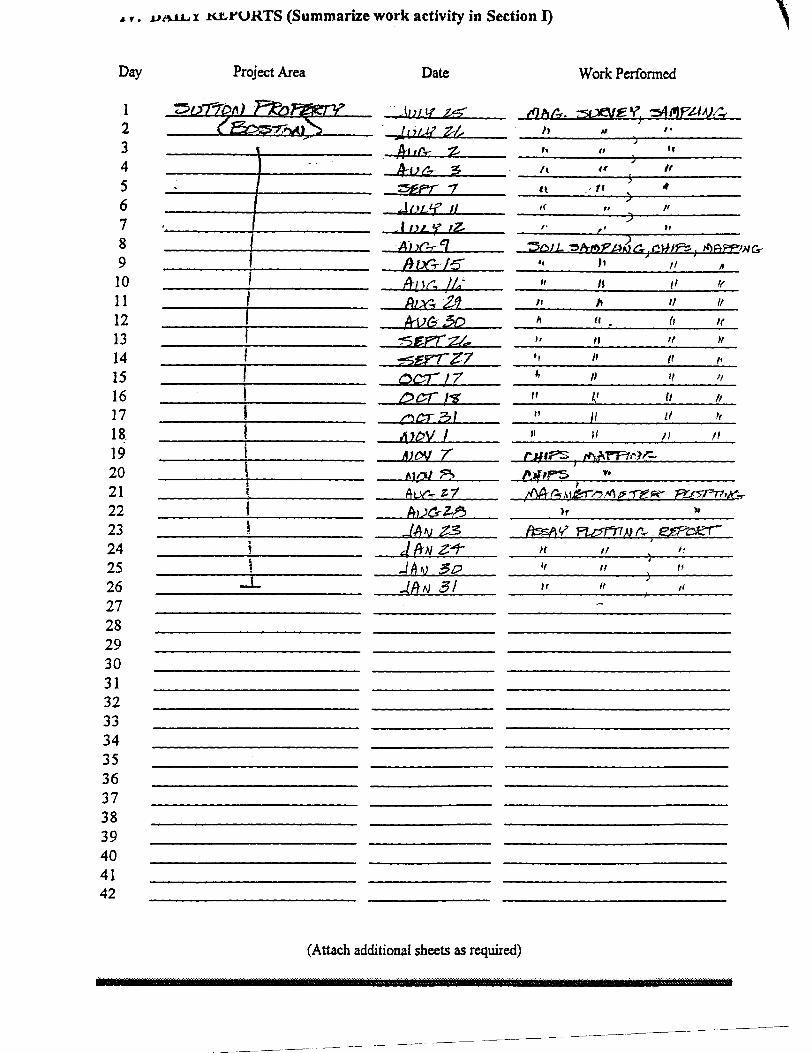
(Summarize work activity in Section I)
Day
1234567
Project Area Date Work Performed
89101112131415161718.192021222324252627282930313233343536373839404142
ff] A A.JlJ/J?
gr g.
nf tZ-
T
31
ti
ft
tt
/t
(Attach additional sheets as required)
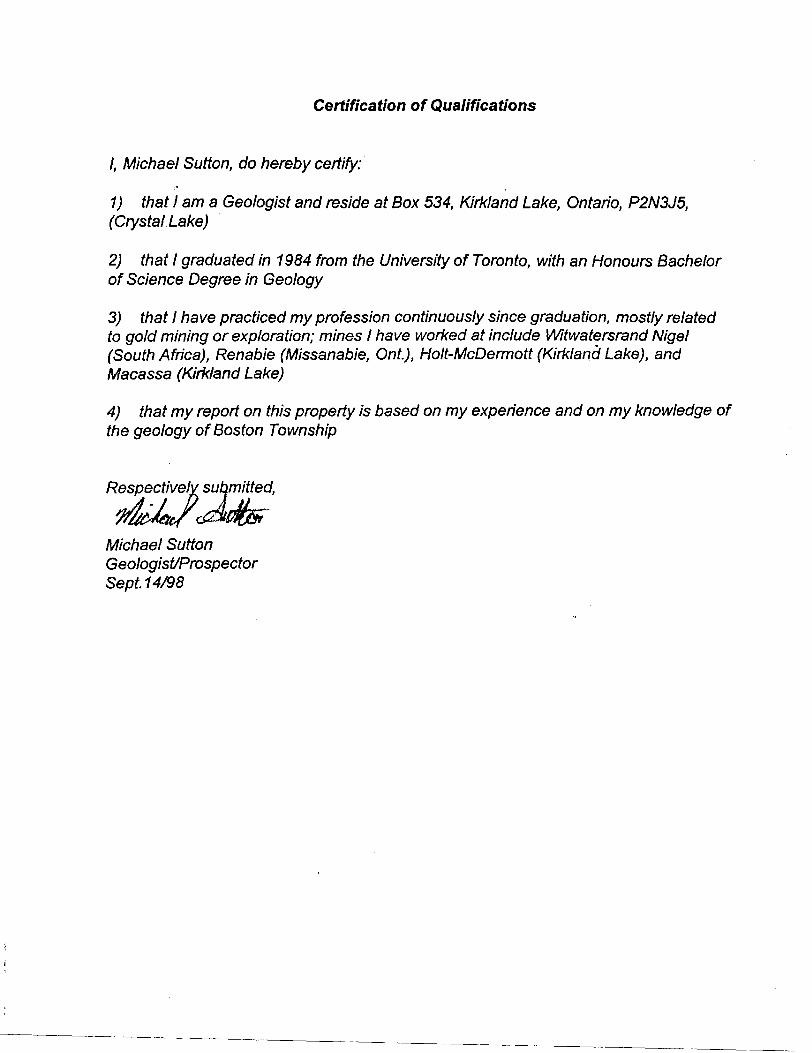
Certification of Qualifications
l, Michael Sutton, do hereby certify:
1) that l am a Geologist and reside at Box 534, Kirkland Lake, Ontario, P2N3J5, (Crystal Lake)
2) that l graduated in 1984 from the University of Toronto, with an Honours Bachelor of Science Degree in Geology
3) that l have practiced my profession continuously since graduation, mostly related to gold mining or exploration; mines l have worked at include Witwatersrand Nigel (South Africa), Renabie (Missanabie, Ont.), Holt-McDermott (Kirkland Lake), and Macassa (Kirkland Lake)
4) that my report on this property is based on my experience and on my knowledge of the geology of Boston Township
Respectively submitted,
Michael SuttonGeologist/ProspectorSept.14/98
AJi V
i31
35
4 tw
su o\5i
•* gr
i
P^
yt-H-
A ^
o* m
S
SL^Sz i 30
"
^-^
~
Si
K 0* A la N
cA
^ j^
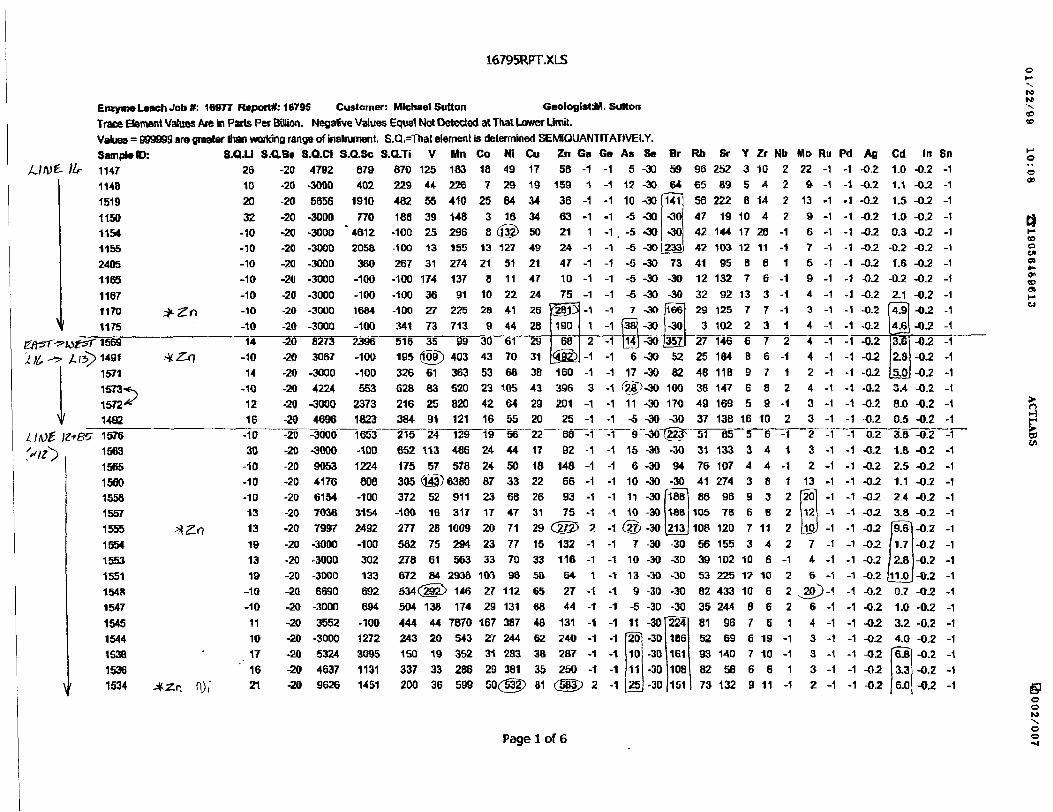
16795RPT.XLS
EnzymftLMCh Job ft 16977 Report*: 16795 Customer: Michael Sutton Gcologfst:M. Sutton
Trace Bemcnt Vatues Are hi Parts Per Billion. Negalive Values Equal Not Detected at That Lower Limit.Values = 999999 are greater Ihan working range of instrument, S.Q^That element is determined SEMIQUANTITATIVELY.
ok* ^xro
to to
Sample ID: S.Q.Li S.Q.B* 3.Q.CI S.Q.Sc S.Q.Ti V Mn Co Ni Cu;UWE- llr 1147 26 -20 4792 879 870 125 183 18 49 17
1
1148 10 -20 -3000 402 229 44 226 7 29 191519 20 -20 5656 1910 482 55 410 25 84 341150 32 -20 -3000 770 188 39 148 3 16 341154 -10 -20 -3000 ' 4612 -100 25 296 B @) 501155 -10 -20 -3000 2058 -100 13 155 13 127 492405 -10 -20 -3000 360 267 31 274 21 51 211165 -10 -20 -3000 -100 -100 174 137 8 11 471167 -10 -20 -3000 -100 -100 36 91 10 22 241170 J^Zn -10 -20 -3000 1684 -100 27 225 28 41 261175 -10 -20 -3000 -100 341 73 713 9 44 28
gfl^r-fltfffT ISBa 14 -20 8273 2396 516 35 99 30 61 29'ilt,-^ /. 13^)1491 *Z-f\ -10 -20 3087 -100 195(109)403 43 70 31
\
1571 14 -20 -3000 -100 326 61 363 53 68 381573 *-. -10 -20 4224 553 628 83 520 23 105 431572^ 12 -20 -3000 2373 216 25 820 42 64 291492 16 -20 4696 1623 384 91 121 16 55 20
UlOf- 1Z+85 1576 -10 -20 -3000 1653 215 24 129 19 56 22fi j^ 1 I^Wu WU fci/ ^*l W M W V
*1565 -10 -20 9053 1224 175 57 578 24 50 181560 -10 -20 4176 808 305 (J43) 6380 87 33 221558 -10 -20 6154 -100 372 52 911 23 68 261557 13 -20 7036 3154 -100 16 317 17 47 311555 ^.2-f] 13 -20 7997 2492 277 28 1009 20 71 291554 19 -20 -3000 -100 582 75 294 23 77 151553 13 -20 -3000 302 278 61 563 33 70 331551 19 -20 -3000 133 672 84 2938 103 96 581548 -10 -20 6690 692 534 CJK^ 146 27 112 651547 -10 -20 -3000 694 504 138 174 29 131 681545 11 -20 3552 -100 444 44 7870 167 387 481544 10 -20 -3000 1272 243 20 543 27 244 621638 ' 17-20 5324 3095 150 19 352 31 283 381536 " 16 -20 4637 1131 337 33 286 29 381 351534 Jnzn (Di 21 -20 9626 1451 200 36 5" 50(t32) 81
Zn Ga Ge Aa58
15936632124
471075
^BJ3190
68
^160396201
2S6892
148669375
C2Z25132116642744
131240287250
(m
-1 -1Se Br Rb Sr Y 2r Nb Mo Ru W Ag
5 -30 59 96 252 3 10 Z 22 -1 -1 -0.21 -1 12 -30 64 65 89 5 4 2 9-1-1 -0.2
-1 -1 10 -30-1 -1 -5 -30
1 -1 , -5-1 -1-1 -1
-5-G
-1 -1 -5-1 -1-1 -1
1 -1 (i
-5
7
Hi2 -1 [141
-1 -1-1 -1
617
•30
141-30•40
-30 [Z33
56 222 B 14 2 13 -1 -1 -0.247 19 10 4 2 9 -1 -1 -0.242 144 17 28 -1 6 -1 -1 -0.2
Cd1.01.11.51.00.3
42 103 12 11 -1 7 -1 -1 -0.2 -0.2-30 73 41 95 8 6 1 6-1-1 -0.2 1.6-30 -30 12 132 7 6 -1 9 -1 -1 -0.2 -0.2-30 -30 32 92 13 3 -1 4 -1 -1 -0.2-30-30-30
166-30
357
29 125 77-1 3-1-1 -0-23 102 2 3 1 4-1-1 -0.2
27 146 6 7 2 4 -1 -1 -0.2-30 52 25 184 B 6 -1 4-1-1 -0.2-30 82 48 118 9 7 1 2-1-1 -0.2
3 -1 ^2tp-30 100 38 147 6 8 2 4 -1 -1 -0.2-1 -1-1 -1-1 -1 "-1 -1
-1 -1-1 -1-1 -1
-1 -12 -1(
-1 -1-1 -1
1 -1-1 -1-1 -1-1 -1-1 -1-1 -1-1 -1
) 2 -1
11-5~9~
156
101110' —
W7
10139
-5
11'20
1011
JZ5
-30 170 49 169 59-1 3-1-1 -0.2-30 -30 37 13B 16 10 2 3 -1 -1 -O.2-30 (22SF 51 85 5 6 -1 2 -1 -1 -0.2-30 -30 31 133 3 4 1 3 -1 -1 -0.2-30 94 76 107 44-1 2-1-1 -0.2-30 -30^ 41 274 3 8 1 13 -1 -1 -0.2-30-30-30
188188213
86 96 9 3 2 [201 -1 -1 -0.2105 78 6 8 2 12 -1 -1 -0.2
108 120 7 11 2 hoj -1 -1 -0.2-30 -30 56 155 3 4 2 7-1-1 -0.2
2.14.94.63.62.85.03.48.00.5381.82.51.12.43.8IwT1.7
-30 -30 39 102 10 6 -1 4 -1 -1 -0.2 1 2.8-30 -30 53 225 12 10 2 6 -1 -1 -0.2 fi 1.0-30 -30 82 433 1062 ^20} -1 -1 -0.2-30 -30 35 244 8 6 2 6-1-1 -0.2-30-30-30-30-30
224186161108151
81 96 7 6 1 4-1-1 -0552 69 6 19 -1 3 -1 -1 -0.293 140 7 10 -1 3 -1 -1 -0.282 58 6 6 1 3-1-1 -0573 132 9 11 -1 2 -1 -1 -05
0.71.03.24.0653.3GJO
In Sn ^•0.2 -1 o-O5 -1 *-0.2 -1-0.2 -1 rt-05 -1 2-0.2 -1 g-0.2 -1 2-0.2 -1 g-0.2 -1 2-0.2 -1 "-05 -1-0.2 -1-05 -1-05 -1-0.2 -1-05 -1 Z
-0.2 -1 p-05 -1 W
Vi-05 -1-O5 -1-0.2 -1-0.2 -1-0.2 -1-0.2 -1-0.2 -1-05 -1-0.2 -1-05 -1-05 -1-05 -1
-0.2 -1-05 -1-0.2 -1-05 -1 g,
ooK9
Page l of 6
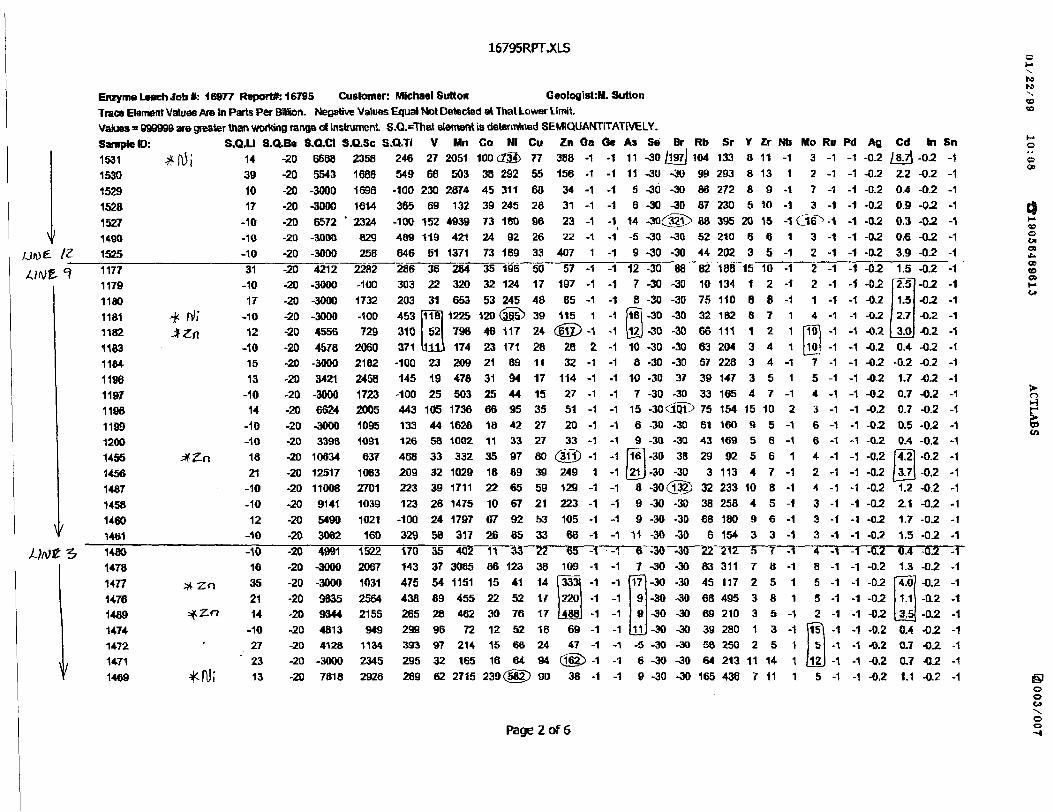
16795RPT.XLS
Enzyme Lmch Job*: 16977 Report*: 16795 Customer: Michael Sutton G eoloflisl:M. SuttonTrace Element Values Are In Parts Per Billion. Negative Values Equal Not Detected at Thai Lower Limit.Values s 999999 are greater than working range of instrument. S.Q^Tnat element is determined SE Ml QUANTITATIVELY.Sample ID: S.Q.LI S.Q.Be S.Q.CI S.Q.Sc S.Q.TI1531 ^ff\5j 14 -20 6668 2358 2461530 39 -20 5543 1688 549
V2768
1529 10 -20 -3000 1696 -100 230
\/
1528 17 -20 -3000 1614 3651527 -10 -20 6572 " 2324 -1001490 -10 -20 -3000 829 489
LW Z It 1525 -10 -20 -3000 258 846jffjf. cj 1177 31 -20 4212 2282 286
1179 -10 -20 -3000 -100 3031180 17 -20 -3000 1732 2031181 ^ rVi" -10 -20 -3000 -100 4531182 XZa 12 -20 4556 729 3101183 -10 -20 4576 2060 3711184 15 -20 -3000 2102 -1001196 13 -20 3421 2458 1451197 -10 -20 -3000 1723 -1001198 14 -20 6624 2005 4431199 -10 -20 -3000 1095 1331200 -10 -20 3396 1091 1261455 XZ-n 18 -20 10634 637 4681456 21 -20 12517 1063 2091487 -10 -20 11008 2701 2231458 -10 -20 9141 1039 1231460 12 -20 5490 1021 -100
V 1461 -10 -20 3082 160 329
LWt ^ i*** -10 -20 4991 1522 1701478 16 -20 -3000 2067 1431*77 #zri 35 -20 -3000 1031 4751476 21 -20 9B35 2564 4381489 *Z-n 14 .20 9344 2155 2651474 -10 -20 4813 949 2991472 ' 27 -20 4128 1134 393
. . 1471 " 23 -20 -3000 2345 2951469 ^HJi 13 -20 7618 2926 269
69152119
51362231
11fl52
111231925
1054458333239
Mn Co Nl Cu Zn Ga Ge As2051 100 OSi 77 388
503 38 292 55 1562874 45 311 68
132 39 245 284939 73 180 96
421 24 92 26
34312322
1371 73 169 33 407284 35 196 50320 32 124 17653 53 245 48
1225 120 (3S5) 39798 46 117 24 C174 23 171 28209 21 69 11478 31 94 17503 25 44 15
1736 66 95 351628 18 42 271002 11 33 27
57197
65115
Se Br Rb Sr Y Zr Nta Mo Ru Pd Afl Cd-1 -1 11 -30/197/104 133 8 11 -1 3 -1 -1 -0.2 }JBJ\•1 -1 11 -30 -30 99 293 8 13 1 2-1-1 -0.2-1 -1-1 -1
5-30-30 86 272 89-1 7-1-1 -0.26 -30 -30 87 230 5 10 -1 3 -1 -1 -0.2
-1 -1 14 -30(^2^ 88 395 20 15 -1 Cl(P -1 -1 -0.2-1 -1 -5 -30 -30 52 210 6 6 1 3 -1 -1 -0.2
1 -1 9 -30 -30 44 202 35-1 2-1-1 -0.2-1 -1 12-1 -1-1 -1
1 -1 f
78si
Hz) -1 -1 lllJ2832
11427512033
2 -1 10-1 -1 8-1 -1 10-1 -1-1 -1-1 -1-1 -1
332 35 97 80 (Mi) -1 -1 |1029 18 89 391711 22 65 59
26 1475 10 67 2124 1797 67 92 5356 317 26 85 3335 402 11 33 2237 3085 86 123 3854 1151 15 41 1489 455 22 52 1728 482 30 76 1796 72 12 52 1897 214 15 68 24
2491292231056665
1093332204866947
32 165 16 64 94 06262 2715 239 (582} 90 38
71569
16]1 -1 [21J
-1 -1-1 -1-1 -1-1 -1-1 -1-1 -1•1 -1•1 -1-1 -1-1 -1-1 -1
^ -1 -1-1 -1
899
11
-30 88 82 188 15 10 -1 2 -1 -1 -0.2-30 -30 10 134 1 2 -1 2-1 -1 -0.2-30 -30 75 110 88-1 1-1-1 -0.2-30 -30 32 182 6 7 1 4-1-1 -Q.2-30 -30 66 111 1 2 1 pfol -1 -1 -0.2-30 -30 63 204 3 4 1 [lOJ -1 -1 -02-30 -30 57 228 3 4 -1 7 -1 -1 -0.2-30 37 39 147 3 5 1 5 -1 -1 -0.2-30 -30 33 165 47-1 4-1-1 -0.2-SOClttD 75 154 15 10 2 3 -1 -1 -0.2-30 -30 61 160 9 5 -1 6 -1 -1 -02-30 -30 43 169 5 6 -1 6 -1 -1 -0.2-30 38 29 92 5 6 1 4-1-1 -0.2-30 -30 3 113 4 7 -1 2 -1 -1 -0.2-30 (132) 32 233 10 8 -1 4 -1 -1 -0.2-30 -30 38 258 4 5 -1 3-1 -1 -0.2-30 -3D 68 180 96-1 3-1-1 -02-30 -30 6 154 3 3 -1 3-1-1 -0.2
6-30 -30 22 212 5 7 -1 4 -1-1 -0"2~7
1799
li-5
69
-30 -30 83 311 78-1 8-1-1 -0.2-30 -30 45 117 2 5 1 6 -1 -1 -0.2-30 -30 68 495 3 8 1 5-1-1 -0.2-30 -30 69 210 35-1 2-1-1 -0.2-30 -30 39 280 1 3 -1 fl?l -1 -1 -0.2-30 -30 56 250 2 5 15-1-1 -0.2-30 -30 64 213 11 14 1 /12J -1 -1 -0.2-30 -30 165 436 7 11 1 5-1-1 -0.2
2.2040.90.30.63.91.52.51.52.73.00.4
-0.2
1.70.70.70.50.44.23.71.2211.71.5641.34.01.13.50.40.70.71.1
hi Sn-0.2 -1-0.2 -1-0.2 -1-02 -1
-0.2 -1-0.2 -1-0.2 -1-0.2 -1-02 -1•02 -1-0.2 -1-0.2 -1•0.2 -1-0.2 -1•0.2 -1-0.2 -1-0.2 -1-0.2 -1-0.2 -1-0.2 -1-0.2 -1-0.2 -1-02 -1•02 -1-02 -1-6.2 -1-0.2 -1-0.2 -1-0.2 -1-0.2 -1•02 -1-0.2 -1-0.2 -1-0.2 -1
o l"V.to
CD
oOD
O Oiat t*03to
oH
o o o
Page 2 of 6
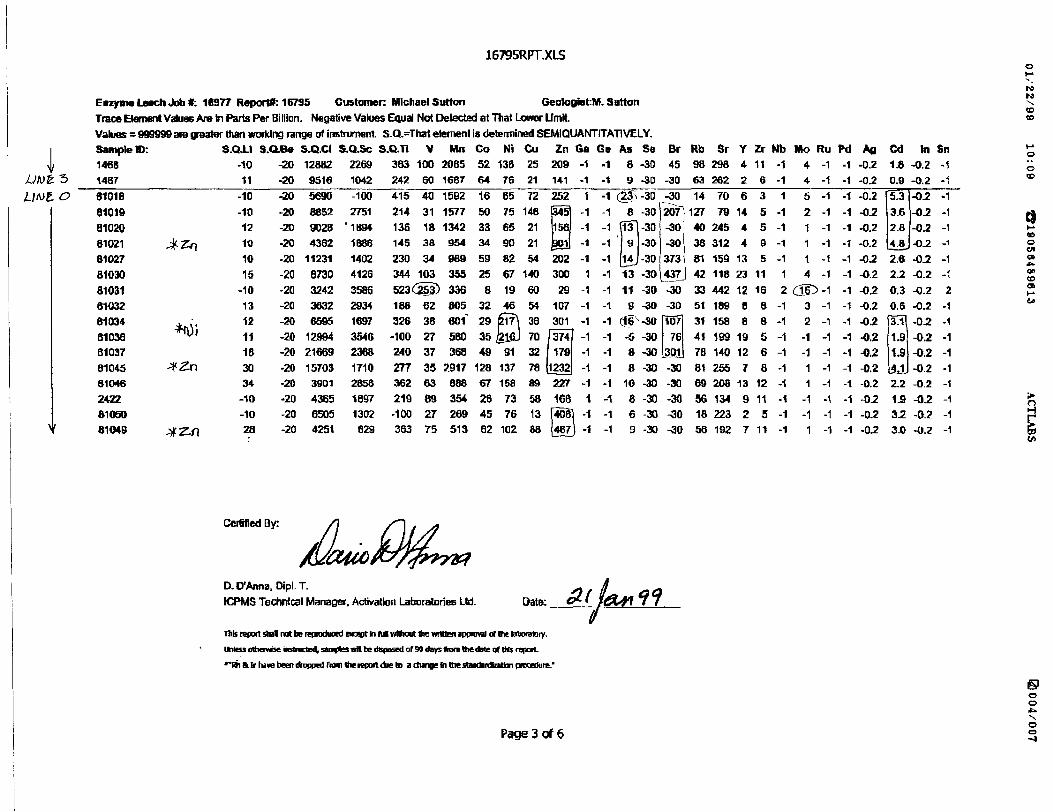
16795RPT.XLS
Enzyme Loach Job *: 16977 Report*: 16795 Customer: Michael Sutton Geologist:)*. SuttonTrace Element Vahi96 Are In Parts Per Billion. Negative Values Equal Not Detected at That Lower LTmlt
9tf
CDto
Values ^ 999999 ara greater than working range of instrument. S.Q^That element is determined SEMIQUANTITATIVELY.i Sample D: S.Q.LI S.CLBe S.Q.CI S.Q.Sc S.Q.T1 V Mn Co Ni Cu]/ 1468 -10 -20 12882 2269 383 100 2085 52 136 25
Utit ^3 1467 11 -20 9516 10*2 242 60 1687 64 76 21LlfJf. O 81018 -10 -20 5690 -100 415 40 1592 16 65 72
\
81019 -10 -20 8852 2751 214 31 1577 50 75 14681020 12 -20 9028 '1894 138 18 1342 33 65 2181021 ^-Zr\ 10 -20 4362 1B86 145 38 954 34 90 2181027 10 -20 11231 1402 230 34 989 59 82 5481030 15 -20 8730 4126 344 103 355 25 67 14081031 -10 -20 3242 3586 523(253) 336 8 19 6061032 13 -20 3632 2934 188 62 805 32 46 5481034 . :. 12 -20 6595 1697 326 38 60f 29 6l7\ 3681036 ^' 11 -20 12994 3546 -100 27 580 35 glfiJ 7081037 16 -20 21669 2368 240 37 368 49 91 3281045 3f2n 30 -20 15703 1710 277 35 ?.917 128 137 7881046 34 -20 3901 2656 362 63 888 67 158 fld2422 -10 -20 4365 1697 219 89 354 26 73 58
81050 -10 -20 6505 1302 -100 27 269 45 76 13' 81049 XZf) 2B -20 42S1 829 363 75 513 62 102 AB
Zn209141
2523451 56J01202300
291073013741792322274&Alot
[408U|37
Ga Ge As Se Br-1 -1 8 -30 45-1 -1 9 -30 -30
1 -1 (j8S -30 -JO-1 -1 8 -30-1 -1 ff3]-30-1 -1 ' 9-30-1 -1 (l4j-30
1 -1 13 -30
Ka Sr Y Zr Nb Mo Ru Pd Ag Cd In Sn ^96 298 4 11 -1 4 -1 -1 -0.2 1.8 -0.2 -1 o63 262 2 6 -1 4-1-1 -0.2 0.9 -0.2 -1 w14 70 6 3 1 5-1-1 -0.2
2071 127 79 14 5 -1 2 -1 -1 -02-30-30
373437
-1 -1 11 -30 -30-1-1 9-30 -30-i -1 de -ao-1 -1 -6 -30-1-1 8-30
10/
76301
-1 -1 8 -30 -30-1 -1 10 -30 -301-1 6-30 -30
1-1-1 6 -30 -301-1-1 9 -30 -30
40 245 4 5 -1 1 -1 -1 -0.238 312 49-1 1-1-1 -0.2
5.33.62.84.8
-0.2 -1-0.2 -1 g
-0-2 ~1 S-0.2 -1 o
( 81 159 13 5 -1 1 -1 -1 -O.2 2.6 -0.2 -1 *j 42 118 23 11 1 4 -1 -1 -A2 2.2 -0.2 -1 *
33 442 12 16 2 (ST) -1 -1 -02 0.3 -0.2 2 ™51 189 86-1 3-1-1 -0.2 0.8 -0.2 -1 "31 158 88-1 2-1-1 -0.241 199 19 5 -1 -1 -1 -1 -0.278 140 12 6 -1 -1 -1 -1 -0.281 255 7 8 -1 1-1-1 -0.2
3.11.91.94,1
-0.2 -1-0.2 -1-0.2 -1-0.2 -1
69 208 13 12 -1 1 -1 1 -0.2 2.2 -0.2 -1BC -in J 04*1 -f 4 H *ft91QftO4 ^OD i o4 y 11 -1 -T -\ -l -\j.c. l .H -UJc -i f}
18 223 2 5 -1 -1 -1 -1 -0.2 3.2 -0.2 -1 S56 192 7 11 -1 1 -1 -1 -0.2 3.0 -0.2 -1 5
Certified By:
D.D'Anna, Dipl.T.ICPMS Technical Manager. Activation Laboratories Ltd.
11* re^shal not be raprodi^TOSt In ft* without the written
Uhtess otherwise instmcW, sampfes wit be disposed or 90 days Hora the date of Bits repot.
Till a Ir iMwa been dropped ftonnh* report due to a (Junkin tt* steadanfcBbon procedure."
o o
Page 3 of 6
16795RPT.XLS
Enzyme LeatTrace Bemer Values ^ 99ft SamplalD: St Te Gd Tb Oy Ho Er
1 -1 -1 -1 -11 -1 -1 -1 -12-1 2-1 -1
-1 -1 14 -1
-1 -1 129 -1
-1 -1 28 -1
-1 -1 138 1-1 -1 32 -1
1 -1 39 1 1 -1 119 3
18 3 1022 3 12
xK*ro^v
o to
o(D
CDo c*
OB
(O O)
Page 4 of 6
o01
o o
16795RPT.XLS
Enzyme Leai Trace Qemer VaUws-999! Sample ID: Sb T* l CB Ba La Ce Pt Kd SRI Eu Gd Tb Dy Ho Er Tra Yb Lu Hf Ta W Re Os Pt Au S.O.Hg TI Pb B! Th U
15311530
1S28 15271490 152511771179 11BOIIDI
1182l lOO
118411 so
1197 119811991200 14551456 1487• •r 3O
l^w
1461; 1480
14771476
14741472
1469
Ni 2 -1/xLzJ -i-i -i -i -i2 -1 : -i -1 i -ii -1
-i -1 -i -i
ft) /' 1-1Z-f\ 1 -1
1 -11 -\1 -1 1
-1 -1 1 -1
-1 -11 -1
Z-f) 1 -i 1 -1
-1 -11 -1
-t -1-1 -1
1 -11 -1
ztn i -i
ZV7 1 -*-i -t-i -i -i -i
AJi' -1 -1
J5j9969 60 '11
46 629723 92
71OB
100 12?
7713876
7291
4071
IDD43
40/fc
Mf\f'
49 101
2 '3 f4 14 i
5 4
-1 C2
-1
e-i (-i-i2
-1S'23
-1 -1-1-1
1-1-1
4-1
1-1-1.2
4
19&J163OO 560 S44 372 726)B61
279
*i-J
279367574——— -1
005 [709292
213 197 387ou*v
421
341J"KJ
360845fnff
514351
2027
1010
15 5
27 87
202
1711 25344
20146
135
24
1 9
77
5323
25
23 4 1138 6 2225 5 15 11 2 fi 46 8 28 20 3 9 14 2 740 7 24
i O
33 5 18
4-12
9 1 46 *1 1
B 1 410 2 5 39 6 2224 5 171J z H
24 4 12 11 2 6 46 6 2241 1 C
"M5 R -1O
• O O C
11 2 9f-f. d IO
7 1 411 2 7
6 4 i
5 4 n
6 1 4
44 fi 28 25 4 12
3 -14 1
~ l
2 -15 2 2 -1 1 -15 2
-1 -1
4 -1 2 -1
-1 -1
-1 -1-1 -1-1 -1
1 -14 13 -12 -1 2 -1 2 -14 12 -14 11 -1
2 -12 -1 1 -12 -1
-1 -1-1 -1-1 -1
5 13 1
3-1 2-1 -1 -1 1 -1 -t -1 -1 0.1 -1 -1 -0.13-1 2-1 -1 -1 -1 -1 -1 -1 -1 -0.1 -1 -1 -0.13-1 2-1 -1 -1 -1 -1 -1 -1 -1 -0.1 -1 -1 -0.1
2-1 1-1 -1 -1 -1 -1 -1 -1 -1 -0.1 -1 -1 -0.1 5-1 4-12 -1 2-1-1-11, -0.1 -1 -1 -4.1 2-1 2-1 -1 -1 -1 -1 -1 -1 -1 -0.1 -1 -1 -0.1 t -1 -1 -i -1 -1 -t -1 -1 -1 -1 -0.1 -1 -1 -0.1
5-1 3-12 -1 2-1 -1 -1 -1 -0.1 -1 -1 -0.1 -1 .1 -1 -1 .1 .1 -1 -1 -1 -1 -1 -01 -1 -1 -0.1
3-1 2-1 -1 -1 -1 -1 -1 -1 -1 -0.1 -1 -1 -0.1 2-1 1-1-1 -1-1 -1 -1 -1 1 -0.1 -1 -1 -0.1
.1 .-J .1 -1 -1 -1 .1 -1 -1 -1 1 -0.1 -1 -1 -0.1-1 -1 -1 -1 -1 -1 -1 -1 -1 -1 -1 -0.1 -1 -1 -0.1-1 -1 -1 -1 -1 -1 -1 .1 -1 .1 -1 -0.1 -1 -1 -0.1-1 .1 -i ,1 -1 -1 -i -i -1 -1 -1 -0.1 -1 -1 -0.1
1 -i -1 -1 -1 .1 -1 .1 -1 -i -1 -0.1 -1 -1 -0.1
4-14-12-1 1-1 -1 -1 1 -0.1 -1 -1 -0.13-1 2-11 -1 -1 -1 -1 -1 -1 -0-1 -1 -1 -0.11-1 1-1 -1 -1 -1 -1 -1 -1 -1 -0.1 -1 -1 -0.1 2-1 1-1 -1 -1 -1 -1 -1 -1 1 0.1 -1 -1 -0.1 1-1 1-1 -1 -i -1 -1 -1 -1 -1 0.1 -1 -1 -0.1 4-1 2-11 -1 -1 -1 -1 -1 -1 -0.1 -1 -1 -0.11-1 1-1 -1 -1 -1 -1 -1 -1 -1 -0.1 -1 -1 -0.13-12-11 -1 -1 -1 -1 -1 -1 -0.1 -1 -1 -0.11 -i -1 -1 -1 .1 -1 -1 -1 -1 -1 -0.1 -1 -1 -0.1
1-1 1-1 .1 .1 -1 -1 -1 -1 -1 -o.f -1 -1 -0,12-1 2-1 -1 -1 -1 -1 -1 -1 -1 -0.1 -1 -1 -0.1
-1 -1 - -1 -1 -1 -1 -1 -1 -1 -1 -0.1 -1 -1 -0.11 -1 . -1 -1 -1 -1 -1 -1 -1 -1 0.1 -t .1 -0.1
-1 -1 - -1 -1 -1 -1 -1 -1 -1 -1 0.1 -1 -1 -0.1-1 -1 - -1 -1 -1 -1 -1 -1 -1 -1 -0.1 -1 -1 -0.1-1 -i . -1 -1 -1 -1 -i -1 -1 -1 -0.1 -1 -1 -0.1
4-13-11 -1 1-1 -1 -1 1 -0.1 -1 -1 -0.1 2-1 2-1 -1 -1 -1 -1 -1 -1 1 -0.1 -1 -1 -0.1
-1 2-1 1-1 2-1 -1
-1 3-1 1 -1 -1
-1 1 -1 1-1 -1-1 -1-1 -1-1 -1-1 -1
1 -i-1 -1
-1 -1-1 -1-1 -1-1 -1-1 -1 -1 -1-1 -1-1 -1-1 -1-1 -1-1 1-1 1-1 -1-1 -1-1 -1-1 -1-1 -1
-1 2
6 -12 -11 -1
-1 -1 -1 -1 -1 -1 -1 -1-1 -1 2 -1
-1 -1 2 -12 -1
-1 -1-1 -128 -1
3 -1
-1 -1-1 -1
1 -1
2 -1 2 -15 -11 -11 -12 -1
-1 -11 -1
3 4
-1 -1-1 -1
1 -1-•l -1
1 -1 8 -1
2l 2
LisJ '2 1
1 -1 2 1 2 -1 1 -12 1
-1 -12 1 1 1
-1 -1-1 -1-1 -1
1 -1-1 -1
2 12 12 1 2 11 -1 2 1
-1 -11 -1
-1 1-1 -1
1 -1
-1-1
- -1- 1
-1
/a 2 (j/ 1
roIs9
CD CO
O
o
CD O eaCDitoae eo at
o oOB
Page 5 of 6
16795RPT.XLS
Enzyme LeatTrace Bemer
SamptolD: Sb Te
1467 1 -1
81018 -1 -1Ol vi !f -1 " l
81020 1 -1 81021 Z- f) 1-181027 1 -141030 1 -181031 1 -181032 -1 181034 2~] -1 81038 /\)i -1 -1 81037 2J -1fi4fVU ^gr f*. 4 tt
RHfUH 4 4
2422 -1 -181050 -1 -1furua ^7^ .1 .1
74 4757
2128370
114111
6110811 V
1124 en
OA
114&Q
91Rft
Cs-12
-14
-1-1-1-1-1-1-1-1
2231
-11
Ba405i\n2483*tj
680 \012|418247215 340?DQ
ii?n(WJ
397805en f
ft*! A
4ni
La GA Pr Nd Sm Eu Gd Tb Oy Ho Er Trn Yb Lu HI Ta W3 81 5 1-1 1-1-1-1-1 -1 -1 -1 -1 -1 -126-13-1-1 -1 -1 -1 -1 -1 -1 -1 -1 -1 -1 -1
14 23 3 10 2-1 2-1 1 -1 -1 -1 -1 -1 -1 -1 -134 57 8 28 52 5-13-11 -1 1-1-1-1 -1
5 11 2 6 1 -1 1 -1 1 -1 -1 -1 -1 -1 -1 -1 -1
4 10 2 5 1-1 1-1-1-1 -1 -1 -1 -1 -1 -1 -129 45 7 24 5 1 4 -1 3 -1 1 -1 1 -1 -1 -1 -168 118 18 64 12 3 11 1 6 -1 2 -1 1 -1 -1 -1 -1
21 46 7 24 625-14-11 -1 1-1-1-1-1 11 Z4 4 12 3-1 3-12-11 -1 -1 -1 -1 -1 -1
10 21 3 11 3-13-12-11 -1 -1 -1 -1 -1 -1
54 *7 12 45 7 2 7 -1 4 -1 2 -1 1 -1 -1 -1 -1 18 33 5 19 41 3-12-11 -1 -1 -1 -1 -1 -1
12 25 4 13 3-1 3-12 -1 -1 -1 -1 -1 1 -1 -1
24 48 7 26 52 5-13 12-1 1-1-1-1-115 31 5 17 31 3-12-11 -1 -1 -1 -1 -1 -1
4 814-1-1-1-1 -1 -1 -1 -1 -1 -1 -1 -1 -1
15 7R 4 15 H -1 ? -1 9 .1 -1 .1 -1 -1 -1 -1 -1
Re -0.1-0.1-0.1wr0.1•0.10.1
0.3-0.1
-0.1-0.1
-0.1
0.2-0.1-01
-0.1-0.1n 1
Os Pt Au S.Q.Hg Tl Pb B\ Th U-1 -1 -0.1 -1 -1 -1 -1 -1 -1-1 -1 -0.1 -1 -1 -1 -1 -1 -1
-1 -1 -0.1 -1 -1 2-1 -1 1-1 -1 -0.1 -13 2-1 -1 -1-1 -1 -0.1 -1 -1 2 -1 -1 -1
-1 - -0.1 -1 -1 -1 -1 -1 -1-1 - -0.1 -12 2-1 -1 -1-1 - -0.1 -128-122-1 - -0.1 -115-132 -1 - -0.1 -114-111-1 - -0.1 -1 -1 3 -1 -1 -1-i - -0.1 -i -1 a -i -1 -1-1 - -0.1 -1 -1 3 -1 -1 1
-1 -1 -0.1 -11 6-1 1-1
-1 -1 -0.1 -11 11 21'1 -1 -0.1 -1-1 1-1 11
-1 -1 -0.1 -1 -1 -1 -1 -1 -1
i1 -1 -A 1 -11 .1 -1 .1 .-1
x. ro ro^v
(Cto
oM O
o c* os*-OC CD CD
q
O O
Page 6 of 6o o
ACTLABS AC™*™NLABORATORIES LTD
Invoice No.: 16795Work Order: 16977Invoice Date: 22-JAN-99Date Submitted: 05-JAN-99Your Reference: NONEAccount Number: M021
MIKE SUTTONBOX 534KIRKLAND LAKE, ONP2N 3J5CANADA
CERTIFICATE OF ANALYSIS
86 SOILS(PREP.REV2) were submitted for analysis.
The following analytical packages were requested. Please see our current fee schedule for elements and detection limits.
REPORT 16795 RPT.XLS CODE 7-ENZYME LEACH ICPXMS(ENZYME.REVl)
This report may be reproduced without our consent. If only selected portions of the report are reproduced, permission must be obtained. If no instructions were given at time of sample submittal regarding excess material, it will be discarded within 90 days of this report. Our liability is limited solely to the analytical cost of these analyses, Test results are representative only of material submitted for analysis.
CERTIFIED BY :
DR E.HOFFMANXGENERAL MANAGER
1336 SANDHILL DRIVE, ANCASTER, ONTARIO, CANADA L9G 4V5 . TEL: 905-648-9611 . FAX: 905-648-9613 E-MAIL: [email protected] or 102040.700 @ COMPUSERVE.COM
HI
I-Qsw
l!\i
x
l
(V
i.i,
1
f
W
9i•\
Sfc
^
•SV
\iNsii
^*f M
*l
0^
xft
C
JP^
ss
si
B
^o
Jjfr
^.^
*r ^
-Kj-'28
i D
\T
Jt,
T
Jsj
y
-c': '
^ b Rl-
X/v
m -o 13 m ~
O
J-L
MVS
Xe
vN
vi)VIr ^
is
V
-sx
0-
\
s
x-^A
Ax*Z!V
(N CS
CD
O
l O
'- .j.".
QPREP.
APR.
INIT. DATE
X 1
/ /
f)u
k*
cB
QPREP.
APP.
INIT. DATE
1 t
t f
5
EjBLUEUNE'
QPREP.
APR.
INIT. DATE
1 1
l f
QPREP.
APP.
INIT. DATE
X X
X X
———————— J —— QPREP.
APF.
INIT. DATE
X X
X X
,V eaPREP.
APP.
INIT. DATE
1 X
1 t
Q BUJELINE '
..V - ' f -f : ''" ' '. ! ' ' ' - 'f W " .1' - -' ' ' ' ' - ' '- " - ' ' '""-"L--' - :- -'•.-.: - . ' ' . - , -. ./- .••.•- ' . - . -1 : . '•-.•••••ty'.' '••••- ,' :- /i"-.:-, -. .- . -. .' , ". - '.-- - - '';: ' 'V.:-' ••'-'- - ,,-;;. '
•'• : -,- ;,:ti;-,s flA.i:.-''.' 1 . .'. . •-•"'•^7-'*, ' ;.':''- ,.--'.:- w--.. ' -. . '.; .' -" . "r-^S.:--,ii,(--'v .. -. - . ;:--. . - :- ' '.if';: *: .",!;***3. i-:,-: 1 . ' :' ' ' .- .''*^..-. - -' "- -.-.Vi'— ..i/'. ...- ' -.. '.i - '... : ' -. ... fi ' -; - .; . .. ' ' - ;.', , iV ' ,: ,- - :.-'-. -. ' ,- 'j"
QPREP.APP.
INIT. DATE
1 t •
1 X
fit* -*
C4
B INIT. DATE
PREP.
APP. " x 7
en
y j
6
7
B
9
10
11
i:13
14
15
16
17
18
19
20
21
22
23
24
25
26
27
28
29
30
1
2
3
34
5
36
7
38
9
QB
Swastika LaboratoriesA Division of Assayers Corporation Ltd.
Established 1928 Assaying - Consulting - Representation
Geochemical Analysis Certificate 9W-0218-RG1Company: M. SUTTON Date: JAN-28-99Project: OPAP 98Attn: M. Sutton
We hereby certify the following Geochemical Analysis of 7 Chip samples submitted JAN-27-99 by .
Sample Cu Ni Pb Zn Number PFM PIM PPM PPM2434 S02 594 44 28902439 548 1230 51 60409 150 65 17 17781009 4 8 l 2081011 14 23 3 2081013 "~~"~ ----------------------j------------------^--
81014 160 33 33 464
Certified by
l Cameron Ave., P.O. Box 10, Swastika, Ontario POK l TO Telephone (705)642-3244 Fax (705)642-3300
Swastika LaboratoriesA Division of TSL/Assayers Inc.
Established 1928 Assaying - Consulting . Representation page iof2
Geochemical Analysis Certificate 9W-0017-RG1Company: M.SUTTON Date: JAN-08-99Project:Attn: M. Sutton
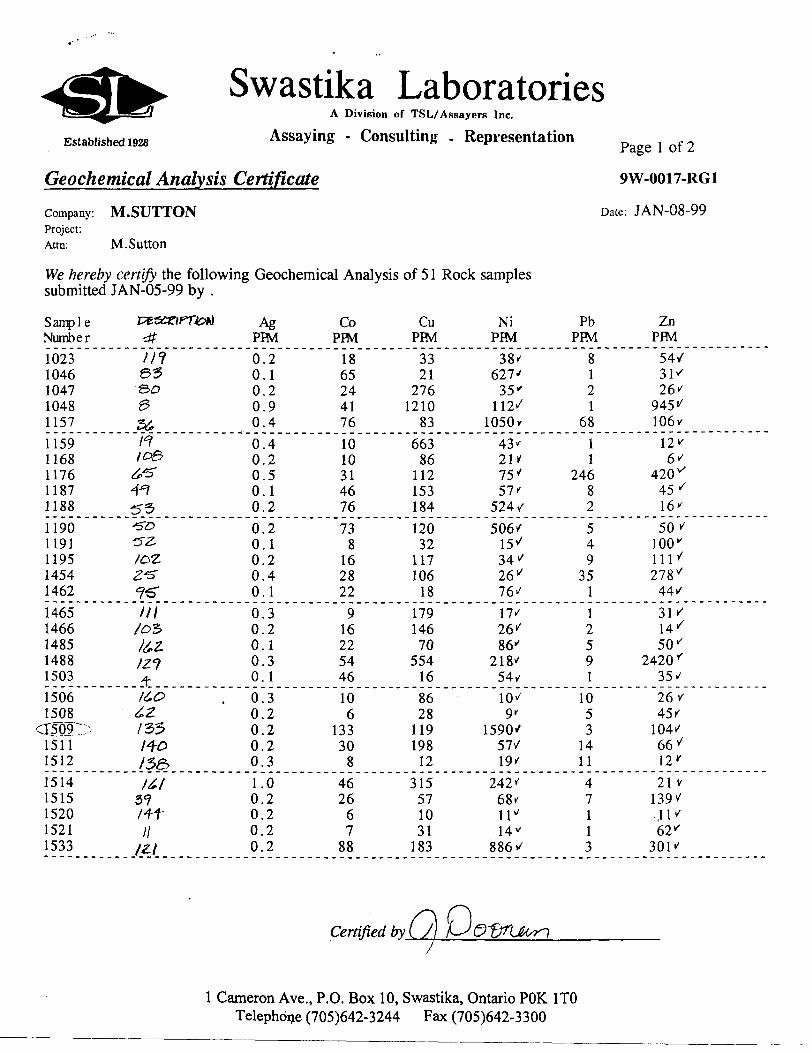
We hereby certify the following Geochemical Analysis of 51 Rock samples submitted JAN-05-99 by .
Sample FES^PTNumber 3f
1023 //?1046 Q^1047 -&01048 ^H57 Z6
1159 /^1168 IG&1176 6*51187 4^1188 3*,1190 -SO1191 *5Z-1195 toZ1454 Z*S1462 ^
1465 /y/1466 /tt1485 y^Z1488 /271503 ^
1506 Ai^1508 6ZT5oT~:x /331511 M-o1512 /5a1514 ^x1515 3?1520 /-ft1521 a1533 fa
te*l AgPPM
0.20.10.20.90.4
0.40.20.50.10.2
0.20.10.20.40.1
0.30.20.10.30.1
0.30.20.20.20.3
1.00.20.20.20.2
CoPPM
1865244176
1010314676
738
162822
916225446
106
133308
462667
88
CuPPM
3321
2761210
83
66386
112153184
1203211710618
17914670
55416
862811919812
315571031
183
NiPPM38'
627'35'112'
1050*43"21*75"57'
524 v506'15'34'26'76'
17'26'86"
218'54 v10'9'
1590'57/19'
242'68'11"14"
886
PbPPM
8121
68
11
24682
549
351
12591
1053
1411
47113
ZnPPM
54/3K26'
945"106*12"6'
420 v45'16"
50'100"111'278 V44 v
31'14'50'
2420"35'
26'45 i104'66'12'
21 y139^ 41'62"
301'
Certified by LJ
l Cameron Ave., P.O. Box 10, Swastika, Ontario POK 1TO Telephone (705)642-3244 Fax (705)642-3300
Swastika LaboratoriesEstablished 1928
A Division of TSL/Assayers Inc.
Assaying - Consulting . Representation
Geochemical Analysis CertificateCompany: M.SUTTONProject:Attn: M.Sutton
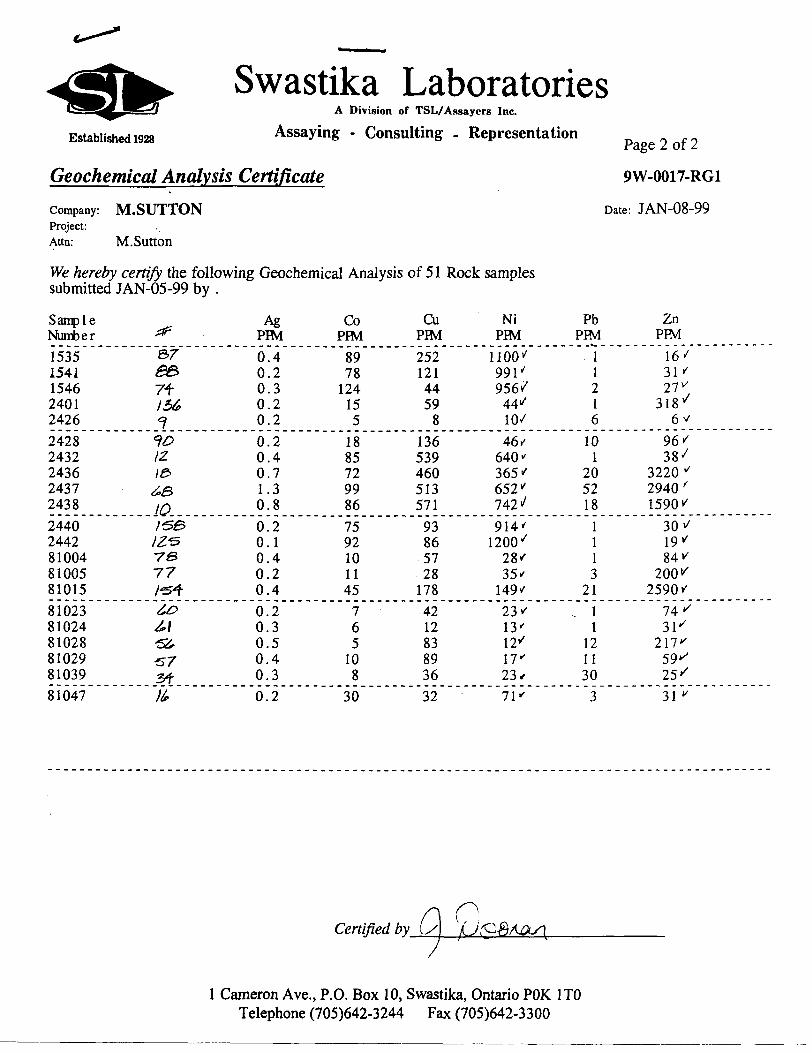
We hereby certify the following Geochemical Analysis of 51 Rock samples submitted JAN-05-99 by .
Page 2 of 2
9W-0017-RG1
Date: JAN-08-99
Sample Number1535 1541 1546 2401 24262428 2432 2436 2437 2438
2440 2442 81004 81005 8101581023 81024 81028 81029 8103981047
ff
&Tee-7f I3&i10 12 I& 6B
...JO.......t'sa/2^5re77/-s*60^l'St,
*573fH,
Ag PIM
0.4 0.2 0.3 0.2 0.20.2 0.4 0.7 1.3 0.80.2 0.1 0.4 0.2 0.40.2 0.3 0.5 0.4 0.30.2
Co PFM
8978 124 15 5
18 85 72 99 8675 92 10 11 457 6 5
10 8
30
Cu PIM
252 121 44 59 8
136 539 460 51357193 8657 28 17842 12 83 89 3632
Ni PPM1100' 991' 956/ 44*"
10/
46 i 640' 365 * 652" 742^914' 1200' 28' 35" 149v23" 13"12' 17' 23*71"
Pb PFM
1 1 2 1 610
1 20 52 181 1 1 3
21, 1
1 12 11 303
Zn PPM16' 31' 27'
318 y 6v96' 38'
3220 ' 2940 ' 1590'30' 19' 84'
200^ 2590'
74 i/31'217" 59^ 25'31 "
Certified by (s\
l Cameron Ave., P.O. Box 10, Swastika, Ontario POK l TO Telephone (705)642-3244 Fax (705)642-3300
ACTLABS ACTIVATION LABORATORIES LTD
Invoice No.: 16811Work Order: 16995Invoice Date: 25-JAN-99Date Submitted: 07-JAN-99Your Reference: NONEAccount Number: 2277
MIKE SUTTONBOX 534KIRKLAND LAKE, ONP2N 3J5CANADA
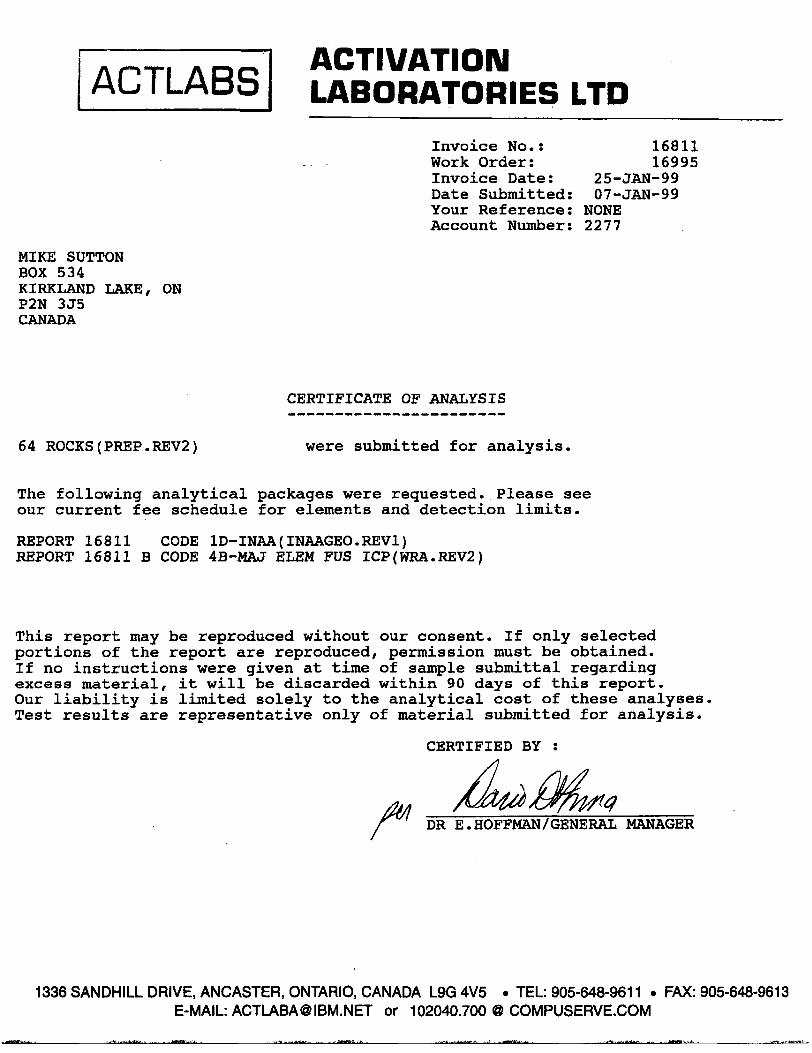
CERTIFICATE OF ANALYSIS
64 ROCKS(PREP.REV2) were submitted for analysis.
The following analytical packages were requested. Please see our current fee schedule for elements and detection limits.
REPORT 16811 CODE ID-INAA(INAAGEO.REVl)REPORT 16811 B CODE 4B-MAJ ELEM FUS ICP(WRA.REV2)
This report may be reproduced without our consent. If only selected portions of the report are reproduced, permission must be obtained. If no instructions were given at time of sample submittal regarding excess material, it will be discarded within 90 days of this report. Our liability is limited solely to the analytical cost of these analyses. Test results are representative only of material submitted for analysis.
CERTIFIED BY
AA DR E.HOFFMAN/GENERAL MANAGER
1336 SANDHILL DRIVE, ANCASTER, ONTARIO, CANADA L9G 4V5 . TEL: 905-648-9611 - FAX: 905-648-9613 E-MAIL: [email protected] or 102040.700 @ COMPUSERVE.COM
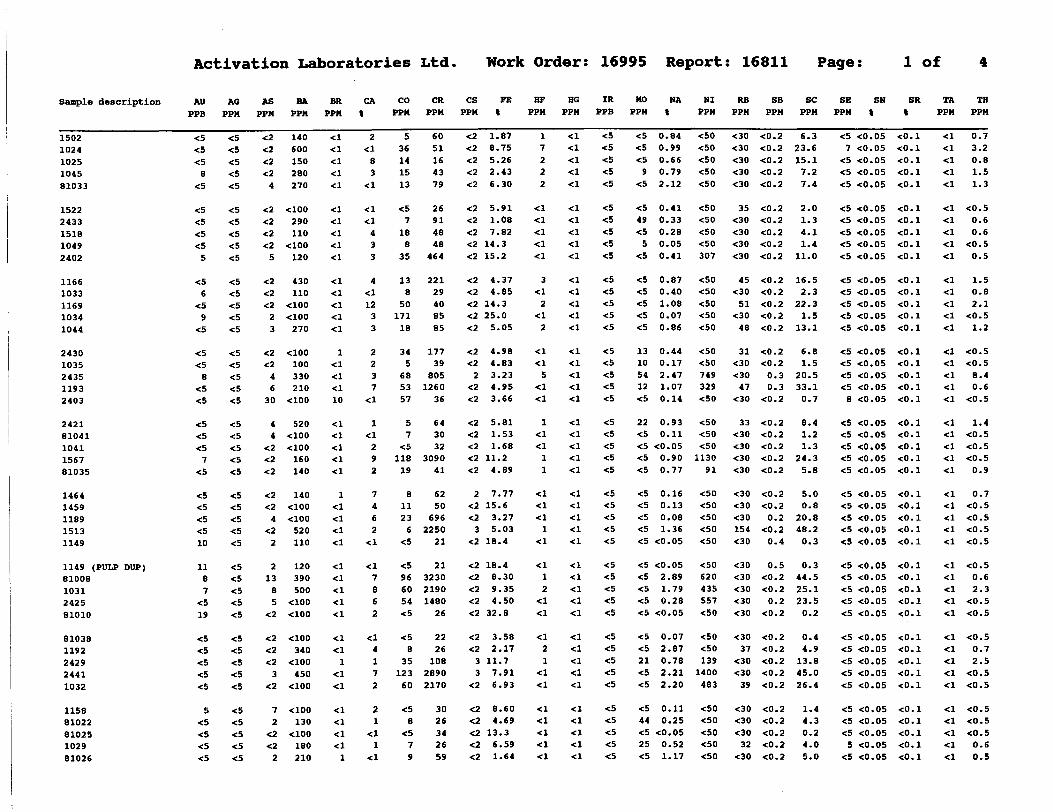
Activation Laboratories Ltd. Work Order: 16995 Report: 16811 Page: l of
Sample description
1502 10241025104581033
15222433151810492402
11661033116910341044
24301035243511932403
2421B10411041156781035
14641459118915131149
1149 (PULP DUP)810081031242581010
810381192242924411032
11588102281025102981026
AU PPB
e5rf
rf8
e5
e5
rfe5
rf5
e56
rf9
rf
rfrf
8rfrf
rfrfrf
7rf
rfrfrfrf10
1187
rf19
rfrfrfrfrf
5rfrfrfrf
AG PPM
rf rfrfrfrf
rfrfrfrfrf
rfrfrfrfrf
rfrfrfrfrf
rfrfrfrfrf
rfrfrfrfrf
rfrfrfrfrf
rfrfrfrfrf
rfrfrfrfrf
AS PPM
^
^•C2•C2
4
e2•C2^•C2
5
^•C2•C2
23
•C2•C2
46
30
44
e2•C2e2
•C2•e2
4e2
2
213
85
e2
e2e2<2
3e2
72
<2<2
2
BA PPM
140 600150280270
<100290110
elOO120
430110
elOOelOO
270
<100100330210
elOO
520<100.clOO
160140
140elOO•clOO
520110
120390500
•clOO•clOO
•clOO340
•clOO450
•clOO
•clOO130
•clOO180210
BR PPM
•ci •ci•el•el•el
el<l<l<l<l
el•elel<l<l
1•ci<lel10
el•el<lel•ci
1•elelelel
•el•el<l<lel
elel
1•elel
el•elelel
1
GA t
2el
83
el
elel
433
4el12
33
2237
el
1el
292
7462
el
el7862
el4172
21
el1
el
CO PPM
5 36141513
e57
188
35
138
50171
18
345
685357
57
e5118
19
81123
6e5
rf966054e5
rf8
35123
60
rf8
rf79
CR PPM
60 51164379
26914848
464
22129408585
17739
8051260
36
643032
309041
6250
6962250
21
21323021901480
26
2226
10828902170
3026342659
CS FE PPM t
e2 1 . 87 e2 8.75•C2 5.26e2 2.43e2 6.30
e2 5.91e2 1.08e2 7.82e2 14.3e2 15.2
e2 4.37e2 4.85e2 14.3e2 25.0e2 5.05
e2 4.98e2 4.83
2 3.23e2 4.95rt 3.66
e2 5.81e2 1.53e2 1.68e2 11.2e2 4.89
2 7.77e2 15.6e2 3.27
3 5.03e2 18.4
e2 18.4e2 8.30e2 9.35e2 4.50e2 32.8
e2 3.58rt 2.17
3 11.73 7.91
e2 6.93
e2 8.60e2 4.69e2 13.3e2 6.59e2 1.64
BF PPM
17222
elelelelel
3el
2el
2
elel
5elel
1elel
11
elelel
1•el
el12
elel
el21
elel
•elel•elelel
EG PPM
el elelel•el
elelelelel
elel•cielel
elelelelel
elelelelel
elelelelel
•elelelelel
elelelelel
elelelelel
IR PPB
e5 e5rfrfrf
rfrfrfrfrf
e5e5e5rfe5
e5rfrfrfrf
e5rfe5e5rf
e5e5e5rfe5
rfe5rfrfe5
rfe5e5rfrf
rfrfe5rfe5
MO HA PPM t
e5 0.84 rf 0.99e5 0.66
9 0.79e5 2.12
e5 0.4149 0.33rf 0.28
5 0.05rf 0.41
e5 0.87e5 0.40e5 1.08rf 0.07e5 0.86
13 0.4410 0.1754 2.4712 1.07e5 0.14
22 0.93e5 0.11rf eO.05e5 0.90e5 0.77
e5 0.16e5 0.13rf 0.08e5 1.36e5 eO.05
e5 eO.05eS 2.89e5 1.79e5 0.28rf eO.05
e5 0.07e5 2.8721 0.78e5 2.21e5 2.20
e5 0.1144 0.25rf eO.0525 0.52e5 1.17
Nl PPM
e50 rfOe50eSOe50
e50eSOeSOrfO307
eSOeSOe50eSOe50
eSOe50749329eSO
e50eSOe50
113091
e50e50eSOe50e50
e50620435557e50
e50eSO139
1400483
eSOeSOe50rfOe50
RB PPM
e30 e30e30e30e30
35e30e30e30e30
45e30
51e30
48
31e30e30
47e30
33e30e30e30e30
e30e30e30154e30
e30e30•C30e30•C30
e3037
e30e30
39
e30OOe30
32e30
SB PPM
<0.2 eO.2<0.2eO.2•CO. 2
•eO.2•eO.2eO.2•eO.2•CO. 2
•CO. 2•eO.2eO.2•CO. 2eO.2
•eO.2<0.2
0.30.3
eO.2
•eO.2eO.2eO.2eO.2eO.2
eO.2•eO.2
0.2eO.2
0.4
0.5eO.2eO.2
0.2eO.2
eO.2eO.2<0.2•eO.2eO.2
eO.2eO.2eO.2eO.2•CO. 2
sePPM
6.3 23.615.17.27.4
2.01.34.11.4
11.0
16.52.3
22.31.5
13.1
6.81.5
20.533.10.7
8.41.21.3
24.35.8
5.00.8
20.848.20.3
0.344.525.123.50.2
0.44.9
13.845.026.4
1.44.30.24.05.0
SE SH PPM 1
e5 eO.05 7 eO.05
e5 -cO.05rf eO.05e5 eO.05
e5 eO.05e5 eO.05e5 eO.05e5 eO.05e5 eO.05
e5 eO.05e5 eO.05e5 eO.05e5 eO.05e5 eO.OS
e5 eO.05rf -eO.05e5 eO.05eS eO.05
8 eO.05
e5 eO.05e5 eO.05e5 eO.05e5 eO.05e5 eO.05
eS eO.05rf eO.05e5 eO.OSeS eO.05e5 eO.05
e5 eO.05eS eO.05e5 eO.05rf eO.05e5 eO.05
e5 eO.05eS eO.05eS eO.05rf .eO.05e5 eO.05
e5 eO.05eS eO.05e5 eO.05
5 eO.05rf eO.05
SR t
eO.l eO.leO.leO.leO.l
eO.leO.leO.leO.leO.l
eO.leO.leO.leO.leO.l
eO.leO.leO.leO.leO.l
eO.leO.leO.l•cO.leO.l
eO.leO.leO.leO.l•cO.l
eO.leO.leO.leO.leO.l
eO.leO.leO.leO.leO.l
eO.leO.leO.leO.leO.l
TA PPM
elelelelel
•elelelelel
elelelelel
elelelel•el
•elelelelel
elelelelel
elelelelel
elel^•el•ci
•el•el•el•elel
TH PPM
0.7 3.20.81.51.3
eO.50.60.6
eO.50.5
1.50.82.1
•eO.51.2
eO.5eO.5
8.40.6
eO.5
1.4eO.5eO.5eO.5
0.9
0.7eO.5eO.5eO.5eO.5
eO.50.62.3
eO.5eO.5
eO.50.72.5
eO.5eO.5
e0.5eO.5eO.50.60.5
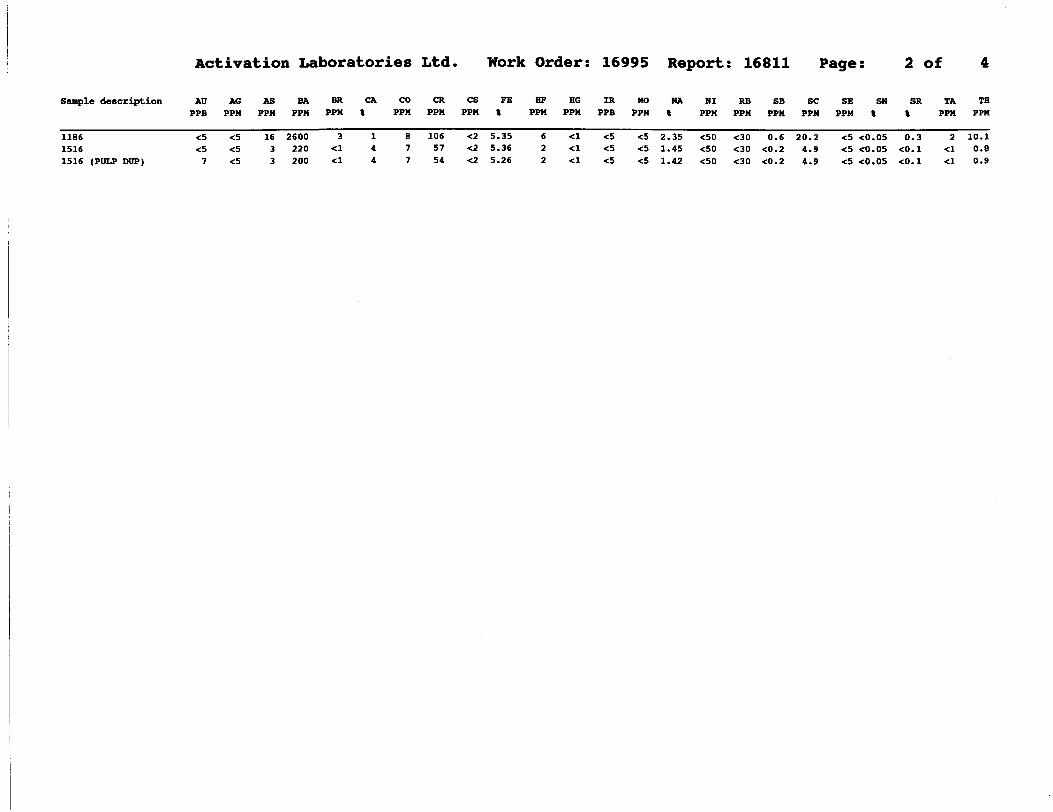
Activation Laboratories Ltd. Work Order: 16995 Report: 16811 Page: 2 of
Sample description
1186 15161516 (PULP DOT)
AUPPB
•C57
AGPPM
•C5•C5
AS BAPPM PPM
16 2600 3 2203 200
BRPPM
3 •el•el
CAt
1 44
COPPM
8 77
CRPPM
106 5754
CS FEPPM t
•C2 5.35 •C2 5.36•C2 5.26
BFPPM
6 22
HGPPM
•el •el•Ci
IRPPB
•e5 •e5<5
MO NAPPM \
•C5 2.35^ 1.45^ 1.42
HIPPM
•cSO^0
RB SB SCPPM PPM PPM
•C30 0.6 20.2 00 e0.2 4.900 -CO. 2 4.9
SE SNPPM t
•cS •cO.OS •C5 ^.05^ KO.OS
SR TA THt PPM PPM
0.3 2 10.1 KO.l ^ 0.8<0.1 <l 0.9
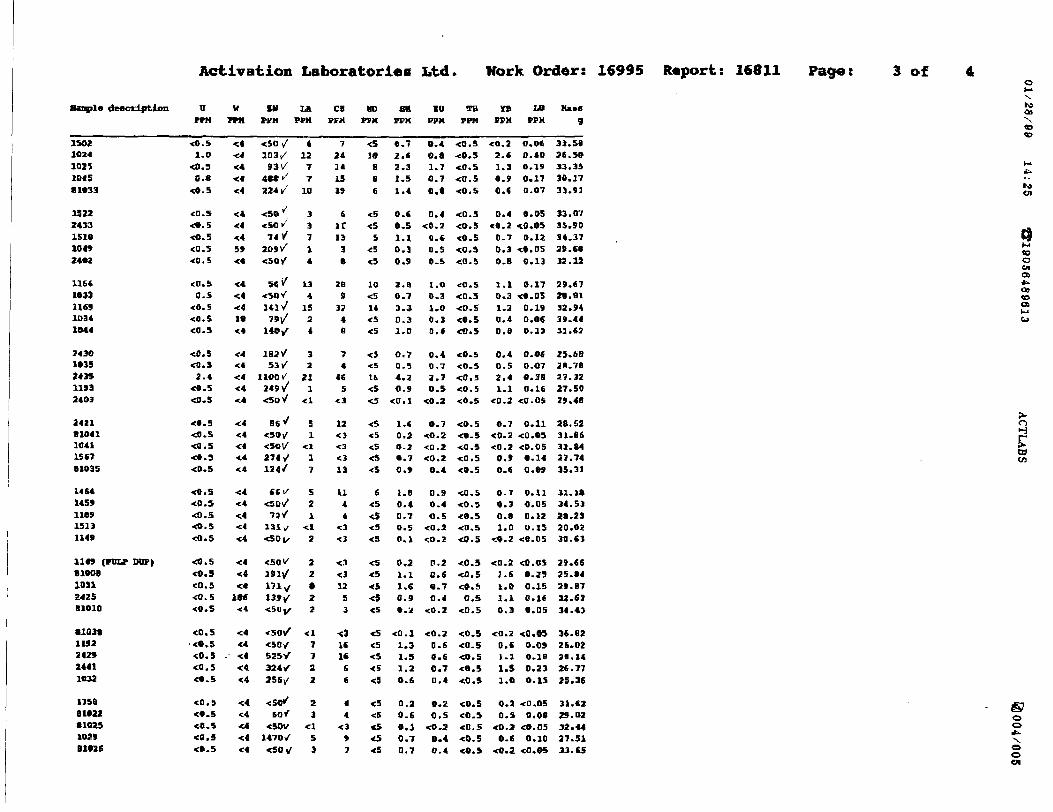
Activation Laborator lea Ltd. Work Order: 16995 Report: 16811 Pago i 3 of
flaapl* description
15021024102 S1015a 1*33
1S222433151810492402
11641033116910341044
24301035243S11932403
24211 10411041156781035
146414S9lias15131149
1149 (PtJU DOT)S 1008ion242511010
•10 3t1192242924411032
1158B10J2•10251029• 1*26
uPPM
40.51.0
40.50.8
40.5
40.540.54O.540.540.5
40.5o.s
4*. 540,5
40.5
40.540.32.4
40.50.5
40.540. S
40.540.540.5
40. S40.540.540.54O.5
40. S40.540.540.540.5
40.5•40.540. ScQ.S40.5
40.540.540.540.540.5
9 TPM
4444444444
44
44445944
4444441844
444444
44
44
44
4444
44
44
44
44
4444
44
4444
4418644
4444
- 444444
44444444
44
IB 1A ft* PPM
450 y'103/
93V/488 i/224 i/
450^4SO J
74 V209 VfaoY
M/450 V141^79/
140 y'
1B2/53 1'
llOOv'249 V'450 V
B6^45O/450 1/274 v/124/
*SV4501/
73 V'131 v'450^
450V191^171 y139 450 1^
450/450/525^324V256/
450*60 f
450V1470/450 V
412
77
10
33714
134
1524
32
211
4l
51
41
1
7
521
41
2
22e22
417722
21
41
S3
CBPCX
724141519
jir13
3e
2B9
374e
74
465
43
1243
43
4313
1144
4343
434J12
53
431616
e6
44
43
97
MD VEX
4510
BB6
45
45S
4545
1045
144545
4)4S
164545
45
4545
4545
6454545
4S
45454545
45
45
4545
4545
454E
454545
EHMX
0-72. C2.31.51.4
0.60.51.10.30.9
2. B0.73.30.31,0
0. 7Q. S4.20.9
40.1
1-C0.20.20.70.9
i.e0.40.79.50.1
0.21.11.60.90.2
40.1
1.3l.S1.20.6
0.20.60.10.70.7
•0PPM
O.40.01.70.7C.*
0.440.5
4.6D. 50.5
1.0tt. 31.00.30.4
0.40.72.70.5
40.2
O. 740.240.240.20.4
0.9O. 4O.S
40.240.2
P.I
0.60.70.4
40.2
40.20.60.60.7D. 4
0.2O.S
40.20.40.4
TB PPM
40.540.540.5
40. 540.5
40.54O.540.540. S
40.5
•cO.S40. S
4O.540.544). S
40.540. S40.540.540.5
40.540.540.540.5
40.5
40.540.540.540. S
40.5
40.540. S
40.50.5
40.5
40.540.540.5
40.5
40.5
40.540.540.540.540.5
ra UBPPX PPM
40.2 0.062.6 0.401.3 0.190.9 0.170.6 D. 07
0.4 0.0540.2 40.05
0.7 0.120.3 40.05O.B 0.13
1.1 0.170.3 40.051.2 0.190.4 0.06o.e o.i3
0.4 0.06O.S 0.072.4 0.391.1 0.16
40.2 40-05
0. 7 0.1140.2 40.0540.2 40.050.9 0.140.6 0.09
0.7 o. 110.3 0.050.8 0.121.0 0.15
40.2 40.05
40.2 40.051.6 0.251.0 0.151.1 0.160.3 0.05
40.2 40. OSa, s o.o91.1 0.19l.S 0.231.0 0.15
0.2 40. OS0.5 0.08
4O.2 40.050.6 0.10
40.2 40.05
Xua9
31.5836.5033.3530.1733.91
33.0735.9034.3729.6832.12
29.6728.8132.9439.4431.42
ZS.6B2I.7B27.3227.5029.48
2*. 52ai. as32.8427.7435.31
31.1034.5328.2320.0230.61
29.6625.8429. B732.6334.43
34.6226.0221.1426.7725.36
31.4229.0232.4437.5133. S5
ODX (D
roen
to o en aaea M (j
O
CO (a
oQ
o01
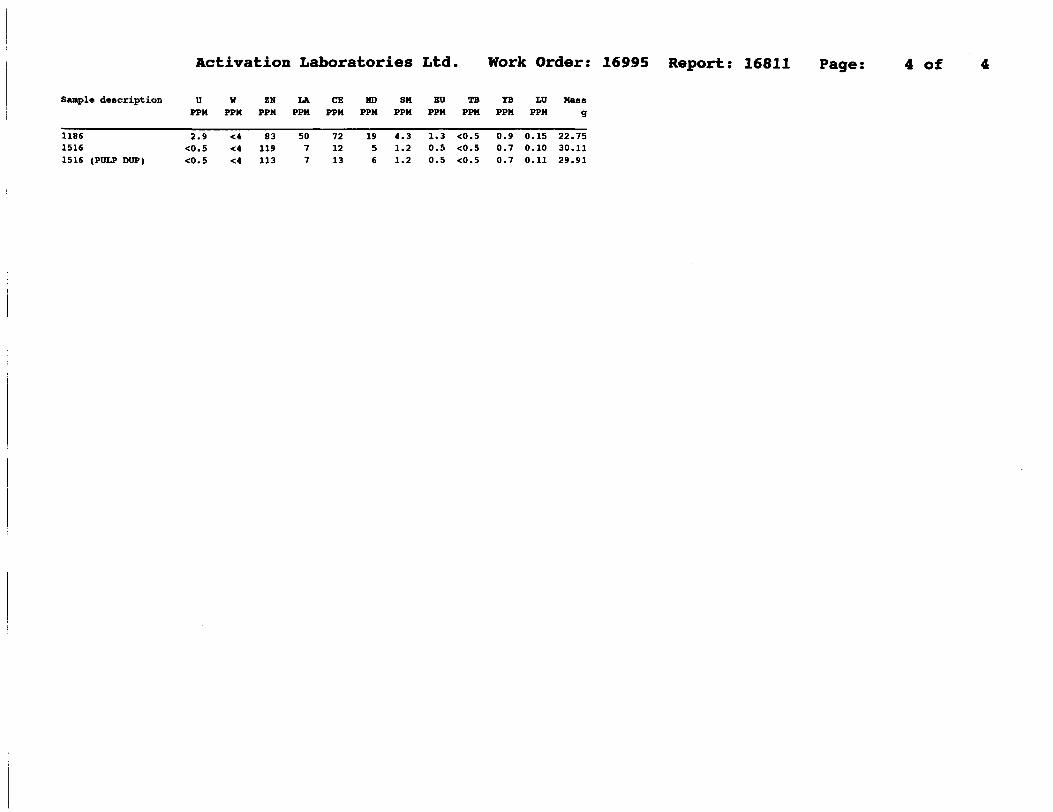
Activation Laboratories Ltd. Work Order: 16995 Report: 16811 Page: 4 of
Sample description
1186 15161516 (PULP DUP)
UPPM
2.9 •CO. 5•eO.5
W ZNPPM PPM
^ 83^ 119<4 113
LAPPM
5077
CEPPM
721213
MDPPM
19 56
SMPPM
4.3 1.21.2
BUPPM
1.3 0.50.5
TBPPM
<0.5•CO. 5
YBPPM
0.9 0.70.7
LUPPM
0.15 0.100.11
Maesg
22.75 30.1129.91
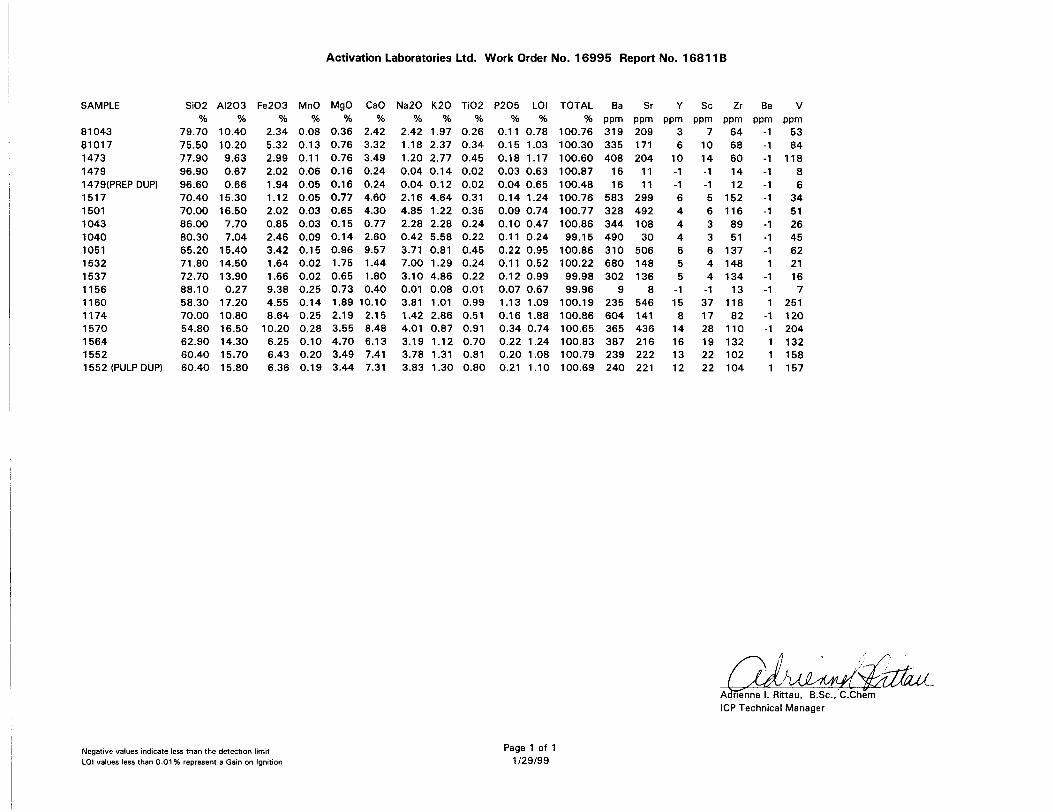
Activation Laboratories Ltd. Work Order No. 16995 Report No. 16811B
SAMPLE
8104381017147314791479IPREPDUP)15171501104310401051153215371156116011741570156415521552 (PULPDUP)
Si02"h
79.7075.5077.9096.9096.6070.4070.0086.0080.3065.2071.8072.7088.1058.3070.0054.8062.9060.4060.40
AI203%
10.4010.209.630.670.6615.3016.507.707.04
15.4014.5013.900.2717.2010.8016.5014.3015.7015.80
Fe203'to
2.345.322.992.021.941.122.020.852.463.421.641.669.384.558.64
10.206.256.436.36
MnO"h
0.080.130.110.060.050.050.030.030.090.150.020.020.250.140.250.280.100.200.19
MgOVo
0.360.760.760.160.160.770.650.150.140.961.750.650.731.892.193.554.703.493.44
CaO"/o
2.423.323.490.240.244.604.300.772.609.571.441.800.4010.102.158.486.137.417.31
Na20"/o
2.421.181.200.040.042.164.852.280.423.717.003.100.013.811.424.013.193.783.83
K20"/o
1.972.372.770.140.124.641.222.285.580.811.294.860.081.012.860.871.121.311.30
Ti02"/o
0.260.340.450.020.020.310.350.240.220.450.240.220.010.990.510.910.700.810.80
P205 LOI•ft 0A
0.11 0.780.15 1.030.18 1.170.03 0.630.04 0.650.14 1.240.09 0.740.10 0.470.11 0.240.22 0.950.11 0.520.12 0.990.07 0.671.13 1.090.16 1.880.34 0.740.22 1.240.20 1.080.21 1.10
TOTAL"/o
100.76100.30100.60100.87100.48100.76100.77100.8699.15
100.86100.2299.9899.96
100.19100.86100.65100.83100.79100.69
Bappm3193354081616
583328344490310680302
9235604365387239240
Srppm2091712041111
29949210830
506148136
8546141436216222221
Yppm
3610-1-16444655-115814161312
Seppm
71014-1-1
5633644-1371728192222
Zr Bppm ppn6468601412
1521168951
13714813413
11882110132102104
3 V
i ppm5384118
86
345126456221
1 161 71 2511 1201 2041 1321 1581 157
Adrienne l. Rittau, B.Se., C.Chim ICP Technical Manager
Negative values indicate less than the detection limit LOt values less than 0.01 'fa represent a Gain on Ignition
Page 1 of 1 1/29/99
Established 1928
Swastika LaboratoriesA Division of Assayers Corporation Ltd.
Assaying - Consulting - Representation
Geochemical Analysis Certificate 9W-2446-RG1Company: M. SUTTON Date: SEP-03-99Project:Attn: M. Sutton
We hereby certify the following Geochemical Analysis of 1 1 Chip samples submitted AUG-31-99 by .
Sample Number6001 6002 6003 6004 60056006 6007 6008 6009 6010
Cu PIM440 413 17
258 16389 56
286 554 158
Pb PIM239 41 27 48 4346 39 634327
Zn PIM810
5920 41
655375190 68
630 3850 691
6011
Certified by-
l Cameron Ave., P.O. Box 10, Swastika, Ontario POK l TO Telephone (705)642-3244 Fax (705)642-3300
inic
D
r- oo
01 Q
|T-
CN co
"T"?
(\J l
CM CVJ
CVJ O
J CO
l CO
CO CO
CO C1)
Tax Reg. ^
l*M::^KiRKbMD ^' ; -":^ iSi'lf^^ ; -P^.'l-7t)5-567-6^20^^^||
'"'•' ''••' '-~""~:!~'^~~ ; .'•'"" - ; -rr-i "'4 inc net ooftitX ?U O if'^i',:TCL1 705 567 329S
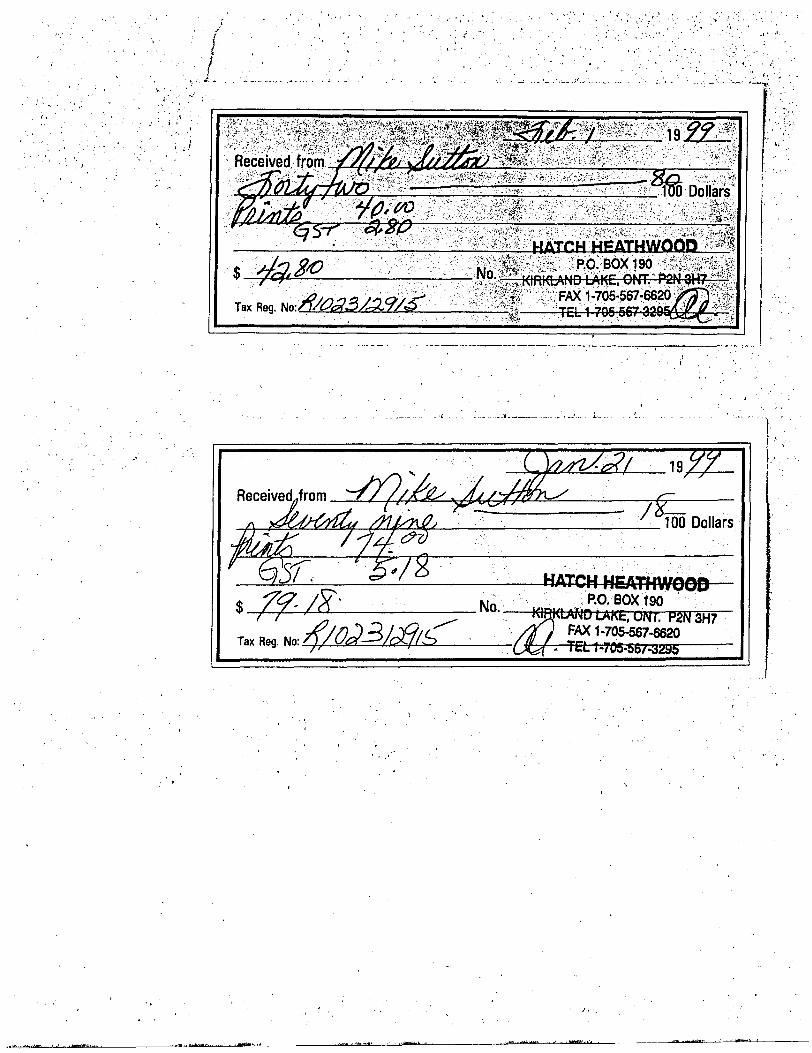
ReceivedJrom ~~7/ /19
^ 100 Dollars
-HAICH-HEATHWOOD*-r -,r 7Tax Reg. No: LL
NO.; RO..BpXl90LAKE, Ortr. P2N 3H7
FAX 1-705-567-6620
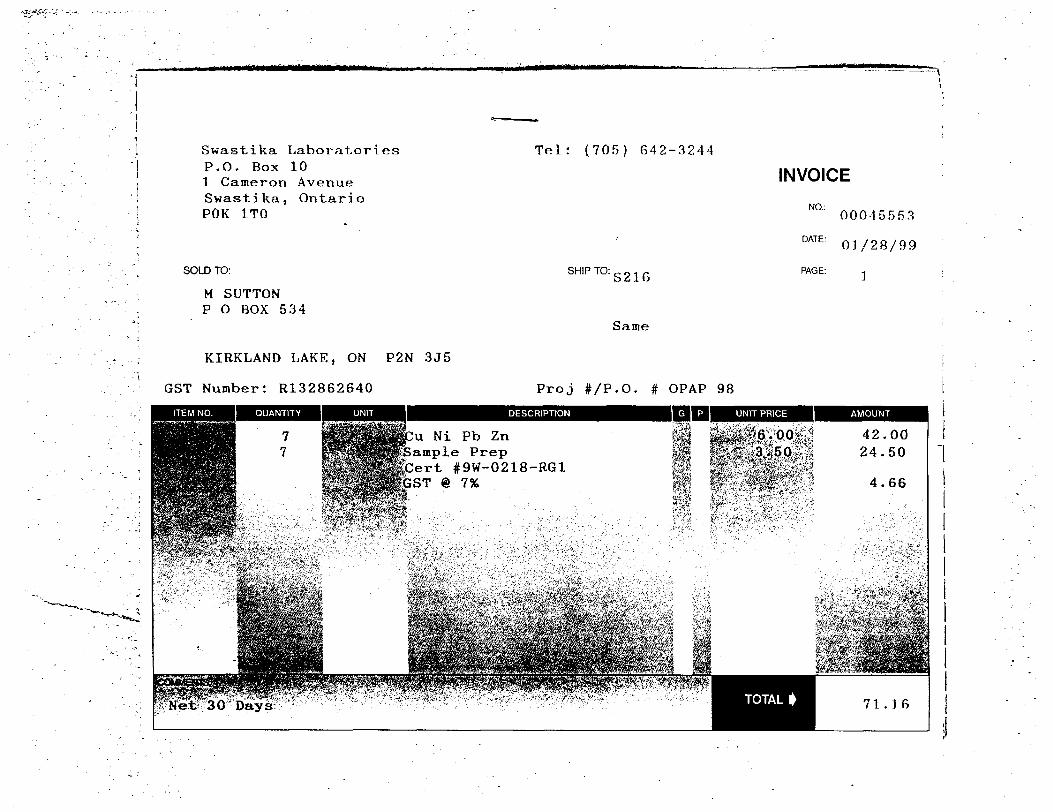
Swastika Laboratories P.O. Box 10 l Cameron Avenue Swastika, Ontario POK 1TO
Tel: (705) 642-3244
SOLD TO: SHIP TO: S216M SUTTON P O BOX 534
KIRKLAND LAKE, ON P2N 3J5
GST Number: R1328G2640
Same
Proj f/P.O. # OPAP 98
INVOICE
NO.:
DATE:
PAGE:
00045553
01/28/99
u Ni Pb Zn ample Prep ert #9W-0218-RG1
GST @ T&i
Net??30 * Days
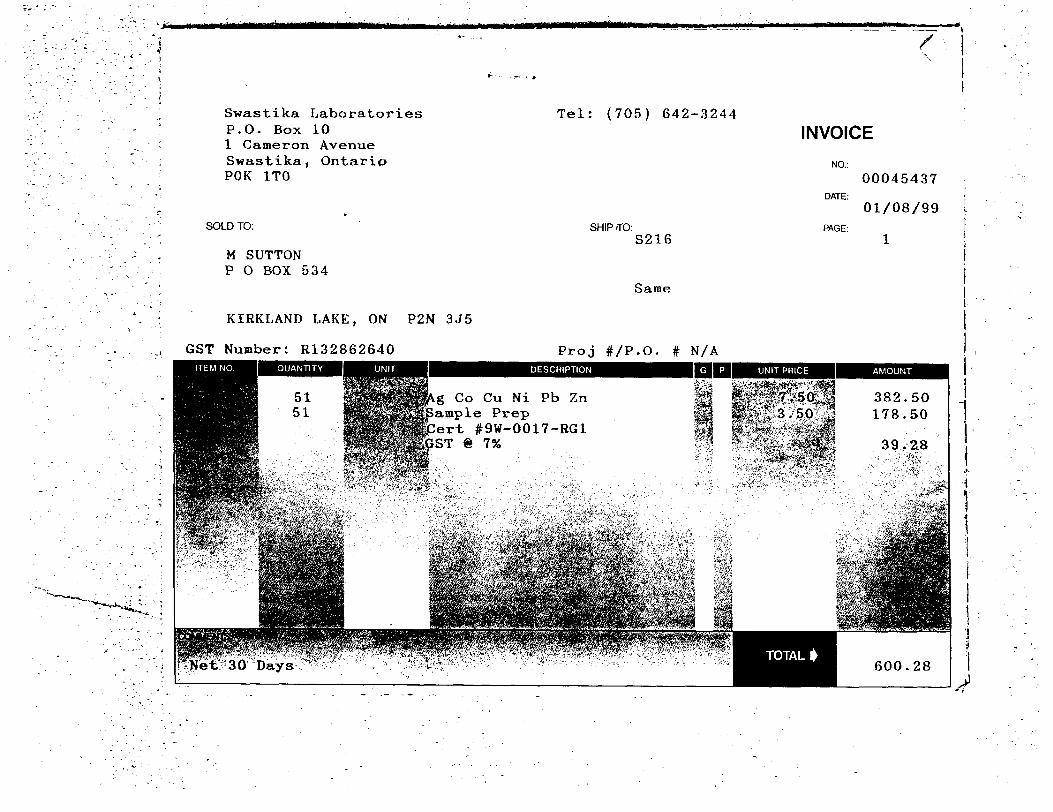
Swastika Laboratories P.O. Box 10 l Cameron Avenue Swastika, Ontario POK 1TO
SOLD TO:
M SUTTONP O BOX 534
KIRKLAND LAKE, ON P2N 3J5
GST Number: R132862640
Tel: (705) 642-3244
INVOICE
NO.:
SHIP TO:S216
Same
Proj #7P.O. # N/A
IB! m
DATE:
PAGE:
00045437
01/08/99
g Co Cu Ni Pb Zn ample Prep ert #9W-0017-RG1 ST 6 756
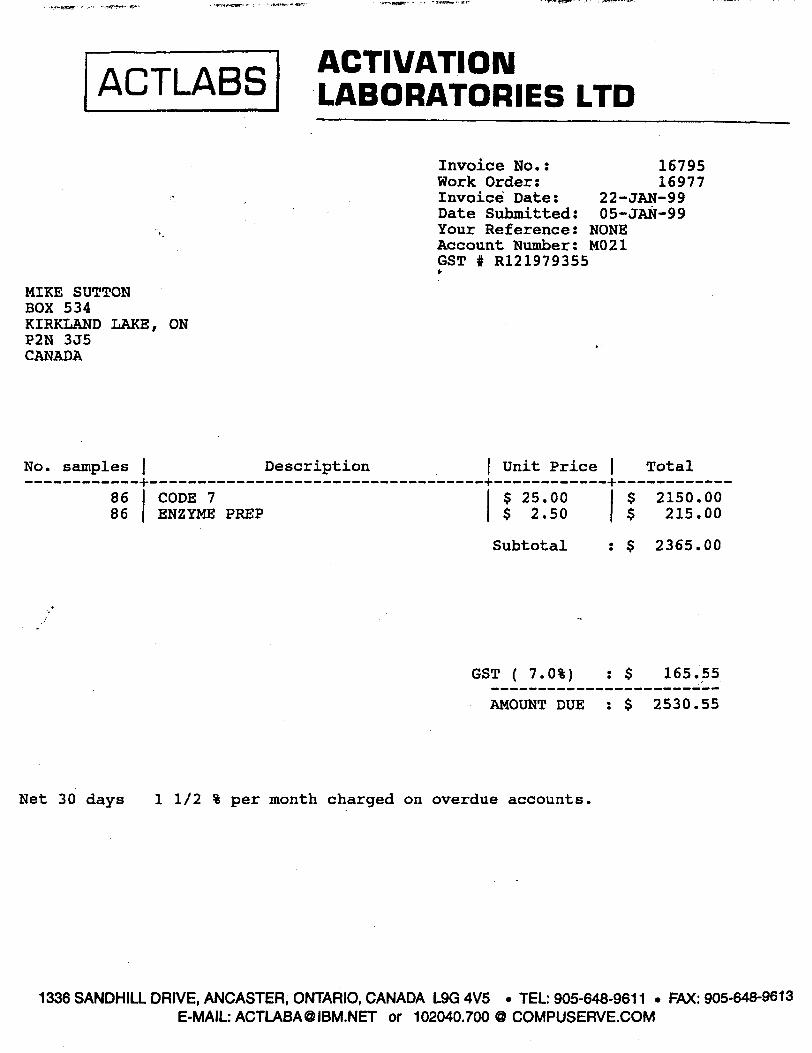
ACTLABS ACTIVATION LABORATORIES LTD
Invoice No.: Work Order: Invoice Date: Date Submitted: Your Reference:
16795 16977
22-JAN-99 05-JAN-99
NONEAccount Number: M021 GST # R121979355
MIKE SUTTONBOX 534KIRKLAND LAKE, ONP2N 3J5CANADA
No. samples j Description Unit Price | Total
86 86
CODE 7 ENZYME PREP
$ 25.00 $ 2.50
$ $
2150.00 215.00
Subtotal $ 2365.00
GST ( 7
AMOUNT DUE
165.55
2530.55
Net 30 days l 1/2 S: per month charged on overdue accounts.
1336 SANDHILL DRIVE, ANCASTER, ONTARIO, CANADA L9G 4V5 . TEL: 905-648-9611 . FAX: 905-648-9613 E-MAIL: [email protected] or 102040.700 @ COMPUSERVE.COM
01/29/99 18:12 O19056489613 ACTLABS El 001
ACTLABS ACTIVATION LABORATORIES LTD
MIKE SUTTONBOX 534KIRKLAND LAKE, ONP2N 3J5CANADA
Invoice No.i Work Order: Invoice Date: Date Submitted:
16811 16995
25-JAH-99 07-JAN-99
Your Reference: HONE Account Number: 2377 GST # R121979355
Ho. samples | Description l Unit Price Total
644617
CRUSHID4B
AMD MILL MILDi--- —— -—— -— i
S 6.00S 11.75S 27.00
S5S
384.00540.50459*00
Subtotal S 1383.50
GST ( 7.04) i 5 96*85
AMOUNT DUE : S 1480.35
30 days l 1/2 4 per month charged on overdue accounts*
1336 SANDHILL DRIVE, ANCASTER, ONTARIO, CANADA L9G 4V5 . TEL: 905-648-9611 . FAX: 905-648-9613 E-MAIL ACTLABAe IBM.NET or 102040.700 @ COMPUSERVE.COM
ika Laboratoriesf; 1 !" 'T1 ':--f,. ; A -;~:. H a 'V f- 1' T K t.'
SwaKt, i k 8- ; On L a r it?POK iT ft
SOLDTO:
M SUTTONP O BOX 534.
KIO.KLAWD fjAKE, ON'
T Number: RI 32862640
SHIP TO:
•O*.- 4 -S /p M jv iv /' . ,.. ,j .1 ,- s - -' - -i.-
INVOICENO.:
DATE:09/ ' /
PAGE:
33.00rs 5016 5038.50
l 09/11/97 l
l
i3
O
[j On
*.CO
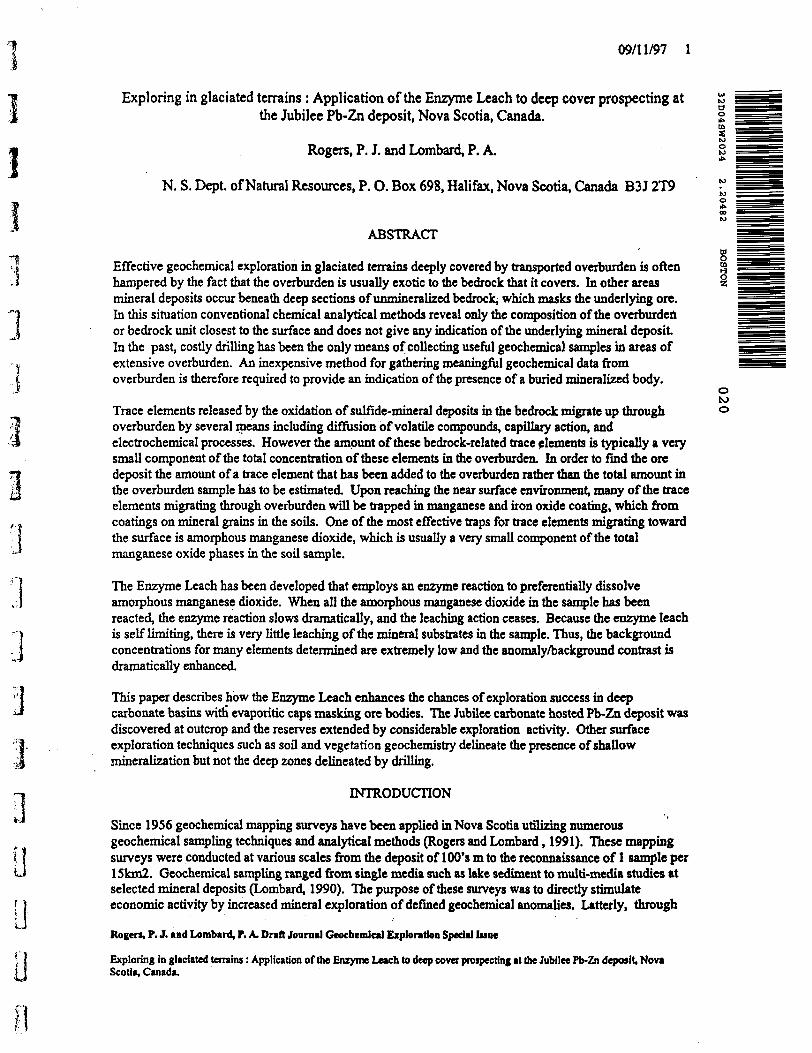
Exploring in glaciated terrains: Application of the Enzyme Leach to deep cover prospecting at the Jubilee Pb-Zn deposit, Nova Scotia, Canada.
Rogers, P. J. and Lombard, P. A. S
N. S. Dept. of Natural Resources, P. O. Box 698, Halifax, Nova Scotia, Canada B3J2T9 ^o rf*.COto
ABSTRACTBo
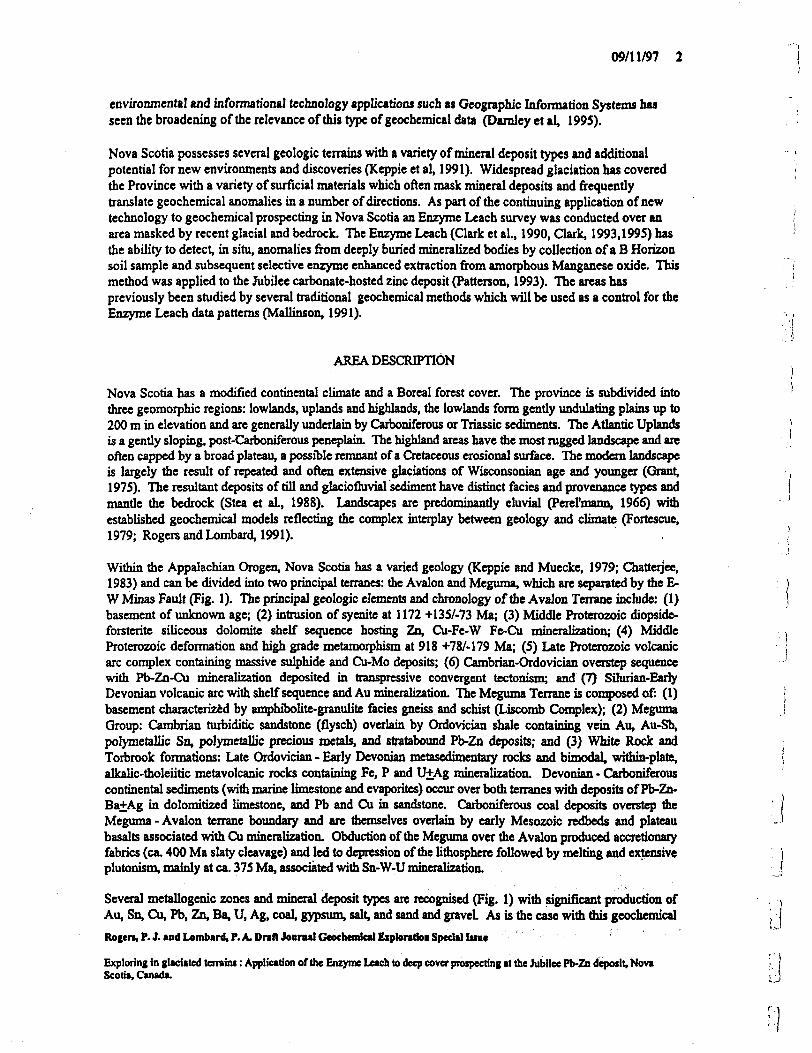
Effective geochemical exploration in glaciated terrains deeply covered by transported overburden is often ^hampered by the fact that the overburden is usually exotic to the bedrock that it covers. In other areas i mineral deposits occur beneath deep sections of unmineralized bedrock, which masks the underlying ore. In this situation conventional chemical analytical methods reveal only die composition of the overburden or bedrock unit closest to the surface and does not give any indication of the underlying mineral deposit In the past, costly drilling has been the only means of collecting useful geochemical samples in areas of extensive overburden. An inexpensive method for gathering meaningful geochemical data fromoverburden is therefore required to provide an indication of the presence of a buried mineralized body.
o toTrace elements released by the oxidation of sulfide-mineral deposits in the bedrock migrate up through 0 overburden by several means including diffusion of volatile compounds, capillary action, and electrochemical processes. However the amount of these bedrock-related trace elements is typically a very small component of the total concentration of these elements in the overburden. In order to find the ore deposit the amount of a trace element that has been added to the overburden rather than the total amount in the overburden sample has to be estimated. Upon reaching the near surface environment, many of the trace elements migrating through overburden will be trapped in manganese and iron oxide coating, which from coatings on mineral grains hi the soils. One of the most effective traps for trace elements migrating toward the surface is amorphous manganese dioxide, which is usually a very small component of the total manganese oxide phases in the soil sample.
The Enzyme Leach has been developed that employs an enzyme reaction to preferentially dissolve amorphous manganese dioxide. When all the amorphous manganese dioxide in the sample has been reacted, the enzyme reaction slows dramatically, and the leaching action ceases. Because the enzyme leach is self limiting, there is very little leaching of the mineral substrates in the sample. Thus, the background concentrations for many elements determined are extremely low and the anomaly/background contrast is dramatically enhanced.
This paper describes how the Enzyme Leach enhances the chances of exploration success in deep carbonate basins with* evaporitic caps masking ore bodies. The Jubilee carbonate hosted Pb-Zn deposit was discovered at outcrop and the reserves extended by considerable exploration activity. Other surface exploration techniques such as soil and vegetation geochemistry delineate the presence of shallow mineralization but not the deep zones delineated by drilling.
INTRODUCTION
Since 1956 geochemical mapping surveys have been applied in Nova Scotia utilizing numerous geochemical sampling techniques and analytical methods (Rogers and Lombard, 1991). These mapping surveys were conducted at various scales from the deposit of 100's m to the reconnaissance of l sample per 15km2. Geochemical sampling ranged from single media such as lake sediment to multi-media studies at selected mineral deposits (Lombard, 1990). The purpose of these surveys was to directly stimulate economic activity by increased mineral exploration of defined geochemical anomalies. Latterly, through
Rogers, P. J. and Lombard, P. A. Draft Journal Geochemical Eiploration Special Issue
Exploring in glaciated terrains: Application of the Enzyme Leach to deep cover prospecting at the Jubilee Pb-Zn deposit, Nova Scotia, Canada.
09/11/97 2
environmental and informational technology applications such as Geographic Information Systems has seen the broadening of the relevance of this type of geochemical data (Darnley etal, 1995).
Nova Scoria possesses several geologic terrains with a variety of mineral deposit types and additionalpotential for new environments and discoveries (Keppie et al, 1991). Widespread glaciation has coveredthe Province with a variety of surficial materials which often mask mineral deposits and frequentlytranslate geochemical anomalies in a number of directions. As pan of the continuing application of newtechnology to geochemical prospecting in Nova Scotia an Enzyme Leach survey was conducted over anarea masked by recent glacial and bedrock. The Enzyme Leach (Clark et al., 1990, Clark, 1993,1995) hasthe ability to detect, in situ, anomalies from deeply buried mineralized bodies by collection of a B Horizonsoil sample and subsequent selective enzyme enhanced extraction from amorphous Manganese oxide. Thismethod was applied to the Jubilee carbonate-hosted zinc deposit (Patterson, 1993). The areas haspreviously been studied by several traditional geochemical methods which will be used as a control for theEnzyme Leach data patterns (Mallinson, 1991). - ,
. -; . ,\
AREA DESCRIPTIONj
Nova Scotia has a modified continental climate and a Boreal forest cover. The province is subdivided into 'three geomorphic regions: lowlands, uplands and highlands, the lowlands form gently undulating plains up to200 m in elevation and are generally underlain by Carboniferous or Triassic sediments. The Atlantic Uplands jis a gently sloping, post-Carboniferous peneplain. The highland areas have the most rugged landscape and are )often capped by a broad plateau, a possible remnant of a Cretaceous erosional surface. The modern landscapeis largely the result of repeated and often extensive glaciation* of Wisconsonian age and younger (Grant,1975). The resultant deposits of till and glaciofluvial sediment have distinct facies and provenance types and jmantle the bedrock (Stea et al., 1988). Landscapes are predominantly eluvial (PcTcl'mann, 1966) with 'established geochemical models reflecting the complex interplay between geology and climate (Fortescue,1979; Rogers and Lombard, 1991). }
\
Within die Appalachian Orogen, Nova Scotia has a varied geology (Keppie and Muecke, 1979; Chatterjee,1983) and can be divided into two principal terrenes: the Avalon and Meguma, which are separated by the E- )W Minas Fault (Fig. 1). The principal geologic elements and chronology of the Avalon Terrane include: (1) \basement of unknown age; (2) intrusion of syenite at 1172 +135/-73 Ma; (3) Middle Proterozoic diopside-forsterite siliceous dolomite shelf sequence hosting Zn, Cu-Fe-W Fe-Cu mineralization; (4) Middle ,Proterozoic deformation and high grade metamorphism at 918 +78/-179 Ma; (5) Late Proterozoic volcanic larc complex containing massive sulphide and Cu-Mo deposits; (6) Cambrian-Ordovician overstep sequencewith Pb-Zn-Cu mineralization deposited in transpressive convergent tectonism; and (7) Silurian-EarlyDevonian volcanic arc with shelf sequence and Au mineralization. The Meguma Terrane is composed of: (1) Jbasement characterized by amphibolite-granulite facies gneiss and schist (Liscomb Complex); (2) Meguma jGroup: Cambrian turbiditic sandstone (flysch) overlain by Ordovician shale containing vein Au, Au-Sb,polymetallic Sn, polymetallic precious metals, and stratabound Pb-Zn deposits; and (3) White Rock andTorbrook formations: Late Ordovician - Early Devonian metasedimentary rocks and bimodal, within-plate,alkalic-tholeiitic metavolcanic rocks containing Fe, P and U+Ag mineralization. Devonian - Carboniferouscontinental sediments (with marine limestone and evaporites) occur over both terranes with deposits of Pb-Zn-Ba+Ag in dolomitized limestone, and Pb and Cu in sandstone. Carboniferous coal deposits overstep the lMeguma - Avalon terrane boundary and are themselves overlain by early Mesozoic redbeds and plateau -'basalts associated with Cu mineralization. Obduction of the Meguma over the Avalon produced accretionaryfabrics (ea. 400 Ma slaty cleavage) and led to depression of the lithosphere followed by melting and extensiveplutonism, mainly at ea. 375 Ma, associated with Sn-W-U mineralization.
Several metallogenic zones and mineral deposit types are recognised (Fig. 1) with significant production of , , Au, Sn, Cu, Pb, Zn, Ba, U, Ag, coal, gypsum, salt, and sand and gravel As is the case with mis geochemical ; j
l.sJ
Roger*, P. J. and Lombard, P. A. Drift Journal Gtochemlcal Exploration Special brae
Exploring in glaciated terrain!: Application of the Enzyme Leach lo deep cover prospecting at the Jubilee Pb-Zn deposit, Nova i, ; Scotia, Canada. i j
1 09/11/97 3
-s study most geoscience surveys have been largely funded by cooperative economic development agreements , J between the Federal Department of Natural Resources (Geological Survey of Canada) and the provincial
Department of Natural Resources.
1J JUBILEE EXPLORATION HISTORY
l The Jubilee deposit is located at latitude 45 59N and longitude 60 58 W, about 3 km southeast of the village l of Little Narrows on the Zona Peninsula, Victoria County, Cape Breton Island some 60 km southeast of
Sydney (Fig. 1). Sinkhole development and karst topography plus old gypsum quarries are common-j throughout much of the area. The Jubilee showing was discovered in 1935 following application of
l glacial boulder tracing. Subsequent exploration took place along the outcrop/basal till contact withdrilling, geophysics and soil geochemistry by several companies including Minex, Mcintyre Porcupine, Gerry Mining, Amax Minerals, Texas Gulf and more latterly Falconbridge up to the present day (Hein et
j al., 1988 and Mallinson, 1991). Each of these stages of exploration have provided various sub-cropping J extensions to the Jubilee deposit (Fig. 2).
i The deposit area is underlain by Horton Group continental red beds overlain by the marine carbonates andl evaporites of the Windsor Group. Horton sediments range in thickness from 1000 to 2700 m and the basal
carbonate unit 6m and 15m in the area of the Jublilee Fault, a postulated growth fault system (Isenor et al.,-^ 1980).
'•"* The entire Jubilee Deposit has an estimated resource of 2.5Mt at 4 to 507o Zn and Pb (Isenor et al., 1980) in 3 zones along the Jubilee Fault Main Zone. Mineralisation is of pyrite/marcasite-sphalerite-galena-
3 barite and plunges about 17 to the northwest for a minimum of 1700 m (Fig. 2). The deposit averages 3 to 5 m in width but can be up to 250 m locally with a 340 m vertical depth. Along the Jubilee Fault the mineralization is associated with breccia zones act as traps for Zn-Pb sulphide concentrations. Liquid
j j hydrocarbons (tar and a lighter dark brown distillate) along with solid bitumen occur throughout the core as i vug fillings and along some fractures Mallinson, 1991).
FIELD AND SAMPLE COLLECTION METHODS
O O
o li
In 1991 vegetation and soil samples (Fig. 3) were collected at a 500m spacing as part of a series of multi media geochemical surveys of selected mineral deposits in Nova Scotia. The vegetation samples were collected from the most commonly available species: Red Spruce twig and bark and Balsam Fir twigs following methods outlined in Dunn and Rogers 1993. All samples were ashed prior to analysis by Instrumental Neutron Activation. B-horizon soils were collected from shallow hand dug pits for normal and Enzyme Leach study. The Enzyme Leach samples were air dried below 40 C to maintain the volatile content and sieved to pass 60 mesh (Clark et al., 1990). The normal soil samples were oven dried and sieved to pass an 80 mesh screen. During the discovery of die Jubilee deposit soil geochemistry was very effective in locating the mineralization in the immediate area of the deposit. As part of this project a 'total" extraction was used as opposed to the earlier partial extraction methods to further test the soil response. The conventional soil samples were analyzed after a 4 acid "total" extraction using Inductively Coupled Plasma, Optical Emission Spectroscopy while the Enzyme Leach soils were analyzed by Inductively Coupled Plasma (Mass Spectroscopy). Quality control procedures of the Geological Survey of Canada were used throughout (Garrett et al., 1980).
DATA ANALYSIS AND ANOMALY RECOGNITION
All the elements with values greater than background are plotted using Surfer. The plots consists of an image map providing colour differentiation between high values and low values. High values are plotted in warm colours and low values plotted in cool colours. A contour map is then plotted over the image plotRoger*, P. J. and Lombard, P. A. Draft Journal Gcocbrmlul Exploration Special tone
O Exploring in glaciated terrains: Application of the Enzyme Leach to deep cover prospecting at the Jubilee Pb-Zn deposit, Nova Scotia, Canada.
09/11/97 4
to enhance the plot. Finally a post plot is made of the sample sites and overlain on the other two plots.Once all the individual plots are made, a clear overlay is printed with the post plots for different families ofelements. These overlays are used to map out the concentric lows for the different families of elements.Once this analysis is completed, The patterns for the different families of elements are overlain. The ;intersection of the concentric lows define the oxidation anomalies. .
The Enzyme Leach develops 2 principal types of anomalies: oxidation and diffusion or apical anomalies inareas covered by transported overburden and it is important to recognize the nature and types of theseanomalies. The most important are usually oxidation anomalies, which are produced by the subtleoxidation of buried reduced bodies (Fig. 4). It is important to note that any reduced body (an ore deposit, abarren body of disseminated pyrite, a buried geothermal system, etc.) can produce a similar looking joxidation anomaly. Once these anomalies are found the fundamental process is one of pattern recognition. i
Oxidation Anomalies are characterized by very high contrast values for the Oxidation Suite of elements ;including ; CI, Br, I, As, Sb, Mo, W, Re, Se, and Te. Often V, U, Th, rare-earth elements, and base metals i(Cu, Zn, Cd...) will be anomalous in the same soil samples, but with reduced contrast. Less commonly,enzyme-soluble Au and enzyme-soluble Hg will be found in the area of these anomalies. Oxidation ,anomalies typically form an asymmetrical halo or ragged, partial halo around the buried reduced body. \When interpreting oxidation suite halos, is vital to look at the patterns for all the elements in the OxidationSuite defined above as illustrated in Figure. 5.
i The reduced body underlies the central low within that halo. '
The trace element suite in oxidation anomalies, although often enriched in many types of metal deposits, isnot typically representative of the composition of the buried reduced body. For example, essentially the isame suite of elements forms halos around petroleum reservoirs and buried porphyry deposits.
Diffusion or Apical Anomalies occur as highs directly over the source of the anomaly rather than forming ia halo around the source. The source of the anomaly can be the actual source of the anomalous trace 'elements, or it can be a structure such as a fault that facilitates the movement of trace elements to thesurface. In both cases, the anomaly will usually be almost directly over the sub-crop of the fault. In idiffusion anomalies, the suite of trace elements represented in the anomaly will often be indicative of the Jchemical composition of the ultimate source of those trace elements. Diffusion anomalies are notcharacterized by the oxidation suite of elements. Fault-related diffusion anomalies can contain many of the -ioxidation suite elements. Where a deeply buried reduced body is intersected by a fault, many of the \oxidation suite elements will commonly form an extremely high-contrast anomaly directly over the trace ofthe buried fault. Otherwise, diffusion anomalies usually exhibit a more diminished contrast abovebackground than do oxidation anomalies. - i
RESULTS
A: Vegetation Geochemistry ;
All the vegetation data was contoured using the Surfer (6.01) computer program to illustrate the spatialrelationship to the Jubilee deposit j
Red Spruce Bark:
Arsenic, Gold, Cerium, Chromium, Cesium, Rubidium, Antimony, Thorium and Uranium all had a similarrelationship of a southwesterly displacement due to glacial smearing down-ice from the mineralized area(Fig. 6a, b and c). Zinc and Bromine formed a distinct low while Barium, Cobalt and Molybdenum ' )
(J Rogers, P. J. md Lombard, P. A. Draft Journal Geochemical Exploration Special tone
Exploring in glaciated terreini: Application of the Enzyme Leach to deep cover prospecting at the Jubilee Pb-Zn deposit, Nova . Scotia, Canada. .' j
Q Q
09/11/97 5
indicated enrichment to the West of the deposit (Fig. 7a, b and c). Silver and Nickel have no recognizable signature.
n Red Spruce Twig:
Similar data patterns were noted to those of the bark with Arsenic, Gold, Cerium, Chromium, Cesium (reduced), Rubidium, Antimony and Thorium outlining the glacial smearing (Fig. 8a, b and c). As has
j been noted previously in other detailed vegetation studies Nova Scotia (Rogers and Dunn, 1991) a i differential response between media is present as the Bromine, Molybdenum and Zinc anomalies in this
case are spatially related to the mineralized source up-ice. Barium, Cobalt, Silver, Nickel and Uranium ~] have no anomalous response.
Balsam Fir Twig:
n The differential vegetation media response is also well illustrated by this data as out of the previously--' anomalous groupings only Gold, Cerium, Chromium, Cesium, Rubidium and Antimony indicate the
glacial smearing (Fig. 9a, b and c) with a much reduced response. Thorium occurs as a low in the Balsam l Fir twigs while Silver, Arsenic, Barium, Bromine, Cobalt, Molybdenum, Uranium and Zinc are not
'3 anomalous. Nickel has an East-West trend possibly indicating a bedrock fault
l B: Conventional Soil Sampling4
Because of the large distance between soil sampling lines (Fig.3) the data could not be effectively .-.j contoured and were plotted as profiles in Excel 7.0. For each of the 3 lines the analytical package providedf 4 35 elements. The data will be presented from the shallowest burial (Line 3) to deepest (Line l).iJ -
Line 3 Outcrop Deposit:
-J Silver, Gold, Antimony, Bismuth, Tungsten and Niobium had no response while Molybdenum, Arsenic,Uranium, Thorium, Cadmium, Vanadium, Phosphorous, Magnesium, Sodium, Potassium, Beryllium,
'j Zirconium and Yttrium a small one. Of the other elements Iron and Manganese have anomalies possibly j associated with the Jubilee Main Fault (Fig. lOa). Nickel, Cobalt, Arsenic and Lead with minor Vanadium
have the best response to the mineralisation and are the principal pathfinders here (Fig. l Ob and c). Copper-j and Lithium have only a slight enhancement while Zinc seems to be indicating an additional zone to the
j west of the main area of mineralisation (Fig. lOc).i,-*
Line 2 Buried Deposit (approximately 40m):
;j A similar list of elements have no or little response for this sampling line including Arsenic, Vanadiumand Cobalt (Fig. l la). Iron, Lithium and Nickel have a slight positive anomaly, Manganese a negative or
/l low anomaly. Zinc and Barium appear to be the sole pathfinders here with anomalies (Fig. l la, b and c).I Line l Buried Deposit (approximately 350m):
Additional elements to those of Line 3 with little response include Barium, Nickel, Cadmium, Calcium, Titanium and Boron. Iron, Manganese, Vanadium, Lithium, Arsenic, Lead and Copper have a small but positive response away from the main ore zone at sample 022 possibly related either to a fault or a zone of brecciation. Zinc, Barium, Nickel and Cobalt reflect the trend of the sub-cropping ore zone (Fig. 12a, b and c). All elements have a muted response with low contrast and values when compared to Line 3 as illustrated for Zinc in Figure 13.
C: Enzyme Leach Soil SamplingRogers, P. J. and Lombard, P. A. Draft Journal Gtocbemleal Exploration Special Issue
Exploring in glaciated terrains : Application of the Enzyme Leach to deep cover prospecting at the Jubilee Pb-Zn deposit, Nova Scotia, Canada.
09/11/97 6
As with the conventional soils the data plotted as profiles in Excel 7.0 for each line, in this case the analytical package provides 60 elements and is presented from the shallowest burial (Line 3) to deepest (Line 1).
Line 3 Outcrop Deposit:
Here no response was noted for a large group of elements including : REE, Beryllium, Silver, Indium, Platinum, Gold, Mercury, and Bismuth with a low response for Germanium, Niobium, Antimony, Tellurium, REE, Thallium, Thorium, Tungsten, Uranium and Cesium.
The halogen elements have a marked Apical or Diffusion Anomaly response, especially Bromine over the ore zone (Fig. 14a) along with the economic elements Arsenic, Lead, Zinc, Nickel and Cobalt (Fig. 14b). A well developed Oxidation Anomaly about 800m wide is also seen in the profiles for Rubidium, Strontium, Molybdenum and Barium (Fig. 14c)
Line 2 Buried Deposit (approximately 40m):
Along this line no response was noted for a large group of elements including : REE, Beryllium, Silver, Indium, Platinum, Gold, Mercury, Thallium, Selenium and Bismuth with a low response for Germanium, Molybdenum, Antimony, Tellurium, Gadolinium, Hafnium, Tantalum, Tungsten and Cesium.
The Halogen elements have Apical or Diffusion anomalies over the ore-zone (Fig. ISa) along with Zinc, Cadmium, Manganese, Gallium with minor Lead and Antimony (Fig. 15b) Several Oxidation Suite elements indicate a broad low about 600m wide including: Rubidium, Titanium, Tin, Lithium, Copper, Zirconium, Yttrium, lanthanum, Cerium, Samarium, Thorium, Niobium and Scandium (Fig. 15c).
Line l Buried Deposit (approximately 350m)
Enzyme Leach Oxidation Anomaly Lows are noted for several elements as a narrow feature over the projected sub-crop of the mineralization at sample 022 (Fig. 16a and b). The halogen elements Chlorine, Bromine and Iodine have a small but well defined Oxidation Low along with Lithium, Manganese, Arsenic, Strontium, Cadmium, Cobalt, Nickel, Copper, Zinc and Zirconium (Fig. 16a). The mineralization sub-crop is also detailed by Apical or Diffusion anomalies for Vanadium, Gallium, Rubidium, Tin, Yttrium, Lanthanum, Cerium, REE with minor Scandium, Titanium and Barium (Fig. 16b and c).
DISCUSSION
The patterns shown by the vegetation geochemistry indicate the value of this method as a cost-effective reconnaissance tool when prospecting for carbonate hosted deposits as the 500m grid intersected and defined the down-ice dispersion from the Jubilee deposit This result is consistent from other detailed studies of turbidite hosted gold deposits in die Meguma Zone (Rogers and Dunn, 1991) where vegetation geochemistry was able to delineate the narrow ribbon shaped glacial dispersion trains so typical of Nova Scotia. The results also illustrate die common differential response between media as die Red Spruce bark gives die more consistent spatial response to die mineralization whereas die Red Spruce and Balsam Fir twig data is more equivocal. The response from all 3 media suggest that die spacing of 500m is adequate to detect die Jubilee deposit but is probably die maximum that could be effectively employed in geochemical exploration.
Conventional soil sampling using a partial 2 acid extraction was initially employed to explore die property and defined die shallow sub-cropping mineralization principally along die bedrock-basal till contact InRogers, P. J. and Lombard, P. A. Draft Journal Geochemical Exploration Special Issue
Exploring h) glaciated terrains: Application of the Enzyme Leach to deep cover prospecting at the Jubilee Pb-Zn deposit, Nova Scotia, Canada.
J
O
y u
09/11/97 7
this study utilizing a 4 acid "total" extraction at the surface outcrop on Line l the geochemical response "was muted and dominated by Iron and Manganese scavenging control producing false anomalies. Lead, Nickel, Cobalt and Arsenic with minor Vanadium were the only significant pathfinder as Barium was not effectively sampled by the total acid extraction. For Line 2 Zinc and Barium are the only significant pathfinders while along Line 3 the response is very muted with the Jubilee Main Fault dominating the response with Iron and Manganese. There is a varied response from the soil geochemistry, total extraction, as the deepest line had the lowest number of anomalies and values Surface methods here is an extreme difference in response to depth of burial as illustrated by the diminution of Zinc values. The soil sampling was constrained by topography, in particular karst which made sample collection difficult.
The Enzyme Leach soil sampling was effective in detecting the presence of Oxidation anomalies related to a reducing sulphide body at depth. Oxidation cells from 200 to 800m in width were indicated by numerous elements particularly of the Oxidation Suite, the narrowest were noted at surface with the widest at a depth of 350m along Line 3. The sampling spacing of 200m detected the mineralization but like the soil sampling was constrained by the topography. The Enzyme Leach also confirmed the marked influence of the faulting as a control on the mineralisation as Chlorine, Bromine and Iodine occurred as Apical anomalies on all lines. The width of the Oxidation Anomaly increases with depth reaching 800m at the deepest point controlled by drilling information.
CONCLUSIONS
All of the surface geochemical methods employed are capable of indicating the presence of the sub- cropping Jubilee Pb-Zn mineralization on Line l, but to a varying degree. Each method has a different and specialized response which is dependent on the type of media employed. The vegetation survey is perhaps the most cost-effective of all techniques employed for primary reconnaissance but at a sample spacing of no more than 500m. The vegetation geochemistry is very species dependent and will be constrained by availability and type of tree. As is very common in the glaciated terrain of Nova Scotia smearing of anomalies into thin ribbon shaped dispersion trains is again present here. Vegetation geochemistry outlines these dispersion trains in all of the 3 species sampled, Red Spruce bark being the tree species of choice. The soil sampling spacing of 200m was sufficient to delineate the ore-zone, but 100m is recommended for future detailed work.
At the deposit scale the use of a total extraction on soils has resulted in significant information loss with muted contrast evident in most elements, particularly for pathfinder elements such as Barium. The dominance of Iron and Manganese geochemistry associated with the widespread faulting results in a generally poor response from the total extraction. The broad association of Iron and Manganese points to possible affinities with Irish type base metal deposits and could be used to focus an exploration program.
All surface geochemical methods do not delineate the deeply buried ore deposit as all anomalies are of very low contrast, if present at all on Line 3. Zinc geochemistry alters radically with increase in depth and shows no response at all to mineralization at a depth of 350m. The Enzyme Leach is the only surface geochemical technique to effectively identify the presence of a buried reduced body by a combination of Halogen, Oxidation Suite and Apical or Diffusion anomalies. The predominant fault control to the mineralization is illustrated by the Apical nature of the Chlorine, Bromine and Iodine anomalies. The Enzyme Leach indicates the presence of an electrochemical cell which broadens in width with increasing depth, up to 800m at a depth of 350m on Line 3. This method holds great promise for cost-effective ' exploration of the basal Windsor carbonate in Nova Scotia which is the prime vector for base metal deposits of Mississippi Valley or Irish, type.
REFERENCES
Rogers, P. J. and Lombard, P. A. Draft Journal Gcocbemlcal Exploration Special line
Exploring in glaciated terrains: Application of the Enzyme Leach to deep cover prospecting at the Jubilee Pb-Zn deposit, Nova Scotia, Canada.
09/11/97 8
Chatterjee, A. K. 1983. Metallogenic map of Nova Scotia; N.S. Dep. Natural Resources, Scale 1:500 000.
Clark, J.R., Meier, A.L., and Riddle, G., 1990, Enzyme leaching of surficial geochemical samples fordetecting hydromorphic trace-element anomalies associated with precious-metal mineralized bedrockburiedbeneath glacial overburden in northern Minnesota: in: Gold' 90, Society of Mining Engineers, Chapter 19,p. 189-207.
Clark, J.R., 1993. Enzyme-induced leaching of B-horizon soils for mineral exploration in areas of glacial overburden. Trans. Instn. Min. Metall. (Sect. B: Appl. earth sci.), 102: B19-B29.
Clark, I.R., (this issue), Concepts and models for interpretation of Enzyme Leach data. J. Geochemical Explor.
Darnley, A. G., Bjorklund, A., Bolviken, B., Gustasson, N., Koval, P.V., Plant, J.A., Steenfelt, A., Tauchid, M., and Xie, X., 1995. A Global Geochemical Datbasc for Environmental and Resource Management Recommendations for International Geochemical Mapping. Final Report of IGCP Project 259. Earth Sciences 19, UNESCO, Paris.
Fortescue, J. A. C. 1979, Environmental Geochemistry; Berlin-Heidleberg, Springer-Verlag, 347 p.
Garrett, R. G., Kane, V. E. and Zeigler, R. K. 1980. The management, analysis and display of regional geochemical data. Journal Geochemical Exploration, V. 13, p. 115-152.
Grant, D. R. 1975. Glacial style and the Quaternary stratigraphic record in the Atlantic Provinces, Canada; Geol. Surv. Can., Pap. 75-1B, p. 109-110.
Hein, F.J., Graves, M.C. and Ruffinan, A. 1988. Geology of the Jubilee zinc-lead deposit, Victoria County, Cape Breton Island, Nova Scotia. Geological Survey of Canada, Open File report 88-1891.
kenor, G.P., Stewart, E. and Chatterjee, A.K. 1980. Jubilee Lead-Zinc Deposit: in Chatterjee, A.K. et al., J Mineral Deposits and Mineralogenic Provinces of Nova Scotia, Field Trip Guidebook, Halifax 80 Joint j Annual Meeting of the Geological Association of Canada and the Mineralogical Association of Canada, 60- 63. T
!
Keppie, J. D. and Muecke, G. K. (Compilers) 1979. Geological Map of Nova Scotia; N.S. Dep. Mines andEnergy, Scale l :500 000. ^
iKeppie, J. D., Nance', R. D., Murphy, J. B. and Dostal, J. 1991. Northern Appalachians: Avalon and Meguma ' Terraces; in Dalhneyer R. D. and Lecorche, J. P., eds., The West African Orogens and Circum-Atlantic Correlatives, Berlin-Heidelberg, Springer-Verlag, p. 315-333. * i
Lombard, P. A. (Compiler) 1990. Geochemical Atlas of Nova Scotia, Part I: Drainage Surveys 1971 to 1987;N. S. Dep. Natural Resources, Open File Rept 90-015,119 p. ,
iMallinson, T. 1991. Report on Ae 1991 Diamond Drilling program, Jubilee Project Nova Scotia Department of Natural Resources Assessment Report 91-066
Patterson, J. M. 1993. Metalliferous environments in Nova Scotia, Nova Scotia Dep. Natural Resources, Information Series 22,59 p.
Roger*, P. J. md Lombard, P. A. Draft Journal Geochemical Exploration Special Issue
Exploring in glaciated terrains: Application of the Enzyme Leach to deep cover prospecting at the Jubilee Pb-Zn deposit, Nova Scotia, Canada.
, 09/11/97 9. J
l PcTcl'mann, A. I. 1966, Landscape Geochemistry (Translation No. 676, Geol. Surv. Can., 1972); Moscow, J Vysshaya Shkola, 388 p.
* Rogers, P. J. and Dunn, C. E. 1993. Trace element geochemistry of vegetation applied to mineral exploration j in eastern Nova Scotia, Canada; J. Geochem. Explor., v. 48, p. 71-95.
Rogers P. J. and Lombard P. A., 1991. Regional geochemical surveys conducted by the Nova Scotia l Department of Mines and Energy from 1957 to 1989; N. S. Dep. Natural Resource^ Open File Repi 90-017, ' 30 p.
~'l Rogers, P. J., Chatterjee, A. K. and Aucon J. W., 1990. Metallogenic domains and their reflection in regional j lake sediment surveys from the Meguma Zone, southern Nova Scotia; J. Geochem. Explor., v. 39, p. 153-174.
i Stea R. R., Turner, R. G., Finck, P. W. and Graves, R. M. 1988. Glacial dispersal in Nova Scotia: a zonal i concept; in MacDonald, D. R. and Mills, K. A., eds., Prospecting in Areas of Glaciated Terrain 1988; Can.
InstMin. Metall., p. 57-80.
O
o
o oi
Rogers, P. J. and Lombard, P. A. Draft Journal Geochemical Exploration Special brae
oH
Exploring in glaciated terrains: Application of the Enzyme Leach to deep cover prospecting at the Jubilee Pb-Zn deposit, Nova Scotia, Canada.
09/07/97 10
Figures
Figure l . Simplified geological map of Nova Scotia with principal mineral deposits and location of the Jubilee study area (alter Keppic and Muccke. 1979).
Figure 2. Geological map of the Jubilee deposit with geochemical sampling areas (after Mallinson, 1991).
Figure 3. Details of the Enzyme Leach and conventional soil sampling lines with drill crosssection (after Mallinson, 1991).
Figure 4. Enzyme Leach cross section of hypothetical electrochemical cell.
Figu re 5. Enzyme Leach variation of anomalous response with depth (after Clark, xxx).
Figure 6. Vegetation sampling : Red Spruce Bark - a) Gold, b) Arsenic and c) Chromium Surfer contour maps.
Figure 7. Vegetation sampling : Red Spruce Bark - a) Cobalt, b) Antimony and c) Zinc Surfer contour maps.
Figure 8. Vegetation sampling : Red Spruce Twig - a) Gold, b) Bromine and c) Thorium Surfer ' contour maps.
Figure 9. Vegetation sampling : Balsam Fir Twig - a) Cesium, b) Cerium and c) Antimony Surfer : contour maps.
Figure 10. Soil sampling : Total Leach Line 3 - a) Iron, b) Cobalt-Nickel and c) Copper-Lead . .1i
Figure 1 1. Soil sampling : Total Leach Line 2 - a) Zinc-Barium, b) Lithium and c) Iron .' \
Figure 12. Soil sampling: Total Leach Line l -a) Cobalt-Nickel, b) Barium-Zinc and c) \ Manganese.
Figure 13. Soil sampling -.Total Leach Lines l, 2 and 3 variation of Zinc values with depth of j cover.
Figure 14. Soil sampling : Enzyme Leach Line 3 - a) Chlorine-Bromine-Iodine, b) Zinc-Cadmium- j Gallium and c) Lanthanum-Cerium-Zirconium . j
Figure 15. Soil sampling : Enzyme Leach Line 2 - a), Chlorine-Bromine-Iodine, b) Zinc-Cadmium- Gallium and c) Lanthanum-Cerium-Zirconium .
Figure 16. Soil sampling : Enzyme Leach Line l - a), Chlorine-Bromine-Iodine b) Copper Lead Cobalt Nickel and c) Vanadium-Gallium-Rubidium .
Rogers,?. J. utd Lombard, P. A. Draft Journal Geochemical Exploration Spedil bioe . :
Exploring in gliculed temint: Application of tbe Enzyme Le*ch to deep cover proapedkg rt tbe Jubilee Pb-Zn deposit. Nova Sootia, Ctnida.
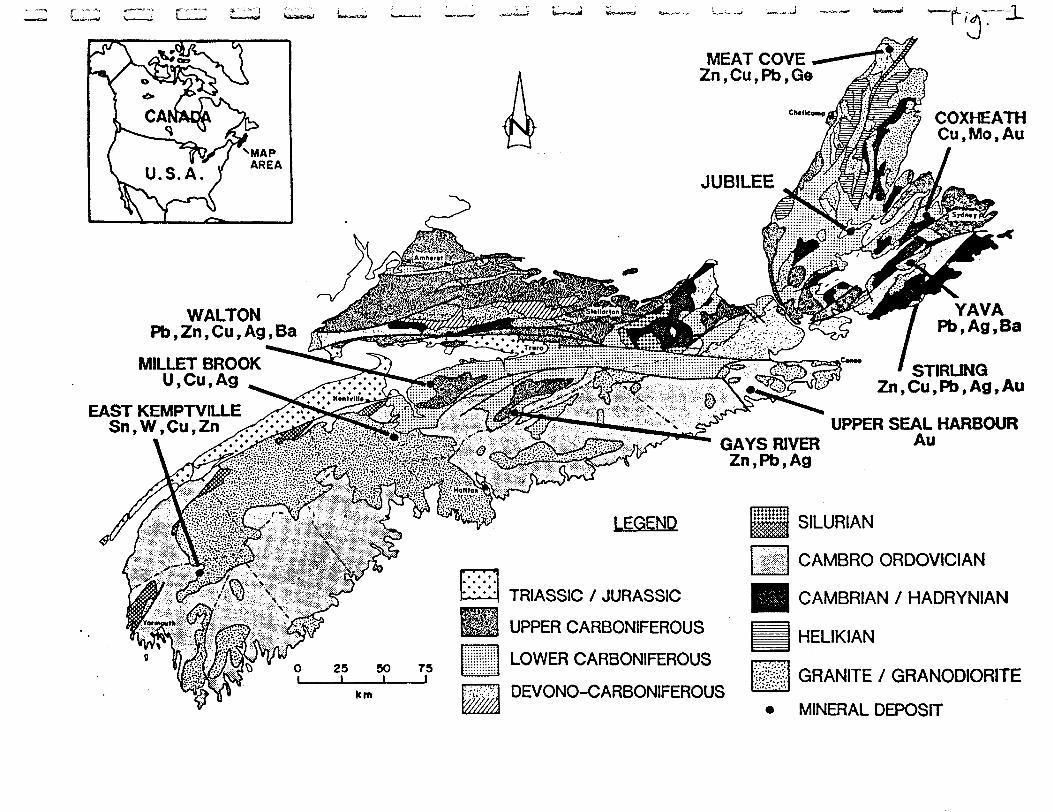
YAVA Pb,Ag,Ba
MEAT COVE 2n.Cu.Pb.Ge
5 COXHEATH Cu,Mo,Au
JUBILEE
WALTON Pb,Zn,Cu,Ag,Ba
MILLET BROOK U,Cu,Ag
EAST KEMPTVILLE Sn,W,Cu,Zn
TRIASSIC l JURASSIC
UPPER CARBONIFEROUS
LOWER CARBONIFEROUS
DEVONO-CARBONIFEROUS
STIRLING Zn,Cu,Pb,Ag,Au
UPPER SEAL HARBOUR GAYS RIVER Au Zn, Pb, Ag
SILURIAN
CAMBRO ORDOVICIAN
CAMBRIAN l HADRYNIAN
HELIKIAN
GRANITE l GRANODIORITE
MINERAL DEPOSIT
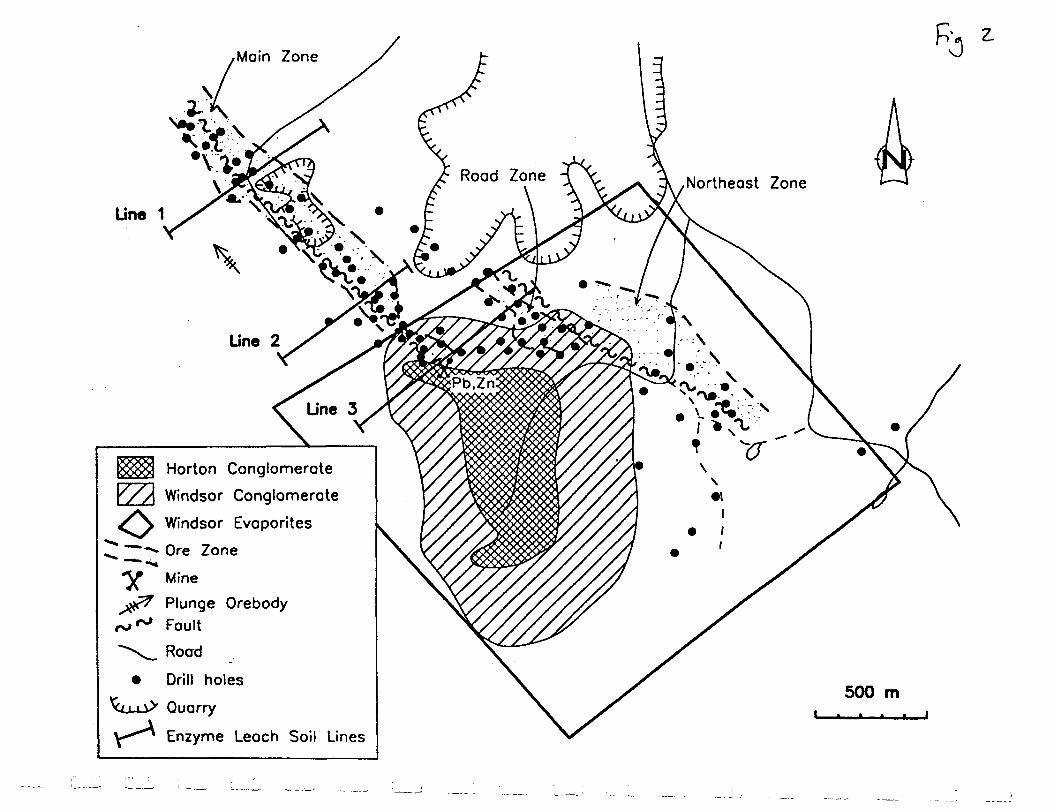
.Moin Zone
Line 1
Horton Conglomerate
Windsor Conglomerate
Windsor Evaporites ——* Ore Zone
MinePlunge Orebody
^ Fault
x^. Road
i Drill holes
Quarry
Enzyme Leach Soil Lines
500 m
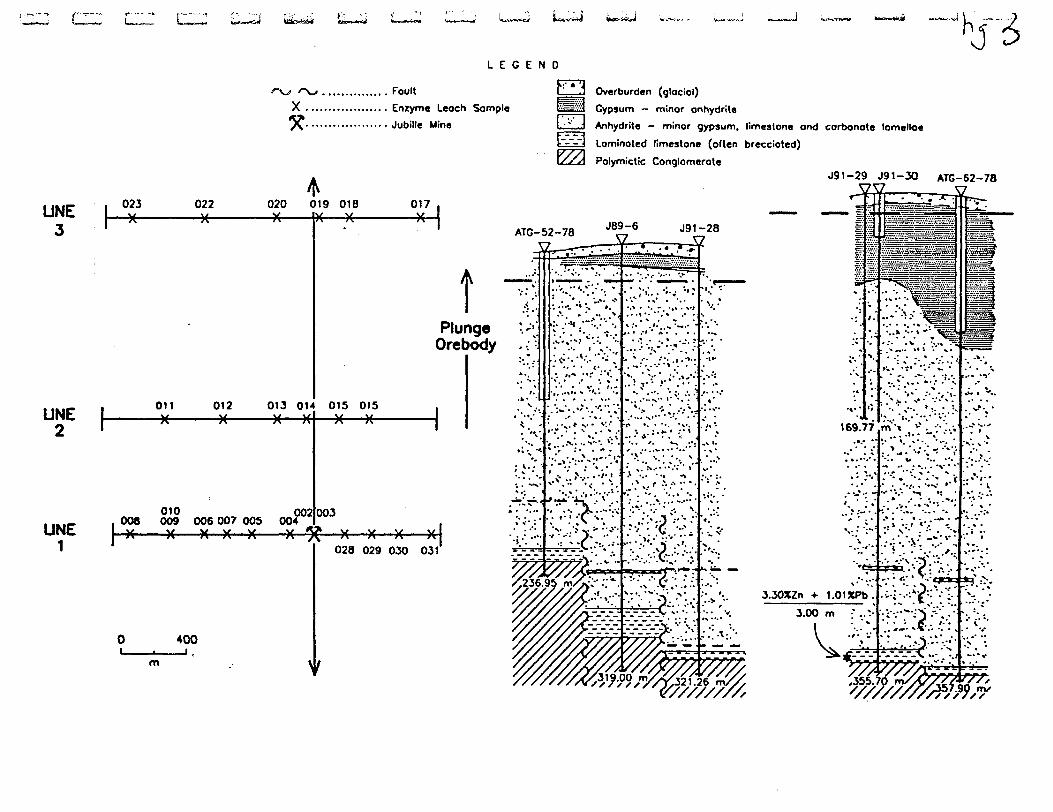
i~-*i Li
LEGEND
, . FaultK;' * '
UNE 3
UNE 2
, 023 022 020 019 018 017 ,IV V X lv/ v/ v/ i
1 Oil 012 013 01'
010 002 008 009 006 007 005 004
l\y \j \x\s\s \y ^
0 400
m . *
M M M ,
1Plur
Oreb
015 015 ,— X —— H —————— 1
003
J —— X —— X —— X —— )f|
028 029 030 031
f
Sample {ja^a Gypsum - minor anhydrite .' . ..i Anhydrite — minor gypsum, limestone and carbonate lamellae r~~~~j Laminated limestone (often brecciated) \SsA Polymictic Conglomerate
J91-29 J91-30 ATG-62-7B W *7
ATG-52-78 J8|r6 J9 '
f 1ige V-;tody . :. -
. ' "** /.•k - * -
". *'.
.--".r
mi
^.--f^VSi-^
;- .•'•i .""'.-"''••'
~-"-.--.- - . ~ .-.
yjjj?,^^rfXX/XvXr^rt r
^^-^^^^^•^
T ;. .' \. " ;- ;
. ' '\ -- •*.** .* '* ;- * . ••".... *"*-' '
X'^'-L.vX,•I* -. * '-. '\-.
r.-.-j-.V *' '- '
^;:'-
fe^
-28 f2 i
1
.-:ft '
V; 169/
* " * * * * .
./v V;
:-^':. 3.30XZn -t- 1.01XPI
i
Wso
x
i;7
i r
j .V
;;;..v 3.00 m : ,.-.-
fffiy/ 'TT/.
S?.::l-,'.-':-.. ^.:
^^S——rS-g^S
v^^p^pS
Ife^^SSJ^^-
S*^^S|S^rSi
- --^^p^l
m "* t '-v i.:'\\;
*-.' t* '.. -*.-* .* ' m. . - "V * '*
* " - * '- ^,.-. .v." -* '* " !t . *.^( *I. t "v
.* . . l . -4k - -
:: "x'- . : - .. "-j
tf^-'-'C^'f!.'.--
"•''''•-'.^f*?
BSv--;^5^Sc
23^^^-^^•^x^j
* * * V i.-* -i*
\
i"
'/////////rmjy
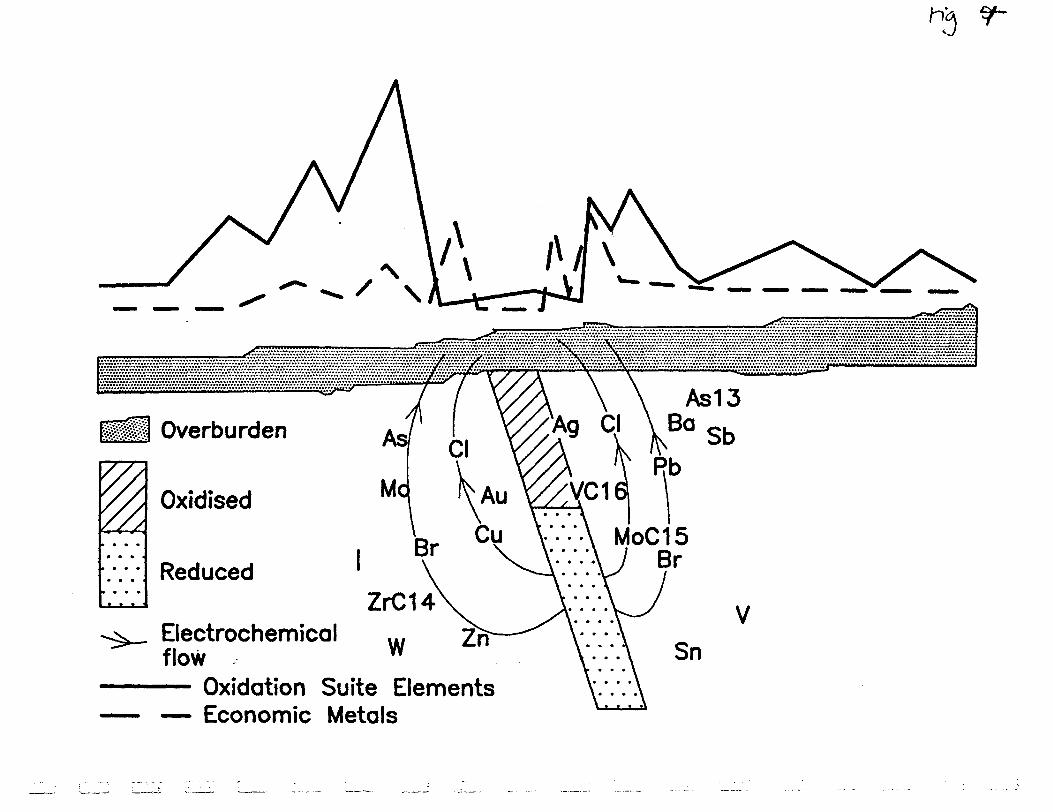
Oxidised
ReducedZrCU
Electrochemical flow— Oxidation Suite Elements— Economic Metals
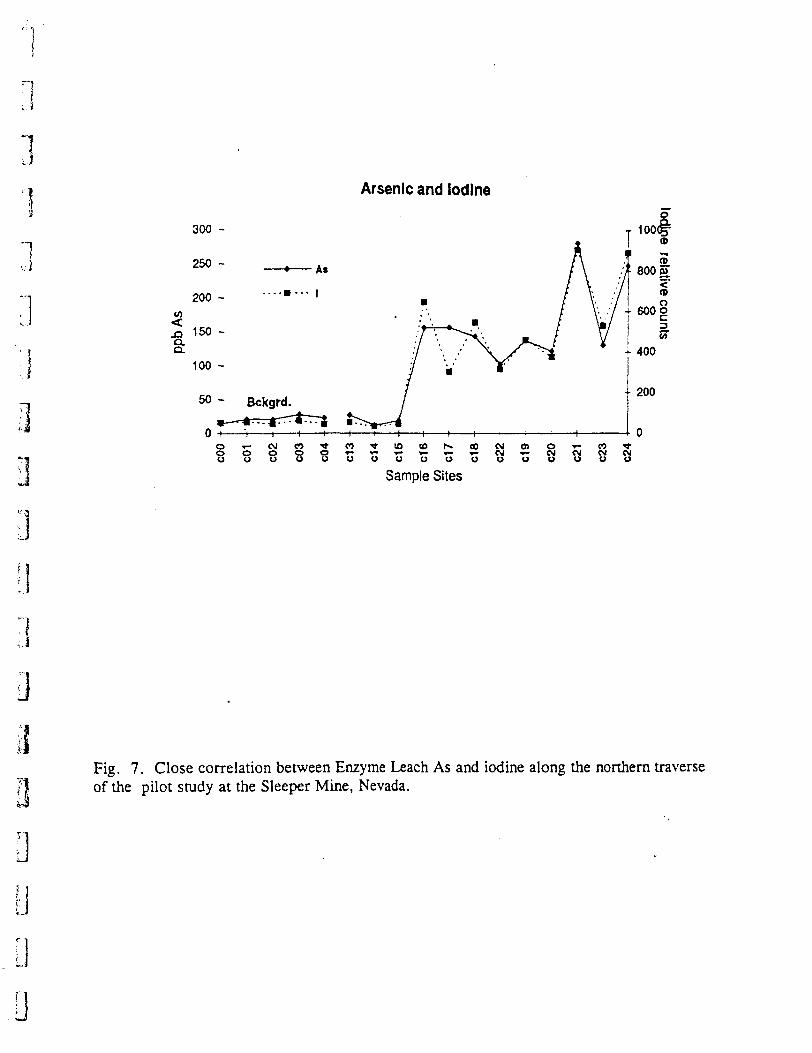
300 -
Arsenic and Iodine
Sample Siteso
Fig. 7. Close correlation between Enzyme Leach As and iodine along the northern traverse of the pilot study at the Sleeper Mine, Nevada.
Oy
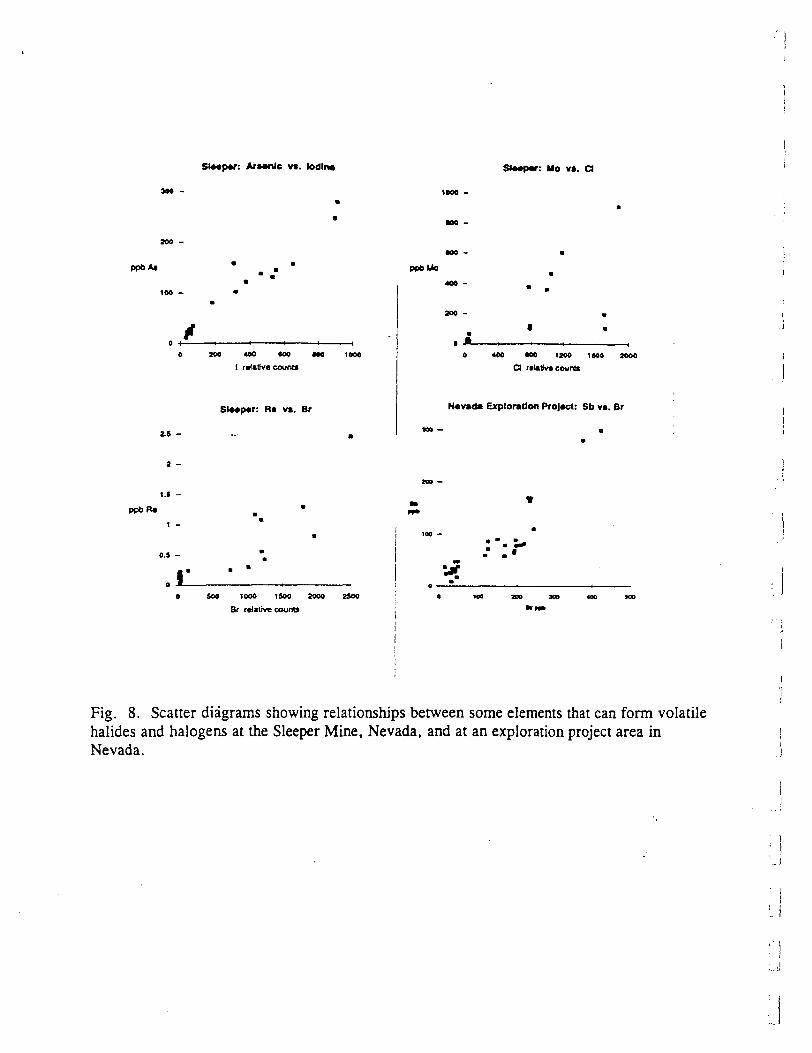
Sl**p*r: Arsenic vs. lodln* : Mo vs. a
PPDAI
O MO 400 tOO MO 1000
I relative count!
: R* vs. Br
W* Mo
O 440 •00 1200 1WJ 2000
CI relative count!
Navxte Exploration Project: Sb vs. Br
PpbR*
O 500 1000 1500 2000 2SOO
Br relative counts
•jr
200 300 4OO MO
Fig. 8. Scatter diagrams showing relationships between some elements that can form volatile halides and halogens at the Sleeper Mine, Nevada, and at an exploration project area in Nevada.
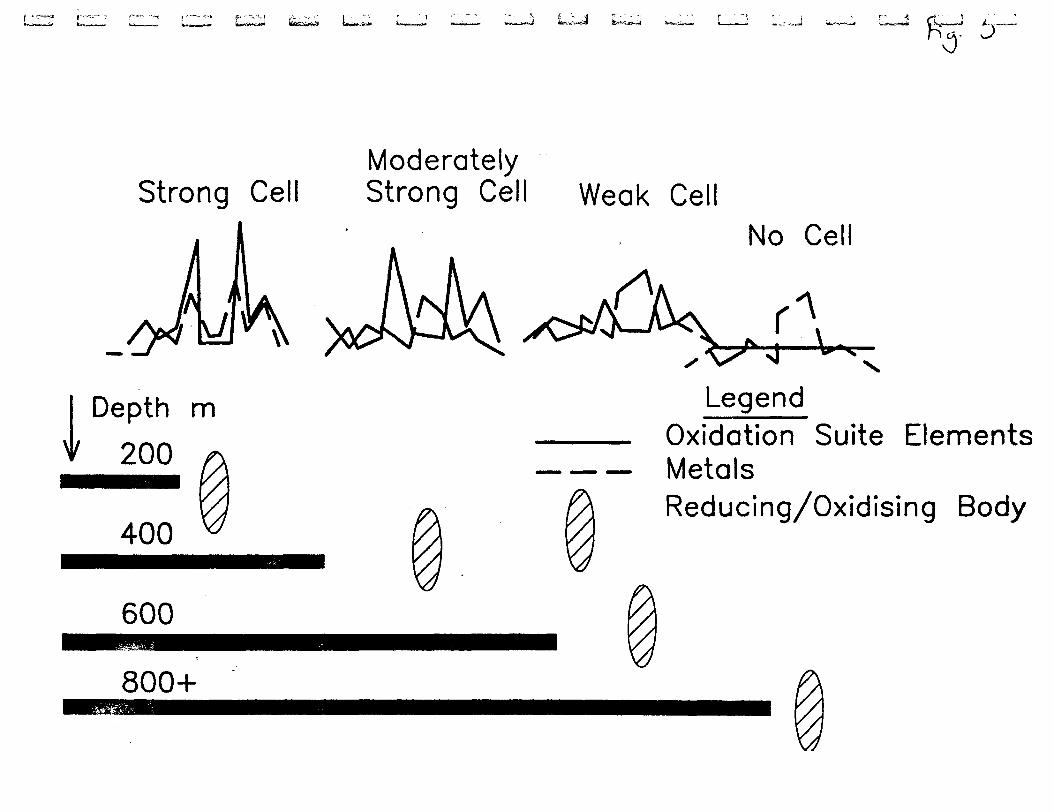
U**v.^ ...r-J ^ -. J-
Strong CellModerately Strong Cell Weak Cell
No Cell
Depth m 200
400
600
Legend———— Oxidation Suite Elements— — — Metals
Reducing/Oxidising Body
800+
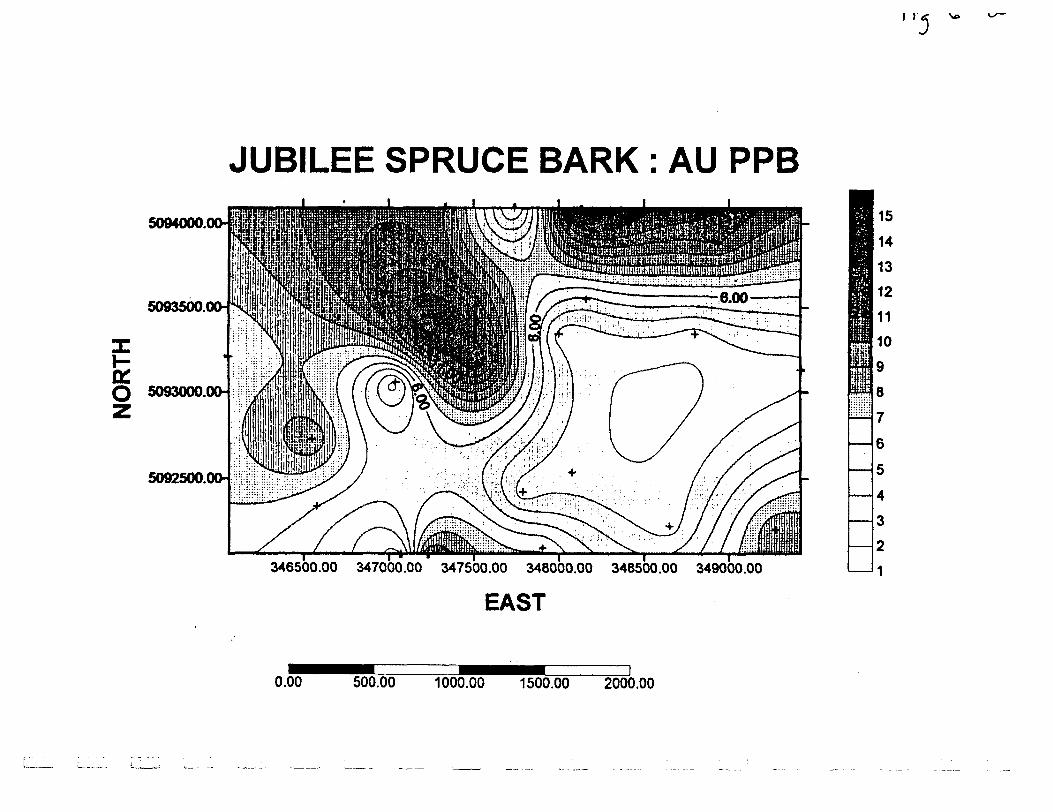
i r5
JUBILEE SPRUCE BARK : AU PPB5094000.00- i
5092500.00-
346500.00 347000.00 347500.00 348000.00 348500.00 349000.00
EAST
15
14
13
12
11
10
|9
876
5
4
3
21
0.00 500.00 1000.00 1500.00 2000.00
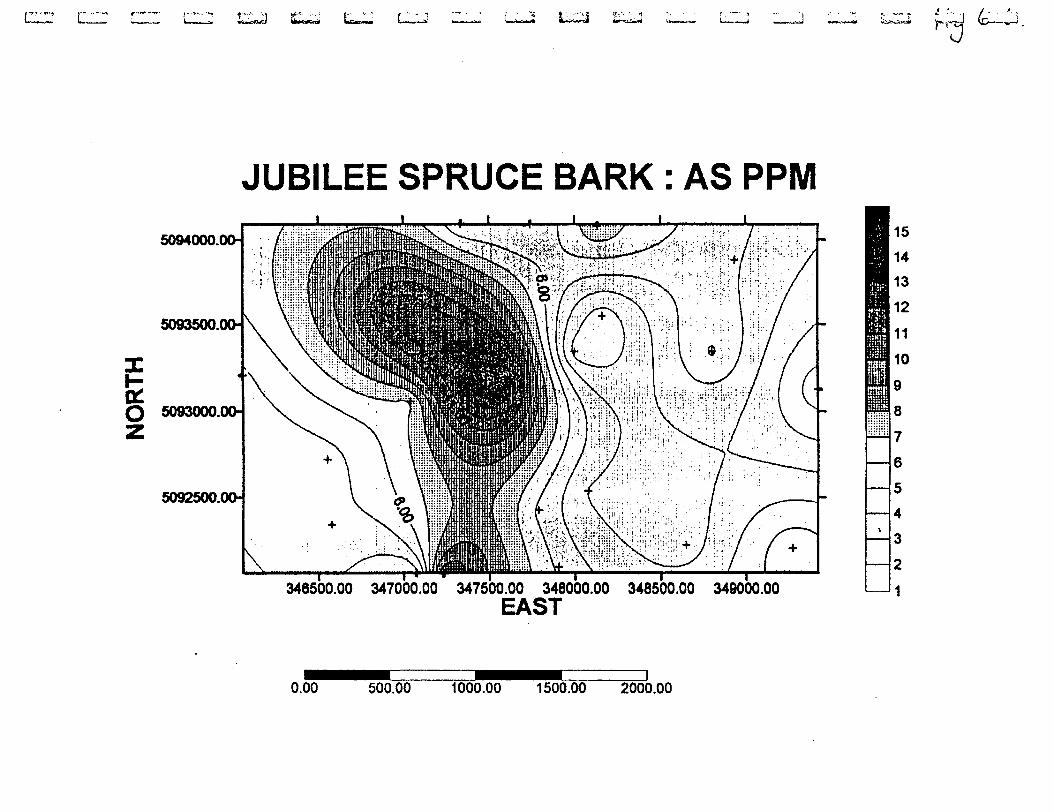
t : "-'"'lfc^iXi-j^J
" " ' "' f ~ ' "" l^wmb^M t'-'n- ,,t - - ~- . -i (c—^~
JUBILEE SPRUCE BARK : AS PPM5094000.00-
346500.00 347000.00 347500.00 348000.00 348500.00 349000.00EAST
15
14
13
12
11
10
9876543
2
0.00 500.00 1000.00 1500.00 2000.00
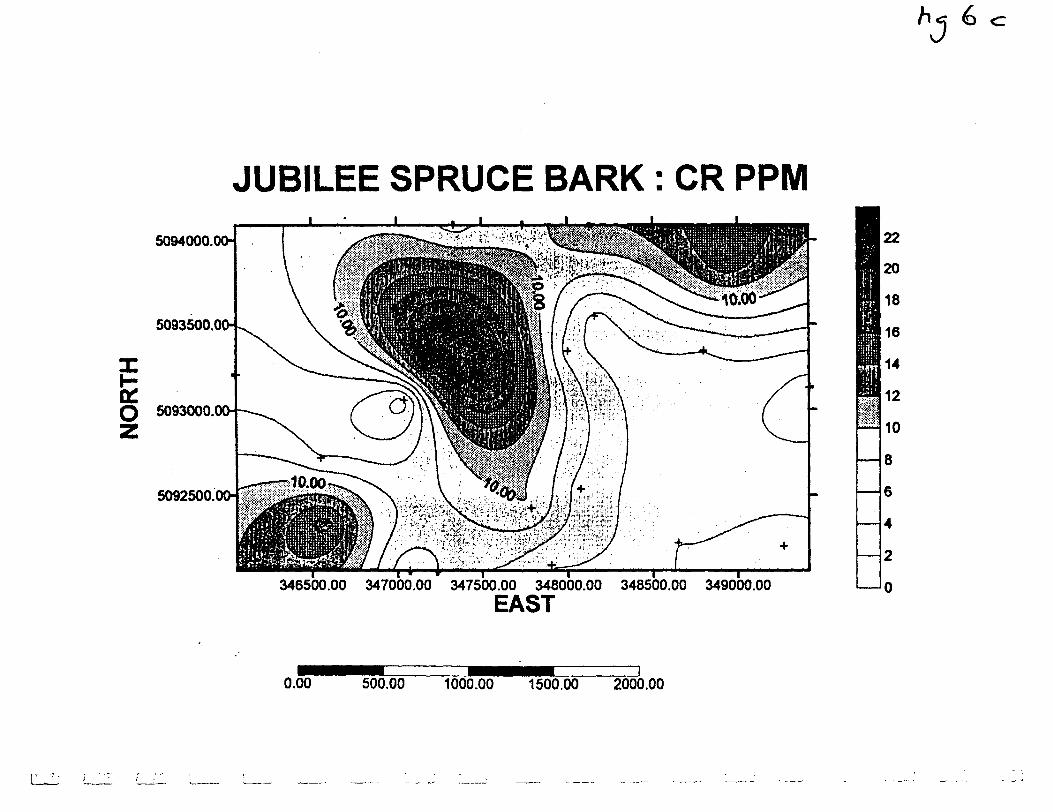
JUBILEE SPRUCE BARK : CR PPM5094000.00-
5093500.
o:Q 5093000
5092500.
346500.00 347000.00 347500.00 348000.00 348500.00 349000.00EAST
22
20
18
16
14
12
10
8
6
4
2
O
0.00 500.00 1000.00 1500.00 2000.00
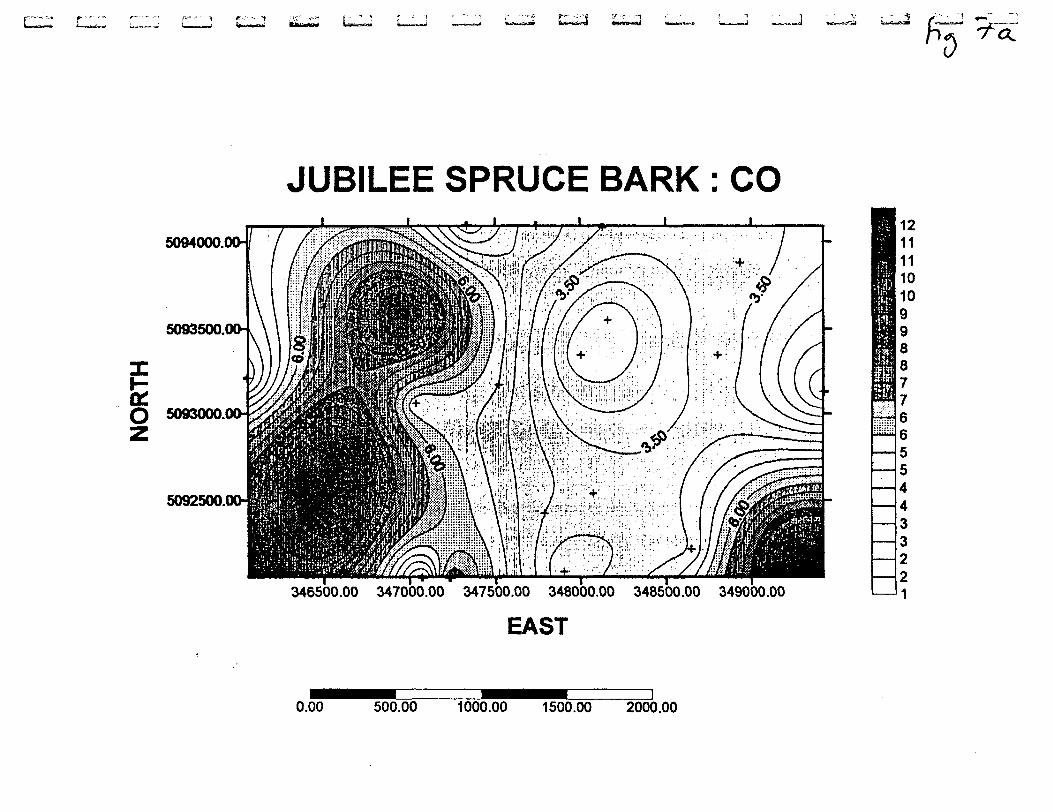
faiTir^Mi* *grtBK*M
JUBILEE SPRUCE BARK : CO5094000.
5093500.
aaO 5093000.
5092500.
346500.00 347000.00 347500.00 348000.00 348500.00 349000.00
EAST
12111110
i 10998
|6554433221
0.00 500.00 1000.00 1500.00 2000.00
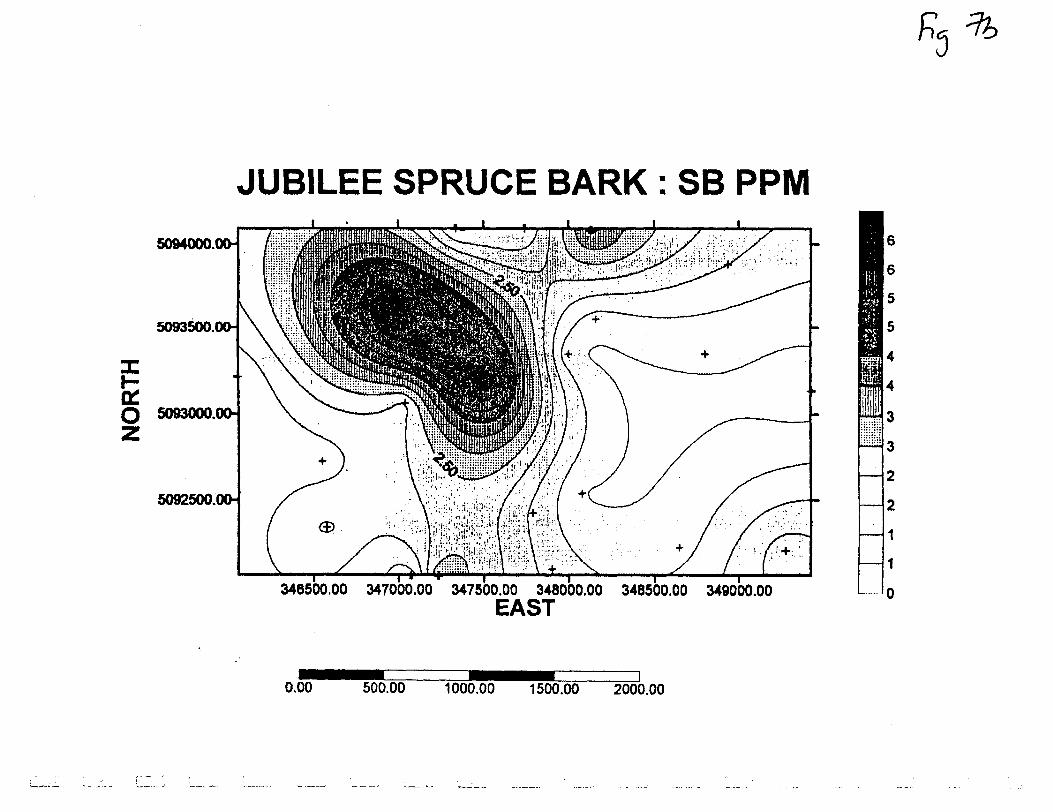
JUBILEE SPRUCE BARK : SB PPM5094000.00-
5093500.00-
O 5093000.00-
5092500.001
\ s ,\ ./j.::;:^aa.Jir' -.'.l-, l ' \ •f ^ *S l L
346500.00 347000.00 347500.00 348000.00 348500.00 349000.00EAST
6
0.00 500.00 1000.00 1500.00 2000.00
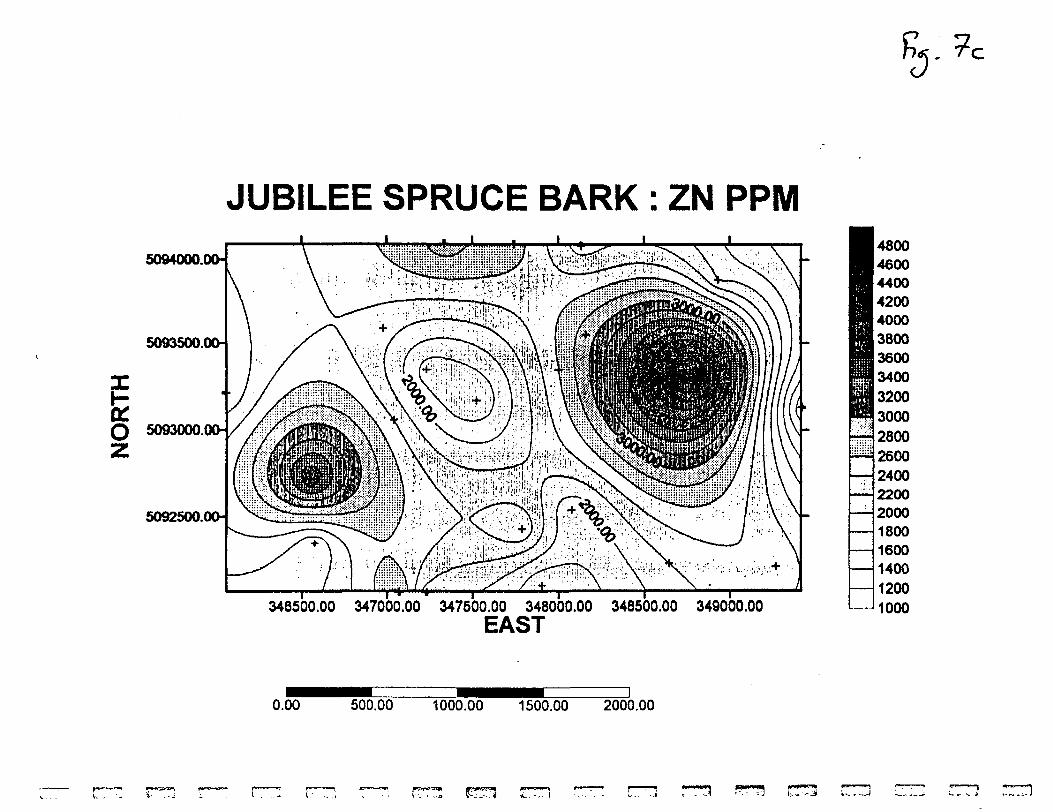
JUBILEE SPRUCE BARK : ZN PPM5094000.00-
5093500.00-
O 5093000.00-
5092500.00-
*!.!!!.!:.n.!.MilUlMUil......!l...hi
346500.00 347000.00 347500.00 348000.00 348500.00 349000.00EAST
48004600440042004000380036003400320030002800260024002200200018001600140012001000
0.00 500.00 1000.00 1500.00 2000.00
i-' 'u 1 -f, --it v"*--~-^ - 4i .-".-i r~**3 '*^"w^
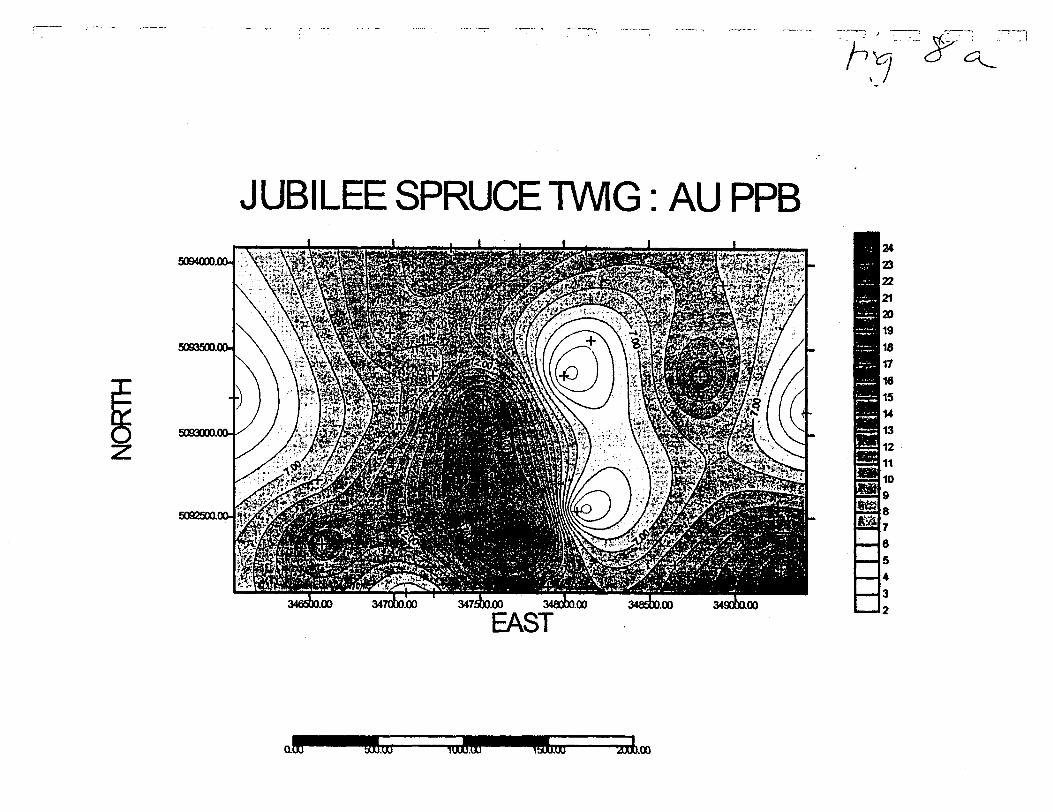
JUBILEE SPRUCE TWIG: AU PPB
K,
5094000.00-
5092500.00-
346500.00 347000.00 34:
EAST
m
242322212019181716151413121110987e s432
0.00 axnxr 1UUU.UU 15UO.UU "2300.00
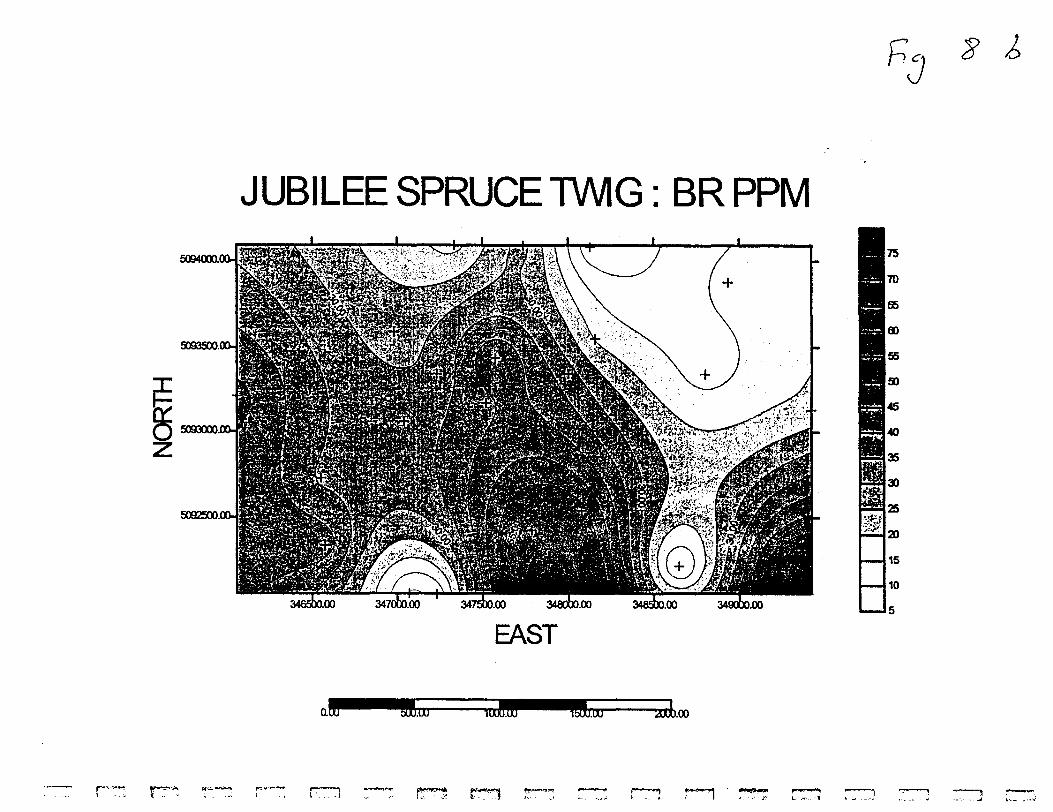
f* ci v
JUBILEE SPRUCE TWIG: BR PPM5094000.00-
5033500J
5090000.1
5092500.00-
3465txXOO 347000.00
EAST
75
70
G6
60
55
50
45
40
35
30
25
20
15
10
5
•2300.00
p.-^-V!**.*^ Cf^-*^, g,;
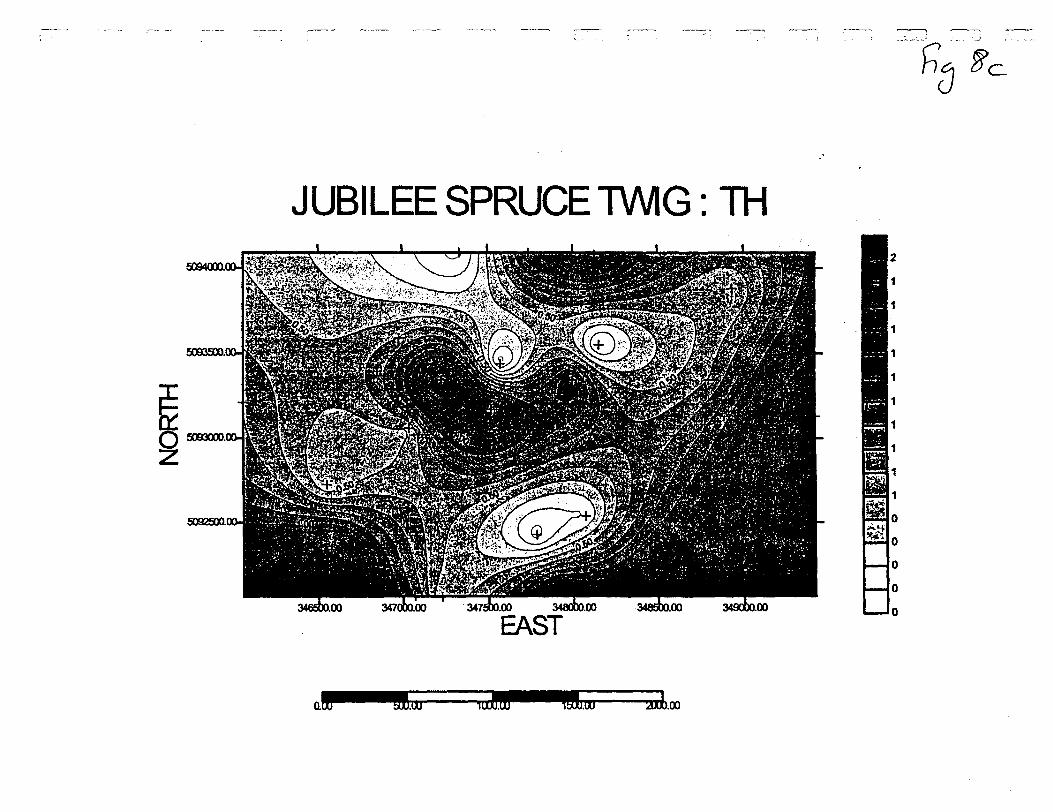
c/
JUBILEE SPRUCE TWIG: TH5094000.00-
347sbaooEAST
.00 B;
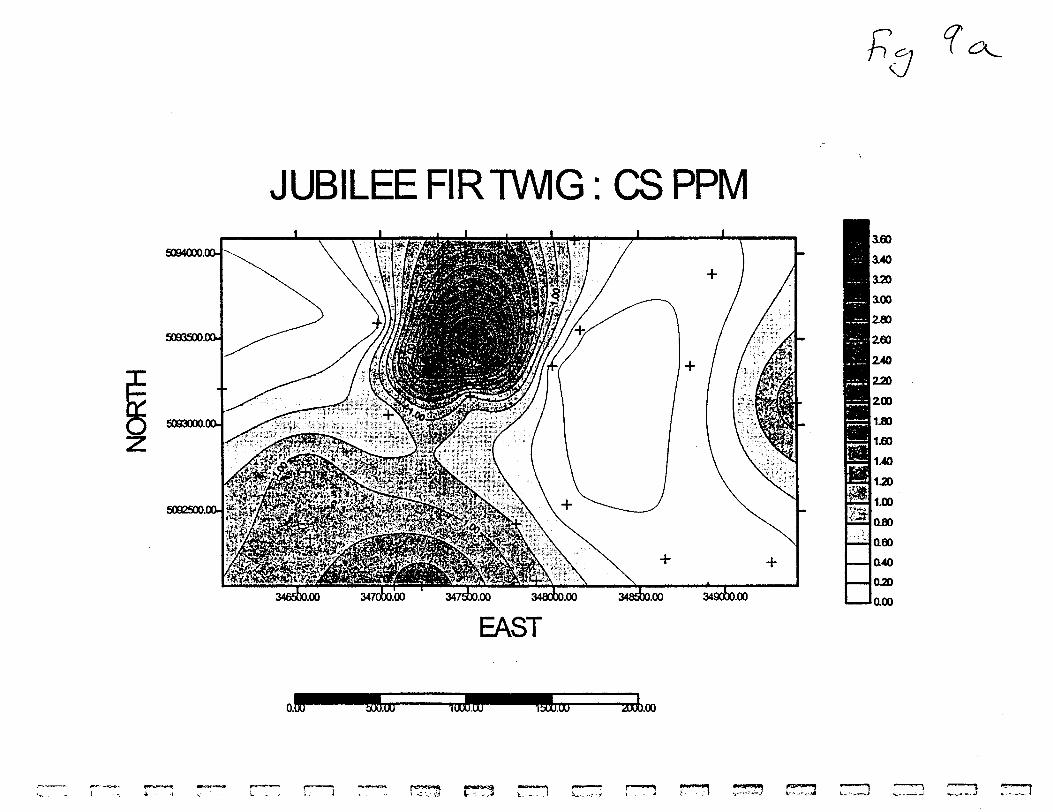
"300.00
(
5094000.00-
5093500.00-
5093000.00-
JUBILEE FIRTW1G: CS PPM
5092500.00-
346sbo.OO 347obo.bo 347500.00348000.00
EAST348500.00 349000.00
160
140
120100
280
2.60
240
220
200I.80
II.60 11.40
1.00
aeo aeo0.40
I 020 aoo
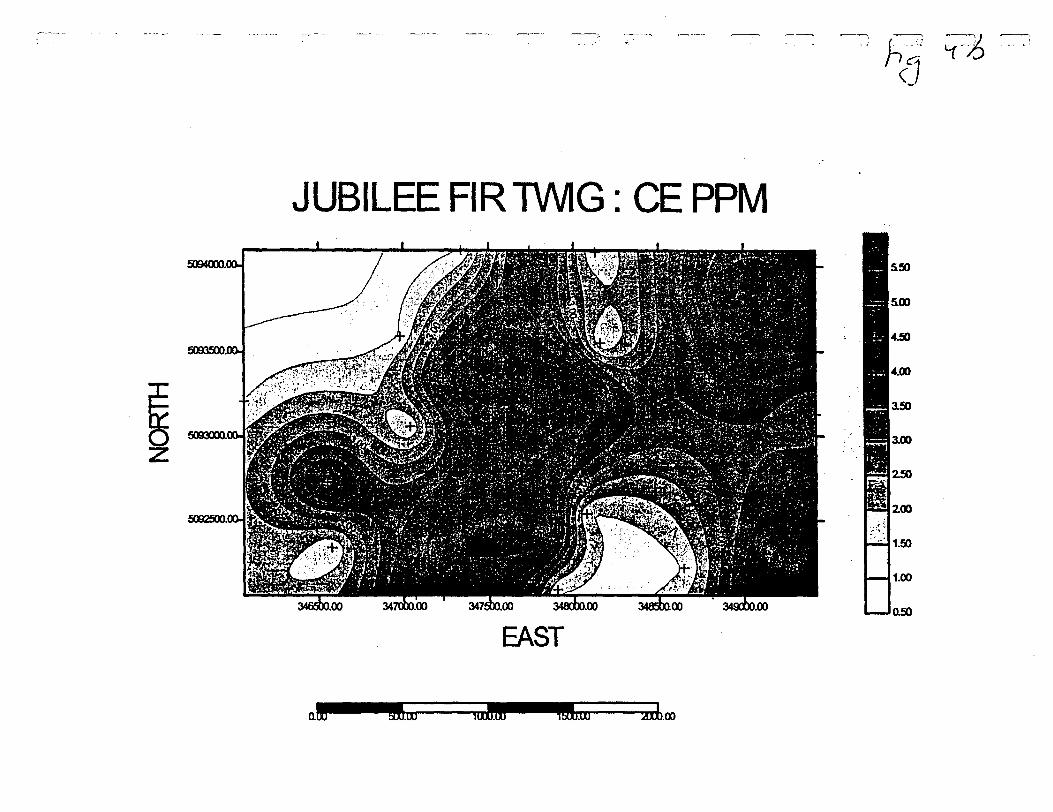
JUBILEE FIR TWIG: CE PPM5094000.00-
.00
5.50
5.00
14.50
14.00
j 150
laoo
J 250
200
1.50
1.00
0.50
O.UU buu.uu TUUU.OU Tauu.uu "2DDD.OO
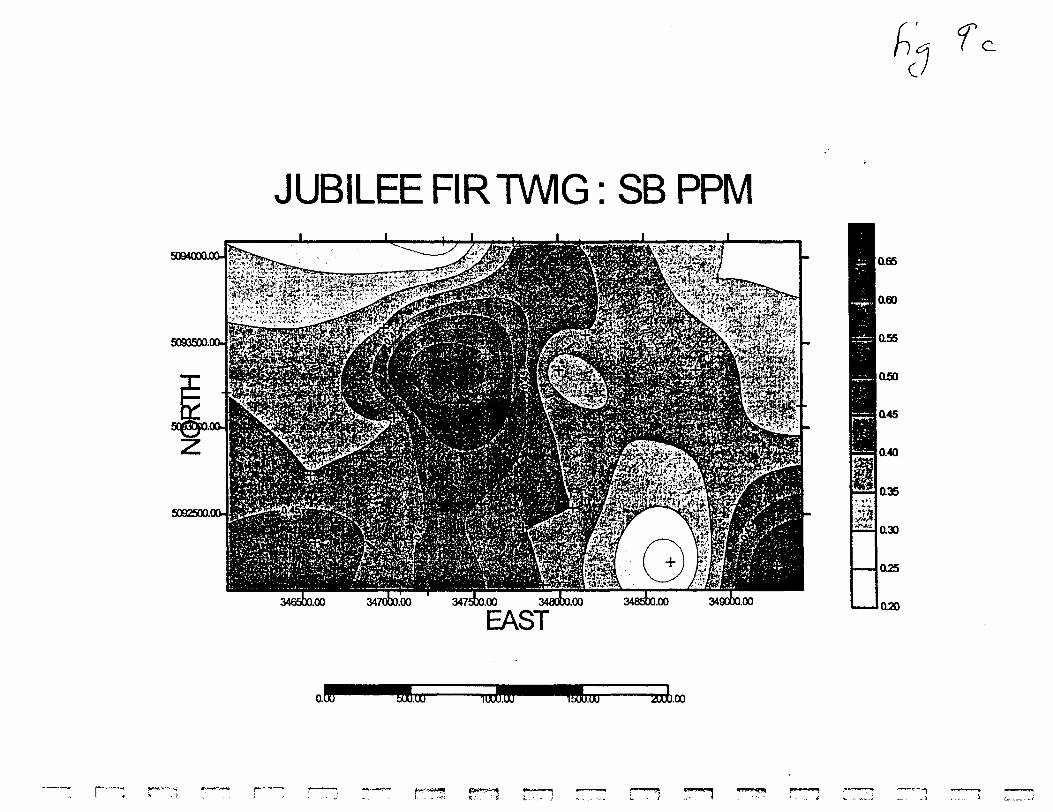
JUBILEE FIR TWIG: SB PPM5094000.00.il
EAST
lass
aeo
ass
oso
0.45
|a4o
0.35
0.30
025
020
O.UU auu.uu itxxi.uu "2DDD.OO
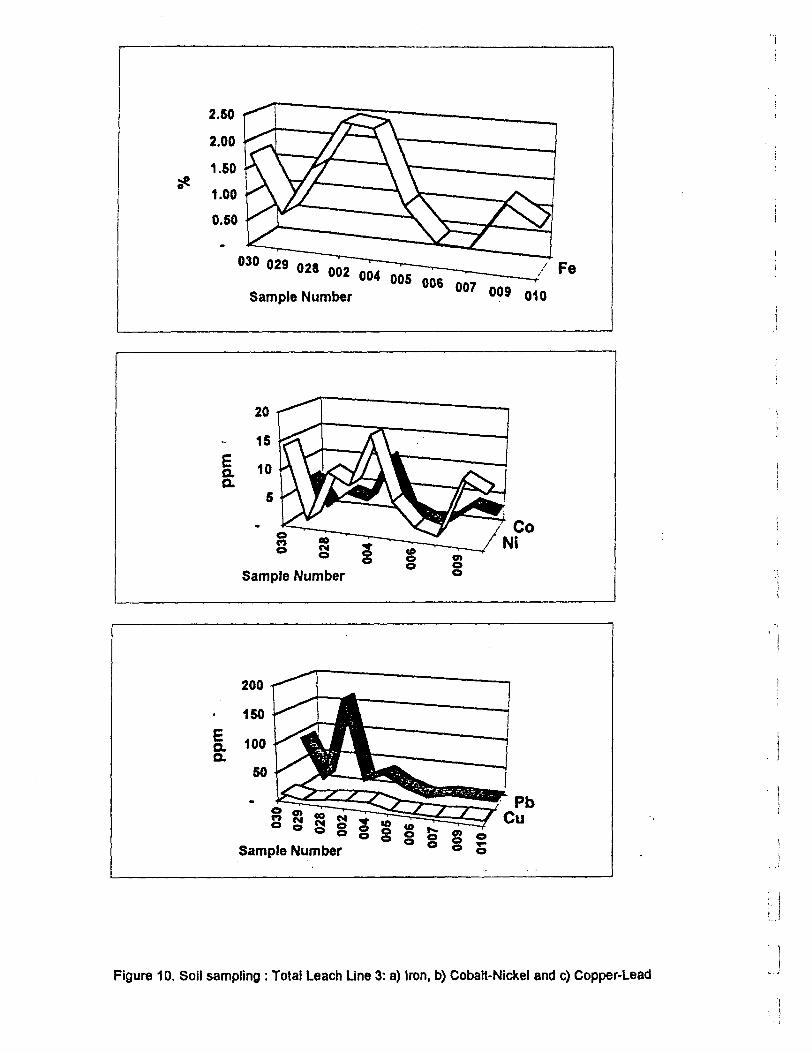
Sample Number
a a
Sample Number
silSample Number
Figure 10. Soil sampling: Total Leach Line 3: a) Iron, b) Cobatt-Nickel and c) Copper-Lead
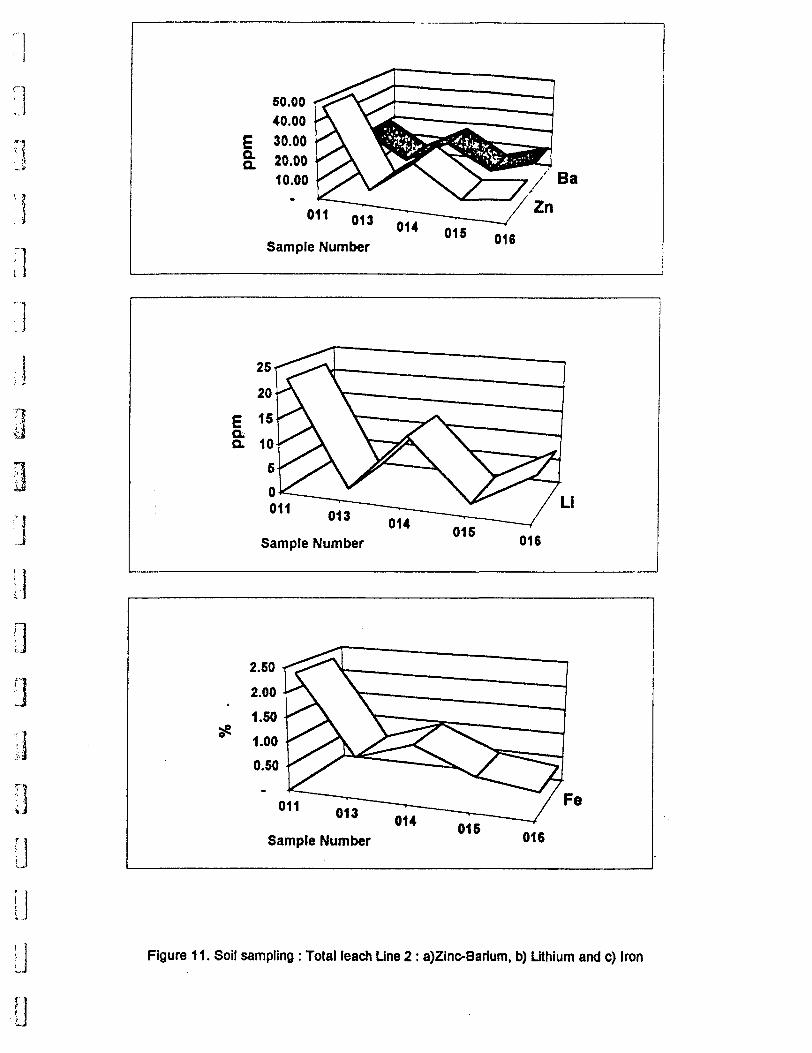
n
a a
013011
Sample Number014 015
O011 013
Sample Number014 015
016
O
o011 013 014
Sample Number015
LJ
oFigure 11. Soil sampling : Total leach Une 2: a)Zinc-Barium, b) Lithium and c) Iron
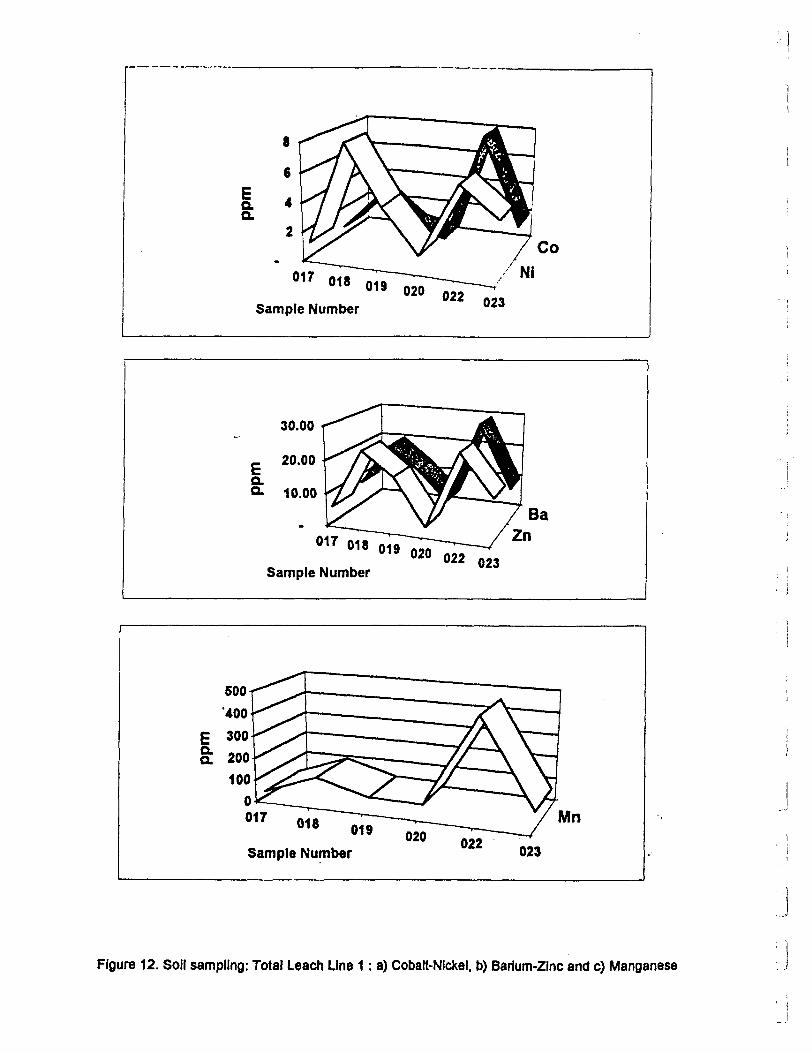
Q.a
017Sample Number
Ni
023
017Sample Number
019 020Sample Number 022 023
Figure 12. Soil sampling: Total Leach Line 1 : a) Cobatt-Nickel, b) Barium-Zinc and c) Manganese
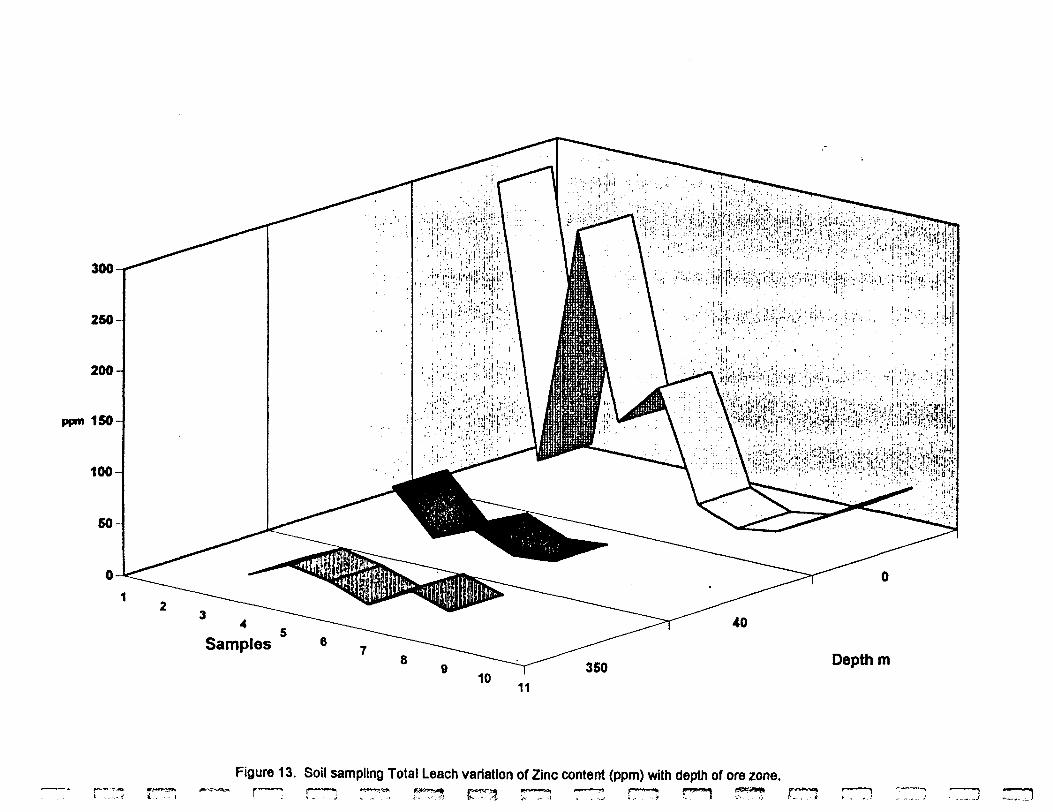
300
250
200
ppm 150
100-
Samples 640
350 Depth m
Figure 13. Soil sampling Total Leach variation of Zinc content (ppm) with depth of ore zone.. . ~j i -. . . -. 'l '. -t :-~ ff
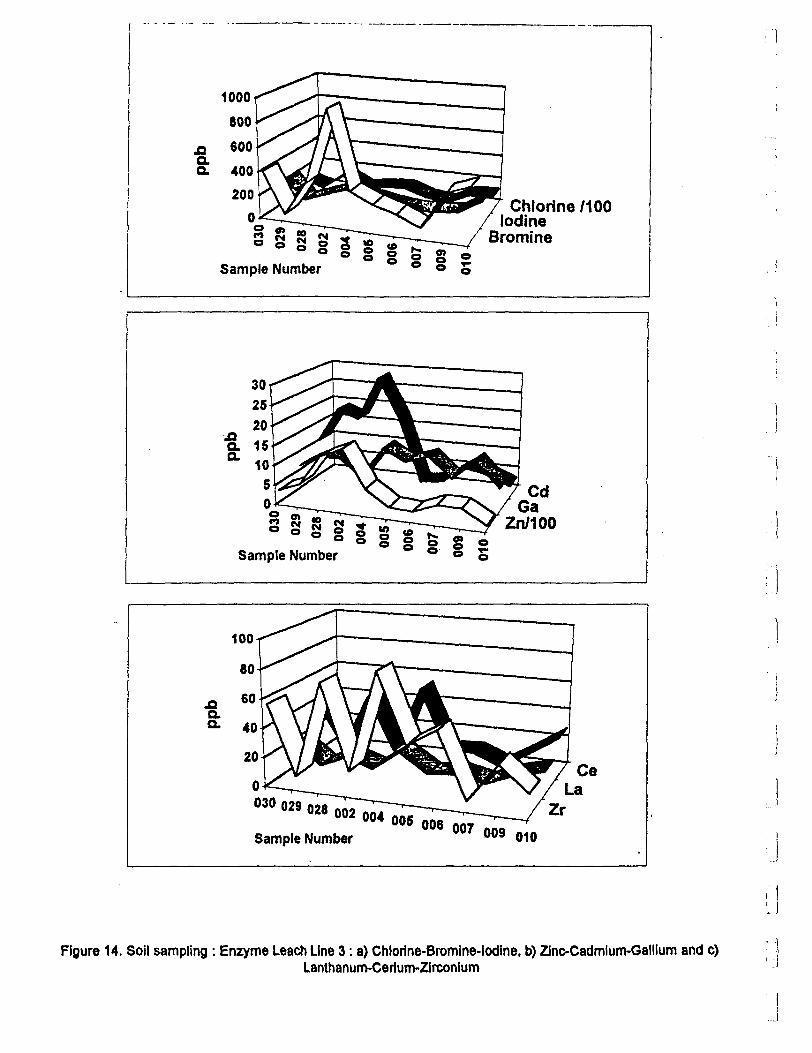
fta
lilChlorine /100
Iodine Bromine
Sample Number
Sample Number
.o a a.
Sample Number
Figure 14. Soil sampling : Enzyme Leach Line 3: a) Chlorine-Bromine-Iodine, b) Zinc-Cadmium-Gallium and c)Lanthanum-Cerium-Zirconium
J
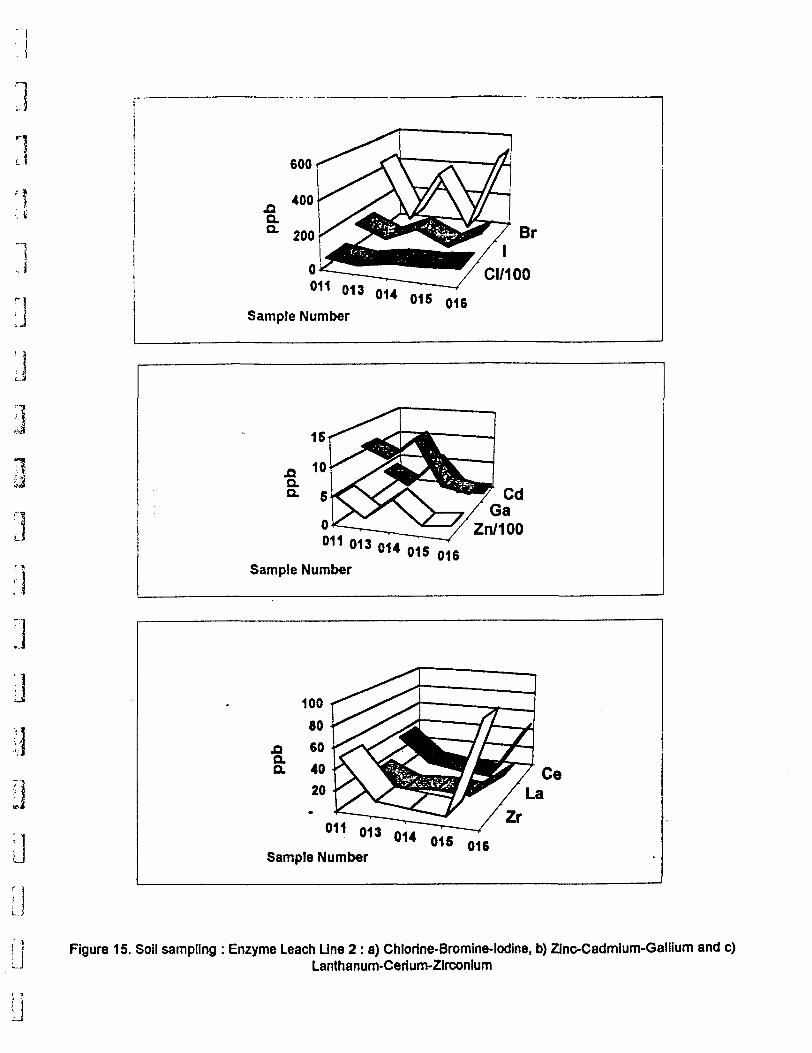
1•; i
600
XIa a
CI/100
Sample Number
011 013 014
Sample Number015 016
O O
ja a a
011Sample Number
Figure 15. Soil sampling : Enzyme Leach Line 2: a) Chlorine-Bromine-lodine, b) Zinc-Cadmium-Gallium and c)Lanthanum-Cerium-Zirconium
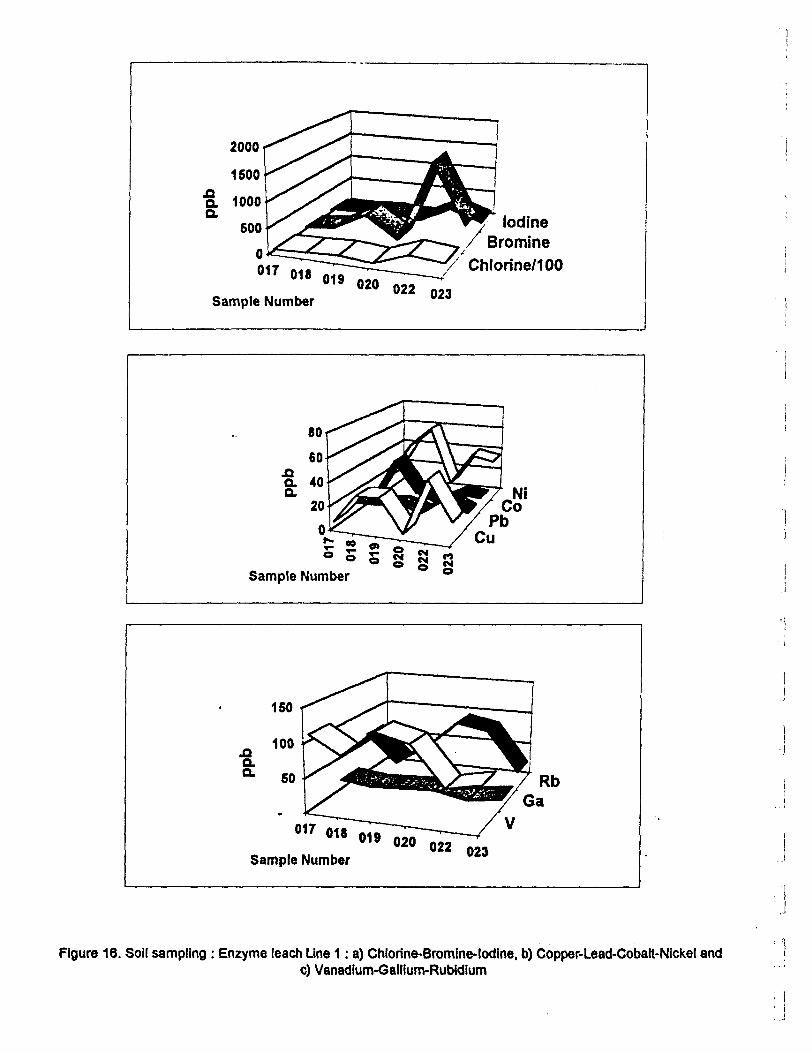
Iodine Bromine
Chlorine/100
Sample Number 023
Sample Number
JQaQ.
150
100
017 018 019 020Sample Number
022 023
Figure 16. Soil sampling : Enzyme leach Line 1: a) Chlorine-Bromine-Iodine, b) Copper-Lead-Cobatt-Nickel andc) Vanadium-Gallium-Rubidium
.J
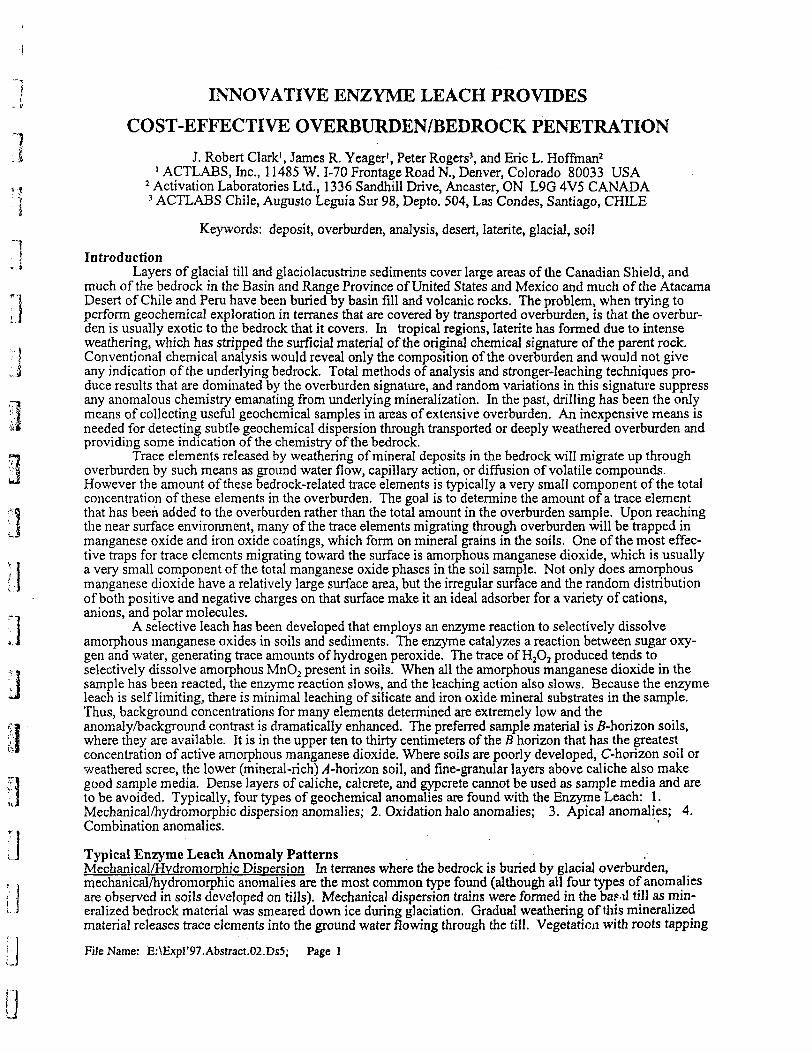
INNOVATIVE ENZYME LEACH PROVIDES COST-EFFECTIVE OVERBURDEN/BEDROCK PENETRATION
J. Robert Clark', James R. Yeager1 , Peter Rogers3 , and Eric L. Hoffman21 ACTLABS, Inc., 11485 W. 1-70 Frontage Road N., Denver, Colorado 80033 USA
1 Activation Laboratories Ltd., 1336 Sandhill Drive, Ancaster, ON L9G 4V5 CANADA3 ACTLABS Chile, Augusto Leguia Sur 98, Depto. 504, Las Condes, Santiago, CHILE
Keywords: deposit, overburden, analysis, desert, laterite, glacial, soil
IntroductionLayers of glacial till and glaciolacustrine sediments cover large areas of the Canadian Shield, and
much of the bedrock in the Basin and Range Province of United States and Mexico and much of the Atacama Desert of Chile and Peru have been buried by basin fill and volcanic rocks. The problem, when trying to perform geochemical exploration in terranes that are covered by transported overburden, is that the overbur den is usually exotic to the bedrock that it covers. In tropical regions, laterite has formed due to intense weathering, which has stripped the surficial material of the original chemical signature of the parent rock. Conventional chemical analysis would reveal only the composition of the overburden and would not give any indication of the underlying bedrock. Total methods of analysis and stronger-leaching techniques pro duce results that are dominated by the overburden signature, and random variations in this signature suppress any anomalous chemistry emanating from underlying mineralization. In the past, drilling has been the only means of collecting useful geochemical samples in areas of extensive overburden. An inexpensive means is needed for detecting subtle geochemical dispersion through transported or deeply weathered overburden and providing some indication of the chemistry of the bedrock.
Trace elements released by weathering of mineral deposits in the bedrock will migrate up through overburden by such means as ground water flow, capillary action, or diffusion of volatile compounds. However the amount of these bedrock-related trace elements is typically a very small component of the total concentration of these elements in the overburden. The goal is to determine the amount of a trace element that has been added to the overburden rather than the total amount in the overburden sample. Upon reaching the near surface environment, many of the trace elements migrating through overburden will be trapped in manganese oxide and iron oxide coatings, which form on mineral grains in the soils. One of the most effec tive traps for trace elements migrating toward the surface is amorphous manganese dioxide, which is usually a very small component of the total manganese oxide phases in the soil sample. Not only does amorphous manganese dioxide have a relatively large surface area, but the irregular surface and the random distribution of both positive and negative charges on that surface make it an ideal adsorber for a variety of cations, anions, and polar molecules.
A selective leach has been developed that employs an enzyme reaction to selectively dissolve amorphous manganese oxides in soils and sediments. The enzyme catalyzes a reaction between sugar oxy gen and water, generating trace amounts of hydrogen peroxide. The trace of H2O2 produced tends to selectively dissolve amorphous MnO2 present in soils. When all the amorphous manganese dioxide in the sample has been reacted, the enzyme reaction slows, and the leaching action also slows. Because the enzyme leach is self limiting, there is minimal leaching of silicate and iron oxide mineral substrates in the sample. Thus, background concentrations for many elements determined are extremely low and the anomaly/background contrast is dramatically enhanced. The preferred sample material is 5-horizon soils, where they are available. It is in the upper ten to thirty centimeters of the B horizon that has the greatest concentration of active amorphous manganese dioxide. Where soils are poorly developed, C-horizon soil or weathered scree, the lower (mineral-rich) /^-horizon soil, and fine-granular layers above caliche also make good sample media. Dense layers of caliche, calcrete, and gypcrete cannot be used as sample media and are to be avoided. Typically, four types of geochemical anomalies are found with the Enzyme Leach: l. Mechanical/hydromorphic dispersion anomalies; 2. Oxidation halo anomalies; 3. Apical anomalies; 4. Combination anomalies.
Typical Enzyme Leach Anomaly PatternsMechanical/Hvdromorphic Dispersion In terranes where the bedrock is buried by glacial overburden, mechanical/hydromorphic anomalies are the most common type found (although all four types of anomalies are observed in soils developed on tills). Mechanical dispersion trains were formed in the bae-il till as min eralized bedrock material was smeared down ice during glaciation. Gradual weathering of this mineralized material releases trace elements into the ground water flowing through the till. Vegetation with roots tapping
File Name: E:\Expr97.Abstract.02.Ds5; Page l
O
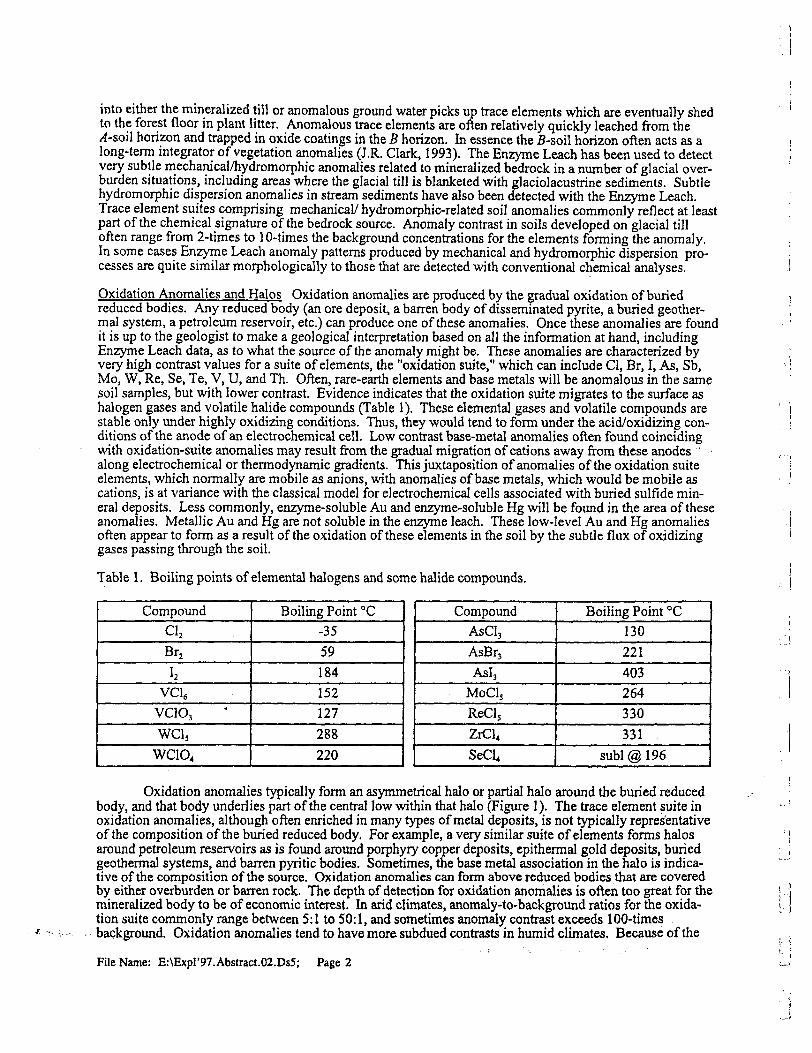
into either the mineralized till or anomalous ground water picks up trace elements which are eventually shed to the forest floor in plant litter. Anomalous trace elements are often relatively quickly leached from the /4-soiI horizon and trapped in oxide coatings in the B horizon. In essence the 5-soil horizon often acts as a long-term integrator of vegetation anomalies (J.R. Clark, 1993). The Enzyme Leach has been used to detect very subtle mechanical/hydromorphic anomalies related to mineralized bedrock in a number of glacial over burden situations, including areas where the glacial till is blanketed with glaciolacustrine sediments. Subtle hydromorphic dispersion anomalies in stream sediments have also been detected with the Enzyme Leach. Trace element suites comprising mechanical/ hydromorphic-related soil anomalies commonly reflect at least part of the chemical signature of the bedrock source. Anomaly contrast in soils developed on glacial till often range from 2-times to 10-times the background concentrations for the elements forming the anomaly. In some cases Enzyme Leach anomaly patterns produced by mechanical and hydromorphic dispersion pro cesses are quite similar morphologically to those that are detected with conventional chemical analyses.
Oxidation Anomalies and Halos Oxidation anomalies are produced by the gradual oxidation of buried reduced bodies. Any reduced body (an ore deposit, a barren body of disseminated pyrite, a buried geother mal system, a petroleum reservoir, etc.) can produce one of these anomalies. Once these anomalies are found it is up to the geologist to make a geological interpretation based on all the information at hand, including Enzyme Leach data, as to what the source of the anomaly might be. These anomalies are characterized by very high contrast values for a suite of elements, the "oxidation suite," which can include CI, Br, I, As, Sb, Mo, W, Re, Se, Te, V, U, and Th. Often, rare-earth elements and base metals will be anomalous in the same soil samples, but with lower contrast. Evidence indicates that the oxidation suite migrates to the surface as halogen gases and volatile halide compounds (Table 1). These elemental gases and volatile compounds are stable only under highly oxidizing conditions. Thus, they would tend to form under the acid/oxidizing con ditions of the anode of an electrochemical cell. Low contrast base-metal anomalies often found coinciding with oxidation-suite anomalies may result from the gradual migration of cations away from these anodes " along electrochemical or thermodynamic gradients. This juxtaposition of anomalies of the oxidation suite elements, which normally are mobile as anions, with anomalies of base metals, which would be mobile as cations, is at variance with the classical model for electrochemical cells associated with buried sulfide min eral deposits. Less commonly, enzyme-soluble Au and enzyme-soluble Hg will be found in the area of these anomalies. Metallic Au and Hg are not soluble in the enzyme leach. These low-level Au and Hg anomalies often appear to form as a result of the oxidation of these elements in the soil by the subtle flux of oxidizing gases passing through the soil.
Table 1. Boiling points of elemental halogens and some halide compounds.
CompoundCI,Br2I2
VC16VC1O3WC15
WC1O,
Boiling Point 0C-3559184152127288220
CompoundAsCl3AsBr3AsI3
MoCl5ReCl5ZrCl4SeCl4
Boiling Point "C130221403264330331
subl@196
Oxidation anomalies typically form an asymmetrical halo or partial halo around the buried reduced body, and that body underlies part of the central low within that halo (Figure 1). The trace element suite in oxidation anomalies, although often enriched in many types of metal deposits, is not typically representative of the composition of the buried reduced body. For example, a very similar suite of elements forms halos around petroleum reservoirs as is found around porphyry copper deposits, epithermal gold deposits, buried geothermal systems, and barren pyritic bodies. Sometimes, the base metal association in the halo is indica tive of the composition of the source. Oxidation anomalies can form above reduced bodies that are covered by either overburden or barren rock. The depth of detection for oxidation anomalies is often too great for the mineralized body to be of economic interest. In arid climates, anomaly-to-background ratios for the oxida tion suite commonly range between 5:1 to 50:1, and sometimes anomaly contrast exceeds 100-times background. Oxidation anomalies tend to have more, subdued contrasts in humid climates. Because of the
File Name: E:\Expr97.Abstract.02.Ds5; Page 2
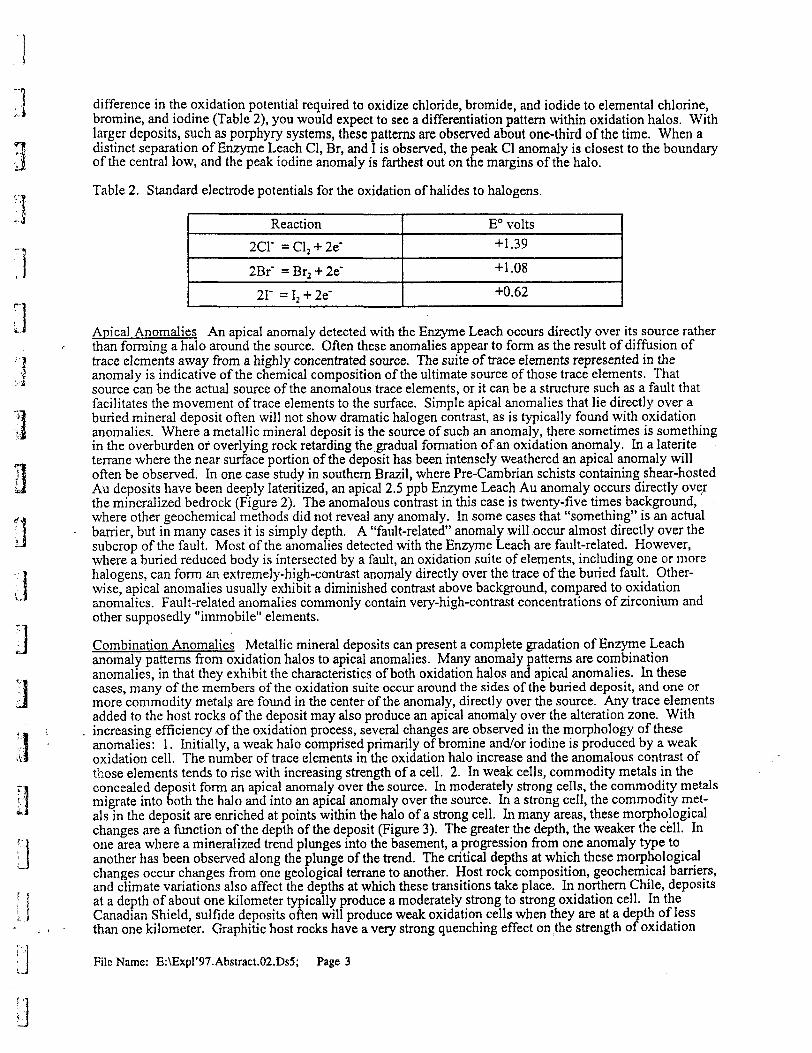
"]
O
difference in the oxidation potential required to oxidize chloride, bromide, and iodide to elemental chlorine, bromine, and iodine (Table 2), you would expect to see a differentiation pattern within oxidation halos. With larger deposits, such as porphyry systems, these patterns are observed about one-third of the time. When a distinct separation of Enzyme Leach CI, Br, and I is observed, the peak CI anomaly is closest to the boundary of the central low, and the peak iodine anomaly is farthest out on the margins of the halo.
Table 2. Standard electrode potentials for the oxidation of halides to halogens.
Reaction2CK = Cl2 + 2e-2Br' = Br2 + 2e•2r ^Ij + 26-
E0 volts+1.39
+1.08+0.62
Apical Anomalies An apical anomaly detected with the Enzyme Leach occurs directly over its source rather than forming a halo around the source. Often these anomalies appear to form as the result of diffusion of trace elements away from a highly concentrated source. The suite of trace elements represented in the anomaly is indicative of the chemical composition of the ultimate source of those trace elements. That source can be the actual source of the anomalous trace elements, or it can be a structure such as a fault that facilitates the movement of trace elements to the surface. Simple apical anomalies that lie directly over a buried mineral deposit often will not show dramatic halogen contrast, as is typically found with oxidation anomalies. Where a metallic mineral deposit is the source of such an anomaly, there sometimes is something in the overburden of overlying rock retarding the gradual formation of an oxidation anomaly. In a laterite terrane where the near surface portion of the deposit has been intensely weathered an apical anomaly will often be observed. In one case study in southern Brazil, where Pre-Cambrian schists containing shear-hosted Au deposits have been deeply lateritized, an apical 2.5 ppb Enzyme Leach Au anomaly occurs directly over the mineralized bedrock (Figure 2). The anomalous contrast in this case is twenty-five times background, where other geochemical methods did not reveal any anomaly. In some cases that "something" is an actual barrier, but in many cases it is simply depth. A "fault-related" anomaly will occur almost directly over the subcrop of the fault. Most of the anomalies detected with the Enzyme Leach are fault-related. However, where a buried reduced body is intersected by a fault, an oxidation suite of elements, including one or more halogens, can form an extremely-high-contrast anomaly directly over the trace of the buried fault. Other wise, apical anomalies usually exhibit a diminished contrast above background, compared to oxidation anomalies. Fault-related anomalies commonly contain very-high-contrast concentrations of zirconium and other supposedly "immobile" elements.
Combination Anomalies Metallic mineral deposits can present a complete gradation of Enzyme Leach anomaly patterns from oxidation halos to apical anomalies. Many anomaly patterns are combination anomalies, in that they exhibit the characteristics of both oxidation halos and apical anomalies. In these cases, many of the members of the oxidation suite occur around the sides of the buried deposit, and one or more commodity metals are found in the center of the anomaly, directly over the source. Any trace elements added to the host rocks of the deposit may also produce an apical anomaly over the alteration zone. With increasing efficiency of the oxidation process, several changes are observed in the morphology of these anomalies: l. Initially, a weak halo comprised primarily of bromine and/or iodine is produced by a weak oxidation cell. The number of trace elements in the oxidation halo increase and the anomalous contrast of those elements tends to rise with increasing strength of a cell. 2. In weak cells, commodity metals in the concealed deposit form an apical anomaly over the source. In moderately strong cells, the commodity metals migrate into both the halo and into an apical anomaly over the source. In a strong cell, the commodity met als in the deposit are enriched at points within the halo of a strong cell. In many areas, these morphological changes are a function of the depth of the deposit (Figure 3). The greater the depth, the weaker the cell. In one area where a mineralized trend plunges into the basement, a progression from one anomaly type to another has been observed along the plunge of the trend. The critical depths at which these morphological changes occur changes from one geological terrane to another. Host rock composition, geochemical barriers, and climate variations also affect the depths at which these transitions take place. In northern Chile, deposits at a depth of about one kilometer typically produce a moderately strong to strong oxidation cell. In the Canadian Shield, sulfide deposits often will produce weak oxidation cells when they are at a depth of less than one kilometer. Graphitic host rocks have a very strong quenching effect on the strength of oxidation
File Name: E:\Expl'97.Abstract.02.Ds5; Page 3
O
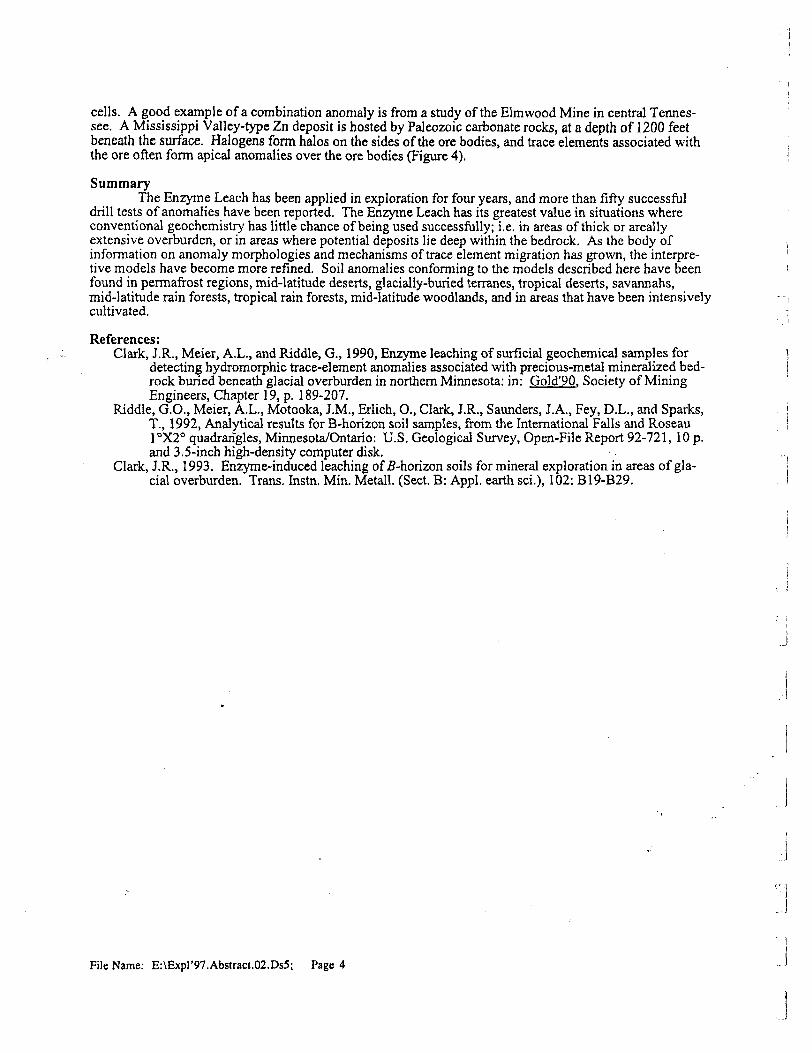
cells. A good example of a combination anomaly is from a study of the Elmwood Mine in central Tennes see. A Mississippi Valley-type Zn deposit is hosted by Paleozoic carbonate rocks, at a depth of 1200 feet beneath the surface. Halogens form halos on the sides of the ore bodies, and trace elements associated with the ore often form apical anomalies over the ore bodies (Figure 4).
SummaryThe Enzyme Leach has been applied in exploration for four years, and more than fifty successful
drill tests of anomalies have been reported. The Enzyme Leach has its greatest value in situations where conventional geochemistry has little chance of being used successfully; i.e. in areas of thick or areally extensive overburden, or in areas where potential deposits lie deep within the bedrock. As the body of information on anomaly morphologies and mechanisms of trace element migration has grown, the interpre tive models have become more refined. Soil anomalies conforming to the models described here have been found in permafrost regions, mid-latitude deserts, glacially-buried terranes, tropical deserts, savannahs, mid-latitude rain forests, tropical rain forests, mid-latitude woodlands, and in areas that have been intensively cultivated.
References:Clark, I.R., Meier, A.L., and Riddle, G., 1990, Enzyme leaching of surficial geochemical samples for
detecting hydromorphic trace-element anomalies associated with precious-metal mineralized bed rock buried beneath glacial overburden in northern Minnesota: in: Gold'90. Society of Mining Engineers, Chapter 19, p. 189-207.
Riddle, G.O., Meier, A.L., Motooka, J.M., Erlich, O., Clark, J.R., Saunders, J.A., Fey, D.L., and Sparks, T., 1992, Analytical results for B-horizon soil samples, from the International Falls and Roseau rX20 quadrangles, Minnesota/Ontario: U.S. Geological Survey, Open-File Report 92-721, 10 p. and 3.5-inch high-density computer disk.
Clark, J.R., 1993. Enzyme-induced leaching of 5-horizon soils for mineral exploration in areas of gla cial overburden. Trans. Instn. Min. Metall. (Sect. B: Appl. earth sci.), 102: B19-B29.
File Name: E:\Expl'97.Abstract.02.Ds5; Page 4
400 Central Low
200 400
West
600Meters
800 1000 1200
East
Basin-Fill Alluvium
Cambrian Carbonates ft Shales
CLAY PIT CROSS SECTION
Figure l. Typical Enzyme Leach oxidation halo over the Clay Pit deposit, an epithermal gold ore body in the Getchell Trend, Nevada. The central low directly overlies the upper end of the mineralized body. The deposit is capped by seventy meters of argillized Tertiary volcanic rock and eighty meters of basin-fill alluvium.
File Name: E:\Expr97.Abstract.02.Ds5; Page 5
Enzyme Leach Au 4 As Profiles Deepfey Weathered Lode-Gold Deposit, Brazil
-1000 -800 -600 -400^ -200
Distance Metres200 400 600
100 metres
LODE Au ZONES
FRESH ROCK
Figure 2. Apical Au anomaly over deeply lateritized lode-gold deposit in southern Brazil. Conventional geochemical analyses failed to produce an anomaly.
File Name: E:\Expr97.Abstract.02.Ds5; Page 6
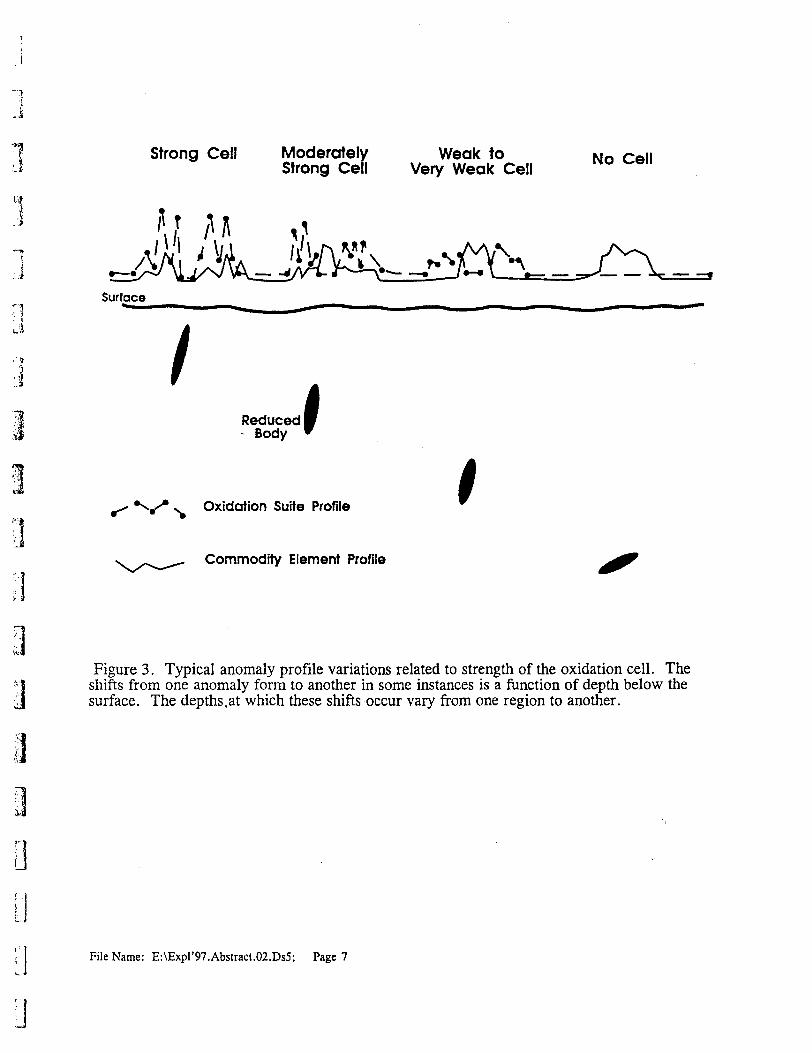
1 Strong Cell Moderately Weak to No C6ii d Strong Cell Very Weak Cell
Surface
Reduced Body t
. Oxidation Suite Profile
Commodity Element Profile
l
"I
j
Figure 3. Typical anomaly profile variations related to strength of the oxidation cell. The shifts from one anomaly form to another in some instances is a function of depth below the surface. The depths. at which these shifts occur vary from one region to another.
File Name: E:\ExpI'97.Abstract.02.Ds5; Page 7
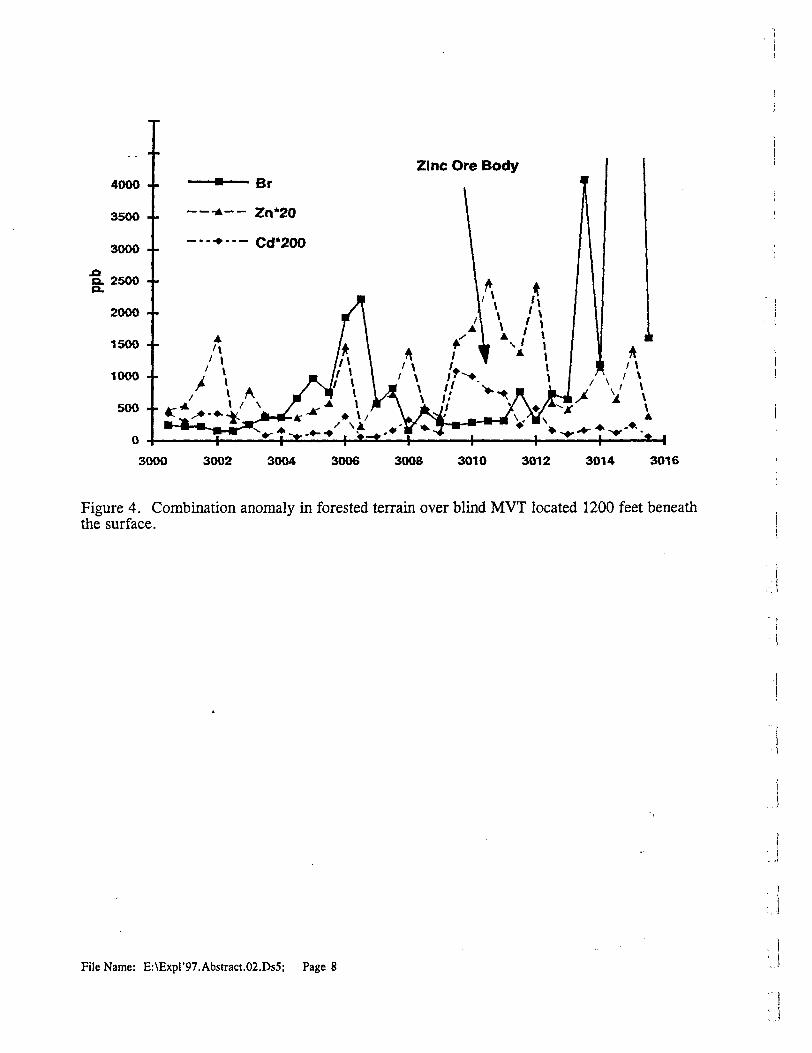
4000 - -
3500 --
3000 --
Q. 2500 4- o.
Br— -A— Zn*20
——-*—— Cd*200
Zinc Ore Body
3OOO 3002 3004 3O06 3006 3010 3012 3014 3016
Figure 4. Combination anomaly in forested terrain over blind MVT located 1200 feet beneath the surface.
File Name: E:\Expl'97.Abstract.02.Ds5; Page 8
JULY 1997 SOCIETY OF ECONOMIC GEOLOGISTS NUMBER 30
Empirical Geologic Modeling inIntrusion-related Gold Exploration;
An Example from the BuffaloValley Area, Northern Nevada
J.A. KIZIS, JR. (SEG 1993)—FAIRMILE GOLD CORP. * S.R. BRUFF—HUMBOLDT MINING SERVICESE.M. CRIST (SEG 1976)—CONSULTANT * D.C.MOUGH—CONSULTANT
R.G. VAUGHAN (SEG 1996)—NORTH AMERICAN EXPLORATION, INC.
Coi
Q his paper describes an empirically derived model for gold mineralization at Fairmile Gold Corporation's Buffalo
Valley Project, Nevada. The model relates gold to genetically related granodioritic intrusions, and is based on field observations and multi element geochemistry of surface exposures and drill cuttings. This model has been successfully used to evaluate several targets on the Project, and it may as well serve as an exploration tool for similar deposits elsewhere. The model has been especially helpful in evaluating targets covered by post-mineral alluvium.
The Buffalo Valley Project is located in the Buffalo Valley Mining District, in the north western part of the Battle Mountain-Eureka mineral trend (Figure 1). This part of the trend contains numerous multi-million-ounce gold deposits, such as Fortitude, Lone Tree, and McCoy/Cove, as well as many areas undergoing exploration. Approximately 2,000 kg (65,000 troy oz) of gold were mined from a small open pit at Buffalo Valley in the late 1980s.
Recent exploration by Fairmile Gold Corporation beneath and adjacent to the Buffalo Valley open-pit mine has delineated a resource consisting of approximately 16,200 kg Au (522,000 troy oz Au) (Figure 2), of which approximately 11.4 million measured/ indicated tonnes (T) (12.6 million tons) contain iZ^JOtNcg Au (401,000 troy oz Au) with a grade of 1.1 g/T (0.031 troy oz Au per ton) and approximately 4.2 million inferred T (4.6 million tons) contain 3,800 kg Au (121,000 troy oz Au) with a grade of 0.9 g/T
Tnnton Canyon
Buffalo Valley
—•""""TO""^: 'S\,^ N^Coppmr Bnln
*r ^ V Coppw Canyon
jumr mvmuH eoia Mttr
* Gold Dipnlt
FIGURE 1 . Map showing the location of the Buffalo Valley Project and surrounding gold deposits.
(0.027 troy oz Au per ton). Geologic, metallurgic, and economic studies are now in progress to further evaluate this resource, which remains open to the southwest. An additional 2,100 kg Au (67,000 troy oz Au) have been preliminarily defined at "Target F" (Figure 2), although this low-grade (0.75 g/T Au) material currently is not considered to be economic because it occurs beneath more than 60 m of gravel cover. Promising intercepts of gold have been encountered at several other targets, which are being actively explored. lo page 6
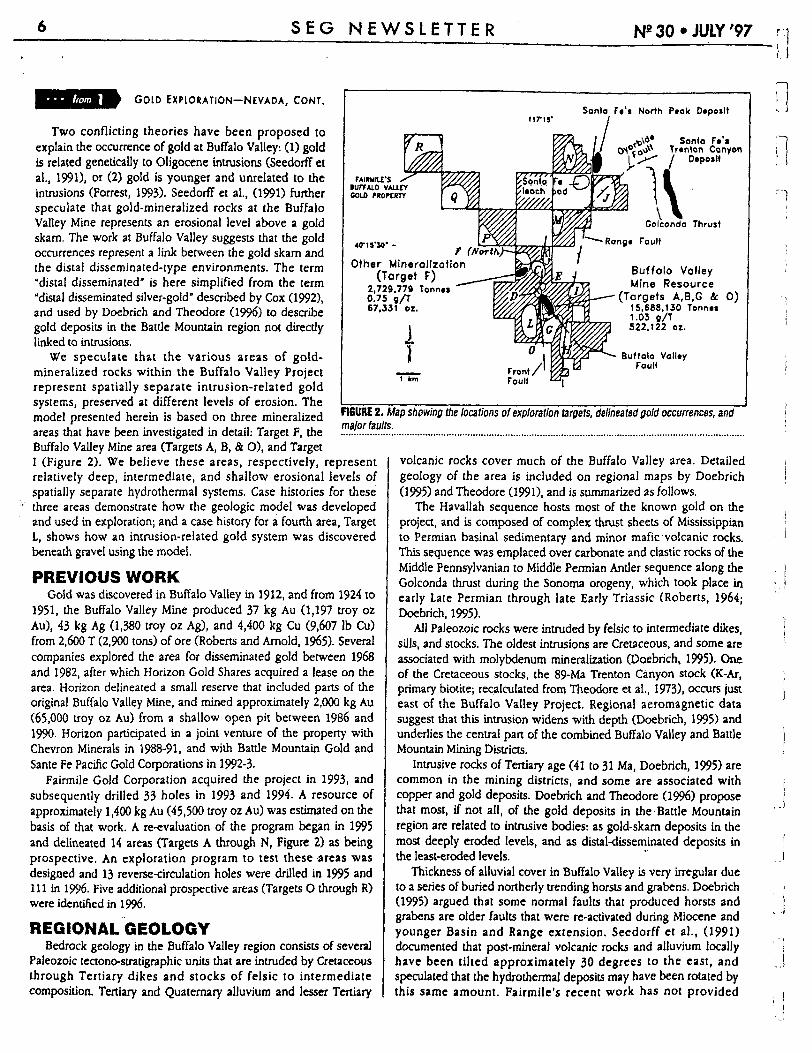
SEG NEWSLETTER N2 30-JULY'97
tins'Santo FYt North Peak Deposit
Sonto Fe'sTrenton Canyon
Deposit
Colconda Thrust
4*rts'JO" '
GOLD EXPLORATION-NEVADA, CONT.
Two conflicting theories have been proposed to explain the occurrence of gold at Buffalo Valley: (1) gold is related genetically to Oligocene intrusions (Seedorff et al., 199D, or (2) gold is younger and unrelated to the intrusions (Forrest, 1993). Seedorff et al., (1991) further speculate that gold-mineralized rocks at the Buffalo Valley Mine represents an erosional level above a gold skarn. The work at Buffalo Valley suggests that the gold occurrences represent a link between the gold skarn and the distal disseminated-type environments. The term "distal disseminated" is here simplified from the term "distal disseminated silver-gold" described by Cox (1992), and used by Doebrich and Theodore (1996) to describe gold deposits in the Battle Mountain region not directly linked to intrusions.
We speculate that the various areas of gold- mineralized rocks within the Buffalo Valley Project represent spatially separate intrusion-related goldsystems, preserved at different levels of erosion. The ____________________________ model presented herein is based on three mineralized JJJJjj^J*" shmriag ** l00ati0"3 Ol' exploratlon ^^ *M****OoM occurrences, and areas that have been investigated in detail: Target F, the .....'.............^.................................................................................................................................Buffalo Valley Mine area (Targets A, B, 4 O), and Target
Other Mineralization(Target F)
2,729.779 Tonnes 0.75 g/T 67.331 oz.
Buffalo Valley Mine Resource
(Targets A.B.G ft O)15.668.130 Tonnes 1.03 g/T 522.122 oz.
Buffalo Valley Paull
I (Figure 2). We believe these areas, respectively, represent relatively deep, intermediate, and shallow erosional levels of spatially separate hydrothermal systems. Case histories for these three areas demonstrate how the geologic model was developed and used in exploration; and a case history for a fourth area, Target L, shows how an intrusion-related gold system was discovered beneath gravel using the model.
PREVIOUS WORKGold was discovered in Buffalo Valley in 1912, and from 1924 to
1951, the Buffalo Valley Mine produced 37 kg Au (1,197 troy oz Au), 43 kg Ag (1,380 troy oz Ag), and 4,400 kg Cu (9,607 Ib Cu) from 2,600 T (2,900 tons) of ore (Roberts and Arnold, 1965). Several companies explored the area for disseminated gold between 1968 and 1982, after which Horizon Gold Shares acquired a lease on the area. Horizon delineated a small reserve that included parts of the original Buffalo Valley Mine, and mined approximately 2,000 kg Au (65,000 troy oz Au) from a shallow open pit between 1986 and 1990. Horizon participated in a joint venture of the property with Chevron Minerals in 1988-91, and with Battle Mountain Gold and Sante Fe Pacific Gold Corporations in 1992-3-
Fairmile Gold Corporation acquired the project in 1993, and subsequently drilled 33 holes in 1993 and 1994. A resource of approximately 1,400 kg Au (45,500 troy oz Au) was estimated on the basis of that work. A re-evaluation of the program began in 1995 and delineated 14 areas (Targets A through N, Figure 2) as being prospective. An exploration program to test these areas was designed and 13 reverse-circulation holes were drilled in 1995 and 111 in 1996. Five additional prospective areas (Targets O through R) were identified in 1996.
REGIONAL GEOLOGYBedrock geology in the Buffalo Valley region consists of several
Paleozoic tectono-stratigraphic units that are intruded by Cretaceous through Tertiary dikes and stocks of felsic to intermediate composition. Tertiary and Quaternary alluvium and lesser Tertiary
volcanic rocks cover much of the Buffalo Valley area. Detailed geology of the area is included on regional maps by Doebrich (1995) and Theodore (1991), and is summarized as follows.
The Havallah sequence hosts most of the known gold on the project, and is composed of complex thrust sheets of Mississippian to Permian basinal sedimentary and minor mafic volcanic rocks. This sequence was emplaced over carbonate and clastic rocks of the Middle Pennsylvanian to Middle Permian Antler sequence along the Golconda thrust during the Sonoma orogeny, which took place in early Late Permian through late Early Triassic (Roberts, 1964; Doebrich, 1995).
All Paleozoic rocks were intruded by felsic to intermediate dikes, sills, and stocks. The oldest intrusions are Cretaceous, and some are associated with molybdenum mineralization (Doebrich, 1995). One of the Cretaceous stocks, the 89-Ma Trenton Canyon stock (K-Ar, primary biotite; recalculated from Theodore et al., 1973), occurs just east of the Buffalo Valley Project. Regional aeromagnetic data suggest that this intrusion widens with depth (Doebrich, 1995) and underlies the central pan of the combined Buffalo Valley and Battle Mountain Mining Districts.
Intrusive rocks of Tertiary age (41 to 31 Ma, Doebrich, 1995) are common in the mining districts, and some are associated with copper and gold deposits. Doebrich and Theodore (1996) propose that most, if not all, of the gold deposits in the Battle Mountain region are related to intrusive bodies: as gold-skarn deposits in the most deeply eroded levels, and as distal-disseminated deposits in the least-eroded levels.
Thickness of alluvial cover in Buffalo Valley is very irregular due to a series of buried northerly trending horsts and grabens. Doebrich (1995) argued that some normal faults that produced horsts and grabens are older faults that were re-activated during Miocene and younger Basin and Range extension. Seedorff et al., (1991) documented that post-mineral volcanic rocks and alluvium locally have been tilted approximately 30 degrees to the east, and speculated that the hydrothermal deposits may have been rotated by this same amount. Fairmile's recent work has not provided
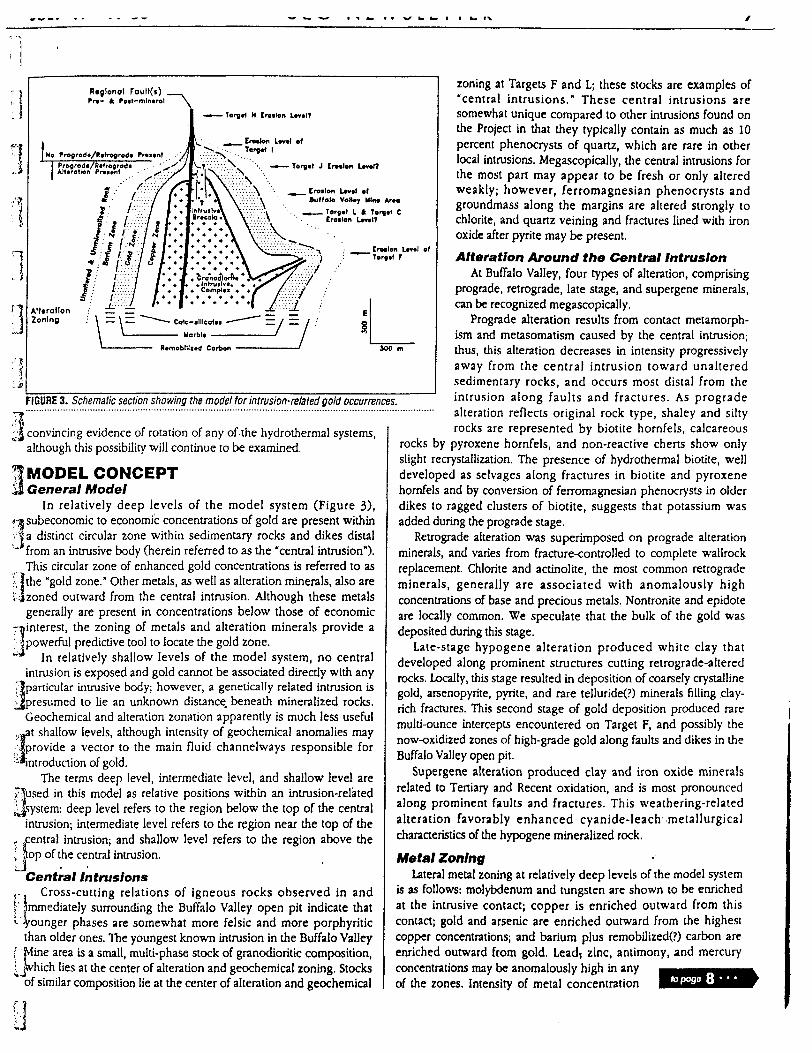
3
l
O
Rvglonol Fouft(t)- ft PM I—mineral
H [roilon LmIT
Torg.l J Erosion Unl?
—_ Croslon Isvol ofBuffalo VolUy Mlna Arta
-^—— Torgot L t Torgd C Croslon Lsvst?
troslon Ltvsl of "Torjsl r
Alteration Zoning
R*mobltli*d Corbon '
FIGURE 3. Schematic section showing the model for intrusion-related gold occurrences.
j;| convincing evidence of rotation of any of the hydrothermal systems, although this possibility will continue to be examined.
f! MODEL CONCEPTH General Model
In relatively deep levels of the model system (Figure 3), f| subeconomic to economic concentrations of gold are present within via distinct circular zone within sedimentary rocks and dikes distal
from an intrusive body (herein referred to as the "central intrusion").This circular zone of enhanced gold concentrations is referred to as
?, I the "gold zone." Other metals, as well as alteration minerals, also are s Jzoned outward from the central intrusion. Although these metals
generally are present in concentrations below those of economic rainterest, the zoning of metals and alteration minerals provide a : Ipowerful predictive tool to locate the gold zone.
In relatively shallow levels of the model system, no centralintrusion is exposed and gold cannot be associated directly with any
jlparticular intrusive body; however, a genetically related intrusion is Jfpresumed to lie an unknown distance, beneath mineralized rocks.
Geochemical and alteration zonation apparently is much less useful ,^at shallow levels, although intensity of geochemical anomalies may •fprovide a vector to the main fluid channelways responsible for introduction of gold.
The terms deep level, intermediate level, and shallow level are /lused in this model as relative positions within an intrusion-related ^Jsystem: deep level refers to the region below the top of the central
intrusion; intermediate level refers to the region near the top of the ,. ^central intrusion; and shallow level refers to the region above the \ flop of the central intrusion.LJ
Central Intrusionsr Cross-cutting relations of igneous rocks observed in and f Immediately surrounding the Buffalo Valley open pit indicate that ^younger phases are somewhat more felsic and more porphyritic
than older ones. The youngest known intrusion in the Buffalo Valley ( Mine area is a small, multi-phase stock of granodioritic composition, ^Jvhich lies at the center of alteration and geochemical zoning. Stocks
of similar composition lie at the center of alteration and geochemical
zoning at Targets F and L; these stocks are examples of "central intrusions." These central intrusions are somewhat unique compared to other intrusions found on the Project in that they typically contain as much as 10 percent phenocrysts of quartz, which are rare in other local intrusions. Megascopically, the central intrusions for the most part may appear to be fresh or only altered weakly; however, ferromagnesian phenocrysts and groundmass along the margins are altered strongly to chlorite, and quartz veining and fractures lined with iron oxide after pyrite may be present.Alteration Around the Central Intrusion
At Buffalo Valley, four types of alteration, comprising prograde, retrograde, late stage, and supergene minerals, can be recognized megascopically.
Prograde alteration results from contact metamorph ism and metasomatism caused by the central intrusion; thus, this alteration decreases in intensity progressively away from the central intrusion toward unaltered sedimentary rocks, and occurs most distal from the intrusion along faults and fractures. As prograde alteration reflects original rock type, shaley and silty rocks are represented by biotite hornfels, calcareous
rocks by pyroxene hornfels, and non-reactive cherts show only slight recrystallization. The presence of hydrothermal biotite, well developed as selvages along fractures in biotite and pyroxene hornfels and by conversion of ferromagnesian phenocrysts in older dikes to ragged clusters of biotite, suggests that potassium was added during the prograde stage.
Retrograde alteration was superimposed on prograde alteration minerals, and varies from fracture-controlled to complete wallrock replacement. Chlorite and actinolite, the most common retrograde minerals, generally are associated with anomalously high concentrations of base and precious metals. Nontronite and epidote are locally common. We speculate that the bulk of the gold was deposited during this stage.
Late-stage hypogene alteration produced white clay that developed along prominent structures cutting retrograde-altered rocks. Locally, this stage resulted in deposition of coarsely crystalline gold, arsenopyrite, pyrite, and rare telluride(?) minerals filling clay- rich fractures. This second stage of gold deposition produced rare multi-ounce intercepts encountered on Target F, and possibly the now-oxidized zones of high-grade gold along faults and dikes in the Buffalo Valley open pit.
Supergene alteration produced clay and iron oxide minerals related to Tertiary and Recent oxidation, and is most pronounced along prominent faults and fractures. This weathering-related alteration favorably enhanced cyanide-leach .metallurgical characteristics of the hypogene mineralized rock.
Metal ZoningLateral metal zoning at relatively deep levels of the model system
is as follows: molybdenum and tungsten are shown to be enriched at the intrusive contact; copper is enriched outward from this contact; gold and arsenic are enriched outward from the highest copper concentrations; and barium plus remobilized(?) carbon are enriched outward from gold. Lead; zinc, antimony, and mercury concentrations may be anomalously high in any of the zones. Intensity of metal concentration topoge 8
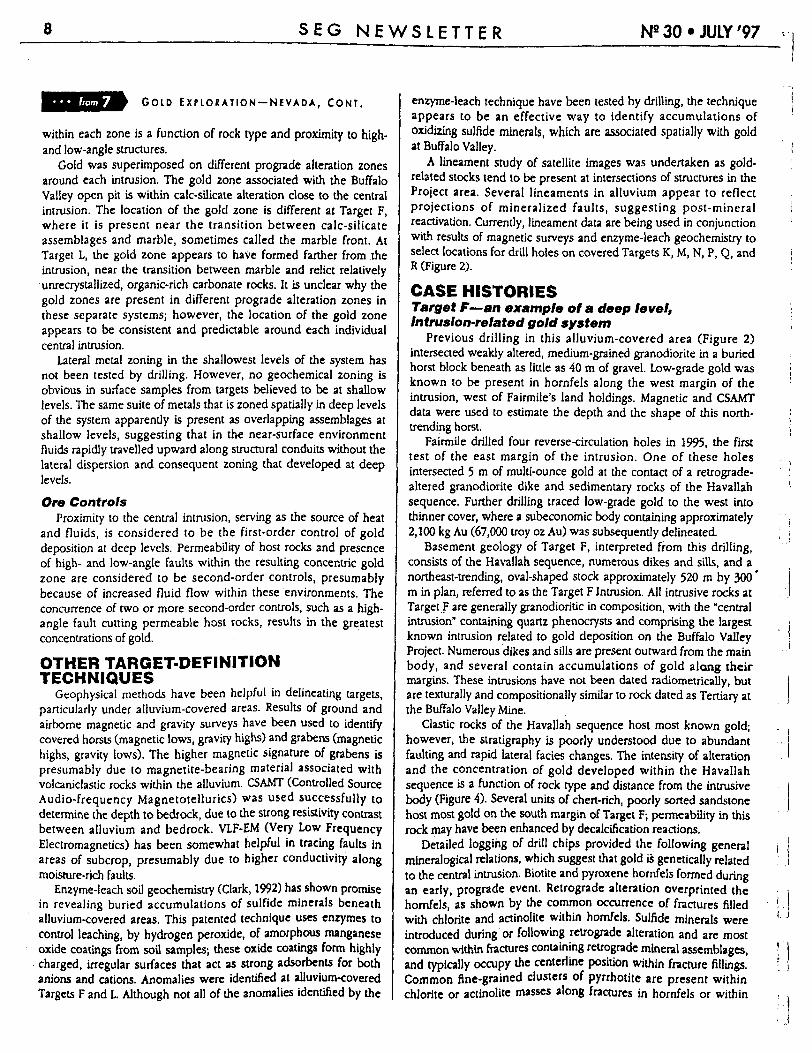
8 SEG NEWSLETTER N* 30* JULY '97
GOLD EXPLORATION — NEVADA, CONT.
within each zone is a function of rock type and proximity to high- and low-angle structures.
Gold was superimposed on different prograde alteration zones around each intrusion. The gold zone associated with the Buffalo Valley open pit is within calc-silicate alteration close to the central intrusion. The location of the gold zone is different at Target F, where it is present near the transition between calc-silicate assemblages and marble, sometimes called the marble front. At Target L, the gold zone appears to have formed farther from the intrusion, near the transition between marble and relict relatively unrecrystallized, organic-rich carbonate rocks. It is unclear why the gold zones are present in different prograde alteration zones in these separate systems; however, the location of the gold zone appears to be consistent and predictable around each individual central intrusion.
Lateral metal zoning in the shallowest levels of the system has not been tested by drilling. However, no geochemical zoning is obvious in surface samples from targets believed to be at shallow levels. The same suite of metals that is zoned spatially in deep levels of the system apparently is present as overlapping assemblages at shallow levels, suggesting that in the near-surface environment fluids rapidly travelled upward along structural conduits without the lateral dispersion and consequent zoning that developed at deep levels.Ore Controls
Proximity to the central intrusion, serving as the source of heat and fluids, is considered to be the first-order control of gold deposition at deep levels. Permeability of host rocks and presence of high- and low-angle faults within the resulting concentric gold zone are considered to be second-order controls, presumably because of increased fluid flow within these environments. The concurrence of two or more second-order controls, such as a high- angle fault cutting permeable host rocks, results in the greatest concentrations of gold.
OTHER TARGET-DEFINITION TECHNIQUES
Geophysical methods have been helpful in delineating targets, particularly under alluvium-covered areas. Results of ground and airborne magnetic and gravity surveys have been used to identify covered horsts (magnetic lows, gravity highs) and grabens (magnetic highs, gravity lows). The higher magnetic signature of grabens is presumably due to magnetite-bearing material associated with volcaniclastic rocks within the alluvium. CSAMT (Controlled Source Audio-frequency Magnetotellurics) was used successfully to determine the depth to bedrock, due to the strong resistivity contrast between alluvium and bedrock. VLF-EM (Very Low Frequency Electromagnetics) has been somewhat helpful in tracing faults in areas of subcrop, presumably due to higher conductivity along moisture-rich faults.
Enzyme-leach soil geochemistry (Clark, 1992) has shown promise in revealing buried accumulations of sulfide minerals beneath alluvium-covered areas. This patented technique uses enzymes to control leaching, by hydrogen peroxide, of amorphous manganese oxide coatings from soil samples; these oxide coatings form highly charged, irregular surfaces that act as strong adsorbents for both anions and cations. Anomalies were identified at alluvium-covered Targets F and L. Although not all of the anomalies identified by the
enzyme-leach technique have been tested by drilling, the technique appears to be an effective way to identify accumulations of oxidizing sulfide minerals, which are associated spatially with gold at Buffalo Valley.
A lineament study of satellite images was undertaken as gold- related stocks tend to be present at intersections of structures in the Project area. Several lineaments in alluvium appear to reflect projections of mineralized faults, suggesting post-mineral reactivation. Currently, lineament data are being used in conjunction with results of magnetic surveys and enzyme-leach geochemistry to select locations for drill holes on covered Targets K, M, N, P, Q, and R (Figure 2).
CASE HISTORIESTarget F—an example of a deep level, Intrusion-related gold system
Previous drilling in this alluvium-covered area (Figure 2) intersected weakly altered, medium-grained granodiorite in a buried horst block beneath as little as 40 m of gravel. Low-grade gold was known to be present in hornfels along the west margin of the intrusion, west of Fairmile's land holdings. Magnetic and CSAMT data were used to estimate the depth and the shape of this north- trending horst.
Fairmile drilled four reverse-circulation holes in 1995, the first test of the east margin of the intrusion. One of these holes intersected 5 m of multi-ounce gold at the contact of a retrograde- altered granodiorite dike and sedimentary rocks of the Havallah sequence. Further drilling traced low-grade gold to the west into thinner cover, where a subeconomic body containing approximately 2,100 kg Au (67,000 troy oz Au) was subsequently delineated.
Basement geology of Target F, interpreted from this drilling, consists of the Havallah sequence, numerous dikes and sills, and a northeast-trending, oval-shaped stock approximately 520 m by 300' m in plan, referred to as the Target F Intrusion. All intrusive rocks at Target F are generally granodiorite in composition, with the "central intrusion" containing quartz phenocrysts and comprising the largest known intrusion related to gold deposition on the Buffalo Valley Project. Numerous dikes and sills are present outward from the main body, and several contain accumulations of gold along their margins. These intrusions have not been dated radiometrically, but are texturally and compositionally similar to rock dated as Tertiary at the Buffalo Valley Mine.
Clastic rocks of the Havallah sequence host most known gold; however, the stratigraphy is poorly understood due to abundant faulting and rapid lateral facies changes. The intensity of alteration and the concentration of gold developed within the Havallah sequence is a function of rock type and distance from the intrusive body (Figure 4). Several units of chert-rich, poorly sorted sandstone host most gold on the south margin of Target F; permeability in this rock may have been enhanced by decalcification reactions.
Detailed logging of drill chips provided the following general mineralogical relations, which suggest that gold is genetically related to the central intrusion. Biotite and pyroxene hornfels formed during an early, prograde event. Retrograde alteration overprinted the hornfels, as shown by the common occurrence of fractures filled with chlorite and actinolite within hornfels. Sulfide minerals were introduced during or following retrograde alteration and are most common within fractures containing retrograde mineral assemblages, and typically occupy the center! ine position within fracture fillings. Common fine-grained clusters of pyrrhotite are present within chlorite or actinolite masses along fractures in hornfels or within
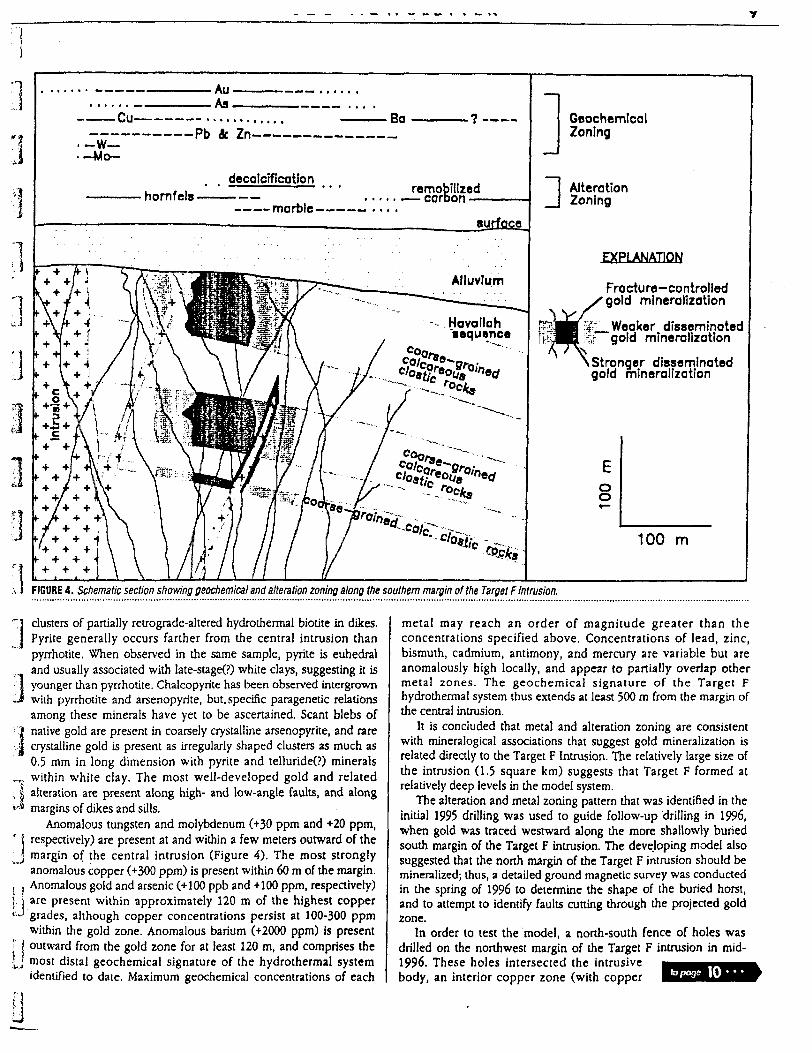
Cu——————Pb tt Zn
Geochemical Zoning
Alteration Zoning
EPLANATION
Fracture-controlled gold mineralization
4~^ Weaker disseminated ',r gold mineralization
Stronger disseminated gold mineralization
o o
100 m
FIGURE 4. Schematic section showing geochemical and alteration zoning along the southern margin of the Target F Intrusion.
dusters of partially retrograde-altered hydrothermal biotite in dikes. Pyrite generally occurs farther from the central intrusion than pyrrhotite. When observed in the same sample, pyrite is euhedral and usually associated with late-stage(?) white clays, suggesting it is younger than pyrrhotite. Chalcopyrite has been observed intergrown with pyrrhotite and arsenopyrite, but. specific paragenetic relations among these minerals have yet to be ascertained. Scant blebs of native gold are present in coarsely crystalline arsenopyrite, and rare crystalline gold is present as irregularly shaped clusters as much as 0.5 mm in long dimension with pyrite and telluride(?) minerals within white clay. The most well-developed gold and related alteration are present along high- and low-angle faults, and along margins of dikes and sills.
Anomalous tungsten and molybdenum (+30 ppm and +20 ppm, respectively) are present at and within a few meters outward of the margjn of the central intrusion (Figure 4). The most strongly anomalous copper (+300 ppm) is present within 60 m of the margin. Anomalous gold and arsenic (+100 ppb and +100 ppm, respectively) are present within approximately 120 m of the highest copper grades, although copper concentrations persist at 100-300 ppm within the gold zone. Anomalous barium (+2000 ppm) is present outward from the gold zone for at least 120 m, and comprises the most distal geochemical signature of the hydrothermal system identified to date. Maximum geochemical concentrations of each
metal may reach an order of magnitude greater than the concentrations specified above. Concentrations of lead, zinc, bismuth, cadmium, antimony, and mercury are variable but are anomalously high locally, and appear to partially overlap other metal zones. The geochemical signature of the Target F hydrothermal system thus extends at least 500 m from the margin of the central intrusion.
It is concluded that metal and alteration zoning are consistent with mineralogical associations that suggest gold mineralization is related directly to the Target F Intrusion. The relatively large size of the intrusion (1.5 square km) suggests that Target F formed at relatively deep levels in the model system.
The alteration and metal zoning pattern that was identified in the initial 1995 drilling was used to guide follow-up drilling in 1996, when gold was traced westward along the more shallowly buried south margin of the Target F intrusion. The developing model also suggested that the north margin of the Target F intrusion should be mineralized; thus, a detailed ground magnetic survey was conducted in the spring of 1996 to determine the shape of the buried horst, and to attempt to identify faults cutting through the projected gold zone.
In order to test the model, a north-south fence of holes was drilled on the northwest margin of the Target F intrusion in mid- 1996. These holes intersected the intrusive body, an interior copper zone (with copper lo page 10
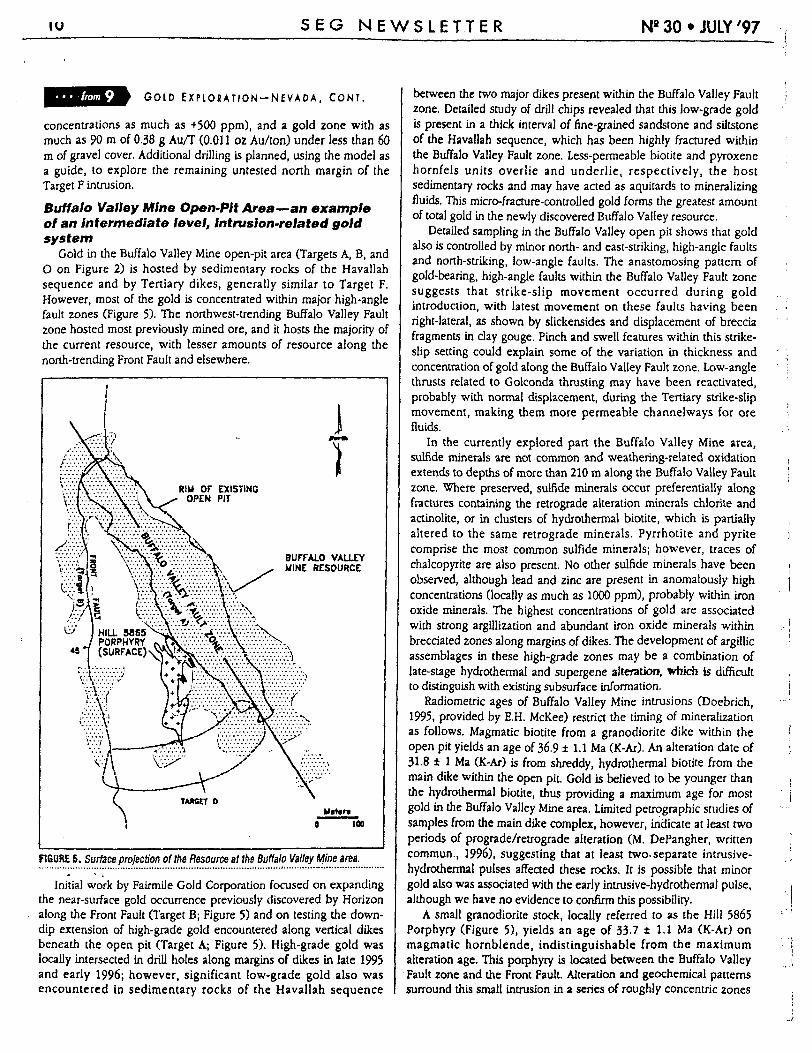
IU SEG NEWSLETTER N8 30-JULY'97
from 9 Goto EXPLORATION—NEVADA, CONI.
concentrations as much as +500 ppm), and a gold zone with as much as 90 m of 0.38 g Au/T (0.011 oz Au/ton) under less than 60 m of gravel cover. Additional drilling is planned, using the model as a guide, to explore the remaining untested north margin of the Target F intrusion.
Buffalo Valley Mine Open-Pit Area—an example of an Intermediate level, Intrusion-related gold system
Gold in the Buffalo Valley Mine open-pit area (Targets A, B, and O on Figure 2) is hosted by sedimentary rocks of the Havallah sequence and by Tertiary dikes, generally similar to Target F. However, most of the gold is concentrated within major high-angle fault zones (Figure 5). The northwest-trending Buffalo Valley Fault zone hosted most previously mined ore, and it hosts the majority of the current resource, with lesser amounts of resource along the north-trending Front Fault and elsewhere.
i
RIM OF EXISTING OPEN PIT
BUFFALO VALLEY MINE RESOURCE
HILL 5865 PORPHYRY (SURFACE) \X
F1GUHB 5. Surface projection of the Resource at the Buffalo Valley Mine area.
Initial work by Fairmile Gold Corporation focused on expanding the near-surface gold occurrence previously discovered by Horizon along the Front Fault (Target B; Figure 5) and on testing the down dip extension of high-grade gold encountered along vertical dikes beneath the open pit (Target A; Figure 5). High-grade gold was locally intersected in drill holes along margins of dikes in late 1995 and early 1996; however, significant low-grade gold also was encountered in sedimentary rocks of the Havallah sequence
between the two major dikes present within the Buffalo Valley Fault zone. Detailed study of drill chips revealed that this low-grade gold is present in a thick interval of fine-grained sandstone and siltstone of the Havallah sequence, which has been highly fractured within the Buffalo Valley Fault zone. Less-permeable biotite and pyroxene hornfels units overlie and underlie, respectively, the host sedimentary rocks and may have acted as aquitards to mineralizing fluids. This micro-fracture-controlled gold forms the greatest amount of total gold in the newly discovered Buffalo Valley resource.
Detailed sampling in the Buffalo Valley open pit shows that gold also is controlled by minor north- and east-striking, high-angle faults and north-striking, low-angle faults. The anastomosing pattern of gold-bearing, high-angle faults within the Buffalo Valley Fault zone suggests that strike-slip movement occurred during gold introduction, with latest movement on these faults having been right-lateral, as shown by slickensides and displacement of breccia fragments in clay gouge. Pinch and swell features within this strike- slip setting could explain some of the variation in thickness and concentration of gold along the Buffalo Valley Fault zone. Low-angle thrusts related to Golconda thrusting may have been reactivated, probably with normal displacement, during the Tertiary strike-slip movement, making them more permeable channelways for ore fluids.
In the currently explored part the Buffalo Valley Mine area, sulfide minerals are not common and weathering-related oxidation extends to depths of more than 210 m along the Buffalo Valley Fault zone. Where preserved, sulfide minerals occur preferentially along fractures containing the retrograde alteration minerals chlorite and actinolite, or in clusters of hydrothermal biotite, which is partially altered to the same retrograde minerals. Pyrrhotite and pyrite comprise the most common sulfide minerals; however, traces of chalcopyrite are also present. No other sulfide minerals have been observed, although lead and zinc are present in anomalously high concentrations (locally as much as 1000 ppm), probably within iron oxide minerals. The highest concentrations of gold are associated with strong argillization and abundant iron oxide minerals within brecciated zones along margins of dikes. The development of argillic assemblages in these high-grade zones may be a combination of late-stage hydrothermal and supergene alteration, which is difficult to distinguish with existing subsurface information.
Radiometric ages of Buffalo Valley Mine intrusions (Doebrich, 1995, provided by E.H. McKee) restrict the timing of mineralization as follows. Magmatic biotite from a granodiorite dike within the open pit yields an age of 36.9 ± 1.1 Ma (K-Ar). An alteration date of 31.8 ± l Ma (K-Ar) is from shreddy, hydrothermal biotite from the main dike within the open pit. Gold is believed to be younger than the hydrothermal biotite, thus providing a maximum age for most gold in the Buffalo Valley Mine area. Limited petrographic studies of samples from the main dike complex, however, indicate at least two periods of prograde/retrograde alteration (M. DePangher, written commun., 1996), suggesting that at least two-separate intrusive- hydrotherma! pulses affected these rocks. It is possible that minor gold also was associated with the early intrusive-hydrothermal pulse, although we have no evidence to confirm this possibility.
A small granodiorite stock, locally referred to as the Hill 5865 Porphyry (Figure 5), yields an age of 33.7 ± 1.1 Ma (K-Ar) on magmatic hornblende, indistinguishable from the maximum alteration age. This porphyry is located between the Buffalo Valley Fault zone and the Front Fault. Alteration and geochemical patterns surround this small intrusion in a series of roughly concentric zones
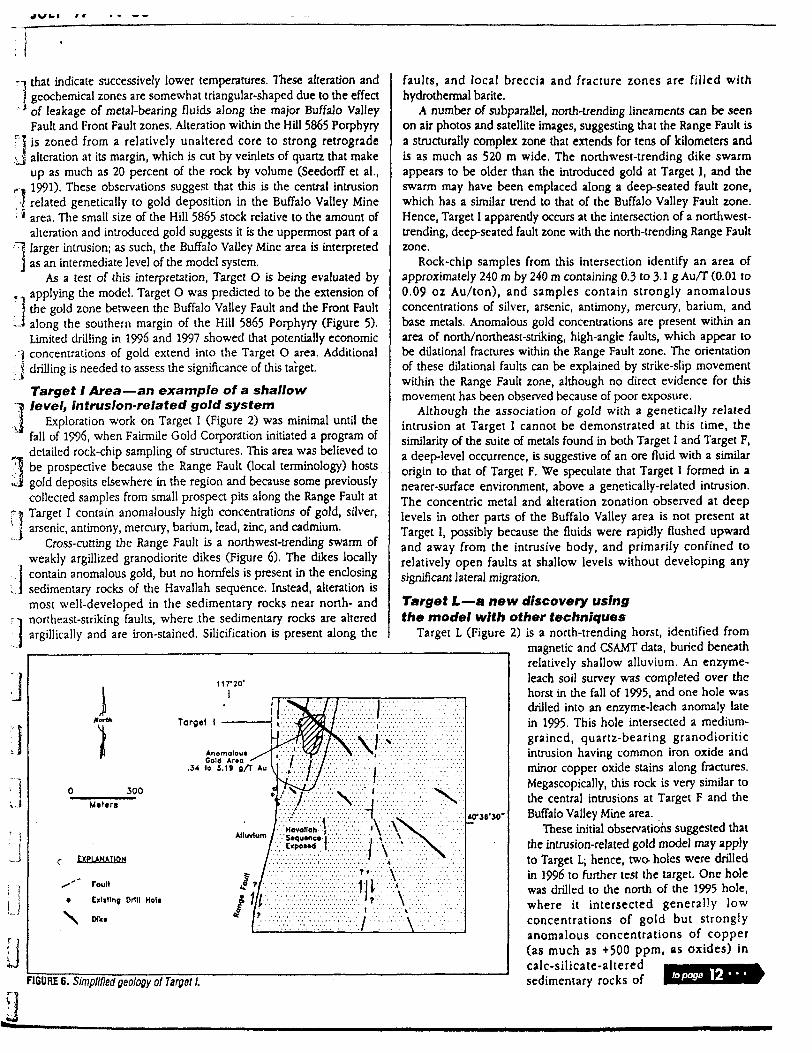
that indicate successively lower temperatures. These alteration and geochemical zones are somewhat triangular-shaped due to the effect of leakage of metal-bearing fluids along the major Buffalo Valley Fault and Front Fault zones. Alteration within the Hill 5865 Porphyry is zoned from a relatively unaltered core to strong retrograde alteration at its margin, which is cut by veinlets of quartz that make up as much as 20 percent of the rock by volume (Seedorff et al., 1991). These observations suggest that this is the central intrusion related genetically to gold deposition in the Buffalo Valley Mine area. The small size of the Hill 5865 stock relative to the amount of alteration and introduced gold suggests it is the uppermost part of a larger intrusion; as such, the Buffalo Valley Mine area is interpreted as an intermediate level of the model system.
As a test of diis interpretation, Target O is being evaluated by applying the model. Target O was predicted to be the extension of the gold zone between the Buffalo Valley Fault and the Front Fault along the southern margin of the Hill 5865 Porphyry (Figure 5). Limited drilling in 1996 and 1997 showed that potentially economic concentrations of gold extend into the Target O area. Additional drilling is needed to assess the significance of this target.Target l Area—an example of a shallow level, intrusion-related gold system
Exploration work on Target I (Figure 2) was minimal until the fall of 1996, when Fairmile Gold Corporation initiated a program of detailed rock-chip sampling of structures. This area was believed to be prospective because the Range Fault (local terminology) hosts gold deposits elsewhere in the region and because some previously collected samples from small prospect pits along the Range Fault at Target I contain anomalously high concentrations of gold, silver, arsenic, antimony, mercury, barium, lead, zinc, and cadmium.
Cross-cutting the Range Fault is a northwest-trending swarm of weakly argillized granodiorite dikes (Figure 6). The dikes locally contain anomalous gold, but no hornfels is present in the enclosing sedimentary rocks of the Havallah sequence. Instead, alteration is most well-developed in the sedimentary rocks near north- and northeast-striking faults, where the sedimentary rocks are altered argillically and are iron-stained. Silicification is present along the
J11 r 20'
300M(tirs
EXPLANATION
^-'" Foult
a billing Drill Hoi.
\ Mk.
Target l
Anomolou*Cold Arto -
.34 to J. 19 g/T A"
Alluvium
FIGURE 6. Simplified geology ol Target l.
faults, and local breccia and fracture zones are filled with hydrothermal barite.
A number of subparallel, north-trending lineaments can be seen on air photos and satellite images, suggesting that the Range Fault is a structurally complex zone that extends for tens of kilometers and is as much as 520 m wide. The northwest-trending dike swarm appears to be older than the introduced gold at Target J, and the swarm may have been emplaced along a deep-seated fault zone, which has a similar trend to that of the Buffalo Valley Fault zone. Hence, Target I apparently occurs at the intersection of a northwest- trending, deep-seated fault zone with the north-trending Range Fault zone.
Rock-chip samples from this intersection identify an area of approximately 240 m by 240 m containing 0.3 to 3.1 g Au/T (0.01 to 0.09 oz Au/ton), and samples contain strongly anomalous concentrations of silver, arsenic, antimony, mercury, barium, and base metals. Anomalous gold concentrations are present within an area of north/northeast-striking, high-angle faults, which appear to be dilational fractures within the Range Fault zone. The orientation of these dilational faults can be explained by strike-slip movement within the Range Fault zone, although no direct evidence for this movement has been observed because of poor exposure.
Although the association of gold with a genetically related intrusion at Target I cannot be demonstrated at this time, the similarity of the suite of metals found in both Target I and Target F, a deep-level occurrence, is suggestive of an ore fluid widi a similar origin to that of Target F. We speculate that Target I formed in a nearer-surface environment, above a genetically-related intrusion. The concentric metal and alteration zonation observed at deep levels in other parts of the Buffalo Valley area is not present at Target I, possibly because the fluids were rapidly flushed upward and away from the intrusive body, and primarily confined to relatively open faults at shallow levels without developing any significant lateral migration.
Target L—a new discovery using the model with other techniques
Target L (Figure 2) is a north-trending horst, identified from magnetic and CSAMT data, buried beneath relatively shallow alluvium. An enzyme- leach soil survey was completed over the horst in the fall of 1995, and one hole was drilled into an enzyme-leach anomaly late in 1995. This hole intersected a medium- grained, quartz-bearing granodioritic intrusion having common iron oxide and minor copper oxide stains along fractures. Megascopically, this rock is very similar to the central intrusions at Target F and the Buffalo Valley Mine area.
These initial observations suggested that the intrusion-related gold model may apply to Target L; hence, two- holes were drilled in 1996 to further test the target. One hole was drilled to the north of the 1995 hole, where it intersected generally low concentrations of gold but strongly anomalous concentrations of copper (as much as +500 ppm, as oxides) in calc-silicate-altered sedimentary rocks of
WSS'JO'
to page 12
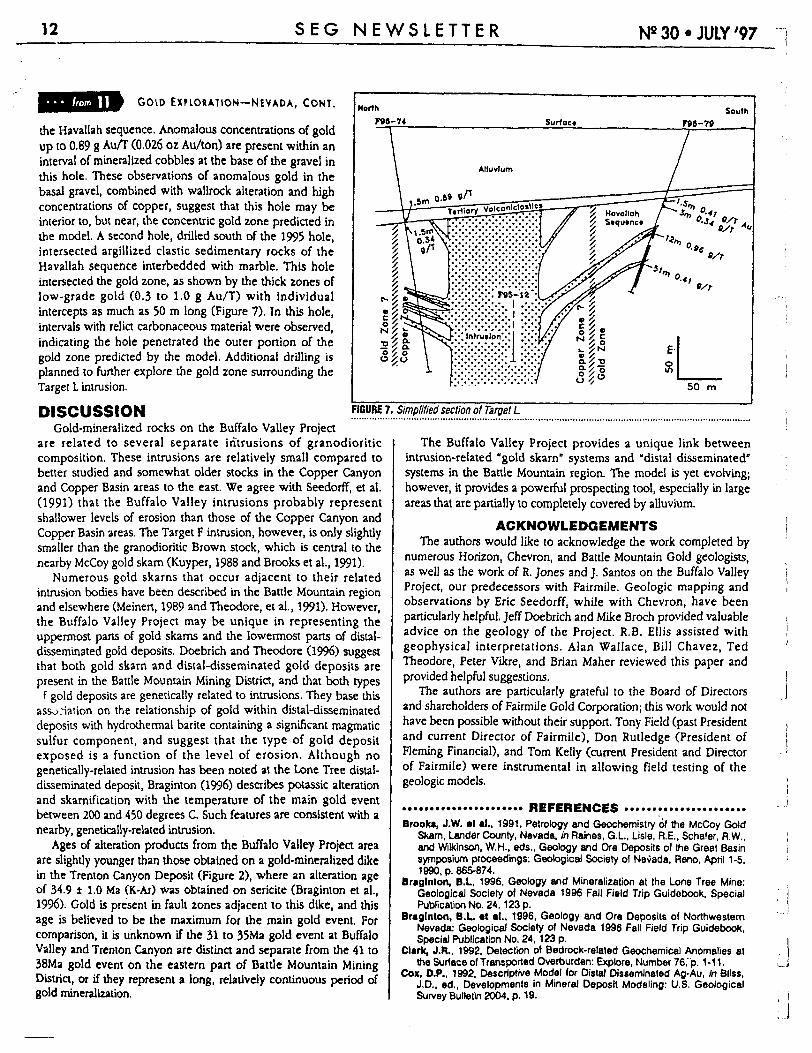
12 SEG NEWSLETTER N2 30 -JULY '97
GOLD EXPLORATION—NEVADA, Com.
the Havallah sequence. Anomalous concentrations of gold up to 0.89 g Au/T (0.026 oz Au/ton) are present within an interval of mineralized cobbles at the base of the gravel in this hole. These observations of anomalous gold in the basal gravel, combined with wallrock alteration and high concentrations of copper, suggest that this hole may be interior to, but near, the concentric gold zone predicted in the model. A second hole, drilled south of the 1995 hole, intersected argillized clastic sedimentary rocks of the Havallah sequence interbedded with marble. This hole intersected the gold zone, as shown by the thick zones of low-grade gold (0.3 to 1.0 g Au/T) with individual intercepts as much as 50 m long (Figure 7). In this hole, intervals with relict carbonaceous material were observed, indicating the hole penetrated the outer portion of the gold zone predicted by the model. Additional drilling is planned to further explore the gold zone surrounding the Target L intrusion.
DISCUSSIONGold-mineralized rocks on the Buffalo Valley Project
are related to several separate intrusions of granodioritic composition. These intrusions are relatively small compared to better studied and somewhat older stocks in the Copper Canyon and Copper Basin areas to the east. We agree with Seedorff, et al. (1991) that the Buffalo Valley intrusions probably represent shallower levels of erosion than those of the Copper Canyon and Copper Basin areas. The Target F intrusion, however, is only slightly smaller than the granodioritic Brown stock, which is central to the nearby McCoy gold skarn (Kuyper, 1988 and Brooks et al., 1991).
Numerous gold skarns that occur adjacent to their related intrusion bodies have been described in the Battle Mountain region and elsewhere (Meinert, 1989 and Theodore, et al., 1991). However, the Buffalo Valley Project may be unique in representing the uppermost parts of gold skams and the lowermost parts of distal- disseminated gold deposits. Doebrich and Theodore (1996) suggest that both gold skarn and distal-disseminated gold deposits are present in the Battle Mountain Mining District, and that both types
f gold deposits are genetically related to intrusions. They base this association on the relationship of gold within distal-disseminated deposits with hydrothermal barite containing a significant magmatic sulfur component, and suggest that the type of gold deposit exposed is a function of the level of erosion. Although no genetically-related intrusion has been noted at the Lone Tree distal- disseminated deposit, Braginton (1996) describes potassic alteration and skarnification with the temperature of the main gold event between 200 and 450 degrees C. Such features are consistent with a nearby, genetically-related intrusion.
Ages of alteration products from the Buffalo Valley Project area are slightly younger than those obtained on a gold-mineralized dike in the Trenton Canyon Deposit (Figure 2), where an alteration age of 34.9 ± 1.0 Ma (K-Ar) was obtained on sericite (Braginton et al., 1996). Gold is present in fault zones adjacent to this dike, and this age is believed to be the maximum for the main gold event. For comparison, it is unknown if the 31 to 35Ma gold event at Buffalo Valley and Trenton Canyon are distinct and separate from the 41 to 38Ma gold event on the eastern part of Battle Mountain Mining District, or if they represent a long, relatively continuous period of gold mineralization.
FIGURE 1. Simplified section of Target L
The Buffalo Valley Project provides a unique link between intrusion-related "gold skarn" systems and "distal disseminated" systems in the Battle Mountain region. The model is yet evolving; however, it provides a powerful prospecting tool, especially in large areas that are partially to completely covered by alluvium.
ACKNOWLEDGEMENTSThe authors would like to acknowledge the work completed by
numerous Horizon, Chevron, and Battle Mountain Gold geologists, as well as the work of R. Jones and J. Santos on the Buffalo Valley Project, our predecessors with Fairmile. Geologic mapping and observations by Eric Seedorff, while with Chevron, have been particularly helpful. Jeff Doebrich and Mike Broch provided valuable advice on the geology of the Project. R.B. Ellis assisted with geophysical interpretations. Alan Wallace, Bill Chavez, Ted Theodore, Peter Vikre, and Brian Maher reviewed this paper and provided helpful suggestions.
The authors are particularly grateful to the Board of Directors and shareholders of Fairmile Gold Corporation; this work would not have been possible without their support. Tony Field (past President and current Director of Fairmile), Don Rutledge (President of Fleming Financial), and Tom Kelly (current President and Director of Fairmile) were instrumental in allowing field testing of the geologic models.
REFERENCESBrooks, J. W. at al., 1991, Petrology and Geochemistry of the McCoy Gold
Skarn, Lender County, Nevada, in Raines, G.L., Lisle, R.E., Schafer, R.W.,and Wilkinson, W. H., eds., Geology and Ore Deposits of the Great Basinsymposium proceedings: Geological Society of Nevada, Reno, April 1-5,1990, p. 865-874.
Braginton, B.L. 1996, Geology and Mineralization at the Lone Tree Mine:Geological Society of Nevada 1996 Fall Field Trip Guidebook, SpecialPublication No. 24,123 p.
Braginton, B.L *t al., 1996, Geology and Ore Deposits of NorthwesternNevada: Geological Society of Nevada 1996 Fall Field Trip Guidebook,Special Publication No. 24, 123 p.
Clark, J.R., 1992, Detection of Bedrock-related Geochemical Anomalies atthe Surface of Transported Overburden: Explore, Numbef 76,'p. 1-11.
Cox, O.P.. 1992, Descriptive Model for Distal Disseminated Ag-Au, in Bliss,J.D., ed., Developments in Mineral Deposit Modeling: U.S. GeologicalSurvey Bulletin 2004. p. 19.
: Preliminary review copy.
Concepts and Models for Interpretation of Enzyme Leach Data for Mineral and Petroleum Exploration
' by
J. Robert ClarkEnzyme-ACTLABS, LLC
11485 W. 1-70 Service RoadWheat Ridge, Colorado 80033 USA
AbstractThe Enzyme Leach is a highly selective analytical extraction used primarily for
detecting extremely subtle geochemical anomalies in 5-horizon soils. Pattern recognition is the key to proper interpretation of Enzyme Leach data, since anomaly patterns are quite dif ferent from conventional geochemical data.
Many ore bodies are buried beneath thick sequences of overburden, lake beds, or younger volcanic rocks. In other situations ore bodies or petroleum reservoirs lie deep within rocks that contain no evidence of the resource below. Given geologic time, extremely small amounts of trace elements related to the underlying body can migrate by various mechanisms
; to the surface, where they would tend to be trapped by various oxide precipitates coating mineral grains in the soil. One of the most effective of these traps is amorphous MnO2 , which is a very small portion of the total manganese oxides in the soil. Amorphous precipi tates of MnO2 should be a very effective trap for a wide variety of cations, anions, and polar molecules that may be migrating to the surface. Because of the efficiency of this trapping
; material, the locations of Enzyme Leach anomalies are generally independent of the quantity ' of leachable Mn in the soils. The Enzyme Leach makes use of an enzyme-catalyzed reaction i to selectively dissolve the most reactive form of MnO2 in soils, the amorphous form of the
compound. Consequently, a very small portion of the Mn02 in the samples is dissolved, and the presence of traces levels of H2O2 in the leach solution helps lower the solubility of Fe over
, what it normally would be. Because of this selectivity, the background leachable concentra- J tions of many trace elements that are determined are in the low part-per-billion (ppb) range.
Thus, the anomalies often have very dramatic contrast above background. Currently Enzyme ? Leach anomalies can be classified two ways. Morphologically, there are three commonly j recognized anomaly forms: 1. halo anomalies; 2. apical anomalies; 3. combination
anomalies. Genetically, there are also three classes: A. oxidation anomalies (sometimes i referred to as oxidation halos, where they form a morphological halo); B. diffusion anoma- I lies, which result from the gradual thermodynamic dispersal of a highly concentrated source;
C. mechanical/hydromorphic dispersion anomalies.T| Oxidation anomalies appear to be caused by very subtle electrochemical cells that J develop at the top of reduced bodies in the subsurface. These anomalies are characterized by
very high contrast values for a suite of elements, the "oxidation suite," which includes CI, Br, , I, As, Sb, Mo, W, Re, Se, Te, V, U, and Th. Often, rare-earth elements will accompany the
Ji oxidation suite. Base metals can be anomalous in the same soil samples, but usually withlower contrast. Anomalous contrasts are often quite dramatic, in some cases exceeding 50-
! times background. Oxidation anomalies often take the form of an asymmetrical halo orpartial halo around the buried reduced body, and that body underlies much of the central low within that halo. They have been found associated with reduced bodies located as much as 2File name: E:\Clark.Documenu\ENZYME-PrelimRel.DS5; Page: l
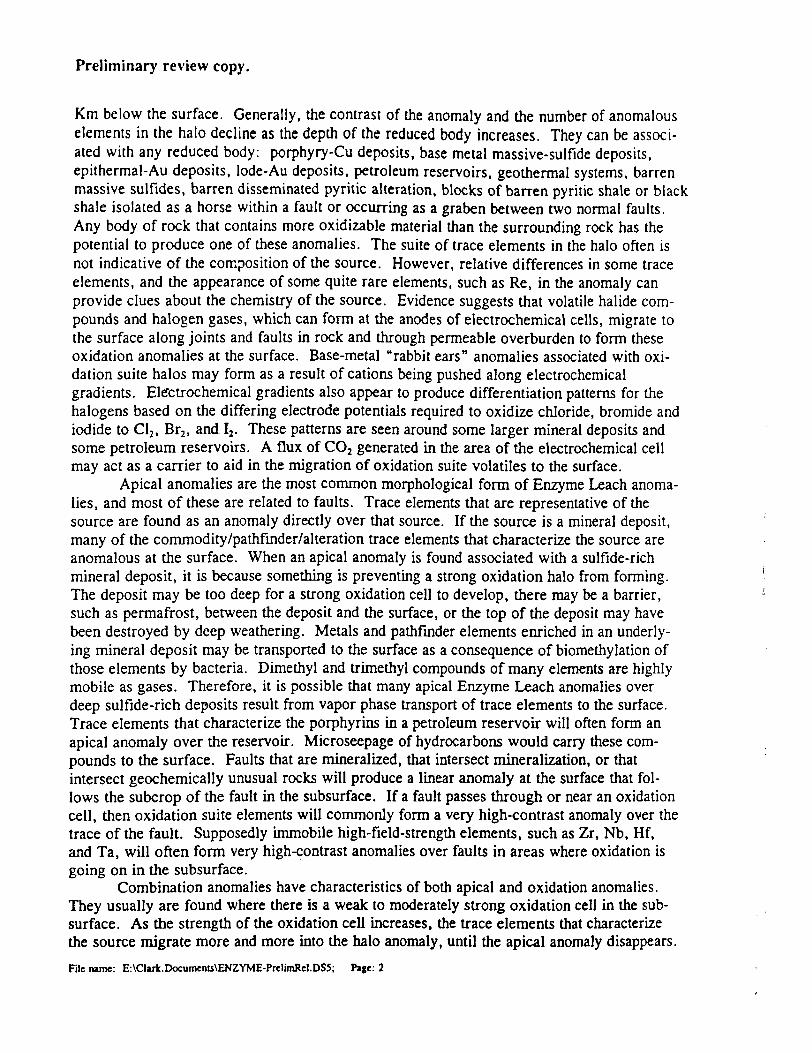
Preliminary review copy.
Km below the surface. Generally, the contrast of the anomaly and the number of anomalous elements in the halo decline as the depth of the reduced body increases. They can be associ ated with any reduced body: porphyry-Cu deposits, base metal massive-sulfide deposits, epithermal-Au deposits, lode-Au deposits, petroleum reservoirs, geothermal systems, barren massive sulfides, barren disseminated pyritic alteration, blocks of barren pyritic shale or black shale isolated as a horse within a fault or occurring as a graben between two normal faults. Any body of rock that contains more oxidizable material than the surrounding rock has the potential to produce one of these anomalies. The suite of trace elements in the halo often is not indicative of the composition of the source. However, relative differences in some trace elements, and the appearance of some quite rare elements, such as Re, in the anomaly can provide clues about the chemistry of the source. Evidence suggests that volatile halide com pounds and halogen gases, which can form at the anodes of electrochemical cells, migrate to the surface along joints and faults in rock and through permeable overburden to form these oxidation anomalies at the surface. Base-metal "rabbit ears" anomalies associated with oxi dation suite halos may form as a result of cations being pushed along electrochemical gradients. Electrochemical gradients also appear to produce differentiation patterns for the halogens based on the differing electrode potentials required to oxidize chloride, bromide and iodide to C12 , Br2 , and I2 . These patterns are seen around some larger mineral deposits and some petroleum reservoirs. A flux of CO2 generated in the area of the electrochemical cell may act as a carrier to aid in the migration of oxidation suite volatiles to the surface.
Apical anomalies are the most common morphological form of Enzyme Leach anoma lies, and most of these are related to faults. Trace elements that are representative of the source are found as an anomaly directly over that source. If the source is a mineral deposit, many of the commodity/pathfinder/alteration trace elements that characterize the source are anomalous at the surface. When an apical anomaly is found associated with a sulfide-rich mineral deposit, it is because something is preventing a strong oxidation halo from forming. The deposit may be too deep for a strong oxidation cell to develop, there may be a barrier, such as permafrost, between the deposit and the surface, or the top of the deposit may have been destroyed by deep weathering. Metals and pathfinder elements enriched in an underly ing mineral deposit may be transported to the surface as a consequence of biomethylation of those elements by bacteria. Dimethyl and trimethyl compounds of many elements are highly mobile as gases. Therefore, it is possible that many apical Enzyme Leach anomalies over deep sulfide-rich deposits result from vapor phase transport of trace elements to the surface. Trace elements that characterize the porphyrins in a petroleum reservoir will often form an apical anomaly over the reservoir. Microseepage of hydrocarbons would carry these com pounds to the surface. Faults that are mineralized, that intersect mineralization, or that intersect geochemically unusual rocks will produce a linear anomaly at the surface that fol lows the subcrop of the fault in the subsurface. If a fault passes through or near an oxidation cell, then oxidation suite elements will commonly form a very high-contrast anomaly over the trace of the fault. Supposedly immobile high-field-strength elements, such as Zr, Nb, Hf, and Ta, will often form very high-contrast anomalies over faults in areas where oxidation is going on in the subsurface.
Combination anomalies have characteristics of both apical and oxidation anomalies. They usually are found where there is a weak to moderately strong oxidation cell in the sub surface. As the strength of the oxidation cell increases, the trace elements that characterize the source migrate more and more into the halo anomaly, until the apical anomaly disappears.File name: E:\Clark.Documents\ENZYME-PreltmRel.DS5; Pige: 2
Preliminary review copy.
A variety of geological situations can complicate Enzyme Leach anomalies, making interpretation more uncertain. Oxidation halos are often irregular in shape, spotty, or highly asymmetrical. Therefore, it would be very easy to misinterpret a pattern, simply because a single traverse passed through the wrong part of an anomalous area. Closely spaced mineral ized bodies can produce interference patterns between adjacent oxidation halos. Graphitic host rocks tend to have a strong quenching effect on an oxidation cell, diminishing the con trast of the anomaly and making the source appear to be much deeper than it actually is. Anomaly patterns can shift substantially with time, due to intense weathering of the top of a deposit, changes in the water table, and other factors. Active and relic anomalies in the same areas will complicate the interpretations. Geochemical barriers in the subsurface, such as strongly oxidized sedimentary units, can attenuate or completely block the formation of an Enzyme Leach anomaly.
l. IntroductionThe Enzyme Leach is a new highly selective extraction developed for detecting
extremely subtle geochemical signatures in surficial geological materials. Many exploration geologists hope for a new exploration technology that can be used as a "black box;" i.e. they are looking for something that will save them from the uncertainties of doing geology. The Enzyme Leach is not a "black box." Rather, it is like conventional geochemistry or geo physics in that it is another tool to help exploration geologists develop geological models about the area that is being explored. It is best employed as an aid in detecting structures and mineralized bodies deep within the subsurface. Regardless of the tools that are used to make geological interpretations, they still must be tested, usually by drilling, to determine how well the model fits the reality of the rocks beneath the surface.
Pattern recognition is the key to interpretation of Enzyme Leach data, and in most situations the patterns are completely different from those produced by conventional geochemical methods. Conventional geochemical concepts for the most part are not useful. In order to understand the patterns, it is necessary to understand how they are detected, what chemical constituents of the soil are being analyzed, and have a model regarding how the anomalies are migrating to the surface, even if that process is only partially understood. Knowledge of the geological problem and the history of the development of the exploration models is important for being able to interpret Enzyme Leach data.
l. l Nature of geological problemLayers of glacial till and glaciolacustrine sediments cover large areas at high latitudes
in the Northern Hemisphere, and in many areas of the world much of the bedrock has been buried by basin fill and volcanic rocks. The problem, when trying to perform geochemical exploration in terranes that are covered by transported overburden, is that the overburden is usually exotic to the bedrock that it covers. In tropical regions, laterite has formed due to intense weathering, which in many areas has stripped the surficial material of the original chemical signature of the parent rock. In some regions blind mineral deposits occur deep beneath the surface where the overlying rocks contain no sign of the underlying ore bodies (Yeager et al., this issue). Conventional chemical analyses would reveal only the composition of the overburden or obscuring rock and would not give any indication of the underlying bedrock. Total methods of analysis and stronger-leaching techniques produce results that are dominated by the overburden or cover rock signature, and random variations in this signatureFile name: E:\Clark.Documents\ENZYME-PrelimRel.DS5; Page: 3
Preliminary review copy.
often dramatically outweigh any anomalous chemistry emanating from underlying mineralized rocks. In the past, drilling has been the only means of collecting useful geochemical samples in areas of extensive overburden or rock cover. An inexpensive means is needed for detect ing subtle geochemical dispersion through transported or deeply weathered overburden and providing some indication of the chemistry of the bedrock.
Trace elements released by gradual weathering of mineral deposits in the bedrock can migrate up through overburden or cover rock by such means as groundwater flow, capillary action, or diffusion of volatile compounds. However, the amount of these bedrock-related trace elements is typically a very small component of the total concentration of these elements in the overburden or residual soil. The goal is to determine the amount of a trace element that has been added to the overburden rather than the total amount in the overburden sample. Upon reaching the near surface environment, many of the trace elements migrating through overburden or cover rock will be trapped in manganese oxide and iron oxide coatings, which form on mineral grains in the soils. One of the most effective traps for trace elements migrating toward the surface is amorphous manganese dioxide, which is usually a very small component of the total manganese oxide phases in the soil sample. Not only does amorphous manganese dioxide have a relatively large surface area, but the irregular surface and the ran dom distribution of both positive and negative charges on that surface make it an ideal adsorber for a variety of cations, anions, and polar molecules. Thus, an analytical technique that would tend to preferentially dissolve coating materials rich in amorphous MnO2 could provide very useful information in exploration for blind mineral deposits.
l .2 Selective analysisIn most cases the chemistry that is done before instrumental determinations are made
is critical to the quality of the geochemical interpretations made from the resulting data. Most laboratory procedures for wet-chemical analyses of geological materials employ either a total digestion, strong leach, or fusion of the sample to put the elements of interest into solution in preparation for instrumental determinations. Even though partial digestions and leaches of the sample materials are less destructive than a total digestion or fusion, these methods frequently use relatively strong concentrations of reagents, resulting in a significant dissolution of many of the constituent minerals in the rock, soil, or sediment (Church et al., 1987). When the geochemist is trying to detect very low level trace element anomalies, it is more important to analyze for trace elements "on" the soil particles, not "in" the constituent mineral grains. Trace elements bound "on" the solid matter of the soil are much more likely to have been transported from an obscured source. Partial leaches employing a wide variety of leaching agents have been found useful for selectively analyzing geological materials for weak signa tures of transported trace elements. The history of selective geochemical analysis has been reviewed by Chao (1984) and by Hall (this issue).
A selective leach has been developed that employs an enzyme reaction to selectively dissolve amorphous manganese oxides in soils and sediments. The enzyme catalyzes a reac tion between sugar oxygen and water, generating trace amounts of hydrogen peroxide, thus:
Dextrose -t- O2 4- H2O -* v**~a*u.*) -* Gluconic Acid + H2O2 .
While concentrated hydrogen peroxide has been widely used as an oxidant in selective leach ing processes, it can also function as a reducing agent for several metallic oxides. In anFile name: E:\Clark.Documems\ENZYME-PrelimRel.DS5: Page: 4
l
4 *
Preliminary review copy.
aqueous solution, it will react with manganese dioxide, consuming hydrogen ions, resulting in the manganese being reduced to the divalent state, which is soluble, thus:
Mn02w * HA 4- 2H+ -* Mn2 * * 02(a,, * 2H2O
(Robinson, 1929; Rose and Suhr, 1971; Filipek et al., 1981; Filipek and Theobald, 1981). In the process, trace elements trapped in the manganese dioxide coatings are released. Because amorphous manganic dioxide is far more reactive than is the crystalline form of the com pound, the trace of H2O2 produced by the enzyme-induced reaction tends to selectively dissolve the amorphous MnO2 present in soils (Clark, 1995). When all the amorphous man ganese dioxide in the sample has been reacted, and hydrogen peroxide is no longer being consumed at a rapid rate, the H2O2 concentration builds up to a low-part-per-million thresh- old, the enzyme reaction slows, and the leaching action also slows. Because the enzyme leach tends to be self limiting, there is minimal leaching of silicate and iron oxide mineral sub strates in the sample. Thus, background concentrations for many elements determined are extremely low and the anomaly/background contrast is dramatically enhanced. Leachable concentrations for many trace elements in soils are the mid-to-low part per billion range.
1.3 Current level of knowledgeModels for Enzyme Leach anomaly pattern interpretations discussed here in are based
on the current level of knowledge after four years of commercial application of the technique. These models are subject to revision as new studies become available for public dissemina tion. Three morphological types of geochemical anomalies are recognized with the Enzyme Leach: 1. "halo" anomalies; 2. "apical" anomalies (which includes most "fault-related" anomalies); 3. "combination" anomalies (showing attributes of both halos and apical anomalies). Of these, apical anomalies are by far the most common. A genetic classification is also being developed that includes: l, oxidation anomalies; 2. simple diffusion anoma lies; 3. "mechanical/hydromorphic dispersion" anomalies. Vegetation has been observed to play a role in recycling and enhancing Enzyme Leach soil anomalies for some trace elements in temperate climates (Clark, 1993) and in humid tropical climates. In areas where there is a very deep weathering profile, distinct shifts in anomaly patterns have been observed. In a high altitude arid environment, low leachable Mn content of the soils has been observed to produce diminished Enzyme Leach anomaly contrasts. In most cases agricultural activity has little effect on Enzyme Leach anomalies. One notable exception is described in Yeager (this issue). Using the Enzyme Leach in areas of thick glacial overburden has been covered in detail by Jackson (1995), Rogers and Lombard (this issue), and Bajc et al. (this issue).
2. MethodsThe preferred sample material is fi-horizon soils, where they are available. Generally,
the greatest concentration of active amorphous manganese dioxide is in the upper ten to thirty centimeters of the B horizon. Usually, 100 to 200 grams of sample material is adequate. In coarser grained soils, more sample material maybe needed. Where soils are poorly devel oped, C-horizon soil or weathered scree, the lower (mineral-rich) /4-horizon soil, and fine-granular layers above caliche also can be usable sample media, with lower anomaly con trast than would be found with the B-horizon. Samples, collected from the "bleached" /40-horizon usually are not suitable. Dense layers of caliche, calcrete, and gypcrete cannot beFile name: E:\Clark.Documents\ENZYME-PrelimRel.DS5; Page: S
Preliminary review copy.
used as sample media and are to be avoided. A detailed description of sampling protocols is in the Appendix. Samples should be air dried if at all possible. If they are artificially dried, the temperature should not exceed 40" C. Samples should not be exposed to excessive heat (such as in an enclosed truck camper shell, a closed trailer, or a shed exposed to intense sun light in hot weather). When overheating occurs, halogens and trace elements that associate with halogens in oxidation anomalies are lost, while leachable concentrations of certain other trace elements may increase (data presented in Appendix). Sample preparation commonly consists of sieving the samples for the minus-60-mesh fraction ("C0.25 mm). In some cases, the minus-80-mesh fraction, the minus-240-mesh (silt and clay fractions), or the minus-60- mesh/plus-240-mesh fraction (fine-sand and very-fine-sand fractions) are used, depending upon what has been found to work best for the soils in the area where the grid of samples was collected.
A detailed description of the Enzyme Leach process can be found in Clark (1995). In summary, l.00 g is leached for one hour with 15 mL of \7o (w/v) dextrose and 0.1 mL of glucose oxidase solution. All stock solutions are prepared in 18 M-ohm water. After leach ing, 10 mL of the, solution is removed and saved for analysis. Leach solutions are immediately stabilized with 0.1 mL ultrapure nitric acid. An isotopically pure spike of an internal standard solution is added. Determinations are made by inductively coupled plasma-mass spectrometry (ICP-MS) for a package of 60 elements: Li, Be, CI, Se, Ti, V, Mn, Co, Ni, Cu, Zn, Ga, Ge, As, Se, Br, Rb, Sr, Y, Zr, Nb, Mo, Ru, Pd Ag, Cd, In, Sn, Sb, Te, I, Cs, Ba, La, Ce, Pr, Nd, Sm, Eu, Gd, Tb, Dy, Ho, Er, Tm, Yb, Lu, Hf, Ta, W, Re, Os, Pt, Au, Hg, Tl, Pb, Bi, Th, and U. Of these, Li, Be, CI, Se, Ti, and Hg are deter mined semiquantitatively, due to limitations of the instrumental technology. Inductively coupled plasma-optical emission spectrometry (ICP-OES) can be used to determine B or Fe.
Enzyme Leach data can be presented in a variety of ways. By the far, the most effec tive is to sample on a regular grid, where the sample spacing will be suitable for the scale of deposit that you are looking for. The data for each element that shows interesting contrast above background are then contoured. If sampling is done along isolated traverses, then the best method of data presentation is to use a spreadsheet program to graph the data, producing a geochemical profile for each element that shows contrast. Most of the data that are pre sented in this paper are shown as geochemical profiles, because many of the projects shown here were pilot studies, where the traverses to be sampled were often selected by the host companies.
3. Observations and Discussions3.1 Leach selectivity
Only a small portion of the total manganese oxides in a typical soil is dissolved by the Enzyme Leach. A typical 5-horizon soil sample from northern Minnesota contains ^00 /ig/g (parts per million or ppm) total Mn, and most of the Mn in these soils would be present as manganese oxides. In a study of 1670 soils from northern Minnesota with the three leaches, the Enzyme Leach removed about five-times more Mn than a simple water wash (1.5 ppm vs. 0.3 ppm), while a stronger version of the Enzyme Leach dissolves about 10-fold more (17 ppm) than the Enzyme Leach leach (Clark, 1993, p. B22). The strongest of these three leaches typically dissolves less than 3% of the manganese oxides in these soils. Thus, it is logical that the Enzyme Leach is dissolving the most reactive forms of Mn02 . Interest ingly, the anomalous threshold for Co in this sample set was 42 ppb for the Enzyme Leach,FUe name: E:\Clark.Documents\ENZYME-PrelimRel.DS5; Page: 6
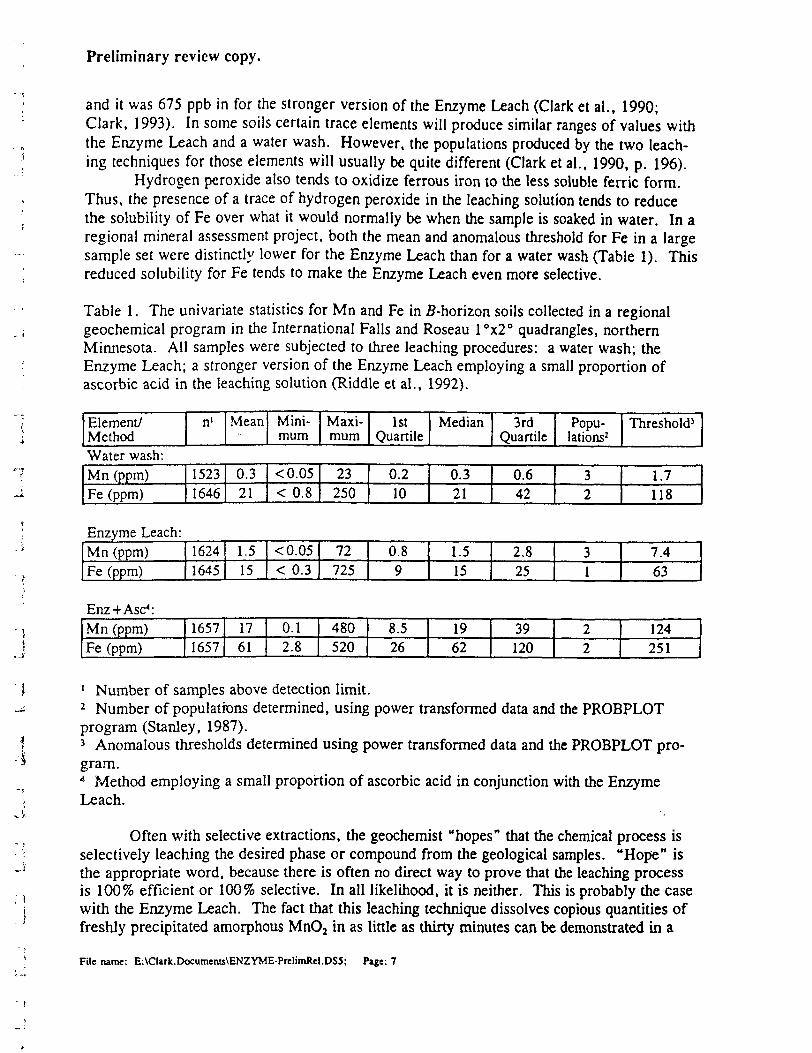
Preliminary review copy.
and it was 675 ppb in for the stronger version of the Enzyme Leach (Clark et al., 1990; Clark, 1993). In some soils certain trace elements will produce similar ranges of values with the Enzyme Leach and a water wash. However, the populations produced by the two leach ing techniques for those elements will usually be quite different (Clark et al., 1990, p. 196).
Hydrogen peroxide also tends to oxidize ferrous iron to the less soluble ferrie form. Thus, the presence of a trace of hydrogen peroxide in the leaching solution tends to reduce the solubility of Fe over what it would normally be when the sample is soaked in water. In a regional mineral assessment project, both the mean and anomalous threshold for Fe in a large sample set were distinctly lower for the Enzyme Leach than for a water wash (Table 1). This reduced solubility for Fe tends to make the Enzyme Leach even more selective.
Table 1. The univariate statistics for Mn and Fe in 5-horizon soils collected in a regional geochemical program in the International Falls and Roseau I 0 x2 0 quadrangles, northern Minnesota. All samples were subjected to three leaching procedures: a water'wash; the Enzyme Leach; a stronger version of the Enzyme Leach employing a small proportion of ascorbic acid in the leaching solution (Riddle et al., 1992).
Element/ Method
n1 Mean Mini mum
Maxi mum
1st Quartile
Median 3rd Quartile
Popu lations2
Threshold3
Water wash:Mn (ppm)Fe (ppm)
15231646
0.321
<0.05< 0.8
23250
0.210
0.321
0.642
32
1.7118
Enzyme Leach:Mn (ppm)Fe (ppm)
16241645
1.515
*C0.05< 0.3
72725
0.89
1.515
2.825
31
7.463
Enz+Asc4 :Mn (ppm)Fe (ppm)
16571657
1761
0.12.8
480520
8.526
1962
39120
22
124251
1 Number of samples above detection limit.2 Number of populations determined, using power transformed data and the PROBPLOT program (Stanley, 1987).3 Anomalous thresholds determined using power transformed data and the PROBPLOT pro gram.4 Method employing a small proportion of ascorbic acid in conjunction with the Enzyme Leach.
Often with selective extractions, the geochemist "hopes" that the chemical process is selectively leaching the desired phase or compound from the geological samples. "Hope" is the appropriate word, because there is often no direct way to prove that the leaching process is \QQ7o efficient or 100% selective. In all likelihood, it is neither. This is probably the case with the Enzyme Leach. The fact that this leaching technique dissolves copious quantities of freshly precipitated amorphous MnO2 in as little as thirty minutes can be demonstrated in a
File name: E:\Clark.Documents\ENZYME-PrelimRel.DS5; Page: 7
Preliminary review copy.
simple experiment (Clark, 1995). The very slow dissolution of crystalline Mn02 phases can also be easily demonstrated in the same manner. In nature there is no pure amorphous Mn0 2 coating on a mineral grain, or for that matter of any other compound or phase in coatings. Mineral grain coatings produced by weathering are mixtures of various amorphous com pounds (such as oxides and hydroxides of Mn, Fe, and Al) and mineral precipitates (such as calcite, gypsum, goethite, limonite, manganite, psilomelane, pyrolusite, gibbsite, boehmite, diaspore, and silica). It would be expected that the amorphous compounds occur in relatively small quantities compared to the crystalline phases present, and that amorphous materials are really a complex mixture of components, including a large proportion of water. In fact, when the Enzyme Leach is selectively dissolving amorphous MnO: , it is probably to a degree physically dismantling a complex material that includes hydroxy precipitates of Fe and Al.
During leaching trace elements from a variety of components of the soil are probably brought into solution by the Enzyme Leach: 1. trace elements trapped in amorphous MnO2 ; 2. trace elements associated with other amorphous compounds that are stripped as the mate rial is physically dismembered; 3. trace elements occurring in water soluble salts; 4. trace elements brought into solution by hydrolysis of silicates; -5. trace elements stripped from ion exchange sites on clay minerals. In some cases, you can get an idea of what trace elements are coming from which sources. For instance, in anomalous soils associated with a very strong oxidation cell, roughly one-half of the CI would be water soluble. In the case of the Enzyme Leach, it is "hoped" that the background values for many elements are derived from the hydrolysis of silicate minerals in the soil, and that the anomalies for those trace elements come from amorphous Mn02 . It is also "hoped" that the volume of those amorphous mate rials in the coatings is sufficient to trap all the trace elements emanating from mineralized sources in the subsurface. If this is so, then the locations of anomalies would generally be independent of the quantity of leachable Mn in the soils. Except for a few rare cases, this appears to be the case. One exception is described in Yeager et al. (this issue).
3.2 Oxidation anomaliesOxidation anomalies appear to be caused by very weak electrochemical cells that
develop at the top of reduced bodies in the subsurface. Any reduced body (an ore deposit, a barren body of disseminated pyrite, a buried geothermal system, a petroleum reservoir, etc.) can produce one of these anomalies. Once these anomalies are found it is up to the geologist to make a geological interpretation based on all the information at hand (geology, geophysics, geochemistry, etc.) as to what the source of the anomaly might be. These anomalies are characterized by very high contrast values for a suite of elements, the "oxidation suite," which includes CI, Br, I, As, Sb, Mo, W, Re, Se, Te, V, U, and Th. Often, rare-earth ele ments will accompany the oxidation suite. Base metals can be anomalous in the same soil samples, but usually with lower contrast.
Oxidation anomalies often take the form of an asymmetrical halo or partial halo around the buried reduced body, and that body underlies much of the central low within that halo. The Clay Pit deposit in the Getchell trend of Nevada is a typical example (Fig. 1). Clay Pit, an epithermal-gold deposit hosted by Paleozoic carbonates and shales, was uplifted, exposed by erosion, and then covered by a volcanic flow. Immediately after this flow was laid down, there was a geothermal event, and the volcanic rocks were altered to nearly pure clay. Currently the deposit lies under an approximately 70-meter-thick layer of clay and another 80 meters of basin-fill alluvium. Prior to running the Enzyme Leach survey at thatFile tume: E:\Clark.Documenu\ENZYME-PrelimRel.DS5; Pige: 8
Preliminary review copy.
location, Clay Pit had been a test site for ihe U.S. Geological Survey. Neither CHIM, nor any of the other analytical procedures applied to soils at that site detected the ore body in the subsurface. At the time that this study was begun, it was presumed that the thick clay layer was an impermeable barrier blocking migration of trace elements to the surface. Profiles for Enzyme Leach As and Sb (Fig. 1) show high-contrast "rabbit-ears" patterns at the surface, over the Clay Pit ore body. Other oxidation suite elements are anomalous at Clay Pit (CI, Br, I, V, Mo, W, and rare earth elements), but they do not bracket the top of the deposit as tightly as do As and Sb, and some of them form distinctly asymmetrical anomalies with broad central lows. A base metal, Co, also shows a narrow central low that lies directly over the top of the deposit. A biogeochemical study done by James Erdman concurrently with this study did reveal a broader, much lower-contrast, less structured anomaly than the Enzyme Leach anomaly shown here.
Frequently, one or more elements will very tightly bracket a central low that is close to the same dimensions as the top of the end of the deposit, and that central low will be directly over the reduced body in the subsurface. It does not matter which direction the ore body is dipping or which direction groundwater is flowing, even in areas of relatively strong groundwater flow, the central low is always found over the upper end of the reduced body that is responsible for generating the oxidation halo.
If part of the or.e body is oxidized and part is reduced, the central low of the oxidation cell does not cover the entire ore body. Instead, the location and size of the central low is controlled by the location of the reduced part of the ore body. The Rodeo epithermal-Au deposit, located in the northern end of the Carlin trend in Nevada, is a partly oxidized body. A set of soil samples collected across the Rodeo while it was being drilled revealed an Enzyme Leach oxidation halo anomaly that bracketed the reduced ore at depth, not the entire ore body (Fig. 2). In this case, much of the ore lies under or outside the "rabbit ears" por tion of the anomaly pattern.
The trace element suite in oxidation anomalies, although often enriched in many types of metal deposits, frequently is not representative of the composition of the buried reduced body. For example, a very similar suite of elements forms halos around petroleum reser- voirs, porphyry copper deposits, epithermal gold deposits, buried geothermal systems, and barren pyritic bodies. Sometimes the base metal association or the presence of rare members of the oxidation suite (Re, Se, and Te) in the halo are indicative of the composition of the source. Oxidation anomalies can form above reduced bodies that are covered by either over- burden or barren rock. The depth of detection for oxidation anomalies is often too great for the mineralized body to be of economic interest. An oxidation halo anomaly has been drilled where the reduced body was 950 to 1050 meters beneath the surface. In arid climates, anomaly-to-background ratios for the oxidation suite commonly range between 5:1 to 50:1, and sometimes anomaly contrast exceeds 100-times background. Oxidation anomalies tend to have more subdued contrasts in humid climates.
Oxidation anomalies characteristically have high site variance. At one site, Mo might have an anomalous contrast of 80-times background, while a duplicate sample collected 5 meters away may have a Mo anomalous contrast of only 7-times background. Both sites are highly anomalous, but there is a huge difference between the two. This is very common in oxidation halos, to the point that it is positive evidence of the presence of the oxidation anomaly. It is also evidence that can be used to argue of vapor-phase transport of the ele ments in the oxidation suite.File name: E:\Clarlc.Documents\ENZYME-PreIimRel.DSS; Page: 9
Preliminary review copy.
In some cases central lows, located over a deposit, can have site variance so low that it is within the instrumental variance. In an early pilot study done over the Mike epithermal-Au deposit, north of Gold Quarry, in the Carlin Trend, Nevada, a central low was found where 17 consecutive samples had an Enzyme Leach-Sb mean value of 10.2 ppb with a variance of 2.5 ppb. In that concentration range, that was the determination variance of the analytical instrument that was used. In some cases, site variance within a central low for a few ele ments, such as Sb, As, or V, is so incredibly low that it falls within the range of instrumental variance. In background areas, outside the area affected by the oxidation anomaly, the site variance will typically be much higher for the same elements. Whenever this is observed, some geochemical process has to be altering the soils within the central low in such a way that it results in a very peculiar lack of variance in certain teachable trace elements.
3.2.1 Discovery and evidence of possible origin of oxidation anomaliesOxidation anomalies were discovered in 1989 during a test of the Enzyme Leach using
soils collected at the Sleeper bonanza-gold deposit, north of Winnemucca, Nevada. A set of 5-horizon soils was collected along two traverses across the mineralized structure, but outside the boundaries of the open pit (Fig. 3). Overburden along both traverses was roughly 15 meters thick at the east end and 37 meters thick at the west end of the traverses. Overburden consisted of typical clastic basin-fill sediments. Sample spacing along the lines was roughly 30 meters, and all soils were collected at a depth of 0.25 to 0.4 meters. Five "background" soils were also collected on overburden, but upslope from known mineralization (Fig. 3). Along the traverse south of the pit a single-sample apical anomaly was found directly over the mineralized structure. North of the Sleeper pit a broader anomaly was found along traverse 2. The data set that is presented here is the discovery data for oxidation anomalies. The original line for traverse 2 was not long enough to close off the anomaly west of the mineral ized structure. Also, it was not expected that the halogens would be anomalous, so only raw counts were measured on the ICP-MS instrument for CI, Br, and I. All other elements mea sured were standardized. Follow-up sampling at Sleeper along longer traverses ratified the patterns of this original set of data.
Anomalies for a number of elements were found on the north traverse. In Figs. 4 and 5, the trace element values for background sample sites (cOO through c04) are shown on the left side of the graphs, while the geochemical profile for that element is shown to the right. The vertical dashed line represents the approximate position of the center of the mineralized structure in the subsurface. Chlorine, Br, Re, and Se present multi-site extremely-high con trast anomalies on traverse 2 (Fig. 4). Selenium was known to be enriched in this deposit. Rhenium is a very rare element, which is often enriched in molybdenite, and molybdenite was known to occur in the Sleeper deposit. Thus, it is likely that these Se and Re anomalies formed by some type of dispersion from the bedrock to the surface. Six elements produced anomalies that had a peak on either side of the mineralized structure. Molybdenum, W, Ag, Pb, Th, and have what is often referred to as a "rabbit-ears" profile (Fig. 5). "Rabbit-ears" anomalies are thought of as resulting from and electrochemical process (Govett, 1976; Smee and Sinha, 1979; Smee, 1983; Govett et al., 1984; Govett and Atherden, 1987). Thus, it would appear that an electrochemical process was in some way involved in generating these anomalies.
Fig. 6 is a graph of the maximum anomaly contrast ratio for each of the anomalous elements in the initial Sleeper study. The maximum contrast ratio is the highest value for thatFile name: E:\Clark.Documents\ENZYME-PrelimRel.DSJ; Page: 10
Preliminary review copy.
element divided by its background concentration. Data for two other partial leaches are also included in Fig. 6. Both the oxalic acid leach and the Kl+ascorbic acid leach (described in Viets et al., 1984) failed to produce as good anomaly contrast as the Enzyme Leach or show the "rabbit-ears" profiles. The elements are sorted according to decreasing Enzyme Leach anomaly contrast. If differences in anomaly contrast are a function of relative mobility, then the Enzyme Leach reveals two groups of trace elements in Fig. 6. Those elements that most geochemists would consider to be chemically mobile in the surficial environment as cations have the lowest contrasts. Those that commonly would be assumed to be mobile as anions under near surface conditions have the highest contrast. For example, most geochemists would think that the halogens would be mobile as chloride, bromide, and iodide ions, Mo as the molybdate ion, Se as selenate or selenite ions, etc. However, this probably is not the case for these high-contrast elements.
First, if the "rabbit-ear" anomalies at Sleeper are really related to an oxidation cell, as described by Govett (1976), Tilsley (1978), Smee (1983), Govett et al. (1984), and Govett and Atherden (1987), then you would not expect both anions and cations to be migrating into anomalies in the same places. Anions and cations should be migrating in opposite directions where a current is flowing. Second, it would not be expected that anions would show appar ent rates of migration more than ten-times greater than cations. Why is an extremely rare element, Re, showing anomaly contrast at the surface four-times higher than are Cu or Ni, which are much more abundant in the deposit. Why are U and Th, which are not enriched in the deposit, producing greater anomaly contrasts than metals that are enriched in this miner alized system. Thus, it appears that two transport mechanisms are involved in the migration of these trace elements to the surface. The high-contrast group is moving to the surface much more efficiently than is the low-contrast group, the cations, but both groups are being con centrated in or near the same places at the surface. Furthermore, elements derived from the country rock or overburden, such as U and Th, can be enriched in the same anomalies.
The "rabbit-ears" anomaly profile for Ag and Pb can be explained by the conventional model for an electrochemical cell as described by Bolviken and Logn (1975), Govett (1976), Tilsley (1978), Smee (1983), Govett et al. (1984), and Govett and Atherden (1987). Elec trochemical transport of ions is a very inefficient process, and a substantial length of time would be necessary to produce an anomaly at the surface through thick overburden. The erosional surface at Sleeper was determined to be approximately 3 million years old (William Utterbach, personal communication). If an electrochemical cell existed in the subsurface at Sleeper, then several-million years probably would be sufficient time to generate a Ag anomaly three-times higher than background at the surface through 30 meters of overburden by means electrochemical transport.
The high-contrast suite (i.e. the "oxidation suite") of elements is a different story. Existing models for electrochemical cells in the crust (Bolviken and Logn, 1975; Govett, 1976; Tilsley, 1978; Smee and Sinha, 1979; Smee, 1983; Govett et al., 1984; and Govett and Atherden, 1987) do not explain "oxidation suite" anomalies. A plot of As and I together on the same profile for traverse 2 at Sleeper shows a strong degree of correspondence for the two elements (Fig. 7). When the data for arsenic and iodine from all the sample sites are plotted together on a scatter diagram, the background sample sites plot in a small cluster near the origin of the graph, and the anomalous sites tend to line up in a linear trend going away from the origin (Fig. 8). Either As and I are being mobilized and migrating to the surface together, or they are being trapped sympathetically by the same mechanism in the soil. MostFilename: E:\Clark.Documents\ENZYME-PrelimRel.DS5; Page: 11
Preliminary review copy.
likely, As and iodine are traveling to the surface together. If that is the case, then there is a strong possibility that they are traveling as AsI3 . A scatter diagram of Mo and CI shows a similar relationship for five of nine anomalous sample sites (Fig. 8). Rhenium and Br also tend to follow each other (Fig. 8). Since 1993, these linear relationships between members of the oxidation suite have been observed numerous times in exploration projects and pilot studies in many parts of the world, most commonly where the overburden is dry. In some locations Mo and Br correlate with each other, sometimes a strong correlation is found between Se and CI or Se and Br, sometimes W and CI correlate with each other, and in sev eral projects Sb and Br (Fig. 8) have been observed to follow each other. Frequently, contour maps of exploration grids will produce very similar patterns for As, V and iodine near mineralized bedrock, indicating that V often associates with As and iodine. In each of these cases, it seems that each pair of elements is migrating together to the surface from a source in the subsurface.
Metals and metalloids of the oxidation suite (Mo, W, Re, V, As, Sb, Se, Te, Th, and U) form halides and oxyhalides that have relatively low boiling points (Table 2). The halo gens also have low boiling points. These elemental gases and volatile halide compounds would tend to form under the acid/oxidizing conditions of the anode of an electrochemical cell. Geochemical analysts have long been aware of the tendency to loose these elements from digestions that evolve elemental halogen gases. Each of the compounds listed in Table 2 has a significant vapor pressure under ambient conditions near the surface of the Earth. For instance, the volatility of MoClj can be demonstrated on an analytical balance that weighs to 0.0001 g, in that the reading of the last digit is declining too fast to record the number. There is a strong tendency for gases in the subsurface to diffuse vertically toward the surface (Klusman, 1993). Thus, if these volatile compounds formed at the anode of an electro chemical cell in the subsurface, they would tend to diffuse vertically away from that anode, toward the surface. These are not charged species, and they would not diffuse along electro chemical gradients. In fact, the oxidation suite appears to form apical anomalies over their sources, anodes. Because these apparent anodes are located irregularly around the sides of the upper ends of reduced bodies, asymmetrical "rabbit-ears" anomalies are found at the sur face bracketing the upper ends of these bodies at depth. These volatile halides would be metastable in the soils at the surface, and the trapping efficiency of the coatings on mineral grains in the soil for the various trace elements probably would vary considerably. Fig. 9 is a model for the anomaly pattern produced at the surface over a reduced body, where "oxida tion suite" anomalies occur over the anodes (oxidizing poles) that flank a buried source. The reducing pole (cathode) would correspond to the "central low" of these anomaly patterns. It appears that a wide variety of factors come into play in establishing the symmetry, or lack thereof, of these oxidation cells. These would include, geometry of the deposit, faulting and fracturing of the deposit and host rocks, variations in the chemistry of the host rocks, chem istry and zoning of the reduced body, relative depth of the water table, and direction of groundwater flow.
File name: E:\Clark.Documents\ENZYME-PrelimRel.DS5; Page: 12
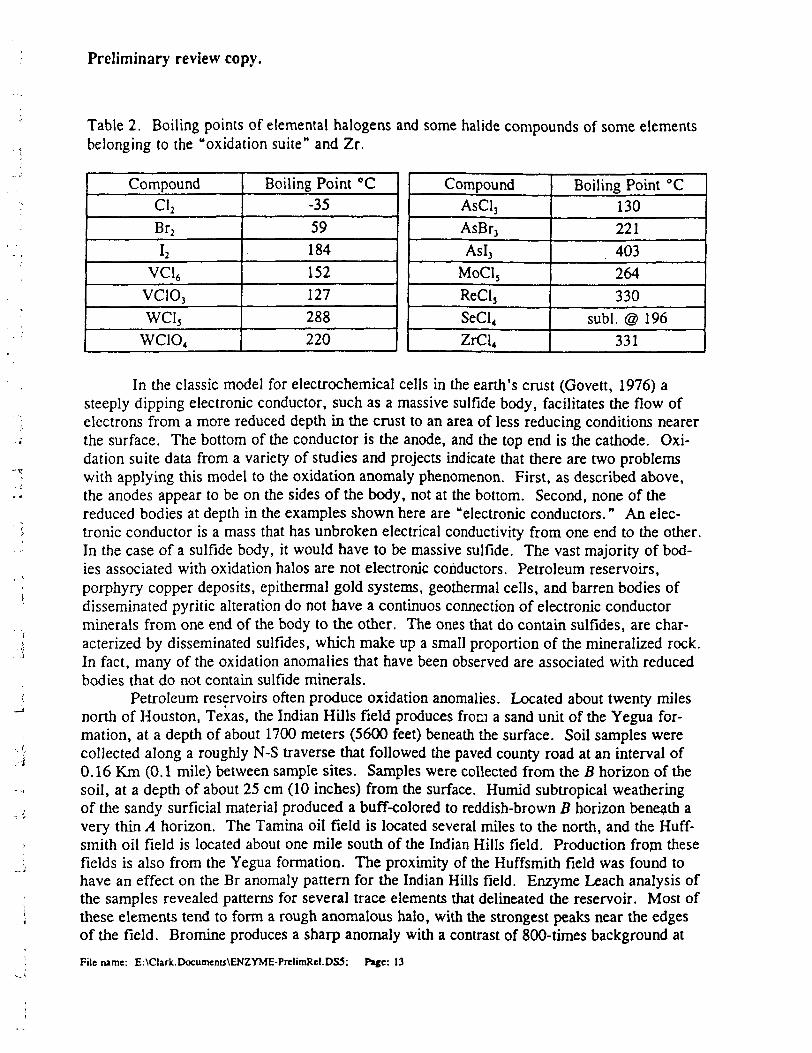
Preliminary review copy.
Table 2. Boiling points of elemental halogens and some halide compounds of some elements belonging to the "oxidation suite" and Zr.
CompoundC1 2Br2I2
VC16VClOjWC13
WC1O4
Boiling Point "C-3559184152127288220
CompoundAsCl3AsBr3AsI3
MoCl3ReCl3SeCl,ZrCl4
Boiling Point 0 C130221403264330
subl. @ 196331
In the classic model for electrochemical cells in the earth's crust (Govett, 1976) a steeply dipping electronic conductor, such as a massive sulfide body, facilitates the flow of electrons from a more reduced depth in the crust to an area of less reducing conditions nearer the surface. The bottom of the conductor is the anode, and the top end is the cathode. Oxi dation suite data from a variety of studies and projects indicate that there are two problems with applying this model to the oxidation anomaly phenomenon. First, as described above, the anodes appear to be on the sides of the body, not at the bottom. Second, none of the reduced bodies at depth in the examples shown here are "electronic conductors." An elec tronic conductor is a mass that has unbroken electrical conductivity from one end to the other. In the case of a sulfide body, it would have to be massive sulfide. The vast majority of bod ies associated with oxidation halos are not electronic conductors. Petroleum reservoirs, porphyry copper deposits, epithermal gold systems, geothermal cells, and barren bodies of disseminated pyritic alteration do not have a continues connection of electronic conductor minerals from one end of the body to the other. The ones that do contain sulfides, are char acterized by disseminated sulfides, which make up a small proportion of the mineralized rock. In fact, many of the oxidation anomalies that have been observed are associated with reduced bodies that do not contain sulfide minerals.
Petroleum reservoirs often produce oxidation anomalies. Located about twenty miles north of Houston, Texas, the Indian Hills field produces from a sand unit of the Yegua for mation, at a depth of about 1700 meters (5600 feet) beneath the surface. Soil samples were collected along a roughly N-S traverse that followed the paved county road at an interval of 0.16 Km (0. l mile) between sample sites. Samples were collected from the B horizon of the soil, at a depth of about 25 cm (10 inches) from the surface. Humid subtropical weathering of the sandy surficial material produced a buff-colored to reddish-brown B horizon beneath a very thin A horizon. The Tamina oil field is located several miles to the north, and the Huff- smith oil field is located about one mile south of the Indian Hills field. Production from these fields is also from the Yegua formation. The proximity of the Huffsmith field was found to have an effect on the Br anomaly pattern for the Indian Hills field. Enzyme Leach analysis of the samples revealed patterns for several trace elements that delineated the reservoir. Most of these elements tend to form a rough anomalous halo, with the strongest peaks near the edges of the field. Bromine produces a sharp anomaly with a contrast of 800-times background atFile name: E:\Clark.Documcnts\ENZYME-PrelimRel.DS5: Page: 13
Preliminary review copy.
the north edge of the field, and south of the field, in the area between Indian Hills and Huff- smith, there is a broad Br anomaly with a contrast of 80-times background (Fig. 10). No chlorine anomaly was detected around Indian Hills, and the iodine anomaly, which has a maximum contrast of 9-times background, is confined largely to the south side of the field. Thorium produces weakly anomalous values over much of the area of the field, but the strongest values are near the edges (Fig. 10). Zinc forms a halo, with peaks near the edge of the field (Fig. 10).
An alternative model for the formation of halo anomalies at the surface around petro leum reservoirs at depth calls upon a zone of reduced permeability above the reservoir to be responsible for the central low over the reservoir (Sandy, 1987). This barrier would be formed by petroleum microseepage-induced alteration and microbial deposition of carbonates and sulfides in the section directly overlying the reservoir. There are three problems with this model. If such a barrier was responsible for diverting microseepage to the flanks of the reservoir, then why does not the barrier continue to propagate laterally eventually extinguish ing the microseepage of hydrocarbons to the surface. Second, it does not explain oxidation suite anomalies on the flanks of reservoirs, often coincident with hydrocarbon anomalies. Third, stratiform layers of chemical precipitates are not impermeable. Dense layers of cali che in the subsurface do not block the migration of oxidation suite elements to the surface. Why should a similar layer over a reservoir be any more effective at blocking the migration of hydrocarbons.
If an electrochemical process is responsible for the formation of volatile compounds that migrate to the surface, then it is possible that variations in oxidation potential within the electrochemical cell will cause differential migration of volatiles that form at different elec trode potentials. The halogens would be a likely candidate for this differentiation, because of the difference in the oxidation potential required to oxidize chloride, bromide, and iodide to elemental chlorine, bromine, and iodine (Table 3). In most instances, no differentiation pat tern is observed for the halogens, and the peaks often closely coincide. However, about one-third of the time larger mineralized systems produce iodine peaks farthermost from the central low, chlorine peaks adjacent to the boundary of the central low, and Br peaks between CI and iodine. In a pilot study in western Alaska, a test line, which was not long enough to show the entire anomaly on one side of the central low and barely crossed the central low at the other end, revealed a coincident central low for CI, Br, and iodine (Fig. 11). On the one flank, which included one side of the halo, a typical differentiation pattern was observed in the geochemical profile. This apparent differential migration of CI, Br and iodine has been observed around several porphyry prospects in North America and Chile. Stan Keith (per sonal communication) has suggested that this may be primary halogen zoning produced by the mineralizing event, rather than electrochemical differentiation. The fact that this pattern has also been observed around some petroleum reservoirs argues strongly against a primary zon ing interpretation. The Hillman oil field in southern Ontario shows Br/I zoning on each side of the field. (Fig. 12).
File name: E:\CUrk.DocumenB\ENZYME-PreIimRel.DSS; Page: 14
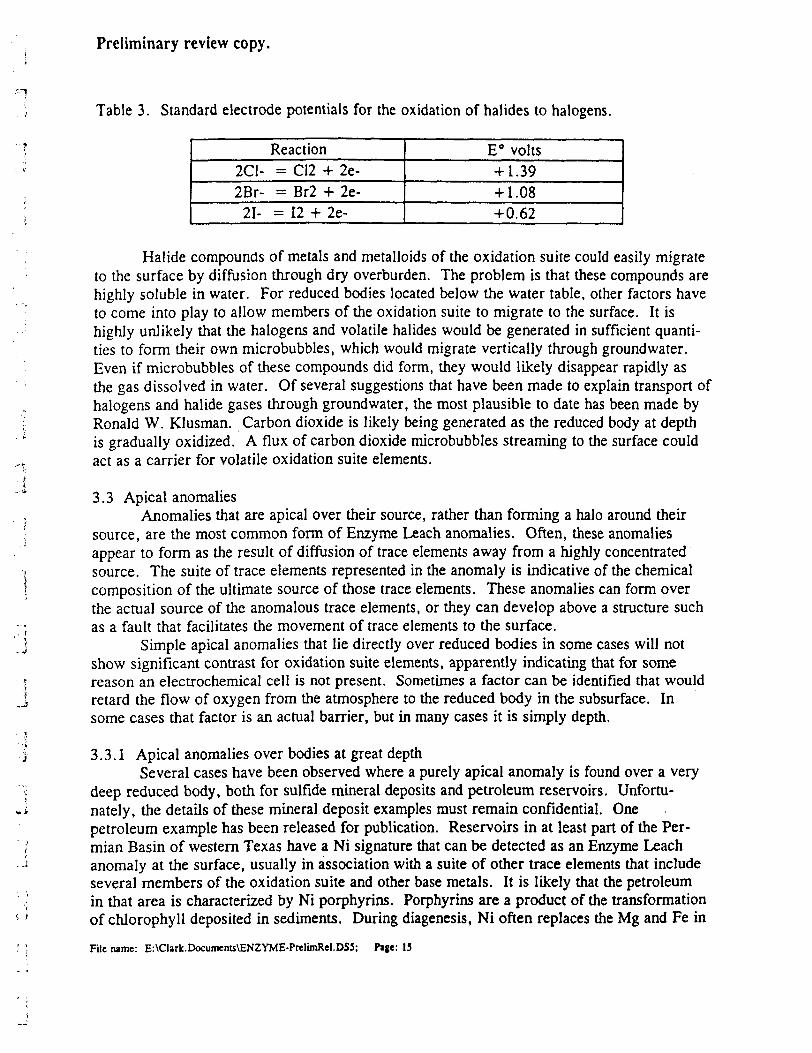
Preliminary review copy.
'l i Table 3. Standard electrode potentials for the oxidation of halides to halogens.
Reaction2C1- = C12 -f 2e-2Br- = Br2 ± 2e-
21- = 12 + 2e-
E0 volts+ 1.39+ 1.08+0.62
Halide compounds of metals and metalloids of the oxidation suite could easily migrate to the surface by diffusion through dry overburden. The problem is that these compounds are highly soluble in water. For reduced bodies located below the water table, other factors have to come into play to allow members of the oxidation suite to migrate to the surface. It is highly unlikely that the halogens and volatile halides would be generated in sufficient quanti ties to form their own microbubbles, which would migrate vertically through groundwater. Even if microbubbles of these compounds did form, they would likely disappear rapidly as the gas dissolved in water. Of several suggestions that have been made to explain transport of halogens and halide gases through groundwater, the most plausible to date has been made by Ronald W. Klusman. Carbon dioxide is likely being generated as the reduced body at depth is gradually oxidized. A flux of carbon dioxide microbubbles streaming to the surface could act as a carrier for volatile oxidation suite elements.
3.3 Apical anomaliesAnomalies that are apical over their source, rather than forming a halo around their
source, are the most common form of Enzyme Leach anomalies. Often, these anomalies appear to form as the result of diffusion of trace elements away from a highly concentrated source. The suite of trace elements represented in the anomaly is indicative of the chemical composition of the ultimate source of those trace elements. These anomalies can form over the actual source of the anomalous trace elements, or they can develop above a structure such as a fault that facilitates the movement of trace elements to the surface.
Simple apical anomalies that lie directly over reduced bodies in some cases will not show significant contrast for oxidation suite elements, apparently indicating that for some reason an electrochemical cell is not present. Sometimes a factor can be identified that would retard the flow of oxygen from the atmosphere to the reduced body in the subsurface. In some cases that factor is an actual barrier, but in many cases it is simply depth.
3.3.1 Apical anomalies over bodies at great depthSeveral cases have been observed where a purely apical anomaly is found over a very
deep reduced body, both for sulfide mineral deposits and petroleum reservoirs. Unfortu- nately, the details of these mineral deposit examples must remain confidential. One petroleum example has been released for publication. Reservoirs in at least part of the Per- mian Basin of western Texas have a Ni signature that can be detected as an Enzyme Leach anomaly at the surface, usually in association with a suite of other trace elements that include several members of the oxidation suite and other base metals. It is likely that the petroleum in that area is characterized by Ni porphyrins. Porphyrins are a product of the transformation of chlorophyll deposited in sediments. During diagenesis, Ni often replaces the Mg and Fe inFile name: E:\Clarlc.Documents\ENZYME-PrelimRel.DS5; Pige: 15
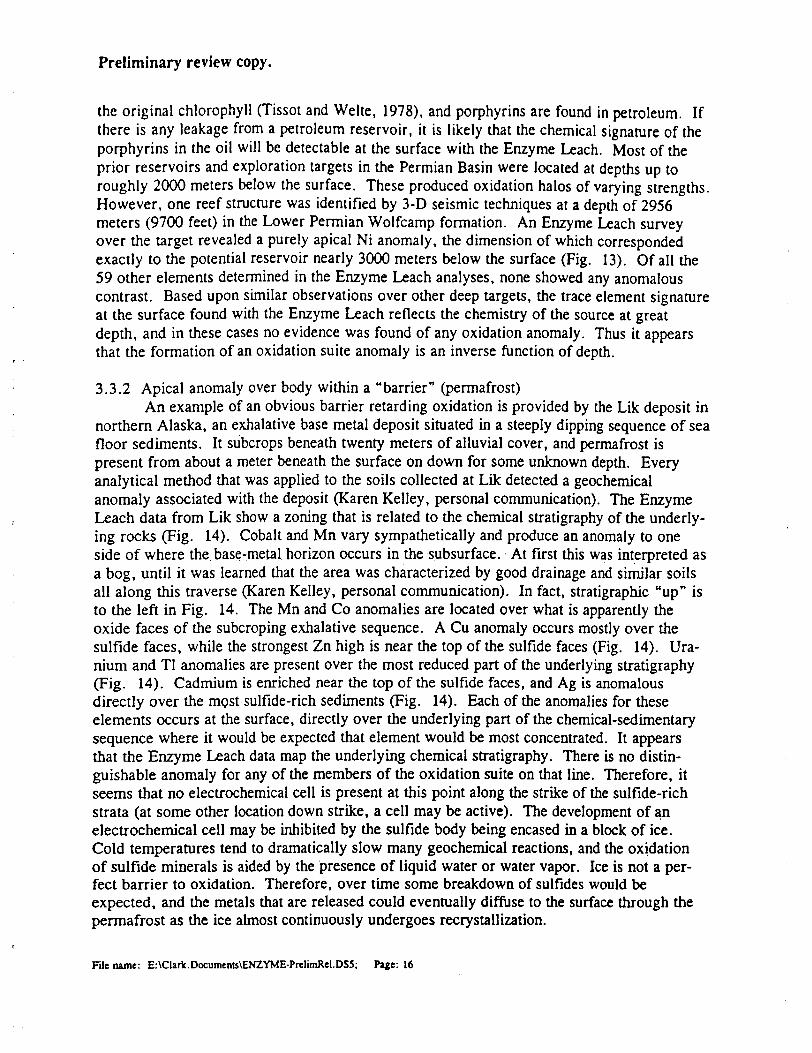
Preliminary review copy.
the original chlorophyll (Tissot and Welte, 1978), and porphyrins are found in petroleum. If there is any leakage from a petroleum reservoir, it is likely that the chemical signature of the porphyrins in the oil will be detectable at the surface with the Enzyme Leach. Most of the prior reservoirs and exploration targets in the Permian Basin were located at depths up to roughly 2000 meters below the surface. These produced oxidation halos of varying strengths. However, one reef structure was identified by 3-D seismic techniques at a depth of 2956 meters (9700 feet) in the Lower Permian Wolfcamp formation. An Enzyme Leach survey over the target revealed a purely apical Ni anomaly, the dimension of which corresponded exactly to the potential reservoir nearly 3000 meters below the surface (Fig. 13). Of all the 59 other elements determined in the Enzyme Leach analyses, none showed any anomalous contrast. Based upon similar observations over other deep targets, the trace element signature at the surface found with the Enzyme Leach reflects the chemistry of the source at great depth, and in these cases no evidence was found of any oxidation anomaly. Thus it appears that the formation of an oxidation suite anomaly is an inverse function of depth.
3.3.2 Apical anomaly over body within a "barrier" (permafrost)An example of an obvious barrier retarding oxidation is provided by the Lik deposit in
northern Alaska, an exhalative base metal deposit situated in a steeply dipping sequence of sea floor sediments. It subcrops beneath twenty meters of alluvial cover, and permafrost is present from about a meter beneath the surface on down for some unknown depth. Every analytical method that was applied to the soils collected at Lik detected a geochemical anomaly associated with the deposit (Karen Kelley, personal communication). The Enzyme Leach data from Lik show a zoning that is related to the chemical stratigraphy of the underly ing rocks (Fig. 14). Cobalt and Mn vary sympathetically and produce an anomaly to one side of where the. base-metal horizon occurs in the subsurface. At first this was interpreted as a bog, until it was learned that the area was characterized by good drainage and similar soils all along this traverse (Karen Kelley, personal communication). In fact, stratigraphic "up" is to the left in Fig. 14. The Mn and Co anomalies are located over what is apparently the oxide faces of the subcrop ing exhalative sequence. A Cu anomaly occurs mostly over the sulfide faces, while the strongest Zn high is near the top of the sulfide faces (Fig. 14). Ura nium and Tl anomalies are present over the most reduced part of the underlying stratigraphy (Fig. 14). Cadmium is enriched near the top of the sulfide faces, and Ag is anomalous directly over the most sulfide-rich sediments (Fig. 14). Each of the anomalies for these elements occurs at the surface, directly over the underlying part of the chemical-sedimentary sequence where it would be expected that element would be most concentrated. It appears that the Enzyme Leach data map the underlying chemical stratigraphy. There is no distin guishable anomaly for any of the members of the oxidation suite on that line. Therefore, it seems that no electrochemical cell is present at this point along the strike of the sulfide-rich strata (at some other location down strike, a cell may be active). The development of an electrochemical cell may be inhibited by the sulfide body being encased in a block of ice. Cold temperatures tend to dramatically slow many geochemical reactions, and the oxidation of sulfide minerals is aided by the presence of liquid water or water vapor. Ice is not a per fect barrier to oxidation. Therefore, over time some breakdown of sulfides would be expected, and the metals that are released could eventually diffuse to the surface through the permafrost as the ice almost continuously undergoes recrystallization.
File name: E:\Clark.Documents\ENZYME-PrelimRel.DS5; Page: 16
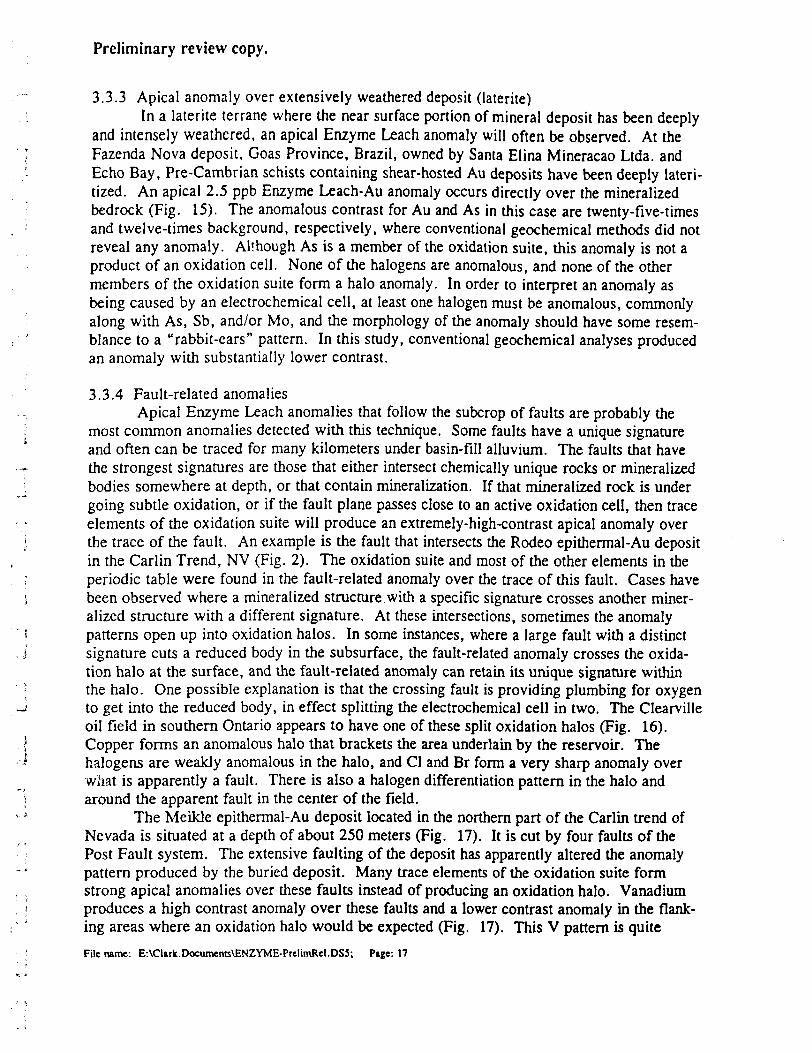
Preliminary review copy.
3.3.3 Apical anomaly over extensively weathered deposit (laterite)In a laterite terrane where the near surface portion of mineral deposit has been deeply
and intensely weathered, an apical Enzyme Leach anomaly will often be observed. At the Fazenda Nova deposit, Goas Province, Brazil, owned by Santa Elina Mineracao Ltda. and Echo Bay, Pre-Cambrian schists containing shear-hosted Au deposits have been deeply lateri- tized. An apical 2.5 ppb Enzyme Leach-Au anomaly occurs directly over the mineralized bedrock (Fig. 15). The anomalous contrast for Au and As in this case are twenty-five-times and twelve-times background, respectively, where conventional geochemical methods did not reveal any anomaly. Although As is a member of the oxidation suite, this anomaly is not a product of an oxidation cell. None of the halogens are anomalous, and none of the other members of the oxidation suite form a halo anomaly. In order to interpret an anomaly as being caused by an electrochemical cell, at least one halogen must be anomalous, commonly along with As, Sb, and/or Mo, and the morphology of the anomaly should have some resem blance to a "rabbit-ears" pattern. In this study, conventional geochemical analyses produced an anomaly with substantially lower contrast.
3.3.4 Fault-related anomaliesApical Enzyme Leach anomalies that follow the subcrop of faults are probably the
most common anomalies detected with this technique. Some faults have a unique signature and often can be traced for many kilometers under basin-fill alluvium. The faults that have the strongest signatures are those that either intersect chemically unique rocks or mineralized bodies somewhere at depth, or that contain mineralization. If that mineralized rock is under going subtle oxidation, or if the fault plane passes close to an active oxidation cell, then trace elements of the oxidation suite will produce an extremely-high-contrast apical anomaly over the trace of the fault. An example is the fault that intersects the Rodeo epithermal-Au deposit in the Carlin Trend, NV (Fig. 2). The oxidation suite and most of the other elements in the periodic table were found in the fault-related anomaly over the trace of this fault. Cases have been observed where a mineralized structure with a specific signature crosses another miner alized structure with a different signature. At these intersections, sometimes the anomaly patterns open up into oxidation halos. In some instances, where a large fault with a distinct signature cuts a reduced body in the subsurface, the fault-related anomaly crosses the oxida tion halo at the surface, and the fault-related anomaly can retain its unique signature within the halo. One possible explanation is that the crossing fault is providing plumbing for oxygen to get Into the reduced body, in effect splitting the electrochemical cell in two. The Clearville oil field in southern Ontario appears to have one of these split oxidation halos (Fig. 16). Copper forms an anomalous halo that brackets the area underlain by the reservoir. The halogens are weakly anomalous in the halo, and CI and Br form a very sharp anomaly over what is apparently a fault. There is also a halogen differentiation pattern in the halo and around the apparent fault in the center of the field.
The Meikle epithermal-Au deposit located in the northern part of the Carlin trend of Nevada is situated at a depth of about 250 meters (Fig. 17). It is cut by four faults of the Post Fault system. The extensive faulting of the deposit has apparently altered the anomaly pattern produced by the buried deposit. Many trace elements of the oxidation suite form strong apical anomalies over these faults instead of producing an oxidation halo. Vanadium produces a high contrast anomaly over these faults and a lower contrast anomaly in the flank ing areas where an oxidation halo would be expected (Fig. 17). This V pattern is quiteFile name: E:\Clark.Documents\ENZYME-PrelimRel.DS5; Pige: 17
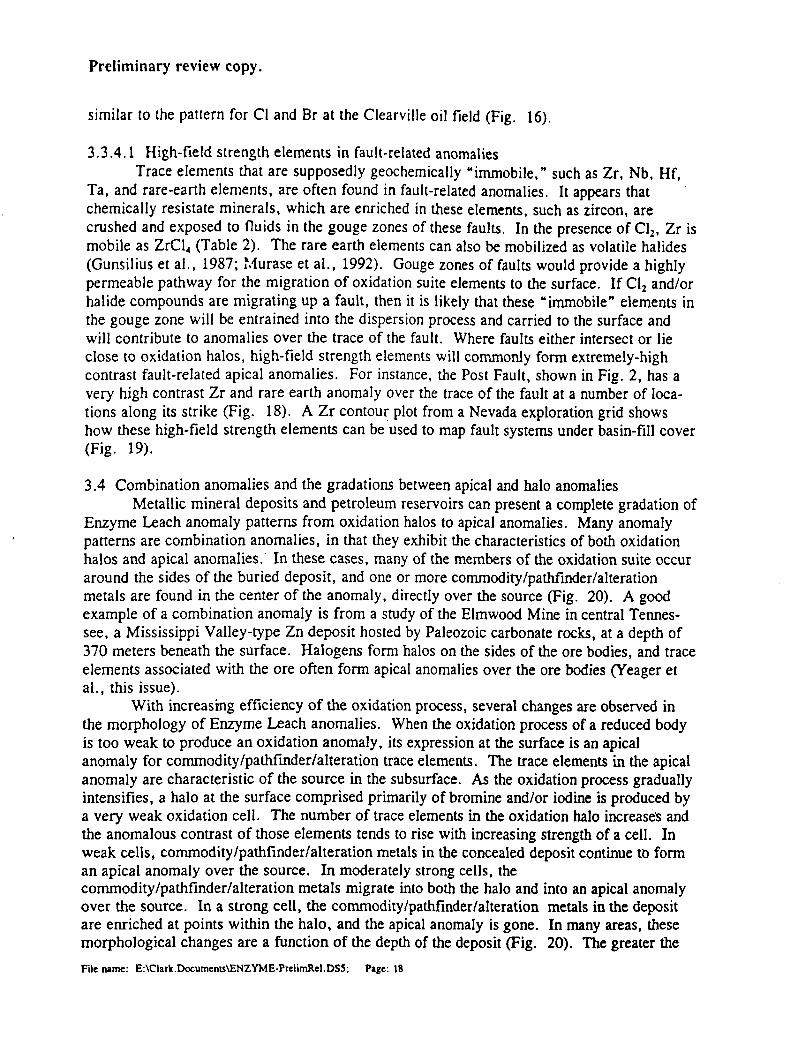
Preliminary review copy.
similar to the pattern for CI and Br at the Clearville oil field (Fig. 16).
3.3.4.1 High-field strength elements in fault-related anomaliesTrace elements that are supposedly geochemically "immobile," such as Zr, Nb, Hf,
Ta, and rare-earth elements, are often found in fault-related anomalies. It appears that chemically resistate minerals, which are enriched in these elements, such as zircon, are crushed and exposed to fluids in the gouge zones of these faults. In the presence of C1 2 , Zr is mobile as ZrCl4 (Table 2). The rare earth elements can also be mobilized as volatile halides (Gunsilius et al., 1987; Murase et al., 1992). Gouge zones of faults would provide a highly permeable pathway for the migration of oxidation suite elements to the surface. If C1 2 and/or halide compounds are migrating up a fault, then it is likely that these "immobile" elements in the gouge zone will be entrained into the dispersion process and carried to the surface and will contribute to anomalies over the trace of the fault. Where faults either intersect or lie close to oxidation halos, high-field strength elements will commonly form extremely-high contrast fault-related apical anomalies. For instance, the Post Fault, shown in Fig. 2, has a very high contrast Zr and rare earth anomaly over the trace of the fault at a number of loca tions along its strike (Fig. 18). A Zr contour plot from a Nevada exploration grid shows how these high-field strength elements can be used to map fault systems under basin-fill cover (Fig. 19).
3.4 Combination anomalies and the gradations between apical and halo anomaliesMetallic mineral deposits and petroleum reservoirs can present a complete gradation of
Enzyme Leach anomaly patterns from oxidation halos to apical anomalies. Many anomaly patterns are combination anomalies, in that they exhibit the characteristics of both oxidation halos and apical anomalies. In these cases, many of the members of the oxidation suite occur around the sides of the buried deposit, and one or more commodity/pathfinder/alteration metals are found in the center of the anomaly, directly over the source (Fig. 20). A good example of a combination anomaly is from a study of the Elrnwood Mine in central Tennes see, a Mississippi Valley-type Zn deposit hosted by Paleozoic carbonate rocks, at a depth of 370 meters beneath the surface. Halogens form halos on the sides of the ore bodies, and trace elements associated with the ore often form apical anomalies over the ore bodies (Yeager et al., this issue).
With increasing efficiency of the oxidation process, several changes are observed in the morphology of Enzyme Leach anomalies. When the oxidation process of a reduced body is too weak to produce an oxidation anomaly, its expression at the surface is an apical anomaly for commodity/pathfinder/alteration trace elements. The trace elements in the apical anomaly are characteristic of the source in the subsurface. As the oxidation process gradually intensifies, a halo at the surface comprised primarily of bromine and/or iodine is produced by a very weak oxidation cell. The number of trace elements in the oxidation halo increases and the anomalous contrast of those elements tends to rise with increasing strength of a cell. In weak cells, commodity/pathfinder/alteration metals in the concealed deposit continue to form an apical anomaly over the source. In moderately strong cells, thecommodity/pathfinder/alteration metals migrate into both the halo and into an apical anomaly over the source. In a strong cell, the commodity/pathfinder/alteration metals in the deposit are enriched at points within the halo, and the apical anomaly is gone. In many areas, these morphological changes are a function of the depth of the deposit (Fig. 20). The greater theFile name: E:\Clark.Documems\ENZYME-PrelirnRel.DS5; Page: 18
.-J
J -Jt
Preliminary review copy.
depth, the weaker the cell. In one area where a mineralized trend plunges into the basement a progression from one anomaly type to another has been observed along the plunge of the trend. The critical depths at which these morphological changes occur changes from one geological terrane to another. Host rock composition, geochemical barriers, and climate variations also affect the depths at which these transitions take place. In northern Chile, deposits at a depth of about one kilometer typically produce moderately strong to strong oxi dation cells. In the Canadian Shield, it appears that sulfide deposits often will produce weak oxidation cells when they are at a depth of much less than one kilometer.
3.5 Mechanical/hydromorphic anomaliesIn terranes where the bedrock is buried by extensive deposits of glacial overburden,
mechanical/hydromorphic anomalies are observed, often in close association with oxidation- halo anomalies and apical anomalies. Applying the Enzyme Leach in glacially buried terranes has been discussed by Jackson (1995). Mechanical dispersion trains formed in the basal till as mineralized bedrock material was smeared down ice during glaciation. Gradual weathering of this mineralized material releases trace elements into the groundwater flowing through the till. Vegetation with roots tapping into either the mineralized till or anomalous groundwater picks up trace elements which are eventually shed to the forest floor in plant litter. Anomalous trace elements are often relatively quickly leached from the A-soil horizon and trapped in oxide coatings in the B horizon. In essence the 5-soil horizon often acts as a long-term inte grator of vegetation anomalies (Clark, 1993). The Enzyme Leach has been used to detect very subtle mechanical/hydromorphic anomalies related to mineralized bedrock in glacial overburden situations, including areas where the glacial till is blanketed with a thick layer of glaciolacustrine sediments. Subtle hydromorphic dispersion anomalies in stream sediments have also been detected with the Enzyme Leach. Trace element suites comprising mechanical/hydromorphic-related soil anomalies often reflect at least part of the chemical signature of the bedrock source. Anomaly contrasts in soils developed on glacial till often range from 2-times to 10-times the background concentrations for the elements forming the anomaly. In some cases Enzyme Leach anomaly patterns produced by mechanical and hydromorphic dispersion processes are quite similar morphologically to those that are detected in similar situations with conventional chemical analyses. Also, it is not uncommon to find oxidation halos bracketing a lode-Au zone, while a low contrast W and/or Bi anomaly can be detected for several hundred meters down ice from the prospect. Similarly, low con trast base metal anomalies can be found on the down-ice side of an oxidation halo or apical anomaly associated with a massive sulfide.
3.6 Complicating factors and interpretation problems 3.6.1 Interference patterns
When mineralized bodies lie in close proximity to each other, interference patterns between adjacent anomalies will often produce a confused picture to the exploration geologist. A good example is found at the Pinson Mine, in the Getchell Trend, Nevada. The Mag epithermal-Au deposit is covered by about 80 meters of basin-fill alluvium (Fig. 21). At the time that the original pilot study was done in 1992, it was found that the original line was too short to encompass the entire oxidation halo. A year later, the line was extended, and the sample spacing was increased on the east end of the line to be sure to get far enough out from the Mag body to get into background. Subsequently, a second subeconomic mineralized bodyFile name: E:\CUrk.Documents\ENZYME-PrcIiraRel.DS5; Pige: 19
, J
Preliminary review copy.
was discovered down slope from the Mag deposit, in the area where a wider sample spacing had been employed. Plots for several oxidation suite elements shows a central low over both mineralized bodies (for example: Fig. 21). If the geologist only had this traverse to use to select drill targets, the first target choice would be put a vertical hole into the apparent central low between the two highest peaks (Fig. 21). If the drill hole went deep enough, eventually it would intersect the Mag ore body. However, if it did not intersect a mineralized body, the geologist would still be left without an explanation for a very attractive anomaly. The logical second choice for a drill target would be the central low over the Mag deposit, because this is where the overburden would be expected to be thinner, rather than the central low downslope with a higher contrast halo. Ambiguities such as this are often cleared up when sampling is done on a grid and the data are contoured.
3.6.2 Graphitic horizonsGraphitic host rocks can have a very strong quenching effect on the strength of oxida
tion cells. Massive sulfide occurrences hosted by graphitic rocks seem to produce much weaker oxidation anomalies than would be expected. Similar mineralized bodies hosted by altered volcanic rocks in the same locality often will produce much stronger oxidation cells, even though they might be substantially deeper beneath the surface. It would appear that graphitic host rocks tend to short out the electrochemical cells, preventing the oxidation potentials from getting high enough to generate strong anomalies.
3.6.3 Au and Hg Enzyme Leach anomaliesMetallic Au and Hg are not soluble in the Enzyme Leach. And, yet Au or Hg
anomalies can turn up within areas affected by oxidation anomalies. The Enzyme Leach- soluble Au and Hg has to be present in some nonmetallic, oxidized, form that can be dissolved during the leaching process. The pilot study done over the Rabbit Creek deposit (now part of the Twin Creeks Project, in the Getchell Trend of Nevada) in 1990 shows examples of this kind of Au anomaly. The northernmost sampling traverse is in an area where the overburden is about 50 meters thick and the southern traverse is about 200 meters above the bedrock Fig. 22). Several of the samples around the sides of the Rabbit Creek deposit were found to have detectable Au above the 0.1 ppb level (Fig. 22). One sample was as high as 0.6 ppb.. These same samples are also anomalous in oxidation suite elements, like CI, Br, I, or Mo. Gold trichloride sublimes at only 265 0 C. Therefore, it is possible that AuClj migrated as a volatile through as much as 200 meters of overburden. However, the soils in this area have a total Au content of about 3 ppb. If a subtle flux of substances like C12 , Br2 ,12 , or MoCl5 pass through such a soil, it would be not be surprising if part of the Au in the soil was oxidized, making it soluble to the Enzyme Leach.
The Happy Creek Prospect, also located in Northern Nevada, is another location where Enzyme Leach-Au anomalies are found (Fig. 22). The Au anomalies in Fig. 22 are at a much higher level, 2 to 5 ppb. At these levels it is doubtful that the Au anomaly is pro duced from background Au that is being oxidized in place. After this initial pilot study, a detailed soil sampling program was conducted using a regular grid pattern, the samples were analyzed using the Enzyme Leach, and the data were contoured. Several of the central lows in the sampled area were drilled, and zones of epithermal mineralization with subeconomic Au grades were found more than 300 meters down. In a recent pilot study, it was shown that the geologist should begin to suspect that Enzyme Leach-Au is originating in the bedrockFile name: E:\CUrk.Documents\ENZYME-PrelimRel.DS5; Pige: 20
Preliminary review copy.
when the values go above the 0.6 ppb level.Mercury behaves similarly to Au. When either Au or Hg anomalies are detected with
the Enzyme Leach, it is most often a positive indication of oxidation anomalies. If the values l go high enough, a bedrock source for the anomaly should be suspected. Occasionally, an { apical Enzyme Leach-Au anomaly will be found in the center of an oxidation halo along with
Sb, or sometimes As. There is not yet an adequate explanation for the formation of these l apical Au/Sb anomalies, but they have led to more than one discovery.
3.6.4 Collapsed Oxidation HalosWhere an extremely deep weathering profile has resulted in the total destruction of the
sulfldes in the upper portion of a mineral deposit, the oxidation halo is often observed to have 7 collapsed inward, and at present specific features within the deposit are the centers of oxida
tion cells. Most commonly in these cases the gouge zones within faults that cut the deposit control the locations of oxidation cells. Typically, the quite narrow central lows of these col lapsed halos are centered over the deeper weathering crevices along the faults. The clearest
{ publishable example of this to date is at the Radomiro Tomic deposit north of Calama, Chile,where the current oxidation cell is controlled by a single fault.
l Radomiro Tomic (RT), located along the east side of the "West Fissure" and just l north of Chuquicamata, is a deeply buried porphyry copper deposit. The upper portion of the
primary sulfldes is very deeply weathered, typically to depths of well over one hundred "^ meters (Figure 23). The weathered subcrop is covered by gravels that are in some places up ,j, to one hundred meters thick. Secondary copper sulfldes are present near the bottom of the
weathering profile. Exotic copper ore is also present in the section above the unweathered ? sulfide zone. The post-ore fault is a splay off of the West Fissure. A series of extensive j pilot studies were conducted over this deposit using a variety of conventional and new
geochemical techniques in late 1994. Rather than forming a halo around the deposit, the•l oxidation suite anomaly is found over the deposit (Figure 23). The central low for this- anomaly is less than 200 meters wide, and it is situated directly over the large post-ore fault.
If the sample spacing had been wider than 100 meters, this central low may not have been l identified. That would have made it appear that the oxidation suite anomaly is apical over the J source, rather than forming a halo around the source, which in this case is the narrow gouge
zone in the fault. l Evidence of two stages of weathering are present at RT. When collapsed halos are
—' observed, weaker oxidation suite anomalies are often found at points around the mineral , deposit where you would expect to find the halo under normal circumstances. These small 'l outlying anomalies could be due to a weaker larger-scale oxidation cell, or they could be* "relic halos" left over from an earlier period in the weathering history of the deposit. If these
are genuine relic halos, then you would expect the halogen halo to collapse much more rap-t idly than the base metal halos, because of evidence discussed earlier (Fig. 6) that suggests
that the oxidation suite is transported into anomalies much more rapidly than the base metals, r, If oxidation suite elements are transported into the anomalies more rapidly, then their anoma-
] lies will probably dissipate first in the old location and redevelop first in the new location. A "^ Enzyme Leach-Cu halo is often found lying outside the sulfide-rich part of porphyry systems.
i It is not unusual for this Cu halo to be more than one kilometer outside the primary Cu-! enriched area. If Cu is being moved by electrochemical processes laterally over such are
large distance, then a substantial amount of time would be required to form these halol File name: E:\CUrk.Documents\ENZYME-PreIimRel.DSJ; Pige: 21
Preliminary review copy.
anomalies. The higher magnitude Cu anomalies at RT halo the deposit, not the currently active part of the oxidation system, and the highest contrast Cu anomaly is actually upslope from the primary sulfides (Figure 24). It has been suggested that these flanking Cu spikes at RT are structurally controlled. That is probably true in part, but essentially the same pattern has been observed at several other porphyries. Within the collapsed halo, weakly anomalous Cu appears to be migrating into the new halo, in the same area as the new halogen anomaly (Fig. 24). Therefore, it would appear that during an earlier stage of weathering and with current weathering of RT, the oxidation process appears to have been characterized by a strong oxidation cell, differing only in the size of the cell.
3.6.5 Smelter smoke and mine dust contaminationOne of the possible problems addressed at RT and at Mansa Mina, located south of
Chuquicamata, is the potential for false anomalies generated by the dense smelter smoke that frequently blows across the surface in these areas. First, many of the anomalous trace ele ments detected with the Enzyme Leach would not be found in appreciable quantities in smelter smoke (for example: the halogens, vanadium, and tungsten). Second, if smelter smoke was producing anomalies in the soils of this area, the anomaly would have a broad dispersion pattern. Instead, what you see are sharp anomalies that tie directly to geologically recognized features in the basement. Finally, Enzyme Leach tests in the area around Chu quicamata and in other mining areas indicate that detectable contamination is usually confined to the upper l or 2 centimeters of the soil.
3.6.6 Apical anomalies over alteration zonesAny trace elements added to the host rocks of the deposit may also produce an apical
anomaly over the alteration zone. These alteration related apical anomalies can also be seen at the Elmwood Mine (Yeager et al., this issue). In some areas Ba anomalies can be found over barite, alunite, or potassic alteration zones. Sometimes, a Cs halo can be found over a phyllic or propylitic alteration zone. Data for elements such as Ba, Cs, Rb, and Sr should be plotted for any exploration grid to see if alteration patterns in the bedrock can be identified.
3.6.6 Geochemical barriers in section above bodyWhere a geochemical barrier occurs in the rock column above a mineralized body, the
signal of that body can be blocked from reaching the surface. Several instances have been observed where the presence of highly oxidized sediments in the section above a mineral deposit appear to attenuate the anomaly from the deposit at depth. For instance, the Carlin formation appears to have an attenuating effect on the contrast of Enzyme Leach anomalies. Other instances have been reported indicating that thick red beds in the overlying section can completely block the development of Enzyme Leach anomalies.
4. Conclusions and Process Models4.1 Role of fractures in anomaly formation
Fracturing facilitates the migration of Enzyme Leach anomalies to the surface from a bedrock source. These anomalies can only reach the surface because the overlying rocks have some degree of permeability. One of the commonly held myths in geology is that hard rocks and fine-grained sediments are impermeable. All rocks are permeable to one degree orFile name: E:\Clark.Documems\ENZYME-PrelimRel.DS5; Ptge: 22
Preliminary review copy.
; another. For dense, seemingly impermeable rocks, such as varved glaciolacustrine sedi- 1 ments, limestones, shales, or volcanic Hows, the path of least resistance through these rocks
i!} is going to be joints. It does not matter if it is varved lake beds or ignimbrite flows, they are ; all jointed. Regardless of whether the exploration target is a Mississippi Valley-type deposit 1 located beneath 400 meters of limestones and shales in North America or a porphyry located , beneath a thick section of ignimbrites in Chile, the anomaly over the deposit can only reach ; the surface because there is a permeable route to the surface, and in most cases that route
would be along joints in the overlying rock., A common thread that is found in the interpretation of Enzyme Leach data in explora
tion projects, regardless of the types of anomalies that are found, is the strong degree of structural control that is frequently observed in plots of the data. Even in oxidation halos,
- where the sampling density in a grid or traverse is sufficiently dense, the highest contrast ; anomalies for the oxidation suite elements appear to line up over joints or faults. On a larger
scale, structure can help control the development of oxidation cells. On an even larger scale, ; the reduced bodies that produce oxidation anomalies are frequently located along structures
that controlled their genesis, and these genetic structures can often be identified in contourplots of Enzyme Leach data.
T-
l 4.2 Role of vapor transport in oxidation anomaliesVapor phase transport appears to play an important role in the genesis of many
" geochemical anomalies detected with the Enzyme Leach. With regard to oxidation anomalies, a number of observations and principles have already been discussed that support this inter pretation. Electrochemical cells in the subsurface could generate electrical potentials
l sufficient to cause the oxidation of chloride, bromide, and iodide ions to Cl2(f) , Br2(t) , and I2(I) .j Concurrently, there would be a tendency for certain metals and metalloids mat are present to
form halides that easily migrate in a vapor phase with halogen gases. Because of the rela-- tively low boiling points of these halogens and halide compounds, they would have significant ! vapor pressures under ambient conditions in the subsurface, in most geographic areas. This
would explain the strong correlation between some trace elements and the halogens found in a j number of projects. The site variance in oxidation anomalies fits the vapor-phase transport
model. Because of the tendency of volatile compounds to migrate vertically toward the sur- , face with little lateral dispersion (Klusman, 1993), a soil sample collected directly over a joint \ in the bedrock, could have a much higher contrast anomaly than a sample collected five " meters away. Hundreds of exploration projects and pilot studies have shown repeatedly that , the oxidation suite of elements has a much higher anomaly contrast than do trace elements-} that would be mobile as ions. Therefore, it appears that the oxidation suite of elements is
traveling as something other than charged ions. Vapor phase transport of volatile compounds in microbubbles would be a much more efficient means of moving these trace elements to the
; surface than would ionic diffusion or dispersion along lines of electromotive force. Fracture control of microseepage of volatiles has been called upon by other researchers to account for analogous observations (Klusman, 1993; Sikka, 1959).
4.3 Electrochemical processes; Evidence supporting the electrochemical interpretation for oxidation anomalies comes ; from several observations. The central low, as defined by the elements that most tightly
bracket the low, is always over the upper end of the reduced body, not the entire body. This! File name: E:\Clark.Documents\ENZYME-PrelimReI.DS5; Page: 23
Preliminary review copy.
is what would be expected if there was a flow of current between the reduced body and the surface; i.e. the current would flow from the end of the body closest to the surface. The observation that groundwater flow does not move these anomalies off the top of the reduced body located in the subsurface, also suggests that something capable of having an effect within a short time frame is holding these anomalies in place. Electrical discharges would tend to hold the system in place. These anomalies are associated only with geological fea tures that have a contrast in oxidation potential with the surrounding rock. If part of an ore body is reduced and part oxidized, then the anomaly is associated with the reduced part. Many cations form anomalies that resemble the "rabbit ears" pattern, predicted with the clas sical model for an electrochemical cell associated with a massive sulfide body (Bolviken and Logn, 1975; Govett, 1976). With some notable exceptions, oxidation anomalies consist of similar trace element suites regardless of the type of reduced body that appears to be causing the apparent electrochemical cell. Porphyry-Cu deposits produce a suite of anomalous ele ments at the surface that is similar to the suite produced by a petroleum reservoir. However, the contrast of the various elements does vary considerably depending on the source. Anomaly patterns found with the Enzyme Leach are similar to those modeled for an electro chemical cell associated with a petroleum reservoir (Tompkins, 1990). Apparent patterns of differentiation of CI, Br, and I around mineral deposits and petroleum reservoirs are strong evidence of oxidation potential gradients in these electrochemical cells. The high oxidation potentials that would account for these halogen patterns would also promote the formation of volatile halide compounds at the anodes of electrochemical cells. This would allow for the migration of the oxidation suite of elements to the surface by a relatively efficient vapor-phase microseepage mechanism. A flux of carbon dioxide, which could be generated as a result of the break down of carbonated minerals during this process, could act as a carrier for volatile compounds of the oxidation suite (R. W. Klusman, personal communication).
4.4 Unified hypotheses and anomaly evolution 4.4.1 Apical metal anomaly hypothesis
Apical metal anomalies associated with petroleum reservoirs can be explained by microseepage of hydrocarbons from the reservoir. Those hydrocarbons would contain por- phyrins that are rich in trace metals (Tissot and Welte, 1978), and the petroleum in each reservoir would have a metal signature that would be carried vertically to the surface by microseepage. In a weak to moderate strength electrochemical cell those trace elements would likely show up as apical anomalies at the surface, over the reservoir. In a case where a strong cell developed, the trace metals may be found in the halo at the surface, around the reservoir.
Apical metal anomalies over deep sulfide mineral deposits require a different disper sion mechanism. It is quite possible that bacteria play a role in the formation of these anomalies. Even when a sulfide mineral body is located at too great a depth for an oxidation anomaly to form, it is still possible for bacteria to very gradually begin the process of oxida tion of sulfide minerals in the deposit. This bacterial oxidation might be imperceptible to the miner working underground in a deep deposit, but it would explain how commodity metals can reach the surface. Considering the concentration low levels that can be detected with the Enzyme Leach, it would take only a small amount of some metal reaching the surface to produce an anomaly. As sulfur oxidizing bacteria feed on sulfide minerals, they will ingest the metals in the sulfides. In order to rid themselves of elements that they cannot tolerate,File name: E:\CIark.Documenu\ENZYME-PrelimRel.DS5; Page: 24
Preliminary review copy.
these bacteria would methylate the harmful trace elements, and excrete the products (Klus- man, 1993, p. 290-291). Dimethyl and trimethyl compounds of metals and metalloids are volatile and could easily migrate to the surface to form Enzyme Leach-detectable anomalies directly over a mineral deposit located several kilometers beneath the surface. The more toxic the trace element is to the bacteria, the more efficiently the bacteria will dispose of that element by means of biomethylation (Klusman, personal communication). Evidence that suggests this can be seen in the Enzyme Leach anomalies over the Elmwood zinc deposit. The maximum Zn anomaly contrast is 5.5 times background, and the maximum anomaly contrast for Cd is 60 (Yeager et al.; Table l, this issue). Thus, biomethylation can explain the very subtle dispersion of metals like Zn, Cd, As, Sb, Cu, and Pb to the surface, over deep mineral deposits. It does not explain Enzyme Leach-Ba anomalies at the surface over deep occurrences of barite in the subsurface.
4.4.2 Oxidation cell hypothesisAs a deep mineral deposit or petroleum reservoir is slowly unroofed by erosion, it will
be easier for atmospheric oxygen to diffuse downward to the deposit. Whether the subtle oxidation of the deposit is accomplished by biological or inorganic reactions is irrelevant. Anytime a reduced substance is oxidized electrons are produced. In the case of a sulfide mineral, each sulfur atom will give up six electrons when it oxidizes from sulfide to sulfate. Thus, there is the possibility for generating an electrochemical cell with the accompanying current discharges. With an oxidizable body at depth, atmospheric oxygen at the surface, and a semipermeable material in the middle, all the elements are in place to form an electro chemical cell, with currents flowing from the reduced body to the source of oxygen.
Most published models for electrochemical cells in the crust can explain some of the features observed in these Enzyme Leach oxidation anomalies (Bolviken and Logn, 1975; Govett, 1976; Smee and Sinha, 1979; Sivenas and Beales, 1982a; Sivenas and Beales, 1982b; Smee, 1983; Govett et al., 1984; Govett and Atherden, 1987). For instance, base metal anomaly patterns often fit these models. However, these models do not explain oxidation suite halos. These models also call upon the reduced body to be an electronic conductor. Most of the reduced bodies, where Enzyme Leach evidence of oxidation has been found, are not electronic conductors. Therefore, earlier electrochemical models cannot explain many of the observations associated with Enzyme Leach oxidation anomalies. Futhermore, whatever model is employed, it has to explain similar empirical observations for both petroleum reser- voirs and deep mineral deposits.
For the most part, the reduced bodies are electrically resistive media. In the case of the reduced bodies that contain sulfide minerals, as the sulfides break down in the mineral bodies, the ionic strength of water within the body will increase, lowering electrical resi: Lance. But, they still are not "electronic conductors." The rock and overburden overlying these reduced bodies also are electrically resistive media. Consequently, one of these elec trochemical cells also would be a capacitor. The electrical potential (voltage) has to build until it is high enough to discharge across the resistive barrier. When the discharge occurs, electrons will flow from the reduced body in the subsurface toward the source of oxygen, the atmosphere, following the path of least resistance. Oxidation suite anomalies appear to form over the anodes of these cells. These anomalies are found at the surface, around the sides of the reduced bodies at depth. Therefore, contrary to previous models (for example: Govett, 1976; Sivenas and Beales, 1982a; Smee, 1983), the anode is not at the bottom of an electronicFile name: E:\Clark.DocumerUs\ENZYME-PrelimRel.DS5; Page: 25
Preliminary review copy.
conductor. Instead, there are probably multiple anodes, located around the sides of a reduced body, and if that body has a vertical extent (dipping vertically or at an angle), anodes are near the top end of the body. The active anodes form where the electrical current returns to the reduced body. Oxidation occurs at the anodes: sulfide oxidizes to sulfate, metal ions and H* form, and electrons are generated. Reduction reactions would characterize the cathodes, the points at which electron discharges would be leaving the reduced bodies. Central lows of oxidation anomalies probably occur over the cathodes of these electrochemical cells (Fig. 25).
Since that voltages that build up would be discharging through a resistive media, the electrochemical potentials that are involved are not small. Those voltage differentials would likely be sufficient to electrolyze water; i.e. the voltage differential between the anode and cathode would be at least 1.229 volts. Under the acid conditions that would accompany the breakdown of sulfide minerals, water could dissociate at the anodes into O2 and H+, while at the cathode H2 would form at the expense of H*. If chloride is being oxidized to C1 2 , then the electrical potential at the anode is at least 1.36 volts. The formation of a reducing gas, such as H2 , at the cathode would help explain the phenomenon of the central lows of oxida tion anomalies. Because of their buoyancy, H2 microbubbles would rise through ground water at a relative rapid rate. A weak flux of hydrogen or biogenic methane rising from the cathode as microbubbles would produce a "reduced chimney" above the deposit (Fig. 25). In the case of a petroleum reservoir, leakage of hydrocarbons from the reservoir, combined with H2 formed at an electrochemical cathode at the top of the reservoir, could produce the same effect. Such a column of reduced gas would alter the overlying rocks and soil. This would account for authigenic magnetite and pyrite being found over petroleum reservoirs. Fur thermore, a very subtle flux of hydrogen gas rising through a reduced chimney, given a sufficient amount of time, could reduce leachable As and Sb in the soils to forms which are not leachable, and cause the unusually low and uniform values for these elements found in some central lows. In a few cases, apical As and/or Sb anomalies that accompany an apical Au anomaly have been observed in what is otherwise a central low for the other members of the oxidation suite. Under acid conditions and in the presence of H2 , oxidized forms of As and Sb will be reduced to arsine and stibine (AsH3 and SbH3), both of which are gases under near surface conditions, and both of which would migrate with the flux of H2 . Thus, stibine and arsine could form at the cathode of an oxidizing mineral body and be swept to the sur face. Therefore, it would appear that As and Sb can be members of the oxidation suite of elements, as well as of a less well defined "hydride suite." Research needs to be done to determine if Au is mobile in a vapor phase in the presence of stibine or arsine.
4.4.3 Apical anomaly to oxidation halo to apical anomalyA mineral deposit or petroleum reservoir that is too deep to form an electrochemical
cell can develop an apical anomaly at the surface due to leakage of the reservoir or the very subtle destruction of sulfide minerals by bacteria. The chemistry of the apical anomaly would reflect the composition of the source at depth. In some cases, a barrier will retard oxidation. As the deposit or reservoir is unroofed over time, and the fugacity of O2 in the area of the reduced body will increase to a point that oxidation reactions and/or microbial activity inten sify to the point that electrical charges can develop and currents can discharge. Initially, because of mineralogical inhomogeneities within most sulfide bodies, oxidation cells would be small and irregularly distributed around the top of the reduced body. These would rapidlyFUe name: E:\Clirk.Documents\ENZYME-PrelimRel.DS5; Page: 26
Preliminary review copy.-tl grow and coalesce. At this early oxidation stage, anomalies of a few oxidation suite elements
(probably including Br and/or I) would develop at the surface, forming a rough halo around? the apical anomaly, and together making a combined anomaly. Spotty anodes would occuri around the sides of the deposit, and the cathode would expand to cover the top of the deposit.
A plume of reduced gases, probably including H2 , would develop over the cathode and pro-i duce a "reduced chimney" that would extend to the surface. As more of the rock overlying' the reduce body is removed by erosion (or the barrier blocking the flow of oxidation breaks
down) the intensity of the oxidation process would increase concurrent with increasing com plexity of the oxidation anomaly at the surface. The strength and frequency of subterranean electrical discharges would increase, and some of the metals liberated by the breakdown of sulfides that had been migrating into the apical anomaly, would begin to migrate laterally, pushed along by electrical potential, opposite to the flow of electrons, into the anomalous
; halo, and near to where the oxidation suite anomalies would be forming. The electrical dis charges would be analogous to miniature underground lightning strikes. They would not necessarily flow from the same point on the cathode or return to the same anode every time. Instead, they would move around, depending on where the greatest potentials had built up at
;. that point in time and upon differences in resistance of different pathways through the semi-\ permeable media above and around the reduced body.
Eventually the oxidation cell would evolve into a strong cell (Fig. 20), and the apical part of the anomaly would be gone. Up until this point, much of the oxidation of an underly-
r ing mineral deposit would be almost imperceptible to a mine geologist. At some point in the process of unroofing and oxidation, more intense weathering and possibly supergene enrich-
' ment would take place. As the top of a mineral deposit is consumed, anomaly patterns would\ shift dramatically. If a deposit underwent multiple periods of weathering and/or supergene
enrichment caused by stages of erosion, climatic shifts, and changes in the water table, there; could be multiple periods of oxidation-anomaly formation and destruction. Collapsed halosl (Fig. 23) or apical anomalies could form in more than one of these stages. Once the top of
the deposit is exposed at the surface or totally oxidized for some considerable depth below theJ surface, an apical anomaly is frequently all that is left (Fig. 15).j It must be kept in mind that all of this is a very slow process requiring many millions
of years, even if erosion is accelerated by geological events. The quantities of trace elements! that are mobilized to form apical anomalies and oxidation anomalies are incredibly small. If; it were not for the sensitivity and selectivity of the analytical methodology, most of these
anomalies would be impossible to detect. It is only when the reduced bodies are either rela tively close to the surface or an oxidation cell is extremely active that these anomalies can be
' quantified with conventional analytical techniques. Because only very small amounts ofmaterial are transported to the surface to form these anomalies, most Enzyme Leach anoma lies probably form at a very slow rate. In areas buried by glacial overburden, anomalies have apparently reformed since the last glaciation. In a project in Ecuador, it was found that anomalies were reforming subsequent to the landscape being buried by 10 to 30 meters of volcanic ash in historical times. However, the length of time that is required for these anomalies to equilibrate is not known.
4.5 Additional data and comparative dataFull sets of data plots the Clay Pit deposit, the Mag deposit, Sleeper, Rabbit Creek,
the Lik deposit, Indian Hills, Hillrnan, and Clearville can be obtained by sending an E-mail toFile name: E:\Clark.Documems\ENZYME-PrelimRel.DS5: Pige: 27
Preliminary review copy.
the author at [email protected]. Conventional analytical techniques were tested in many of the pilot studies mentioned in this paper. Analytical data using other methods at Clay Pit are the property of the U.S. Geological Survey. Aqua regia/ICP-OES data from the pilot study at the Rodeo and Meikle deposits are the property of Barrick Goldstrike. The oxalic acid leach and Kl+ascorbic acid leach data from the Sleeper pilot study can be obtained from the author by sending an E-mail to [email protected]. Comparative analytical data from the Happy Creek prospect are the property of Gerle Gold Company. Data for other analytical techniques at the Lik deposit are the property of the U.S. Geological Survey. Comparative analytical data for the RT deposit are the property of Codelco. Additional information regarding the Brazilian laterite study can be obtained form Dr. Peter Rogers, (E-mail address: [email protected]).
AcknowledgementsMany geologists and companies have contributed information to this paper, but they
cannot be mentioned here, because of the companies' need to keep their activities confiden tial. The author is deeply indebted to these people and to the following persons and companies.. Tom Nash collected the samples for the pilot study at the Sleeper Mine. Bill Utterbach, mine geologist at Sleeper, provided geological information. Amax Gold Corpora tion allowed access to the property for the study shown here and a follow-up study to confirm the first set of results. Maurice Chaffee collected the samples for the Rabbit Creek pilot study. Santa Fe Pacific allowed access to the Rabbit Creek property. Jim Erdman assisted with the sampling at Clay Pit and Mag, and Ed Kretchmer and Joe Foster provided geological information. Pinson Mining Company allowed access to the Clay Pit and Mag properties. The pilot studies at the Rodeo and Meikle deposits were performed by Barrick Gold Explora tion, and the work was done by Ed Wells, Alan Morris, and Terry Collins. Publication was allowed by Barrick Goldstrike, and geological interpretations for this paper was provided by Terry Collins. Sampling at Radomiro Tomic was performed by Alvaro Puig, Keith Harman and Mike Hawkins, and Codelco and Mt. Isa Mines allowed publication of the profiles. Reed Tompkins assisted with the collection of the samples in the Indian Hills pilot study. Reed Tompkins and Clay Durham provided geological information about the area. Eric Hoffman assisted with the sampling at the Hillman and Clearville oil fields. Owen Lavin and Jim Erdman assisted with sample collection over the Mike deposit, and Newmont Gold allowed access to the property. William Heck collected the Permian Basin samples and allowed pub lication of the data'. Karen Kelley collected the samples for the pilot study at the Lik deposit. Peter Rogers performed the pilot study of the lateritized lode-Au deposit in Brazil. Stan Hoffman collected the samples for the Happy Creek pilot study, and Ray Hrkac of Gerle Gold Ltd. allowed publication of the data.
References Bajc, A......Bolviken, B. and Logn, O., 1975, An electrochemical model for element distribution around
sulphide bodies. In: I.L. Elliott and W.K. Fletcher (Editors), Geochemical Exploration1974. Elsevier, Amsterdam, pp. 631-648.
Chao, T.T., 1984, Use of partial dissolution techniques in geochemical exploration: Journalof Geochemical Exploration, vol. 20, p. 101-135.
Church, S.E., Mosier, E.L., and Motooka, J.M., 1987, Mineralogical basis for the interpre-File name: E:\Clark.Documems\ENZYME-PrelimRel.DS5; Pige: 28
Preliminary review copy.- t
tation of multielement (ICP-AES), oxalic acid, and aqua regia partial digestions of stream sediments for reconnaissance exploration eeochemistry: Journal of Geochemical Explo-
-j ration, vol. 29, p. 207-233.r Clark, I.R., Meier, A.L., and Riddle, G., 1990, Enzyme leaching of surficial geochemical
samples for detecting hydromorphic trace-element anomalies associated with precious- metal mineralized bedrock buried beneath glacial overburden in northern Minnesota: in:
i Gold '90, Society of Mining Engineers, Chapter 19, p. 189-207.Clark, I.R., 1993. Enzyme-induced leaching of B-horizon soils for mineral exploration in
areas of glacial overburden. Trans. Instn. Min. Metall. (Sect. B: Appl earth sci) 102- B19-B29.
Clark, I.R., 1995, Method of geochemical prospecting. United States Patent 5,385,827, 20"' PP-
i Filipek, L.H., Chao, T.T., and Carpenter, R.H., 1981, Factors affecting the partitioning of Cu, Zn, and Pb in boulder coatings and stream sediments in the vicinity of a polymetallic
; sulfide deposit: Chemical Geology., vol. 33, p. 45-64.Filipek, L.H. and Theobald, P.K., Jr., 1981, Sequential extraction techniques applied to a
porphyry copper deposit in the Basin and Range province: Journal of Geochemical ' Exploration, vol. 14, p. 155-174. li- Govett, G.J.S., 1976, Detection of deeply buried and blind sulphide deposits by measurement
of H* and conductivity of closely spaced surface soil samples. J. Geochem. Explor., 6: "I 359-382.
Govett, G.J.S., Dunlop, A.C. and Atherden, P.R., 1984, Electrogeochemical techniques in x deeply weathered terrain in Australia. J. Geochem. Explor., 21: 311-331. ) Govett, G.J.S. and Atherden, P.R., 1987, Electrogeochemical patterns in surface soils - !' detection of blind mineralization beneath exotic cover, Thalanga, Queensland, Australia.
J. Geochem. Explor., 28: 201-218. i Gunsilius, H. Urland, W., Kremer, R., 1987, Darstellung von selten-erd-trichloriden uber
chemischen transport mit aluminiumtrichlorid. Z. Anorg. Allg. Chem., 550: 35-40. Hall, G.E.M......
j Jackson, R.G., 1995, The Application of Water and Soil Geochemistry to Detect Blind Min eralization in Areas of Thick Overburden. Ontario Geol. Survey, Open File Report 5927,
? 151 p. J Klusman, R. W., 1993, Soil Gas and Related Methods for Natural Resource Exploration.
John Wiley and Sons, 483 p.'l Murase, K., Shinozaki, K., Machida, K., and Adachi, G., Mutual separation characteristics
, J, and mechanism for lanthanoid elements via gas phase complexes with alkaline metaland/or aluminium chlorides. Bull. Chem. Soc. Jpn., 65: 2724-2728.
Riddle, G.O., Meier, A.L., Motooka, J.M., Erlich, O., Clark, J.R., Saunders, J.A., Fey, Vi D.L., and Sparks, T., 1992, Analytical results for B-horizon soil samples, from the
International Falls and Roseau 1 0 X2 0 quadrangles, Minnesota/Ontario: U.S. Geological ' Survey, Open-File Report 92-721, 10 p. and 3.5-inch high-density computer disk.
J Robinson, W.O., 1929, Detection and significance of manganese dioxide in the soil: SoilScience, vol. 27, no. 5, p. 335-350.
l Rogers, P.J. and Lombard, P.A., this issue, Exploring in glaciated terrains: Application of Enzyme Leach to deep cover prospecting at the Jubilee Pb-Zn deposit, Nova Scotia, Canada. J. Geochem. Expl......
: File name: E:\Clark.Documents\ENZYME-PrelimRel.DS3; Page: 29
f i
Preliminary review copy.
Rose, A. W. and Suhr, N.H., 1971, Major element content as a means of allowing for back ground variation in stream-sediment geochemical exploration, in: Boyle, R.W., ed., Geochemical Exploration: Canadian Institute of Mining and Metallurgy, Spec. Vol 11 p. 587-593.
Sandy, J., 1987, Fracture control of surface geochemical anomaly patterns. Bull. Assoc. of Petroleum Geochemical Explorationists, 3, 1.
Sikka, D., 1959, A radiometric survey of the Redwater Oilfield, Alberta, Canada. McGill University, Dept. of Geol. Sci., Ph.D. thesis, 218 p.
Sivenas, P. and Beales, F.W., 1982, Natural geobatteries associated with sulphide ore depos its, I. Theoretical studies. J. Geochem. Explor., 17: 123-143.
Sivenas, P. and Beales, F.W., 1982, Natural geobatteries associated with sulphide ore depos its, II. Field studies at the Virburnum Trend, southeast Missouri, U.S.A.. J. Geochem. Explor., 17: 145-160.
Smee, B.W. and Sinha, A.K., 1979. Geological, geophysical and geochemical considerations for exploration in clay-covered areas: a review. CIM Bul., April 1979, pp. 67-82.
Smee, B.W., 1983. Laboratory and field evidence in support of the electrogeochemically enhanced migration of ions through glaciolacustrine sediment. J. Geochem. Explor., 19: 277-304.
Tissot, B.P., and Welte, D.H., 1978, Petroleum Formation and Occurrence. Springer- Verlag, 538 p.
Tompkins, R., 1990, Direct location technologies: a unified theory. Oil and Gas Jour., Sept. 24, 1990, pp. 126-134.
Viets, J.G., Clark, I.R., Campbell, W.L., 1984, A rapid, partial leach and organic separation for the sensitive determination of Ag, Bi, Cd, Cu, Mo, Pb, Sb, and Zn in surface geo logic materials by flame atomic absorption. J. Geochem. Explor., 20: 355-366.
Yeager, J. R., Clark, J.R., Mitchell, W., and Renshaw, R., (this issue), Enzyme Leach anomalies associated with deep Mississippi Valley-type zinc ore bodies at the Elmwood Mine, Tennessee. J. Geochem. Expl.
5. Appendix - Discussion of Sample Collection and Sample Handling5.1 Sample collection
Although the Enzyme Leach can be used as a partial-analysis method for virtually any surficial geological material, the sample media most commonly analyzed with this method is ^-horizon soils. Research to date indicates that amorphous MnO2 in soils is most abundant in the B horizon. This horizon is the most chemically active part of the soil, with regard to the formation of oxide coatings on mineral grains. Studies in both arid and humid climates indi cate that the sampler should be careful to collect soil samples from the B horizon when at all possible.
The following information is based on observations from studies in glacially-buried terrane in northern Minnesota and Canada, desert pediments in Nevada, areas of extensive overburden in South America, test sites in the Colorado Front Range, and over oil fields in western Wyoming and southeastern Texas. Soil horizons vary in appearance and depth, even within relatively small areas. It should be emphasized that the samplers should be collecting material from a consistent soil horizon, rather than a consistent depth. Samplers should be encouraged to expose the soil profile whenever they encounter soil zoning that varies fromFile name: E:\Clark.Documents\ENZYME-PrelimRel.DS5; Pige: 30
Preliminary review copy.
previous observations. Before beginning, it is a good idea to observe soils profiles in ditches and trenches in and near the area to be sampled. The best potential sample sites are those that appear to be undisturbed and that have mature vegetation growing on and around the site.
; Samples collected from trenches and pit cuts are also good, as long as a fresh surface isscraped on the face of the soil profile to be sure that you are collecting freshly exposed mate rial. Ditch banks, on the side away from infrequently used roads, under most circumstances
i can also be good sample sites, after digging into the bank to expose fresh material. Thesampler should observe the conditions at such sites and make a judgement about the potential for contamination or of excessive disturbance. Road fill (new or old) is not usable sample material. Also, roads are often contaminated with a variety of pollutants that can linger for centuries. Plowed fields can provide usable samples, if an undisturbed site is not available. It is better to move a sample site a relatively short distance rather than to use a bad site just because it is at the specified spot.
5.1.1 Desert soils.There is an adage to the effect that desert soils are not zoned (azonal). In many cases
this is not true. The appearance of the horizons is different from soils in humid climates, but 1 they are still frequently zoned. The current surface on many desert pediments is more than l one million years old, which is more than sufficient time for soil horizons to develop. Rela
tively little organic matter is found in ^-horizon soils in desert climates. The A horizon is "7 typically a light-gray to light-grayish-tan, loose, fine sand to silt. Descending through the soil , "i profile, the B horizon begins where the soil is more cemented and slightly darker in color,
often becoming slightly more brown than the overlying loose material. The brown color \ often becomes darker farmer down into the B horizon, but in other cases, the color difference ' between the A and B horizons is almost imperceptible. Where the color changes are minimal,
a key criteria is that the cementing of the grains in the B horizon often produces a weak l blocky fracture that is absent in the A horizon. In areas that have a history of previous min- 5 ing activity, the upper centimeter of the A horizon can be highly contaminated with many
trace elements. Rarer elements, such as gold, can be enriched by as much as 10- to 100-times ! background. The A horizon should be scraped from the area around the spot to be sampled
•' for a radius large enough to prevent this contaminated material from trickling into the samplematerial.
v In areas of extreme aridity, such as the Atacama desert of South America, the sampler ~ often will not find soil horizons. At most locations in that region the best level to sample is
3 25 cm to 40 cm beneath the surface. Most of the projects undertaken in deserts to date have I used "JS-horizon" soils collected above the caliche layer, where something resembling a B
horizon can be identified. In the Atacama desert a fine granular, almost sugary textured,reddish layer will often be encountered just above the caliche layer. This reddish color
; results from oxide coatings on granular selenite that has formed in the soil. The presence ofgranular selenite in the soil does not detract from the results, and this layer is a very usable
i sample media. Recent aeolian material deposited directly on top caliche is not a suitable ] media for the Enzyme Leach.
:i 5.1.1.1 Caliche[ j Do not sample from the caliche layer or immediately beneath it. Caliche will produce
extremely erratic Enzyme Leach data, with numerous, unreproducible false anomalies.j File name: E:\Clark.Documtnts\ENZYME-PrelimRel.DS5; Page: 31
Preliminary review copy.
Where caliche comes too close to the surface to collect a sample, move the sample site a short distance or abandon it.
5.1.2 Humid climate soils.Sample sites with the best developed soil horizons are usually found in groves of trees.
In northern climates, aspen groves are the best. The A horizon consists of an upper humus layer, a dark layer of mixed organic and mineral matter, and there may be a bleached mineral layer at the bottom, the A0 horizon. The bleached layer results from the reducing action of the overlying organic-rich layers, which dissolves oxide coatings on mineral grains. The top of the B horizon is the point below which there is no organic matter and where oxide coatings are found on mineral grains. Iron oxide coatings typically give 5-horizon soils colors that are some shade of brown or red (dark brown, medium brown, light brown, brick red, tan, orange, etc.). Where the A horizon is quite thick, such as around bogs, there is often a faintly gray layer beneath the bleached layer of the A horizon. The faint gray color is due to manganese oxides, and this material is usable B horizon, if a darker colored 5-horizon layer is not available. In a humid, forested area all the material comprising the A horizon of the soil (decaying leaf litter, humus, and organic-rich mineral layers) should be scraped away to reveal the B horizon. The sample is collected from 10 to 30 centimeters into the top of the B horizon, /i-horizon contamination of 5-horizon samples should be avoided as much as pos sible.
When driving probes through bogs, a grayish-blue clay layer is often found under the peat. This material is analogous to a fire clay under a coal seam. (Given a few million years, that is what it would be.) It is chemically different from the glacially derived material below it, and it will give different background values for a number of elements determined with the Enzyme Leach.
5.1.3 Hard pan at the surfaceIn some areas either caliche or laterite is at the surface or so close to the surface that a
usable sample can not be collected. There are cases where loose wind blown silt lies directly on top of the caliche. This material cannot be used as a sample media, since it has not been in place long enough to begin to equilibrate with dispersion processes from the underlying bedrock. In order to collect a usable sample in areas like these, it will be necessary to either dig through or drill through the hard pan. The distance below the hard pan layer that you must go to get a valid sample will vary from area to area, and pilot studies must be carried out in each new situation to determine the optimum sampling depth.
5.1.4 Mountain soils and glacially scoured terrane.Due to the rapid rate of mechanical weathering in mountainous areas, there are locali
ties where the soil is truly azonal. Also, during Pleistocene glaciation, the regolith was completely removed in many areas and a chemically mature soil profile has not had sufficient time to redevelop. In such cases the sampler should dig deep enough to obtain soil material that is as free of organic matter as possible.
5.1.5 Rock-chip sampl ingIn areas where barren volcanic or sedimentary cover rock is all that is present at the
surface, an Enzyme Leach survey can still be done with limitations. Look for joints andFile name: E:\CUrk.Documcnts\ENZYME-PnlimRel.DS5; Page: 32
Preliminary review copy.
] fractures that contain oxide coatings just beneath the surface. Use a rock hammer to break up the rock so that you can collect chips from within the fractures. Make sure that the chips you collect have as much of that fracture surface as possible. Sample handling is identical to that
i for soils. In the laboratory, the chips are dropped into a clean jaw crusher to reduce them to millimeter-scale material. The weathered surfaces from the chips tend to end up in the fines that come out of the crusher. The sample is then screened for the minus-60-mesh fraction and treated as if it were a soil. The Enzyme Leach data from these rock-chip samples have sub-
1 stantially reduced anomaly contrast compared to soils from the same region, but the anomaly morphologies are the same.
5.2 Sample handling, 5.2.1 Quantity of sample to collectj Samples should consist of about 100 to 200 grams of material depending on the fine
ness of the soil. Coarser soils require more material to assure adequate sieved sample material for analysis.
5.2.2 Sample bags7 There has been a fair amount of discussion about the type of bags to use with Enzyme J Leach samples. Most sample bags are suitable. Polyolefin well cutting bags work very well.
They are free of contamination and they allow the samples to dry through the porous material. "•~ Polyethylene bags and plastic sandwich bags work well. They are free of contamination, but J wet samples will not dry in them, requiring extra sample handling to ensure that the samples
dry properly. Craft paper soil-sample bags are sturdy when wet samples are placed in them, l and they allow the samples to dry through the paper. Some people are concerned about trace J element contaminants in the paper getting into the samples. Several tests have been run in
which the outer l mm of a clay-rich sample that had been stored wet in a craft paper bag was j scraped off and analyzed separately. There was not a discernible difference between the rind
* i in contact with the paper and the core of the sample. If the samples are damp, then the mass flow is out of the sample, through the paper, and into the atmosphere, the wrong direction to
j take contaminants from the paper and carry it into the sample. Common paper bags tear eas ily, especially when damp, and are not suitable collecting soils for any type of analysis.
l 5.2.3 Sample drying"* If at all possible, the samples should be air dried. If circumstances require the use of
? a drying oven, the temperature should not exceed 400C, and the drying time should not be j longer than is necessary to dry the sample. Too high a drying temperature alters the chemis-* try of the amorphous manganese dioxide coatings and drives out the volatile halogens and ^ halide compounds (Fig. 26). At the same time the leachable amounts of some metals like Cu
\ can increase (Fig. 26). David Cohen (personal communication) attributes this increase in leachable metals to the collapse of amorphous coatings as H20 is driven out. This would
j result in metals that are not compatible with the collapsing structure being forced to the out- J side of the material, where they would be more readily dissolved by the Enzyme Leach.
Most laboratory drying ovens are not suitable for drying Enzyme Leach soil samples.-1 They are designed for drying laboratory glassware, and their thermostats are designed for• j operating at substantially higher temperatures than 40" C. The interval between heating and
cooling cycles of the thermostats can be as large as 15 0 C. If one of these cheaply thermo-. j File name: E:\Clark.Documents\ENZYME-PrtlimRel.DS5; Pi*e: 33i ^*.j
•''l
Preliminary review copy.
stats sticks during a heating cycle, the temperature can quickly rise to 60" C, or more. Forced-air drying ovens are prone to do the most damage. Although they do have a more uniform temperature distribution in the oven, the heat transfer rate to the samples is much greater with moving heated air than for slowly convecting air. Moving air is also going to disperse volatiles in the samples at a much higher rate than is stagnant air. The reader should look at Fig. 26 and then make a decision about whether or not to use a drying oven If in doubt, let the service provider perform the sample preparation, or air dry the samples. They know which sieve sizes to use, and what steps must be followed to maintain the geochemical integrity of the sample material.
Pulverized samples have been "cooked" by the heat that is generated in the grinding mill. The grinding process also destroys the coating on mineral grains. Samples which were collected previously for some other purpose and were pulverized during preparation are not suitable for analysis with the Enzyme Leach.
5.2.4 Sample handling in the fieldWhen presented with this information about not overheating samples, many geologists
become quite concerned, because the surface temperature on a hot day in many deserts often goes well above 50 0 C. Earth is an outstanding thermal insulator. Ten centimeters below the surface the temperature will be approaching constant level that is much cooler and will be fairly consistent from day to day. Most samples are collected at 30 cm or greater depth.
Once the samples are collected, they should not be stored in a place where the tem perature can rise much above 40" C for several hours. Enclosed trailers and camper shells that are sitting still in the sun are a definite hazard. Samples should be kept in the shade if it is a hot sunny day. Also, samples that are stored together in a pile have greater thermal iner tia and will heat up slower than samples that are laid out individually on the ground.
File name: E:\Clark.Documents\ENZYME-PrelimRel.DS5; Page: 34
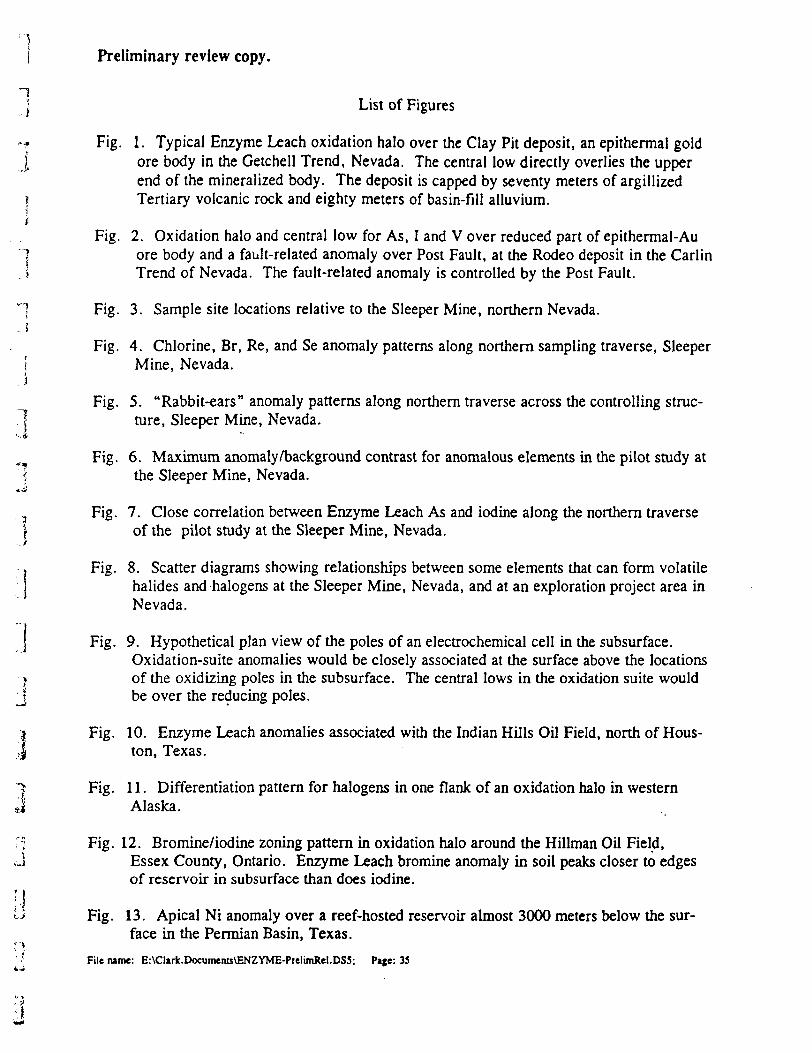
Preliminary review copy.
lJ List of Figures
-•f Fig. 1. Typical Enzyme Leach oxidation halo over the Clay Pit deposit, an epithermal gold j ore body in the Getchell Trend, Nevada. The central low directly overlies the upper
end of the mineralized body. The deposit is capped by seventy meters of argillizedi Tertiary volcanic rock and eighty meters of basin-fill alluvium.f t
Fig. 2. Oxidation halo and central low for As, I and V over reduced part of epithermal-Au"j ore body and a fault-related anomaly over Post Fault, at the Rodeo deposit in the Carlin. i Trend of Nevada. The fault-related anomaly is controlled by the Post Fault.
H Fig. 3. Sample site locations relative to the Sleeper Mine, northern Nevada. A
Fig. 4. Chlorine, Br, Re, and Se anomaly patterns along northern sampling traverse, Sleeper I Mine, Nevada.
Fig. 5. "Rabbit-ears" anomaly patterns along northern traverse across the controlling struc- ~l ture, Sleeper Mine, Nevada.
Fig. 6. Maximum anomaly/background contrast for anomalous elements in the pilot study at \ the Sleeper Mine, Nevada.
, Fig. 7. Close correlation between Enzyme Leach As and iodine along the northern traverse j of the pilot study at the Sleeper Mine, Nevada.
, Fig. 8. Scatter diagrams showing relationships between some elements that can form volatile j halides and halogens at the Sleeper Mine, Nevada, and at an exploration project area in
Nevada.
j Fig. 9. Hypothetical plan view of the poles of an electrochemical cell in the subsurface.Oxidation-suite anomalies would be closely associated at the surface above the locations
? of the oxidizing poles hi the subsurface. The central lows hi the oxidation suite would J be over the reducing poles.
j Fig. 10. Enzyme Leach anomalies associated with the Indian Hills Oil Field, north of Hous- J ton, Texas.
"l Fig. 11. Differentiation pattern for halogens in one flank of an oxidation halo in western J Alaska.
o Fig. 12. Bromine/iodine zoning pattern in oxidation halo around the Hillman Oil Field, J Essex County, Ontario. Enzyme Leach bromine anomaly in soil peaks closer to edges
of reservoir in subsurface than does iodine.;j*-' Fig. 13. Apical Ni anomaly over a reef-hosted reservoir almost 3000 meters below the sur
face hi the Permian Basin, Texas.l File name: E:\CUrk.Documents\ENZVME-PreIimRel.DS5; P*ge: 35
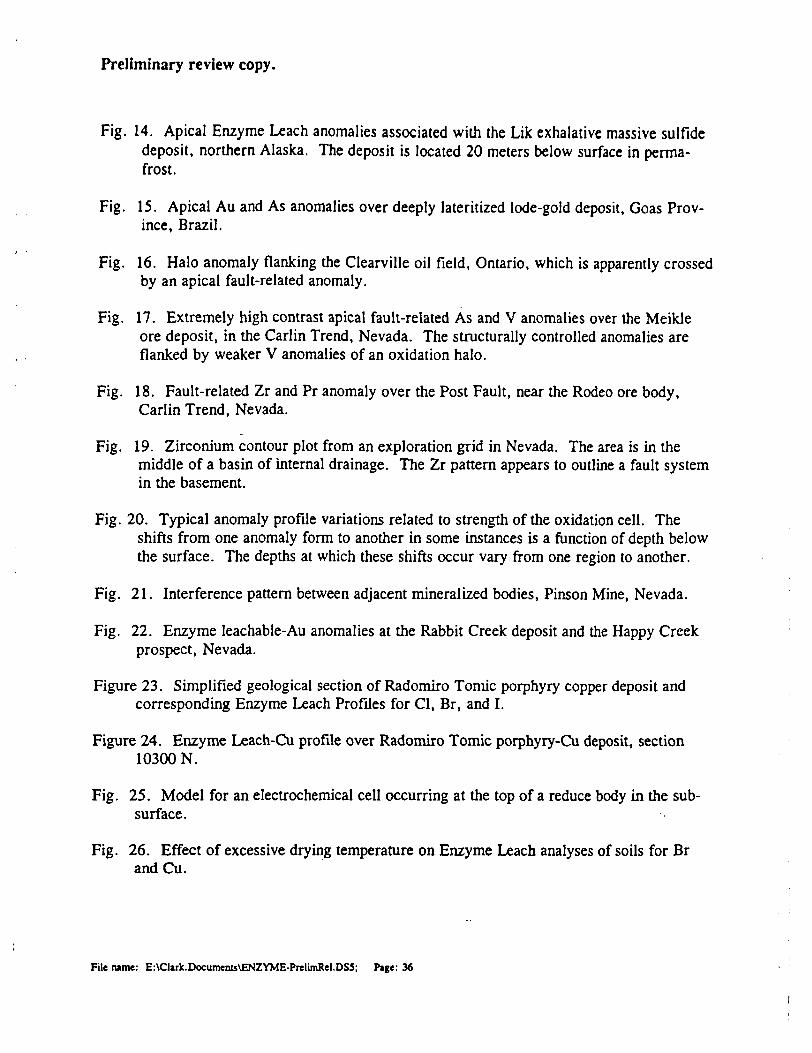
Preliminary review copy.
Fig. 14. Apical Enzyme Leach anomalies associated with the Lik exhalative massive sulfide deposit, northern Alaska. The deposit is located 20 meters below surface in perma frost.
Fig. 15. Apical Au and As anomalies over deeply lateritized lode-gold deposit, Goas Prov ince, Brazil.
Fig. 16. Halo anomaly flanking the Clearville oil field, Ontario, which is apparently crossed by an apical fault-related anomaly.
Fig. 17. Extremely high contrast apical fault-related As and V anomalies over the Meikle ore deposit, in the Carlin Trend, Nevada. The structurally controlled anomalies are flanked by weaker V anomalies of an oxidation halo.
Fig. 18. Fault-related Zr and Pr anomaly over the Post Fault, near the Rodeo ore body, Carlin Trend, Nevada.
Fig. 19. Zirconium contour plot from an exploration grid in Nevada. The area is in themiddle of a basin of internal drainage. The Zr pattern appears to outline a fault system in the basement.
Fig. 20. Typical anomaly profile variations related to strength of the oxidation cell. Theshifts from one anomaly form to another in some instances is a function of depth below the surface. The depths at which these shifts occur vary from one region to another.
Fig. 21. Interference pattern between adjacent mineralized bodies, Pinson Mine, Nevada.
Fig. 22. Enzyme leachable-Au anomalies at the Rabbit Creek deposit and the Happy Creek prospect, Nevada.
Figure 23. Simplified geological section of Radomiro Tomic porphyry copper deposit and corresponding Enzyme Leach Profiles for CI, Br, and I.
Figure 24. Enzyme Leach-Cu profile over Radomiro Tomic porphyry-Cu deposit, section 10300 N.
Fig. 25. Model for an electrochemical cell occurring at the top of a reduce body in the sub surface.
Fig. 26. Effect of excessive drying temperature on Enzyme Leach analyses of soils for Br and Cu.
File name: E:\Clark.Documents\ENZYME-PrelimRel.DS5; Page: 36
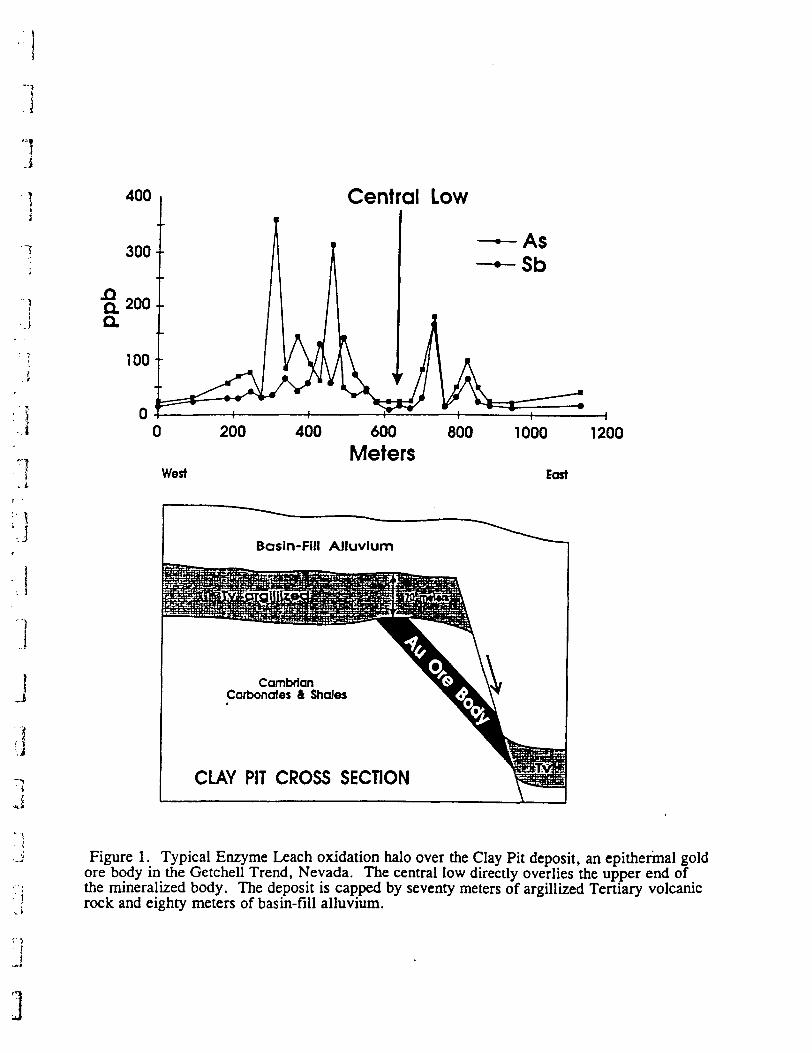
j •J
.i
..l
j
J
Central Low
O 200
West
400 600Meters
800 1000 1200
East
Basin-Fill Alluvium
Cambrian Carbonates 4 Shales
CLAY PIT CROSS SECTION
Figure 1. Typical Enzyme Leach oxidation halo over the Clay Pit deposit, an epithermal gold ore body in the Getchell Trend, Nevada. The central low directly overlies the upper end of the mineralized body. The deposit is capped by seventy meters of argillized Tertiary volcanic rock and eighty meters of basin-fill alluvium.
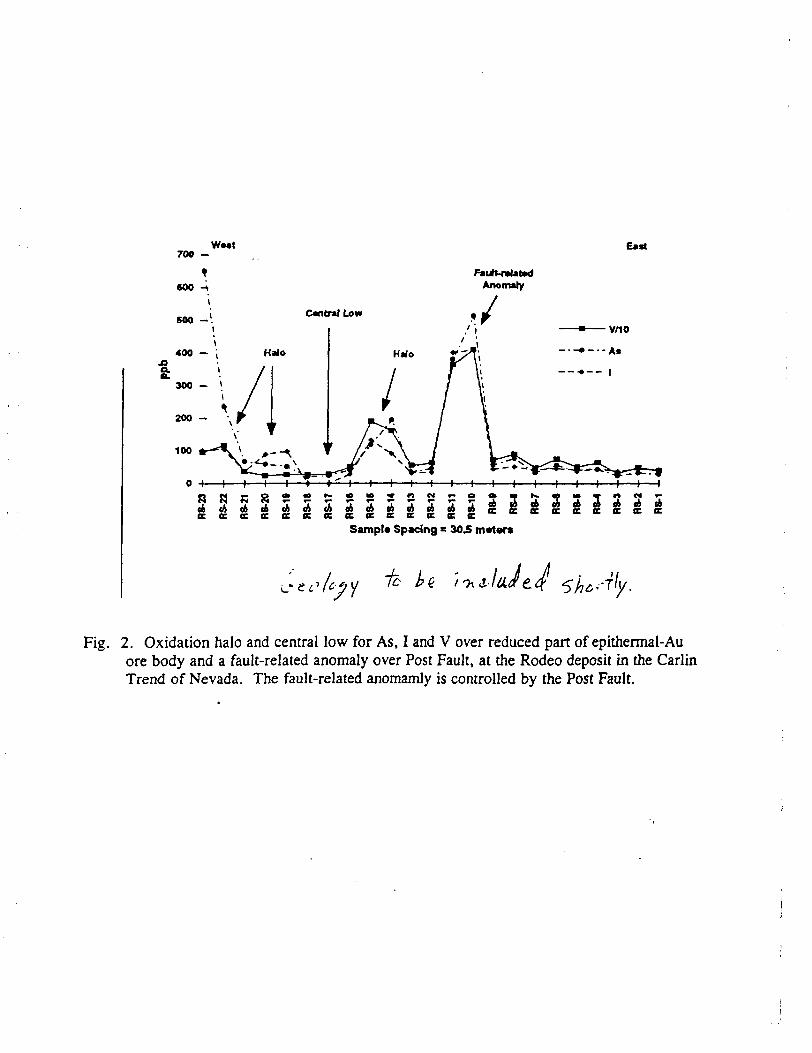
700 -
t600
W**t East
Fautt-nUted Anomaly
Sampl* Spacing B 30^ meters
Fig. 2. Oxidation halo and central low for As, I and V over reduced part of epithermal-Au ore body and a fault-related anomaly over Post Fault, at the Rodeo deposit in the Carlin Trend of Nevada. The fault-related anomamly is controlled by the Post Fault.
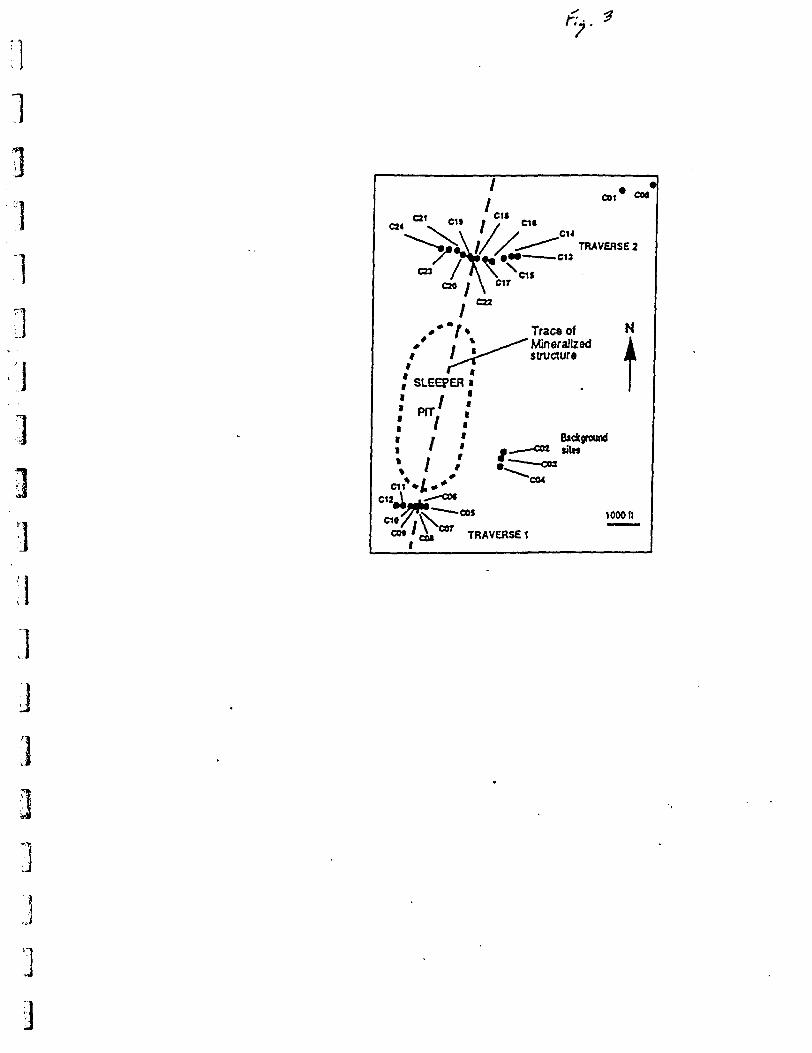
l
1
O
3
;J
C34C14
Traca ofMineralized structure
cat
TRAVERSE 2
N
tBackground site*
'CM
-COl 1000(1
TRAVERSE 1
j
] J33
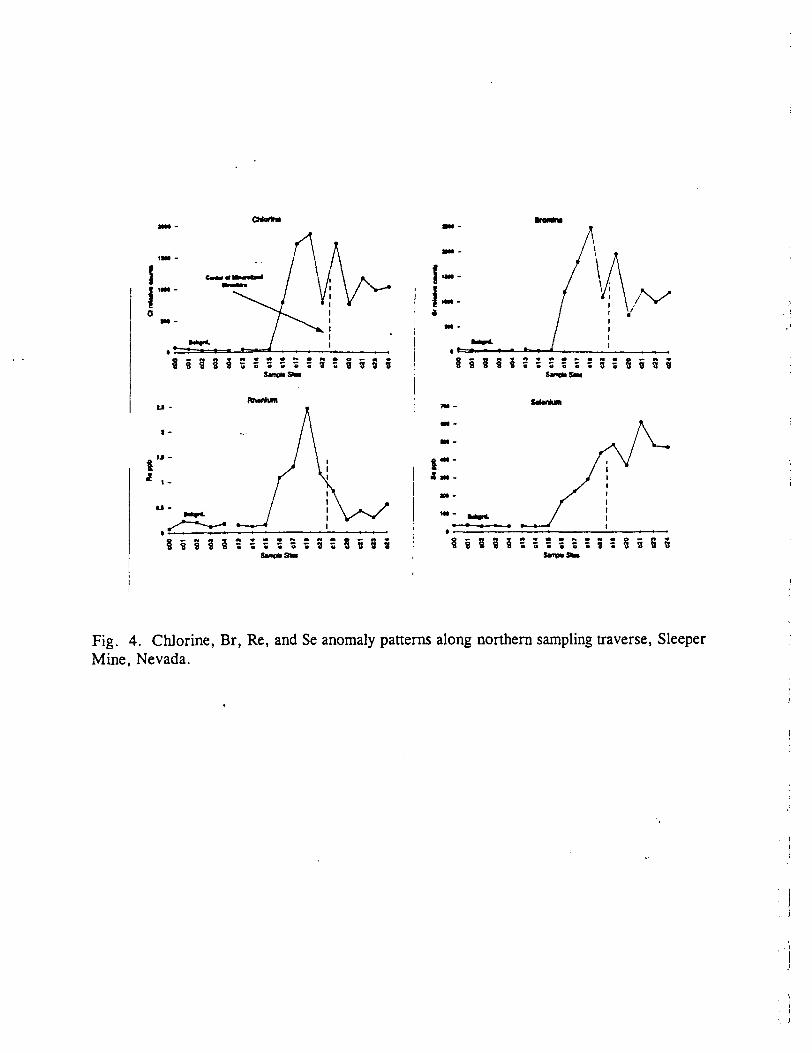
CMortn*
tl
S*i*M9M
i fcHa
l 2:
SanvkSM
Fig. 4. Chlorine, Br, Re, and Se anomaly patterns along northern sampling traverse, Sleeper Mine, Nevada.
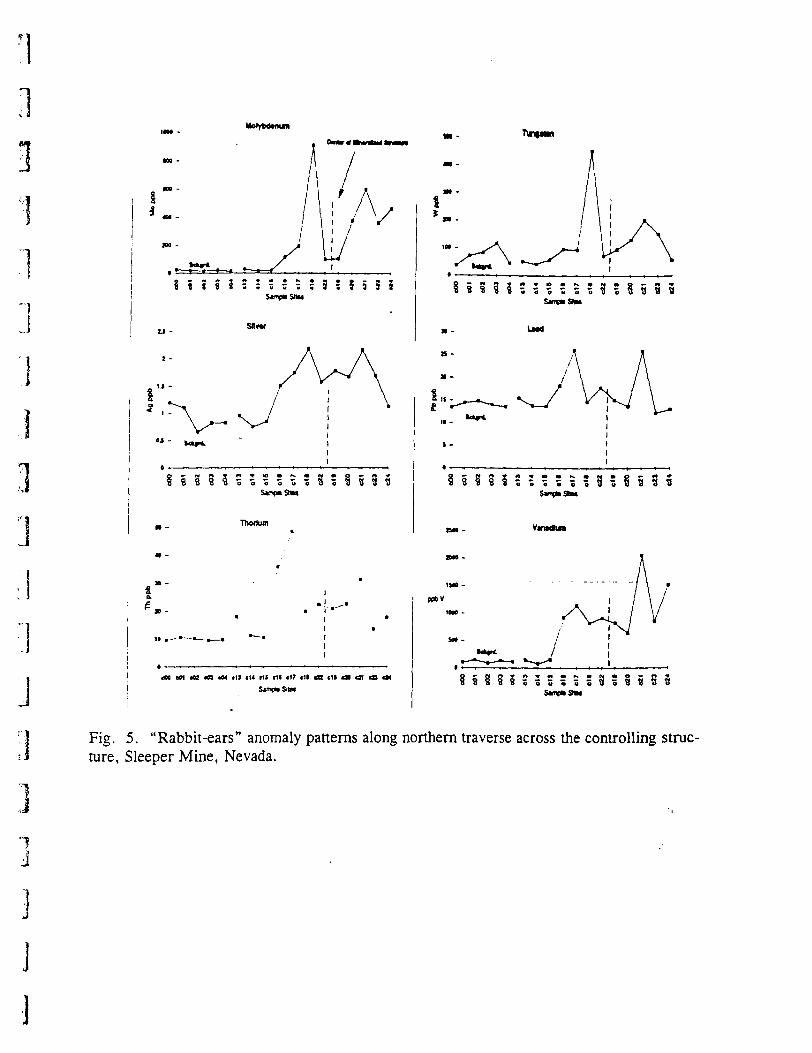
1
1
l
3
fenwtfl
8 i ; 5 i 5 -. ; 3 J 5 5 3 i
SUnr
j
ax an aa aa au t\] at tu cii cir di IB di o en ea c*
Fig. 5. "Rabbit-ears" anomaly patterns along northern traverse across the controlling struc ture, Sleeper Mine, Nevada.
l
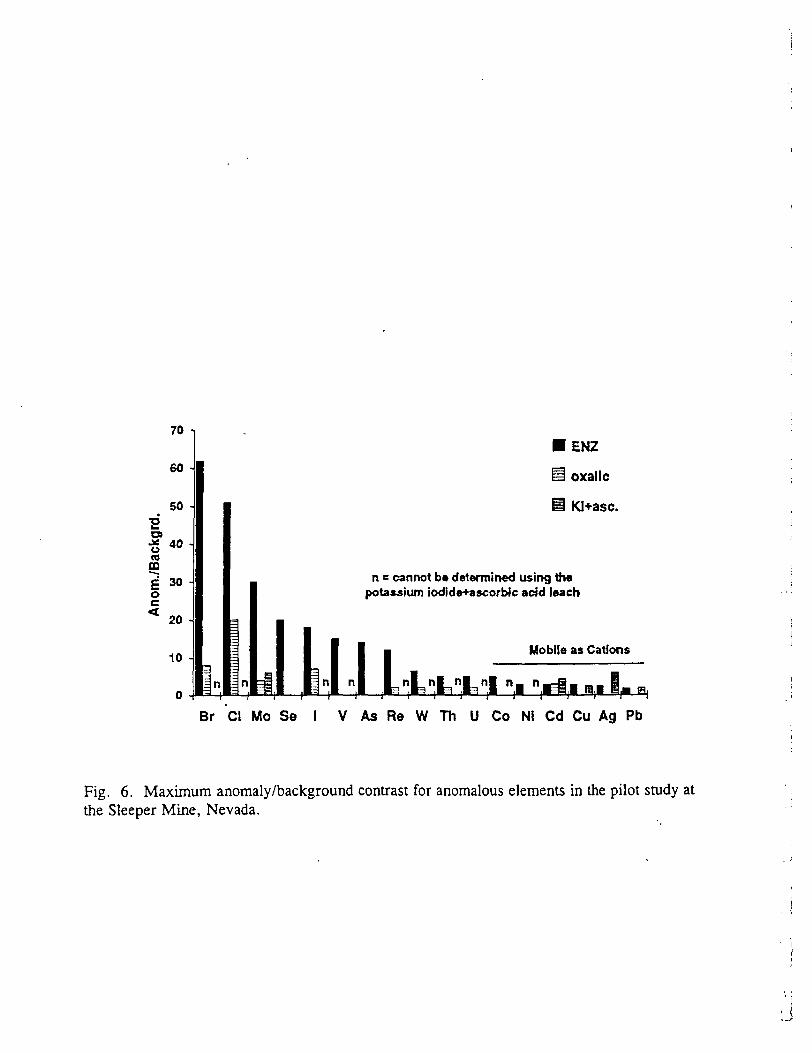
70 -i
60 -
50 -"2CD•g 40-mffig 30 -0c"* 20 -
10 -
ft .
m^
|n
B
ENZ
oxalic
Kl+asc.
n s cannot ba determined using the
2
|
\ n
potassium iodide+ascorbic acid leach
11 1 1 l a Mobile
li hnl 1 1 1 nl nl nl ^a4v .1 .li ,l ,l ms ma ma *s .1 .1 ,B^
as Cations
• n.L,
Br CI Mo Se l V As Re W Th U Co HI Cd Cu Ag Pb
Fig. 6. Maximum anomaly/background contrast for anomalous elements in the pilot study at the Sleeper Mine, Nevada.
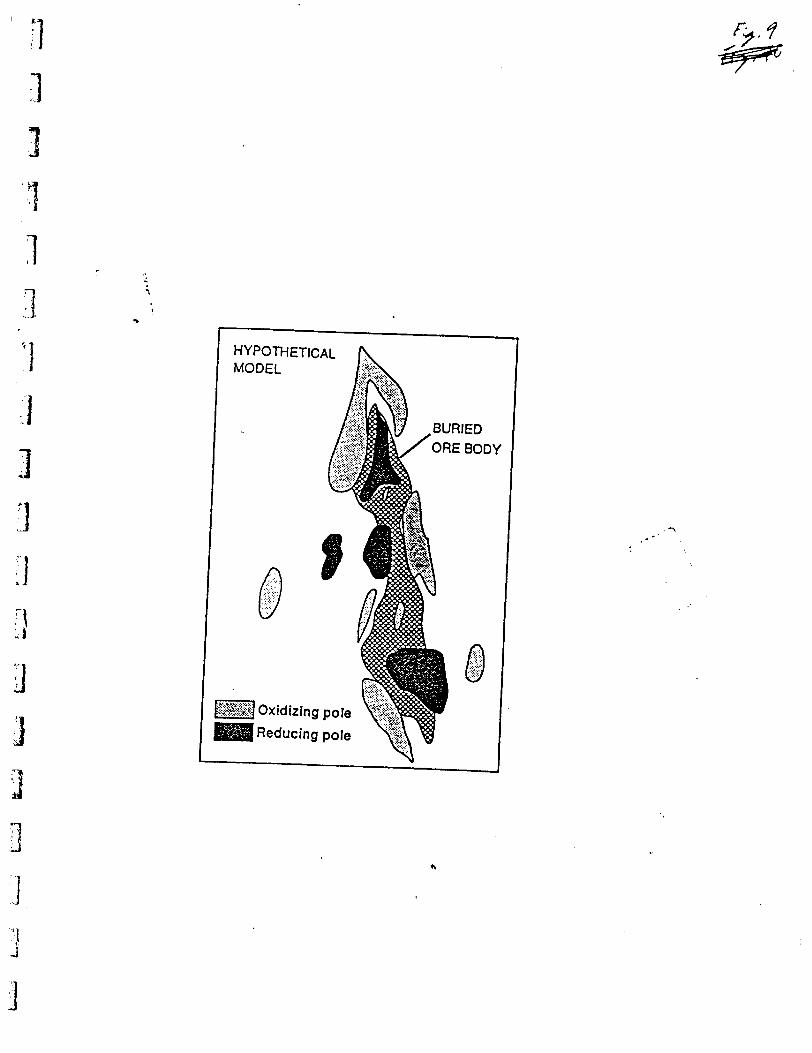
n o11
3 Of]
HYPOTHETICAL MODEL
l Oxidizing pole Reducing pole
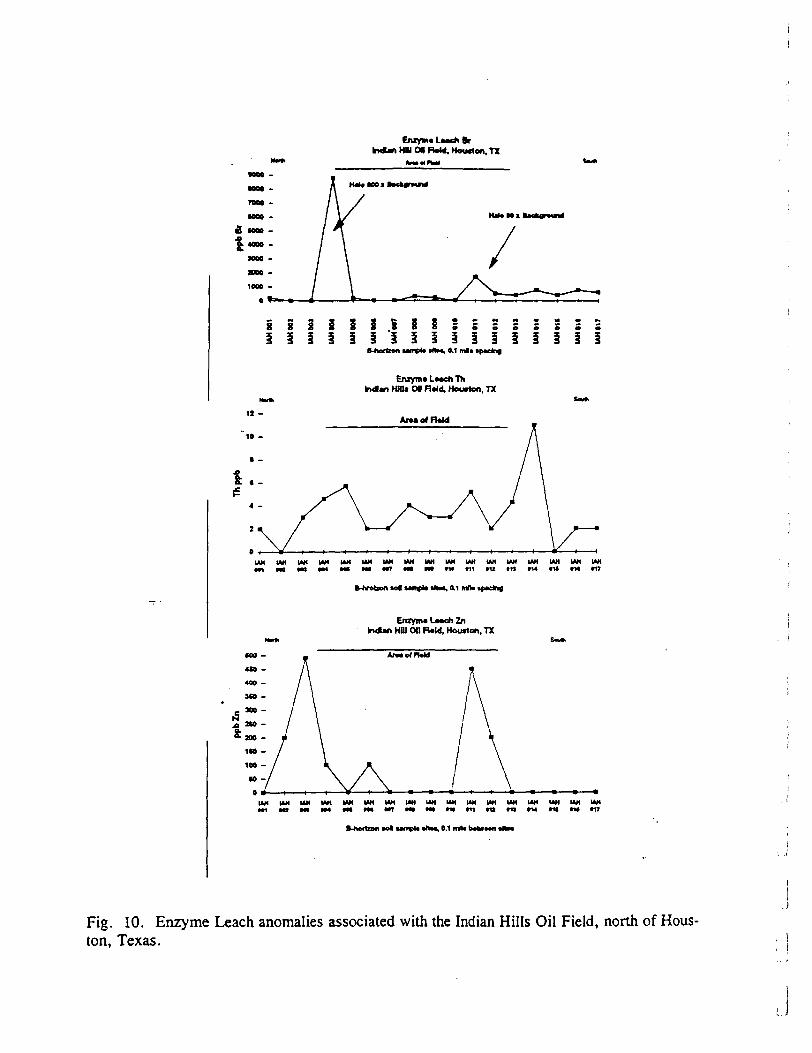
Eflzym* U*ch Br Man Nil O* FMd. Howton.'
iSiSSSSSSssssssss iiiiiiiiiiiiiiiii
B-hertzon Minpt* iftM, 0.1 mfl* i
Enryrn* L**eh Th Indian Km* OC Reid, Hoodoo, TX
B-hrofaon Ml unpto "to*. O, l irtte tracing
Enzym* L**ch Zn hdUn HDI Oil R.W, Houston, TX
Fig. 10. Enzyme Leach anomalies associated with the Indian Hills Oil Field, north of Hous ton, Texas.
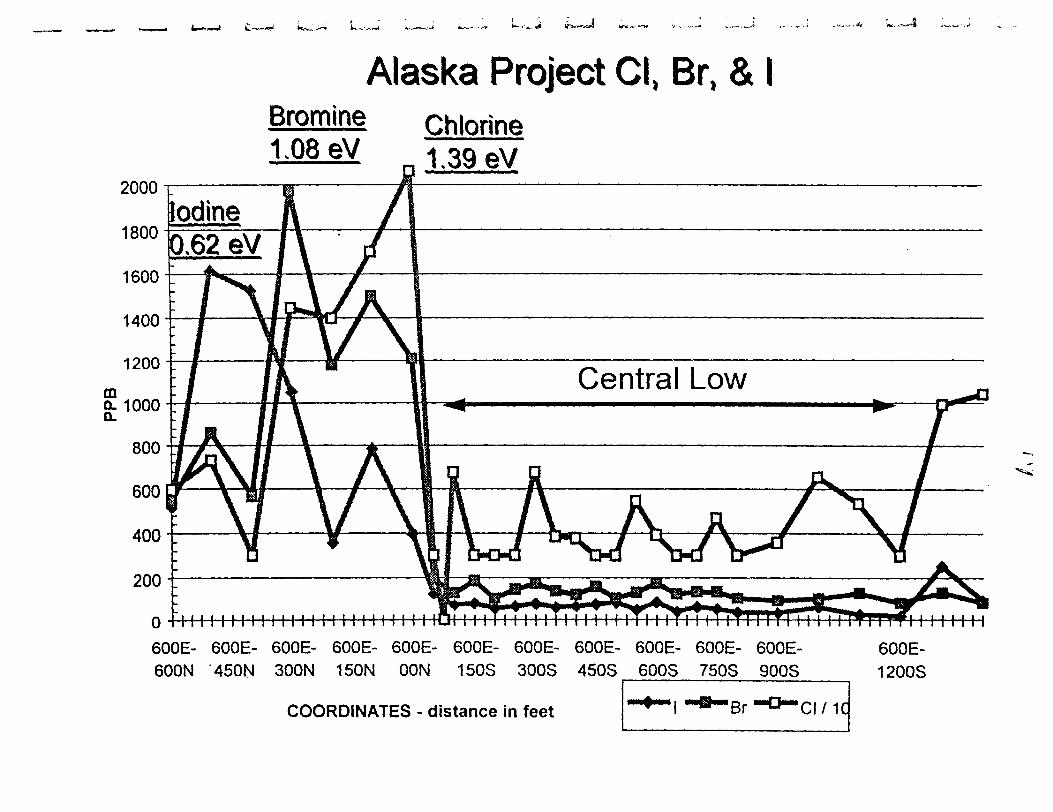
t- ,:,, J f-^r**aa
Alaska Project CI, Br,Bromine chlorine108 eV 139 eV
2000
Central Low
600E- 600E- 600E- 600E- 600E- 600E- 600E- 600E- 600E- 600E- 600E- 600N 450N 300N 150N OON 150S 300S 450S 600S 750S 900S
COORDINATES - distance in feet Br
600E- 1200S
CI 1 1C
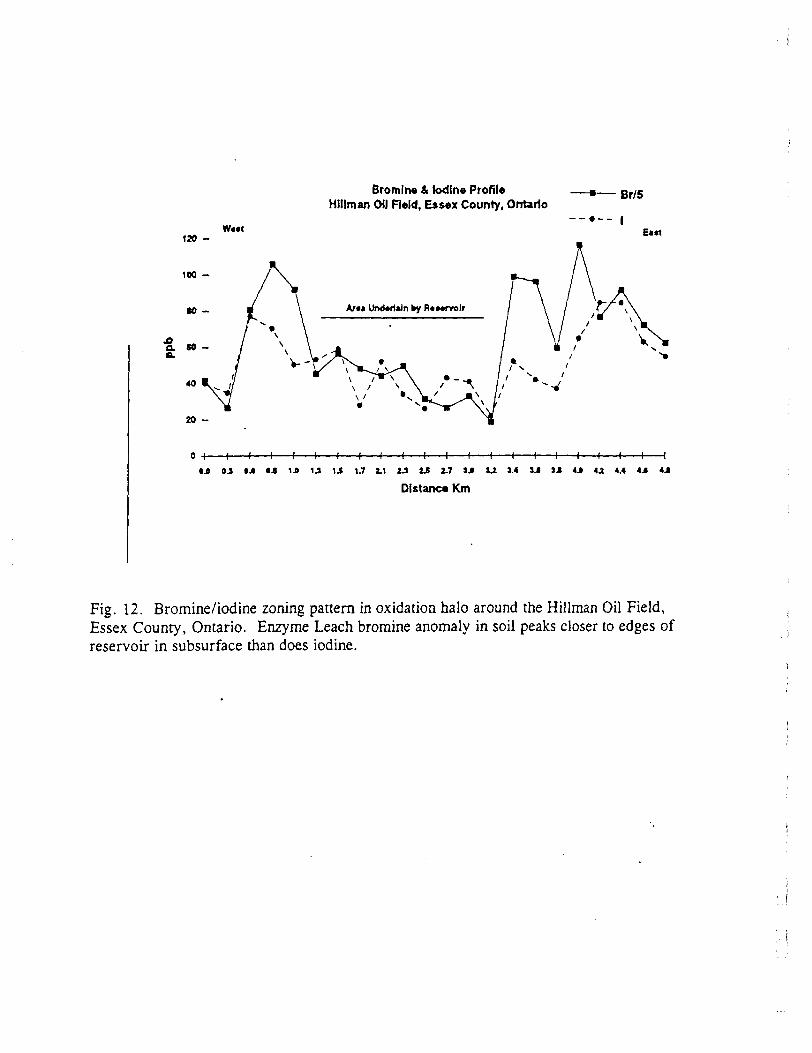
Bromine St Iodine Profile Hillman Oil Reid, Essex County, Ontario
Br/5
120 -
100 -
•O -
W*it EtM
40
20 -
O H———l——l——l——l——l——l——l——l——l——l——l——l——l——l——l——l——l——l——l———l
•J OJ tJt H 1.0 1J \S 1.7 M ZJ 2JS 2.7 3.1 IZ J.4 3J 34 4J 4J 4.4 4A
Distance Km
Fig. 12. Bromine/iodine zoning pattern in oxidation halo around the Hillman Oil Field, Essex County, Ontario. Enzyme Leach bromine anomaly in soil peaks closer to edges of reservoir in subsurface than does iodine.
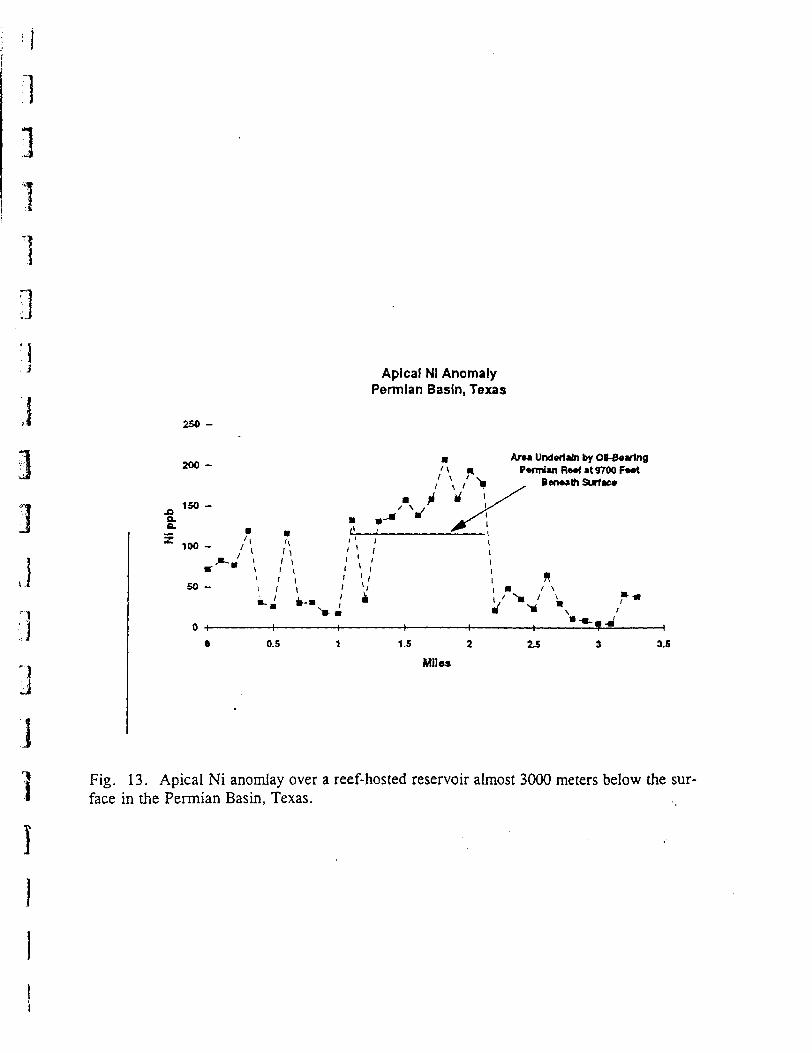
1
]•j
250 -
Apical NI Anomaly Permian Basin, Texas
J
200 -
150 -
100 -
so -
ATM Underlain by OO-BearlngPenrtan Re* at 9700 F*rt
Beneath Surf ac*
a 0.5 1 1.5 2 is——— \ ————
3 3.5
Miles
]Fig. 13. Apical Ni anomiay over a reef-hosted reservoir almost 3000 meters below the sur face in the Permian Basin, Texas.
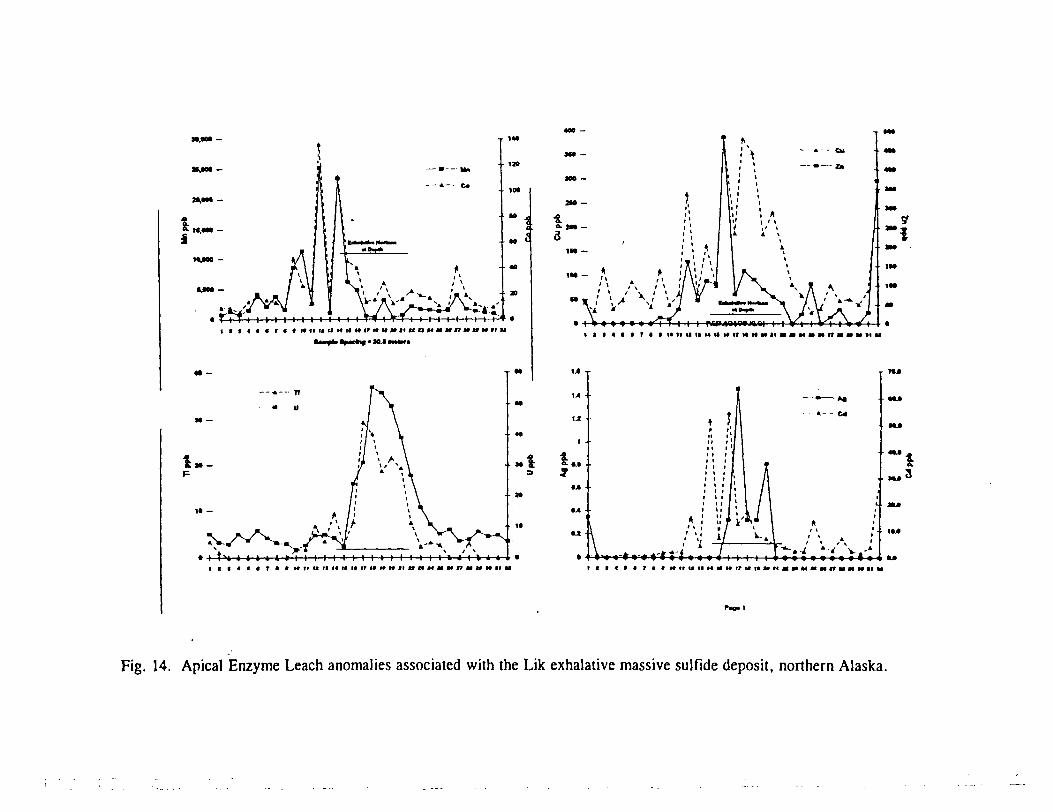
M.OOO -
M II U II 14 II H IT M H M II U n M M M It M H M II U
• M.I IMW*
1 l l 4 l * T l If* 11 11 II l* 14
Fig. 14. Apical Enzyme Leach anomalies associated with the Lik exhalative massive sulfide deposit, northern Alaska.
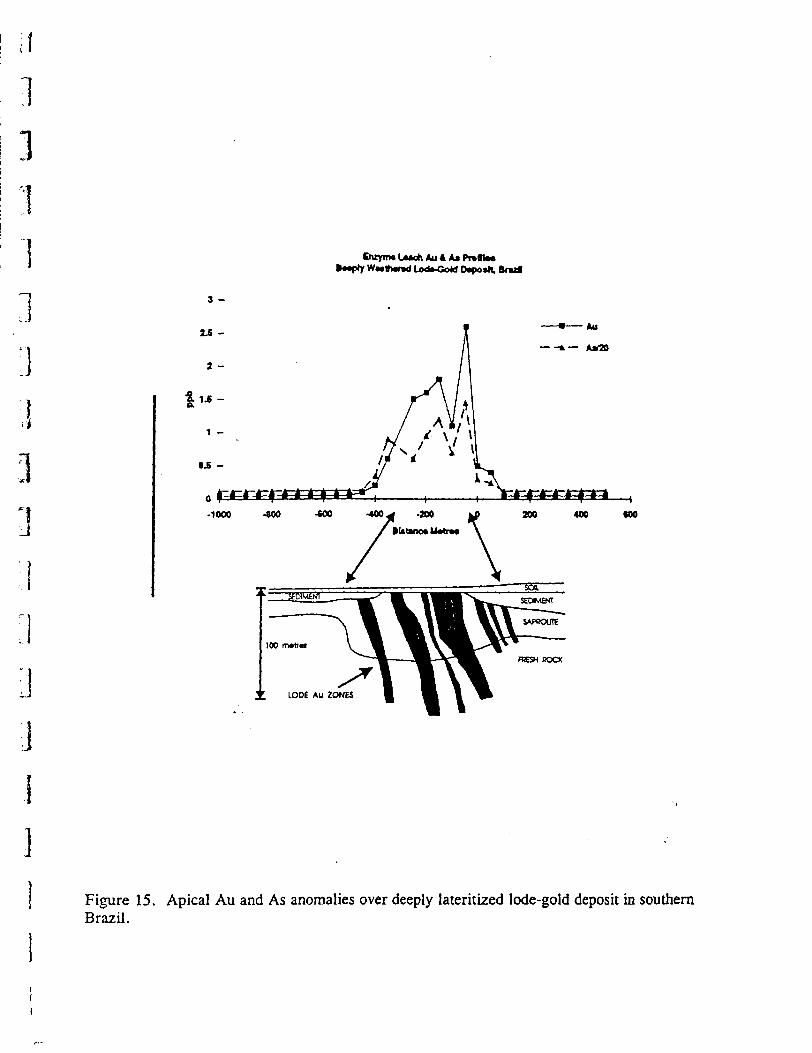
l ':fl .1
3
I
;j
33
J
s -
IS -
buyirw LMdi Au A A* tom** •Mpfy WMtfMT*d Uxto-CoM D^Mll. Brmd
Figure 15. Apical Au and As anomalies over deeply lateritized lode-gold deposit in southern Brazil.
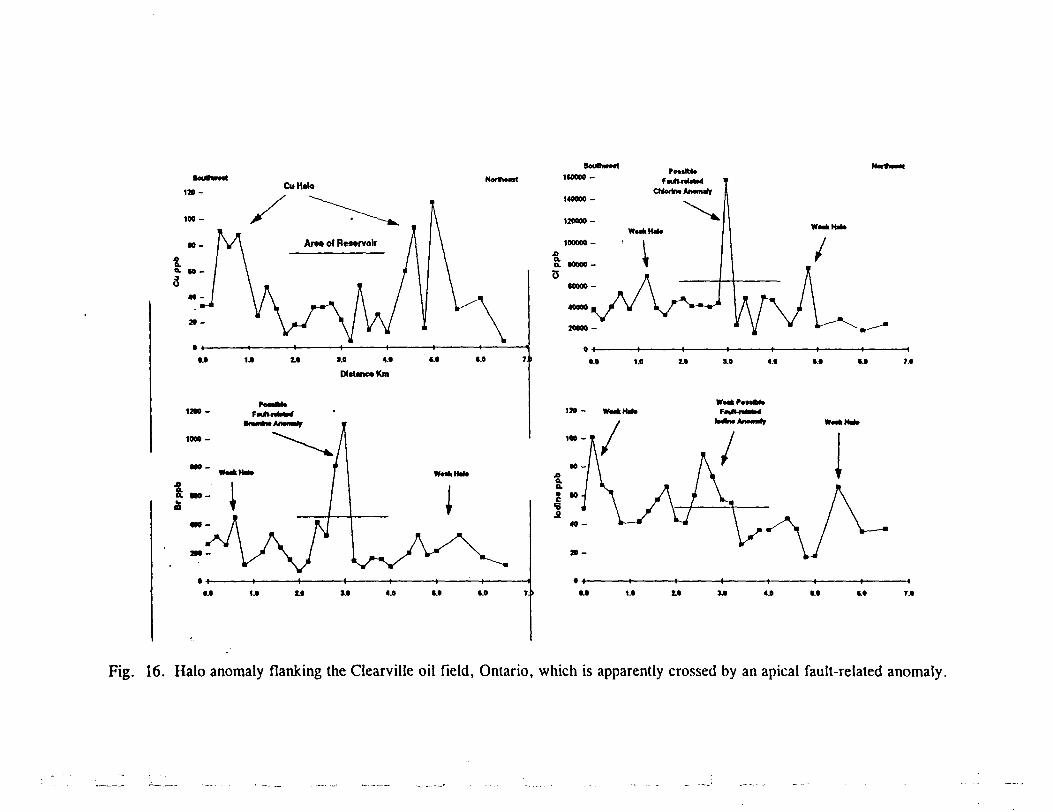
W** Nil*
Fig. 16. Halo anomaly flanking the Clearville oil field, Ontario, which is apparently crossed by an apical fault-related anomaly.
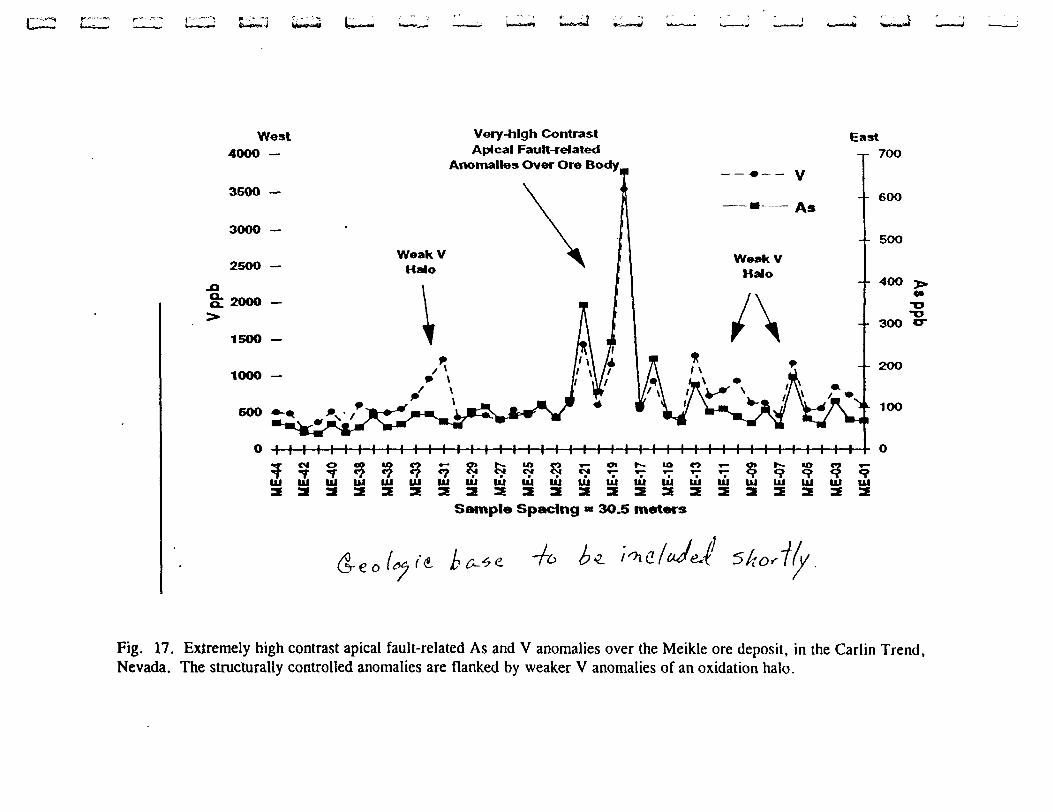
r--r:-.'^t f---':-*—A*-3*a t, s^—*i
West 400O —
3500 —
Very-high ContrastApical Fault-related
Anomalies Over Ore Bodv
East-r 700
10O
O l l l l l l l l l l l l l l l l l l l l l l l l l l l l l l l l l l l l l l l l l l l O
in fit til fii HI Mf "t "' "' "t fM "'2222322222
Sample Spacing - 3O.5 meters
Fig. 17. Extremely high contrast apical fault-related As and V anomalies over the Meikle ore deposit, in the Carlin Trend, Nevada. The structurally controlled anomalies are flanked by weaker V anomalies of an oxidation halo.
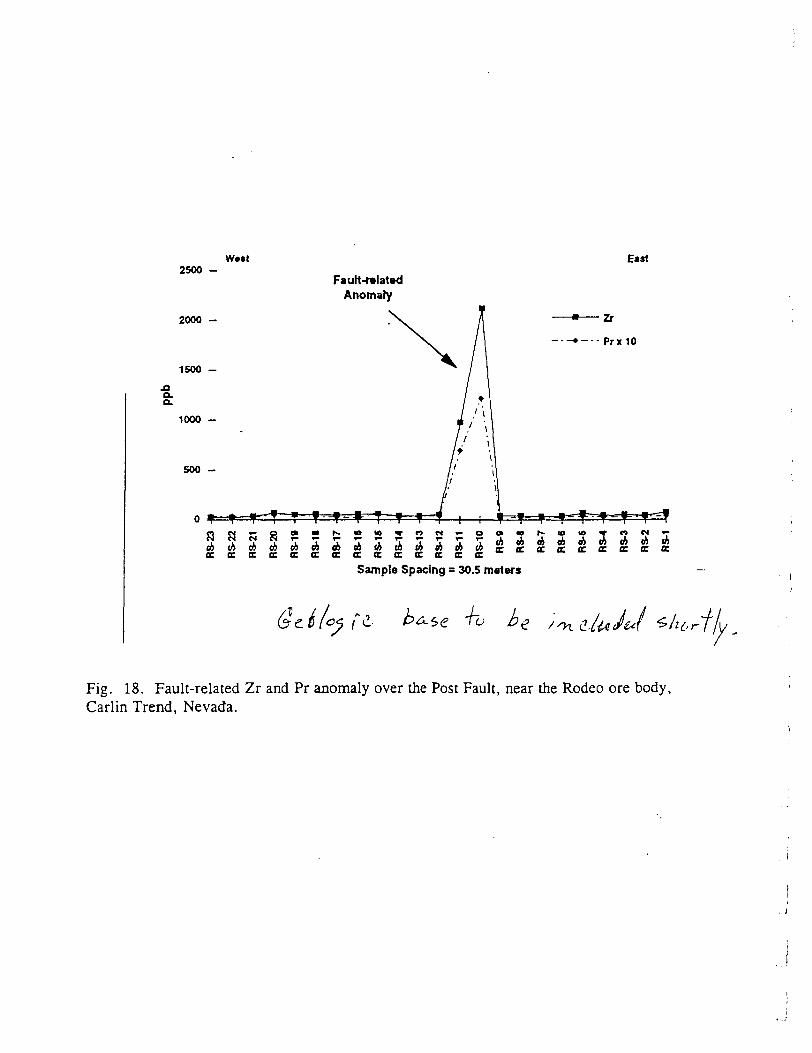
w.*t2500 -
2000 -
1500 -
East
o. o.1000 -
500 -
Fault-related Anomaly
cctciracccecccttccccSample Spacing = 30.5 meters
S c. f bf ft- -ho h
Fig. 18. Fault-related Zr and Pr anomaly over the Post Fault, near the Rodeo ore body, Carlin Trend, Nevada.
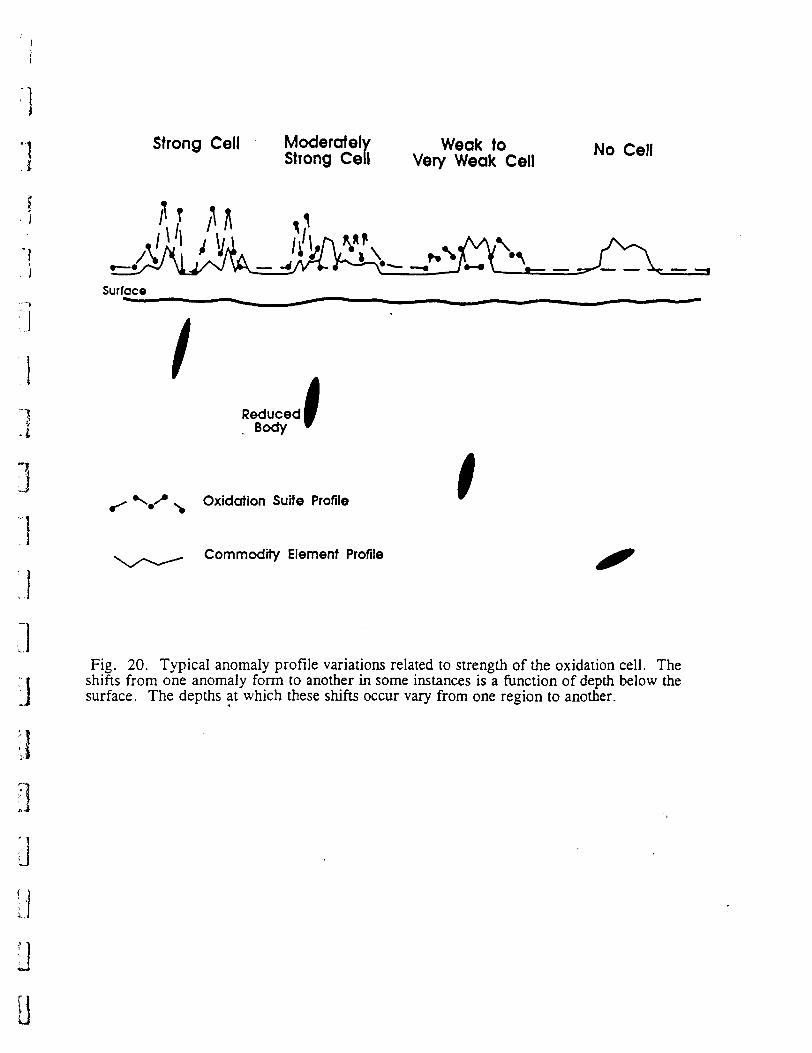
i]n Strong Cell Moderately Weak to No Cel,
Strong Cell Very Weak Cell Ce"
i"I
JSurface
l Reduced- Body l
^ Oxidation Suite Profile
Commodity Element Profile
; i j
l!
Fig. 20. Typical anomaly profile variations related to strength of the oxidation cell. The shifts from one anomaly form to another in some instances is a function of depth below the surface. The depths at which these shifts occur vary from one region to another.
O
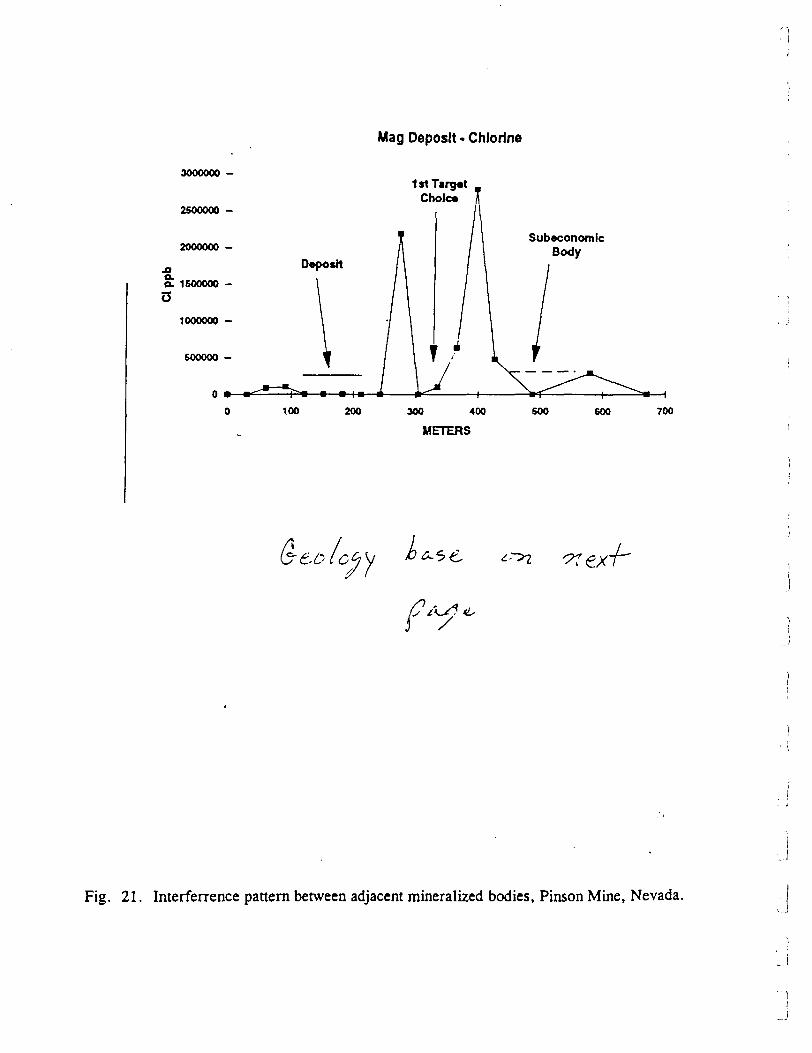
Mag Deposit - Chlorine
3000000 -
2SOOOOO -
2000000 -
1st Target Cholc*
Subeconomic Body
100 200 300 400
METERS
600 600 700
i
Fig. 21. Interferrence pattern between adjacent mineralized bodies, Pinson Mine, Nevada.
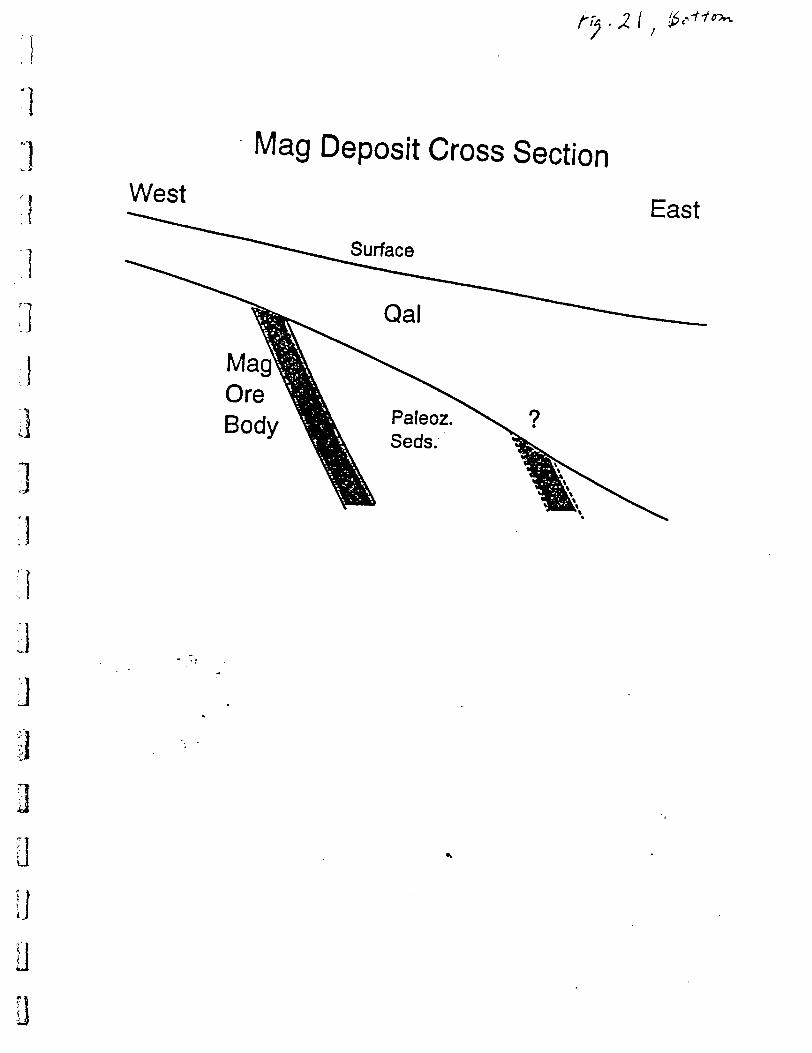
Mag Deposit Cross SectionWest East
Surface
:]
3
MagOreBody
3 O
Oo
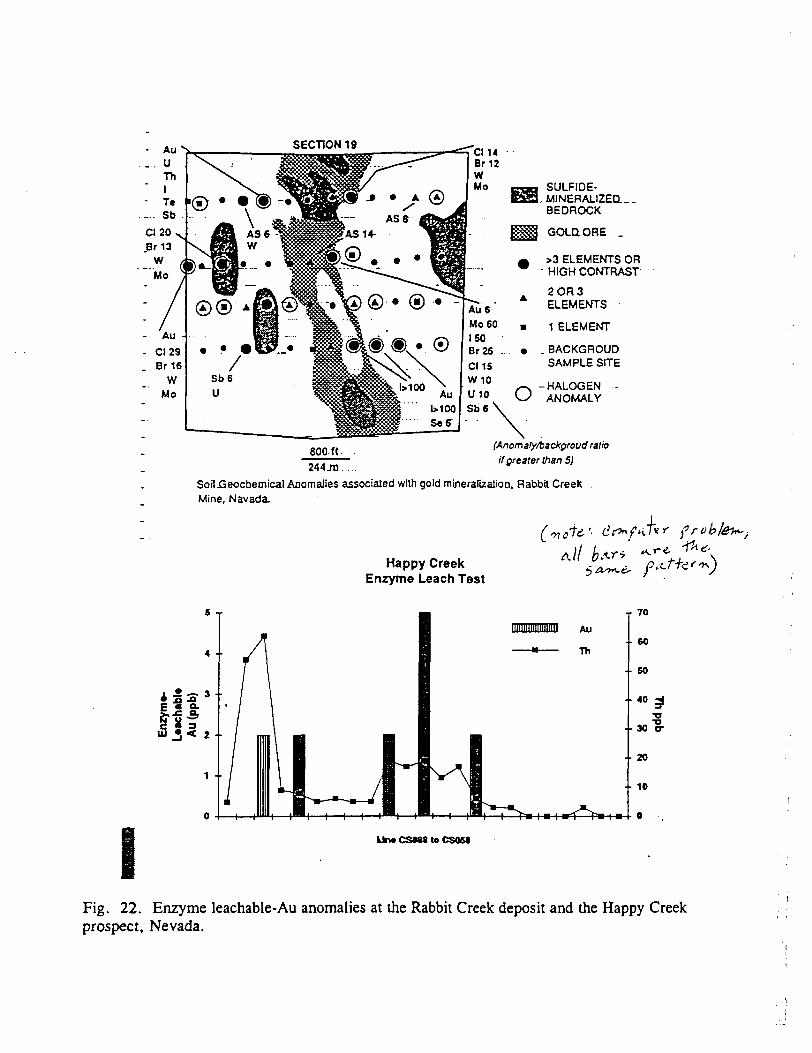
SECTION 19
BOO f t
SULFIDE- MINERALIZED--.
BEDROCK
GOLD. ORE .
^ ELEMENTS OR - HIGH CONTRAST
2 OR 3ELEMENTS
1 ELEMENT
.BACKGROUD SAMPLE SITE
O -HALOGEN ANOMALY
(Anomaly/backgroud ratio if greater than S)
Soil jGeocbemical Anomalies associated with gold mineralization. Rabbit Creek Mine, Navada.
Happy Creek Enzyme Leach Test
'- d e** f* l* '
di
S T
kin* CSOM to CS068
Fig. 22. Enzyme leachable-Au anomalies at the Rabbit Creek deposit and the Happy Creek prospect, Nevada.
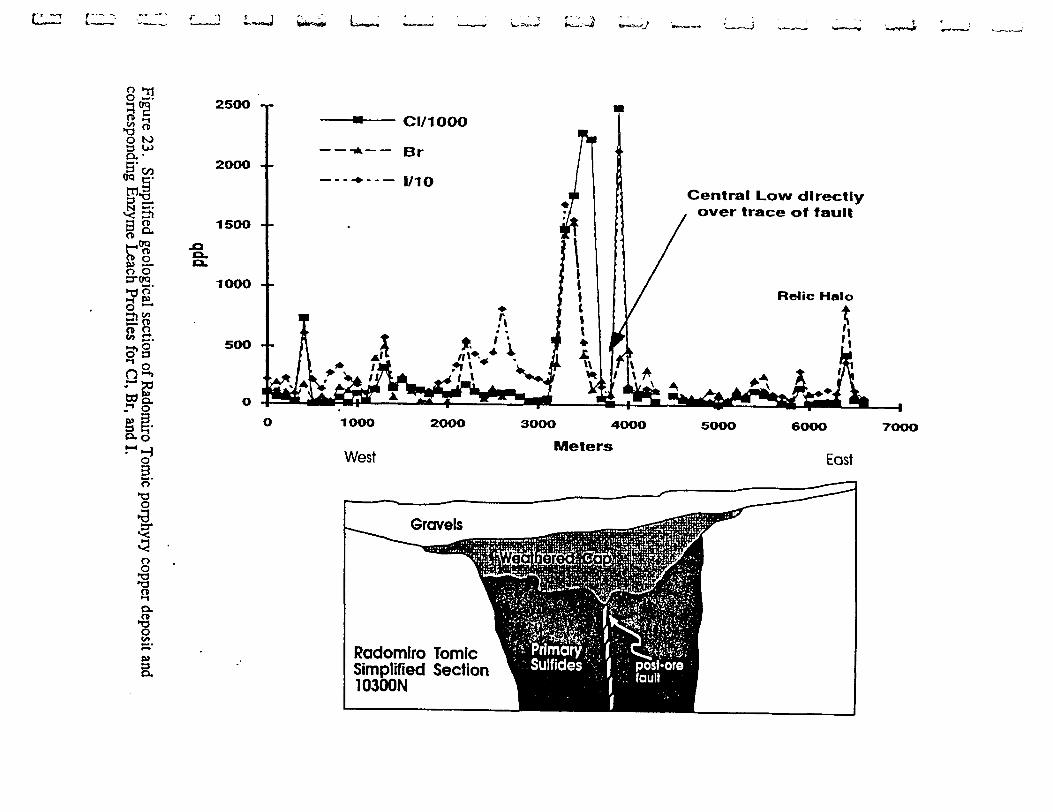
lJ
gW
M
8in
qdd
40o
2o
Figure 23. Sim
plified geological section of Radomiro Tom
ic porphyry copper deposit and corresponding Enzym
e Leach Profiles for CI, Br, and I.
[j
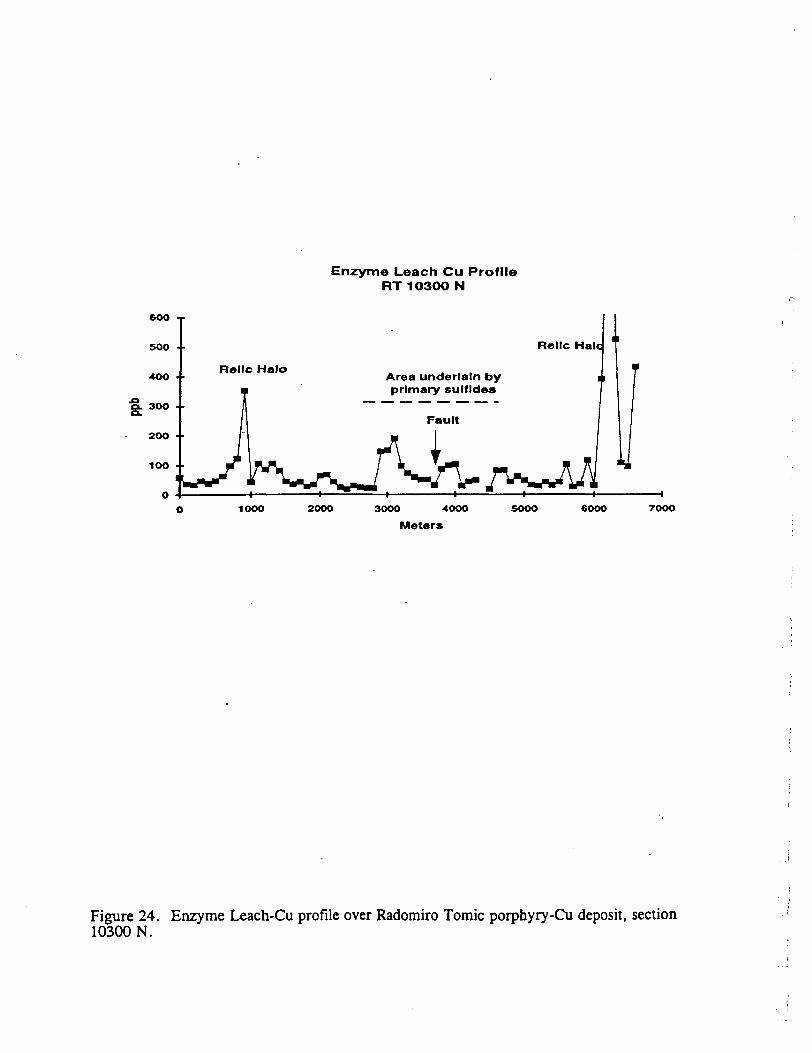
Enzyme Leach Cu Profile RT 10300 N
Area underlain by primary suit Ides
1OOO 200O 3OOO 4OOO
Meters5000 sooo 7OOO
Figure 24. Enzyme Leach-Cu profile over Radomiro Tomic porphyry-Cu deposit, section 10300 N.
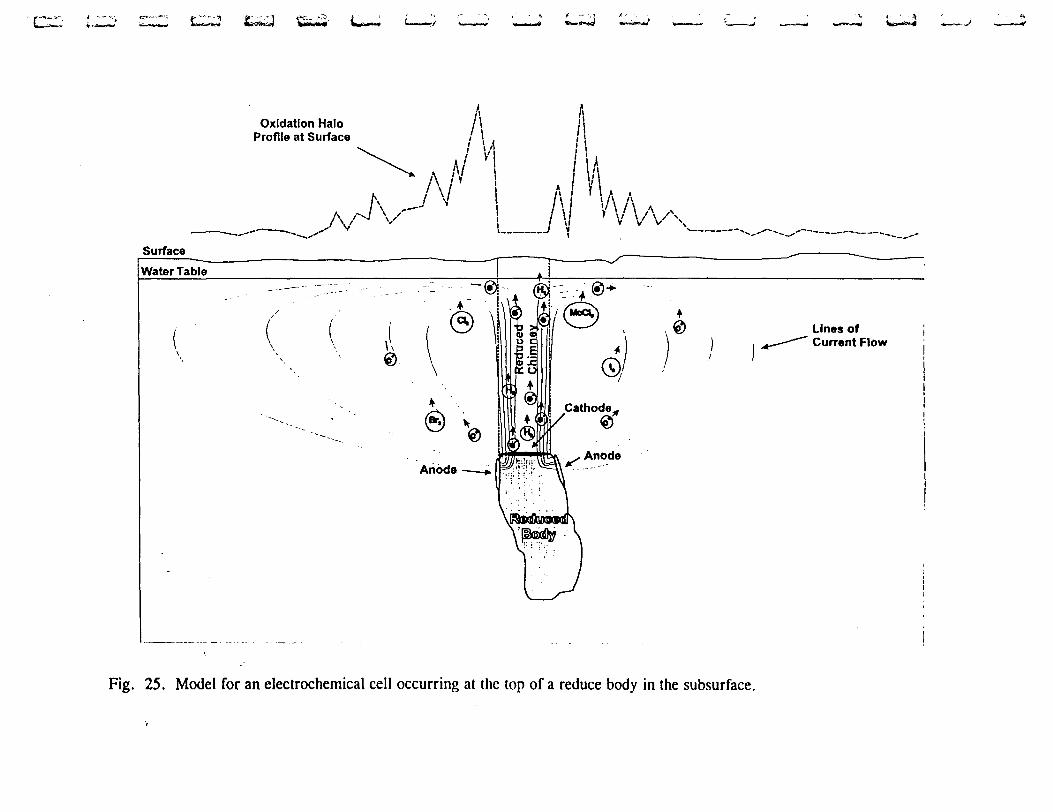
—'
Oxidation Halo Profile at Surface
Surface
Fig. 25. Model for an electrochemical cell occurring at the top of a reduce body in the subsurface.
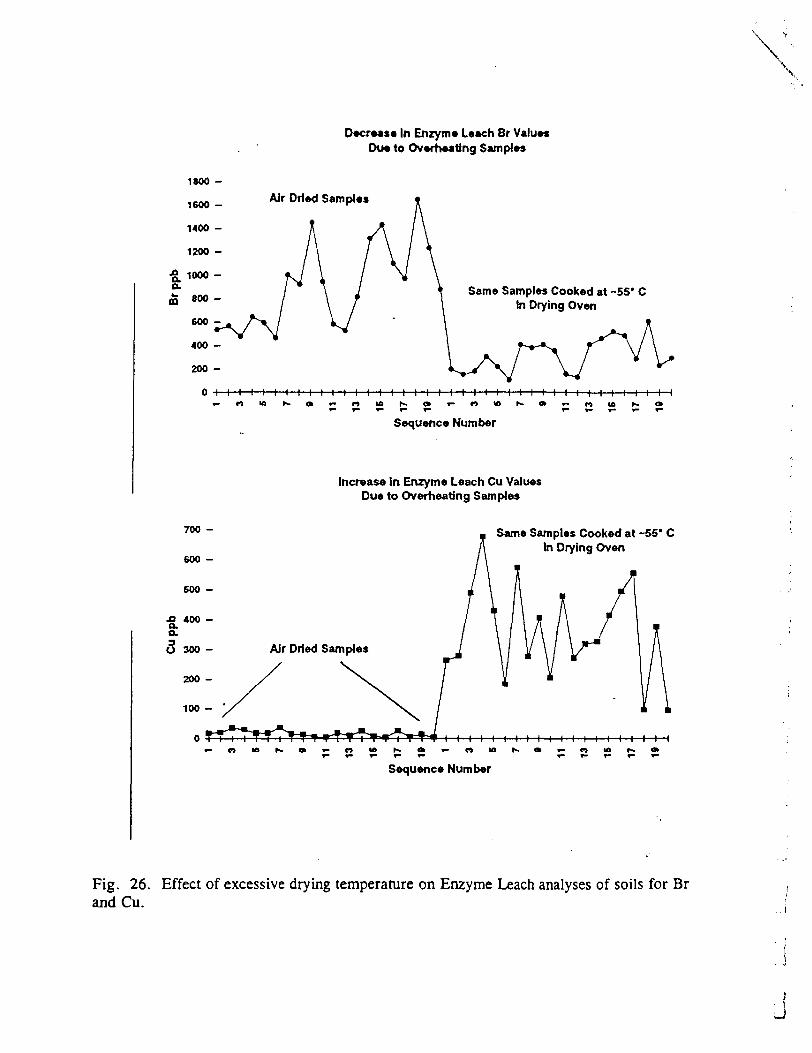
Decrease In Enzyme Leach Br Values Do* to Overheating Samples
v
\
AJr Dried Samples
t i i l i i i i i i i i i i i l i i i i i i i i i i l l i l i i i l i i i i i
Same Samples Cooked at -55* C In Drying Oven
Increase in Enzyme Leach Cu Values Due to Overheating Samples
Same Samples Cooked at -55* C In Drying Oven
Sequence Number
Fig. 26. Effect of excessive drying temperature on Enzyme Leach analyses of soils for Br and Cu.
. i
Enzyme Leach Anomalies Associated With DeepMississippi Valley-Type Zinc Ore Bodies
at the Elmwood Mine, Tennessee
byJames R. Yeager 1 , J. Robert Clark 1 , Wallace Mitchell 2 , and Roy Renshaw3
'ACTLABS, Inc., 11485 W. 1-70 Service Road N., Wheat Ridge, CO 800332Savage Zinc Inc., P.O. Box 359, Gordonsville, TN 38563
3615 Comet Drive, Nashville, TN 37209
Abstract
Mississippi Valley-Type deposits that have been or are currently being mined in North
America were discovered either because they outcropped or by means of deep drilling. Con
ventional geochemical methods are ineffectual for detecting these blind deposits when they
occur deep within sequences of stable-platform carbonates and shales. Enzyme Leach analy
sis of soils collected at the Elmwood Mine, Tennessee, revealed contrast anomalies over ore
bodies 370 meters below the surface. In areas where the soils are in chemical equilibrium,
"combination" anomalies occur over zinc ore bodies. These are characterized by asym
metrical halogen halos that occur around a halogen central low. Commodity metals and trace
elements associated with the ore form apical anomalies that occur over the ore bodies, and
within the halogen halo.
Under most circumstances, common agriculture practices do not demonstrably affect
Enzyme Leach resuks. However, agricultural activity in Central Tennessee appears to have
' l altered the Mn chemistry of the soils in at least some locations. Where this disequilibrium
occurs, Enzyme Leach data are very erratic. In the one case where this was encountered,
j ratioing the data to Mn reveals anomalies that bracket the blind ore bodies.
J 1. Introduction
i ) One of the commonly acknowledged problems in exploration for Mississippi Valley-
j
[j
atype (MVT) deposits that occur deep within the subsurface is that they give no geochemicalFilename: E:\Elmwood.Text.001.Ds5; Page l
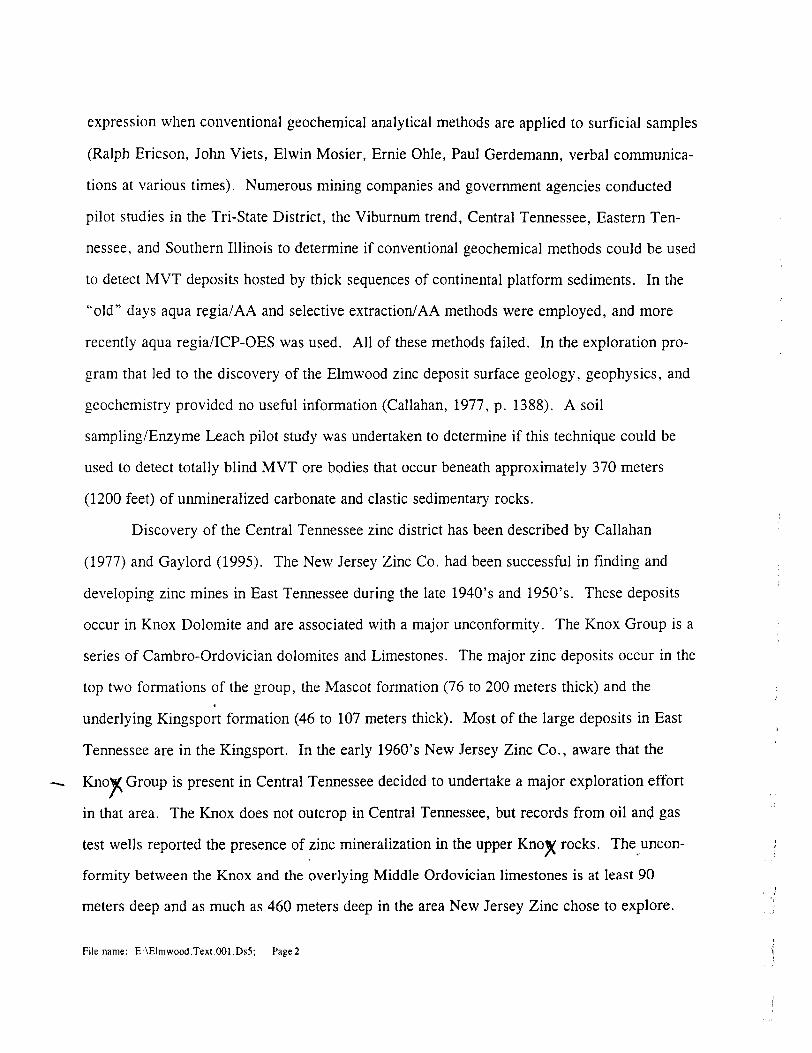
expression when conventional geochemical analytical methods are applied to surficial samples
(Ralph Ericson, John Viets, Elwin Mosier, Ernie Ohle, Paul Gerdemann, verbal communica
tions at various times). Numerous mining companies and government agencies conducted
pilot studies in the Tri-State District, the Viburnum trend, Central Tennessee, Eastern Ten
nessee, and Southern Illinois to determine if conventional geochemical methods could be used
to detect MVT deposits hosted by thick sequences of continental platform sediments. In the
"old" days aqua regia/AA and selective extraction/AA methods were employed, and more
recently aqua regia/ICP-OES was used. All of these methods failed. In the exploration pro
gram that led to the discovery of the Elmwood zinc deposit surface geology, geophysics, and
geochemistry provided no useful information (Callahan, 1977, p. 1388). A soil
sampling/Enzyme Leach pilot study was undertaken to determine if this technique could be
used to detect totally blind MVT ore bodies that occur beneath approximately 370 meters
(1200 feet) of unmineralized carbonate and clastic sedimentary rocks.
Discovery of the Central Tennessee zinc district has been described by Callahan
(1977) and Gaylord (1995). The New Jersey Zinc Co. had been successful in finding and
developing zinc mines in East Tennessee during the late 1940's and 1950's. These deposits
occur in Knox Dolomite and are associated with a major unconformity. The Knox Group is a
series of Cambro-Ordovician dolomites and Limestones. The major zinc deposits occur in the
top two formations of the group, the Mascot formation (76 to 200 meters thick) and the
underlying Kingsport formation (46 to 107 meters thick). Most of the large deposits in East
Tennessee are in the Kingsport. In the early 1960's New Jersey Zinc Co., aware that the
KnoV Group is present in Central Tennessee decided to undertake a major exploration effort
in that area. The Knox does not outcrop in Central Tennessee, but records from oil and gas
test wells reported the presence of zinc mineralization in the upper Knov rocks. The uncon
formity between the Knox and the overlying Middle Ordovician limestones is at least 90
meters deep and as much as 460 meters deep in the area New Jersey Zinc chose to explore.
Filename: E:\Elmwood.Text.001.Ds5; Page2
j Knowing that geochemistry and geophysics would not work on such deeply buried targets, the
-•c now famous "Random Walk" with a drill rig was employed as the exploration method.t
; Widely spaced holes (typically 8 to 10 kilometers apart) were selected using a random statis-
f tical procedure for selecting drill sites (Callahan, 1977; Koch and Schuenemeyer, 1982). The i
program was begun in 1964, and in 1967 New Jersey Zinc finally hit ore grade and thickness
j in hole number 79. This discovery would eventually become the Elmwood Mine near Gor-
donsville, Tennessee. The mine began production in 1975 and is currently one of the leading
- J zinc producers in the United States.
i The geology of the area is relatively simple. It lies along the crest of the Nashville, 'i
dome (Fig. 1), which is the southern end of the Cincinnati Arch. The rocks dip 4-9 meters
l per kilometer away from the axis of the arch. There is no significant faulting in the area.
The ore occurs in breccia bodies in the Lower Ordovician Mascot and Kingsport formationsHi.i which are the two uppermost formations in the Knox Group (Fig. 2). The top of the Mascot
- j .. is a major erosional unconformity. Above this unconformity lie several Middle Ordovician
limestone formations. These formations vary in thickness from 90 meters to more than 300
j meters in the area New Jersey Zinc explored, and they were considered "overburden" during
the drilling, since they contain no clues as the whether or not the underlying Mascot and
j Kingsport formations are mineralized. More complete descriptions of the geology of the area
-, and of the Elmwood Mine can be found in Gay lord (1995) and Tennessee Division of Geol-
^ ogy (1969).
^1 The Mascot and Kingsport are interbedded limestones and dolomites. During the
formation of the unconformity at the top of the Knox Group an extensive karst topography
: f developed as a result of dissolution of the Mascot and Kingsport. Later, the collapse breccias•* *
that formed during karstification were invaded by mineralizing brines and the open spaces
J were partially filled with calcite, sphalerite, galena, pyrite, fluorite and barite. These col-
'; ) lapsed cave systems are intensely mineralized in places, but their random distribution and U
Filename: E:\Elmwood.Text.001.Ds5; Page3a o
unpredictable size and shape make them very difficult to find and evaluate. For instance, the
follow-up drill hole to the discovery hole was sited 30 meters to the north, and it missed the
ore body (Callahan, 1977, p. 1389). Deep drilling from the surface has been the primary tool
for finding new ore bodies.
The climate is temperate and humid, with hot summers and moderate winters.
Weathering is best described as subtropical. Soils are typical of those produced by subtropi
cal weathering of carbonate rocks. Below a modest A horizon, there is a reddish-orange B
horizon that commonly contains a large proportion of fine silica and cherty residuum pro
duced by weathering of the Paleozoic carbonate rocks. Rolling hills and bottom land with
mixed fields and forests characterize the landscape. Elevations in the area range between 140
and 250 meters above "sea level. Most of the cultivated land is in pastures. In the 1800's and
early 1900's, most of the land had been cleared for agriculture, but early in this century many
of the fields on the hillsides were abandoned and allowed to return to forest. The uncultivated
. areas are covered by hardwood deciduous forests mixed with pines or cedars. Cane breaks
are found in scattered areas along river flood plains and along streams.
A pilot study was initiated to determine if a highly selective extraction could be used
to detect the zinc ore bodies through substantial thicknesses of unmineralized continental shelf
carbonates and shales. It was also hoped that evidence could be found of dispersive processes
that might help in interpretation of selective leach data. Up until this study was undertaken,
the only Enzyme Leach data for this humid subtropical weathering environment were from a
petroleum pilot study near Houston, Texas. Therefore, it was necessary to determine if simi
lar Enzyme Leach anomaly patterns would be associated with buried mineralization in this
climate as had been observed in other climatic regimes.
2. Sample collection, analysis, and data plotting
Sampling was undertaken in March, 1996, just as the vegetation was beginning to bud
Filename: E:\Elmwood.Text.001.Ds5; Page4
\ out in the early spring. Three traverses had been surveyed that crossed ore bodies located
- j roughly 370 meters (1200 feet) beneath the surface (Fig. 3). The locations of the ore bodies l •' were not revealed until after the analytical data had been generated and submitted to Savage
} Zinc Inc. Two of the traverses were located in largely forested upland, while one traverse
was located mostly in pastures. Samples were collected at 30.5 meter (100 foot) intervals
along the traverses at a total of 185 sites. A pickmatic gardening implement (flat-bladed pick
ax) was used to dig the holes. Samples were collected typically at a depth of 0.2 to 0.3i
' ' meters (8 to 12 inches). Approximately 200 grams of 5-horizon material from each site was
} placed in a 13 x 18 cm Ziplock(tm) plastic freezer bag that had been marked with a site iden-!
tification number. Most of the soils were damp when they were collected. After being
: shipped to the laboratory, the samples were air dried, disaggregated, and sieved using a
stainless steel screen for the minus-60-mesh fraction of the soil.'?.J Each sample was leached using the Enzyme Leach procedure described in Clark (this
' f - - issue), Clark (1995), and Clark (1990), and fifty-six analytes were determined by ICP-MS on
a Perkin Elmer Elan 6000. Detailed statistical evaluation of the data was not necessary, since
. j the anomalies were obvious when the raw data were inspected. Similarly, multivariate
analysis of the data was not performed, since for the most part the anomaly patterns were l j quite apparent. Anomalous trace elements were also ratioed to Mn, and the resulting values
. were plotted as another set of variables. The analytical data for the variables that showed
. contrast above the apparent background were graphed in a spreadsheet program as geochemi-
| cal profiles along each traverse. The anomalies that were revealed were then compared to the
locations of MVT ore bodies in the subsurface. Trace element data from related variables
f were scaled in order to allow those variables to be plotted on the same figure. Often, radical
anomaly contrast at one sample site will control the scaling of a geochemical profile or con-
-J tour plot, visually suppressing the pattern for that variable in the rest of the profile or plot. In
{ ] such cases drastically anomalous values were truncated so that more subtle anomalous values
Filename: E:\Elrmvood.Text.001.Ds5; PageS
with a contrast of 3- to 50-times background for that particular variable could be evaluated on
the same figure. This was done by putting a maximum limit on the Y-axis of the graph.
For comparative purposes, the soil samples were also subjected to the standard aqua
regia digestion followed by ICP-OES determination of 30 elements as is typically performed
on most geochemical soil samples.
3. Results and discussion
Several members of the oxidation suite of elements had highly anomalous values at
some of the sample sites. This indicates that oxidation reactions are probably occurring in the
subsurface in the area that was sampled (Clark, this issue). This in turn indicates a strong
likelihood that there are reduced bodies beneath the areas sampled. Of the oxidation suite
elements, CI, Br, and I produced the most consistent anomaly patterns. Bromine had the
highest anomaly contrast in the test set of samples, with a peak contrast of more than 600-
times background (Table 1). Two other members of the oxidation suite, Mo and As, were
found to produce anomalies with good contrast above background (Table 1), but the patterns
for these two elements were not nearly as diagnostic of the location of reduced bodies in the
subsurface as the halogens. Zinc, Pb, and Cd, which are strongly enriched in the ore, were
anomalous in the Enzyme Leach data as well (Table 1), and proved to be quite useful in
detecting ore bodies in the subsurface. Sphalerite in Central Tennessee zinc deposits is highly
enriched in Ge, and the Elmwood Mine is the leading world resource for germanium. Sur
prisingly, this commodity element was not found to be anomalous at the surface in any of the
areas tested. Obviously, whatever process is mobilizing Zn, Pb, and Cd and causing them to
migrate to the surface is not able to do the same with Ge. Barium and Mn are enriched'in the
gangue minerals associated with the ore, and anomalies for these elements are apparent in the
Elmwood Enzyme Leach data. In a crystalline host rock setting they would be considered to
be part of an alteration suite. In Central Tennessee it would be better to refer to Ba and Mn
Filename: E:\Elmwood.Text.001.Ds5; Page6
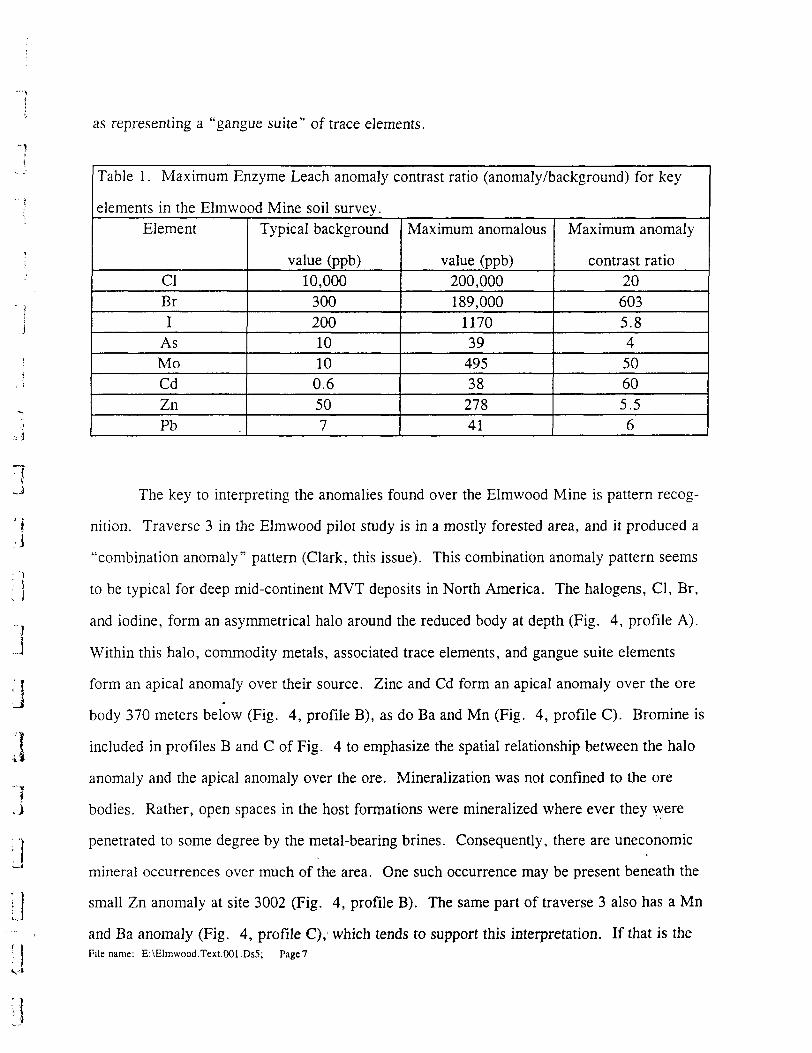
as representing a "gangue suite" of trace elements.
l
Table 1 . Maximum Enzyme Leach anomaly contrast ratio (anomaly/background) for key
elements in the Elmwood Mine soil survey.Element
CIBrI
AsMoCdZnPb
Typical background
value (ppb)10,000
3002001010
0.6507
Maximum anomalous
value (ppb)200,000189,000
117039
49538
27841
Maximum anomaly
contrast ratio20
6035.8450605.56
The key to interpreting the anomalies found over the Elmwood Mine is pattern recog
nition. Traverse 3 in the Elmwood pilot study is in a mostly forested area, and it produced a
"combination anomaly" pattern (Clark, this issue). This combination anomaly pattern seems
to be typical for deep mid-continent MVT deposits in North America. The halogens, CI, Br,
and iodine, form an asymmetrical halo around the reduced body at depth (Fig. 4, profile A).
Within this halo, commodity metals, associated trace elements, and gangue suite elements
form an apical anomaly over their source. Zinc and Cd form an apical anomaly over the ore
body 370 meters below (Fig. 4, profile B), as do Ba and Mn (Fig. 4, profile C). Bromine is
included in profiles B and C of Fig. 4 to emphasize the spatial relationship between the halo
anomaly and the apical anomaly over the ore. Mineralization was not confined to the ore
bodies. Rather, open spaces in the host formations were mineralized where ever they were
penetrated to some degree by the metal-bearing brines. Consequently, there are uneconomic
mineral occurrences over much of the area. One such occurrence may be present beneath the
small Zn anomaly at site 3002 (Fig. 4, profile B). The same part of traverse 3 also has a Mn
and Ba anomaly (Fig. 4, profile C), which tends to support this interpretation. If that is theFilename: E:\Elmwood.Text.001.Ds5; Page?
case, then the mineral occurrence in that area may be too small to produce an oxidation halo.
Thus, that part of the profile would lack a halogen halo.
Traverse l presents quite a different picture. Geochemical profiles for CI, Br, I, and
Zn (Fig. 5) show a confused pattern that is hard to interpret, unlike the typical pattern for a
mid-continent MVT. It would appear that there is some kind of anomaly between sites 1010
and 1030, but there is so much noise in the background data that the patterns are ambiguous
(Fig. 5). Manipulation of the data by ratioing the erratic trace elements to Mn eliminated the
noise and produced interpretable patterns for a number of trace elements along traverse l.
Chlorine, Br, and I, when ratioed to Mn, reveal two adjacent halos (Fig. 6). The central low
of one halo lies over a 15 meter thick ore body that grades 59fc Zn, and the other central low
is over an 8 meter thick ore body that grades 17o Zn. Both ore bodies lie at a depth of
roughly 370 meters. The Zn/Mn, Cd/Mn, and Pb/Mn ratios also define the same halos (Fig.
6). A weak high for the Zn/Mn ratio can be seen in the center of one of these anomalies,
possibly representing an apical high over ore. However, ratioing to Mn would tend to elimi
nate the apical part of a combination anomaly. Therefore, the true anomaly pattern is likely
to be altered by ratioing trace elements.
Out of hundreds of pilot studies and exploration projects, there are very few cases
where it has been found useful to ratio Enzyme Leach data to leachable Mn. This raises the
question: What is different about the chemistry of the soils along this traverse that makes it
necessary to ratio the data to Mn, when it is not necessary with the rest of the pilot study
data. The land use is the most obvious difference between this area and the other two
traverses. Traverses 2 and 3 are located in areas that are mostly forested. Traverse l crosses
an area that is mainly in pastures.
In all previous projects in cultivated areas, agricultural activity has been found'to have
virtually no effect on Enzyme Leach data. However, since agricultural practices vary con
siderably between regions, this cannot be taken as a rule. In the southeastern United States
Filename: E:\Elmwood.Text.001.Ds5; PageS
!
l the humid, relatively warm climate results in the rapid depletion of fertility of limestone soils
when they are cultivated. In order to "sweeten" the soil, and retain its fertility, it is a com-
mon practice to spread crushed agricultural limestone on the fields. Waste rock from the
Elmwood Mine is sold for this purpose to the local farms. Much of the waste from the mine
is enriched in Mn, since Mn was introduced into the host formations by the mineralizing
brines. In this climate, the agricultural limestone undergoes rapid chemical weathering.
There is the distinct possibility that as the crushed limestone weathers, much of the Mn that is
released becomes amorphous manganese dioxide, and acts like a sponge soaking up large
amounts of any available trace elements. This could account for the erratic, high values for a
number of elements in the raw Enzyme Leach data for traverse l (Fig. 5). If this is the case,
then ratioing the data to Mn would tend to remove the influence of this agricultural factor
from the data.
Aqua regia/ICP-OES analyses of the same soil samples did not yield any distinct
.anomalies or trace element patterns that could be related to the underlying ore bodies. These
data can be obtained by sending an E-mail to [email protected].
4. Conclusions
J Mississippi Valley-type deposits located deep within the carbonate sedimentary section
- j in Central Tennessee are undergoing some kind of subtle chemical process that is dispersing
trace elements to the'surface. The presence of halogen halos flanking the areas directly above
] the ore bodies suggests that a gradual oxidation process is involved in the formation of these
anomalies (Clark, this issue). The soil anomalies that form at the surface from this dispersion"7
-J process have migrated through substantial thicknesses of carbonate rocks. These anomalies
- j can be detected with the Enzyme Leach technique of soil analysis. Combination anomalies
-* seem to be characteristic of these deposits in areas where the Mn chemistry of the soil is in
; j equilibrium. Halogens form an asymmetrical halo that brackets the ore body at depth.
Filename: E:\Elmwood.Text.001.Ds5; Page9
O
Commodity metals and related trace elements, such as Zn, Cd, and Pb, form an apical
anomaly in the center of the halo, directly over the ore body. Non-ore elements, like Mn and
Ba that were added to the host rocks during mineralization also form apical anomalies over
their source.
Areas that are under active cultivation in Central Tennessee may yield noisy Enzyme
Leach data that are difficult to interpret. Because the Enzyme Leach is designed to be
somewhat selective for amorphous manganese oxides, the Mn chemistry of soils in these cul
tivated fields may be in disequilibrium. Perhaps this results from the addition of Mn-enriched
agricultural limestone to the fields. In the Elmwood pilot study, ratioing data from actively
cultivated fields to Mn eliminated the erratic signals. This produced very high contrast halo
anomalies for CI, Br, I, Zn, Cd, and Pb, which bracket the ore bodies 370 meters below the
surface.
5. Acknowledgements
The authors are grateful to the Savage Zinc Co., Inc. for allowing access to the prop
erty and for giving permission to publish this paper.
Filename: E:\Elmwood.Text.001.Ds5; Page 10
References- ?
( tCallahan, W.H., 1977, The history of the discovery of the zinc deposit at Elmwood, Tennes-
,' ~*
i; see, concept and consequence. Econ. Geol., 72: 1382-1392.
-, Clark, I.R., Meier, A.L., and Riddle, G., 1990, Enzyme leaching of surficial geochemical j ' samples for detecting hydromorphic trace-element anomalies associated with precious-
j metal mineralized bedrock buried beneath glacial overburden in northern Minnesota: in: )
Gold'90, Society of Mining Engineers, Chapter 19, p. 189-207.
l Clark, I.R., 1993. Enzyme-induced leaching of B-horizon soils for mineral exploration in
areas of glacial overburden. Trans. Instn. Min. Metall. (Sect. B: Appl. earth sci.), 102:?
^ B19-B29.
"l Clark, J.R., 1995, Method of geochemical prospecting. United States Patent 5,385,827, 20
pp.
j . Clark, J.R., (this issue), Concepts and models for interpretation of Enzyme Leach data. J.
Geochemical Explor.
Gaylord, W.B., 1995, Geology of the Elmwood and Gordonsville Mines, Central Tennessee
j zinc district - an update. In: Misra, K.C. (ed.), Carbonate-Hosted Lead-Zinc-Fluorite-
Barite Deposits of North America. Society of Economic Geologists Guidebook Series,
-j 22: 173-204.
Tennessee Division of Geology, 1969, Papers on the stratigraphy and mine geology of the
l Kingsport and Mascot Formations (Lower Ordovician) of East Tennessee. Report of
T , Investigations 23.
v * Koch, G.S. and Schuenemeyer, J.H., 1982, Exploration for zinc in Middle Tennessee by
"j drilling: a statistical analysis. Econ. Geol., 77: 653-663.
OFilename: E:\Elmwood.Text.001.Ds5; Page 11
y
List of Figures
Fig. 1. Location of Elmwood Mine relative to the axis of the Nashville dome.
Fig. 2. Generalized stratigraphic sections for Central Tennessee and the Gordonsville area.
Fig. 3. Map showing location of mine workings and the three pilot sampling traverses.
Fig. 4. Geochemical profiles for CI, Br, I, Zn, Cd, Ba, and Mn over an MVT zinc ore body
370 meters down in the sedimentary section.
Fig. 5. Confused geochemical profiles for CI, Br, I, and Zn data from traverse l, an area
that is largely under active cultivation.
Fig. 6. Traverse l Enzyme Leach anomalies over deep ore bodies revealed by ratioing CI,
Br, I, Zn, Cd, and Pb to Mn.
Filename: E:\EImwood.Text.001.Ds5; Page 12
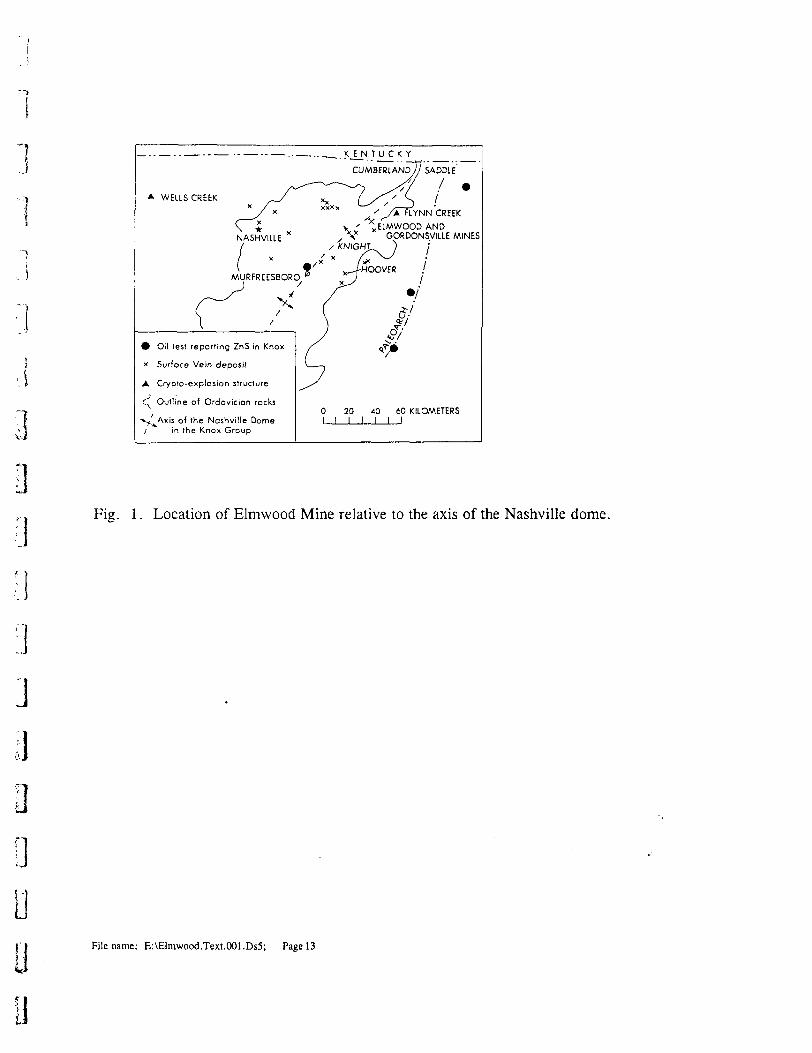
]ELMWOOD AND
GORDONSVILLE MINES
Oil test reporting ZnS in Knox
Surface Vein deposit
Crypio-explosion structure
Outline of Ordovician rocks
Axis of the Nashville Dome in the Knox Group
O 20 40 60 KILOMETERS l l l l l l l
OFig. l. Location of Elmwood Mine relative to the axis of the Nashville dome.
:J J3
O O
Filename: E:\Elmwood.Text.001.Ds5; Page 13
y
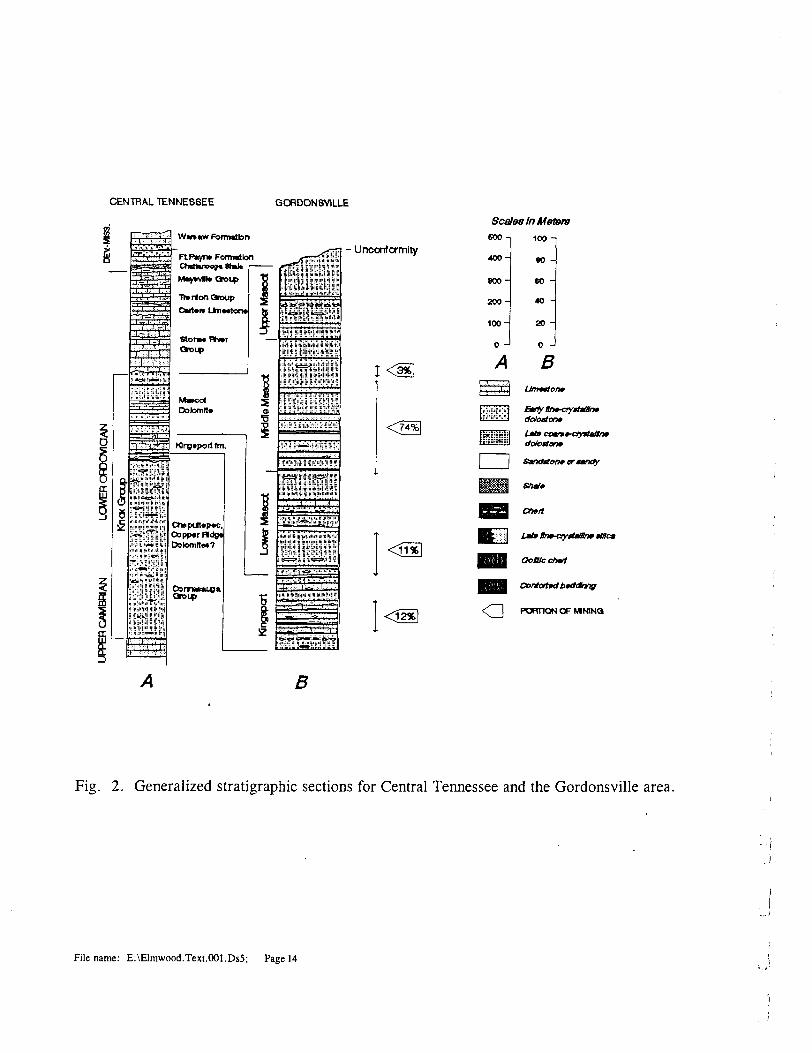
CENTRAL TENNESSEE GORDONSVILLE
5! - Unconformity
B
ScaleslnMatsre600 -
400-
800-
200-
100-
0 -
100 -
*o -
so -
40 -
20 -
0 -
A B\:- "1 M
i.. •••p i' M Umtttcnf
|:R:::H:.: | Ltte cc*r*f-ay*taa.it "" tfo/ettenf
Safx&ton* ertffxty
Ct*!t
Oottfc cfMft
PORTION OF MNINQ
Fig. 2. Generalized stratigraphic sections for Central Tennessee and the Gordonsville area.
Filename: E:\Elmwood.Text.001.Ds5; Page 14
l Fig. 3. Map showing location of mine workings and the three pilot sampling traverses."l
'"l
J
j
o o' I Filename: E:\Elmwood.Text.001.Ds5; Page 15o y
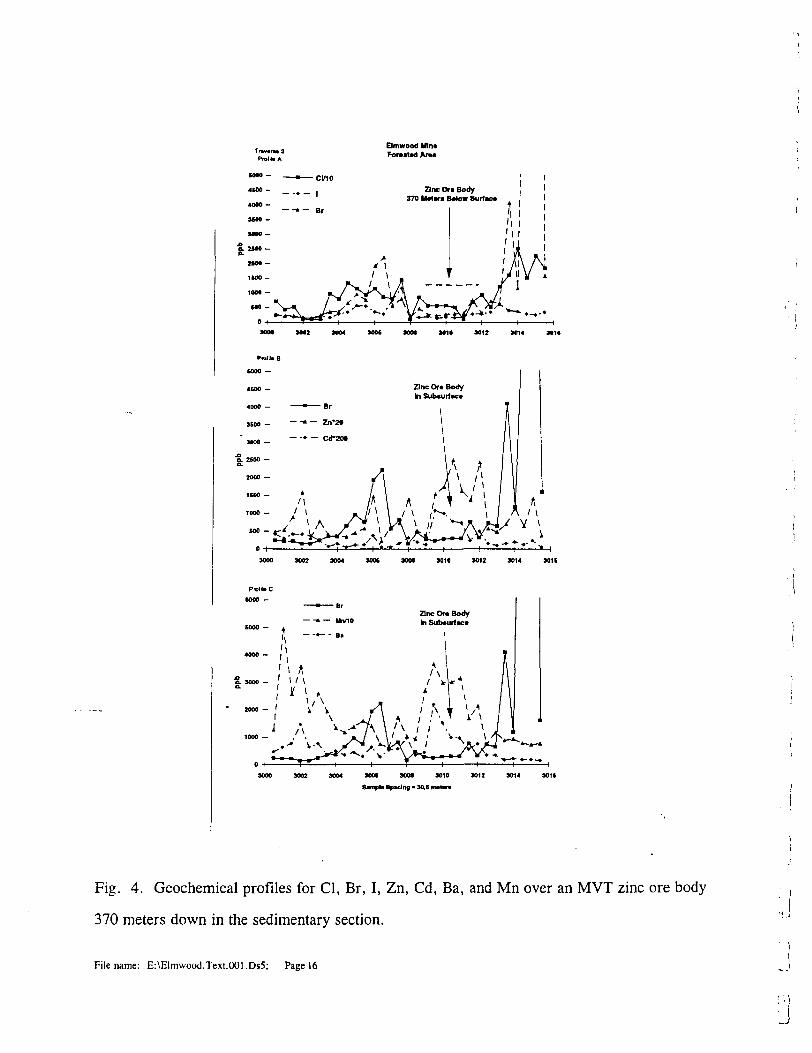
Elmwood Uin* Foreat*d ATM
3000 3002 3004 300C 3001 M10 3012 3014 301 i
3000 3002 3004 3006 3001 3010 3012 3014
Fig. 4. Geochemical profiles for CI, Br, I, Zn, Cd, Ba, and Mn over an MVT zinc ore body
370 meters down in the sedimentary section.
Filename: E:\Elmwood.Text.001.Ds5; Page 16
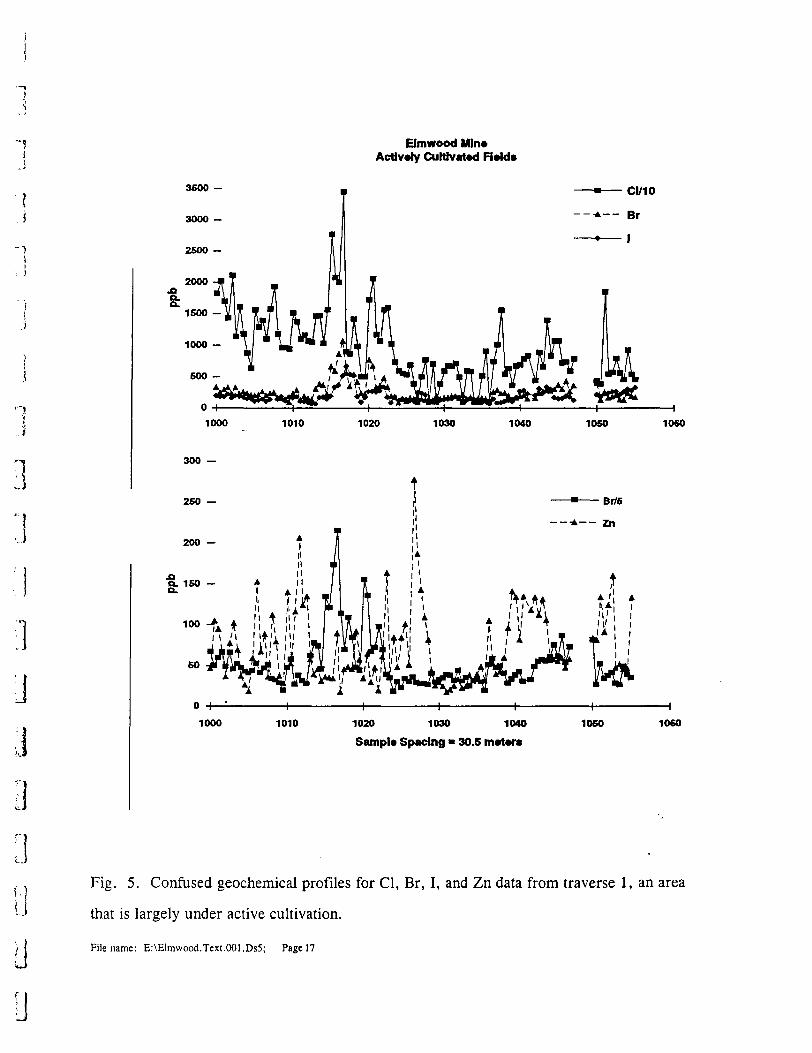
Elmwood Min* Activity Cultivated Firids
O 4 1000
300 —
260 —
200 —
1010 1020 1030 1040 1050
Br/6
O
O O
1000 1010 1020 1030 1040 1050
Sample Spacing " 30.5 m*t*rs
1060
1060
Fig. 5. Confused geochemical profiles for CI, Br, I, and Zn data from traverse l, an area
that is largely under active cultivation.
Filename: E:\Elmwood.Text.OOl.Ds5; Page 17
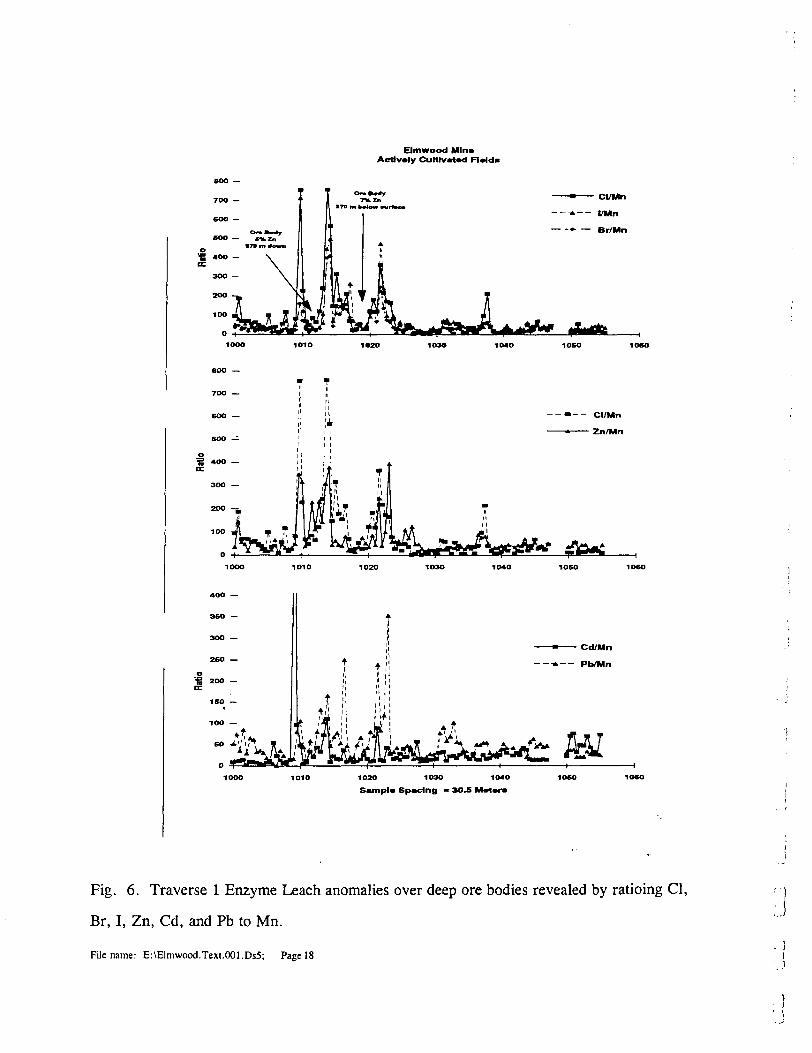
Elmwood Mln* Actively Cultivated Raids
1O2O 1O3O 1O4O
Sample Spacing " 3O.5 Metara
Fig. 6. Traverse l Enzyme Leach anomalies over deep ore bodies revealed by ratioing CI,
Br, I, Zn, Cd, and Pb to Mn.
Filename: E:\Elmwood.Text.001.Ds5; Page 18
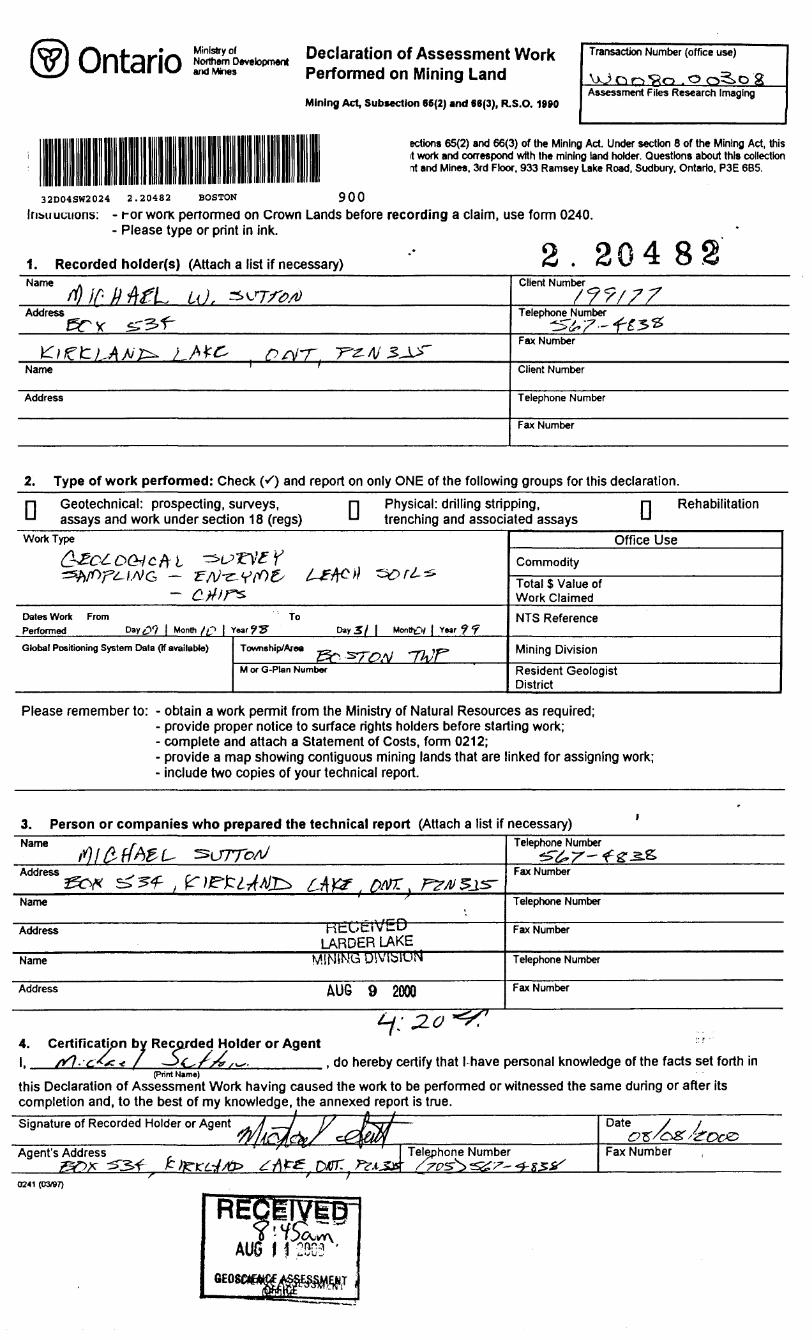
Declaration of Assessment Work Performed on Mining LandMining Act, Subsection 65(2) and 66(3), R.S.O.1990
Transaction Number (office use)
.O 0^.0 2Assessment Files Research Imaging
ectfons 65(2) and 66(3) of the Mining Act. Under section 8 of the Mining Act, this it work and correspond with the mining land holder. Questions about this collection it and Mines. 3rd Floor, 933 Ramsey Lake Road, Sudbury. Ontario. P3E 6B5.
32D04SW2024 2.20482 BOSTON 900
IriMiuuuons: - rorwonx performed on Crown Lands before recording a claim, use form 0240. - Please type or print in ink.
2 9 H 4 R 9 .. .. __ . __ ....--.,-, v ...--.. - .... .. .. ____ .,, * M \J ± **J f*fName A
Address
Knett^AMZz*. i^lC* PrtT T^/l/SJ^"Name ' '
Address
Client Number
Telephone Number
Fax Number
Client Number
Telephone Number
Fax Number
2. Type of work performed: Check (S) and report on only ONE of the following groups for this declaration.Geotechnical: prospecting, surveys, assays and work under section 18 (regs)
Physical: drilling stripping, trenching and associated assays D Rehabilitation
Work Type
QSct-OGlcftl W^ m G ^ f^
Dates Work From Performed Day^?9 | Month (O l '
Global Positioning System Data (If available)
'-'r'COt' l^E-Pfc*) -sor^^.^
To fear?? Day S f | MonOg'l | Year ^f
Township/Area -cz^ i-i if^
M or G-Plan Number
Office UseCommodity
Total S Value of Work Claimed
NTS Reference
Mining Division
Resident Geologist District
Please remember to: - obtain a work permit from the Ministry of Natural Resources as required;- provide proper notice to surface rights holders before starting work;- complete and attach a Statement of Costs, form 0212;- provide a map showing contiguous mining lands that are linked for assigning work;- include two copies of your technical report.
3. Person or companies who prepared the technical report (Attach a list if necessary)Telephone Number
Fax Number
Name Telephone Number
HtGciVED LARDER LAKE
Address Fax Number
Name Telephone Number
Address AUG 9 2000 Fax Number
4. Certification by Recorded Holder or Agentl. /y?, e.**:* , do hereby certify that l have personal knowledge of the facts set forth in
(Print Name)this Declaration of Assessment Work having caused the work to be performed or witnessed the same during or after its completion and, to the best of my knowledge, the annexed report is true.
0241 (03/97)
57RECBWipAUG j i m^'
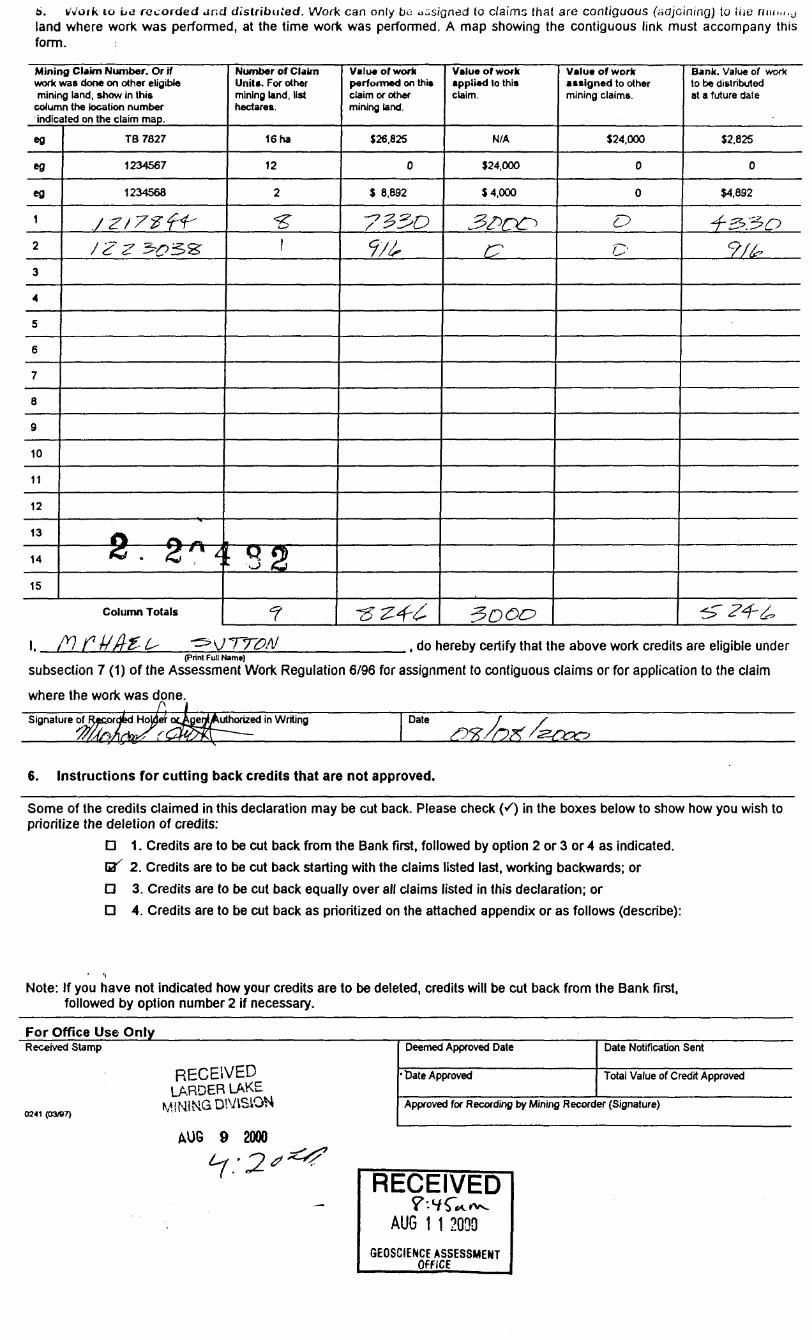
6. vVoik 10 be recorded and distributed. Work can only bo unsigned lo claims that are contiguous (adjoining) to iiie nun.i. j land where work was performed, at the time work was performed. A map showing the contiguous link must accompany this form. ;
Mining Claim Number. Or if work was done on other eligible mining land, show in this
column the location number indicated on the claim map.
eg
eg
eg
1
2
3
4
5
6
7
8
9
10
11
12
13
14
15
TB 7827
1234567
1234568
J 2 1 73 fi'/Z Z 3voSS-
— g. 2^
Column Totals
Number of Claim Unit*. For other mining land, list hectares.
16 ha
12
2
^
l
S2
f
Value of work performed on this claim or other mining land.
526,825
0
S 8,892
-7250
Vt,
-3-24-6
Value of work applied lo this claim.
N/A
124,000
S 4,000
3&OC)
C?
5DOO
Value of work assigned to other mining claims.
S24.000
0
0
Oo
Bank. Value of work to be distributed at a future date
12.825
0
54,892
4-^:^09/k
^ 2+4*
i. , do hereby certify that the above work credits are eligible under(Print Full Name)
subsection 7 (1) of the Assessment Work Regulation 6/96 for assignment to contiguous claims or for application to the claim
where the work was done.Signature of uthorized In Writing Date
6. Instructions for cutting back credits that are not approved.
Some of the credits claimed in this declaration may be cut back. Please check (^) in the boxes below to show how you wish to prioritize the deletion of credits:
D 1. Credits are to be cut back from the Bank first, followed by option 2 or 3 or 4 as indicated.B' 2. Credits are to be cut back starting with the claims listed last, working backwards; orO 3. Credits are to be cut back equally over all claims listed in this declaration; orD 4. Credits are to be cut back as prioritized on the attached appendix or as follows (describe):
Note: If you have not indicated how your credits are to be deleted, credits will be cut back from the Bank first, followed by option number 2 if necessary.
For Office Use OnlyReceived Stamp
0241 (03/87)
RECEIVED LARDER LAKE
MINING DWVSION
Deemed Approved Date
* "Date Approved
Date Notification Sent
Total Value of Credit Approved
Approved for Recording by Mining Recorder (Signature)
9 2000
RECEIVEDAUG 1 1 2090
GEOSCIENCE ASSESSMENT OFFICE
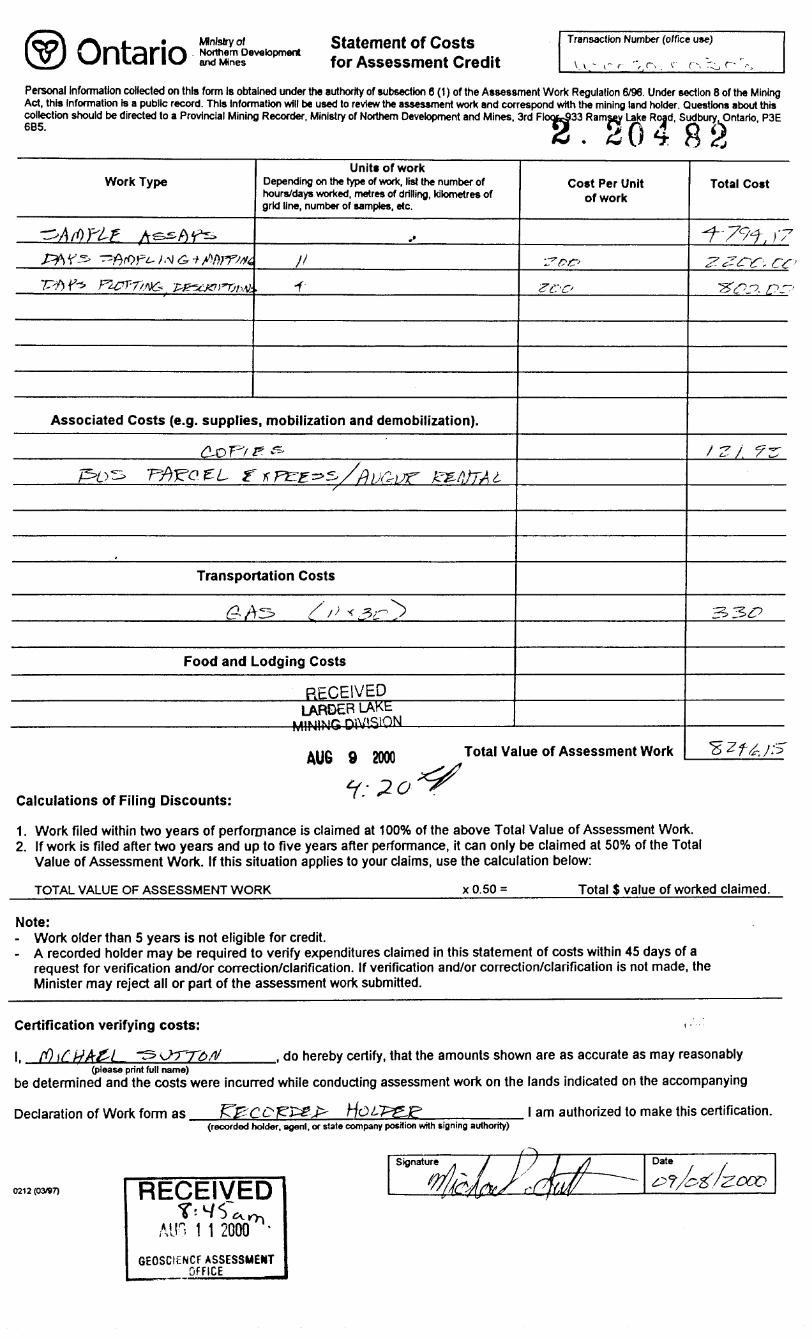
^\ t *c inr PinoV-/I ILCll IW
Ministry ofNomiemand Mines
Statement of Costs for Assessment Credit
Transaction Number (office use)
VA - i.- r "t r-i r r^, r,-, r-
Personal Information collected on this form Is obtained under the authority of subsection 6 (1) of the Assessment Work Regulation 6/96. Under section 8 of the Mining Act, this Information Is a public record. This Information will be used to revtew the assessment work and correspond wtth the mining land holder. Questions about this collection should be directed to a Provincial Mining Recorder, Ministry of Northern Development and Mines, 3rd Floo^33 Ramsay Lake Road, SudburyJDntario. P3Eoad
Work Type
™^^"j j\ /Y\ V*1*x 1? A ,-^-- ^*r A AJ^f ' •— •"•y / j /*/ 7 t**' f yT *— -"*""™* */ i ~~**
/^*y V-S" ~^P)rf)^L- /.^ gr-t jfifoFfWt,
T^f)^ ri^t^.-j&xiarrjM.,
Units of workDepending on the type of work, list the number of hours/days worked, metres of drilling, kilometres of grid line, number of samples, etc.
^
f)
-f"
Associated Costs (e.g. supplies, mobilization and demobilization).
dLoPV*?^
PDS. TfrFQ-tL f.trez^/ftvcrinr Fz/tfrAts
Transportation Costs
^AS // ; ^J5iT^
Food and Lodging Coste
RECEIVEDLARDER LAKE
MINING DiV'S^^
Cost Per Unit of work
r PC*
ZC'C*
AUG Q 9flflfl Total Value of Assessment Work
Total Cost
-f~79f , } -7
Z? Z tt', CC'
^^^ rr.
t z j 7-5
^3^)
*SZf6j*
Calculations of Filing Discounts:1:20
1. Work filed within two years of performance is claimed at 100"}*) of the above Total Value of Assessment Work.2. If work is filed after two years and up to five years after performance, it can only be claimed at 5QVo of the Total
Value of Assessment Work. If this situation applies to your claims, use the calculation below:
TOTAL VALUE OF ASSESSMENT WORK x0.50 = Total $ value of worked claimed.
Note:- Work older than 5 years is not eligible for credit.- A recorded holder may be required to verify expenditures claimed in this statement of costs within 45 days of a
request for verification and/or correction/clarification. If verification and/or correction/clarification is not made, the Minister may reject all or part of the assessment work submitted.
Certification verifying costs:
l. ___, do hereby certify, that the amounts shown are as accurate as may reasonably(please print full name)
be determined and the costs were incurred while conducting assessment work on the lands indicated on the accompanying
Declaration of Work form as Hc^T^P(recorded holder, agent, or state company position wHh signing authority)
l am authorized to make this certification.
0212 (03*7) RECEIVEDAtto 1 1 2000
GEOSCIENCF ASSESSMENT OFFICE

Ministry of Ministere duNorthern Development Developpement du Nordand Mines et des Mines Ontario
Geoscience Assessment Office 933 Ramsey Lake Road
October 10, 2000 6th FloorSudbury, Ontario
MICHAEL WILLIAM SUTTON P3E 6B5BOX 534KIRKLAND LAKE, Ontario Telephone: (888) 415-9845P2N-3J5 Fax: (877)670-1555
Visit our website at: www.gov.on.ca/MNDM/MINES/LANDS/mlsmnpge.htm
Dear Sir or Madam: Submission Number: 2.20482
Status Subject: Transaction Number(s): W0080.00308 Approval
We have reviewed your Assessment Work submission with the above noted Transaction Number(s). The attached summary page(s) indicate the results of the review. WE RECOMMEND YOU READ THIS SUMMARY FOR THE DETAILS PERTAINING TO YOUR ASSESSMENT WORK.
If the status for a transaction is a 45 Day Notice, the summary will outline the reasons for the notice, and any steps you can take to remedy deficiencies. The 90-day deemed approval provision, subsection 6(7) of the Assessment Work Regulation, will no longer be in effect for assessment work which has received a 45 Day Notice. Allowable changes to your credit distribution can be made by contacting the Geoscience Assessment Office within this 45 Day period, otherwise assessment credit will be cut back and distributed as outlined in Section #6 of the Declaration of Assessment work form.
Please note any revisions must be submitted in DUPLICATE to the Geoscience Assessment Office, by the response date on the summary.
If you have any questions regarding this correspondence, please contact LUCILLE JEROME by e-mail at [email protected] or by telephone at (705) 670-5858.
Yours sincerely,
ORIGINAL SIGNED BYSteve B. BeneteauActing Supervisor, Geoscience Assessment OfficeMining Lands Section
Correspondence ID: 15311 Copy for: Assessment Library
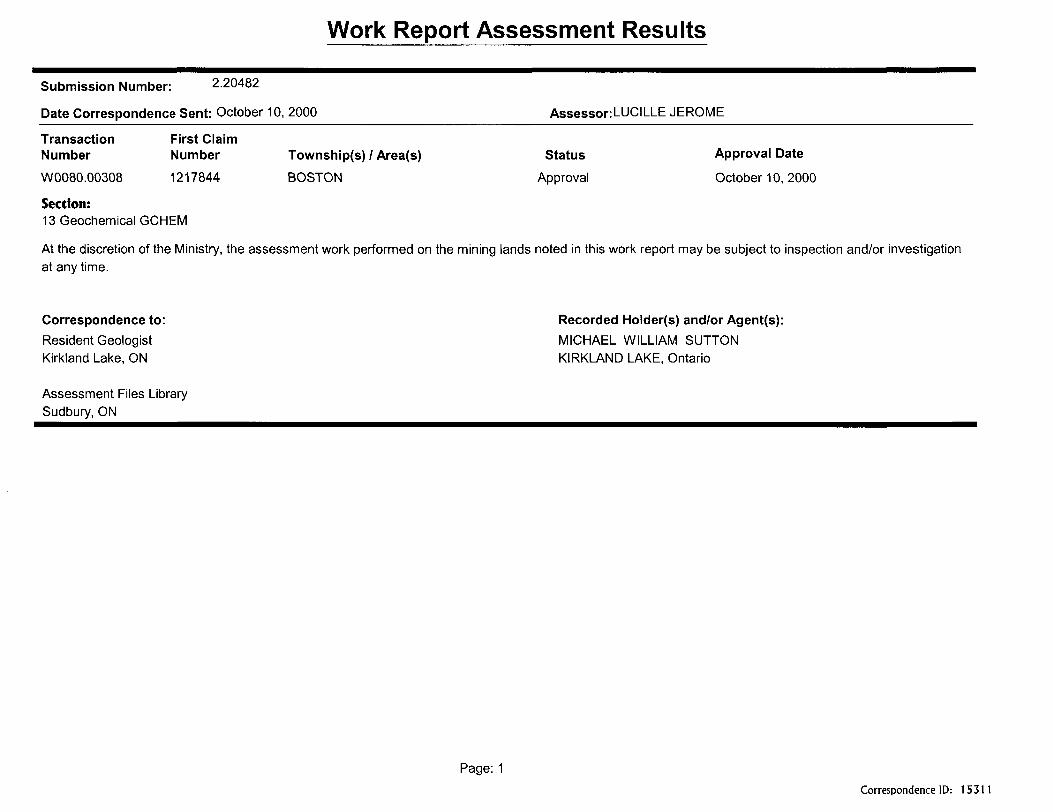
Work Report Assessment Results
Submission Number: 2.20482
Date Correspondence Sent: October 10, 2000______________________Assessor:LUCILLE JEROME^^^^^^^^^^^^^^^^^
Transaction First ClaimNumber Number Township(s) l Area(s) Status Approval Date
W0080.00308 1217844 BOSTON Approval October 10,2000
Section:13 Geochemical GCHEM
At the discretion of the Ministry, the assessment work performed on the mining lands noted in this work report may be subject to inspection and/or investigation at anytime.
Correspondence to: Recorded Holder(s) and/or Agent(s):Resident Geologist MICHAEL WILLIAM SUTTONKirkland Lake, ON KIRKLAND LAKE, Ontario
Assessment Files Library Sudbury, ON
Page: 1Correspondence ID: 15311
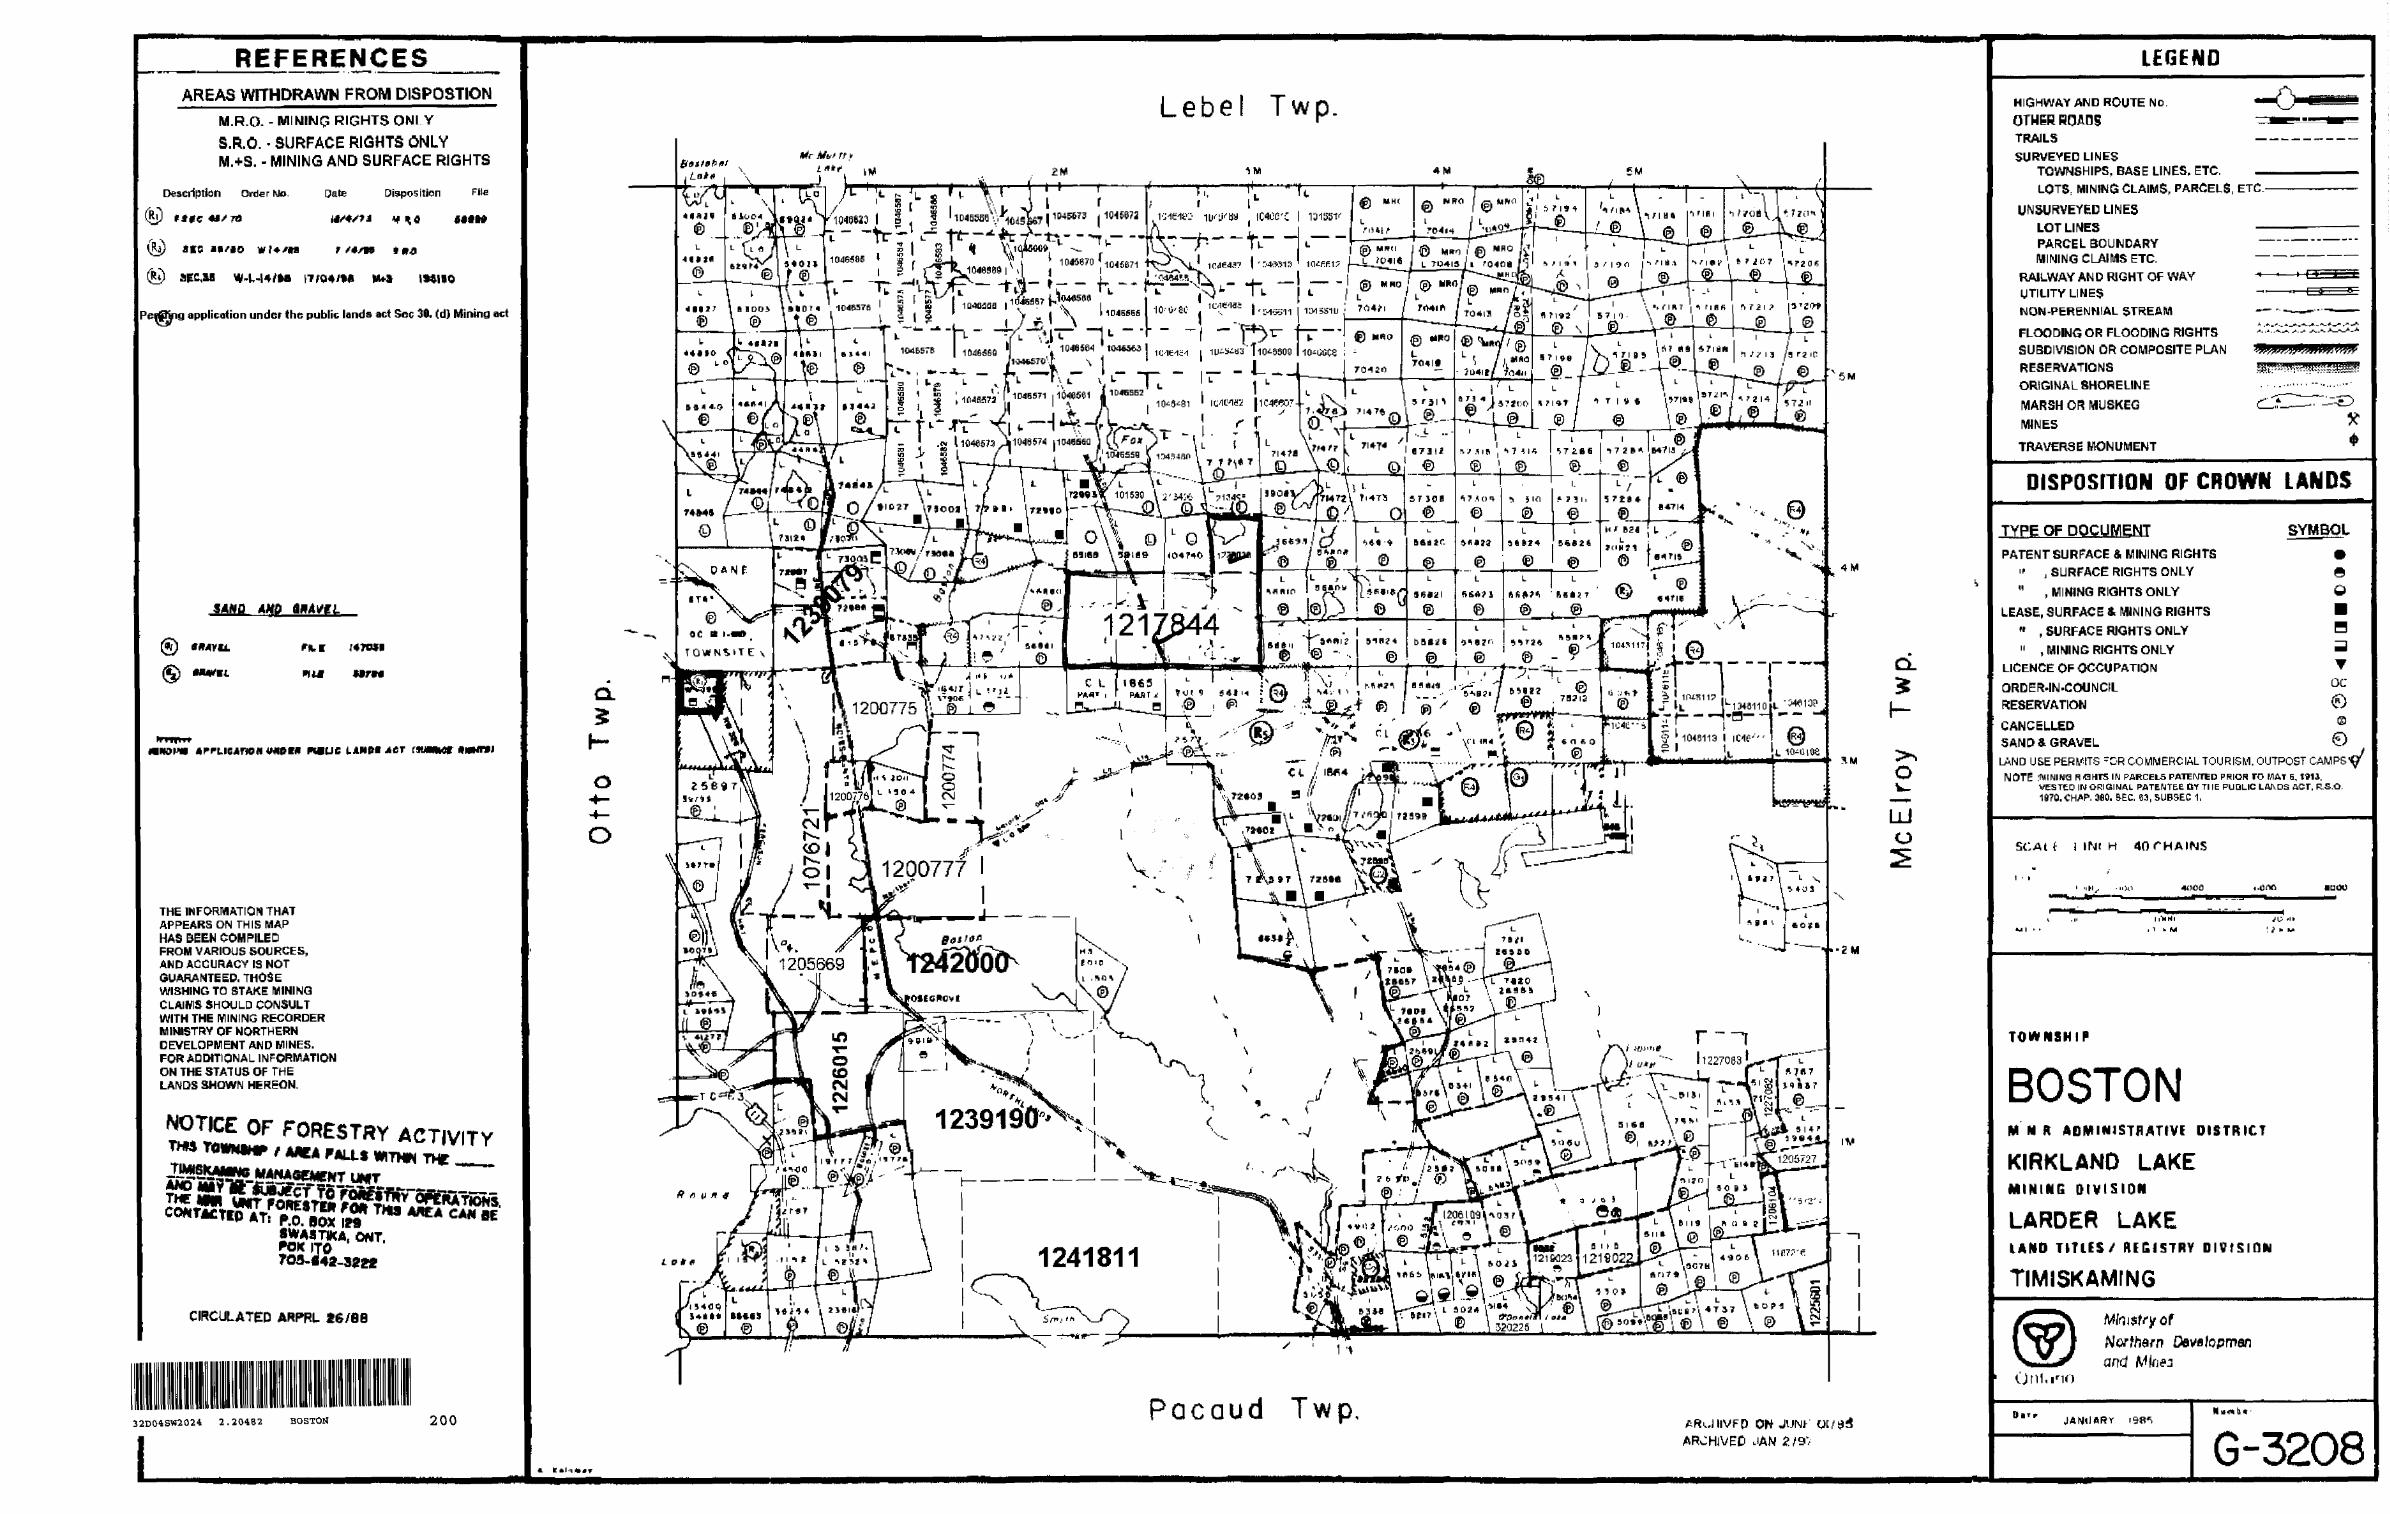
REFERENCESAREAS WITHDRAWN FROM DISPOSTIOH
M.R.Q. - MIMING RIGHTS ONI Y
S.R.O. - SURFACE RIGHTS ONLY M.+S. - MINING AND SURFACE RIGHTS
Description Ortier NO. Date Disposition File
J * age us70 a/4/11 v no ttttt
A EC if/io wf+stfl r ttste tito
IS*IBO
evBVig application under the public lands act Sec 30. (d) Mining act
SAND MD
f K, f 1470*1
THE INFORMATION THAT APPEARS ON THIS MAP HAS BEEN COMPILED FROM VARIOUS SOURCES, AMD ACCURACY IS NOT GUARANTEED. THOSE WISHING TO STAKE MINING CLAIMS SHOULD CONSULT WITH THE MINING RECORDER MINISTRY OF NORTHERN DEVELOPMENT AND MINES. FOR ADDITIONAL INFORMATION ON THE STATUS OF THE LANDS SHOWN HEREON.
JJMlSKMKNi
FOREST*Yf MCA FAUt
CIRCULATED ARPRL 26/06
32D04SW2024 2.20452 BOSTON 200
Lebel Twp.
CL3
o
o
© (g) ^ -"^
1D46S71 i 1616561 i 1DJIE5E2
.- ' \ **
1200777
" - - ' J SO^B
" '-—J"~—^.
1239190——.-^nf ©*T^ /." ---i:'i
fi u fi * T*^?T,.
1241811*j*A.—-3f-—
Pacaud Twp,JAW 2 /9V
UJ U
LEGEND
HIGHWAY AND ROUTE NoOTHER ROADSTRAILS —
SURVEYED LINESTOWNSHIPS, BASELINES, ETC. — LOTS: MINING CLAIMS, PARCELS, ETC,
UN SURVEYED LINES LOT LINES PARCEL BOUNDARY MINING CLAIMS ETC. -
RAILWAY AND RIGHT OF WAY UTILITY LIMES NON-PERENNIAL STREAM
FLOODING OR FLOODING RIGHTSSUBDIVISION OR COMPOSITE PLANRESERVATIONSORIGINAL SHORELINEMARSH OR MUSKEGMINES
TRAVERSE MONUMENT
DISPOSITION OF CROWN LANDS
TYPE OF DOCUMENTP ATE NT SURFACE S MINING RIGHTS
" , SURFACE RIGHTS ONLY " , MINING RIGHTS ONLY
LEASE, SURFACE 4 MINING RIGHTS " , SURFACE RIGHTS ONLY 11 , MIMING RIGHTS ONLY
LICENCE OF OCCUPATION
ORDER-IN- COUNCILRESERVATION
SYMBOL
*eQ
T oc;
CANCELLEDSAND 4 GRAVEL ©LAND USE PERMITS "OR COMMERCIAL TOURISM. OUTPOST CAMPS yNOTE IWININQ PARCELS PATENTED PRIOR TO MAT 6, t91i.
VESTED IK ORIGINAL PATENTEE BY Tl IE PUBLIC Lfll\DS ftCT, R.S.O. 1970.CH/1P, 380. &EC, 63, S-UBSEC 1,
t l 1N( H
4(100 •UOO
nVlHl , i i. M : i f f
TOWNSHIP
BOSTONM M ft ADMINISTRATIVE DISTRICT
KIRKLAND LAKEMINING DIVISION
LARDER LAKELAUD TITLES/ REGISTRY DIVISION
TIMISKAMING
W m* h*
G-3208
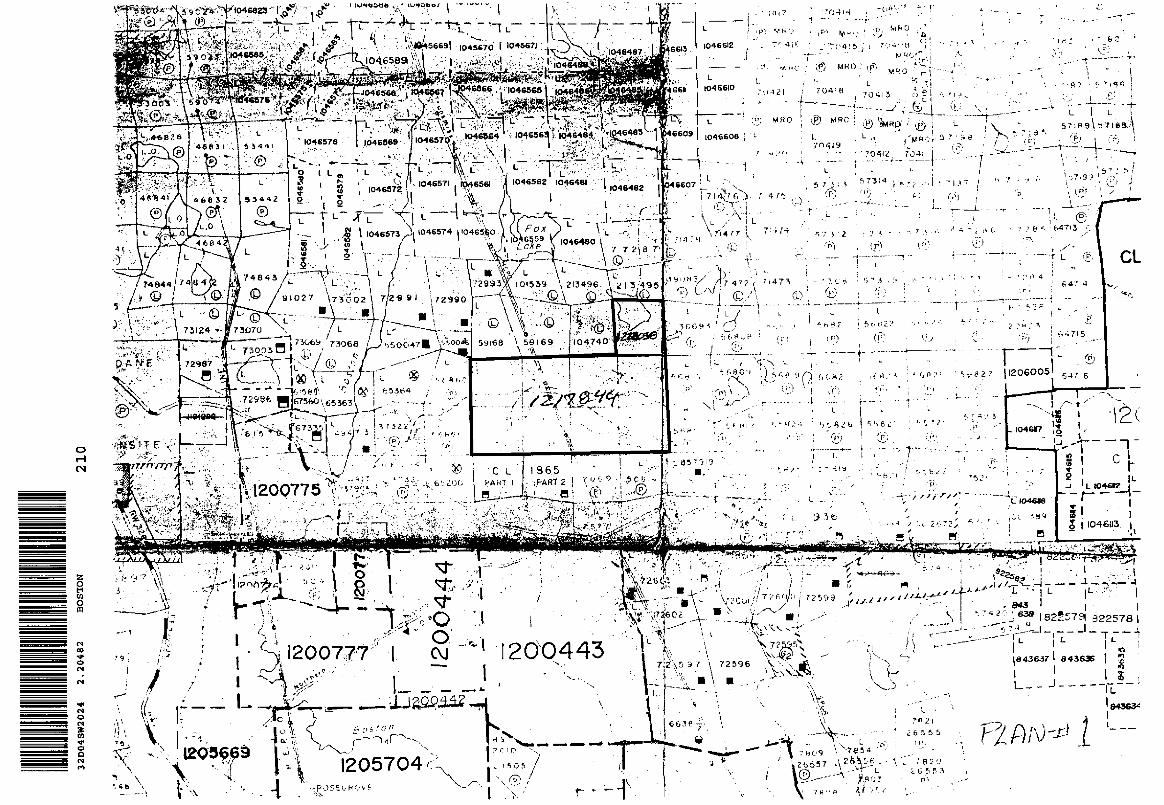
32D
04SW
2024
2.
2048
2BO
STO
N21
0
i 5
, -.
tj --
.i ",
-A t
t-ii
ir j S
*gt
B^L
j' ff
"i
'''; -
- ~
if^'*
r
i'3-
* T'
' 'o
"
!?\
S3
L^
; u-^
r "
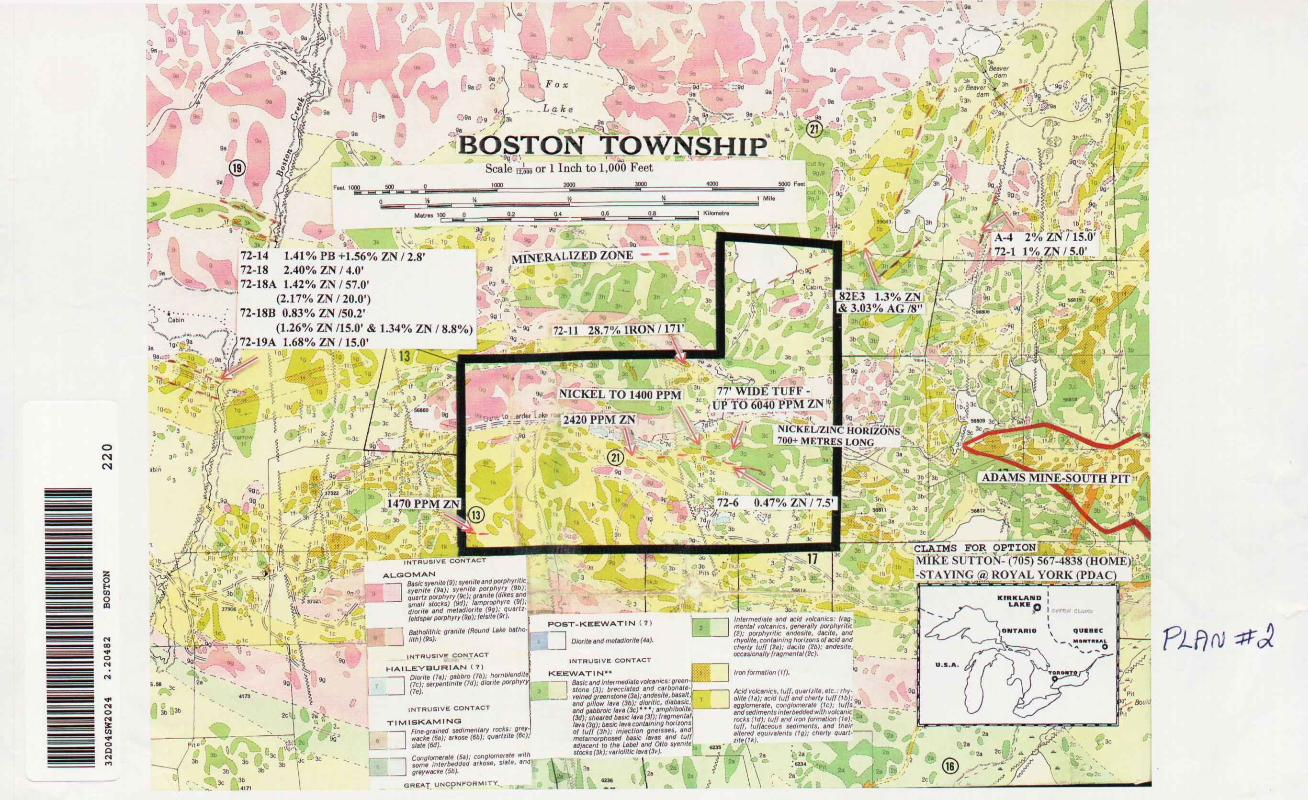
oOJ
Scale gJB or l Inch to 1,000 FeetJCOO 3000
^'r^arifc - - V™' *,:72-14 1.41 07o PB -H.56% ZN 1 2.872-18 2.40 07o ZN 1 4.0'
I72-18A 1.42VoZNy57.0'1.3 07oZN
AG/8"72-18B 0.83 07oZNy50.272-1128.7%lRQN /J?!'"
NICKEL TO 1400 PPM ^ T^WIDE TUFF -V UP TO 6040 PPM
NICKEL/ZINC700+ METRES LONG
ADAMS MINE-SOUTH Pi
1470 PPMe f
r: 3"
CLAIMS FOR OPTION MIKE SUTTON^(7ri5) 567-4838 (HOMI
•X: ----"(-STAYING (a), ROYAL YORK (PDAC)•V Mf- -j - - :- r-.-^-""1-.-- " -. inr~ r . -., -i . , f.
syenite (9a); syenite porphyrr (90), Qutrt, porphrry (Se); ff'amle f**es ano sms'J siocfts) C9dJ; lamprophyie (St), aioiite and metaaio'ite Os); ouarli-
porphyry (9p); felsite (Sr). and ac/fl ni/ojo/canics, generally porphyritic
il): porphyritic andesite, dacite, ana , containing noruons at acid and tuft (2al; dacite (20);
occasionally fragmental fjc)-INTRUSIVE CONTACT
HA1UEYBURIAN !7)KEEWATIN"
Basic and intermeaiate volcanicsJIB (3J, Orecc/aletf and carfionile-
eined greenstone (3a); andesite, basalt, Acid I'cfcflmcs, (uff, quartzite, elc, - rfty- D/'le (f*); acid luff and cherty luff ((o); agglomerate, conglomerate (TcJ; anasedimentslnterbedded with volcanic rc**s f'dj; luW andiron formation (TeJ,- (u(/. tutlKeous sedimenls, anfl IftEif
eou/ve/enfs fJoJ; cftwfjf Qua/I-
and pi/few lau (50); diotitic. tfiaflasic. antf gaOOfo/c /ava (3c) ' ' *; ampniOolitet
MM (3/J; fragmenta containing nari2ons
ol lull (3n); in/ection oneisses, andftas/c 'avas and
adjacent to tne Label ana Otto syenite, stocks (3k}: variolitic lava ft*},
TIMISKAMINGftne-fliarnetf sedimenlsry IOCKS: grey wac*e (6a); acSose ffifij; querliile ffc)
Conglomerate (Sal,- conglomerate w some interbtniaea a ffi ose, slate, dn flfey*ae*e (56J,
GREAT UNCpNFORMITY,,
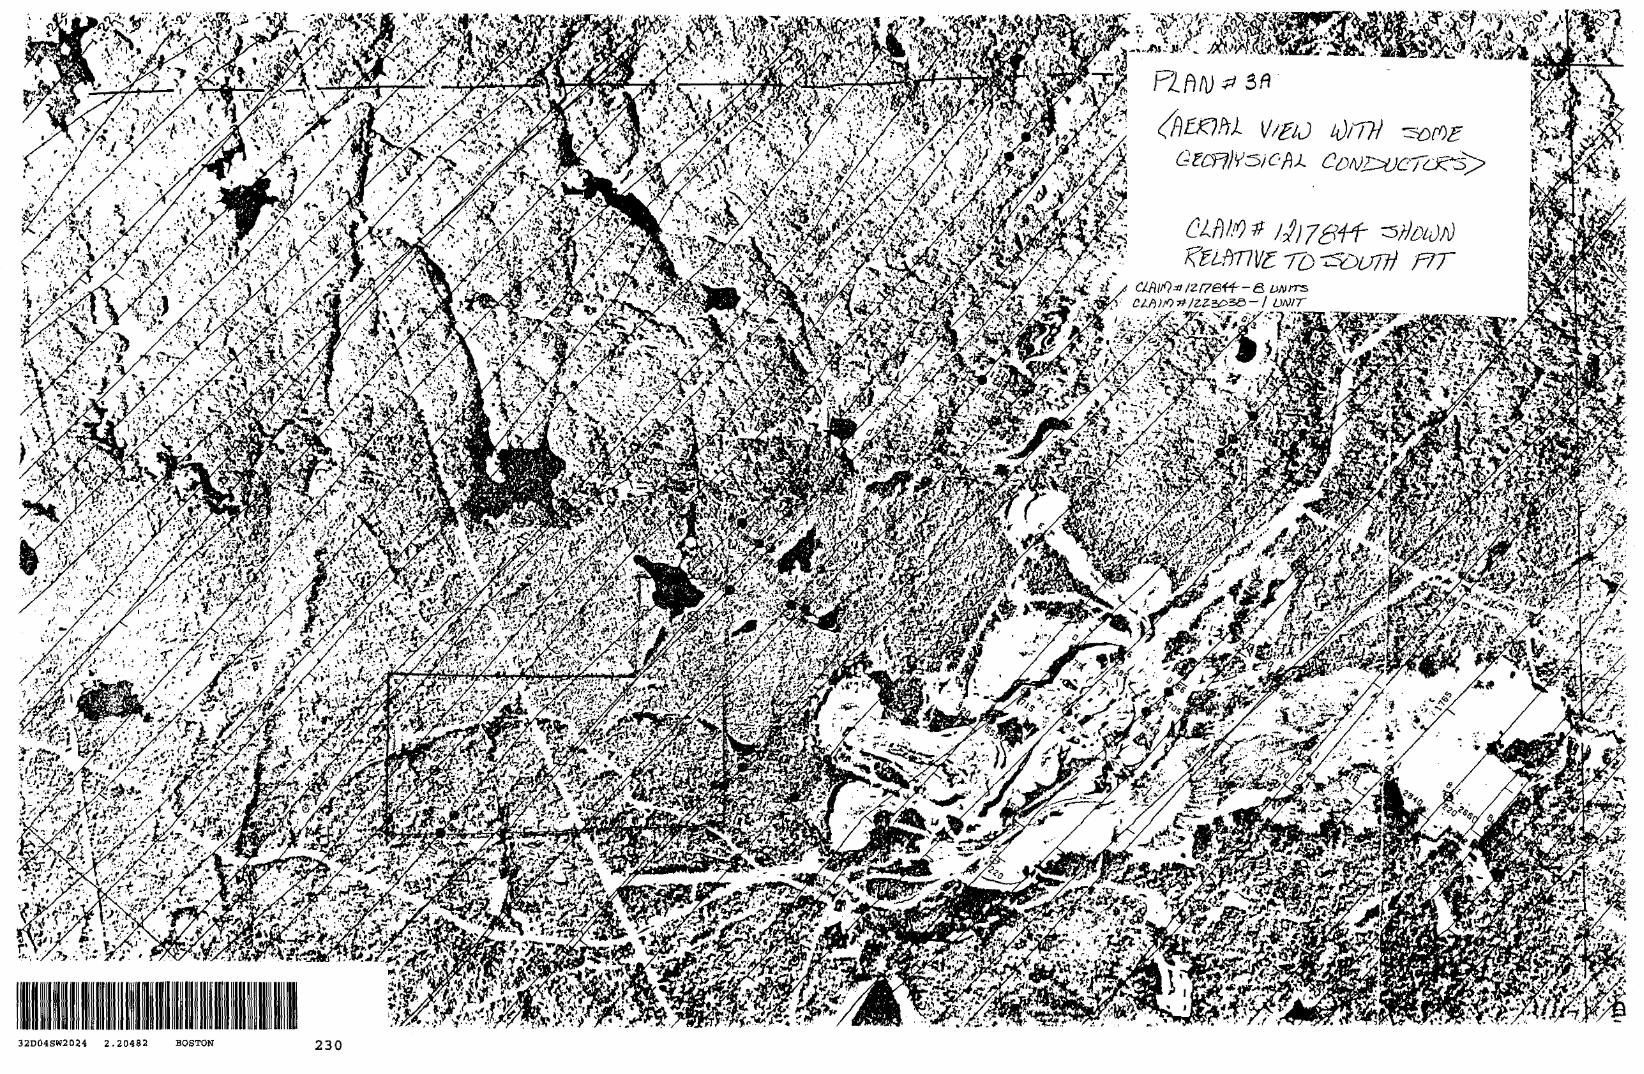
ff w *ff r i -j V. r* k J ' 'V^'fJ^^* ' i* -' T^f - ^^™fwf
32D04SW2024 2.20432 BOSTON 230
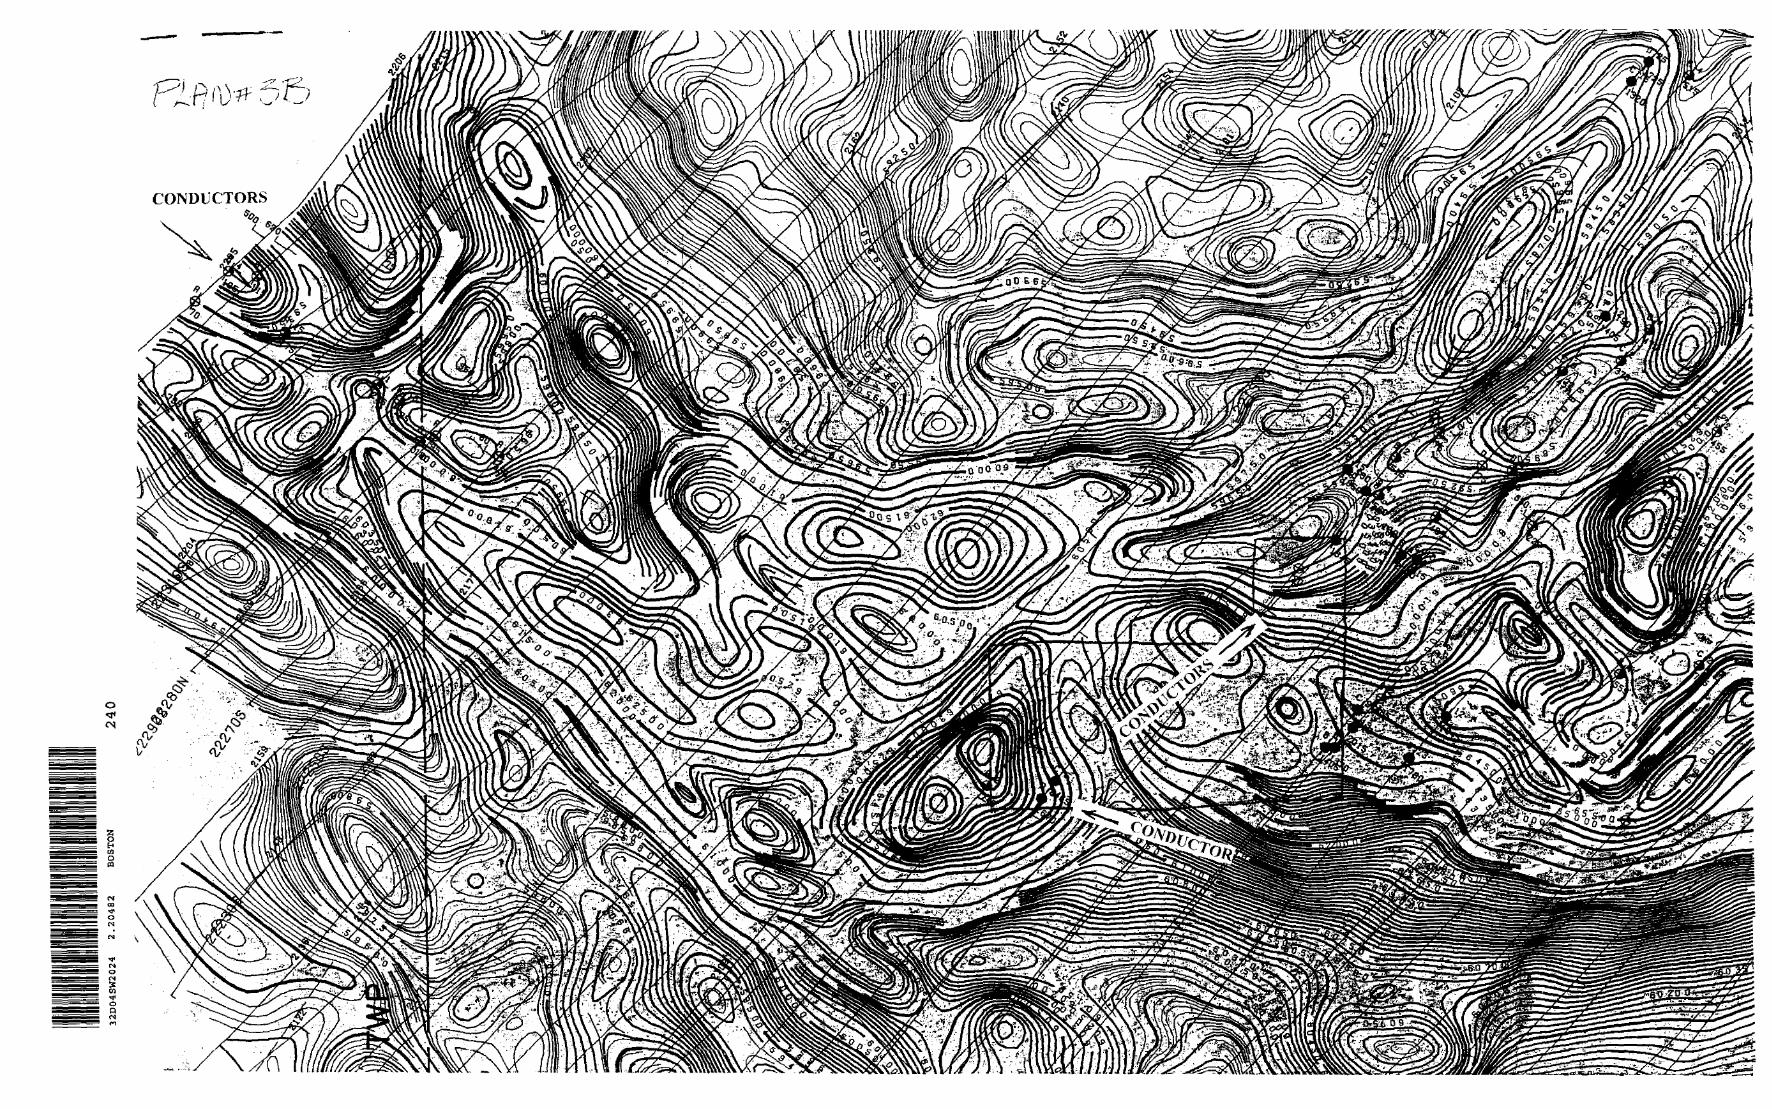
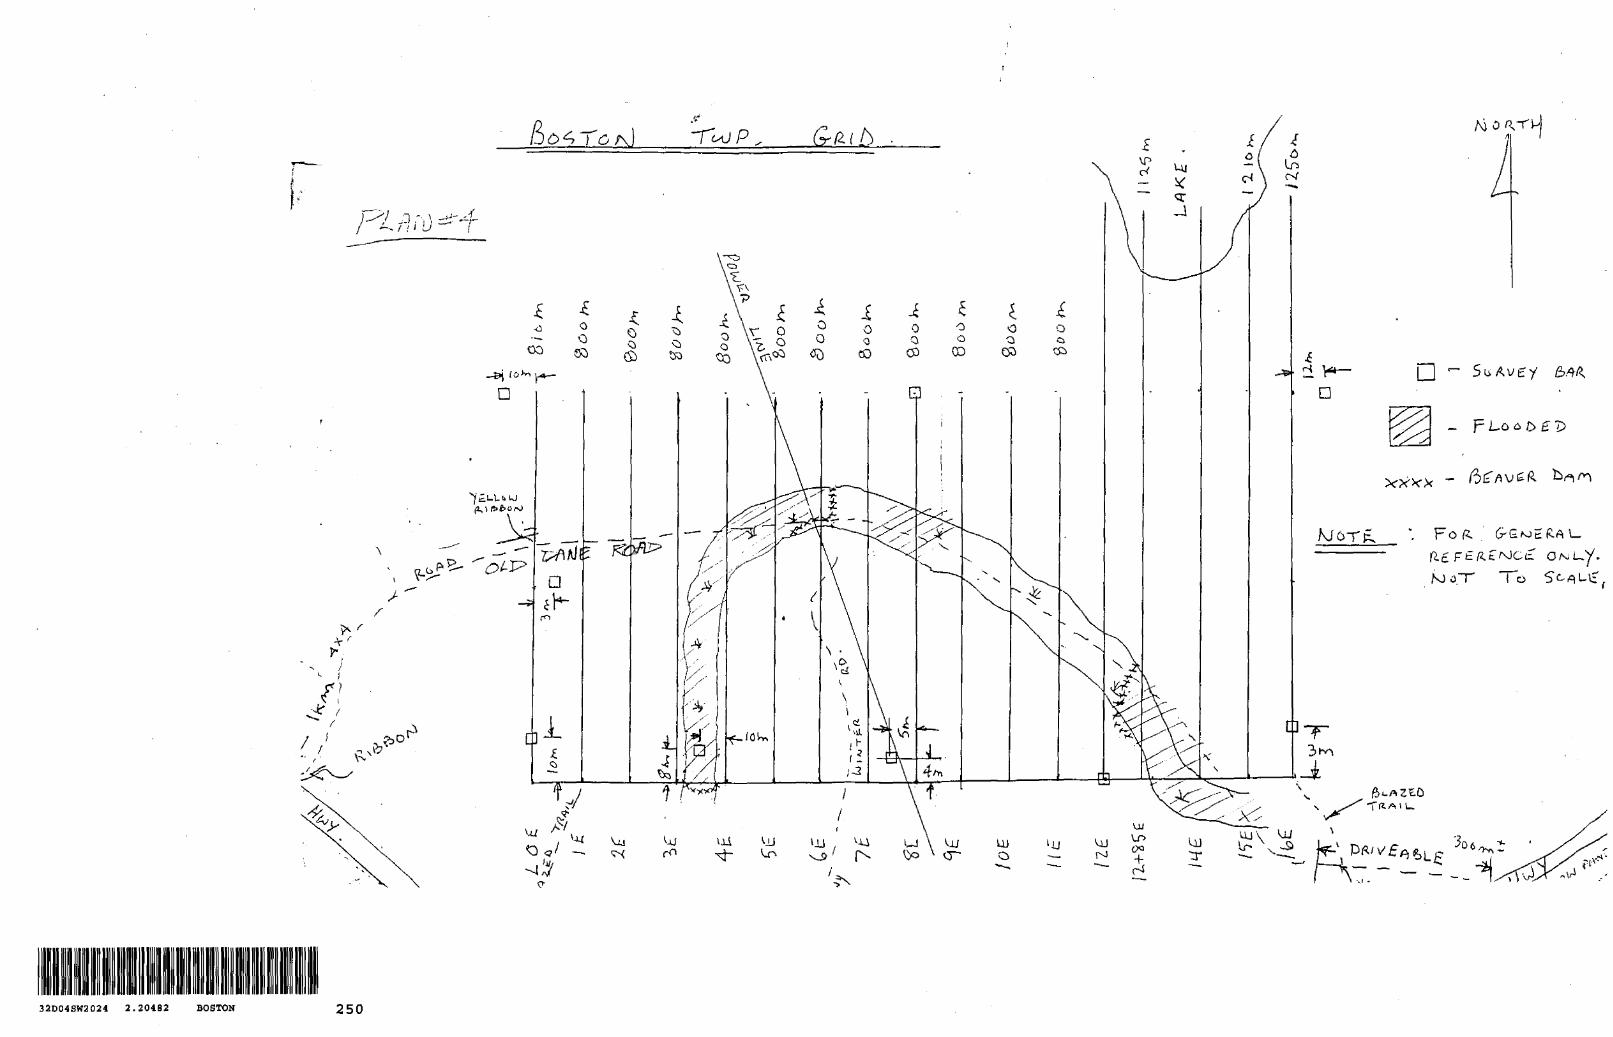
32D04SW2Q24 2.20482 BOSTON 250
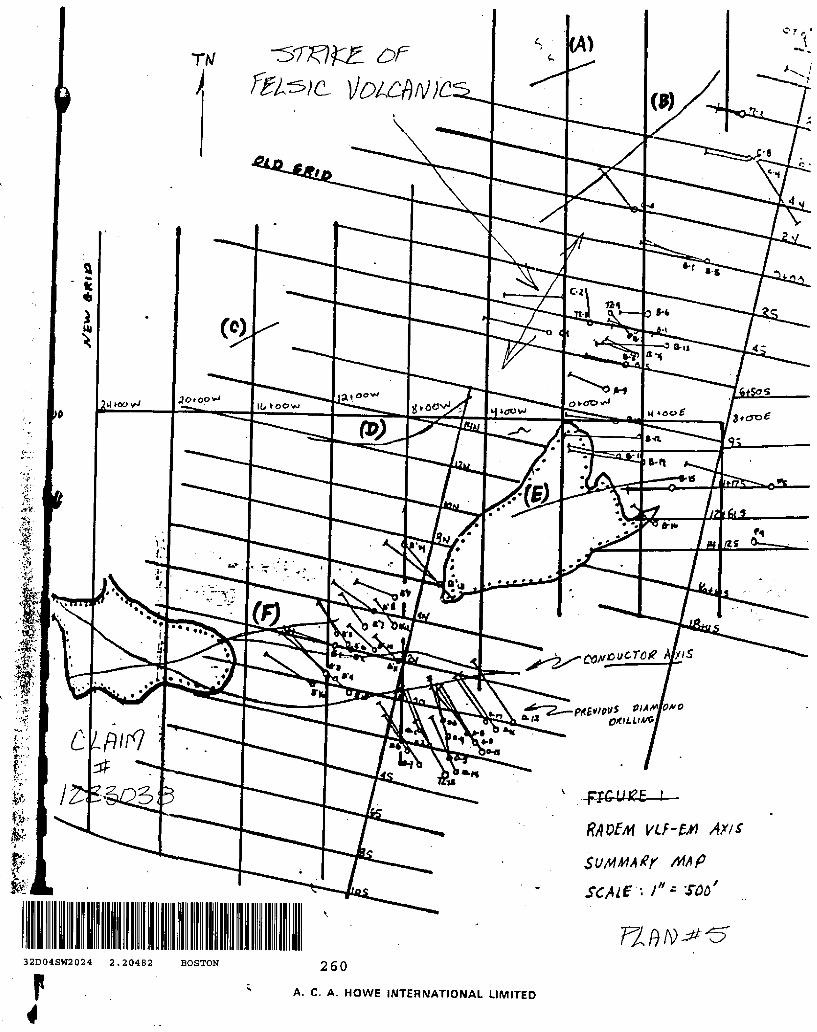
f?/? OfM VLF-W Ay l S
SUtfMA#r M* Psew-1**™*
32D04SW2024 2.20482 BOSTONr 260
A. C. A. HOWE INTERNATIONAL LIMITED
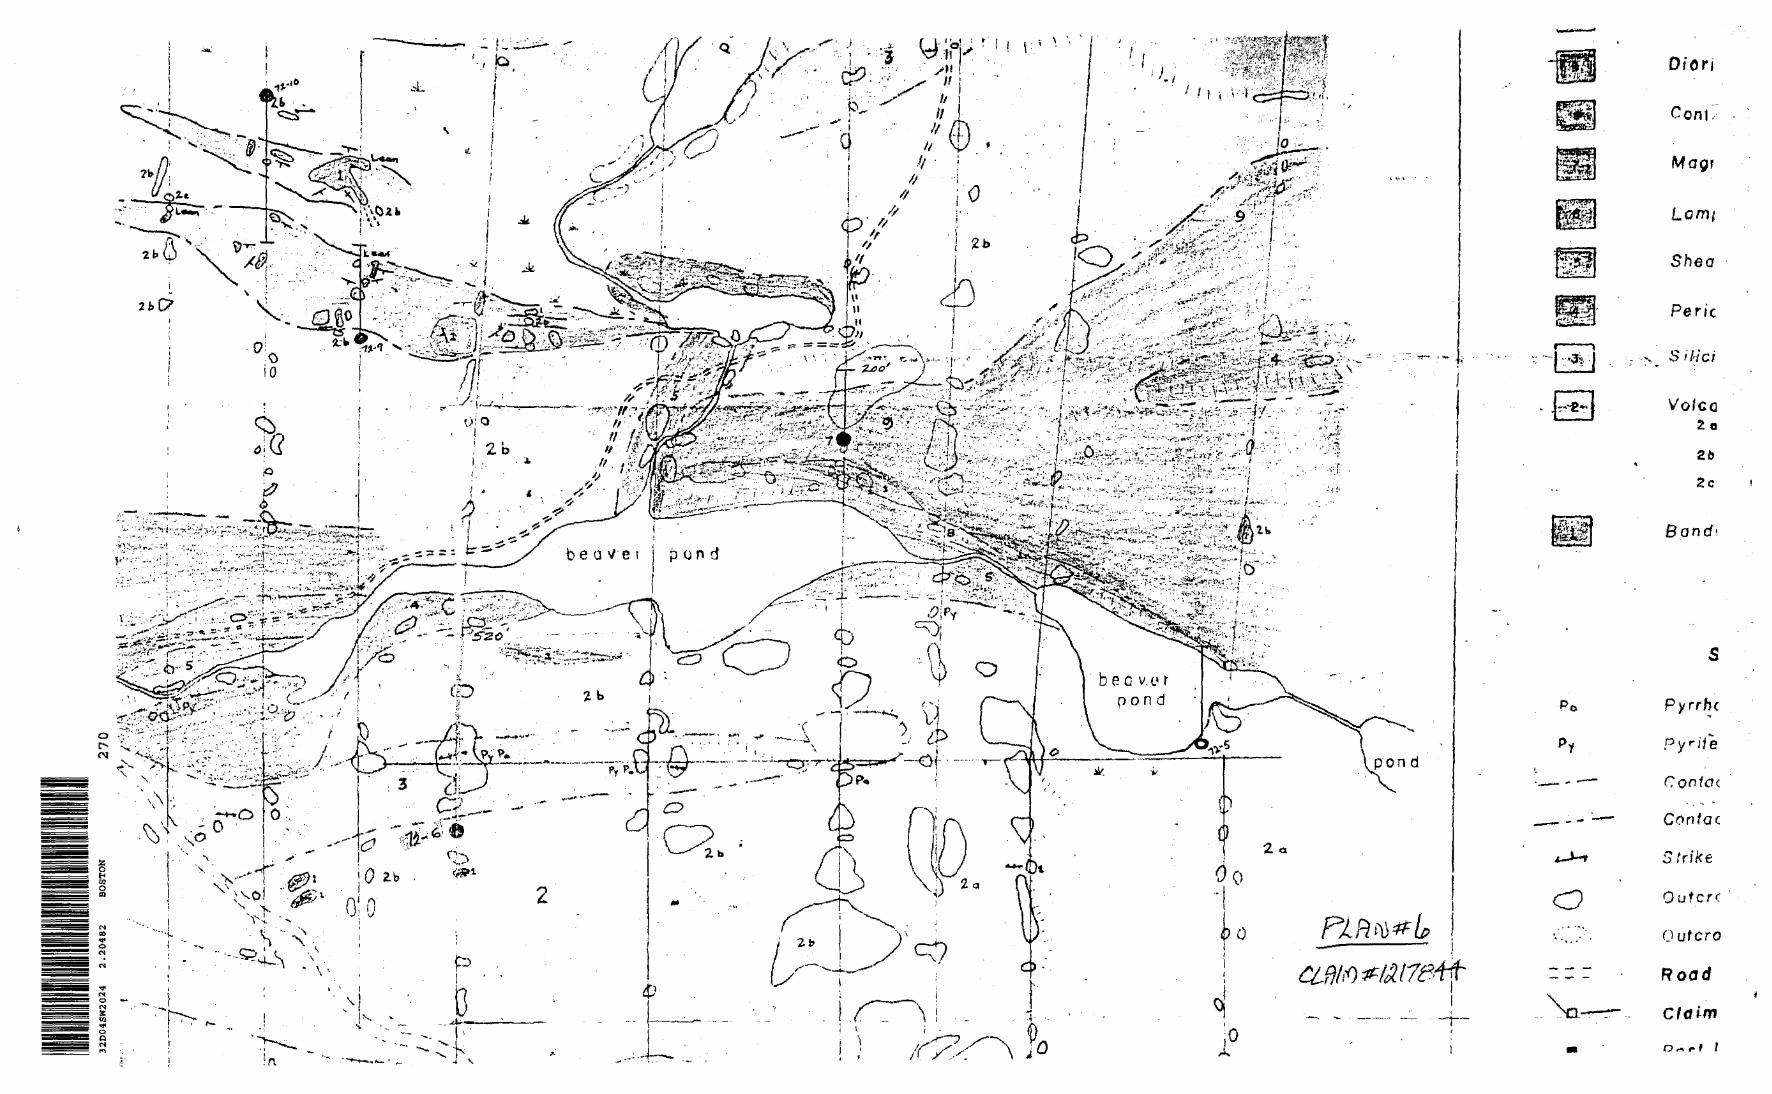
32D04SW2024
2.20482
BOSTON
l
270
l
, t
•' ^ m
. .--/*
f.mft
#vi#^
*,^m
fm^m
m-
f
't iM
\.c
^.,,
,..,
"cp"
O
" ^
Vt* V
. *
v**"
o
w
^M
iW:4
fLo
fr
ey P
7
CL
, a
*ifp
iix#
vW
;•^
•••i
* ^lu
*'
.?H
:."*!
;fc ^'iH
^i
' 'i
mff^A
ll:^
'*
ftfe&
l1 -1
v^7
S'
•Ua
f^ ^5^
\sm
? s rv'
^'^
;V4k
?^if^^
j,^.:;
;:.^,;
;}i;.;
v\ "v
vi'-
1( ^
f^f.""
''''; V
llft
I^l^
t4^ll,.
..:j^ fe
^
if .p
If t, - ^l^i\A
^
r^-'^:
:;'1 ;i '
^ '^
"*-:'
''?fk
;r- V'
l'^i'',
'' :^~
''-';V
-i\N
-r
f/Sfi^
r-'V-
j'-S-!,
!- v^
'J^ .; V.
r-. j'.'.
,-~i '
^ '-.,:'
''^'V
v i
' - ;;,
'-'~-
.f fe
y MW
-m -f^
ft is&
i&a
-^ v^
v'.
?q--
--~
-H9*^
;-U
i:V^i
^l;;..
v^ '"-
.:-
- :.
-:\l ~
4\ f^
. v^
'..
'V.-
:
:':.-.
-si,
n^T
^rfr
s-W
^..-
'- ':
: '.
- ";-
•.-•
--i'SW
A -'•;
- "
r:.r:
.'^1
^^'^
"^-'
----
-^^^^!'
-' -
--. '-
•-.-
^^^-
te^,
:-:i-
\:-V:
K^VO
^
iio o
l i
XI
O
0 ) 1 -,
o a T*- 3
^i o Q Q.
o C
0 ~1 o
O c o -t ,~\
C'j
-^
^r
(Ti
O o 3
,-S"
'J^
l
n o 3 •-+1 o /^
v
"D ve T S"'
03 QN
Mf)
er
a Q
:/ OJ' "
i. o
T)
(b05 rr tt. Q
o 3Q
O
O
OO
o
'
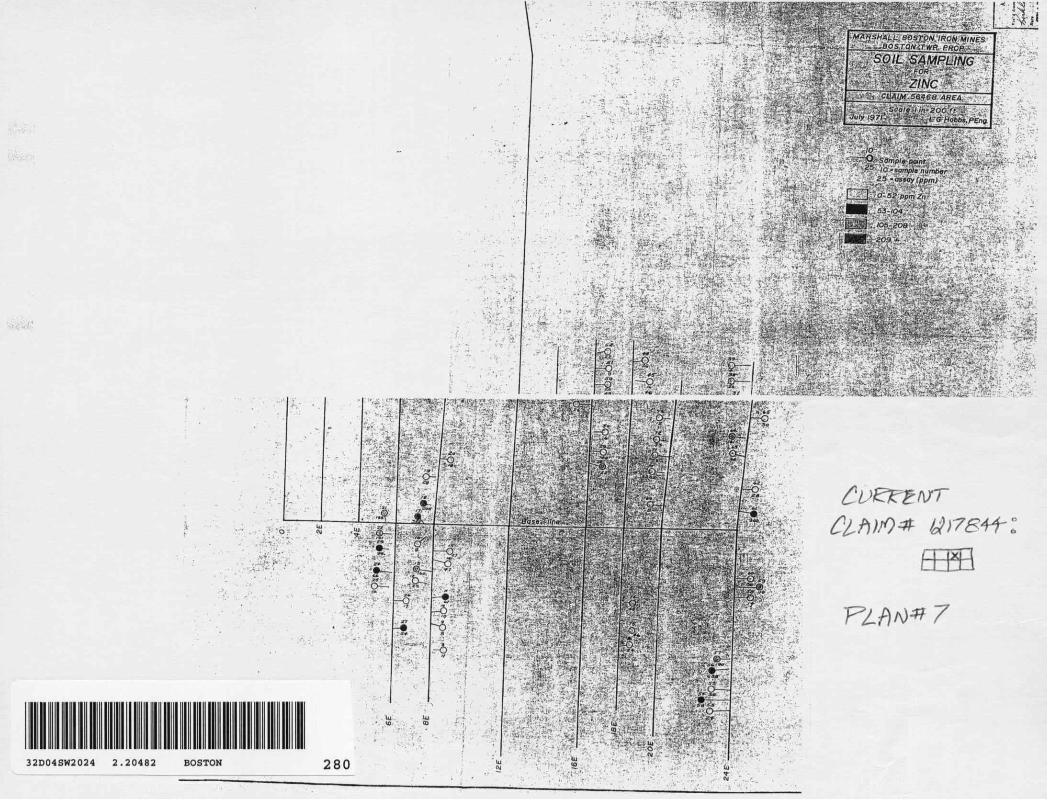
MARSHALL. BOSTON.IRON-MINES ' '
-' - --fe ' "-" r ' ;
" , ^:'^y^^^l^^-: ^.^^sl^'^^l-' i^^^ff^^^if^-- felsiu-
" ^ i - •-•-'±-- ' : i&'fyfc&r.'* '..\ ViJ^-ftia'^.--.-- i..",! y'**-•-•'.-i?" .'J:*;?-; '..-'AS^^'^-'V' "C-—W' i*^' 1
- ^'- '. ^ '"'"-it. |- . J'-*1 '•'•."rfsii'tJi.'-T•"," 1 -*wS*w'fe* s**'^sE'-'"' "••",' i'-''..'7. J'^.Vf-^f T-5-;.- - .- .^r '' •i^4!i*?Vi--iV-.3a!f*fe'S.*ft':i;.
l _ LliL^^^'^-S^^lj^-- 1 1^ Vj:..:.-:
32D04SW2024 2.20482 BOSTON
CfiM,;.;.';^-.;v-^pr— l l-'-; f;-/' '" ---,-' - . - .-.-.^^^.V^IS ^:-.:'"'; i "•"'•^•l iRlLJ J 5; - -I.* ' -,-''-'- - ::'" ; ;.V - ':-' - •-••' -- ^ f-tt ^^
l ^^ ^^SH'^^i^&^j^^^^^g^^'-^--
ffffi7
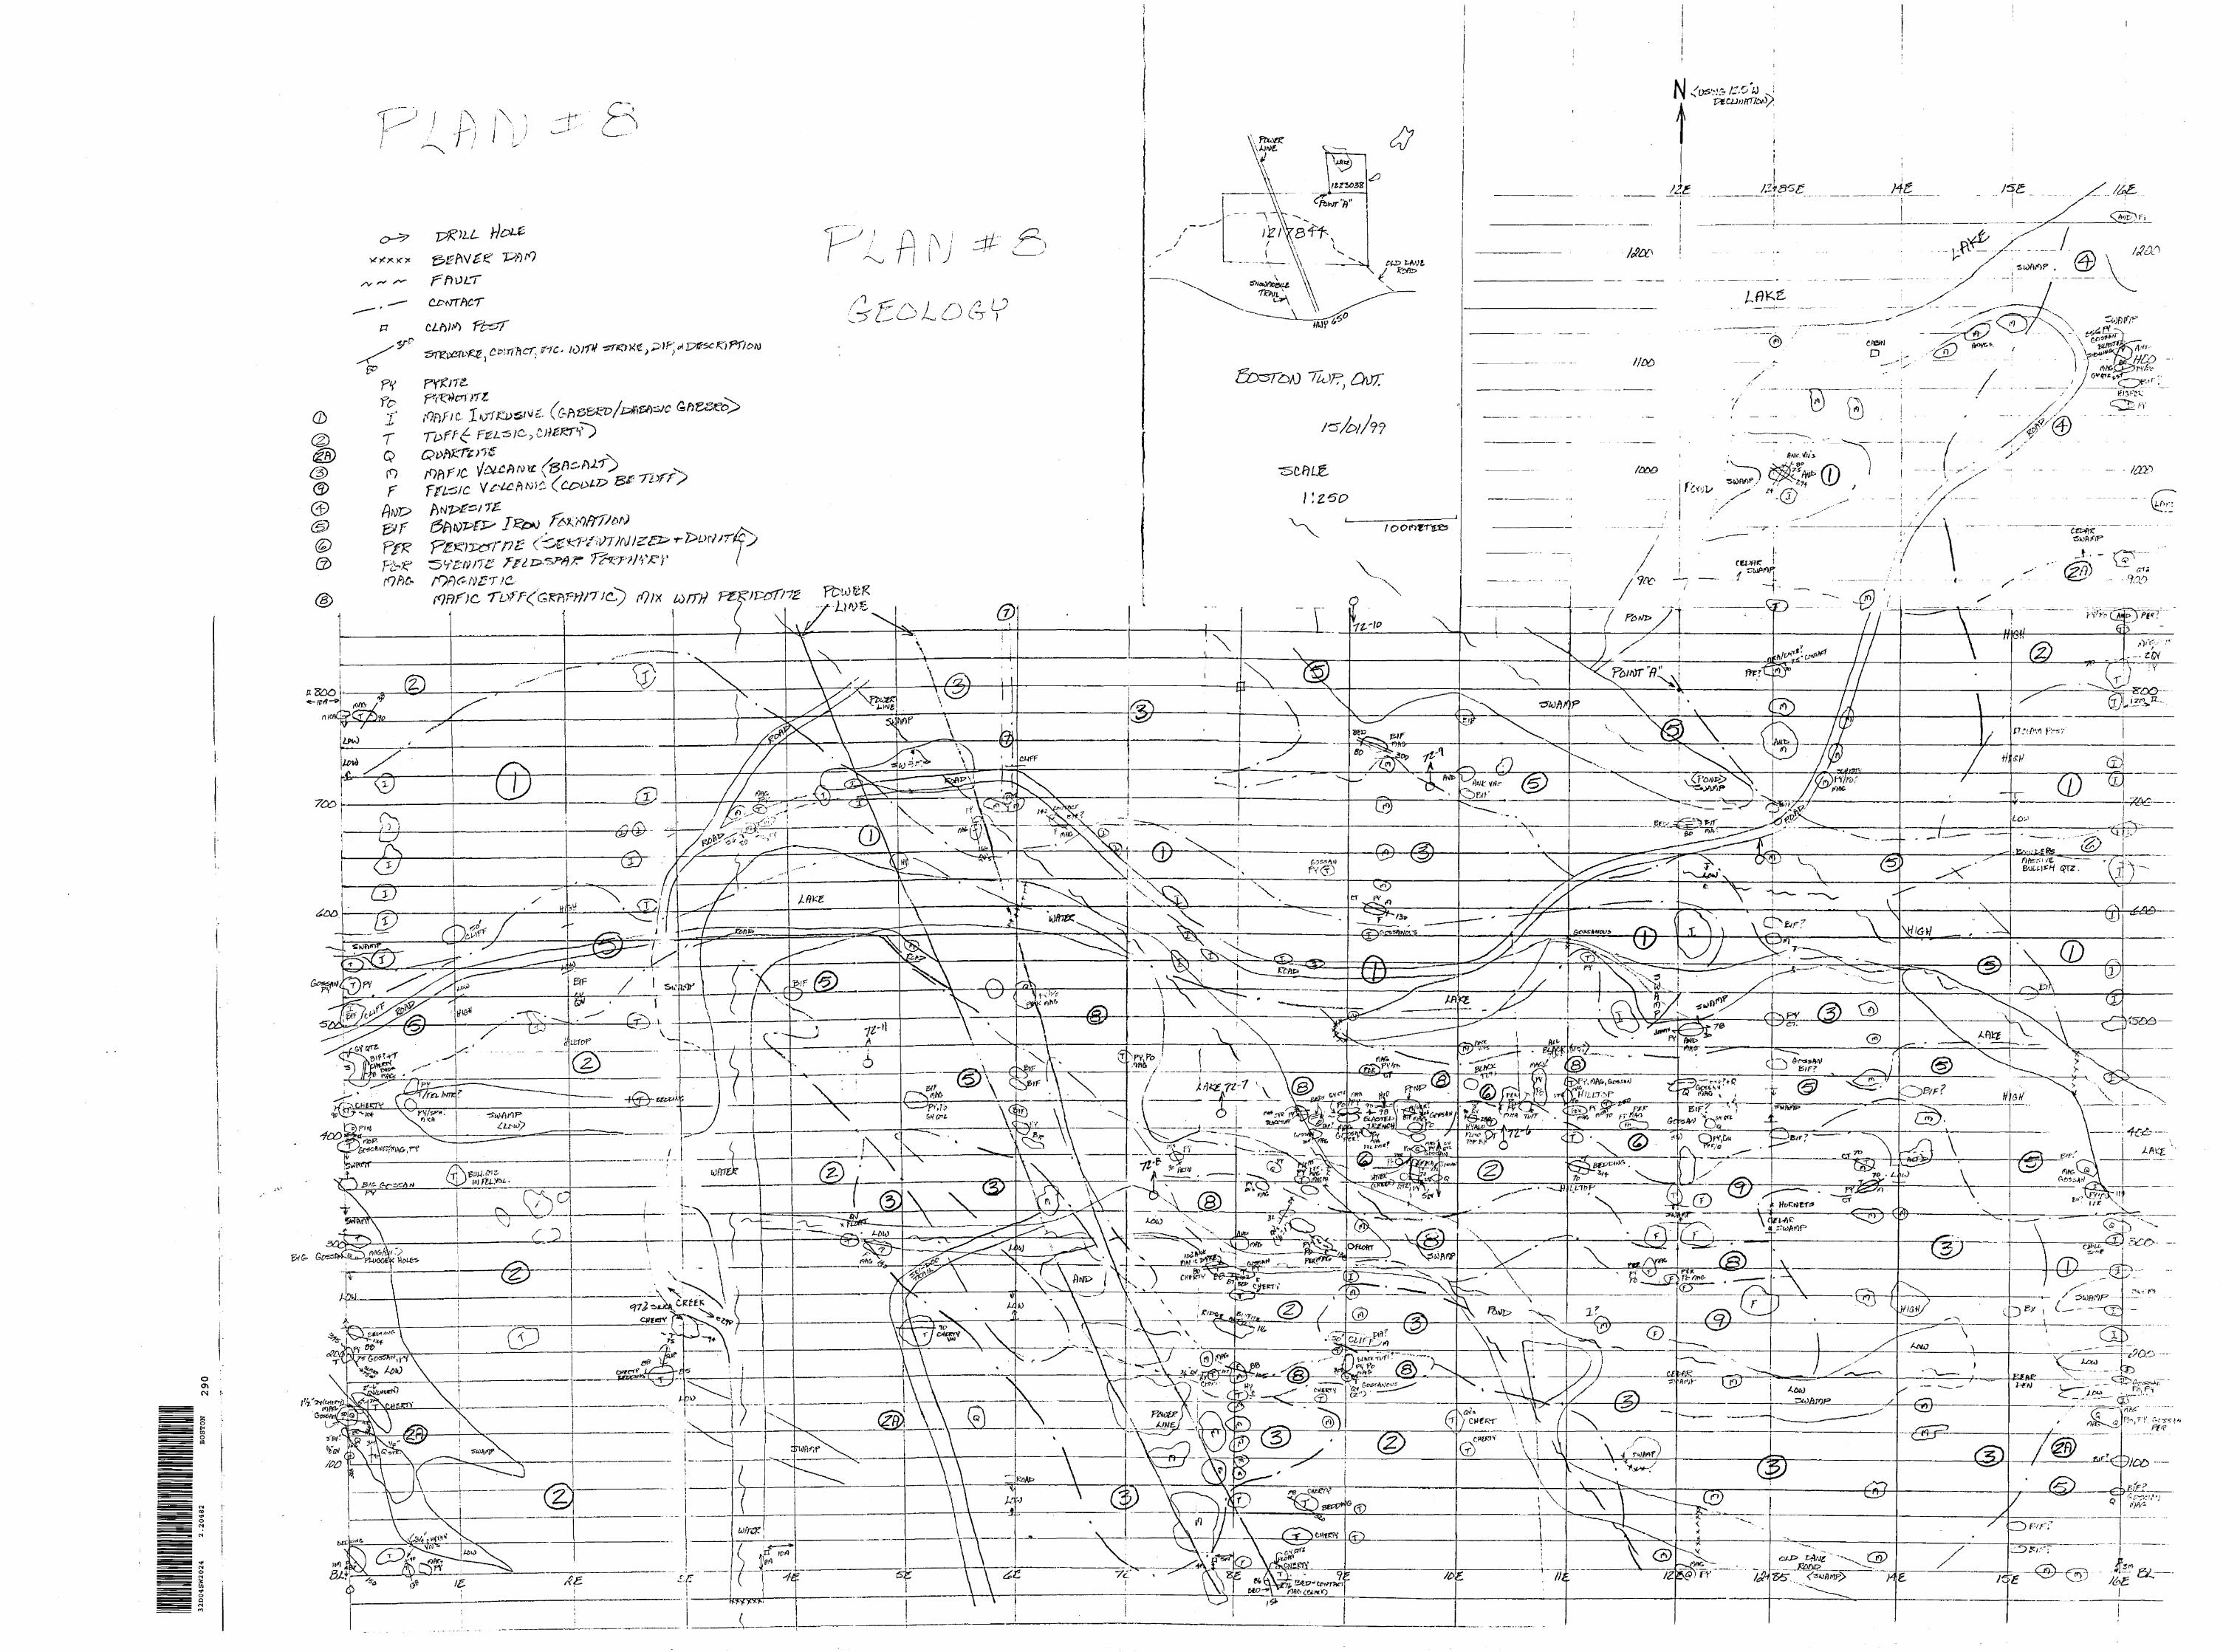
32D
04SW
2024
2.
2048
2BO
STO
N29
0
&1
s•V
fco^
i o
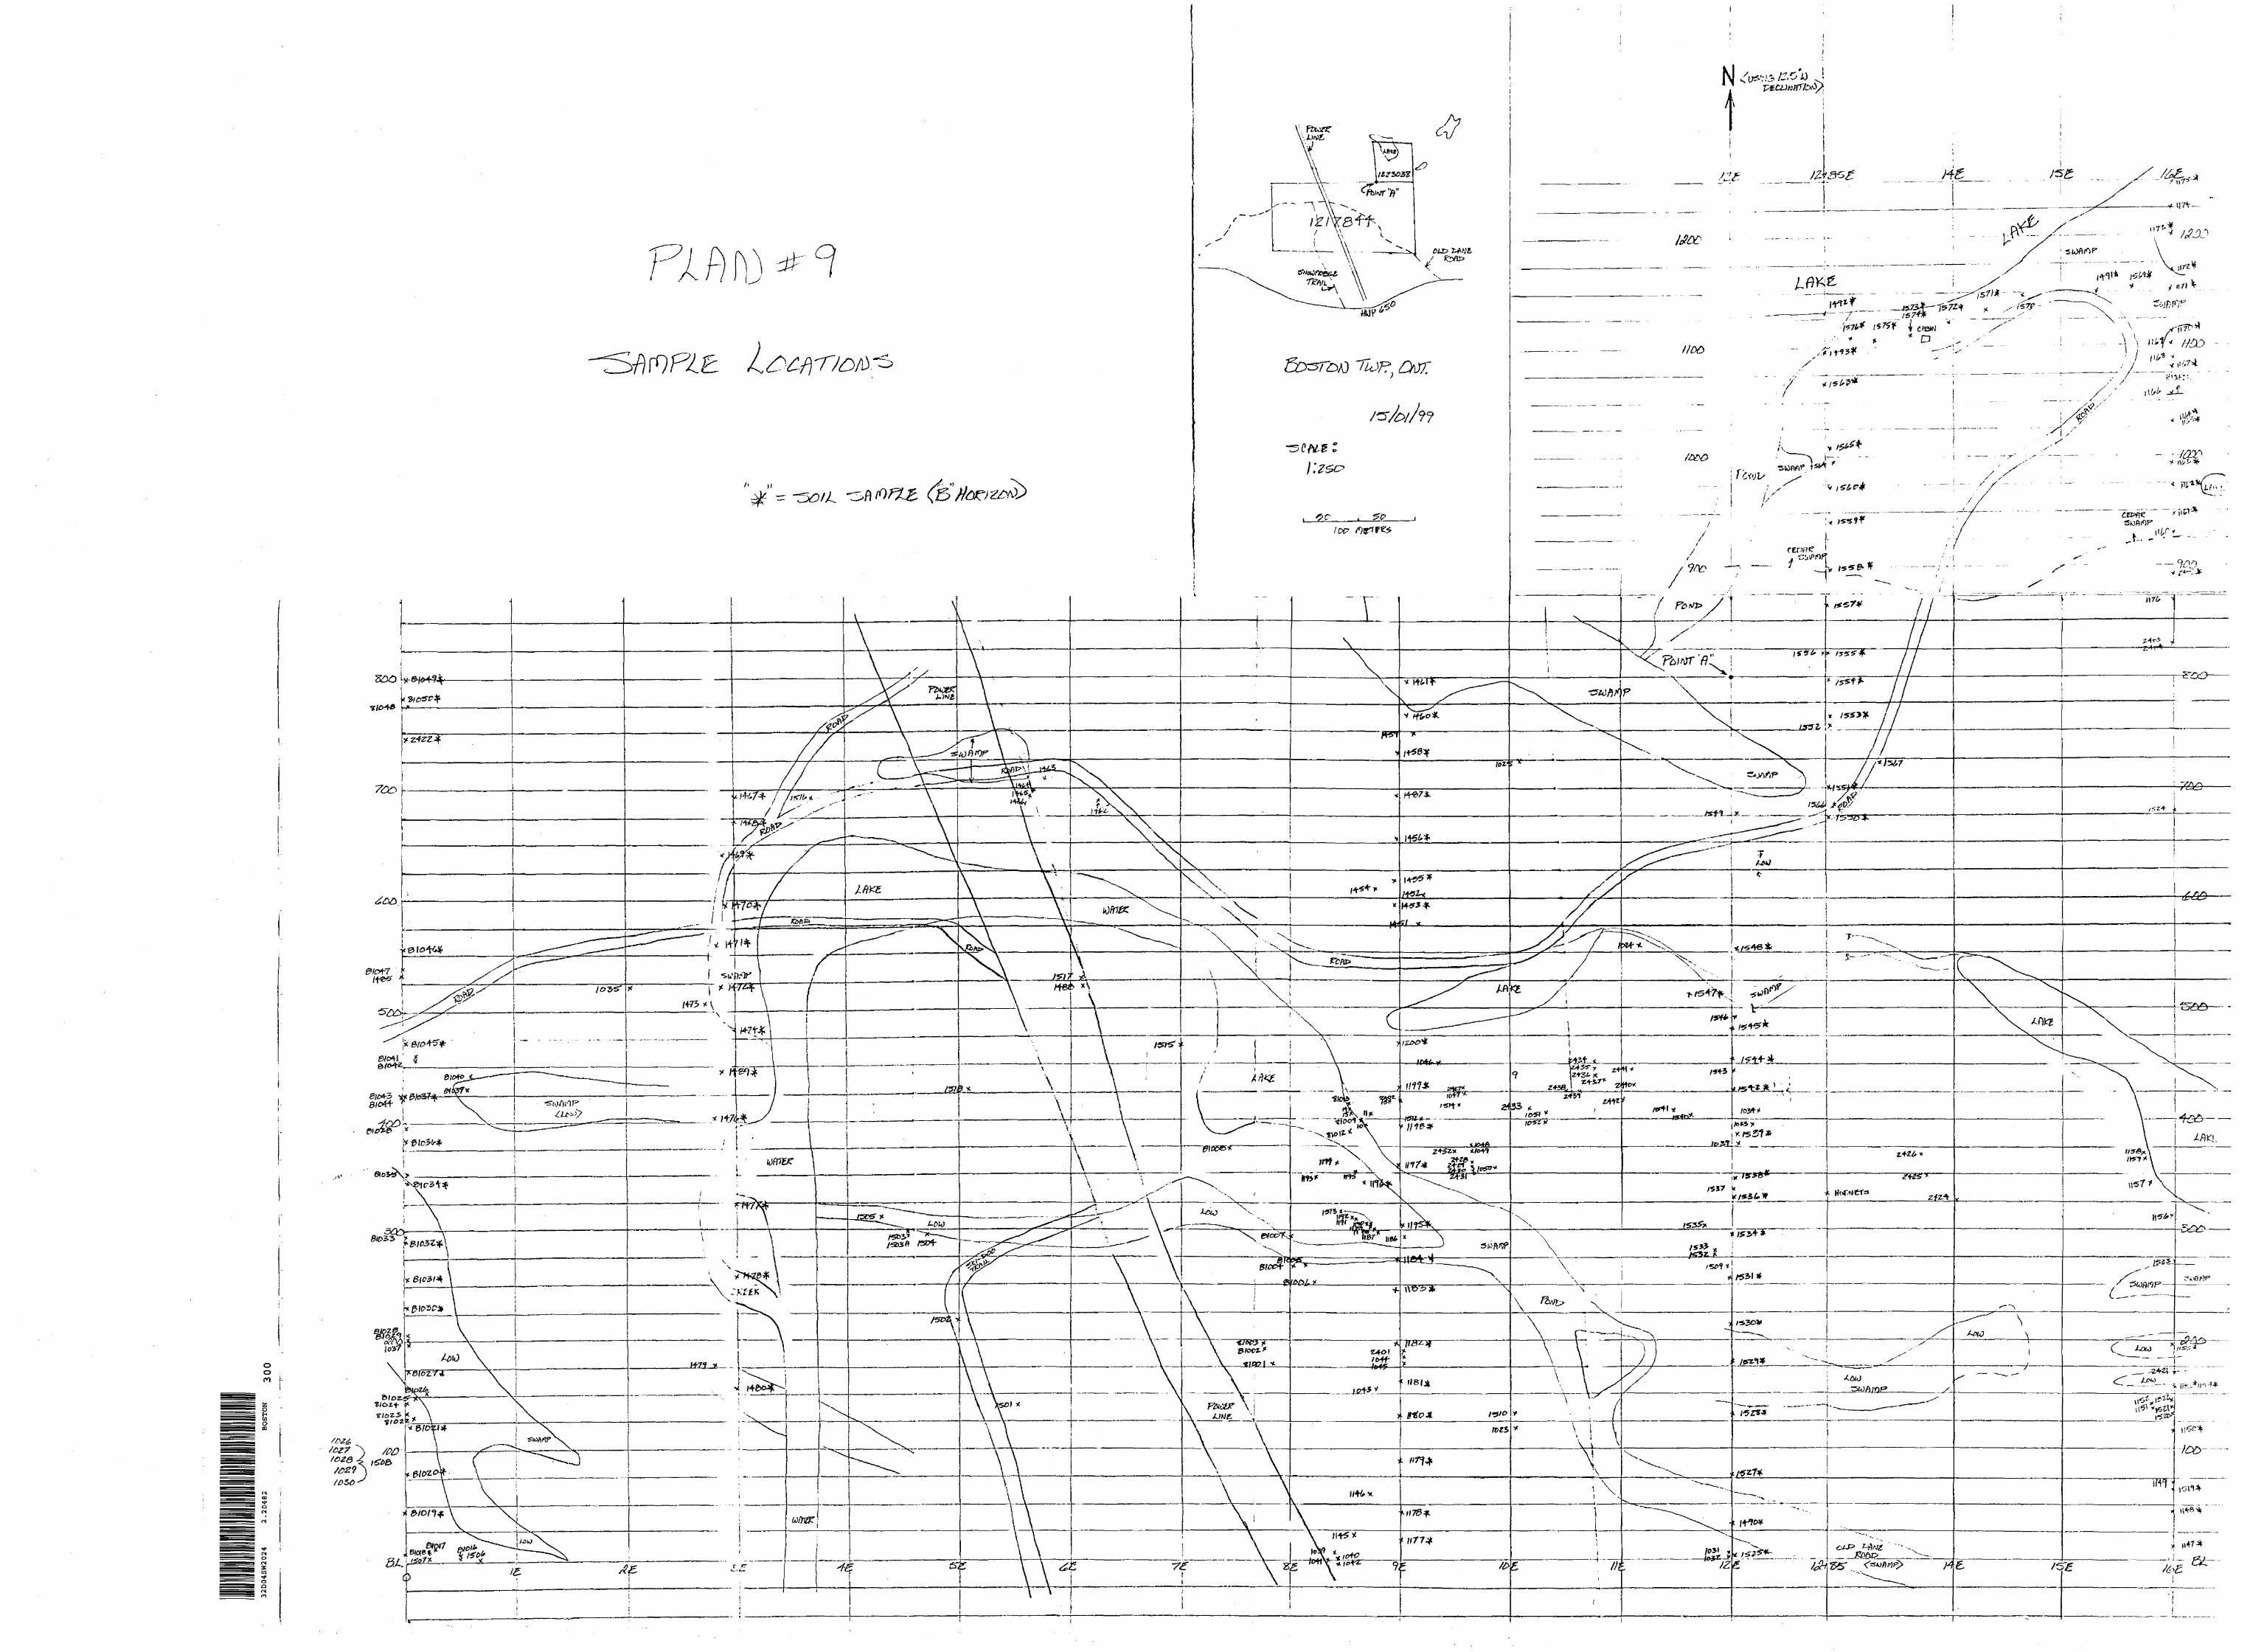
32D04SW2024
2.2
04
62
BOST
ON30
0
-\
CI?7^
- ^ ^
^-D
fe (k
N
-f/
r
^'
*i 1 t
^ <^
15 vi
-lH N
^^
^ l* l o lfc'
^
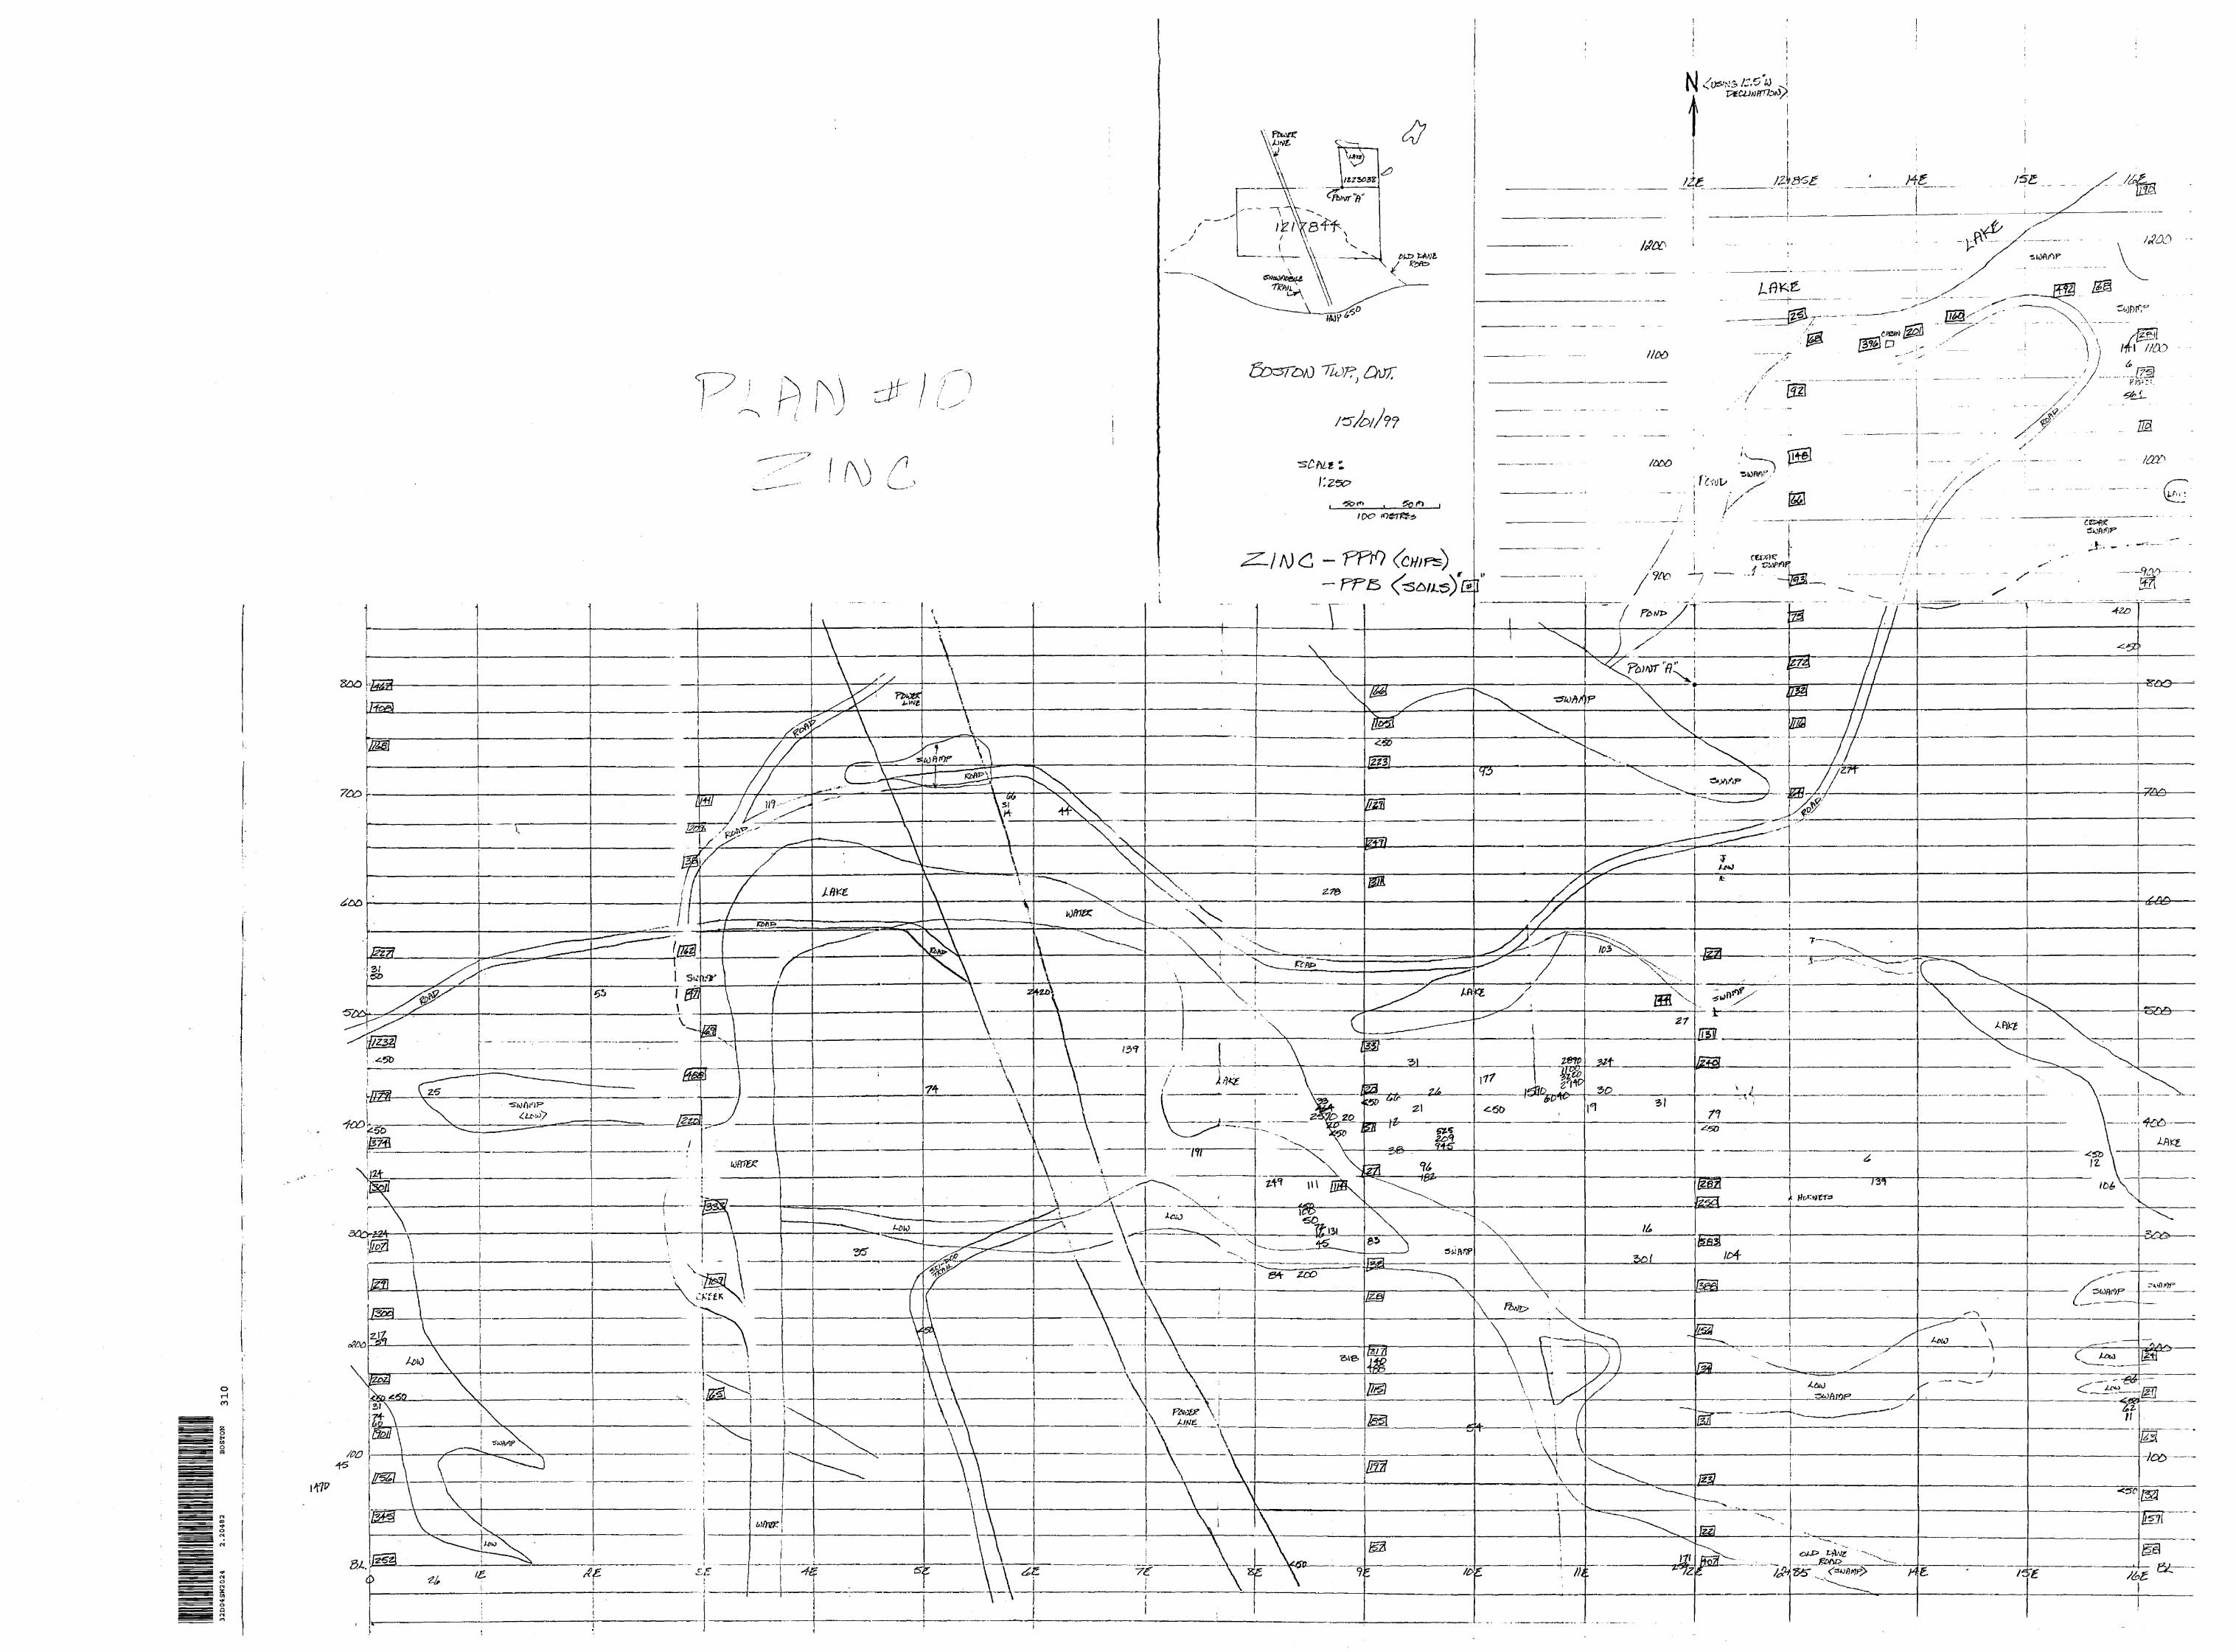
32D
04S
W20
24
2.2
04
82
BOST
ON
31
0
I& ^
* ^N
^
h -H
i ^^
^v:
^ 5;
M
*
^
l
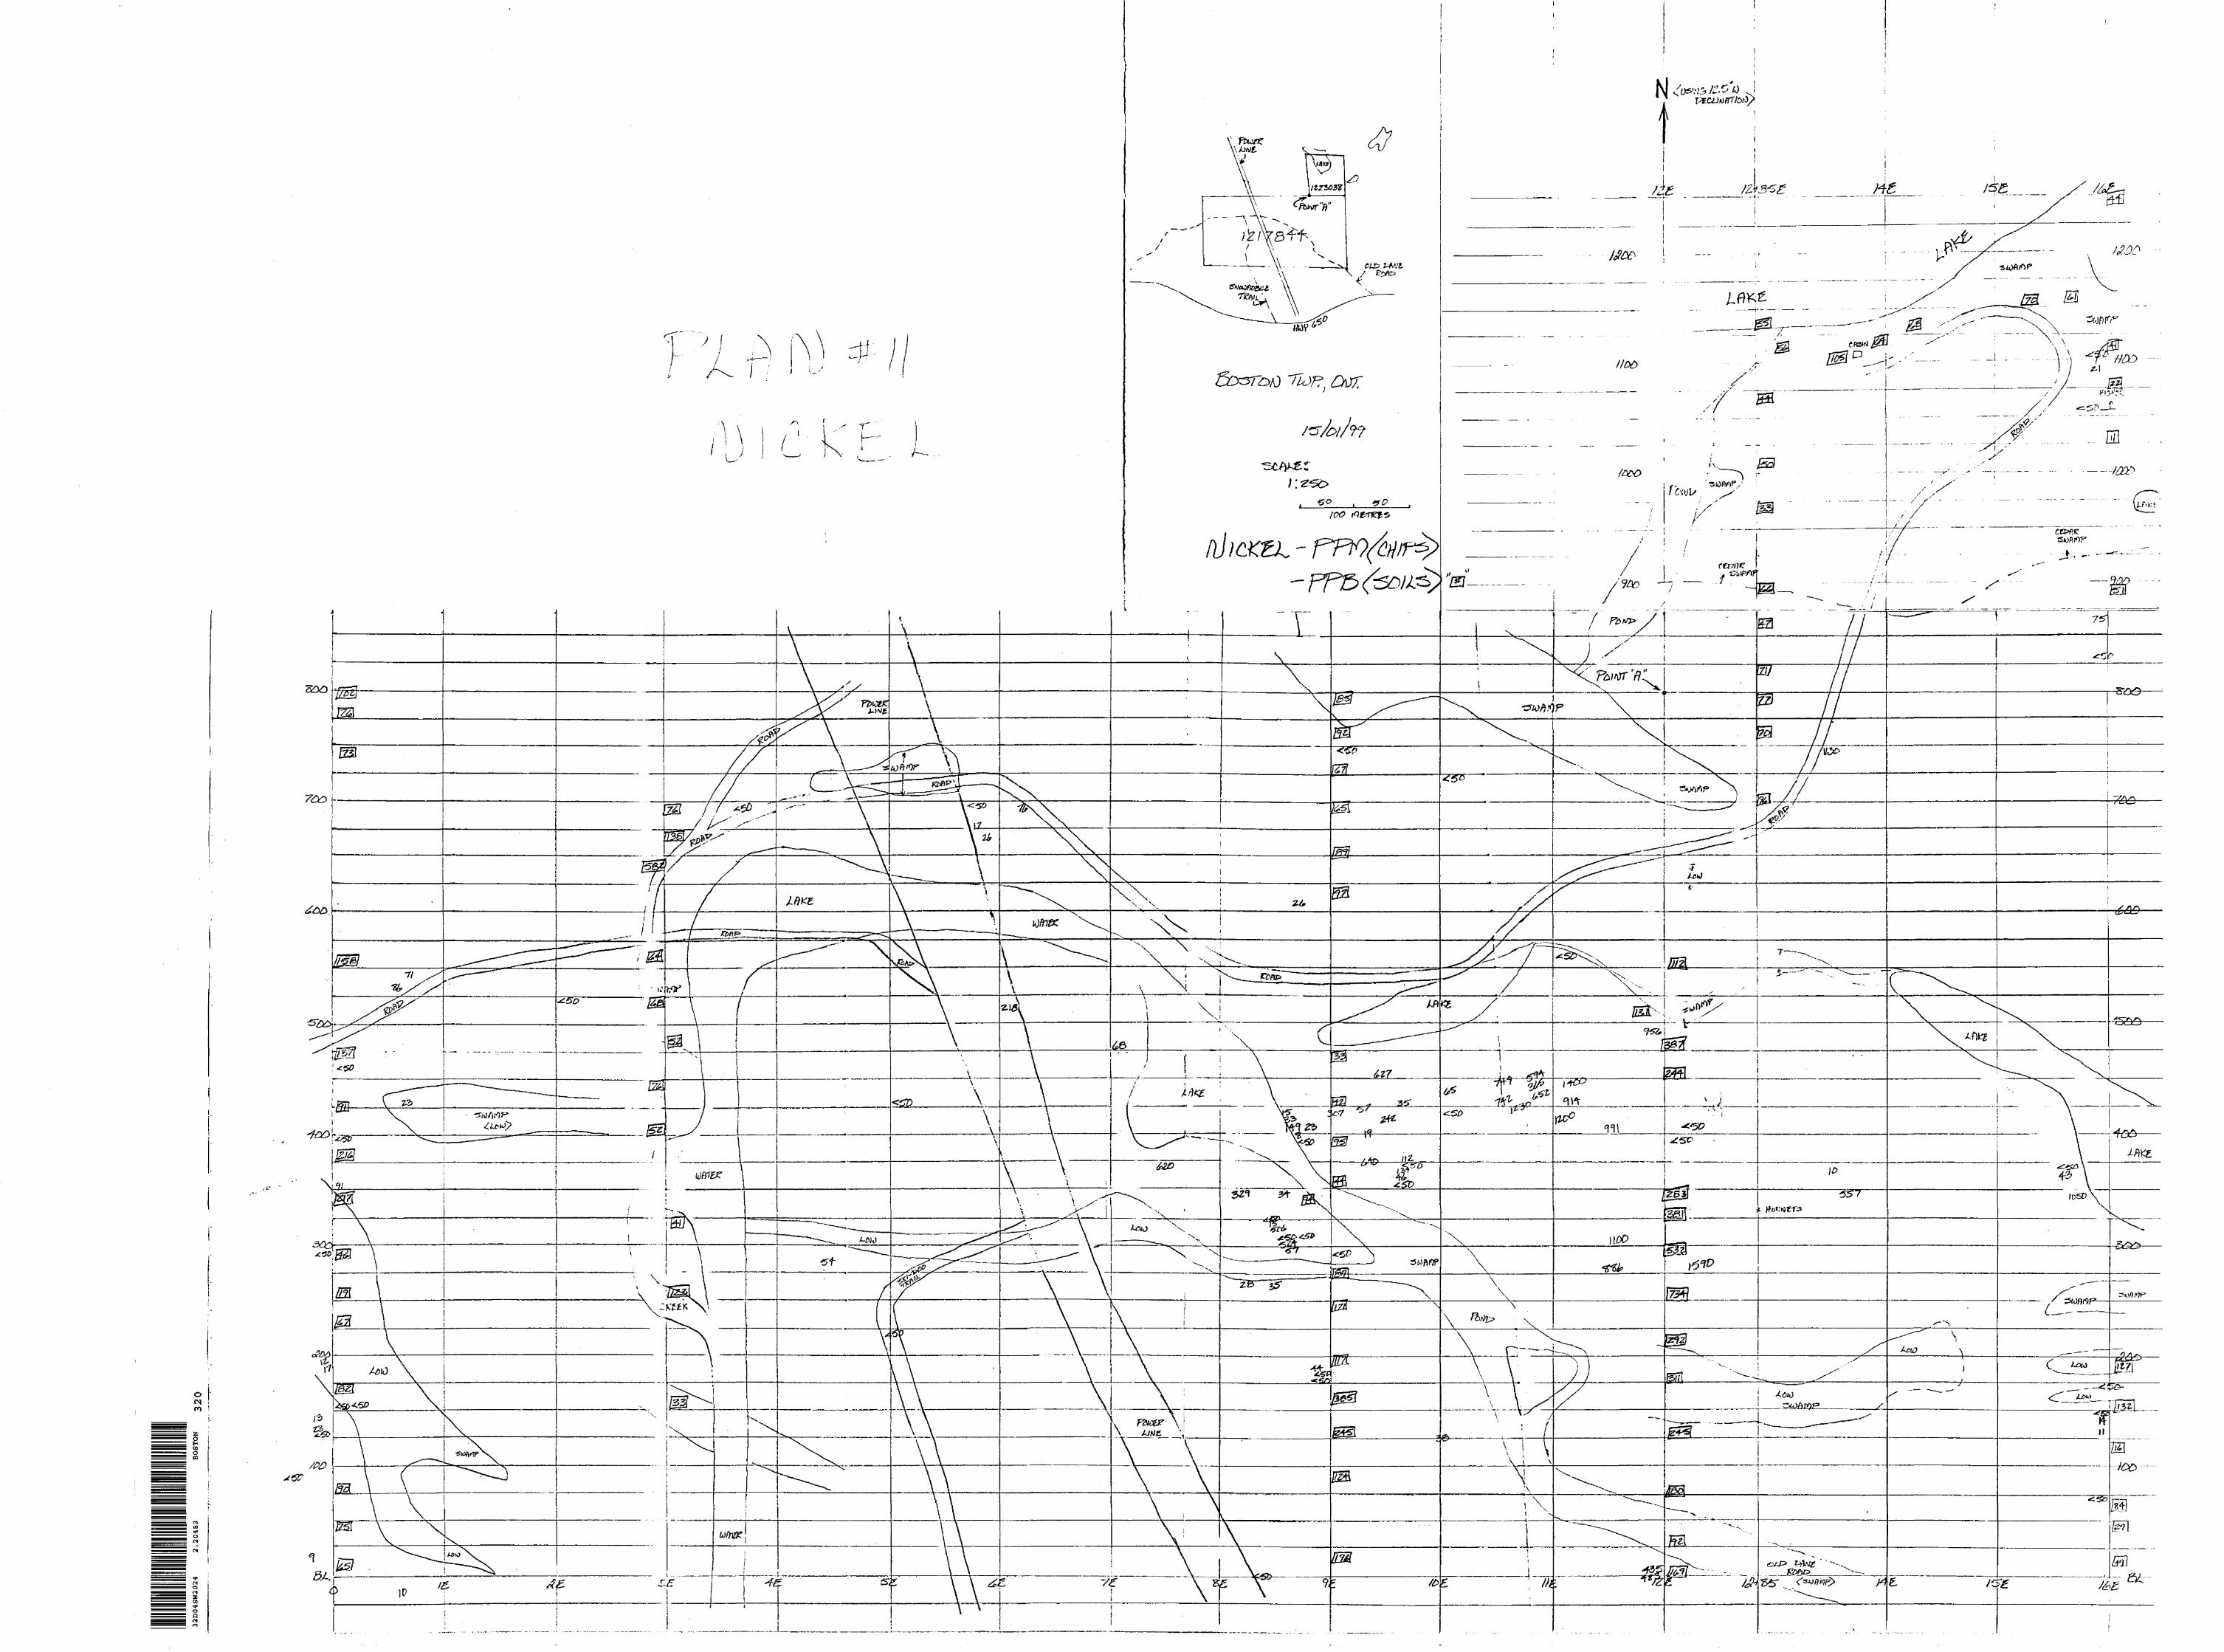
32D
04SW
2024
2
.20
48
2BO
STO
N3
20
~\
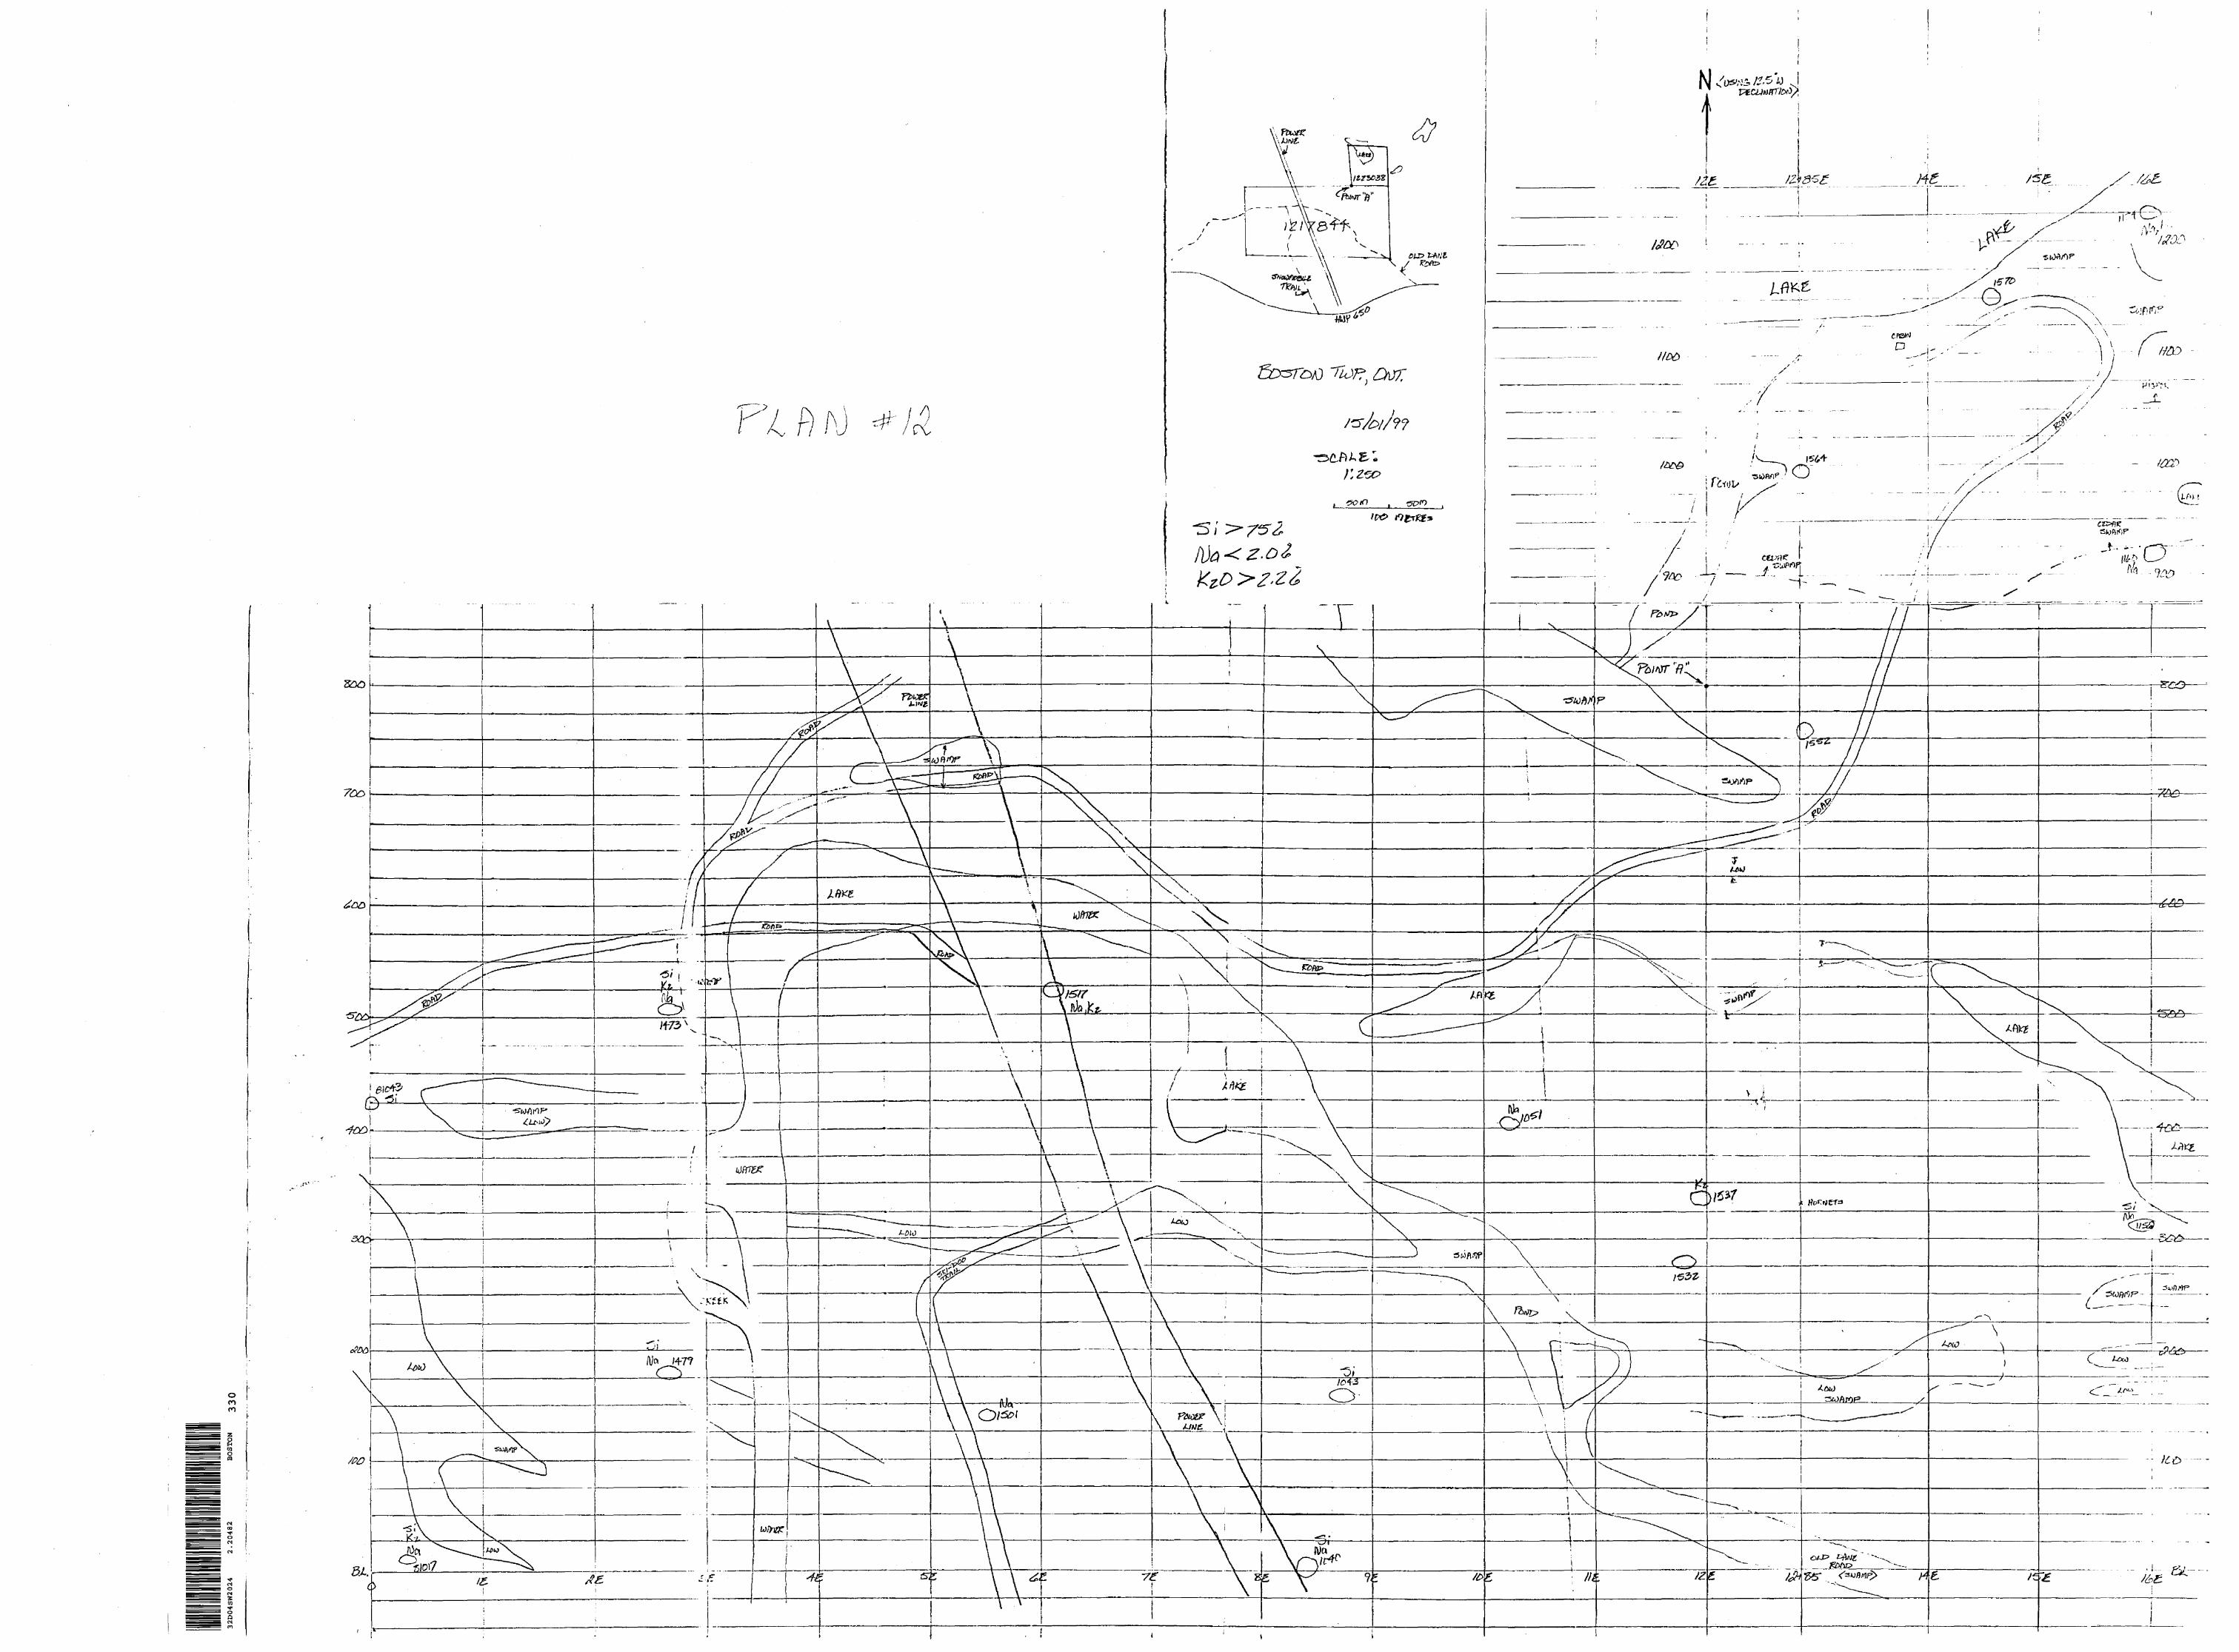
32D
04S
W20
24
2.2
04
82
BOST
ON
330