Embed Size (px)
Citation preview
2011 Explanatory Notes National Agricultural Statistics Service
Table of Contents
Page Purpose Statement…………………………………………………………………………………..… 15-1 Statement of Available Funds and Staff Years ……………………………………………………..... 15-2 Permanent Positions by Grade and Staff Year …………………………………………………..…… 15-3 Motor Vehicle Fleet Data ……………………………………………………………….………..….. 15-4 Salaries and Expenses: Appropriations Language…………………………………………………………………..……. 15-5 Lead-off Tabular Statement…………………………………………………………………..….. 15-5 Project Statement……………………………………………………………………………….... 15-6 Justifications ………………………………………………………………………….………..... 15-7 Geographic Breakdown of Obligations and Staff Years ……………………………………..…. 15-9 Classification by Objects……………………………………………………………………..….. 15-10 Status of Program ………………………………………………………………………………... 15g-1 Summary of Budget and Performance Statement of Goals and Objectives…………………………………………………………….... 15-11 Key Performance Outcomes and Measures…………………………………………………..… 15-15 Full Cost by Strategic Objective………………………………………………………………… 15-17
15-1
NATIONAL AGRICULTURAL STATISTICS SERVICE
Purpose Statement
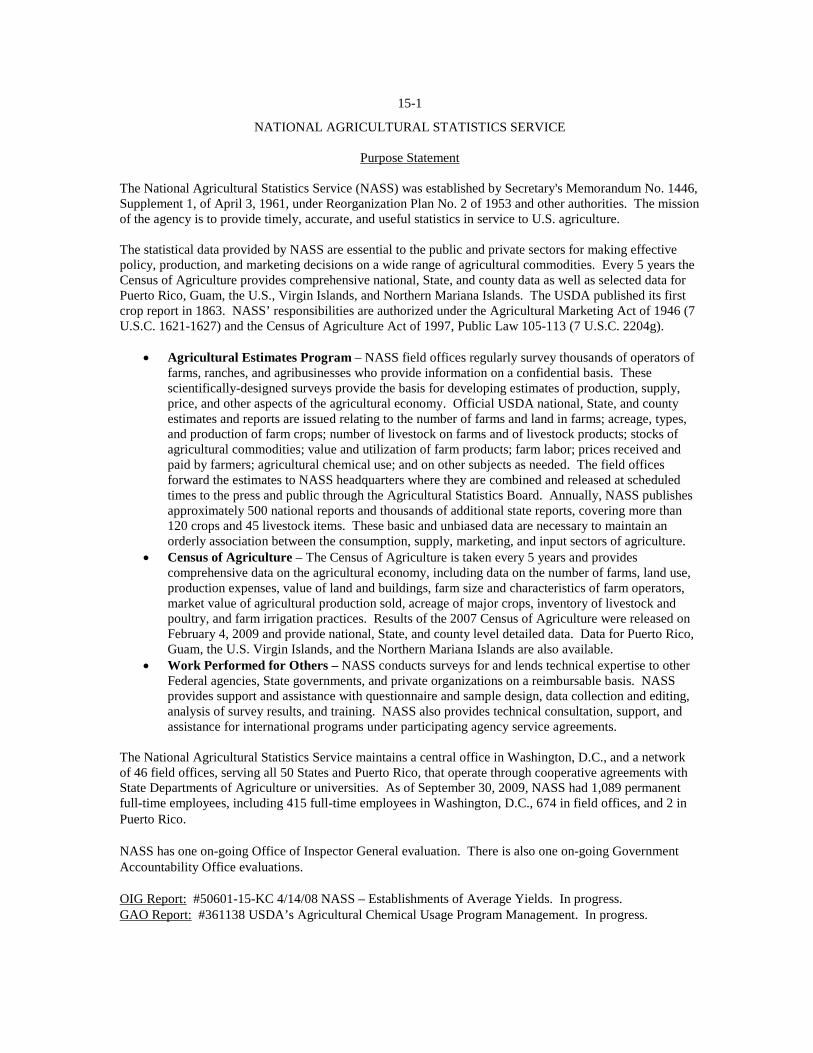
The National Agricultural Statistics Service (NASS) was established by Secretary's Memorandum No. 1446, Supplement 1, of April 3, 1961, under Reorganization Plan No. 2 of 1953 and other authorities. The mission of the agency is to provide timely, accurate, and useful statistics in service to U.S. agriculture. The statistical data provided by NASS are essential to the public and private sectors for making effective policy, production, and marketing decisions on a wide range of agricultural commodities. Every 5 years the Census of Agriculture provides comprehensive national, State, and county data as well as selected data for Puerto Rico, Guam, the U.S., Virgin Islands, and Northern Mariana Islands. The USDA published its first crop report in 1863. NASS’ responsibilities are authorized under the Agricultural Marketing Act of 1946 (7 U.S.C. 1621-1627) and the Census of Agriculture Act of 1997, Public Law 105-113 (7 U.S.C. 2204g).
• Agricultural Estimates Program – NASS field offices regularly survey thousands of operators of farms, ranches, and agribusinesses who provide information on a confidential basis. These scientifically-designed surveys provide the basis for developing estimates of production, supply, price, and other aspects of the agricultural economy. Official USDA national, State, and county estimates and reports are issued relating to the number of farms and land in farms; acreage, types, and production of farm crops; number of livestock on farms and of livestock products; stocks of agricultural commodities; value and utilization of farm products; farm labor; prices received and paid by farmers; agricultural chemical use; and on other subjects as needed. The field offices forward the estimates to NASS headquarters where they are combined and released at scheduled times to the press and public through the Agricultural Statistics Board. Annually, NASS publishes approximately 500 national reports and thousands of additional state reports, covering more than 120 crops and 45 livestock items. These basic and unbiased data are necessary to maintain an orderly association between the consumption, supply, marketing, and input sectors of agriculture.
• Census of Agriculture – The Census of Agriculture is taken every 5 years and provides comprehensive data on the agricultural economy, including data on the number of farms, land use, production expenses, value of land and buildings, farm size and characteristics of farm operators, market value of agricultural production sold, acreage of major crops, inventory of livestock and poultry, and farm irrigation practices. Results of the 2007 Census of Agriculture were released on February 4, 2009 and provide national, State, and county level detailed data. Data for Puerto Rico, Guam, the U.S. Virgin Islands, and the Northern Mariana Islands are also available.
• Work Performed for Others – NASS conducts surveys for and lends technical expertise to other Federal agencies, State governments, and private organizations on a reimbursable basis. NASS provides support and assistance with questionnaire and sample design, data collection and editing, analysis of survey results, and training. NASS also provides technical consultation, support, and assistance for international programs under participating agency service agreements.
The National Agricultural Statistics Service maintains a central office in Washington, D.C., and a network of 46 field offices, serving all 50 States and Puerto Rico, that operate through cooperative agreements with State Departments of Agriculture or universities. As of September 30, 2009, NASS had 1,089 permanent full-time employees, including 415 full-time employees in Washington, D.C., 674 in field offices, and 2 in Puerto Rico. NASS has one on-going Office of Inspector General evaluation. There is also one on-going Government Accountability Office evaluations. OIG Report: #50601-15-KC 4/14/08 NASS – Establishments of Average Yields. In progress. GAO Report: #361138 USDA’s Agricultural Chemical Usage Program Management. In progress.
15-2
NATIONAL AGRICULTURAL STATISTICS SERVICE
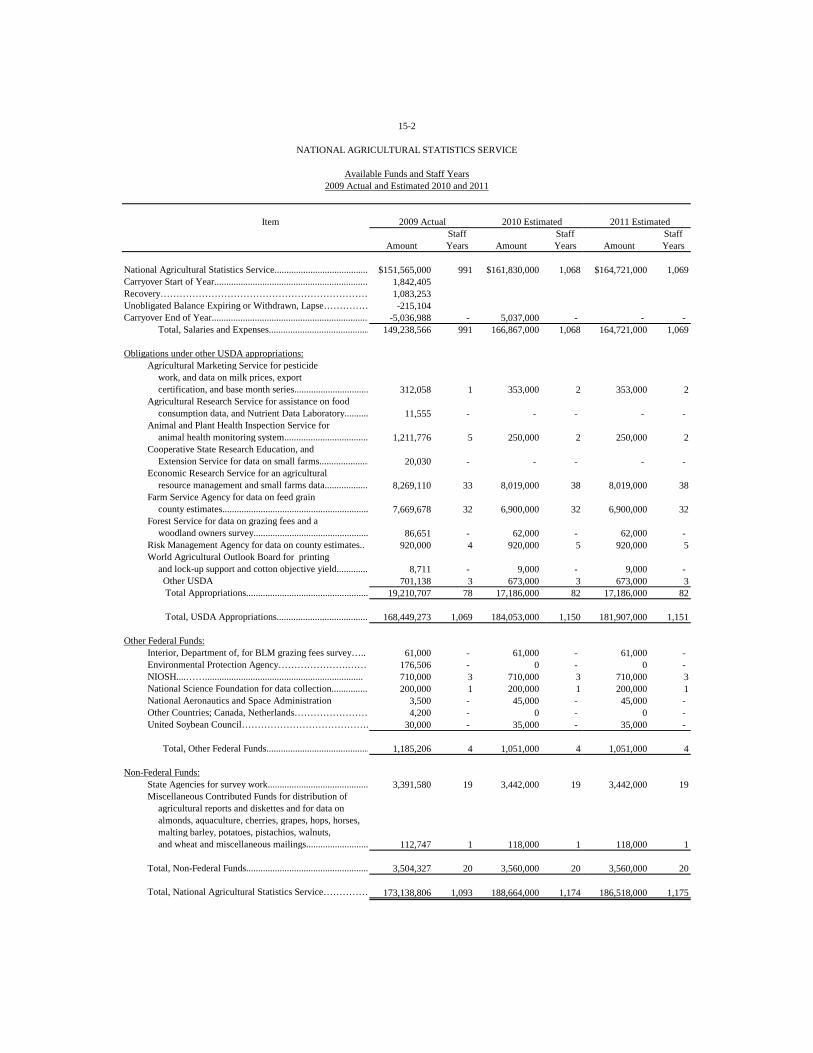
Available Funds and Staff Years2009 Actual and Estimated 2010 and 2011
ItemStaff Staff Staff
Amount Years Amount Years Amount Years
National Agricultural Statistics Service........................................ $151,565,000 991 $161,830,000 1,068 $164,721,000 1,069Carryover Start of Year................................................................. 1,842,405Recovery………………………………………………………… 1,083,253Unobligated Balance Expiring or Withdrawn, Lapse…………… -215,104Carryover End of Year.................................................................. -5,036,988 - 5,037,000 - - -
Total, Salaries and Expenses.......................................... 149,238,566 991 166,867,000 1,068 164,721,000 1,069
Obligations under other USDA appropriations:Agricultural Marketing Service for pesticide
work, and data on milk prices, exportcertification, and base month series............................... 312,058 1 353,000 2 353,000 2
Agricultural Research Service for assistance on foodconsumption data, and Nutrient Data Laboratory.......... 11,555 - - - - -
Animal and Plant Health Inspection Service foranimal health monitoring system................................... 1,211,776 5 250,000 2 250,000 2
Cooperative State Research Education, andExtension Service for data on small farms..................... 20,030 - - - - -
Economic Research Service for an agriculturalresource management and small farms data................... 8,269,110 33 8,019,000 38 8,019,000 38
Farm Service Agency for data on feed graincounty estimates............................................................. 7,669,678 32 6,900,000 32 6,900,000 32
Forest Service for data on grazing fees and a woodland owners survey................................................ 86,651 - 62,000 - 62,000 -
Risk Management Agency for data on county estimates.. 920,000 4 920,000 5 920,000 5World Agricultural Outlook Board for printing
and lock-up support and cotton objective yield.............. 8,711 - 9,000 - 9,000 - Other USDA 701,138 3 673,000 3 673,000 3 Total Appropriations................................................... 19,210,707 78 17,186,000 82 17,186,000 82
Total, USDA Appropriations....................................... 168,449,273 1,069 184,053,000 1,150 181,907,000 1,151
Other Federal Funds:Interior, Department of, for BLM grazing fees survey….. 61,000 - 61,000 - 61,000 - Environmental Protection Agency………………….…… 176,506 - 0 - 0 - NIOSH....…….................................................................. 710,000 3 710,000 3 710,000 3National Science Foundation for data collection................ 200,000 1 200,000 1 200,000 1National Aeronautics and Space Administration 3,500 - 45,000 - 45,000 - Other Countries; Canada, Netherlands…………………… 4,200 - 0 - 0 - United Soybean Council…………………………………. 30,000 - 35,000 - 35,000 -
Total, Other Federal Funds........................................... 1,185,206 4 1,051,000 4 1,051,000 4
Non-Federal Funds:State Agencies for survey work.......................................... 3,391,580 19 3,442,000 19 3,442,000 19Miscellaneous Contributed Funds for distribution of
agricultural reports and diskettes and for data onalmonds, aquaculture, cherries, grapes, hops, horses,malting barley, potatoes, pistachios, walnuts,and wheat and miscellaneous mailings.......................... 112,747 1 118,000 1 118,000 1
Total, Non-Federal Funds................................................... 3,504,327 20 3,560,000 20 3,560,000 20
Total, National Agricultural Statistics Service…………… 173,138,806 1,093 188,664,000 1,174 186,518,000 1,175
2009 Actual 2010 Estimated 2011 Estimated
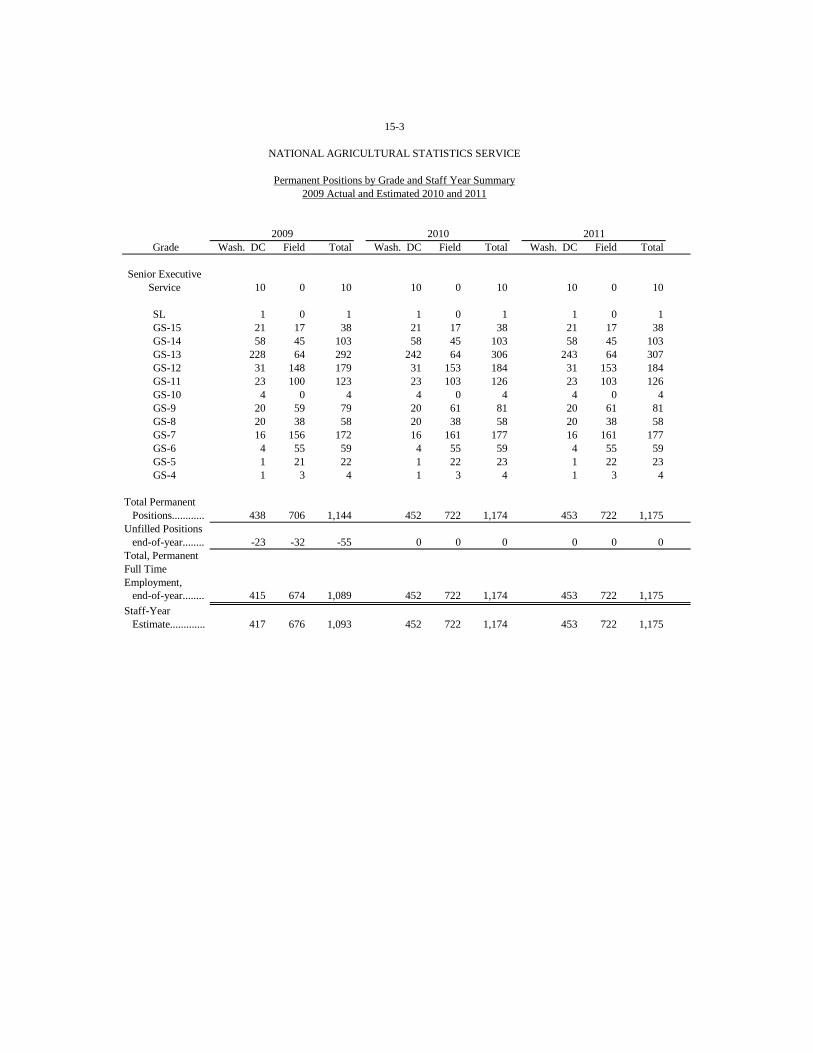
Grade Wash. DC Field Total Wash. DC Field Total Wash. DC Field Total
Senior ExecutiveService 10 0 10 10 0 10 10 0 10
SL 1 0 1 1 0 1 1 0 1 GS-15 21 17 38 21 17 38 21 17 38 GS-14 58 45 103 58 45 103 58 45 103 GS-13 228 64 292 242 64 306 243 64 307 GS-12 31 148 179 31 153 184 31 153 184 GS-11 23 100 123 23 103 126 23 103 126 GS-10 4 0 4 4 0 4 4 0 4
GS-9 20 59 79 20 61 81 20 61 81GS-8 20 38 58 20 38 58 20 38 58GS-7 16 156 172 16 161 177 16 161 177GS-6 4 55 59 4 55 59 4 55 59GS-5 1 21 22 1 22 23 1 22 23GS-4 1 3 4 1 3 4 1 3 4
Total Permanent Positions............ 438 706 1,144 452 722 1,174 453 722 1,175Unfilled Positions end-of-year......... -23 -32 -55 0 0 0 0 0 0Total, PermanentFull TimeEmployment, end-of-year......... 415 674 1,089 452 722 1,174 453 722 1,175Staff-Year Estimate............. 417 676 1,093 452 722 1,174 453 722 1,175
2009 Actual and Estimated 2010 and 2011
20112009 2010
15-3
NATIONAL AGRICULTURAL STATISTICS SERVICE
Permanent Positions by Grade and Staff Year Summary
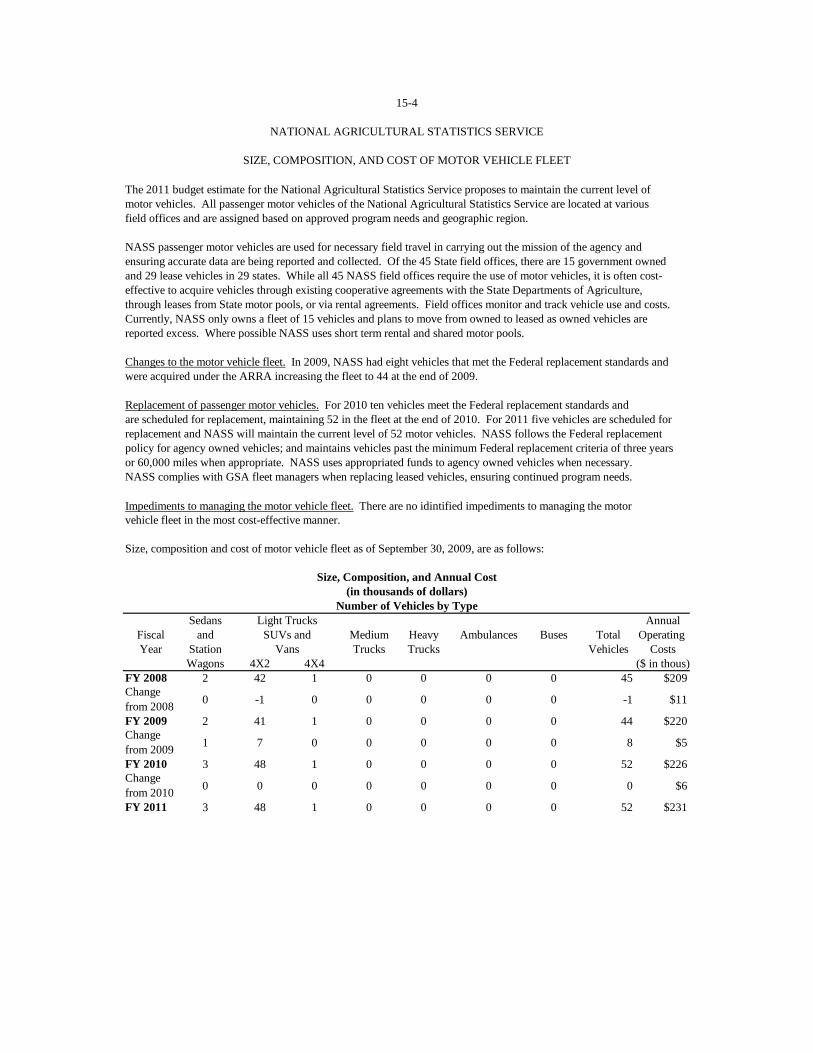
The 2011 budget estimate for the National Agricultural Statistics Service proposes to maintain the current level ofmotor vehicles. All passenger motor vehicles of the National Agricultural Statistics Service are located at various field offices and are assigned based on approved program needs and geographic region.
NASS passenger motor vehicles are used for necessary field travel in carrying out the mission of the agency andensuring accurate data are being reported and collected. Of the 45 State field offices, there are 15 government ownedand 29 lease vehicles in 29 states. While all 45 NASS field offices require the use of motor vehicles, it is often cost-effective to acquire vehicles through existing cooperative agreements with the State Departments of Agriculture,through leases from State motor pools, or via rental agreements. Field offices monitor and track vehicle use and costs. Currently, NASS only owns a fleet of 15 vehicles and plans to move from owned to leased as owned vehicles arereported excess. Where possible NASS uses short term rental and shared motor pools.
Changes to the motor vehicle fleet. In 2009, NASS had eight vehicles that met the Federal replacement standards andwere acquired under the ARRA increasing the fleet to 44 at the end of 2009.
Replacement of passenger motor vehicles. For 2010 ten vehicles meet the Federal replacement standards andare scheduled for replacement, maintaining 52 in the fleet at the end of 2010. For 2011 five vehicles are scheduled forreplacement and NASS will maintain the current level of 52 motor vehicles. NASS follows the Federal replacementpolicy for agency owned vehicles; and maintains vehicles past the minimum Federal replacement criteria of three yearsor 60,000 miles when appropriate. NASS uses appropriated funds to agency owned vehicles when necessary.NASS complies with GSA fleet managers when replacing leased vehicles, ensuring continued program needs.
Impediments to managing the motor vehicle fleet. There are no idintified impediments to managing the motorvehicle fleet in the most cost-effective manner.
Size, composition and cost of motor vehicle fleet as of September 30, 2009, are as follows:
Sedans AnnualFiscal and Medium Heavy Ambulances Buses Total Operating Year Station Trucks Trucks Vehicles Costs
Wagons 4X2 4X4 ($ in thous)FY 2008 2 42 1 0 0 0 0 45 $209Change from 2008 0 -1 0 0 0 0 0 -1 $11
FY 2009 2 41 1 0 0 0 0 44 $220Change from 2009 1 7 0 0 0 0 0 8 $5
FY 2010 3 48 1 0 0 0 0 52 $226Change from 2010 0 0 0 0 0 0 0 0 $6
FY 2011 3 48 1 0 0 0 0 52 $231
Light TrucksSUVs and
Vans
Number of Vehicles by Type
15-4
NATIONAL AGRICULTURAL STATISTICS SERVICE
SIZE, COMPOSITION, AND COST OF MOTOR VEHICLE FLEET
Size, Composition, and Annual Cost(in thousands of dollars)
15-5
NATIONAL AGRICULTURAL STATISTICS SERVICE
Salaries and Expenses:
The estimates include appropriation language for this item as follows (new language underscored; deleted osed in brackets):
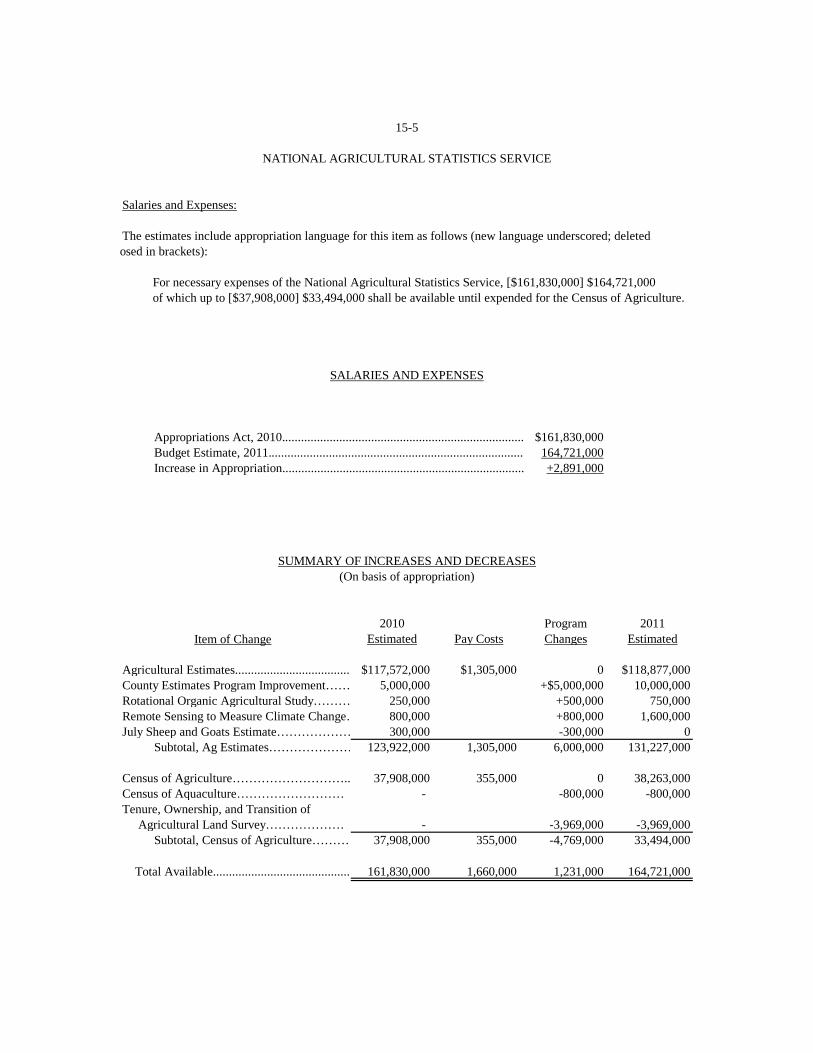
For necessary expenses of the National Agricultural Statistics Service, [$161,830,000] $164,721,000of which up to [$37,908,000] $33,494,000 shall be available until expended for the Census of Agriculture.
Appropriations Act, 2010............................................................................ $161,830,000 Budget Estimate, 2011................................................................................ 164,721,000 Increase in Appropriation............................................................................ +2,891,000
SUMMARY OF INCREASES AND DECREASES (On basis of appropriation)
2010 Program 2011Estimated Pay Costs Changes Estimated
Agricultural Estimates.................................... $117,572,000 $1,305,000 0 $118,877,000County Estimates Program Improvement…… 5,000,000 +$5,000,000 10,000,000Rotational Organic Agricultural Study……… 250,000 +500,000 750,000Remote Sensing to Measure Climate Change… 800,000 +800,000 1,600,000July Sheep and Goats Estimate……………… 300,000 -300,000 0 Subtotal, Ag Estimates………………… 123,922,000 1,305,000 6,000,000 131,227,000
Census of Agriculture……………………….. 37,908,000 355,000 0 38,263,000Census of Aquaculture……………………… - -800,000 -800,000Tenure, Ownership, and Transition of Agricultural Land Survey………………… - -3,969,000 -3,969,000 Subtotal, Census of Agriculture……… 37,908,000 355,000 -4,769,000 33,494,000
Total Available........................................... 161,830,000 1,660,000 1,231,000 164,721,000
SALARIES AND EXPENSES
Item of Change
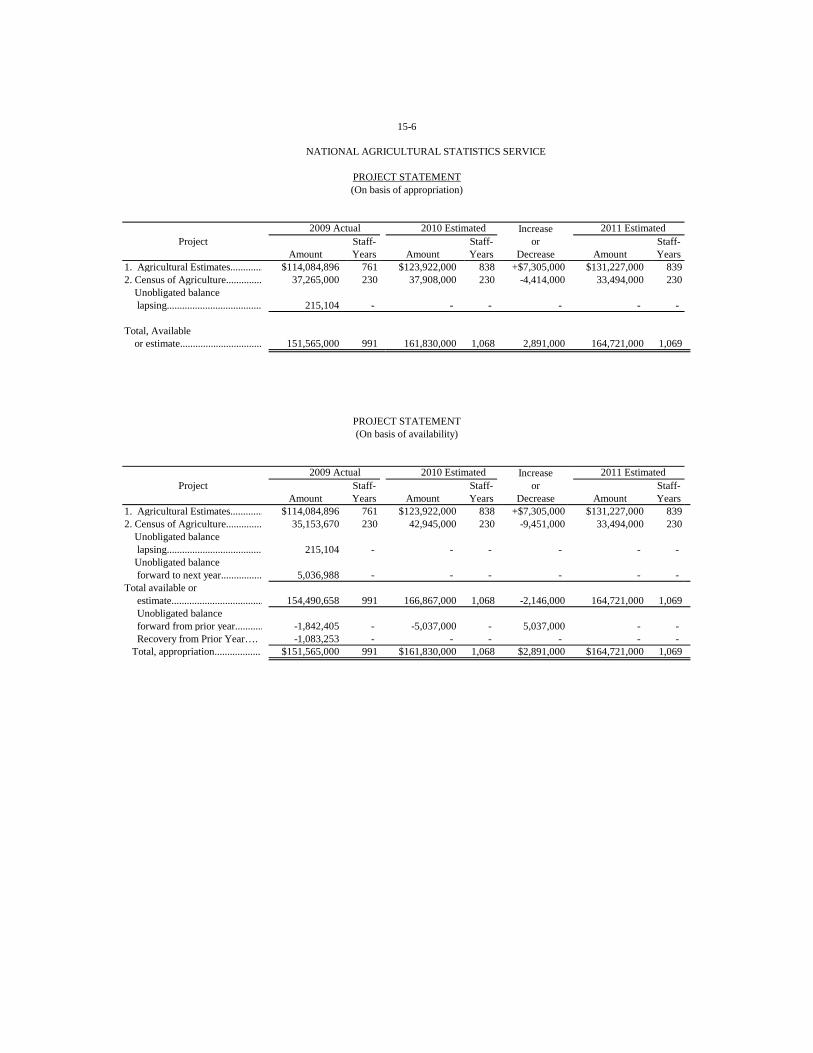
IncreaseProject Staff- Staff- or Staff-
Amount Years Amount Years Decrease Amount Years1. Agricultural Estimates............. $114,084,896 761 $123,922,000 838 +$7,305,000 $131,227,000 8392. Census of Agriculture.............. 37,265,000 230 37,908,000 230 -4,414,000 33,494,000 230 Unobligated balance lapsing..................................... 215,104 - - - - - -
Total, Available or estimate................................ 151,565,000 991 161,830,000 1,068 2,891,000 164,721,000 1,069
IncreaseProject Staff- Staff- or Staff-
Amount Years Amount Years Decrease Amount Years1. Agricultural Estimates............. $114,084,896 761 $123,922,000 838 +$7,305,000 $131,227,000 8392. Census of Agriculture.............. 35,153,670 230 42,945,000 230 -9,451,000 33,494,000 230 Unobligated balance lapsing..................................... 215,104 - - - - - - Unobligated balance forward to next year................ 5,036,988 - - - - - - Total available or estimate.................................... 154,490,658 991 166,867,000 1,068 -2,146,000 164,721,000 1,069 Unobligated balance forward from prior year........... -1,842,405 - -5,037,000 - 5,037,000 - - Recovery from Prior Year…. -1,083,253 - - - - - - Total, appropriation.................. $151,565,000 991 $161,830,000 1,068 $2,891,000 $164,721,000 1,069
(On basis of appropriation)
2010 Estimated
(On basis of availability)
2011 Estimated
15-6
2011 Estimated
PROJECT STATEMENT
2009 Actual 2010 Estimated
2009 Actual
NATIONAL AGRICULTURAL STATISTICS SERVICE
PROJECT STATEMENT
15-7
Justification of Increases and Decreases (1) A net increase of $7,305,000 for agricultural estimates ($123,922,000 available in 2010) consisting of:
(a) An increase of $5,000,000 and 1 staff year to enhance the annual county estimates program in support of agricultural producer safety nets ($5,000,000 available in 2010).
NASS has produced county-level statistics for selected commodities for many years. However, the importance of these data has been magnified in recent years as the Department’s programs utilize the information to determine disposition of billions of dollars. The Risk Management Agency relies on NASS annual county estimates to administer crop insurance programs that provide U.S. farmers a safety net ensuring protection against unpredictable growing conditions. Additionally, the Farm Service Agency relies on NASS county level data to administer the Conservation Reserve Program, crop revenue support programs, and emergency assistance payments. The important uses of these data continue to grow.
The County Estimates Survey program was originally designed, administered, and processed at the local NASS Field Office level in support of State cooperative agreements with local governments or universities. As local level funding has evaporated and uses of the data have expanded to support USDA administered farmer programs, it became apparent that new requirements dictated standards and consistency across all NASS Field Offices. Consequently, NASS teams began work on developing the infrastructure to support transition to a nationally-administered County Estimates Survey program. Initial work focused on internal processes and tools that support analyses and estimation and has recently shifted toward ensuring consistency in sampling, design, and program execution. NASS currently obligates approximately $5 million to this program. One million was appropriated in FY 2004, one million is received through reimbursable programs, and $4 million in redirected funding constitutes the annual expenditures.
However, to effectively and responsibly meet USDA data needs for critical program delivery, several issues that must be addressed will require new program funding. NASS must implement a new probability-based survey design. This will require non-response follow-up to secure data from all sampled records to achieve an 80 percent response rate. Further development and enhancement of survey processing and estimation tools is also needed to establish the robust and flexible processing system required for the multitude of crop and production practices data needed to administer USDA programs. NASS must continue to explore and research small area estimation techniques, including geo-spatial tools. This is increasingly necessary due to the changing structure of the agriculture community. Finally, NASS must continue to explore ways to effectively leverage USDA and other external data sources in an effort to reduce burden on our Nation's farmers and ranchers. The agency request of $5 million would allow progress in many of these areas. (b)
An increase of $500,000 for Agricultural Estimates ($250,000 available in 2010) to develop a rotational organic agriculture data series.
The 2008 Farm Bill provided $1.0 million for NASS to “develop surveys on organically produced agricultural products.” The 2008 Organic Production Survey was conducted during 2009 in response to this mandate. The one-time funding provided by the Farm Bill allows NASS to develop baseline statistics about this quickly expanding and vital sector of U.S. agriculture. The requested funding will allow NASS to begin a comprehensive data series on organic production, handling, and distribution. Without this increase, the funds will be insufficient to develop this annual program. The specifics potentially include: economic details to gauge the basic financial health of the organic sector; total farm household income, gross farm sales and net farm income; use of contracting in the organic sector; expanded questions for value-added products; barriers to organic production; and availability of organic marketing channels. A data series will allow USDA and others to monitor the continued growth, evolution, and understanding of this sector in support of a nutritious domestic and International food supply.
15-8
(c)
An increase of $800,000 for Agricultural Estimates ($800,000 available in 2010) to enhance remote sensing activities.
NASS has made tremendous progress in utilizing advanced technologies, such as remote sensing, to monitor agricultural acreage and production during the growing season. This initiative would expand the number of states that have a cropland data layer and provide NASS the ability to collect additional data on crop conditions, soil moisture, and/or drought monitoring to fulfill an important informational gap. The development of a web-accessible geospatial tool for crop progress and condition data will aid economic and policy analysis to help agriculture mitigate and adapt to climate change. Integration of this information into databases and operational reports regularly issued by NASS and the World Agricultural Outlook Board will allow widespread dissemination of detailed web-based analyses, reports, and other data, and will support major information products domestically and worldwide.
(d) A decrease of $300,000 ($300,000 available in 2010) to eliminate the July sheep and goats estimate. Sheep and goat inventory estimates are currently provided twice a year. This proposal eliminates the July Sheep and Goats inventory survey, but allows for the more detailed January estimate to continue. The continued decline in the sheep industry resulted in this being identified as a lower priority item which could offset requested funding in support of higher priority Administration goals. NASS completed a comprehensive review of all programs to determine priority. (e)
An increase of $1,305,000 to fund increased pay costs.
A large percent of NASS’ non data collection budget supports personnel compensation. This increase is critically important to NASS to enable the agency to perform its mission and meet the growing need for agricultural statistics. It will also ensure adequate staffing for the current statistical program and maintain most statistical program components.
(2) A net decrease of $4,414,000 for the Census of Agriculture ($37,908,000 available in 2010) consisting
of:
(a) A decrease of $800,000 to eliminate the Census of Aquaculture. These on-going reports provide the industry with the basic information needed to make key policy and business decisions. However, the majority of aquaculture, catfish and trout, are currently included in the NASS agricultural estimates program; which includes a monthly report of catfish processing, a biannual report of catfish production, and an annual report on trout production. Therefore, this program was identified as a lower priority item which could offset requested funding in support of higher priority Administration goals. NASS completed a comprehensive review of all programs to determine priority.
(b) A decrease of $3,969,000 to eliminate the tenure, ownership, and transition of agricultural land survey (TOTAL).
The periodic TOTAL survey provides a comprehensive look at the land tenure of the U.S. agriculture sector for both landlords and farm operators. However, the largest portion of land tenure is the farm operator component that is already being accounted for in the Agricultural Resource Management Survey. The TOTAL survey is inactive. It was last conducted in 1998. Therefore, this program was identified as a lower priority item which could offset requested funding in support of higher priority Administration goals. NASS completed a comprehensive review of all programs to determine priority. (c) An increase of $355,000 to fund increased pay costs.
A large percentage of NASS’ non-data collection budget supports personnel compensation. This increase is critically important to NASS to enable the agency to perform its mission.
AmountStaff Years Amount
Staff Years Amount
Staff Years
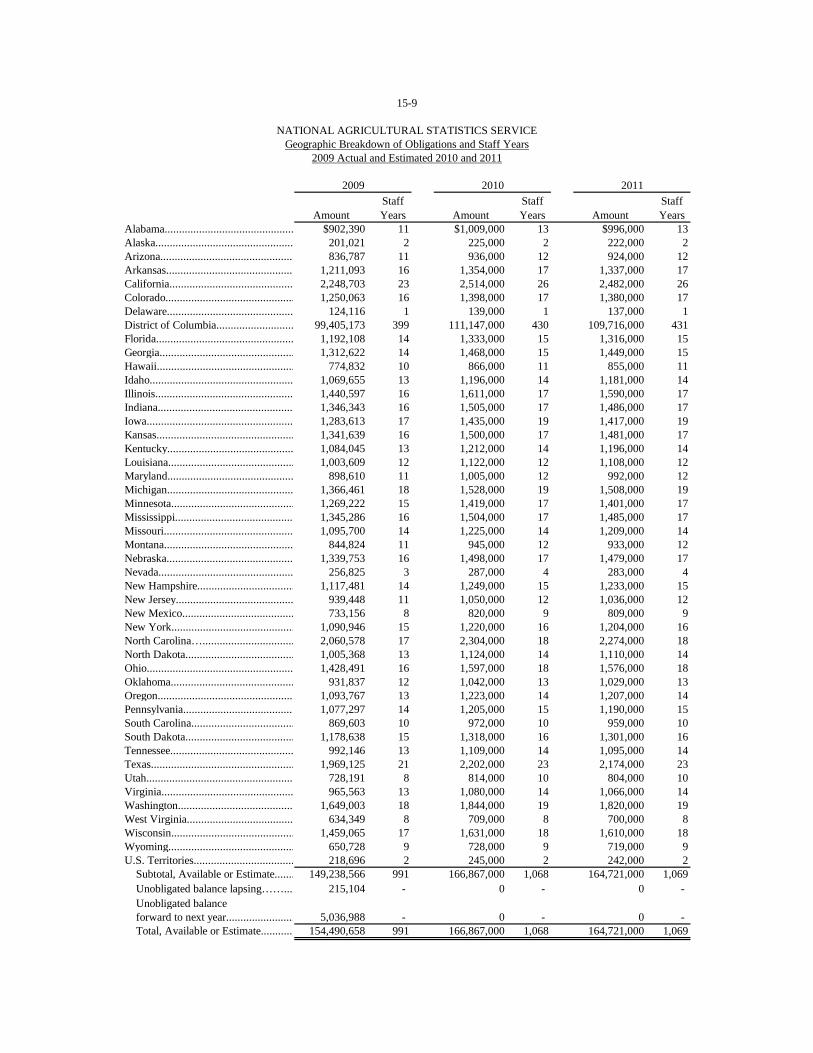
Alabama............................................. $902,390 11 $1,009,000 13 $996,000 13Alaska................................................ 201,021 2 225,000 2 222,000 2Arizona............................................... 836,787 11 936,000 12 924,000 12Arkansas............................................. 1,211,093 16 1,354,000 17 1,337,000 17California............................................ 2,248,703 23 2,514,000 26 2,482,000 26Colorado............................................. 1,250,063 16 1,398,000 17 1,380,000 17Delaware............................................ 124,116 1 139,000 1 137,000 1District of Columbia........................... 99,405,173 399 111,147,000 430 109,716,000 431Florida................................................ 1,192,108 14 1,333,000 15 1,316,000 15Georgia............................................... 1,312,622 14 1,468,000 15 1,449,000 15Hawaii................................................ 774,832 10 866,000 11 855,000 11Idaho.................................................. 1,069,655 13 1,196,000 14 1,181,000 14Illinois................................................ 1,440,597 16 1,611,000 17 1,590,000 17Indiana................................................ 1,346,343 16 1,505,000 17 1,486,000 17Iowa................................................... 1,283,613 17 1,435,000 19 1,417,000 19Kansas................................................ 1,341,639 16 1,500,000 17 1,481,000 17Kentucky............................................ 1,084,045 13 1,212,000 14 1,196,000 14Louisiana............................................ 1,003,609 12 1,122,000 12 1,108,000 12Maryland............................................ 898,610 11 1,005,000 12 992,000 12Michigan............................................ 1,366,461 18 1,528,000 19 1,508,000 19Minnesota........................................... 1,269,222 15 1,419,000 17 1,401,000 17Mississippi.......................................... 1,345,286 16 1,504,000 17 1,485,000 17Missouri............................................. 1,095,700 14 1,225,000 14 1,209,000 14Montana............................................. 844,824 11 945,000 12 933,000 12Nebraska............................................. 1,339,753 16 1,498,000 17 1,479,000 17Nevada............................................... 256,825 3 287,000 4 283,000 4New Hampshire.................................. 1,117,481 14 1,249,000 15 1,233,000 15New Jersey......................................... 939,448 11 1,050,000 12 1,036,000 12New Mexico....................................... 733,156 8 820,000 9 809,000 9New York........................................... 1,090,946 15 1,220,000 16 1,204,000 16North Carolina…................................ 2,060,578 17 2,304,000 18 2,274,000 18North Dakota...................................... 1,005,368 13 1,124,000 14 1,110,000 14Ohio................................................... 1,428,491 16 1,597,000 18 1,576,000 18Oklahoma........................................... 931,837 12 1,042,000 13 1,029,000 13Oregon................................................ 1,093,767 13 1,223,000 14 1,207,000 14Pennsylvania....................................... 1,077,297 14 1,205,000 15 1,190,000 15South Carolina.................................... 869,603 10 972,000 10 959,000 10South Dakota...................................... 1,178,638 15 1,318,000 16 1,301,000 16Tennessee........................................... 992,146 13 1,109,000 14 1,095,000 14Texas.................................................. 1,969,125 21 2,202,000 23 2,174,000 23Utah.................................................... 728,191 8 814,000 10 804,000 10Virginia.............................................. 965,563 13 1,080,000 14 1,066,000 14Washington......................................... 1,649,003 18 1,844,000 19 1,820,000 19West Virginia..................................... 634,349 8 709,000 8 700,000 8Wisconsin........................................... 1,459,065 17 1,631,000 18 1,610,000 18Wyoming............................................ 650,728 9 728,000 9 719,000 9U.S. Territories................................... 218,696 2 245,000 2 242,000 2 Subtotal, Available or Estimate....... 149,238,566 991 166,867,000 1,068 164,721,000 1,069 Unobligated balance lapsing…….... 215,104 - 0 - 0 - Unobligated balance forward to next year........................ 5,036,988 - 0 - 0 - Total, Available or Estimate............ 154,490,658 991 166,867,000 1,068 164,721,000 1,069
2009 Actual and Estimated 2010 and 2011
2009 2010 2011
15-9
NATIONAL AGRICULTURAL STATISTICS SERVICEGeographic Breakdown of Obligations and Staff Years
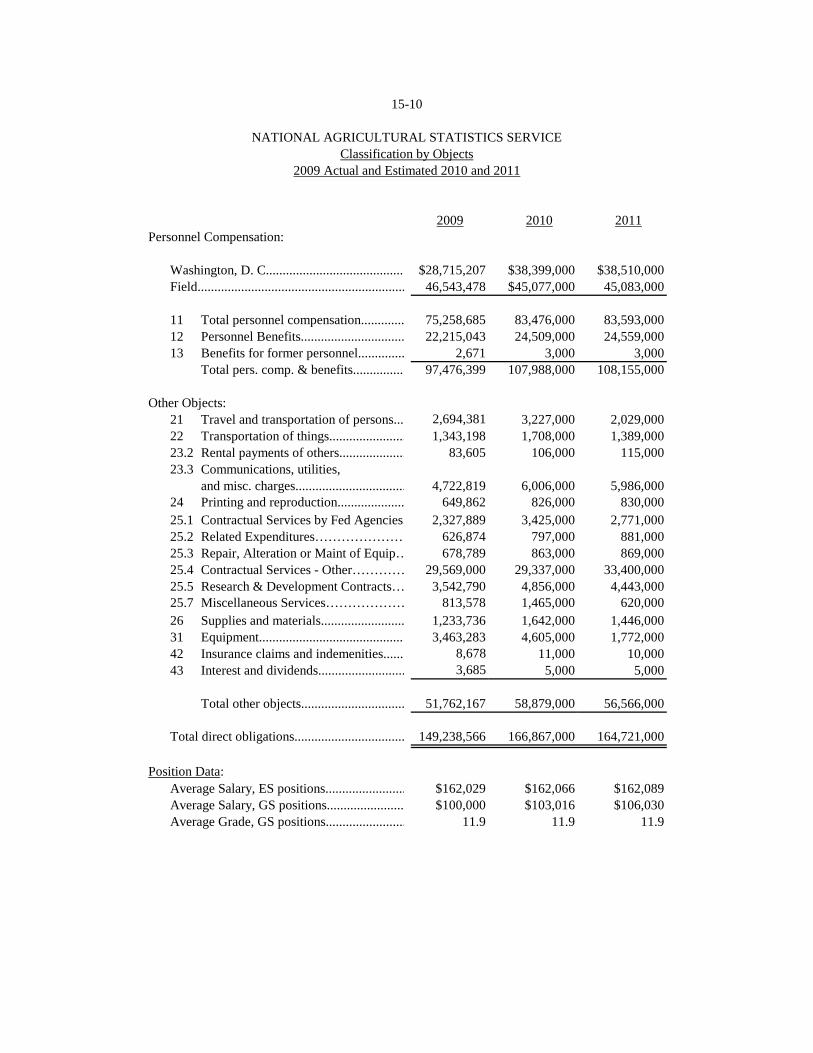
2009 2010 2011Personnel Compensation:
Washington, D. C.......................................... $28,715,207 $38,399,000 $38,510,000Field.............................................................. 46,543,478 $45,077,000 45,083,000
11 Total personnel compensation............. 75,258,685 83,476,000 83,593,00012 Personnel Benefits............................... 22,215,043 24,509,000 24,559,00013 Benefits for former personnel.............. 2,671 3,000 3,000
Total pers. comp. & benefits................ 97,476,399 107,988,000 108,155,000
Other Objects: 21 Travel and transportation of persons... 2,694,381 3,227,000 2,029,00022 Transportation of things....................... 1,343,198 1,708,000 1,389,00023.2 Rental payments of others.................... 83,605 106,000 115,00023.3 Communications, utilities, 23.3 and misc. charges................................. 4,722,819 6,006,000 5,986,00024 Printing and reproduction.................... 649,862 826,000 830,00025.1 Contractual Services by Fed Agencies. 2,327,889 3,425,000 2,771,00025.2 Related Expenditures………………… 626,874 797,000 881,00025.3 Repair, Alteration or Maint of Equip… 678,789 863,000 869,00025.4 Contractual Services - Other………… 29,569,000 29,337,000 33,400,00025.5 Research & Development Contracts… 3,542,790 4,856,000 4,443,00025.7 Miscellaneous Services……………… 813,578 1,465,000 620,00026 Supplies and materials......................... 1,233,736 1,642,000 1,446,00031 Equipment............................................ 3,463,283 4,605,000 1,772,00042 Insurance claims and indemenities....... 8,678 11,000 10,00043 Interest and dividends.......................... 3,685 5,000 5,000
Total other objects............................... 51,762,167 58,879,000 56,566,000
Total direct obligations................................. 149,238,566 166,867,000 164,721,000
Position Data:
Average Salary, ES positions........................ $162,029 $162,066 $162,089Average Salary, GS positions....................... $100,000 $103,016 $106,030Average Grade, GS positions........................ 11.9 11.9 11.9
15-10
NATIONAL AGRICULTURAL STATISTICS SERVICEClassification by Objects
2009 Actual and Estimated 2010 and 2011
15g-1
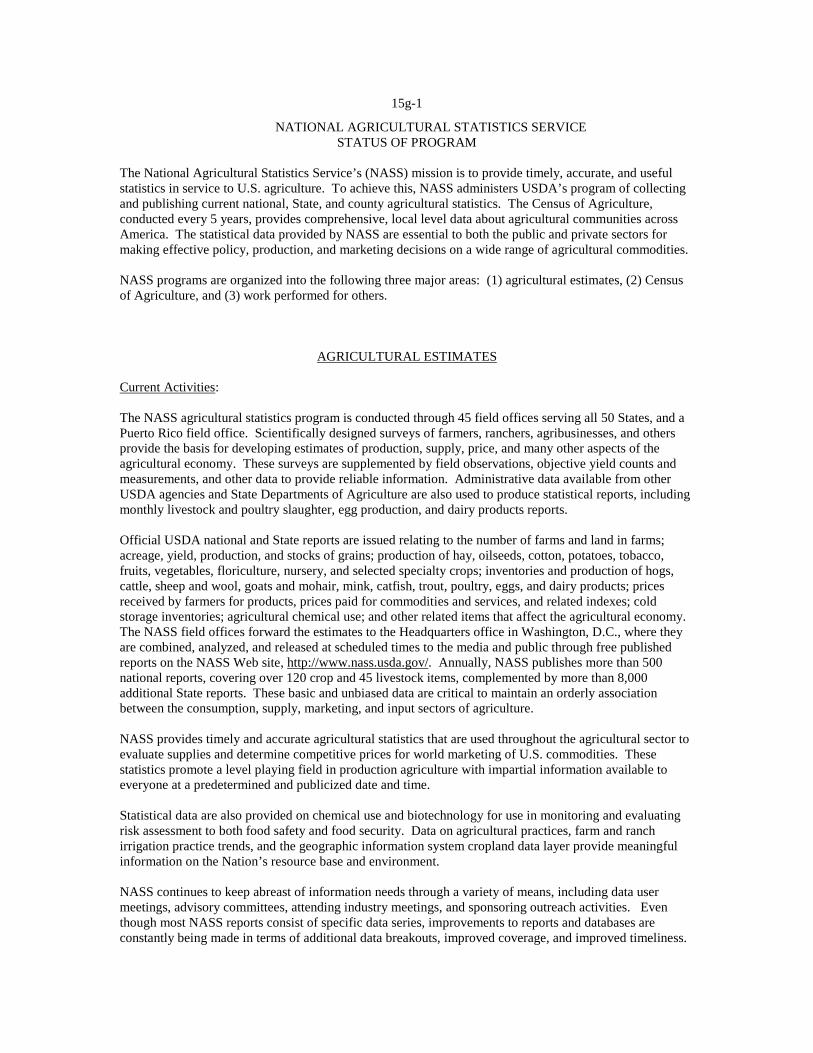
NATIONAL AGRICULTURAL STATISTICS SERVICE STATUS OF PROGRAM
The National Agricultural Statistics Service’s (NASS) mission is to provide timely, accurate, and useful statistics in service to U.S. agriculture. To achieve this, NASS administers USDA’s program of collecting and publishing current national, State, and county agricultural statistics. The Census of Agriculture, conducted every 5 years, provides comprehensive, local level data about agricultural communities across America. The statistical data provided by NASS are essential to both the public and private sectors for making effective policy, production, and marketing decisions on a wide range of agricultural commodities. NASS programs are organized into the following three major areas: (1) agricultural estimates, (2) Census of Agriculture, and (3) work performed for others.
AGRICULTURAL ESTIMATES Current Activities: The NASS agricultural statistics program is conducted through 45 field offices serving all 50 States, and a Puerto Rico field office. Scientifically designed surveys of farmers, ranchers, agribusinesses, and others provide the basis for developing estimates of production, supply, price, and many other aspects of the agricultural economy. These surveys are supplemented by field observations, objective yield counts and measurements, and other data to provide reliable information. Administrative data available from other USDA agencies and State Departments of Agriculture are also used to produce statistical reports, including monthly livestock and poultry slaughter, egg production, and dairy products reports. Official USDA national and State reports are issued relating to the number of farms and land in farms; acreage, yield, production, and stocks of grains; production of hay, oilseeds, cotton, potatoes, tobacco, fruits, vegetables, floriculture, nursery, and selected specialty crops; inventories and production of hogs, cattle, sheep and wool, goats and mohair, mink, catfish, trout, poultry, eggs, and dairy products; prices received by farmers for products, prices paid for commodities and services, and related indexes; cold storage inventories; agricultural chemical use; and other related items that affect the agricultural economy. The NASS field offices forward the estimates to the Headquarters office in Washington, D.C., where they are combined, analyzed, and released at scheduled times to the media and public through free published reports on the NASS Web site, http://www.nass.usda.gov/. Annually, NASS publishes more than 500 national reports, covering over 120 crop and 45 livestock items, complemented by more than 8,000 additional State reports. These basic and unbiased data are critical to maintain an orderly association between the consumption, supply, marketing, and input sectors of agriculture. NASS provides timely and accurate agricultural statistics that are used throughout the agricultural sector to evaluate supplies and determine competitive prices for world marketing of U.S. commodities. These statistics promote a level playing field in production agriculture with impartial information available to everyone at a predetermined and publicized date and time. Statistical data are also provided on chemical use and biotechnology for use in monitoring and evaluating risk assessment to both food safety and food security. Data on agricultural practices, farm and ranch irrigation practice trends, and the geographic information system cropland data layer provide meaningful information on the Nation’s resource base and environment. NASS continues to keep abreast of information needs through a variety of means, including data user meetings, advisory committees, attending industry meetings, and sponsoring outreach activities. Even though most NASS reports consist of specific data series, improvements to reports and databases are constantly being made in terms of additional data breakouts, improved coverage, and improved timeliness.
15g-2
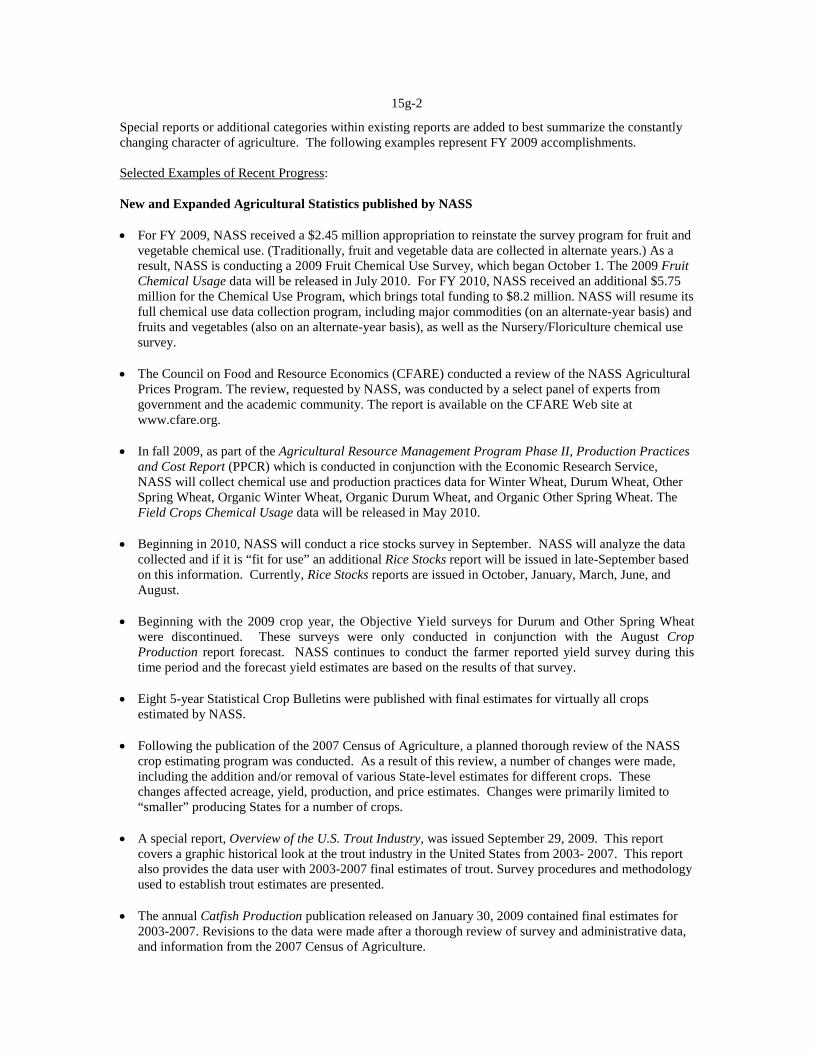
Special reports or additional categories within existing reports are added to best summarize the constantly changing character of agriculture. The following examples represent FY 2009 accomplishments. Selected Examples of Recent Progress: New and Expanded Agricultural Statistics published by NASS • For FY 2009, NASS received a $2.45 million appropriation to reinstate the survey program for fruit and
vegetable chemical use. (Traditionally, fruit and vegetable data are collected in alternate years.) As a result, NASS is conducting a 2009 Fruit Chemical Use Survey, which began October 1. The 2009 Fruit Chemical Usage data will be released in July 2010. For FY 2010, NASS received an additional $5.75 million for the Chemical Use Program, which brings total funding to $8.2 million. NASS will resume its full chemical use data collection program, including major commodities (on an alternate-year basis) and fruits and vegetables (also on an alternate-year basis), as well as the Nursery/Floriculture chemical use survey.
• The Council on Food and Resource Economics (CFARE) conducted a review of the NASS Agricultural
Prices Program. The review, requested by NASS, was conducted by a select panel of experts from government and the academic community. The report is available on the CFARE Web site at www.cfare.org.
• In fall 2009, as part of the Agricultural Resource Management Program Phase II, Production Practices and Cost Report (PPCR) which is conducted in conjunction with the Economic Research Service, NASS will collect chemical use and production practices data for Winter Wheat, Durum Wheat, Other Spring Wheat, Organic Winter Wheat, Organic Durum Wheat, and Organic Other Spring Wheat. The Field Crops Chemical Usage data will be released in May 2010.
• Beginning in 2010, NASS will conduct a rice stocks survey in September. NASS will analyze the data
collected and if it is “fit for use” an additional Rice Stocks report will be issued in late-September based on this information. Currently, Rice Stocks reports are issued in October, January, March, June, and August.
• Beginning with the 2009 crop year, the Objective Yield surveys for Durum and Other Spring Wheat
were discontinued. These surveys were only conducted in conjunction with the August Crop Production report forecast. NASS continues to conduct the farmer reported yield survey during this time period and the forecast yield estimates are based on the results of that survey.
• Eight 5-year Statistical Crop Bulletins were published with final estimates for virtually all crops estimated by NASS.
• Following the publication of the 2007 Census of Agriculture, a planned thorough review of the NASS crop estimating program was conducted. As a result of this review, a number of changes were made, including the addition and/or removal of various State-level estimates for different crops. These changes affected acreage, yield, production, and price estimates. Changes were primarily limited to “smaller” producing States for a number of crops.
• A special report, Overview of the U.S. Trout Industry, was issued September 29, 2009. This report covers a graphic historical look at the trout industry in the United States from 2003- 2007. This report also provides the data user with 2003-2007 final estimates of trout. Survey procedures and methodology used to establish trout estimates are presented.
• The annual Catfish Production publication released on January 30, 2009 contained final estimates for
2003-2007. Revisions to the data were made after a thorough review of survey and administrative data, and information from the 2007 Census of Agriculture.
15g-3
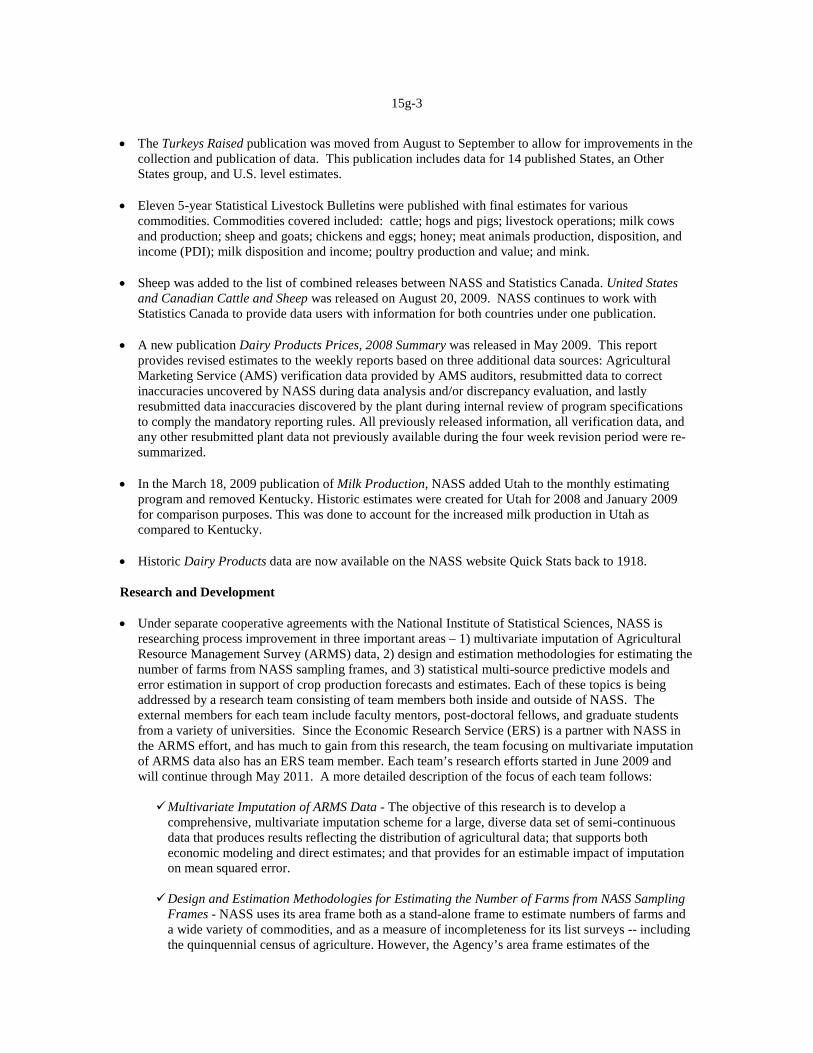
• The Turkeys Raised publication was moved from August to September to allow for improvements in the
collection and publication of data. This publication includes data for 14 published States, an Other States group, and U.S. level estimates.
• Eleven 5-year Statistical Livestock Bulletins were published with final estimates for various commodities. Commodities covered included: cattle; hogs and pigs; livestock operations; milk cows and production; sheep and goats; chickens and eggs; honey; meat animals production, disposition, and income (PDI); milk disposition and income; poultry production and value; and mink.
• Sheep was added to the list of combined releases between NASS and Statistics Canada. United States and Canadian Cattle and Sheep was released on August 20, 2009. NASS continues to work with Statistics Canada to provide data users with information for both countries under one publication.
• A new publication Dairy Products Prices, 2008 Summary was released in May 2009. This report provides revised estimates to the weekly reports based on three additional data sources: Agricultural Marketing Service (AMS) verification data provided by AMS auditors, resubmitted data to correct inaccuracies uncovered by NASS during data analysis and/or discrepancy evaluation, and lastly resubmitted data inaccuracies discovered by the plant during internal review of program specifications to comply the mandatory reporting rules. All previously released information, all verification data, and any other resubmitted plant data not previously available during the four week revision period were re-summarized.
• In the March 18, 2009 publication of Milk Production, NASS added Utah to the monthly estimating
program and removed Kentucky. Historic estimates were created for Utah for 2008 and January 2009 for comparison purposes. This was done to account for the increased milk production in Utah as compared to Kentucky.
• Historic Dairy Products data are now available on the NASS website Quick Stats back to 1918. Research and Development • Under separate cooperative agreements with the National Institute of Statistical Sciences, NASS is
researching process improvement in three important areas – 1) multivariate imputation of Agricultural Resource Management Survey (ARMS) data, 2) design and estimation methodologies for estimating the number of farms from NASS sampling frames, and 3) statistical multi-source predictive models and error estimation in support of crop production forecasts and estimates. Each of these topics is being addressed by a research team consisting of team members both inside and outside of NASS. The external members for each team include faculty mentors, post-doctoral fellows, and graduate students from a variety of universities. Since the Economic Research Service (ERS) is a partner with NASS in the ARMS effort, and has much to gain from this research, the team focusing on multivariate imputation of ARMS data also has an ERS team member. Each team’s research efforts started in June 2009 and will continue through May 2011. A more detailed description of the focus of each team follows:
Multivariate Imputation of ARMS Data - The objective of this research is to develop a
comprehensive, multivariate imputation scheme for a large, diverse data set of semi-continuous data that produces results reflecting the distribution of agricultural data; that supports both economic modeling and direct estimates; and that provides for an estimable impact of imputation on mean squared error.
Design and Estimation Methodologies for Estimating the Number of Farms from NASS Sampling Frames - NASS uses its area frame both as a stand-alone frame to estimate numbers of farms and a wide variety of commodities, and as a measure of incompleteness for its list surveys -- including the quinquennial census of agriculture. However, the Agency’s area frame estimates of the
15g-4
numbers of farms for 2007 were less than those from its dual-frame 2007 Census of Agriculture, raising the question of how many farms not represented on the Agency’s list sampling frames were also missing from its area frame. Thus the challenge is to develop statistical procedures to measure the number of farms missing from both frames and to incorporate these measurements into list sample weights. The dual-frame absence suggests the potential of using capture-recapture techniques or implementing a tri-system estimator. This research is focusing on designing the most effective estimation methodologies to address the issue.
Statistical Multi-source Predictive Models and Error Estimation in Support of Crop Production Forecasts and Estimates - NASS produces multiple forecasts of crop production throughout the growing season and then estimates production at end-of-season or after harvest. The components of crop production include area planted, area harvested, and yield per harvested area. Official forecasts and estimates for these components are derived from multiple current and historical sources: surveys and administrative/auxiliary information -- including weather and remotely sensed data -- and data for previous years. Historically the information for the production components has been synthesized by a panel of experts in NASS’ Agricultural Statistics Board (ASB) using these multiple sources, with publication of the resulting official forecasts/estimates. Subsequently, the official forecasts/estimates of production are compared to the utilization of the crops to assess the accuracy of the forecasts. The statistical questions that are being addressed by this research are 1) whether improvements can be made in the ASB‘s analysis process via increased use of data modeling or through other approaches; and 2) how these models or other techniques can be validated during the short time period available for analysts to review the inputs before publication of the time sensitive official estimates.
• Two states, Kansas and Ohio were added to the remote sensing yield program for the 2009 crop year.
This brings the total number of States to seven. State and district level yield indications were provided monthly to the States in September and October. County level indications for all seven States were provided in October.
• In support of NASS’ efforts to improve its very important county estimates program, its Research and
Development Division (RDD) contracted with four world renown experts on small area estimation – Dr. Graham Kalton of Westat; Dr. Malay Ghosh of the University of Florida; Allen Schirm of Mathematica Policy Research, Inc.; and Dr. Partha Lahiri of the University of Maryland and the Joint Program in Survey Methodology. These consultants met with Agency staff from October 2008 to February 2009 and presented their recommendations for program improvement in late February. One of the major benefits of this external review of our county estimates program was a subsequent cooperative agreement with Partha Lahiri, as an American Statistical Association Fellow, to pursue the type of small area estimation modeling that the group had recommended. The subsequent, on-going work in this area is very promising.
• In an effort to provide additional focus on improving the efficiency of survey data editing and
imputation in NASS, a restructure of RDD’s Census and Survey Research Branch was completed in March 2009, to include an Editing and Imputation Research Section. In addition to refining imputation methods used in the Agency’s census and sample survey programs, an effort which in itself stands to yield significant benefits in resulting data quality, the section will focus strongly on selective and statistical data editing for the Agency’s sample surveys. The latter focus has strong potential for increasing the efficiency of the editing process by reducing a very resource intensive, manual review process while maintaining or improving ultimate survey data quality.
• The NASS Area Frame Section completed the implementation of ArcGIS 9 from ArcView this year. This upgrade in technology has already provided improvements in the stratification process. The new software helps to make a seamless frame with no gaps, and it streamlines the quality control process to identify problems.
15g-5
• NASS’ RDD expanded its efforts to publicize its non-sensitive research efforts in recommending improvements to the Agency’s data collection and estimation program. Last year the Agency posted over 800 reports on the Internet. This will allow Agency staff, as well as other government agencies and statistical organizations to benefit from this statistical research. Also this year, presentations and papers delivered at professional meetings and conferences were made available via these sites. These latest improvements in information sharing broaden the efforts in publicizing NASS’ research efforts and in assisting NASS employees in identifying best practices in conducting surveys and using geospatial information.
• The remote sensing acreage estimation program expanded in three dimensions for the 2009 crop year. It expanded the number of States from 19 to 27, expanded the number of crops from 5 to 15, and expanded the number of times indications are provided from 3 to 6 periods. The remote sensing acreage program now covers all market sensitive crops and States.
Cyber and Physical Security • In compliance with Homeland Security Presidential Directive 12 (HSPD-12), NASS made major strides
in ensuring all of its employees are properly suited to perform their jobs. This was accomplished through completion of individual background checks as mandated by HSPD-12. NASS has also started processing background checks for National Association of State Departments of Agriculture (NASDA) personnel who are contracted as enumerators. NASS is nearing completion on issuing the USDA HSPD-12 Identification badges (LincPass) to its entire staff. NASS continues to upgrade its electronic physical access systems enabling compatibility with LincPass smartcards. NASS continues to upgrade its two-factor authentication solution, also ensuring compatibility with LincPass smartcards.
• NASS continues to elevate its users’ awareness on the importance of sound security practices and
procedures by means of mandatory information security awareness and privacy training. System and Network Administrators with significant security responsibilities were required to complete security-focused courses specific to their field of expertise.
• NASS elevated protection to its enterprise network environment by supplementing currently installed
security devices with additional security monitoring, and analytical tools/solutions. This enables NASS to better monitor and protect its data and network.
• NASS migrated its current hard disk encryption solution to the USDA standard; ensuring centralized
encryption management on Agency laptops. This ensures the highest level of security on all Agency laptops, ensuring protection from unauthorized access. And, should a laptop get lost or stolen, will render stored data inaccessible.
Data Users Meeting
• The 2009 Data Users Meeting was held in Chicago, Illinois on November 2, 2009. The meeting
provided an open forum for data users to ask questions about the entire USDA statistics program. From the customer service perspective, the Data Users Meeting provided an excellent opportunity to learn about the data users’ concerns and desires for improvements or changes to the statistics and economics programs. It is also a great opportunity to learn where they do not understand the basis for some of the statistics and analyses. The meeting was hosted by NASS in cooperation with the World Agricultural Outlook Board, ERS, AMS, Foreign Agricultural Service, and the U.S. Census Bureau.
Advisory Committee on Agriculture Statistics
• In February 2009, a meeting was held in Arlington, Virginia, to advise NASS on annual program
priorities; upcoming 2012 Census of Agriculture; and offer suggestions on the NASS on-going survey program, State of NASS and an update on the Data Enclave. Staff from NASS gave presentations on
15g-6
2012 Agricultural Census Content. In addition, the committee discussed topics on the Status of Programs for NASS and public comments. A specific ARMS Data Users meeting was held immediately following the Advisory Committee meeting. The Data Enclave was presented by representatives of the National Opinion Research Center (NORC). NORC is an institution that can manage access to data needs of statistical agencies. They discussed how they are maintaining confidentiality and data management. NASS provides ARMS data to NORC and the University Researchers that contact NASS to do research with ARMS data in turn work with NORC.
CENSUS OF AGRICULTURE Current Activities: The Census of Agriculture is conducted every 5 years and provides comprehensive data series at the national, State, and county level. A snapshot of the agriculture economy including the number of farms, farm typology, characteristics of farm operators, land use, production expenses, value of land and buildings, farm size, market value of agricultural production sold, acreage of hundreds of crops, inventory of livestock and poultry, and extensive farming practices including irrigation, marketing and utilization of government sponsored programs. The results of the 2007 Census of Agriculture were published in fiscal year 2009 and will continue through the release of the topic driven Fact Sheets. Information from the Census of Agriculture provides extensive and detailed data at the county level which facilitates locality-based policy and business decisions affecting the agricultural industry and rural residents. The following examples represent accomplishments during fiscal year 2009. Selected Examples of Recent Progress: 2007 Census of Agriculture: NASS achieved several milestones in the 2007 Census of Agriculture revealed in 2009 including: • Seventy-four percent final coverage rate for minority operators as compared to sixty-eight percent in
2002. • Four percent response or 96,780 questionnaires was completed over the Internet. This is the first time
the Census of Agriculture provided this mode of response resulting in a significant increase over the usual two percent total response levels for this mode on our annual ongoing program.
• Publication tables at the US, State, and county level were released February 4, 2009. At this same time, the outlying areas of Puerto Rico, Guam, Northern Mariana Islands, and U.S. Virgin Islands were also released.
• For the first time, a Watershed publication was produced which summarized the 2007 Census of
Agriculture and the 2002 Census of Agriculture at the 6-digit basin or watershed level according to the United States Geologic Survey.
• Fact Sheets were developed and released for Farm Numbers, Demographics, and Economics. • A series of Census profiles were made available. These profiles included summarized data by
Congressional Districts, State, County, Race, Ethnicity and Gender.

15g-7
Census Follow-On Surveys • Data Collection and analysis is nearing completion for the 2008 Organic Production Survey (OPS). The
results from the 2008 OPS will be released February 3, 2010. • The 2008 Organic Production Survey was the first survey completely processed in the PRISM System.
This system, which was originally developed to process the data from the Census of Agriculture, uses enterprise level data bases to manage, edit and analyze the data. Using the system for the on-going survey program provides NASS additional return on its extensive investment in the development of the system and allows end users to apply skills learned during the Census of Agriculture.
• Data Collection and analysis was completed for the 2008 Farm and Ranch Irrigation Survey (FRIS).
The results from the 2008 FRIS will be released in two phases. The first portion of the release will be November 30, 2009 and will cover the irrigation for field crops. The second portion of the release will be in February 2010 and will cover all horticultural operations in two categories: sales from $1 – $10,000 and greater than $10,000.
• Plans for two additional follow-on surveys were being developed during 2009: the 2009 Census of
Horticultural Specialties and the 2009 On-Farm Renewable Energy Production Survey. • Initial plans are being developed on projects which include a study on the Tenure, Ownership, and
Transition of Agricultural Land (TOTAL). The TOTAL survey will be conducted in 2011 along with the Census of Aquaculture.
2012 Census of Agriculture • NASS contracted with the Council on Food, Agriculture and Resource Economics to conduct an outside
census review panel that made recommendations for improvements to the Census of Agriculture. Three teams are currently working on the planning for the 2012 Census and will address many of the recommendations. The three teams are the Content Team, the Data Collection Testing Team and Publications Team.
• Planning and development for the 2012 Census of Agriculture was initiated with the formation of two
teams: one responsible for the content (Content Team) and one responsible for development and testing of the forms and data collection (Data Collection Testing Team). The latter team reviewed the data collected on the 2007 Census of Agriculture as well as comments from NASS field offices and other staff to target areas for improvement. Revisions to the form have been developed, and a first round of forms testing is planned for late 2009 and early 2010. Testing includes in-person cognitive interviews to ensure respondents are able to report the required data accurately and a mail-out of 5,000 forms testing both mail and on-line reporting via the Internet. Following analysis of the first round of testing, a second round of testing is planned for late 2010 and early 2011. The focus of the second round will be testing the census processing systems as well as finalizing the forms and data collection procedures. This iterative approach to testing will help improve the quality of the data collected on the 2012 Census of Agriculture by improving both the initial reporting of census data and the subsequent data handling and processing.
• Two additional sub teams were formed from the Data Collection Testing Team. One sub team is to
develop improvements to the web-based Electronic Data Reporting system for the 2012 Census of Agriculture. The second sub team is investigating the potential for a special form for improved data collection for American Indian operations.
• Counting over 2.2 million farms takes a fully implemented and routinely performed list building effort.
Beginning in reference year 2009, NASS began developing its Census Mail List. Over the course of the next three years, NASS will process millions of potential agriculture operation identification report
15g-8
forms through the National Agricultural Classification Survey instrument to determine if they should be included in the 2012 Census of Agriculture.
• NASS conducted a workshop for representatives from approximately 30 Community Based
Organizations (CBOs) in April 2009 to review results from the 2007 Census of Agriculture which were relevant to their constituents. In addition, a framework for partnering together with NASS to improve the accuracy of demographic data from the 2012 census was discussed.
• Three Texas CBOs are partnering with NASS to develop a NASS-CBO Partnership Handbook to
provide guidance on creating productive partnerships in support of the 2012 census. eGovernment
• NASS makes its data available to the public through query tools that can be downloaded as well as an
on-line database that can be queried called Quick Stats. These on-line applications are displayed on www.agcensus.usda.gov and www.data.gov . This NASS web tool for accessing Census of Agriculture data is one of the five featured tools on Data.gov and currently has a five-star rating.
• NASS depends heavily on the electronic media as a vehicle for soliciting input from internal and
external resources. In particular, proper census planning requires eliciting responses by advertising an Internet portal to provide the public a forum for data user feedback. These public forums are being utilized for planning the Census follow-on programs.
• NASS began utilizing Twitter, Facebook, and other social networking tools to draw attention to all of
the data products NASS offers to the public. This effort has been heavily used in FY 2009.
WORK PERFORMED FOR OTHERS
Current Activities: NASS conducts surveys for and lends technical expertise to other Federal agencies, State governments, and private organizations on a reimbursable basis. NASS provides support and assistance in the areas of questionnaire and sample design, data collection and editing, analysis of survey results, and training. NASS also provides technical consultation, support, and assistance to foreign countries desiring to enhance their statistical programs. NASS performs services and statistical consultation for other Federal and State agencies and private commodity organizations on a reimbursable basis. Statistics generated meet special needs not covered by the National Agricultural Statistics Program. In addition, statistical consultation by NASS staff members contributes to improvements in the overall quality and consistency of statistical information produced for the needs of other organizations. The following examples represent accomplishments during fiscal year 2009. Selected Examples of Recent Progress: Agricultural Resource Management Survey (ARMS). • The ARMS is conducted annually in cooperation with the USDA’s ERS. The survey provides data to
enable NASS to publish chemical use statistics and to provide ERS the ability to estimate farm income, conduct economic analysis relating to field crop chemical usage, estimate costs associated with producing agricultural commodities, and compile farm business and household financial data. Data collected support both agencies’ estimation programs for farm production expenditures. Use of
15g-9
respondent incentives continued in 2009 with the use of debit cards for respondents in the core ARMS sample. The 2008 ARMS Phase III, conducted in the winter of 2009, focused on farm financial data.
National Animal Health Monitoring System (NAHMS).
• NASS conducted a survey under contract for the Animal and Plant Health Inspection Service (APHIS),
National Animal Health Monitoring System (NAHMS) to study health management practices of goats on farms in 21 States. Although this was the first goat health survey the study was a continuation in a series of surveys sponsored by NAHMS, an information gathering and dissemination organization within APHIS. NASS provided statistical services including questionnaire development, data collection, data keying, data editing, and summarization.
United Soybean Board.
• NASS has been collaborating with the United Soybean Board (USB) for 6 years by supplying the Board
with soybean samples from 11 States involved in our annual Soybean Objective Yield Survey. Compositional analysis of the random samples is made to determine such variables as oil and protein content. These analyses help determine the quality of soybeans produced in the U.S. and how they compare with those grown in other countries and help USB establish priorities for research, marketing, and education efforts. At the end of each crop season, USB provides analyses back to NASS field offices that can be provided to Soybean Objective Yield respondents.
County Cash Rents Survey.
• Through the 2008 Farm Bill, NASS was directed to conduct an annual Cash Rents survey to establish
per acre estimates of county average cash rental rates for dry land and irrigated cropland and pastureland. The first survey, 2008 County Cash Rents, was successfully completed in the spring 2009 with survey results published in May 2009. The survey generated county and/or district level estimates of cash rental rates for all counties with 20,000 plus acres (any combination of dry cropland, irrigated cropland or permanent pasture). Data collected support the Farm Service Agency’s administration of payments for the Conservation Reserve Program. The 2009 probability-based survey was underway in August 2009, with results expected in early spring 2010.
Childhood Injury and Occupational Injury Survey. • NASS conducted a nationwide survey, for the National Institute of Occupational Safety and Health
(NIOSH), of approximately 57,000 farm operations that focused on injuries to children, less than 20 years of age, that resided, worked, or visited on minority or Hispanic farming operations. Part of the study also focused on occupational injuries to minority or Hispanic farm operators and their families. This Occupational Injury and Illness Survey is a continuation of NIOSH studies conducted by NASS and sponsored by the Centers for Disease Control that focus on the occupational health of farm operators and their families. NASS provided statistical services such as sample selection, questionnaire and computer-assisted telephone instrument development, data collection, data keying, and data editing. NASS will publish a press release highlighting some of the study’s findings and a final detailed report will be published by NIOSH in 2010.
NASS Review of USDA Agency Office of Management and Budget (OMB) Submissions. • NASS is recognized as USDA’s statistical agency and works regularly with OMB staff in the approval
of Information Collection Requests (ICRs). By virtue of this role, NASS is also tasked with assisting all other USDA agencies in review of their ICRs prior to OMB submission. In most cases, this involves a thorough review of their proposed survey methodology. In 2009, NASS assisted the following agencies with ICR review: Forest Service, Food and Nutrition Service, Food Safety Inspection Service, AMS, Risk Management Agency, ERS and APHIS.
15g-10
International Technical Assistance Provided • NASS provided technical assistance and training to improve agricultural statistics programs in six
countries. Short-term assignments supported work in Armenia, Georgia, Madagascar, Mongolia, Nigeria, and Serbia. The technical assistance ranged from basic survey concepts and procedures to complete national Census of Agriculture support. In addition, NASS coordinated and/or conducted training programs in the U.S. for 120 visitors representing 24 countries. These assistance and training activities promote better quality data and improved access to data from other countries, which allows U.S. analysts to better understand the world supply and demand situation. Improved analysis supports trade and more efficient marketing of U.S. agricultural products.
AMS Pesticide Data Program. • The AMS Pesticide Data Program (PDP) is the basis for a broad statistical analysis of pesticide
contamination of food commodities intended for human consumption. Each quarter, samples of three (seasonally varying) groups of fresh commodities and one group of processed commodities are collected from a random sample of distribution centers located in key states. The selection of distribution centers from which commodity samples are taken follows the basic systematic probability-proportional-to-size (PPS) sampling technique pioneered by Phil Kott, Chief Research Statistician, NASS-RDD, early in the consulting relationship between NASS and the AMS. Within the framework of the basic PPS scheme, the following issues are still under investigation: the formulation of more suitable measures of size for distribution centers, with the possibility of multiple measures of size corresponding to different commodity groups; regional sub-sampling to allow for more cost effective deployment of enumerators within each participating state; a rational scheme for choosing the commodities that are to be tested each quarter; and a renewed effort to expand the sampling frame of distribution centers.
AMS Microbiological Data Program. • The AMS Microbiological Data Program (MDP) is a counterpart to the PDP, focusing on the potential
human health risks from contamination of fresh produce by common microbiological agents. Currently, the sampling of distribution centers for selected groups of fresh commodities follows the PPS sampling methodology used for the PDP survey. However, especially in light of recent reports of microbiological contamination of the US food supply reported by the news media, there is a growing awareness that the MDP survey should be designed to meet objectives which differ significantly from that of the PDP survey, which is geared toward long range estimates of contamination levels. NASS is working with AMS in the development of a practicable, cost-effective MDP sampling scheme to assist in localizing the incidence of contamination in a timely manner to avoid widespread distribution.
Center for Nutrition Policy and Promotion.
• NASS assisted Center for Nutrition Policy and Promotion staff in developing nutrition guidance for the American public, based on the 2005 Dietary Guidelines for Americans published by the U.S. Department of Health & Human Services.
MyPyramid Food Intake Patterns • NASS staff analyzed data structure, validated data, developed algorithms, and wrote efficient Statistical
Analysis System programs to calculate the daily food consumption of the U.S. population. Output results were studied to see how actual consumption patterns compare to the current recommended Food Pyramid, based on the 2003-2004 NHANCES survey data from the Agricultural Research Service. Using the nutrient profile results, nutrient amounts recommended from each food group can be adjusted to assure that nutrient goals for each age/gender group are met.
15-11 NATIONAL AGRICULTURAL STATISTICS SERVICE
Summary of Budget and Performance
Statement of Department Goals and Objectives
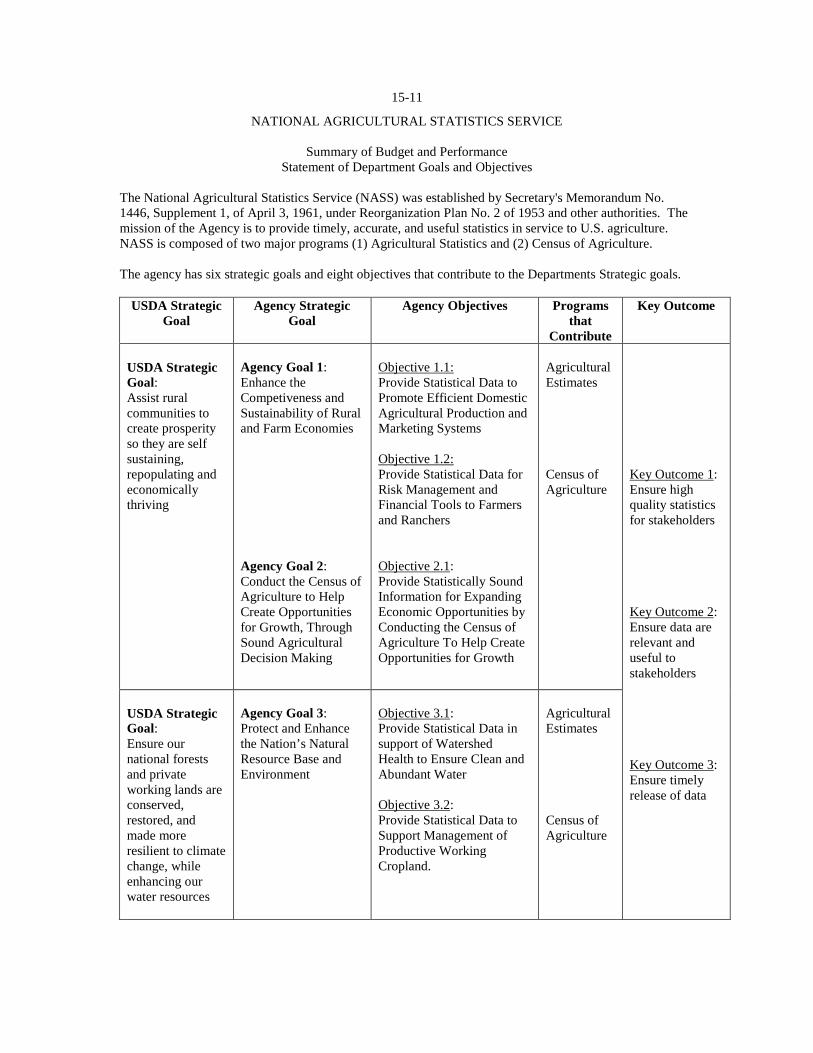
The National Agricultural Statistics Service (NASS) was established by Secretary's Memorandum No. 1446, Supplement 1, of April 3, 1961, under Reorganization Plan No. 2 of 1953 and other authorities. The mission of the Agency is to provide timely, accurate, and useful statistics in service to U.S. agriculture. NASS is composed of two major programs (1) Agricultural Statistics and (2) Census of Agriculture. The agency has six strategic goals and eight objectives that contribute to the Departments Strategic goals.
USDA Strategic Goal
Agency Strategic Goal
Agency Objectives Programs that
Contribute
Key Outcome
USDA Strategic Goal: Assist rural communities to create prosperity so they are self sustaining, repopulating and economically thriving
Agency Goal 1: Enhance the Competiveness and Sustainability of Rural and Farm Economies Agency Goal 2: Conduct the Census of Agriculture to Help Create Opportunities for Growth, Through Sound Agricultural Decision Making
Objective 1.1: Provide Statistical Data to Promote Efficient Domestic Agricultural Production and Marketing Systems Objective 1.2: Provide Statistical Data for Risk Management and Financial Tools to Farmers and Ranchers Objective 2.1: Provide Statistically Sound Information for Expanding Economic Opportunities by Conducting the Census of Agriculture To Help Create Opportunities for Growth
Agricultural Estimates Census of Agriculture
Key Outcome 1: Ensure high quality statistics for stakeholders Key Outcome 2: Ensure data are relevant and useful to stakeholders Key Outcome 3: Ensure timely release of data
USDA Strategic Goal: Ensure our national forests and private working lands are conserved, restored, and made more resilient to climate change, while enhancing our water resources
Agency Goal 3: Protect and Enhance the Nation’s Natural Resource Base and Environment
Objective 3.1: Provide Statistical Data in support of Watershed Health to Ensure Clean and Abundant Water Objective 3.2: Provide Statistical Data to Support Management of Productive Working Cropland.
Agricultural Estimates Census of Agriculture

15-12 USDA Strategic Goal: Help America promote agricultural production and biotechnology exports as America works to increase food security
Agency Goal 4: Support International Economic Development and Trade Capacity Building Through Technical Assistance Agency Goal 5: Support the Growth of Sustainable Agricultural Production
Objective 4.1: Provide Technical Assistance to Improve Agricultural Statistics in Developing and Transitioning Countries Objective 5.1: Provide a rotational organic agriculture data series
Agricultural Estimates Census of Agriculture
Key Outcome 1: Ensure high quality statistics for stakeholders Key Outcome 2: Ensure data are relevant and useful to stakeholders Key Outcome 3: Ensure timely release of data
USDA Strategic Goal: Ensure that all of America’s children have access to safe, nutritious and balanced meals
Agency Goal 6: Support a safe U.S. Food Supply and Agricultural Production
Objective 6.1: Provide Chemical Usage Statistics to Enable Informed Decision Making Using Sound Science in Risk Analysis
Agricultural Estimates
Key Outcome 1: Ensure high quality statistics for stakeholders. Long-term Performance Measure: Improve the ACSI score for providing timely, accurate, and useful statistical products and service. Selected Past Accomplishments toward Achievement of the Key Outcomes: • Agricultural Estimates - NASS maintained its ACSI score with one point reduction from 2004 to 2008.
The overall NASS score for customer satisfaction was 76. NASS continually strives to produce quality data by using sound analytical techniques, by using proven methods, and by carefully reviewing the content of all information products. The next ACSI will be conducted in FY 2011.
• Census of Agriculture – With enhanced collaborative efforts from Community Based Organizations
NASS improved the coverage of small and disadvantaged operations counted in the 2007 Census of Agriculture.
Selected Accomplishments Expected at the FY 2011 Proposed Resource Level:
• Agricultural Estimates – Implement a probability-based survey design and conduct adequate non-response follow-up for NASS county estimates to significantly improve the quality of these estimates. The Risk Management Agency relies on these data to administer billions of dollars of crop insurance programs that provide U.S. farmers a safety net against unpredictable growing conditions.
• Census of Agriculture – Preparations to ensure a high quality 2012 Census of Agriculture continue. In
2011 NASS will mail out over 1 million screening forms in an effort to expand coverage for all farms. This screener will help ensure a quality mail list which will improve the scope of Census of Agriculture coverage. Additionally, it minimizes the response burden to individuals not qualifying by the definition of a farm which will improve the overall quality of the 2012 Census of Agriculture.
15-13 Efficiency Measure: The increase in the data collection costs per sample unit divided by the annual rate of inflation (measured by the Employment Cost Index) is less than one. Key Outcome 2: Ensure data are relevant and useful to stakeholders. Long-term Performance Measure: The relevance of the report content of NASS products and services as measured by the ACSI score. Selected Past Accomplishments toward Achievement of the Key Outcome: • Agricultural Estimates/Census of Agriculture - NASS has kept abreast of information needs through a
variety of means, including data user meetings, advisory committees, attendance at industry meetings, and sponsorship of outreach activities. Improvements to reports and data bases have been made like additional data breakouts, improved coverage, and improved timeliness. Special reports or additional categories within existing reports are added to best summarize the constantly changing character of agriculture. With better editing and analysis tools NASS has expanded the census products to include a new Watersheds report. NASS issued the first of an annual County Cash Rents report in 2009 at the County, District, and State levels providing rental amounts for irrigated and non-irrigated cropland, and pasture land.
Selected Accomplishments Expected at the FY 2011 Proposed Resource Level: • Agricultural Estimates - The FY 2011 initiative on remote sensing will expand and improve a valuable
tool to monitor key indicators of global climate change that impact agriculture production. The FY 2011 funding supports an on-going data series on organic agriculture production. This data series is paramount to measuring the continued growth and evolution of this key sector.
• Census of Agriculture - In 2011, NASS will be conducting a 30,000 sample Census of Agriculture
Content Test. The results of this test will be applied to the form to improve the quality of data collected and survey procedures during the 2012 Census Proper. Additionally, this test will serve as a dry test run for programming and processing the 2012 Census of Agriculture.
Efficiency Measure: The increase in the data collection costs per sample unit divided by the annual rate of inflation (measured by the Employment Cost Index) is less than one. Key Outcome 3: Ensure timely release of data. Long-term Performance Measure: Percent of time official reports are released on the date and time pre-specified to data users. Selected Past Accomplishments toward Achievement of the Key Outcome: • Agricultural Estimates/Census of Agriculture - NASS has met its goal regarding release dates in seven
of the past ten years. February 4, 2009 NASS results were published for the 2007 Census of Agriculture for U.S. States and Counties along with Puerto Rico, Guam, Virgin Islands, and Northern Mariana Islands.
Selected Accomplishments Expected at the FY 2011 Proposed Resource Level: • Agricultural Estimates/Census of Agriculture - NASS will continue to place a high priority on meeting
pre-established release dates. NASS intends to publish the results of the 2009 On Farm Renewable Energy Survey by March 2011. The scope of the survey includes energy produced by wind, methane digesters, solar, and liquid fuels.
Efficiency Measure: The increase in the data collection costs per sample unit divided by the annual rate of inflation (measured by the Employment Cost Index) is less than one.
15-14
Staff Staff Increase or StaffAmount Years Amount Years Decrease Amount Years
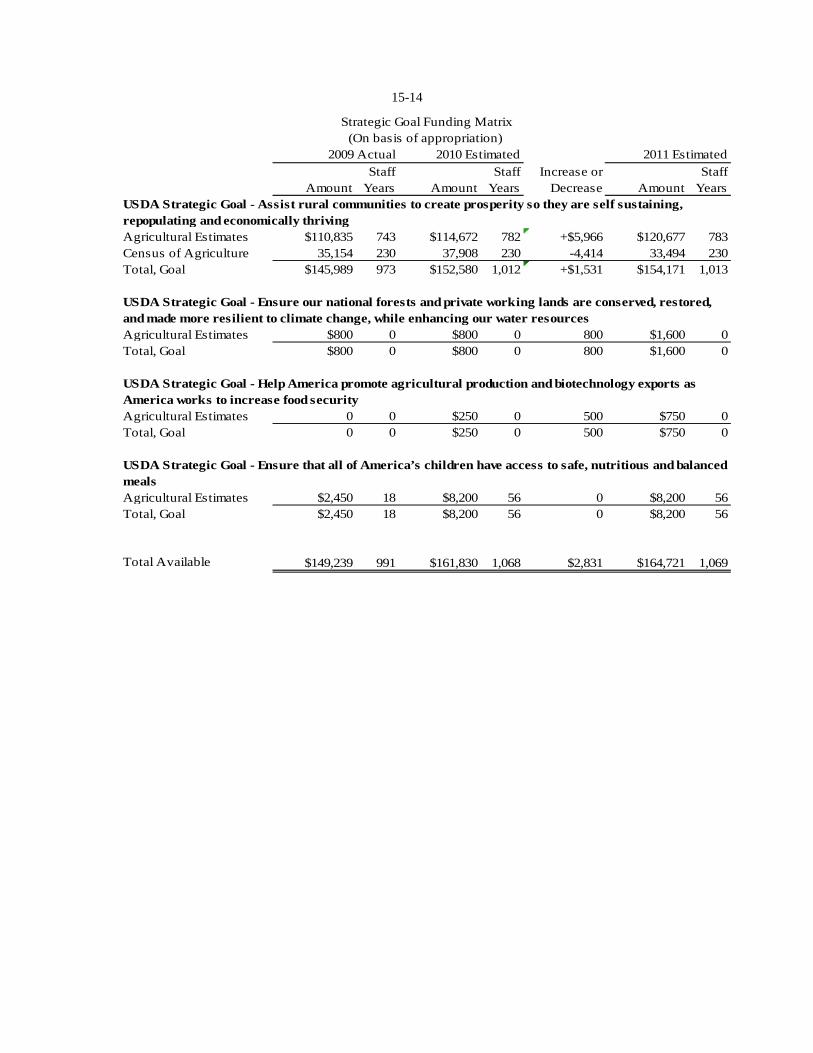
Agricultural Estimates $110,835 743 $114,672 782 +$5,966 $120,677 783Census of Agriculture 35,154 230 37,908 230 -4,414 33,494 230Total, Goal $145,989 973 $152,580 1,012 +$1,531 $154,171 1,013
Agricultural Estimates $800 0 $800 0 800 $1,600 0Total, Goal $800 0 $800 0 800 $1,600 0
Agricultural Estimates 0 0 $250 0 500 $750 0Total, Goal 0 0 $250 0 500 $750 0
Agricultural Estimates $2,450 18 $8,200 56 0 $8,200 56Total, Goal $2,450 18 $8,200 56 0 $8,200 56
Total Available $149,239 991 $161,830 1,068 $2,831 $164,721 1,069
USDA Strategic Goal - Ensure that all of America’s children have access to safe, nutritious and balanced meals
2009 Actual 2010 Estimated 2011 Estimated
Strategic Goal Funding Matrix(On basis of appropriation)
USDA Strategic Goal - Assist rural communities to create prosperity so they are self sustaining, repopulating and economically thriving
USDA Strategic Goal - Ensure our national forests and private working lands are conserved, restored, and made more resilient to climate change, while enhancing our water resources
USDA Strategic Goal - Help America promote agricultural production and biotechnology exports as America works to increase food security
15-15
NATIONAL AGRICULTURAL STATISTICS SERVICE Summary of Budget and Performance
Key Performance Outcomes and Measures USDA Strategic Goals: Key outcomes and performance measures under each of the Agency’s strategic goals are based on its mission to provide timely, accurate, and useful agricultural statistics. Each goal of the USDA Strategic Plan to which NASS contributes has a measure for each of the Investment Criteria: Usefulness (relevance), accuracy (quality), and timeliness (performance). These performance measures can be summarized into 3 generic measures: Timeliness: Percent of time official reports are released on the date and time pre-specified to data users. Agricultural statistics are the core of many decisions made in the agriculture sector. If these data are not timely, the disruption and chaos generated would be immeasurable. This performance measure is the same for all of the goals and is only be calculated across all NASS reports. Accuracy: Precision. These performance measures vary by goal, but get to the root of why NASS is considered a leading provider of agricultural statistics. Precision of data are necessary for stakeholders to be able to rely on the data to make day-to-day management decisions and eliminate unnecessary chaos in the market. Proposed increases in the FY 2011 Department Estimates are focused on significant improvement of county estimates utilized by many other USDA agencies in administering farm programs and assessing policy changes. These estimates impact billions of dollars in agriculture insurance indemnities. Usefulness: Coverage. These performance measures vary by objective. Key stakeholders are continuously providing input into the need for data series. This input comes in many forms, and is always monitored to ensure commodity inclusion and coverage is adequate and necessary. Key Performance Targets
Performance Measure
2008 Actual
2009 Estimate
2010 Target
2011 Target
Usefulness – The accuracy and usefulness of the report content of NASS products and services as measured by ACSI 1/
a. Units b. Dollars
82 2/
Not Measured
2/
Not Measured
2/
>84 2/
Timeliness – Percent of time official reports are released on the date and time pre-specified to data users.
a. Units
99.6%
99.8%
100%
100% 1/ The American Customer Satisfaction Index is only measured every 3 years. However, the usefulness of NASS reports is monitored annually and efforts are continually made to ensure USDA is meeting the growing data needs of its constituents. 2/ The entire NASS budget is used to strive toward each of the OMB R&D criteria including usefulness (relevance).
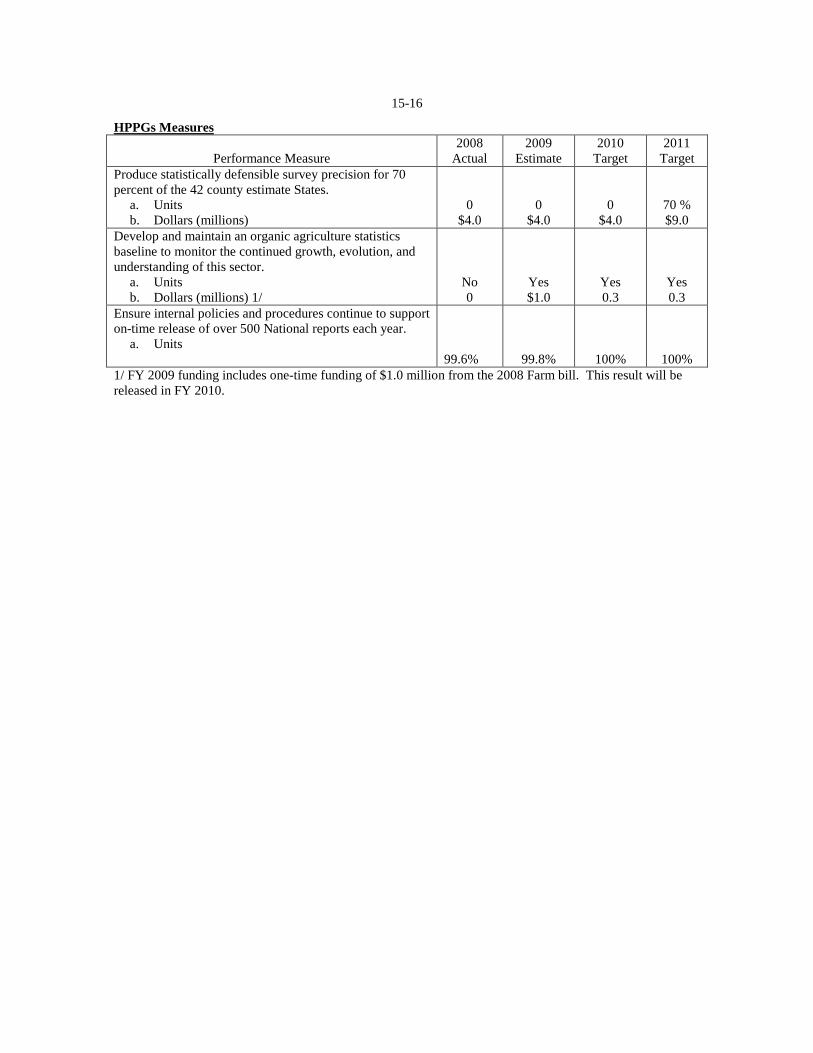
15-16
HPPGs Measures
Performance Measure 2008
Actual 2009
Estimate 2010
Target 2011
Target Produce statistically defensible survey precision for 70 percent of the 42 county estimate States.
a. Units b. Dollars (millions)
0 $4.0
0 $4.0
0 $4.0
70 % $9.0
Develop and maintain an organic agriculture statistics baseline to monitor the continued growth, evolution, and understanding of this sector.
a. Units b. Dollars (millions) 1/
No 0
Yes $1.0
Yes 0.3
Yes 0.3
Ensure internal policies and procedures continue to support on-time release of over 500 National reports each year.
a. Units
99.6%
99.8%
100%
100% 1/ FY 2009 funding includes one-time funding of $1.0 million from the 2008 Farm bill. This result will be released in FY 2010.
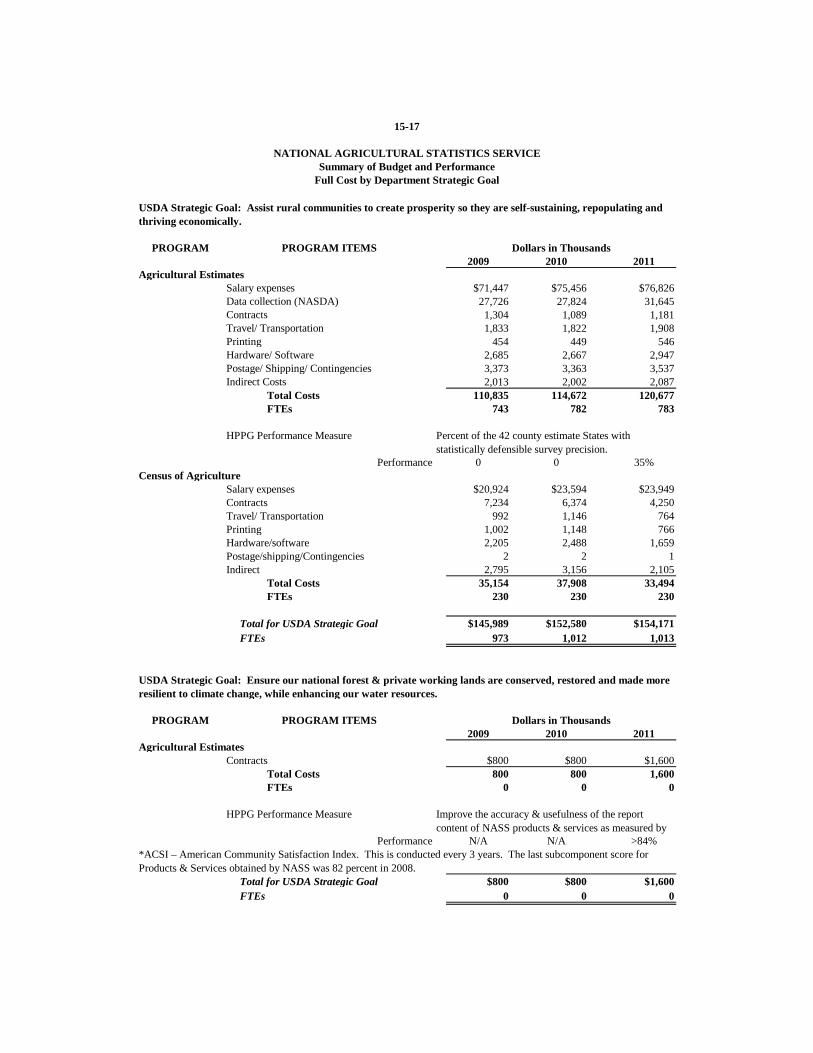
PROGRAM PROGRAM ITEMS2009 2010 2011
Agricultural EstimatesSalary expenses $71,447 $75,456 $76,826 Data collection (NASDA) 27,726 27,824 31,645Contracts 1,304 1,089 1,181Travel/ Transportation 1,833 1,822 1,908Printing 454 449 546Hardware/ Software 2,685 2,667 2,947Postage/ Shipping/ Contingencies 3,373 3,363 3,537Indirect Costs 2,013 2,002 2,087 Total Costs 110,835 114,672 120,677 FTEs 743 782 783
HPPG Performance Measure
Performance 0 0 35%Census of Agriculture
Salary expenses $20,924 $23,594 $23,949Contracts 7,234 6,374 4,250Travel/ Transportation 992 1,146 764Printing 1,002 1,148 766Hardware/software 2,205 2,488 1,659Postage/shipping/Contingencies 2 2 1Indirect 2,795 3,156 2,105 Total Costs 35,154 37,908 33,494 FTEs 230 230 230
Total for USDA Strategic Goal $145,989 $152,580 $154,171 FTEs 973 1,012 1,013
PROGRAM PROGRAM ITEMS2009 2010 2011
Agricultural EstimatesContracts $800 $800 $1,600 Total Costs 800 800 1,600 FTEs 0 0 0
HPPG Performance Measure
Performance N/A N/A >84%
Total for USDA Strategic Goal $800 $800 $1,600 FTEs 0 0 0
Percent of the 42 county estimate States with statistically defensible survey precision.
Improve the accuracy & usefulness of the report content of NASS products & services as measured by
USDA Strategic Goal: Ensure our national forest & private working lands are conserved, restored and made more resilient to climate change, while enhancing our water resources.
15-17
NATIONAL AGRICULTURAL STATISTICS SERVICESummary of Budget and Performance
Full Cost by Department Strategic Goal
*ACSI – American Community Satisfaction Index. This is conducted every 3 years. The last subcomponent score for Products & Services obtained by NASS was 82 percent in 2008.
Dollars in Thousands
USDA Strategic Goal: Assist rural communities to create prosperity so they are self-sustaining, repopulating and thriving economically.
Dollars in Thousands
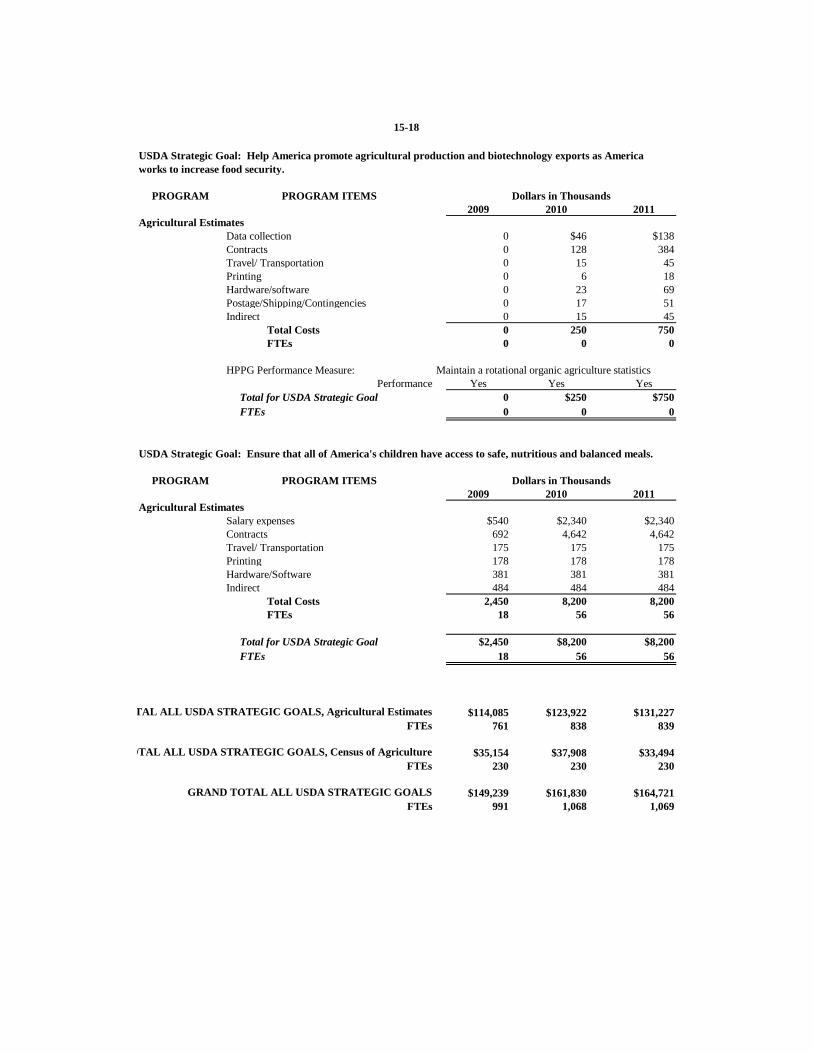
PROGRAM PROGRAM ITEMS2009 2010 2011
Agricultural EstimatesData collection 0 $46 $138 Contracts 0 128 384 Travel/ Transportation 0 15 45 Printing 0 6 18 Hardware/software 0 23 69 Postage/Shipping/Contingencies 0 17 51 Indirect 0 15 45 Total Costs 0 250 750 FTEs 0 0 0
HPPG Performance Measure:Performance Yes Yes Yes
Total for USDA Strategic Goal 0 $250 $750 FTEs 0 0 0
PROGRAM PROGRAM ITEMS2009 2010 2011
Agricultural EstimatesSalary expenses $540 $2,340 $2,340 Contracts 692 4,642 4,642 Travel/ Transportation 175 175 175 Printing 178 178 178 Hardware/Software 381 381 381 Indirect 484 484 484 Total Costs 2,450 8,200 8,200 FTEs 18 56 56
Total for USDA Strategic Goal $2,450 $8,200 $8,200 FTEs 18 56 56
$114,085 $123,922 $131,227 FTEs 761 838 839
$35,154 $37,908 $33,494 FTEs 230 230 230
$149,239 $161,830 $164,721 FTEs 991 1,068 1,069
Dollars in Thousands
USDA Strategic Goal: Ensure that all of America's children have access to safe, nutritious and balanced meals.
Dollars in Thousands
Maintain a rotational organic agriculture statistics
USDA Strategic Goal: Help America promote agricultural production and biotechnology exports as America works to increase food security.
GRAND TOTAL ALL USDA STRATEGIC GOALS
15-18
TAL ALL USDA STRATEGIC GOALS, Agricultural Estimates
OTAL ALL USDA STRATEGIC GOALS, Census of Agriculture