Embed Size (px)
Citation preview

KINE 439 - Dr. Green
Section 2
Electrophysiology and ECG Basics
Rate & Axis
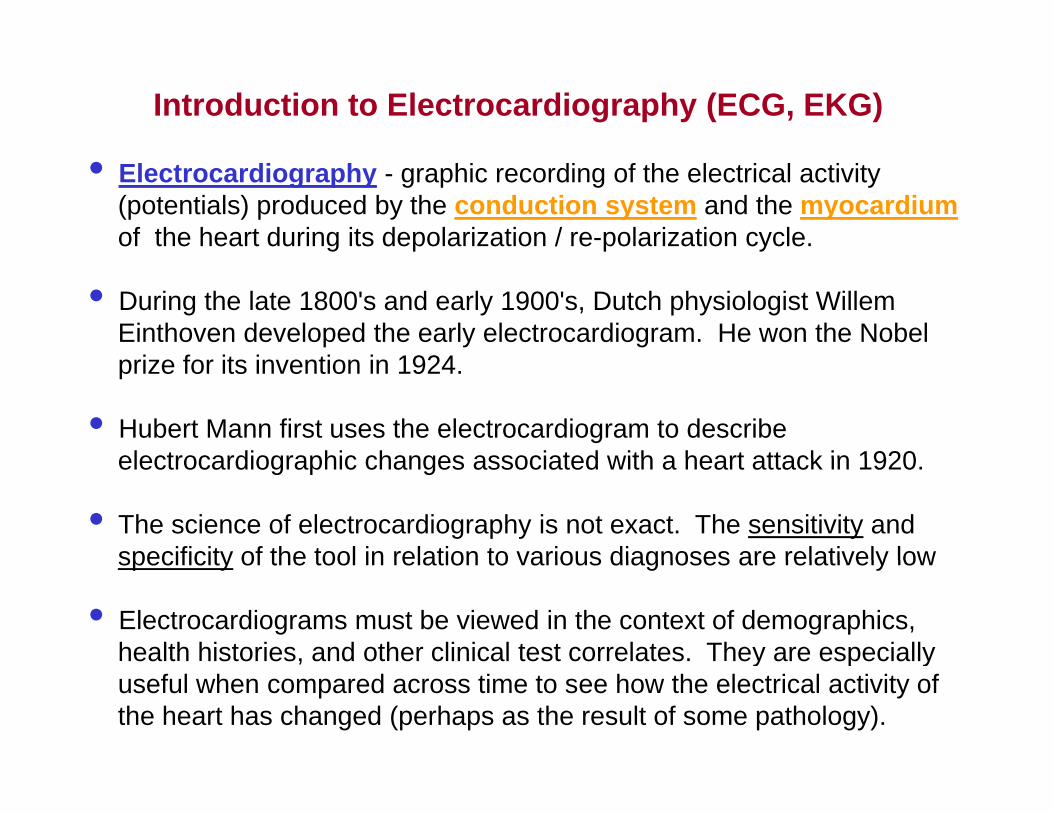
Introduction to Electrocardiography (ECG, EKG)
• Electrocardiography - graphic recording of the electrical activity (potentials) produced by the conduction system and the myocardiumof the heart during its depolarization / re-polarization cycle.
• During the late 1800's and early 1900's, Dutch physiologist Willem Einthoven developed the early electrocardiogram. He won the Nobel
i f it i ti i 1924prize for its invention in 1924.
• Hubert Mann first uses the electrocardiogram to describe electrocardiographic changes associated with a heart attack in 1920electrocardiographic changes associated with a heart attack in 1920.
• The science of electrocardiography is not exact. The sensitivity and specificity of the tool in relation to various diagnoses are relatively lowspecificity of the tool in relation to various diagnoses are relatively low
• Electrocardiograms must be viewed in the context of demographics, health histories, and other clinical test correlates. They are especially , y p yuseful when compared across time to see how the electrical activity of the heart has changed (perhaps as the result of some pathology).

Cardiac Electrophysiology
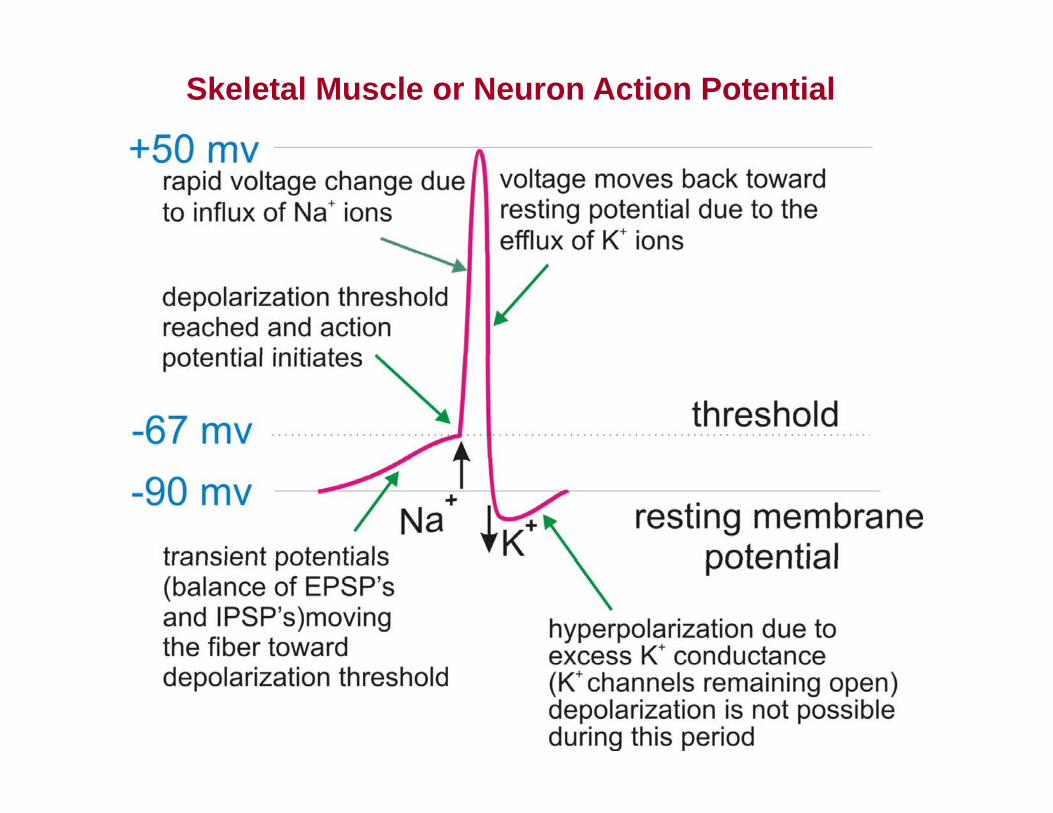
Skeletal Muscle or Neuron Action Potential
O t d K+I d N + d
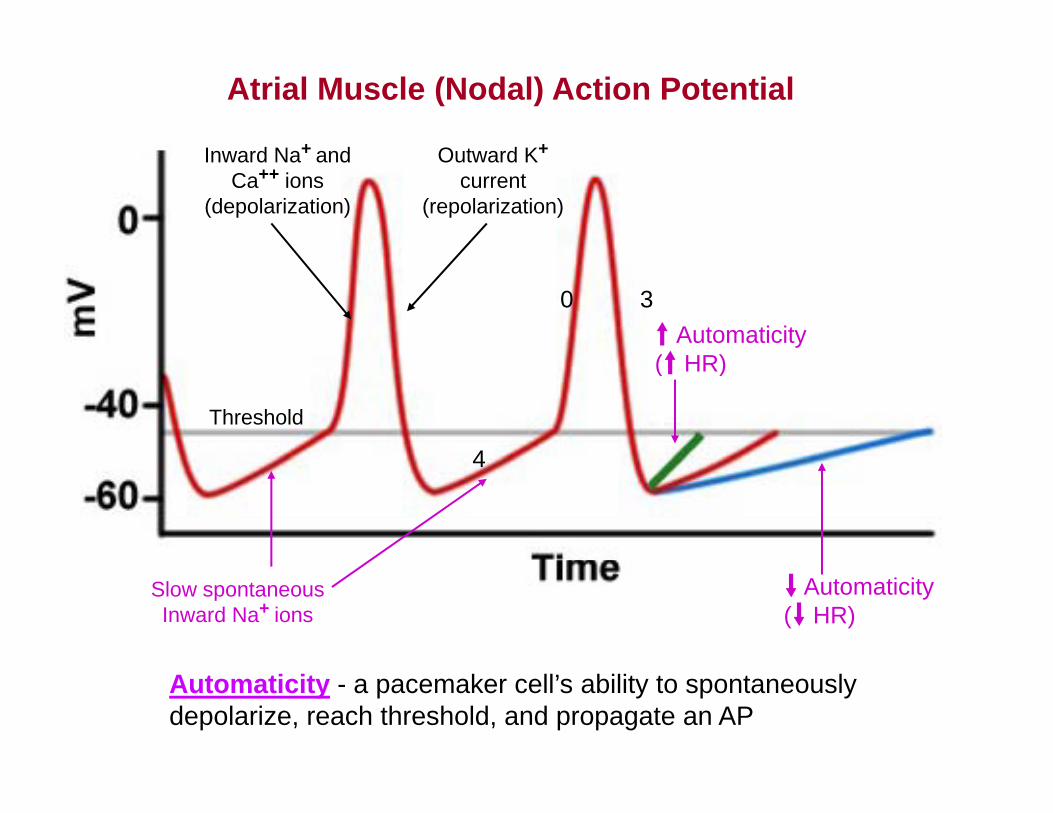
Atrial Muscle (Nodal) Action Potential
Outward K+
current (repolarization)
Inward Na+ and Ca++ ions
(depolarization)
t Automaticity (t HR)
0 3
Threshold
(t HR)
44
Slow spontaneous Inward Na+ ions
d Automaticity (d HR)
Automaticity - a pacemaker cell’s ability to spontaneously depolarize, reach threshold, and propagate an AP
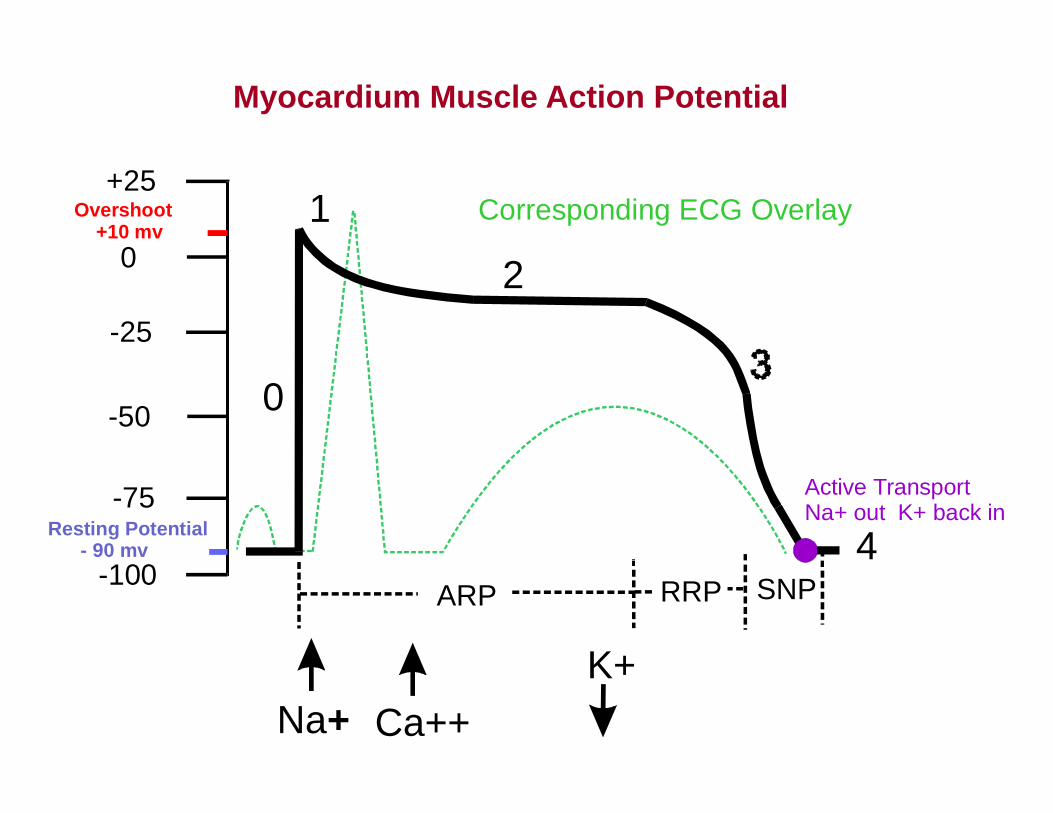
Action Potential of a Myocardial CellMyocardium Muscle Action Potential
+25
0
Overshoot +10 mv
1 Corresponding ECG Overlay0
-25
2
-50 0
-75Resting Potential - 90 mv 4
Active TransportNa+ out K+ back in
-100
K+
ARP RRP SNP
Na+ Ca++K+
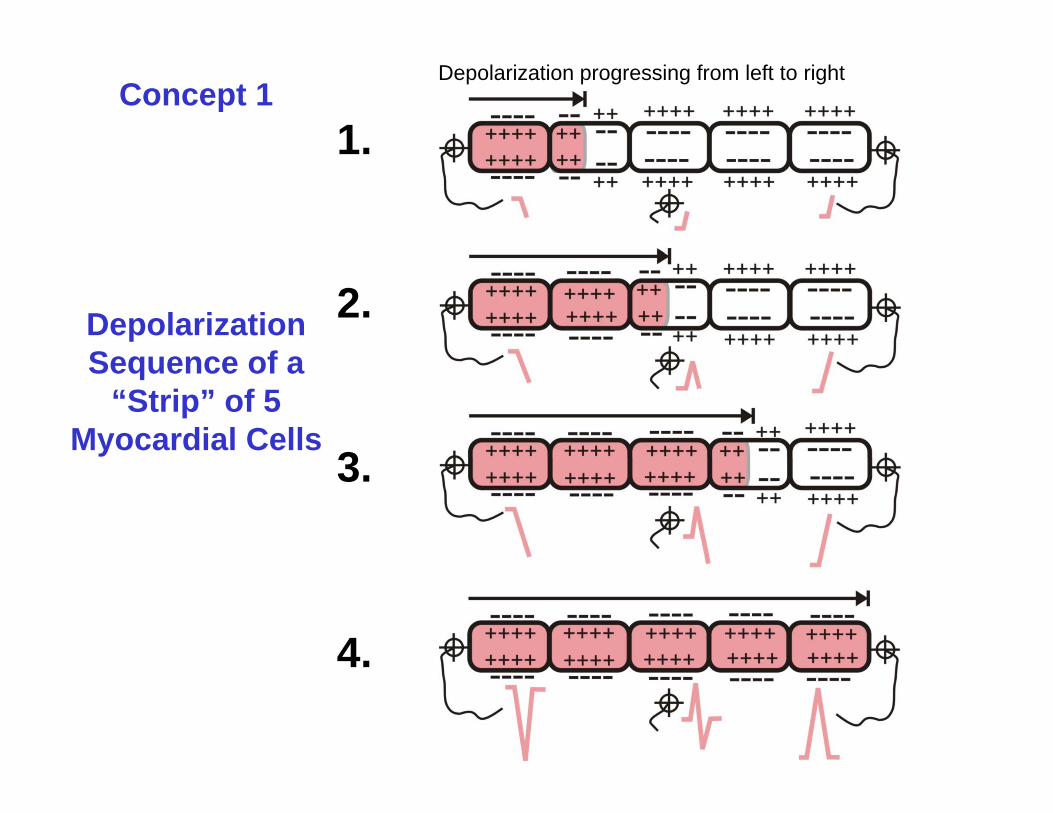
1.Concept 1
Depolarization progressing from left to right
1.
2.Depolarization S f
3
Sequence of a “Strip” of 5
Myocardial Cells3.
4.4.
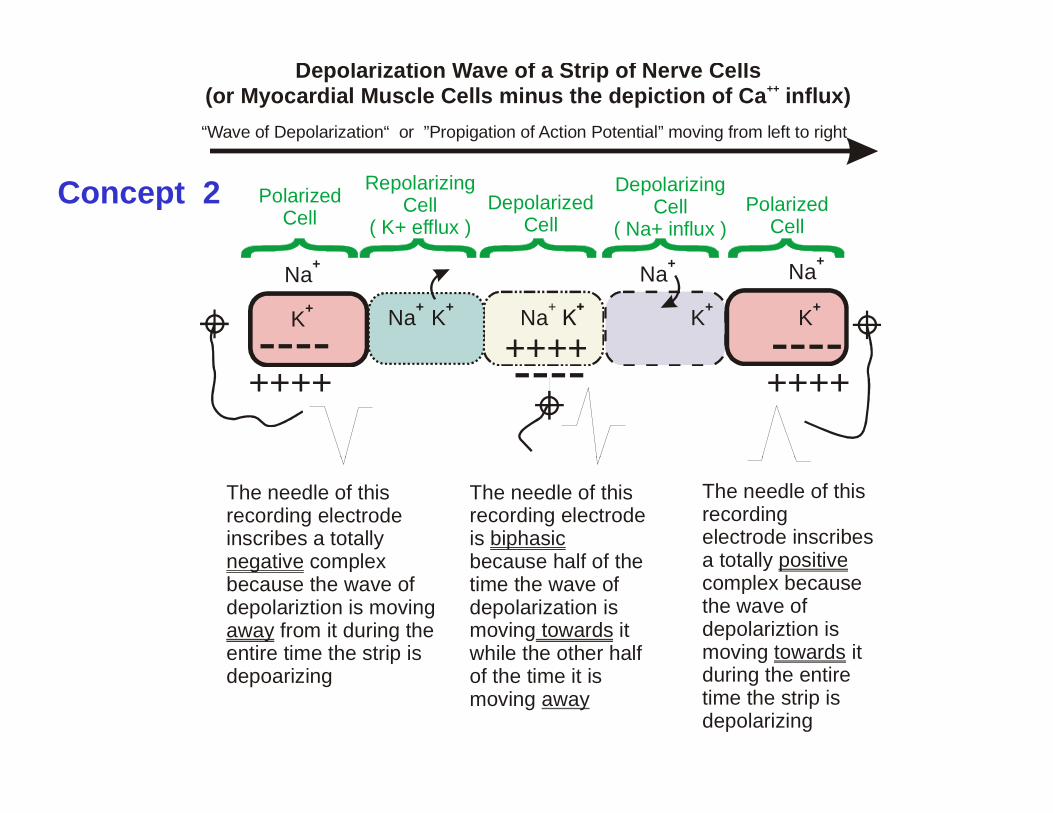
“Wave of Depolarization“ or ”Propigation of Action Potential” moving from left to right
Depolarization Wave of a Strip of Nerve Cells (or Myocardial Muscle Cells minus the depiction of Ca influx)++
Concept 2 PolarizedCell
RepolarizingCell
( K+ efflux )Depolarized
Cell
DepolarizingCell
( Na+ influx )Polarized
Cell
Na+
K+ Na+Na+ K+
Na+
K+
Na+
K+
---- ----++++++++ ---- ++++
++++
The needle of this recording electrode inscribes a totally
complexnegative
The needle of this recording electrode is because half of the
biphasic
The needle of this recording electrode inscribes a totally positive complex
because the wave of depolariztion is moving
from it during the entire time the strip is
negative
away
because half of the time the wave of depolarization is moving it while the other half
towards
a totally complex because the wave of depolariztion is moving it
positive
towardspdepoarizing of the time it is
moving away
gduring the entire time the strip is depolarizing
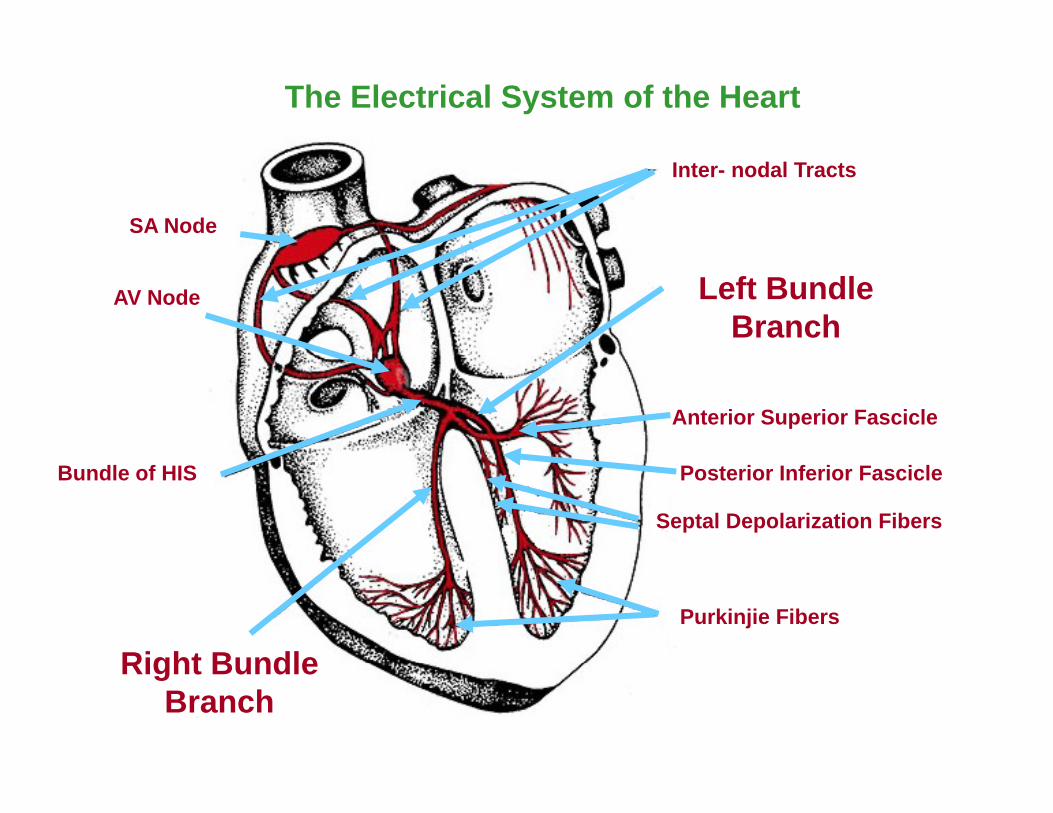
The Electrical System of the Heart
Inter- nodal Tracts
SA Node
AV Node Left Bundle Branch
Anterior Superior Fascicle
Posterior Inferior Fascicle
Septal Depolarization Fibers
Bundle of HIS
Purkinjie Fibers
Right BundleRight Bundle Branch
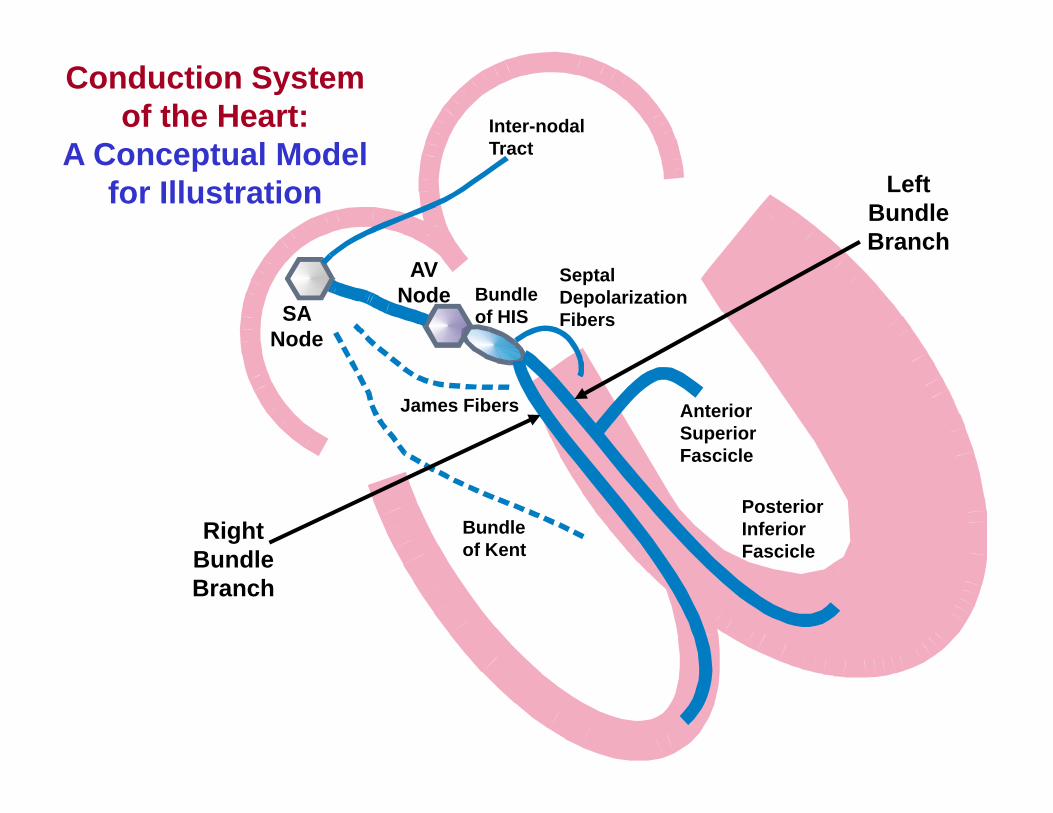
Inter-nodal Tract
Conduction System of the Heart:
A Conceptual Model TractA Conceptual Model for Illustration Left
Bundle Branch
SA Node
AV Node Bundle
of HIS
Septal Depolarization Fibers
James Fibers Anterior Superior Fascicle
Bundle of Kent
Right Bundle
Fascicle
Posterior Inferior FascicleBundle
Branch
Generation of the Electrocardiogram
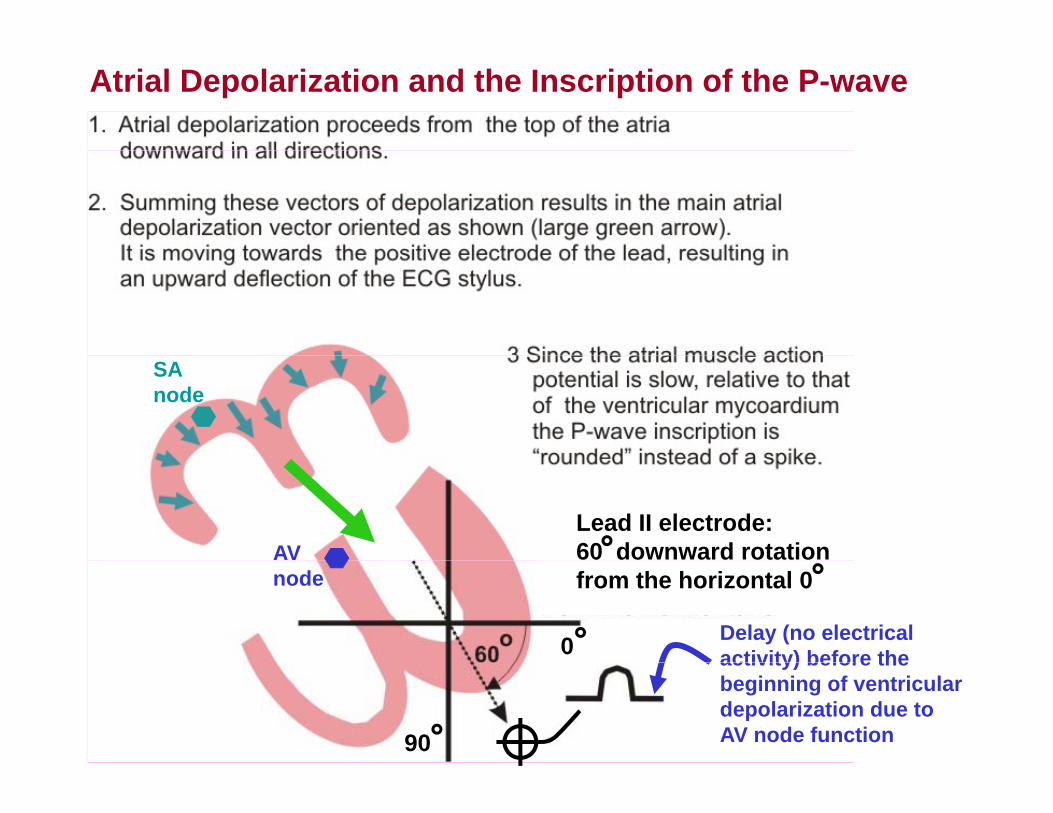
Atrial Depolarization and the Inscription of the P-wave
SA node
Lead II electrode: 60 downward rotation AV
Delay (no electrical activity) before the
from the horizontal 0
0
node
activity) before the beginning of ventricular depolarization due to AV node function90
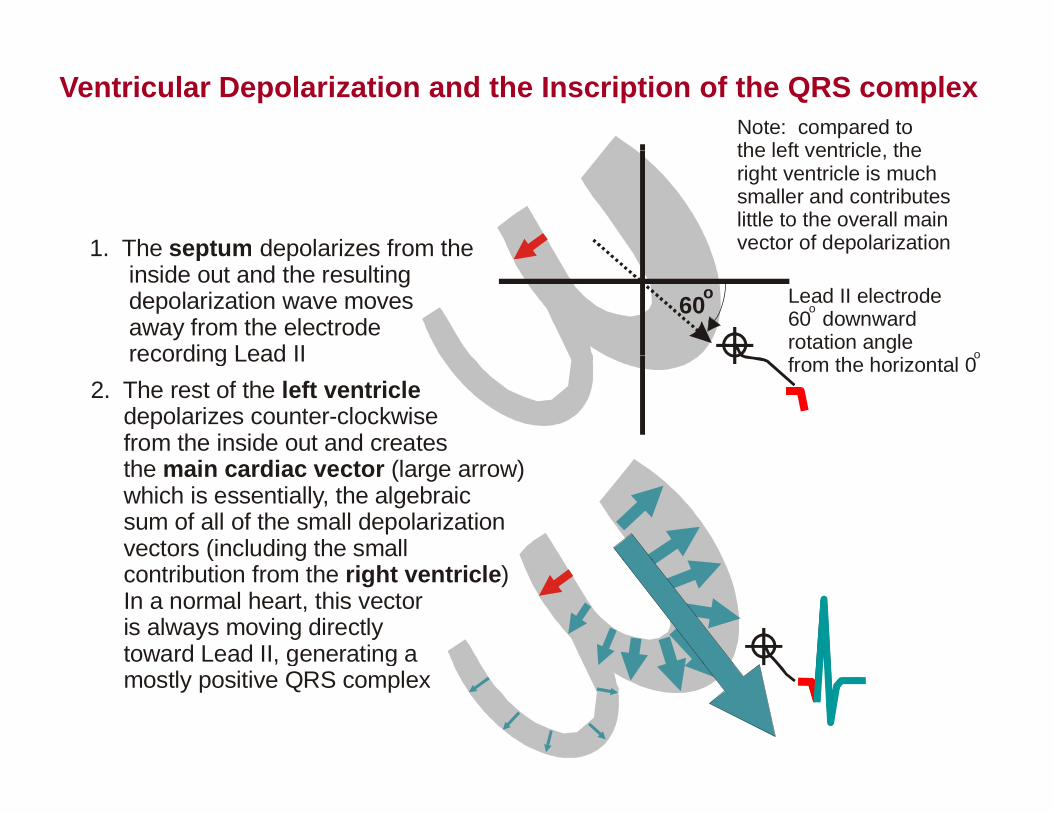
Ventricular Depolarization and the Inscription of the QRS complexNote: compared tothe left ventricle the
1 The depolarizes from theseptum
the left ventricle, the right ventricle is muchsmaller and contributeslittle to the overall mainvector of depolarization1. The depolarizes from the
inside out and the resulting depolarization wave moves away from the electrode
recording Lead II
septum
Lead II electrode60 downwardrotation angle
o
o
p
60o
recording Lead II2. The rest of the depolarizes counter-clockwise from the inside out and creates
left ventriclefrom the horizontal 0o
the (large arrow) which is essentially, the algebraic sum of all of the small depolarization vectors (including the small
main cardiac vector
( g contribution from the ) . In a normal heart, this vector is always moving directly toward Lead II, generating a
right ventricle
, g g mostly positive QRS complex
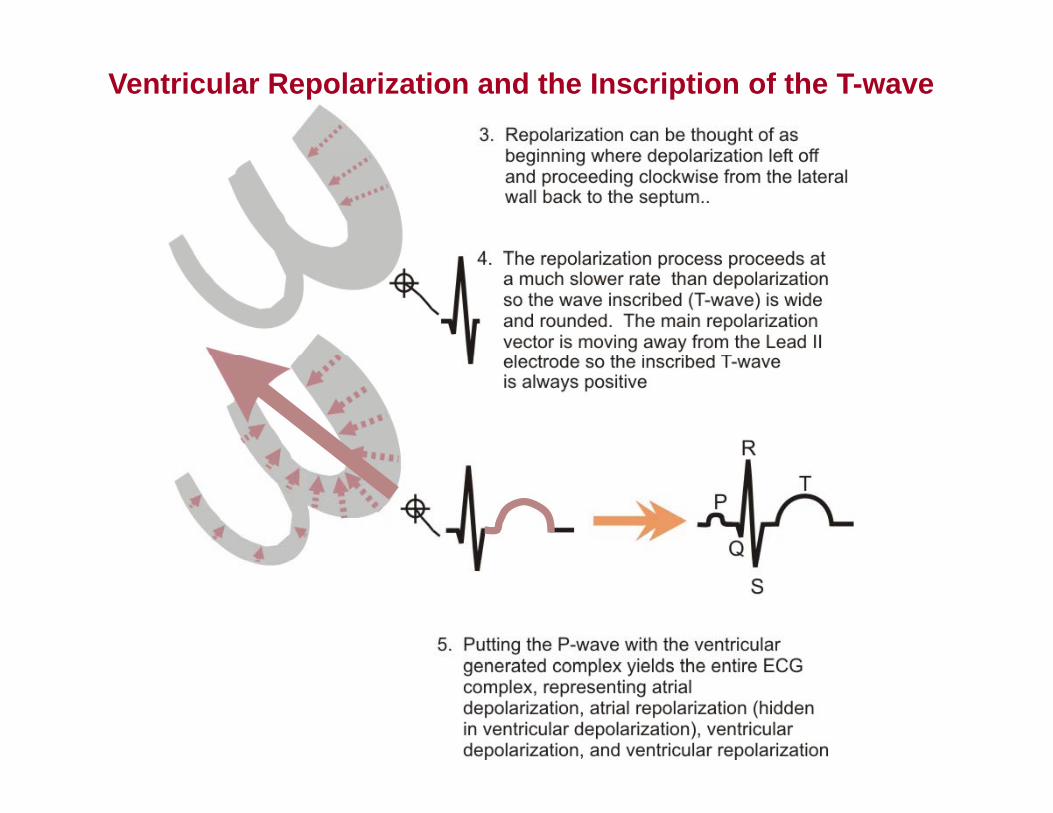
Ventricular Repolarization and the Inscription of the T-wave
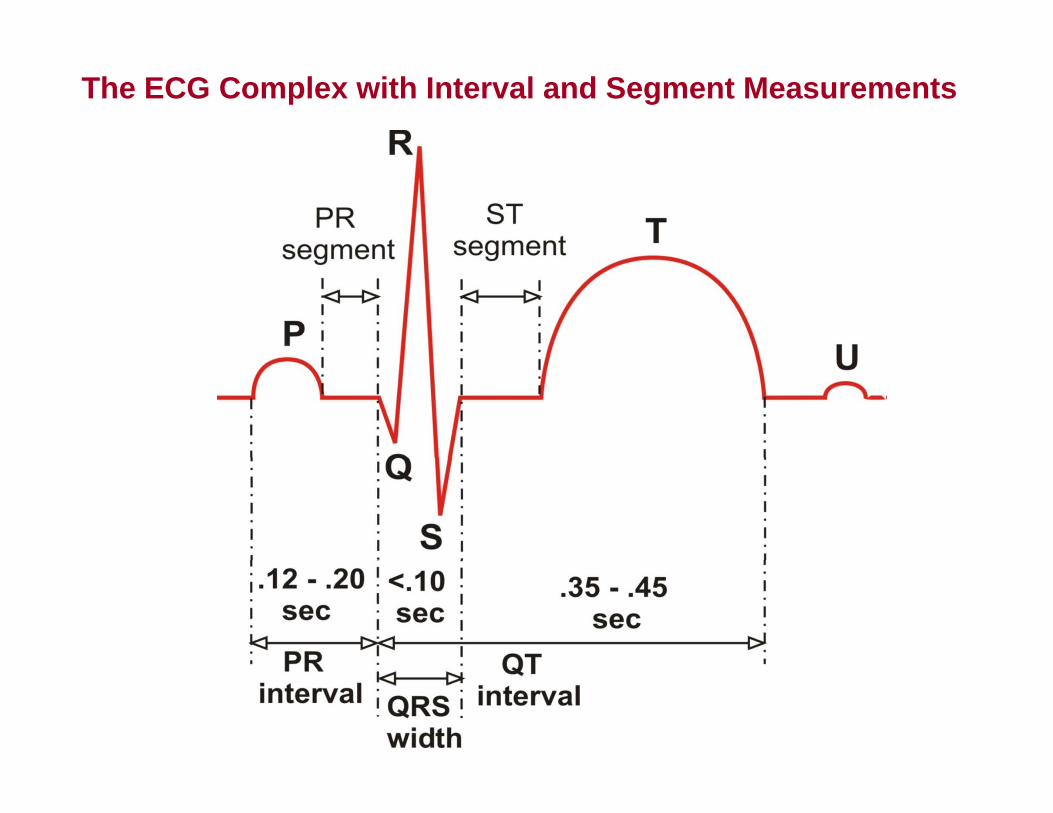
The ECG Complex with Interval and Segment Measurements
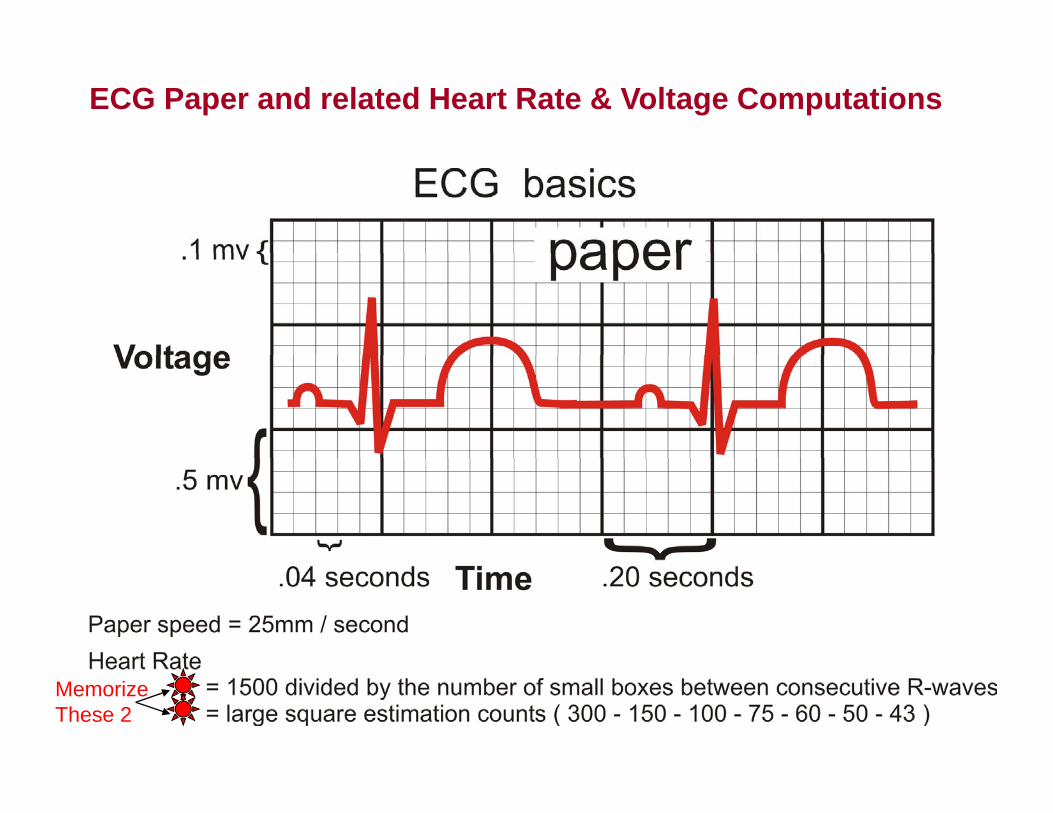
ECG Paper and related Heart Rate & Voltage Computations
Memorize These 2
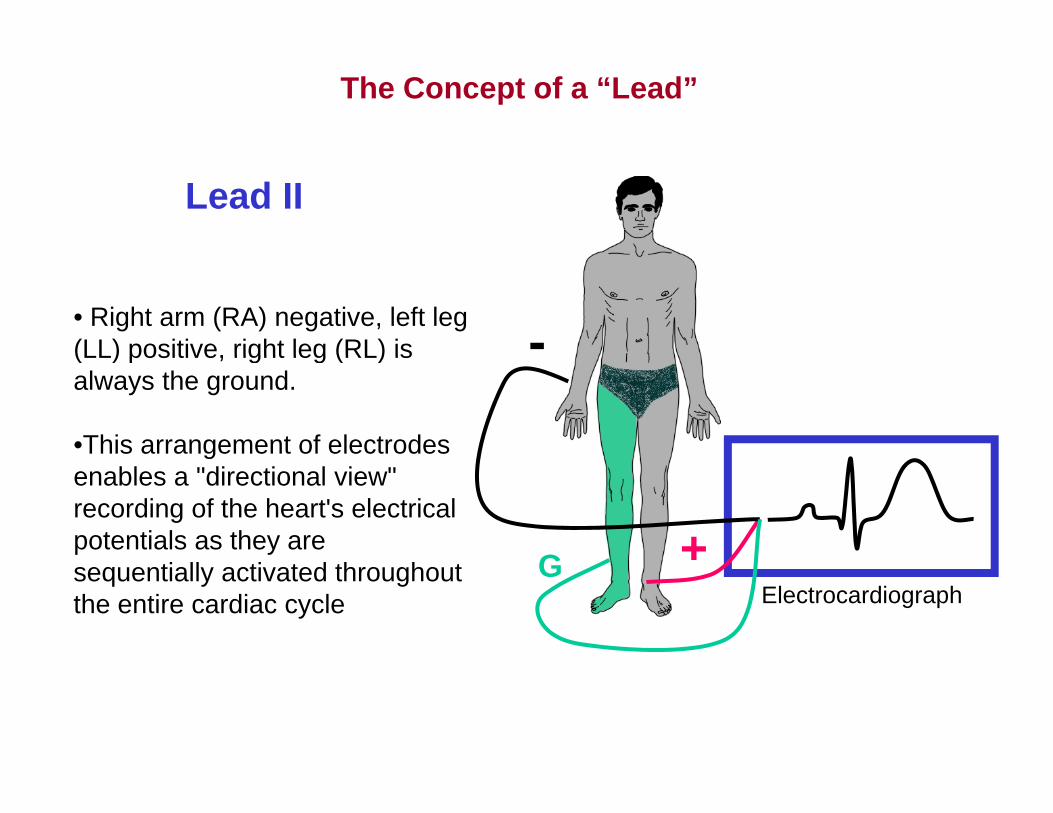
The Concept of a “Lead”
Lead II
-• Right arm (RA) negative, left leg (LL) positive, right leg (RL) is(LL) positive, right leg (RL) is always the ground.
•This arrangement of electrodes
+G
genables a "directional view" recording of the heart's electrical potentials as they are
Gsequentially activated throughout the entire cardiac cycle Electrocardiograph
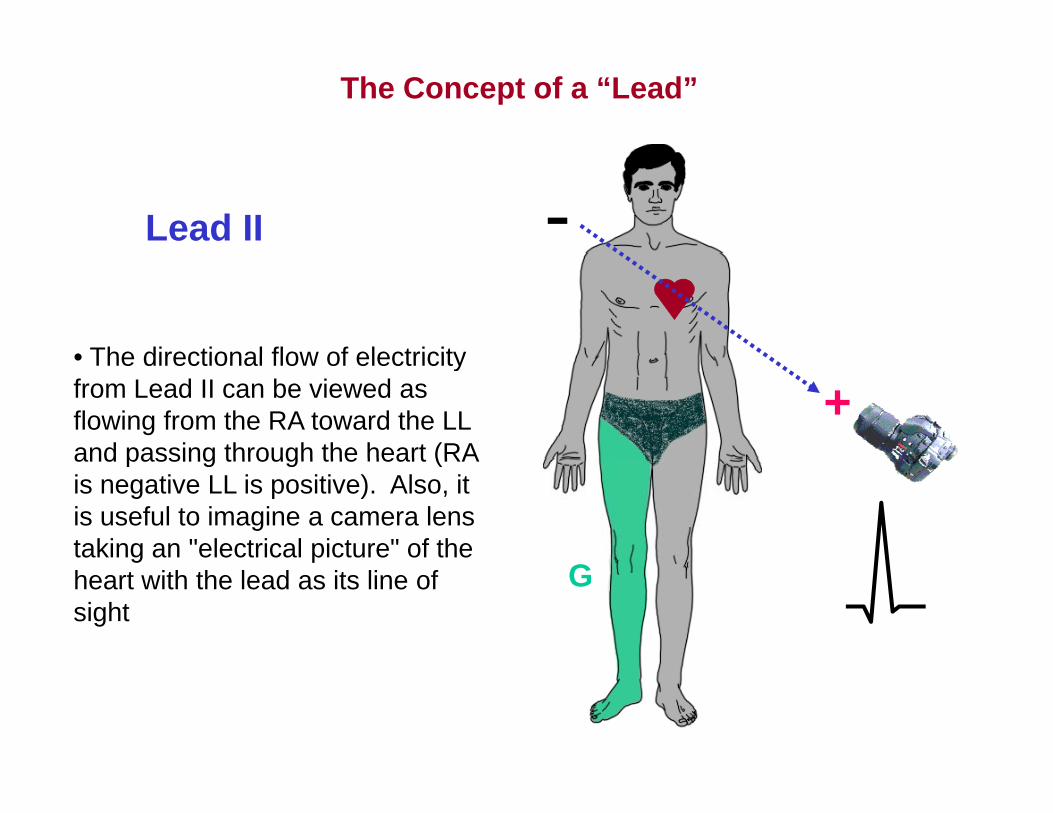
The Concept of a “Lead”
-Lead II
• The directional flow of electricity
+• The directional flow of electricity from Lead II can be viewed as flowing from the RA toward the LL and passing through the heart (RAand passing through the heart (RA is negative LL is positive). Also, it is useful to imagine a camera lens taking an "electrical picture" of the g pheart with the lead as its line of sight
G
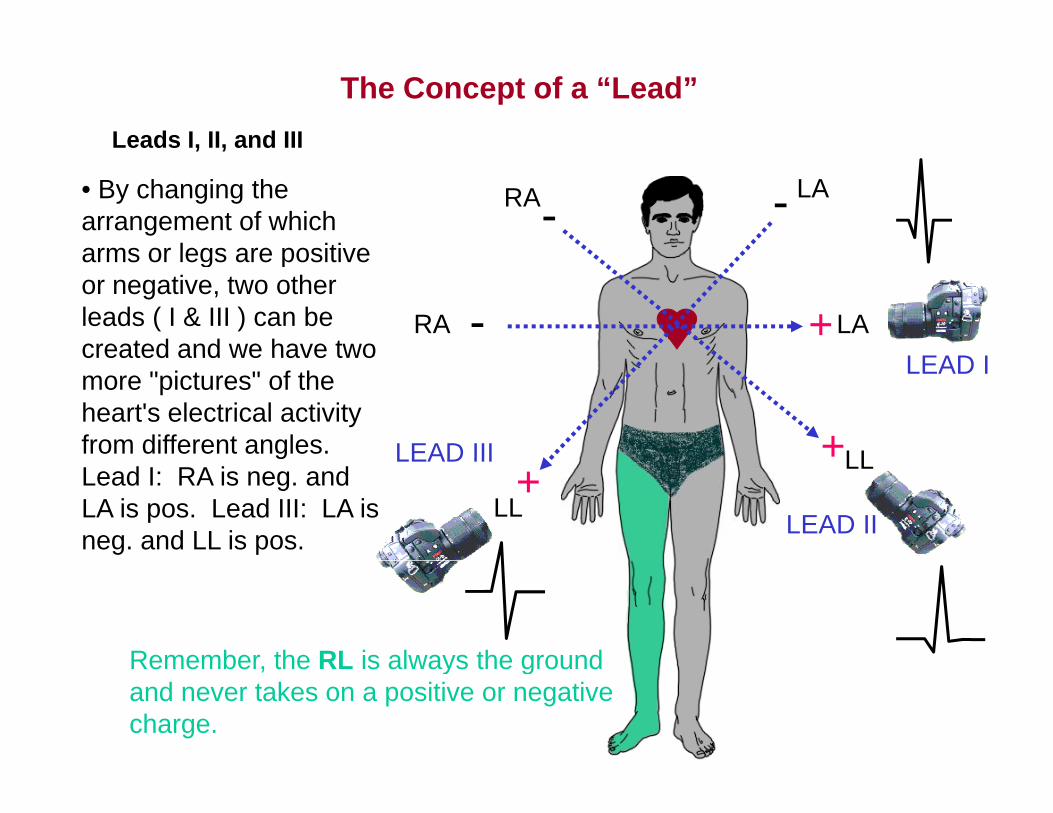
The Concept of a “Lead”Leads I, II, and III
RA --LA• By changing the
arrangement of which arms or legs are positive
, ,
+-RA LALEAD I
arms or legs are positive or negative, two other leads ( I & III ) can be created and we have two
LL+
LEAD I
LEAD III
created and we have two more "pictures" of the heart's electrical activity from different angles. LL+
LL LEAD II
LEAD IIIgLead I: RA is neg. and LA is pos. Lead III: LA is neg. and LL is pos.
Remember the RL is always the groundRemember, the RL is always the ground and never takes on a positive or negative charge.
The Concept of a “Lead”
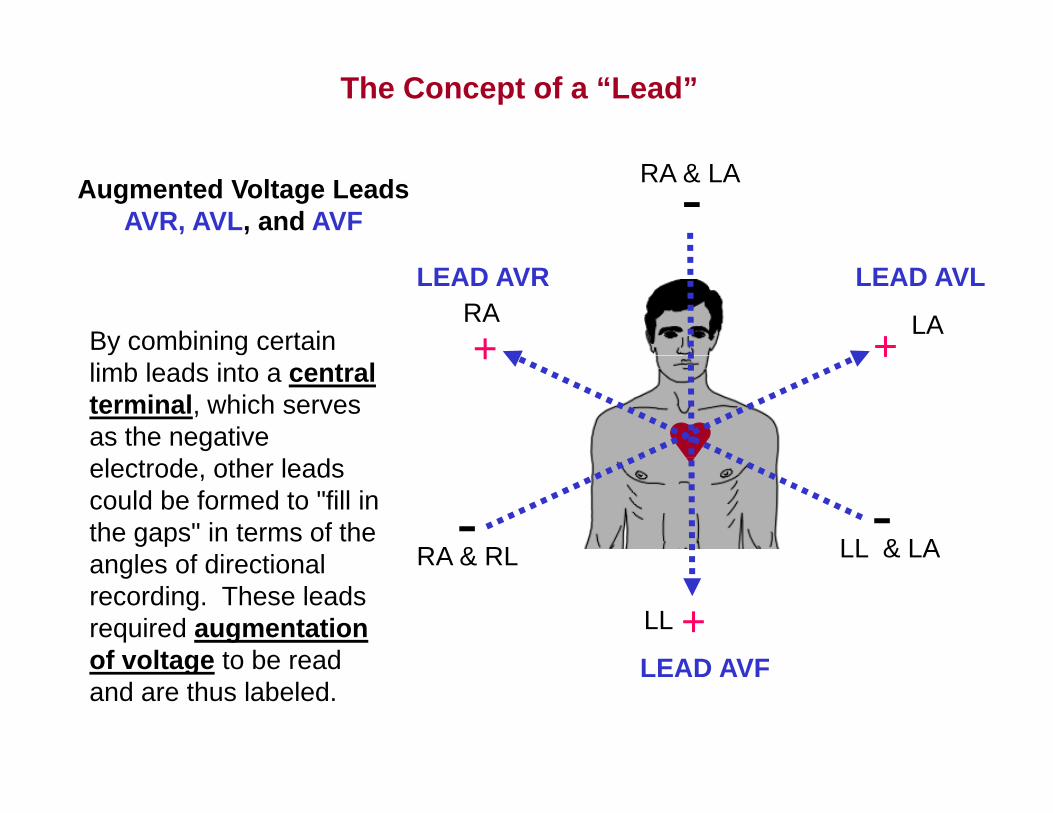
-RA & LAAugmented Voltage Leads AVR, AVL, and AVF
+RA+
LA
LEAD AVR LEAD AVL
By combining certain ++limb leads into a central terminal, which serves as the negative
RA & RL LL & LA- -electrode, other leads could be formed to "fill in the gaps" in terms of the angles of directional RA & RL
+LL
LEAD AVF
angles of directional recording. These leads required augmentation of voltage to be read LEAD AVFof voltage to be read and are thus labeled.
The Concept of a “Lead”
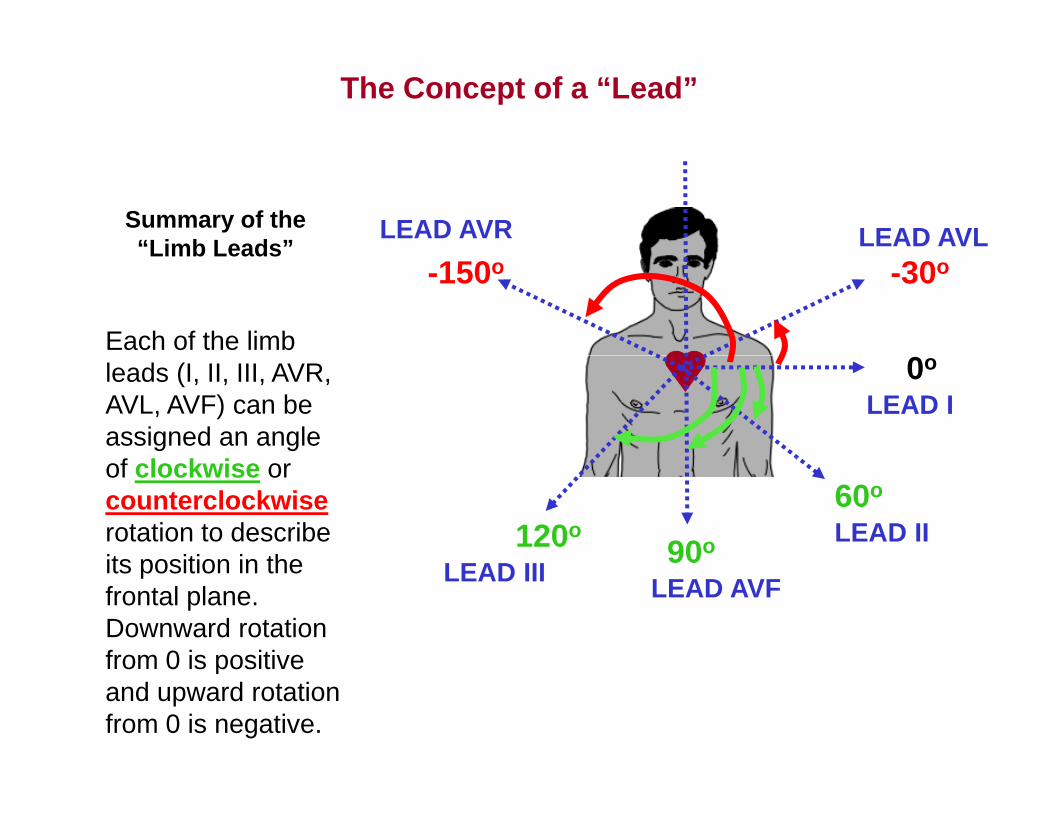
LEAD AVR LEAD AVLSummary of the “Limb Leads”
-30o-150o
Each of the limb
Limb Leads
0o
LEAD Ileads (I, II, III, AVR, AVL, AVF) can be assigned an angle
LEAD II60o
90o120o
of clockwise or counterclockwiserotation to describe its position in the
LEAD AVFLEAD III90its position in the
frontal plane. Downward rotation from 0 is positivefrom 0 is positive and upward rotation from 0 is negative.
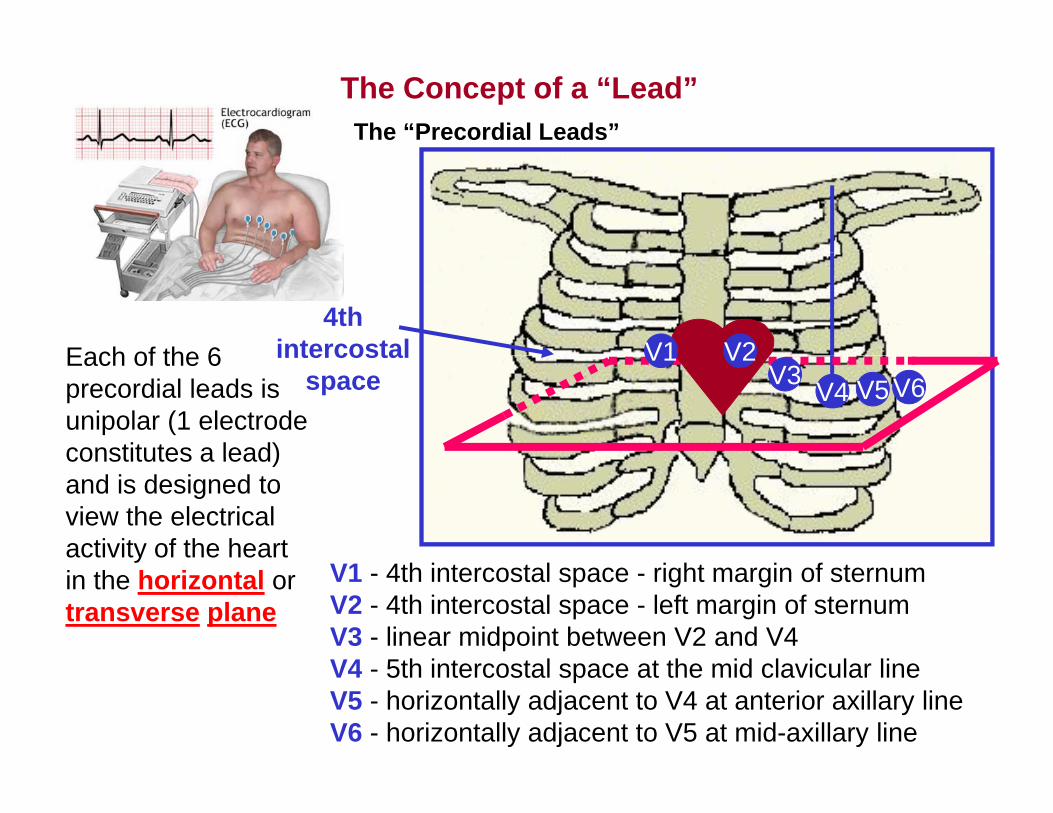
The “Precordial Leads”The Concept of a “Lead”
Each of the 64th
intercostal V2V1V4 V5 V6
Each of the 6 precordial leads is unipolar (1 electrode constitutes a lead)
intercostal space
V2V1V3
constitutes a lead) and is designed to view the electrical activity of the heart
V1 - 4th intercostal space - right margin of sternumV2 - 4th intercostal space - left margin of sternumV3 - linear midpoint between V2 and V4V4 5th i t t l t th id l i l li
yin the horizontal or transverse plane
V4 - 5th intercostal space at the mid clavicular lineV5 - horizontally adjacent to V4 at anterior axillary lineV6 - horizontally adjacent to V5 at mid-axillary line
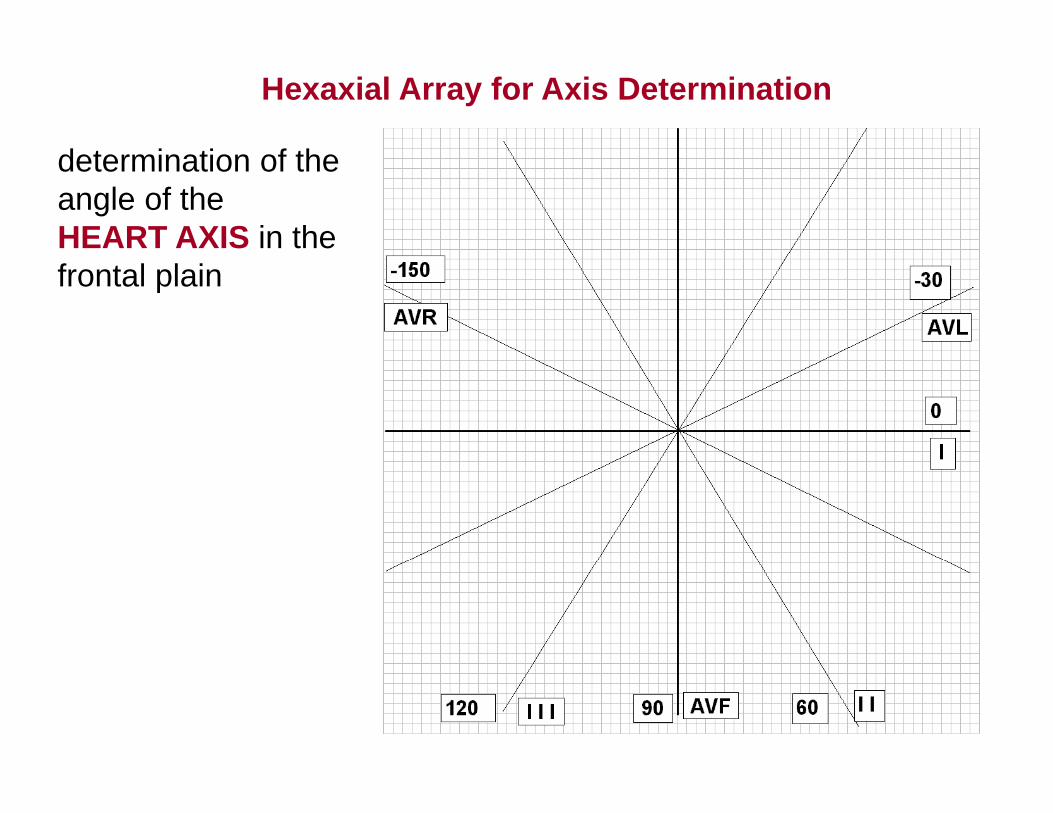
Hexaxial Array for Axis Determination
d t i ti f thdetermination of the angle of the HEART AXIS in the frontal plain
Hexaxial Array for Axis Determination – Example 1
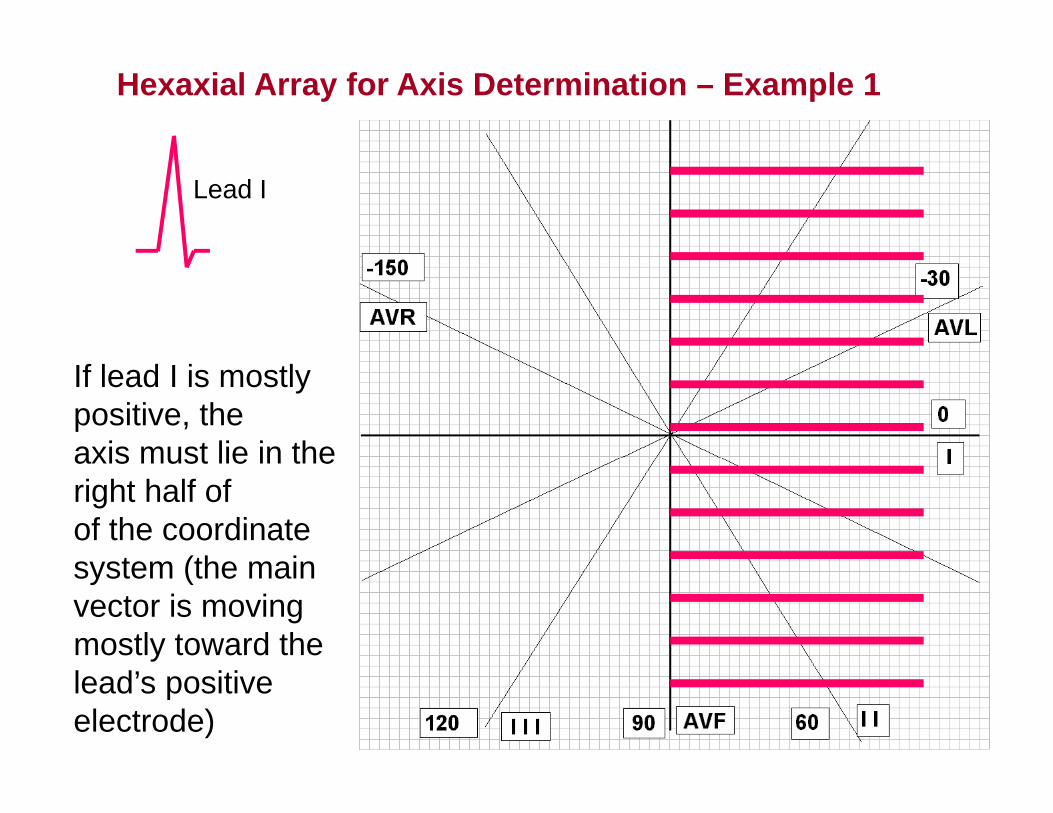
Lead I
If lead I is mostly positive, theaxis must lie in theaxis must lie in the right half ofof the coordinate
t (th isystem (the main vector is moving mostly toward the lead’s positive electrode)
Hexaxial Array for Axis Determination – Example 1
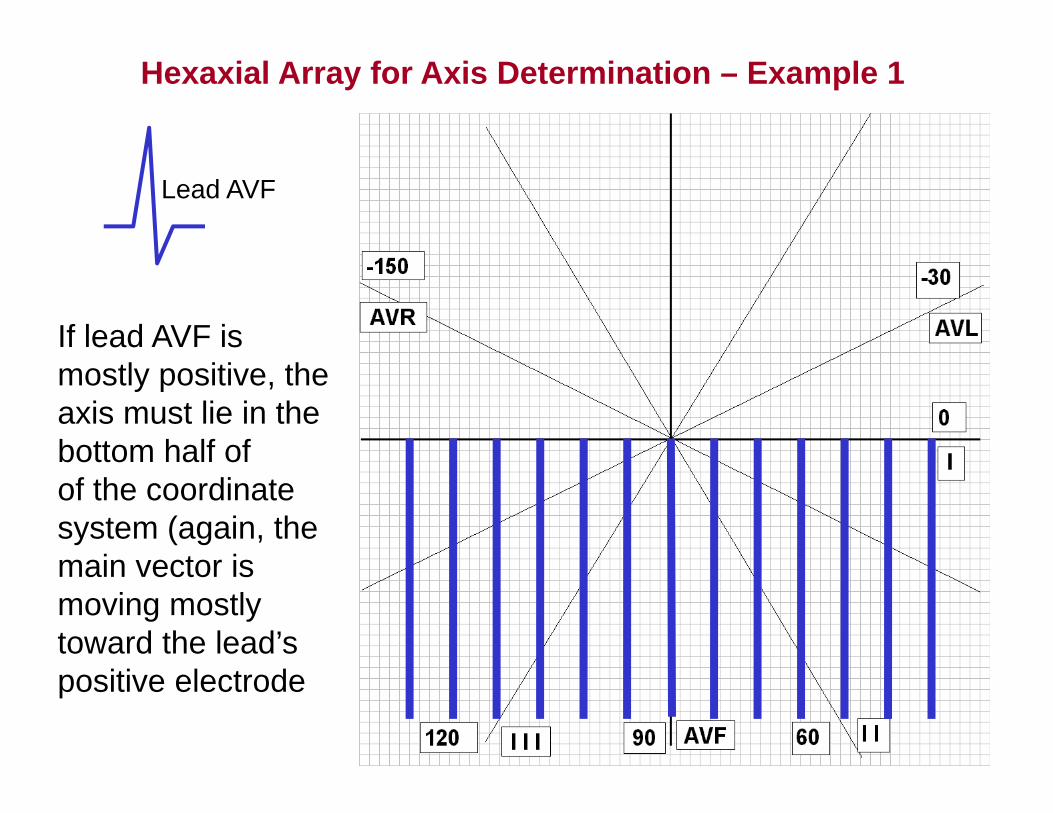
Lead AVF
If lead AVF is mostly positive, theaxis must lie in the bottom half ofbottom half ofof the coordinate system (again, the main vector ismain vector is moving mostly toward the lead’s positive electrode
Hexaxial Array for Axis Determination – Example 1
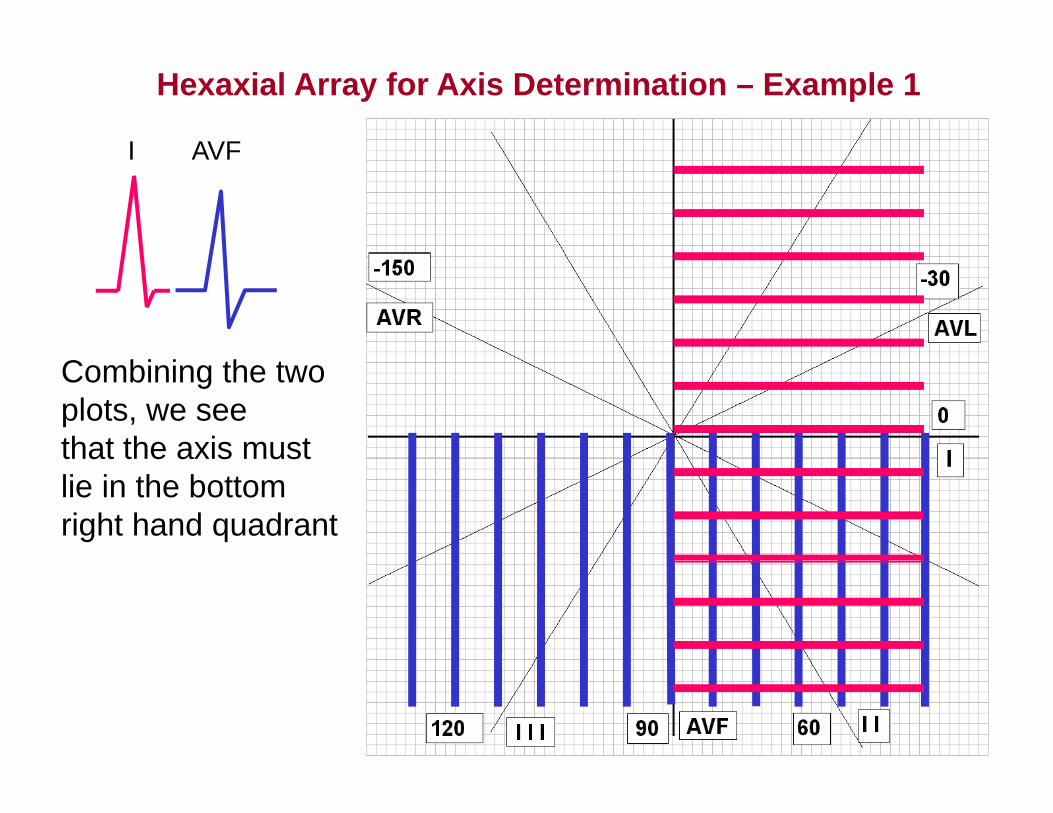
I AVFI AVF
Combining the two plots, we seethat the axis mustthat the axis must lie in the bottomright hand quadrant
I AVF AVL
Hexaxial Array for Axis Determination – Example 1
I AVF AVL
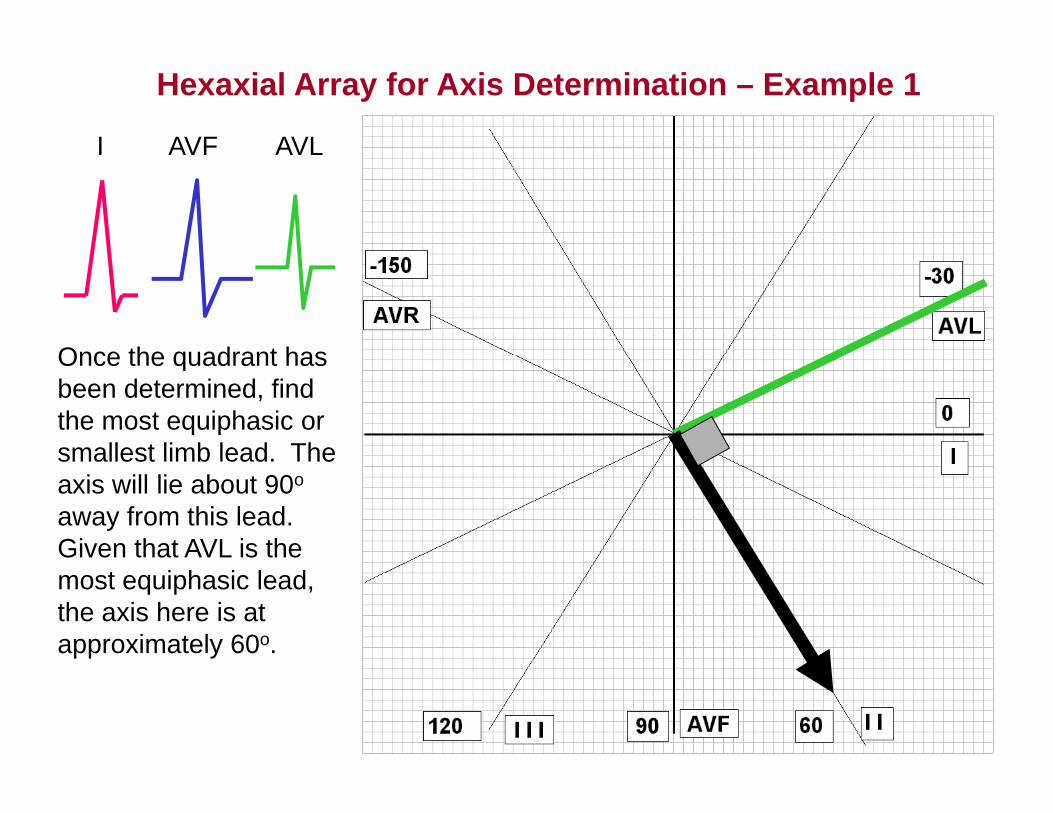
Once the quadrant hasOnce the quadrant has been determined, find the most equiphasic or smallest limb lead Thesmallest limb lead. The axis will lie about 90o
away from this lead. Given that AVL is the most equiphasic lead, the axis here is at approximately 60o.
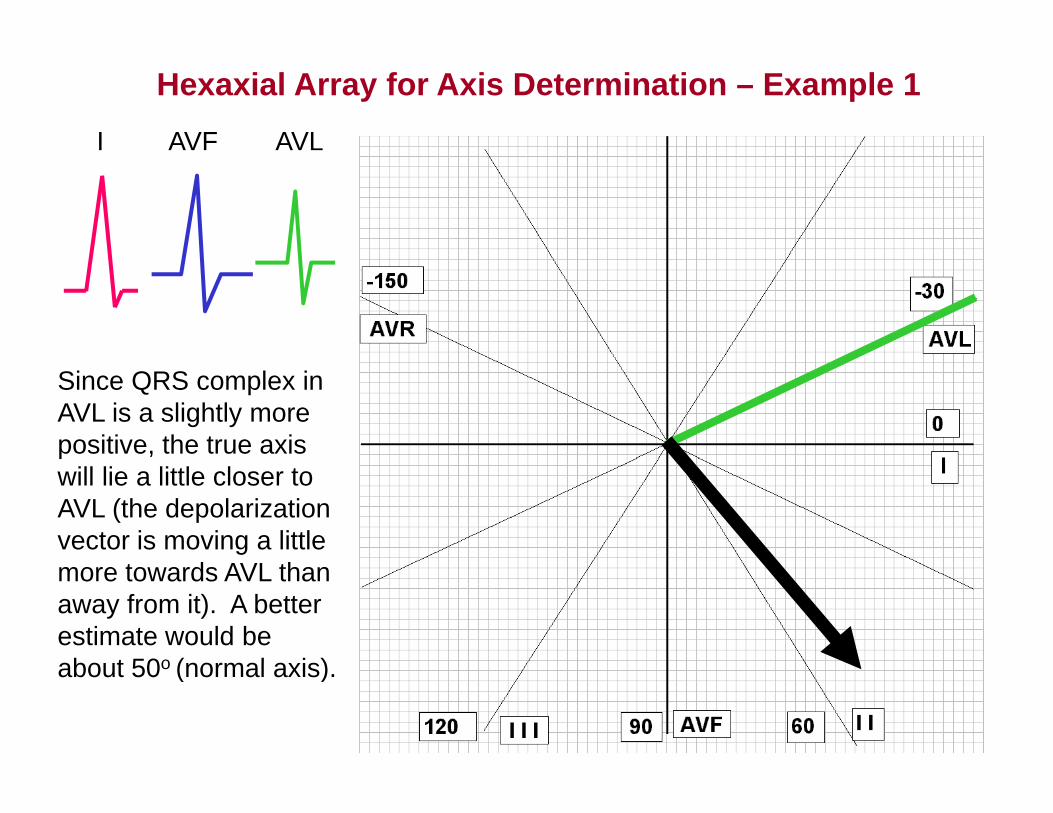
Hexaxial Array for Axis Determination – Example 1I AVF AVL
Since QRS complex in AVL is a slightly more positive, the true axis pwill lie a little closer to AVL (the depolarization vector is moving a little more towards AVL than away from it). A better estimate would be abo t 50o (normal a is)about 50o (normal axis).
Hexaxial Array for Axis Determination – Example 2
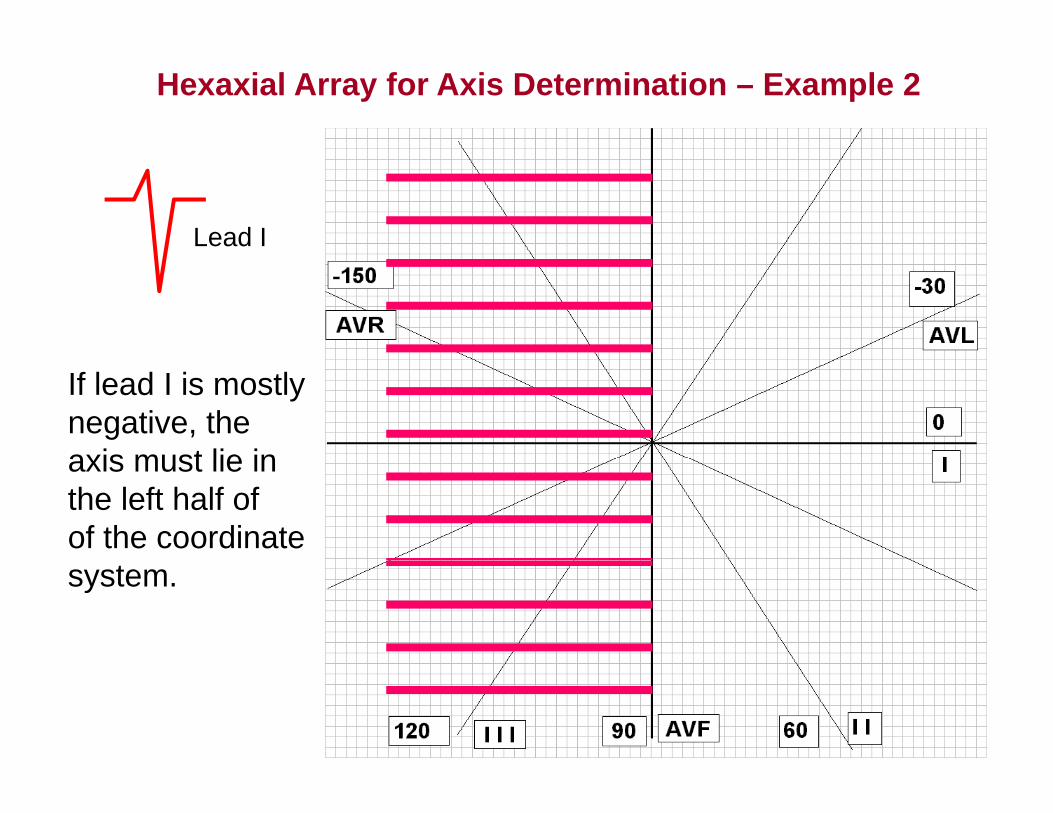
Lead I
If lead I is mostly negative, theaxis must lie inaxis must lie in the left half ofof the coordinate system.
Hexaxial Array for Axis Determination – Example 2
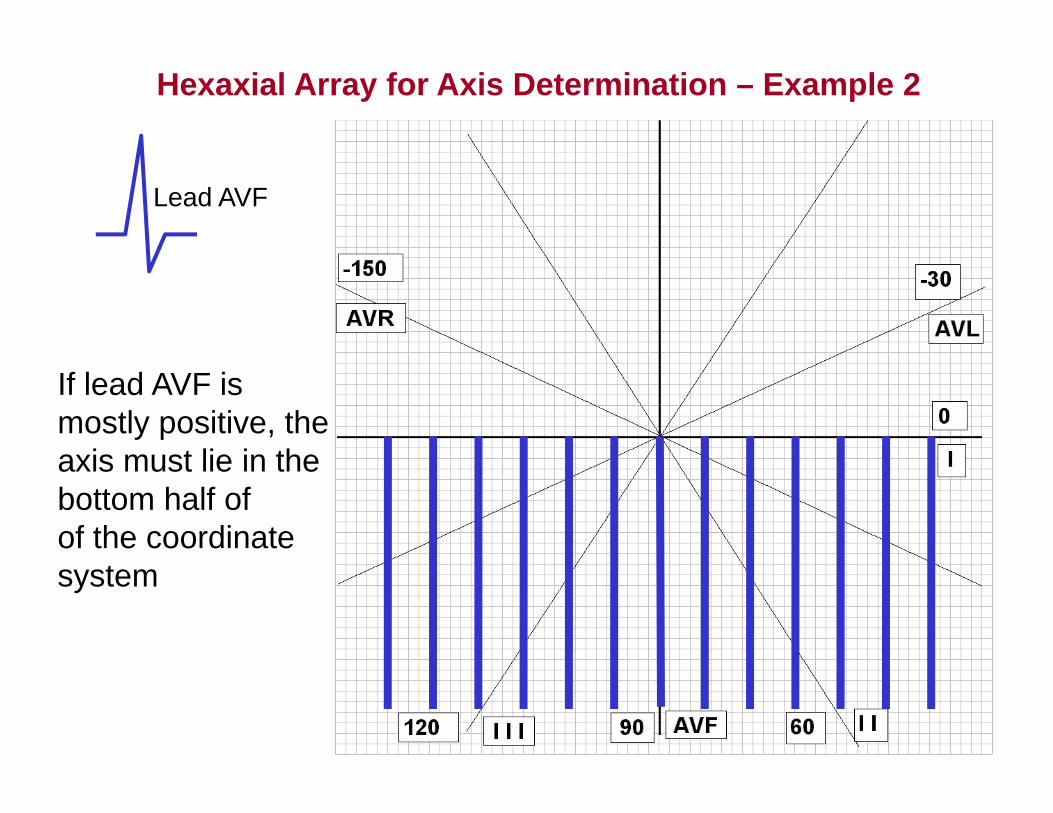
Lead AVF
If lead AVF is mostly positive, theaxis must lie in theaxis must lie in the bottom half ofof the coordinate system
I AVF
Hexaxial Array for Axis Determination – Example 2
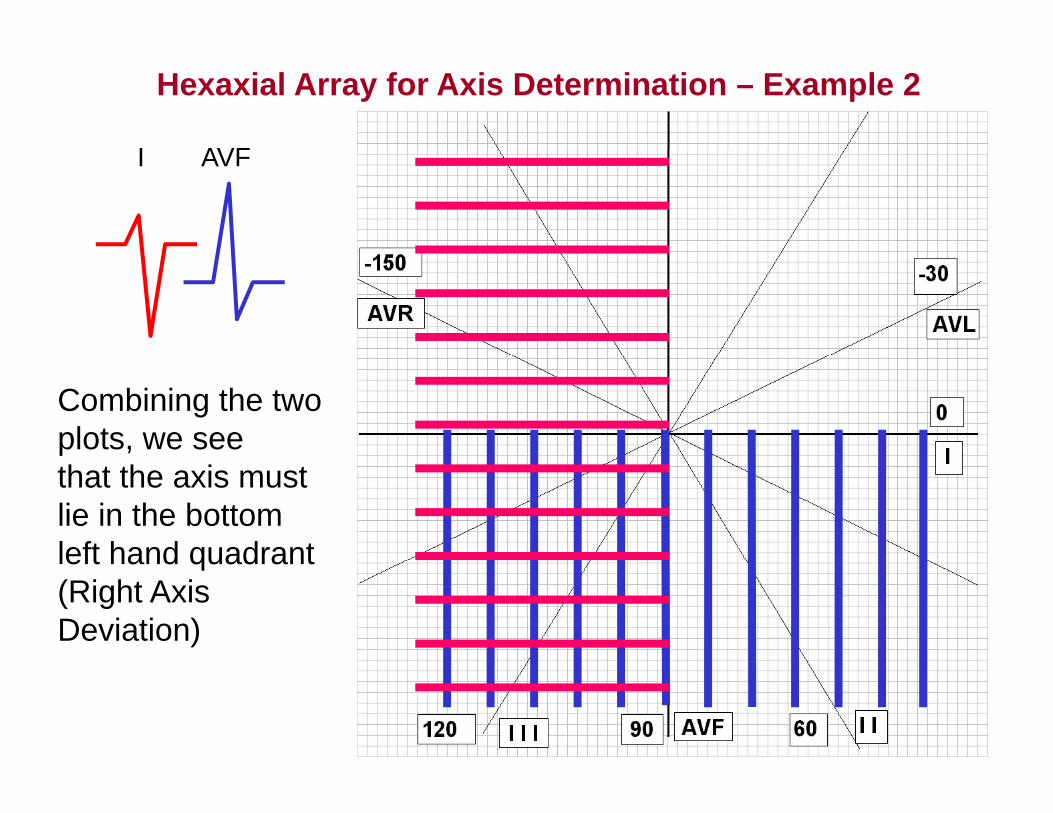
I AVF
Combining the two plots, we seethat the axis must lie in the bottomleft hand quadrantleft hand quadrant (Right Axis Deviation)
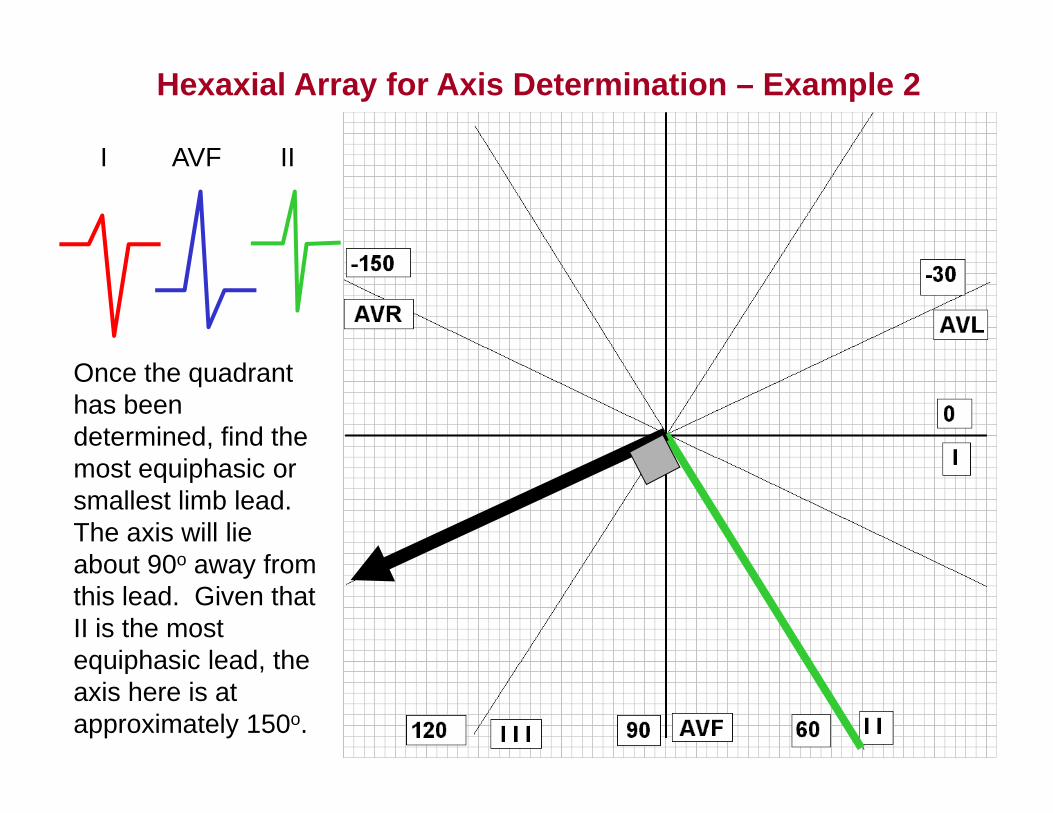
Hexaxial Array for Axis Determination – Example 2
I AVF III AVF II
Once the quadrant has been determined, find the most equiphasic or smallest limb lead. The axis will lie about 90o away fromabout 90o away from this lead. Given that II is the most equiphasic lead theequiphasic lead, the axis here is at approximately 150o.
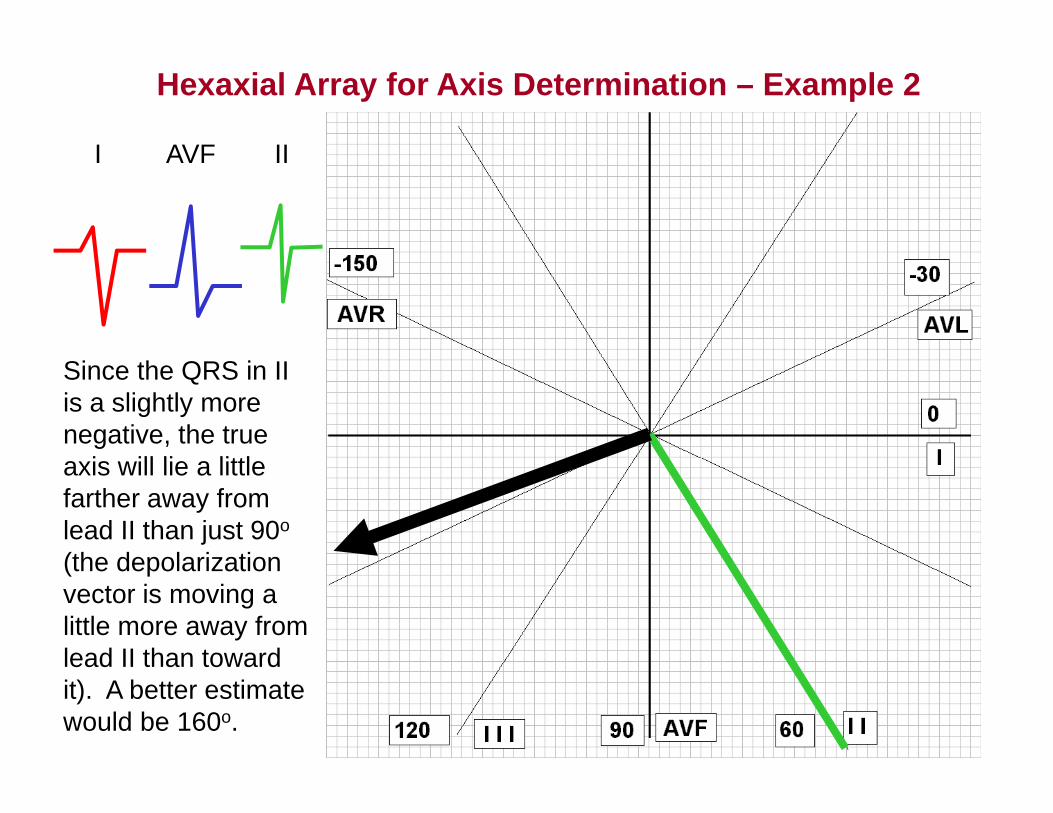
Hexaxial Array for Axis Determination – Example 2
I AVF III AVF II
Since the QRS in II is a slightly more negative, the true
i ill li littlaxis will lie a little farther away from lead II than just 90o
(the depolarization(the depolarization vector is moving a little more away from lead II than towardlead II than toward it). A better estimate would be 160o.
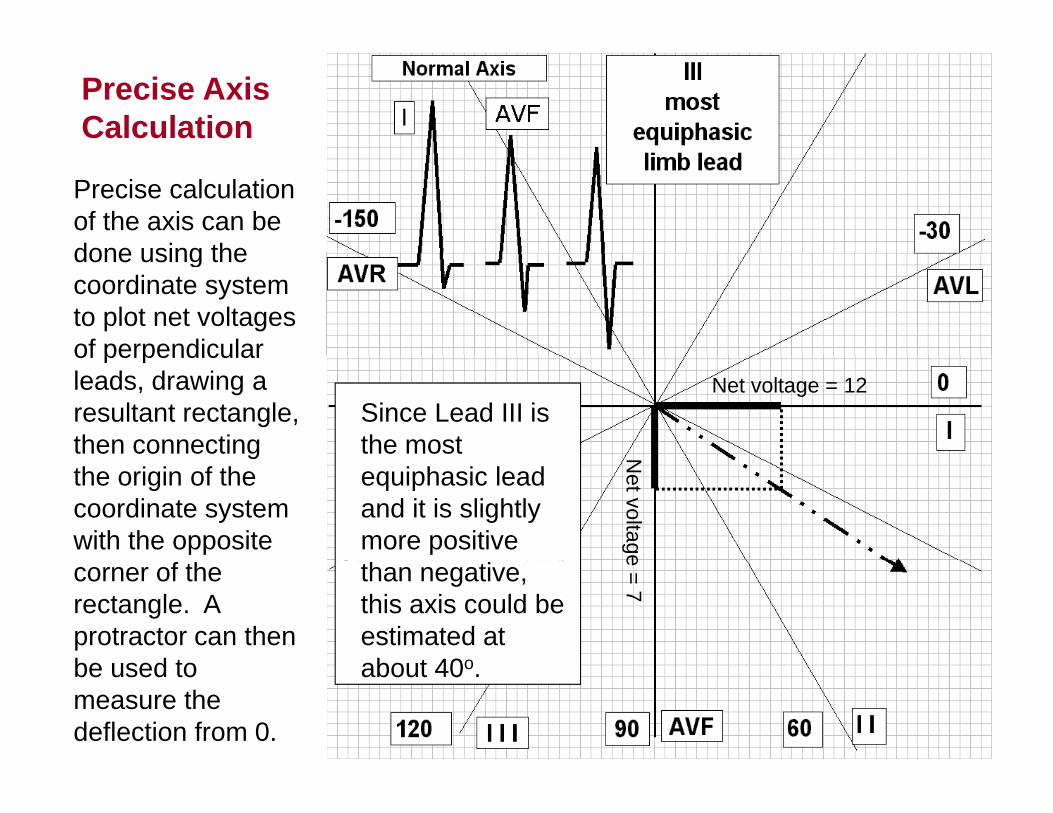
Precise Axis Calculation
Precise calculation of the axis can be done using thedone using the coordinate system to plot net voltages of perpendicular
Since Lead III is the most
of perpendicular leads, drawing a resultant rectangle, then connecting
Net voltage = 12
equiphasic lead and it is slightly more positive
gthe origin of the coordinate system with the opposite
Net voltage
than negative, this axis could be estimated at abo t 40o
corner of the rectangle. A protractor can then be sed to
e = 7
about 40o.be used to measure the deflection from 0.