Embed Size (px)
Citation preview
fcx.com
4th Quarter 2017 Earnings
Conference CallJanuary 25, 2018
2
Cautionary Statement
Regarding Forward-Looking Statements
This presentation contains forward-looking statements in which FCX discusses its potential future performance. Forward-looking statements are all statements other than statements of historical facts, such as projections or expectations relating to ore grades and milling rates, production and sales volumes, unit net cash costs, operating cash flows, anticipated tax refunds resulting from U.S. tax reform, capital expenditures, exploration efforts and results, development and production activities and costs, liquidity, tax rates, the impact of copper, gold and molybdenum price changes, the impact of deferred intercompany profits on earnings, reserve estimates, future dividend payments, and share purchases and sales. The words “anticipates,” “may,” “can,” “plans,” “believes,” “estimates,” “expects,” “projects,” "targets," “intends,” “likely,” “will,” “should,” “to be,” ”potential" and any similar expressions are intended to identify those assertions as forward-looking statements.
FCX cautions readers that forward-looking statements are not guarantees of future performance and actual results may differ materially from those anticipated, projected or assumed in the forward-looking statements. Important factors that can cause FCX's actual results to differ materially from those anticipated in the forward-looking statements include supply of and demand for, and prices of, copper, gold and molybdenum; mine sequencing; production rates; potential inventory adjustments; potential impairment of long-lived mining assets; the outcome of negotiations with the Indonesian government regarding PT Freeport Indonesia's (PT-FI) long-term mining rights; the potential effects of violence in Indonesia generally and in the province of Papua; industry risks; regulatory changes; political risks; labor relations; weather- and climate-related risks; environmental risks; litigation results (including the final disposition of Indonesian tax disputes and the outcome of Cerro Verde’s royalty dispute with the Peruvian national tax authority); and other factors described in more detail under the heading “Risk Factors” in FCX's Annual Report on Form 10-K for the year ended December 31, 2016, filed with the U.S. Securities and Exchange Commission (SEC) as updated by FCX’s subsequent filings with the SEC. With respect to FCX's operations in Indonesia, such factors include whether PT-FI will be able to resolve complex regulatory matters in Indonesia and continue to export copper after February 16, 2018.
Investors are cautioned that many of the assumptions upon which FCX's forward-looking statements are based are likely to change after the forward-looking statements are made, including for example commodity prices, which FCX cannot control, and production volumes and costs, some aspects of which FCX may not be able to control. Further, FCX may make changes to its business plans that could affect its results. FCX cautions investors that it does not intend to update forward-looking statements more frequently than quarterly notwithstanding any changes in its assumptions, changes in business plans, actual experience or other changes, and FCX undertakes no obligation to update any forward-looking statements.
This presentation also includes forward-looking statements regarding mineralized material and potential resources not included in proven and probable mineral reserves. Mineralized material is a mineralized body that has been delineated by appropriately spaced drilling and/or underground sampling to support the estimated tonnage and average metal grades. Such a deposit cannot qualify as recoverable proven and probable reserves until legal and economic feasibility are confirmed based upon a comprehensive evaluation of development costs, unit costs, grades, recoveries and other material factors. Our estimates of potential resources are based on geologically reasonable interpolation and extrapolation of more limited information than is used for mineralized material (measured and indicated) and requires higher copper prices. Significant additional drilling is required and no assurance can be given that the potential quantities of metal will be produced. Accordingly, no assurances can be given that estimated mineralized material and potential resources not included in reserves will become proven and probable reserves.
This presentation also contains certain financial measures such as unit net cash costs per pound of copper and molybdenum, net debt and adjusted EBITDA which are not recognized under U.S. generally accepted accounting principles. As required by SEC Regulation G, reconciliations of unit net cash costs per pound of copper and molybdenum to amounts reported in FCX's consolidated financial statements are in the supplemental schedules of FCX’s 3Q17 press release, which are also available on FCX's website, "fcx.com.” A reconciliation of adjusted EBITDA to amounts reported in FCX’s consolidated financial statements is included in this presentation.
2017 Highlights
3
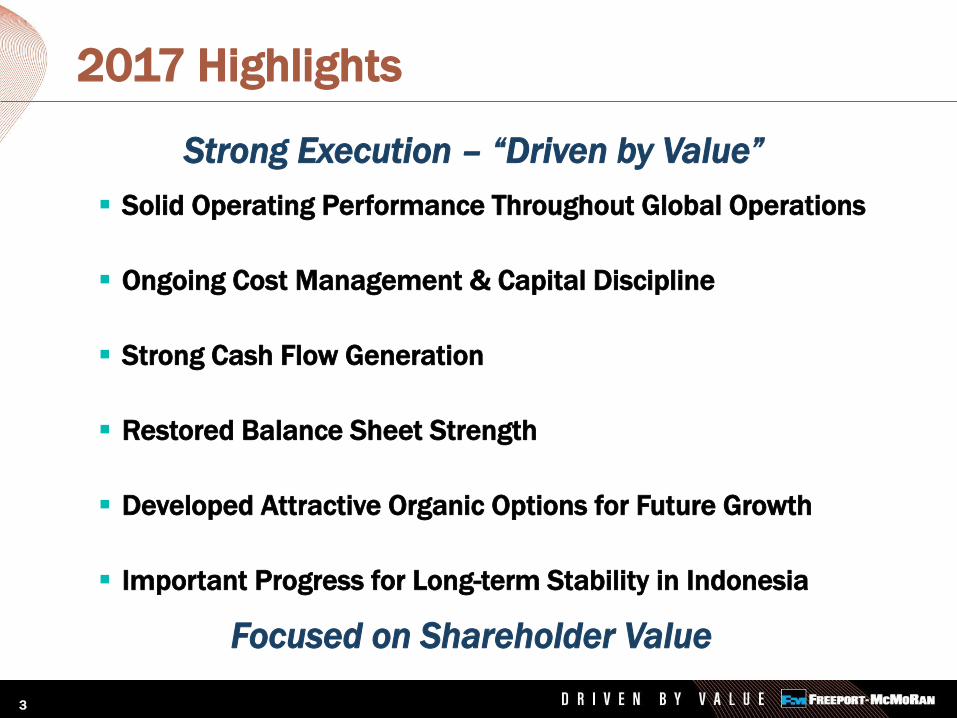
Strong Execution – “Driven by Value”
Solid Operating Performance Throughout Global Operations
Ongoing Cost Management & Capital Discipline
Strong Cash Flow Generation
Restored Balance Sheet Strength
Developed Attractive Organic Options for Future Growth
Important Progress for Long-term Stability in Indonesia
Focused on Shareholder Value
Key Metrics
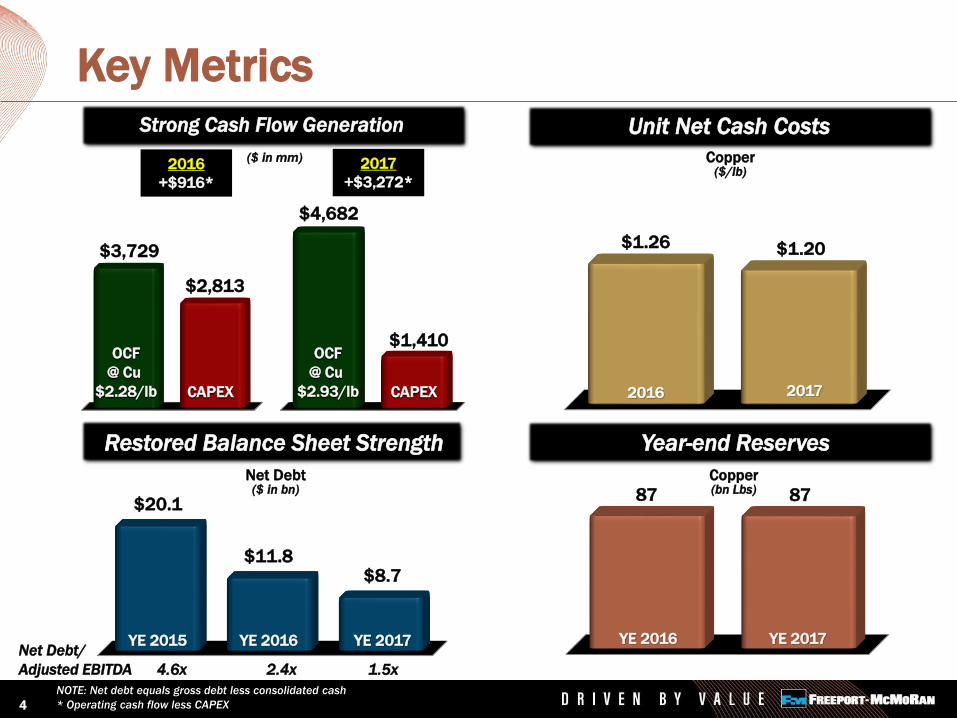
NOTE: Net debt equals gross debt less consolidated cash
* Operating cash flow less CAPEX
$20.1
$11.8$8.7
YE 2015 YE 2016 YE 2017
Net Debt($ in bn)
Restored Balance Sheet Strength
4
87 87
YE 2016 YE 2017
Copper (bn Lbs)
Year-end Reserves
($ in mm)
Strong Cash Flow Generation
2017
+$3,272*
$2,813
$4,682
$1,410OCF
@ Cu
$2.28/lb CAPEX
OCF
@ Cu
$2.93/lb
$3,729
CAPEX
$1.26 $1.20
Copper ($/lb)
Unit Net Cash Costs
2016 2017
2016
+$916*
4.6x 2.4x 1.5x
Net Debt/
Adjusted EBITDA
5
Copper Market Commentary
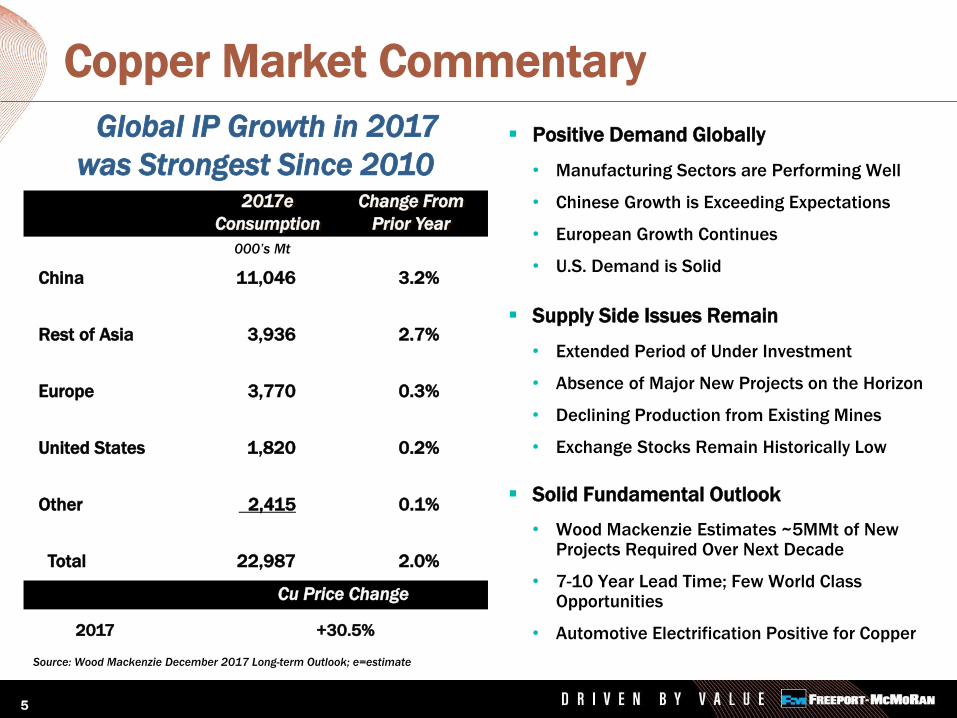
China 11,046 3.2%
Rest of Asia 3,936 2.7%
Europe 3,770 0.3%
United States 1,820 0.2%
Other 2,415 0.1%
Total 22,987 2.0%
2017e Change From
Consumption Prior Year
Global IP Growth in 2017
was Strongest Since 2010
Source: Wood Mackenzie December 2017 Long-term Outlook; e=estimate
000’s Mt
Positive Demand Globally
• Manufacturing Sectors are Performing Well
• Chinese Growth is Exceeding Expectations
• European Growth Continues
• U.S. Demand is Solid
Supply Side Issues Remain
• Extended Period of Under Investment
• Absence of Major New Projects on the Horizon
• Declining Production from Existing Mines
• Exchange Stocks Remain Historically Low
Solid Fundamental Outlook
• Wood Mackenzie Estimates ~5MMt of New Projects Required Over Next Decade
• 7-10 Year Lead Time; Few World Class Opportunities
• Automotive Electrification Positive for Copper 2017 +30.5%
Cu Price Change
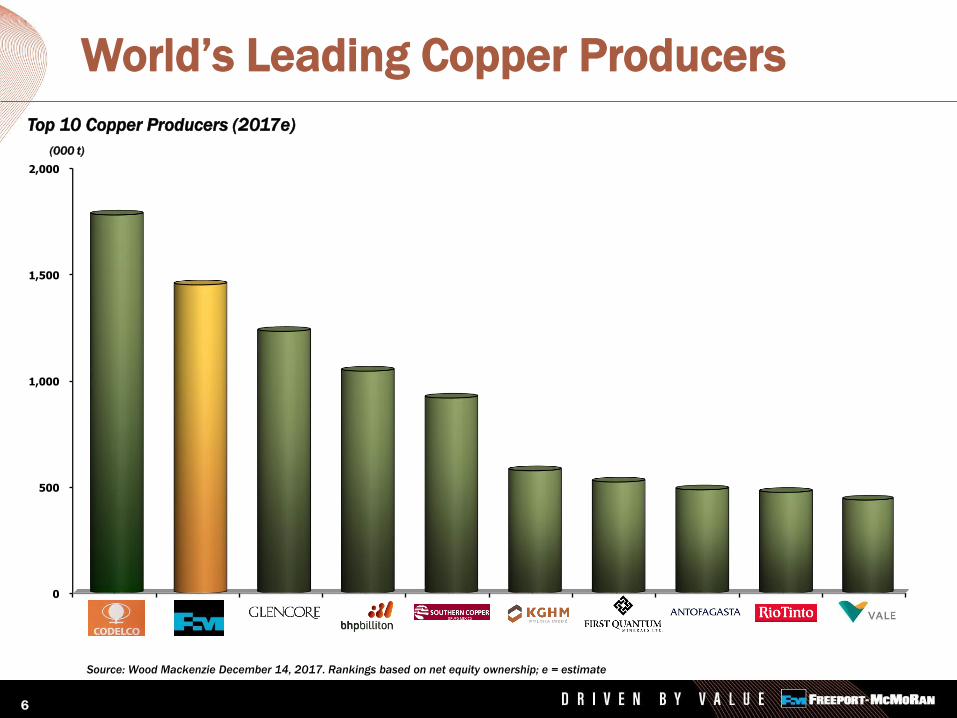
World’s Leading Copper Producers
0
500
1,000
1,500
2,000
Codelco Freeport-McMoRan
Glencore BHP SouthernCopper
KGHM FirstQuantum
Antofagasta Rio Tinto Vale
(000 t)
Top 10 Copper Producers (2017e)
Source: Wood Mackenzie December 14, 2017. Rankings based on net equity ownership; e = estimate
6
7
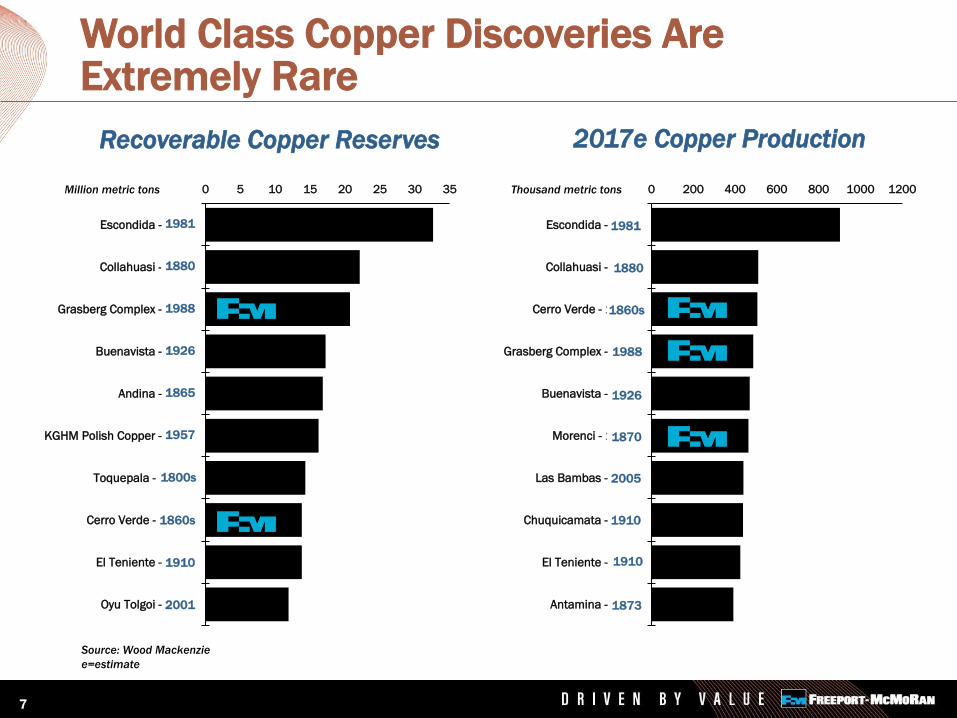
World Class Copper Discoveries Are Extremely Rare
2017e Copper Production Recoverable Copper Reserves
0 5 10 15 20 25 30 35
Escondida - 1981
Collahuasi - 1880
Grasberg Complex - 1988
Buenavista - 1899
Andina - 1865
KGHM Polish Copper - 1957
Toquepala - 1800s
Cerro Verde - 1860s
El Teniente - 1910
Oyu Tolgoi - 2001
0 200 400 600 800 1000 1200
Escondida - 1981
Collahuasi - 1880
Cerro Verde - 1860s
Grasberg Complex - 1988
Buenavista - 1926
Morenci - 1870s
Las Bambas - 2005
Chuquicamata - 1910
El Teniente - 1910
Antamina - 1873
1981
1880
1988
1926
1865
1957
1860s
1910
2001
1800s
1981
1926
1880
1860s
2005
1870
1910
1910
1873
1988
Source: Wood Mackenzie
e=estimate
Million metric tons Thousand metric tons
8
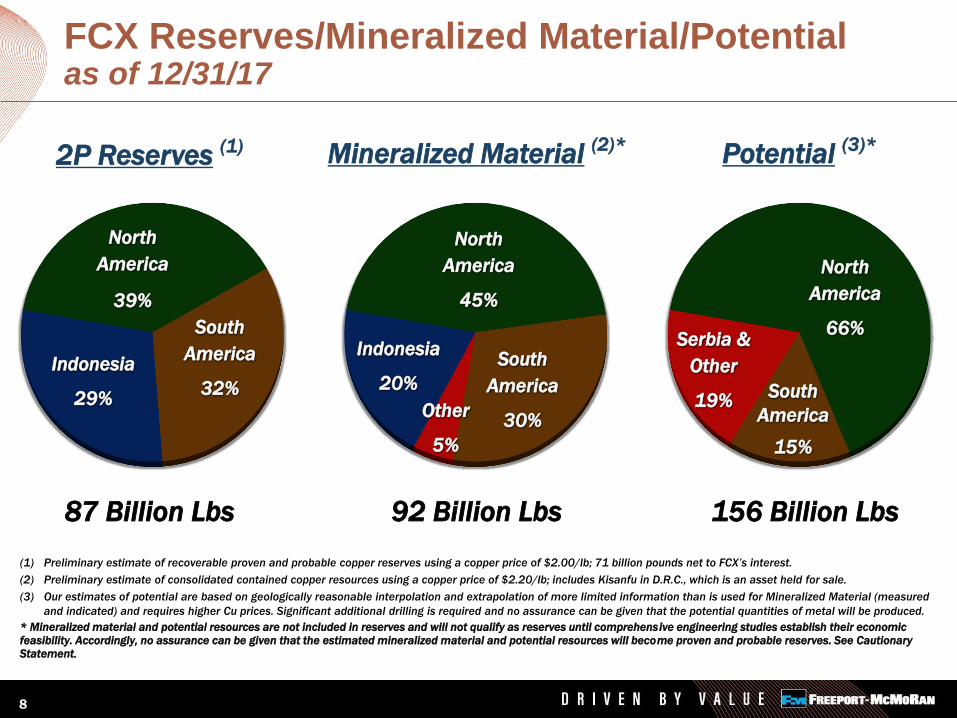
FCX Reserves/Mineralized Material/Potentialas of 12/31/17
Mineralized Material (2)*2P Reserves (1)
87 Billion Lbs 92 Billion Lbs 156 Billion Lbs
Potential (3)*
South
America
30%
Indonesia
20%
North
America
45%
South
America
32%
Indonesia
29%
North
America
39%
South
America
15%
Other
5%
North
America
66%
(1) Preliminary estimate of recoverable proven and probable copper reserves using a copper price of $2.00/lb; 71 billion pounds net to FCX’s interest.
(2) Preliminary estimate of consolidated contained copper resources using a copper price of $2.20/lb; includes Kisanfu in D.R.C., which is an asset held for sale.
(3) Our estimates of potential are based on geologically reasonable interpolation and extrapolation of more limited information than is used for Mineralized Material (measured
and indicated) and requires higher Cu prices. Significant additional drilling is required and no assurance can be given that the potential quantities of metal will be produced.
* Mineralized material and potential resources are not included in reserves and will not qualify as reserves until comprehensive engineering studies establish their economic
feasibility. Accordingly, no assurance can be given that the estimated mineralized material and potential resources will become proven and probable reserves. See Cautionary
Statement.
Serbia &
Other
19%
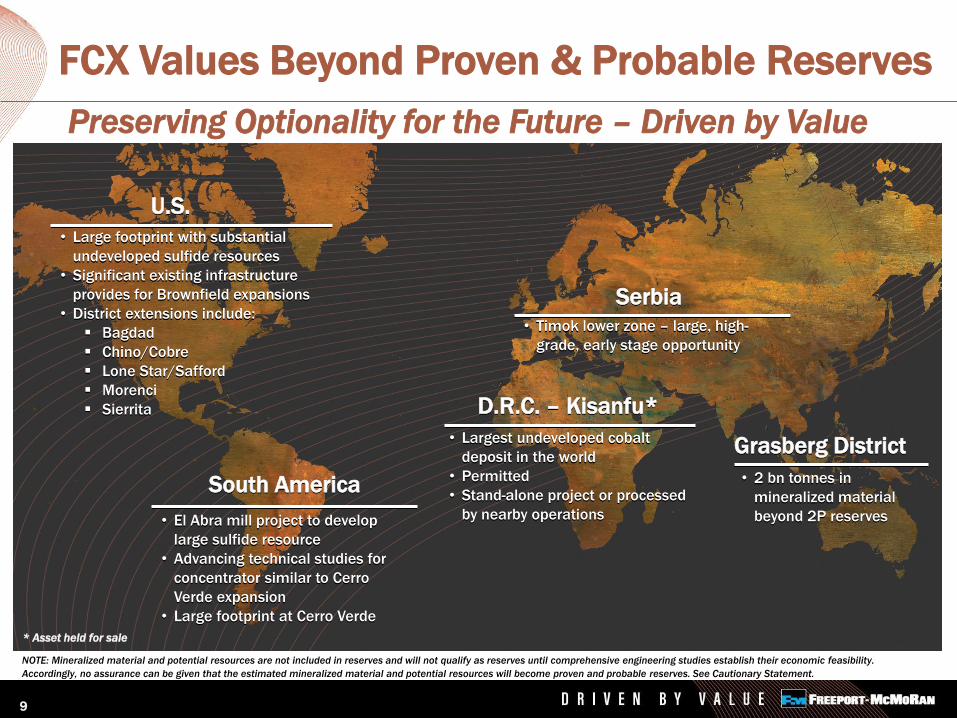
FCX Values Beyond Proven & Probable Reserves
9
• Timok lower zone – large, high-
grade, early stage opportunity
• Largest undeveloped cobalt
deposit in the world
• Permitted
• Stand-alone project or processed
by nearby operations
• 2 bn tonnes in
mineralized material
beyond 2P reserves
• Large footprint with substantial
undeveloped sulfide resources
• Significant existing infrastructure
provides for Brownfield expansions
• District extensions include:
Bagdad
Chino/Cobre
Lone Star/Safford
Morenci
Sierrita
• El Abra mill project to develop
large sulfide resource
• Advancing technical studies for
concentrator similar to Cerro
Verde expansion
• Large footprint at Cerro Verde
Serbia
D.R.C. – Kisanfu*
Grasberg District
U.S.
South America
* Asset held for sale
NOTE: Mineralized material and potential resources are not included in reserves and will not qualify as reserves until comprehensive engineering studies establish their economic feasibility.
Accordingly, no assurance can be given that the estimated mineralized material and potential resources will become proven and probable reserves. See Cautionary Statement.
Preserving Optionality for the Future – Driven by Value
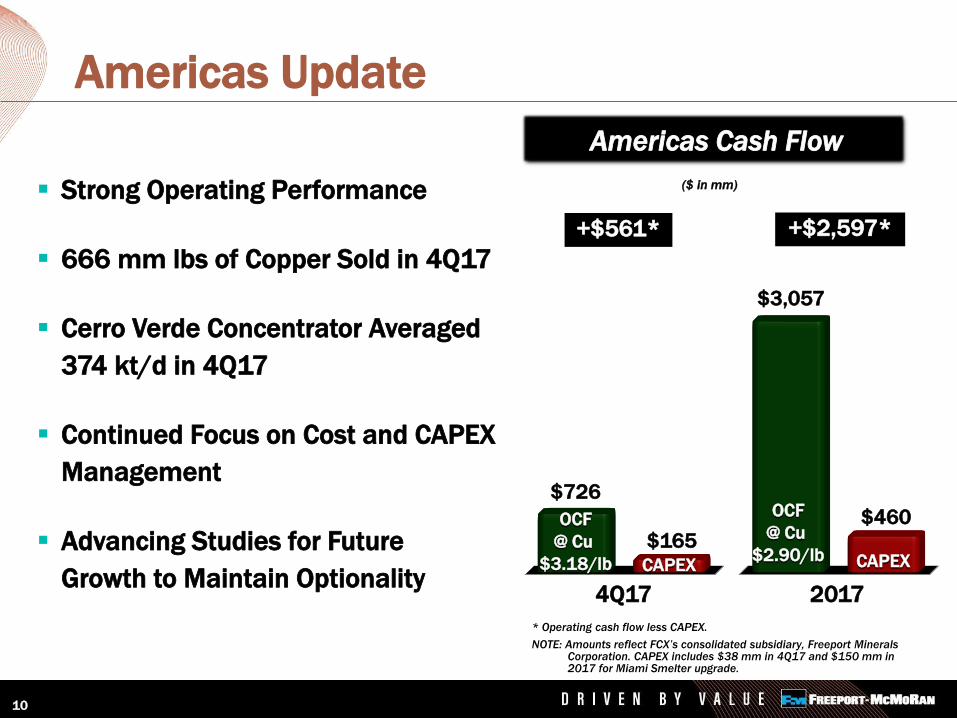
Strong Operating Performance
666 mm lbs of Copper Sold in 4Q17
Cerro Verde Concentrator Averaged
374 kt/d in 4Q17
Continued Focus on Cost and CAPEX
Management
Advancing Studies for Future
Growth to Maintain Optionality
Americas Update
10
* Operating cash flow less CAPEX.
NOTE: Amounts reflect FCX’s consolidated subsidiary, Freeport Minerals Corporation. CAPEX includes $38 mm in 4Q17 and $150 mm in 2017 for Miami Smelter upgrade.
($ in mm)
Americas Cash Flow
+$561* +$2,597*
$165$460OCF
@ Cu
$3.18/lb CAPEX
4Q17 2017
OCF
@ Cu
$2.90/lb
$726
CAPEX
$3,057
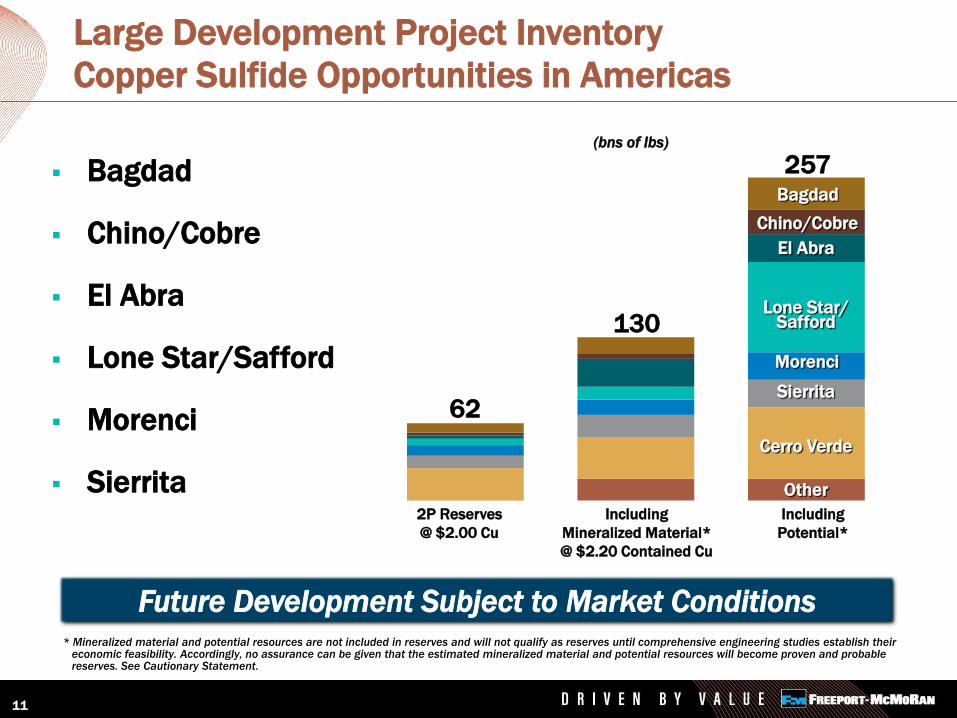
Bagdad
Chino/Cobre
El Abra
Lone Star/Safford
Morenci
Sierrita
Large Development Project Inventory
Copper Sulfide Opportunities in Americas
Future Development Subject to Market Conditions
11
2P Reserves
@ $2.00 Cu
Including
Mineralized Material*
@ $2.20 Contained Cu
Including
Potential*
Other
Sierrita
Morenci
Lone Star/Safford
El Abra
Chino/Cobre
Cerro Verde
Bagdad
62
130
257(bns of lbs)
* Mineralized material and potential resources are not included in reserves and will not qualify as reserves until comprehensive engineering studies establish their economic feasibility. Accordingly, no assurance can be given that the estimated mineralized material and potential resources will become proven and probable reserves. See Cautionary Statement.
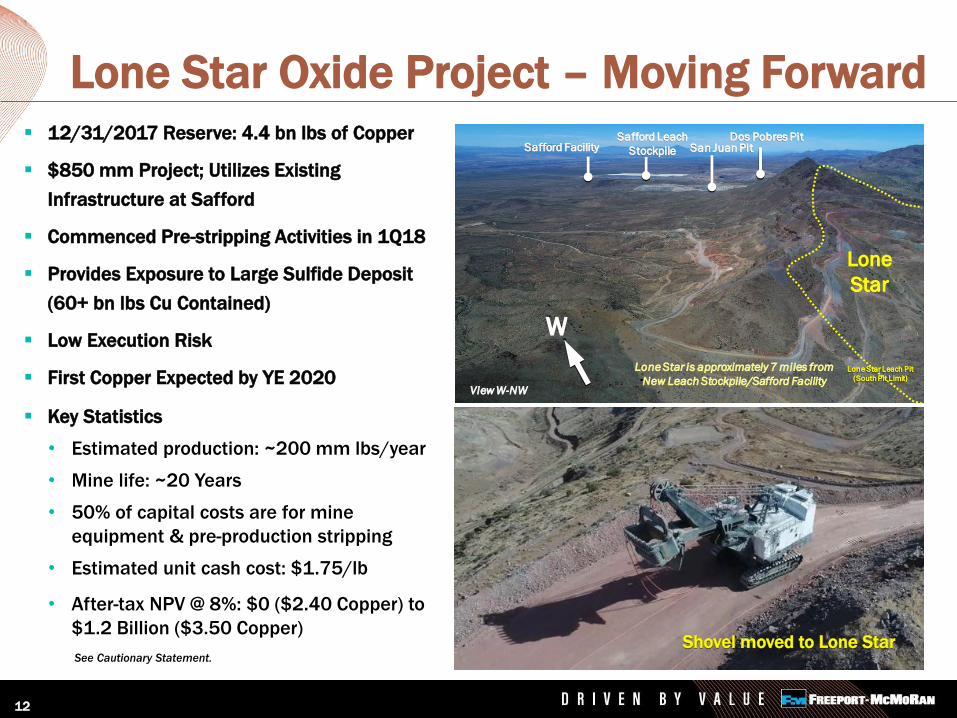
Lone Star Oxide Project – Moving Forward
12
12/31/2017 Reserve: 4.4 bn lbs of Copper
$850 mm Project; Utilizes Existing
Infrastructure at Safford
Commenced Pre-stripping Activities in 1Q18
Provides Exposure to Large Sulfide Deposit
(60+ bn lbs Cu Contained)
Low Execution Risk
First Copper Expected by YE 2020
Key Statistics
• Estimated production: ~200 mm lbs/year
• Mine life: ~20 Years
• 50% of capital costs are for mine
equipment & pre-production stripping
• Estimated unit cash cost: $1.75/lb
• After-tax NPV @ 8%: $0 ($2.40 Copper) to
$1.2 Billion ($3.50 Copper)Shovel moved to Lone Star
See Cautionary Statement.
Dos Pobres PitSan Juan Pit
Safford Leach
StockpileSafford Facility
W
Lone Star Leach Pit
(South Pit Limit)
View W-NW
Lone Star is approximately 7 miles from
New Leach Stockpile/Safford Facility
Lone
Star
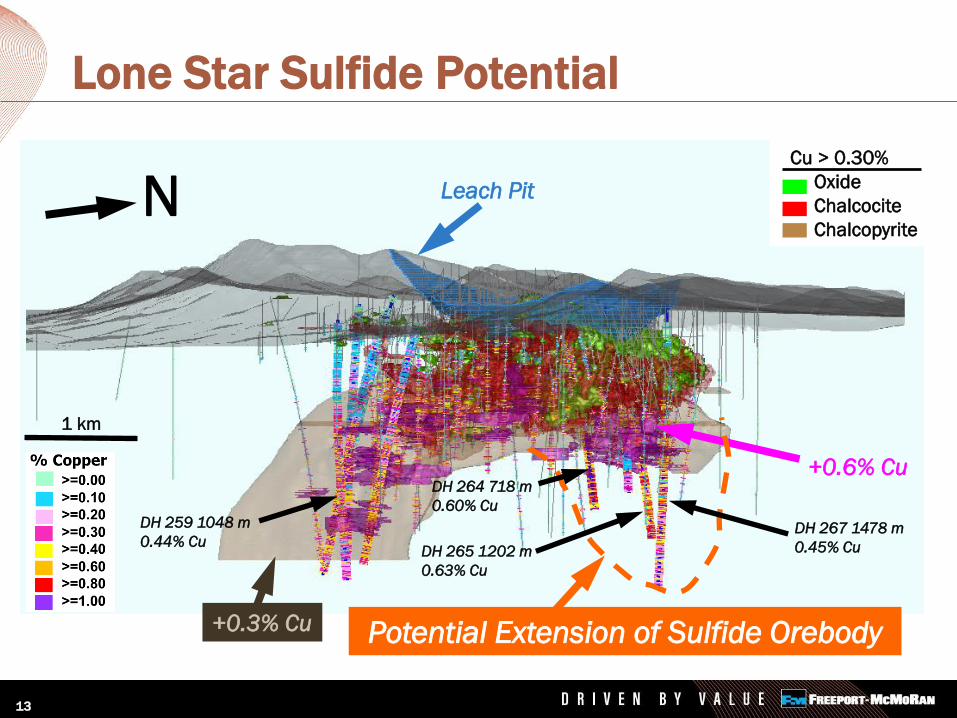
Lone Star Sulfide Potential
13
+0.3% Cu
+0.6% Cu
1 km
Potential Extension of Sulfide Orebody
Leach Pit
DH 267 1478 m
0.45% Cu
NCu > 0.30%
Oxide
Chalcocite
Chalcopyrite
DH 264 718 m
0.60% Cu
DH 265 1202 m
0.63% Cu
DH 259 1048 m
0.44% Cu
El Abra Sulfide Mill Project
14
Large Sulfide Resource
Resource Estimate: 2 Billion Tonnes at >0.45% Copper
Advancing Technical Studies
• 240 kt/d Concentrator – Similar to Recent Cerro Verde Expansion
• Estimated Production: ~750 mm lbs/year
• 6-8 Year Expected Lead Time
— 3-4 Years of Feasibility and Permitting
— 3-4 Year Construction Period
NOTE: Potential resources are not included in reserves and will not qualify as reserves until comprehensive engineering studies establish their economic feasibility.
Accordingly, no assurance can be given that the estimated mineralized material and potential resources will become proven and probable reserves. See Cautionary Statement.
15
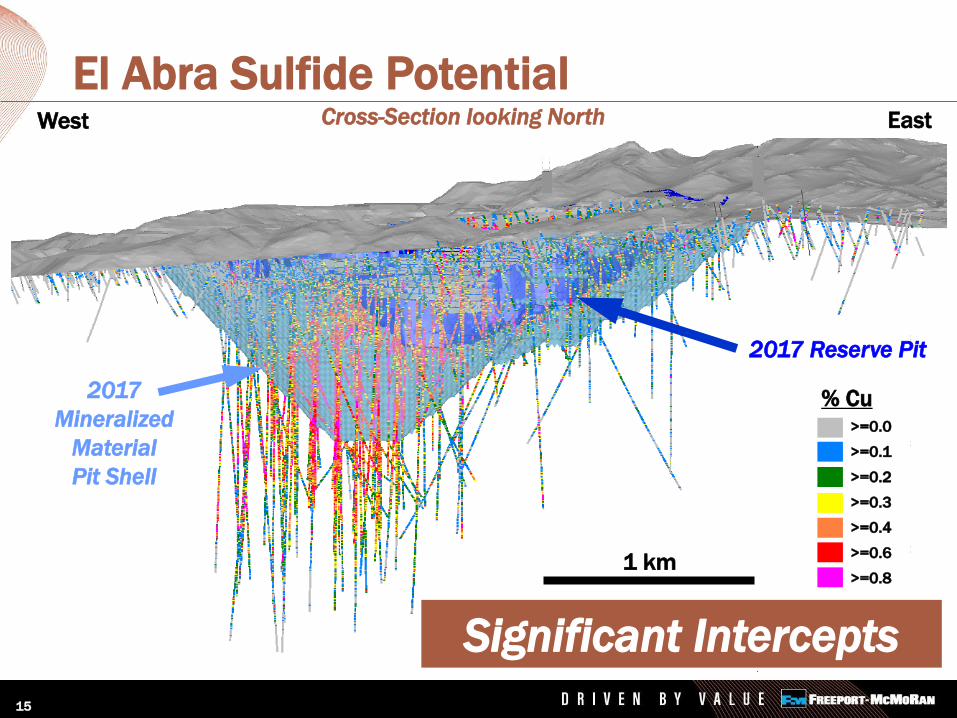
El Abra Sulfide PotentialWest East
% Cu
Cross-Section looking North
1 km
2017
Mineralized
Material
Pit Shell
>=0.0
>=0.1
>=0.2
>=0.3
>=0.4
>=0.6
>=0.8
2017 Reserve Pit
Significant Intercepts
Indonesia Update
16
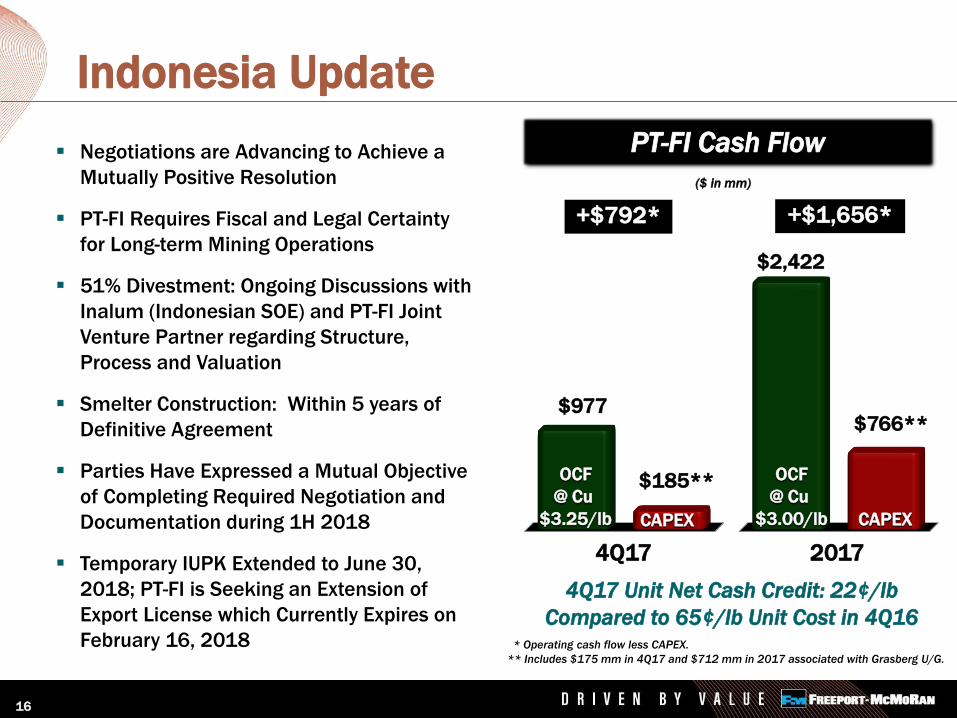
Negotiations are Advancing to Achieve a
Mutually Positive Resolution
PT-FI Requires Fiscal and Legal Certainty
for Long-term Mining Operations
51% Divestment: Ongoing Discussions with
Inalum (Indonesian SOE) and PT-FI Joint
Venture Partner regarding Structure,
Process and Valuation
Smelter Construction: Within 5 years of
Definitive Agreement
Parties Have Expressed a Mutual Objective
of Completing Required Negotiation and
Documentation during 1H 2018
Temporary IUPK Extended to June 30,
2018; PT-FI is Seeking an Extension of
Export License which Currently Expires on
February 16, 2018
4Q17 Unit Net Cash Credit: 22¢/lb
Compared to 65¢/lb Unit Cost in 4Q16* Operating cash flow less CAPEX.
** Includes $175 mm in 4Q17 and $712 mm in 2017 associated with Grasberg U/G.
($ in mm)
PT-FI Cash Flow
+$792* +$1,656*
$185**
$2,422
$766**
OCF
@ Cu
$3.25/lb CAPEX
4Q17 2017
OCF
@ Cu
$3.00/lb
$977
CAPEX
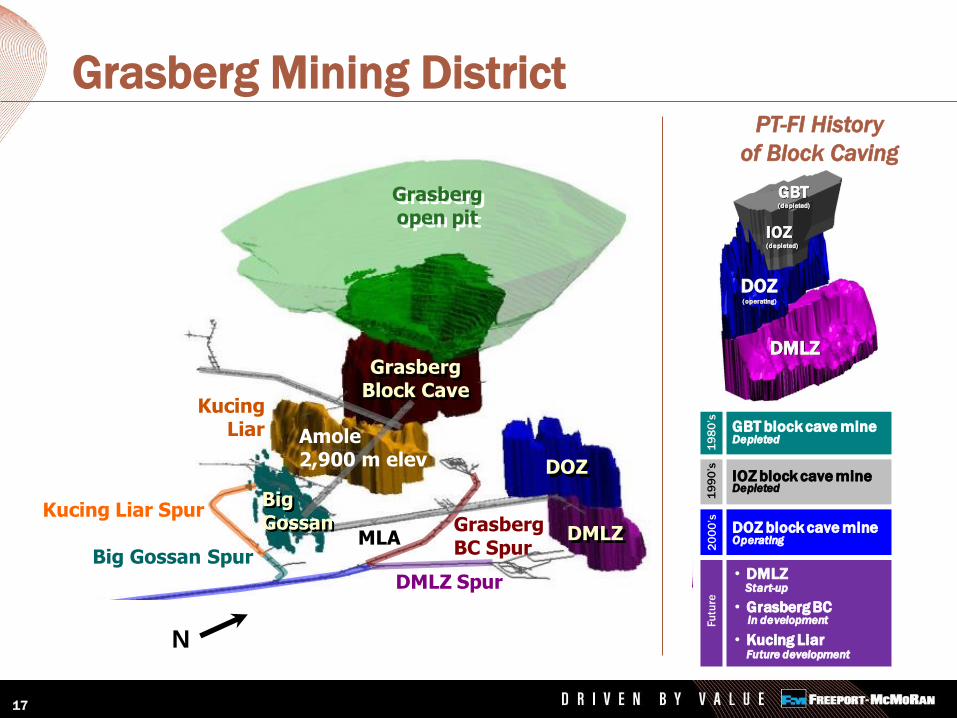
Plan View
DOZ
DMLZ
Grasberg &Kucing Liar
BigGossan
N
N
DOZ
DMLZ
GrasbergBlock Cave
KucingLiar
Grasbergopen pit
MLA
Common Infrastructure2,500 m elev
GrasbergBC Spur
Kucing Liar Spur
Big Gossan Spur
DMLZ Spur
Portals(at Ridge Camp)
BigGossan
Amole2,900 m elev
N
Grasberg Mining District
17
19
80
’s1
99
0’s
20
00
’sFu
ture
• DMLZ
• Grasberg BC
• Kucing Liar
DOZ block cave mine
IOZ block cave mine
GBT block cave mineDepleted
Depleted
Operating
Future development
DOZ(operating)
DMLZ
IOZ(depleted)
GBT(depleted)
In development
Start-up
Ertsberg East
19
80
’s1
99
0’s
20
00
’sFu
ture
• DMLZ
• Grasberg BC
• Kucing Liar
DOZ block cave mine
IOZ block cave mine
GBT block cave mineDepleted
Depleted
Operating
Future development
DOZ(operating)
DMLZ
IOZ(depleted)
GBT(depleted)
In development
Start-up
Ertsberg East
PT-FI History
of Block Caving
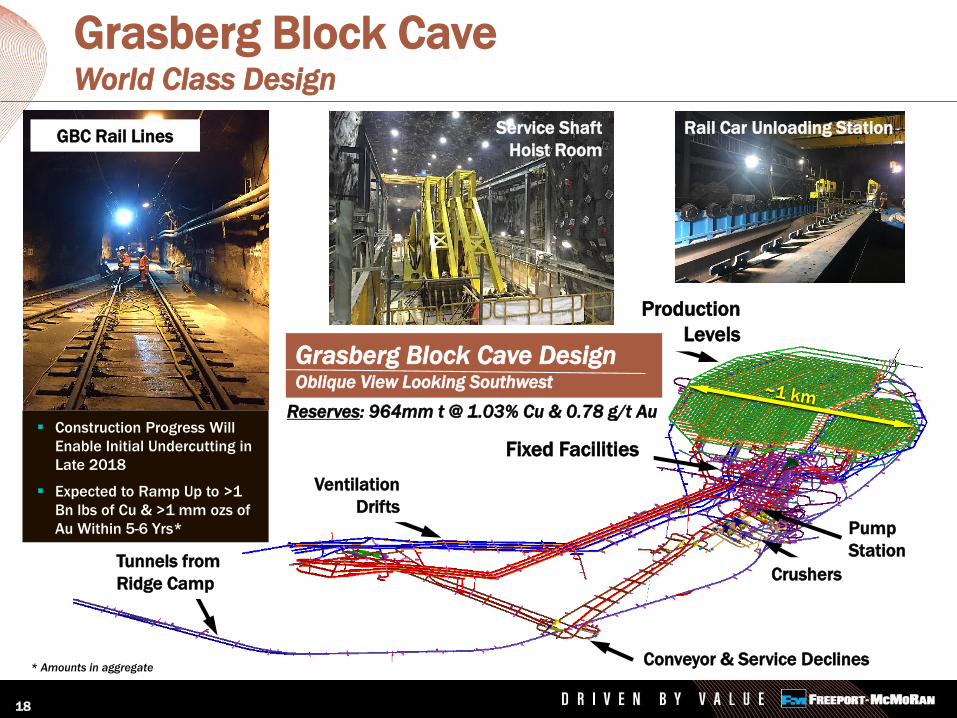
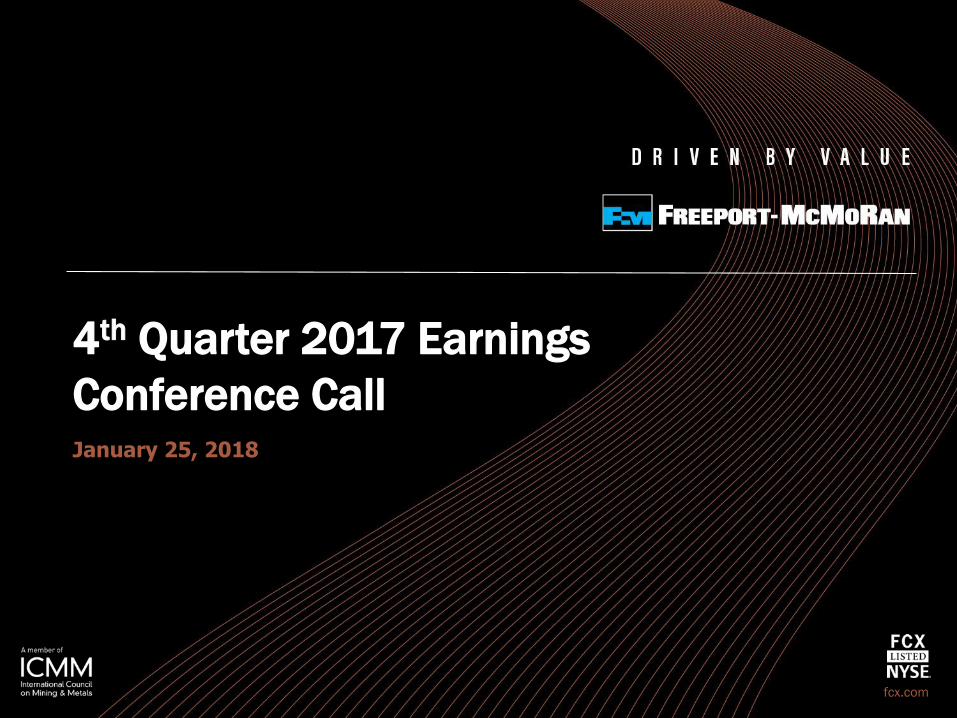
Grasberg Block CaveWorld Class Design
18
Production
Levels
Fixed Facilities
Ventilation
Drifts
Tunnels from
Ridge Camp
Pump
Station
Crushers
Conveyor & Service Declines
Rail Car Unloading StationService Shaft
Hoist Room
Grasberg Block Cave DesignOblique View Looking Southwest
Reserves: 964mm t @ 1.03% Cu & 0.78 g/t Au
GBC Rail Lines
Construction Progress Will
Enable Initial Undercutting in
Late 2018
Expected to Ramp Up to >1
Bn lbs of Cu & >1 mm ozs of
Au Within 5-6 Yrs*
* Amounts in aggregate
Near-term Objectives 28 km of Development in 2018
Complete Rail & Ore Flow
Systems in 2H18
Complete Key Fixed Facilities
Complete 200+ Drawpoints for
Cave Initiation
First Undercut Blasting in 4Q18
First Cave Production in 1Q19
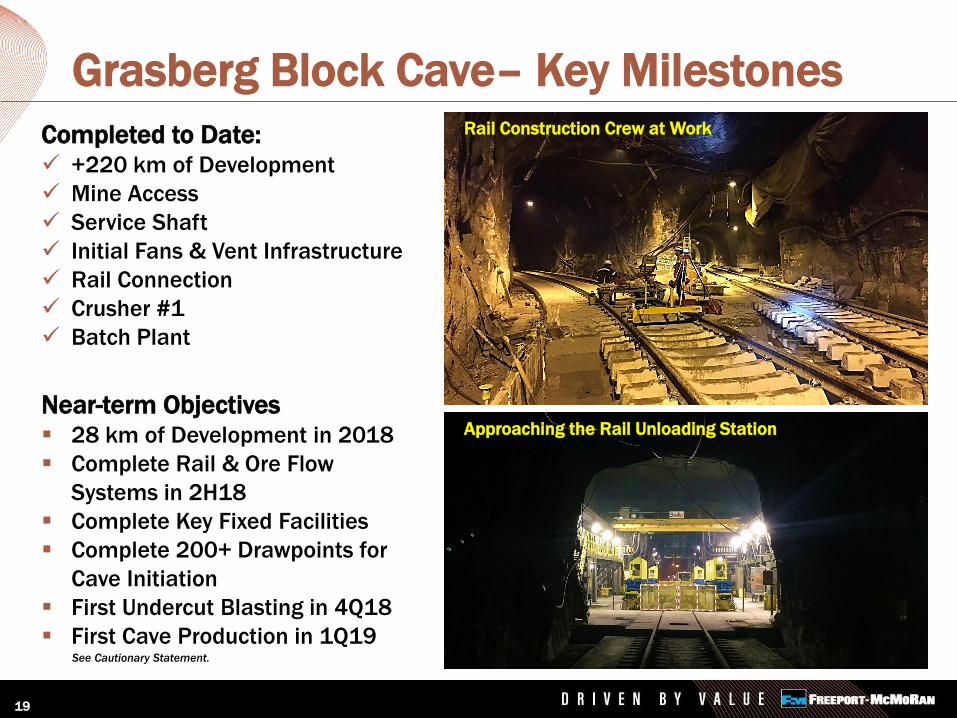
Grasberg Block Cave– Key Milestones
19
Completed to Date: +220 km of Development
Mine Access
Service Shaft
Initial Fans & Vent Infrastructure
Rail Connection
Crusher #1
Batch Plant
See Cautionary Statement.
Approaching the Rail Unloading Station
Rail Construction Crew at Work
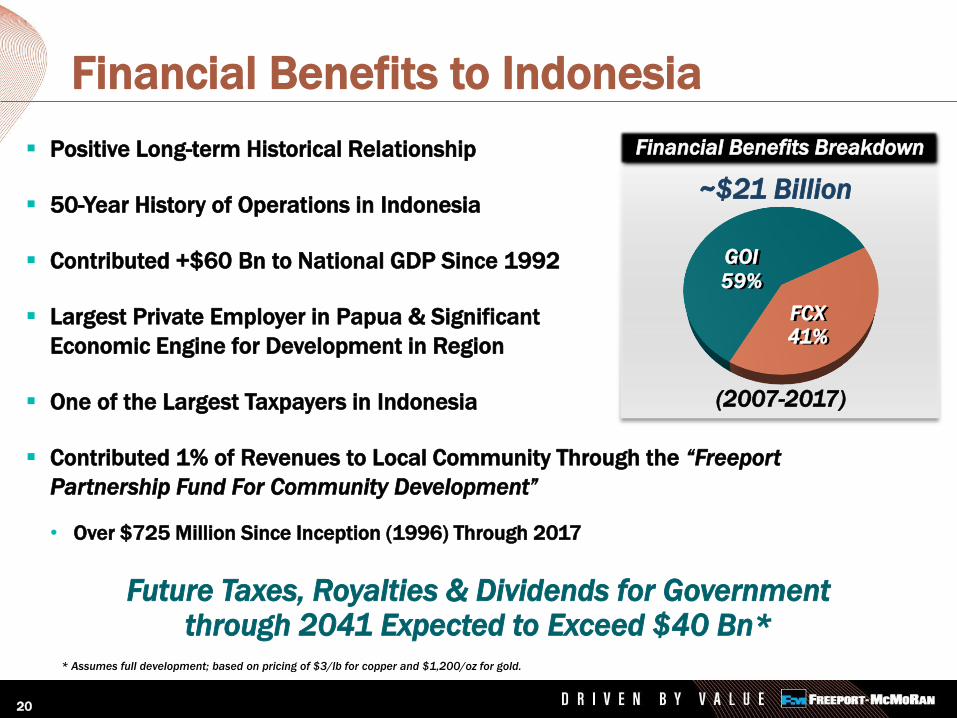
Financial Benefits Breakdown Positive Long-term Historical Relationship
50-Year History of Operations in Indonesia
Contributed +$60 Bn to National GDP Since 1992
Largest Private Employer in Papua & Significant
Economic Engine for Development in Region
One of the Largest Taxpayers in Indonesia
Contributed 1% of Revenues to Local Community Through the “Freeport
Partnership Fund For Community Development”
• Over $725 Million Since Inception (1996) Through 2017
Financial Benefits to Indonesia
~$21 Billion
59%
41%FCX
GOI
(2007-2017)
Future Taxes, Royalties & Dividends for Government through 2041 Expected to Exceed $40 Bn*
20
* Assumes full development; based on pricing of $3/lb for copper and $1,200/oz for gold.
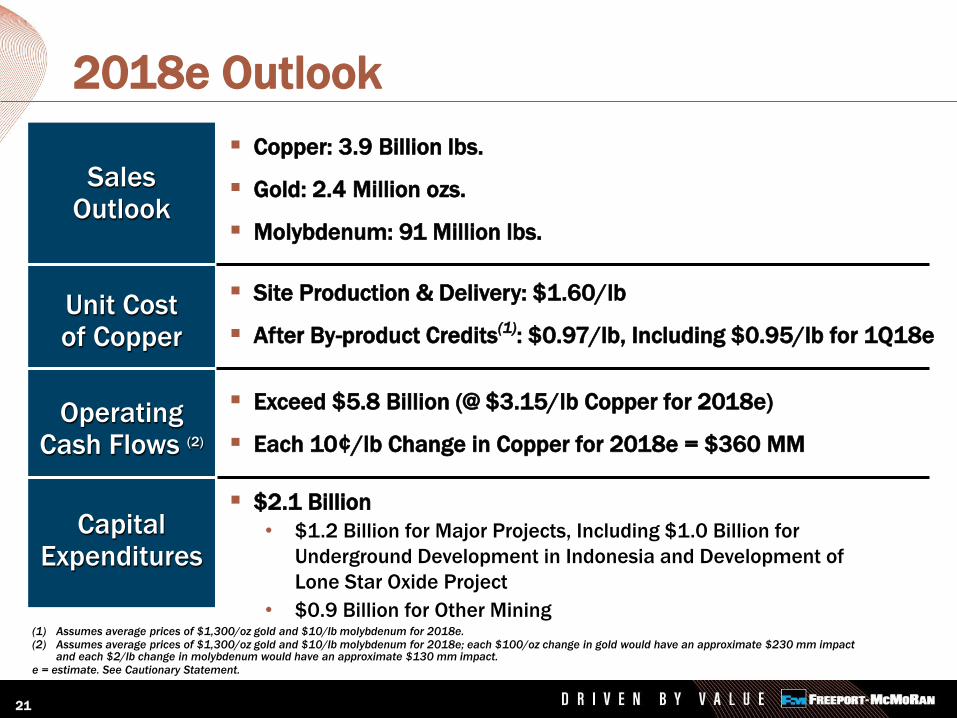
2018e Outlook
Copper: 3.9 Billion lbs.
Gold: 2.4 Million ozs.
Molybdenum: 91 Million lbs.
SalesOutlook
Unit Costof Copper
OperatingCash Flows (2)
Capital Expenditures
Site Production & Delivery: $1.60/lb
After By-product Credits(1): $0.97/lb, Including $0.95/lb for 1Q18e
Exceed $5.8 Billion (@ $3.15/lb Copper for 2018e)
Each 10¢/lb Change in Copper for 2018e = $360 MM
$2.1 Billion
• $1.2 Billion for Major Projects, Including $1.0 Billion for
Underground Development in Indonesia and Development of
Lone Star Oxide Project
• $0.9 Billion for Other Mining(1) Assumes average prices of $1,300/oz gold and $10/lb molybdenum for 2018e.(2) Assumes average prices of $1,300/oz gold and $10/lb molybdenum for 2018e; each $100/oz change in gold would have an approximate $230 mm impact
and each $2/lb change in molybdenum would have an approximate $130 mm impact.
e = estimate. See Cautionary Statement.
21
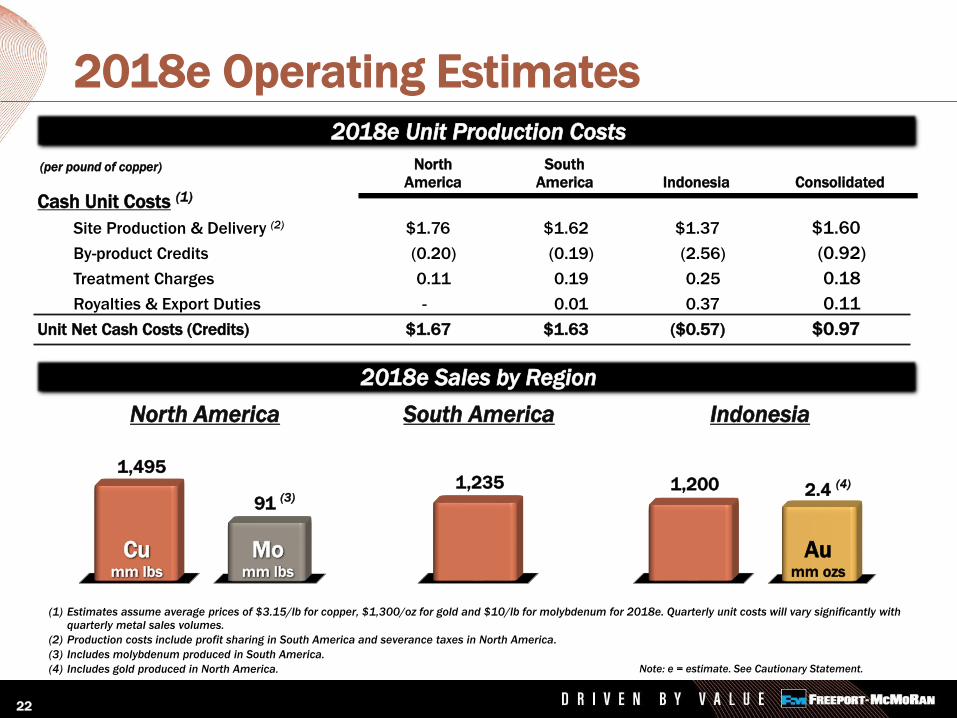
1,235
South America
91 (3)
Momm lbs
1,495
Cumm lbs
1,200
Indonesia
2.4 (4)
Aumm ozs
2018e Operating Estimates
(1) Estimates assume average prices of $3.15/lb for copper, $1,300/oz for gold and $10/lb for molybdenum for 2018e. Quarterly unit costs will vary significantly with
quarterly metal sales volumes.
(2) Production costs include profit sharing in South America and severance taxes in North America.
(3) Includes molybdenum produced in South America.
(4) Includes gold produced in North America.
North America
(per pound of copper) North South
America America Indonesia Consolidated
Cash Unit Costs (1)
Site Production & Delivery (2) $1.76 $1.62 $1.37 $1.60
By-product Credits (0.20) (0.19) (2.56) (0.92)
Treatment Charges 0.11 0.19 0.25 0.18
Royalties & Export Duties - 0.01 0.37 0.11
Unit Net Cash Costs (Credits) $1.67 $1.63 ($0.57) $0.97
2018e Unit Production Costs
Note: e = estimate. See Cautionary Statement.
2018e Sales by Region
22
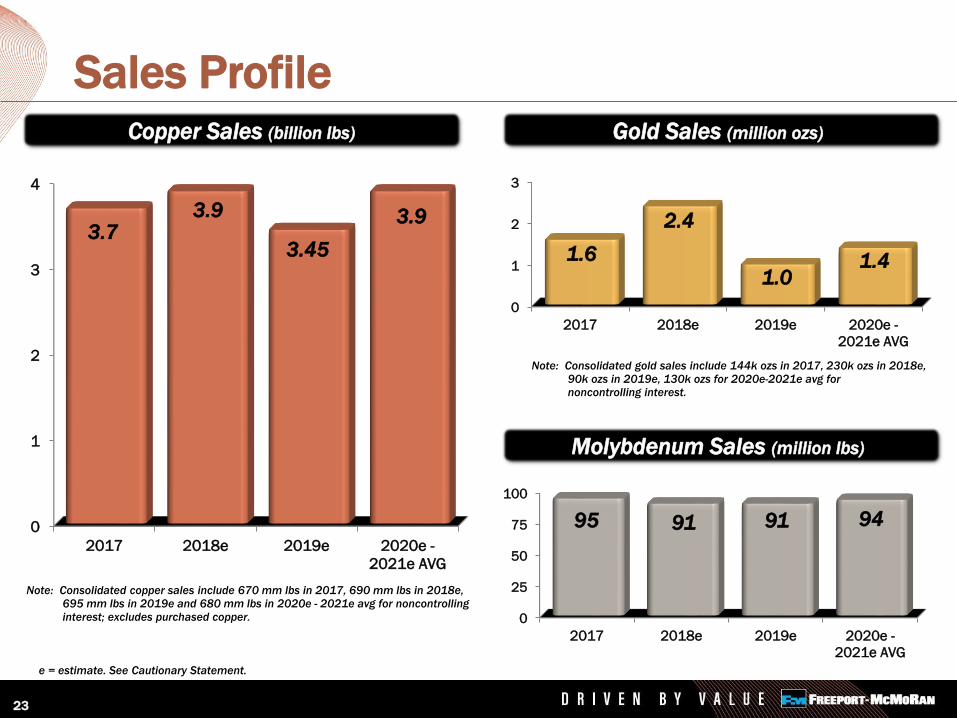
23
0
1
2
3
4
2017 2018e 2019e 2020e -
2021e AVG
3.73.9
3.45
3.9
Copper Sales (billion lbs)
Sales Profile
Note: Consolidated copper sales include 670 mm lbs in 2017, 690 mm lbs in 2018e,
695 mm lbs in 2019e and 680 mm lbs in 2020e - 2021e avg for noncontrolling
interest; excludes purchased copper.
e = estimate. See Cautionary Statement.
Note: Consolidated gold sales include 144k ozs in 2017, 230k ozs in 2018e,
90k ozs in 2019e, 130k ozs for 2020e-2021e avg for
noncontrolling interest.
0
1
2
3
2017 2018e 2019e 2020e -
2021e AVG
1.6
2.4
1.01.4
0
25
50
75
100
2017 2018e 2019e 2020e -
2021e AVG
95 91 91 94
Gold Sales (million ozs)
Molybdenum Sales (million lbs)
Copper Sales (billion lbs)
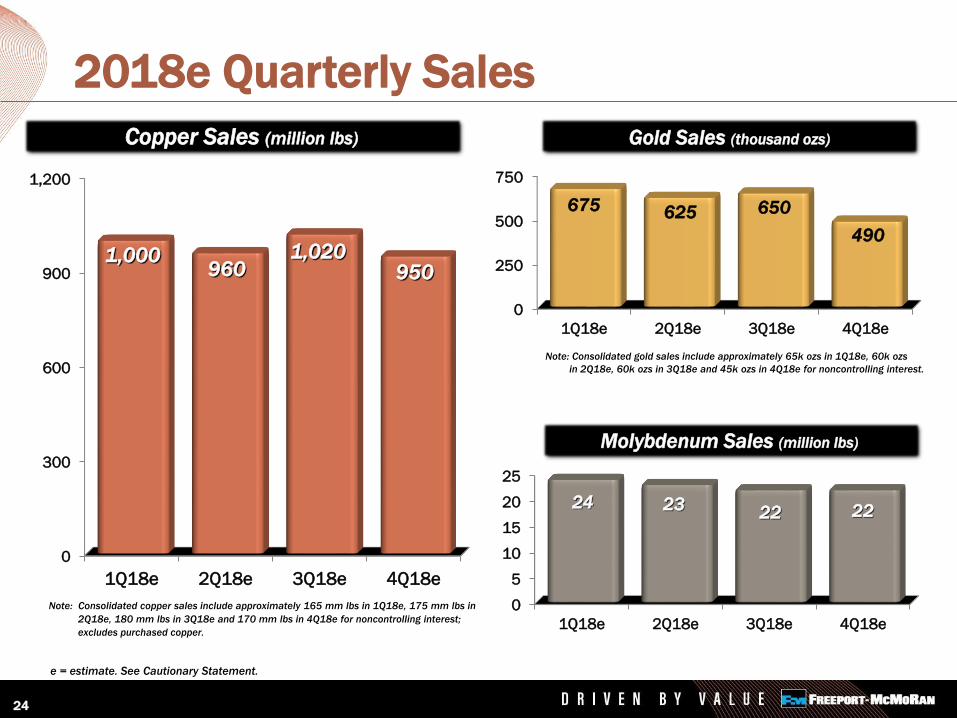
24
0
300
600
900
1,200
1Q18e 2Q18e 3Q18e 4Q18e
1,000960
1,020950
2018e Quarterly Sales
0
250
500
750
1Q18e 2Q18e 3Q18e 4Q18e
675 625 650
490
Gold Sales (thousand ozs)
0
5
10
15
20
25
1Q18e 2Q18e 3Q18e 4Q18e
24 2322 22
Molybdenum Sales (million lbs)
Note: Consolidated gold sales include approximately 65k ozs in 1Q18e, 60k ozs
in 2Q18e, 60k ozs in 3Q18e and 45k ozs in 4Q18e for noncontrolling interest.
e = estimate. See Cautionary Statement.
Note: Consolidated copper sales include approximately 165 mm lbs in 1Q18e, 175 mm lbs in
2Q18e, 180 mm lbs in 3Q18e and 170 mm lbs in 4Q18e for noncontrolling interest;
excludes purchased copper.
Copper Sales (million lbs)
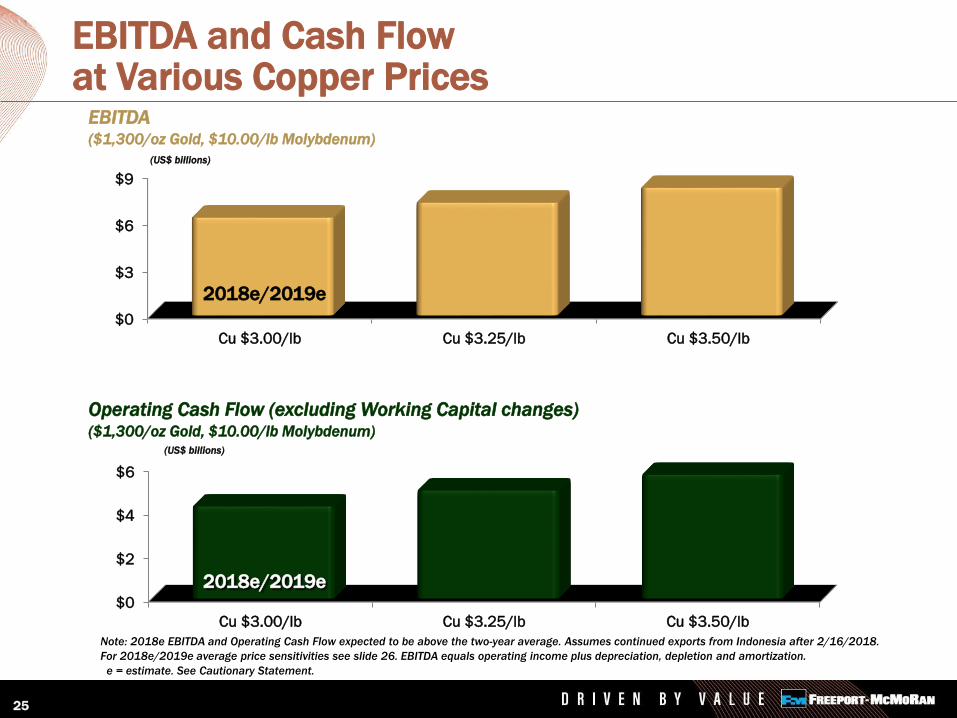
25
$0
$3
$6
$9
Cu $3.00/lb Cu $3.25/lb Cu $3.50/lb
$0
$2
$4
$6
Cu $3.00/lb Cu $3.25/lb Cu $3.50/lb
EBITDA and Cash Flow at Various Copper Prices
EBITDA ($1,300/oz Gold, $10.00/lb Molybdenum)
Operating Cash Flow (excluding Working Capital changes)($1,300/oz Gold, $10.00/lb Molybdenum)
(US$ billions)
(US$ billions)
Note: 2018e EBITDA and Operating Cash Flow expected to be above the two-year average. Assumes continued exports from Indonesia after 2/16/2018.
For 2018e/2019e average price sensitivities see slide 26. EBITDA equals operating income plus depreciation, depletion and amortization.
e = estimate. See Cautionary Statement.
2018e/2019e
2018e/2019e
26
OperatingChange EBITDA Cash Flow
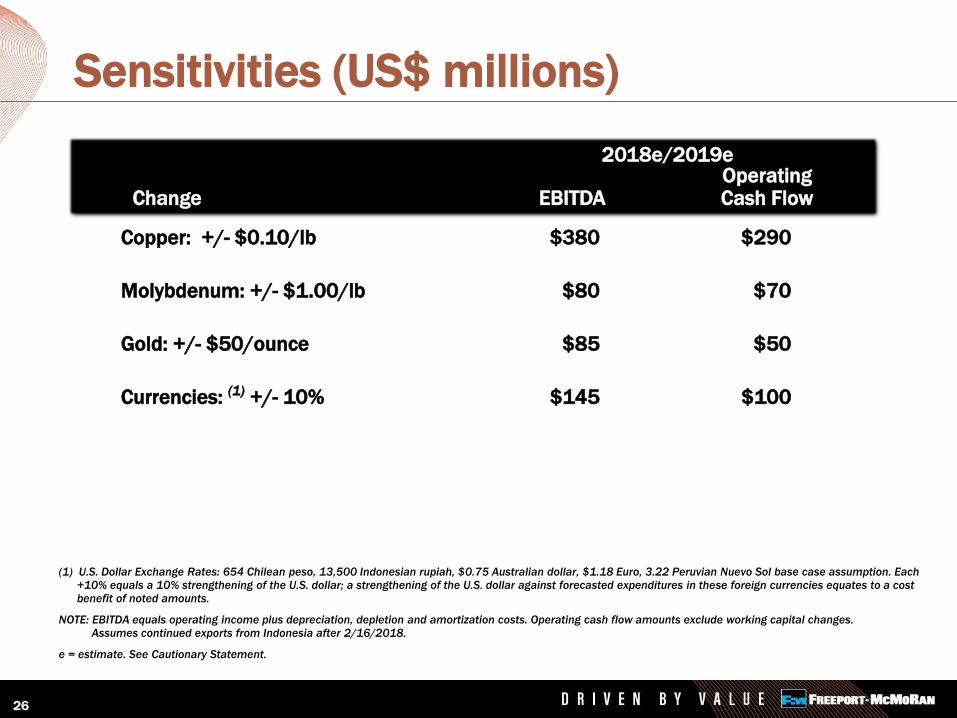
Sensitivities (US$ millions)
(1) U.S. Dollar Exchange Rates: 654 Chilean peso, 13,500 Indonesian rupiah, $0.75 Australian dollar, $1.18 Euro, 3.22 Peruvian Nuevo Sol base case assumption. Each
+10% equals a 10% strengthening of the U.S. dollar; a strengthening of the U.S. dollar against forecasted expenditures in these foreign currencies equates to a cost benefit of noted amounts.
NOTE: EBITDA equals operating income plus depreciation, depletion and amortization costs. Operating cash flow amounts exclude working capital changes.
Assumes continued exports from Indonesia after 2/16/2018.
e = estimate. See Cautionary Statement.
2018e/2019e
Copper: +/- $0.10/lb $380 $290
Molybdenum: +/- $1.00/lb $80 $70
Gold: +/- $50/ounce $85 $50
Currencies: (1) +/- 10% $145 $100
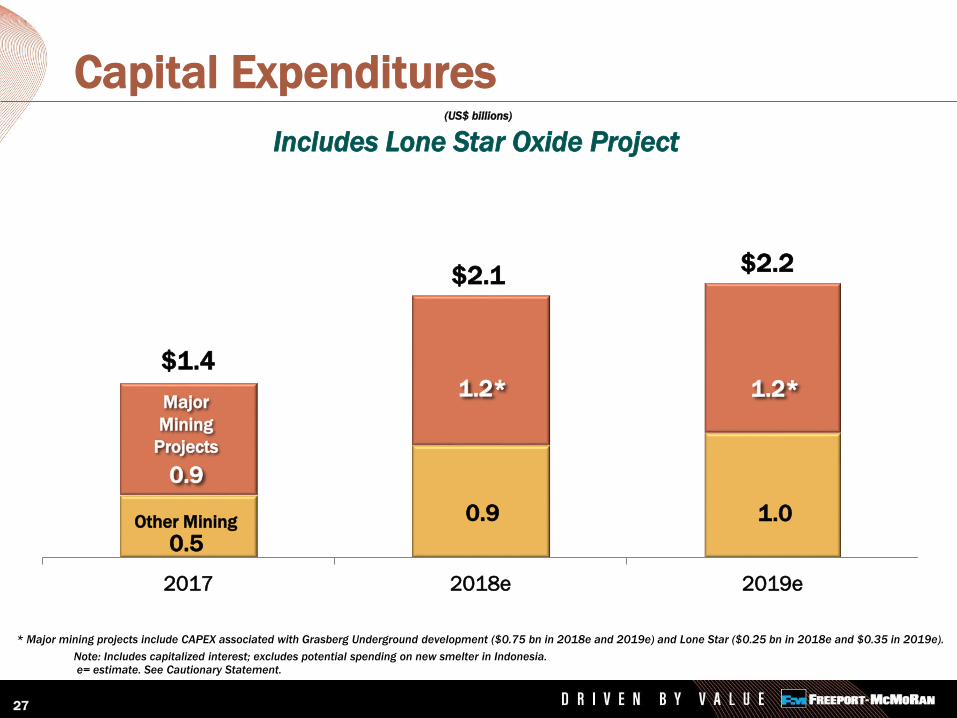
27
2017 2018e 2019e
Capital Expenditures(US$ billions)
Note: Includes capitalized interest; excludes potential spending on new smelter in Indonesia. e= estimate. See Cautionary Statement.
Other Mining
0.5
Major
Mining
Projects
0.9
0.9
1.2*
$2.1
Includes Lone Star Oxide Project
$1.4
* Major mining projects include CAPEX associated with Grasberg Underground development ($0.75 bn in 2018e and 2019e) and Lone Star ($0.25 bn in 2018e and $0.35 in 2019e).
1.0
1.2*
$2.2
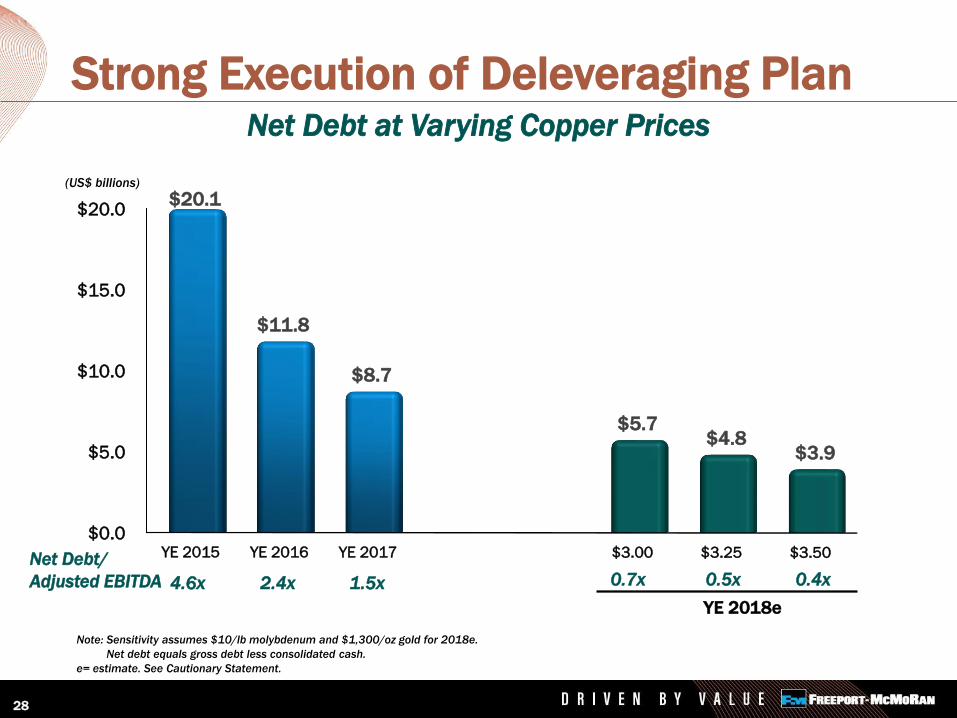
28
Strong Execution of Deleveraging PlanNet Debt at Varying Copper Prices
(US$ billions)
Note: Sensitivity assumes $10/lb molybdenum and $1,300/oz gold for 2018e.
Net debt equals gross debt less consolidated cash.
e= estimate. See Cautionary Statement.
$0.0
$5.0
$10.0
$15.0
$20.0
YE 2015 YE 2016 YE 2017 $3.00 $3.25 $3.50
$20.1
$11.8
$8.7
$5.7$4.8
$3.9
Net Debt/
Adjusted EBITDA
YE 2018e
0.7x 0.5x 0.4x4.6x 2.4x 1.5x
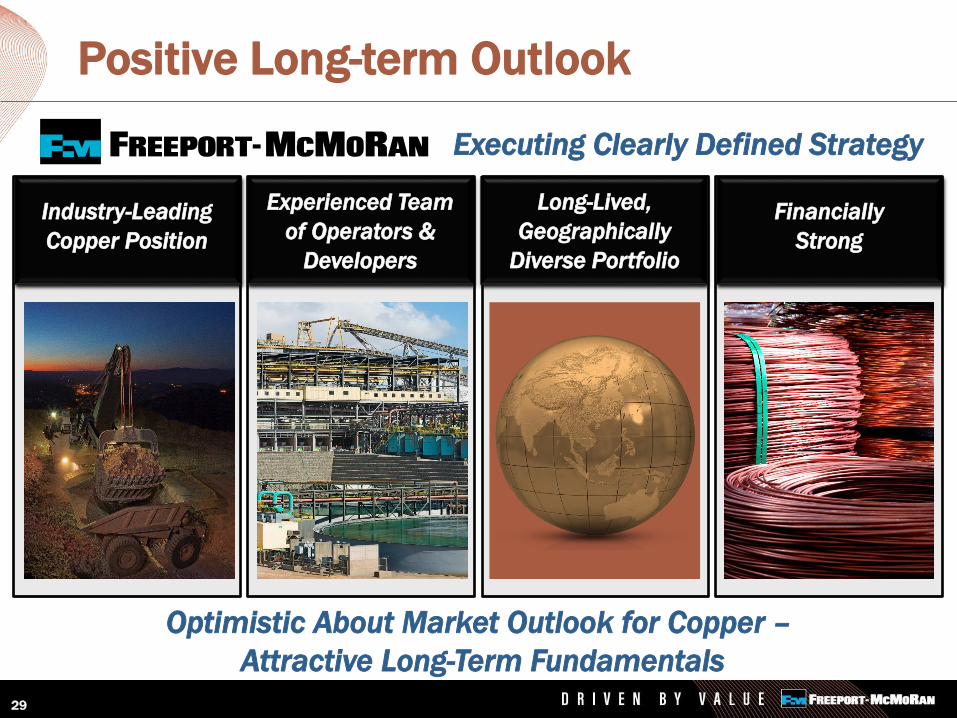
Positive Long-term Outlook
Experienced Team
of Operators &
Developers
Long-Lived,
Geographically
Diverse Portfolio
Industry-Leading
Copper Position
Optimistic About Market Outlook for Copper –
Attractive Long-Term Fundamentals
Financially
Strong
29
Executing Clearly Defined Strategy

Reference Slides
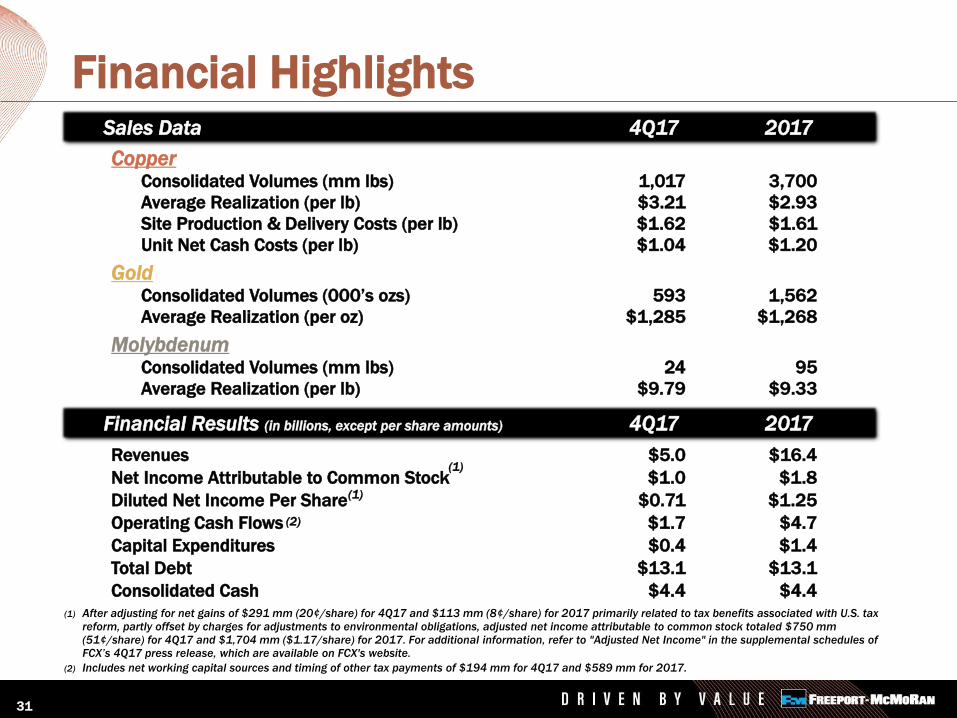
Financial Highlights
CopperConsolidated Volumes (mm lbs) 1,017 3,700
Average Realization (per lb) $3.21 $2.93
Site Production & Delivery Costs (per lb) $1.62 $1.61
Unit Net Cash Costs (per lb) $1.04 $1.20
GoldConsolidated Volumes (000’s ozs) 593 1,562
Average Realization (per oz) $1,285 $1,268
MolybdenumConsolidated Volumes (mm lbs) 24 95
Average Realization (per lb) $9.79 $9.33
Sales Data 4Q17 2017
Financial Results (in billions, except per share amounts) 4Q17 2017
(1) After adjusting for net gains of $291 mm (20¢/share) for 4Q17 and $113 mm (8¢/share) for 2017 primarily related to tax benefits associated with U.S. tax
reform, partly offset by charges for adjustments to environmental obligations, adjusted net income attributable to common stock totaled $750 mm
(51¢/share) for 4Q17 and $1,704 mm ($1.17/share) for 2017. For additional information, refer to "Adjusted Net Income" in the supplemental schedules of FCX’s 4Q17 press release, which are available on FCX's website.
(2) Includes net working capital sources and timing of other tax payments of $194 mm for 4Q17 and $589 mm for 2017.
Revenues $5.0 $16.4
Net Income Attributable to Common Stock $1.0 $1.8
Diluted Net Income Per Share $0.71 $1.25
Operating Cash Flows $1.7 $4.7
Capital Expenditures $0.4 $1.4
Total Debt $13.1 $13.1
Consolidated Cash $4.4 $4.4
(2)
31
(1)
(1)
32
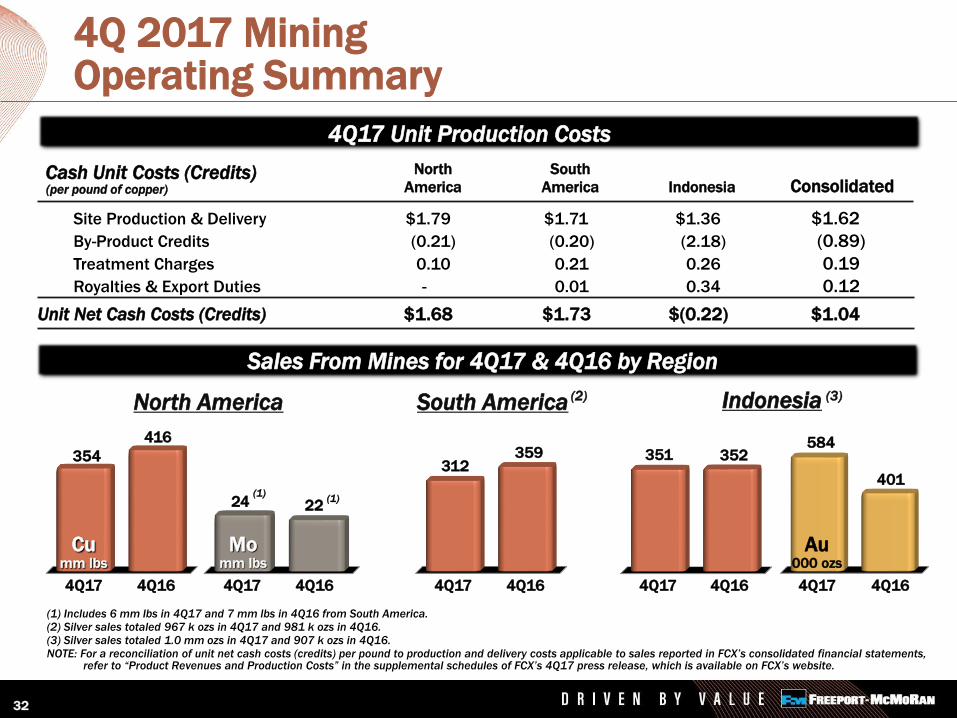
4Q 2017 MiningOperating Summary
(1) Includes 6 mm lbs in 4Q17 and 7 mm lbs in 4Q16 from South America.(2) Silver sales totaled 967 k ozs in 4Q17 and 981 k ozs in 4Q16.
(3) Silver sales totaled 1.0 mm ozs in 4Q17 and 907 k ozs in 4Q16.
NOTE: For a reconciliation of unit net cash costs (credits) per pound to production and delivery costs applicable to sales reported in FCX’s consolidated financial statements, refer to “Product Revenues and Production Costs” in the supplemental schedules of FCX’s 4Q17 press release, which is available on FCX’s website.
(per pound of copper)
North South
America America Indonesia Consolidated
Site Production & Delivery $1.79 $1.71 $1.36 $1.62
By-Product Credits (0.21) (0.20) (2.18) (0.89)
Treatment Charges 0.10 0.21 0.26 0.19
Royalties & Export Duties - 0.01 0.34 0.12
Unit Net Cash Costs (Credits) $1.68 $1.73 $(0.22) $1.04
Cash Unit Costs (Credits)
North America
2224 (1)(1)
Momm lbs
4Q17 4Q16
416
354
4Q17 4Q16
Cumm lbs
Indonesia (3)
352351
4Q17 4Q16
401
584
4Q17 4Q16
Au000 ozs
South America (2)
4Q17 4Q16
312359
4Q17 Unit Production Costs
Sales From Mines for 4Q17 & 4Q16 by Region
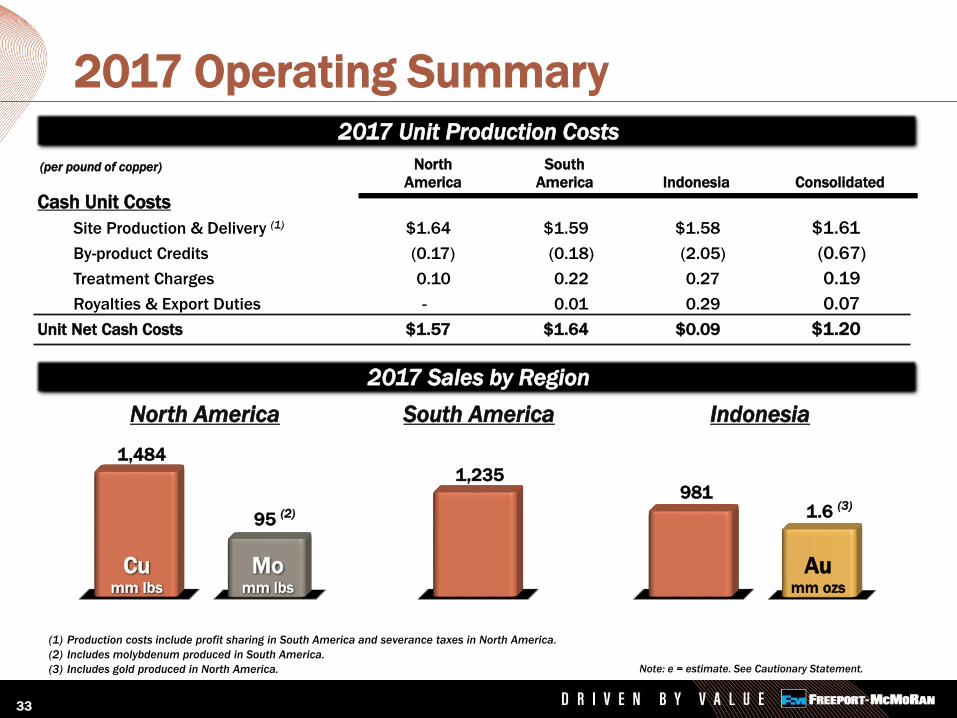
1,235
South America
95 (2)
Momm lbs
1,484
Cumm lbs
981
Indonesia
1.6 (3)
Aumm ozs
2017 Operating Summary
(1) Production costs include profit sharing in South America and severance taxes in North America.
(2) Includes molybdenum produced in South America.
(3) Includes gold produced in North America.
North America
(per pound of copper) North South
America America Indonesia Consolidated
Cash Unit Costs
Site Production & Delivery (1) $1.64 $1.59 $1.58 $1.61
By-product Credits (0.17) (0.18) (2.05) (0.67)
Treatment Charges 0.10 0.22 0.27 0.19
Royalties & Export Duties - 0.01 0.29 0.07
Unit Net Cash Costs $1.57 $1.64 $0.09 $1.20
2017 Unit Production Costs
Note: e = estimate. See Cautionary Statement.
2017 Sales by Region
33
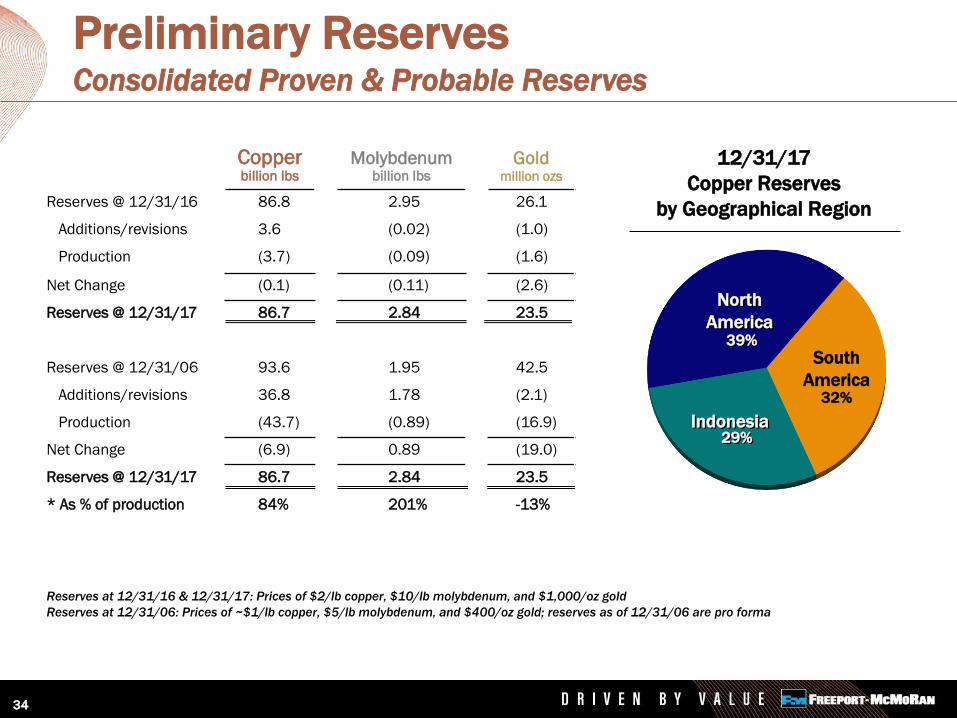
Preliminary ReservesConsolidated Proven & Probable Reserves
34
Reserves at 12/31/16 & 12/31/17: Prices of $2/lb copper, $10/lb molybdenum, and $1,000/oz gold
Reserves at 12/31/06: Prices of ~$1/lb copper, $5/lb molybdenum, and $400/oz gold; reserves as of 12/31/06 are pro forma
12/31/17
Copper Reserves
by Geographical Region
North
America
Indonesia29%
39%
South
America32%
Copperbillion lbs
Molybdenumbillion lbs
Goldmillion ozs
Reserves @ 12/31/16 86.8 2.95 26.1
Additions/revisions 3.6 (0.02) (1.0)
Production (3.7) (0.09) (1.6)
Net Change (0.1) (0.11) (2.6)
Reserves @ 12/31/17 86.7 2.84 23.5
Reserves @ 12/31/06 93.6 1.95 42.5
Additions/revisions 36.8 1.78 (2.1)
Production (43.7) (0.89) (16.9)
Net Change (6.9) 0.89 (19.0)
Reserves @ 12/31/17 86.7 2.84 23.5
* As % of production 84% 201% -13%
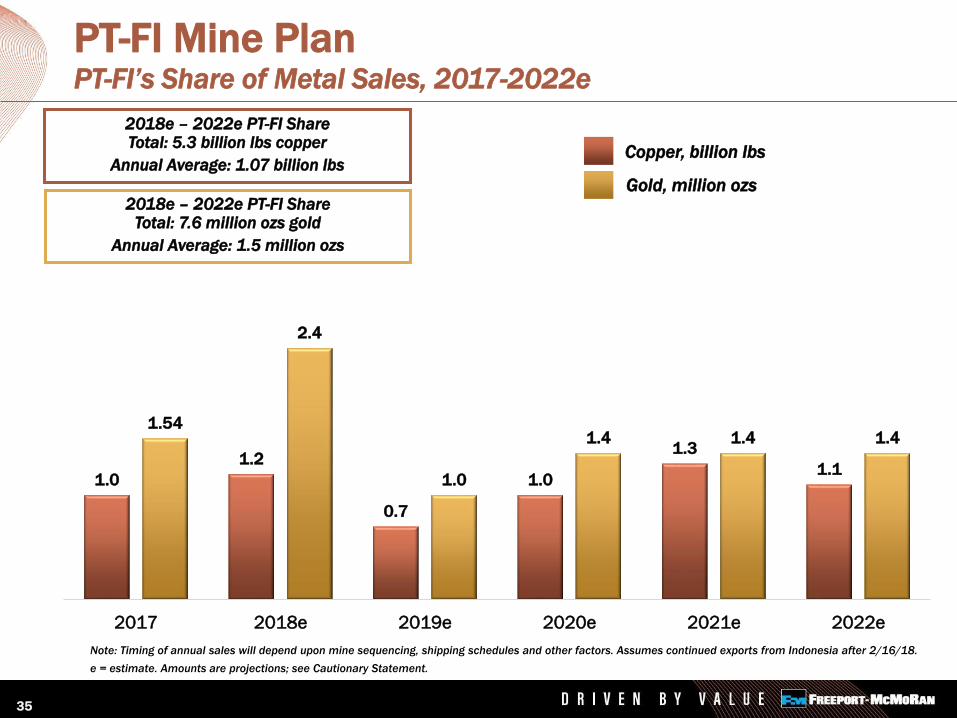
PT-FI Mine Plan PT-FI’s Share of Metal Sales, 2017-2022e
Copper, billion lbs
Gold, million ozs
2018e – 2022e PT-FI ShareTotal: 5.3 billion lbs copper
Annual Average: 1.07 billion lbs
2018e – 2022e PT-FI ShareTotal: 7.6 million ozs gold
Annual Average: 1.5 million ozs
Note: Timing of annual sales will depend upon mine sequencing, shipping schedules and other factors. Assumes continued exports from Indonesia after 2/16/18.
e = estimate. Amounts are projections; see Cautionary Statement.
35
1.0
1.2
0.7
1.0
1.3
1.1
1.54
2.4
1.0
1.4 1.4 1.4
2017 2018e 2019e 2020e 2021e 2022e
$0
$2
$4
$6
$8
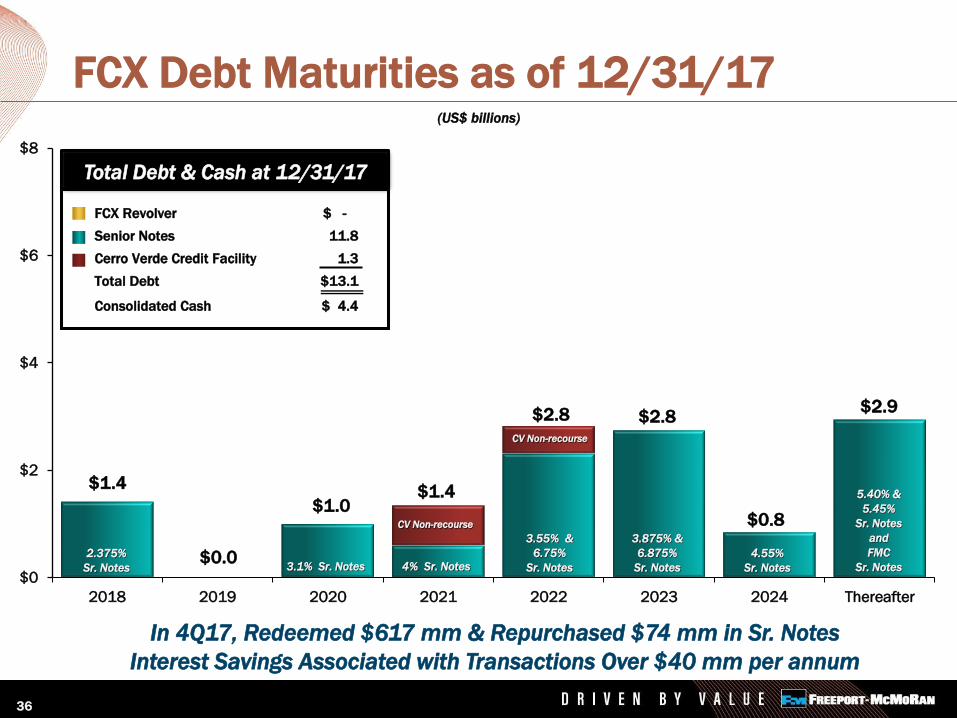
2018 2019 2020 2021 2022 2023 2024 Thereafter
FCX Debt Maturities as of 12/31/17
$1.4
$0.0
(US$ billions)
$1.4
$2.9
5.40% &
5.45%
Sr. Notes
and
FMC
Sr. Notes
$1.0
$2.8 $2.8
3.875% &
6.875%
Sr. Notes
3.55% &
6.75%
Sr. Notes4% Sr. Notes3.1% Sr. Notes2.375%
Sr. Notes
$0.8
4.55%
Sr. Notes
36
FCX Revolver $ -
Senior Notes 11.8
Cerro Verde Credit Facility 1.3
Total Debt $13.1
Consolidated Cash $ 4.4
Total Debt & Cash at 12/31/17
CV Non-recourse
CV Non-recourse
In 4Q17, Redeemed $617 mm & Repurchased $74 mm in Sr. Notes
Interest Savings Associated with Transactions Over $40 mm per annum
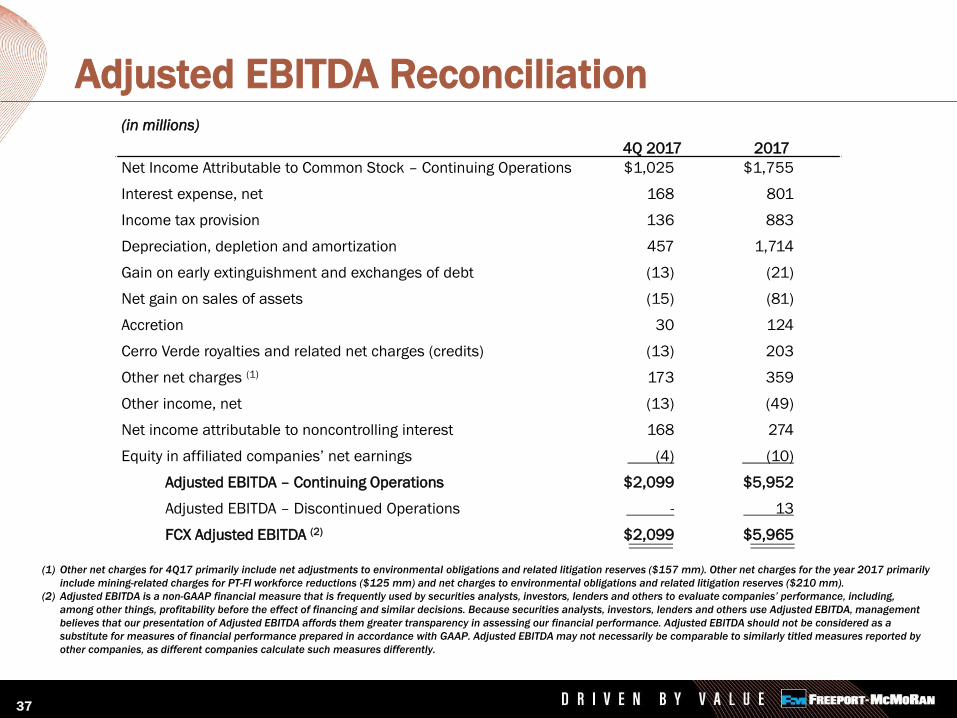
Adjusted EBITDA Reconciliation (in millions)
4Q 2017 2017
Net Income Attributable to Common Stock – Continuing Operations $1,025 $1,755
Interest expense, net 168 801
Income tax provision 136 883
Depreciation, depletion and amortization 457 1,714
Gain on early extinguishment and exchanges of debt (13) (21)
Net gain on sales of assets (15) (81)
Accretion 30 124
Cerro Verde royalties and related net charges (credits) (13) 203
Other net charges (1) 173 359
Other income, net (13) (49)
Net income attributable to noncontrolling interest 168 274
Equity in affiliated companies’ net earnings (4) (10)
Adjusted EBITDA – Continuing Operations $2,099 $5,952
Adjusted EBITDA – Discontinued Operations - 13
FCX Adjusted EBITDA (2) $2,099 $5,965
(1) Other net charges for 4Q17 primarily include net adjustments to environmental obligations and related litigation reserves ($157 mm). Other net charges for the year 2017 primarily
include mining-related charges for PT-FI workforce reductions ($125 mm) and net charges to environmental obligations and related litigation reserves ($210 mm).
(2) Adjusted EBITDA is a non-GAAP financial measure that is frequently used by securities analysts, investors, lenders and others to evaluate companies’ performance, including,
among other things, profitability before the effect of financing and similar decisions. Because securities analysts, investors, lenders and others use Adjusted EBITDA, management
believes that our presentation of Adjusted EBITDA affords them greater transparency in assessing our financial performance. Adjusted EBITDA should not be considered as a
substitute for measures of financial performance prepared in accordance with GAAP. Adjusted EBITDA may not necessarily be comparable to similarly titled measures reported by
other companies, as different companies calculate such measures differently.
37