Embed Size (px)
Citation preview
Grasim Industries Limited
A Cement and VSF Major
Performance Review
Q4FY10
20th May 2010
Statements in this “Presentation” describing the Company’s objectives, estimates, expectations or predictions maybe “forward looking statements” within the meaning of applicable securities laws and regulations. Actual resultscould differ materially from those expressed or implied. Important factors that could make a difference to theCompany’s operations include global and Indian demand supply conditions, finished goods prices, feedstockavailability and prices, cyclical demand and pricing in the Company’s principal markets, changes in Governmentregulations, tax regimes, economic developments within India and the countries within which the companyconducts business and other factors such as litigation and labour negotiations. The Company assumes noresponsibility to publicly amend, modify or revise any forward looking statement, on the basis of any subsequent
Cautionary Statement
2
responsibility to publicly amend, modify or revise any forward looking statement, on the basis of any subsequentdevelopment, information or events, or otherwise.
Highlights
Business Review
Financial Performance
Capex Plan
Summary
Contents
3
Summary
Highlights – Cement Restructuring
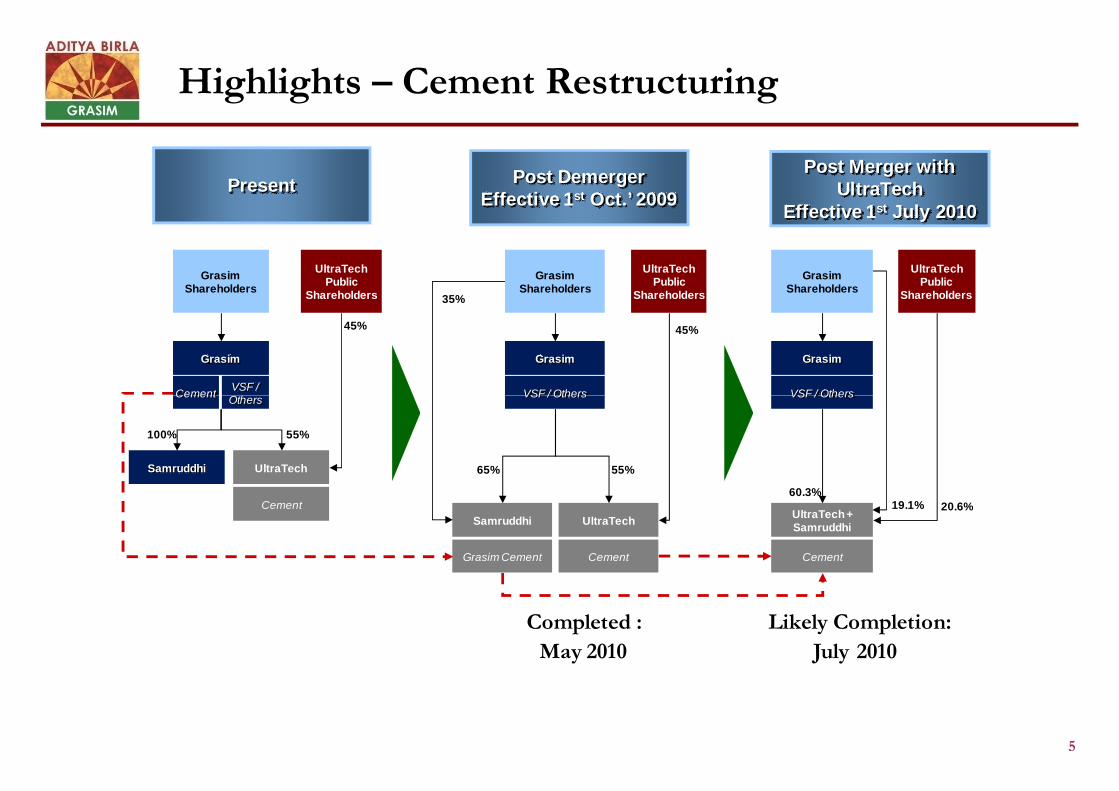
Demerger of Cement Business into Samruddhi Cement Ltd. (Samruddhi)
All necessary approvals received including sanction from M.P. and Gujarat High Courts
Scheme effective from appointed date of demerger i.e. 1st October, 2009
Grasim shareholders to get one equity share of Rs.5 each in Samruddhi for every equity
share of Rs.10 each held in the Company
Grasim will hold 65% equity stake in Samruddhi
Listing of Samruddhi expected by June 2010
4
Listing of Samruddhi expected by June 2010
Standalone results are recasted excluding cement business performance w.e.f. 1st Oct., 2009
Merger of Samruddhi into UltraTech
Sanction from High Courts is under process
Merger will be effective from 1st July, 2010 (Target completion - July, 2010)
UltraTech to issue 4 equity shares of Rs.10 each for every 7 equity shares of Rs.5 each held
in Samruddhi
Highlights – Cement Restructuring
Grasim
GrasimShareholders
UltraTechPublic
Shareholders
45%
Present
Grasim
35%
VSF / Others
UltraTechPublic
Shareholders
45%
GrasimShareholders
Post DemergerEffective 1st Oct.’ 2009
GrasimShareholders
Grasim
VSF / Others
UltraTechPublic
Shareholders
Post Merger withUltraTech
Effective 1st July 2010
CementVSF /Others
5
55%
Samruddhi
100%
UltraTech
Cement
UltraTech
55%65%
Samruddhi
VSF / Others
Grasim Cement Cement
VSF / Others
UltraTech+Samruddhi
Cement
19.1% 20.6%
60.3%
CementOthers
Completed : Likely Completion:
May 2010 July 2010
VSF
Greenfield VSF plant at Vilayat, Gujarat at an estimated investment of Rs.1,000 Crs.
Cement
3.1 Mn. Tons Grinding unit at Kotputli, Rajasthan now operational, total capacity
increased to 48.8 Mn. Tons
Venturing into International Business - acquisition of Star Cement by UltraTech
with a capacity of 3.0 Mn. Tons
Highlights – Growth Plans
6
with a capacity of 3.0 Mn. Tons
Cement grinding units in UAE, Bahrain and Bangladesh
Continued Focus to grow in India and Indian Ocean Rim
25 Mn. Tons new capacity required to maintain our market share in next 5 years
Alternative proposals under examination
Efforts are to start Brownfield expansions of 10 Mn. Tons by Q4FY11 after completing
the detailed study
Continued focus on achieving manufacturing and logistics cost savings
Propose to set up Waste Heat Recovery Systems across all cement plants
Propose to set up Bulk Terminals in key cement consuming centres
Highlights – Quarter 4
9.52
10.36
5
7
9
11
Q4/09 Q4/10
9%
Mn Ton
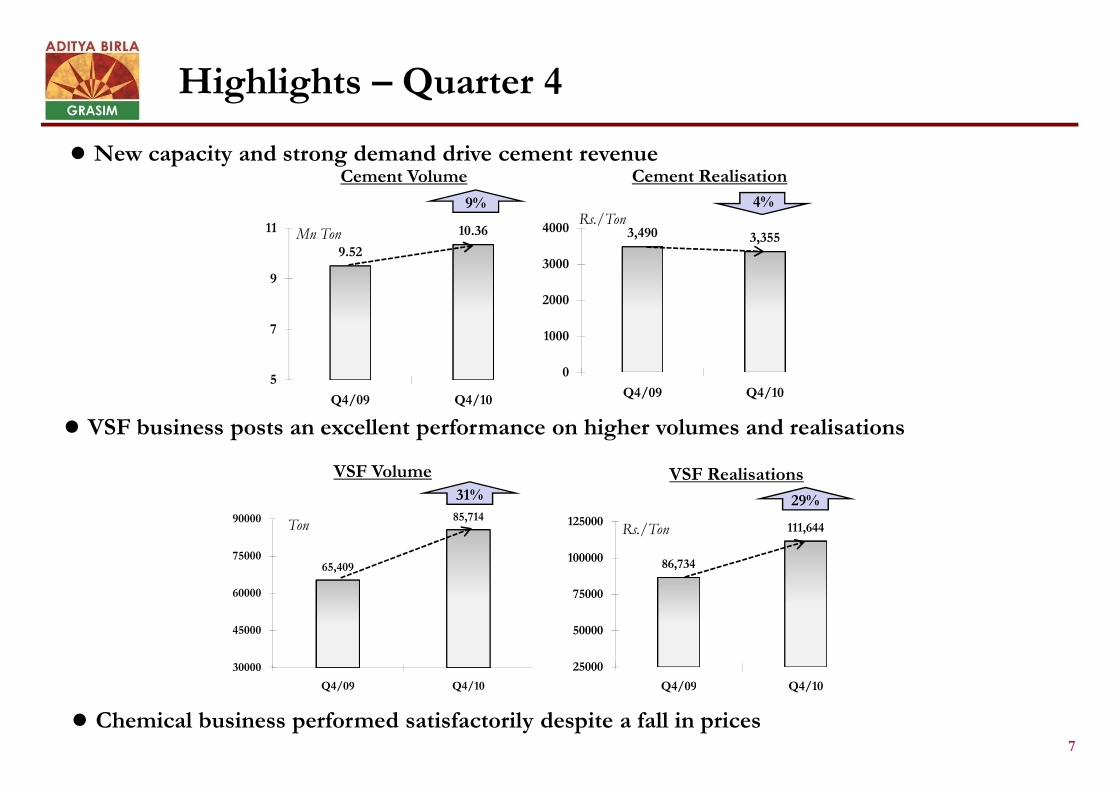
Cement Volume New capacity and strong demand drive cement revenue
3,490 3,355
0
1000
2000
3000
4000
Q4/09 Q4/10
Rs./Ton
Cement Realisation
4%
7
Chemical business performed satisfactorily despite a fall in prices
Q4/09 Q4/10
65,409
85,714
30000
45000
60000
75000
90000
Q4/09 Q4/10
31%
Ton
VSF Volume
VSF business posts an excellent performance on higher volumes and realisations
86,734
111,644
25000
50000
75000
100000
125000
Q4/09 Q4/10
VSF Realisations
29%
Q4/09 Q4/10
Rs./Ton
Business Review Cement
VSF
8
VSF
Chemicals
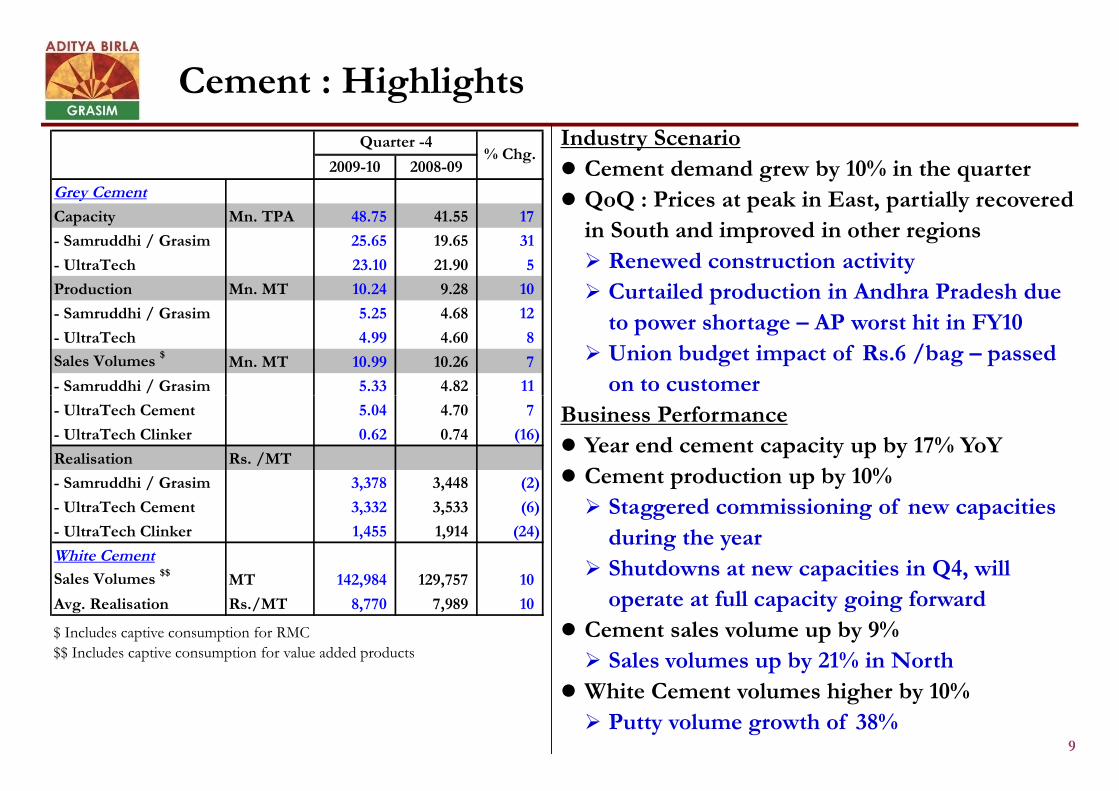
Industry Scenario
Cement demand grew by 10% in the quarter
QoQ : Prices at peak in East, partially recovered
in South and improved in other regions
Renewed construction activity
Curtailed production in Andhra Pradesh due
to power shortage – AP worst hit in FY10
Union budget impact of Rs.6 /bag – passed
on to customer
Cement : Highlights
2009-10 2008-09
Grey Cement
Capacity Mn. TPA 48.75 41.55 17
- Samruddhi / Grasim 25.65 19.65 31
- UltraTech 23.10 21.90 5
Production Mn. MT 10.24 9.28 10
- Samruddhi / Grasim 5.25 4.68 12
- UltraTech 4.99 4.60 8
Sales Volumes $Mn. MT 10.99 10.26 7
- Samruddhi / Grasim 5.33 4.82 11
Quarter -4% Chg.
9
on to customer
Business Performance
Year end cement capacity up by 17% YoY
Cement production up by 10%
Staggered commissioning of new capacities
during the year
Shutdowns at new capacities in Q4, will
operate at full capacity going forward
Cement sales volume up by 9%
Sales volumes up by 21% in North
White Cement volumes higher by 10%
Putty volume growth of 38%
$ Includes captive consumption for RMC
$$ Includes captive consumption for value added products
- UltraTech Cement 5.04 4.70 7
- UltraTech Clinker 0.62 0.74 (16)
Realisation Rs. /MT
- Samruddhi / Grasim 3,378 3,448 (2)
- UltraTech Cement 3,332 3,533 (6)
- UltraTech Clinker 1,455 1,914 (24)
White Cement
Sales Volumes $$MT 142,984 129,757 10
Avg. Realisation Rs./MT 8,770 7,989 10
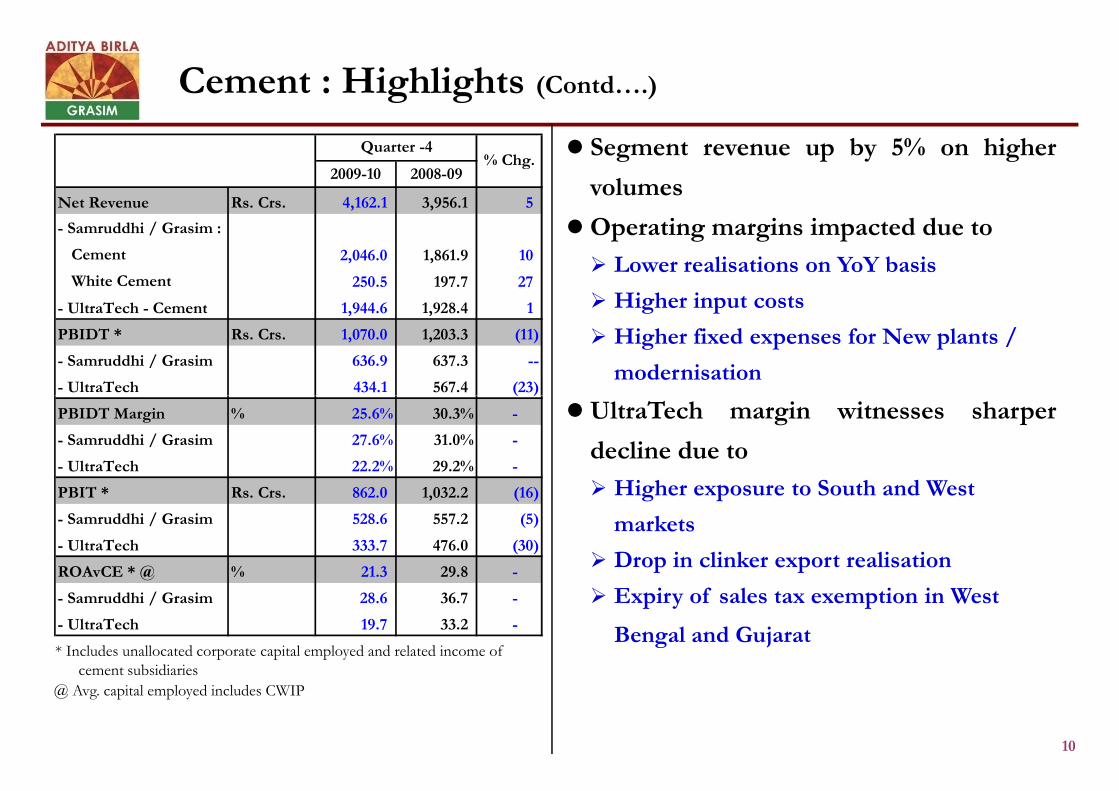
Cement : Highlights (Contd….)
Segment revenue up by 5% on higher
volumes
Operating margins impacted due to
Lower realisations on YoY basis
Higher input costs
Higher fixed expenses for New plants /
modernisation
2009-10 2008-09
Net Revenue Rs. Crs. 4,162.1 3,956.1 5
- Samruddhi / Grasim :
Cement 2,046.0 1,861.9 10
White Cement 250.5 197.7 27
- UltraTech - Cement 1,944.6 1,928.4 1
PBIDT * Rs. Crs. 1,070.0 1,203.3 (11)
- Samruddhi / Grasim 636.9 637.3 --
- UltraTech 434.1 567.4 (23)
Quarter -4% Chg.
10
UltraTech margin witnesses sharper
decline due to
Higher exposure to South and West
markets
Drop in clinker export realisation
Expiry of sales tax exemption in West
Bengal and Gujarat
@ Avg. capital employed includes CWIP
* Includes unallocated corporate capital employed and related income ofcement subsidiaries
- UltraTech 434.1 567.4 (23)
PBIDT Margin % 25.6% 30.3% -
- Samruddhi / Grasim 27.6% 31.0% -
- UltraTech 22.2% 29.2% -
PBIT * Rs. Crs. 862.0 1,032.2 (16)
- Samruddhi / Grasim 528.6 557.2 (5)
- UltraTech 333.7 476.0 (30)
ROAvCE * @ % 21.3 29.8 -
- Samruddhi / Grasim 28.6 36.7 -
- UltraTech 19.7 33.2 -
Cement demand expected to grow at 10% + for the next five years
Indian economy to continue on strong growth trajectory
Government initiatives to boost rural development, infrastructure and housing
Surplus scenario may emerge after peak demand in Quarter 1 which is expected to
last for the next 6-8 quarters
Higher coal prices may also exert pressure on margins
Business to focus on future growth plans, both organic & inorganic, while
Cement : Outlook
11
Business to focus on future growth plans, both organic & inorganic, while
consolidating gains from current capacity
Higher capacity utilisation of new plants to give additional volumes
Encash the benefits of the acquisition in Middle East, our international foray
Growth in India continues to remain a priority
Creating logistic infrastructure to improve efficiency and strengthen cost
competitiveness
Expanding UltraTech Building Solutions network to strengthen brand image
Viscose Staple Fibre : Highlights
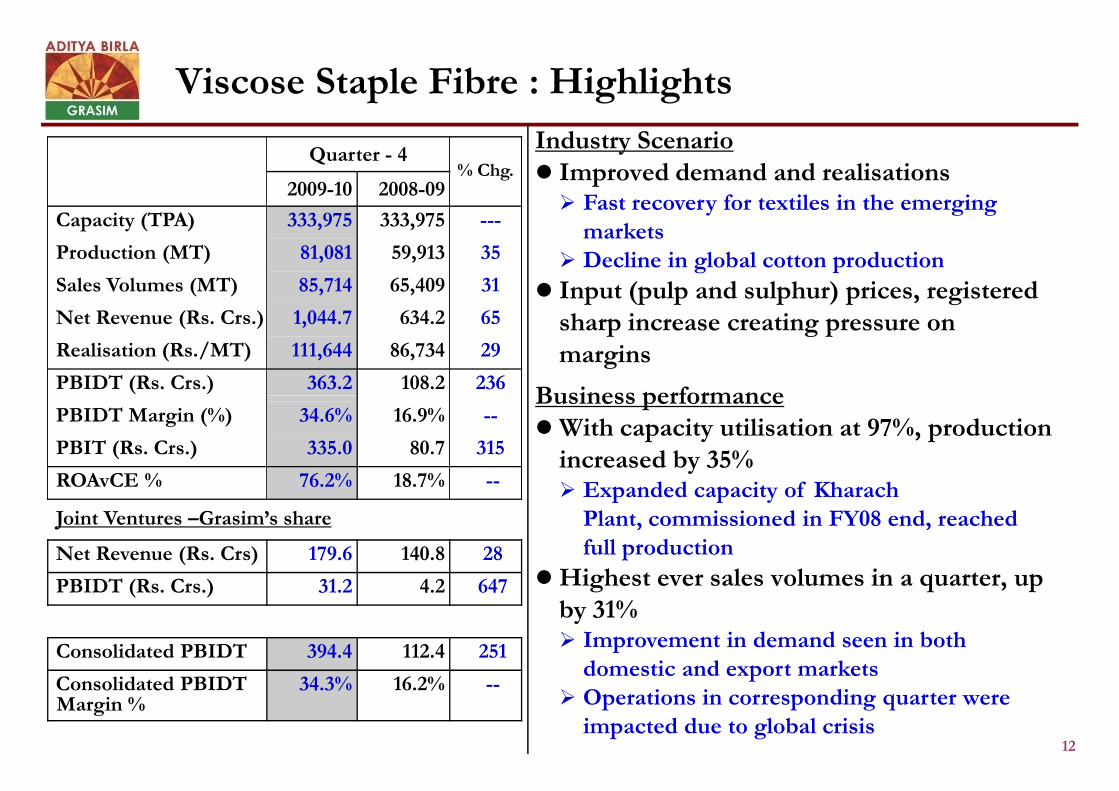
Industry Scenario Improved demand and realisations Fast recovery for textiles in the emerging
markets Decline in global cotton production
Input (pulp and sulphur) prices, registeredsharp increase creating pressure onmargins
Business performance
Quarter - 4% Chg.
2009-10 2008-09
Capacity (TPA) 333,975 333,975 ---
Production (MT) 81,081 59,913 35
Sales Volumes (MT) 85,714 65,409 31
Net Revenue (Rs. Crs.) 1,044.7 634.2 65
Realisation (Rs./MT) 111,644 86,734 29
PBIDT (Rs. Crs.) 363.2 108.2 236
12
Business performanceWith capacity utilisation at 97%, production
increased by 35% Expanded capacity of Kharach
Plant, commissioned in FY08 end, reachedfull production
Highest ever sales volumes in a quarter, upby 31% Improvement in demand seen in both
domestic and export markets Operations in corresponding quarter were
impacted due to global crisis
PBIDT Margin (%) 34.6% 16.9% --
PBIT (Rs. Crs.) 335.0 80.7 315
ROAvCE % 76.2% 18.7% --
Joint Ventures –Grasim’s share
Net Revenue (Rs. Crs) 179.6 140.8 28
PBIDT (Rs. Crs.) 31.2 4.2 647
Consolidated PBIDT 394.4 112.4 251
Consolidated PBIDTMargin %
34.3% 16.2% --
Viscose Staple Fibre : Highlights (Contd….)
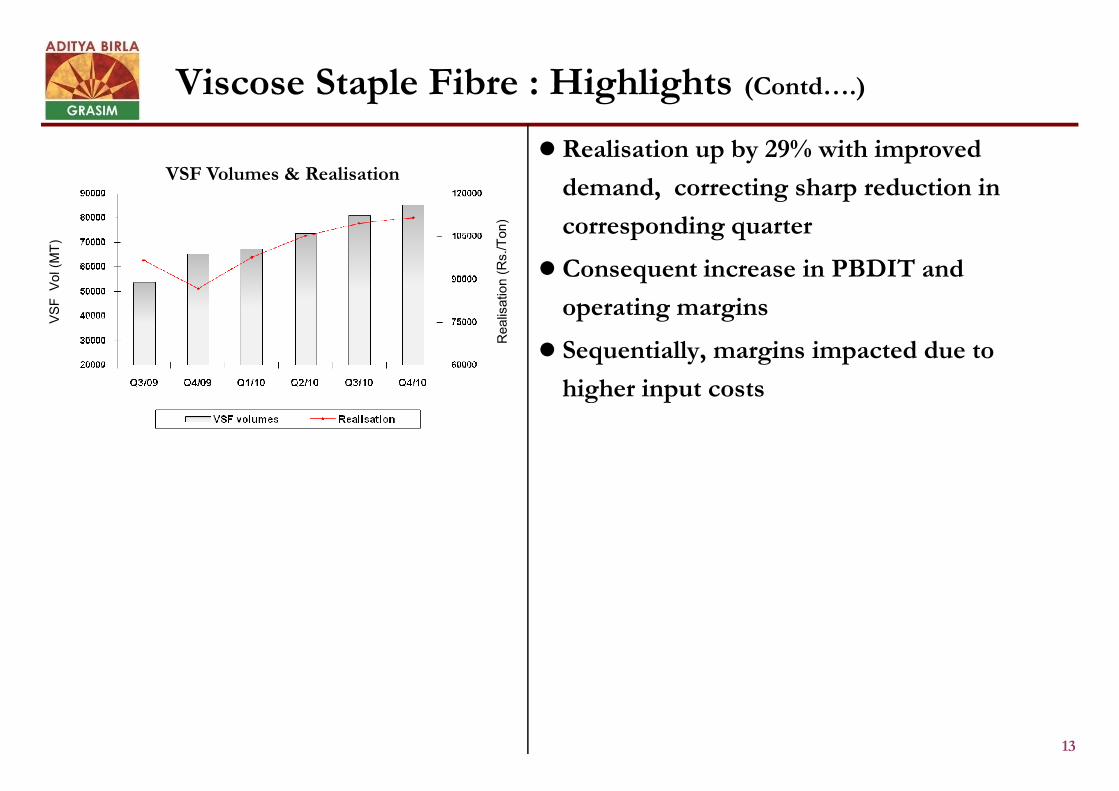
Realisation up by 29% with improved
demand, correcting sharp reduction in
corresponding quarter
Consequent increase in PBDIT and
operating margins
Sequentially, margins impacted due to
higher input costs
VSF Volumes & Realisation
13
higher input costs
Viscose Staple Fibre : Outlook
Demand outlook expected to be stable in the short to medium term
Risk of substitution due to high VSF prices
Margins likely to decline from current level
Upward trend in pulp, sulphur and energy costs
Large capacity expansions in China
Production at Nagda plant likely to be effected in Q1FY11 due to water shortage
All efforts being made to avoid / minimise the stoppage
14
All efforts being made to avoid / minimise the stoppage
Greenfield VSF plant to be set up at Vilayat, Gujarat at an estimated investment of
Rs.1,000 Crs.
Commercial production expected to commence in FY13
Chinese JV capacity to double from 35,000 TPA to 70,000 TPA by end of Q1FY11
Continued focus on debottlenecking of existing capacities and cost reduction
opportunities through integration across the value chain
Market Enlargement and increasing share of Specialty fibres continue to get sharper
focus
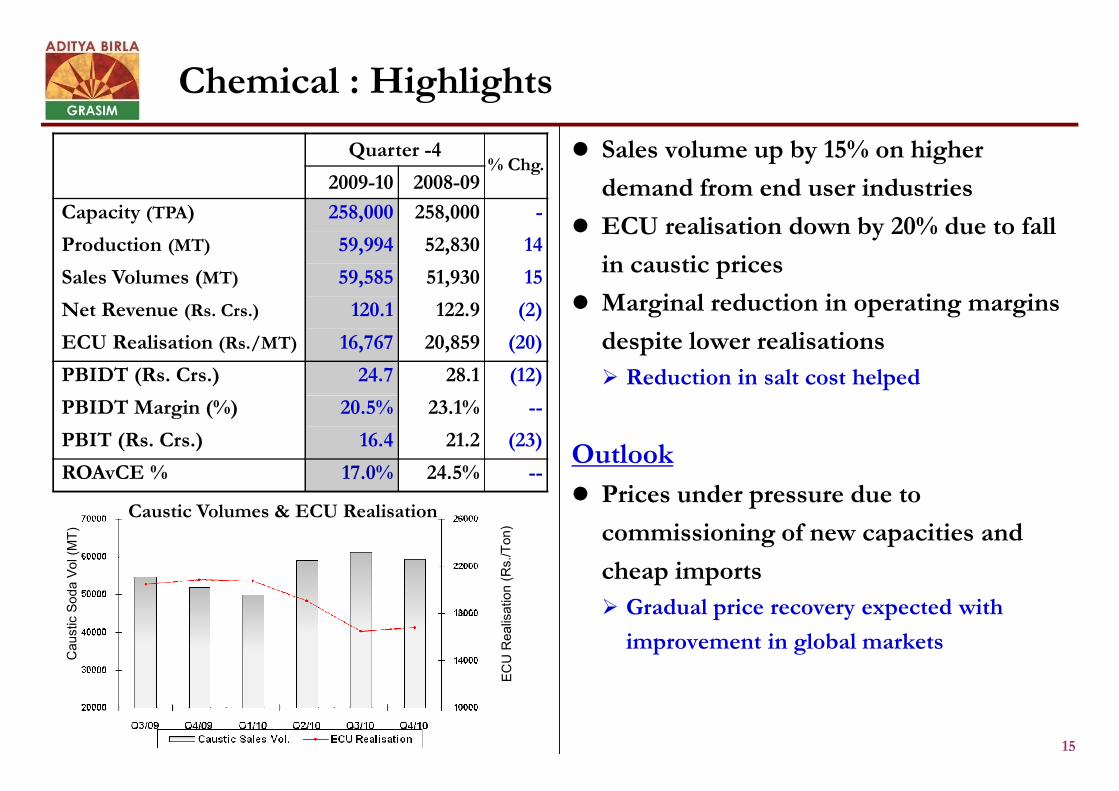
Chemical : Highlights
Sales volume up by 15% on higher
demand from end user industries
ECU realisation down by 20% due to fall
in caustic prices
Marginal reduction in operating margins
despite lower realisations
Reduction in salt cost helped
Quarter -4% Chg.
2009-10 2008-09
Capacity (TPA) 258,000 258,000 -
Production (MT) 59,994 52,830 14
Sales Volumes (MT) 59,585 51,930 15
Net Revenue (Rs. Crs.) 120.1 122.9 (2)
ECU Realisation (Rs./MT) 16,767 20,859 (20)
PBIDT (Rs. Crs.) 24.7 28.1 (12)
15
Outlook
Prices under pressure due to
commissioning of new capacities and
cheap imports
Gradual price recovery expected with
improvement in global markets
PBIDT Margin (%) 20.5% 23.1% --
PBIT (Rs. Crs.) 16.4 21.2 (23)
ROAvCE % 17.0% 24.5% --
Caustic Volumes & ECU Realisation
Financial Performance
16
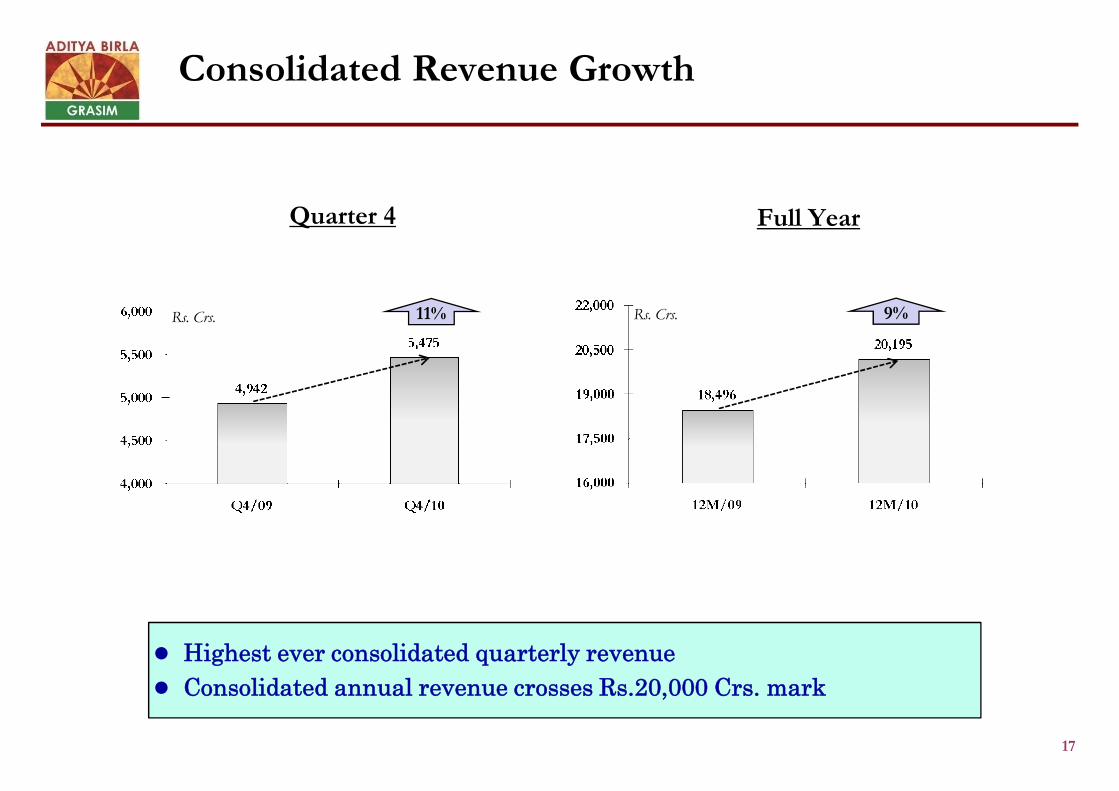
Quarter 4
11%
Consolidated Revenue Growth
Full Year
Rs. Crs. 9%Rs. Crs.
17
Highest ever consolidated quarterly revenue
Consolidated annual revenue crosses Rs.20,000 Crs. mark
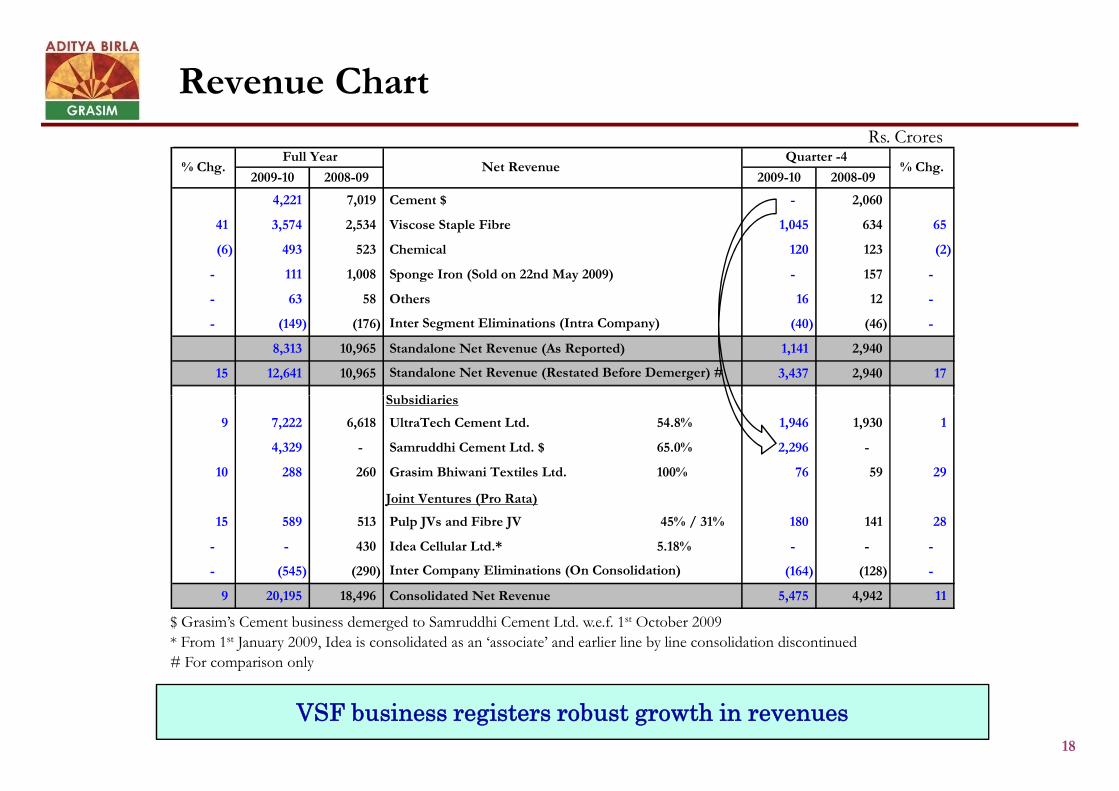
2009-10 2008-09 2009-10 2008-09
4,221 7,019 Cement $ - 2,060
41 3,574 2,534 Viscose Staple Fibre 1,045 634 65
(6) 493 523 Chemical 120 123 (2)
- 111 1,008 Sponge Iron (Sold on 22nd May 2009) - 157 -
- 63 58 Others 16 12 -
- (149) (176) (40) (46) -
8,313 10,965 Standalone Net Revenue (As Reported) 1,141 2,940
15 12,641 10,965 3,437 2,940 17
Subsidiaries
Quarter -4% Chg.
Inter Segment Eliminations (Intra Company)
Standalone Net Revenue (Restated Before Demerger) #
% Chg.Full Year
Net Revenue
Revenue ChartRs. Crores
18
Subsidiaries
9 7,222 6,618 UltraTech Cement Ltd. 54.8% 1,946 1,930 1
4,329 - Samruddhi Cement Ltd. $ 65.0% 2,296 -
10 288 260 Grasim Bhiwani Textiles Ltd. 100% 76 59 29
Joint Ventures (Pro Rata)
15 589 513 Pulp JVs and Fibre JV 45% / 31% 180 141 28
- - 430 Idea Cellular Ltd.* 5.18% - - -
- (545) (290) (164) (128) -
9 20,195 18,496 Consolidated Net Revenue 5,475 4,942 11
Inter Company Eliminations (On Consolidation)
$ Grasim’s Cement business demerged to Samruddhi Cement Ltd. w.e.f. 1st October 2009
* From 1st January 2009, Idea is consolidated as an ‘associate’ and earlier line by line consolidation discontinued
# For comparison only
VSF business registers robust growth in revenues
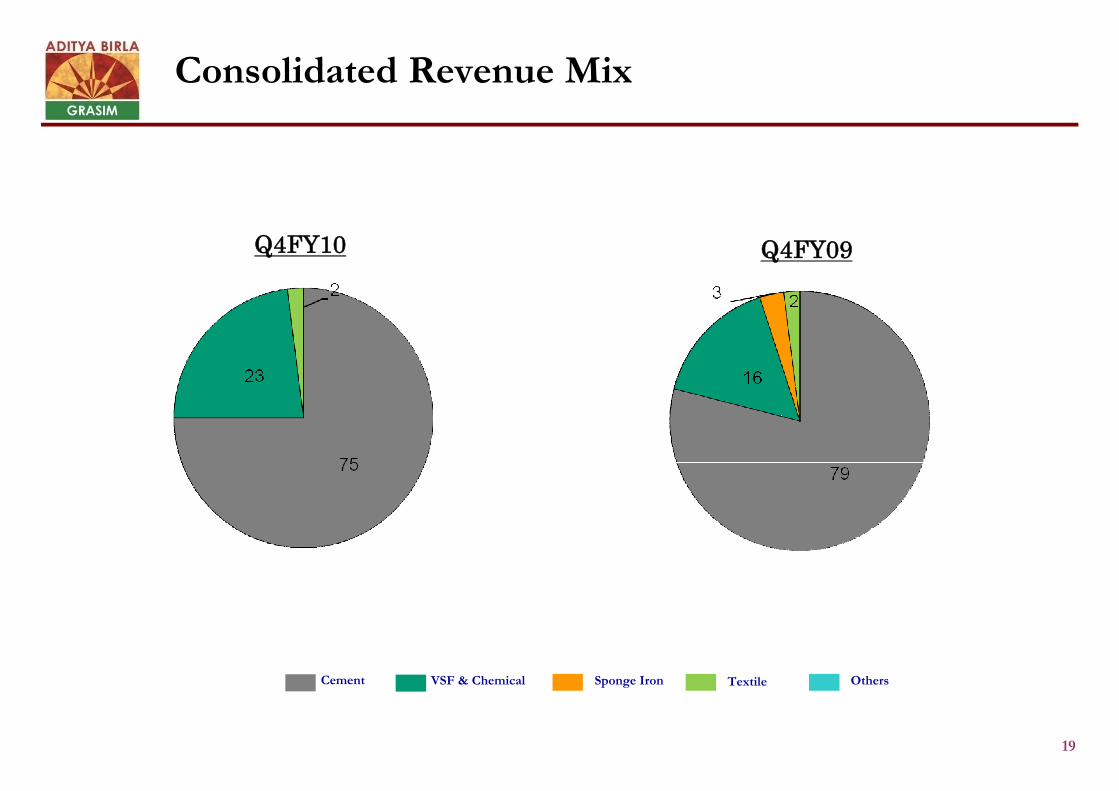
Consolidated Revenue Mix
Q4FY10 Q4FY09
19
Cement VSF & Chemical Sponge Iron OthersTextile
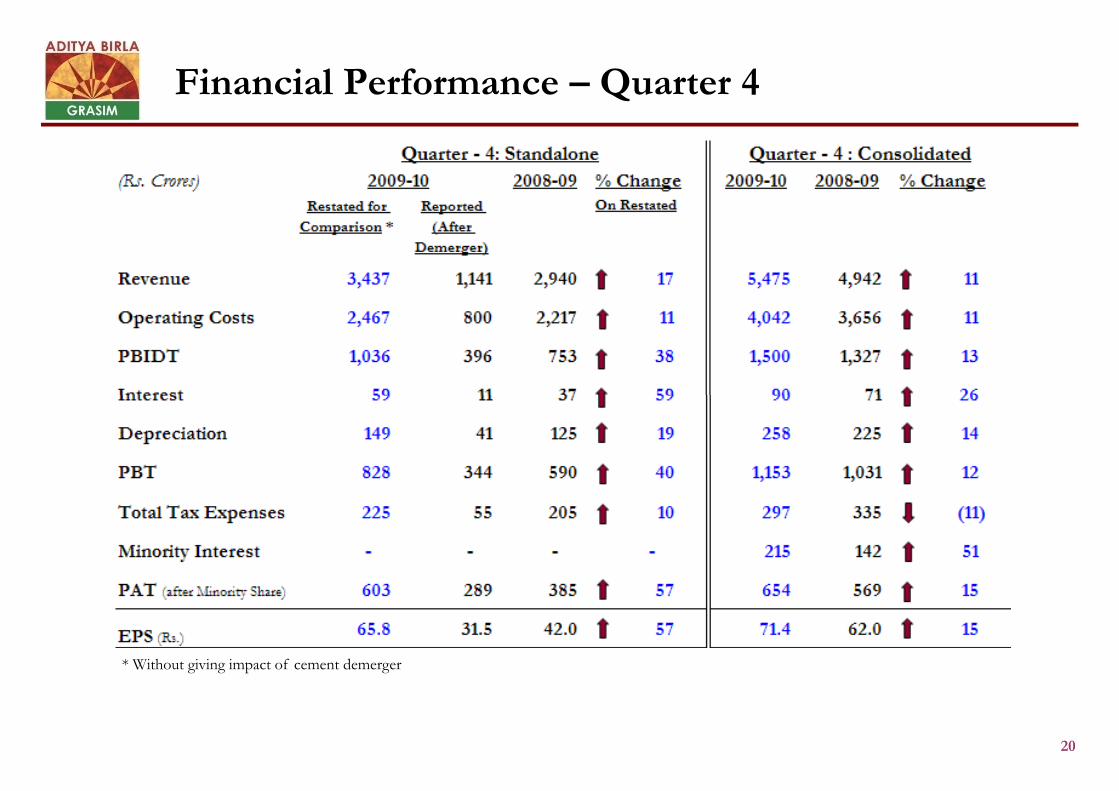
Financial Performance – Quarter 4
20
* Without giving impact of cement demerger
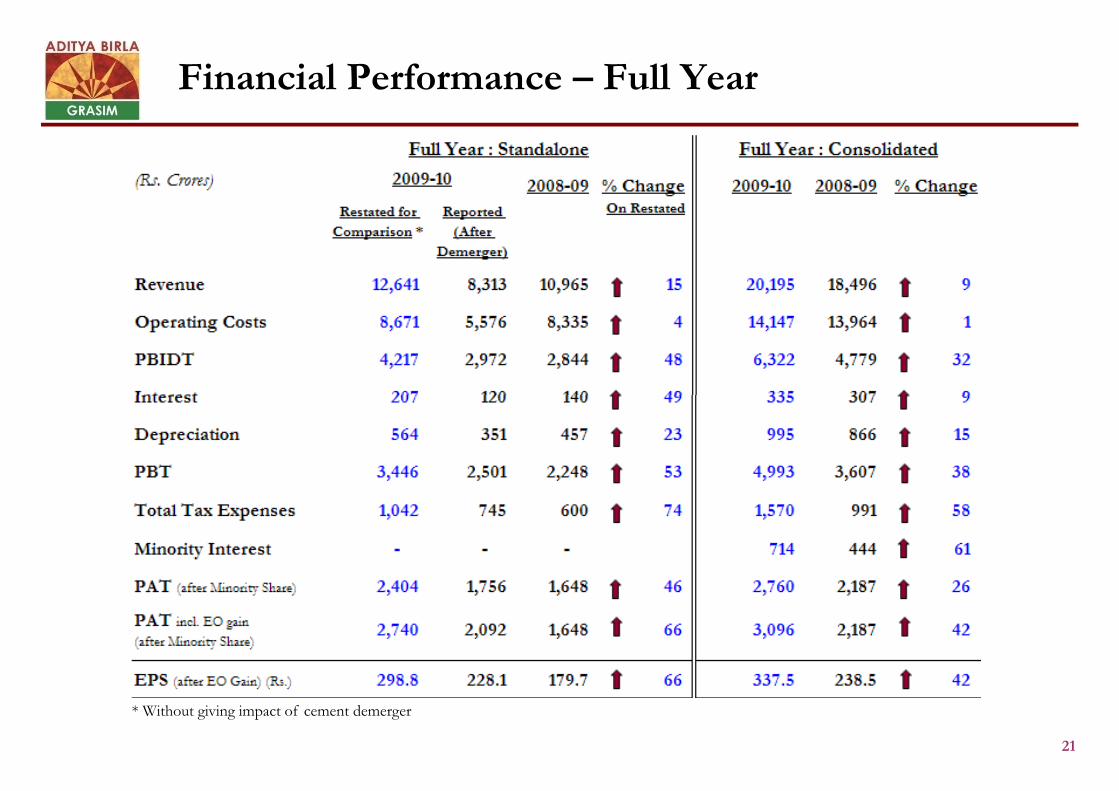
Financial Performance – Full Year
21
* Without giving impact of cement demerger
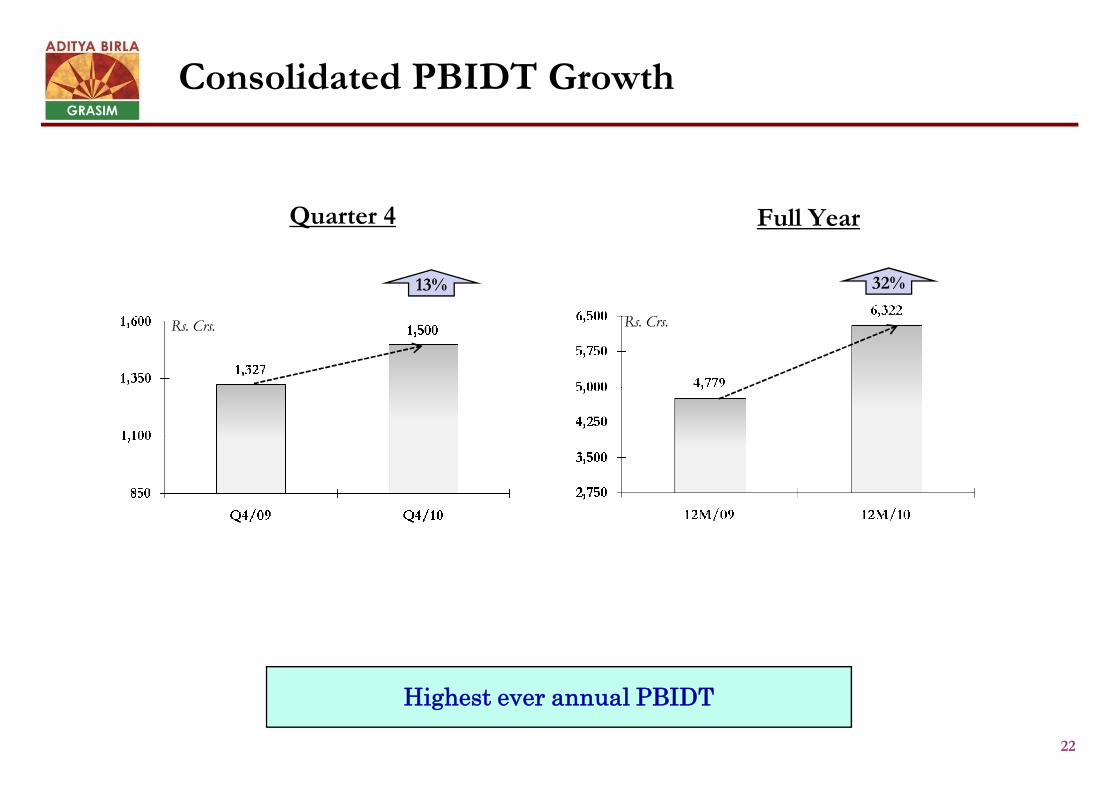
Quarter 4
13%
Consolidated PBIDT Growth
Full Year
32%
Rs. Crs.Rs. Crs.
22
Highest ever annual PBIDT
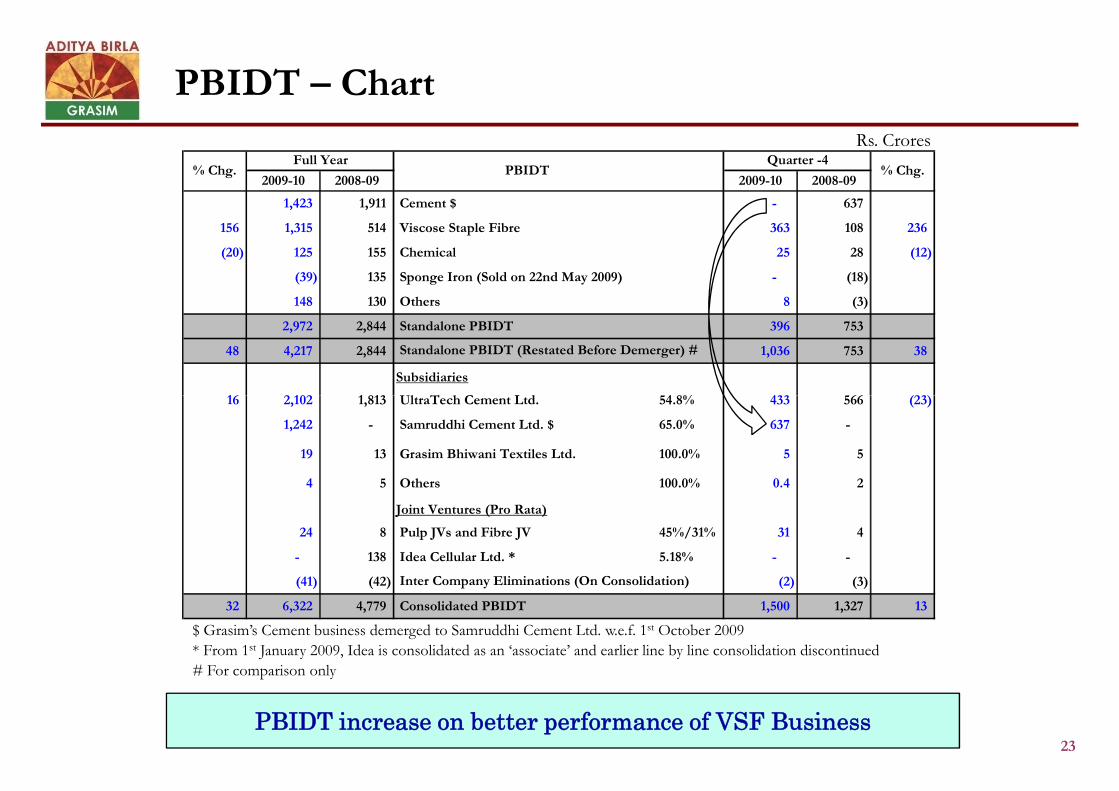
2009-10 2008-09 2009-10 2008-09
1,423 1,911 Cement $ - 637
156 1,315 514 Viscose Staple Fibre 363 108 236
(20) 125 155 Chemical 25 28 (12)
(39) 135 Sponge Iron (Sold on 22nd May 2009) - (18)
148 130 Others 8 (3)
2,972 2,844 Standalone PBIDT 396 753
48 4,217 2,844 1,036 753 38
Subsidiaries
16 2,102 1,813 UltraTech Cement Ltd. 54.8% 433 566 (23)
% Chg.
Standalone PBIDT (Restated Before Demerger) #
% Chg.Full Year
PBIDTQuarter -4
PBIDT – Chart
Rs. Crores
23
16 2,102 1,813 UltraTech Cement Ltd. 54.8% 433 566 (23)
1,242 - Samruddhi Cement Ltd. $ 65.0% 637 -
19 13 Grasim Bhiwani Textiles Ltd. 100.0% 5 5
4 5 Others 100.0% 0.4 2
Joint Ventures (Pro Rata)
24 8 Pulp JVs and Fibre JV 45%/31% 31 4
- 138 Idea Cellular Ltd. * 5.18% - -
(41) (42) (2) (3)
32 6,322 4,779 Consolidated PBIDT 1,500 1,327 13
Inter Company Eliminations (On Consolidation)
PBIDT increase on better performance of VSF Business
$ Grasim’s Cement business demerged to Samruddhi Cement Ltd. w.e.f. 1st October 2009
* From 1st January 2009, Idea is consolidated as an ‘associate’ and earlier line by line consolidation discontinued
# For comparison only
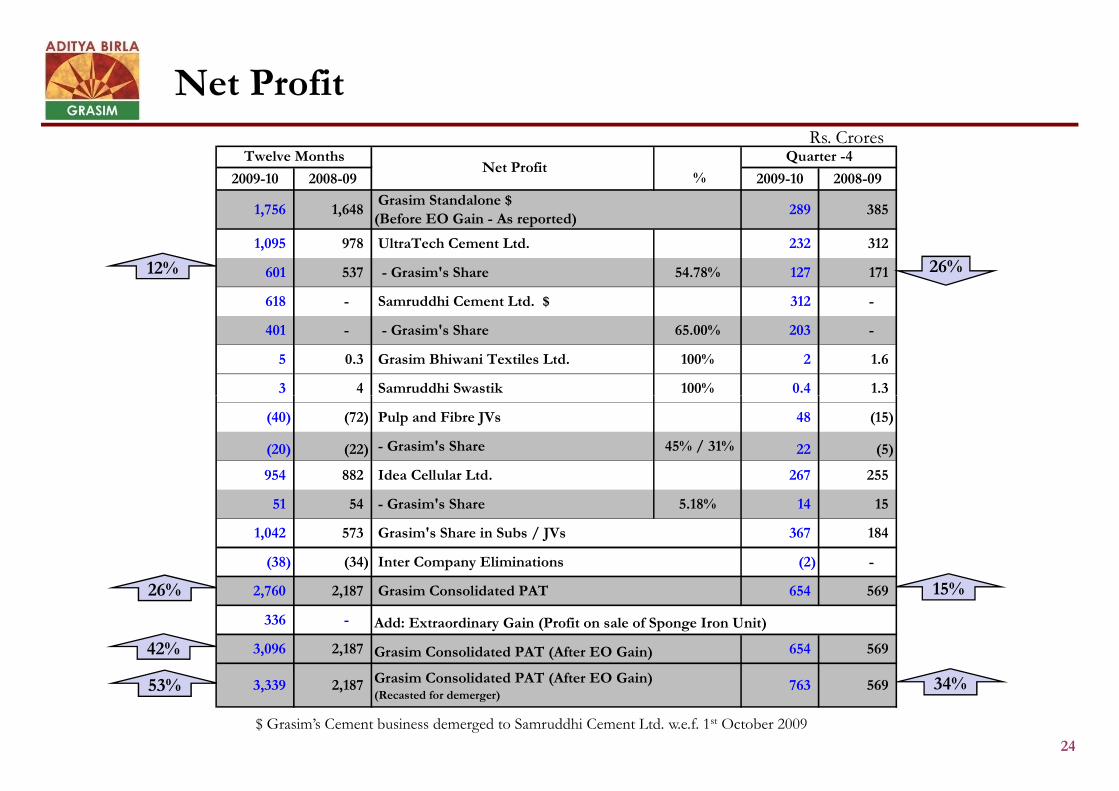
Net ProfitRs. Crores
12%
2009-10 2008-09 2009-10 2008-09
1,756 1,648Grasim Standalone $
(Before EO Gain - As reported)289 385
1,095 978 UltraTech Cement Ltd. 232 312
601 537 - Grasim's Share 54.78% 127 171
618 - Samruddhi Cement Ltd. $ 312 -
401 - - Grasim's Share 65.00% 203 -
5 0.3 Grasim Bhiwani Textiles Ltd. 100% 2 1.6
3 4 Samruddhi Swastik 100% 0.4 1.3
Twelve MonthsNet Profit
%
Quarter -4
26%
24
26%
42%
15%
$ Grasim’s Cement business demerged to Samruddhi Cement Ltd. w.e.f. 1st October 2009
53% 34%
3 4 Samruddhi Swastik 100% 0.4 1.3
(40) (72) Pulp and Fibre JVs 48 (15)
(20) (22) - Grasim's Share 45% / 31% 22 (5)
954 882 Idea Cellular Ltd. 267 255
51 54 - Grasim's Share 5.18% 14 15
1,042 573 Grasim's Share in Subs / JVs 367 184
(38) (34) Inter Company Eliminations (2) -
2,760 2,187 Grasim Consolidated PAT 654 569
336 - Add: Extraordinary Gain (Profit on sale of Sponge Iron Unit)
3,096 2,187 Grasim Consolidated PAT (After EO Gain) 654 569
3,339 2,187 763 569Grasim Consolidated PAT (After EO Gain)(Recasted for demerger)
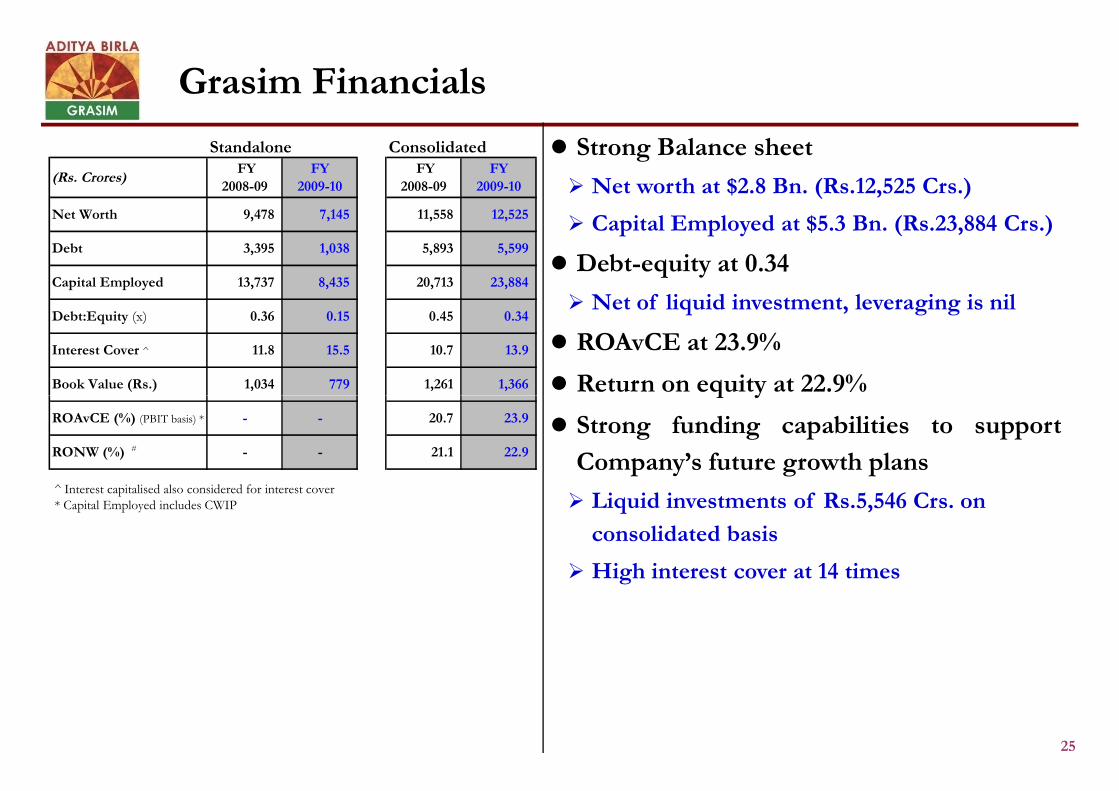
Grasim Financials
Strong Balance sheet
Net worth at $2.8 Bn. (Rs.12,525 Crs.)
Capital Employed at $5.3 Bn. (Rs.23,884 Crs.)
Debt-equity at 0.34
Net of liquid investment, leveraging is nil
ROAvCE at 23.9%
Return on equity at 22.9%
Standalone Consolidated
(Rs. Crores)FY
2008-09FY
2009-10FY
2008-09FY
2009-10
Net Worth 9,478 7,145 11,558 12,525
Debt 3,395 1,038 5,893 5,599
Capital Employed 13,737 8,435 20,713 23,884
Debt:Equity (x) 0.36 0.15 0.45 0.34
Interest Cover ^ 11.8 15.5 10.7 13.9
Book Value (Rs.) 1,034 779 1,261 1,366
25
^ Interest capitalised also considered for interest cover* Capital Employed includes CWIP
Return on equity at 22.9%
Strong funding capabilities to support
Company’s future growth plans
Liquid investments of Rs.5,546 Crs. on
consolidated basis
High interest cover at 14 times
ROAvCE (%) (PBIT basis) * - - 20.7 23.9
RONW (%) # - - 21.1 22.9
Capex
26
Capex
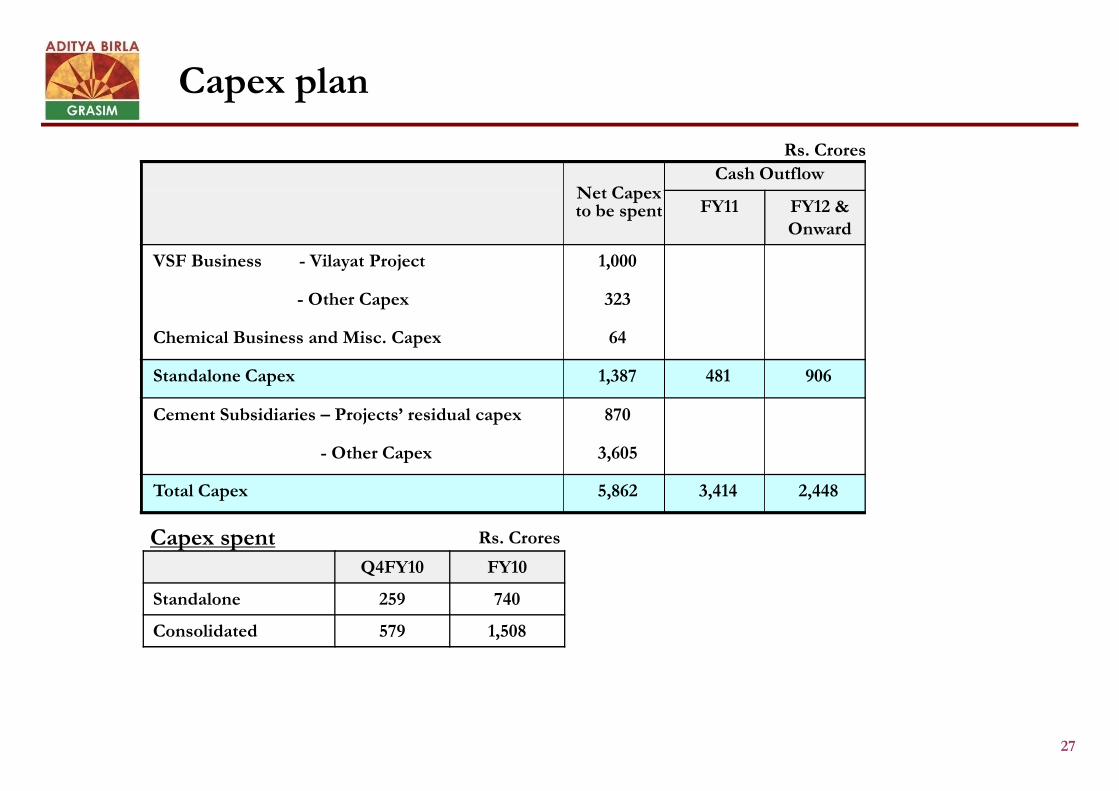
Capex plan
Rs. Crores
Net Capexto be spent
Cash Outflow
FY11 FY12 &Onward
VSF Business - Vilayat Project 1,000
- Other Capex 323
Chemical Business and Misc. Capex 64
Standalone Capex 1,387 481 906
27
Cement Subsidiaries – Projects’ residual capex 870
- Other Capex 3,605
Total Capex 5,862 3,414 2,448
Q4FY10 FY10
Standalone 259 740
Consolidated 579 1,508
Capex spent Rs. Crores
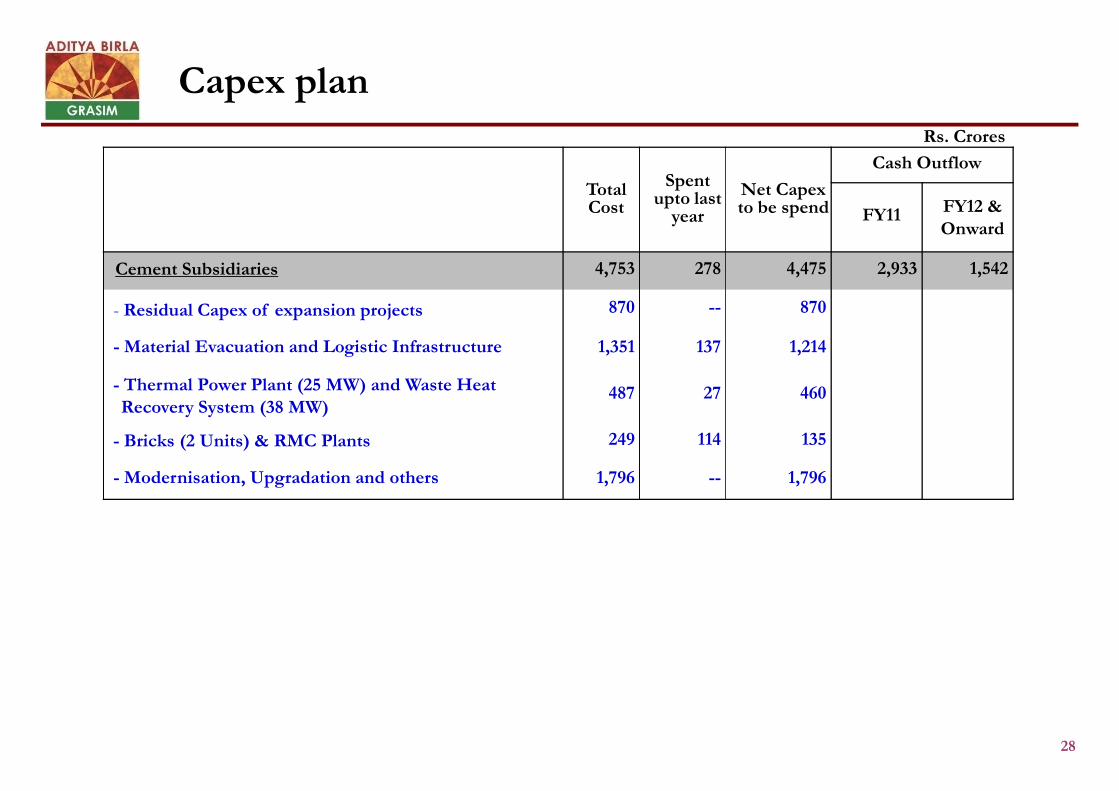
Capex planRs. Crores
TotalCost
Spentupto last
year
Net Capexto be spend
Cash Outflow
FY11 FY12 &Onward
Cement Subsidiaries 4,753 278 4,475 2,933 1,542
- Residual Capex of expansion projects 870 -- 870
- Material Evacuation and Logistic Infrastructure 1,351 137 1,214
- Thermal Power Plant (25 MW) and Waste Heat 487 27 460
28
Recovery System (38 MW)487 27 460
- Bricks (2 Units) & RMC Plants 249 114 135
- Modernisation, Upgradation and others 1,796 -- 1,796

Summary
29
Summary
Summary
Grasim – A Cement and VSF major
Leadership position in both the flagship businesses
Strong competitive edge
Global size operations
Leading global player in VSF
Integrated business model from plantation to fibre
Continued focus on increasing capacities and creating differentiation
30
Domestic leadership in Cement
Platform for accelerated future growth being created thru’ business restructuring
Aim to grow faster than the market
Leveraging investments in capacity, TPPs and other infrastructure for sustained volume and
cost leadership
Businesses on the cusp of the next phase of growth to consolidate leadership position
Strong balance sheet to support the ambitious growth plans
On Restructuring, Cement business will be consolidated in a pure play company
Grasim at consolidated level will continue to be Cement and VSF major as before
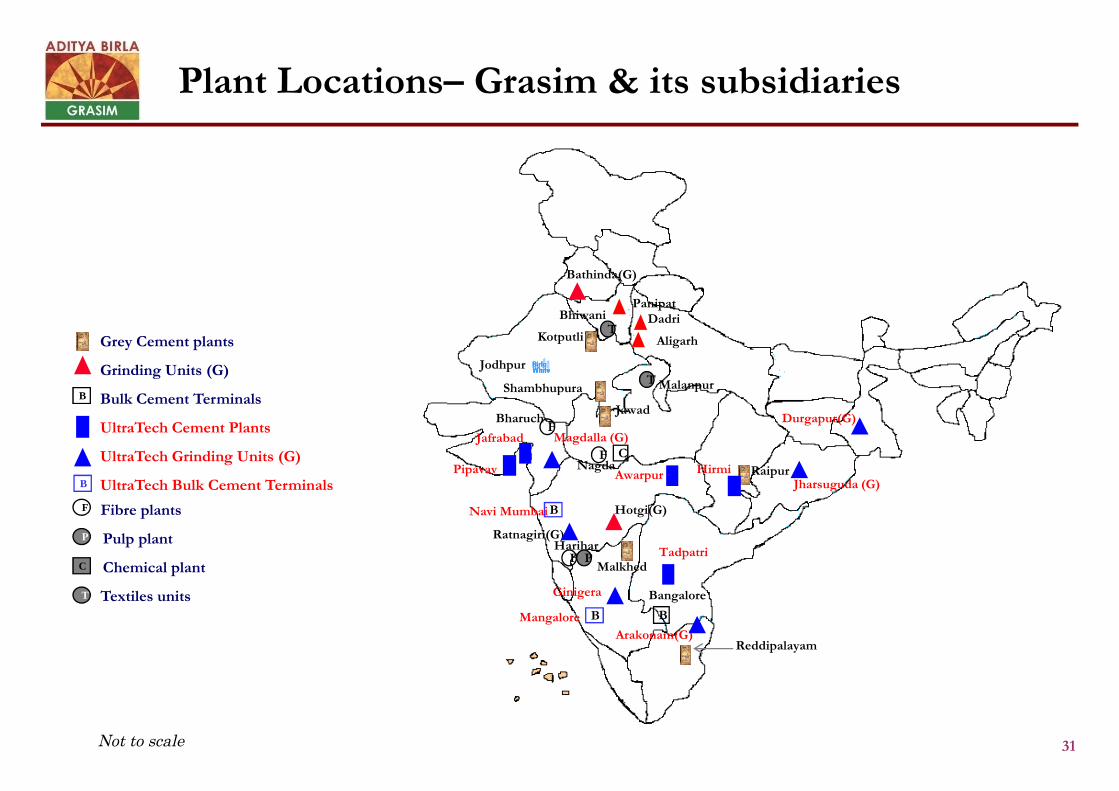
Grey Cement plants
Grinding Units (G)
Bulk Cement TerminalsB
Plant Locations– Grasim & its subsidiaries
Shambhupura
Jodhpur
Bathinda(G)
BhiwaniT
Kotputli
DadriPanipat
T Malanpur
Aligarh
31
Bulk Cement Terminals
UltraTech Cement Plants
UltraTech Grinding Units (G)
UltraTech Bulk Cement Terminals
Fibre plants
Pulp plant
Chemical plant
Textiles units
Not to scale
T
F
P
B
C
B
Shambhupura
Jawad
Raipur
Malkhed
Reddipalayam
Bangalore
Hotgi(G)
B
Pipavav
Jafrabad Magdalla (G)
Awarpur HirmiJharsuguda (G)
Durgapur(G)
Tadpatri
Arakonam(G)
Ratnagiri(G)
BNavi Mumbai
BMangalore
BharuchF
NagdaF C
HariharF P
Ginigera
Grasim Industries Limited
Annexure
Annexure
Consolidated Financial Performance
Standalone Financial Performance
Consolidated and Standalone Financial
Consolidated and Standalone Profitability
Businesswise Performance
Cement Summary
VSF Summary
34
VSF Summary
Chemical Summary
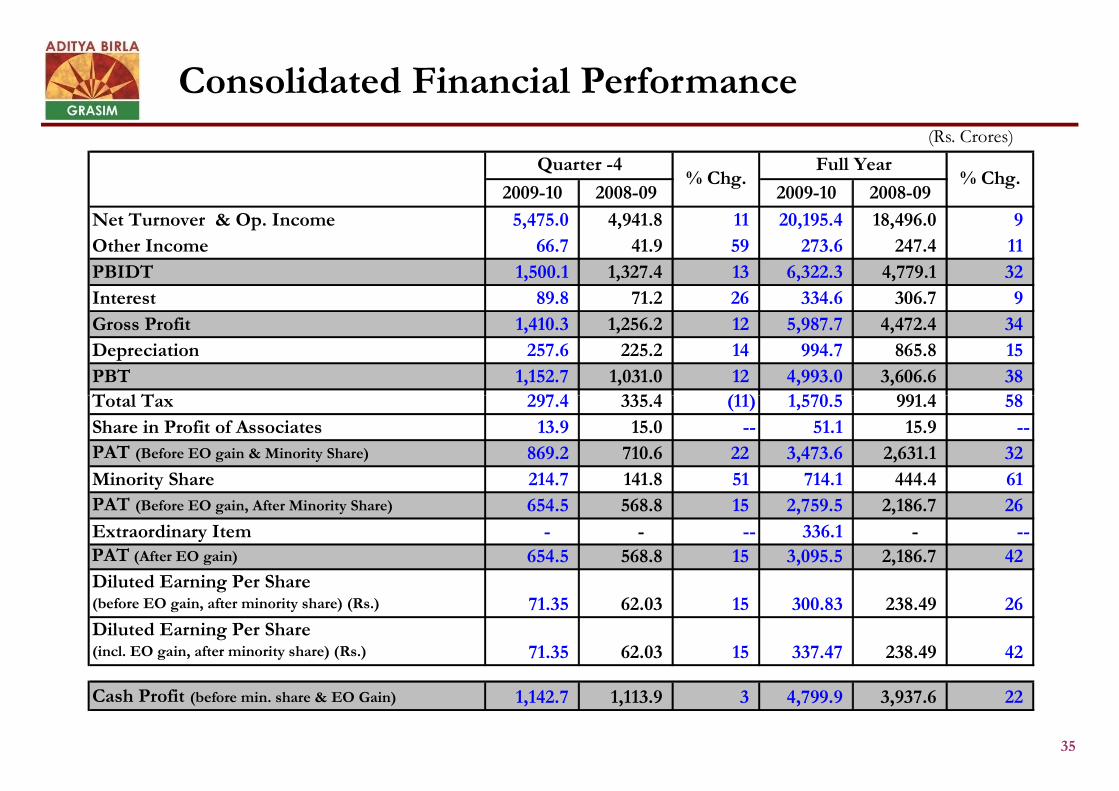
Consolidated Financial Performance(Rs. Crores)
2009-10 2008-09 2009-10 2008-09
Net Turnover & Op. Income 5,475.0 4,941.8 11 20,195.4 18,496.0 9
Other Income 66.7 41.9 59 273.6 247.4 11
PBIDT 1,500.1 1,327.4 13 6,322.3 4,779.1 32
Interest 89.8 71.2 26 334.6 306.7 9
Gross Profit 1,410.3 1,256.2 12 5,987.7 4,472.4 34
Depreciation 257.6 225.2 14 994.7 865.8 15
PBT 1,152.7 1,031.0 12 4,993.0 3,606.6 38
Total Tax 297.4 335.4 (11) 1,570.5 991.4 58
% Chg.Quarter -4
% Chg.Full Year
35
Total Tax 297.4 335.4 (11) 1,570.5 991.4 58
Share in Profit of Associates 13.9 15.0 -- 51.1 15.9 --
PAT (Before EO gain & Minority Share) 869.2 710.6 22 3,473.6 2,631.1 32
Minority Share 214.7 141.8 51 714.1 444.4 61
PAT (Before EO gain, After Minority Share) 654.5 568.8 15 2,759.5 2,186.7 26
Extraordinary Item - - -- 336.1 - --PAT (After EO gain) 654.5 568.8 15 3,095.5 2,186.7 42
Diluted Earning Per Share(before EO gain, after minority share) (Rs.) 71.35 62.03 15 300.83 238.49 26
Diluted Earning Per Share(incl. EO gain, after minority share) (Rs.) 71.35 62.03 15 337.47 238.49 42
Cash Profit (before min. share & EO Gain) 1,142.7 1,113.9 3 4,799.9 3,937.6 22
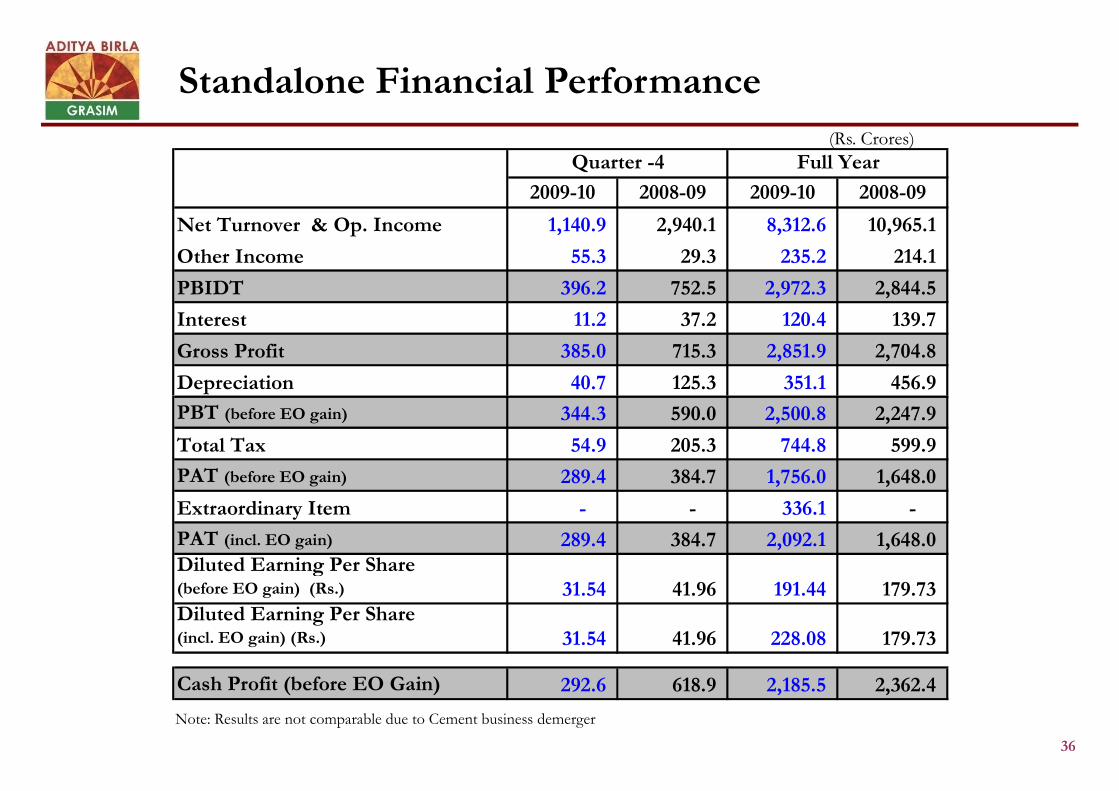
Standalone Financial Performance
(Rs. Crores)
2009-10 2008-09 2009-10 2008-09
Net Turnover & Op. Income 1,140.9 2,940.1 8,312.6 10,965.1
Other Income 55.3 29.3 235.2 214.1
PBIDT 396.2 752.5 2,972.3 2,844.5
Interest 11.2 37.2 120.4 139.7
Gross Profit 385.0 715.3 2,851.9 2,704.8
Depreciation 40.7 125.3 351.1 456.9
Quarter -4 Full Year
36
Note: Results are not comparable due to Cement business demerger
PBT (before EO gain) 344.3 590.0 2,500.8 2,247.9
Total Tax 54.9 205.3 744.8 599.9
PAT (before EO gain) 289.4 384.7 1,756.0 1,648.0
Extraordinary Item - - 336.1 -
PAT (incl. EO gain) 289.4 384.7 2,092.1 1,648.0Diluted Earning Per Share(before EO gain) (Rs.) 31.54 41.96 191.44 179.73Diluted Earning Per Share(incl. EO gain) (Rs.) 31.54 41.96 228.08 179.73
Cash Profit (before EO Gain) 292.6 618.9 2,185.5 2,362.4
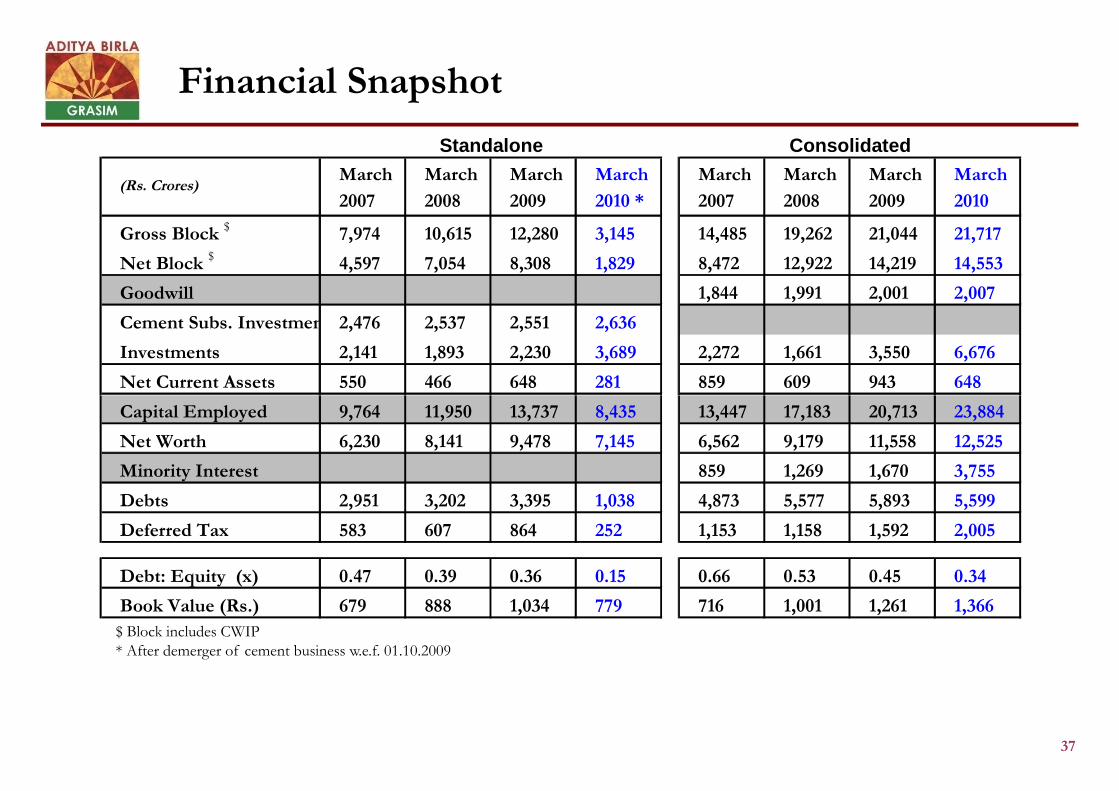
Financial Snapshot
March March March March March March March March
2007 2008 2009 2010 * 2007 2008 2009 2010
Gross Block $ 7,974 10,615 12,280 3,145 14,485 19,262 21,044 21,717
Net Block $ 4,597 7,054 8,308 1,829 8,472 12,922 14,219 14,553
Goodwill 1,844 1,991 2,001 2,007
Cement Subs. Investment 2,476 2,537 2,551 2,636
Investments 2,141 1,893 2,230 3,689 2,272 1,661 3,550 6,676
Net Current Assets 550 466 648 281 859 609 943 648
Standalone Consolidated
(Rs. Crores)
37
$ Block includes CWIP* After demerger of cement business w.e.f. 01.10.2009
Capital Employed 9,764 11,950 13,737 8,435 13,447 17,183 20,713 23,884
Net Worth 6,230 8,141 9,478 7,145 6,562 9,179 11,558 12,525
Minority Interest 859 1,269 1,670 3,755
Debts 2,951 3,202 3,395 1,038 4,873 5,577 5,893 5,599
Deferred Tax 583 607 864 252 1,153 1,158 1,592 2,005
Debt: Equity (x) 0.47 0.39 0.36 0.15 0.66 0.53 0.45 0.34
Book Value (Rs.) 679 888 1,034 779 716 1,001 1,261 1,366
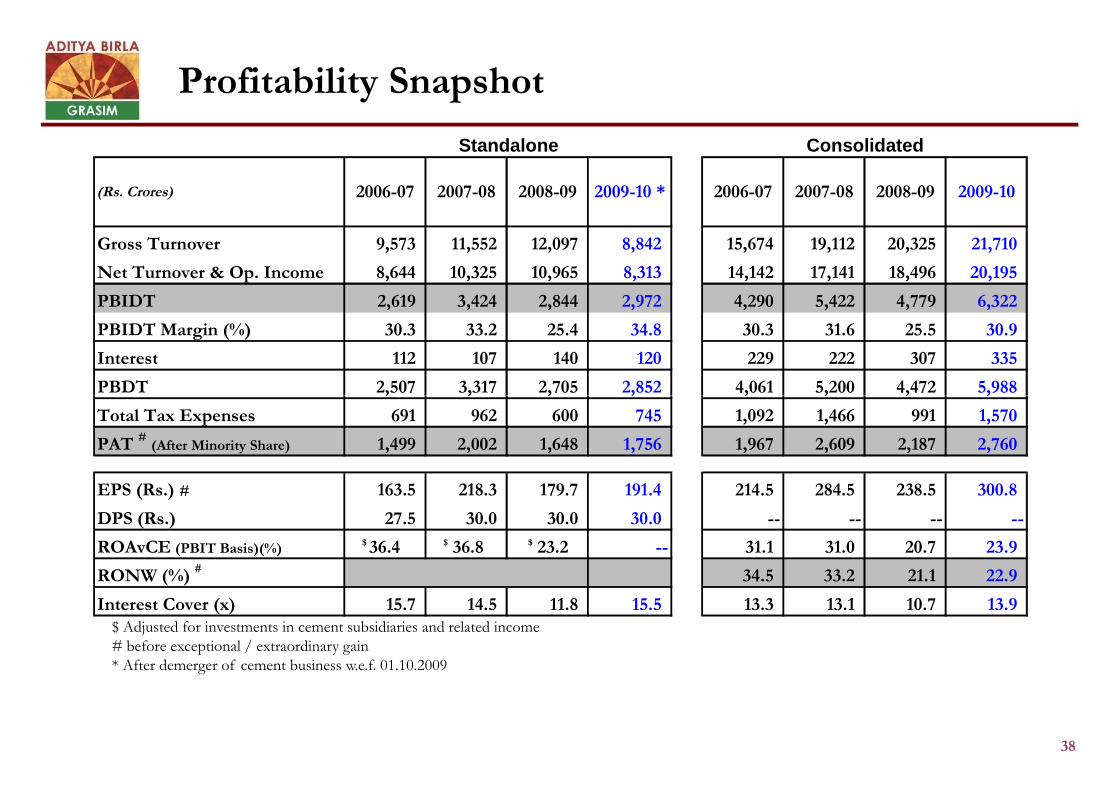
Profitability Snapshot
(Rs. Crores) 2006-07 2007-08 2008-09 2009-10 * 2006-07 2007-08 2008-09 2009-10
Gross Turnover 9,573 11,552 12,097 8,842 15,674 19,112 20,325 21,710
Net Turnover & Op. Income 8,644 10,325 10,965 8,313 14,142 17,141 18,496 20,195
PBIDT 2,619 3,424 2,844 2,972 4,290 5,422 4,779 6,322
PBIDT Margin (%) 30.3 33.2 25.4 34.8 30.3 31.6 25.5 30.9
Interest 112 107 140 120 229 222 307 335
PBDT 2,507 3,317 2,705 2,852 4,061 5,200 4,472 5,988
ConsolidatedStandalone
38
$ Adjusted for investments in cement subsidiaries and related income# before exceptional / extraordinary gain* After demerger of cement business w.e.f. 01.10.2009
PBDT 2,507 3,317 2,705 2,852 4,061 5,200 4,472 5,988
Total Tax Expenses 691 962 600 745 1,092 1,466 991 1,570
PAT #(After Minority Share) 1,499 2,002 1,648 1,756 1,967 2,609 2,187 2,760
EPS (Rs.) # 163.5 218.3 179.7 191.4 214.5 284.5 238.5 300.8
DPS (Rs.) 27.5 30.0 30.0 30.0 -- -- -- --
ROAvCE (PBIT Basis)(%)$ 36.4 $ 36.8 $ 23.2 -- 31.1 31.0 20.7 23.9
RONW (%) # 34.5 33.2 21.1 22.9
Interest Cover (x) 15.7 14.5 11.8 15.5 13.3 13.1 10.7 13.9
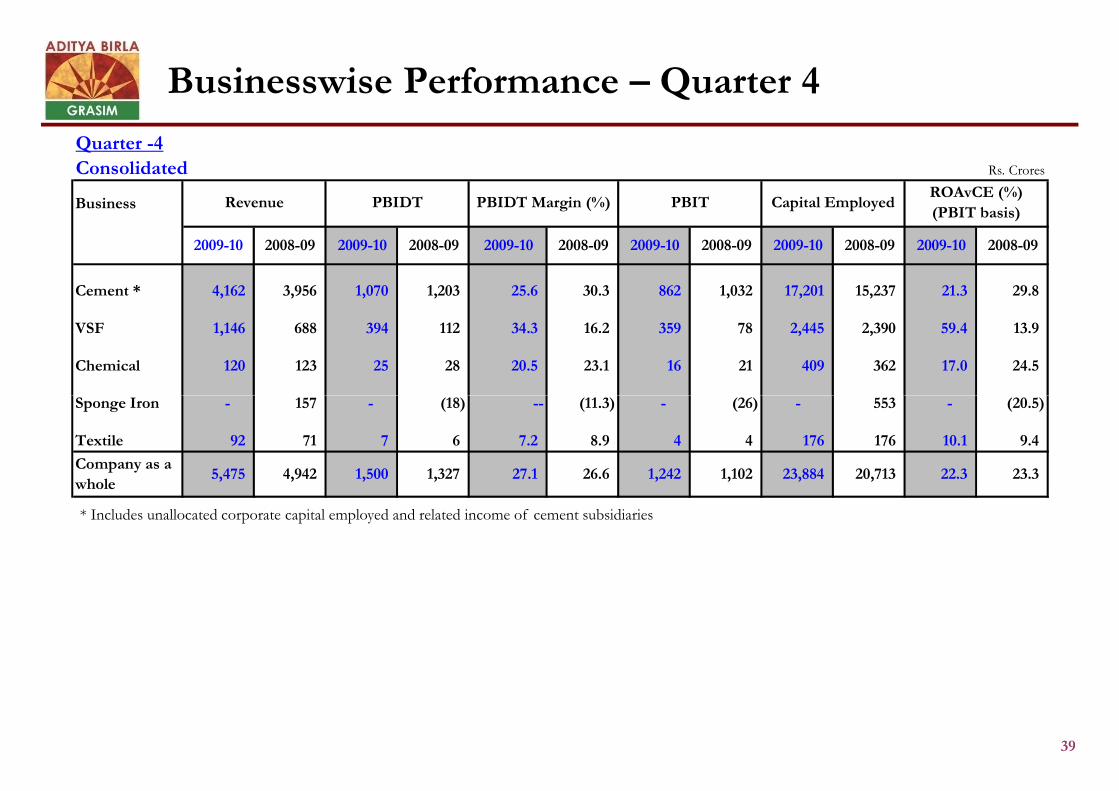
Businesswise Performance – Quarter 4
Quarter -4Consolidated Rs. Crores
Business
2009-10 2008-09 2009-10 2008-09 2009-10 2008-09 2009-10 2008-09 2009-10 2008-09 2009-10 2008-09
Cement * 4,162 3,956 1,070 1,203 25.6 30.3 862 1,032 17,201 15,237 21.3 29.8
VSF 1,146 688 394 112 34.3 16.2 359 78 2,445 2,390 59.4 13.9
Chemical 120 123 25 28 20.5 23.1 16 21 409 362 17.0 24.5
Sponge Iron - 157 - (18) -- (11.3) - (26) - 553 - (20.5)
Revenue PBIDT PBIDT Margin (%) PBIT Capital EmployedROAvCE (%)
(PBIT basis)
39
* Includes unallocated corporate capital employed and related income of cement subsidiaries
Sponge Iron - 157 - (18) -- (11.3) - (26) - 553 - (20.5)
Textile 92 71 7 6 7.2 8.9 4 4 176 176 10.1 9.4
Company as a
whole5,475 4,942 1,500 1,327 27.1 26.6 1,242 1,102 23,884 20,713 22.3 23.3
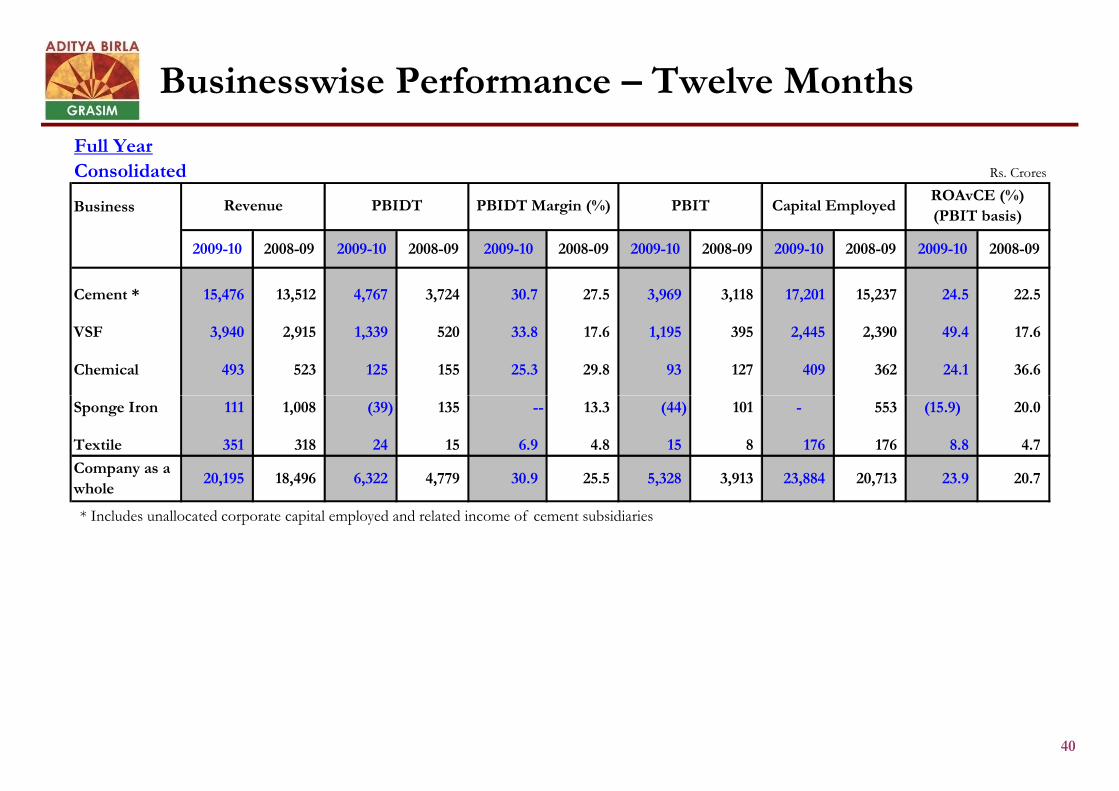
Businesswise Performance – Twelve Months
Full YearConsolidated Rs. Crores
Business
2009-10 2008-09 2009-10 2008-09 2009-10 2008-09 2009-10 2008-09 2009-10 2008-09 2009-10 2008-09
Cement * 15,476 13,512 4,767 3,724 30.7 27.5 3,969 3,118 17,201 15,237 24.5 22.5
VSF 3,940 2,915 1,339 520 33.8 17.6 1,195 395 2,445 2,390 49.4 17.6
Chemical 493 523 125 155 25.3 29.8 93 127 409 362 24.1 36.6
Revenue PBIDT PBIDT Margin (%) PBIT Capital EmployedROAvCE (%)
(PBIT basis)
40
* Includes unallocated corporate capital employed and related income of cement subsidiaries
Sponge Iron 111 1,008 (39) 135 -- 13.3 (44) 101 - 553 (15.9) 20.0
Textile 351 318 24 15 6.9 4.8 15 8 176 176 8.8 4.7
Company as a
whole20,195 18,496 6,322 4,779 30.9 25.5 5,328 3,913 23,884 20,713 23.9 20.7
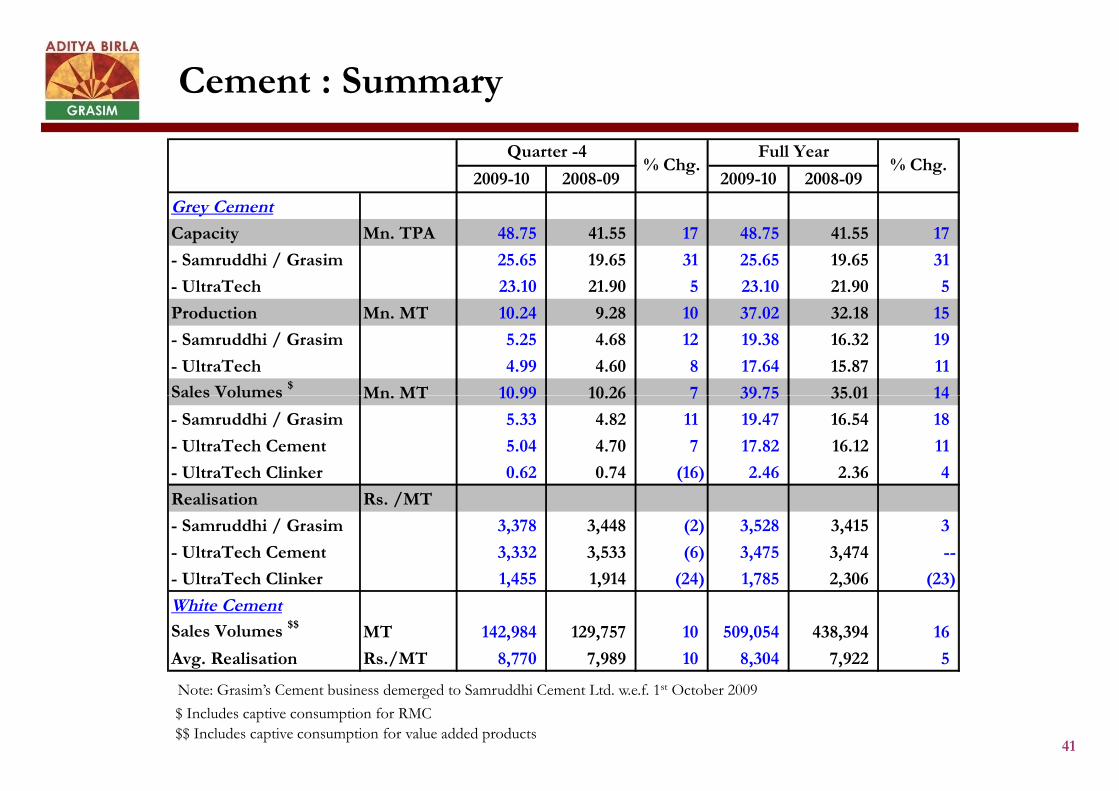
Cement : Summary
2009-10 2008-09 2009-10 2008-09
Grey Cement
Capacity Mn. TPA 48.75 41.55 17 48.75 41.55 17
- Samruddhi / Grasim 25.65 19.65 31 25.65 19.65 31
- UltraTech 23.10 21.90 5 23.10 21.90 5
Production Mn. MT 10.24 9.28 10 37.02 32.18 15
- Samruddhi / Grasim 5.25 4.68 12 19.38 16.32 19
- UltraTech 4.99 4.60 8 17.64 15.87 11
Sales Volumes $Mn. MT 10.99 10.26 7 39.75 35.01 14
% Chg.Quarter -4
% Chg.Full Year
41
Note: Grasim’s Cement business demerged to Samruddhi Cement Ltd. w.e.f. 1st October 2009
$ Includes captive consumption for RMC
$$ Includes captive consumption for value added products
Sales Volumes Mn. MT 10.99 10.26 7 39.75 35.01 14
- Samruddhi / Grasim 5.33 4.82 11 19.47 16.54 18
- UltraTech Cement 5.04 4.70 7 17.82 16.12 11
- UltraTech Clinker 0.62 0.74 (16) 2.46 2.36 4
Realisation Rs. /MT
- Samruddhi / Grasim 3,378 3,448 (2) 3,528 3,415 3
- UltraTech Cement 3,332 3,533 (6) 3,475 3,474 --
- UltraTech Clinker 1,455 1,914 (24) 1,785 2,306 (23)
White Cement
Sales Volumes $$MT 142,984 129,757 10 509,054 438,394 16
Avg. Realisation Rs./MT 8,770 7,989 10 8,304 7,922 5
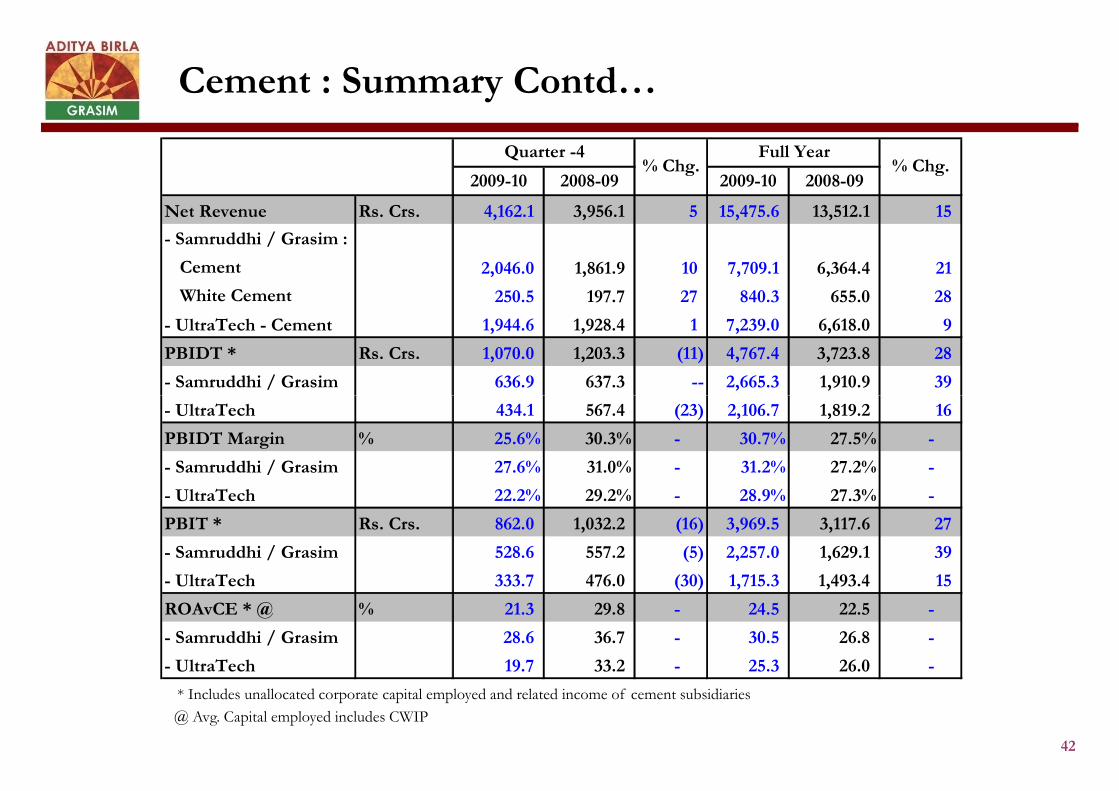
Cement : Summary Contd…
2009-10 2008-09 2009-10 2008-09
Net Revenue Rs. Crs. 4,162.1 3,956.1 5 15,475.6 13,512.1 15
- Samruddhi / Grasim :
Cement 2,046.0 1,861.9 10 7,709.1 6,364.4 21
White Cement 250.5 197.7 27 840.3 655.0 28
- UltraTech - Cement 1,944.6 1,928.4 1 7,239.0 6,618.0 9
PBIDT * Rs. Crs. 1,070.0 1,203.3 (11) 4,767.4 3,723.8 28
- Samruddhi / Grasim 636.9 637.3 -- 2,665.3 1,910.9 39
Full YearQuarter -4% Chg. % Chg.
42
@ Avg. Capital employed includes CWIP
* Includes unallocated corporate capital employed and related income of cement subsidiaries
- UltraTech 434.1 567.4 (23) 2,106.7 1,819.2 16
PBIDT Margin % 25.6% 30.3% - 30.7% 27.5% -
- Samruddhi / Grasim 27.6% 31.0% - 31.2% 27.2% -
- UltraTech 22.2% 29.2% - 28.9% 27.3% -
PBIT * Rs. Crs. 862.0 1,032.2 (16) 3,969.5 3,117.6 27
- Samruddhi / Grasim 528.6 557.2 (5) 2,257.0 1,629.1 39
- UltraTech 333.7 476.0 (30) 1,715.3 1,493.4 15
ROAvCE * @ % 21.3 29.8 - 24.5 22.5 -
- Samruddhi / Grasim 28.6 36.7 - 30.5 26.8 -
- UltraTech 19.7 33.2 - 25.3 26.0 -
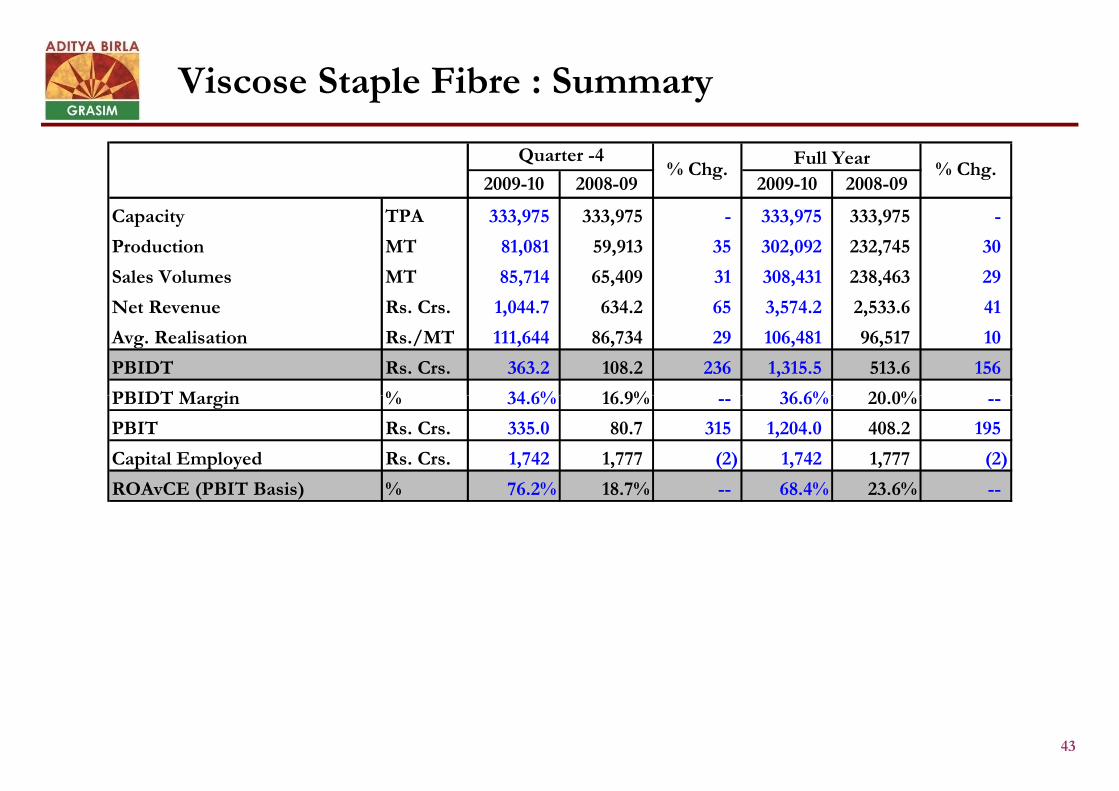
Viscose Staple Fibre : Summary
2009-10 2008-09 2009-10 2008-09
Capacity TPA 333,975 333,975 - 333,975 333,975 -
Production MT 81,081 59,913 35 302,092 232,745 30
Sales Volumes MT 85,714 65,409 31 308,431 238,463 29
Net Revenue Rs. Crs. 1,044.7 634.2 65 3,574.2 2,533.6 41
Avg. Realisation Rs./MT 111,644 86,734 29 106,481 96,517 10
PBIDT Rs. Crs. 363.2 108.2 236 1,315.5 513.6 156
PBIDT Margin % 34.6% 16.9% -- 36.6% 20.0% --
Quarter -4 Full Year% Chg. % Chg.
43
PBIDT Margin % 34.6% 16.9% -- 36.6% 20.0% --
PBIT Rs. Crs. 335.0 80.7 315 1,204.0 408.2 195
Capital Employed Rs. Crs. 1,742 1,777 (2) 1,742 1,777 (2)
ROAvCE (PBIT Basis) % 76.2% 18.7% -- 68.4% 23.6% --
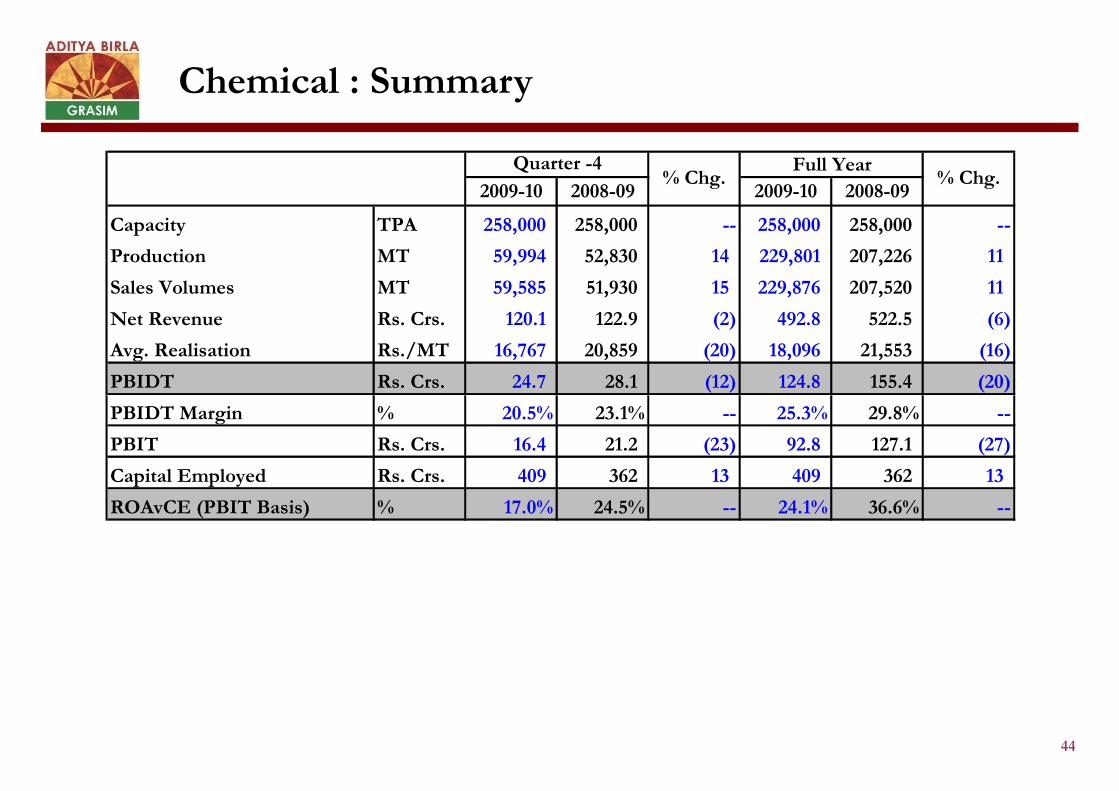
Chemical : Summary
2009-10 2008-09 2009-10 2008-09
Capacity TPA 258,000 258,000 -- 258,000 258,000 --
Production MT 59,994 52,830 14 229,801 207,226 11
Sales Volumes MT 59,585 51,930 15 229,876 207,520 11
Net Revenue Rs. Crs. 120.1 122.9 (2) 492.8 522.5 (6)
Avg. Realisation Rs./MT 16,767 20,859 (20) 18,096 21,553 (16)
PBIDT Rs. Crs. 24.7 28.1 (12) 124.8 155.4 (20)
Quarter -4% Chg.
Full Year% Chg.
44
PBIDT Margin % 20.5% 23.1% -- 25.3% 29.8% --
PBIT Rs. Crs. 16.4 21.2 (23) 92.8 127.1 (27)
Capital Employed Rs. Crs. 409 362 13 409 362 13
ROAvCE (PBIT Basis) % 17.0% 24.5% -- 24.1% 36.6% --
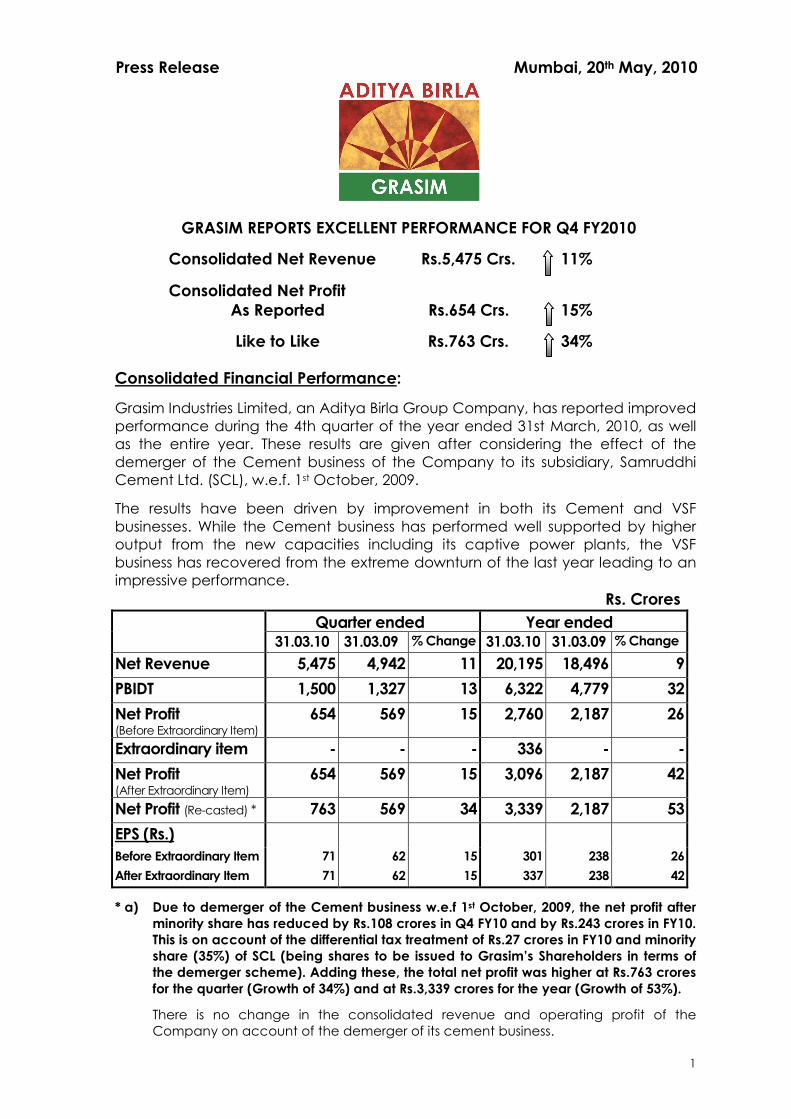
1
Press Release Mumbai, 20th May, 2010
GRASIM REPORTS EXCELLENT PERFORMANCE FOR Q4 FY2010
Consolidated Net Revenue Rs.5,475 Crs. 11%
Consolidated Net ProfitAs Reported Rs.654 Crs. 15%
Like to Like Rs.763 Crs. 34%
Consolidated Financial Performance:
Grasim Industries Limited, an Aditya Birla Group Company, has reported improvedperformance during the 4th quarter of the year ended 31st March, 2010, as wellas the entire year. These results are given after considering the effect of thedemerger of the Cement business of the Company to its subsidiary, SamruddhiCement Ltd. (SCL), w.e.f. 1st October, 2009.
The results have been driven by improvement in both its Cement and VSFbusinesses. While the Cement business has performed well supported by higheroutput from the new capacities including its captive power plants, the VSFbusiness has recovered from the extreme downturn of the last year leading to animpressive performance.
Rs. Crores
* a) Due to demerger of the Cement business w.e.f 1st October, 2009, the net profit afterminority share has reduced by Rs.108 crores in Q4 FY10 and by Rs.243 crores in FY10.This is on account of the differential tax treatment of Rs.27 crores in FY10 and minorityshare (35%) of SCL (being shares to be issued to Grasim’s Shareholders in terms ofthe demerger scheme). Adding these, the total net profit was higher at Rs.763 croresfor the quarter (Growth of 34%) and at Rs.3,339 crores for the year (Growth of 53%).
There is no change in the consolidated revenue and operating profit of theCompany on account of the demerger of its cement business.
Quarter ended Year ended31.03.10 31.03.09 % Change 31.03.10 31.03.09 % Change
Net Revenue 5,475 4,942 11 20,195 18,496 9
PBIDT 1,500 1,327 13 6,322 4,779 32
Net Profit(Before Extraordinary Item)
654 569 15 2,760 2,187 26
Extraordinary item - - - 336 - -
Net Profit(After Extraordinary Item)
654 569 15 3,096 2,187 42
Net Profit (Re-casted) * 763 569 34 3,339 2,187 53
EPS (Rs.)
Before Extraordinary Item 71 62 15 301 238 26
After Extraordinary Item 71 62 15 337 238 42
2
b) The Extraordinary item of Rs.336 crores reflects the profit on the sale of Vikram Ispat,the sponge iron unit of the Company.
Dividend
The Board of Directors of Grasim has recommended a dividend of Rs.30 per share,which is the same as per last year. Additionally, the Board of Directors of SCL, hasproposed a dividend of Rs.1.75 per share for six months’ working. Each Grasimshareholder will be receiving one equity share of Rs.5 in SCL for every one shareheld in Grasim on 28th May 2010, the record date fixed for this purpose, in terms ofthe demerger scheme.
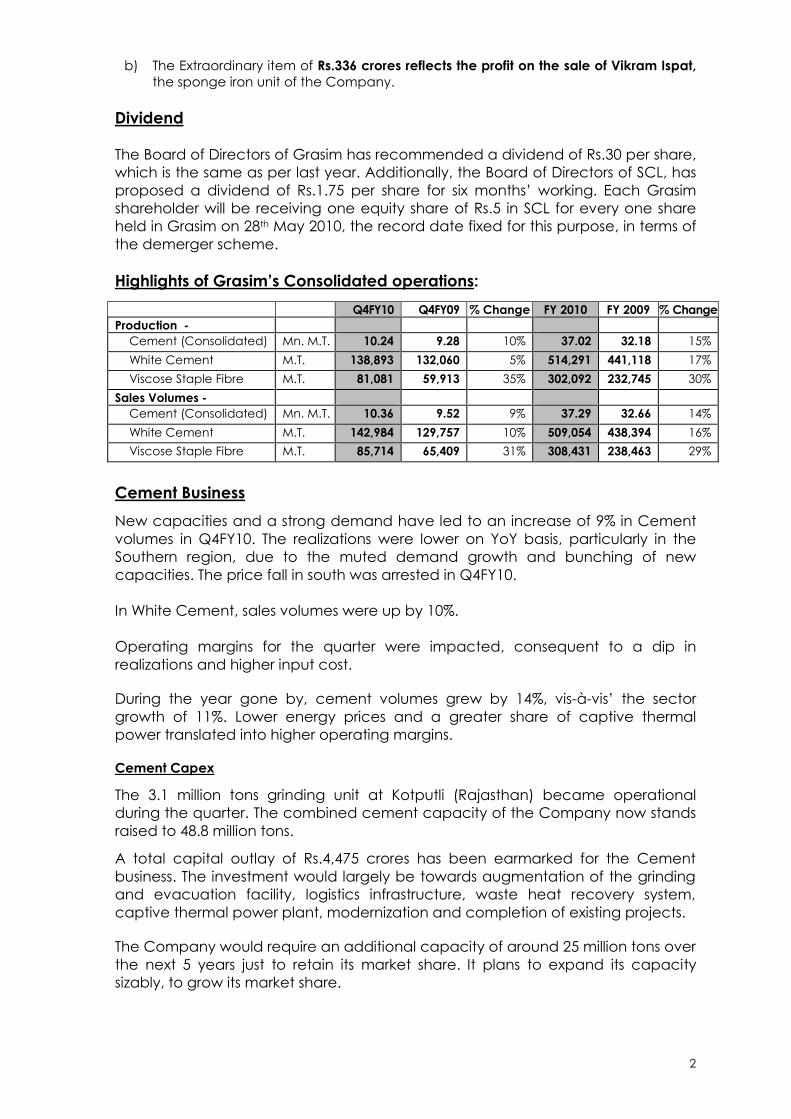
Highlights of Grasim’s Consolidated operations:
Q4FY10 Q4FY09 % Change FY 2010 FY 2009 % Change
Production -
Cement (Consolidated) Mn. M.T. 10.24 9.28 10% 37.02 32.18 15%
White Cement M.T. 138,893 132,060 5% 514,291 441,118 17%
Viscose Staple Fibre M.T. 81,081 59,913 35% 302,092 232,745 30%
Sales Volumes -
Cement (Consolidated) Mn. M.T. 10.36 9.52 9% 37.29 32.66 14%
White Cement M.T. 142,984 129,757 10% 509,054 438,394 16%
Viscose Staple Fibre M.T. 85,714 65,409 31% 308,431 238,463 29%
Cement Business
New capacities and a strong demand have led to an increase of 9% in Cementvolumes in Q4FY10. The realizations were lower on YoY basis, particularly in theSouthern region, due to the muted demand growth and bunching of newcapacities. The price fall in south was arrested in Q4FY10.
In White Cement, sales volumes were up by 10%.
Operating margins for the quarter were impacted, consequent to a dip inrealizations and higher input cost.
During the year gone by, cement volumes grew by 14%, vis-à-vis’ the sectorgrowth of 11%. Lower energy prices and a greater share of captive thermalpower translated into higher operating margins.
Cement Capex
The 3.1 million tons grinding unit at Kotputli (Rajasthan) became operationalduring the quarter. The combined cement capacity of the Company now standsraised to 48.8 million tons.
A total capital outlay of Rs.4,475 crores has been earmarked for the Cementbusiness. The investment would largely be towards augmentation of the grindingand evacuation facility, logistics infrastructure, waste heat recovery system,captive thermal power plant, modernization and completion of existing projects.
The Company would require an additional capacity of around 25 million tons overthe next 5 years just to retain its market share. It plans to expand its capacitysizably, to grow its market share.
3
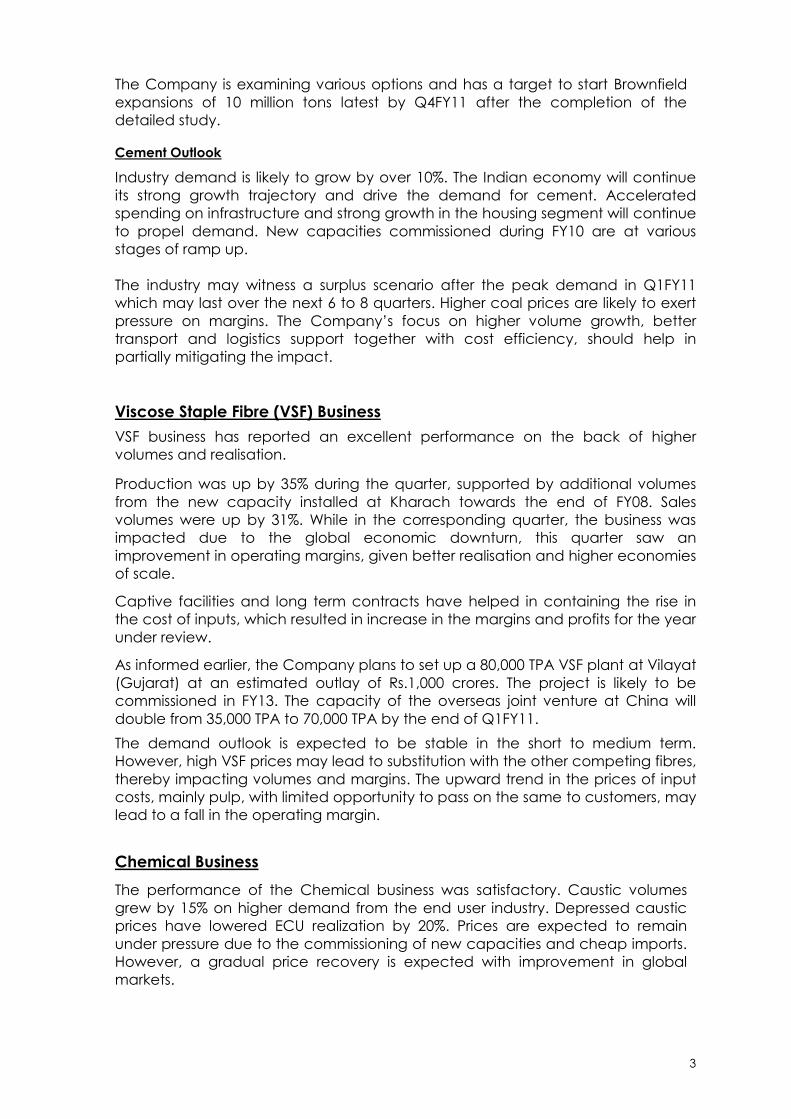
The Company is examining various options and has a target to start Brownfieldexpansions of 10 million tons latest by Q4FY11 after the completion of thedetailed study.
Cement Outlook
Industry demand is likely to grow by over 10%. The Indian economy will continueits strong growth trajectory and drive the demand for cement. Acceleratedspending on infrastructure and strong growth in the housing segment will continueto propel demand. New capacities commissioned during FY10 are at variousstages of ramp up.
The industry may witness a surplus scenario after the peak demand in Q1FY11which may last over the next 6 to 8 quarters. Higher coal prices are likely to exertpressure on margins. The Company’s focus on higher volume growth, bettertransport and logistics support together with cost efficiency, should help inpartially mitigating the impact.
Viscose Staple Fibre (VSF) Business
VSF business has reported an excellent performance on the back of highervolumes and realisation.
Production was up by 35% during the quarter, supported by additional volumesfrom the new capacity installed at Kharach towards the end of FY08. Salesvolumes were up by 31%. While in the corresponding quarter, the business wasimpacted due to the global economic downturn, this quarter saw animprovement in operating margins, given better realisation and higher economiesof scale.
Captive facilities and long term contracts have helped in containing the rise inthe cost of inputs, which resulted in increase in the margins and profits for the yearunder review.
As informed earlier, the Company plans to set up a 80,000 TPA VSF plant at Vilayat(Gujarat) at an estimated outlay of Rs.1,000 crores. The project is likely to becommissioned in FY13. The capacity of the overseas joint venture at China willdouble from 35,000 TPA to 70,000 TPA by the end of Q1FY11.
The demand outlook is expected to be stable in the short to medium term.However, high VSF prices may lead to substitution with the other competing fibres,thereby impacting volumes and margins. The upward trend in the prices of inputcosts, mainly pulp, with limited opportunity to pass on the same to customers, maylead to a fall in the operating margin.
Chemical Business
The performance of the Chemical business was satisfactory. Caustic volumesgrew by 15% on higher demand from the end user industry. Depressed causticprices have lowered ECU realization by 20%. Prices are expected to remainunder pressure due to the commissioning of new capacities and cheap imports.However, a gradual price recovery is expected with improvement in globalmarkets.
4
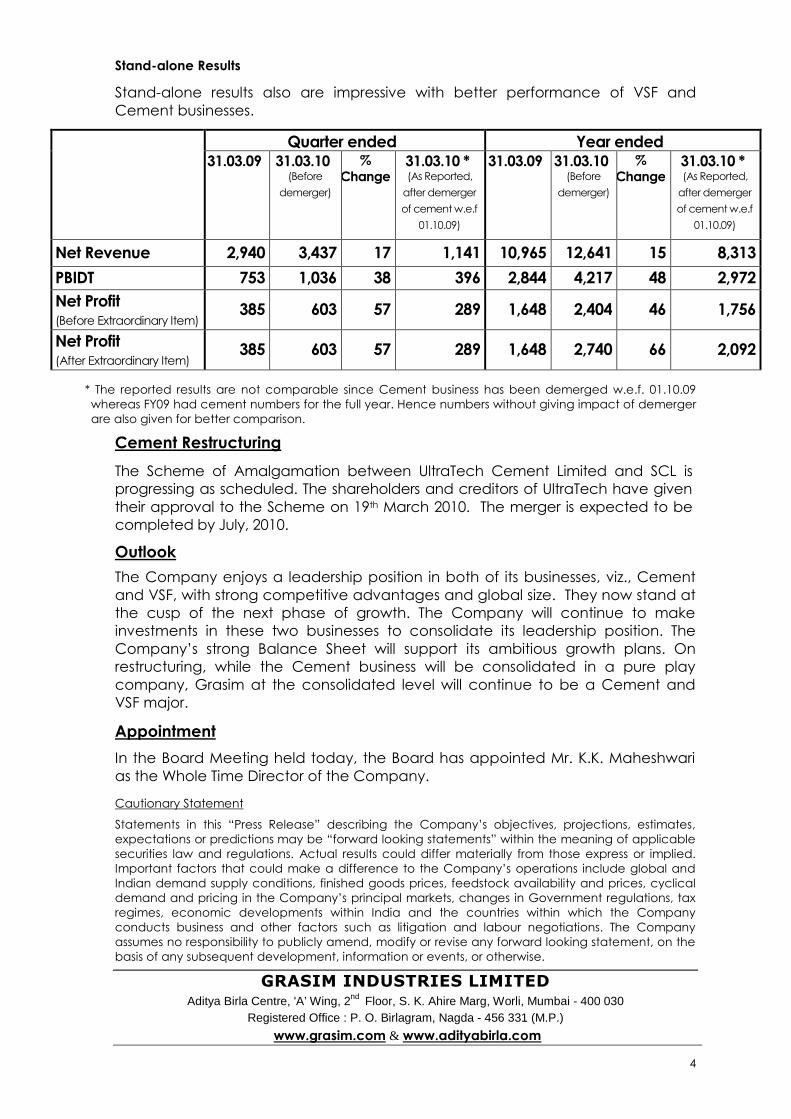
Stand-alone Results
Stand-alone results also are impressive with better performance of VSF andCement businesses.
* The reported results are not comparable since Cement business has been demerged w.e.f. 01.10.09whereas FY09 had cement numbers for the full year. Hence numbers without giving impact of demergerare also given for better comparison.
Cement Restructuring
The Scheme of Amalgamation between UltraTech Cement Limited and SCL isprogressing as scheduled. The shareholders and creditors of UltraTech have giventheir approval to the Scheme on 19th March 2010. The merger is expected to becompleted by July, 2010.
Outlook
The Company enjoys a leadership position in both of its businesses, viz., Cementand VSF, with strong competitive advantages and global size. They now stand atthe cusp of the next phase of growth. The Company will continue to makeinvestments in these two businesses to consolidate its leadership position. TheCompany’s strong Balance Sheet will support its ambitious growth plans. Onrestructuring, while the Cement business will be consolidated in a pure playcompany, Grasim at the consolidated level will continue to be a Cement andVSF major.
Appointment
In the Board Meeting held today, the Board has appointed Mr. K.K. Maheshwarias the Whole Time Director of the Company.
Cautionary Statement
Statements in this “Press Release” describing the Company’s objectives, projections, estimates,expectations or predictions may be “forward looking statements” within the meaning of applicablesecurities law and regulations. Actual results could differ materially from those express or implied.Important factors that could make a difference to the Company’s operations include global andIndian demand supply conditions, finished goods prices, feedstock availability and prices, cyclicaldemand and pricing in the Company’s principal markets, changes in Government regulations, taxregimes, economic developments within India and the countries within which the Companyconducts business and other factors such as litigation and labour negotiations. The Companyassumes no responsibility to publicly amend, modify or revise any forward looking statement, on thebasis of any subsequent development, information or events, or otherwise.
GRASIM INDUSTRIES LIMITEDAditya Birla Centre, 'A’ Wing, 2
ndFloor, S. K. Ahire Marg, Worli, Mumbai - 400 030
Registered Office : P. O. Birlagram, Nagda - 456 331 (M.P.)
www.grasim.com & www.adityabirla.com
Quarter ended Year ended31.03.09 31.03.10
(Before
demerger)
%Change
31.03.10 *(As Reported,
after demerger
of cement w.e.f
01.10.09)
31.03.09 31.03.10(Before
demerger)
%Change
31.03.10 *(As Reported,
after demerger
of cement w.e.f
01.10.09)
Net Revenue 2,940 3,437 17 1,141 10,965 12,641 15 8,313
PBIDT 753 1,036 38 396 2,844 4,217 48 2,972
Net Profit(Before Extraordinary Item)
385 603 57 289 1,648 2,404 46 1,756
Net Profit(After Extraordinary Item)
385 603 57 289 1,648 2,740 66 2,092
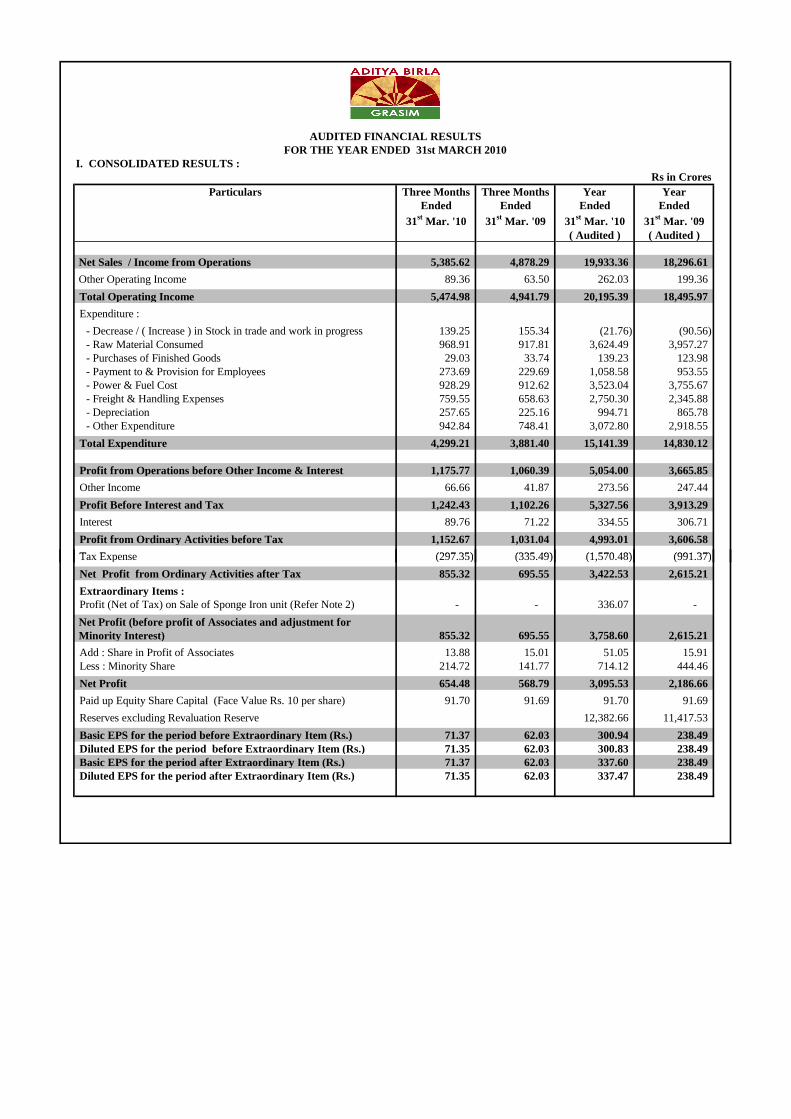
I. CONSOLIDATED RESULTS :Rs in Crores
Particulars Three Months Three Months Year YearEnded Ended Ended Ended
31st
Mar. '10 31st
Mar. '09 31st
Mar. '10 31st
Mar. '09( Audited ) ( Audited )
Net Sales / Income from Operations 5,385.62 4,878.29 19,933.36 18,296.61
Other Operating Income 89.36 63.50 262.03 199.36
Total Operating Income 5,474.98 4,941.79 20,195.39 18,495.97
Expenditure :
- Decrease / ( Increase ) in Stock in trade and work in progress 139.25 155.34 (21.76) (90.56)- Raw Material Consumed 968.91 917.81 3,624.49 3,957.27- Purchases of Finished Goods 29.03 33.74 139.23 123.98- Payment to & Provision for Employees 273.69 229.69 1,058.58 953.55- Power & Fuel Cost 928.29 912.62 3,523.04 3,755.67- Freight & Handling Expenses 759.55 658.63 2,750.30 2,345.88- Depreciation 257.65 225.16 994.71 865.78- Other Expenditure 942.84 748.41 3,072.80 2,918.55
Total Expenditure 4,299.21 3,881.40 15,141.39 14,830.12
Profit from Operations before Other Income & Interest 1,175.77 1,060.39 5,054.00 3,665.85
Other Income 66.66 41.87 273.56 247.44
Profit Before Interest and Tax 1,242.43 1,102.26 5,327.56 3,913.29
Interest 89.76 71.22 334.55 306.71
Profit from Ordinary Activities before Tax 1,152.67 1,031.04 4,993.01 3,606.58
Tax Expense (297.35) (335.49) (1,570.48) (991.37)
AUDITED FINANCIAL RESULTSFOR THE YEAR ENDED 31st MARCH 2010
Tax Expense (297.35) (335.49) (1,570.48) (991.37)
Net Profit from Ordinary Activities after Tax 855.32 695.55 3,422.53 2,615.21
Extraordinary Items :Profit (Net of Tax) on Sale of Sponge Iron unit (Refer Note 2) - - 336.07 -
Net Profit (before profit of Associates and adjustment forMinority Interest) 855.32 695.55 3,758.60 2,615.21
Add : Share in Profit of Associates 13.88 15.01 51.05 15.91Less : Minority Share 214.72 141.77 714.12 444.46
Net Profit 654.48 568.79 3,095.53 2,186.66
Paid up Equity Share Capital (Face Value Rs. 10 per share) 91.70 91.69 91.70 91.69
Reserves excluding Revaluation Reserve 12,382.66 11,417.53
Basic EPS for the period before Extraordinary Item (Rs.) 71.37 62.03 300.94 238.49Diluted EPS for the period before Extraordinary Item (Rs.) 71.35 62.03 300.83 238.49Basic EPS for the period after Extraordinary Item (Rs.) 71.37 62.03 337.60 238.49Diluted EPS for the period after Extraordinary Item (Rs.) 71.35 62.03 337.47 238.49
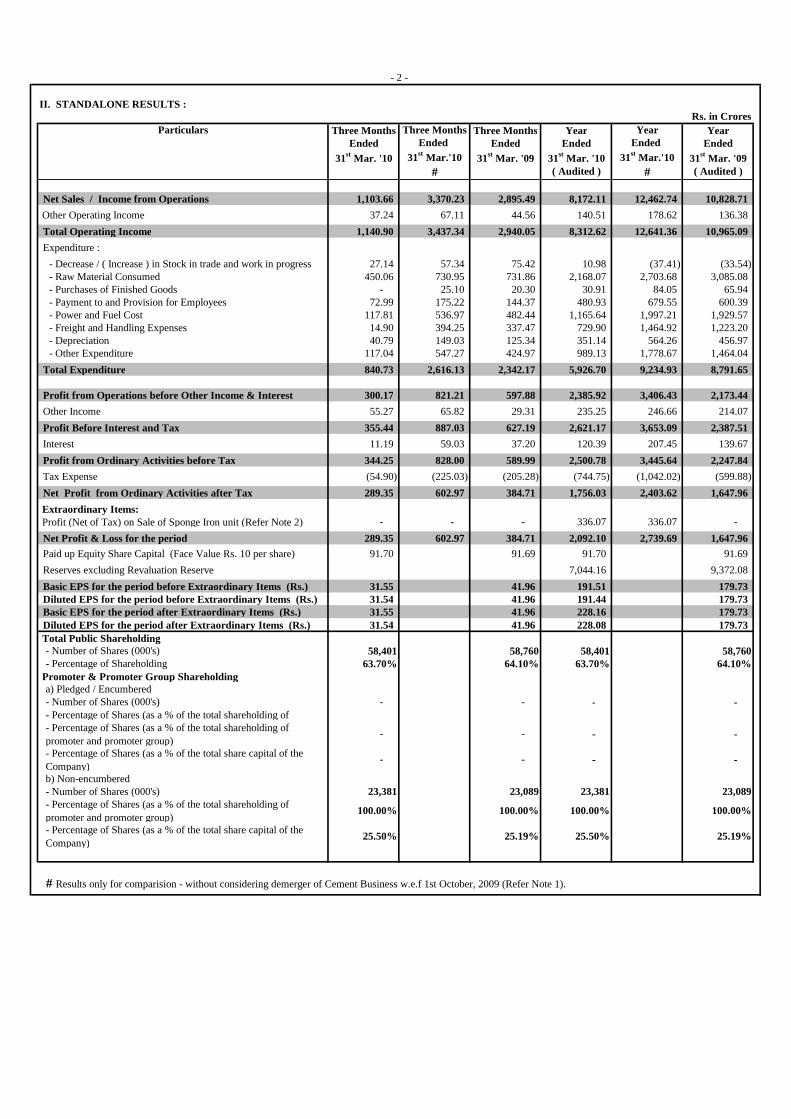
II. STANDALONE RESULTS :Rs. in Crores
Particulars Three Months Three Months Three Months Year Year YearEnded Ended Ended Ended Ended Ended
31st
Mar. '10 31st
Mar.'10 31st
Mar. '09 31st
Mar. '10 31st
Mar.'10 31st
Mar. '09
# ( Audited ) # ( Audited )
Net Sales / Income from Operations 1,103.66 3,370.23 2,895.49 8,172.11 12,462.74 10,828.71
Other Operating Income 37.24 67.11 44.56 140.51 178.62 136.38
Total Operating Income 1,140.90 3,437.34 2,940.05 8,312.62 12,641.36 10,965.09
Expenditure :
- Decrease / ( Increase ) in Stock in trade and work in progress 27.14 57.34 75.42 10.98 (37.41) (33.54)- Raw Material Consumed 450.06 730.95 731.86 2,168.07 2,703.68 3,085.08- Purchases of Finished Goods - 25.10 20.30 30.91 84.05 65.94- Payment to and Provision for Employees 72.99 175.22 144.37 480.93 679.55 600.39- Power and Fuel Cost 117.81 536.97 482.44 1,165.64 1,997.21 1,929.57- Freight and Handling Expenses 14.90 394.25 337.47 729.90 1,464.92 1,223.20- Depreciation 40.79 149.03 125.34 351.14 564.26 456.97- Other Expenditure 117.04 547.27 424.97 989.13 1,778.67 1,464.04
Total Expenditure 840.73 2,616.13 2,342.17 5,926.70 9,234.93 8,791.65
Profit from Operations before Other Income & Interest 300.17 821.21 597.88 2,385.92 3,406.43 2,173.44
Other Income 55.27 65.82 29.31 235.25 246.66 214.07
Profit Before Interest and Tax 355.44 887.03 627.19 2,621.17 3,653.09 2,387.51
Interest 11.19 59.03 37.20 120.39 207.45 139.67
Profit from Ordinary Activities before Tax 344.25 828.00 589.99 2,500.78 3,445.64 2,247.84
Tax Expense (54.90) (225.03) (205.28) (744.75) (1,042.02) (599.88)
Net Profit from Ordinary Activities after Tax 289.35 602.97 384.71 1,756.03 2,403.62 1,647.96
Extraordinary Items:Profit (Net of Tax) on Sale of Sponge Iron unit (Refer Note 2) - - - 336.07 336.07 -
Net Profit & Loss for the period 289.35 602.97 384.71 2,092.10 2,739.69 1,647.96
Paid up Equity Share Capital (Face Value Rs. 10 per share) 91.70 91.69 91.70 91.69
Reserves excluding Revaluation Reserve 7,044.16 9,372.08
Basic EPS for the period before Extraordinary Items (Rs.) 31.55 41.96 191.51 179.73Diluted EPS for the period before Extraordinary Items (Rs.) 31.54 41.96 191.44 179.73Basic EPS for the period after Extraordinary Items (Rs.) 31.55 41.96 228.16 179.73Diluted EPS for the period after Extraordinary Items (Rs.) 31.54 41.96 228.08 179.73
Total Public Shareholding- Number of Shares (000's) 58,401 58,760 58,401 58,760- Percentage of Shareholding 63.70% 64.10% 63.70% 64.10%
Promoter & Promoter Group Shareholdinga) Pledged / Encumbered- Number of Shares (000's) - - - -- Percentage of Shares (as a % of the total shareholding of- Percentage of Shares (as a % of the total shareholding of
promoter and promoter group)- - - -
- Percentage of Shares (as a % of the total share capital of the
Company)- - - -
b) Non-encumbered- Number of Shares (000's) 23,381 23,089 23,381 23,089- Percentage of Shares (as a % of the total shareholding of
promoter and promoter group)100.00% 100.00% 100.00% 100.00%
- Percentage of Shares (as a % of the total share capital of the
Company)25.50% 25.19% 25.50% 25.19%
# Results only for comparision - without considering demerger of Cement Business w.e.f 1st October, 2009 (Refer Note 1).
- 2 -
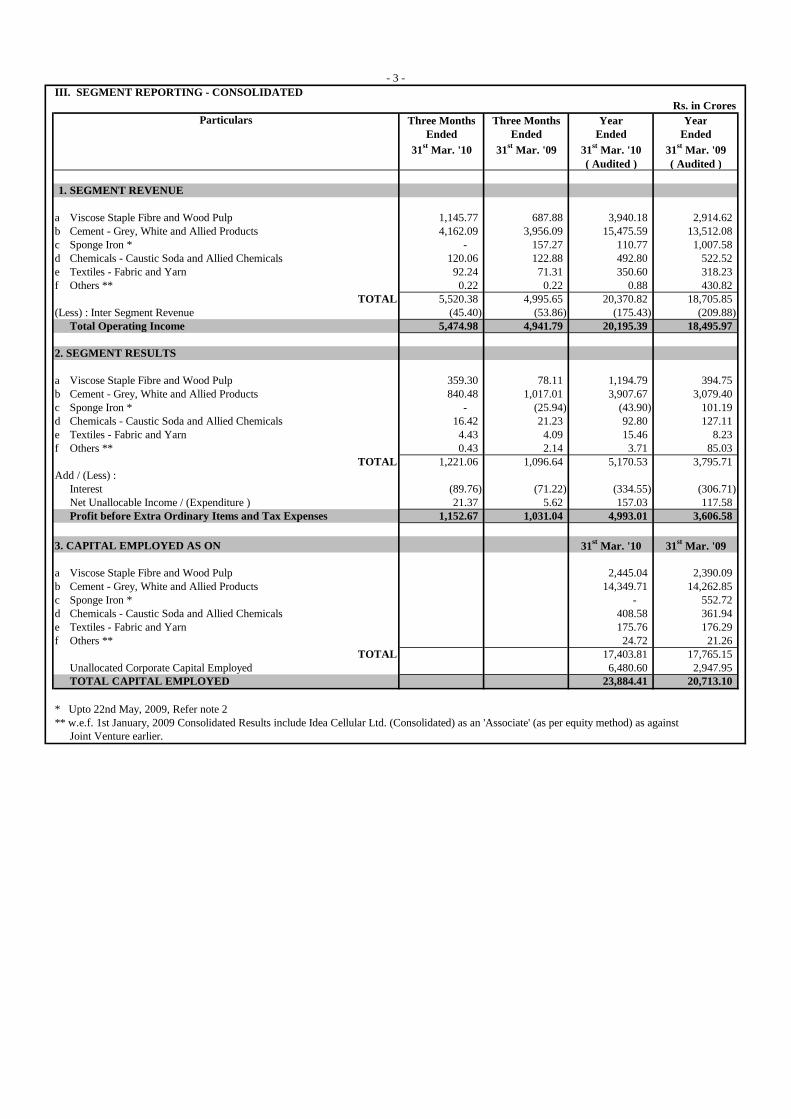
III. SEGMENT REPORTING - CONSOLIDATEDRs. in Crores
Three Months Three Months Year YearEnded Ended Ended Ended
31st
Mar. '10 31st
Mar. '09 31st
Mar. '10 31st
Mar. '09( Audited ) ( Audited )
1. SEGMENT REVENUE
a Viscose Staple Fibre and Wood Pulp 1,145.77 687.88 3,940.18 2,914.62b Cement - Grey, White and Allied Products 4,162.09 3,956.09 15,475.59 13,512.08c Sponge Iron * - 157.27 110.77 1,007.58d Chemicals - Caustic Soda and Allied Chemicals 120.06 122.88 492.80 522.52e Textiles - Fabric and Yarn 92.24 71.31 350.60 318.23f Others ** 0.22 0.22 0.88 430.82
TOTAL 5,520.38 4,995.65 20,370.82 18,705.85(Less) : Inter Segment Revenue (45.40) (53.86) (175.43) (209.88)
Total Operating Income 5,474.98 4,941.79 20,195.39 18,495.97
2. SEGMENT RESULTS
a Viscose Staple Fibre and Wood Pulp 359.30 78.11 1,194.79 394.75b Cement - Grey, White and Allied Products 840.48 1,017.01 3,907.67 3,079.40c Sponge Iron * - (25.94) (43.90) 101.19d Chemicals - Caustic Soda and Allied Chemicals 16.42 21.23 92.80 127.11e Textiles - Fabric and Yarn 4.43 4.09 15.46 8.23f Others ** 0.43 2.14 3.71 85.03
TOTAL 1,221.06 1,096.64 5,170.53 3,795.71Add / (Less) :
Interest (89.76) (71.22) (334.55) (306.71)Net Unallocable Income / (Expenditure ) 21.37 5.62 157.03 117.58Profit before Extra Ordinary Items and Tax Expenses 1,152.67 1,031.04 4,993.01 3,606.58
3. CAPITAL EMPLOYED AS ON 31st
Mar. '10 31st
Mar. '09
a Viscose Staple Fibre and Wood Pulp 2,445.04 2,390.09b Cement - Grey, White and Allied Products 14,349.71 14,262.85c Sponge Iron * - 552.72d Chemicals - Caustic Soda and Allied Chemicals 408.58 361.94e Textiles - Fabric and Yarn 175.76 176.29f Others ** 24.72 21.26
TOTAL 17,403.81 17,765.15Unallocated Corporate Capital Employed 6,480.60 2,947.95TOTAL CAPITAL EMPLOYED 23,884.41 20,713.10
* Upto 22nd May, 2009, Refer note 2** w.e.f. 1st January, 2009 Consolidated Results include Idea Cellular Ltd. (Consolidated) as an 'Associate' (as per equity method) as against
Joint Venture earlier.
Particulars
- 3 -
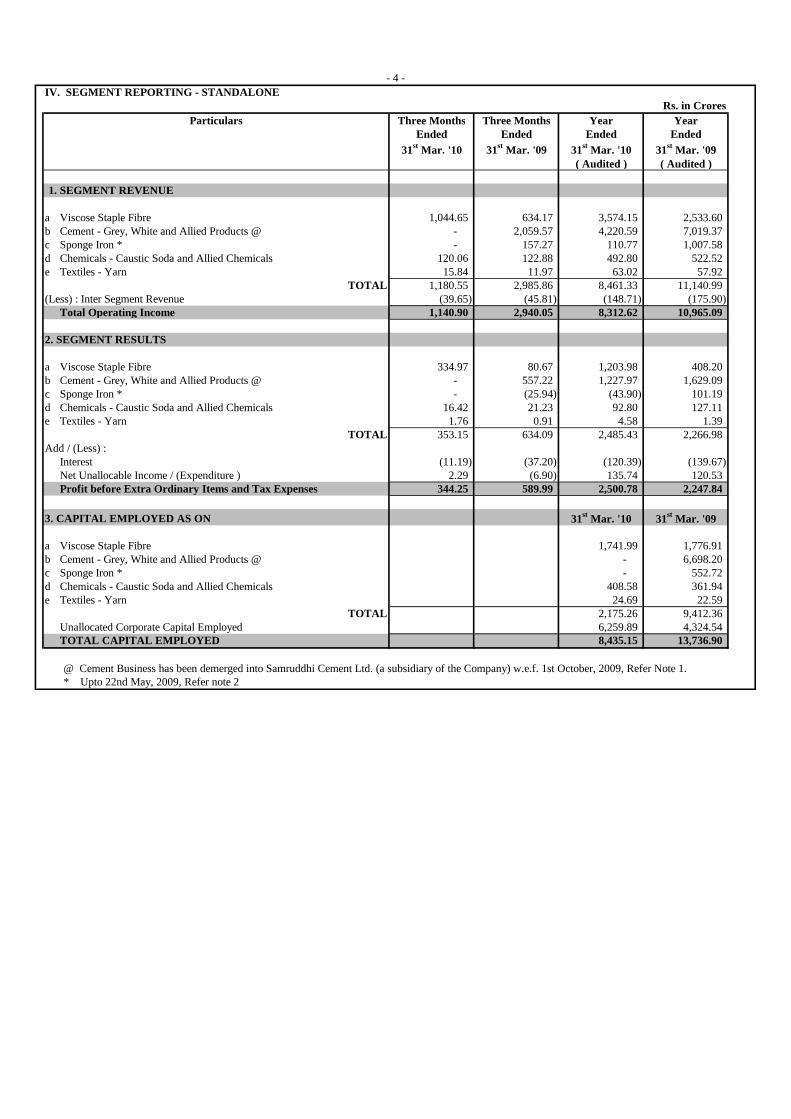
IV. SEGMENT REPORTING - STANDALONERs. in Crores
Three Months Three Months Year YearEnded Ended Ended Ended
31st
Mar. '10 31st
Mar. '09 31st
Mar. '10 31st
Mar. '09( Audited ) ( Audited )
1. SEGMENT REVENUE
a Viscose Staple Fibre 1,044.65 634.17 3,574.15 2,533.60b Cement - Grey, White and Allied Products @ - 2,059.57 4,220.59 7,019.37c Sponge Iron * - 157.27 110.77 1,007.58d Chemicals - Caustic Soda and Allied Chemicals 120.06 122.88 492.80 522.52e Textiles - Yarn 15.84 11.97 63.02 57.92
TOTAL 1,180.55 2,985.86 8,461.33 11,140.99(Less) : Inter Segment Revenue (39.65) (45.81) (148.71) (175.90)
Total Operating Income 1,140.90 2,940.05 8,312.62 10,965.09
2. SEGMENT RESULTS
a Viscose Staple Fibre 334.97 80.67 1,203.98 408.20b Cement - Grey, White and Allied Products @ - 557.22 1,227.97 1,629.09c Sponge Iron * - (25.94) (43.90) 101.19d Chemicals - Caustic Soda and Allied Chemicals 16.42 21.23 92.80 127.11e Textiles - Yarn 1.76 0.91 4.58 1.39
TOTAL 353.15 634.09 2,485.43 2,266.98Add / (Less) :
Interest (11.19) (37.20) (120.39) (139.67)Net Unallocable Income / (Expenditure ) 2.29 (6.90) 135.74 120.53Profit before Extra Ordinary Items and Tax Expenses 344.25 589.99 2,500.78 2,247.84
3. CAPITAL EMPLOYED AS ON 31st
Mar. '10 31st
Mar. '09
a Viscose Staple Fibre 1,741.99 1,776.91b Cement - Grey, White and Allied Products @ - 6,698.20c Sponge Iron * - 552.72d Chemicals - Caustic Soda and Allied Chemicals 408.58 361.94e Textiles - Yarn 24.69 22.59
TOTAL 2,175.26 9,412.36Unallocated Corporate Capital Employed 6,259.89 4,324.54TOTAL CAPITAL EMPLOYED 8,435.15 13,736.90
@ Cement Business has been demerged into Samruddhi Cement Ltd. (a subsidiary of the Company) w.e.f. 1st October, 2009, Refer Note 1.* Upto 22nd May, 2009, Refer note 2
Particulars
- 4 -
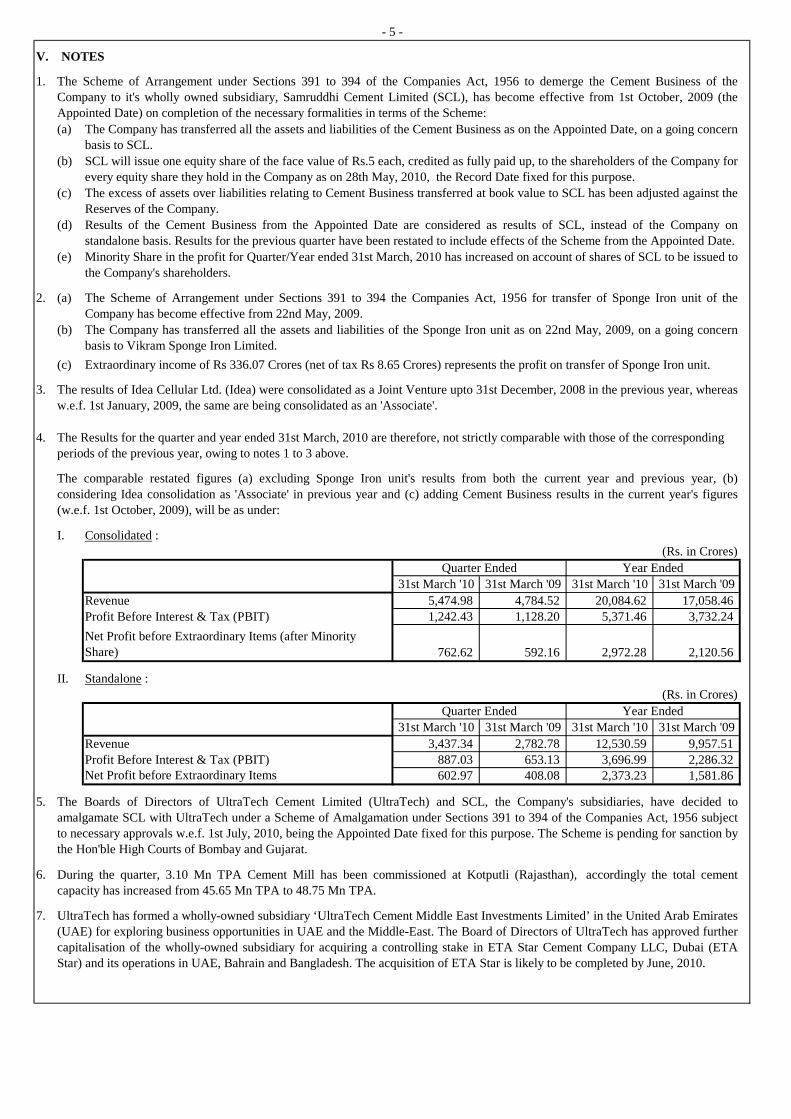
V. NOTES
1.
(a)
(b)
(c)
(d)
(e)
2. (a)
(b)
(c)
3.
4. The Results for the quarter and year ended 31st March, 2010 are therefore, not strictly comparable with those of the correspondingperiods of the previous year, owing to notes 1 to 3 above.
I. Consolidated :(Rs. in Crores)
31st March '10 31st March '09 31st March '10 31st March '09
5,474.98 4,784.52 20,084.62 17,058.461,242.43 1,128.20 5,371.46 3,732.24
762.62 592.16 2,972.28 2,120.56
II. Standalone :(Rs. in Crores)
31st March '10 31st March '09 31st March '10 31st March '09
3,437.34 2,782.78 12,530.59 9,957.51887.03 653.13 3,696.99 2,286.32602.97 408.08 2,373.23 1,581.86
5.
6.
7.
Net Profit before Extraordinary Items
The Boards of Directors of UltraTech Cement Limited (UltraTech) and SCL, the Company's subsidiaries, have decided toamalgamate SCL with UltraTech under a Scheme of Amalgamation under Sections 391 to 394 of the Companies Act, 1956 subjectto necessary approvals w.e.f. 1st July, 2010, being the Appointed Date fixed for this purpose. The Scheme is pending for sanction bythe Hon'ble High Courts of Bombay and Gujarat.
During the quarter, 3.10 Mn TPA Cement Mill has been commissioned at Kotputli (Rajasthan), accordingly the total cementcapacity has increased from 45.65 Mn TPA to 48.75 Mn TPA.
UltraTech has formed a wholly-owned subsidiary ‘UltraTech Cement Middle East Investments Limited’ in the United Arab Emirates(UAE) for exploring business opportunities in UAE and the Middle-East. The Board of Directors of UltraTech has approved furthercapitalisation of the wholly-owned subsidiary for acquiring a controlling stake in ETA Star Cement Company LLC, Dubai (ETAStar) and its operations in UAE, Bahrain and Bangladesh. The acquisition of ETA Star is likely to be completed by June, 2010.
Net Profit before Extraordinary Items (after MinorityShare)
Quarter Ended Year Ended
RevenueProfit Before Interest & Tax (PBIT)
The comparable restated figures (a) excluding Sponge Iron unit's results from both the current year and previous year, (b)considering Idea consolidation as 'Associate' in previous year and (c) adding Cement Business results in the current year's figures(w.e.f. 1st October, 2009), will be as under:
Quarter Ended Year Ended
RevenueProfit Before Interest & Tax (PBIT)
Minority Share in the profit for Quarter/Year ended 31st March, 2010 has increased on account of shares of SCL to be issued tothe Company's shareholders.
The Scheme of Arrangement under Sections 391 to 394 the Companies Act, 1956 for transfer of Sponge Iron unit of theCompany has become effective from 22nd May, 2009.
The Company has transferred all the assets and liabilities of the Sponge Iron unit as on 22nd May, 2009, on a going concernbasis to Vikram Sponge Iron Limited.
Extraordinary income of Rs 336.07 Crores (net of tax Rs 8.65 Crores) represents the profit on transfer of Sponge Iron unit.
The results of Idea Cellular Ltd. (Idea) were consolidated as a Joint Venture upto 31st December, 2008 in the previous year, whereasw.e.f. 1st January, 2009, the same are being consolidated as an 'Associate'.
- 5 -
The Scheme of Arrangement under Sections 391 to 394 of the Companies Act, 1956 to demerge the Cement Business of theCompany to it's wholly owned subsidiary, Samruddhi Cement Limited (SCL), has become effective from 1st October, 2009 (theAppointed Date) on completion of the necessary formalities in terms of the Scheme:
The Company has transferred all the assets and liabilities of the Cement Business as on the Appointed Date, on a going concernbasis to SCL.
SCL will issue one equity share of the face value of Rs.5 each, credited as fully paid up, to the shareholders of the Company forevery equity share they hold in the Company as on 28th May, 2010, the Record Date fixed for this purpose.
The excess of assets over liabilities relating to Cement Business transferred at book value to SCL has been adjusted against theReserves of the Company.
Results of the Cement Business from the Appointed Date are considered as results of SCL, instead of the Company onstandalone basis. Results for the previous quarter have been restated to include effects of the Scheme from the Appointed Date.
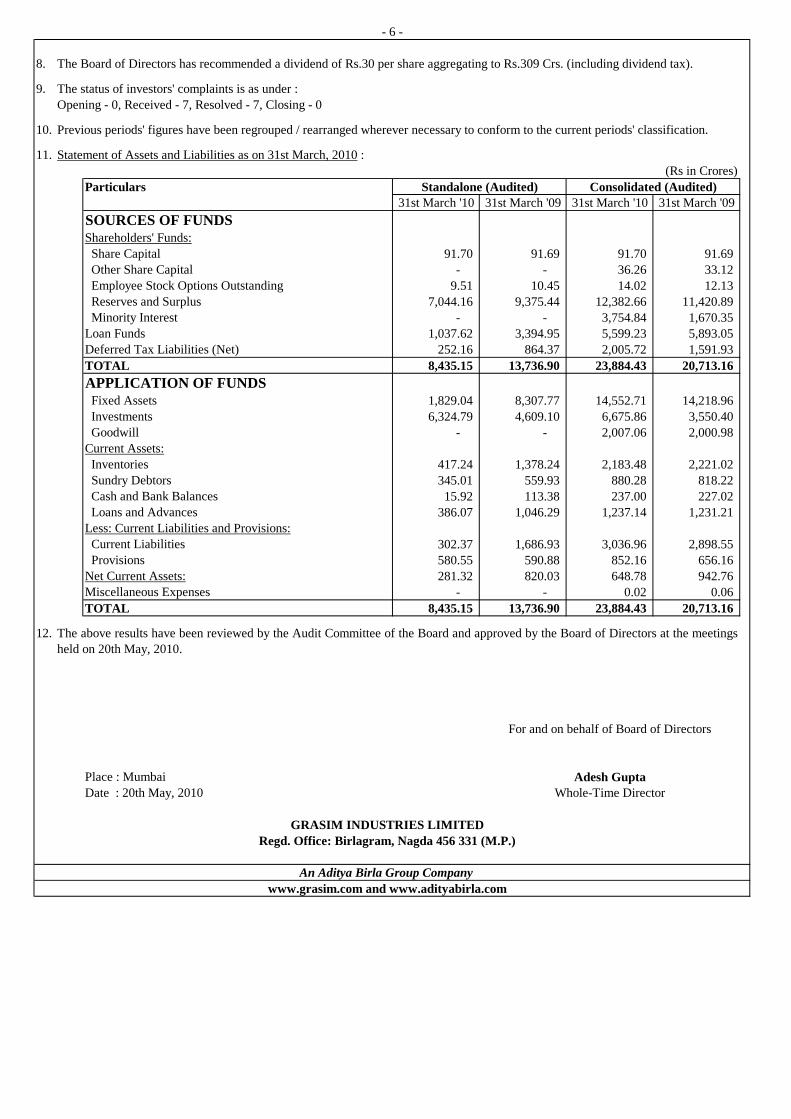
8. The Board of Directors has recommended a dividend of Rs.30 per share aggregating to Rs.309 Crs. (including dividend tax).
9. The status of investors' complaints is as under :Opening - 0, Received - 7, Resolved - 7, Closing - 0
10. Previous periods' figures have been regrouped / rearranged wherever necessary to conform to the current periods' classification.
11. Statement of Assets and Liabilities as on 31st March, 2010 :(Rs in Crores)
Particulars31st March '10 31st March '09 31st March '10 31st March '09
SOURCES OF FUNDSShareholders' Funds:Share Capital 91.70 91.69 91.70 91.69Other Share Capital - - 36.26 33.12Employee Stock Options Outstanding 9.51 10.45 14.02 12.13Reserves and Surplus 7,044.16 9,375.44 12,382.66 11,420.89Minority Interest - - 3,754.84 1,670.35
Loan Funds 1,037.62 3,394.95 5,599.23 5,893.05Deferred Tax Liabilities (Net) 252.16 864.37 2,005.72 1,591.93
TOTAL 8,435.15 13,736.90 23,884.43 20,713.16
APPLICATION OF FUNDSFixed Assets 1,829.04 8,307.77 14,552.71 14,218.96Investments 6,324.79 4,609.10 6,675.86 3,550.40Goodwill - - 2,007.06 2,000.98
Current Assets:Inventories 417.24 1,378.24 2,183.48 2,221.02Sundry Debtors 345.01 559.93 880.28 818.22Cash and Bank Balances 15.92 113.38 237.00 227.02Loans and Advances 386.07 1,046.29 1,237.14 1,231.21
Less: Current Liabilities and Provisions:Current Liabilities 302.37 1,686.93 3,036.96 2,898.55Provisions 580.55 590.88 852.16 656.16
Net Current Assets: 281.32 820.03 648.78 942.76Miscellaneous Expenses - - 0.02 0.06
TOTAL 8,435.15 13,736.90 23,884.43 20,713.16
12.
For and on behalf of Board of Directors
Place : Mumbai Adesh GuptaDate : 20th May, 2010 Whole-Time Director
The above results have been reviewed by the Audit Committee of the Board and approved by the Board of Directors at the meetingsheld on 20th May, 2010.
GRASIM INDUSTRIES LIMITEDRegd. Office: Birlagram, Nagda 456 331 (M.P.)
An Aditya Birla Group Company
www.grasim.com and www.adityabirla.com
- 6 -
Standalone (Audited) Consolidated (Audited)
Thank You