Embed Size (px)
Citation preview
ARTICLE
Received 16 Oct 2014 | Accepted 19 Mar 2015 | Published 24 Apr 2015
Both respiration and photosynthesis determinethe scaling of plankton metabolismin the oligotrophic oceanPablo Serret1,2, Carol Robinson3, Marıa Aranguren-Gassis1,w, Enma Elena Garcıa-Martın1,w,
Niki Gist4, Vassilis Kitidis4, Jose Lozano1,2, John Stephens4, Carolyn Harris4 & Rob Thomas5
Despite its importance to ocean–climate interactions, the metabolic state of the oligotrophic
ocean has remained controversial for 415 years. Positions in the debate are that it is either
hetero- or autotrophic, which suggests either substantial unaccounted for organic matter
inputs, or that all available photosynthesis (P) estimations (including 14C) are biased. Here
we show the existence of systematic differences in the metabolic state of the North
(heterotrophic) and South (autotrophic) Atlantic oligotrophic gyres, resulting from
differences in both P and respiration (R). The oligotrophic ocean is neither auto- nor hetero-
trophic, but functionally diverse. Our results show that the scaling of plankton metabolism by
generalized P:R relationships that has sustained the debate is biased, and indicate that the
variability of R, and not only of P, needs to be considered in regional estimations of the
ocean’s metabolic state.
DOI: 10.1038/ncomms7961
1 Departamento de Ecologıa y Biologıa animal, Universidad de Vigo, E36310 Vigo, Spain. 2 Estacion de Ciencias Marinas de Toralla, Universidad de Vigo,Toralla island, E-36331 Vigo, Spain. 3 School of Environmental Sciences, University of East Anglia, Norwich Research Park, Norwich NR4 7TJ, UK. 4 PlymouthMarine Laboratory, Prospect Place, Plymouth PL1 3DH, UK. 5 British Oceanographic Data Centre, Joseph Proudman Building, 6 Brownlow Street, Liverpool L35DA, UK. w Present addresses: 4WK Kellogg Biological Station, Michigan State University, 3700 E. Gull Lake Drive, Hickory Corners MI 49060, USA (M.A.-G.); School of Environmental Sciences, University of East Anglia, Norwich Research Park, Norwich NR4 7TJ, UK (E.E.G.-M.). Correspondence and requests formaterials should be addressed to P.S. (email: [email protected]).
NATURE COMMUNICATIONS | 6:6961 | DOI: 10.1038/ncomms7961 | www.nature.com/naturecommunications 1
& 2015 Macmillan Publishers Limited. All rights reserved.
The microbial biota of the surface ocean is a primedeterminant of the ocean’s productivity and biogeochem-ical functioning. Marine phytoplankton is responsible for
half of the Earth’s oxygenic photosynthesis, which contributes tothe redox state of the planet and the global cycles of C and O2 inthe ocean and atmosphere, affecting the global climate andcreating habitable conditions for many organisms1,2. Part of thephotosynthetically produced organic matter is respired in thesurface ocean, either to support the maintenance costs of thephytoplankton or by the heterotrophic activity of other microbes.This oxidation counterbalances the fluxes of C and O2 fromphotosynthesis, and reduces the net amount of organic matteravailable for consumption by metazoans. The difference betweenplankton photosynthesis (P) and auto- plus heterotrophicrespiration (R) is net community production (NCP), theamount of photosynthetically fixed C available for sequestrationto the deep ocean or for transfer up the marine food web3.Over significant scales, NCP summarizes the energy flow andmetabolic state of a planktonic ecosystem, setting upper boundsto its contribution to O2 and CO2 fluxes, and hence to globalclimate.
The oligotrophic ocean is the most extensive biome of theworld, occupying about half of the Earth’s surface. Its arealproductivity is limited because of the strong vertical stratificationof the water column that reduces nutrient inputs to theilluminated zone. However, its extent makes its contribution toglobal productivity, C export and biologically driven ocean–atmosphere fluxes significant4–6. In addition, climate change isincreasing both the area7 and stratification of oligotrophicgyres7,8, with feedbacks to the biological rates and themetabolic state. Despite its importance, the metabolic state ofthe oligotrophic ocean has remained controversial3, since delGiorgio et al.9 published a seminal paper on the relationshipbetween primary production and bacterial respiration in theocean. Direct measurements of community metabolism in low-production ecosystems show a prevalence of heterotrophy(PoR)10, that leads to the ‘intriguing, if not disquieting’ ideathat the extensive and remote oligotrophic ocean isheterotrophic3. These results are based on the in vitroincubation of small seawater samples (B125 ml) during shortperiods of time (B24 h), which are susceptible to biases from thebottle confinement of natural plankton communities11. Analternative to incubation-based methods is to study the indirectimpact of plankton metabolism on inventories of biogenic orlimiting compounds in large water bodies (km2) during longperiods of time (weeks to months)12–14. Contrary to directmeasurements of planktonic activity, results from this approachshow a prevalence of autotrophy (P4R) in the oligotrophicocean11. These calculations involve a large uncertainty derivedfrom the estimations of water mass mixing and air–sea gasexchange10, and assume a constancy in gradients of stocks andwater transport that conflicts with non-steady ocean dynamics15.
Beyond methodological biases that have played a major role inthe debate3,10,11, these two approaches measure differentprocesses over completely different time and spatial scales—snapshots of the NCP of single communities versus theintegrative metabolism of a succession of communities in awater mass. Comparison hence requires scaling-up in vitro datato the large and long spatial and temporal extent of in situestimates. To this aim, empirical P:R relationships have been usedto predict NCP from the extensive global data set of P (mainly14C derived)16–19. All the extrapolations carried out during thelast 15 years have found heterotrophy to prevail whenever P islow, leading some authors to conclude that the oligotrophic oceanis heterotrophic and the (autotrophic) in situ data are biased10.According to these authors, the input of organic matter to the
open ocean is much higher than the observations of stocks andexport from the euphotic zone, and non-oxygenic autotrophicprocesses (not included in P estimations) are significantly morerelevant than currently believed10. On the contrary, others haveconcluded that the oligotrophic ocean is autotrophic, and that allthe in vitro measurements of plankton production—includingtens of thousands of 14C measurements—could be biased becauseof the perturbation of the light conditions11. Such a widespreadand constant state of autotrophy would require a supply ofinorganic nutrients to the surface oligotrophic ocean at ratesmuch higher than observations of stocks and fluxes indicate15.Both positions hence ultimately imply unresolved explanatoryhypotheses that would force a reconsideration of our knowledgeabout the magnitude, variability and control of organic matterproduction and cycling in the open ocean.
Despite the lengthy discussion on methodological biases, verylittle attention has been paid to the scaling procedure that isessential for data comparisons. In all cases, the empirical P:R16–19
or P/R:P17,20 relationships are assumed universal16–18,20 orconstant for a certain latitudinal band (for example, 10–40�)19,which relies on some important and untested assumptions. Theidea that NCP (that is, P minus R) may be predicted in theoligotrophic ocean from P alone is based on the hypothesis thatchanges in P but not in R control the metabolic balance eitherglobally10,16–18,20 or at low latitudes11,19. This may occur becausethe variability of R is irrelevant or minor20–22, or because it istightly coupled to the variability of P16–19. In either case, the useof a single P:R relation implies that the influence ofP-independent processes on heterotrophic R (for example,magnitude and quality of allochthonous organic matter inputs,consumption of organic matter accumulated during productivephases, composition, structure and activity of the heterotrophiccommunities) are uniform throughout at least the low latitudeband of the global ocean. This is a very tenuous assumption, aseven in the most extensive data sets18,19 used both to calculatebalances and to derive P:R relationships10,11,18,19, the greatmajority of data from the oligotrophic ocean come from oneprovince, the Eastern Atlantic gyre (NAST-E). However, areduced number of observations in the South Atlantic gyrehave suggested differences in community metabolism that wouldreflect distinct P:R relationships23,24.
To test the assumption that no regional differences exist ineither the P:R relationship or the metabolic balance throughoutthe oligotrophic ocean, that is, to assess the basis of the scalingprocedure sustaining the debate, we have compiled 194 verticalprofiles (median five depths) in the epipelagic zone (defined hereas the layer between the surface and the 1% of photosyntheticallyactive radiation—PAR—depth) of in vitro derived P, R and NCPmeasurements (DO2 after 24-h light and dark incubations) madeacross the Atlantic (50� N–50� S) during 10 Atlantic MeridionalTransect (AMT11-18, AMT21-22) cruises from 2000 to 2012. Allthe cruises except AMT17 and AMT18 included both the Northand South gyres (NAST and SATL). This is a very consistent dataset in terms of sampling, incubation and analytical methodologyand precision, it is equivalent to B76% of non-AMT Atlanticdata in the latest published global NCP data set18, and includes 46profiles from the very undersampled SATL. The analysis of thisdata set confirms the prevalence of net heterotrophy in the NAST,but shows that the plankton metabolism in the similarlyoligotrophic SATL was predominantly autotrophic. Our datareveal significant differences in R, P:R relationship and NCPbetween the two Atlantic ocean gyres, indicating that theoligotrophic ocean is functionally diverse. This would bias anyregional to global prediction of NCP based on generalized P:Rrelationships, constraining the scaling of plankton metabolism tofunctionally coherent ecosystems.
ARTICLE NATURE COMMUNICATIONS | DOI: 10.1038/ncomms7961
2 NATURE COMMUNICATIONS | 6:6961 | DOI: 10.1038/ncomms7961 | www.nature.com/naturecommunications
& 2015 Macmillan Publishers Limited. All rights reserved.
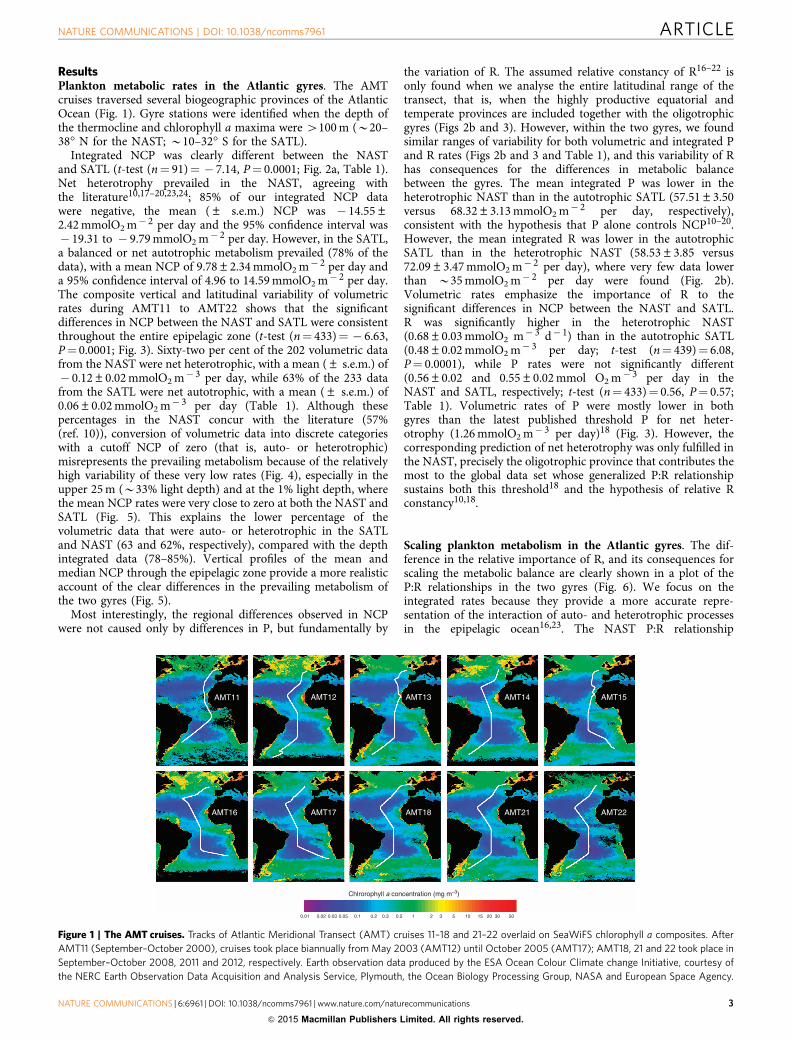
ResultsPlankton metabolic rates in the Atlantic gyres. The AMTcruises traversed several biogeographic provinces of the AtlanticOcean (Fig. 1). Gyre stations were identified when the depth ofthe thermocline and chlorophyll a maxima were 4100 m (B20–38� N for the NAST; B10–32� S for the SATL).
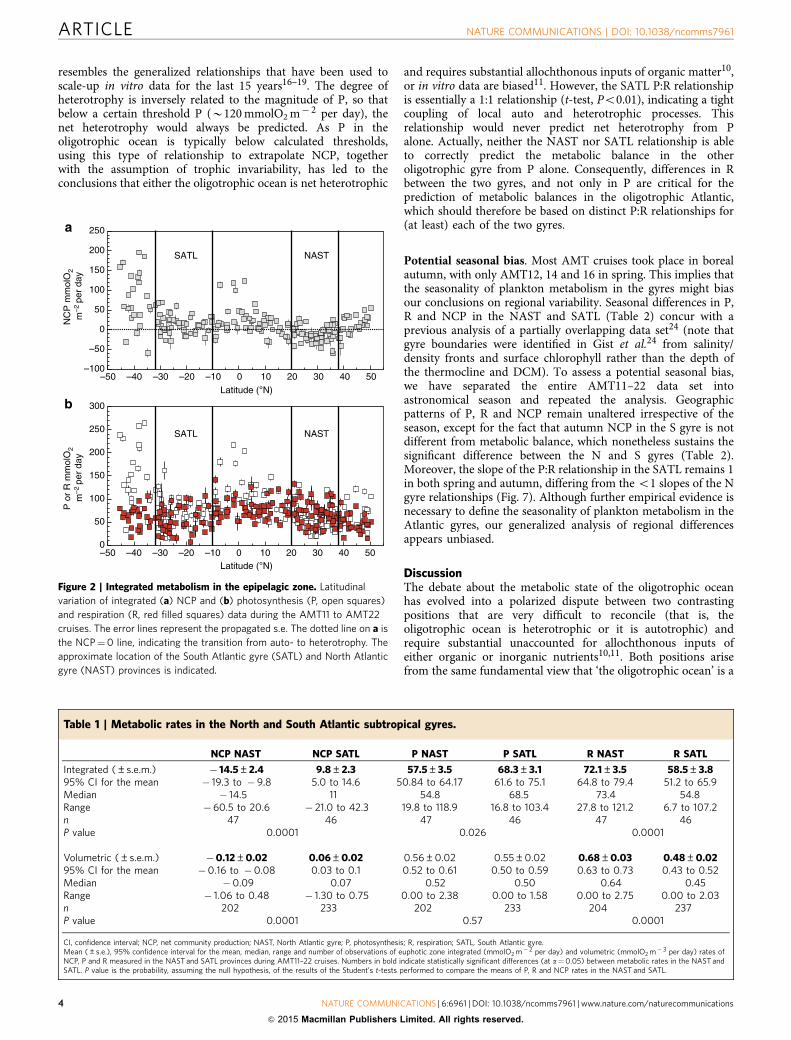
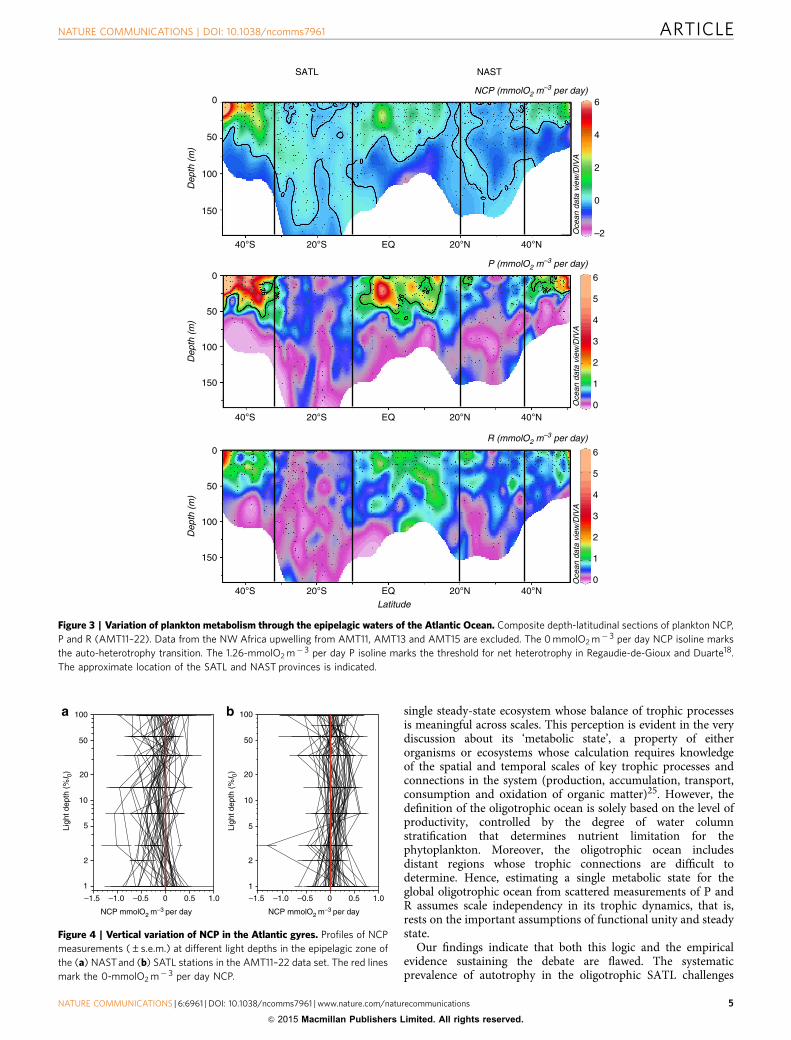
Integrated NCP was clearly different between the NASTand SATL (t-test (n¼ 91)¼ � 7.14, P¼ 0.0001; Fig. 2a, Table 1).Net heterotrophy prevailed in the NAST, agreeing withthe literature10,17–20,23,24; 85% of our integrated NCP datawere negative, the mean (± s.e.m.) NCP was � 14.55±2.42 mmolO2 m� 2 per day and the 95% confidence interval was� 19.31 to � 9.79 mmolO2 m� 2 per day. However, in the SATL,a balanced or net autotrophic metabolism prevailed (78% of thedata), with a mean NCP of 9.78±2.34 mmolO2 m� 2 per day anda 95% confidence interval of 4.96 to 14.59 mmolO2 m� 2 per day.The composite vertical and latitudinal variability of volumetricrates during AMT11 to AMT22 shows that the significantdifferences in NCP between the NAST and SATL were consistentthroughout the entire epipelagic zone (t-test (n¼ 433)¼ � 6.63,P¼ 0.0001; Fig. 3). Sixty-two per cent of the 202 volumetric datafrom the NAST were net heterotrophic, with a mean (± s.e.m.) of� 0.12±0.02 mmolO2 m� 3 per day, while 63% of the 233 datafrom the SATL were net autotrophic, with a mean (± s.e.m.) of0.06±0.02 mmolO2 m� 3 per day (Table 1). Although thesepercentages in the NAST concur with the literature (57%(ref. 10)), conversion of volumetric data into discrete categorieswith a cutoff NCP of zero (that is, auto- or heterotrophic)misrepresents the prevailing metabolism because of the relativelyhigh variability of these very low rates (Fig. 4), especially in theupper 25 m (B33% light depth) and at the 1% light depth, wherethe mean NCP rates were very close to zero at both the NAST andSATL (Fig. 5). This explains the lower percentage of thevolumetric data that were auto- or heterotrophic in the SATLand NAST (63 and 62%, respectively), compared with the depthintegrated data (78–85%). Vertical profiles of the mean andmedian NCP through the epipelagic zone provide a more realisticaccount of the clear differences in the prevailing metabolism ofthe two gyres (Fig. 5).
Most interestingly, the regional differences observed in NCPwere not caused only by differences in P, but fundamentally by
the variation of R. The assumed relative constancy of R16–22 isonly found when we analyse the entire latitudinal range of thetransect, that is, when the highly productive equatorial andtemperate provinces are included together with the oligotrophicgyres (Figs 2b and 3). However, within the two gyres, we foundsimilar ranges of variability for both volumetric and integrated Pand R rates (Figs 2b and 3 and Table 1), and this variability of Rhas consequences for the differences in metabolic balancebetween the gyres. The mean integrated P was lower in theheterotrophic NAST than in the autotrophic SATL (57.51±3.50versus 68.32±3.13 mmolO2 m� 2 per day, respectively),consistent with the hypothesis that P alone controls NCP10–20.However, the mean integrated R was lower in the autotrophicSATL than in the heterotrophic NAST (58.53±3.85 versus72.09±3.47 mmolO2 m� 2 per day), where very few data lowerthan B35 mmolO2 m� 2 per day were found (Fig. 2b).Volumetric rates emphasize the importance of R to thesignificant differences in NCP between the NAST and SATL.R was significantly higher in the heterotrophic NAST(0.68±0.03 mmolO2 m� 3 d� 1) than in the autotrophic SATL(0.48±0.02 mmolO2 m� 3 per day; t-test (n¼ 439)¼ 6.08,P¼ 0.0001), while P rates were not significantly different(0.56±0.02 and 0.55±0.02 mmol O2 m� 3 per day in theNAST and SATL, respectively; t-test (n¼ 433)¼ 0.56, P¼ 0.57;Table 1). Volumetric rates of P were mostly lower in bothgyres than the latest published threshold P for net heter-otrophy (1.26 mmolO2 m� 3 per day)18 (Fig. 3). However, thecorresponding prediction of net heterotrophy was only fulfilled inthe NAST, precisely the oligotrophic province that contributes themost to the global data set whose generalized P:R relationshipsustains both this threshold18 and the hypothesis of relative Rconstancy10,18.
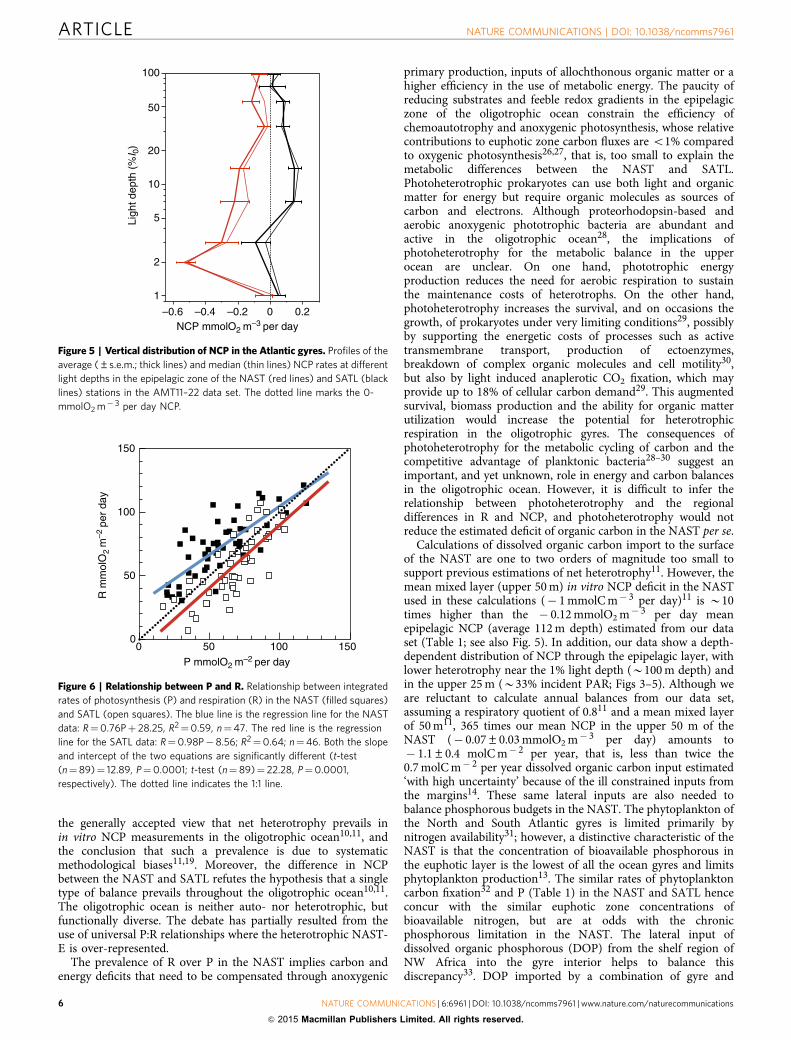
Scaling plankton metabolism in the Atlantic gyres. The dif-ference in the relative importance of R, and its consequences forscaling the metabolic balance are clearly shown in a plot of theP:R relationships in the two gyres (Fig. 6). We focus on theintegrated rates because they provide a more accurate repre-sentation of the interaction of auto- and heterotrophic processesin the epipelagic ocean16,23. The NAST P:R relationship
AMT12 AMT14 AMT15
AMT16 AMT17 AMT18 AMT21 AMT22
AMT13AMT11
0.01 0.02 0.03 0.05 0.1 0.2 0.3 0.5 1 2 3 5 10 15 20 30 50
Chlrorophyll a concentration (mg m–3)
Figure 1 | The AMT cruises. Tracks of Atlantic Meridional Transect (AMT) cruises 11–18 and 21–22 overlaid on SeaWiFS chlorophyll a composites. After
AMT11 (September–October 2000), cruises took place biannually from May 2003 (AMT12) until October 2005 (AMT17); AMT18, 21 and 22 took place in
September–October 2008, 2011 and 2012, respectively. Earth observation data produced by the ESA Ocean Colour Climate change Initiative, courtesy of
the NERC Earth Observation Data Acquisition and Analysis Service, Plymouth, the Ocean Biology Processing Group, NASA and European Space Agency.
NATURE COMMUNICATIONS | DOI: 10.1038/ncomms7961 ARTICLE
NATURE COMMUNICATIONS | 6:6961 | DOI: 10.1038/ncomms7961 | www.nature.com/naturecommunications 3
& 2015 Macmillan Publishers Limited. All rights reserved.
resembles the generalized relationships that have been used toscale-up in vitro data for the last 15 years16–19. The degree ofheterotrophy is inversely related to the magnitude of P, so thatbelow a certain threshold P (B120 mmolO2 m� 2 per day), thenet heterotrophy would always be predicted. As P in theoligotrophic ocean is typically below calculated thresholds,using this type of relationship to extrapolate NCP, togetherwith the assumption of trophic invariability, has led to theconclusions that either the oligotrophic ocean is net heterotrophic
and requires substantial allochthonous inputs of organic matter10,or in vitro data are biased11. However, the SATL P:R relationshipis essentially a 1:1 relationship (t-test, Po0.01), indicating a tightcoupling of local auto and heterotrophic processes. Thisrelationship would never predict net heterotrophy from Palone. Actually, neither the NAST nor SATL relationship is ableto correctly predict the metabolic balance in the otheroligotrophic gyre from P alone. Consequently, differences in Rbetween the two gyres, and not only in P are critical for theprediction of metabolic balances in the oligotrophic Atlantic,which should therefore be based on distinct P:R relationships for(at least) each of the two gyres.
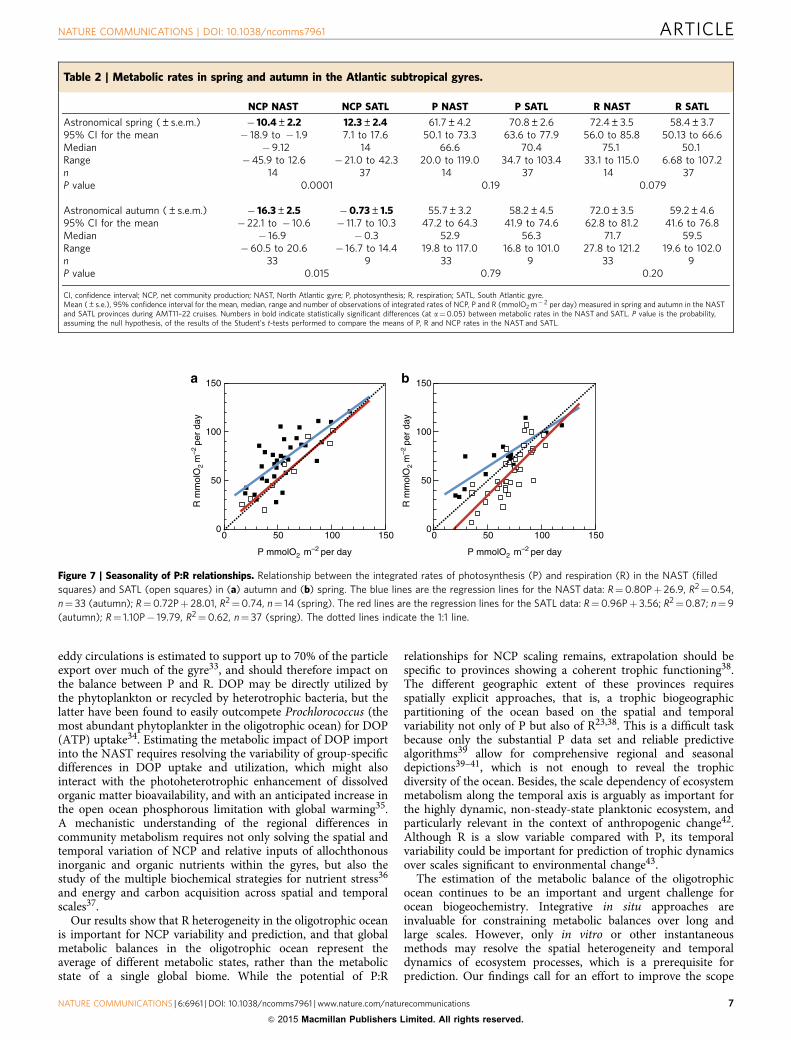
Potential seasonal bias. Most AMT cruises took place in borealautumn, with only AMT12, 14 and 16 in spring. This implies thatthe seasonality of plankton metabolism in the gyres might biasour conclusions on regional variability. Seasonal differences in P,R and NCP in the NAST and SATL (Table 2) concur with aprevious analysis of a partially overlapping data set24 (note thatgyre boundaries were identified in Gist et al.24 from salinity/density fronts and surface chlorophyll rather than the depth ofthe thermocline and DCM). To assess a potential seasonal bias,we have separated the entire AMT11–22 data set intoastronomical season and repeated the analysis. Geographicpatterns of P, R and NCP remain unaltered irrespective of theseason, except for the fact that autumn NCP in the S gyre is notdifferent from metabolic balance, which nonetheless sustains thesignificant difference between the N and S gyres (Table 2).Moreover, the slope of the P:R relationship in the SATL remains 1in both spring and autumn, differing from the o1 slopes of the Ngyre relationships (Fig. 7). Although further empirical evidence isnecessary to define the seasonality of plankton metabolism in theAtlantic gyres, our generalized analysis of regional differencesappears unbiased.
DiscussionThe debate about the metabolic state of the oligotrophic oceanhas evolved into a polarized dispute between two contrastingpositions that are very difficult to reconcile (that is, theoligotrophic ocean is heterotrophic or it is autotrophic) andrequire substantial unaccounted for allochthonous inputs ofeither organic or inorganic nutrients10,11. Both positions arisefrom the same fundamental view that ‘the oligotrophic ocean’ is a
Table 1 | Metabolic rates in the North and South Atlantic subtropical gyres.
NCP NAST NCP SATL P NAST P SATL R NAST R SATL
Integrated (±s.e.m.) � 14.5±2.4 9.8±2.3 57.5±3.5 68.3±3.1 72.1±3.5 58.5±3.895% CI for the mean � 19.3 to � 9.8 5.0 to 14.6 50.84 to 64.17 61.6 to 75.1 64.8 to 79.4 51.2 to 65.9Median � 14.5 11 54.8 68.5 73.4 54.8Range �60.5 to 20.6 � 21.0 to 42.3 19.8 to 118.9 16.8 to 103.4 27.8 to 121.2 6.7 to 107.2n 47 46 47 46 47 46P value 0.0001 0.026 0.0001
Volumetric (±s.e.m.) �0.12±0.02 0.06±0.02 0.56±0.02 0.55±0.02 0.68±0.03 0.48±0.0295% CI for the mean �0.16 to �0.08 0.03 to 0.1 0.52 to 0.61 0.50 to 0.59 0.63 to 0.73 0.43 to 0.52Median �0.09 0.07 0.52 0.50 0.64 0.45Range � 1.06 to 0.48 � 1.30 to 0.75 0.00 to 2.38 0.00 to 1.58 0.00 to 2.75 0.00 to 2.03n 202 233 202 233 204 237P value 0.0001 0.57 0.0001
CI, confidence interval; NCP, net community production; NAST, North Atlantic gyre; P, photosynthesis; R, respiration; SATL, South Atlantic gyre.Mean (±s.e.), 95% confidence interval for the mean, median, range and number of observations of euphotic zone integrated (mmolO2 m� 2 per day) and volumetric (mmolO2 m� 3 per day) rates ofNCP, P and R measured in the NAST and SATL provinces during AMT11–22 cruises. Numbers in bold indicate statistically significant differences (at a¼0.05) between metabolic rates in the NAST andSATL. P value is the probability, assuming the null hypothesis, of the results of the Student’s t-tests performed to compare the means of P, R and NCP rates in the NAST and SATL.
0
50
100
150
200
250
300
Latitude (°N)
Latitude (°N)
–50 –40 –30 –20 –10 0 10 20 30 40 50
–100
–50
0
50
100
150
200
250
–50 –40 –30 –20 –10 0 10 20 30 40 50
SATL NAST
SATL NAST
NC
P m
mol
O2
m–2
per
day
P o
r R
mm
olO
2 m
–2 p
er d
ay
Figure 2 | Integrated metabolism in the epipelagic zone. Latitudinal
variation of integrated (a) NCP and (b) photosynthesis (P, open squares)
and respiration (R, red filled squares) data during the AMT11 to AMT22
cruises. The error lines represent the propagated s.e. The dotted line on a is
the NCP¼0 line, indicating the transition from auto- to heterotrophy. The
approximate location of the South Atlantic gyre (SATL) and North Atlantic
gyre (NAST) provinces is indicated.
ARTICLE NATURE COMMUNICATIONS | DOI: 10.1038/ncomms7961
4 NATURE COMMUNICATIONS | 6:6961 | DOI: 10.1038/ncomms7961 | www.nature.com/naturecommunications
& 2015 Macmillan Publishers Limited. All rights reserved.
single steady-state ecosystem whose balance of trophic processesis meaningful across scales. This perception is evident in the verydiscussion about its ‘metabolic state’, a property of eitherorganisms or ecosystems whose calculation requires knowledgeof the spatial and temporal scales of key trophic processes andconnections in the system (production, accumulation, transport,consumption and oxidation of organic matter)25. However, thedefinition of the oligotrophic ocean is solely based on the level ofproductivity, controlled by the degree of water columnstratification that determines nutrient limitation for thephytoplankton. Moreover, the oligotrophic ocean includesdistant regions whose trophic connections are difficult todetermine. Hence, estimating a single metabolic state for theglobal oligotrophic ocean from scattered measurements of P andR assumes scale independency in its trophic dynamics, that is,rests on the important assumptions of functional unity and steadystate.
Our findings indicate that both this logic and the empiricalevidence sustaining the debate are flawed. The systematicprevalence of autotrophy in the oligotrophic SATL challenges
1
2
5
10
20
50
100
–1.5 –1.0 –0.5 0 0.5 1.0 –1.5 –1.0 –0.5 0 0.5 1.0
1
2
5
10
20
50
100
Ligh
t dep
th (
%I 0)
Ligh
t dep
th (
%I 0)
NCP mmolO2 m–3 per day NCP mmolO2 m
–3 per day
Figure 4 | Vertical variation of NCP in the Atlantic gyres. Profiles of NCP
measurements (±s.e.m.) at different light depths in the epipelagic zone of
the (a) NAST and (b) SATL stations in the AMT11–22 data set. The red lines
mark the 0-mmolO2 m� 3 per day NCP.
NASTSATL
0
50
100
Dep
th (
m)
150
Latitude
NCP (mmolO2 m–3 per day)6
4
2
0
–2
Dep
th (
m)
0
50
100
150
Dep
th (
m)
0
50
100
150
6
5
3
1
4
2
0
6
5
3
1
4
2
040°N20°N20°S40°S EQ
40°N20°N20°S40°S EQ
40°N20°N20°S40°S EQ
Oce
an d
ata
view
/DIV
AO
cean
dat
a vi
ew/D
IVA
Oce
an d
ata
view
/DIV
A
P (mmolO2 m–3 per day)
R (mmolO2 m–3 per day)
Figure 3 | Variation of plankton metabolism through the epipelagic waters of the Atlantic Ocean. Composite depth-latitudinal sections of plankton NCP,
P and R (AMT11–22). Data from the NW Africa upwelling from AMT11, AMT13 and AMT15 are excluded. The 0 mmolO2 m� 3 per day NCP isoline marks
the auto-heterotrophy transition. The 1.26-mmolO2 m� 3 per day P isoline marks the threshold for net heterotrophy in Regaudie-de-Gioux and Duarte18.
The approximate location of the SATL and NAST provinces is indicated.
NATURE COMMUNICATIONS | DOI: 10.1038/ncomms7961 ARTICLE
NATURE COMMUNICATIONS | 6:6961 | DOI: 10.1038/ncomms7961 | www.nature.com/naturecommunications 5
& 2015 Macmillan Publishers Limited. All rights reserved.
the generally accepted view that net heterotrophy prevails inin vitro NCP measurements in the oligotrophic ocean10,11, andthe conclusion that such a prevalence is due to systematicmethodological biases11,19. Moreover, the difference in NCPbetween the NAST and SATL refutes the hypothesis that a singletype of balance prevails throughout the oligotrophic ocean10,11.The oligotrophic ocean is neither auto- nor heterotrophic, butfunctionally diverse. The debate has partially resulted from theuse of universal P:R relationships where the heterotrophic NAST-E is over-represented.
The prevalence of R over P in the NAST implies carbon andenergy deficits that need to be compensated through anoxygenic
primary production, inputs of allochthonous organic matter or ahigher efficiency in the use of metabolic energy. The paucity ofreducing substrates and feeble redox gradients in the epipelagiczone of the oligotrophic ocean constrain the efficiency ofchemoautotrophy and anoxygenic photosynthesis, whose relativecontributions to euphotic zone carbon fluxes are o1% comparedto oxygenic photosynthesis26,27, that is, too small to explain themetabolic differences between the NAST and SATL.Photoheterotrophic prokaryotes can use both light and organicmatter for energy but require organic molecules as sources ofcarbon and electrons. Although proteorhodopsin-based andaerobic anoxygenic phototrophic bacteria are abundant andactive in the oligotrophic ocean28, the implications ofphotoheterotrophy for the metabolic balance in the upperocean are unclear. On one hand, phototrophic energyproduction reduces the need for aerobic respiration to sustainthe maintenance costs of heterotrophs. On the other hand,photoheterotrophy increases the survival, and on occasions thegrowth, of prokaryotes under very limiting conditions29, possiblyby supporting the energetic costs of processes such as activetransmembrane transport, production of ectoenzymes,breakdown of complex organic molecules and cell motility30,but also by light induced anaplerotic CO2 fixation, which mayprovide up to 18% of cellular carbon demand29. This augmentedsurvival, biomass production and the ability for organic matterutilization would increase the potential for heterotrophicrespiration in the oligotrophic gyres. The consequences ofphotoheterotrophy for the metabolic cycling of carbon and thecompetitive advantage of planktonic bacteria28–30 suggest animportant, and yet unknown, role in energy and carbon balancesin the oligotrophic ocean. However, it is difficult to infer therelationship between photoheterotrophy and the regionaldifferences in R and NCP, and photoheterotrophy would notreduce the estimated deficit of organic carbon in the NAST per se.
Calculations of dissolved organic carbon import to the surfaceof the NAST are one to two orders of magnitude too small tosupport previous estimations of net heterotrophy11. However, themean mixed layer (upper 50 m) in vitro NCP deficit in the NASTused in these calculations (� 1 mmolC m� 3 per day)11 is B10times higher than the � 0.12 mmolO2 m� 3 per day meanepipelagic NCP (average 112 m depth) estimated from our dataset (Table 1; see also Fig. 5). In addition, our data show a depth-dependent distribution of NCP through the epipelagic layer, withlower heterotrophy near the 1% light depth (B100 m depth) andin the upper 25 m (B33% incident PAR; Figs 3–5). Although weare reluctant to calculate annual balances from our data set,assuming a respiratory quotient of 0.811 and a mean mixed layerof 50 m11, 365 times our mean NCP in the upper 50 m of theNAST (� 0.07±0.03 mmolO2 m� 3 per day) amounts to� 1.1±0.4 molC m� 2 per year, that is, less than twice the0.7 molC m� 2 per year dissolved organic carbon input estimated‘with high uncertainty’ because of the ill constrained inputs fromthe margins14. These same lateral inputs are also needed tobalance phosphorous budgets in the NAST. The phytoplankton ofthe North and South Atlantic gyres is limited primarily bynitrogen availability31; however, a distinctive characteristic of theNAST is that the concentration of bioavailable phosphorous inthe euphotic layer is the lowest of all the ocean gyres and limitsphytoplankton production13. The similar rates of phytoplanktoncarbon fixation32 and P (Table 1) in the NAST and SATL henceconcur with the similar euphotic zone concentrations ofbioavailable nitrogen, but are at odds with the chronicphosphorous limitation in the NAST. The lateral input ofdissolved organic phosphorous (DOP) from the shelf region ofNW Africa into the gyre interior helps to balance thisdiscrepancy33. DOP imported by a combination of gyre and
1
2
5
10
20
50
100
–0.6 –0.4 –0.2 0 0.2
Ligh
t dep
th (
%I 0
)
NCP mmolO2 m–3 per day
Figure 5 | Vertical distribution of NCP in the Atlantic gyres. Profiles of the
average (±s.e.m.; thick lines) and median (thin lines) NCP rates at different
light depths in the epipelagic zone of the NAST (red lines) and SATL (black
lines) stations in the AMT11–22 data set. The dotted line marks the 0-
mmolO2 m� 3 per day NCP.
0
50
100
150
0 50 100 150
R m
mol
O2
m–2
per
day
P mmolO2 m–2 per day
Figure 6 | Relationship between P and R. Relationship between integrated
rates of photosynthesis (P) and respiration (R) in the NAST (filled squares)
and SATL (open squares). The blue line is the regression line for the NAST
data: R¼0.76Pþ 28.25, R2¼0.59, n¼47. The red line is the regression
line for the SATL data: R¼0.98P� 8.56; R2¼0.64; n¼46. Both the slope
and intercept of the two equations are significantly different (t-test
(n¼89)¼ 12.89, P¼0.0001; t-test (n¼ 89)¼ 22.28, P¼0.0001,
respectively). The dotted line indicates the 1:1 line.
ARTICLE NATURE COMMUNICATIONS | DOI: 10.1038/ncomms7961
6 NATURE COMMUNICATIONS | 6:6961 | DOI: 10.1038/ncomms7961 | www.nature.com/naturecommunications
& 2015 Macmillan Publishers Limited. All rights reserved.
eddy circulations is estimated to support up to 70% of the particleexport over much of the gyre33, and should therefore impact onthe balance between P and R. DOP may be directly utilized bythe phytoplankton or recycled by heterotrophic bacteria, but thelatter have been found to easily outcompete Prochlorococcus (themost abundant phytoplankter in the oligotrophic ocean) for DOP(ATP) uptake34. Estimating the metabolic impact of DOP importinto the NAST requires resolving the variability of group-specificdifferences in DOP uptake and utilization, which might alsointeract with the photoheterotrophic enhancement of dissolvedorganic matter bioavailability, and with an anticipated increase inthe open ocean phosphorous limitation with global warming35.A mechanistic understanding of the regional differences incommunity metabolism requires not only solving the spatial andtemporal variation of NCP and relative inputs of allochthonousinorganic and organic nutrients within the gyres, but also thestudy of the multiple biochemical strategies for nutrient stress36
and energy and carbon acquisition across spatial and temporalscales37.
Our results show that R heterogeneity in the oligotrophic oceanis important for NCP variability and prediction, and that globalmetabolic balances in the oligotrophic ocean represent theaverage of different metabolic states, rather than the metabolicstate of a single global biome. While the potential of P:R
relationships for NCP scaling remains, extrapolation should bespecific to provinces showing a coherent trophic functioning38.The different geographic extent of these provinces requiresspatially explicit approaches, that is, a trophic biogeographicpartitioning of the ocean based on the spatial and temporalvariability not only of P but also of R23,38. This is a difficult taskbecause only the substantial P data set and reliable predictivealgorithms39 allow for comprehensive regional and seasonaldepictions39–41, which is not enough to reveal the trophicdiversity of the ocean. Besides, the scale dependency of ecosystemmetabolism along the temporal axis is arguably as important forthe highly dynamic, non-steady-state planktonic ecosystem, andparticularly relevant in the context of anthropogenic change42.Although R is a slow variable compared with P, its temporalvariability could be important for prediction of trophic dynamicsover scales significant to environmental change43.
The estimation of the metabolic balance of the oligotrophicocean continues to be an important and urgent challenge forocean biogeochemistry. Integrative in situ approaches areinvaluable for constraining metabolic balances over long andlarge scales. However, only in vitro or other instantaneousmethods may resolve the spatial heterogeneity and temporaldynamics of ecosystem processes, which is a prerequisite forprediction. Our findings call for an effort to improve the scope
Table 2 | Metabolic rates in spring and autumn in the Atlantic subtropical gyres.
NCP NAST NCP SATL P NAST P SATL R NAST R SATL
Astronomical spring (±s.e.m.) � 10.4±2.2 12.3±2.4 61.7±4.2 70.8±2.6 72.4±3.5 58.4±3.795% CI for the mean � 18.9 to � 1.9 7.1 to 17.6 50.1 to 73.3 63.6 to 77.9 56.0 to 85.8 50.13 to 66.6Median � 9.12 14 66.6 70.4 75.1 50.1Range �45.9 to 12.6 � 21.0 to 42.3 20.0 to 119.0 34.7 to 103.4 33.1 to 115.0 6.68 to 107.2n 14 37 14 37 14 37P value 0.0001 0.19 0.079
Astronomical autumn (±s.e.m.) � 16.3±2.5 �0.73±1.5 55.7±3.2 58.2±4.5 72.0±3.5 59.2±4.695% CI for the mean � 22.1 to � 10.6 � 11.7 to 10.3 47.2 to 64.3 41.9 to 74.6 62.8 to 81.2 41.6 to 76.8Median � 16.9 �0.3 52.9 56.3 71.7 59.5Range � 60.5 to 20.6 � 16.7 to 14.4 19.8 to 117.0 16.8 to 101.0 27.8 to 121.2 19.6 to 102.0n 33 9 33 9 33 9P value 0.015 0.79 0.20
CI, confidence interval; NCP, net community production; NAST, North Atlantic gyre; P, photosynthesis; R, respiration; SATL, South Atlantic gyre.Mean (±s.e.), 95% confidence interval for the mean, median, range and number of observations of integrated rates of NCP, P and R (mmolO2 m� 2 per day) measured in spring and autumn in the NASTand SATL provinces during AMT11–22 cruises. Numbers in bold indicate statistically significant differences (at a¼0.05) between metabolic rates in the NAST and SATL. P value is the probability,assuming the null hypothesis, of the results of the Student’s t-tests performed to compare the means of P, R and NCP rates in the NAST and SATL.
0
50
100
150
0 50 100 1500
50
100
150
P mmolO2 m–2 per dayP mmolO2 m
–2 per day
0 50 100 150
R m
mol
O2
m–2
per
day
R m
mol
O2
m–2
per
day
Figure 7 | Seasonality of P:R relationships. Relationship between the integrated rates of photosynthesis (P) and respiration (R) in the NAST (filled
squares) and SATL (open squares) in (a) autumn and (b) spring. The blue lines are the regression lines for the NAST data: R¼0.80Pþ 26.9, R2¼0.54,
n¼ 33 (autumn); R¼0.72Pþ 28.01, R2¼0.74, n¼ 14 (spring). The red lines are the regression lines for the SATL data: R¼0.96Pþ 3.56; R2¼0.87; n¼9
(autumn); R¼ 1.10P� 19.79, R2¼0.62, n¼ 37 (spring). The dotted lines indicate the 1:1 line.
NATURE COMMUNICATIONS | DOI: 10.1038/ncomms7961 ARTICLE
NATURE COMMUNICATIONS | 6:6961 | DOI: 10.1038/ncomms7961 | www.nature.com/naturecommunications 7
& 2015 Macmillan Publishers Limited. All rights reserved.
and resolution of R and NCP measurements in the ocean. Whilewe are far from a mechanistic understanding of the variability ofplankton trophic functioning, the scale difference between in situand in vitro methods provides unique opportunities to derive andtest system-dependent empirical models for NCP extrapolation. Abetter appreciation of the scaling of metabolic processes tobiogeochemical fluxes is a priority to improve our prediction ofthe ocean’s interaction with the changing climate.
MethodsSampling. Ten latitudinal (B50� N–45� S) transects of B70 stations across theAtlantic Ocean were conducted from 2000 to 2012 on RRS James Clark Ross, RRSDiscovery and RRS James Cook between the United Kingdom and South America(Fig. 1). All the cruises except AMT17 and AMT18 included measurements ofmetabolism in both the North and South gyres (NAST and SATL). AMT cruises11, 13, 15 and 17–22 took place in boreal autumn, while AMT12, 14 and 16 were inboreal spring. Details of sampling, incubation and analytical procedures foreach cruise, including the complete cruise reports, may be found at http://www.amt-uk.org/ and Robinson et al.44
Chlorophyll a concentration. During each cruise, vertical profiles of temperatureand fluorescence were obtained twice daily (at B2 h before dawn and at solarnoon) to a depth of B300 m with SeaBird and WETLabs Wet star sensors fitted toa SeaBird 9/11 plus CTD system. Chlorophyll a concentration was derived fromcalibrated fluorescence readings. A rosette of 24� 20 l Niskin bottles fitted with theCTD system was used to collect seawater samples from six to nine depths(including light depths sampled for photosynthesis and respiration incubations—see below) to calibrate the CTD fluorometer following Welschmeyer45. Samples of250 ml were filtered through 47-mm 0.2-mm polycarbonate filters. The filters wereplaced in a vial with 10 ml 90% acetone and left in a freezer for 24 h. The sampleswere then analysed on a precalibrated Turner Designs Trilogy fluorometer with anon-acidified chl module (CHL NA #046) fitted.
Plankton metabolism. Gross photosynthesis (P), dark community respiration (R)and NCP were determined from in vitro changes in dissolved O2 after 24-h lightand dark bottle incubations. Although in situ incubations would be preferred todeck incubations, they were prevented by cruise logistics (AMT cruises are cruisesof opportunity where stations last B2 h and are separated by B350 km(B13,500 km transect sampled over 42 days). Seawater was sampled daily, B2 hbefore dawn, from three to six depths (median 5) using the rosette of 24� 20 lNiskin bottles. The total number of suitable stations ranges from 8 (AMT17) to 37(AMT22) (mean of 19). Water was collected into opaque polypropylene aspiratorsfrom 4 (AMT12), 5 (AMT11,14,15,16,17) or 6 (AMT13,18,21,22) light depthscovering the PAR range from B97 to 1% of surface irradiance. Actual light depthschanged between stations and cruises, but typically included 97, 33, 14, 7 and 1% ofsurface irradiance. Irradiance levels were determined from light measurementsmade the previous day, and the assumption that the deep fluorescence maximumapproximated the depth to which 1% of surface irradiance reached. The depth ofthe 1% light in the next noon PAR profile was always within 7% of our estimateddepth. Twelve to 18 120-cm3, gravimetrically calibrated, borosilicate glass bottleswere carefully filled from each aspirator bottle using silicon tubing, overflowing by4250 ml. From each depth, four to six replicate ‘zero-time’ bottles were fixedimmediately with Winkler reagents (1 ml of 3 M MnCl or MnSO4 and 1 ml of (8 MKOHþ 4 M KI) solutions) added separately with an automatic multipipette. Twofurther sets of four to six replicates were incubated for 24 h in surface water-cooleddeck incubators or in temperature controlled water baths at in situ temperatures.These numbers of replicates are enough to obtain average coefficients of variationof the O2 concentration measurements in the zero, dark and light bottles o0.1%,while allowing the daily completion by one person of all the analyses correspondingto five to six depths. One set of replicates was incubated in the dark, the other set inthe equivalent irradiance to that found at the in situ sampling depth using variouscombinations of neutral density and blue plastic filters. Owing to limitations ofsample water volume and analysis time during AMT12 and 13, we assumed thatplankton community structure was homogeneous within the surface 15 m and soincubated a set of replicates sampled from the 55% light depth at 97% of surfaceirradiance. Flow cytometry data from AMT13 confirmed that this was a reasonableassumption, since picoplankton cell abundance varied by less than 5% between thetwo light depths throughout the transect, and nanoplankton varied by 11% (ref.24). Incubations always started at dawn, and during the hours of darkness theincubators were covered with opaque screens to prevent interference from theship’s deck lights. After the 24-h incubation period, the dark and light bottles werefixed with Winkler reagents. Dissolved oxygen concentration was determined withautomated Winkler titration systems using potentiometric (Metrohm 716 DMSTitrino)46 or photometric47 end-point detection. For the potentiometric method,aliquots of fixed samples were delivered with a 50-ml overflow pipette. Fixing,storage and standardization procedures followed the recommendations byGrasshoff et al.48 Production and respiration rates were calculated from the
difference between the means of the replicate light and dark incubated bottles andzero-time analyses: NCP¼DO2 in light bottles (mean of [O2] in 24-h light—meanzero time [O2]); R¼DO2 in dark bottles (mean zero time [O2]—mean [O2] in 24-hdark); P¼NCPþR. The average s.e.m. of both the NCP and R rate measurements(which includes both experimental and biological variability) was 0.18 (n¼ 875 and876, respectively) mmolO2 m� 3 per day. Integrated values were obtained bytrapezoidal integration of the volumetric data down to the depth of 1% surfaceincident photosynthetically active irradiance. The s.d. of integrated P, R and NCPwas calculated through propagation of the random error in the volumetricmeasurements. Samples were excluded (16 stations) when significant negativevalues of either P or R were measured, or when the variance of replicatedmeasurements was anomalously high. The NAST and SATL P, R and NCP data arenormality distributed (Lilliefors test, a¼ 0.05).
The complete volumetric data set of P, R and NCP is available athttp://www.uea.ac.uk/environmental-sciences/people/People/Facultyþ andþResearchþ Fellow/robinsonc#research maintained by Carol Robinson. Thecomplete data set of all the physical, chemical and biological variables from eachcruise is available at BODC (http://www.bodc.ac.uk/projects/uk/amt). Theconditions under which the data may be used are in line with the NERC DataPolicy (http://www.nerc.ac.uk/research/sites/data/policy/), and will be explainedfollowing a request, before the delivery of data.
References1. Falkowski, P. G. The role of phytoplankton photosynthesis in global
biogeochemical cycles. Photosynth. Res. 39, 235–258 (1994).2. Falkowski, P. G., Fenchel, T. & Delong, E. F. The microbial engines that drive
Earth’s biogeochemical cycles. Science 320, 1034–1039 (2008).3. Ducklow, H. W. & Doney, S. C. What is the metabolic state of the oligotrophic
ocean? A debate. Ann. Rev. Mar. Sci. 5, 525–533 (2013).4. Emerson, S. et al. Experimental determination of organic carbon flux from
open-ocean surface waters. Nature 389, 951–954 (1997).5. Neuer, S. et al. Differences in the biological carbon pump at three subtropical
ocean sites. Geophys. Res. Lett. 29, 321–324 (2002).6. Christian, J. R. Biogeochemical cycling in the oligotrophic ocean: Redfield and
non-Redfield models. Limnol. Oceanogr. 50, 646–657 (2005).7. Polovina, J. J., Howell, E. A. & Abecassis, M. Ocean’s least productive waters are
expanding. Geophys. Res. Lett. 35, L03618 (2008).8. Bidigare, R. R. et al. Subtropical ocean ecosystem structure changes forced by
North Pacific climate variations. J. Plankton Res. 31, 1131–1139 (2009).9. del Giorgio, P. A., Cole, J. J. & Cimbleris, A. Respiration rates in bacteria exceed
phytoplankton production in unproductive aquatic systems. Nature 385,148–151 (1997).
10. Duarte, C. M., Regaudie-de-Gioux, A., Arrieta, J. M., Delgado-Huertas, A. &Agustı, S. The oligotrophic ocean is heterotrophic. Ann. Rev. Mar. Sci. 5,551–569 (2013).
11. Williams, P.J.le. B., Quay, P. D., Westberry, T. K. & Behrenfeld, M. J. Theoligotrophic ocean is autotrophic. Ann. Rev. Mar. Sci. 5, 535–549 (2013).
12. Emerson, S., Stump, C. & Nicholson, D. Net biological oxygen production inthe ocean: remote in situ measurements of O2 and N2 in surface waters. GlobalBiogeochem. Cy. 22, GB3023 (2008).
13. Lipschultz, F., Bates, N. R., Carlson, C. A. & Hansell, D. A. New production inthe Sargasso Sea: History and current status. Global Biogeochem. Cy. 16, 1–17(2002).
14. Hansell, D. A., Ducklow, H. W., Macdonald, A. M. & Baringer, M. O. Metabolicpoise in the North Atlantic Ocean diagnosed from organic matter transports.Limnol. Oceanogr. 49, 1084–1094 (2004).
15. Kahler, P., Oschlies, A., Dietze, H. & Koeve, W. Oxygen, carbon, and nutrientsin the oligotrophic eastern subtropical North Atlantic. Biogeosciences 7,1143–1156 (2010).
16. Williams, P. J.le. B. The balance of plankton respiration and photosynthesis inthe open oceans. Nature 394, 55–57 (1998).
17. Duarte, C. M. & Agustı, S. The CO2 balance of unproductive aquaticecosystems. Science 281, 234–236 (1998).
18. Regaudie-de-Gioux, A. & Duarte, C. M. Global patterns in oceanic planktonicmetabolism. Limnol. Oceanogr. 58, 977–986 (2013).
19. Westberry, T. B., Williams, P. J.le. B. & Behrenfeld, M. J. Global net communityproduction and the putative net heterotrophy of the oligotrophic oceans. GlobalBiogeochem. Cy. 26, GB4019 (2012).
20. Arıstegui, J. & Harrison, W. G. Decoupling of primary production andcommunity respiration in the ocean: implications for regional carbon studies.Aquat. Microb. Ecol. 29, 199–209 (2002).
21. Karl, D. M., Laws, E. A., Morris, P., Williams, P.J.le.B. & Emerson, S. Metabolicbalance of the open sea. Nature 426, 32 (2003).
22. Williams, P. J.le. B., Morris, P. & Karl, D. M. Net community production andmetabolic balance at the oligotrophic ocean site, station ALOHA. Deep-Sea Res.I 51, 1563–1578 (2004).
23. Serret, P., Fernandez, E. & Robinson, C. Biogeographic differences in the netecosystem metabolism of the open ocean. Ecology 83, 3225–3234 (2002).
ARTICLE NATURE COMMUNICATIONS | DOI: 10.1038/ncomms7961
8 NATURE COMMUNICATIONS | 6:6961 | DOI: 10.1038/ncomms7961 | www.nature.com/naturecommunications
& 2015 Macmillan Publishers Limited. All rights reserved.
24. Gist, N., Serret, P., Woodward, E. M. S., Chamberlain, K. & Robinson, C.Seasonal and spatial variability in plankton production and respiration in theSubtropical Gyres of the Atlantic Ocean. Deep-Sea Res. II 56, 931–940 (2009).
25. Smith, S. V. & Hollibaugh, J. T. Annual cycle and interannual variability ofecosystem metabolism in a temperate climate embayment. Ecol. Monogr. 67,509–533 (1997).
26. Middelburg, J. J. Chemoautotrophy in the ocean. Geophys. Res. Lett. 38, L24604(2011).
27. Goericke, R. Bacteriochlorophyll a in the ocean: is anoxygenic bacterialphotosynthesis important? Limnol. Oceanogr. 47, 290–295 (2002).
28. Kirchman, D. L. & Hanson, T. E. Bioenergetics of photoheterotrophic bacteriain the oceans. Environ. Microbiol. Rep. 5, 188–199 (2013).
29. Palovaara, J. et al. Stimulation of growth by proteorhodopsin phototrophyinvolves regulation of central metabolic pathways in marine planktonicbacteria. Proc. Natl Acad. Sci. USA 111, E3650–E3658 (2014).
30. Koblızek, J. in Microbial Carbon Pump in the Ocean. (eds Jiao, N., Azam, F. &Sanders, S.) 49–51 (Science/AAAS, 2011).
31. Moore, C. M. et al. Processes and patterns of oceanic nutrient limitation. Nat.Geosci. 6, 701–710 (2013).
32. Poulton, A. J. et al. Phytoplankton carbon fixation, chlorophyll-biomass anddiagnostic pigments in the Atlantic Ocean. Deep-Sea Res. II 53, 1593–1610(2006).
33. Reynolds, S., Mahaffey, C., Roussenov, V. & Williams, R. G. Evidence forproduction and lateral transport of dissolved organic phosphorus in the easternsubtropical North Atlantic. Global Biogeochem. Cy. 28, 805–824 (2014).
34. Bjorkman, K., Duhamel, S. & Karl, D. M. Microbial group specific uptakekinetics of inorganic phosphate and adenosine-50-triphosphate (ATP) in theNorth Pacific Subtropical Gyre. Front. Microbiol. 3, 1–17 (2012).
35. Karl, D. M., Bidigare, R. R. & Letelier, R. M. Long-term changes in planktoncommunity structure and productivity in the North Pacific subtropical gyre: thedomain shift hypothesis. Deep-Sea Res. II 48, 1449–1470 (2001).
36. Saito, M. A. et al. Multiple nutrient stresses at intersecting Pacific Ocean biomesdetected by protein biomarkers. Science 345, 1173–1177 (2014).
37. Karl, D. M. Microbial oceanography: paradigms, processes and promise. Nat.Rev. Microbiol. 5, 759–769 (2007).
38. Serret, P. et al. Predicting plankton net community production in the AtlanticOcean. Deep-Sea Res. II 56, 941–953 (2009).
39. Carr, M. E. et al. A comparison of global estimates of marine primaryproduction from ocean color. Deep-Sea Res. II 53, 741–770 (2006).
40. Chavez, F. P., Messie, M. & Pennington, J. T. Marine primary production inrelation to climate variability and change. Ann. Rev. Mar. Sci. 3, 227–260(2011).
41. Longhurst, A. Ecological Geography of the Sea 2 (Academic Press, 2006).42. Wolkovich, E. M., Cook, B. I., McLauchlan, K. K. & Davies, T. J. Temporal
ecology in the Anthropocene. Ecol. Lett. 17, 1365–1379 (2014).43. Carpenter, S. R. & Turner, M. G. Hares and tortoises: interactions of fast and
slow variables in ecosystems. Ecosystems 3, 495–497 (2001).44. Robinson, C. et al. The Atlantic Meridional Transect (AMT) Programme:
a contextual view 1995-2005. Deep Sea Res. II 53, 1485–1515 (2006).
45. Welschmeyer, N. A. Fluorometric analysis of chlorophyll-a in the presence ofchlorophyll-b and phaeopigments. Limnol. Oceanogr. 39, 1985–1992 (1994).
46. Oudot, C., Gerard, R., Morin, P. & Gningue, I. Precise shipboard determinationof dissolved oxygen (Winkler procedure) for productivity studies with acommercial system. Limnol. Oceanogr. 33, 146–150 (1988).
47. Williams, P. J.le. B. & Jenkinson, N. W. A transportable micro-processor con-trolled precise Winkler titration suitable for field station and shipboard use.Limnol. Oceanogr. 27, 576–584 (1982).
48. (eds Grasshoff, K., Ehrhardt, M. & Kremling, K.) Methods of Seawater Analysis2nd edn, 419 (Verlag Chemie, 1983).
AcknowledgementsWe thank the principal scientists and all personnel on board during the AMT11 toAMT22 cruises. Special thanks to Sandy Thomalla, Mike Lucas, Alex Poulton, PatrickHolligan, Andy Rees and Claire Widdicombe for chlorophyll a measurements used tocalibrate the CTD fluorescence sensor used to determine the depth of the DCM, and toGavin Tilstone for support with the incubations. This study is a contribution to theinternational IMBER project and was supported by the UK Natural EnvironmentResearch Council National Capability funding to Plymouth Marine Laboratory and theNational Oceanography Centre, Southampton. We acknowledge the UK NERC fundingrequired to initiate and sustain the AMT programme: two Plankton Reactivity in theMarine Environment (PRIME) research grants and the Plymouth Marine LaboratoryCore Strategic Research Programme sustaining AMT (1995–2000), the AMT consortiumgrant NER/O/S/2001/00680 awarded to C.R. (2001–2006) and the Oceans 2025 pro-gramme that funded AMT (2007–2012). We also acknowledge the Spanish MICINNgrants CTM2009-0S069-E/MAR and CTM2011-29616 awarded to P.S., which funded theparticipation of M.A.-G., E.E.G.-M., J.L. and P.S. in AMT cruises. This is contributionnumber 255 of the AMT programme.
Author contributionsP.S. designed this work and wrote the manuscript, based on the ideas that were thor-oughly discussed with C.R., who revised the manuscript. M.A.-G., E.E.G.-M. and V.K.provided additional insight to both the conception and review of the paper. P.S., C.R.,M.A.-G., E.E.G.-M., N.G., V.K., J.L. and J.S. measured plankton metabolism on AMTcruises. C.H. and R.T. provided the AMT22 nutrients and chlorophyll a data,respectively.
Additional informationCompeting financial interests: The authors declare no competing financial interests.
Reprints and permission information is available online at http://npg.nature.com/reprintsandpermissions/
How to cite this article: Serret, P. et al. Both respiration and photosynthesis determinethe scaling of plankton metabolism in the oligotrophic ocean. Nat. Commun. 6:6961doi: 10.1038/ncomms7961 (2015).
NATURE COMMUNICATIONS | DOI: 10.1038/ncomms7961 ARTICLE
NATURE COMMUNICATIONS | 6:6961 | DOI: 10.1038/ncomms7961 | www.nature.com/naturecommunications 9
& 2015 Macmillan Publishers Limited. All rights reserved.