Embed Size (px)
Citation preview

Brazil’s Moment in the Sun Panel Detail:Wednesday, April 28, 2010 11:00 AM - 12:15 PM
Speakers:
Jose Alfredo Graca Lima, Consulate General of Brazil
Everaldo Franca, CEO, PPS Portfolio Performance Inc.
Jerson Kelman, CEO, Light; Partner, BR Investimentos
Ricardo Weiss, Investment Director, Fapes
Moderator:
Vinicius Lummertz, Secretary for Foreign Affairs, Government of the State of Santa Catarina, Brazil
1

Brazil’s economy beginning to recover
Source: Bloomberg.
2

Per capita GDP has risen 170% since 2002
Source: Bloomberg.
3

Brazil’s population approaching 200 million
Source: Bloomberg.
4

Brazil’s fertility rate continues to fall
Source: IBGE.*Projection
5

Brazil’s fertility rate compared to other BRICs and G7 countries
Source: Population Reference Bureau.
6

Brazil maintains relatively low governmentdebt-to-GDP ratio
Source: IMF.
7

Brazil now ranks 10th globally in high net worth individuals
Sources: Merrill Lynch & Cap Gemini.Note: high net worth defined as having greater than $1 million in liquid assets
8

Brazil’s growth in high net worth individuals leads other BRIC nations
Sources: Merrill Lynch & Cap Gemini.Note: high net worth defined as having greater than $1 million in liquid assets
9

Brazil and other BRIC country stock markets outperforming U.S.Daily: January 1, 2006 – April 20, 2010
Source: Bloomberg.
10

Market capitalization of Brazil’s primary stock index beginning to rebound
Source: BM&FBOVESPA.
11

Market capitalization of Brazil’s largest firms similar to major U.S. firms
Source: Bloomberg.
12

Brazil’s history of volatile inflation swingsMonthly: January 1996 – March 2010
Source: Bloomberg.
13

Brazil has yet to tighten post-recession Monthly: January 2000 – March 2010
Source: Bloomberg.
14

Unemployment in Brazil has fallen graduallyover the last six years
Source: IBGE.
15

Brazil’s unemployment rate peaked at 9% in recent recession
Source: IBGE.
16

Both consumer and business confidence on the rebound in Brazil
Sources: Fecomercio SP, CNI.
17

China and U.S. are top destinations for Brazil’s exports
Source: MDIC/Secex.
18

Brazil serves as major export market for U.S. and China
Source: MDIC/Secex.
19

Netherlands and U.S. lead foreign direct investment (FDI) in Brazil
Source: Banco Central do Brasil.
20

Argentina is top Latin American destination for Brazil’s exports
Source: MDIC/Secex.
21

Brazil is a major export market for Latin American countries such as Argentina
Source: MDIC/Secex.
22
Chile makes up majority of Latin America foreign direct investment (FDI) in Brazil
Source: Banco Central do Brasil.
23

Brazil’s direct investment in Latin America goes primarily to Argentina and Peru
Source: Banco Central do Brasil.
24
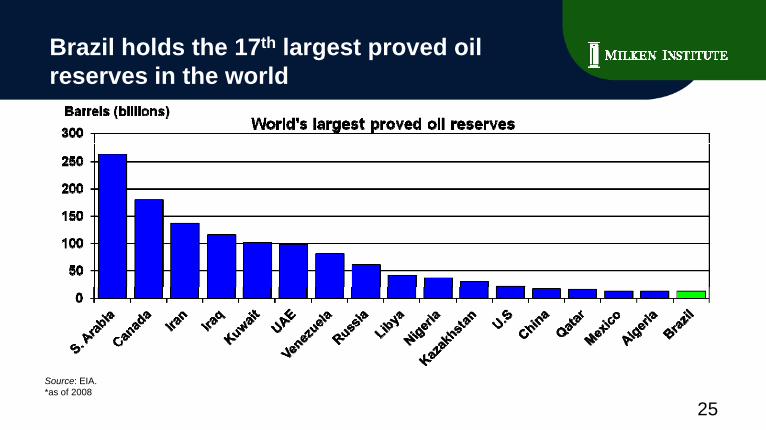
Brazil holds the 17th largest proved oil reserves in the world
Source: EIA.*as of 2008
25

Brazil is the 12th largest oil producer in the world
Source: EIA.*as of 2008
26

Brazil is the 7th largest oil consumer in the world
Source: EIA, as of 2008.
27

Liquid fuel consumption has risen rapidly in Brazil
Source: EIA.* Projections
28

Liquid fuel consumption forecast to rise roughly 5% per annum in 2010 and 2011
Source: EIA.* Projections
29

Global carbon dioxide (CO2) emissions shifting towards emerging markets
Source: EIA.*Projections
30

Brazil’s energy-related carbon dioxide (CO2) emissions are relatively low
Source: EIA.*Projections
31

BRIC country energy-related carbon dioxide (CO2) emissions are forecast to rise
Source: EIA.
32

U.S. and Brazil are world leaders in biofuels consumption
Source: EIA.
33

Global biofuels consumption has risen dramatically
Source: EIA.
34

U.S. and Brazil are world leaders in biofuels production
Source: EIA.
35

Global biofuels production has risen dramatically
Source: EIA.
36
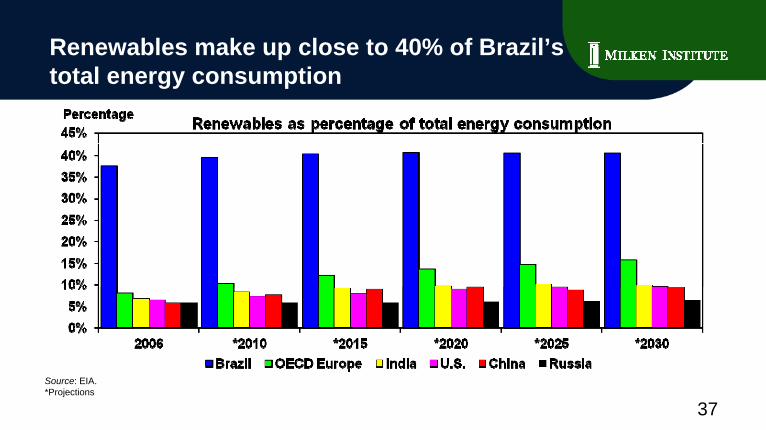
Renewables make up close to 40% of Brazil’stotal energy consumption
Source: EIA.*Projections
37

Renewables make up far greater portion of total energy consumption in Brazil vs. U.S.
Source: EIA.*Projections
38

Rate of deforestation steadily declining
Source: INPE.
39
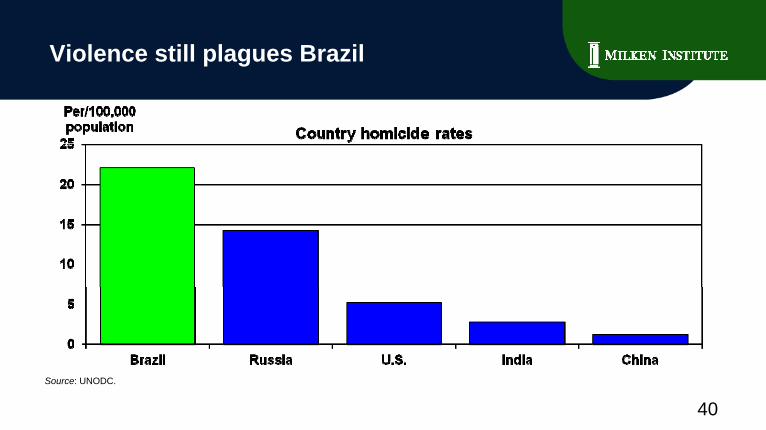
Violence still plagues Brazil
Source: UNODC.
40

Violence in Rio de Janeiro still high
Source: UNODC.
41
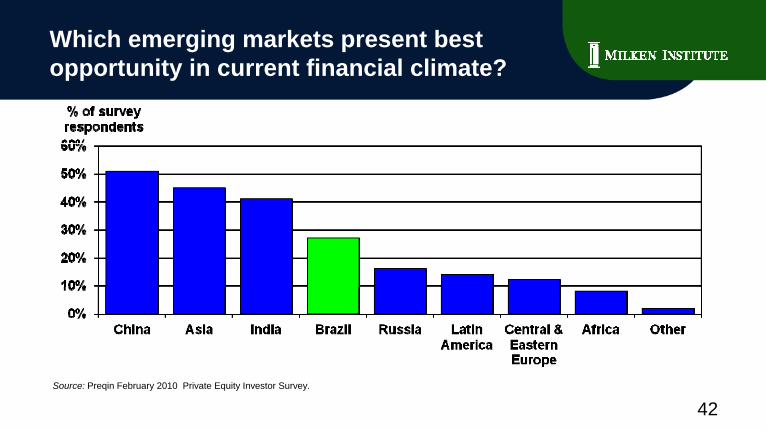
Which emerging markets present best opportunity in current financial climate?
Source: Preqin February 2010 Private Equity Investor Survey.
42

World Bank Ease of Doing Business IndexAnnual ranking (1 = best)
2010 Global Rank 2009 Global Rank 2008 Global RankUnited States 4th 4th 3rdUnited States 4 4 3United Kingdom 5th 6th 6th
Japan 15th 13th 12th
Germany 25th 27th 20th
France 31st 31st 31st
Italy 78th 74th 53rd
China 89th 86th 90thChina 89 86 90Russia 120th 118th 106th
Brazil 129th 127th 122nd
India 133rd 132nd 120th
Source: World Bank Ease of Doing Business Index.
43

Transparency International Corruption Perceptions IndexAnnual ranking (1 = least corrupt)
2009 Global Rank 2008 Global Rank 2007 Global RankGermany 14th 14th 16thGermany 14 14 16United Kingdom 17th 16th 12th
Japan 17th 18th 17th
United States 19th 18th 20th
France 24th 23rd 19th
Italy 63rd 55th 41st
Brazil 75th 80th 72ndBrazil 75 80 72China 79th 72nd 72nd
India 84th 85th 72nd
Russia 146th 147th 143rd
Source: Transparency International Corruption Perceptions Index.
44

World Economic Forum Global Competitiveness IndexAnnual ranking (1 = best)
2009 – 2010 Rank 2008 – 2009 Rank 2007 – 2008 RankUnited States 2nd 1st 1stUnited States 2 1 1Germany 7th 7th 5th
Japan 8th 9th 8th
United Kingdom 13th 12th 9th
France 16th 18th 18th
China 29th 30th 34th
Italy 48th 49th 46thItaly 48 49 46India 49th 50th 48th
Brazil 56th 64th 72nd
Russia 63rd 51st 58th
Source: World Economic Forum Global Competitiveness Index.
45

Assessing sovereign debt risk with credit default swap (CDS) spreadsEnd of day price: April 16, 2010
Source: Bloomberg.
46

Brazil x U.S. Industrials: 5-year ratingsDaily: October 31, 2003 – April 14, 2010
Source: FAPES, BNDES Pension Fund.
47

Brazil real interest ratesWeekly: January 6, 2006 – April 16, 2010
Source: FAPES, BNDES Pension Fund.
48

Brazil: strengths and issues to improve
• Central Bank• BNDES – Brazilian Development
• Quality of government investment, expenses and revenuesBNDES Brazilian Development
Bank• Credit/GDP 2002-10 24% to 45%, 70% in 2014• V-shaped recovery• Domestic demand• Declining real interest rate
p• High tax burden• Infrastructure• Levels of savings and investment• Current account levels• Evolution of pension and tax reforms
Source: FAPES, BNDES Pension Fund.
Declining real interest rate• Embi+ Brazil all time low• Investment grade (2008)• Reserves all time high
49

Current account by trade balanceWeekly: April 2, 2000 – April 11, 2010
Source: FAPES, BNDES Pension Fund.Note: 13 week X 4 moving average
50
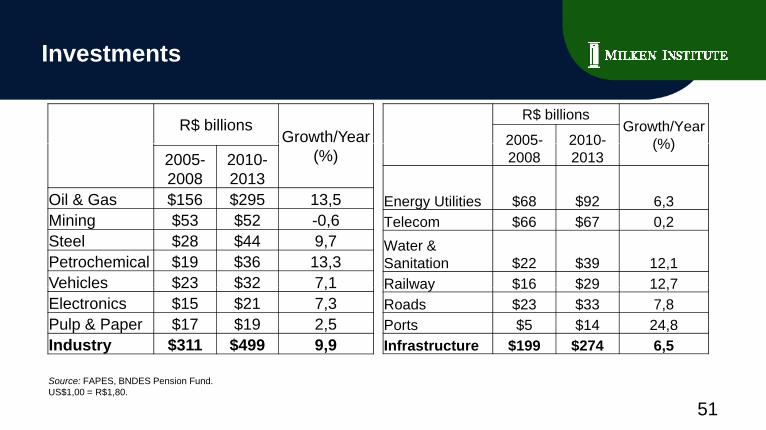
Investments
R$ billionsGrowth/Year
R$ billionsGrowth/Year
(%)2005- 2010-(%)2005-
20082010-2013
Oil & Gas $156 $295 13,5Mining $53 $52 -0,6Steel $28 $44 9,7Petrochemical $19 $36 13,3Vehicles $23 $32 7,1
(%)20052008
20102013
Energy Utilities $68 $92 6,3Telecom $66 $67 0,2Water & Sanitation $22 $39 12,1Railway $16 $29 12,7
Source: FAPES, BNDES Pension Fund.US$1,00 = R$1,80.
Vehicles $23 $32 7,1Electronics $15 $21 7,3Pulp & Paper $17 $19 2,5Industry $311 $499 9,9
Railway $16 $29 12,7Roads $23 $33 7,8Ports $5 $14 24,8Infrastructure $199 $274 6,5
51

Brazilian energy source is renewable
6 7 93 3OECD Countries
45 9
12,9
6,7
54 1
87,1
93,3
Worldwide (2006)
(2007)
Source: BR Investimentos.
45,9 54,1
0% 10% 20% 30% 40% 50% 60% 70% 80% 90% 100%
Brazil (2007)
RenewableNon-renewable
52

Brazil power sector at glance (2008)
Installed capacity 104 GW104 GW74% is hydro
Peak demand64 GW(comparable to England or Italy)
A erage prod ction
Source: BR Investimentos.
Average production51GW X 8760 h/y = 447 TWh/y90% is hydro
53

Per capita consumption of electricity
Source: World Bank, 2007.
54

Centralized dispatch• To take advantage of hydrological diversity, energy is transported through long distances.• Power plants in the same river basin are owned by different companiesdifferent companies.
CEMIGFURNASAES-TIETÊCESPCDSAConsórciosCOPEL
Rio Grande
Rio Paranaíba
Rio Tietê
Ri P
CEMIGFURNASAES-TIETÊCESPCDSAConsórciosCOPEL
Rio Grande
Rio Paranaíba
Rio Tietê
Ri P
Source: BR Investimentos.
TRACTEBELITAIPU
Binacional
Rio Paranapanema
Rio Iguaçu
TRACTEBELITAIPU
Binacional
Rio Paranapanema
Rio Iguaçu
55

DistributionTransmitionTUSTTUST
Long term power purchase agreements (PPAs)
GenerationDistribution Distribution tarifftariff
TUSTTUST TUSD TUSD
TUSTTUST
Free Consummers Captive Consummers
PPA (energy)
Free Consummers
TUSD TUSD ‐‐ Distribution network charge + taxes
TUST – Distribution network charge + taxesDistribution Tariff = Energy + TUSDDistribution Tariff = Energy + TUSD
PPA – Power Purchase Agreement
Source: BR Investimentos.
56
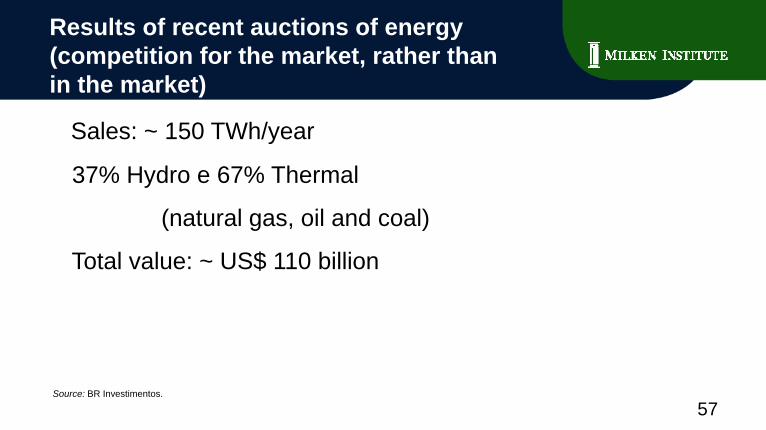
Results of recent auctions of energy(competition for the market, rather than in the market)
Sales: ~ 150 TWh/year y
37% Hydro e 67% Thermal
(natural gas, oil and coal)
Total value: ~ US$ 110 billion
Source: BR Investimentos.
57

Did Brazil run out of sites to build new hydro plants?
CongoCongoIndonesiaIndonesia
PeruPeruR iR iRussiaRussiaChinaChina
ColombiaColombiaIndiaIndia
BRAZILBRAZILCanadaCanada
ItalyItalySwedenSweden
USAUSANorwayNorway
JapanJapanGermanyGermany
FranceFrance10000 20 40 60 80
Source: EPE 58

Hydropower plants in the Amazon river basin
What would be the alternative?Source: BR Investimentos.
59