Embed Size (px)
Citation preview
Copyright © 2002 by Thomson Learning, Inc.
Chapter 11
Taxation, Prices Efficiency, and the Distribution of Income
Copyright © 2002 Thomson Learning, Inc. Thomson Learning™ is a trademark used herein under license.
ALL RIGHTS RESERVED. Instructors of classes adopting PUBLIC FINANCE: A CONTEMPORARY APPLICATION OF THEORY TO POLICY, Seventh Edition by David N. Hyman as an assigned textbook may reproduce material from this publication for classroom
use or in a secure electronic network environment that prevents downloading or reproducing the copyrighted material. Otherwise, no part of this work covered by the copyright hereon may be reproduced or used in any form or by any means—graphic, electronic, or mechanical, including, but not limited to, photocopying, recording, taping, Web distribution, information networks, or information storage and retrieval
systems—without the written permission of the publisher. Printed in the United States of America
ISBN 0-03-033652-X
Copyright © 2002 by Thomson Learning, Inc.
Plan
1-Impôt et efficacité 2-Incidence de l’impôt 3-Analyse en équilibre général 4-Distribution du revenu
Copyright © 2002 by Thomson Learning, Inc.
1- Impôt et efficacité
L’impôt forfaitaire L’accise et l’éq. du marché La surcharge de l’accise L’importance de l’élasticité Le coefficient d’inefficience L’impôt ad valorem
Copyright © 2002 by Thomson Learning, Inc.
L’impôt forfaitaireLump-Sum Taxes
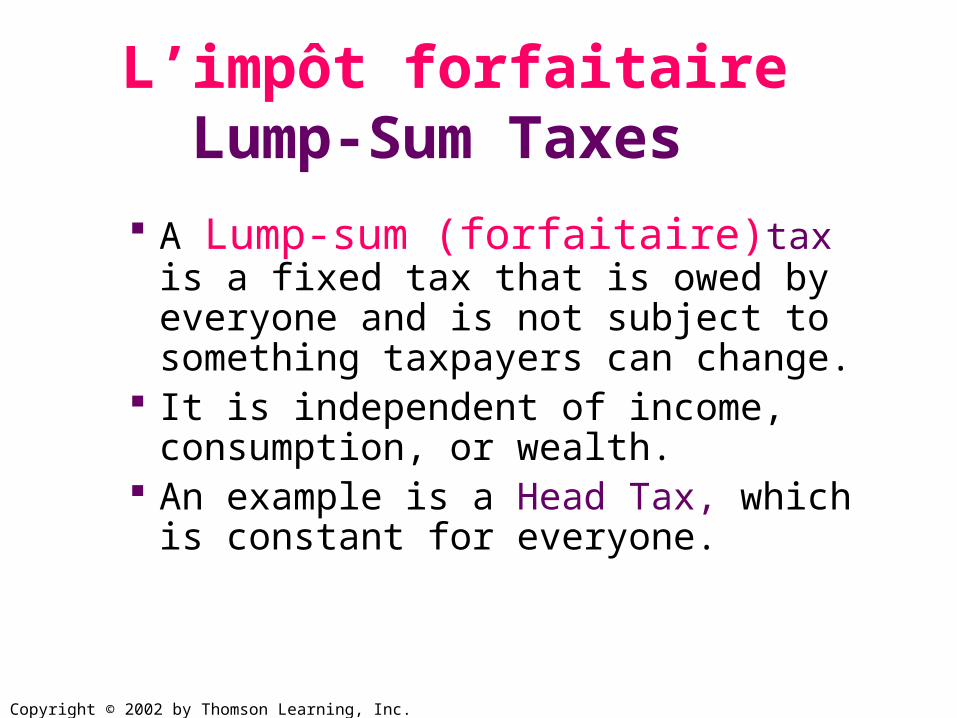
A Lump-sum (forfaitaire)tax is a fixed tax that is owed by everyone and is not subject to something taxpayers can change.
It is independent of income, consumption, or wealth.
An example is a Head Tax, which is constant for everyone.
Copyright © 2002 by Thomson Learning, Inc.
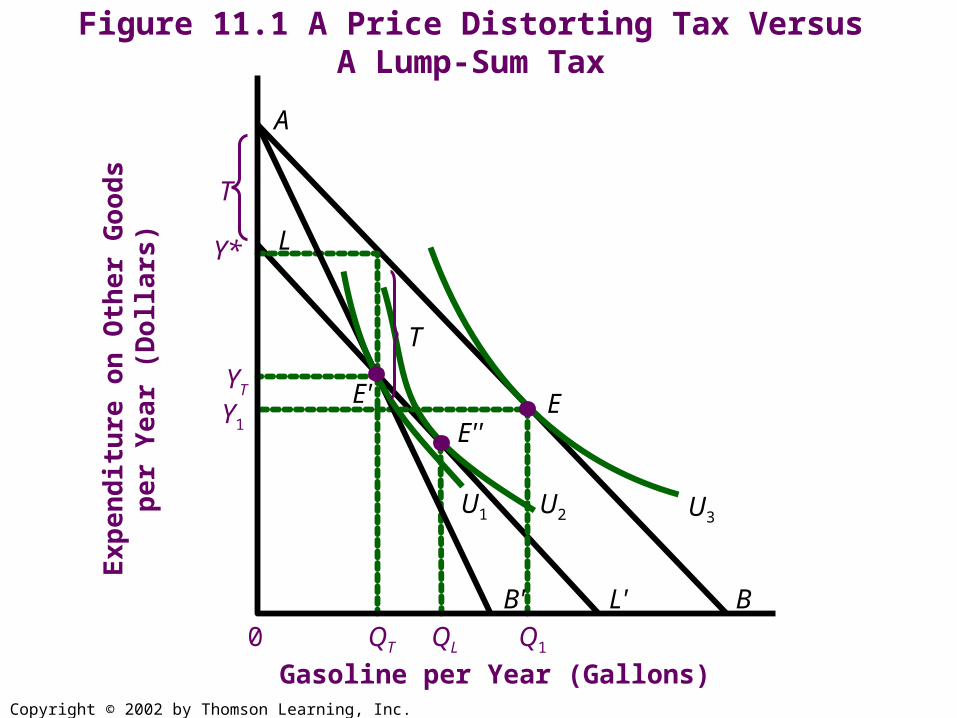
Inefficiency in Taxation and the Lump-Sum Tax
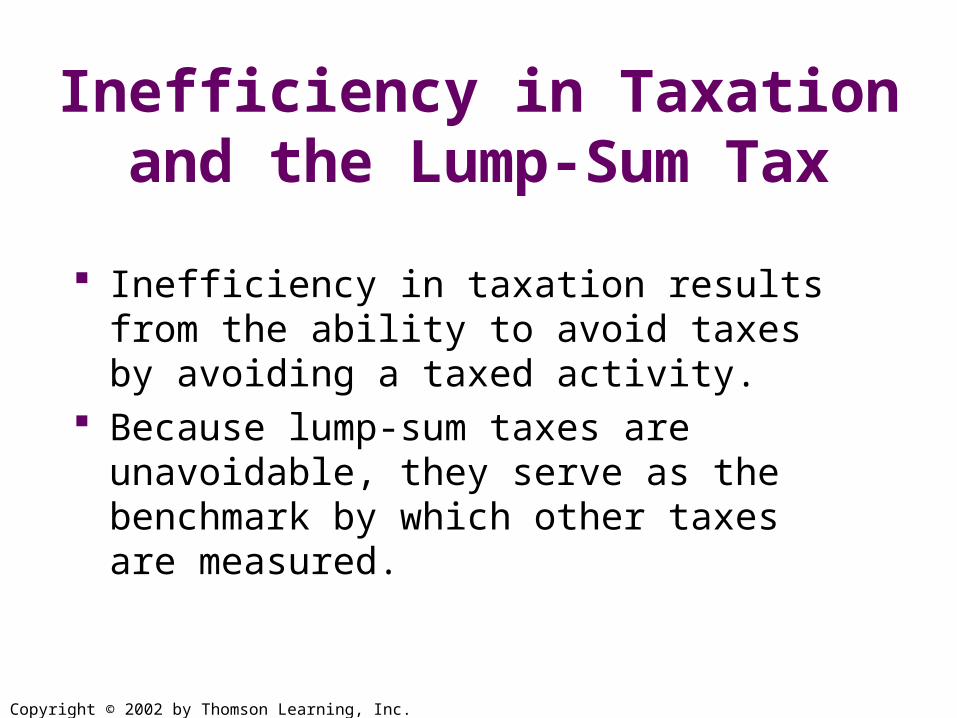
Inefficiency in taxation results from the ability to avoid taxes by avoiding a taxed activity.
Because lump-sum taxes are unavoidable, they serve as the benchmark by which other taxes are measured.
Copyright © 2002 by Thomson Learning, Inc.
A price distorting tax is a tax that alters the relative price of goods.
Price Distorting Taxes
Copyright © 2002 by Thomson Learning, Inc.
Figure 11.1 A Price Distorting Tax Versus A Lump-Sum Tax
Ex
pe
nd
itu
re o
n O
the
r G
oo
ds
pe
r Y
ea
r (D
olla
rs)
Gasoline per Year (Gallons)
0 Q1
Y*
QT QL
Y1 YT
A
L
B B' L'
T
U3 U2 U1
E''
E' E
T
Copyright © 2002 by Thomson Learning, Inc.
L’impôt spécifique et l’équilibre du marché
Unit Taxes A unit tax (spécifique) adds to the price
by a fixed amount. Examples include the 32 cents per pack of cigarettes and 24 cents per gallon of gasoline in federal taxes.
Copyright © 2002 by Thomson Learning, Inc.
Tax Terms
The Gross Price (PG) is the price paid by consumers.
The Net Price (PN) is the price received by producers after the tax is paid.
PN = PG – T
Copyright © 2002 by Thomson Learning, Inc.
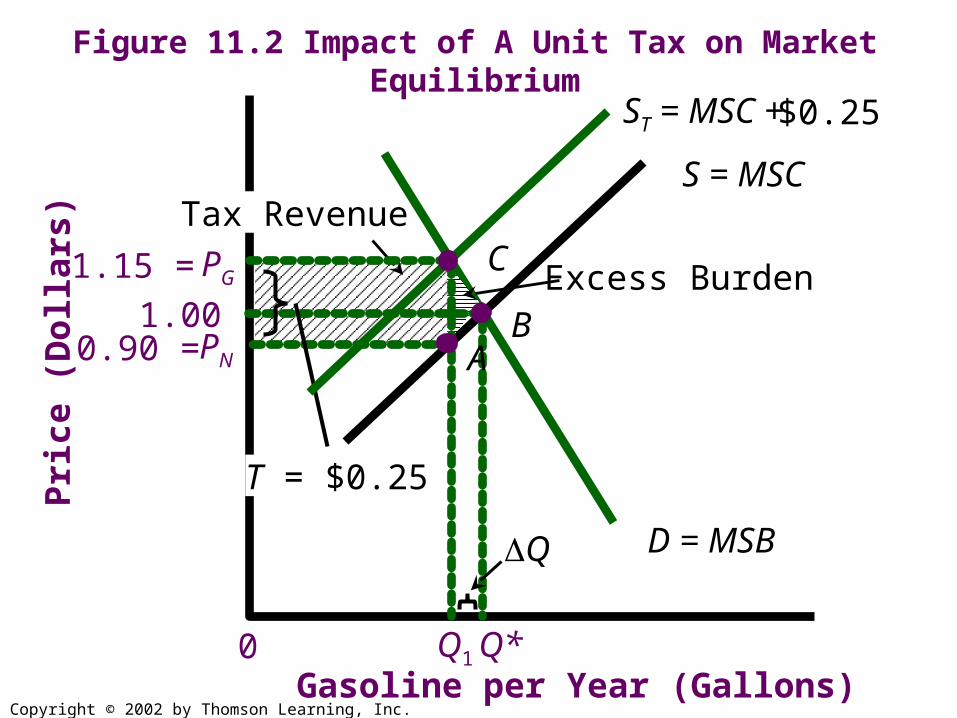
Tax Revenue
Figure 11.2 Impact of A Unit Tax on Market EquilibriumP
ric
e (
Do
llars
)
Gasoline per Year (Gallons) 0 Q1 Q*
1.15 = PG
0.90 = PN
S = MSC
D = MSB
1.00 Excess Burden
T = $0.25
ST = MSC + $0.25
Q
A B
C
Copyright © 2002 by Thomson Learning, Inc.
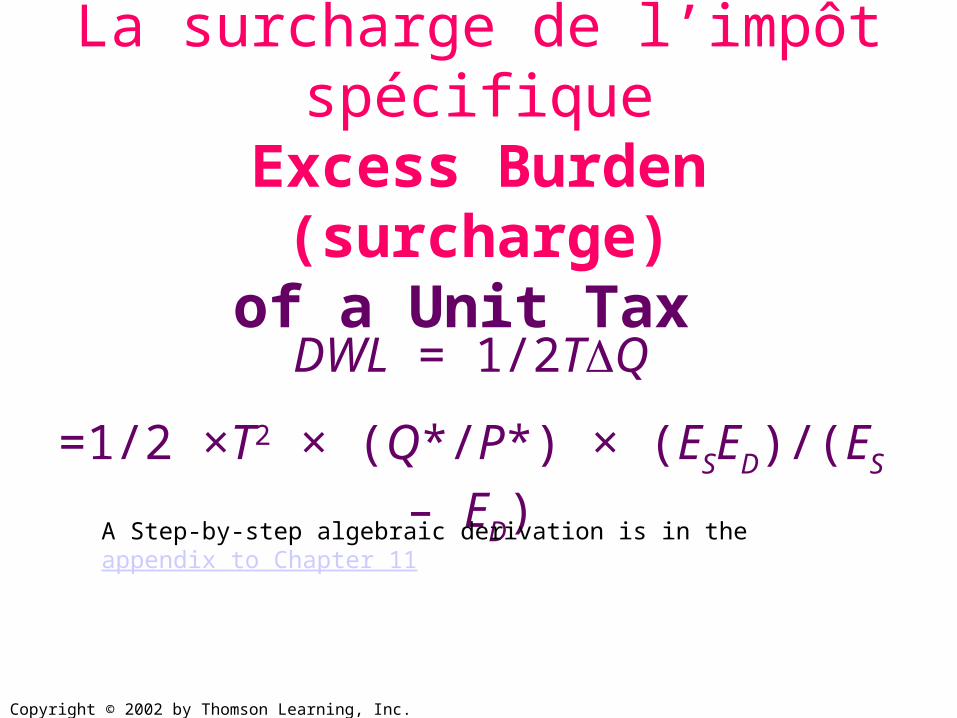
La surcharge de l’impôt spécifique
Excess Burden (surcharge)of a Unit Tax DWL = 1/2TQ
=1/2 ×T2 × (Q*/P*) × (ESED)/(ES – ED)
A Step-by-step algebraic derivation is in the appendix to Chapter 11
Copyright © 2002 by Thomson Learning, Inc.
Implication of the DWL Calculation
A doubling of the per unit tax quadruples the Deadweight Loss.
L’importance de l’élasticité
Copyright © 2002 by Thomson Learning, Inc.
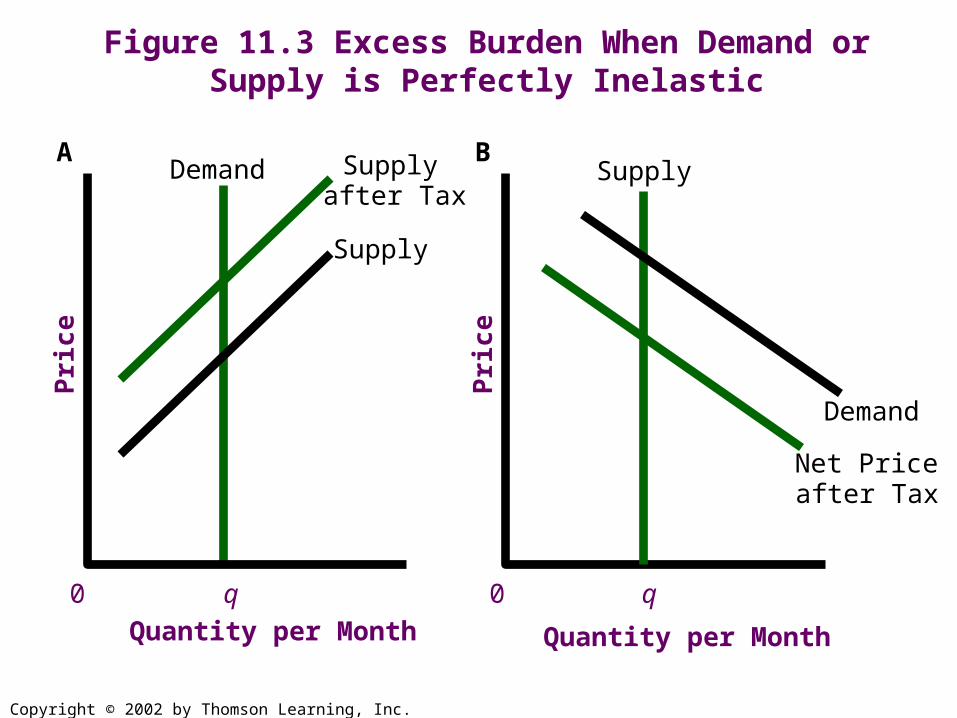
Figure 11.3 Excess Burden When Demand or Supply is Perfectly Inelastic
Demand Supply after Tax
Supply
Pri
ce
Quantity per Month 0 q
A
Pri
ce
0 q
B Supply
Demand
Net Price after Tax
Quantity per Month
Copyright © 2002 by Thomson Learning, Inc.
Le coefficient d’inefficienceEfficiency Loss Ratio of a Tax The Efficiency Loss Ratio is the
deadweight loss per dollar of revenue raised DWL/R .
Estimates of U.S. tax system place it between 25 and 40 cents per dollar of tax revenue raised.
Copyright © 2002 by Thomson Learning, Inc.
L’impôt ad valoremAd-Valorem Taxes
Ad-Valorem Taxes add a fixed percentage to the price of a good.
The primary example is sales taxes.
Copyright © 2002 by Thomson Learning, Inc.
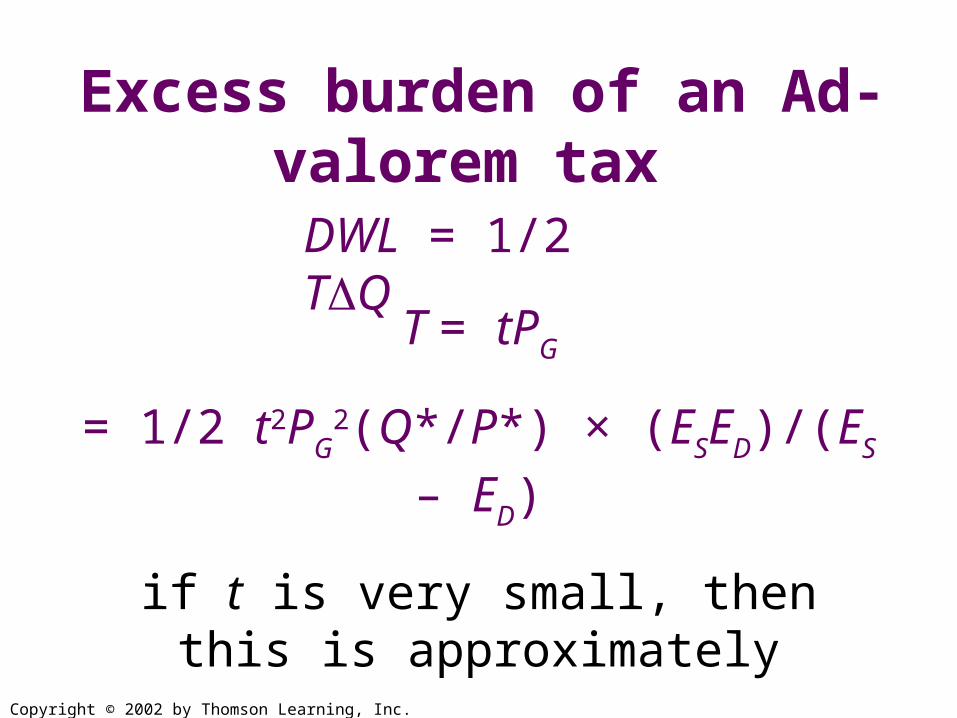
Excess burden of an Ad-valorem tax DWL = 1/2 TQ
= 1/2 t2PG2(Q*/P*) × (ESED)/(ES – ED)
if t is very small, then this is approximately
= 1/2 t2P*Q*(ESED)/(ES – ED)
T = tPG
Copyright © 2002 by Thomson Learning, Inc.
2- Incidence de l’impôt
Qu’est-ce que l’incidence ? De quoi dépend l’incidence ? Le cas du monopole
Copyright © 2002 by Thomson Learning, Inc.
Incidence of a Tax
The Legal Incidence is the burden of a tax as determined by who is legally obligated to pay the tax.
The Economic Incidence is the burden of a tax as determined by how much the parties are affected in terms of paying higher prices, or receiving lower prices.
Copyright © 2002 by Thomson Learning, Inc.
Shifting of Taxes
Forward Shifting is the transfer of the burden of the tax from the seller, who is legally obligated to pay it, to the buyer.
Backward Shifting is the transfer of the burden of the tax from the buyer, who is legally obligated to pay it, to the seller.
Copyright © 2002 by Thomson Learning, Inc.
Using Excise Taxes on Alcohol to Internalize Externalities
Federal taxes on alcohol are per-unit rather than ad-valorem.
Externalities associated with alcohol are estimated at $0.48 per ounce (of hard liquor).
Copyright © 2002 by Thomson Learning, Inc.
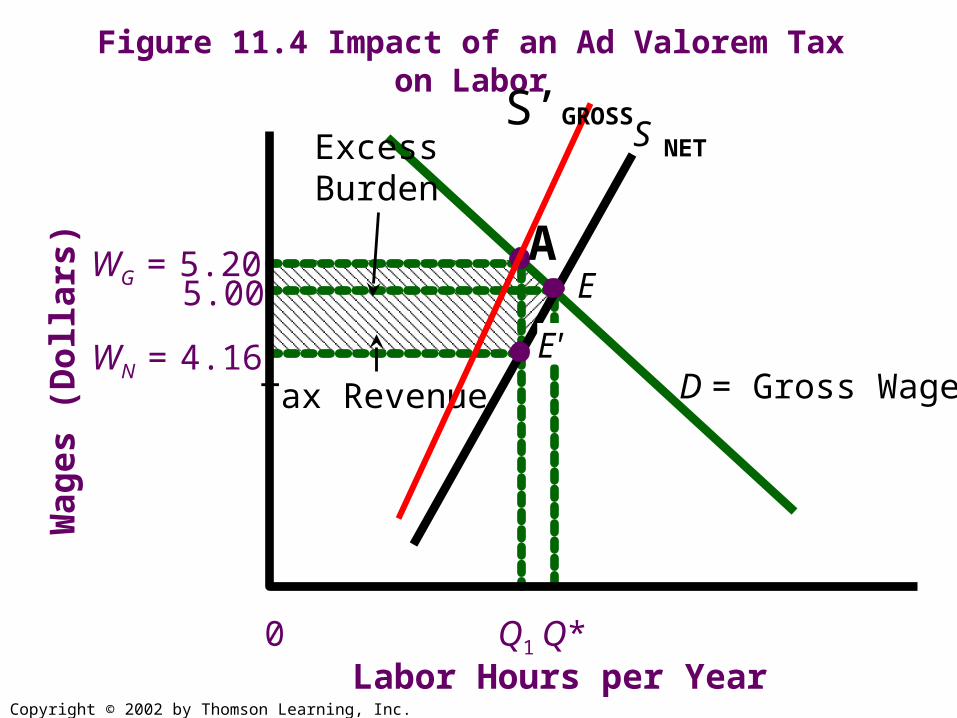
Figure 11.4 Impact of an Ad Valorem Tax on Labor
WG = 5.20
Tax Revenue WN = 4.16
5.00
Wa
ge
s (
Do
llars
)
0 Q1 Q*Labor Hours per Year
D = Gross Wage
SExcessBurden
E'
EA
NETS’GROSS
Copyright © 2002 by Thomson Learning, Inc.
Independence of Legal and Economic Incidence
It does not matter whether the buyer or seller is legally liable for a tax.
The economic incidence of the tax is determined by supply and demand elasticities, the amount of the tax, and the original equilibrium price and quantity.
Copyright © 2002 by Thomson Learning, Inc.
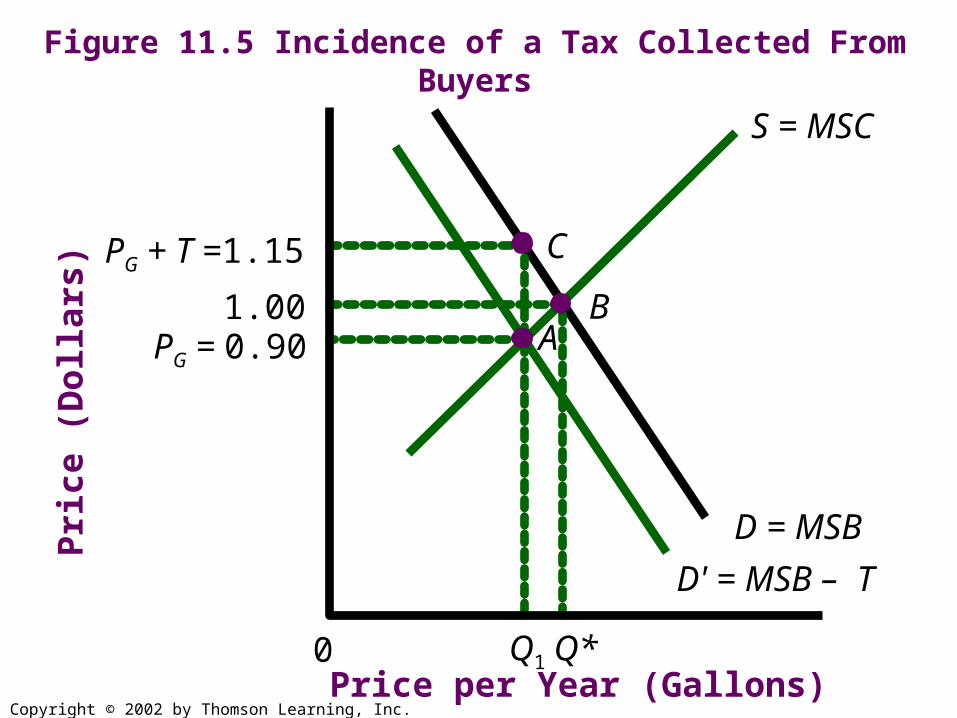
Figure 11.5 Incidence of a Tax Collected From BuyersP
ric
e (
Do
llars
)
Price per Year (Gallons) 0 Q1 Q*
1.00
D = MSB
D' = MSB – T
S = MSC
A
C
B
PG + T =1.15
PG = 0.90
Copyright © 2002 by Thomson Learning, Inc.
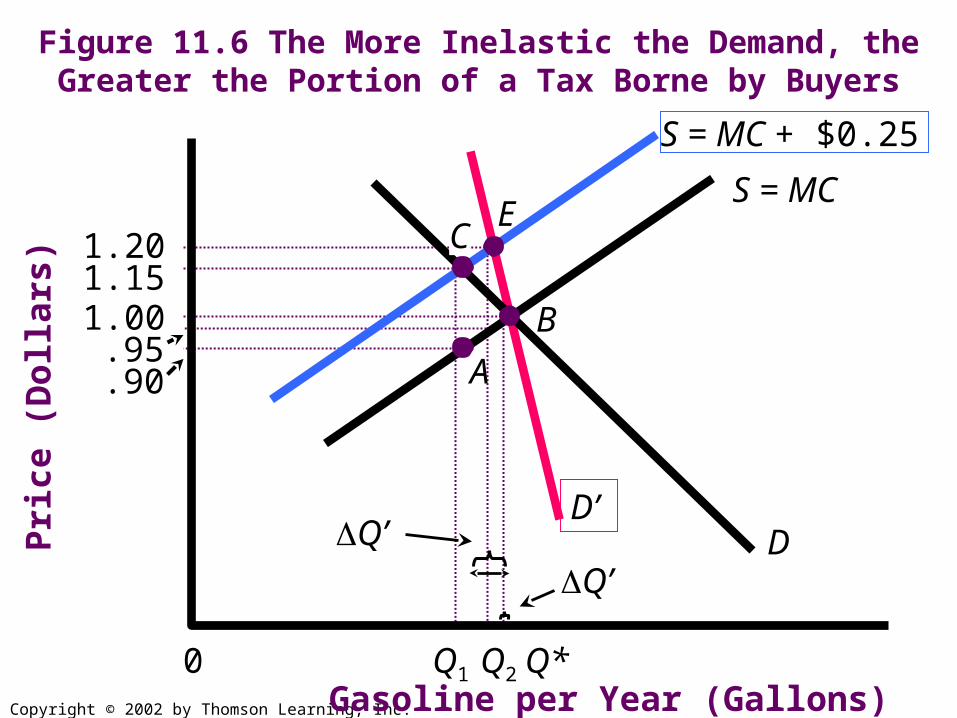
Figure 11.6 The More Inelastic the Demand, the Greater the Portion of a Tax Borne by BuyersP
ric
e (
Do
llars
)
Gasoline per Year (Gallons) 0 Q1 Q*
1.00 .95 .90
1.20 1.15
Q2
Q’ Q’
S = MC + $0.25
D’
ES = MC
D
B
C
A
Copyright © 2002 by Thomson Learning, Inc.
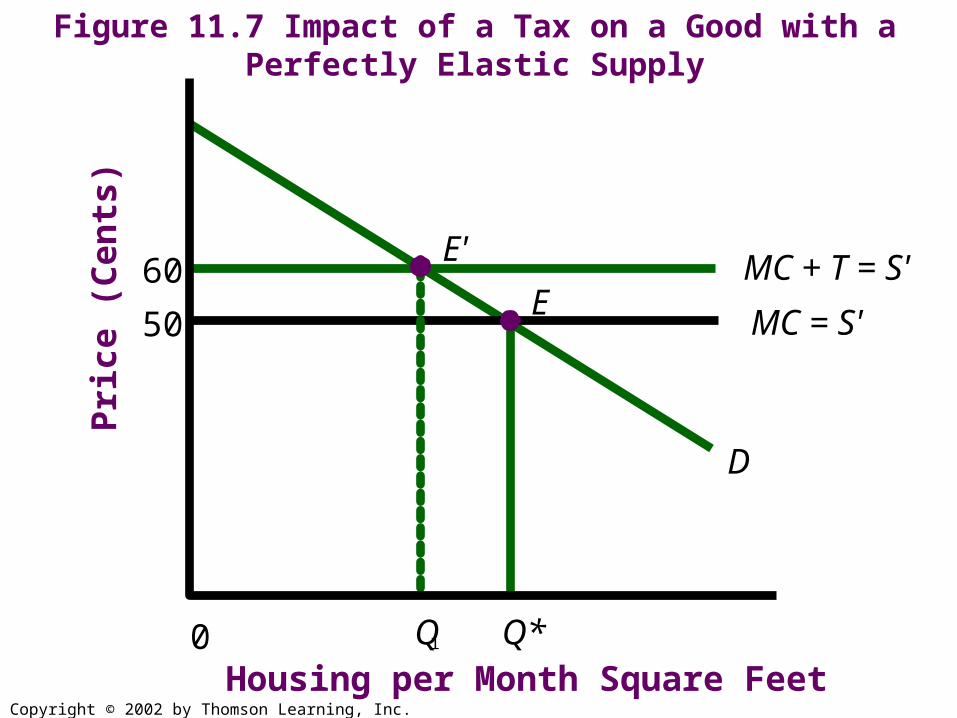
Figure 11.7 Impact of a Tax on a Good with a Perfectly Elastic Supply
Pri
ce
(C
en
ts)
Housing per Month Square Feet 0 Q 1 Q*
60
50
D
MC + T = S'
MC = S'
E'
E
Copyright © 2002 by Thomson Learning, Inc.
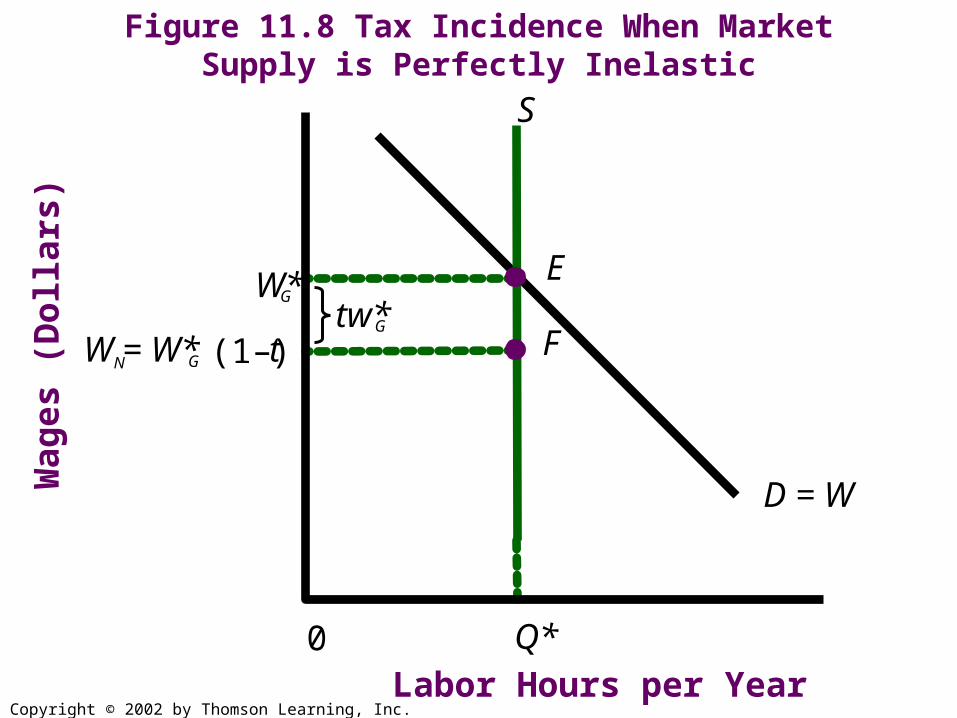
Figure 11.8 Tax Incidence When Market Supply is Perfectly Inelastic
Wa
ge
s (
Do
llars
)
0
W* G
Q*
N G W = W* (1– t)
D = W
S
E tw* G
Labor Hours per Year
F

Copyright © 2002 by Thomson Learning, Inc.
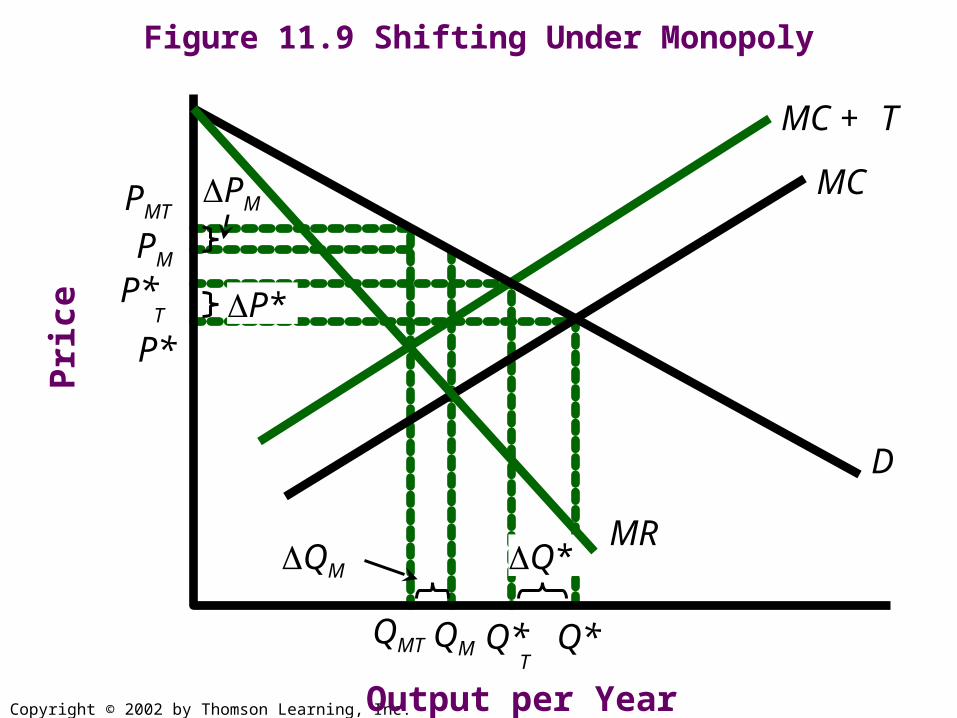
Shifting Under Imperfect Competition
Monopolists can shift less of a given tax forward to consumers than can competitive industry.
Copyright © 2002 by Thomson Learning, Inc.
Figure 11.9 Shifting Under MonopolyP
ric
e
Output per Year
QM
MC
QM
PM
Q*
MC + T
P*
Q*T
QMT Q*
PMT
PM
P*T
P*
D
MR
Copyright © 2002 by Thomson Learning, Inc.
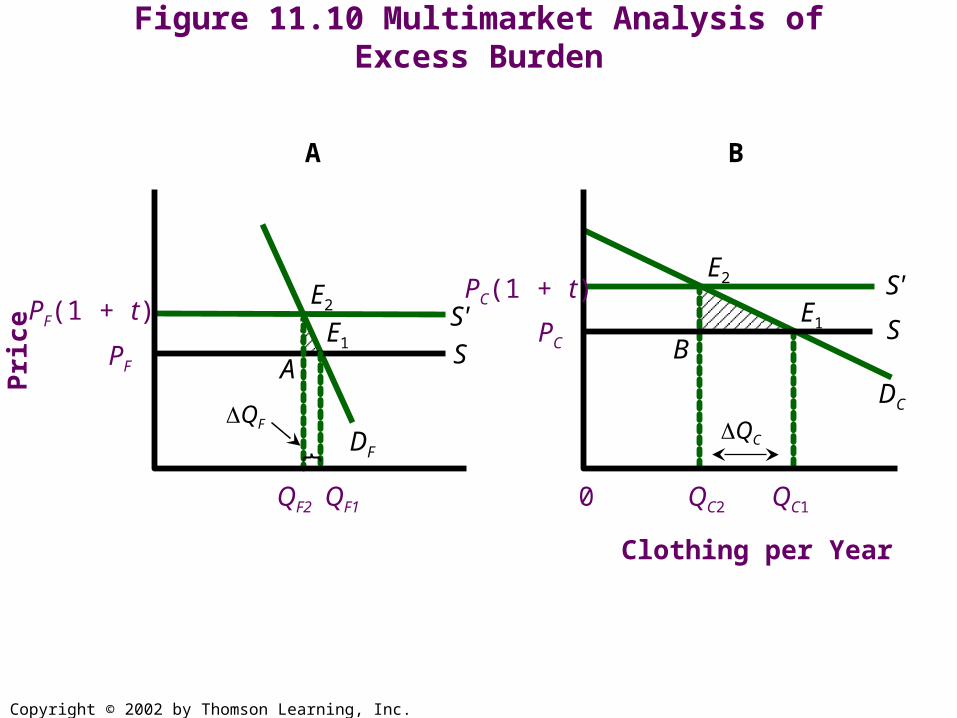
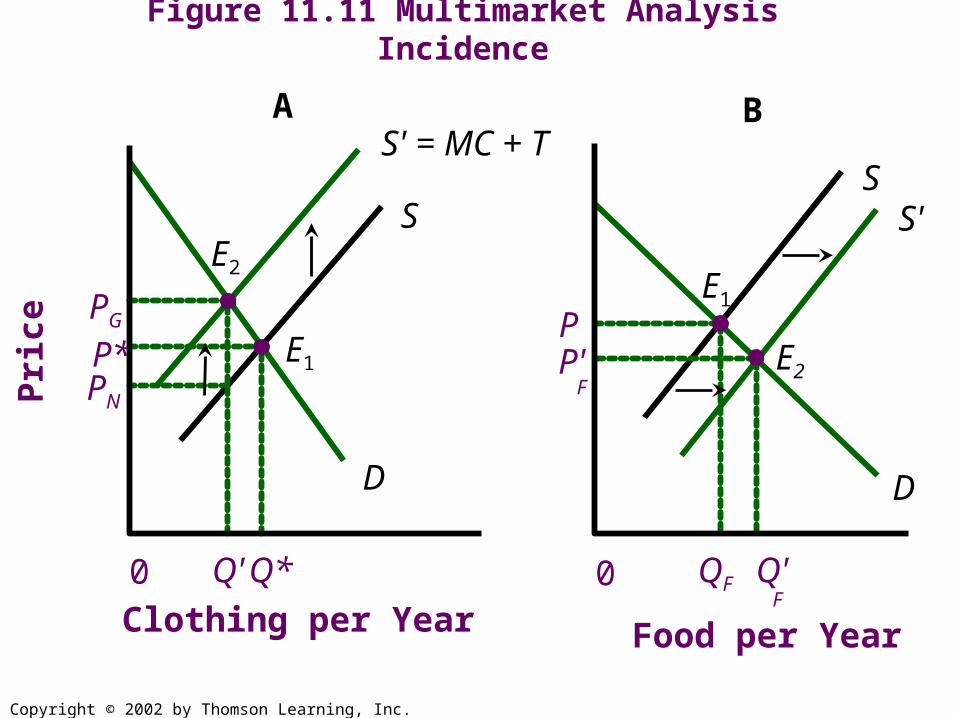
General Equilibrium Analysis and Shifting
When one good is taxed and another good is not taxed, the impact of the tax is not confined to the taxed good.
Because a tax on one good lowers the profit that can be made to firms producing it, they may shift their productive resources to the other good so as to maximize their after-tax rate-of-return in both markets.
This has the effect of equalizing the after-tax rate-of-return.
Copyright © 2002 by Thomson Learning, Inc.
Figure 11.10 Multimarket Analysis of Excess Burden
PF
E2
A
A
DF
S'
S
Pri
ce
Clothing per Year
0 QC2
PC
DC
S'
S PF(1 + t)
B
E1
QC
PC(1 + t)
QC1
E2
E1 B
QF
QF1 QF2
Copyright © 2002 by Thomson Learning, Inc.
Figure 11.11 Multimarket Analysis Incidence
0 Q*
PG
Q'
P* PN
A
D
S' = MC + T
S
B
Pri
ce
Food per Year
0
P
D
S S'
QF
Clothing per Year
P' F
Q' F
E2
E1
E1
E2
Copyright © 2002 by Thomson Learning, Inc.
Government Taxes and Expenditures
and the Distribution of Income The Tax Incidence is who bears the burden of
a tax. The Expenditure Incidence is who receives
the benefits of a government program. The Budget Incidence is the net analysis of a
program’s tax and expenditure incidence. The Differential Tax Incidence is the change
in the tax incidence that results from substituting one equal yield tax for another.

Copyright © 2002 by Thomson Learning, Inc.
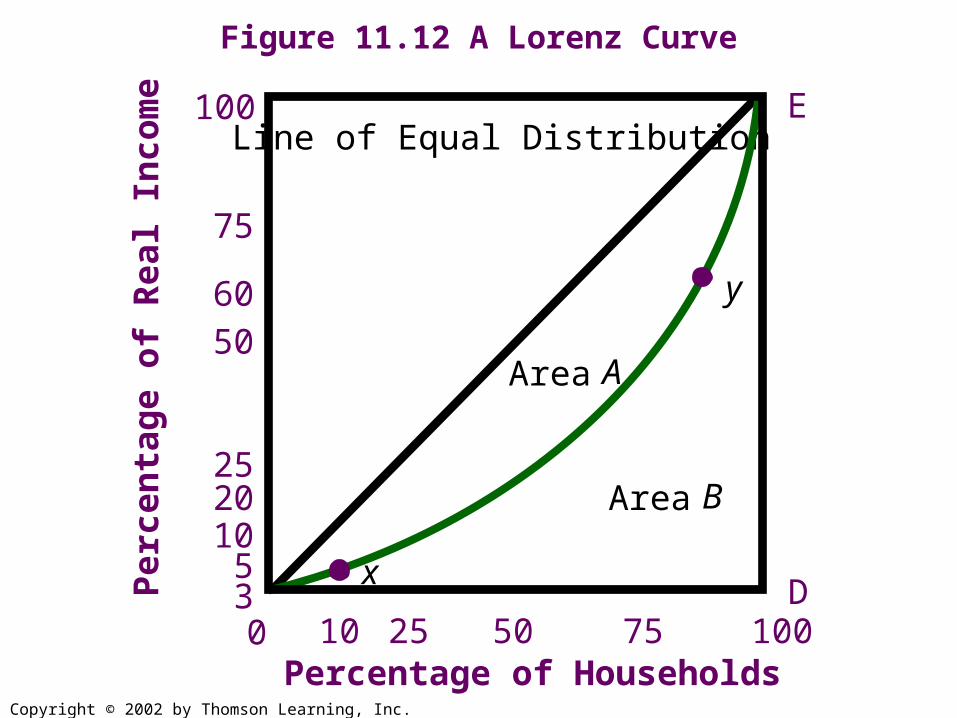
The Lorenz Curve
The Lorenz Curve maps the cumulative percentage of households against their cumulative percentage of income.
Copyright © 2002 by Thomson Learning, Inc.
Figure 11.12 A Lorenz Curve
Pe
rce
nta
ge
of
Re
al I
nc
om
e
Line of Equal Distribution
0 D
100 E
y
x
75
60 50
25 20 10
5 3
10 25 50 75 100 Percentage of Households
Area A
Area B
Copyright © 2002 by Thomson Learning, Inc.
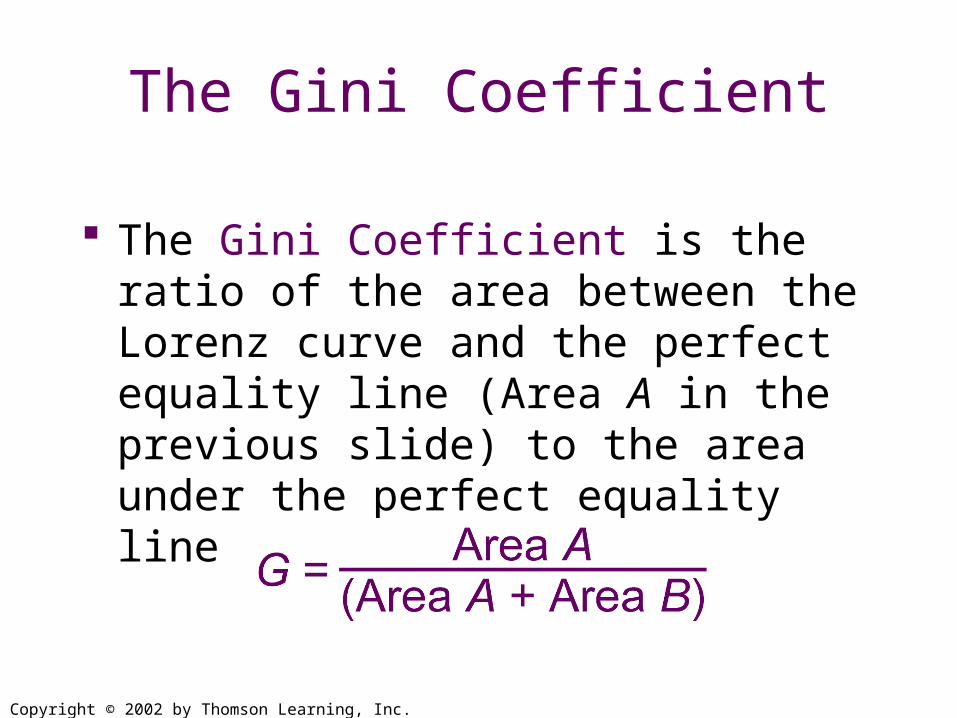
The Gini Coefficient
The Gini Coefficient is the ratio of the area between the Lorenz curve and the perfect equality line (Area A in the previous slide) to the area under the perfect equality line (Areas A and B).
Copyright © 2002 by Thomson Learning, Inc.
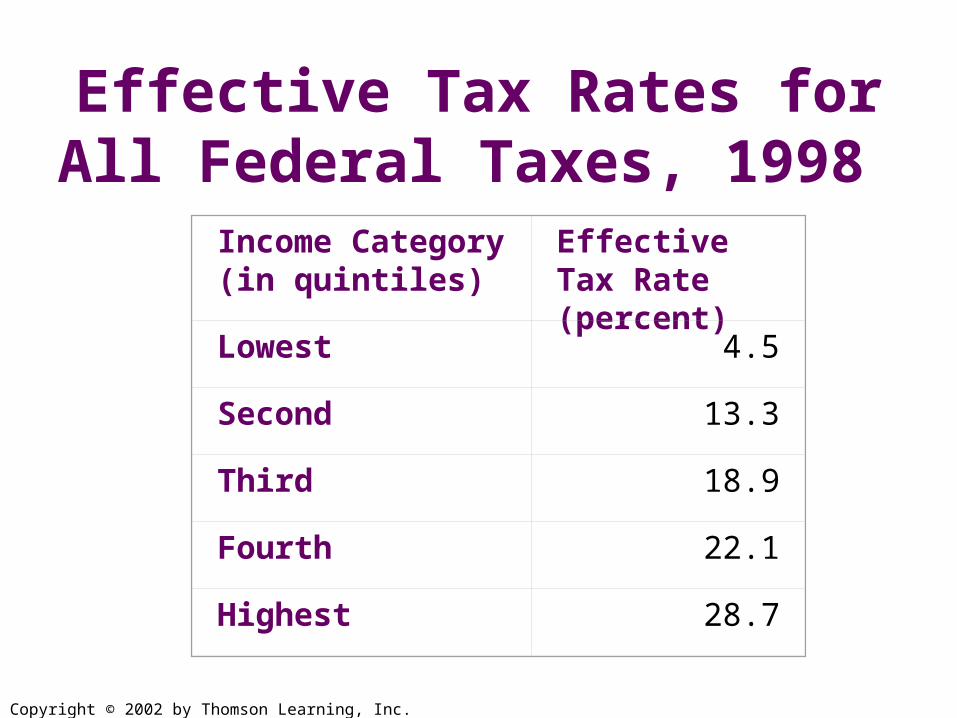
Effective Tax Rates for All Federal Taxes, 1998
Income Category (in quintiles)
Effective Tax Rate (percent)
Lowest 4.5
Second 13.3
Third 18.9
Fourth 22.1
Highest 28.7