Embed Size (px)
Citation preview

TInternet Worm Detection as part of a Distributed
Network Inspection System
Eamonn Linehan
A dissertation submitted to the University of Dublin,
in partial fulfillment of the requirements for the degree of
Master of Science in Computer Science
2004

ii
Declaration
I declare that the work described in this dissertation is, except where otherwise stated,
entirely my own work and has not been submitted as an exercise for a degree at this or
any other university.
______________________
Eamonn Linehan
13P
thP September 2004

iii
Permission to Lend / Copy
This dissertation may be borrowed or copied upon the request with the permission of the
Librarian, Trinity College, University of Dublin. The copyright belongs jointly to the
University of Dublin and Eamonn Linehan.
______________________
Eamonn Linehan
13P
thP September 2004

iv
Acknowledgements
I’d like to thank my supervisor, Dr. Ciaran Mc Goldrick, for being so easy to work with. I’d
also like to thank Merial Huggard, Arkaitz Bitorika, Mathieu Robin, Stephen Lally and
Eamonn Hughes for their help. I’d like to thank my brother, Conor, for his help with my
writing and finally the whole 2004 NDS class who made the last year so enjoyable.
Connections to Funded /Collaborative Projects
This project will extend some of the ideas and concepts that have recently been
investigated as part of an EI Basic Research project on analytical and empirical AQM
evaluation. This work will be carried out in collaboration with the researchers working on
the EI Basic Research AQM project.
In particular Arkaitz Bitorika is currently researching an extension of Active Queue
Management to handle undesired or malicious traffic. That would include controlling
(D)DoS or worm traffic while keeping to the scalability and simplicity principles of Active
Queue Management.
This dissertation will address part of this large problem, namely the identification of
malicious traffic.
v
Abstract
The most widely publicized, and arguably most damaging, types of malicious traffic on the
Internet today include worms, spam, viruses and denial of service attacks. Internet worms
self propagate across networks exploiting flaws in operating systems and services,
spreading viruses and congesting network links. Worms constitute a significant security
and performance threat and have recently been used to facilitate distributed denial of
service (dDoS) attacks. It is the aim of this dissertation to investigate approaches for
detecting a wide range of malicious activity such as worms and (d)DoS. This dissertation
describes the design and implementation of an object orientated framework for distributed
intrusion detection. The framework features heterogeneous sensors with a configurable
event source that can adapt by dynamically composing components at run-time. The
sensors are controlled remotely by a management application that can configure, extend
and control sensors individually. The framework is extensible and allows researchers to
quickly implement and evaluated detection techniques in a live network environment. A
number of components have been implemented for the framework including a component
designed to detect internet worms. It was found that this component could successfully
detect a range of malicious activity including worms on both low utilisation dial-up links
and gateway router links.
vi
Table of Contents
TU1UT TUIntroductionUT.............................................................................. 1
TU1.1UT TUOverviewUT ................................................................................................ 4
TU2UT TUBackground UT............................................................................... 5
TU2.1UT TUIntroductionUT ........................................................................................... 5 TU2.2UT TUProperties of Network TrafficUT ................................................................. 7 TU2.3UT TUNetwork Traffic Analysis TechniquesUT...................................................... 8
TU2.3.1UT TUIntroductionUT...................................................................................... 8 TU2.3.2UT TUTime Frequency AnalysisUT..................................................................... 8 TU2.3.3UT TUWaveletsUT .......................................................................................... 8 TU2.3.4UT TUData Mining TechniquesUT ...................................................................... 9 TU2.3.5UT TUEigen ValuesUT ....................................................................................10
TU2.4UT TUA Taxonomy of Network AnomaliesUT .......................................................10 TU2.4.1UT TUIntroductionUT.....................................................................................10 TU2.4.2UT TUNetwork Operation AnomaliesUT.............................................................11 TU2.4.3UT TUFlash CrowdsUT ...................................................................................11 TU2.4.4UT TUNetwork AbuseUT .................................................................................11 TU2.4.5UT TUOtherUT ..............................................................................................15
TU2.5UT TUIntrusion DetectionUT ...............................................................................15 TU2.5.1UT TUSignature BasedUT ...............................................................................16 TU2.5.2UT TUAnomaly DetectionUT............................................................................17 TU2.5.3UT TUNeural Networks for Anomaly Detection UT ...............................................18 TU2.5.4UT TUStatistical Anomaly DetectionUT .............................................................18 TU2.5.5UT TUProtocol Anomaly DetectionUT................................................................18 TU2.5.6UT TUGraph based Anomaly DetectionUT .........................................................19 TU2.5.7UT TUPayload Based Anomaly DetectionUT .......................................................20
TU2.6UT TUEvading detectionUT..................................................................................20 TU2.6.1UT TUIntroductionUT.....................................................................................20 TU2.6.2UT TUFlooding UT ..........................................................................................20 TU2.6.3UT TUFragmentationUT..................................................................................21 TU2.6.4UT TUEncryptionUT .......................................................................................21 TU2.6.5UT TUObfuscation UT .....................................................................................21
vii
TU3UT TUNetwork Monitoring / Intrusion DetectionUT.............................. 22
TU3.1UT TUNetwork SniffersUT ...................................................................................22 TU3.2UT TUNetwork MonitorsUT..................................................................................23 TU3.3UT TUIntrusion Detection SystemsUT .................................................................24 TU3.4UT TUDefending Against Network Abuse UT ........................................................26
TU3.4.1UT TUIntroductionUT.....................................................................................26 TU3.4.2UT TUNetwork Firewalls UT .............................................................................26 TU3.4.3UT TUIP TracebackUT ....................................................................................27 TU3.4.4UT TUAuthorization in IP networks UT...............................................................28 TU3.4.5UT TUEdge Router Filtering PoliciesUT..............................................................28 TU3.4.6UT TUHoneypotsUT .......................................................................................29
TU3.5UT TUExperimental Systems UT...........................................................................29 TU3.5.1UT TUIntroductionUT.....................................................................................29 TU3.5.2UT TUMULTOPSUT ........................................................................................30 TU3.5.3UT TUEMERALDUT ........................................................................................31 TU3.5.4UT TUHoneycombUT .....................................................................................31
TU3.6UT TUSummaryUT...............................................................................................32
TU4UT TUDistributed Network Inspection SystemUT ................................. 34
TU4.1UT TUIntroductionUT ..........................................................................................34 TU4.2UT TURequirements UT........................................................................................34 TU4.3UT TUDesign ChoicesUT ......................................................................................37
TU4.3.1UT TUIntroductionUT.....................................................................................37 TU4.3.2UT TUDevelopment PlatformUT .......................................................................37 TU4.3.3UT TUOnline Capture or SimulationUT..............................................................38 TU4.3.4UT TUGateway Routers or Dial-up LinksUT .......................................................38
TU4.4UT TUSpecificationUT .........................................................................................40 TU4.4.1UT TUIntroductionUT.....................................................................................40 TU4.4.2UT TUOverall Approach (Distributed Sensor Network)UT.....................................40 TU4.4.3UT TUSensor ArchitectureUT ..........................................................................42 TU4.4.4UT TUSensor Data FlowUT..............................................................................43 TU4.4.5UT TUPluggable Component Based ArchitectureUT .............................................44 TU4.4.6UT TUPackage StructureUT ............................................................................46 TU4.4.7UT TUSensor AlgorithmsUT ............................................................................47 TU4.4.8UT TUEvent SourceUT ...................................................................................47 TU4.4.9UT TUCommunication & ControlUT ..................................................................48
viii
TU4.4.10UT TUSecurityUT ..........................................................................................50 TU4.4.11UT TUSensor ManagerUT ...............................................................................52 TU4.4.12UT TUResponse to DetectionUT.......................................................................52
TU5UT TUDNIS Dynamically Pluggable Components UT .............................. 53
TU5.1UT TUIntroductionUT ..........................................................................................53 TU5.2UT TUSignal Generation Plug-insUT ....................................................................57
TU5.2.1UT TUIntroductionUT.....................................................................................57 TU5.2.2UT TUPort / Address Spread Plug-in UT .............................................................57 TU5.2.3UT TUTCP Stream Reassembly UT ....................................................................58 TU5.2.4UT TUTCP / IP Protocol Anomaly Accounting Plug-insUT......................................59
TU5.3UT TUSignal Analysis Plug-insUT ........................................................................60 TU5.3.1UT TUIntroductionUT.....................................................................................60 TU5.3.2UT TUWavelets Analysis Plug-inUT ..................................................................61 TU5.3.3UT TUMachine LearningUT..............................................................................64 TU5.3.4UT TUPayload Pattern MatchingUT...................................................................66 TU5.3.5UT TUInternet Worm DetectionUT ...................................................................67
TU5.4UT TUWorm Detection ComponentUT..................................................................72
TU6UT TUData Gathering UT........................................................................ 77
TU6.1UT TUData Collection InfrastructureUT...............................................................77 TU6.2UT TUData SetsUT...............................................................................................80
TU7UT TUEvaluationUT ............................................................................... 83
TU7.1UT TUIntroductionUT ..........................................................................................83 TU7.2UT TUDetecting Scanning BehaviorUT ................................................................85 TU7.3UT TUProtocol Anomaly DetectionUT ..................................................................88 TU7.4UT TUComputational ComplexityUT ....................................................................90 TU7.5UT TUPattern Matching for Signature Generation UT ...........................................91
TU8UT TUWorm Detection Results UT.......................................................... 95
TU8.1UT TUIntroductionUT ..........................................................................................95 TU8.1.1UT TUSignal Effectiveness WeightingUT ...........................................................95
TU8.2UT TUDARPA 1998 IDS Evaluation DatasetUT.....................................................96 TU8.2.1UT TUWednesday Week 6UT...........................................................................96 TU8.2.2UT TUThursday Week 6UT..............................................................................97

ix
TU8.2.3UT TUFriday Week 6UT ..................................................................................99 TU8.3UT TUHoneypot TrafficUT..................................................................................100 TU8.4UT TUHoneypot & Background TrafficUT...........................................................101 TU8.5UT TUNormal Dial-up Traffic (False Positives)UT ..............................................102 TU8.6UT TUResults SummaryUT ................................................................................103
TUConclusionUT .................................................................................. 104
TU8.7UT TUSummaryUT.............................................................................................104 TU8.8UT TUDNIS Requirements SatisfiedUT ..............................................................105 TU8.9UT TUFuture ResearchUT ..................................................................................107
TU9UT TUReferencesUT ............................................................................ 110
TU10UT TUAppendix UT ............................................................................ 115
TU10.1UT TUClassification of IDS SystemsUT...........................................................115
x
List of Figures
TUFigure 1 - Research Area OverviewUT .......................................................................... 6 TUFigure 2 - Distributed Denial of ServiceUT....................................................................14 TUFigure 3 - Distributed ArchitectureUT ..........................................................................40 TUFigure 4 - DNIS Sensor ArchitectureUT........................................................................42 TUFigure 5 - Sensor Data Flow DiagramUT ......................................................................43 TUFigure 6 - Plug-in Architecture DiagramUT ...................................................................44 TUFigure 7 - Plug-in Interface HierarchyUT ......................................................................45 TUFigure 8 - Sensor Component InterfaceUT ...................................................................45 TUFigure 9 - DNIS Package StructureUT..........................................................................46 TUFigure 10 - Component Output LoggingUT ...................................................................47 TUFigure 11 - DNIS Sensor CaptureUT............................................................................47 TUFigure 12 - DNIS Network Sensor Remote InterfaceUT ..................................................49 TUFigure 13 - Sensor Status FieldsUT .............................................................................49 TUFigure 14 - DNIS CommunicationUT............................................................................51 TUFigure 15 - DNIS Secure CommunicationsUT ................................................................51 TUFigure 16 - Sensor Manager User InterfaceUT ..............................................................52 TUFigure 17 - Port Spread AlgorithmUT...........................................................................57 TUFigure 18 – TCP Stream reassembly. UT ......................................................................59 TUFigure 19 - IPv4 HeaderUT ........................................................................................59 TUFigure 20 - DNIS Plug-in ChainingUT...........................................................................61 TUFigure 21 - Wavelet Noise FilteringUT..........................................................................61 TUFigure 22 - Original Signal (RMSE of Port and Address Spread)UT ...................................62 TUFigure 23 - Graph after Inverse Wavelet Transformation showing Coefficients.UT ..............63 TUFigure 24 - Wavelet Coefficient FilteringUT...................................................................63 TUFigure 25 - Wavelet Coefficient FilteringUT...................................................................64 TUFigure 26 - Machine Learning Plug-in Class DiagramUT ..................................................65 TUFigure 27 – Payload Size Component Output due to WormUT .........................................68 TUFigure 28 - Worm Activity Characterized by TFTP transfers over UDP.UT ..........................69 TUFigure 29 – The effect Host Spread and Port Spread on RMSEUT .....................................70 TUFigure 30 – Incoming / Outgoing Traffic, Ratio and Difference (Below Line)UT ..................70 TUFigure 31 – Vulnerability Scanning Component.UT ........................................................71 TUFigure 32 - Worm Detection AlgorithmUT.....................................................................72 TUFigure 33 - Worm Detection Example SourceUT ............................................................73
xi
TUFigure 34 - Worm Detection Isolated SignalUT..............................................................73 TUFigure 35 - Worm Detection Filtered SignalUT ..............................................................74 TUFigure 36 - Worm Detection Sliding WindowUT .............................................................74 TUFigure 37 - Probability of WormUT ..............................................................................76 TUFigure 38 - Honeypot Data GatheringUT ......................................................................77 TUFigure 39 - Normal Usage Packet Capture SetupUT .......................................................79 TUFigure 40 - Ports in use During Port ScanUT.................................................................85 TUFigure 41 - Unique Ports during Port ScanUT................................................................86 TUFigure 42 - Port Spread During Port ScanUT.................................................................86 TUFigure 43 - Traffic Direction Ratio during Port ScanUT ...................................................87 TUFigure 44 - Worm Detection on Port Scanning DataUT ...................................................88 TUFigure 45 - Dial-up Traffic 2, IP Protocol Anomaly DetectionUT .......................................88 TUFigure 46 - Honeypot Worm Dataset 2, TCP Protocol Anomaly DetectionUT.......................90
xii
List of Tables
TUTable 1 - Network SniffersUT .....................................................................................23 TUTable 2 - Network MonitorsUT ....................................................................................24 TUTable 3 - Intrusion Detection SystemsUT .....................................................................26 TUTable 4 - Worm Detection Signal FluctuationsUT ...........................................................67 TUTable 5 - Illustration of Sliding Window AnalysisUT .......................................................75 TUTable 6 - Nmap Scan of HoneypotUT...........................................................................78 TUTable 7 - Datasets used for evaluationUT.....................................................................80 TUTable 8 - DARPA Dataset Attacks (Wed - Fri Week 6)UT.................................................82 TUTable 9 - Sample Payload Pattern Match ReportUT ........................................................94 TUTable 10 - Signal Effectiveness WeightsUT ...................................................................95 TUTable 11 - DARPA 1998 (Wednesday) ResultsUT ...........................................................96 TUTable 12 - DARPA 1998 (Thursday) ResultsUT ..............................................................97 TUTable 13 – DARPA 1998 (Friday) ResultsUT..................................................................99 TUTable 14 - Honeypot Traffic Worm DetectionUT ..........................................................100 TUTable 15 - Honeypot & Background Traffic ResultsUT...................................................101 TUTable 16 - Background Dial-up Traffic DetectionUT......................................................102
1
1 Introduction
Network Operators spend a lot of time monitoring networks for anomalies such as
outages, configuration changes, flash crowds, abuse and attacks. The most damaging of
these anomalies are arguably bandwidth attacks. Both Internet wormsTP
1PT and denial of
service attacks fall into this category and have received a lot of media attention in recent
years due to the effects that these attacks have on government and business throughout
the world, causing billions of dollars in damage and affecting the lives of millions. The
term ‘Cyber Terrorism’ is widely used to refer to these types of attacks, the most
damaging of which can cost billions of dollars. Dealing with the “LoveBug” (CERT/CC,
2000) virus cost nearly $10 billion when it struck in 2002 (Coleman, 2003). This figure
may seem extreme but if your look at the projected eCommerce transaction value for this
yearTP
2PT, the Internet being down for just one day could disrupt nearly $6.5 billion worth of
transactions.
In a 2002 research study conducted by the Computer Crime Research Center, 90% of
respondents detected computer security breaches within the last twelve months. This
shows the extent of the problem and according to a recent survey by CERT/CC, the rate of
cyber attacks has been more than doubling every year in recent times with 137,529
incidents being reported to CERT in 2003.
Network Computing (www.networkcomputing.com) estimates the cost per single incident
of unknown buffer overflow attack to be $98,306. In 2002, financial losses due to viruses,
worms, etc were reported to average $283,000 per organization (CSI/FBI, 2003).
A recent paper presented at the Workshop on Economics and Information Security
(WEISS, 2004) predicted that a plausible worst-case worm could cause $50 billion direct
economic damage if it were to attack a widely used service in Microsoft Windows and carry
a destructive payload (Weaver & Paxson, 2004).
TP
1PT The worms discussed in this dissertation are active worms as opposed to viruses (or
email worms) that require user interaction to assist their spread.
TP
2PT A good overview including some useful statistics can be found in the document “The
Emerging Digital Economy”, US Dept. of Commerce, http://www.ecommerce.gov
2
One of the reasons that these attacks are so damaging is that they cause bandwidth to
become saturated with attack traffic resulting in legitimate traffic being blocked due to
congestion and overloaded services. Recent attacks have also shown that critical
infrastructure (that one would assume would not be connected to the public internet) is
also vulnerable to attack. The Slammer worm disrupted some ATM’s and 911 operations
(Forno, 2003) and even Ohio's Davis-Besse nuclear power plants safety monitoring
systems were disabled for a number of hours (Poulsen, 2003). Likewise, Welchia
(Symantec, 2003) managed to reduce the United States Navy-Marine Corps Intranet
network capacity by three quarters, disrupting usage for about 100,000 users (Messmer,
2003) while the country was engaged in substantial military action. Malicious traffic can
also increase DNS latency by 230% and web latency by 30% even on highly over-
provisioned links (Lan Hussain & Dutta, 2003).
There is currently no way for the network itself to distinguish between attack traffic and
legitimate traffic. If it was possible for the network to classify network traffic in this way,
the network itself could counter any such attacks by blocking malicious hosts, modifying
AQM behaviour, informing upstream routers of the problem, sending packets to clients to
reset connections and terminate the attack or simply by informing network administrators
who could then deal with the problem.
We must look at which components of the network would be the most suitable candidates
to perform such detection and classification, and at what level in the hierarchical network
infrastructure it is most appropriate to place this functionality.
There are many devices present in the Internet that interact with traffic flows. The devices
that have the greatest control of, and access to traffic flows are the internet router and
firewall. The internet routers function is to correctly direct packets across the network.
Congestion can occur when the router receives incoming traffic faster that it can send
traffic on its outgoing links. In the presence of congestion, routers must make decisions
on which packets to drop. The algorithms used to do this are known as Active Queue
Management (AQM) algorithms. Current deployed AQM algorithms manage traffic in a
simplistic fashion. Many algorithms classify all User Datagram Protocol (UDP) traffic as
malicious or aggressive because of its unresponsive nature and throttle these flows in
order to protect Transmission Control Protocol (TCP) traffic flows. This classification may
have been sufficient heretofore but At present there are an increasing number of Internet
applications that rely on UDP to deliver soft real time streams. Many of these traffic flows
3
are well behaved (some flow controlled at the application level) and should not, in
general, be aggressively penalized.
Thus, new techniques are needed to provide routers and other traffic control devices with
more accurately classified traffic flow information. This will allow AQM schemes to make
more informed and fairer decisions that may protect downstream devices and hosts from
the effects of congestion, in particular that caused by bandwidth attacks.
The majority of currently deployed schemes for protecting against such attacks work by
analyzing traffic flows at a border gateway router to an Autonomous System (AS). For
many such attacks, it is much simpler to detect that attack near the source or victim
machines. This is principally due to the complexity of current detection technology, which
is incapable of analysing high bandwidth backbone links in real-time (Das, 2000). Some
schemes (Gil & Poletto, 2001) also require that all traffic traveling in both directions be
visible to the device performing the analysis. On backbone links, the packets that
constitute a traffic flow may take different paths and so the entire flow can not be
observed at any single router interface. Backbone links are also often asymmetric,
carrying traffic in only one direction. However placing analysis and response functionality
in the network backbone may be more cost effective and could not as easily be
circumvented by attackers. An extensive literature survey identified no other work that is
looking at a low-level generic solution to this problem of traffic classification.
It is clear that identifying anomalies rapidly and accurately is critical to the efficient
operation of the network. A number of research papers which tackle the problem of
malicious traffic flows simply assume the presence of a method for differentiating
malicious or misbehaving flows from legitimate traffic (Yaar Perrig & Song, 2004).
This dissertation seeks to provide an extensible framework for making such
differentiations and makes use of real network data, to ensure that our results are reliable
and not biased by our own “unconscious assumptions” (Zanero & Savaresi, 2004).

4
1.1 Overview
• Chapter 1. Introduction
• Chapter 2. Background
This chapter will cover all the background necessary to understand the rest of the
document. The chapter will introduce Intrusion Detection, Traffic Analysis, Evading
Detection and Network Anomalies.
• Chapter 3. Network Monitoring / Intrusion Detection
This chapter is a state of the art of network monitoring and intrusion detection
tools and approaches.
• Chapter 4. Distributed Network Inspection System
This chapter covers the intrusion detection framework proposed by this dissertation
and the implementation of a distributed sensor application.
• Chapter 5. DNIS Pluggable Components
This chapter explains how some of the detection components that were
implemented work.
• Chapter 6. Data Gathering
This chapter details how data was collected to evaluate the application..
• Chapter 7. Evaluation
TThis chapter will provide an evaluation of the distributed network inspection system
itself and several of it’s components.
• Chapter 8. Worm Detection Results
This chapter evaluates and detection of worms via the distributed network
inspection system using the test data collected.
• Chapter 7. Conclusions
This chapter summarises the work and includes sections explaining how the
distributed network inspection systems requirements were met and outlines
proposed future research.
5
2 Background
2.1 Introduction
This dissertation deals with the concept of classifying traffic according to its desirability.
Current network traffic classification techniques are simplistic and rely on using IP packet
header data to create groups or aggregates of network traffic flows (Mahajan, Bellovin,
Floyd, Ioannidis, Paxson & Shenker, 2002). These aggregates may often be defined by
such metrics as TCP/UDP session information, topology or groups of users (protocol, IP
subnet address, VLAN), individual station applications (MAC address, 802.1D-1998,
802.1Q) or physical port. These aggregates are then used to enable Quality of Service
(QoS) profiles to be assigned to each group thereby allowing some traffic to be given
preference over other traffic. By identifying malicious or undesirable traffic on the network
these same techniques may be applied to ensure more reliable service to desirable traffic
on the network in the presence of bandwidth attacks and other malicious activity.
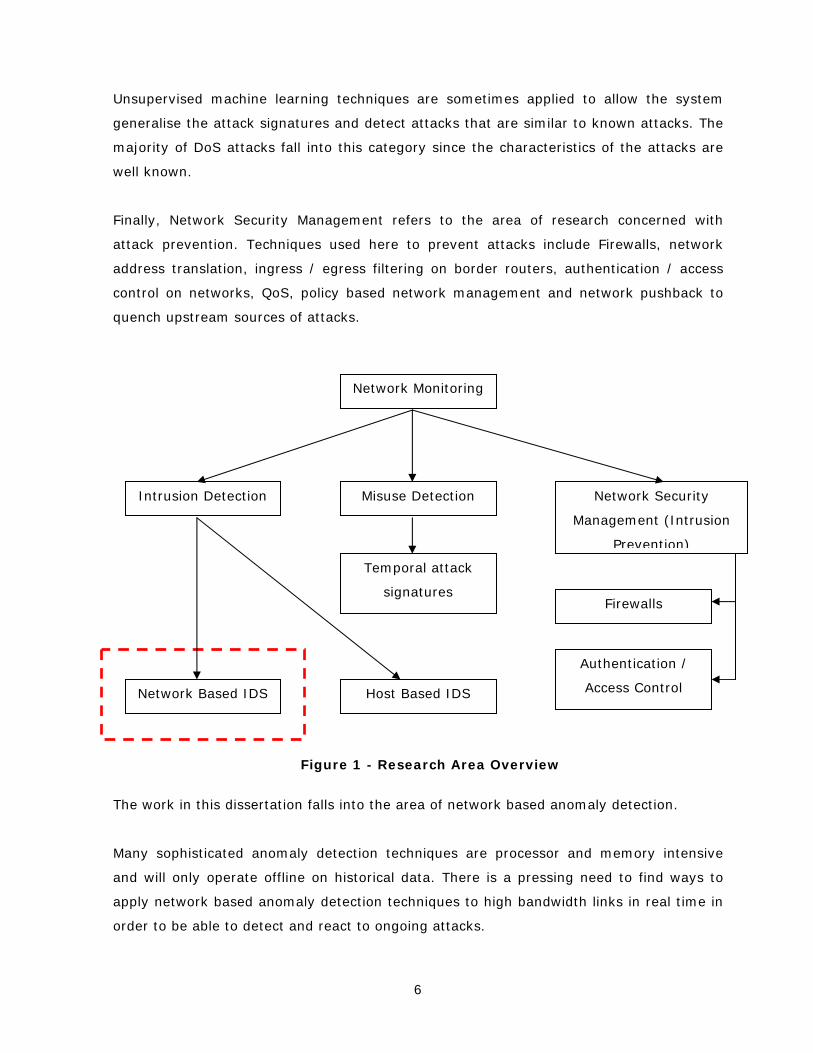
Figure 1 shows the relationship between the areas of research referred to and is intended
to clarify some of the terminology that this dissertation uses. Firstly, Network Policing is a
broad area of ongoing research. The key research directions in Network Policing can
generally be sub divided into Intrusion Detection, Misuse Detection and Network Security
Management.
Intrusion Detection refers to techniques for detecting previously unseen attacks, and
itself can be divided again into host based or network based detection. Host based
intrusion detection involves using application logs to monitor user activity on a host in an
attempt to discover sequences of actions or events that may indicate malicious activity.
Network based Intrusion Detection attempts to detect the same malicious activity by
analyzing the network traffic patterns traveling to and from local hosts. Network based
Intrusion Detection incorporates research in fields such as Traffic Analysis, probing attack
detection and traffic source identification.
Misuse detection is similar to Intrusion detection and incorporates many overlapping areas
of research. One significant difference is that Misuse Detection attempts to discover a re-
occurrence of a previously seen attack. This is done by either a rule based expert system
or using temporal attack signatures that describe the characteristics of known attacks.
6
Unsupervised machine learning techniques are sometimes applied to allow the system
generalise the attack signatures and detect attacks that are similar to known attacks. The
majority of DoS attacks fall into this category since the characteristics of the attacks are
well known.
Finally, Network Security Management refers to the area of research concerned with
attack prevention. Techniques used here to prevent attacks include Firewalls, network
address translation, ingress / egress filtering on border routers, authentication / access
control on networks, QoS, policy based network management and network pushback to
quench upstream sources of attacks.
The work in this dissertation falls into the area of network based anomaly detection.
Many sophisticated anomaly detection techniques are processor and memory intensive
and will only operate offline on historical data. There is a pressing need to find ways to
apply network based anomaly detection techniques to high bandwidth links in real time in
order to be able to detect and react to ongoing attacks.
Figure 1 - Research Area Overview
Network Monitoring
Intrusion Detection Misuse Detection Network Security
Management (Intrusion
Prevention)
Firewalls
Authentication /
Access Control
Temporal attack
signatures
Host Based IDS Network Based IDS
7
Many approaches have been experimented with for conducting anomaly detection (2.5
Intrusion Detection), the most promising of which are the signal analysis approaches.
These techniques are generally not capable of operating in real time and are not
coordinated between multiple sources of traffic measurement. Current IDS’s also lack the
ability to correlate and analyse related security events in multiple domains (Qin Lee Lewis
& Cabrera, 2002).
The remainder of this chapter will discuss the current state of the art in intrusion
detection, including techniques for detection evasion, traffic analysis techniques that these
systems make use of, and a taxonomy of the types of malicious attack traffic that we may
want to detect.
2.2 Properties of Network Traffic
Understanding the nature of network traffic is critical in order to properly design and
implement computer networks and network services like the proposed network monitoring
service. Network traffic, in general, has three main constituents: common periodic trends,
short-lived bursts, and noise.
• Common periodic trends are changes in traffic over time. A common observation
may be that there is more traffic during office hours than at night. There may also
be some more long lived trends such as the growing popularity of a web server or
new file sharing application.
• Short-lived bursts are also a component of any data network traffic analysis. In
general data networks are bursty in nature due to the way host applications and
users behave. This results in rapidly fluctuating traffic levels with many sharp
spikes. Intuitively, the critical characteristic of this self-similar traffic is that there is
no natural length of a "burst": at every time scale ranging from a few milliseconds
to minutes and hours, similar-looking traffic bursts are evident.
• Network traffic analysis also reveals an amount of background noise. This is
configuration and management traffic that is continuously passing around the
network and is not related to any application layer service.
8
In any network traffic analysis these types of traffic will be observed. Hidden amongst
these constituents are the anomalies caused by malicious traffic on the network. It is this
hidden traffic that this dissertation will try to detect.
2.3 Network Traffic Analysis Techniques
2.3.1 Introduction
In order to detect the anomalies hidden amongst the noise and other normal background
traffic patterns, traffic analysis techniques are applied. These techniques can include time
frequency analysis, many different types of signal analysis and a wide variety of data
mining techniques, amongst others. This section will cover a few of these techniques that
have shown the most promise and have seen the most research.
2.3.2 Time Frequency Analysis
Signal analysis techniques have been applied to network traffic in papers such as (Barford,
Kline, Plonka & Ron, 2003) in order to detect traffic flow anomalies. Network traffic is
converted to a signal by graphing activity against time (time-frequency representation).
These techniques involve using filters on this generated signal to effectively expose details
of the prevailing traffic. The ambient and predictable traffic can then be filtered out
allowing the remaining traffic to be analysed statistically. The literature (Barford et al,
2003) has shown how wavelets can be effectively used to analyse network traffic at the
flow level. This paper proposed an algorithm that the authors refer to as deviation scoring,
which consists of continuously calculating the normalised signal deviation over a sliding
time window. Thresholds were then used to generate alerts. However, this paper
illustrates some of the remaining difficulties with these techniques such as a difficulty in
drilling down to specific sources of anomalies and the inability to detect attacks in real
time. This paper also could not classify anomalies as either malicious or otherwise.
2.3.3 Wavelets
2.3.3.1 Overview
Wavelets are mathematical functions that cut up data into different frequency
components, and then study each component with a resolution matched to its scale. They
have advantages over traditional Fourier methods for analyzing physical situations where
the signal contains discontinuities and sharp spikes.

9
Wavelets are based on the idea of superposition of functions. This is the same idea behind
Fourier methods, that consider signals as the superposition of sine and cosine waves.
Because Fourier functions are based on sine and cosine waves, they do a poor job at
approximating sharp spikes. Wavelets, however, do not have a single set of basis
functions like the Fourier transform. Instead, wavelet transforms have an infinite set of
possible basis functions. Thus, wavelet analysis provides access to information that can be
obscured by other time-frequency methods such as Fourier analysis.
2.3.3.2 History
The first mention of wavelets appeared in an appendix to the thesis of A. Haar (1909).
During the 1930’s a number of groups researched the representation of functions using
scale-varying basis functions. It was found that these functions were superior to Fourier
basis functions for studying small complicated details in waves.
Stephane Mallat in 1995 was the first to apply wavelets to digital signal processing. A
more detailed history can be found in (Graps, 2003).
2.3.3.3 Uses
Wavelets are being applied in many fields including astronomy, acoustics, nuclear
engineering, signal and image processing, music, optics, earthquake prediction and in
pure mathematics applications such as solving partial differential equations. Another
important use of wavelets is in data compression.
Because wavelets’ localize frequency components, many functions using wavelets are
“sparse” when transformed into the wavelet domain. This sparseness or smoothing makes
wavelets very useful for purposes such as data compression, detecting features in images
and removing noise from time series.
These last two applications suggest that network traffic analysis would be another
appropriate application of wavelets due to the large amount of noisy, spiky time series
data to be analysed.
2.3.4 Data Mining Techniques
Data mining based anomaly detection uses learning algorithms that are trained on sets of
data that contain malicious traffic and sets that do not. The algorithm, once trained can
10
then ‘recognize’ malicious traffic. These methods share the same weakness as signature
based techniques since they can only detect attacks that are know and have been seen
before, since it must be trained to recognize each type of attack. “The SRI IDES Statistical
Anomaly Detector” (Javitz & Valdes, 1990) is a real-time intrusion detection expert system
that has shown the applicability of data mining techniques to discovering anomalies in
network traffic.
2.3.5 Eigen Values
The most commonly used technique to analyze high dimensional structures is the method
of Principal Component Analysis (PCA), also known as the Karhunen-Lo`eve procedure
and Singular Value Decomposition (SVD) (Shyu1, Chen, Sarinnapakorn & Chang, 2004).
Given a high dimensional object and its associated coordinate space, PCA finds a new
coordinate space which is the best one to use for dimension reduction of the given object.
Once the object is placed into this new coordinate space, projecting the object onto a
subset of the axes can be done in a way that minimizes error. This approach has
successfully been applied for the purposes of outlier detection in network traffic with a
claimed detection rate of close to 99% on a well know test dataset.
2.4 A Taxonomy of Network Anomalies
2.4.1 Introduction
Any change in network usage data could be considered an anomaly, so for the purposes of
this work only changes in network usage that correspond to an identifiable change in
network state will be considered. The following section will present and expand upon a
possible characterization of network anomalies that has been presented in Barford &
Plonk, (2002). This characterization is based on a visual analysis of traffic flow anomalies.
There are many types of anomalies but they can broadly be classed as:
• Network Operations Anomalies
• Flash Crowd Anomalies
• Network Abuse Anomalies
11
2.4.2 Network Operation Anomalies
Network outages can result from a network device failure or temporary mis-configuration.
Other outages may also be caused by re-configurations (e.g adding new equipment or
imposing rate limits). When the network load reaches it’s maximum, then plateau
behavior is observed. Network Operations anomalies are usually identified by a sudden,
nearly instantaneous change in network load followed by a stable but different load.
Theses sources of anomaly result in previously unseen (yet legitimate) traffic patterns that
may be flagged as intrusions. It is important to know about such legitimate sources of
anomalies in order to develop a system that minimizes the likelihood of false alarms.
These anomalies should be detected but are not malicious and so are not the focus of this
work. It may however still be appropriate for the system administrator to be notified when
an occurrence of this type of anomaly is detected.
2.4.3 Flash Crowds
A flash crowd event is a sudden surge in usage of the network focused on a particular host
or subnet. These events are common in networks. For instance: Interest in a website due
to some kind of publicity or event may cause a sharp rise in the network load to the host
on which the website resides. Flash crowd behavior is distinguished by a rapid rise in
traffic flows of a particular type that drop off over time.
Another example would be company’s employees returning to their desks and checking e-
mail immediately following a company-wide meeting. The resulting spike in SMTP activity
is not normal for that time of the day or week but is not necessarily a denial of service
attempt against the mail server either, as a statistical anomaly detector might label it.
2.4.4 Network Abuse
Network Abuse Anomalies can include any type of malicious use of the network. There are
many forms of network abuse. The most common include:
• Viruses
• Worms
• Denial of Service Attacks (DoS)

12
• Distributed DoS Attacks
• SPAM email
2.4.4.1 Viruses
Viruses generally affect hosts rather than networks so you may not expect this section to
appear here. A virus is a chunk of malicious code that will generally attach itself to an
executable file in order to have the operating system execute it. Virus’s themselves are
not a threat to the network but the way they spread certainly is. Many of the famous
viruses over the past decade were mass mailing viruses which spread via email to
contacts in your address book. These viruses clog up internet links, crash servers and in
many cases result in network operators disconnecting large portions of the internet in
order to slow the spread of these viruses.
2.4.4.2 Worms
The term `worm' is simply a shorter term for an `autonomous intrusion agent'. A
computer worm is a program that self-propagates across a network exploiting security or
policy flaws in widely-used services. Worms will have some of the following facets:
• Target discovery
• Carrier
• Activation
• Payloads
Target discovery represents the mechanism by which a worm discovers new targets to
infect. The activity of carrying out reconnaissance, or information gathering, is the
mechanism by which the system extends its view of the world around itself, determines
information about the systems and networks around it, and identifies targets. This can be
achieved through scanning (probing a set of addresses to identify vulnerable hosts) either
sequentially or randomly through addresses. Scanning is highly anomalous behavior, very
different from normal traffic and so should be relatively easy to detect. Worms could use a
pre-generated target list of victims or an external target list that is obtained by
compromising another server (such as a games server). Worms can obtain target lists
from infected machines or passively by waiting for victims to contact the worm.
The carrier is the mechanism the worm uses to transmit itself onto the target. A self-
carried worm actively transmits itself as part of the infection process. Some worms, such
as Blaster, require a secondary communication channel to complete the infection.
13
Embedded worms send themselves along as part of a normal communication channel,
either appending to or replacing normal messages.
Activation is the mechanism by which the worm’s code begins operating on the target.
Some worms try to convince a local user to execute the worm. The Melissa email-worm
used the message “Attached is an important message for you” to trick people into
executing it. Other worms are activated when the user performs some activity or through
scheduled system processes. There are also worms that able to initiate their own
execution by exploiting vulnerabilities in services that are always on and available (e.g.,
CodeRed exploiting IIS Web servers).
Payloads are the various non-propagating routines a worm may use to accomplish the
author’s goal. These goals may be to gain control of a computer system, relay Spam,
relay HTTP requests in order to hide identity and location of websites, conduct Denial of
Service (DOS) attacks or to collect or destroy data from a target computer.
2.4.4.3 Denial of Service Attacks
DoS attacks attempt to exhaust the resources of the victim. The resources may be
network bandwidth, computing power or operating system data structures. A DoS attack
is characterized by an explicit attempt by attackers to prevent legitimate users of a
service from using that service.
Examples include:
• attempts to "flood" a network, thereby preventing legitimate network traffic
• attempts to disrupt connections between two machines, thereby preventing access
to a service
• attempts to prevent a particular individual from accessing a service
• attempts to disrupt service to a specific system or person
Today, the most common DoS attack type reported is the packet flooding attack. There
are three common packet types that are used by many DoS attack tools including TCP
floods (SYN packets), ICMP echo and UDP floods.
DoS attacks can be extremely difficult to detect because the header content of packets,
including source addresses, can be randomised by an attacker. Although headers are
easily forged, it has been shown that characteristics of attack ramp-up and attack
14
spectrum is more difficult to spoof and can be used to classify DoS attacks (Hussain,
Heidemann & Papadopoulos, 2003).
Flooding attacks are classified as (a) single-source, (b) multi-source or (c) reflected based
on the number of attackers and their location, with respect to the observation point and
victim. The following section will discuss Distributed DoS Attacks which are multi-source.
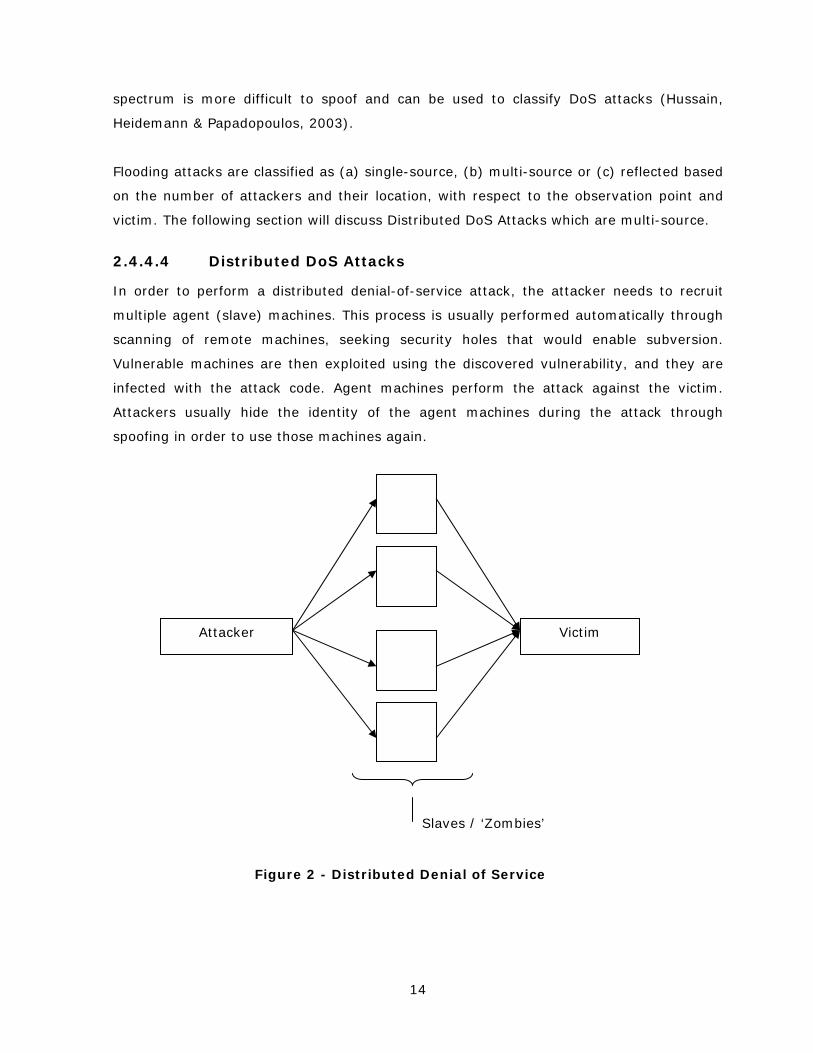
2.4.4.4 Distributed DoS Attacks
In order to perform a distributed denial-of-service attack, the attacker needs to recruit
multiple agent (slave) machines. This process is usually performed automatically through
scanning of remote machines, seeking security holes that would enable subversion.
Vulnerable machines are then exploited using the discovered vulnerability, and they are
infected with the attack code. Agent machines perform the attack against the victim.
Attackers usually hide the identity of the agent machines during the attack through
spoofing in order to use those machines again.
Figure 2 - Distributed Denial of Service
Attacker
Victim
Slaves / ‘Zombies’
15
2.4.4.5 SPAM email
Spam is the name given to unsolicited email that internet users receive every day. It is
normally sent as advertising. The reason these people choose spam as their
advertisement medium is because it’s so cheap. It costs practically nothing to send spam
compared with traditional advertising mediums such as television and radio. In recent
year Spam has become a major problem as networks become clogged with unwanted
Spam email traffic. It has been estimated that 80% of all e-mail is actually Spam
(ePrivacy, 2003).
2.4.5 Other
Other sources of anomaly may include Measurement failures. Measurement failures may
be the result of hardware failures or the loss of data due to in-band transmission of
measurement results across the network. This is a particularly serious problem where
sensors may be distributed across a network and each sensor is capturing network traffic
information and periodically reporting to some central service.
2.5 Intrusion Detection
“Intrusion Detection Systems aim to strengthen the perimeter surrounding the computer
system. They are intended to complement existing security measures such as firewalls to
provide a defense in depth.” (Bace & Mell, 2001)
There are two basic types of intrusion detection: host based and network based. Host
based systems (of which application based IDS’s are a subset) usually consist of a
program or series of programs that review operating system audit trails, and system logs
to detect that an intrusion has taken place.
Host-based IDSs, with their ability to monitor events local to a host, can detect attacks
that cannot be seen by a network-based IDS. They can also operate in an environment in
which network traffic is encrypted. However, at the same time they have the disadvantage
of being harder to manage and vulnerable to attack themselves.
Network based systems monitor traffic on a network segment or switch in an attempt to
detect an intrusion. The advantage of Network-Based IDS's are that a few well-placed

16
network-based IDS’s can monitor a large network and protect a large number of hosts.
Network-based IDS’s are also usually passive devices that listen without interfering with
the normal operation of a network allowing the deployment of network-based IDS’s to
have little impact upon existing networks.
However a network based approach may have difficulty processing all packets in a large or
busy network. Network based IDS’s also cannot analyze encrypted information. This
problem is increasing as more organizations (and attackers) use virtual private networks
(VPN).
There are two basic methods of detection, anomaly based (also known as Profile-based)
and signature basedTP
3PT. Anomaly based systems attempt to map events to the point where
they "learn" what is normal and then detect an anomaly that might indicate an intrusion.
Simple pattern matching is also sometimes used to scan for byte signatures in packets
that may indicate an attack. This pattern matching is often stateful so that it can match
patterns spread across a number of packets belonging to a single stream. These pattern
matching techniques are another form of signature based system. This dissertation will
focus on anomaly based network intrusion detection only.
2.5.1 Signature Based
Most intrusion detection systems (IDS) are what is known as signature-based or misuse
based. This means that they operate in much the same way as a virus scanner, by
searching for a known identity or signature for each specific intrusion event.
Misuse detectors are very effective at detecting attacks without generating an
overwhelming number of false alarms. However they can only detect those attacks they
know about. It can also be all too easy to fool signature-based solutions by changing and
obfuscating the ways in which an attack is made (2.6 Evading detection).
TP
3PT Signature based detection is often referred to in literature as misuse detection. The two
descriptions are interchangeable.
17
2.5.2 Anomaly Detection
Anomaly detection techniques for intrusion detection have been an active area of research
since they were first proposed by Denning in 1987 (Denning, 1987). Anomaly detection
techniques directly address the problem of detecting novel attacks against systems. This
is possible because anomaly detection techniques do not scan for specific patterns, but
instead compare current activities against statistical models of past behavior. Any activity
sufficiently deviant from the model will be flagged as anomalous, and hence considered as
a possible attack. Anomaly detection’s main use today is in the detection of the presence
of network attacks as part of an intrusion detection system.
Organisations generally rely on ad-hoc methods for anomaly detection. It is common
practice for many large organizations to rely on manual inspection and expert knowledge.
For this reason that network engineers often have several monitors on their desk showing
real-time graphs of network load from particular network devices. This method is
inaccurate and prone to error. It relies in a network engineer to be experienced enough to
recognize unwanted traffic patterns and then be able to track down the source of the
problem and take measures to counteract the effects of the unwanted traffic.
This method does not scale to large networks and it is not cost effective to have network
engineers employed to monitor network conditions 24 hours a day. For these reasons
researchers have looked at algorithms that can automatically analyse the same network
traffic graphs that network engineers currently analyse, and recognize anomalous traffic
amongst all the noise of legitimate network traffic.
Tools developed to help in the process of anomaly detection rely on either;
1. Pre-defined thresholds for particular network traffic properties, which when
exceeded, trigger an alarm.
2. Sets of rules or policies based on known anomalies, which are aimed at preventing
a re-occurrence of such an anomaly. This is the most widely deployed method for
detecting attacks and protecting against cyber terrorism.
3. Detecting deviations from forecasted behaviors using data mining techniques,
which use machine learning algorithms to build a model of normal traffic and then
classify incoming traffic as normal or anomalous.
18
Signature-based IDS really only scratches the surface of what most organisations need to
protect against because they rely on spotting a duplication of events or types of attack
that have happened before.
2.5.3 Neural Networks for Anomaly Detection
Neural NetworksTP
4PT have been proposed as a means of performing anomaly detection
(Ghosh & Schwartzbard, 1999).
Two types of architecture for Neural Networks can be distinguished:
• Supervised training algorithms, where in the learning phase, the network learns
the desired output for a given input or pattern.
• Unsupervised training algorithms, where in the learning phase, the network learns
without specifying the desired output.
There is some research into applying the pattern recognition abilities of neural networks to
anomaly detection, but no commercial applications have emerged from this research as of
yet.
2.5.4 Statistical Anomaly Detection
Statistical anomaly detection works by observing behaviour and forming a profile of
normal activity. The profile is a collection of statistics that are generated from observed
traffic. It is then statistically determined whether behaviour is anomalous. An example of
a Statistical Anomaly detector is SRI International’s real-time intrusion-detection expert
system (Javitz & Valdes, 1990).
2.5.5 Protocol Anomaly Detection
Protocol anomaly detection uses the specification of Internet protocols to detect abnormal
use of the protocols. The Internets Request For Comment (RFC) documents define the
proper use of the communication protocols. It is an easy task to check that the actual
traffic on a network conforms to this specification. Protocol anomaly detection has become
TP
4PT A good introduction to Neural Networks is available in “An introduction to Neural
Networks” (Anderson 1995)
19
popular because of its ease of use. It has proven to be much simpler to model the correct
use of a network via the RFCs than it is to model malicious usage, because they do not
require updated signatures for new attacks. They only need to be updated when a new
protocol becomes popular which is relatively infrequently. For these reasons protocol
anomaly detectors have been integrated into most commercial IDS software. Because of
the small rule set that they have to check they do not consume as much resources as
other methods and so can be run on higher bandwidth links.
The Nimda worm spread using a directory traversal exploit in Microsoft’s IIS software. The
exploit allowed a specially crafted URL passed to the server in a HTTP GET request to
cause the execution of “cmd.exe” on the machine giving an attacker access to a shell. A
protocol anomaly detector would have a model of the HTTP protocol and would detect the
presence of illegal charactersTP
5PT in the HTTP headers. In fact many protocol anomaly
detectors did detect Nimda and allowed their organisations to defend against it even
before the rest of the community had discovered it and generated signatures (Das, 2001).
2.5.6 Graph based Anomaly Detection
It has been proposed that network anomalies can be detected by following the graph of
network connections. In this graph the nodes are network hosts and the edges are
connections between these hosts. By following these graphs and observing how they
change over time, anomalous usage can be detected. Anomalies such as, a particular host
that does not usually connect to many machines suddenly connecting to many hosts it has
never contacted before, may indicate that a machine has been compromised. Similarly
activity such as a machine that only ever connects to email and web servers starts
connecting to database servers would also be detected. Internet worms can be detected
because of the way they spread. It would be unusual for a host to contact another host
and shortly later that hosts start contact many other hosts and so on. This tree shaped
graph could be used to identify worm traffic. GrIDS (Cheung, Crawford, et al, 1999) is a
system that has successfully implemented graph based anomaly detection. Other papers
such as “Connection History Based Anomaly Detection” (Toth, Krugel, 2002) show how
this method can successfully be used to detect worms.
TP
5PT The URI specification allows the use of escaped characters when interpreting URIs.
However, as noted in the Unicode Standard, applications should only interpret “shortest
from” Unicode strings.
20
2.5.7 Payload Based Anomaly Detection
Payload based anomaly detection is a technique that has recently emerged. It works by
analyzing the bytes that are being transferred in the payloads of packets and looks for
anomalies. This works because the payloads of packets will have some inherent structure.
Generally each application layer protocol will have its own structure that is unique and can
be used to identify the protocol (Ghosh & Schwartzbard, 1999). By analyzing all the traffic
going to a particular port, say 80 it can be detected if there is anything other than HTTP
traffic traveling on that port. This is a necessary security precaution as firewalls generally
admit all traffic on port 80 without any inspection of the packets contents. Since any
service can be configured to run on any port this is a potential vulnerability. It is not
believed that any of the existing IDS systems implement such a detection method but
they have been documented in numerous papers which look at using methods ranging
from neural networks(Ghosh & Schwartzbard, 1999) to byte frequency distributions (Wang
& Stolfo, 2004) to recognise protocols and anomalies in those protocols.
2.6 Evading detection
2.6.1 Introduction
Most attackers are aware of IDSs and use evasive techniques to dodge them. These
evasive techniques include flooding, fragmentation, encryption, and obfuscation. The
following section will discuss the ease with which these techniques can be applied.
2.6.2 Flooding
By flooding a network with noise traffic (2.2 Properties of Network Traffic), an attacker
can cause the IDS to exhaust its resources examining harmless traffic. In the meantime,
while the IDS is occupied by the volume of noise traffic, the attacker can target its system
with little or no intervention from the IDS. MULTOPS (Gil & Poletto, 2001) is an anomaly
detection system that was designed with this particular evasion technique in mind and
carefully manages its memory so as to not be distracted by flooding.
21
2.6.3 Fragmentation
Because different network media allow variable maximum transmission units (MTUs), TCP
provides for the fragmentation of these transmission units into differently sized packets or
cells. This can be use to hide an attack by using different sizes and different numbers of
packets from different attackers. To combat this technique, anomaly detection systems
perform a stateful inspection of the streams, reconstructing data from fragments wherever
necessary. Essentially the systems must work at the transport layer rather than the
network or data-link layers TP
6PT.
2.6.4 Encryption
Network-based intrusion detection relies on the analysis of traffic that is captured as it
traverses the network from a source to its destination. If a hacker can establish an
encrypted session with its target the IDS cannot analyze the packets and the malicious
traffic will be allowed to pass. Because the IDS cannot see the contents of the packets it
cannot directly respond and must rely on other information.
2.6.5 Obfuscation
Fragmentation and encryption provide a means of obfuscation but there are many other
more subtle ways to hide the content of a packet. An increasingly popular evasive
technique, involves concealing an attack with special characters or characters may be
represented in hex or Unicode formats. Padding packets and randomizing headers can also
obfuscate the presence of the malicious payload.
These techniques are difficult to combat. Flooding encryption and other general
obfuscation are a big problem for traditional IDS systems that work on a subnet and
analyse individual packets.
TP
6PT Layers refer to seven layers of the Open System Interconnection (OSI) model for
network protocols.
22
3 Network Monitoring / Intrusion Detection
This section will introduce some of the existing network monitoring and intrusion detection
systems that are available. Both of these applications share a good deal of overlapping
functionality and are often described using a variety of names including Attack Mitigation
Systems, Network Intrusion Prevention System (NIPS), Network Intrusion Detection
System (NIDS) and Network Security Auditing Systems amongst others.
The section has been divided into four sub classes of tools with each consecutive class
being an extension to the features and abilities of the previous:
• Network Sniffers
• Network Monitoring Systems
• Intrusion Detection Systems
• Experimental Systems
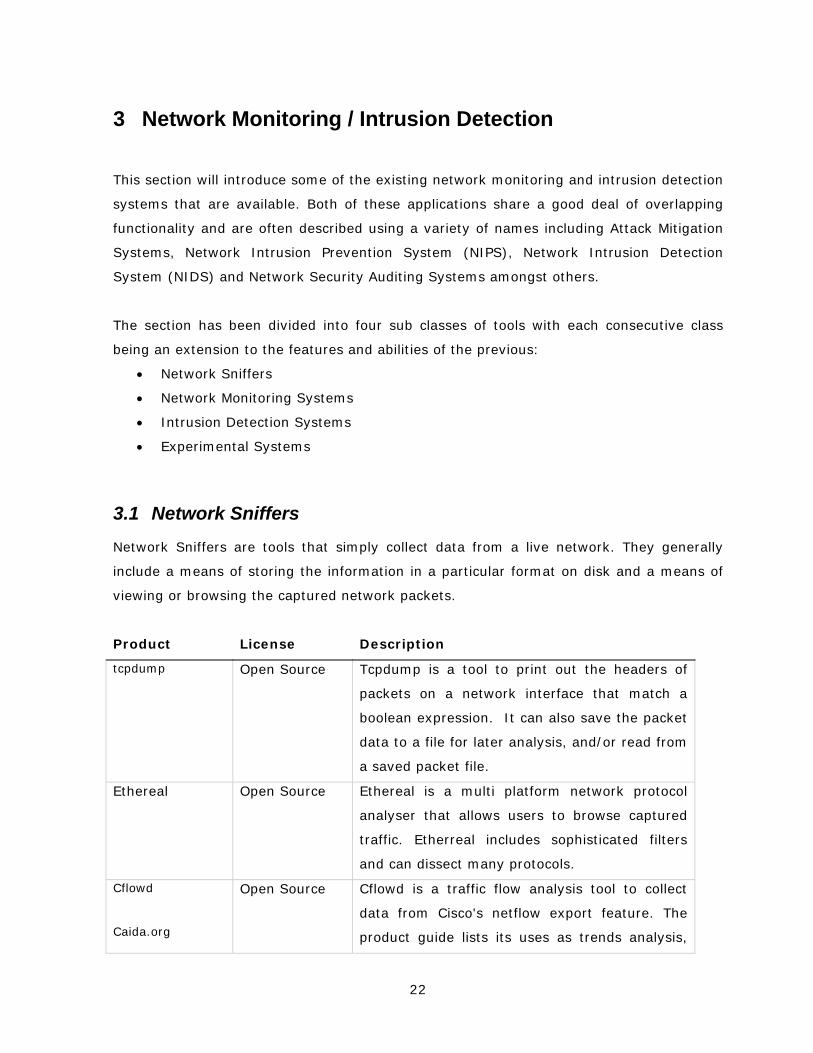
3.1 Network Sniffers
Network Sniffers are tools that simply collect data from a live network. They generally
include a means of storing the information in a particular format on disk and a means of
viewing or browsing the captured network packets.
Product License Description
tcpdump Open Source Tcpdump is a tool to print out the headers of
packets on a network interface that match a
boolean expression. It can also save the packet
data to a file for later analysis, and/or read from
a saved packet file.
Ethereal Open Source Ethereal is a multi platform network protocol
analyser that allows users to browse captured
traffic. Etherreal includes sophisticated filters
and can dissect many protocols.
Cflowd
Caida.org
Open Source Cflowd is a traffic flow analysis tool to collect
data from Cisco's netflow export feature. The
product guide lists its uses as trends analysis,
23
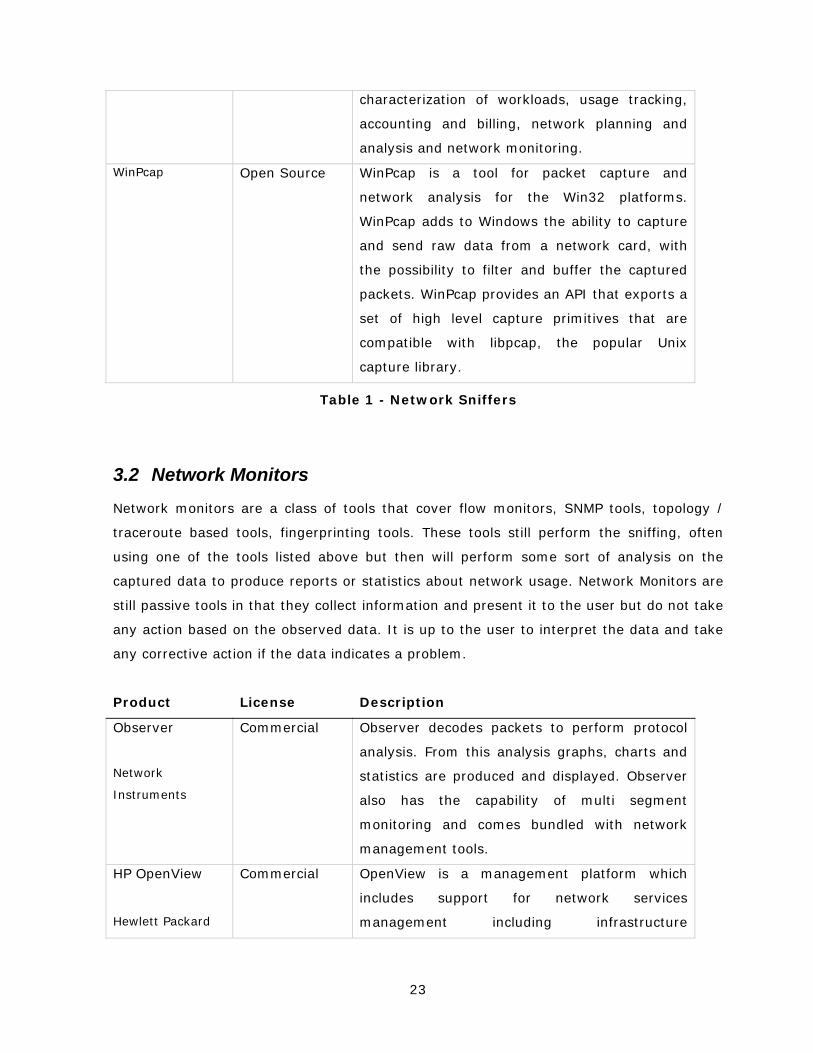
characterization of workloads, usage tracking,
accounting and billing, network planning and
analysis and network monitoring.
WinPcap Open Source WinPcap is a tool for packet capture and
network analysis for the Win32 platforms.
WinPcap adds to Windows the ability to capture
and send raw data from a network card, with
the possibility to filter and buffer the captured
packets. WinPcap provides an API that exports a
set of high level capture primitives that are
compatible with libpcap, the popular Unix
capture library.
Table 1 - Network Sniffers
3.2 Network Monitors
Network monitors are a class of tools that cover flow monitors, SNMP tools, topology /
traceroute based tools, fingerprinting tools. These tools still perform the sniffing, often
using one of the tools listed above but then will perform some sort of analysis on the
captured data to produce reports or statistics about network usage. Network Monitors are
still passive tools in that they collect information and present it to the user but do not take
any action based on the observed data. It is up to the user to interpret the data and take
any corrective action if the data indicates a problem.
Product License Description
Observer
Network
Instruments
Commercial Observer decodes packets to perform protocol
analysis. From this analysis graphs, charts and
statistics are produced and displayed. Observer
also has the capability of multi segment
monitoring and comes bundled with network
management tools.
HP OpenView
Hewlett Packard
Commercial OpenView is a management platform which
includes support for network services
management including infrastructure
24
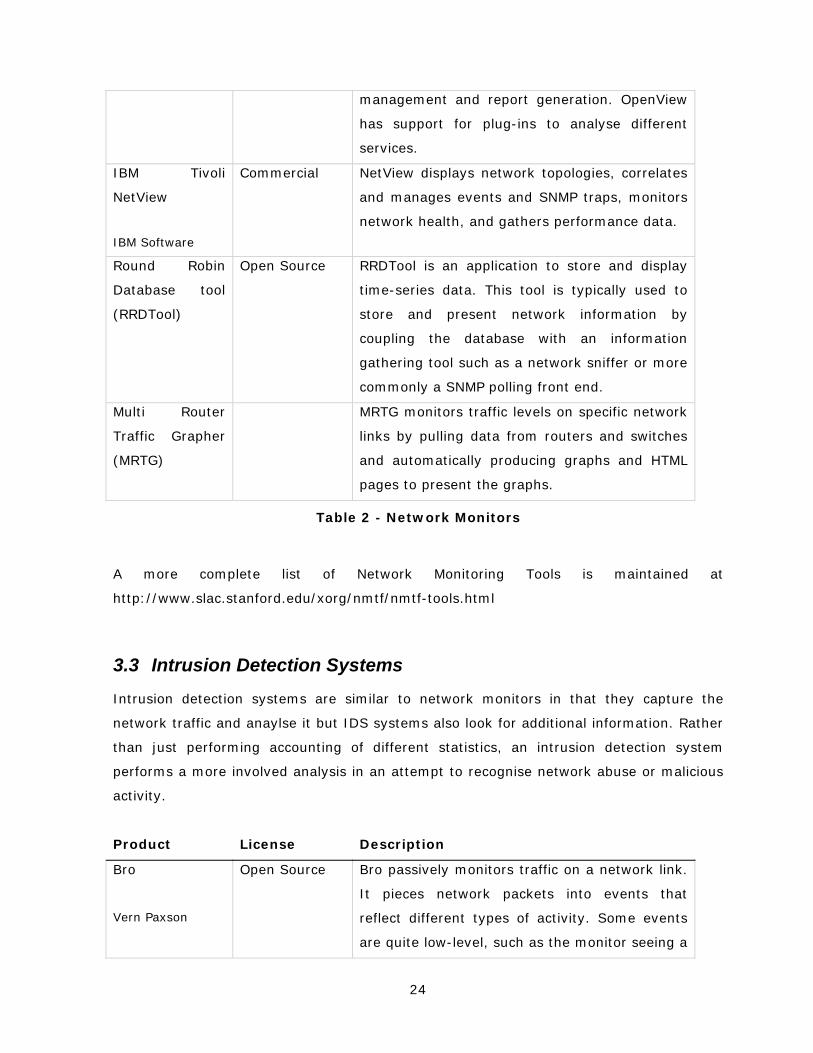
management and report generation. OpenView
has support for plug-ins to analyse different
services.
IBM Tivoli
NetView
IBM Software
Commercial NetView displays network topologies, correlates
and manages events and SNMP traps, monitors
network health, and gathers performance data.
Round Robin
Database tool
(RRDTool)
Open Source RRDTool is an application to store and display
time-series data. This tool is typically used to
store and present network information by
coupling the database with an information
gathering tool such as a network sniffer or more
commonly a SNMP polling front end.
Multi Router
Traffic Grapher
(MRTG)
MRTG monitors traffic levels on specific network
links by pulling data from routers and switches
and automatically producing graphs and HTML
pages to present the graphs.
Table 2 - Network Monitors
A more complete list of Network Monitoring Tools is maintained at
http://www.slac.stanford.edu/xorg/nmtf/nmtf-tools.html
3.3 Intrusion Detection Systems
Intrusion detection systems are similar to network monitors in that they capture the
network traffic and anaylse it but IDS systems also look for additional information. Rather
than just performing accounting of different statistics, an intrusion detection system
performs a more involved analysis in an attempt to recognise network abuse or malicious
activity.
Product License Description
Bro
Vern Paxson
Open Source Bro passively monitors traffic on a network link.
It pieces network packets into events that
reflect different types of activity. Some events
are quite low-level, such as the monitor seeing a
25
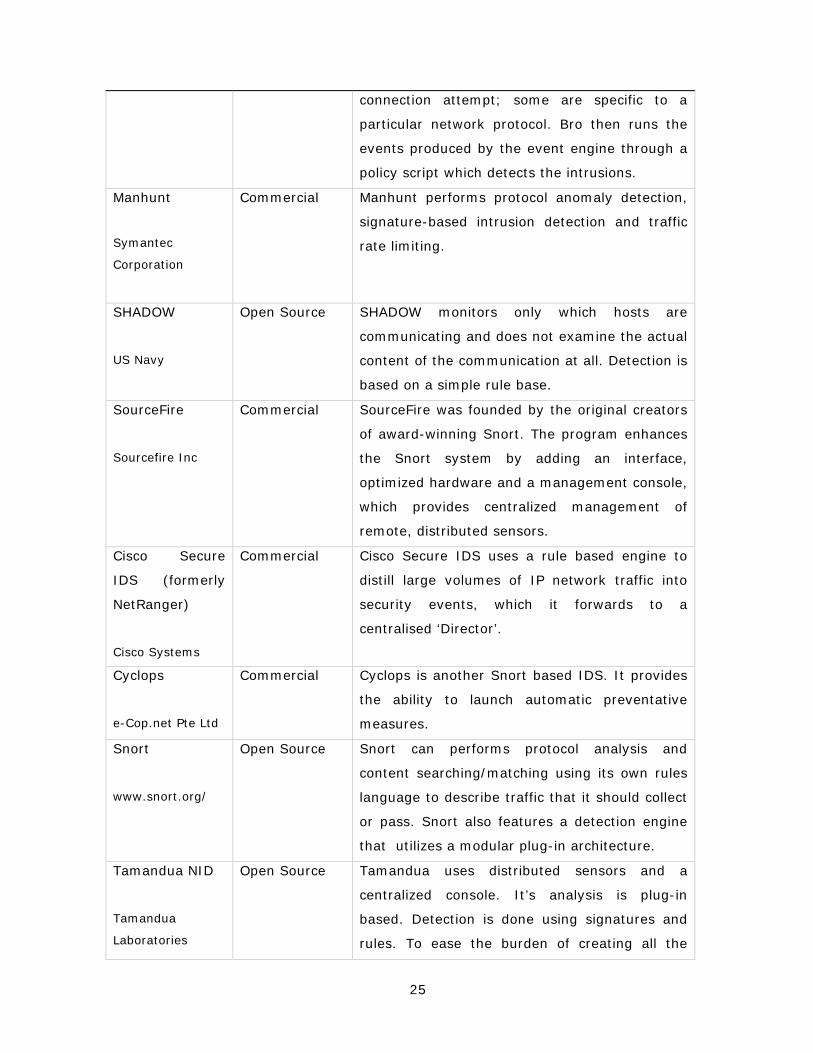
connection attempt; some are specific to a
particular network protocol. Bro then runs the
events produced by the event engine through a
policy script which detects the intrusions.
Manhunt
Symantec
Corporation
Commercial Manhunt performs protocol anomaly detection,
signature-based intrusion detection and traffic
rate limiting.
SHADOW
US Navy
Open Source SHADOW monitors only which hosts are
communicating and does not examine the actual
content of the communication at all. Detection is
based on a simple rule base.
SourceFire
Sourcefire Inc
Commercial SourceFire was founded by the original creators
of award-winning Snort. The program enhances
the Snort system by adding an interface,
optimized hardware and a management console,
which provides centralized management of
remote, distributed sensors.
Cisco Secure
IDS (formerly
NetRanger)
Cisco Systems
Commercial Cisco Secure IDS uses a rule based engine to
distill large volumes of IP network traffic into
security events, which it forwards to a
centralised ‘Director’.
Cyclops
e-Cop.net Pte Ltd
Commercial Cyclops is another Snort based IDS. It provides
the ability to launch automatic preventative
measures.
Snort
www.snort.org/
Open Source Snort can performs protocol analysis and
content searching/matching using its own rules
language to describe traffic that it should collect
or pass. Snort also features a detection engine
that utilizes a modular plug-in architecture.
Tamandua NID
Tamandua
Laboratories
Open Source Tamandua uses distributed sensors and a
centralized console. It’s analysis is plug-in
based. Detection is done using signatures and
rules. To ease the burden of creating all the
26
rules, Tamandua can import SNORT rule sets.
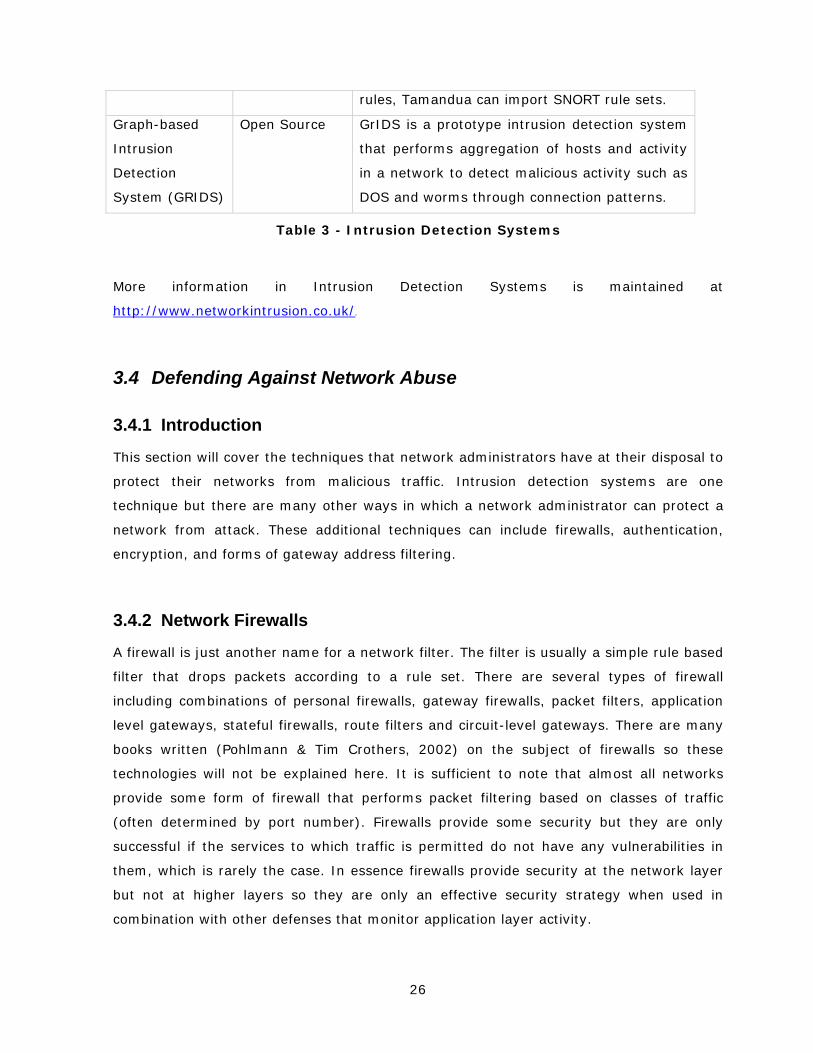
Graph-based
Intrusion
Detection
System (GRIDS)
Open Source GrIDS is a prototype intrusion detection system
that performs aggregation of hosts and activity
in a network to detect malicious activity such as
DOS and worms through connection patterns.
Table 3 - Intrusion Detection Systems
More information in Intrusion Detection Systems is maintained at
HTUhttp://www.networkintrusion.co.uk/UTH
3.4 Defending Against Network Abuse
3.4.1 Introduction
This section will cover the techniques that network administrators have at their disposal to
protect their networks from malicious traffic. Intrusion detection systems are one
technique but there are many other ways in which a network administrator can protect a
network from attack. These additional techniques can include firewalls, authentication,
encryption, and forms of gateway address filtering.
3.4.2 Network Firewalls
A firewall is just another name for a network filter. The filter is usually a simple rule based
filter that drops packets according to a rule set. There are several types of firewall
including combinations of personal firewalls, gateway firewalls, packet filters, application
level gateways, stateful firewalls, route filters and circuit-level gateways. There are many
books written (Pohlmann & Tim Crothers, 2002) on the subject of firewalls so these
technologies will not be explained here. It is sufficient to note that almost all networks
provide some form of firewall that performs packet filtering based on classes of traffic
(often determined by port number). Firewalls provide some security but they are only
successful if the services to which traffic is permitted do not have any vulnerabilities in
them, which is rarely the case. In essence firewalls provide security at the network layer
but not at higher layers so they are only an effective security strategy when used in
combination with other defenses that monitor application layer activity.

27
3.4.3 IP Traceback
IP Traceback is a very active area of research. Traceback is an attempt to solve the
problem of determining the ‘real’ source of traffic on your network. It seems a simple task
to trace an IP connection since each packet contains a source address. The problem is that
it is possible for the sending computer to put in any sending IP address it wishes.
These difficulties are made worse by the fact that hackers will launder their connections
through other machines often changing the source address many times. Currently the best
way to trace such a connection remains by hand. CERT can provide contacts for many
sites who will often already know they have a problem and can supply more information.
Obviously this is not a satisfactory way to trace attackers as it takes a long time and, even
if it can be done, legal issues surrounding crimes across political borders mean that there
is usually little that can be done.
There have been many schemes proposed for traceback, some of the more well known
including:
• Node Append Append each node’s address to the end of the packet as it travels
through the network from attacker to victim. Thus, every packet received by the
victim arrives with a complete ordered list of the routers it traversed.
• Node Sampling A single static “node” field is reserved in the packet header large
enough to hold a single router address. Upon receiving a packet, a router may
choose to write its address in the node field. Eventually the destination builds a
complete route.
• Edge Sampling Works the same as Node Sampling but explicitly encodes edges
(source, destination pairs) in the attack path rather than simply individual nodes.
• Probabilistic packet marking (PPM) This scheme is based on the idea that
routers mark packets that pass through them with their addresses or a part of their
address. Packets are selected at random with some fixed probability of being
selected. As the victim gets the marked packets, it can reconstruct the full path.
• Deterministic Packet Marking (DPM) This scheme is an improved version of
PPM where interfaces rather than routers are treated as atomic units of Traceback.
• ICMP Traceback (iTrace) Every router on the network is configured to pick a
packet statistically and generate an ICMP trace message or iTrace directed to the
same destination as the selected packet. The iTrace message itself consists of the
next and previous hop information, and a timestamp.
28
• Hash-based IP Traceback In a hash-based Traceback, every router captures
partial packet information of every packet that passes through the router, to be
able in the future to determine if that packet passed through it.
Traceback allows network administrators to verify the source of traffic arriving at the
network. If traffic is suspected of being malicious or from a spoofed address, Traceback
allows this to be investigated. When used in this manner Traceback can provide protection
against attacks involving IP address spoofing.
3.4.4 Authorization in IP networks
It has been argued that control of resource usage should be given to the owner of the
limited resource (Anderson Roscoe Wetherall, 2004). This would be achieved by requiring
sources of traffic to first get authorization from the destination as part of connection setup
to send a certain number of bytes or packets across the network. The authorization itself
uses techniques borrowed from the field of micropayments where hash-chaining and other
lightweight cryptographic techniques are used with the principal requirement being that
the cryptography must be secure but very fast. The Anderson, Roscoe, Wetherall paper
suggests the incremental deployment of ‘Request-to-send’ servers and ‘Verification-Points’
to augment the existing network. The proposed solution however requires modification of
the IP networking stack on each host and does not protect the network from bandwidth
attacks. If the proposed solution were successfully deployed it would protect individual
hosts but attackers would still be able to attack network links, for example, by flooding all
hosts on a subnet with traffic.
3.4.5 Edge Router Filtering Policies
Another proposed solution to the DoS problem is to introduce distributed Firewall-like
behaviour into network edge routers (Lakshminarayanan Adkins, Perrig & Stoica, 2004).
In this solution, the hosts on the network are given the ability to respond to packet floods.
This is achieved by having the edge routers maintain filters for each host and having the
hosts themselves dynamically modify their own filters. The filters can do things like tell
the router to reject packets destined to ports that the host does not have any services
running on. This could prevent port scanning. Other filters such as the ability to throttle
connection setup or discriminate and divide bandwidth between different services running
on the same host could be deployed. This solution could protect hosts and the link
between the host and edge router from attack but offers no protection for the backbone

29
network. This would leave ISP’s with the requirement to vastly over-provision their
networks in an attempt to mitigate the effects of bandwidth attacks.
3.4.6 Honeypots
Like most other solutions, Honeypots can not provide any real security when used in
isolation but in conjunction with firewalls and NIDS systems Honeypots can help in the
detection of network intrusions. Honeypots are generally used to gather information on
intrusion attempts and scanning in order to improve defenses at another location such as
a firewall.
A Honeypot is essentially a network decoy or trap that is set for any possible intruders. All
traffic coming in and out of a honeypot is closely monitored and because the Honeypots
are not running any real services any interaction with the Honeypots is treated as
suspicious.
Honeypots can be implemented as a physical collection of machines but more often a
virtual honeypot is used. A virtual honeypot allows a single host to behave as if it were a
number of hosts of different types and even simulate an entire subnet including the
routing and switching equipment. Modern virtual Honeypots such as honeyd (Provos,
2004) can take on the ‘personality’ of different operating systems allowing scanning or
fingerprinting tools like Xprobe (xprobe.sourceforge.net) or Nmap
(www.insecure.org/nmap/) to be fooled into believing they are in fact communicating with
an actual host running a particular operating system.
Honeypots are implemented as high-interaction or low-interaction. A high interaction
honeypot simulates all aspects of an operating system whereas a low-interacgtion
honeypot only simulates part of the operating system (often the operating systems
network stack (Provos, 2004)).
3.5 Experimental Systems
3.5.1 Introduction
This section covers some of the applications that have been implemented as research but
have not been deployed or made publicly available. These applications are generally only
30
proof of concept implementations and are often buggy and have poor performance. They
are included here to give the reader an idea of what direction network analysis tools may
take in the future.
3.5.2 MULTOPS
MULTOPS (Gil & Poletto, 2001) is a system developed at M.I.T., Cambridge to detect
bandwidth attacks (DOS). MULTOPS is based on the assumption that traffic flows should
be approximately symmetric. This assumption is based on observations that on the
internet the packet rate of packet traffic going in one direction is proportional to the
packet rate of traffic going in the opposite direction. MULTOPS is able to detect bandwidth
attacks by looking for attackers who are sending packets to a victim without any or
disproportionately fewer packets coming back. MULTOPS achieves this by using a tree
based data structure that records the ‘packets to’ rate and ‘packets from’ rate for
networks on the internet. The tree data structure adapts to the prevailing traffic by
expanding down to individual subnets or hosts on networks where malicious behaviour is
suspected. The data structure will also contract when traffic patterns return to normal to
preserve memory. MULTOPS is capable of determining the IP address’s under attack and
reacting to this by dropping packets destined to that IP address in order to protect the
host(s) from the effects of the on-going attack. MULTOPS can also be used to detect
attackers but can not be used to detect both the sources and endpoints of attacks at the
same time. In some cases where an attack is widely distributed or is randomizing its
source IP addresses MULTOPS may fail to detect the attack or may drop legitimate
packets. MULTOPS also bases its expected proportion of return traffic on the internet on
the acknowledgement policy of TCP implementations. This means that attackers who use
protocols that do not require acknowledgements, such as UDP or ICMP may be
undetectable by MULTOPS. MULTOPS also performs best at a point in the core network
where it can observe traffic in both directions. However the majority of links in the core of
the network are asymmetric and so traffic would have to be aggregated from several
routers for the MULTOPS algorithm to function correctly. Another weakness of MULTOPS is
its vulnerability to IP spoofing.
31
3.5.3 EMERALD
EMERALD (Porras & Valdes, 1998) stands for “Event monitoring enabling responses to
anomalous live disturbances” and is a follow on application from SRI InternationalTP
7PT who
had previously produced the Intrusion Detection Expert System (Javitz & Valdes, 1990).
EMERALD extends IDES’s intrusion-detection methods to the analysis of network activity,
and is intended as a framework for scalable, distributed, inter-operable computer and
network intrusion detection. EMERALD consists of independently controllable monitors that
are distributed at various points in large networks. The monitors perform both signature
analysis and statistical profiling of network traffic. EMERALD uses a message passing
communication system both internally in the EMERALD monitor and externally between
monitors in the distributed EMERALD system.
3.5.4 Honeycomb
Honeycomb (Kreibich & Crowcroft, 2004) is a tool created by Christian Kreibich at the
University of Cambridge. It essentially integrates a payload anomaly detection system
with a honeypot (3.4.6 Honeypots). It is the aim of Honeycomb to identify previously
unseen malicious network traffic using it’s payload signature and to use this information to
automatically generate a signature that can be read by a NIDSTP
8PT to protect a network from
subsequent attacks.
The system integrates with the open source honeyd tool using a plug-in that gives
honeycomb access to all the state information that honeyd maintains on every connection
to every simulated host. The packet payload analysis uses string comparison algorithms to
discover matching packet payloads.
The longest common substring algorithm is used by honeycomb but unfortunately
matches all protocol-inherent information (i.e. stuff that is *always* contained in packets)
as well as possible worms. The effects of this behaviour are mitigated because all the
traffic to the honeypot can be considered malicious.
When blocks of data are found to match across many streams then a signature is
generated that can be used to filter out packets containing that block of data.
TP
7PT Formerly Stanford Research Institute
TP
8PT Honeycomb exports signatures in Bro or SNORT format files.
32
This research is a novel approach to anomaly detection since it makes use of a honeypot
to reduce the volume of data to be analysed and also reduce the false positive rate.
Honeycomb could not work without a honeypot because of the complexity of it’s
algorithms and resulting low throughput of the application. Honeycomb, however is
successful at generating signatures for day zero worm attacks.
Since Honeycomb only detects a worm after it has seen it try to connect to the honeypot
several times there is a chance that the worm will still enter the network simply by not
connecting to the honeypot. There is also a time delay while honeycomb builds the
signature after it has seen it a number of times and distributes the signature to the NIDS.
It is not clear from any current research how long this delay might be or how likely it is
that a worm connects to a honeypot during the infection of a network. In fact there is
work being done by hackers to create tools that can recognize a honeypot using the same
fingerprintingTP
9PT techniques that the honeypot uses to trick the scanners into believing they
are operating systems.
3.6 Summary
From the above sections the reader can see that many of these applications share
common approaches and architectures. Although the Intrusion Detection Systems virtually
all rely on their own algorithm for performing intrusion detection, they use similar
methods of collecting the information they analyse. Many IDS and network monitors are
distributed in some fashion with sensors or monitors that communicate to a central
management and coordination component.
The majority of IDS systems rely on rules or signatures to perform detection. This
approach is similar to the method of detecting virus’s on computer systems. It has
become the accepted method of also finding malicious activity on networks but has many
disadvantages. The main disadvantage is the time required to manage a rule base or
signature database and keep it up to date with the most recent attack signatures.
Experience with signature based anti-virus has shown the investment in infrastructure
that is necessary to make this approach work can be prohibitive for small networks. Other
TP
9PT Fingerprinting is used by hacker tools such as Xprobe and Nmap to determine the
operating system of a host based on the behaviour of its network stack.

33
commonalities are that a number of systems use plug-ins to separate the framework of
the system from its analysis components. This may indicate a general lack of confidence
by the community in general in the current state of the art in intrusion detection methods.
Another interesting fact is that one system, SNORT, seems to dominate the entire field
with many IDS systems being commercialisations of this open source system. It is worth
pointing out that SNORT is a signature based system.
This work will differ from the majority of these systems in that it will not rely on
signatures or rules for detection. The system will be designed as a framework with open
interfaces to which new detection components or even other IDS systems can be linked.
The source of analysis data will not be configurable so that different types of data can be
analysed by different components. The problems of security and protection against attack
will be addresses with security, a feature that is missing from all current IDS systems.
34
4 Distributed Network Inspection System
4.1 Introduction
Distributed Network Inspection System (DNIS)TP
10PT is a heterogeneous network inspection
framework developed as part of this work. DNIS has a configurable event source and
dynamically composable instrumentation components. A management application
remotely controls dynamic scheduling of component execution across a distributed set of
network monitoring sensors. This flexible framework allows the configuration of multiple
sensors to be changed in response to previously unknown attacks, changes in network
administration policy or different levels of concern or suspicion. The configurable event
sources make the framework extendable in that new event sources can be added at a
later date. The implementation presented here uses network packets as its sole event
source.
The following sections explain in detail the implementation of DNIS. Firstly (4.2
Requirements) will outline a set of requirements for the system. Next the key design
choices will be justified and the system itself will be explained in the (4.4 Specification)
section.
4.2 Requirements
Most intrusion detection systems are developed for particular types of environments, and
the fact that they are difficult to configure and extend is a severe limitation (Kemmerer &
Vigna, 2004). Today’s intrusion detection systems (2.5 Intrusion Detection) are generally
focused on signature based methods and are deployed with the sole purpose of protecting
a corporate intranet from external attack. It has been proposed that a worst-case worm
(Weaver & Paxson, 2004) will infect most machines through internal connections. For this
reason, Distributed Network Inspection System (DNIS) should be capable of being
deployed on any internal or external link in a network in order to provide better
protection.
One of the biggest problems in the field of intrusion detection is the constant need for up-
to-date signature definitions of the attacks. This follows from the use of a “misuse
TP
10PT Pronounced “Denis”
35
detection" approach. While this kind of approach has been widely successful and is
implemented in almost all intrusion detection tools. Misuse-based systems perform very
poorly when faced with an unknown attack. For this reason DNIS will not use misuse
detection but will rely on anomaly detection techniques.
DNIS is required to work in real timeTP
11PT. “An open question is whether a group of
communicating backbone sensors, by using coordination and statistical inference, can
detect the presence of a worm early enough to provide for a response.” (Weaver Paxson
Staniford & Cunningham, 2002). To address this question DNIS will be required to work
on high bandwidth links and be capable of processing data and detecting malicious activity
before the activity has ceased.
DNIS is required to allow for coordinated detection among distributed sensors that are
executing at different physical points in the network (Kemmerer & Vigna, 2004). The
reason for this is that certain traffic features are only apparent on particular links on the
network. For example, if you wanted to keep track of the volume of traffic exiting your
network, then the system would need a component keeping track of this statistic on the
network’s gateway, whereas if you wanted to monitor which hosts are communicating with
which other hosts on your network then you would need to instrument internal links within
your network. Another reason for this requirement is the benefit of distributing the task of
processing large amounts of data. By examining a smaller quantity of relevant data at
different points in the network it may not be necessary to capture and examine every
packet traversing a backbone link (which may be computationally unfeasible). Distributed
in-situ sampling at key locations in the network infrastructure is a better option for
comprehensive research than relying on the fairness of a statistical sampling algorithm
(Phaal & Panchen, 2002) that only samples parts of the traffic.
When detecting malicious activity DNIS should have as low a false positive rate as
possible. It has been shown (Newman, Kristina & Tittel, 2004) that false positives have
long been a problem of anomaly detection schemes. Since DNIS will use a anomaly
detection to identify malicious activity it may be prone to the same problems.
TP
11PT “Real-Time” does not refer to hard real time but instead means the ability to detect
attacks in progress.

36
DNIS should not simply alert the user to the presence of malicious activity but should be
able to drill down to its sourceTP
12PT and the hosts or subnet currently being affected.
DNIS should be designed in a way to make it difficult to be evaded by obfuscating an
attack (2.6 Evading Detection), (Handley, Paxson & Kreibich, 2000).
DNIS must not be vulnerable to attack itself. To achieve this, the components of DNIS
must communicate in a secure manner so that no attacker can observe or alter the data
that is communicated between components. DNIS must be able to defeat attacks that may
try to exhaust the memory of the system.
DNIS will be designed with existing IP network infrastructure and protocols in mind. Some
papers (Anderson Roscoe Wetherall, 2004) have suggested solutions based on changing
the way the network functions. The extremely slow deployment of egress packet filtering
and IPv6 have shown how difficult it is to make even the smallest change to the way the
internet works, therefore any proposed solution must work on existing hardware and with
existing protocols.
DNIS is to be tested and proven on real network data. Many research papers rely on
simulation to achieve their goals. A number of successful simulation tools have been
developed recently REAL (Keshav, 1998) or NS (McCanne & Floyd 2000). However the
outcomes of simulation approaches are not adequate in many cases since they eliminate
the impacts of different network mechanisms.
In Summary, the specific requirements will be:
• DNIS should be capable of being deployed on any internal or external link in a
network.
• DNIS will not use misuse detection but will rely on anomaly detection techniques.
• DNIS is required to work in real time.
• DNIS is required to provide for coordinated detection among distributed sensors.
• DNIS should have as low a false positive rate as possible.
• DNIS should be able to drill down to the source and the hosts or subnet currently
being affected by malicious activity.
TP
12PT DNIS is not required to tackle the problem of IP address spoofing. The source address in
this context is the advertised source address of the traffic.

37
• DNIS should be designed in a way to make it difficult to be evaded by obfuscating
an attack.
• DNIS must not be vulnerable to attack itself.
• DNIS is to be tested and proven on real network data.
4.3 Design Choices
4.3.1 Introduction
This section will justify some of the main choices made with the design and development
of DNIS. Choices such as the development platform, programming language, whether to
use real network traffic or use simulation and what type of links to test on are all covered.
4.3.2 Development Platform
Java was chosen as the development language. It is unusual for network analysis
application to be implemented in an interpreted language such as Java because of the
extra interpretation overhead. This disadvantage is mitigated by the many benefits of
Java. The most important of these are Java’s cross platform portability which allows
components to be installed on almost any platform and operating system.
Java is an object orientated language and as such is well suited to framework
development in which encapsulation, decomposition and extendibility are key concerns.
The DNIS framework is component based and as such an object orientated
implementation is an intuitive approach. Also, because Java is a high level language it is
suitable for fast prototyping and allows for a quicker implementation. Java also is also
widely used and has many open source libraries and applications. Network and remote
application connectivity are built into Java’s default libraries.
Java has also had many recent improvements, in some cases java can produce
performance comparable to, or in some cases better than, the corresponding C-code
(Mangione, 1998). Faster CPU speeds and increases in memory have also made Java
much more appealing than it has been up until now.
Linux was chosen as the platform to do the development and testing. The reason for this
was that Linux comes with a packet capture library built in. The library, libpcap, does not
38
come with Windows machines although there is a WinPCAP package available which can
be installed and provides similar functionality.
4.3.3 Online Capture or Simulation
One of the main methods of proving the effectiveness of an approach to network anomaly
detection in literature has been to use tools such as NS2 to simulate the network
environment. There are a number of disadvantages to this approach. Firstly to simulate
the network environment, researchers must have a very good understanding of the
networks important properties. From these properties the researcher builds a model that
he/she believes is an accurate representation of the real network environment. The
problem is that there is a lack of good measurements and analyses of network
environments from which a researcher may draw accurate conclusions on what the
important properties that must be modeled and duplicated in a simulated environment are
(Floyd & Kohler, 2002). Inaccuracies in the models of network behaviour can lead to false
conclusions.
Papers such as “How ‘Real’ Can Synthetic Network Traffic Be?”, (Hernández-Campos
Jeffay & Smith, 2004) illustrate the difficulty in generating synthetic traffic that is realistic.
In order to avoid unrealistic simulation scenarios it has been decided to use a real network
environment to evaluate DNIS. It was for these reasons that the DNIS system is designed
to work on-line by capturing real network traffic. To facilitate this, a large component of
the sensors is the ability to capture packets. To tackle the problem of having to have
repeatable experiments, packet logging and trace file replaying functionality was added to
the system. More about these features can be found (4.4.3.1 Layer 1 – The Event
Source).
4.3.4 Gateway Routers or Dial-up Links
Another design choice was whether the sensors should be designed to work at gateway
routers or on dial-up links. This decision will lead to several implementation decisions. If
the sensors are designed with dial-up links in mind they will process much lower levels of
traffic so sampling periods will have to be longer. Traffic will also all originate from a
single address so measures of spread will be relatively meaningless.

39
These problems were solved using the plug-in based architecture for components and
keeping everything else generalized so that it can run efficiently in both environments.
Some of the plug-ins are more appropriate on gateway routers and others work better on
dial-up links. To take this into account a weighting can be applied to plug-in output
depending on what type of link the sensor is running on. More about the DNIS plug-ins
can be found in section (5.3 Signal Analysis Plug-ins) and information on signal weighting
can be found in the evaluation section (8.1.1 Signal Effectiveness Weighting).
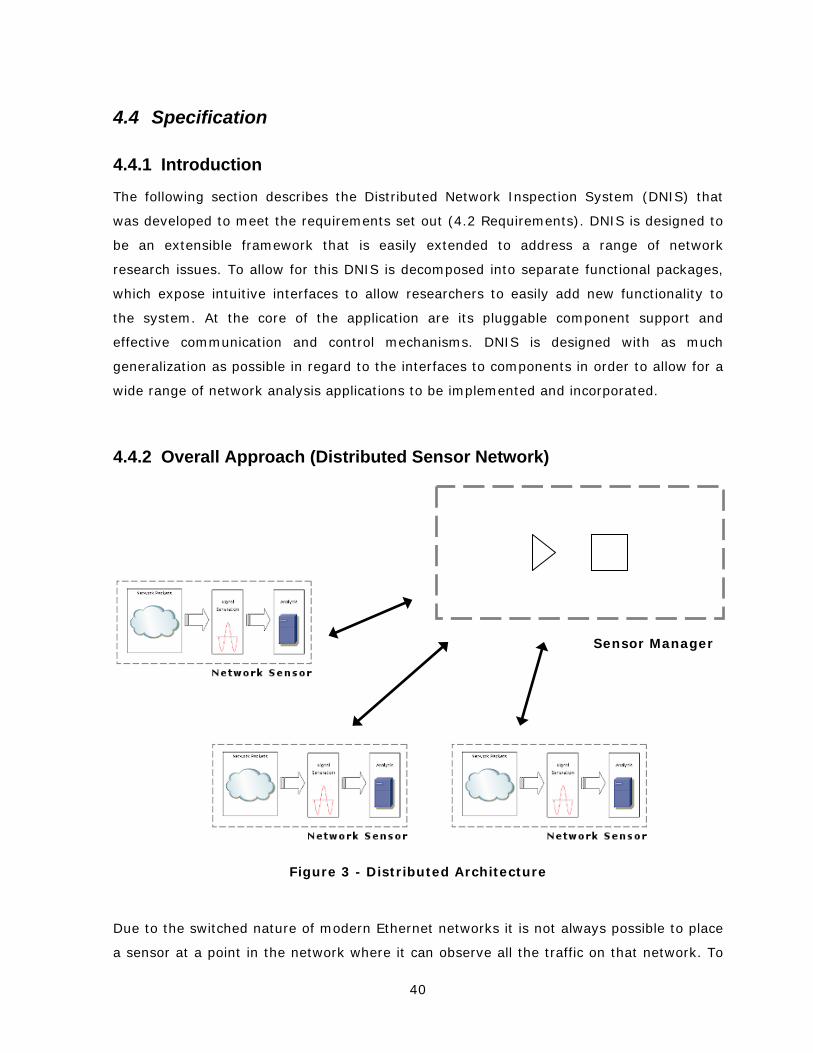
40
4.4 Specification
4.4.1 Introduction
The following section describes the Distributed Network Inspection System (DNIS) that
was developed to meet the requirements set out (4.2 Requirements). DNIS is designed to
be an extensible framework that is easily extended to address a range of network
research issues. To allow for this DNIS is decomposed into separate functional packages,
which expose intuitive interfaces to allow researchers to easily add new functionality to
the system. At the core of the application are its pluggable component support and
effective communication and control mechanisms. DNIS is designed with as much
generalization as possible in regard to the interfaces to components in order to allow for a
wide range of network analysis applications to be implemented and incorporated.
4.4.2 Overall Approach (Distributed Sensor Network)
Figure 3 - Distributed Architecture
Due to the switched nature of modern Ethernet networks it is not always possible to place
a sensor at a point in the network where it can observe all the traffic on that network. To
Sensor Manager
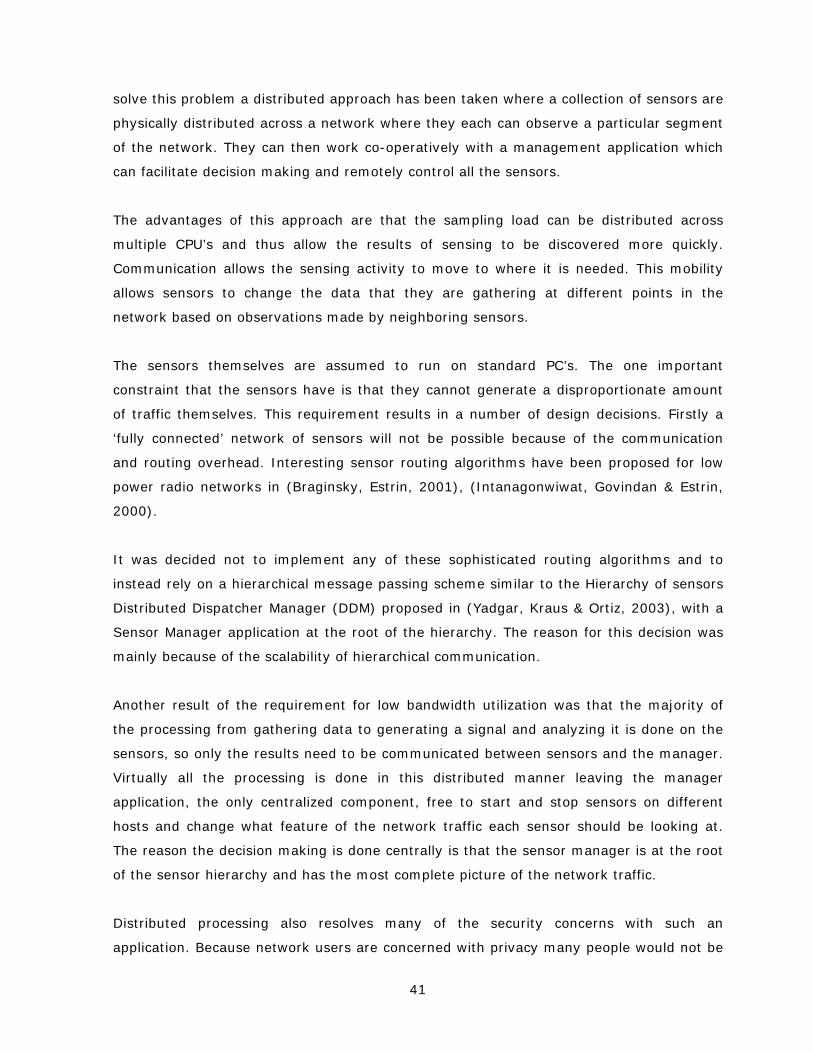
41
solve this problem a distributed approach has been taken where a collection of sensors are
physically distributed across a network where they each can observe a particular segment
of the network. They can then work co-operatively with a management application which
can facilitate decision making and remotely control all the sensors.
The advantages of this approach are that the sampling load can be distributed across
multiple CPU’s and thus allow the results of sensing to be discovered more quickly.
Communication allows the sensing activity to move to where it is needed. This mobility
allows sensors to change the data that they are gathering at different points in the
network based on observations made by neighboring sensors.
The sensors themselves are assumed to run on standard PC’s. The one important
constraint that the sensors have is that they cannot generate a disproportionate amount
of traffic themselves. This requirement results in a number of design decisions. Firstly a
‘fully connected’ network of sensors will not be possible because of the communication
and routing overhead. Interesting sensor routing algorithms have been proposed for low
power radio networks in (Braginsky, Estrin, 2001), (Intanagonwiwat, Govindan & Estrin,
2000).
It was decided not to implement any of these sophisticated routing algorithms and to
instead rely on a hierarchical message passing scheme similar to the Hierarchy of sensors
Distributed Dispatcher Manager (DDM) proposed in (Yadgar, Kraus & Ortiz, 2003), with a
Sensor Manager application at the root of the hierarchy. The reason for this decision was
mainly because of the scalability of hierarchical communication.
Another result of the requirement for low bandwidth utilization was that the majority of
the processing from gathering data to generating a signal and analyzing it is done on the
sensors, so only the results need to be communicated between sensors and the manager.
Virtually all the processing is done in this distributed manner leaving the manager
application, the only centralized component, free to start and stop sensors on different
hosts and change what feature of the network traffic each sensor should be looking at.
The reason the decision making is done centrally is that the sensor manager is at the root
of the sensor hierarchy and has the most complete picture of the network traffic.
Distributed processing also resolves many of the security concerns with such an
application. Because network users are concerned with privacy many people would not be
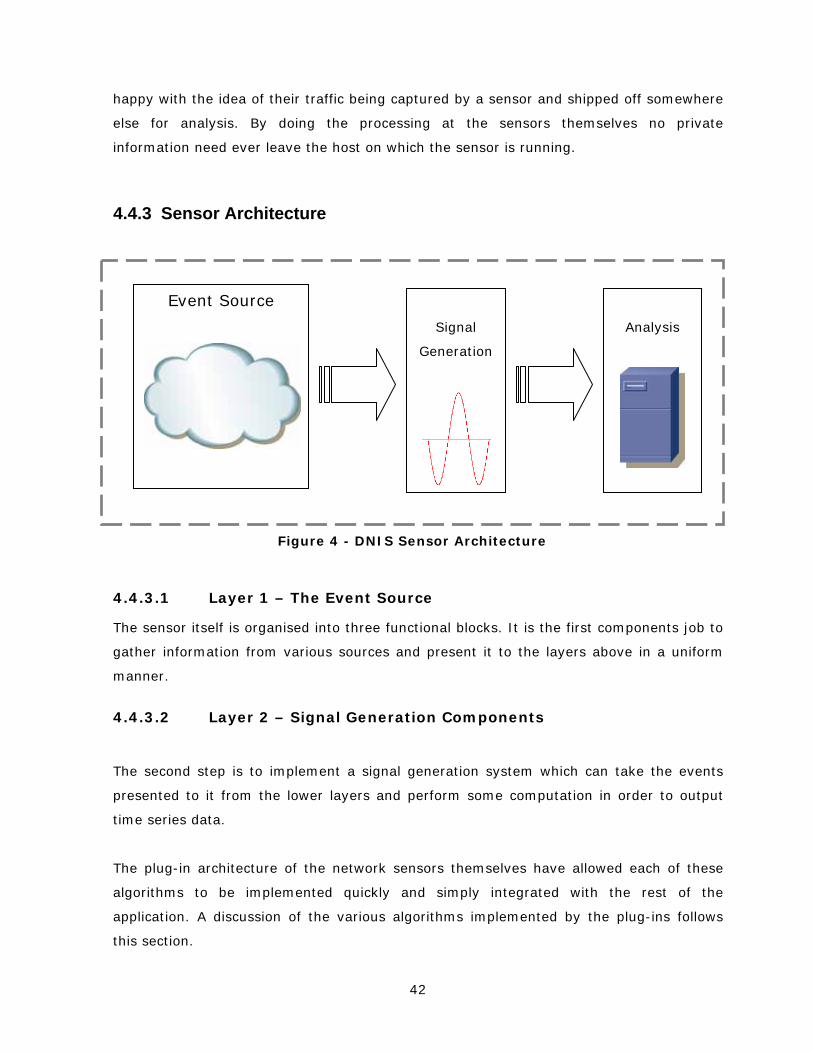
42
happy with the idea of their traffic being captured by a sensor and shipped off somewhere
else for analysis. By doing the processing at the sensors themselves no private
information need ever leave the host on which the sensor is running.
4.4.3 Sensor Architecture
4.4.3.1 Layer 1 – The Event Source
The sensor itself is organised into three functional blocks. It is the first components job to
gather information from various sources and present it to the layers above in a uniform
manner.
4.4.3.2 Layer 2 – Signal Generation Components
The second step is to implement a signal generation system which can take the events
presented to it from the lower layers and perform some computation in order to output
time series data.
The plug-in architecture of the network sensors themselves have allowed each of these
algorithms to be implemented quickly and simply integrated with the rest of the
application. A discussion of the various algorithms implemented by the plug-ins follows
this section.
Figure 4 - DNIS Sensor Architecture
Signal
Generation
Event Source
Analysis
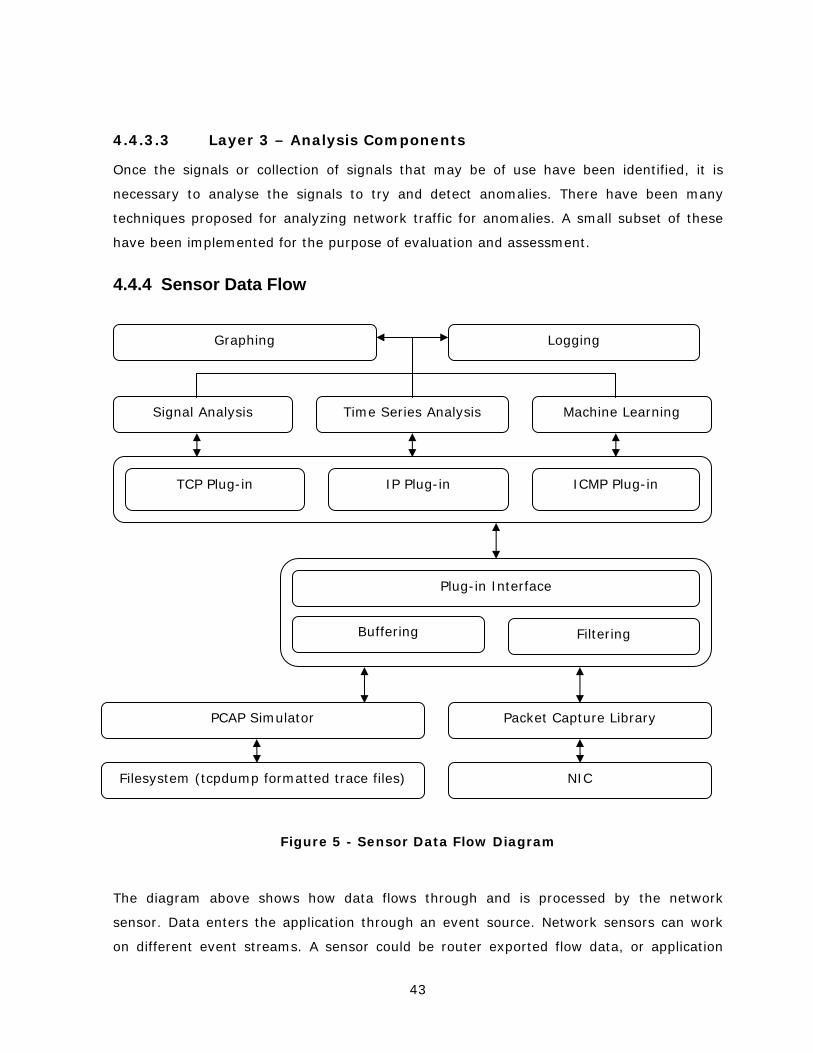
43
4.4.3.3 Layer 3 – Analysis Components
Once the signals or collection of signals that may be of use have been identified, it is
necessary to analyse the signals to try and detect anomalies. There have been many
techniques proposed for analyzing network traffic for anomalies. A small subset of these
have been implemented for the purpose of evaluation and assessment.
4.4.4 Sensor Data Flow
Figure 5 - Sensor Data Flow Diagram
The diagram above shows how data flows through and is processed by the network
sensor. Data enters the application through an event source. Network sensors can work
on different event streams. A sensor could be router exported flow data, or application
PCAP Simulator Packet Capture Library
Buffering Filtering
Time Series Analysis
Logging
Machine Learning Signal Analysis
TCP Plug-in IP Plug-in ICMP Plug-in
Graphing
Filesystem (tcpdump formatted trace files) NIC
Plug-in Interface
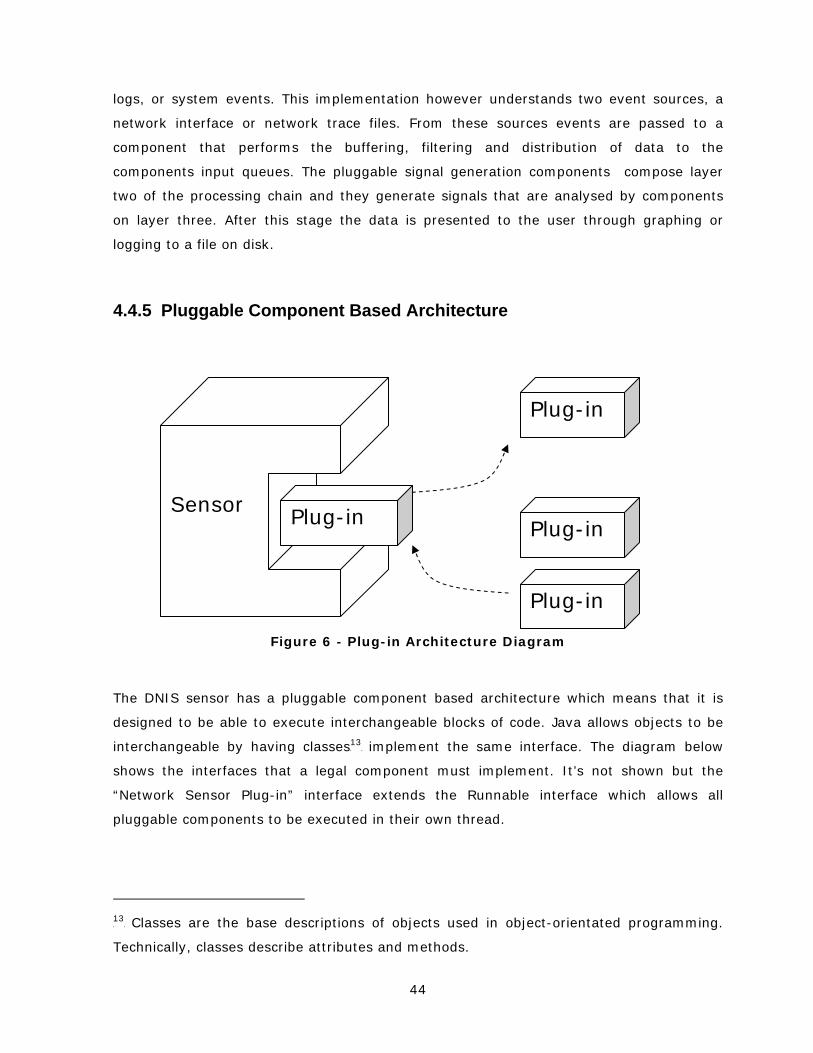
44
logs, or system events. This implementation however understands two event sources, a
network interface or network trace files. From these sources events are passed to a
component that performs the buffering, filtering and distribution of data to the
components input queues. The pluggable signal generation components compose layer
two of the processing chain and they generate signals that are analysed by components
on layer three. After this stage the data is presented to the user through graphing or
logging to a file on disk.
4.4.5 Pluggable Component Based Architecture
Figure 6 - Plug-in Architecture Diagram
The DNIS sensor has a pluggable component based architecture which means that it is
designed to be able to execute interchangeable blocks of code. Java allows objects to be
interchangeable by having classesTP
13PT implement the same interface. The diagram below
shows the interfaces that a legal component must implement. It’s not shown but the
“Network Sensor Plug-in” interface extends the Runnable interface which allows all
pluggable components to be executed in their own thread.
TP
13PT Classes are the base descriptions of objects used in object-orientated programming.
Technically, classes describe attributes and methods.
TSensor TPlug-in
TPlug-in
TPlug-in
TPlug-in
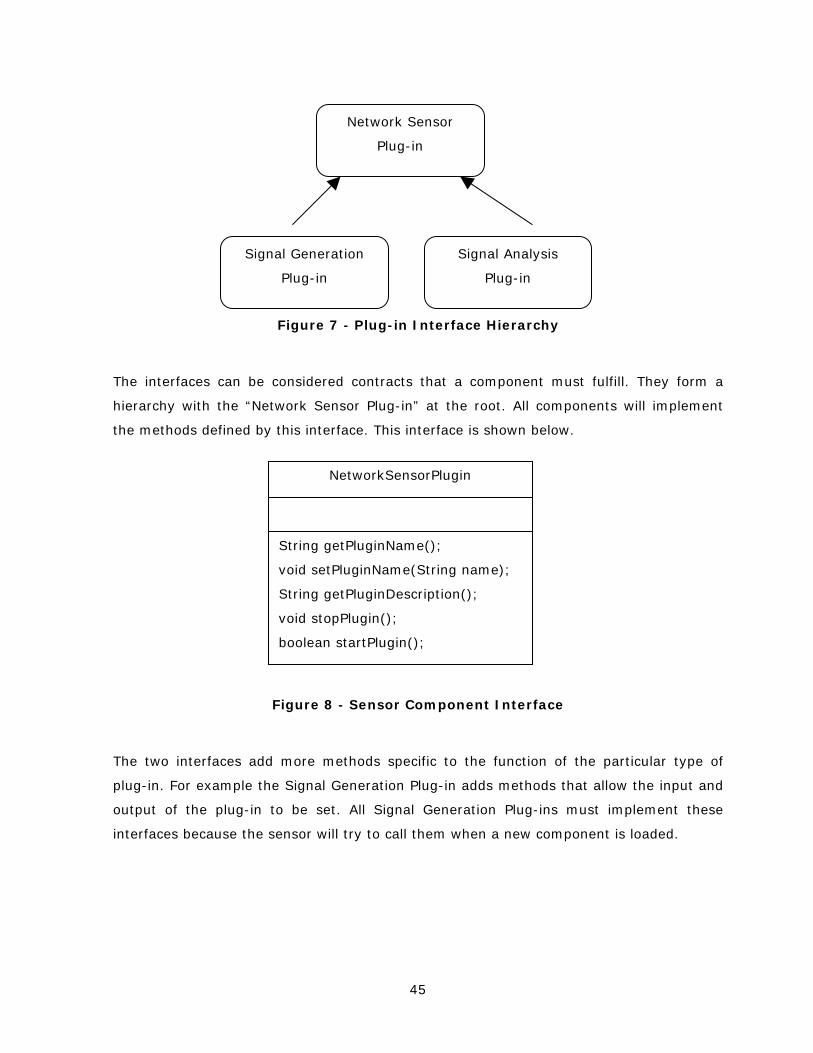
45
Figure 7 - Plug-in Interface Hierarchy
The interfaces can be considered contracts that a component must fulfill. They form a
hierarchy with the “Network Sensor Plug-in” at the root. All components will implement
the methods defined by this interface. This interface is shown below.
Figure 8 - Sensor Component Interface
The two interfaces add more methods specific to the function of the particular type of
plug-in. For example the Signal Generation Plug-in adds methods that allow the input and
output of the plug-in to be set. All Signal Generation Plug-ins must implement these
interfaces because the sensor will try to call them when a new component is loaded.
Network Sensor
Plug-in
Signal Generation
Plug-in
Signal Analysis
Plug-in
String getPluginName();
void setPluginName(String name);
String getPluginDescription();
void stopPlugin();
boolean startPlugin();
NetworkSensorPlugin
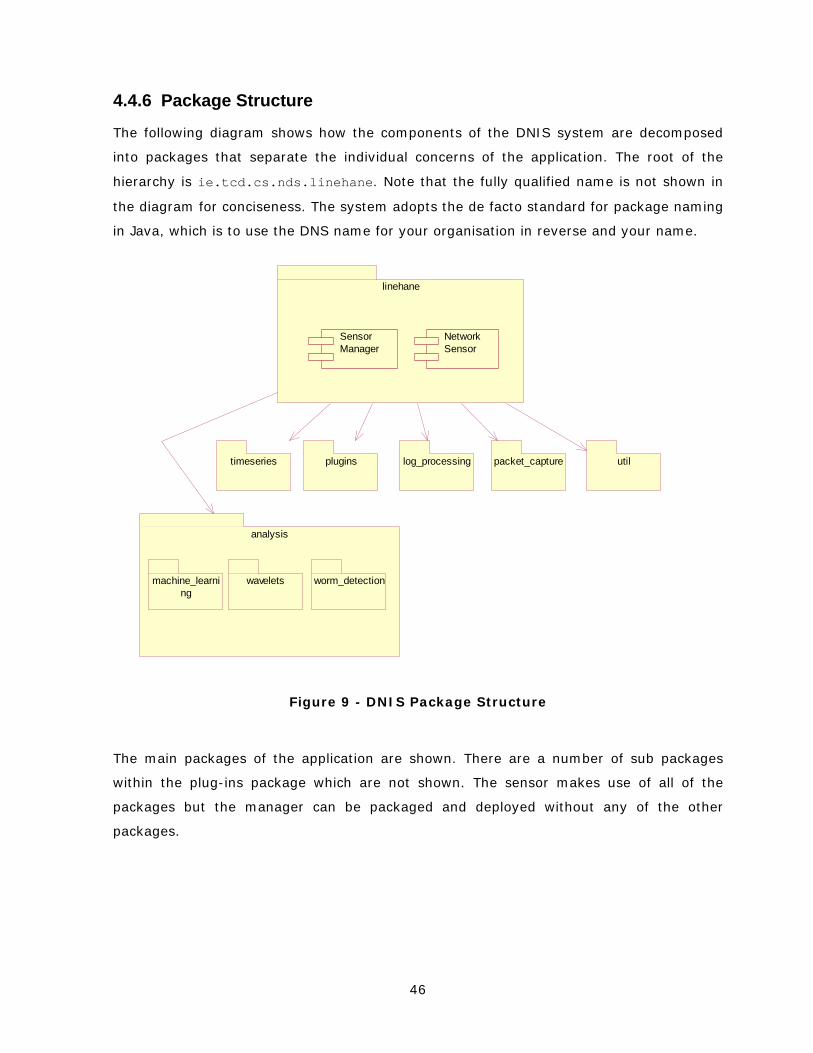
46
4.4.6 Package Structure
The following diagram shows how the components of the DNIS system are decomposed
into packages that separate the individual concerns of the application. The root of the
hierarchy is ie.tcd.cs.nds.linehane. Note that the fully qualified name is not shown in
the diagram for conciseness. The system adopts the de facto standard for package naming
in Java, which is to use the DNS name for your organisation in reverse and your name.
log_processing packet_capturepluginstimeseries util
linehane
Network Sensor
Sensor Manager
analysis
machine_learning
wavelets worm_detection
Figure 9 - DNIS Package Structure
The main packages of the application are shown. There are a number of sub packages
within the plug-ins package which are not shown. The sensor makes use of all of the
packages but the manager can be packaged and deployed without any of the other
packages.
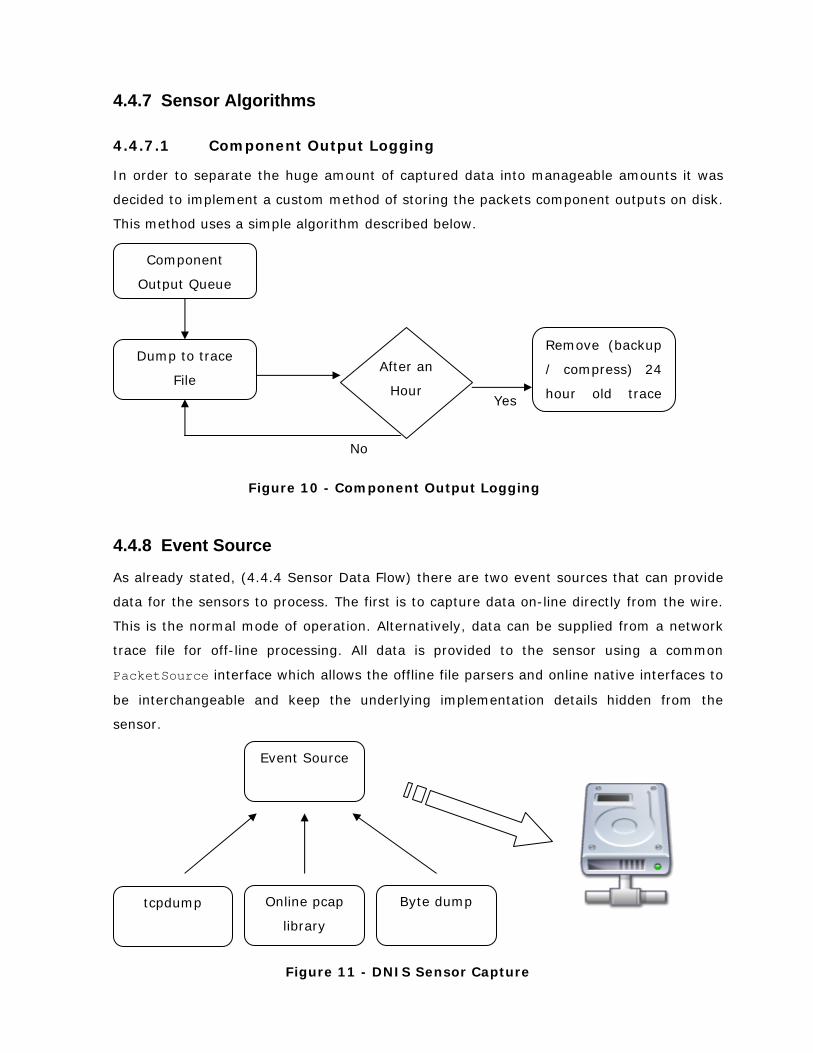
47
4.4.7 Sensor Algorithms
4.4.7.1 Component Output Logging
In order to separate the huge amount of captured data into manageable amounts it was
decided to implement a custom method of storing the packets component outputs on disk.
This method uses a simple algorithm described below.
4.4.8 Event Source
As already stated, (4.4.4 Sensor Data Flow) there are two event sources that can provide
data for the sensors to process. The first is to capture data on-line directly from the wire.
This is the normal mode of operation. Alternatively, data can be supplied from a network
trace file for off-line processing. All data is provided to the sensor using a common
PacketSource interface which allows the offline file parsers and online native interfaces to
be interchangeable and keep the underlying implementation details hidden from the
sensor.
Figure 10 - Component Output Logging
Figure 11 - DNIS Sensor Capture
Online pcap
library
tcpdump Byte dump
Event Source
No
Yes
After an
Hour
Component
Output Queue
Dump to trace
File
Remove (backup
/ compress) 24
hour old trace

48
On-line Capture:
In this mode the sensor uses JINI to interface with a native wrapper, which allows the
sensor to access the underlying operating systems packet capture libraries. These packet
capture libraries allow whole unprocessed packets to be exported directly from the
network interface hardware and presented to the application layer. On arrival at the
Network Interface Card (NIC) a timestamp is appended to the packet that is generated by
the NIC. In this way inaccuracy due to latency between packet arrival and processing is
eliminated. This is particularly important since the sensor is implemented in an interpreted
language.
Off-line file input:
In this mode of operation the sensor can be instructed, on initialisation, to read packets
from a file rather than the network. The sensor can read two different trace file formats
and has been designed with the option to extend this to other trace file formats.
The two, currently implemented, off-line processing file format readers can read tcpdump-
format trace files and a simple byte dump log file that is specific to the DNIS application.
The tcpdump format was chosen because it is a common format that data sets are
available in, it can be interpreted by many commercial analysis tools such as ethereal and
the operating system’s packet capture library already provides a means to replay this
format of trace file using the open_offline() call.
This facility was provided primarily as a development and testing tool. This was developed
mainly because of early difficulties in obtaining access to live network traffic from a
working network and the need for repeatable experiments during testing.
4.4.9 Communication & Control
Communication between the DNIS sensor and the sensor manager is achieved via Java
RMI. The components are connected in a client server manner with the manager having a
connection to each sensorTP
14PT. The manager controls the sensors using only three
operations. These operations are shown in the UML class diagram below.
TP
14PT Connections between sensors and manager can be intermittent. A permanent TCP
connection does not need to be held open between the two components.
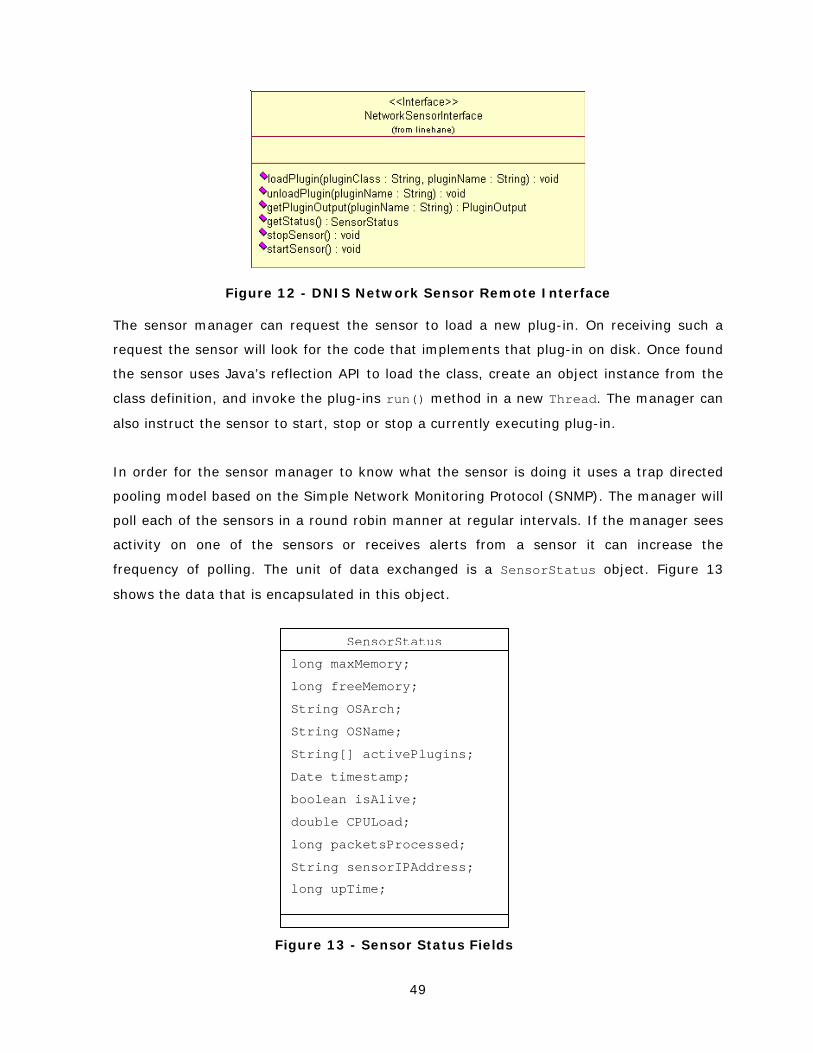
49
Figure 12 - DNIS Network Sensor Remote Interface
The sensor manager can request the sensor to load a new plug-in. On receiving such a
request the sensor will look for the code that implements that plug-in on disk. Once found
the sensor uses Java’s reflection API to load the class, create an object instance from the
class definition, and invoke the plug-ins run() method in a new Thread. The manager can
also instruct the sensor to start, stop or stop a currently executing plug-in.
In order for the sensor manager to know what the sensor is doing it uses a trap directed
pooling model based on the Simple Network Monitoring Protocol (SNMP). The manager will
poll each of the sensors in a round robin manner at regular intervals. If the manager sees
activity on one of the sensors or receives alerts from a sensor it can increase the
frequency of polling. The unit of data exchanged is a SensorStatus object. Figure 13
shows the data that is encapsulated in this object.
Figure 13 - Sensor Status Fields
SensorStatus
long maxMemory;
long freeMemory;
String OSArch;
String OSName;
String[] activePlugins;
Date timestamp;
boolean isAlive;
double CPULoad;
long packetsProcessed;
String sensorIPAddress;
long upTime;
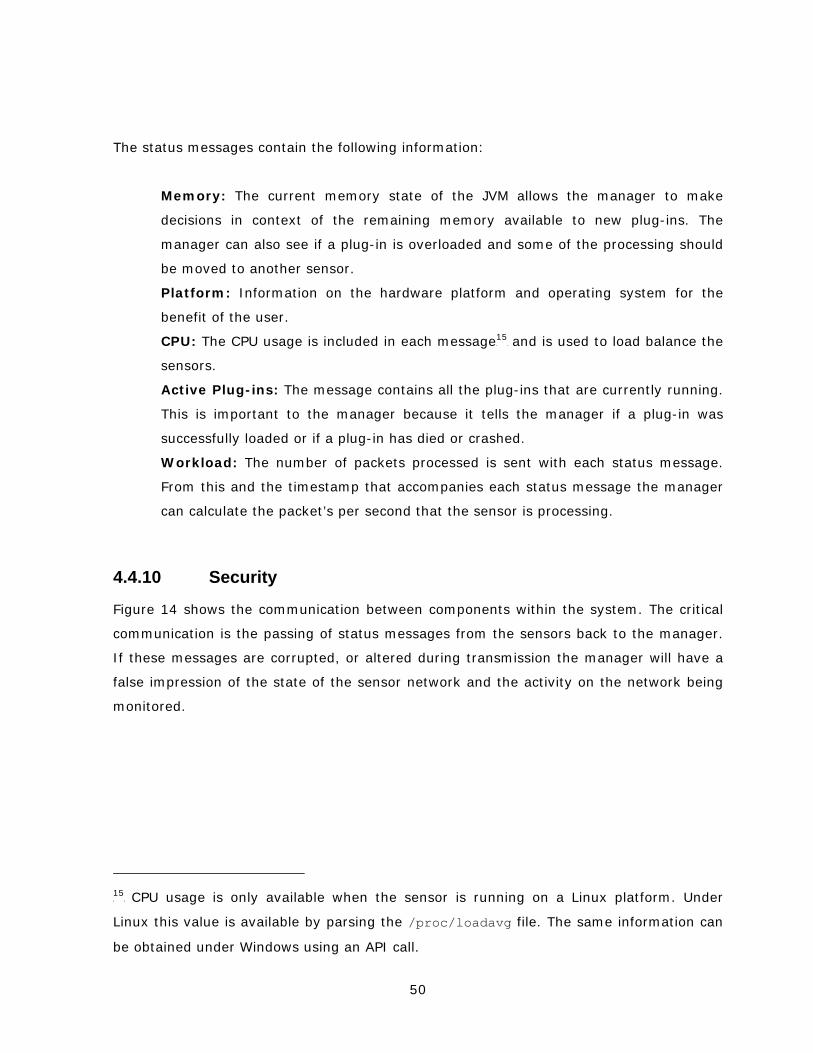
50
The status messages contain the following information:
Memory: The current memory state of the JVM allows the manager to make
decisions in context of the remaining memory available to new plug-ins. The
manager can also see if a plug-in is overloaded and some of the processing should
be moved to another sensor.
Platform: Information on the hardware platform and operating system for the
benefit of the user.
CPU: The CPU usage is included in each messageTP
15PT and is used to load balance the
sensors.
Active Plug-ins: The message contains all the plug-ins that are currently running.
This is important to the manager because it tells the manager if a plug-in was
successfully loaded or if a plug-in has died or crashed.
Workload: The number of packets processed is sent with each status message.
From this and the timestamp that accompanies each status message the manager
can calculate the packet’s per second that the sensor is processing.
4.4.10 Security
Figure 14 shows the communication between components within the system. The critical
communication is the passing of status messages from the sensors back to the manager.
If these messages are corrupted, or altered during transmission the manager will have a
false impression of the state of the sensor network and the activity on the network being
monitored.
TP
15PT CPU usage is only available when the sensor is running on a Linux platform. Under
Linux this value is available by parsing the /proc/loadavg file. The same information can
be obtained under Windows using an API call.
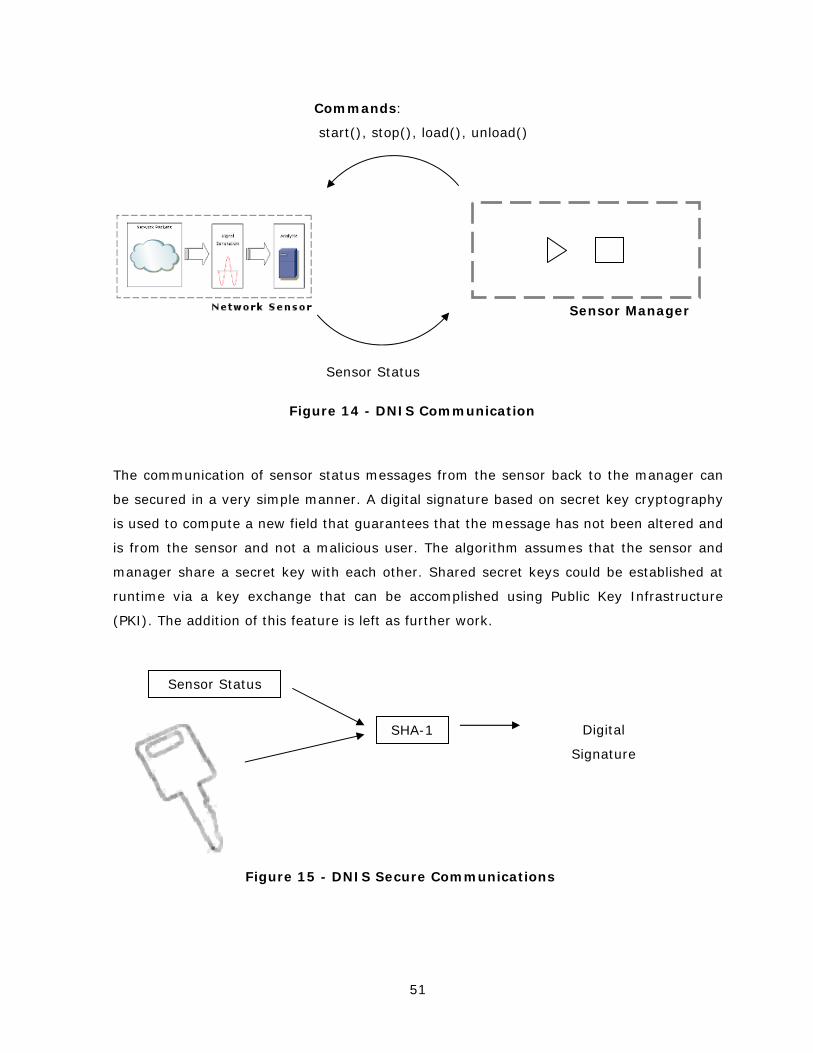
51
The communication of sensor status messages from the sensor back to the manager can
be secured in a very simple manner. A digital signature based on secret key cryptography
is used to compute a new field that guarantees that the message has not been altered and
is from the sensor and not a malicious user. The algorithm assumes that the sensor and
manager share a secret key with each other. Shared secret keys could be established at
runtime via a key exchange that can be accomplished using Public Key Infrastructure
(PKI). The addition of this feature is left as further work.
Figure 14 - DNIS Communication
Figure 15 - DNIS Secure Communications
Sensor Manager
Commands:
start(), stop(), load(), unload()
Sensor Status
Sensor Status
SHA-1 Digital
Signature
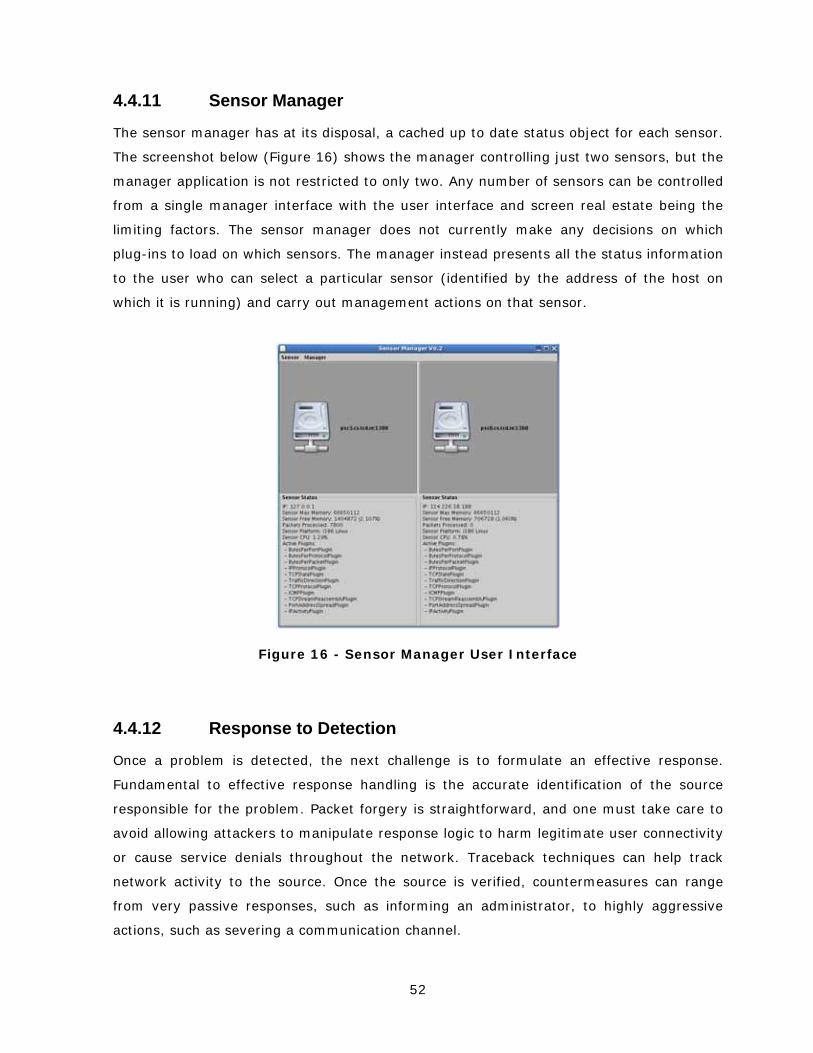
52
4.4.11 Sensor Manager
The sensor manager has at its disposal, a cached up to date status object for each sensor.
The screenshot below (Figure 16) shows the manager controlling just two sensors, but the
manager application is not restricted to only two. Any number of sensors can be controlled
from a single manager interface with the user interface and screen real estate being the
limiting factors. The sensor manager does not currently make any decisions on which
plug-ins to load on which sensors. The manager instead presents all the status information
to the user who can select a particular sensor (identified by the address of the host on
which it is running) and carry out management actions on that sensor.
Figure 16 - Sensor Manager User Interface
4.4.12 Response to Detection
Once a problem is detected, the next challenge is to formulate an effective response.
Fundamental to effective response handling is the accurate identification of the source
responsible for the problem. Packet forgery is straightforward, and one must take care to
avoid allowing attackers to manipulate response logic to harm legitimate user connectivity
or cause service denials throughout the network. Traceback techniques can help track
network activity to the source. Once the source is verified, countermeasures can range
from very passive responses, such as informing an administrator, to highly aggressive
actions, such as severing a communication channel.
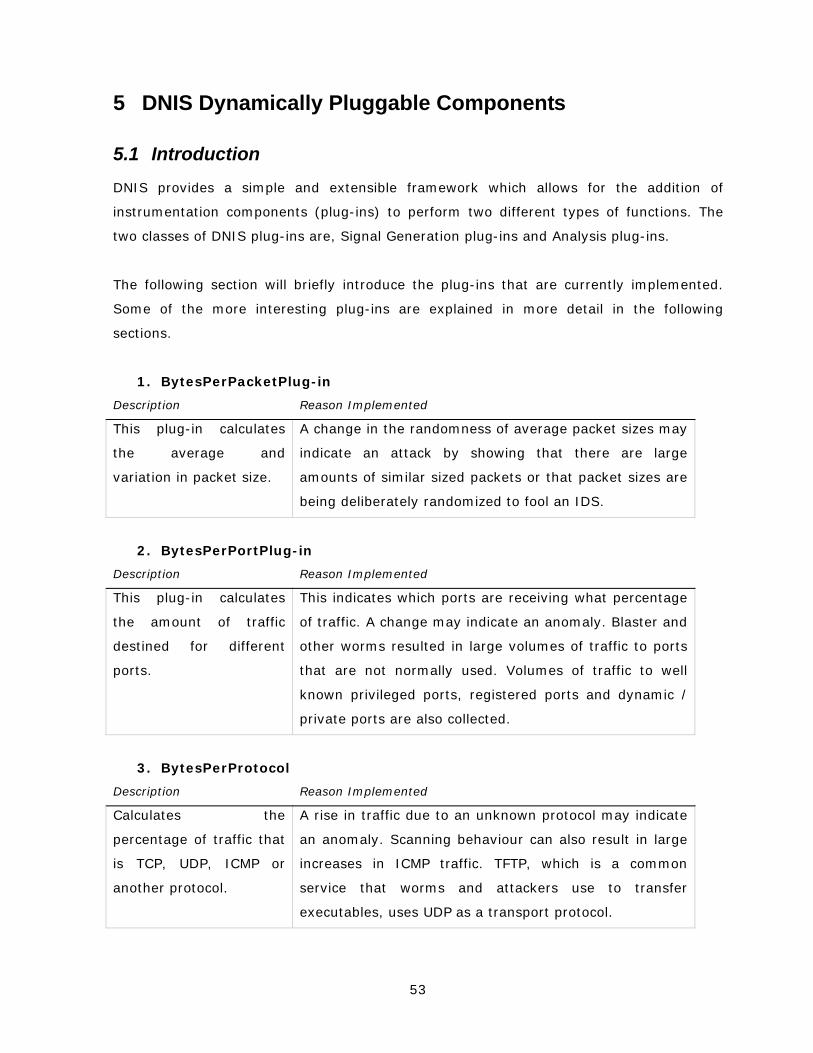
53
5 DNIS Dynamically Pluggable Components
5.1 Introduction
DNIS provides a simple and extensible framework which allows for the addition of
instrumentation components (plug-ins) to perform two different types of functions. The
two classes of DNIS plug-ins are, Signal Generation plug-ins and Analysis plug-ins.
The following section will briefly introduce the plug-ins that are currently implemented.
Some of the more interesting plug-ins are explained in more detail in the following
sections.
1. BytesPerPacketPlug-in
Description Reason Implemented
This plug-in calculates
the average and
variation in packet size.
A change in the randomness of average packet sizes may
indicate an attack by showing that there are large
amounts of similar sized packets or that packet sizes are
being deliberately randomized to fool an IDS.
2. BytesPerPortPlug-in
Description Reason Implemented
This plug-in calculates
the amount of traffic
destined for different
ports.
This indicates which ports are receiving what percentage
of traffic. A change may indicate an anomaly. Blaster and
other worms resulted in large volumes of traffic to ports
that are not normally used. Volumes of traffic to well
known privileged ports, registered ports and dynamic /
private ports are also collected.
3. BytesPerProtocol
Description Reason Implemented
Calculates the
percentage of traffic that
is TCP, UDP, ICMP or
another protocol.
A rise in traffic due to an unknown protocol may indicate
an anomaly. Scanning behaviour can also result in large
increases in ICMP traffic. TFTP, which is a common
service that worms and attackers use to transfer
executables, uses UDP as a transport protocol.
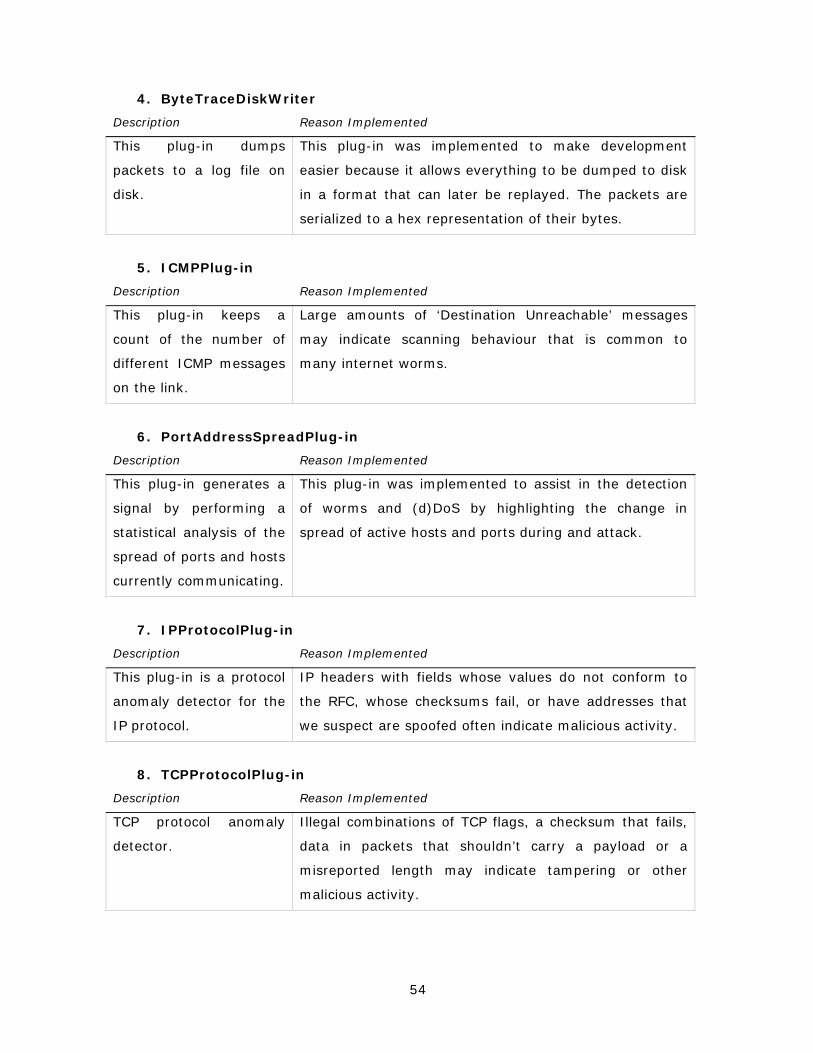
54
4. ByteTraceDiskWriter
Description Reason Implemented
This plug-in dumps
packets to a log file on
disk.
This plug-in was implemented to make development
easier because it allows everything to be dumped to disk
in a format that can later be replayed. The packets are
serialized to a hex representation of their bytes.
5. ICMPPlug-in
Description Reason Implemented
This plug-in keeps a
count of the number of
different ICMP messages
on the link.
Large amounts of ‘Destination Unreachable’ messages
may indicate scanning behaviour that is common to
many internet worms.
6. PortAddressSpreadPlug-in
Description Reason Implemented
This plug-in generates a
signal by performing a
statistical analysis of the
spread of ports and hosts
currently communicating.
This plug-in was implemented to assist in the detection
of worms and (d)DoS by highlighting the change in
spread of active hosts and ports during and attack.
7. IPProtocolPlug-in
Description Reason Implemented
This plug-in is a protocol
anomaly detector for the
IP protocol.
IP headers with fields whose values do not conform to
the RFC, whose checksums fail, or have addresses that
we suspect are spoofed often indicate malicious activity.
8. TCPProtocolPlug-in
Description Reason Implemented
TCP protocol anomaly
detector.
Illegal combinations of TCP flags, a checksum that fails,
data in packets that shouldn’t carry a payload or a
misreported length may indicate tampering or other
malicious activity.

55
9. TCPStatePlug-in
Description Reason Implemented
This plug-in analyses the
state of all ongoing TCP
connections.
The number of connections in each state can be used to
detect anomalies. A common DoS attack involves
opening large numbers of TCP connections and leaving
them in the SYN or SYN-ACK states (DARPA, 1981).
10. ThroughputPlug-in
Description Reason Implemented
This does a simple byte
count.
This plug-in was implemented to add context to the
results coming from other plug-ins.
11. TrafficDirectionPlug-in
Description Reason Implemented
Compares outgoing and
incoming traffic volumes.
This plug-in is intended to run on a gateway link. The
presence of incoming or outgoing DoS attacks can be
detected by looking for a change in the ratio between
incoming and outgoing traffic as proposed in (Gil &
Poletto, 2001)
12. VulnerabilityScanningPlug-in
Description Reason Implemented
This plug-in looks for
activity consistent with
vulnerability scanning.
Vulnerability scanning is the scanning of a large number
of hosts on the same port. The majority of scanning is
usually concentrated on the local network to increase the
infection rate.
13. WaveletAnalyserPlug-in
Description Reason Implemented
This plug-in uses
wavelets to perform
signal analysis.
This plug-in was implemented to help filter noise, high
frequency oscillations and outliers from the output of
other plug-ins.
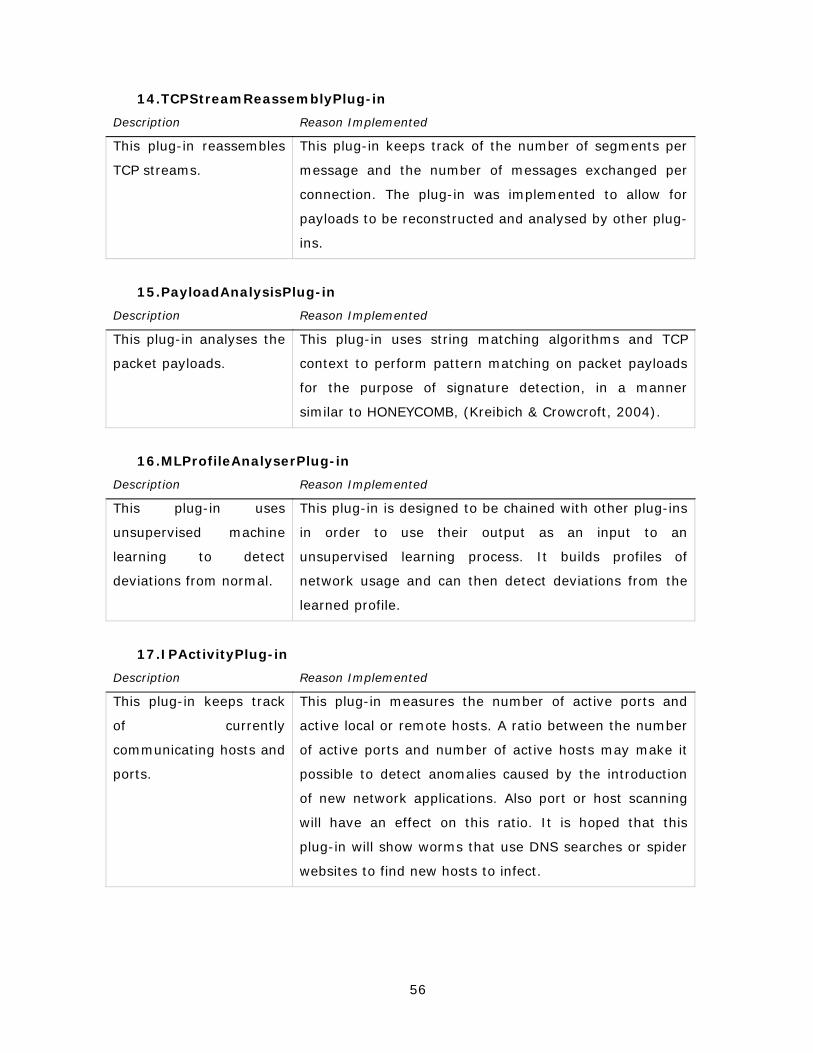
56
14. TCPStreamReassemblyPlug-in
Description Reason Implemented
This plug-in reassembles
TCP streams.
This plug-in keeps track of the number of segments per
message and the number of messages exchanged per
connection. The plug-in was implemented to allow for
payloads to be reconstructed and analysed by other plug-
ins.
15. PayloadAnalysisPlug-in
Description Reason Implemented
This plug-in analyses the
packet payloads.
This plug-in uses string matching algorithms and TCP
context to perform pattern matching on packet payloads
for the purpose of signature detection, in a manner
similar to HONEYCOMB, (Kreibich & Crowcroft, 2004).
16. MLProfileAnalyserPlug-in
Description Reason Implemented
This plug-in uses
unsupervised machine
learning to detect
deviations from normal.
This plug-in is designed to be chained with other plug-ins
in order to use their output as an input to an
unsupervised learning process. It builds profiles of
network usage and can then detect deviations from the
learned profile.
17. IPActivityPlug-in
Description Reason Implemented
This plug-in keeps track
of currently
communicating hosts and
ports.
This plug-in measures the number of active ports and
active local or remote hosts. A ratio between the number
of active ports and number of active hosts may make it
possible to detect anomalies caused by the introduction
of new network applications. Also port or host scanning
will have an effect on this ratio. It is hoped that this
plug-in will show worms that use DNS searches or spider
websites to find new hosts to infect.
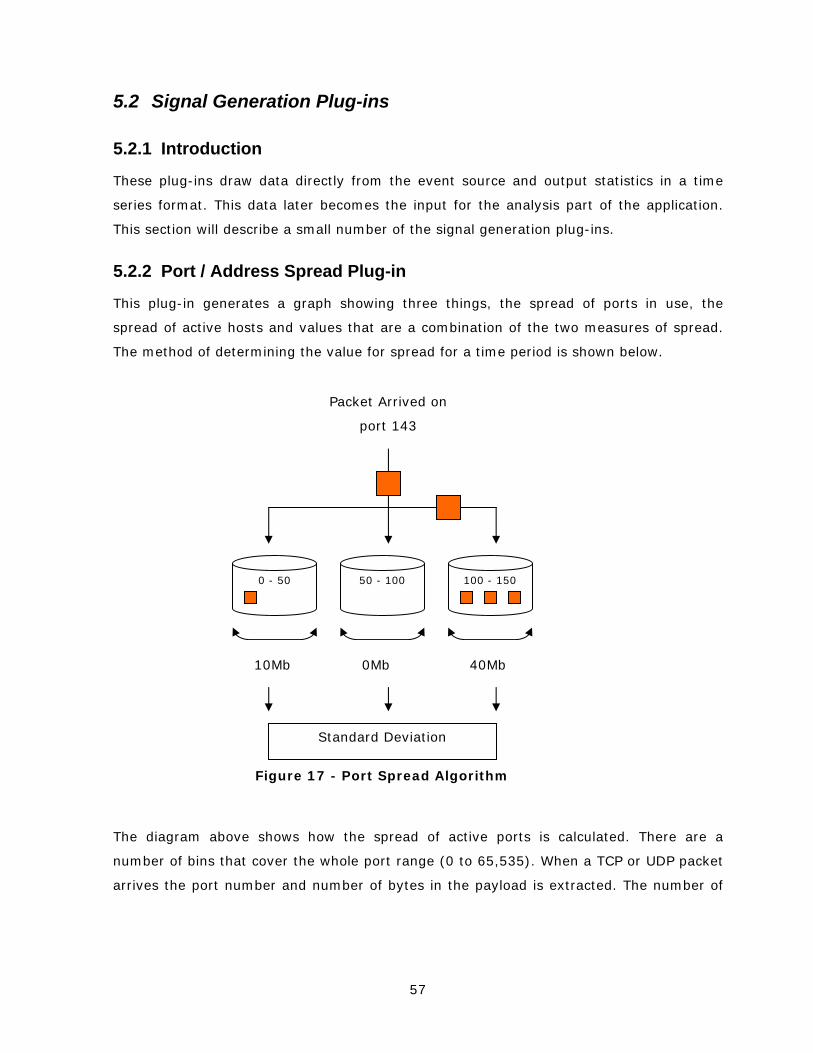
57
5.2 Signal Generation Plug-ins
5.2.1 Introduction
These plug-ins draw data directly from the event source and output statistics in a time
series format. This data later becomes the input for the analysis part of the application.
This section will describe a small number of the signal generation plug-ins.
5.2.2 Port / Address Spread Plug-in
This plug-in generates a graph showing three things, the spread of ports in use, the
spread of active hosts and values that are a combination of the two measures of spread.
The method of determining the value for spread for a time period is shown below.
The diagram above shows how the spread of active ports is calculated. There are a
number of bins that cover the whole port range (0 to 65,535). When a TCP or UDP packet
arrives the port number and number of bytes in the payload is extracted. The number of
Figure 17 - Port Spread Algorithm
10Mb
100 - 150 50 - 100 0 - 50
Packet Arrived on
port 143
0Mb 40Mb
Standard Deviation

58
bytes is then added to the bin into which that port number falls. After a short periodTP
16PT
collecting this data the standard deviation of the byte counts from each bin is calculated.
This value is then used as a measure of spread.
The same algorithm is run simultaneously for host addresses. In this case the 32bit IPv4
addresses are converted to a number before being added to the bins. The two standard
deviations are combined to give a root mean square value which is also output by this
plug-in.
221 SDSD +
Equation 1 - RMSE Calculation
5.2.3 TCP Stream Reassembly
In order to perform payload analysis it is necessary to first re-construct the data stream.
A TCP stream is a set of IP packets traveling in both directions between two hosts using a
pair of port numbers. Within the IP packets there are TCP segments. A sequence of
segments flowing in any single direction constitutes a message. For example a typical
HTTP request and reply would require the TCP connection setup packets to be first
exchanged followed by one or more TCP segments containing the HTTP GET request. A
sequence of segments flowing in the opposite direction follow and contain the HTTP
response. Finally the connection is closed.
For the purpose of signal generation we may want to look at the numbers of segments per
message or messages per connection. In order to evaluate the pattern matching
techniques proposed in (Kreibich & Crowcroft, 2004), we also need to be able to index to a
particular message depth in a connection.
Figure 18 shows more clearly how the messages are re-constructed from the packet data.
TP
16PT Running this part of the algorithm for more than a couple seconds on a high bandwidth
link could cause the number representations in the programming language to overflow
and corrupt the calculation.
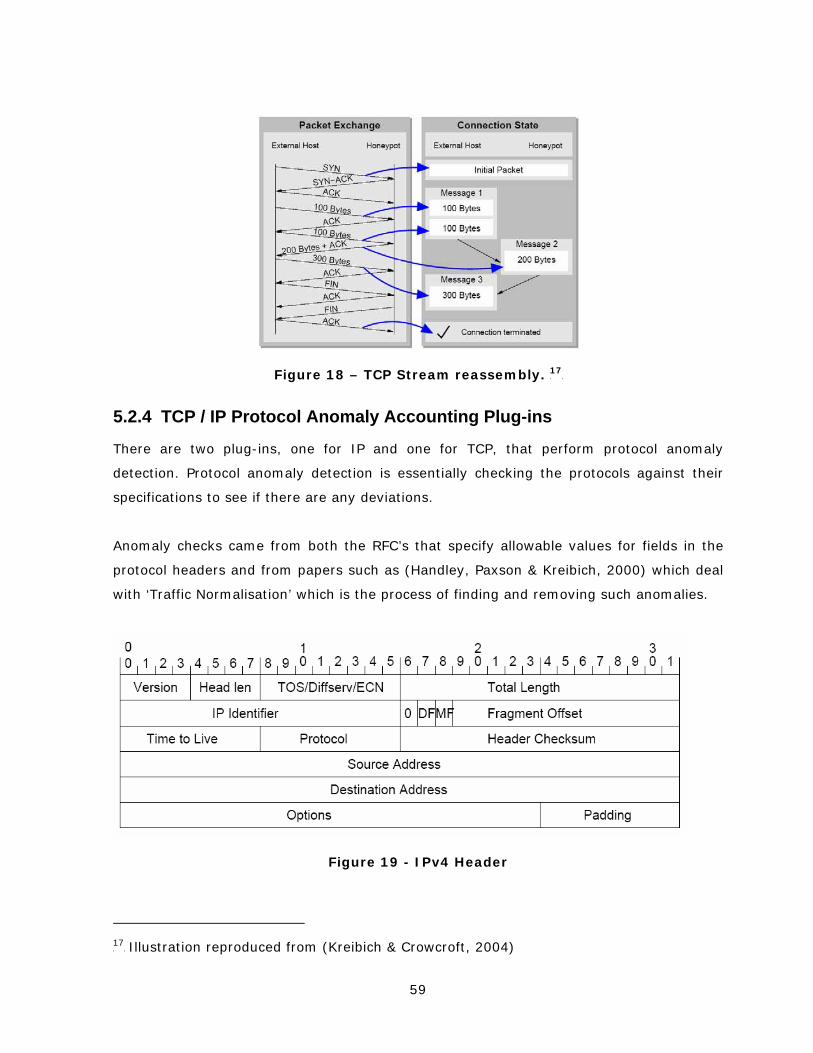
59
Figure 18 – TCP Stream reassembly. TP
17PT
5.2.4 TCP / IP Protocol Anomaly Accounting Plug-ins
There are two plug-ins, one for IP and one for TCP, that perform protocol anomaly
detection. Protocol anomaly detection is essentially checking the protocols against their
specifications to see if there are any deviations.
Anomaly checks came from both the RFC’s that specify allowable values for fields in the
protocol headers and from papers such as (Handley, Paxson & Kreibich, 2000) which deal
with ‘Traffic Normalisation’ which is the process of finding and removing such anomalies.
Figure 19 - IPv4 Header
TP
17PT Illustration reproduced from (Kreibich & Crowcroft, 2004)
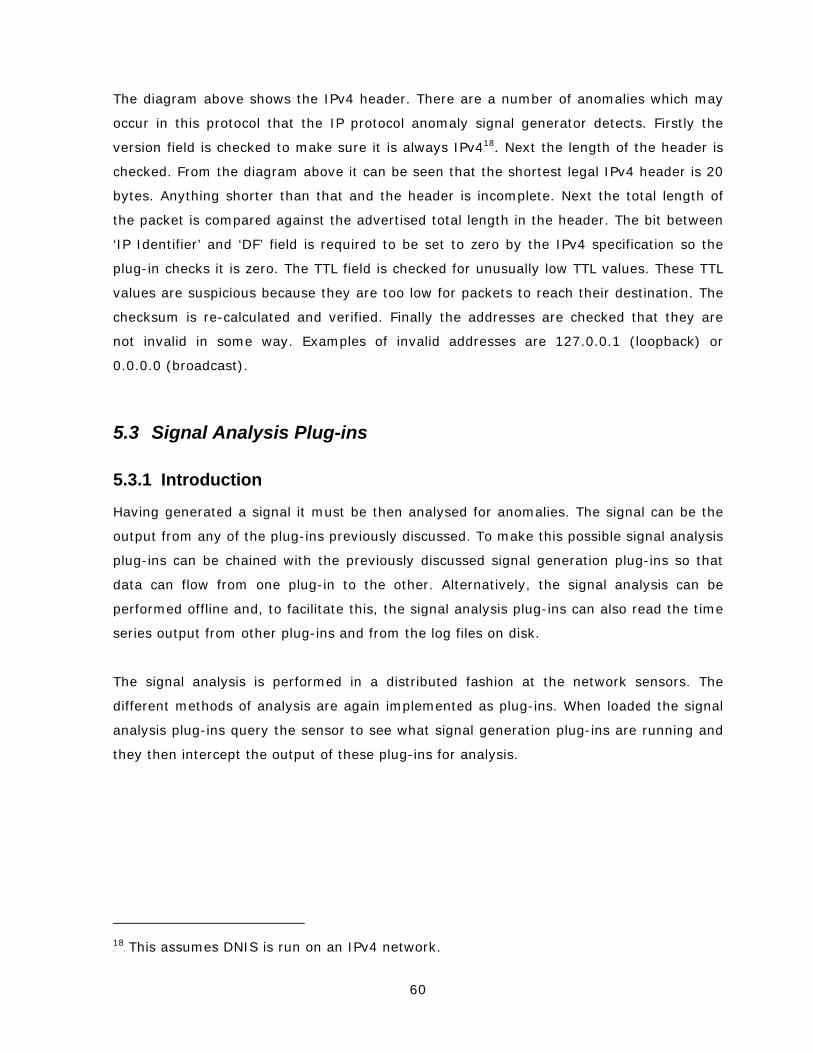
60
The diagram above shows the IPv4 header. There are a number of anomalies which may
occur in this protocol that the IP protocol anomaly signal generator detects. Firstly the
version field is checked to make sure it is always IPv4TP
18PT. Next the length of the header is
checked. From the diagram above it can be seen that the shortest legal IPv4 header is 20
bytes. Anything shorter than that and the header is incomplete. Next the total length of
the packet is compared against the advertised total length in the header. The bit between
‘IP Identifier’ and ‘DF’ field is required to be set to zero by the IPv4 specification so the
plug-in checks it is zero. The TTL field is checked for unusually low TTL values. These TTL
values are suspicious because they are too low for packets to reach their destination. The
checksum is re-calculated and verified. Finally the addresses are checked that they are
not invalid in some way. Examples of invalid addresses are 127.0.0.1 (loopback) or
0.0.0.0 (broadcast).
5.3 Signal Analysis Plug-ins
5.3.1 Introduction
Having generated a signal it must be then analysed for anomalies. The signal can be the
output from any of the plug-ins previously discussed. To make this possible signal analysis
plug-ins can be chained with the previously discussed signal generation plug-ins so that
data can flow from one plug-in to the other. Alternatively, the signal analysis can be
performed offline and, to facilitate this, the signal analysis plug-ins can also read the time
series output from other plug-ins and from the log files on disk.
The signal analysis is performed in a distributed fashion at the network sensors. The
different methods of analysis are again implemented as plug-ins. When loaded the signal
analysis plug-ins query the sensor to see what signal generation plug-ins are running and
they then intercept the output of these plug-ins for analysis.
TP
18PT This assumes DNIS is run on an IPv4 network.
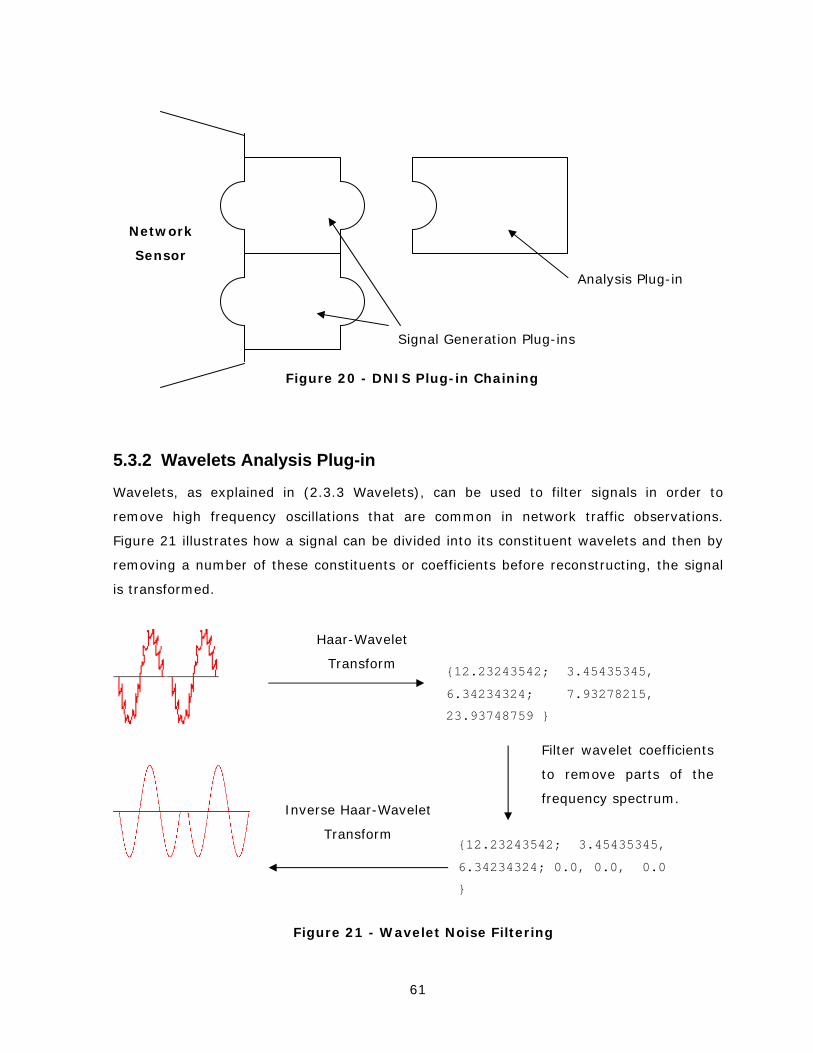
61
5.3.2 Wavelets Analysis Plug-in
Wavelets, as explained in (2.3.3 Wavelets), can be used to filter signals in order to
remove high frequency oscillations that are common in network traffic observations.
Figure 21 illustrates how a signal can be divided into its constituent wavelets and then by
removing a number of these constituents or coefficients before reconstructing, the signal
is transformed.
Figure 20 - DNIS Plug-in Chaining
Figure 21 - Wavelet Noise Filtering
Haar-Wavelet
Transform {12.23243542; 3.45435345,
6.34234324; 7.93278215,
23.93748759 }
{12.23243542; 3.45435345,
6.34234324; 0.0, 0.0, 0.0
}
Inverse Haar-Wavelet
Transform
Filter wavelet coefficients
to remove parts of the
frequency spectrum.
Analysis Plug-in
Signal Generation Plug-ins
Network
Sensor
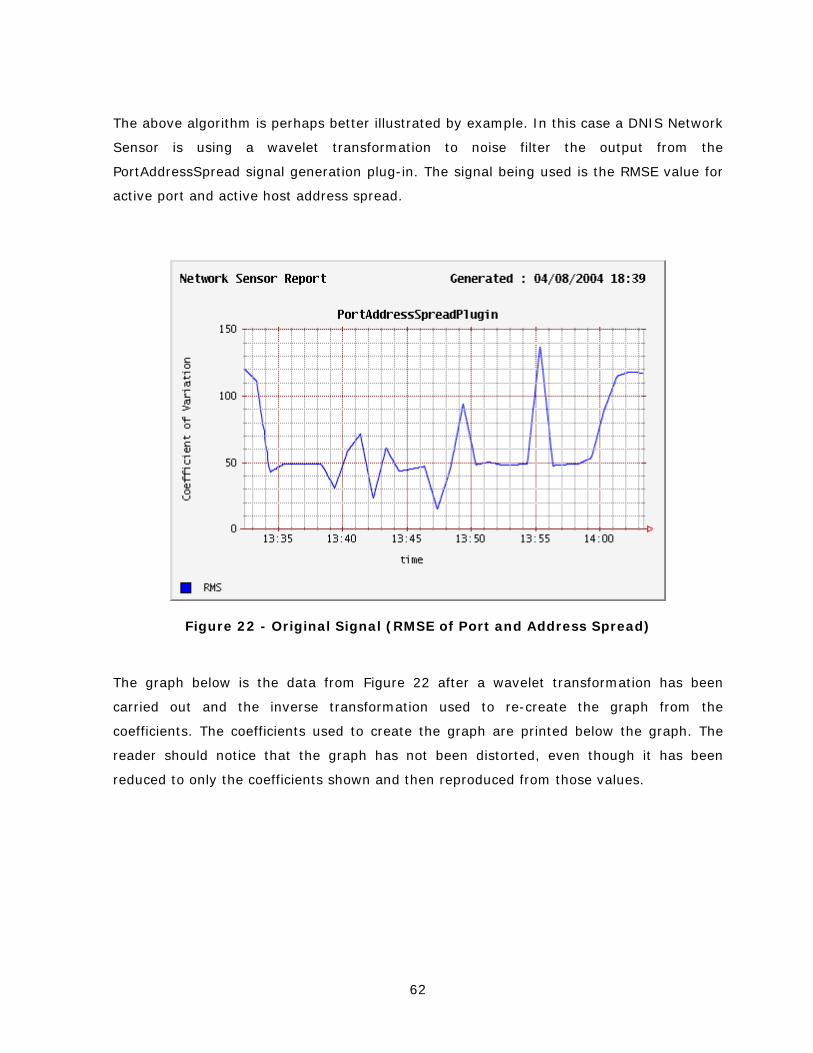
62
The above algorithm is perhaps better illustrated by example. In this case a DNIS Network
Sensor is using a wavelet transformation to noise filter the output from the
PortAddressSpread signal generation plug-in. The signal being used is the RMSE value for
active port and active host address spread.
Figure 22 - Original Signal (RMSE of Port and Address Spread)
The graph below is the data from Figure 22 after a wavelet transformation has been
carried out and the inverse transformation used to re-create the graph from the
coefficients. The coefficients used to create the graph are printed below the graph. The
reader should notice that the graph has not been distorted, even though it has been
reduced to only the coefficients shown and then reproduced from those values.
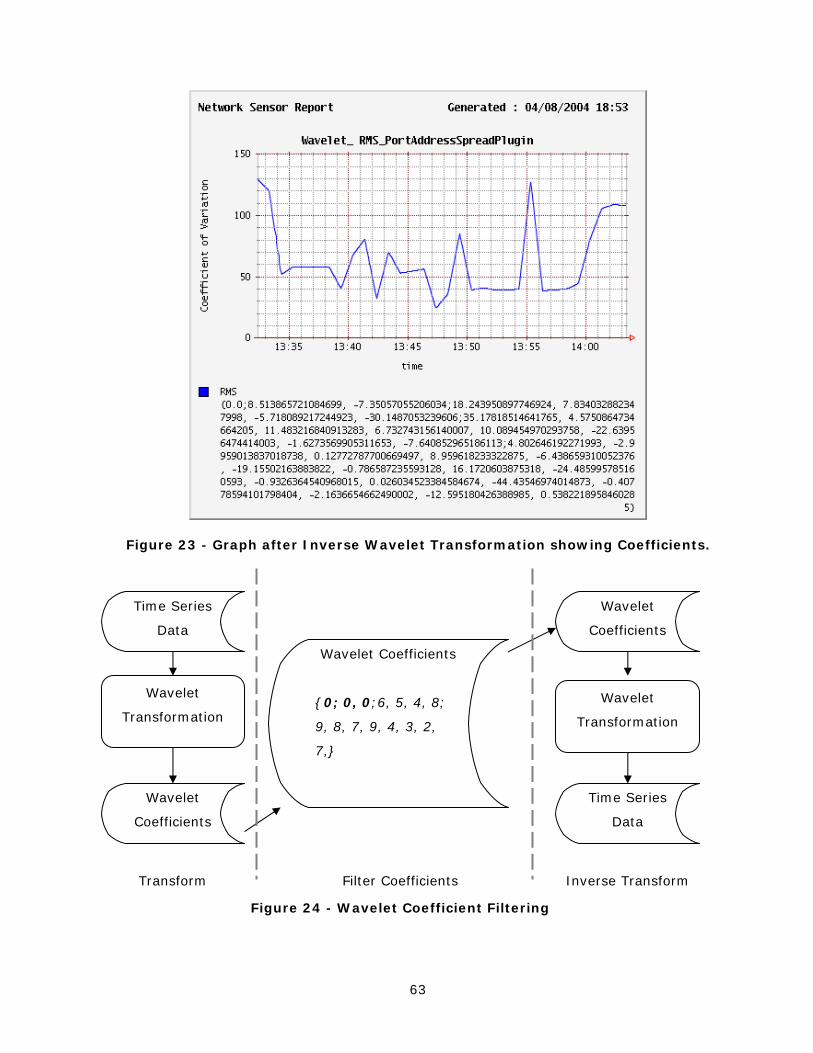
63
Figure 23 - Graph after Inverse Wavelet Transformation showing Coefficients.
Figure 24 - Wavelet Coefficient Filtering
Time Series
Data
Wavelet
Coefficients
Wavelet
Coefficients
Wavelet Coefficients
{0; 0, 0;6, 5, 4, 8;
9, 8, 7, 9, 4, 3, 2,
7,}
Wavelet
Transformation
Time Series
Data
Wavelet
Transformation
Inverse Transform Transform Filter Coefficients
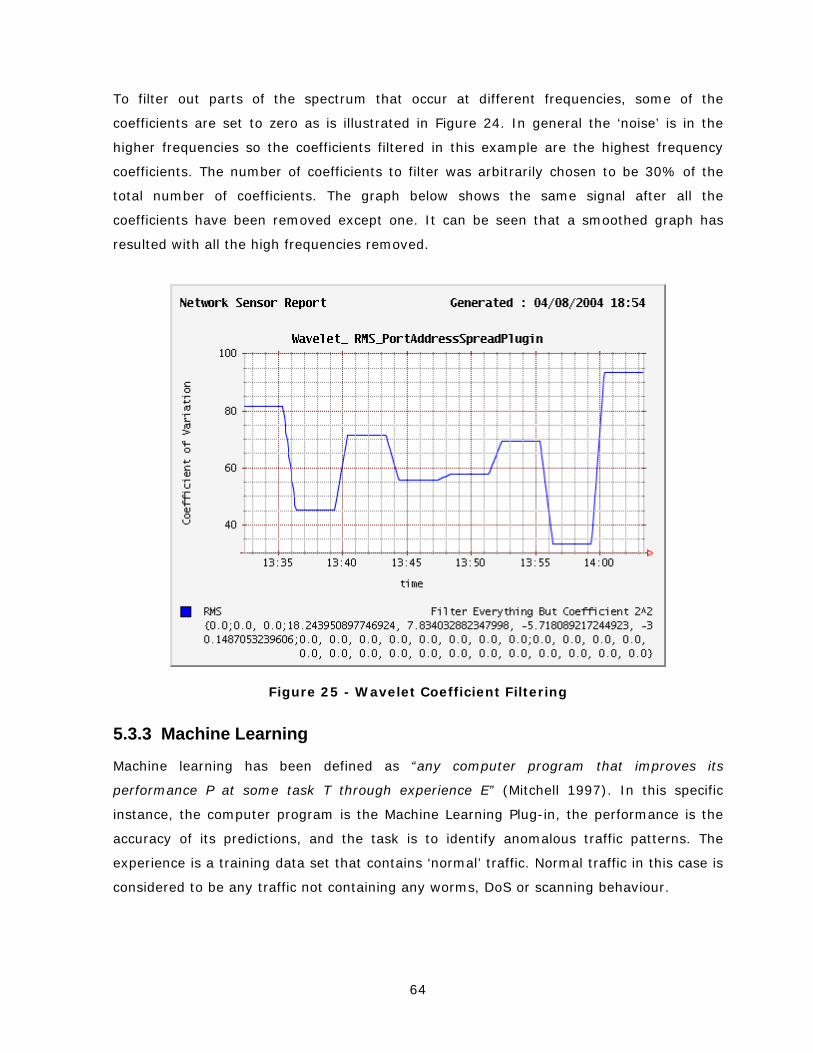
64
To filter out parts of the spectrum that occur at different frequencies, some of the
coefficients are set to zero as is illustrated in Figure 24. In general the ‘noise’ is in the
higher frequencies so the coefficients filtered in this example are the highest frequency
coefficients. The number of coefficients to filter was arbitrarily chosen to be 30% of the
total number of coefficients. The graph below shows the same signal after all the
coefficients have been removed except one. It can be seen that a smoothed graph has
resulted with all the high frequencies removed.
Figure 25 - Wavelet Coefficient Filtering
5.3.3 Machine Learning
Machine learning has been defined as “any computer program that improves its
performance P at some task T through experience E” (Mitchell 1997). In this specific
instance, the computer program is the Machine Learning Plug-in, the performance is the
accuracy of its predictions, and the task is to identify anomalous traffic patterns. The
experience is a training data set that contains ‘normal’ traffic. Normal traffic in this case is
considered to be any traffic not containing any worms, DoS or scanning behaviour.

65
Machine learning allows the plug-in to solve the complex task of determining what is an
anomaly without having to hard code any detailed knowledge about how to recognise an
anomaly.
There are many flavors of machine learning including decision tree learning, Bayesian
learning and clustering. This plug-in uses clustering, which is an unsupervised learning
process. Unsupervised learning has been applied by others to similar problems such as in
“Unsupervised Learning Techniques for an Intrusion Detection System” (Zanero &
Savaresi, 2004). That paper listed the main advantages of this approach as:
• Outlier detection: unsupervised learning techniques are capable of identifying
strange observations in a wide range of phenomena; this is a characteristic we
definitely need in an anomaly based IDS;
• Generalization: unsupervised learning techniques are also quite robust and gave
us the hope of being able to resist to polymorphic attacks;
• Adaptation: a learning algorithm can be tuned totally to the specific network it
operates in, which is also an important feature to reduce the number of false
positives and optimize the detection rate.
This plug-in uses a variation on K-NN, an unsupervised classification technique. In this
instance I have constructed a single class learner that learns ‘profiles’. The profiles are
simply a single cluster of data samples representing normal network behaviour. Like the
other signal analysis plug-ins, this plug-in can be chained to any of the signal generation
Figure 26 - Machine Learning Plug-in Class Diagram
ProfileLearner
Profile
Train(Sample)
Test(Sample) SampleDistance
Distance(Sample,
Sample)
Profile
Point centre
Int radius
MLAnalysisPlug-in
Int state (Training | Testing)
If (Training)
Read all previously
generated signals and
learn profile.
Else if (Testing)
Intercept current
signal generation
output and test
against learned
profile.
66
plug-ins with the exception that the plug-in must be told whether it is to learn from the
data or test the data against it’s profile.
5.3.4 Payload Pattern Matching
Payload analysis is becoming increasingly important as a means of anomaly detection.
This is because of the relative ease with which packet headers can be forged and altered
to obfuscate an attack. There are a number of approaches to payload analysis, all of which
rely on the fact that the payload of packets are not random. In fact the content of the
payload has been shown to be dependant on the application that generated it (Wang et al,
2004).
This feature is important because an intrusion detection system no longer needs to rely on
port numbers to determine the application generating the traffic.TP
19PT This allows a network
monitoring application to recognise, for example, if someone is using port 80TP
20PT to transmit
or receive anything other than HTTP traffic. One of the common ways to recognise the
application from the packet payloads is using machine learning techniques like those
discussed in the previous section (5.3.3). This approach was adopted in papers such as
(Zanero & Savaresi, 2004). Other papers rely on statistical methods to determine the
application using only a byte frequency distribution based profile and standard deviation
(Wang et al, 2004). Yet another paper uses simple string matching algorithms to find
matching content in packet payloads (Kreibich & Crowcroft, 2004). Simply matching the
strings is useful but will ultimately match all the application protocol inherent structure
that will be common to many packets.
The payload pattern matching plug-in in this application implements the final approach to
payload based detection. The reason that this approach was chosen was because of its
clever payload scanning techniques that allow it to uncover structure that has been
fragmented over many packets and the advantage it takes of the context of the data, such
as its location in a stream, to improve the ability to find byte patterns.
TP
19PT It is only a convention that services such as SMTP run on their ICANN registered port
numbers (25). Any service can be run on any port number.
TP
20PT Port 80 is registered for use by World Wide Web Hypertext Transport Protocol by Tim
Berners-Lee.
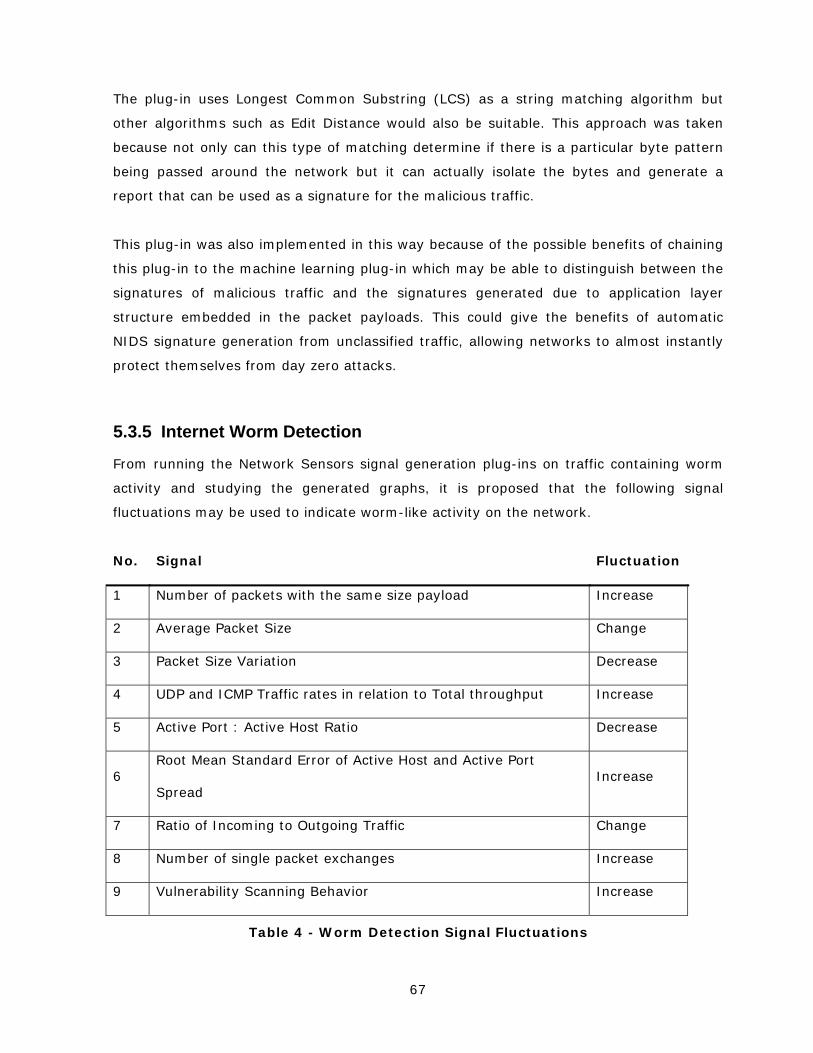
67
The plug-in uses Longest Common Substring (LCS) as a string matching algorithm but
other algorithms such as Edit Distance would also be suitable. This approach was taken
because not only can this type of matching determine if there is a particular byte pattern
being passed around the network but it can actually isolate the bytes and generate a
report that can be used as a signature for the malicious traffic.
This plug-in was also implemented in this way because of the possible benefits of chaining
this plug-in to the machine learning plug-in which may be able to distinguish between the
signatures of malicious traffic and the signatures generated due to application layer
structure embedded in the packet payloads. This could give the benefits of automatic
NIDS signature generation from unclassified traffic, allowing networks to almost instantly
protect themselves from day zero attacks.
5.3.5 Internet Worm Detection
From running the Network Sensors signal generation plug-ins on traffic containing worm
activity and studying the generated graphs, it is proposed that the following signal
fluctuations may be used to indicate worm-like activity on the network.
No. Signal Fluctuation
1 Number of packets with the same size payload Increase
2 Average Packet Size Change
3 Packet Size Variation Decrease
4 UDP and ICMP Traffic rates in relation to Total throughput Increase
5 Active Port : Active Host Ratio Decrease
6 Root Mean Standard Error of Active Host and Active Port
Spread Increase
7 Ratio of Incoming to Outgoing Traffic Change
8 Number of single packet exchanges Increase
9 Vulnerability Scanning Behavior Increase
Table 4 - Worm Detection Signal Fluctuations
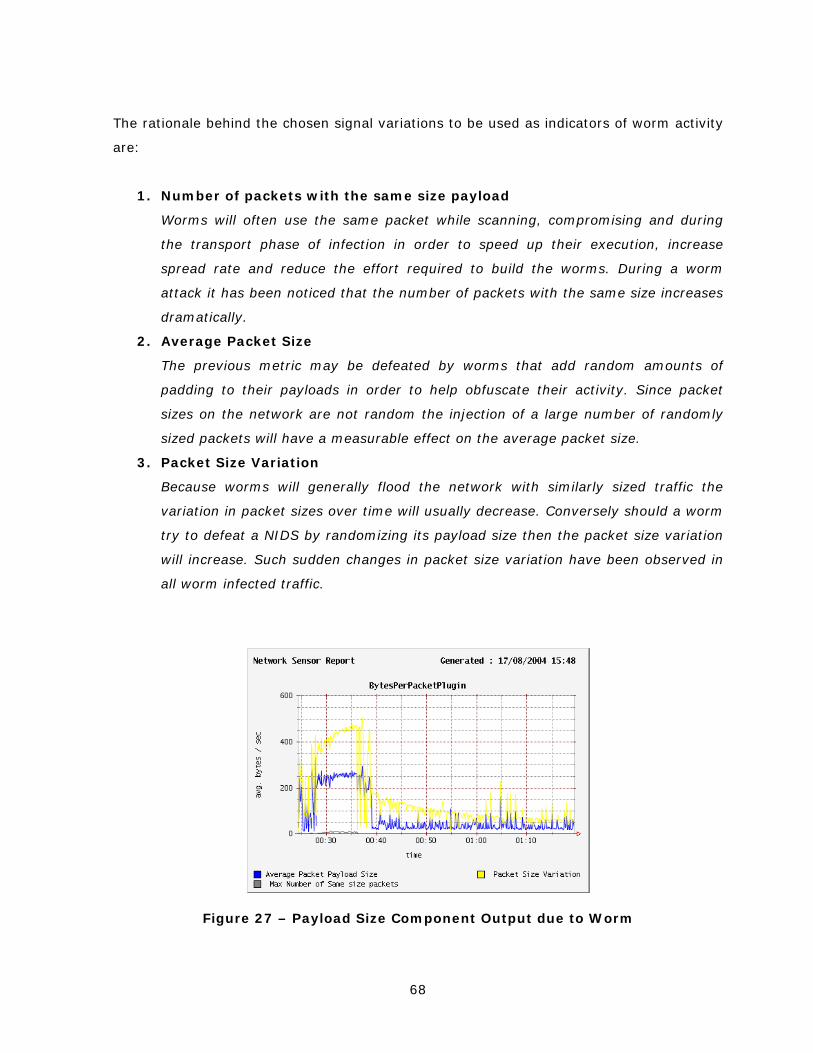
68
The rationale behind the chosen signal variations to be used as indicators of worm activity
are:
1. Number of packets with the same size payload
Worms will often use the same packet while scanning, compromising and during
the transport phase of infection in order to speed up their execution, increase
spread rate and reduce the effort required to build the worms. During a worm
attack it has been noticed that the number of packets with the same size increases
dramatically.
2. Average Packet Size
The previous metric may be defeated by worms that add random amounts of
padding to their payloads in order to help obfuscate their activity. Since packet
sizes on the network are not random the injection of a large number of randomly
sized packets will have a measurable effect on the average packet size.
3. Packet Size Variation
Because worms will generally flood the network with similarly sized traffic the
variation in packet sizes over time will usually decrease. Conversely should a worm
try to defeat a NIDS by randomizing its payload size then the packet size variation
will increase. Such sudden changes in packet size variation have been observed in
all worm infected traffic.
Figure 27 – Payload Size Component Output due to Worm
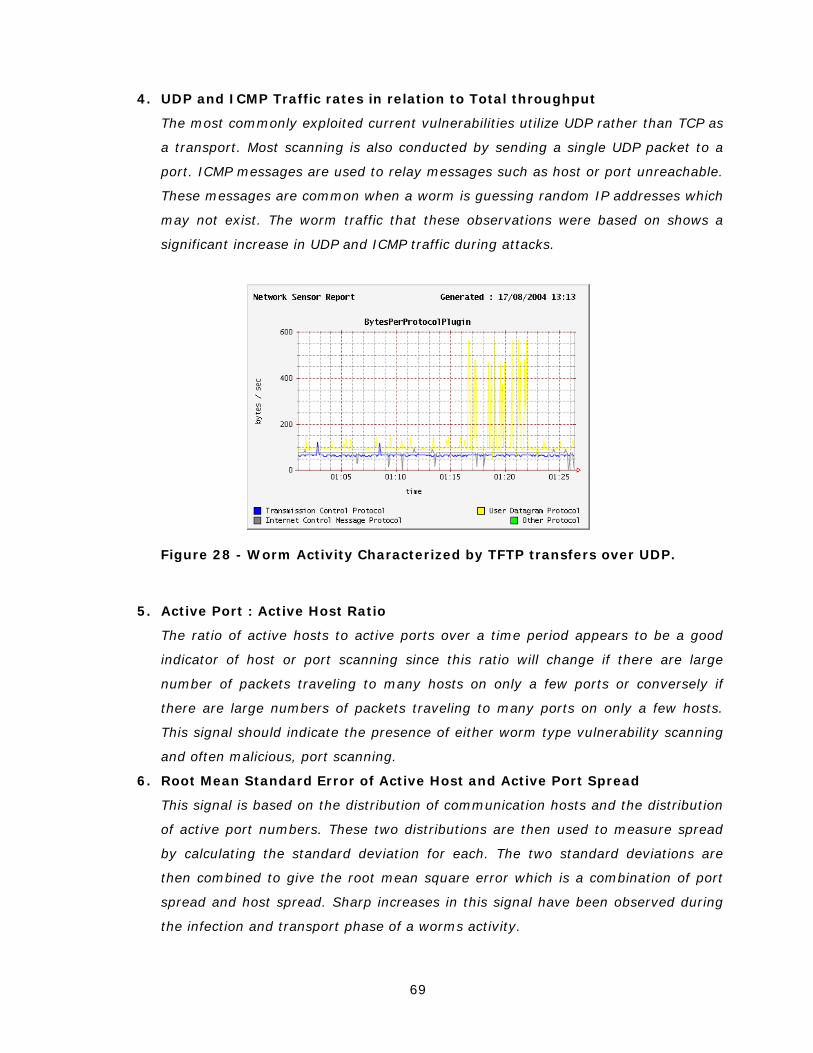
69
4. UDP and ICMP Traffic rates in relation to Total throughput
The most commonly exploited current vulnerabilities utilize UDP rather than TCP as
a transport. Most scanning is also conducted by sending a single UDP packet to a
port. ICMP messages are used to relay messages such as host or port unreachable.
These messages are common when a worm is guessing random IP addresses which
may not exist. The worm traffic that these observations were based on shows a
significant increase in UDP and ICMP traffic during attacks.
Figure 28 - Worm Activity Characterized by TFTP transfers over UDP.
5. Active Port : Active Host Ratio
The ratio of active hosts to active ports over a time period appears to be a good
indicator of host or port scanning since this ratio will change if there are large
number of packets traveling to many hosts on only a few ports or conversely if
there are large numbers of packets traveling to many ports on only a few hosts.
This signal should indicate the presence of either worm type vulnerability scanning
and often malicious, port scanning.
6. Root Mean Standard Error of Active Host and Active Port Spread
This signal is based on the distribution of communication hosts and the distribution
of active port numbers. These two distributions are then used to measure spread
by calculating the standard deviation for each. The two standard deviations are
then combined to give the root mean square error which is a combination of port
spread and host spread. Sharp increases in this signal have been observed during
the infection and transport phase of a worms activity.
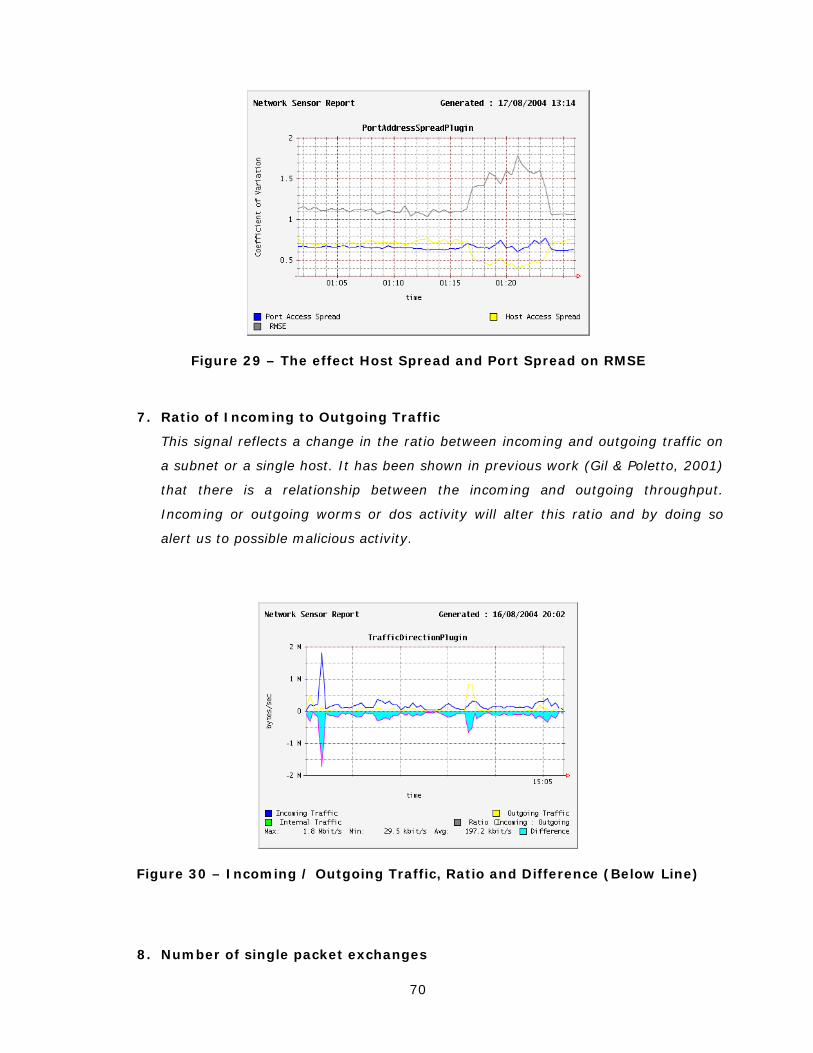
70
Figure 29 – The effect Host Spread and Port Spread on RMSE
7. Ratio of Incoming to Outgoing Traffic
This signal reflects a change in the ratio between incoming and outgoing traffic on
a subnet or a single host. It has been shown in previous work (Gil & Poletto, 2001)
that there is a relationship between the incoming and outgoing throughput.
Incoming or outgoing worms or dos activity will alter this ratio and by doing so
alert us to possible malicious activity.
Figure 30 – Incoming / Outgoing Traffic, Ratio and Difference (Below Line)
8. Number of single packet exchanges
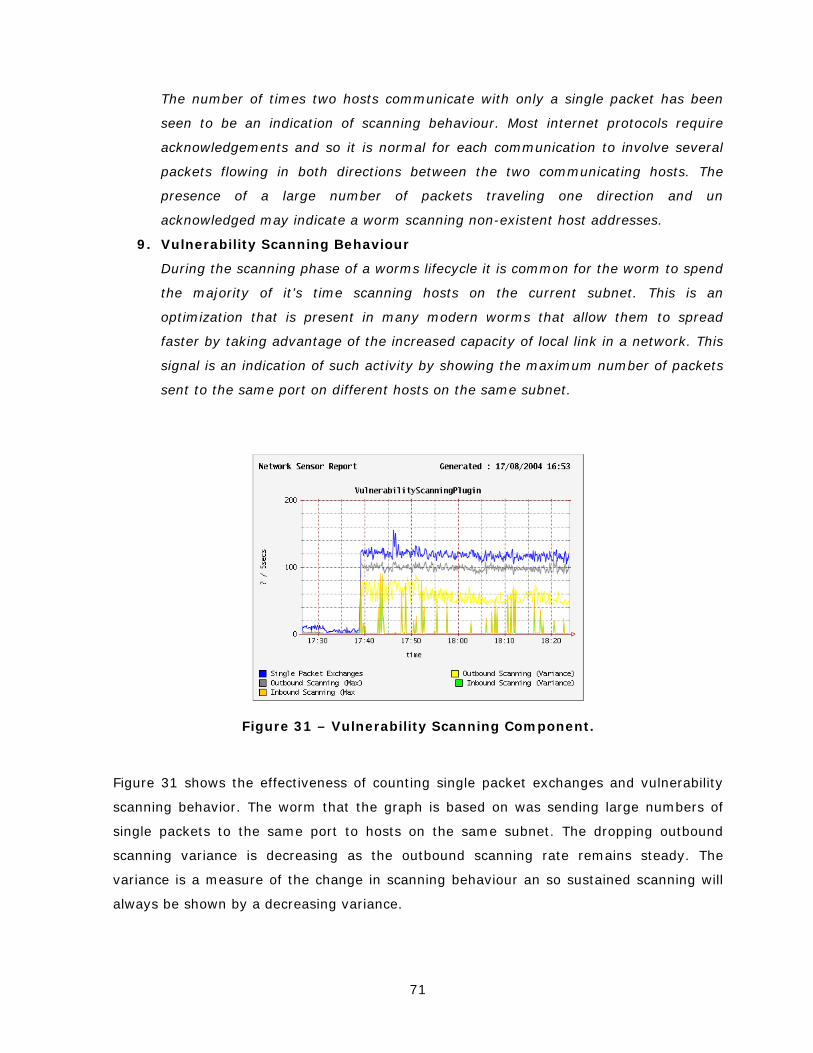
71
The number of times two hosts communicate with only a single packet has been
seen to be an indication of scanning behaviour. Most internet protocols require
acknowledgements and so it is normal for each communication to involve several
packets flowing in both directions between the two communicating hosts. The
presence of a large number of packets traveling one direction and un
acknowledged may indicate a worm scanning non-existent host addresses.
9. Vulnerability Scanning Behaviour
During the scanning phase of a worms lifecycle it is common for the worm to spend
the majority of it’s time scanning hosts on the current subnet. This is an
optimization that is present in many modern worms that allow them to spread
faster by taking advantage of the increased capacity of local link in a network. This
signal is an indication of such activity by showing the maximum number of packets
sent to the same port on different hosts on the same subnet.
Figure 31 – Vulnerability Scanning Component.
Figure 31 shows the effectiveness of counting single packet exchanges and vulnerability
scanning behavior. The worm that the graph is based on was sending large numbers of
single packets to the same port to hosts on the same subnet. The dropping outbound
scanning variance is decreasing as the outbound scanning rate remains steady. The
variance is a measure of the change in scanning behaviour an so sustained scanning will
always be shown by a decreasing variance.
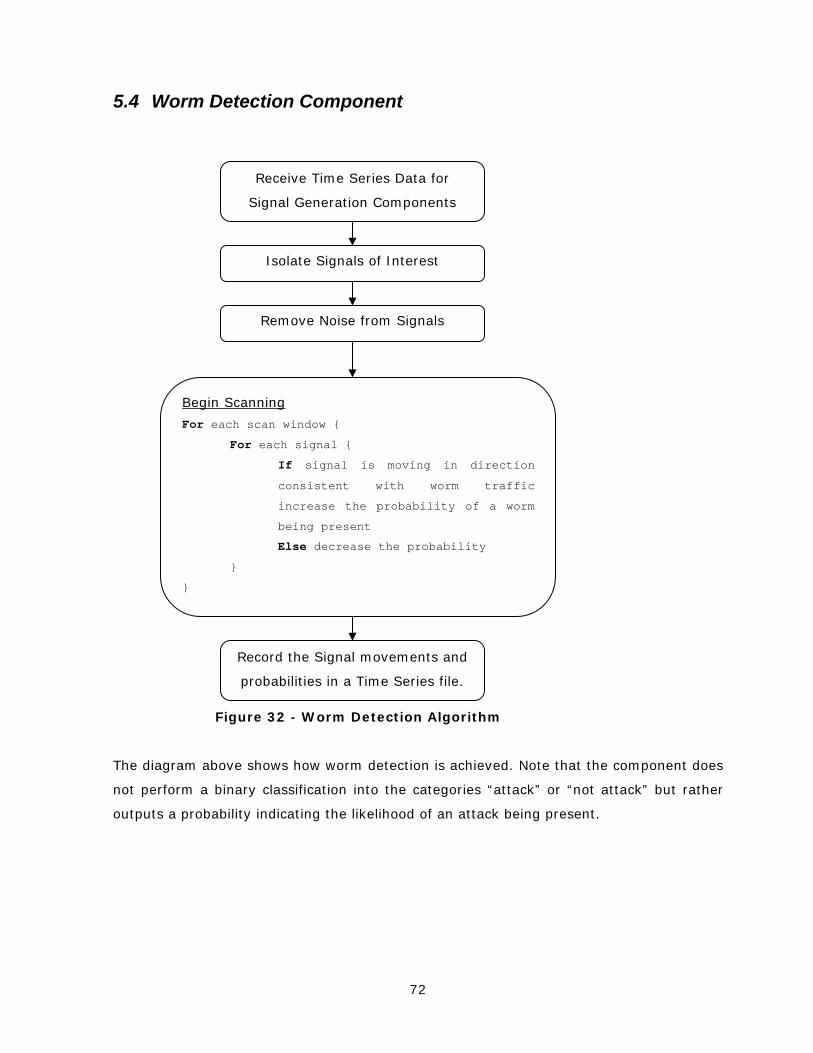
72
5.4 Worm Detection Component
The diagram above shows how worm detection is achieved. Note that the component does
not perform a binary classification into the categories “attack” or “not attack” but rather
outputs a probability indicating the likelihood of an attack being present.
Figure 32 - Worm Detection Algorithm
Receive Time Series Data for
Signal Generation Components
Isolate Signals of Interest
Remove Noise from Signals
UBegin Scanning
For each scan window {
For each signal {
If signal is moving in direction
consistent with worm traffic
increase the probability of a worm
being present
Else decrease the probability
}
}
Record the Signal movements and
probabilities in a Time Series file.
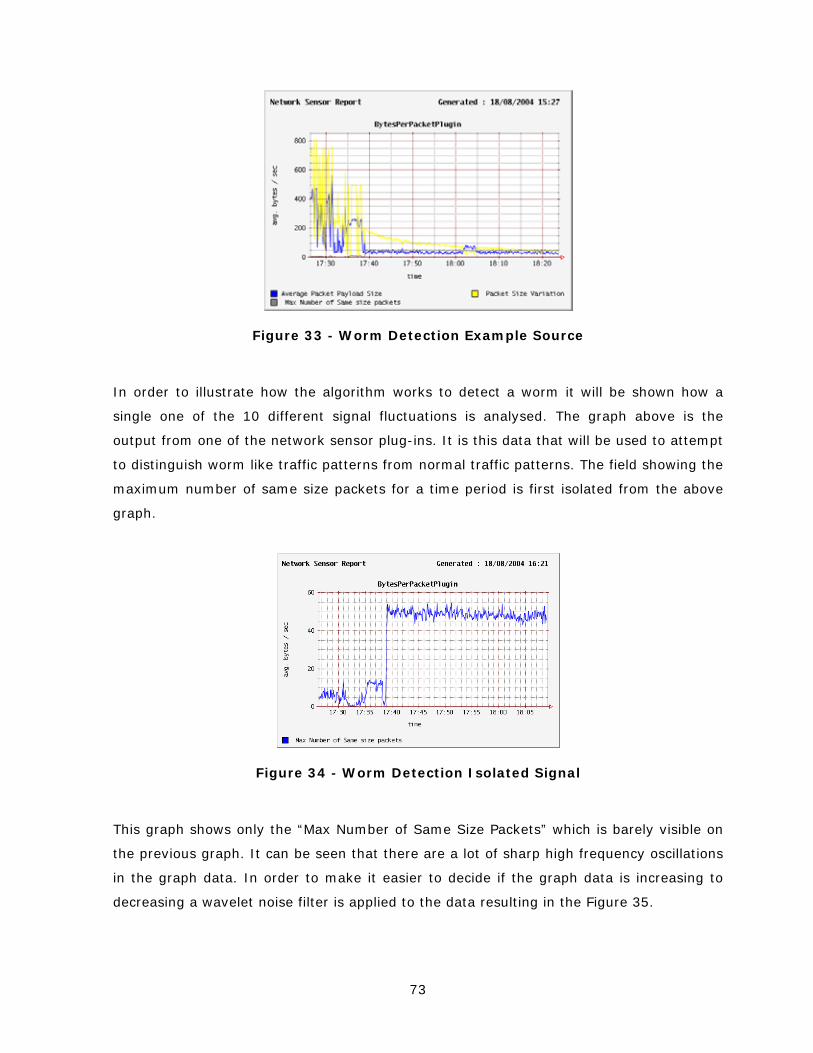
73
Figure 33 - Worm Detection Example Source
In order to illustrate how the algorithm works to detect a worm it will be shown how a
single one of the 10 different signal fluctuations is analysed. The graph above is the
output from one of the network sensor plug-ins. It is this data that will be used to attempt
to distinguish worm like traffic patterns from normal traffic patterns. The field showing the
maximum number of same size packets for a time period is first isolated from the above
graph.
Figure 34 - Worm Detection Isolated Signal
This graph shows only the “Max Number of Same Size Packets” which is barely visible on
the previous graph. It can be seen that there are a lot of sharp high frequency oscillations
in the graph data. In order to make it easier to decide if the graph data is increasing to
decreasing a wavelet noise filter is applied to the data resulting in the Figure 35.
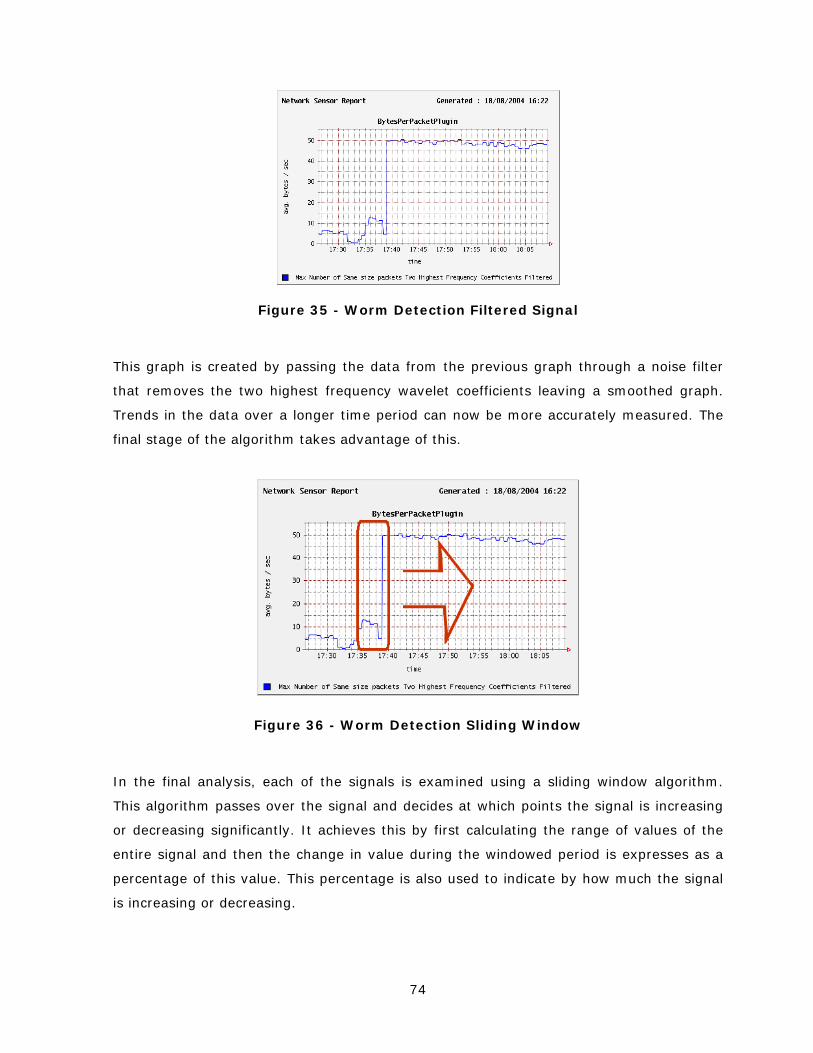
74
Figure 35 - Worm Detection Filtered Signal
This graph is created by passing the data from the previous graph through a noise filter
that removes the two highest frequency wavelet coefficients leaving a smoothed graph.
Trends in the data over a longer time period can now be more accurately measured. The
final stage of the algorithm takes advantage of this.
Figure 36 - Worm Detection Sliding Window
In the final analysis, each of the signals is examined using a sliding window algorithm.
This algorithm passes over the signal and decides at which points the signal is increasing
or decreasing significantly. It achieves this by first calculating the range of values of the
entire signal and then the change in value during the windowed period is expresses as a
percentage of this value. This percentage is also used to indicate by how much the signal
is increasing or decreasing.
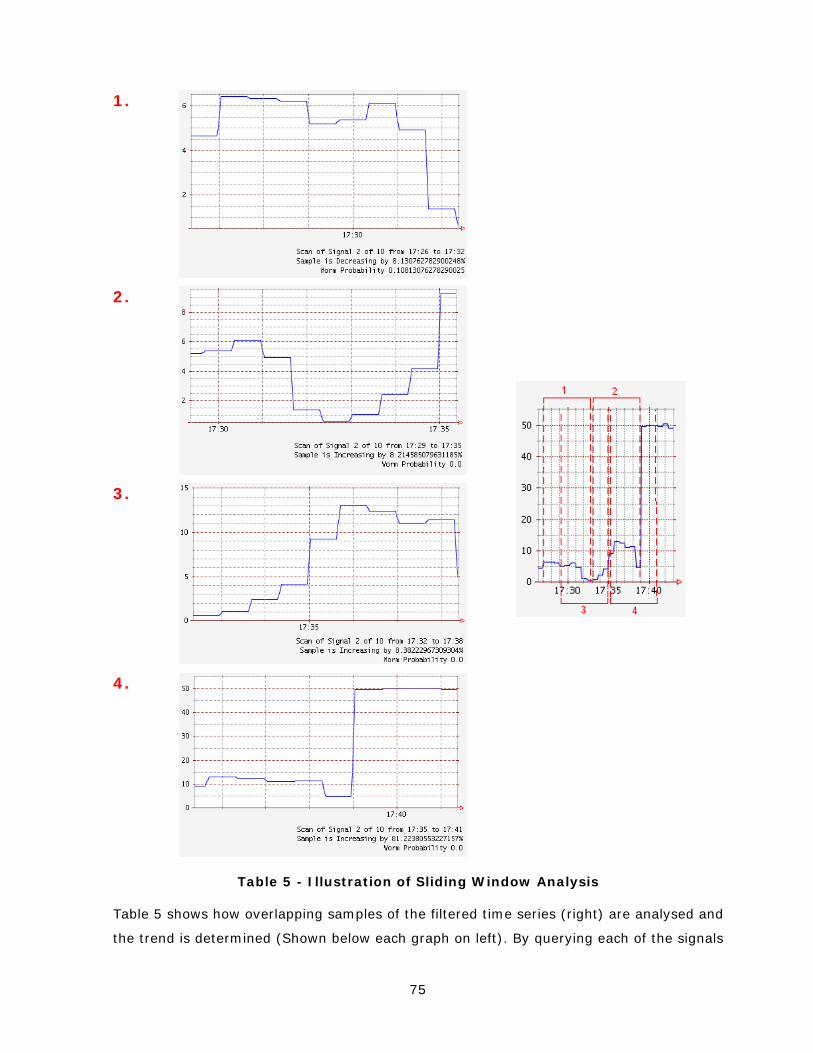
75
1.
2.
3.
4.
Table 5 - Illustration of Sliding Window Analysis
Table 5 shows how overlapping samples of the filtered time series (right) are analysed and
the trend is determined (Shown below each graph on left). By querying each of the signals
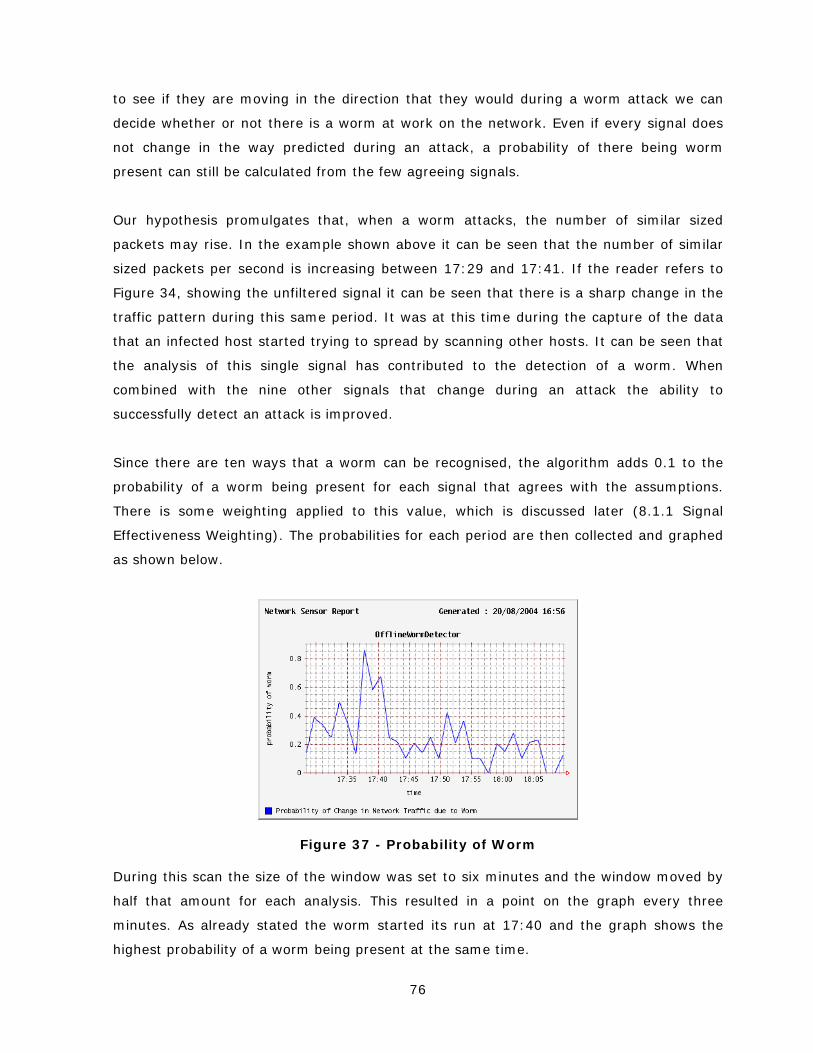
76
to see if they are moving in the direction that they would during a worm attack we can
decide whether or not there is a worm at work on the network. Even if every signal does
not change in the way predicted during an attack, a probability of there being worm
present can still be calculated from the few agreeing signals.
Our hypothesis promulgates that, when a worm attacks, the number of similar sized
packets may rise. In the example shown above it can be seen that the number of similar
sized packets per second is increasing between 17:29 and 17:41. If the reader refers to
Figure 34, showing the unfiltered signal it can be seen that there is a sharp change in the
traffic pattern during this same period. It was at this time during the capture of the data
that an infected host started trying to spread by scanning other hosts. It can be seen that
the analysis of this single signal has contributed to the detection of a worm. When
combined with the nine other signals that change during an attack the ability to
successfully detect an attack is improved.
Since there are ten ways that a worm can be recognised, the algorithm adds 0.1 to the
probability of a worm being present for each signal that agrees with the assumptions.
There is some weighting applied to this value, which is discussed later (8.1.1 Signal
Effectiveness Weighting). The probabilities for each period are then collected and graphed
as shown below.
Figure 37 - Probability of Worm
During this scan the size of the window was set to six minutes and the window moved by
half that amount for each analysis. This resulted in a point on the graph every three
minutes. As already stated the worm started its run at 17:40 and the graph shows the
highest probability of a worm being present at the same time.
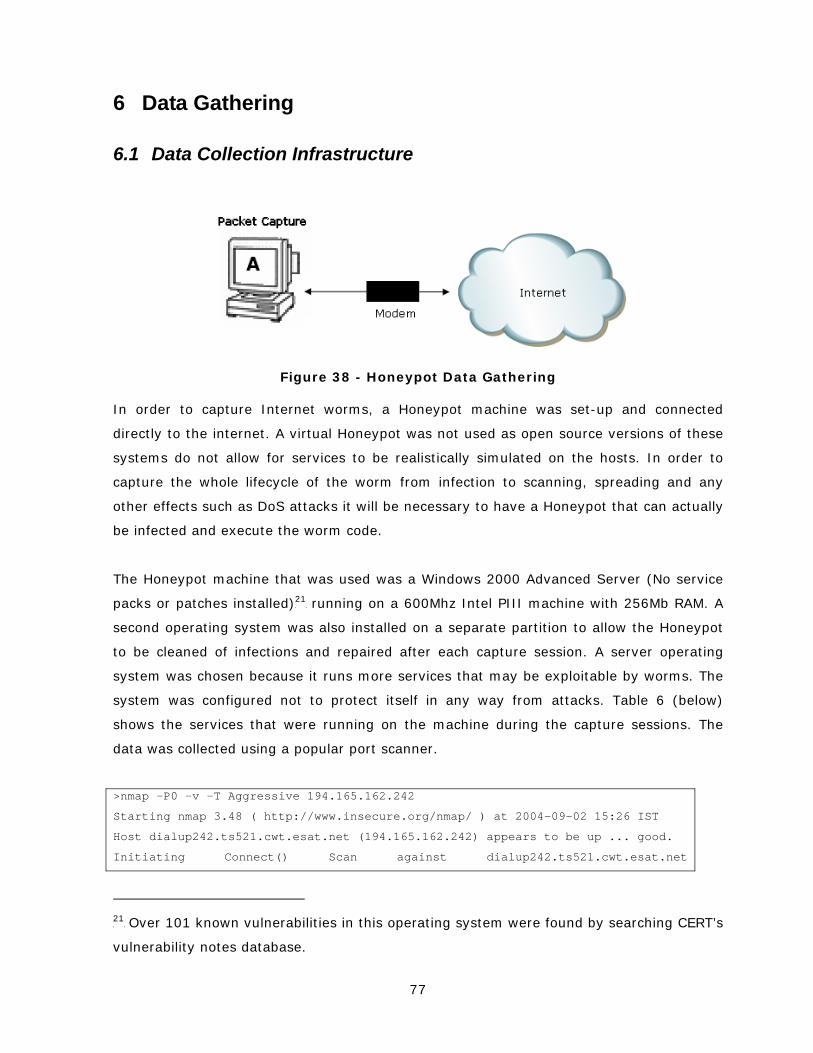
77
6 Data Gathering
6.1 Data Collection Infrastructure
Figure 38 - Honeypot Data Gathering
In order to capture Internet worms, a Honeypot machine was set-up and connected
directly to the internet. A virtual Honeypot was not used as open source versions of these
systems do not allow for services to be realistically simulated on the hosts. In order to
capture the whole lifecycle of the worm from infection to scanning, spreading and any
other effects such as DoS attacks it will be necessary to have a Honeypot that can actually
be infected and execute the worm code.
The Honeypot machine that was used was a Windows 2000 Advanced Server (No service
packs or patches installed)TP
21PT running on a 600Mhz Intel PIII machine with 256Mb RAM. A
second operating system was also installed on a separate partition to allow the Honeypot
to be cleaned of infections and repaired after each capture session. A server operating
system was chosen because it runs more services that may be exploitable by worms. The
system was configured not to protect itself in any way from attacks. Table 6 (below)
shows the services that were running on the machine during the capture sessions. The
data was collected using a popular port scanner.
>nmap -P0 -v -T Aggressive 194.165.162.242
Starting nmap 3.48 ( http://www.insecure.org/nmap/ ) at 2004-09-02 15:26 IST
Host dialup242.ts521.cwt.esat.net (194.165.162.242) appears to be up ... good.
Initiating Connect() Scan against dialup242.ts521.cwt.esat.net
TP
21PT Over 101 known vulnerabilities in this operating system were found by searching CERT’s
vulnerability notes database.
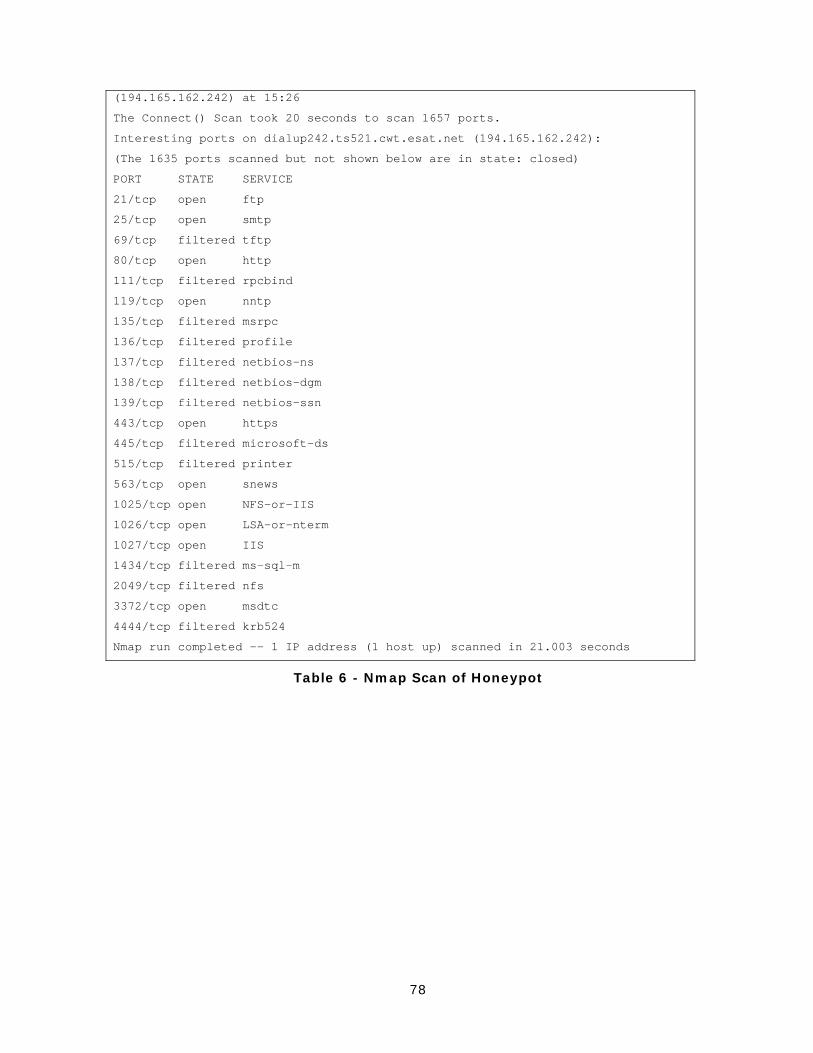
78
(194.165.162.242) at 15:26
The Connect() Scan took 20 seconds to scan 1657 ports.
Interesting ports on dialup242.ts521.cwt.esat.net (194.165.162.242):
(The 1635 ports scanned but not shown below are in state: closed)
PORT STATE SERVICE
21/tcp open ftp
25/tcp open smtp
69/tcp filtered tftp
80/tcp open http
111/tcp filtered rpcbind
119/tcp open nntp
135/tcp filtered msrpc
136/tcp filtered profile
137/tcp filtered netbios-ns
138/tcp filtered netbios-dgm
139/tcp filtered netbios-ssn
443/tcp open https
445/tcp filtered microsoft-ds
515/tcp filtered printer
563/tcp open snews
1025/tcp open NFS-or-IIS
1026/tcp open LSA-or-nterm
1027/tcp open IIS
1434/tcp filtered ms-sql-m
2049/tcp filtered nfs
3372/tcp open msdtc
4444/tcp filtered krb524
Nmap run completed -- 1 IP address (1 host up) scanned in 21.003 seconds
Table 6 - Nmap Scan of Honeypot
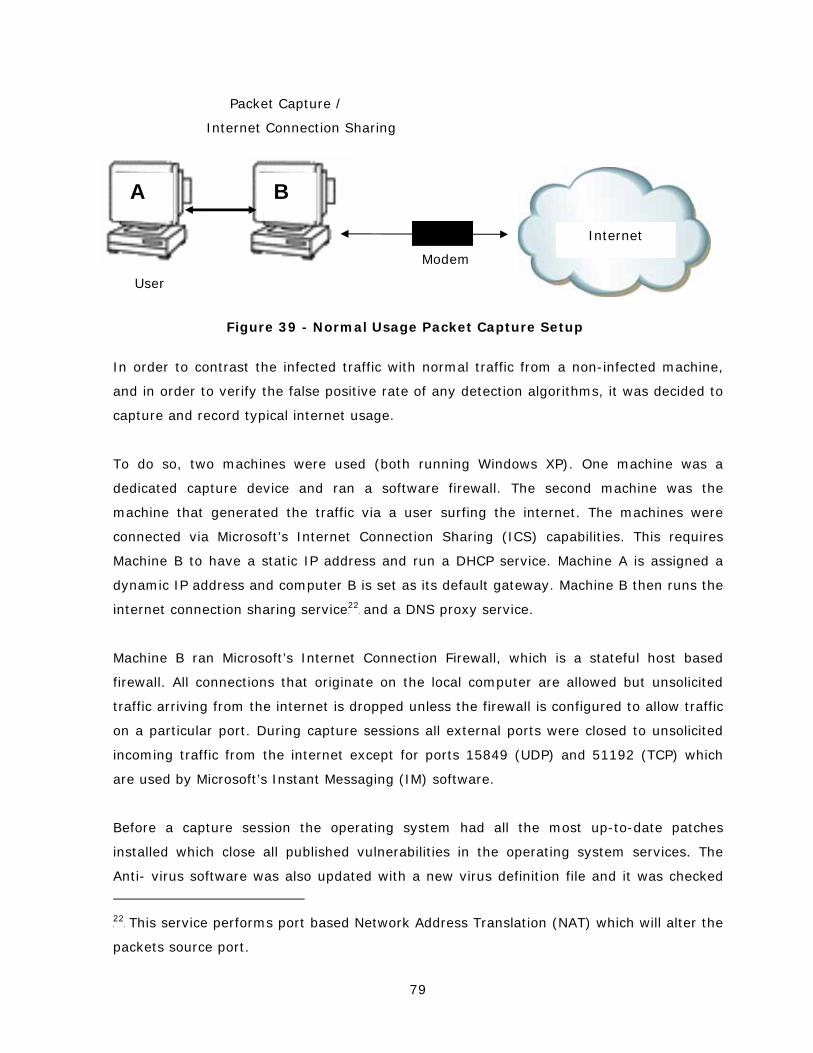
79
In order to contrast the infected traffic with normal traffic from a non-infected machine,
and in order to verify the false positive rate of any detection algorithms, it was decided to
capture and record typical internet usage.
To do so, two machines were used (both running Windows XP). One machine was a
dedicated capture device and ran a software firewall. The second machine was the
machine that generated the traffic via a user surfing the internet. The machines were
connected via Microsoft’s Internet Connection Sharing (ICS) capabilities. This requires
Machine B to have a static IP address and run a DHCP service. Machine A is assigned a
dynamic IP address and computer B is set as its default gateway. Machine B then runs the
internet connection sharing serviceTP
22PT and a DNS proxy service.
Machine B ran Microsoft’s Internet Connection Firewall, which is a stateful host based
firewall. All connections that originate on the local computer are allowed but unsolicited
traffic arriving from the internet is dropped unless the firewall is configured to allow traffic
on a particular port. During capture sessions all external ports were closed to unsolicited
incoming traffic from the internet except for ports 15849 (UDP) and 51192 (TCP) which
are used by Microsoft’s Instant Messaging (IM) software.
Before a capture session the operating system had all the most up-to-date patches
installed which close all published vulnerabilities in the operating system services. The
Anti- virus software was also updated with a new virus definition file and it was checked
TP
22PT This service performs port based Network Address Translation (NAT) which will alter the
packets source port.
Figure 39 - Normal Usage Packet Capture Setup
Modem
Internet
Packet Capture /
Internet Connection Sharing
User
A B
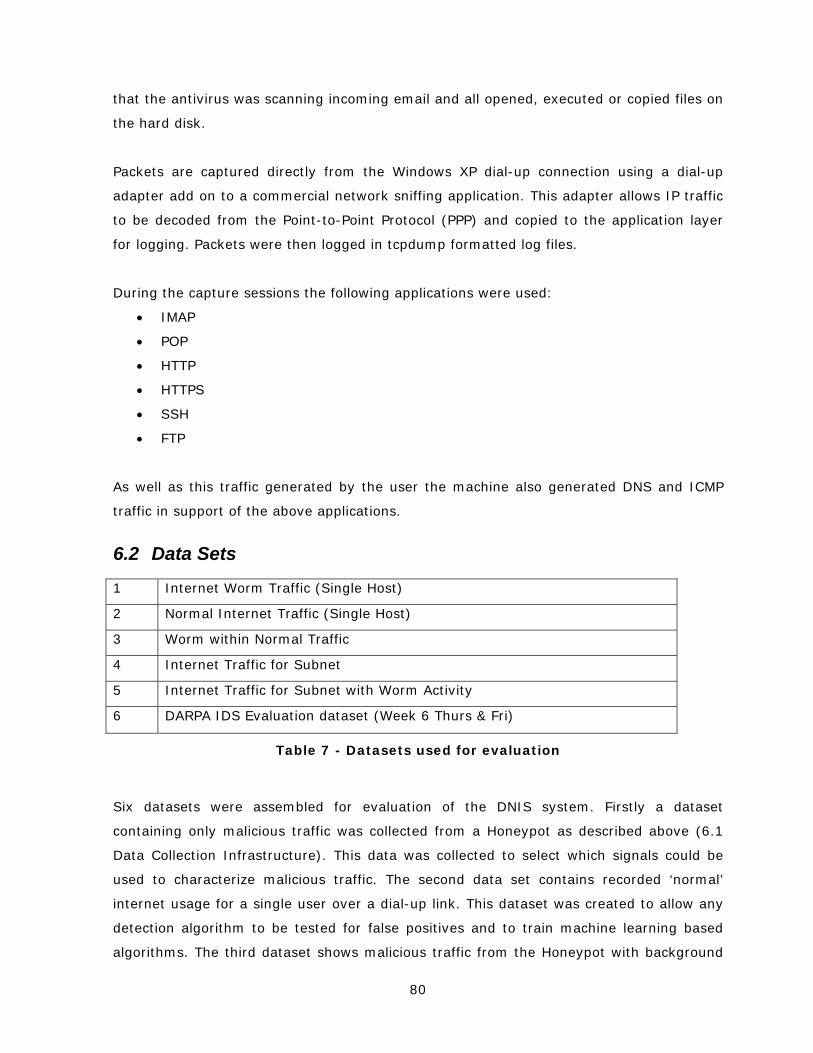
80
that the antivirus was scanning incoming email and all opened, executed or copied files on
the hard disk.
Packets are captured directly from the Windows XP dial-up connection using a dial-up
adapter add on to a commercial network sniffing application. This adapter allows IP traffic
to be decoded from the Point-to-Point Protocol (PPP) and copied to the application layer
for logging. Packets were then logged in tcpdump formatted log files.
During the capture sessions the following applications were used:
• IMAP
• POP
• HTTP
• HTTPS
• SSH
• FTP
As well as this traffic generated by the user the machine also generated DNS and ICMP
traffic in support of the above applications.
6.2 Data Sets
1 Internet Worm Traffic (Single Host)
2 Normal Internet Traffic (Single Host)
3 Worm within Normal Traffic
4 Internet Traffic for Subnet
5 Internet Traffic for Subnet with Worm Activity
6 DARPA IDS Evaluation dataset (Week 6 Thurs & Fri)
Table 7 - Datasets used for evaluation
Six datasets were assembled for evaluation of the DNIS system. Firstly a dataset
containing only malicious traffic was collected from a Honeypot as described above (6.1
Data Collection Infrastructure). This data was collected to select which signals could be
used to characterize malicious traffic. The second data set contains recorded ‘normal’
internet usage for a single user over a dial-up link. This dataset was created to allow any
detection algorithm to be tested for false positives and to train machine learning based
algorithms. The third dataset shows malicious traffic from the Honeypot with background
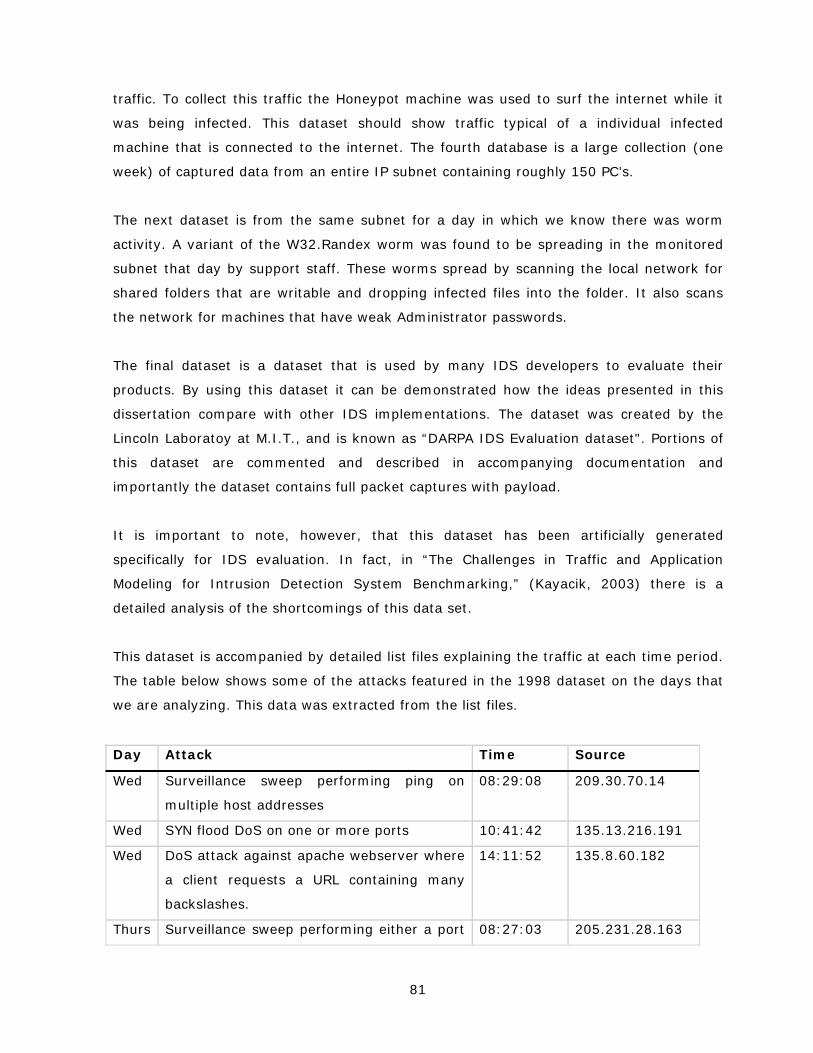
81
traffic. To collect this traffic the Honeypot machine was used to surf the internet while it
was being infected. This dataset should show traffic typical of a individual infected
machine that is connected to the internet. The fourth database is a large collection (one
week) of captured data from an entire IP subnet containing roughly 150 PC’s.
The next dataset is from the same subnet for a day in which we know there was worm
activity. A variant of the W32.Randex worm was found to be spreading in the monitored
subnet that day by support staff. These worms spread by scanning the local network for
shared folders that are writable and dropping infected files into the folder. It also scans
the network for machines that have weak Administrator passwords.
The final dataset is a dataset that is used by many IDS developers to evaluate their
products. By using this dataset it can be demonstrated how the ideas presented in this
dissertation compare with other IDS implementations. The dataset was created by the
Lincoln Laboratoy at M.I.T., and is known as “DARPA IDS Evaluation dataset". Portions of
this dataset are commented and described in accompanying documentation and
importantly the dataset contains full packet captures with payload.
It is important to note, however, that this dataset has been artificially generated
specifically for IDS evaluation. In fact, in “The Challenges in Traffic and Application
Modeling for Intrusion Detection System Benchmarking,” (Kayacik, 2003) there is a
detailed analysis of the shortcomings of this data set.
This dataset is accompanied by detailed list files explaining the traffic at each time period.
The table below shows some of the attacks featured in the 1998 dataset on the days that
we are analyzing. This data was extracted from the list files.
Day Attack Time Source
Wed Surveillance sweep performing ping on
multiple host addresses
08:29:08 209.30.70.14
Wed SYN flood DoS on one or more ports 10:41:42 135.13.216.191
Wed DoS attack against apache webserver where
a client requests a URL containing many
backslashes.
14:11:52 135.8.60.182
Thurs Surveillance sweep performing either a port 08:27:03 205.231.28.163
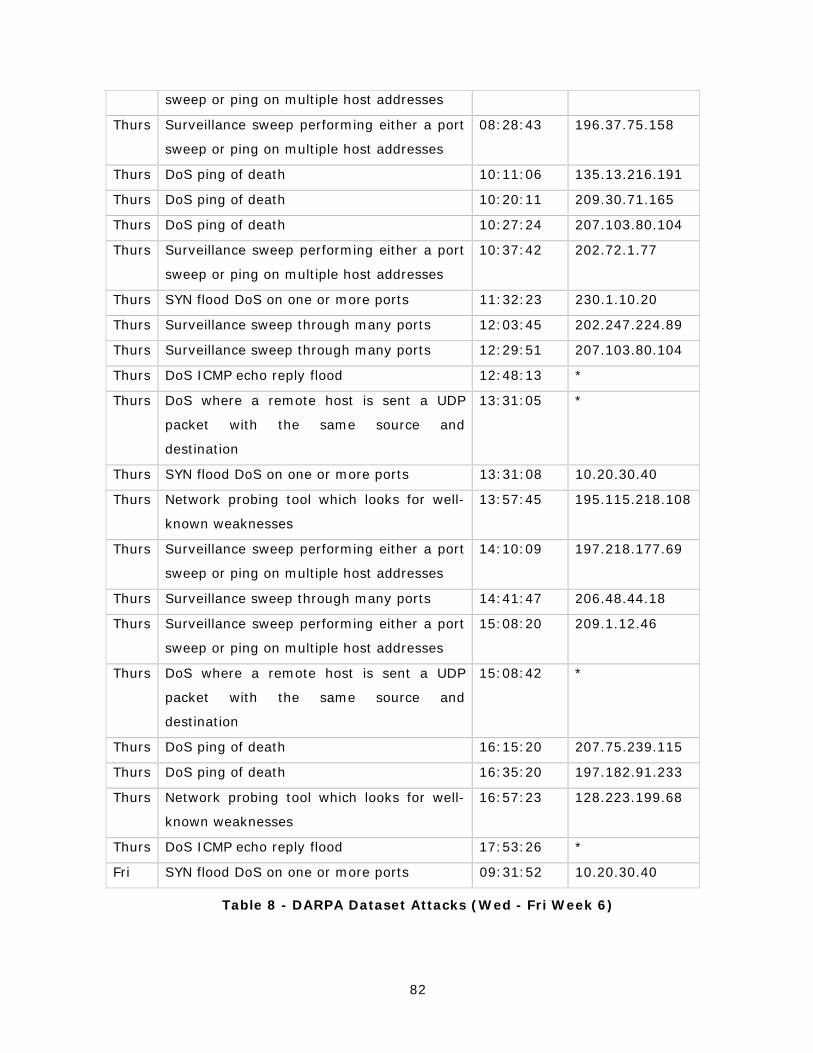
82
sweep or ping on multiple host addresses
Thurs Surveillance sweep performing either a port
sweep or ping on multiple host addresses
08:28:43 196.37.75.158
Thurs DoS ping of death 10:11:06 135.13.216.191
Thurs DoS ping of death 10:20:11 209.30.71.165
Thurs DoS ping of death 10:27:24 207.103.80.104
Thurs Surveillance sweep performing either a port
sweep or ping on multiple host addresses
10:37:42 202.72.1.77
Thurs SYN flood DoS on one or more ports 11:32:23 230.1.10.20
Thurs Surveillance sweep through many ports 12:03:45 202.247.224.89
Thurs Surveillance sweep through many ports 12:29:51 207.103.80.104
Thurs DoS ICMP echo reply flood 12:48:13 *
Thurs DoS where a remote host is sent a UDP
packet with the same source and
destination
13:31:05 *
Thurs SYN flood DoS on one or more ports 13:31:08 10.20.30.40
Thurs Network probing tool which looks for well-
known weaknesses
13:57:45 195.115.218.108
Thurs Surveillance sweep performing either a port
sweep or ping on multiple host addresses
14:10:09 197.218.177.69
Thurs Surveillance sweep through many ports 14:41:47 206.48.44.18
Thurs Surveillance sweep performing either a port
sweep or ping on multiple host addresses
15:08:20 209.1.12.46
Thurs DoS where a remote host is sent a UDP
packet with the same source and
destination
15:08:42 *
Thurs DoS ping of death 16:15:20 207.75.239.115
Thurs DoS ping of death 16:35:20 197.182.91.233
Thurs Network probing tool which looks for well-
known weaknesses
16:57:23 128.223.199.68
Thurs DoS ICMP echo reply flood 17:53:26 *
Fri SYN flood DoS on one or more ports 09:31:52 10.20.30.40
Table 8 - DARPA Dataset Attacks (Wed - Fri Week 6)
83
7 Evaluation
7.1 Introduction
In order to introduce this section, the key features of DNIS will be presented according to
a taxonomy of IDS system characteristics presented in “Intrusion Detection Systems: A
Survey and Taxonomy” (Axelsson, 2000). This will allow the reader to make comparisons
between characteristics of this framework and other IDS systems. The reader is
encouraged to look at the classification of surveyed systems presented in this paper as it
gives a quick state of the art of the area and shows clearly where DNIS fits in. For the
readers convenience this table has been reproduced in the appendix (10.1 Classification of
IDS Systems).
Time of Detection: DNIS is a near real-time detection system. DNIS can however also be
run offline on historical audit data.
Granularity of Data-Processing: DNIS processes data continuously and does not
require processing in batches. Some of the analysis components do however use a sliding
window algorithm to detect changes. This window is configurable in size and can move
continuously as new data arrives resulting in a minimal effect on the time of detection.
Source of Audit Data: The main source of audit data is network traffic but DNIS’s
configurable event source allows alternative event sources to be used at different sensors
allowing kernel, application or network equipment logs to be used.
Response to Detected Intrusions: DNIS does not have any active response to detected
intrusions. This is to prevent DNIS being used to facilitate DoS attacks by causing
incorrect termination of traffic flows. Research into an appropriate response is left as
further work (8.9 Future Research).
Locus of Data Processing: Data processing happens in a distributed fashion.
Locus of Data Collection: Data collection is also distributed.
Security: Unlike any of the systems surveyed in the paper (Axelsson, 2000), DNIS does
make some provision for security. However, the security in DNIS could not be considered
high as it uses simple, symmetric cryptography that could be easily compromised.
Degree of inter-operability: DNIS can receive events from other event sources or even
include another IDS system as an instrumentation component in a sensor, giving DNIS a
high degree of inter-operability.

84
The following sections will provide an evaluation and results, where appropriate, for the
DNIS framework itself and some of the components implemented for this framework. The
worm detection component, as the main aim of this work, is given its own chapter (8
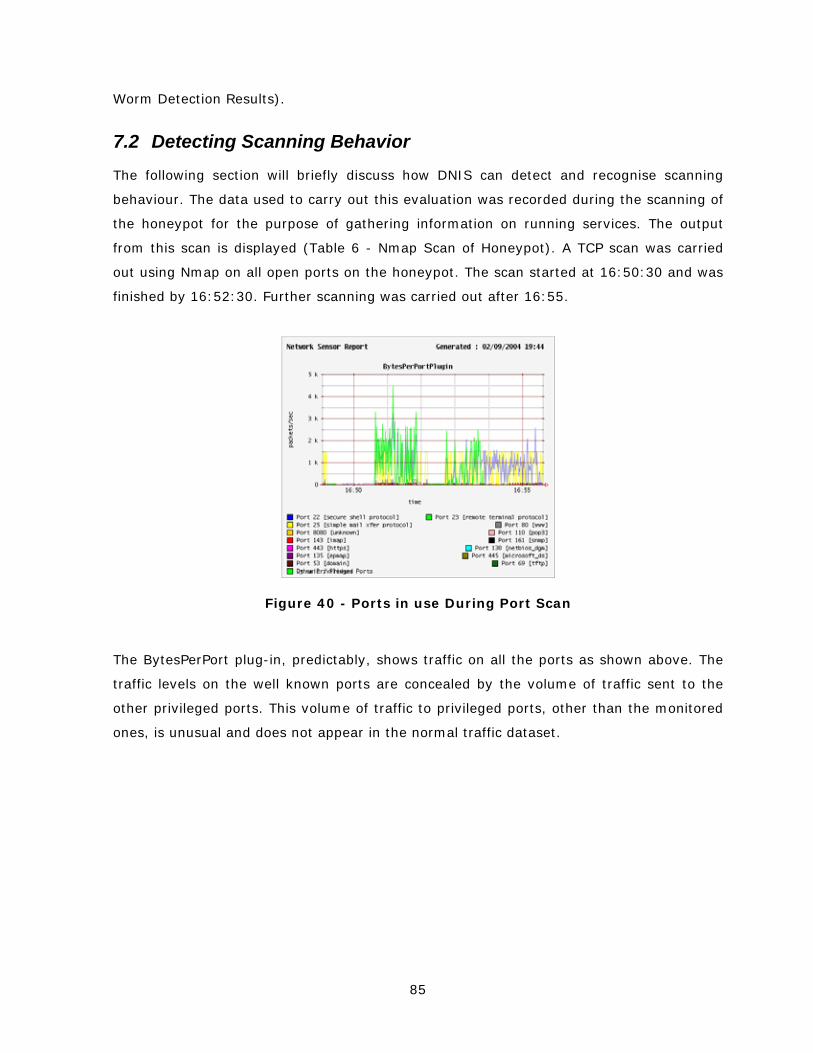
85
Worm Detection Results).
7.2 Detecting Scanning Behavior
The following section will briefly discuss how DNIS can detect and recognise scanning
behaviour. The data used to carry out this evaluation was recorded during the scanning of
the honeypot for the purpose of gathering information on running services. The output
from this scan is displayed (Table 6 - Nmap Scan of Honeypot). A TCP scan was carried
out using Nmap on all open ports on the honeypot. The scan started at 16:50:30 and was
finished by 16:52:30. Further scanning was carried out after 16:55.
Figure 40 - Ports in use During Port Scan
The BytesPerPort plug-in, predictably, shows traffic on all the ports as shown above. The
traffic levels on the well known ports are concealed by the volume of traffic sent to the
other privileged ports. This volume of traffic to privileged ports, other than the monitored
ones, is unusual and does not appear in the normal traffic dataset.
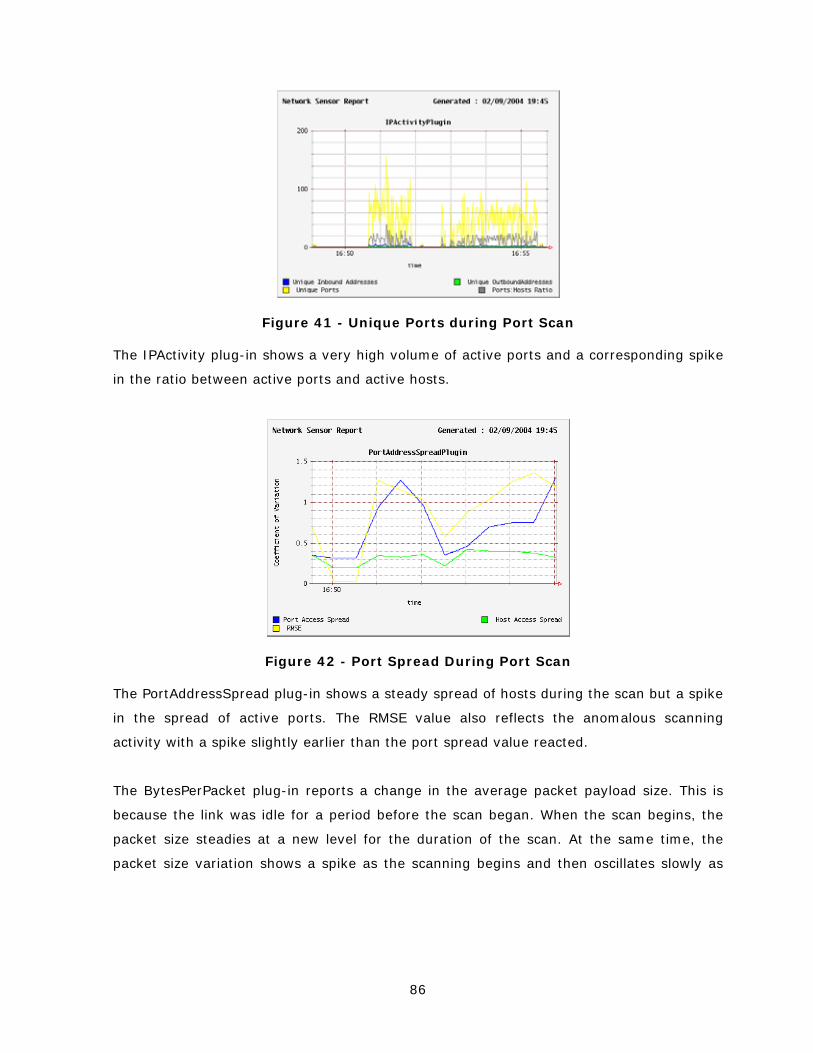
86
Figure 41 - Unique Ports during Port Scan
The IPActivity plug-in shows a very high volume of active ports and a corresponding spike
in the ratio between active ports and active hosts.
Figure 42 - Port Spread During Port Scan
The PortAddressSpread plug-in shows a steady spread of hosts during the scan but a spike
in the spread of active ports. The RMSE value also reflects the anomalous scanning
activity with a spike slightly earlier than the port spread value reacted.
The BytesPerPacket plug-in reports a change in the average packet payload size. This is
because the link was idle for a period before the scan began. When the scan begins, the
packet size steadies at a new level for the duration of the scan. At the same time, the
packet size variation shows a spike as the scanning begins and then oscillates slowly as
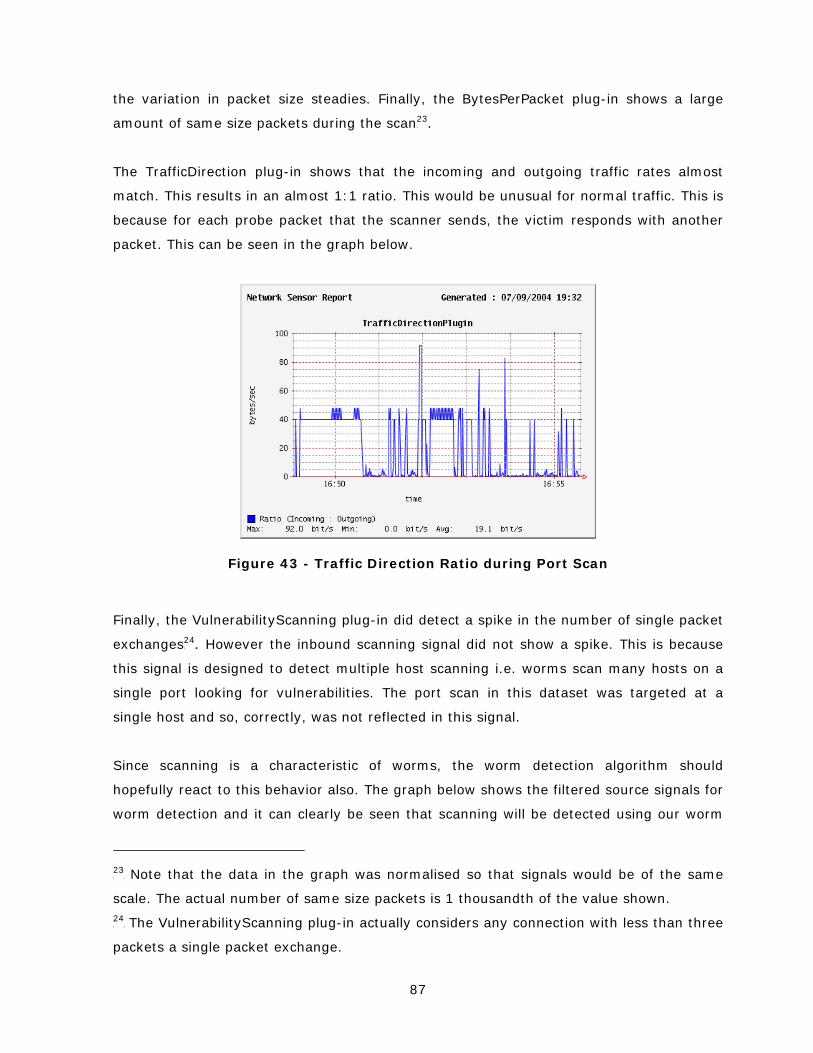
87
the variation in packet size steadies. Finally, the BytesPerPacket plug-in shows a large
amount of same size packets during the scanTP
23PT.
The TrafficDirection plug-in shows that the incoming and outgoing traffic rates almost
match. This results in an almost 1:1 ratio. This would be unusual for normal traffic. This is
because for each probe packet that the scanner sends, the victim responds with another
packet. This can be seen in the graph below.
Figure 43 - Traffic Direction Ratio during Port Scan
Finally, the VulnerabilityScanning plug-in did detect a spike in the number of single packet
exchangesTP
24PT. However the inbound scanning signal did not show a spike. This is because
this signal is designed to detect multiple host scanning i.e. worms scan many hosts on a
single port looking for vulnerabilities. The port scan in this dataset was targeted at a
single host and so, correctly, was not reflected in this signal.
Since scanning is a characteristic of worms, the worm detection algorithm should
hopefully react to this behavior also. The graph below shows the filtered source signals for
worm detection and it can clearly be seen that scanning will be detected using our worm
TP
23PT Note that the data in the graph was normalised so that signals would be of the same
scale. The actual number of same size packets is 1 thousandth of the value shown.
TP
24PT The VulnerabilityScanning plug-in actually considers any connection with less than three
packets a single packet exchange.
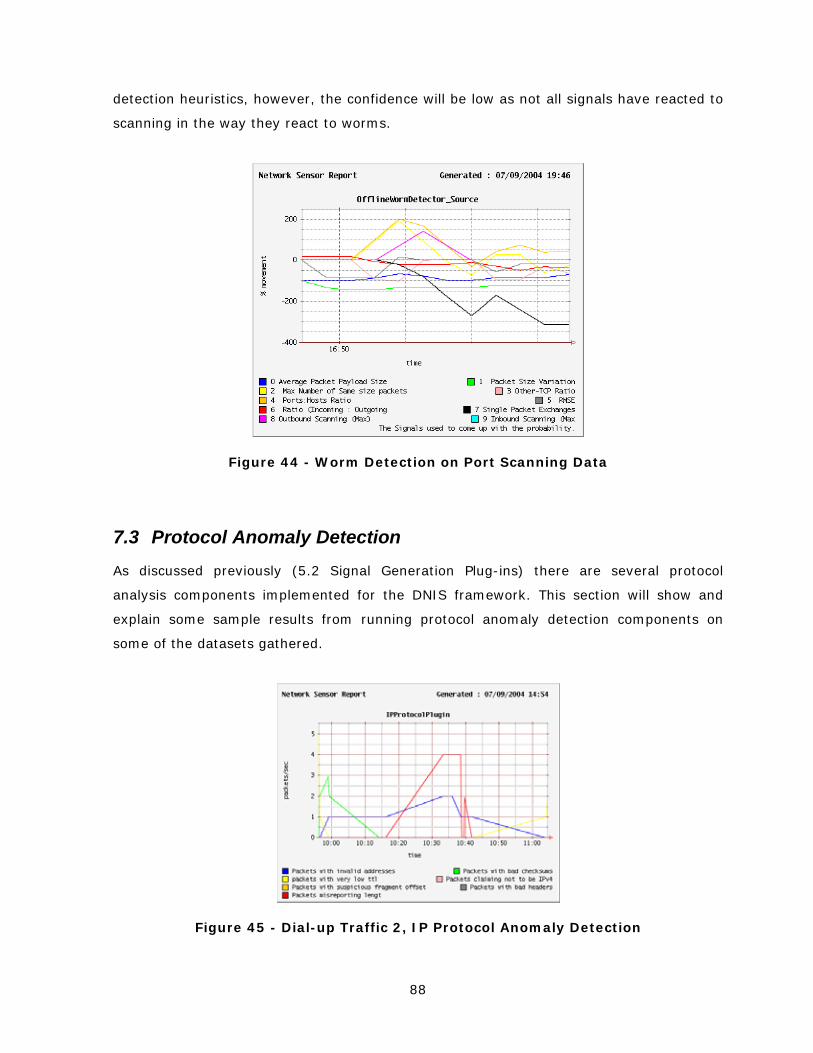
88
detection heuristics, however, the confidence will be low as not all signals have reacted to
scanning in the way they react to worms.
Figure 44 - Worm Detection on Port Scanning Data
7.3 Protocol Anomaly Detection
As discussed previously (5.2 Signal Generation Plug-ins) there are several protocol
analysis components implemented for the DNIS framework. This section will show and
explain some sample results from running protocol anomaly detection components on
some of the datasets gathered.
Figure 45 - Dial-up Traffic 2, IP Protocol Anomaly Detection
89
The Y axis on the graph above shows the number of packets per second. The graph shows
a spike of around 5 packets per second just before 1000hrs. Looking at the key it can be
seen that the anomaly was packets with a very low (< 5) TTL. This may indicate the use
of a program (such as traceroute) that modifies the TTL of packets to discover the
distance (in hops) to a particular host address. The graph also shows a steady number of
packets with invalid addresses. This means that one of the addresses in the IP packet
appears incorrect. Analysing the packets in the trace file it was found that there were
packets with the source and destination address on the same subnet. This is part of the
anomaly detection code, because the IP protocol anomaly detector component was written
with the ability to run on a gateway router in mind. In this case it might indicate packets
with spoofed addresses arriving that are pretending to come from your own address
space. In this particular instance the packets were TCP SYN packets arriving at port 445
(microsoft-ds). This port hosts the Server Message Block protocol that allows files and
printers to be shared across networks. This service is also the source of a number of
vulnerabilities. It is not known for what reason these packets would continue to arrive at a
steady rate without ever setting-up a connection but it may be part of a packet flooding
attack.
Other reasons for a packet to be marked as having an invalid IP address could include:
• The source and destination address are the same
• The packets source is 255.255.255.255
• The top byte of the packets source or destination address is 223 or 127, indicating
address ranges that are not globally routable.
• The source or destination is an address that is reserved and should not be routed
i.e. 10.0.0.0 through 10.255.255.255, 172.16.0.0 through 172.31.0.0,
192.168.0.0 through 192.168.255.255
Interestingly the packets reporting the incorrect length also increased at the same time.
Further analysis showed that it was not the same packets the misreported their length, as
showed invalid addresses, indicating this to be a coincidence. A very small number of
packets also had bad checksums. This was determined by recalculating the checksum of
the packet and comparing it to the checksum stored in the packet. The extremely low rate
of protocol anomalies should be noted. The dataset contains 18,572 packets of which only
59 contained anomalies (0.32% of the total traffic).
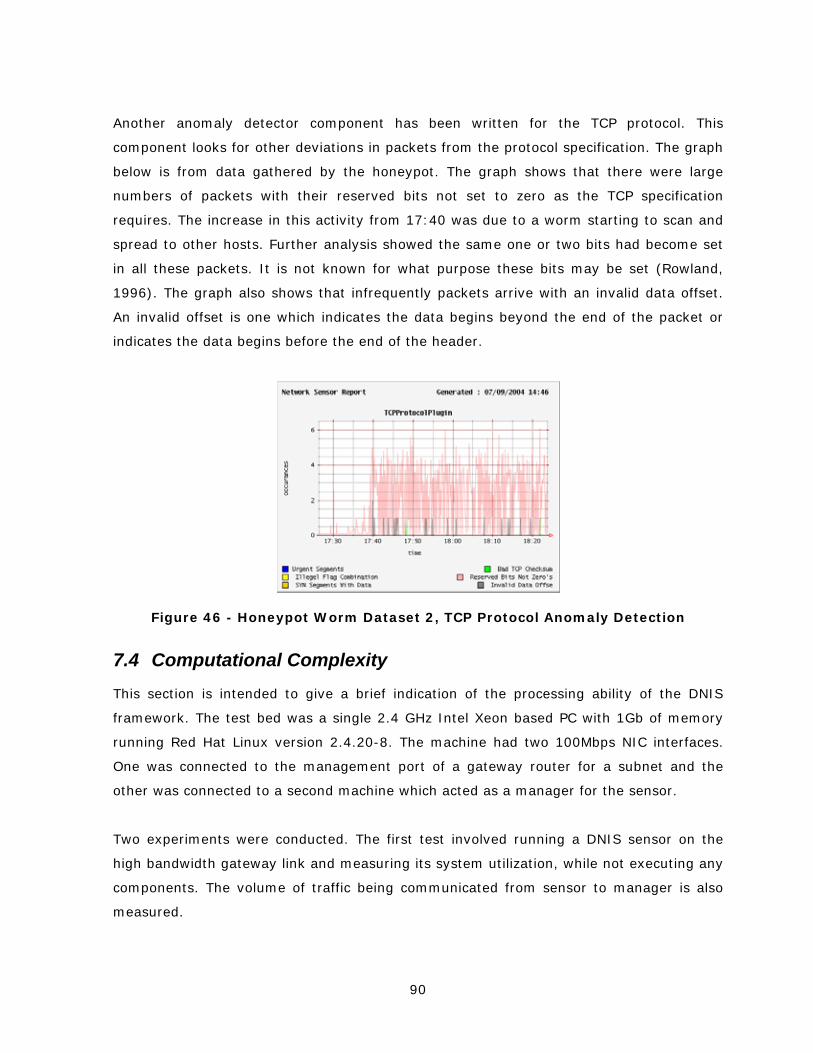
90
Another anomaly detector component has been written for the TCP protocol. This
component looks for other deviations in packets from the protocol specification. The graph
below is from data gathered by the honeypot. The graph shows that there were large
numbers of packets with their reserved bits not set to zero as the TCP specification
requires. The increase in this activity from 17:40 was due to a worm starting to scan and
spread to other hosts. Further analysis showed the same one or two bits had become set
in all these packets. It is not known for what purpose these bits may be set (Rowland,
1996). The graph also shows that infrequently packets arrive with an invalid data offset.
An invalid offset is one which indicates the data begins beyond the end of the packet or
indicates the data begins before the end of the header.
Figure 46 - Honeypot Worm Dataset 2, TCP Protocol Anomaly Detection
7.4 Computational Complexity
This section is intended to give a brief indication of the processing ability of the DNIS
framework. The test bed was a single 2.4 GHz Intel Xeon based PC with 1Gb of memory
running Red Hat Linux version 2.4.20-8. The machine had two 100Mbps NIC interfaces.
One was connected to the management port of a gateway router for a subnet and the
other was connected to a second machine which acted as a manager for the sensor.
Two experiments were conducted. The first test involved running a DNIS sensor on the
high bandwidth gateway link and measuring its system utilization, while not executing any
components. The volume of traffic being communicated from sensor to manager is also
measured.

91
The sensor was measured for 10 minutes and it was found that it was processing 530
packets per second with an average throughput of 62Kbps. No packets were dropped by
the kernel. During this time the CPU usage never rose above 0.4%. The manager
continued to poll the sensor every five seconds. Port 1300 was used for this
communication. Upon isolating this traffic from the capture it was found that each request
by the manager for the sensors status was a TCP conversation in which the manager sent
a 95 byte request and the sensor replied with a 237 byte status message. This gives an
overall communication overhead of 0.07Mbps per sensor. The throughput for the sensor
for the same period was 49.1Mbps.
A similar experiment was run but this time the sensor was running two signal generation
components that were generating and outputting data to the machines disk. The following
results were found.
Again the experiment was run for ten minutes over which the sensor processed an
average of 411 packets per second, with an average throughput of 57Kbps. No packets
were dropped by the kernel. CPU usage averaged at 0.8%. The buffers between the event
source (sniffer) and components were set to 25Mb and remained between 70% and 80%
full. The components were set to output signal information every 5 seconds and wrote a
total of 8,278bytes to disk between them. The communication statistics between the
sensor and manager remained the same and so will not be included again. The only
change was a slight increase in the size of the status message sent back to the manager.
These results show that the sensor itself has little or no effect on the network because of
it’s maximum polling interval of five seconds and small status messages. It also
demonstrates the sensors ability to run multiple independent components without having
a major effect on the speed of the sensor at processing the incoming data.
7.5 Pattern Matching for Signature Generation
The Honeycomb paper (Kreibich & Crowcroft, 2004) proposed the automatic generation of
worm signatures using simple pattern matching. In the paper their evaluation
demonstrates successfully captured signatures for two well known worms.
The evaluation in that paper was weak because it was only tested on a dial-up connection.
It was also suggested, that there may be problems with large numbers of false signatures
92
being generated. For this reason it was decided to implement the techniques described by
the Honeycomb system as a DNIS component and see if their results could be reproduced.
The Honeycomb system as previously described (3.5.4 Honeycomb) is a string based
pattern detection algorithm, layered upon a honeypot that performs TCP stream
reassembly. The same TCP stream reassembly algorithms have already been implemented
in DNIS so it was only a minor effort to implement the detection algorithm described by
Honeycomb.
Honeycomb performs protocol analysis on incoming data. This functionality was not
implemented as DNIS already has components to perform protocol analysis. Secondly,
Honeycomb performs pattern detection in the flow content. DNIS uses a TCP Stream
Reassembly component to reconstruct flows. Flows are represented as a linked list of
messages, each message containing a number of TCP segments and each message having
a direction.
To perform the detection Honeycomb scans the flows in two directions performing the
Longest Common Substring (LCS) string matching algorithm. The two detection methods
were Horizontal Detection and Vertical Detection. The detection methods refer to the way
the flows are traversed. Horizontal Detection is when the nP
thP messages in all connections
are compared. In contrast Vertical detection compares the messages within each
connection.
In order to try and reproduce the results of Honeycomb their algorithms were applied to
the collection of datasets gathered for this work. Each of the datasets showed similar
results and so only one will be presented here. The dataset with honeypot malicious traffic
and background traffic from a user (Table 7 - Datasets used for evaluation) was used to
perform pattern matching on using the payload pattern matching component for DNIS.
This dataset consists of a mass mailing worm and normal background internet usage
(mostly HTTP). This dataset was chosen for illustrative purposes because it is short and
contains a lot of TCP connections.
The dataset contains the W32.NetSky.B worm. There are 28 individual occurrences of that
worm opening a SMTP session with a remote mail exchanger and attempting to deliver a
copy of itself to an email address found on the infected host. The dataset contained
26,510 packets totaling 11,389,91 bytes. 98.57% of the traffic was TCP traffic of which
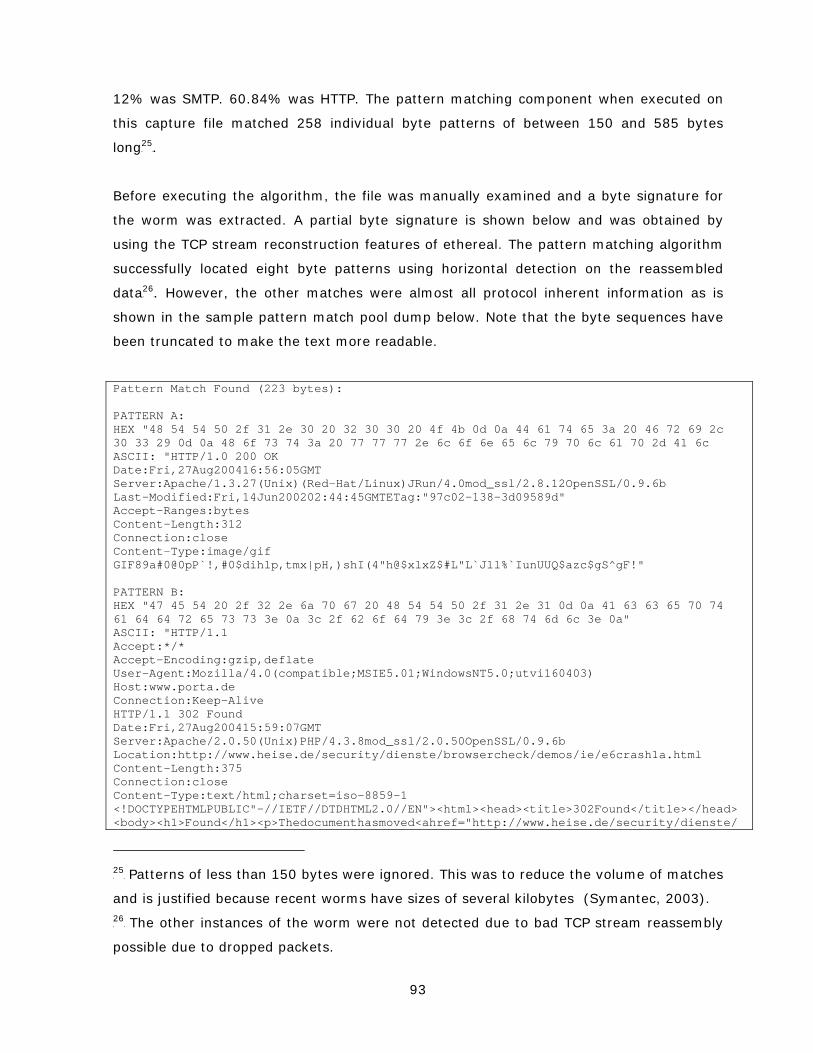
93
12% was SMTP. 60.84% was HTTP. The pattern matching component when executed on
this capture file matched 258 individual byte patterns of between 150 and 585 bytes
long TP
25PT.
Before executing the algorithm, the file was manually examined and a byte signature for
the worm was extracted. A partial byte signature is shown below and was obtained by
using the TCP stream reconstruction features of ethereal. The pattern matching algorithm
successfully located eight byte patterns using horizontal detection on the reassembled
dataTP
26PT. However, the other matches were almost all protocol inherent information as is
shown in the sample pattern match pool dump below. Note that the byte sequences have
been truncated to make the text more readable.
Pattern Match Found (223 bytes): PATTERN A: HEX "48 54 54 50 2f 31 2e 30 20 32 30 30 20 4f 4b 0d 0a 44 61 74 65 3a 20 46 72 69 2c 30 33 29 0d 0a 48 6f 73 74 3a 20 77 77 77 2e 6c 6f 6e 65 6c 79 70 6c 61 70 2d 41 6c ASCII: "HTTP/1.0 200 OK Date:Fri,27Aug200416:56:05GMT Server:Apache/1.3.27(Unix)(Red-Hat/Linux)JRun/4.0mod_ssl/2.8.12OpenSSL/0.9.6b Last-Modified:Fri,14Jun200202:44:45GMTETag:"97c02-138-3d09589d" Accept-Ranges:bytes Content-Length:312 Connection:close Content-Type:image/gif GIF89a#0@0pP`!,#0$dihlp,tmx|pH,)shI(4"h@$xlxZ$#L"L`Jll%`IunUUQ$azc$gS^gF!" PATTERN B: HEX "47 45 54 20 2f 32 2e 6a 70 67 20 48 54 54 50 2f 31 2e 31 0d 0a 41 63 63 65 70 74 61 64 64 72 65 73 73 3e 0a 3c 2f 62 6f 64 79 3e 3c 2f 68 74 6d 6c 3e 0a" ASCII: "HTTP/1.1 Accept:*/* Accept-Encoding:gzip,deflate User-Agent:Mozilla/4.0(compatible;MSIE5.01;WindowsNT5.0;utvi160403) Host:www.porta.de Connection:Keep-Alive HTTP/1.1 302 Found Date:Fri,27Aug200415:59:07GMT Server:Apache/2.0.50(Unix)PHP/4.3.8mod_ssl/2.0.50OpenSSL/0.9.6b Location:http://www.heise.de/security/dienste/browsercheck/demos/ie/e6crash1a.html Content-Length:375 Connection:close Content-Type:text/html;charset=iso-8859-1 <!DOCTYPEHTMLPUBLIC"-//IETF//DTDHTML2.0//EN"><html><head><title>302Found</title></head> <body><h1>Found</h1><p>Thedocumenthasmoved<ahref="http://www.heise.de/security/dienste/
TP
25PT Patterns of less than 150 bytes were ignored. This was to reduce the volume of matches
and is justified because recent worms have sizes of several kilobytes (Symantec, 2003).
TP
26PT The other instances of the worm were not detected due to bad TCP stream reassembly
possible due to dropped packets.
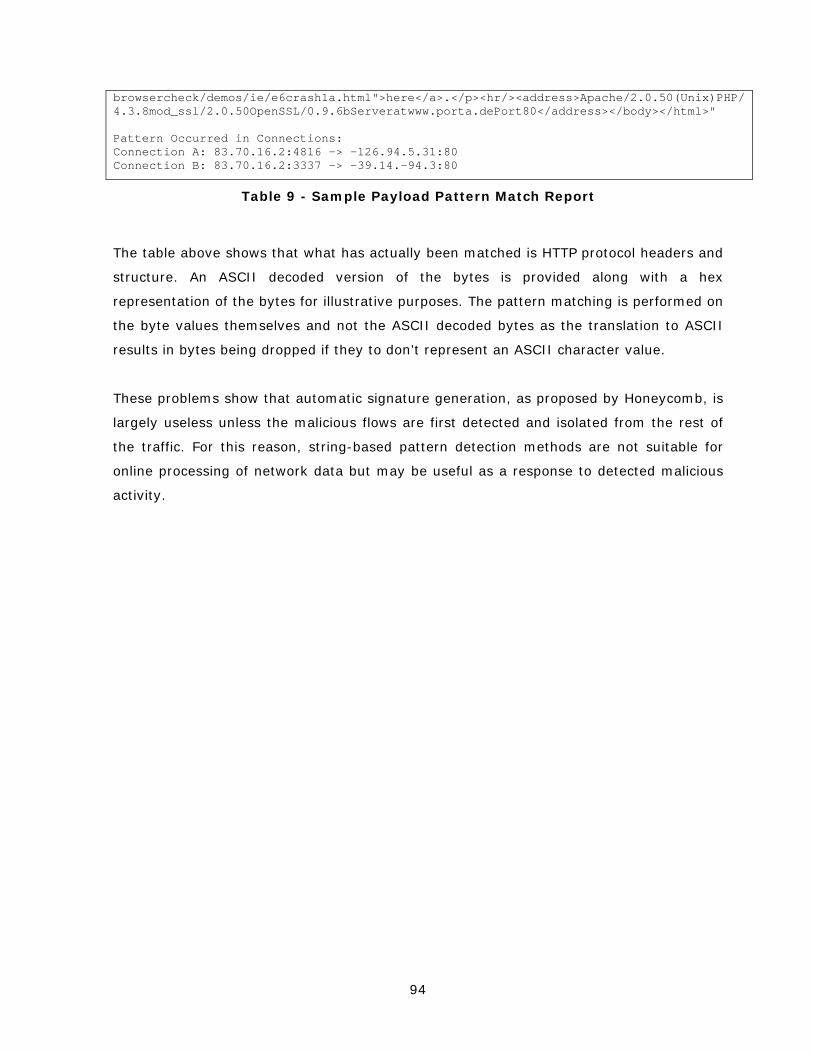
94
browsercheck/demos/ie/e6crash1a.html">here</a>.</p><hr/><address>Apache/2.0.50(Unix)PHP/4.3.8mod_ssl/2.0.50OpenSSL/0.9.6bServeratwww.porta.dePort80</address></body></html>" Pattern Occurred in Connections: Connection A: 83.70.16.2:4816 -> -126.94.5.31:80 Connection B: 83.70.16.2:3337 -> -39.14.-94.3:80
Table 9 - Sample Payload Pattern Match Report
The table above shows that what has actually been matched is HTTP protocol headers and
structure. An ASCII decoded version of the bytes is provided along with a hex
representation of the bytes for illustrative purposes. The pattern matching is performed on
the byte values themselves and not the ASCII decoded bytes as the translation to ASCII
results in bytes being dropped if they to don’t represent an ASCII character value.
These problems show that automatic signature generation, as proposed by Honeycomb, is
largely useless unless the malicious flows are first detected and isolated from the rest of
the traffic. For this reason, string-based pattern detection methods are not suitable for
online processing of network data but may be useful as a response to detected malicious
activity.

95
8 Worm Detection Results
8.1 Introduction
This chapter will present the results of applying the worm detection algorithm described in
(5.4 Worm Detection Component) to the datasets presented in (6.2 Data Sets). Analysis
of the final two datasets that were collected from a subnet in Trinity College was not
completed because of the difficulty in determining if there was malicious activity present.
This dataset is still available and the analysis of it is left as further work. This chapter will
end with a summary of its findings.
8.1.1 Signal Effectiveness Weighting
The worm detection algorithm works by deciding if certain signals are changing as they
would if a worm attacked. In order to allow worm detection to work on any sensor the
signals that were chosen were not specific to any network location.
For example, one of the signals used was the ratio of incoming to outgoing traffic. On a
gateway router this signal will normally have a relatively steady value but if the same
signal is generated from a dial-up connection the signal will vary so wildly as to be
virtually impossible to extract any meaningful information. Similarly the signals that are
based on spread are effected by the fact that one end of the connection is a single host
rather than both ends having multiple hosts.
To take this into account and improve accuracy on both dial-up and backbone links, it was
decided that the signal inputs should be weighted before the probability of a worm being
present is calculated. The weights for dial-up links were chosen by based on experience
with the honeypot datasets. The signals that reacted most to worm activity in these
datasets were weighted heavier than the others. The weights for gateway router links
were calculated in a similar fashion using the DARPA 1998 dataset.
Signal 1 2 3 4 5 6 7 8 9 10
Gateway Router 1.3 1.1 0.7 1.2 0.6 0.8 1.0 1.0 1.0 1.3
Dial-up Link 1.3 0.9 0.7 1.2 0.7 0.7 1.0 1.0 1.2 1.3
Table 10 - Signal Effectiveness Weights
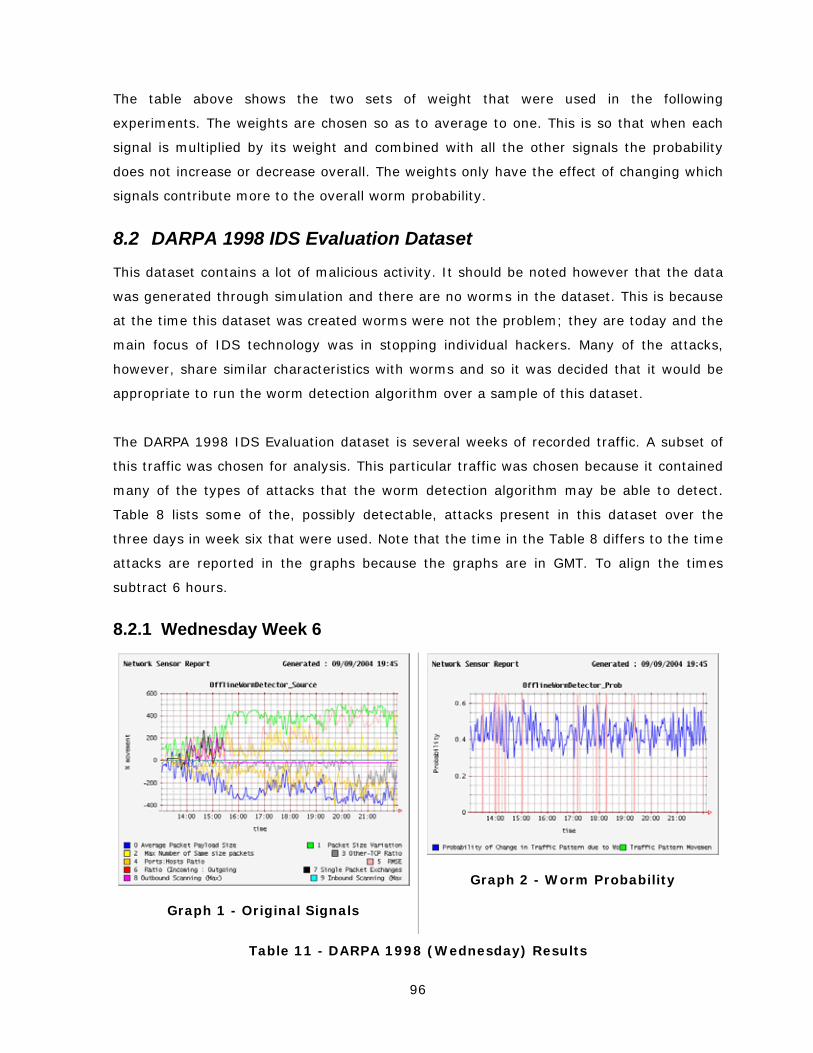
96
The table above shows the two sets of weight that were used in the following
experiments. The weights are chosen so as to average to one. This is so that when each
signal is multiplied by its weight and combined with all the other signals the probability
does not increase or decrease overall. The weights only have the effect of changing which
signals contribute more to the overall worm probability.
8.2 DARPA 1998 IDS Evaluation Dataset
This dataset contains a lot of malicious activity. It should be noted however that the data
was generated through simulation and there are no worms in the dataset. This is because
at the time this dataset was created worms were not the problem; they are today and the
main focus of IDS technology was in stopping individual hackers. Many of the attacks,
however, share similar characteristics with worms and so it was decided that it would be
appropriate to run the worm detection algorithm over a sample of this dataset.
The DARPA 1998 IDS Evaluation dataset is several weeks of recorded traffic. A subset of
this traffic was chosen for analysis. This particular traffic was chosen because it contained
many of the types of attacks that the worm detection algorithm may be able to detect.
Table 8 lists some of the, possibly detectable, attacks present in this dataset over the
three days in week six that were used. Note that the time in the Table 8 differs to the time
attacks are reported in the graphs because the graphs are in GMT. To align the times
subtract 6 hours.
8.2.1 Wednesday Week 6
Graph 1 - Original Signals
Graph 2 - Worm Probability
Table 11 - DARPA 1998 (Wednesday) Results
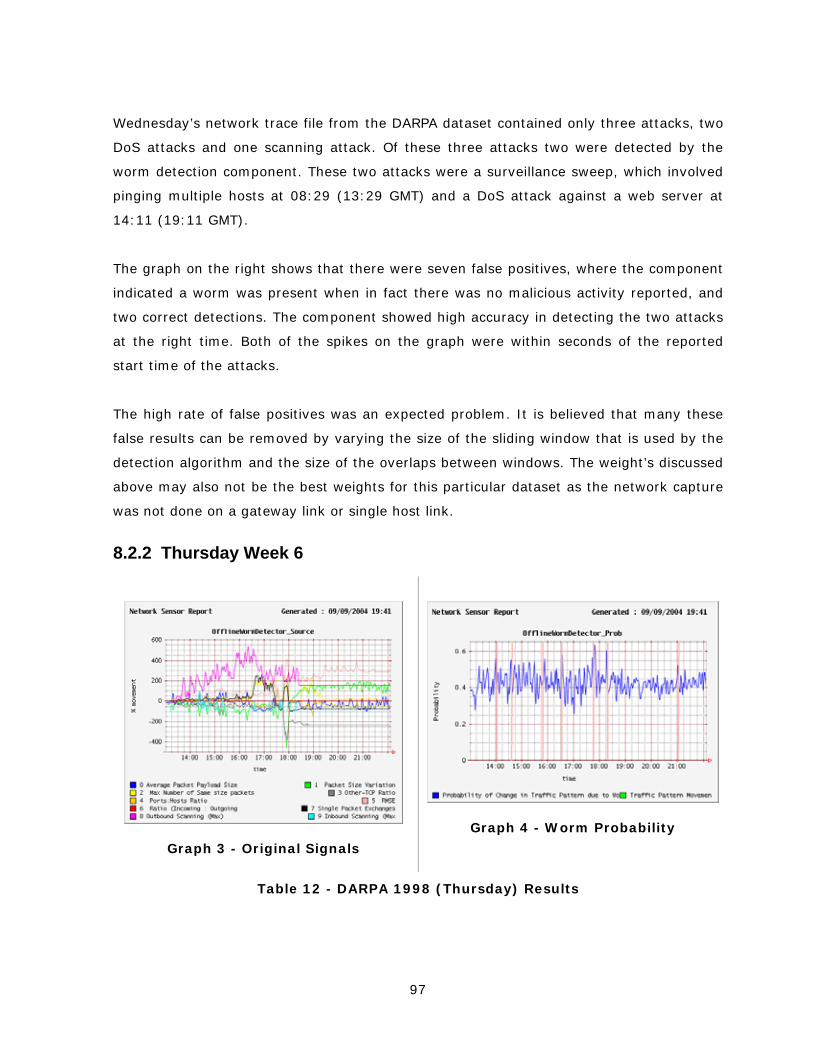
97
Wednesday’s network trace file from the DARPA dataset contained only three attacks, two
DoS attacks and one scanning attack. Of these three attacks two were detected by the
worm detection component. These two attacks were a surveillance sweep, which involved
pinging multiple hosts at 08:29 (13:29 GMT) and a DoS attack against a web server at
14:11 (19:11 GMT).
The graph on the right shows that there were seven false positives, where the component
indicated a worm was present when in fact there was no malicious activity reported, and
two correct detections. The component showed high accuracy in detecting the two attacks
at the right time. Both of the spikes on the graph were within seconds of the reported
start time of the attacks.
The high rate of false positives was an expected problem. It is believed that many these
false results can be removed by varying the size of the sliding window that is used by the
detection algorithm and the size of the overlaps between windows. The weight’s discussed
above may also not be the best weights for this particular dataset as the network capture
was not done on a gateway link or single host link.
8.2.2 Thursday Week 6
Graph 3 - Original Signals
Graph 4 - Worm Probability
Table 12 - DARPA 1998 (Thursday) Results

98
Out of the three days, Thursday had the most malicious activity. A significant proportion
of that activity was surveillance sweeps and DoS activity. From examining the output from
the several signal generation components, it can immediately be seen that there are
several times during the day at which a number of the signals change suddenly. The
detection probability graph on the right reflects these changes by indicating malicious
activity at the same time as a number of these fluctuations.
Comparing our analysis of this part of the dataset with the published material, it was
found that six different attacks have been correctly identified within a minute of their
reported initiation. This is 28% of all the detectable attacks for that day. Further
encouragement is gained from the fact that there were only two false positives. Both of
these were at the beginning of the dataset and so could be attributed to a settling down
period that is a feature of some of the source signals.
The attacks detected were a surveillance sweep at 10:37 (16:37 GMT), a SYN flood at
11:32 (17:32 GMT), surveillance sweep at 12:29 (18:29 GMT), ICMP echo reply flood at
12:48 (18:48 GMT), UDP DoS at 13:31 (19:31 GMT) and finally an ICMP ping DoS attack
at 16:15 (22:15 GMT). All these attacks are either flooding attacks or scanning attacks.
The worm detection algorithm detects these attacks because it has been written to detect
scanning behavior that shows up in the signals almost identical to port sweeps and
network probing. Similarly, flooding a particular host with traffic, triggers the worm
detection algorithm because of the change in the spread of hosts and ports that are
receiving the most traffic. Also the signals based on packet size will react due to large
numbers of similar, if not identical packets on the network.
It is worth noting that many of the attacks that were not detected do actually have a
corresponding spike on the graph. This may not be apparent in the day long graph shown
above but in the hourly breakdown of this same data it can clearly be seen. They were not
marked with a line because the spike was not above the surrounding probabilities. This
does show that the attacks are reflected in the graphs but there is need for further
refinement to remove some of the noise.
It is also interesting that none of the attacks were worms and yet the algorithm was able
to detect them. This suggests that this type of analysis could be applied to the more
general problem of detecting a wider range of unusual changes in traffic patterns.
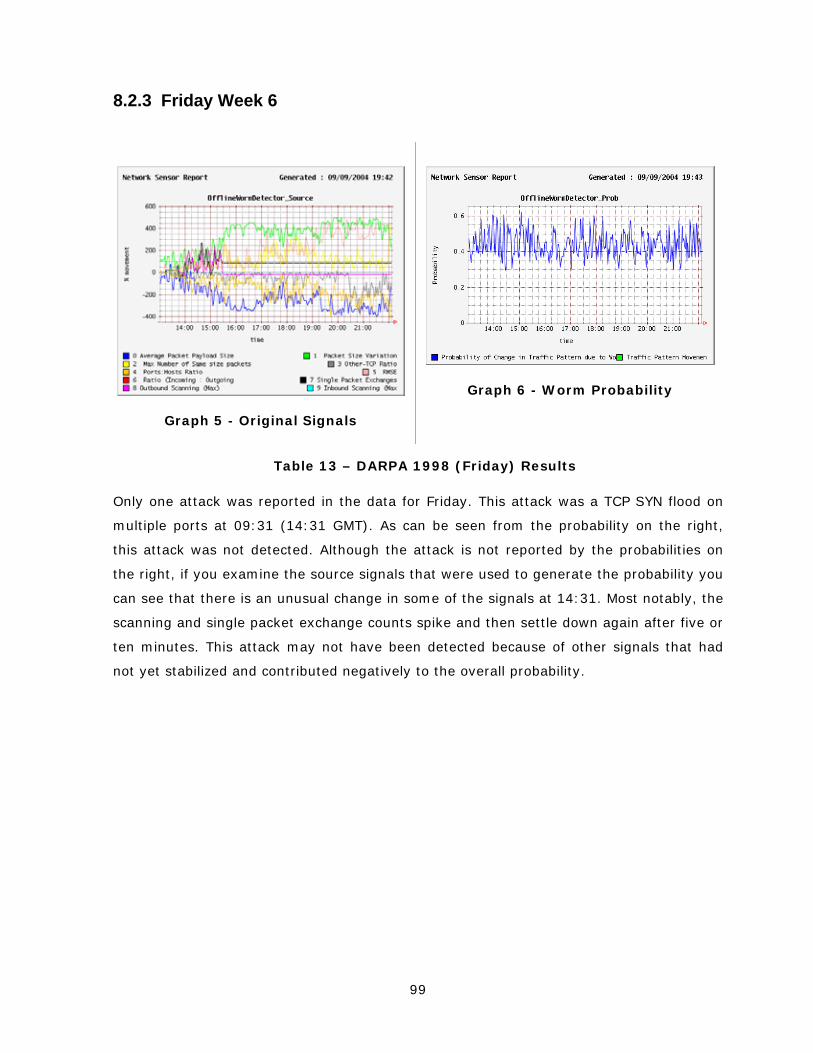
99
8.2.3 Friday Week 6
Only one attack was reported in the data for Friday. This attack was a TCP SYN flood on
multiple ports at 09:31 (14:31 GMT). As can be seen from the probability on the right,
this attack was not detected. Although the attack is not reported by the probabilities on
the right, if you examine the source signals that were used to generate the probability you
can see that there is an unusual change in some of the signals at 14:31. Most notably, the
scanning and single packet exchange counts spike and then settle down again after five or
ten minutes. This attack may not have been detected because of other signals that had
not yet stabilized and contributed negatively to the overall probability.
Graph 5 - Original Signals
Graph 6 - Worm Probability
Table 13 – DARPA 1998 (Friday) Results
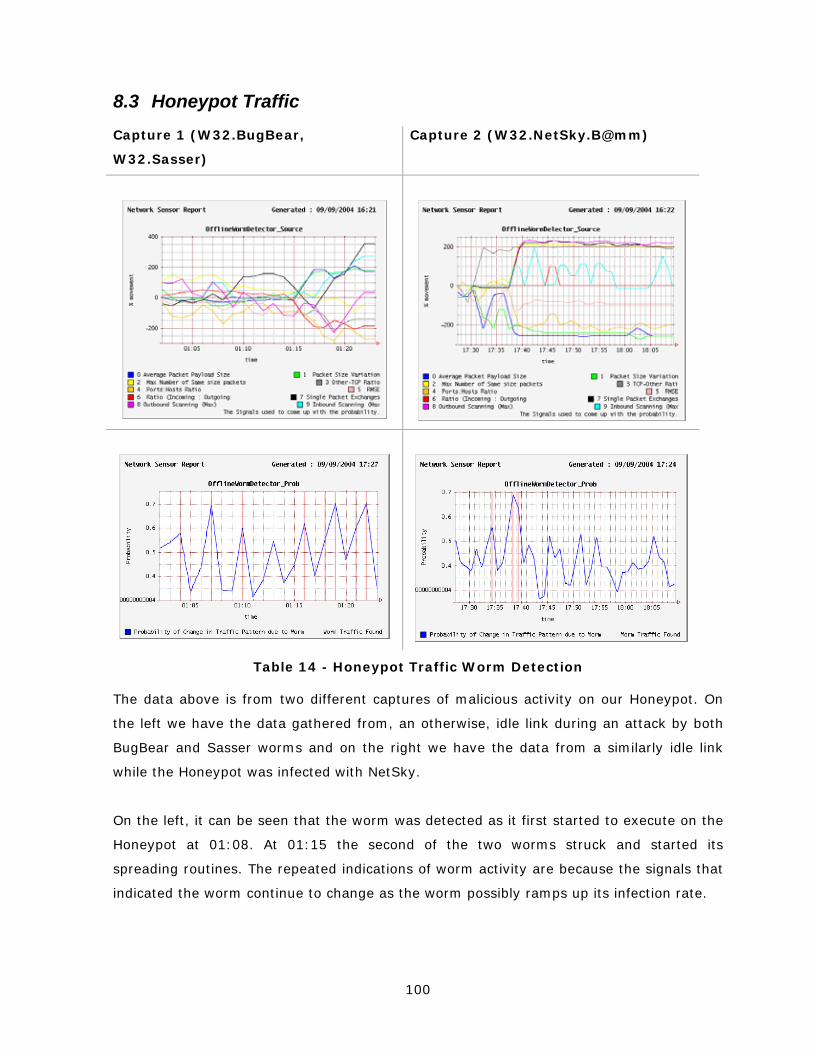
100
8.3 Honeypot Traffic
Capture 1 (W32.BugBear,
W32.Sasser)
Capture 2 (W32.NetSky.B@mm)
Table 14 - Honeypot Traffic Worm Detection
The data above is from two different captures of malicious activity on our Honeypot. On
the left we have the data gathered from, an otherwise, idle link during an attack by both
BugBear and Sasser worms and on the right we have the data from a similarly idle link
while the Honeypot was infected with NetSky.
On the left, it can be seen that the worm was detected as it first started to execute on the
Honeypot at 01:08. At 01:15 the second of the two worms struck and started its
spreading routines. The repeated indications of worm activity are because the signals that
indicated the worm continue to change as the worm possibly ramps up its infection rate.
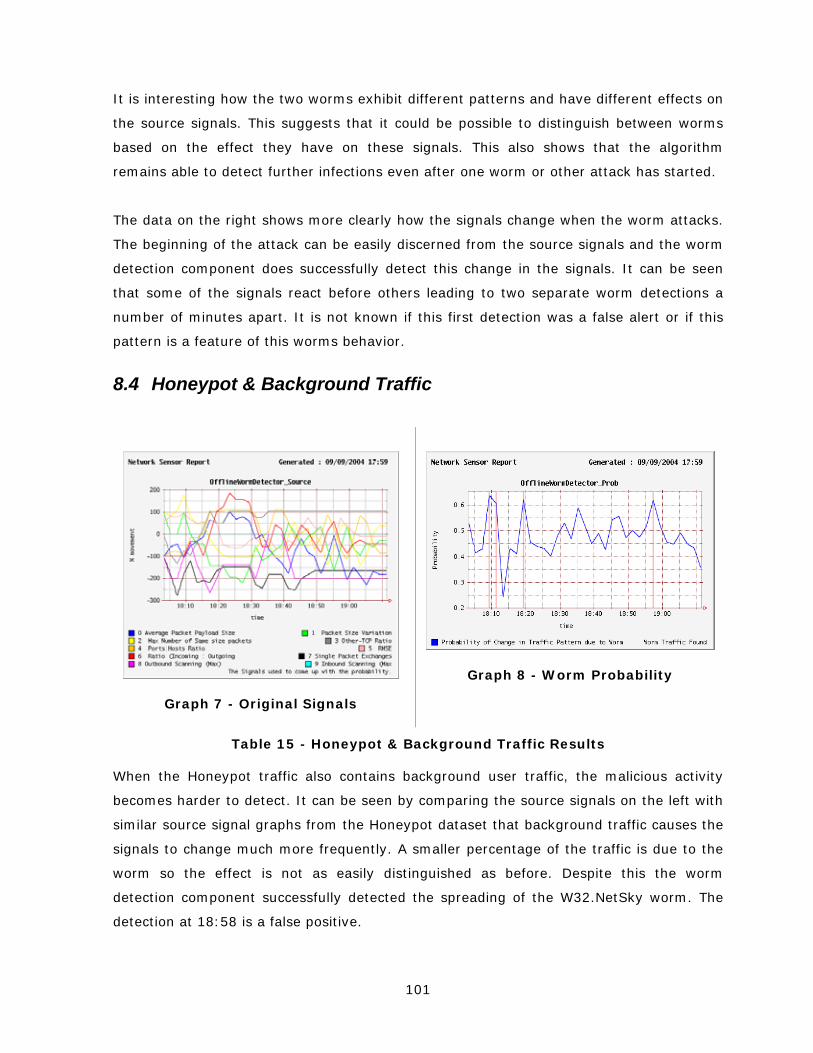
101
It is interesting how the two worms exhibit different patterns and have different effects on
the source signals. This suggests that it could be possible to distinguish between worms
based on the effect they have on these signals. This also shows that the algorithm
remains able to detect further infections even after one worm or other attack has started.
The data on the right shows more clearly how the signals change when the worm attacks.
The beginning of the attack can be easily discerned from the source signals and the worm
detection component does successfully detect this change in the signals. It can be seen
that some of the signals react before others leading to two separate worm detections a
number of minutes apart. It is not known if this first detection was a false alert or if this
pattern is a feature of this worms behavior.
8.4 Honeypot & Background Traffic
Table 15 - Honeypot & Background Traffic Results
When the Honeypot traffic also contains background user traffic, the malicious activity
becomes harder to detect. It can be seen by comparing the source signals on the left with
similar source signal graphs from the Honeypot dataset that background traffic causes the
signals to change much more frequently. A smaller percentage of the traffic is due to the
worm so the effect is not as easily distinguished as before. Despite this the worm
detection component successfully detected the spreading of the W32.NetSky worm. The
detection at 18:58 is a false positive.
Graph 7 - Original Signals
Graph 8 - Worm Probability
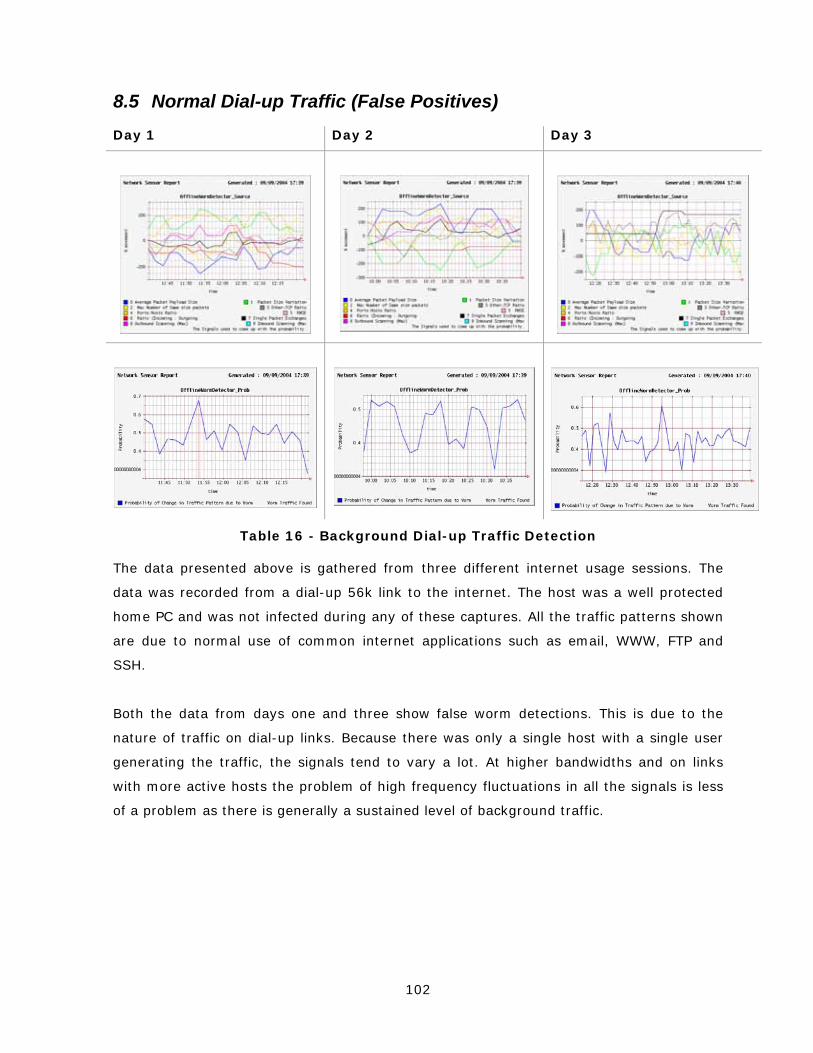
102
8.5 Normal Dial-up Traffic (False Positives)
Day 1 Day 2 Day 3
Table 16 - Background Dial-up Traffic Detection
The data presented above is gathered from three different internet usage sessions. The
data was recorded from a dial-up 56k link to the internet. The host was a well protected
home PC and was not infected during any of these captures. All the traffic patterns shown
are due to normal use of common internet applications such as email, WWW, FTP and
SSH.
Both the data from days one and three show false worm detections. This is due to the
nature of traffic on dial-up links. Because there was only a single host with a single user
generating the traffic, the signals tend to vary a lot. At higher bandwidths and on links
with more active hosts the problem of high frequency fluctuations in all the signals is less
of a problem as there is generally a sustained level of background traffic.
103
8.6 Results Summary
In summary the DARPA dataset showed that the detection of different types of malicious
activity is possible by monitoring changes in a number of key signals. The worm detection
component currently detects a variety of attacks that use scanning and flooding. The
Honeypot dataset showed that worms could be successfully detected and that different
worms cause different traffic patterns to be observed. The Honeypot dataset with
background traffic showed how it can be difficult to detect worms on low bandwidth links.
The normal internet traffic dataset highlighted the problem of low utilisation giving rise to
false worm detections. Links where there is no sustained traffic level causes the source
signals to change rapidly from one extreme to another as intermittent traffic starts and
stops. It appears that the techniques used by the worm detection component are not
appropriate on such links. It has also been mentioned that the component was run with
the same configuration on all the datasets. The only change was to modify the weights for
the DARPA dataset. It may be possible to improve the results presented here through
further tuning of the application and through experimentation with different parameters. It
has been shown that worms can be detected to within seconds of their attack. The actual
delay in detection is dependent on the size of the window of traffic that is analysed at a
time. For these experiments it was set to one minute. Also all of the probability graphs
show that there is a very small range in the probabilities. The range of probabilities
appears to remain centered at 0.3. The algorithm could be modified to give a wider range
of probabilities which would be easier to read but it is not believed that this would have
any effect on accuracy.
104
Conclusion
8.7 Summary
Bandwidth attacks such as Internet worms and DoS are a global problem that can have
serious economic effects. It is clear that identifying anomalies rapidly and accurately is
critical to the efficient operation of any network. Intrusion Detection systems have been
developed in an effort to protect private networks from such attacks. This defense in
depth approach incorporating firewalls, authentication, anti-virus and intrusion detection is
widely accepted as the most comprehensive approach to network security. Intrusion
Detection Systems are a new addition to this defense in depth and remain an immature
technology.
It has been shown that the majority of IDS systems rely on rules or signatures to perform
detection in a manner similar to anti-virus products. This approach requires an extensive
database of attack signatures to be maintained and distributed worldwide. This approach
is labor intensive, does not detect new attacks and often can not keep pace with the
increasingly rapid deployment of attacks facilitated by the distribution of malicious source
code and tool kits for developing attacks within the cracker communityTP
27PT.
For this reason there is a need for software that can generalize such attacks and detect
them without any prior knowledge of a specific attack. Tools that attempt to perform such
detection are commonly referred to as anomaly detection techniques.
This dissertation has presented a heterogeneous network inspection framework for the
development and deployment of an enterprise wide anomaly detection system. The
framework features a configurable event source, dynamically composable instrumentation
components and a remote management application. The DNIS framework combines the
TP
27PT The author takes care to distinguish the often misused term ‘hacker’ from ‘cracker’ who
is a person who breaks into systems with malicious intent. Hackers are people with
technical adeptness and a delight in solving problems and overcoming limits. For a better
description see Eric S. Raymond, 2001, "How To Become A Hacker"
http://catb.org/~esr/faqs/hacker-howto.html

105
best features of the currently available IDS systems with new ideas from the research
community.
Several components have been implemented for the framework that perform different
types of data gathering and anomaly detection. It is intended that the currently
implemented components serve as a base for future development. It has been
demonstrated that a component can be quickly implemented to verify the results of other
researchers work and similarly new techniques can be quickly implemented and evaluated.
Finally, a component designed to detect Internet worms was implemented and found to
successfully recognise internet worms, as well as scanning and flooding activity on both
dial-up and high-bandwidth network links.
This dissertation contributes in several areas. Firstly the framework itself is well described
and gives researchers the ability to develop components that can be directly compared to
other work. It is the author’s intention, with the kind permission of Trinity College Dublin
to release the source code for the framework implementation and components to the
community. The work has also shown that it is possible to detect internet worms using
time series techniques. The application of wavelet signal analysis to network traffic
statistics has also been shown to be very successful. This dissertation has also shown that
different worms have discernable effects on the network which could allow for worms to
be distinguished by their traffic patterns. Finally, a comprehensive state of the art of
intrusion detection systems and related technologies is provided. To the authors
knowledge there has been no other effort to provide such a taxonomy of the tools and
techniques available and it is hoped that this will provide to future researcher a good
foundation in the field.
8.8 DNIS Requirements Satisfied
This section will show how successful the final implementation was measured against the
requirements set out in (4.2 Requirements). The first requirement was that DNIS should
be capable of being deployed on any internal or external network link. This requirement
was fulfilled through the choice of a cross platform programming language and was
demonstrated successfully through the collection and analysis of data from both a dial-up
connection and high bandwidth internet gateway.

106
The second requirement was to avoid misuse detection, which was successfully achieved.
DNIS does not have any hard coded knowledge of any specific attack. Malicious activity is
detected through statistical means or through machine learning.
The requirement to run in real-time was achieved through the ability to dynamically chain
signal generation and analysis components allowing live data arriving at the event source
to be processed by different components on separate threads, without stopping collecting
and buffering further data.
The requirement to allow for coordinated detection among distributed sensors was
successfully achieved through the sensor manager application. The sensor manager
communicates with and controls all the sensors. The manager collects data from each
sensor to enable the sensor configuration to be modified in reaction to the current state of
the network. The automation of the coordination functions is left as future work.
The requirement to have a low false positive rate was a challenging one to meet, and in
fact, the analysis components implemented do suffer from false positives. It is however
believed that through tuning the sensors to their network environment the false positive
rate can be further reduced. The extent of the false positive problem also needs to be
assessed on a larger dataset so as to determine if the effect was due to the dataset
generated by the Honeypot used for data gathering.
The requirement to drill down to the particular source of an anomaly was not met. This
was due to time constraints and not the difficulty of the problem. The sensors have the
ability to keep rolling records of all traffic they see allowing the source of anomalies to be
determined offline by studying these logs in finer detail.
The analysis components were designed to be as general as possible and not to rely on
any packet headers that can be forged. Many of the features of network traffic that the
components expose are vulnerable to being altered significantly by malicious activity.
It is not believed that DNIS is vulnerable to attack itself. Security precautions ensure that
communications are not altered in any way. Careful monitoring of buffer levels, CPU usage
and available memory and the reporting of this information to the manager ensure the
system has protection against DoS attacks. As a further precaution against bandwidth
107
attacks the application does not flood the network with it’s own traffic but uses a proven
polling method with variable intervals and the ability to push events to the manager.
The requirement to avoid evaluating the system on artificially generated data was met and
has been demonstrated (6.2 Data Sets).
8.9 Future Research
There are a number of ways in which this work could be continued. The sensor manager
application that was implemented as part of the framework was rudimentary. A more
advanced implementation of the management application would increase the automation
of communication and control of the sensors. Logging could be centrally managed and
that responsibility could be taken away from individual sensors. An important
improvement would be to add a module storage facility to the manager. Currently
knowledge about available components is hard coded. A more extendable approach would
be to utilize a module storage database such as is proposed by Kemmerer, 1998. This
could allow the manager to perform queries on this database for modules that match
properties such as operating system, name, protocol, description, memory usage, etc.
These modules could then be sent to a sensor and executed there, with the output fed
back to the manager.
The power of the DNIS implementation is based on the capabilities of the analysis
components. While analyzing malicious traffic it became obvious that address or port
scanning is not random in nature. In fact port scans are often conducted sequentially
through the port range. An interesting additional component for the system would
measure the likelihood of a sequence existing in host or port accesses which would
indicate some sort of automated scan since it is extremely unlikely a user will access
machines or ports in a regular ordered manner. Other systems have shown this approach
to be promising for some types of attack.
Additional observations of malicious traffic indicate that it may be worth while analyzing
the entropy or randomness of some features. A generalized entropy model for internet
traffic would greatly benefit research in this area. Again, this could be implemented
quickly as another component and evaluated on the existing data sets.

108
Gathering good data in order to evaluate IDS systems was found to be very difficult. The
dissertation attempted (as much as possible) to use recent traffic captures, reflecting the
types of malicious activity and attacks currently widespread on the Internet. However,
because IDS systems generally require access to packet payloads, the majority of publicly
available research trace files can not be used. There is a need to gather more up-to-date
capture data from real networks showing realistic levels of background user traffic and
with malicious activity documented. This is obviously a tedious task but a distributed
(perhaps open) effort could quickly produce evaluation data that could be used to test and
compare IDS systems.
There has been some work done in using graphs to detect malicious activity. GrIDS
(Cheung, Crawford, Dilger, Hoagland, Levitt, Rowe, Staniford-Chen, Yip & Zerkle, 1996) is
a well known intrusion detection system that attempts to detect worms by building so
called 'activity graphs' that represent network connections between hosts. These graphs
are then searched for predefined patternsTP
28PT. The patterns do not need to be specific to a
particular attack as many attack types will exhibit similar connection graphs. Such a
detection method could augment others to improve the systems performance. A graph
based algorithm would be particularly suitable for the DNIS framework as the sensors are
already distributed and communicating. This would aid in the construction of graphs.
As previously discussed (5.3.4 Payload Pattern Matching) the string based payload pattern
matching techniques from Kreibich et al, (2004) suffer from overfitting. The string
matching algorithms will match all patterns that appear in the payloads. The majority of
these patterns arise from the structure that application layer software adds to the data
before it is passed to the network stack for transmission. The paper concluded that
without a database of signatures for all application layer protocols it would be impossible
to isolate the truly malicious payloads from the legitimate data. This dissertation proposes
that rather than having to provide knowledge of common pattern in all existing protocols,
that machine learning could be used. By training a machine learning algorithm to
recognise all the common protocols the application could then eliminate those pattern
matches from the set of patterns that the string matching algorithm finds. This approach
would also have the benefit of the generalization that machine learning provides and could
allow slight variations on patterns to be correctly marked as belonging to a legitimate
protocol.
TP
28PT Worms often exhibit a tree shaped connection graph
109
There also remains a need for further work in evaluating different responses to detected
malicious activity. There have been many types of response proposed, which include
actively terminating connections, changing firewall rules, adding signatures to an ID or
simply alerting the administrator. It has not been shown which of these responses provide
the best protection.
The DNIS system was developed to work as an online network analysis system. During
development there was a lot of need to run components over captured data and it was
found that the DNIS framework is not well suited to bulk offline data processing. It is
proposed that a second complementary application be developed that would allows
researchers to load DNIS components into an offline analysis or simulation environment in
order to evaluate them before deployment to a live network.
110
9 References Anderson Roscoe Wetherall, 2004, “Preventing Internet Denial-of-Service with
Capabilities”, ACM SIGCOMM Computer Communications Review Volume 34, Number 1:
January 2004.
Anderson, 1995, “An Introduction to Neural Networks”, MIT Press. Boston 1995, ISBN 0-
262-01144-1.
Axelsson, 2000, “Intrusion Detection Systems: A Survey and Taxonomy”, Technical
report, Department of Computer Engineering, Chalmers University of Technology,
Goteborg, Sweden, 2000.
Barford & Plonk, 2002, “Characteristics of Network Traffic Flow Anomalies”, In Proceedings
of the ACM SIGCOMM Internet Measurement Workshop, Nov. 2001.
Barford Kline Plonka & Ron, 2002, “A Signal Analysis of Network Traffic Anomalies”, In
Proceedings of the ACM SIGCOMM Internet Measurement Workshop, Marseilles, France.
Braginsky, Estrin, 2001, “Rumor Routing Algorithm For Sensor Networks”, Under
submission to International Conference on Distributed Computing Systems (ICDCS-22),
November 2001.
Brox, 2002, “Signature Based or Anomaly Based Intrusion Detection – The Practice and
Pitfalls”, http://www.itsecurity.com/papers/proseq1.htm.
CERT/CC, 2000, “Love Letter Worm “, Advisory CA-2000-04
http://www.cert.org/advisories/CA-2000-04.html.
CERT® Coordination Center, 2001, “Denial of Service Attacks”,
www.cert.org/tech_tips/denial_of_service.html.
Cheung, Crawford, Dilger, Hoagland, Levitt, Rowe, Staniford-Chen, Yip & Zerkle, 1996,
“The Design of GrIDS: A Graph-Based Intrusion Detection System”, In Proceedings of the
111
19th National Information Systems Security Conference, volume 1, pages 361--370,
October 1996.
DARPA, 1981, “TRANSMISSION CONTROL PROTOCOL”, RFC: 793, Defense Advanced
Research Projects Agency.
Das, 2000, “Attack Development for Intrusion Detection Evaluation”, Thesis,
MASSACHUSETTS INSTITUTE OF TECHNOLOGY.
Das, 2001, “Protocol Anomaly Detection for Network-based Intrusion Detection”,
www.sans.org/rr/papers/30/349.pdf.
Denning, 1987, “An Intrusion-Detection Model”, IEEE Transactions on Software
Engineering, VOL. SE-13, NO. 2.
ePrivacy, 2003, “Spam by Numbers”, ePrivacy Group, a Philadelphia-based trust
technology company.
Floyd & Kohler, 2002, “Internet Research Needs Better Models”, ACM SIGCOMM Computer
Communication Review archive, Volume 33 , Issue 1 (January 2003), Pages: 29 - 34.
Forno, 2003, “Lessons From the Slammer”, SecurityFocus.com,
http://www.securityfocus.com/columnists/140.
Ghosh & Schwartzbard, 1999, “A Study in Using Neural Networks for Anomaly and Misuse
Detection”, Proceedings of the USENIX Security Symposium 1999.
Gil & Poletto, 2001, “MULTOPS: a data-structure for bandwidth attack detection”, In
Proceedings of the 10th USENIX Security Symposium.
Graps, 2003, “An introduction to Wavelets”,
www.amara.com/IEEEwave/IEEEwavelet.html.
Handley, Paxson & Kreibich, 2000, “Network Intrusion Detection: Evasion, Traffic
Normalisation, and end-to end protocol semantics “, www.sans.org/rr/papers/70/1128.pdf.

112
Hernández-Campos Jeffay & Smith, 2004, “How ‘Real’ Can Synthetic Network Traffic
Be?”, A colloquium given at the Uiversity of Virginia, Charlottesville, VA, March, 2004.
Hussain Heidemann & Papadopoulos, 2003, “A Framework for Classifying Denial of Service
Attacks”, In Proceedings of ACM SIGCOMM 2003.
Hussain, Heidemann & Papadopoulos, 2003, “A Framework for Classifying Denial of
Service Attacks”, USC/Information Sciences Institute, SIGCOMM’03, August 25–29, 2003,
Karlsruhe, Germany.
Intanagonwiwat, Govindan & Estrin, 2000, “Directed Diffusion: A Scalable and Robust
Communication Paradigm for Sensor Networks”, Proceedings of the sixth annual
international conference on Mobile computing and networking. Pages 56-67 August 6 -
11, 2000, Boston, MA USA.
Javitz & Valdes, 1990, “The SRI IDES Statistical Anomaly Detector”, IEEE Symposium on
Security and Privacy May 20 - 22, 1991 Oakland, CA.
Kemmerer, 1998, “NSTAT: A Model-based Real-time Network Intrusion Detection
System”, Technical Report TRCS-97-18, Department of Computer Science, UC Santa
Barbara.
Keshav, 1998, “REAL: A Network Simulator”, Technical Report 88/472, Dept. of computer
Science, UC Berkeley.
Kim Reddy & Vannucci, 2003, “Detecting Traffic Anomalies at the Source through
aggregate analysis of packet header data”, Texas A&M University,
citeseer.ist.psu.edu/578408.html.
Kreibich & Crowcroft, 2004, “Honeycomb – Creating Intrusion Detection Signatures Using
Honeypots”, ACM SIGCOMM Computer Communications Review Volume 34, Number 1:
January 2004.
Lakshminarayanan Adkins, Perrig & Stoica, 2004, “Taming IP Packet Flooding Attacks”,
ACM SIGCOMM Computer Communications Review Volume 34, Number 1: January 2004.
113
Lan Hussain & Dutta, 2003, “Effect of Malicious Traffic on the Network”, In the
Proceedings of PAM 2003.
Lazarevic Ertoz Kumar Ozgur Srivastava, 2001, “A Comparative Study of Anomaly
Detection Schemes in Network Intrusion Detection”, University of Minnesota.
McCanne & Floyd 2000, “ns Network Simulator”, http://www.isi.edu/nsnam/ns/
Messmer, 2003, “Navy Marine Corps Intranet hit by Welchia worm”, NetworkWorldFusion,
http://www.nwfusion.com/news/2003/0819navy.html
Mirkovic Martin & Reiher, 2001, “A Taxonomy of DDoS Attacks and DDoS Defense
Mechanisms”, ACM SIGCOMM Computer Communication Review archive, Volume 34 ,
Issue 2, (April 2004), Pages: 39 – 53.
Paxson, 1999, “Bro: A System for Detecting Network Intruders in Real-Time”, In 7th
Annual USENIX Security Symposium, January 1998.
Phaal & Panchen, 2002, “Packet Sampling Basics”,
http://www.sflow.org/packetSamplingBasics/index.htm.
Pohlmann & Tim Crothers, 2002, "Firewall Systems", John Wiley & Sons Inc, ISBN:
076454926X.
Porras & Valdes, 1998, “Live Traffic Analysis of TCP/IP Gateways”, Internet Society's
Networks and Distributed Systems Security Symposium, March 1998.
Poulsen, 2003, “Slammer worm crashed Ohio nuke plant network”, SECURITYFOCUS
NEWS, http://www.securityfocus.com/news/6767.
Provos, 2003, “honeyd - A Virtual Honeypot Framework”, 13th USENIX Security
Symosium, San Diego, CA.
Provos, 2004, “A Virtual Honeypot Framework”, 13th USENIX Security Symosium, San
Diego.
114
Shyu1, Chen, Sarinnapakorn & Chang, 2004, “A Novel Anomaly Detection Scheme Based
on Principal Component Classifier”, Proceedings of ICDM Foundation and New
Direction of Data Mining workshop, pp 172-179.
Smith Hernández-Campos & Jeffay, 2001, “What TCP/IP Protocol Headers Can Tell Us
About the Web”, In proeedings. ACM SIGMETRICS 2001.
Symantec, 2003, “W32.Welchia.Worm”,
http://securityresponse.symantec.com/avcenter/venc/data/w32.welchia.worm.html.
Toth, Krugel, 2002, “Connection History Based Anomaly Detection”, Proceedings of the
2002 IEEE Workshop on Information Assurance and Security.
Wang & Stolfo, 2004, “Anomalous Payload-based Network Intrusion Detection”, CU Tech
Reports Mar. 31, 2004.
Weaver & Paxson, 2004, “A Worst-Case Worm”, citeseer.ist.psu.edu/669954.html.
Weaver Paxson Staniford & Cunningham, 2002, “Large Scale Malicious Code: A Research
Agenda”, citeseer.ist.psu.edu/644435.html.
Yaar Perrig & Song, 2004, “SIFF: A Stateless Internet Flow Filter to Mitigate DDoS
Flooding Attacks”, citeseer.ist.psu.edu/689335.html.
Yadgar, Kraus & Ortiz, 2003, “SCALING-UP DISTRIBUTED SENSOR NETWORKS”, Chapter
9 in "Distributed Sensor Networks: A Multiagent Perspective", Kluwer Academic Publisher,
ISBN: 1402074999.
Yadgar, Kraus & Ortiz, 2004, “SCALING-UP DISTRIBUTED SENSOR NETWORKS:
COOPERATIVE LARGE-SCALE MOBILE-AGENT ORGANIZATIONS”, Managing Cyber Threats:
Issues, Approaches and Challenges, Chapter 9, Kluwer Academic Publishers.
Zanero & Savaresi, 2004, “Unsupervised Learning Techniques For an Intrusion Detection
System”, citeseer.ist.psu.edu/692871.html.
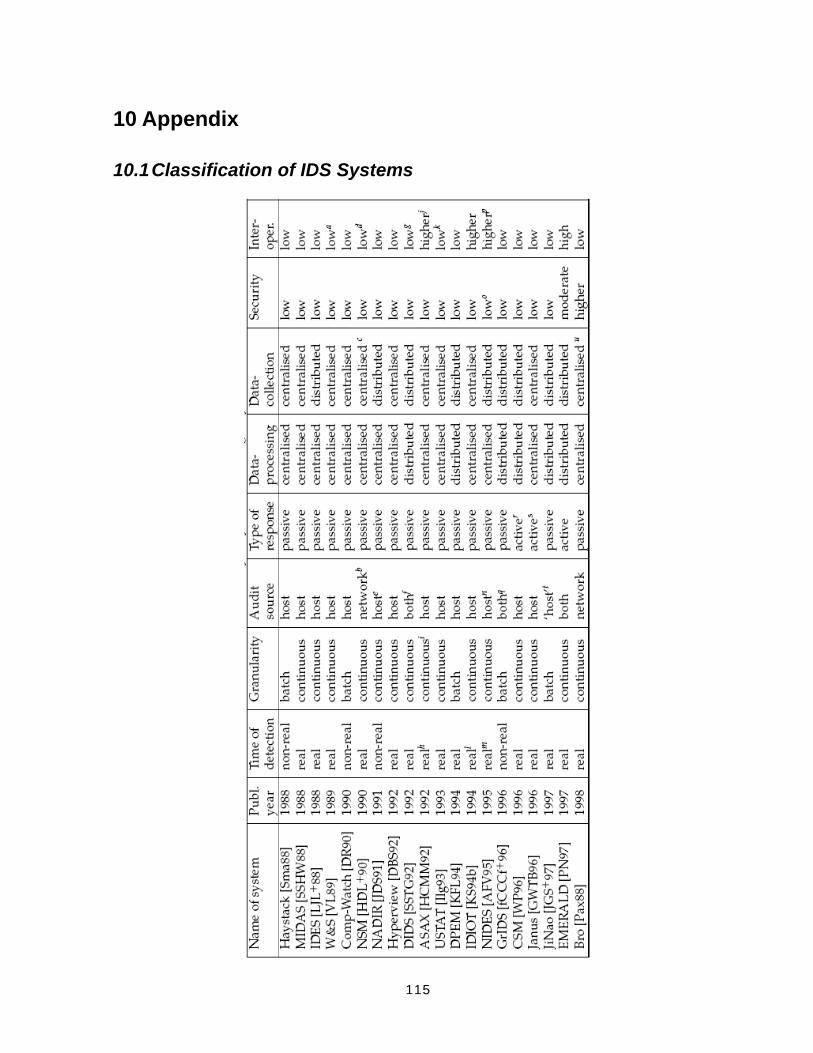
115
10 Appendix
10.1 Classification of IDS Systems