Embed Size (px)
Citation preview
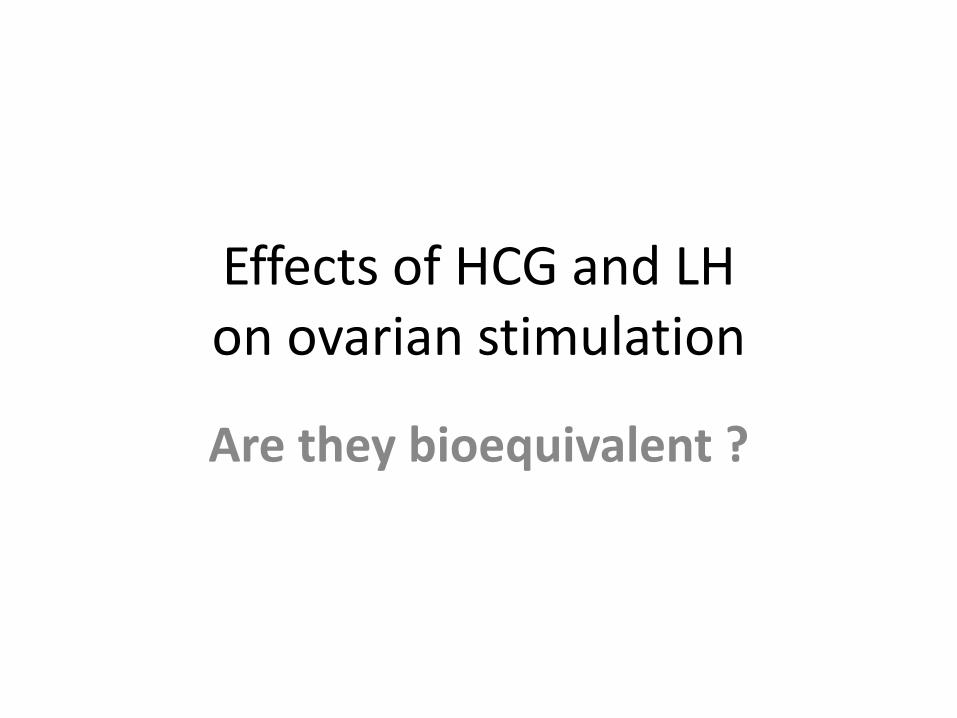
Effects of HCG and LH on ovarian stimulation
Are they bioequivalent ?

Know the type of gonadotrophin required to have enough oocytes of good quality to achieve a healthy child
FSH
IVF
Rob Gilchrist courtesy, adapted
MAXIMIZE EFFICIENCY
MINIMIZE RISK

Pleiotropic effects of gonadotrophins
• rescue follicle(s) from atresia : “recruitment”
• Influence steroid balance : A-E-P
• Effect on ovary
• Effect on implantation
• Diverse effect in total body :
• Risks : OHSS
3

ART treatment pursues several goals at once
• Focus on ovary : many mature follicles
• Endometrium development
• Implantation window
• Minimum of side effects
Can all these goals be reconciled ?
CLEAR TREND TO SEGMENTATION
4

Objectives of the lecture
• LH and hCG: functions, mechanisms of action,
available formulations ( hMG & HP-hMG)
• LH and hCG: understanding the differences
• Defining optimal LH levels
• Results from the daily practice
5

• Molecular structures : gonadotrophin dimers
• The LH effect on the ovarian follicle
6

LH and hCG:
The family of pituitary glycoproteins
7
Strauss J et al, eds. Yen and Jaffe’s Reproductive Endocrinology. 5th ed. 2004.
hLH
&
hCG
hFSH
ɑ-chain
hFSH
hLH
hCG
Asn 52
92 AA
Asn 78
Asn 7
hFSHAsn 24 111 AA
hLH Asn 30115 AA
Ser 121Ser 132
Ser 127Ser 138
Asn 30Asn 13hCG
β-chain
145 AA

2-cell, 2-gonadotropin model
of hormone production
8
Blood GRANULOSA CELLTHECA CELL
ANDROSTENEDIONE
DHEA
cAMP
Cholesterol
Pregnenolone
17-OH Pregnenolone
Protein
Kinase A
17βHSD1CYP17
CYP17
3βHSD
Protein
Kinase AP450arom
Basement Membrane
ESTRADIOL-17β
ESTRONE
ANDROSTENEDIONE
cAMP
CYP11A1
FSHRRLH R
Adapted from Wilson JD et al, eds.
Carr BR. In: Wilson JD et al, eds. Williams Textbook of Endocrinology. 9th ed. Philadelphia, PA: WB Saunders; 1998:751-817.

(Has2,'Tnfaip6,'Ptgs2)
Ccnb1,'Mos,'Mad2,'Bub1b,'Sogl2,'Tex19.1,'Tpx2,'Dazl,'others'
'
Mural&Cells&
LH bioactivity relation to the oocyte
Cumulus-oocyte ‘capacitation’ for development

• hMG–human menopausal gonadotropin— 75 IUs of FSH activity and 75 IUs of LH activity
— HP-hMG–highly purified urinary hMG
• Urinary purified hCG
• Recombinant hCG
• Recombinant LH
Products that provide LH bioactivity
10

Origin of hCG in HP-hMG• Pituitary gonadotrophs produce hCG
– Up to 1/3 of follicular-stage LH activity may derive
from hCG in a natural cycle1
– Lack of E2 feedback during menopause/ovarian
failure increases pituitary hCG production2,3
• Pituitary hCG and placental/urinary hCG are largely
similar, according to4:
– Amino acid analysis
– Mass spectrometric studies
11
1. Cole LA. Reprod Biol Endocrinol. 2010;8:102-116.2. Stenman U-H et al. J Clin Endocrinol Metab. 1987;64(4):730-736.3. Cole LA et al. J Reprod Med. 2004;49(6):423-432. 4. Birken S et al. Endocrinology. 1996;137(4):1402-1411.
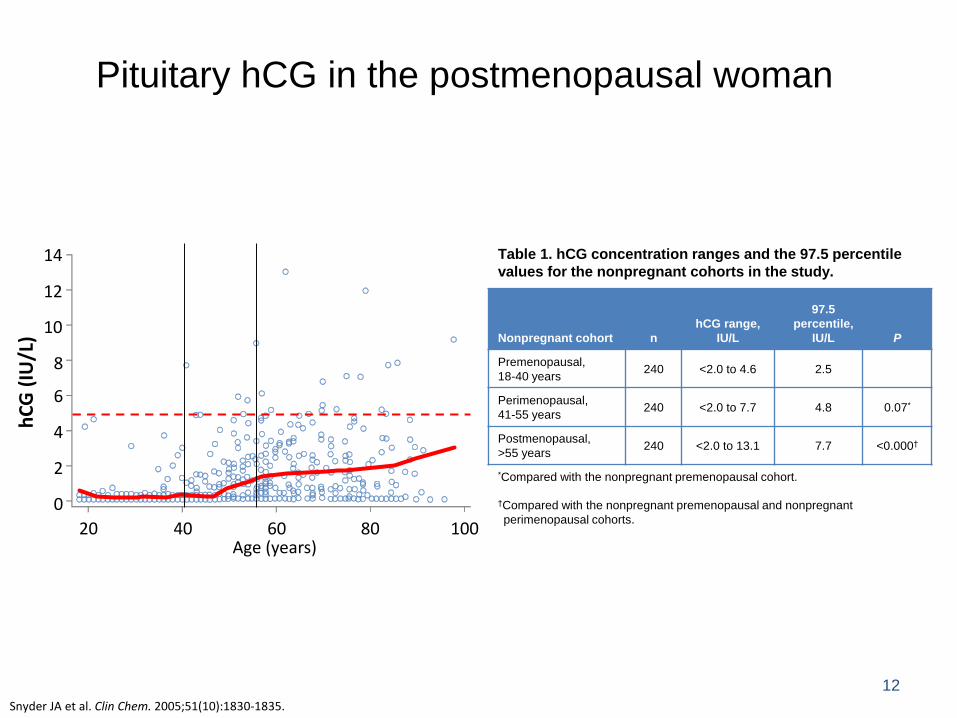
Pituitary hCG in the postmenopausal woman
12
Snyder JA et al. Clin Chem. 2005;51(10):1830-1835.
Nonpregnant cohort n
hCG range,
IU/L
97.5
percentile,
IU/L P
Premenopausal,
18-40 years240 <2.0 to 4.6 2.5
Perimenopausal,
41-55 years240 <2.0 to 7.7 4.8 0.07*
Postmenopausal,
>55 years240 <2.0 to 13.1 7.7 <0.000†
*Compared with the nonpregnant premenopausal cohort.
†Compared with the nonpregnant premenopausal and nonpregnant
perimenopausal cohorts.
Table 1. hCG concentration ranges and the 97.5 percentile
values for the nonpregnant cohorts in the study.
0
2
4
6
8
10
12
14
20 40 60 80 100Age (years)
hC
G (
IU/L
)

The purification process and why hCG is
in HP-hMG
• Postmenopausal pituitary cells secrete gonadotropin into the body’s circulation,
where it is filtered and excreted by the kidneys
• During purification, LH is sequentially moved away from hCG, resulting in
3 fractions
• Fraction 1 is then combined with the other 2 fractions to reach a 1:1 ratio of FSH
and LH activity, as measured by bioassay, producing HP-hMG
13
Fraction 1FSH, little LH
Fraction 3hCG
Finalchromatography
step
Fraction 2FSH, LH, and hCG
HP-hMG is human-derived FSH with approximately 10 IUs of hCGdriving the majority of the 75 IUs of LH activity.

HP-hMG is NOT hMG
14
Source of various gonadotropins since 1985
hMG2 hMG2 hMG2 rFSH2 HP-hMG2
LH (IU/vial) 13.5 5.8 7.4 - 0.4
hCG (IU/vial) 3.4 6.9 7.2 - 9.9
Approximately 95% of the LH bioactivity in HP-hMG is
provided by hCG3
1. FDA Orange Book. www.accessdata.fda.gov. 2. Wolfenson C et al. Reprod Biomed Online. 2005;10(4):442-454. 3. van de Weijer BHM et al. Reprod Biomed Online. 2003;7(5):547-557.
19851 19941 19991 20041 20041

Conclusions
• The gonadotropin content of HP-hMG
is distinct from hMG
• HP-hMG is a highly purified product derived from the
urine of postmenopausal women
– suitable for SC injection
– the majority of the LH activity is "hCG-driven"
15

16
LH and hCG:
understanding the differences in effects
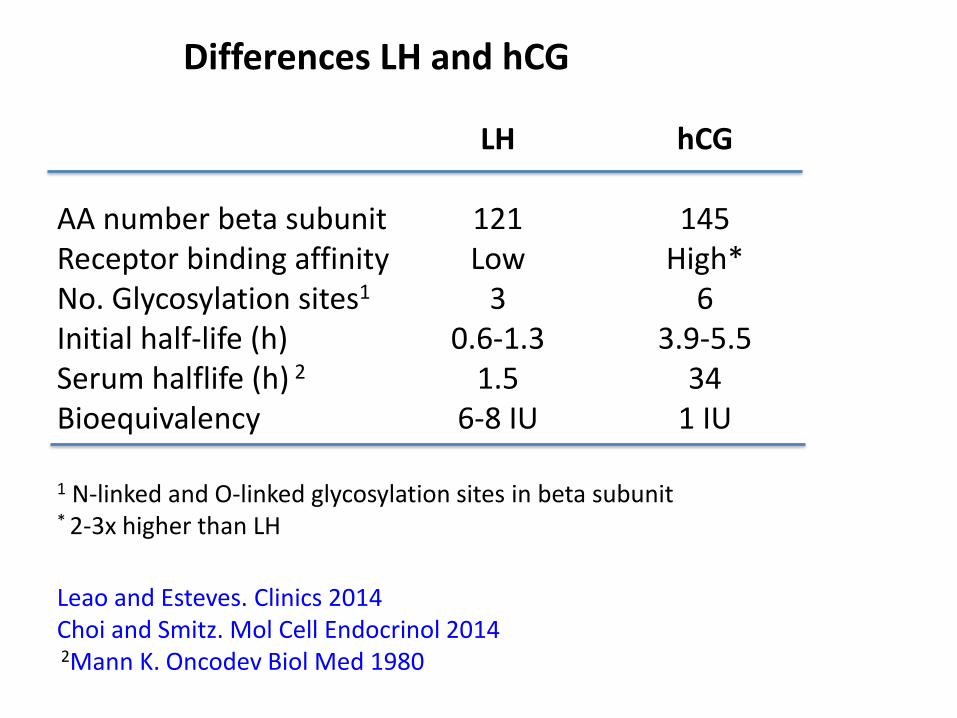
Differences LH and hCG
LH hCG
AA number beta subunit 121 145Receptor binding affinity Low High*No. Glycosylation sites1 3 6Initial half-life (h) 0.6-1.3 3.9-5.5Serum halflife (h) 2 1.5 34Bioequivalency 6-8 IU 1 IU
1 N-linked and O-linked glycosylation sites in beta subunit* 2-3x higher than LH
Leao and Esteves. Clinics 2014Choi and Smitz. Mol Cell Endocrinol 20142Mann K. Oncodev Biol Med 1980
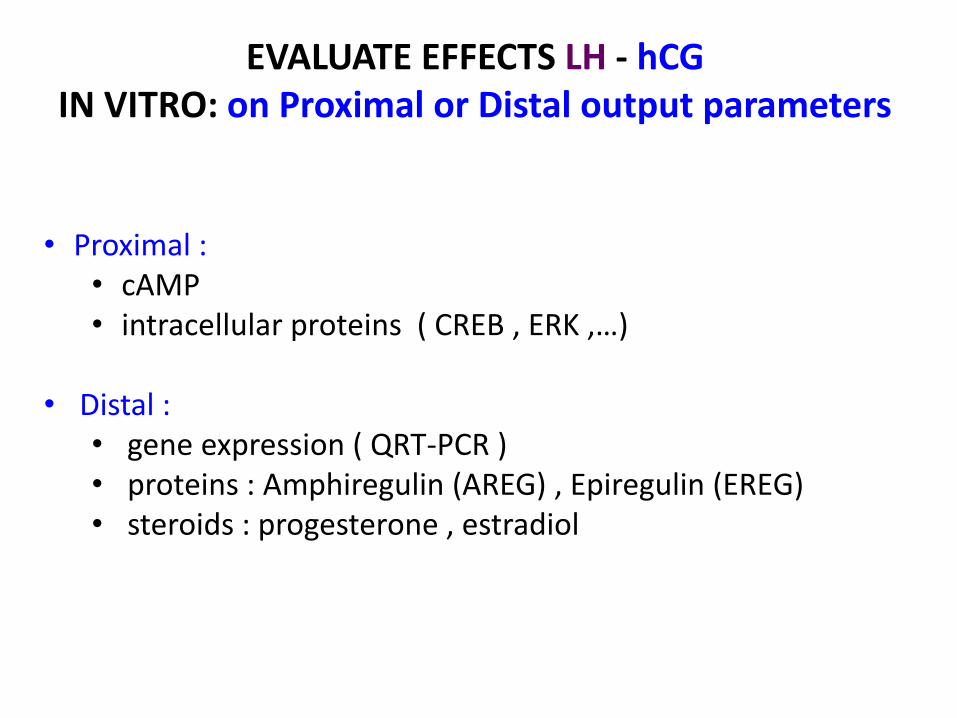
• Proximal :• cAMP• intracellular proteins ( CREB , ERK ,…)
• Distal :• gene expression ( QRT-PCR )• proteins : Amphiregulin (AREG) , Epiregulin (EREG)• steroids : progesterone , estradiol
EVALUATE EFFECTS LH - hCG IN VITRO: on Proximal or Distal output parameters

hLHCG receptor


Casarini et al., Mol Cell Endocrinol 2016
Exposure to GC in vivo ?10 IU/L= 10.7pM10 IU/L is dose when3Amps Menopur injected

Therefore, on cAMP:
• Higher in vitro potency of hCG vs LH (about 5-fold, extractive or recombinant, any cell model)
• Faster maximal response after LH vs hCG(10 min vs. 60 min, COS7-LHCGR and hGLC)
LH and hCG act with different potency and kinetics
Molecular effects are not SIMILAR
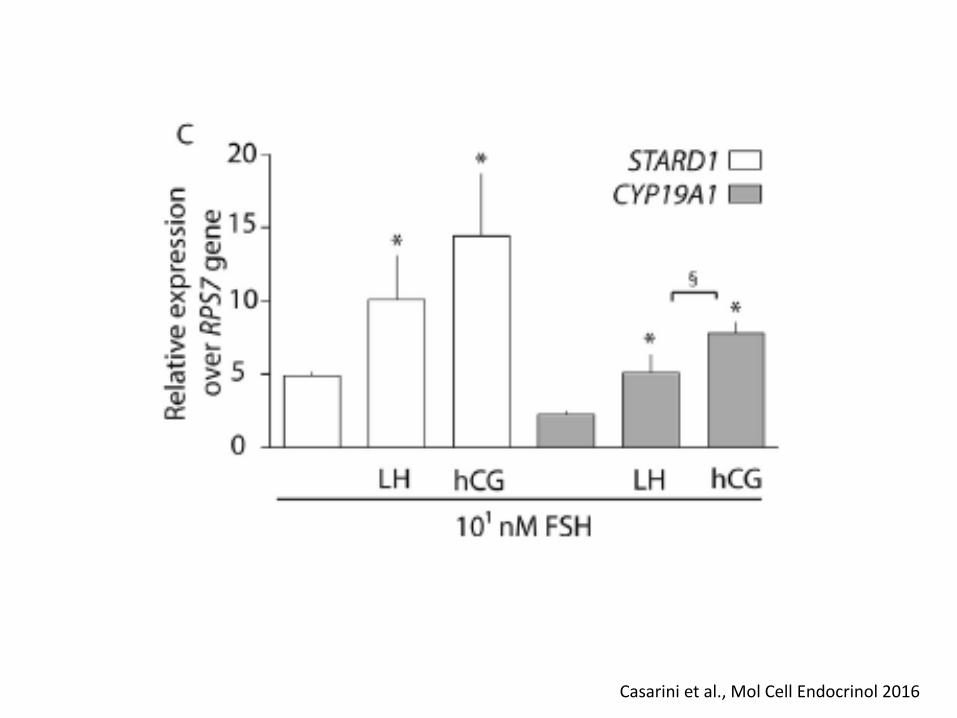
Signal transduction / gene expression
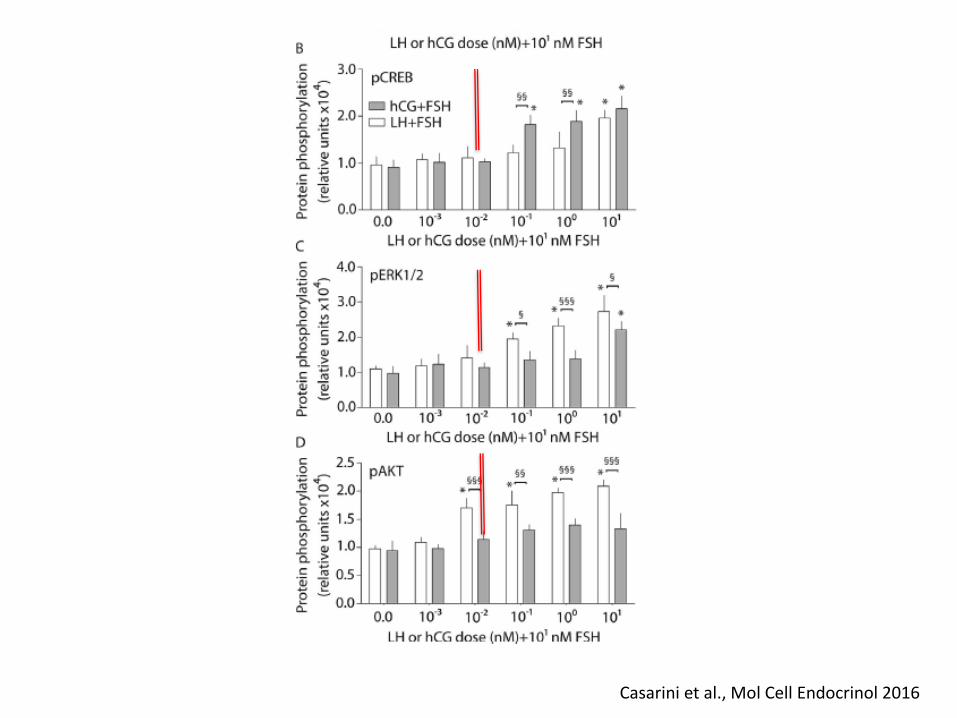
Casarini et al., Mol Cell Endocrinol 2016

Casarini et al., Mol Cell Endocrinol 2016
Casarini et al., Mol Cell Endocrinol 2016

Conclusions of in vitro experiments :LH and hCG are NOT equivalent in vitro
• LH and hCG are biochemically different
• HCG is more active than LH in activation of the cAMP pathway and steroidogenesis
• LH is more active than HCG in pERK and pAKT activation
• LH and hCG both potentiate FSH action

Effects of LH and hCG when adminstered in-vivo

Hypothalamo-pituitary production is pulsatile to allow sustained secretion of Testo , Prog

*P<0.001
Adapted from Thuesen LL et al. Hum Reprod. 2012;27(10):3074-3084. 29
†
Therapy injections: pharmacodynamic profiles
HCG and LH

What is RELEVANCE “in-vivo” : for ART
LH and hCG are …. not equivalent for ART ?Can we understand why ?
Heterogeneity of COS protocols
• FSH alone, vs. FSH + HMG, vs. FSH + LH, vs. FSH + HCG
• Agonist vs. Antagonist
Litterature is available

31
Defining optimal
LH-bioactivity levels
Treshold
&
Ceiling

Therapeutic LH window1-3
32
LH <1.2
Impaired follicular
development
Inadequate thecal
androgen synthesis
and hence, reduced
granulosa
aromatization to
estrogen
No full oocyte
maturation
LH 1.2-10.0
Optimal follicular
growth and
development
Full oocyte
maturation
LH >10.0
LH receptor
downregulation
Suppression of
granulosa cell
proliferation
Follicular atresia
(nondominant
follicles) premature
luteinization
(preovulatory follicle)
1. Balasch J et al. Curr Opin Obstet Gynecol. 2002;14(3):265-274. 2. O’Dea L et al. Curr Med Res Opin. 2008;24(10):2785-2793. 3. Regan L et al. Lancet. 1990;336(8724):1141-1144.
Threshold1,2 Optimal window1-3 Ceiling1,3
1. Esposito MA et al. Fertil Steril. 2001;75(3):519-524.
2. Lahoud R et al. Hum Reprod. 2006;21(10):2645-2649.
3. O’Dea L et al. Curr Med Res Opin. 2008;24(10):2785-2793.
4. Fleming R et al. Hum Reprod. 1998;13(7):1788-1792.
5. Fleming R et al. Hum Reprod. 2000;15(7):1440-1445.
6. Westergaard LG et al. Hum Reprod. 2000;15(5):1003-1008.
7. Westergaard LG et al. Fertil Steril. 2001;76(3): 543-549.
8. Pezzuto A et al. Gynecol Endocrinol. 2010;26(2):118-124.
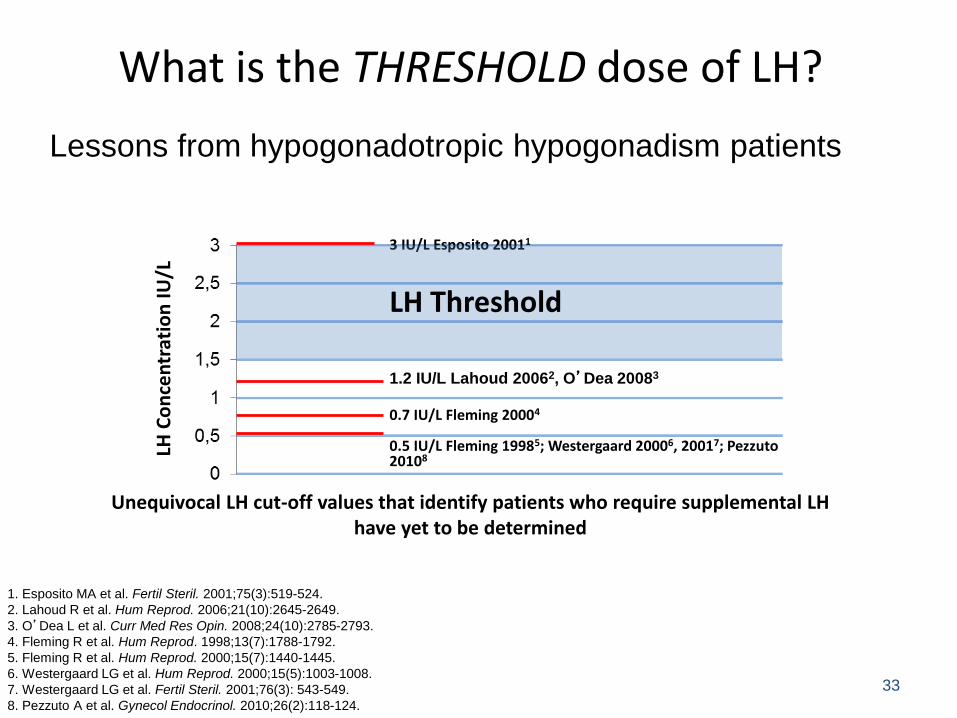
Unequivocal LH cut-off values that identify patients who require supplemental LH have yet to be determined
What is the THRESHOLD dose of LH?
33
3 IU/L Esposito 20011
1.2 IU/L Lahoud 20062, O’Dea 20083
0.7 IU/L Fleming 20004
0.5 IU/L Fleming 19985; Westergaard 20006, 20017; Pezzuto20108
LH Threshold
LH C
on
cen
trat
ion
IU
/LLessons from hypogonadotropic hypogonadism patients
34
LH Treshold influenced by ovarian ageing
Insensitivity of theca cells to LH resulting in low androgen precursor production
Deficient 17 OH-Progesterone production when challenged with HCG ( sensitive marker )
( French and Finnish Studies )

60 patients, 25-37 years of age, undergoing IVFstimulated with 150 IU/day of rFSH (N=62)
0 IU hCG
(n=16)
50 IU hCG
(n=15)
100 IU hCG
(n=16)
150 IU hCG
(n=13)*
*Two patients were withdrawn after randomization due to 10-fold hCG dosing errors.
The results are based on the per protocol (PP) analysis.
hCG ceiling?
• Primary endpoint: number of top-quality
embryos at day 3
35
Thuesen LL et al. 2012
Thuesen LL et al. Hum Reprod. 2012;27(10):3074-3084.

*P<0.001
Thuesen LL et al. Hum Reprod. 2012;27(10):3074-3084.
36
†
HCG injections: pharmacodynamic profiles

Thuesen LL et al. Hum Reprod. 2012;27(10):3074-3084.
37
Dose 0 Dose 50 Dose 100 Dose 150
Effects on ovary of the increasing hCG doses

P=0.58
Small follicles (11-14 mm): day of hCG
Dose 0 (n=16)
n (%)
Dose 50 (n=15)
n (%)
Dose 100 (n=16)
n (%)
Dose 150 (n=13)
n (%)P value
Cumulative no.
live births/started
“fresh cycle”5 (31) 5 (33) 7 (44) 5 (39) 0.89
Thuesen LL et al. Hum Reprod. 2012;27(10):3074-3084.
38
Folli
cle
s 1
1-1
4 m
m
Effects of increasing hCG doses on follicle
growth and clinical outcome

Conclusion:
does an LH ceiling exist during ovarian stimulation?• No negative effects on pregnancy outcomes seen up to
exogenous 150 IU hCG per day
• No negative effects on pregnancy outcomes seen with >1300 IU added rLH (Hugues et al. 2005;20(3):629-635)
• Exogenous sources of LH activity do not appear to have the
same negative impact on ovarian stimulation as does
pathologically elevated endogenous LH
39

40
How do these data
translate in practice?

Andersen A.N. et al, 2006 (MERiT)
• Randomized, open-label, assessor-blind, parallel-group, multicenter,
multinational, phase 3 study
• Patients received long-protocol downregulation with a GnRH agonist
• Primary objective was ongoing pregnancy rate per started cycle
41Andersen AN et al. Hum Reprod. 2006;21(12):3217-3227.
HP-hMG 225-450 IU/day
(n=363)
rFSH 225-450 IU/day
(n=368)
731 premenopausal patients, 21-37 years of age, with regular
menstrual cycles undergoing IVF

Results: primary endpoint
42
(n=368)
P=NS
(n=363)
Ongoing pregnancy rate
Andersen AN et al. Hum Reprod. 2006;21(12):3217-3227.

MERiT endocrinology
• A published report of the MERiT study
investigated the endocrine status of study
subjects during IVF with HP-hMG vs rFSH
• Blood samples were obtained on days 1 and 6 of
stimulation, last stimulation day, and at oocyte
retrieval
• Follicular fluid was collected at retrieval from at
least 1 follicle of ≥17 mm from which an oocyte
had been retrieved
43
Smitz J et al. Hum Reprod. 2007;22(3):676-687.
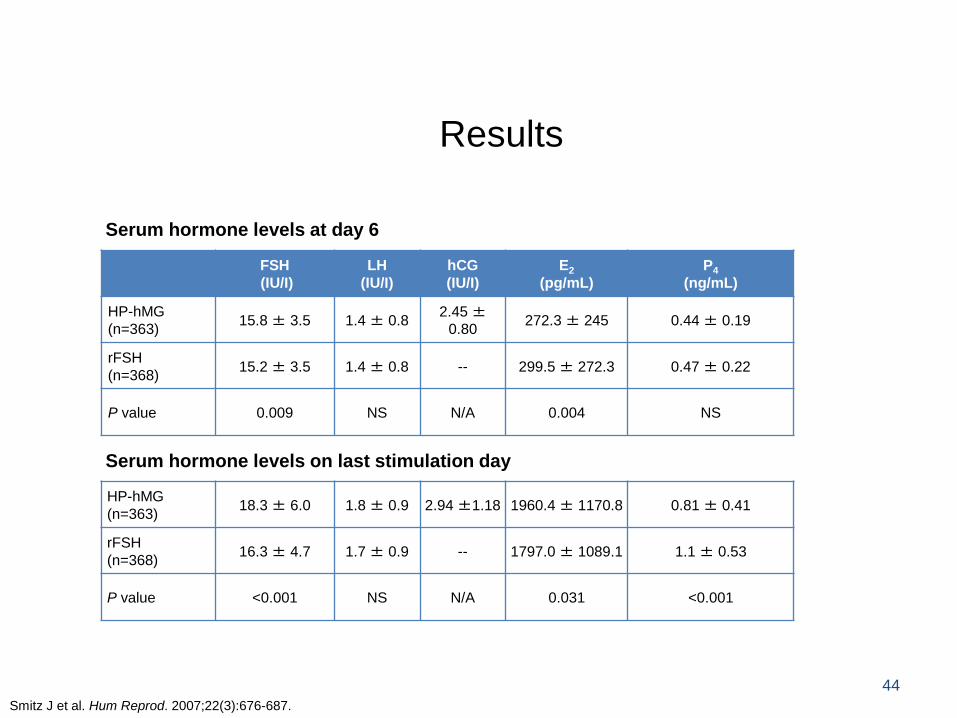
Results
Serum hormone levels at day 6
Serum hormone levels on last stimulation day
44
Smitz J et al. Hum Reprod. 2007;22(3):676-687.
FSH
(IU/I)
LH
(IU/I)
hCG
(IU/I)
E2
(pg/mL)
P4
(ng/mL)
HP-hMG
(n=363)15.8 ± 3.5 1.4 ± 0.8
2.45 ±0.80
272.3 ± 245 0.44 ± 0.19
rFSH
(n=368)15.2 ± 3.5 1.4 ± 0.8 -- 299.5 ± 272.3 0.47 ± 0.22
P value 0.009 NS N/A 0.004 NS
HP-hMG
(n=363)18.3 ± 6.0 1.8 ± 0.9 2.94 ±1.18 1960.4 ± 1170.8 0.81 ± 0.41
rFSH
(n=368)16.3 ± 4.7 1.7 ± 0.9 -- 1797.0 ± 1089.1 1.1 ± 0.53
P value <0.001 NS N/A 0.031 <0.001

100
80
60
40
20
0
Results: day 6 serum hCG concentrations
and outcomes
45
Serum hCG on day 6P=0.008
P=0.003
Smitz J et al. Hum Reprod. 2007;22(3):676-687.
<25%
25%-50%
50%-75%
>75%

MERIT DATASET ( Data on File )
Endocrine data on Day 61
hCG on Day 6
<25%
(N=87)
25–50%
(N=88)
50–75%
(N=90)
>75%
(N=90)
LH (IU/L) 1.4 ± 0.9 1.4 ± 0.8 1.5 ± 0.9 1.5 ± 0.7
Estradiol (nmol/L) 0.6 ± 0.7 0.8 ± 0.7 1.0 ± 1.0 1.3 ± 1.0
Androstenedione (nmol/L) 5.6 ± 2.1 5.8 ± 2.2 6.1 ± 2.8 6.4 ± 2.4
Total testosterone (nmol/L) 0.9 ± 0.4 0.9 ± 0.4 0.9 ± 0.5 0.9 ± 0.4
SHBG (nmol/L) 45 ± 19 52 ± 21 58 ± 24 63 ± 22
FAI 2.5 ± 1.8 1.9 ± 1.1 1.8 ± 1.7 1.6 ± 1.0
Progesterone (nmol/L) 1.3 ± 0.5 1.5 ± 0.6 1.4 ± 0.6 1.5 ± 0.5
1. Data on file
MERiT®

Results: embryo quality
• In the HP-hMG group, 11.3% of embryos assessed were top-quality, versus 9% with rFSH (P=0.044), as assessed by local embryologists
47
P=0.044
Ziebe S et al. Hum Reprod. 2007;22(9):2404-2413.

Conclusions
• Evidence suggests that exogenous LH activity does not have the same negative impact on outcomes as does pathologically elevated endogenous LH
• In the MERiT study, HP-hMG treatment resulted in:— Comparable pregnancy outcomes vs rFSH
— Endocrine profile differed at the end of stimulation – higher E2 and lower P4 with hMG
— Fewer oocytes retrieved but a greater proportion of top-quality embryos vs rFSH
— Day 6 serum hCG levels but NOT LH levels were correlated with pregnancy outcomes
48
Quid with rLH ?
• Evidence suggests that exogenous rLH activity does not have
the same impact on outcomes as does the hCG in HP-hMG
• No improved outcomes when systematically added to rFSH
• Only ‘tendency‘ of improved outcome in :
– Older patients
– Poor responders
• Effect in poor responders (?)
49

50

ESPART: dosage regimen design
Pituitary
downregulation
up to 21 days
Triptorelin
0.1 mg daily
Ovarian stimulation for up to
21 days, until follicle(s) ≥17
mm
r-hFSH + r-hLH (2:1)
Start dose 300/150 IU
Max. dose 450/225 IU
+ daily triptorelin
r-hFSH
Start dose 300 IU
Max. dose 450 IU
R
1:
1
r-hCG Oocyte Embryo
retrieval transfer
r-hCG Oocyte Embryo
retrieval transfer
Luteal Phase support within
48 hours after oocyte
retrieval for
≥7 weeks
Vaginal progesterone gel
Vaginal progesterone gel
34–38
hours
2–3 days
51

Results of the ESPART trial
Outcome
r-hFSH + r-
hLH
(n=462)
r-hFSH
(n=477)
p
value
Biochemical pregnancy, n (%) 80 (17.3) 114 (23.9) 0.020
Embryo implantation rate, n/N* (%)
79/538 (14.7) 93/597 (15.6) 0.675
Clinical pregnancy, n (%) 65 (14.1) 80 (16.8) 0.320
Ongoing pregnancy, n (%) 51 (11.0) 59 (12.4) 0.599
Live birth, n (%) 49 (10.6) 56 (11.7) 0.663
Cancelled cycles,† n (%) 35 (7.6) 32 (6.7) 0.648
*n is the number of fetal sacs identified by transvaginal ultrasound and N is the total number of embryos transferred†All cycle cancellations were due to lack of ovarian response
Secondary and other efficacy endpoints
52

General Conclusions
• exogenous LH bioactivity supplementation does not have the same negative impact on outcomes as elevated endogenous LH
• hCG and LH are different molecules, with a different in-vitro and in-vivo effect— Half-life in circulation
— Binding to receptor
— Post-receptor triggering
• hCG low dose therapy in combination with FSH (HP-hMG)
– influences the ovarian hormone profiles,
– reduces the amount of small follicles (with incompetent oocytes / embryos )
– Is correlated with a favourable safety profile in ART
53