Embed Size (px)
Citation preview
Foreign Investment Strategies
Presentation to Bouygues Management Institute
Chris Barrilleaux
Angela EthertonTodd GallatiKeith GibbonsKathryn Herrold
Greg Lawrence
Troy LeMairePete PerssonNat PhillipsBrent Vidrine
A.B. Freeman School of BusinessTulane University
June 11, 2003
2
Agenda
• Foreign Investment Overview and Trends
• Developing a Winning Foreign Direct Investment Strategy
• Case Studies in Foreign Direct Investment
3
Foreign Investment Overview and Trends
4
Defining foreign investment
There are two types of foreign investment:• Portfolio: foreign investors purchase a local firm’s securities or bonds without
exerting control
• Direct: foreign investor starts a greenfield operation or acquires control of a local firm
If an investor holds at least 10% of a firm’s equity, it is classified as a Foreign Direct Investment (FDI) by the IMF, UNCTAD, and the US Department of Commerce• Other nations have differing definitions on level of control. Examples: UK
20%, Germany 25%
Portfolio investments typically follow FDI
Source: Laura Alfaro, Harvard Business School
5
1.99
1.89
1.51
1.5
1.29
1.23
1.22
1.2
1.19
1.16
1.15
1.12
1.09
1.07
1.05
1.02
0.99
0.95
0.95
0.93
0.91
0.89
0.86
0.85
0.85
ChinaUnited States
United KingdomGermany
FranceItaly
SpainCanadaMexico
AustraliaPolandJapanBrazil
Czech RepublicIndia
HungaryRussia
Hong KongNetherlands
ThailandSouth Korea
SingaporeBelgiumTaiwanAustria
Low confidence High confidence
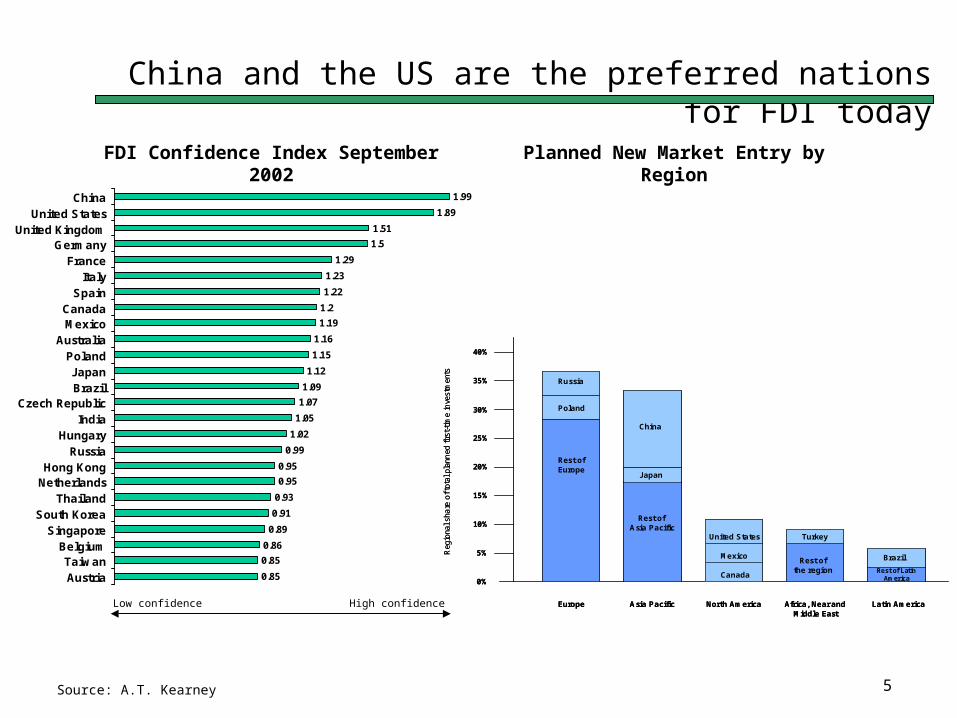
China and the US are the preferred nations for FDI today
Source: A.T. Kearney
FDI Confidence Index September 2002
10%
20%
30%
40%
5%
15%
25%
35%
0%
Russia
Poland
China
Japan
Canada
Mexico
United States Turkey
Brazil
Rest of Europe
Rest ofAsia Pacific
Rest of Latin America
Rest of the region
Europe Asia Pacific North America Africa, Near and Middle East
Latin America
Reg
iona
l sha
re o
f tot
al p
lann
ed fi
rst-
time
inve
stm
ents
Planned New Market Entry by Region
6
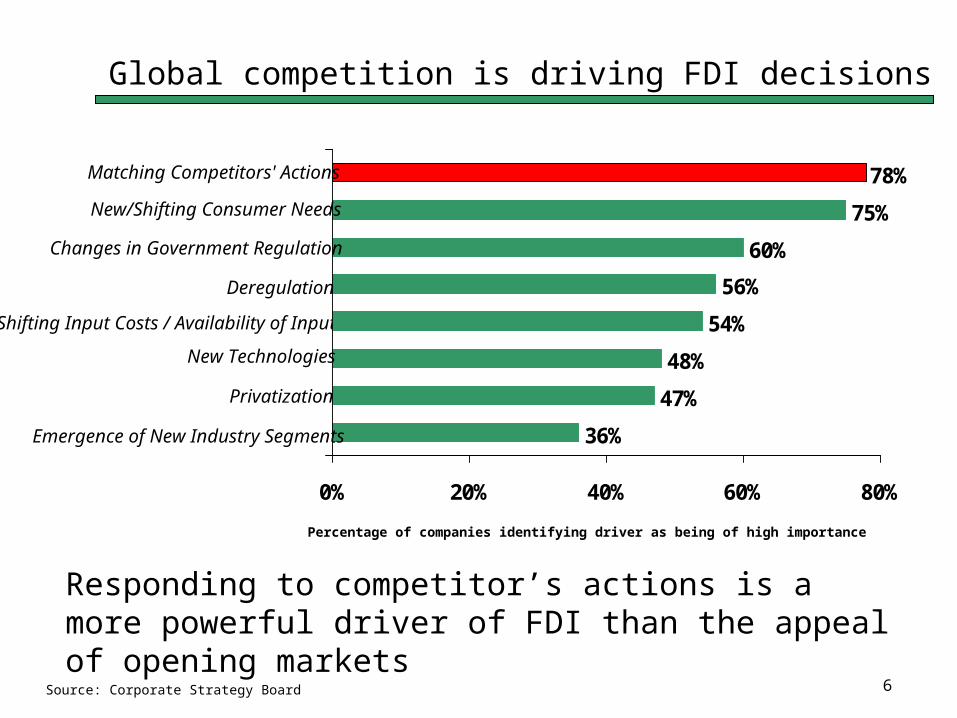
Global competition is driving FDI decisions
Shifting Input Costs / Availability of Inputs
36%
47%
48%
54%
56%
60%
75%
78%
0% 20% 40% 60% 80%
Emergence of New Industry Segments
Privatization
New Technologies
Deregulation
Changes in Government Regulation
New/Shifting Consumer Needs
Matching Competitors' Actions
Responding to competitor’s actions is a more powerful driver of FDI than the appeal of opening markets
Source: Corporate Strategy Board
Percentage of companies identifying driver as being of high importance
7
Developing a winning FDI strategy

8
Investing in a foreign market can be divided into three phases
Select which
market to enter
Determine
mode of entry
Adapt
to the
local market
Drivers: Typical methods: Possible changes:
• Competition• Efficiencies• New markets• Learning
• M&A• Joint Venture• Licensing• Greenfield
• Product• Standards and
Procedures• Culture• Business
Practices
ChallengesProperly sizing the market opportunity
Understanding the country under consideration
Carefully choosing the right mode of entry
Selecting the right partner
Allowing necessary local variants to business practices
Sharing knowledge
Maintain efficiencies
Approach to FDI
9
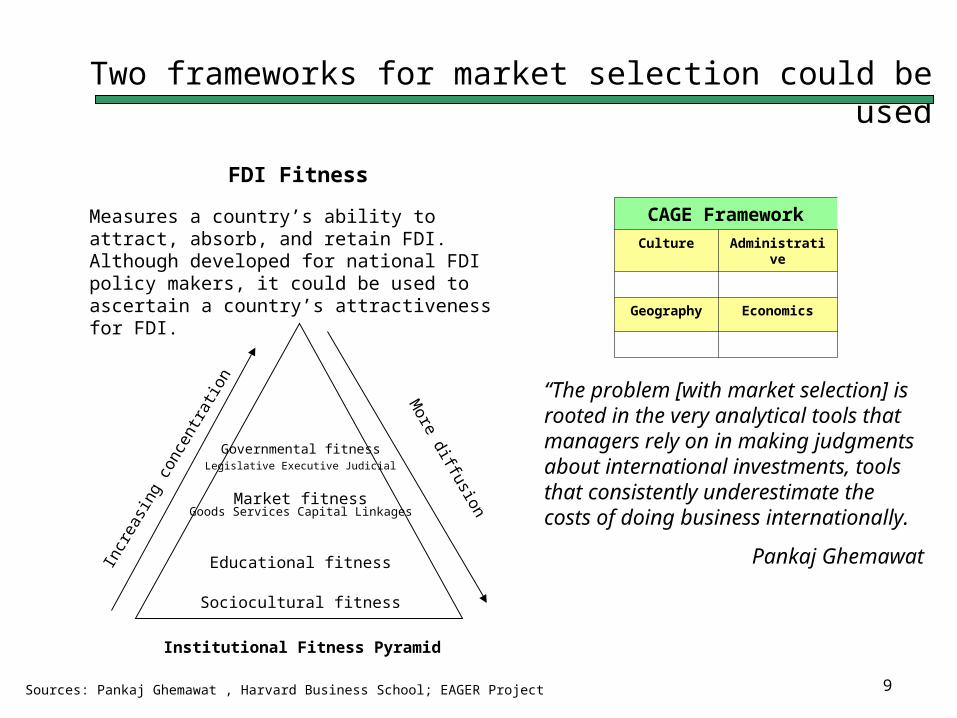
Two frameworks for market selection could be used
CAGE Framework
Culture Administrative
Geography Economics
“The problem [with market selection] is rooted in the very analytical tools that managers rely on in making judgments about international investments, tools that consistently underestimate the costs of doing business internationally.
Pankaj Ghemawat
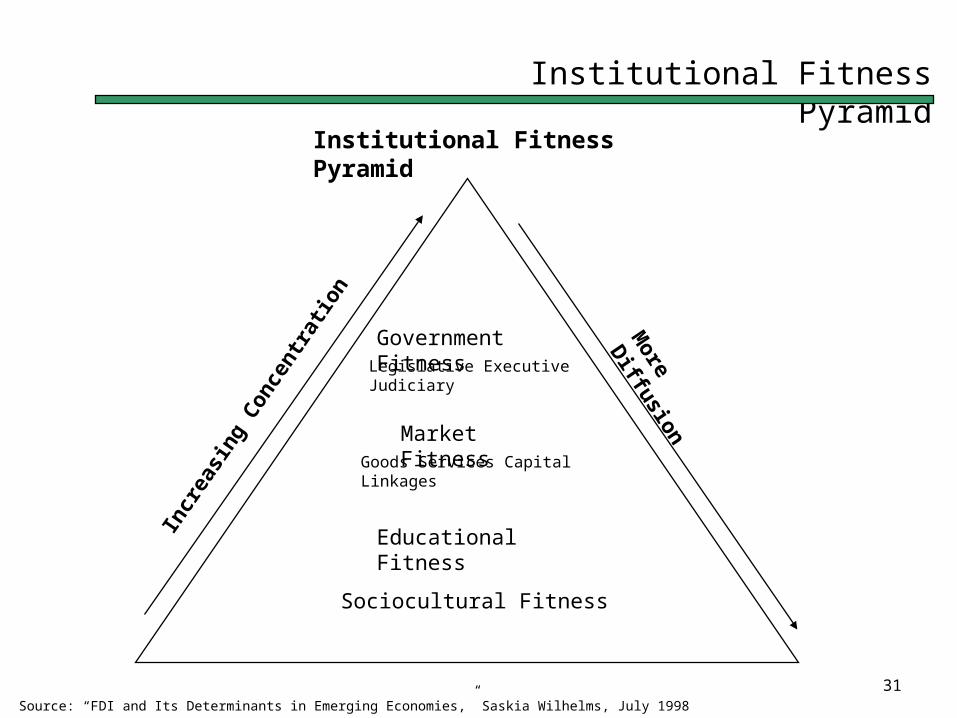
Institutional Fitness Pyramid
Incr
easi
ng c
once
ntra
tion
More diffusion
Sociocultural fitness
Educational fitness
Market fitness
Governmental fitnessLegislative Executive Judicial
Goods Services Capital Linkages
FDI Fitness
Measures a country’s ability to attract, absorb, and retain FDI. Although developed for national FDI policy makers, it could be used to ascertain a country’s attractiveness for FDI.
Sources: Pankaj Ghemawat , Harvard Business School; EAGER Project
10
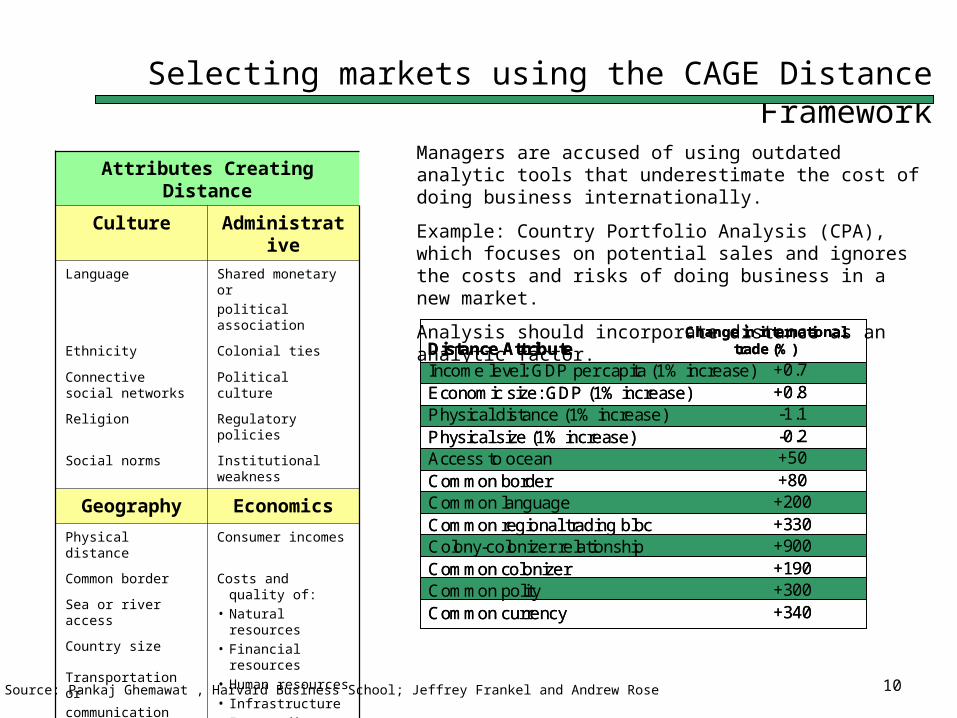
Selecting markets using the CAGE Distance Framework
Attributes Creating Distance
Culture Administrative
Language Shared monetary or
political association
Ethnicity Colonial ties
Connective social networks
Political culture
Religion Regulatory policies
Social norms Institutional weakness
Geography Economics
Physical distance Consumer incomes
Common border Costs and quality of:• Natural resources• Financial resources• Human resources• Infrastructure• Intermediate inputs• Information or
knowledge
Sea or river access
Country size
Transportation or
communication links
Climate
Source: Pankaj Ghemawat , Harvard Business School; Jeffrey Frankel and Andrew Rose
Managers are accused of using outdated analytic tools that underestimate the cost of doing business internationally.
Example: Country Portfolio Analysis (CPA), which focuses on potential sales and ignores the costs and risks of doing business in a new market.
Analysis should incorporate distance as an analytic factor.
Distance AttributeIncome level: GDP per capita (1% increase)Economic size: GDP (1% increase)Physical distance (1% increase)Physical size (1% increase) Access to oceanCommon borderCommon languageCommon regional trading blocColony-colonizer relationshipCommon colonizerCommon polityCommon currency
+0.7+0.8-1.1-0.2+50+80+200+330+900+190+300+340
Change in international trade (%)Distance Attribute
Income level: GDP per capita (1% increase)Economic size: GDP (1% increase)Physical distance (1% increase)Physical size (1% increase) Access to oceanCommon borderCommon languageCommon regional trading blocColony-colonizer relationshipCommon colonizerCommon polityCommon currency
+0.7+0.8-1.1-0.2+50+80+200+330+900+190+300+340
Change in international trade (%)

11
CAGE framework example: Yum! Brands1
100
200
300
400
0 5,000 10,000 15,000 20,000 25,000 30,000 35,000 40,000
Japan
Germany
Canada
Mexico
Per
cap
ita f
ast
food
con
sum
ptio
n ($
)
Per capita income ($)
100
200
300
400
0 5,000 10,000 15,000 20,000 25,000 30,000 35,000 40,000
Per capita income ($)
Per
cap
ita f
ast
food
con
sum
ptio
n ($
)
Country Portfolio AnalysisActual and potential markets are placed on a grid based on some market criteria. Bubble size represents size of market.
Germany and Japan are the two largest market opportunities
CPA Adjusted for DistanceRelative sizes of opportunity are different when adjusted for distance attributes
Canada and Mexico are the two largest market opportunities
Source: Pankaj Ghemawat , Harvard Business School
Notes: 1) Formerly Tricon Restaurants International
12
Case Studies in FDI
13
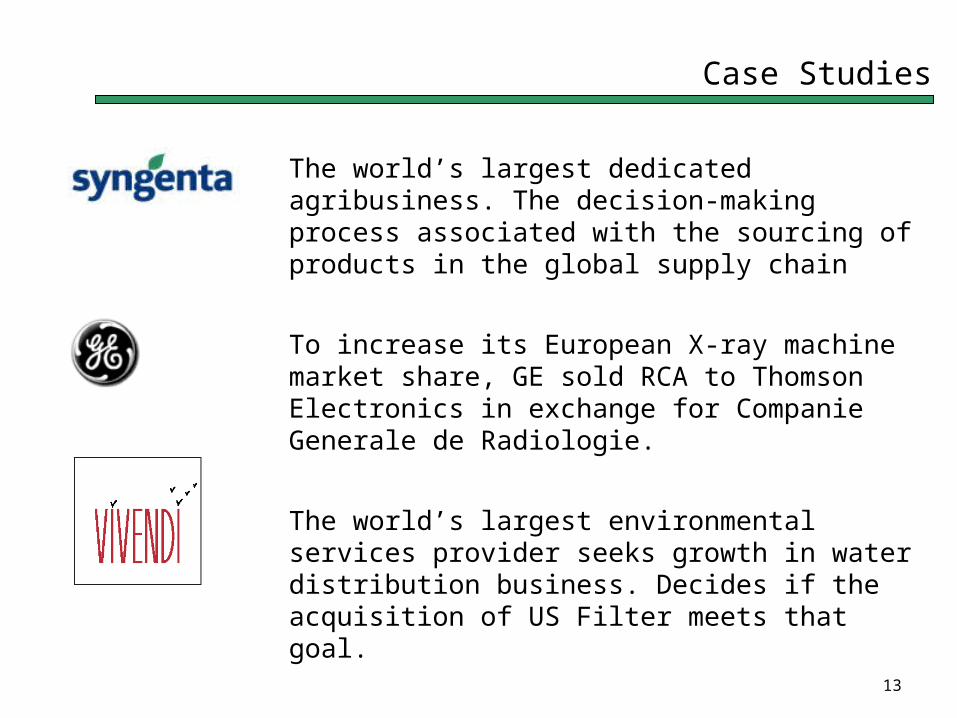
Case Studies
The world’s largest dedicated agribusiness. The decision-making process associated with the sourcing of products in the global supply chain
To increase its European X-ray machine market share, GE sold RCA to Thomson Electronics in exchange for Companie Generale de Radiologie.
The world’s largest environmental services provider seeks growth in water distribution business. Decides if the acquisition of US Filter meets that goal.
14
Case Study: Syngenta
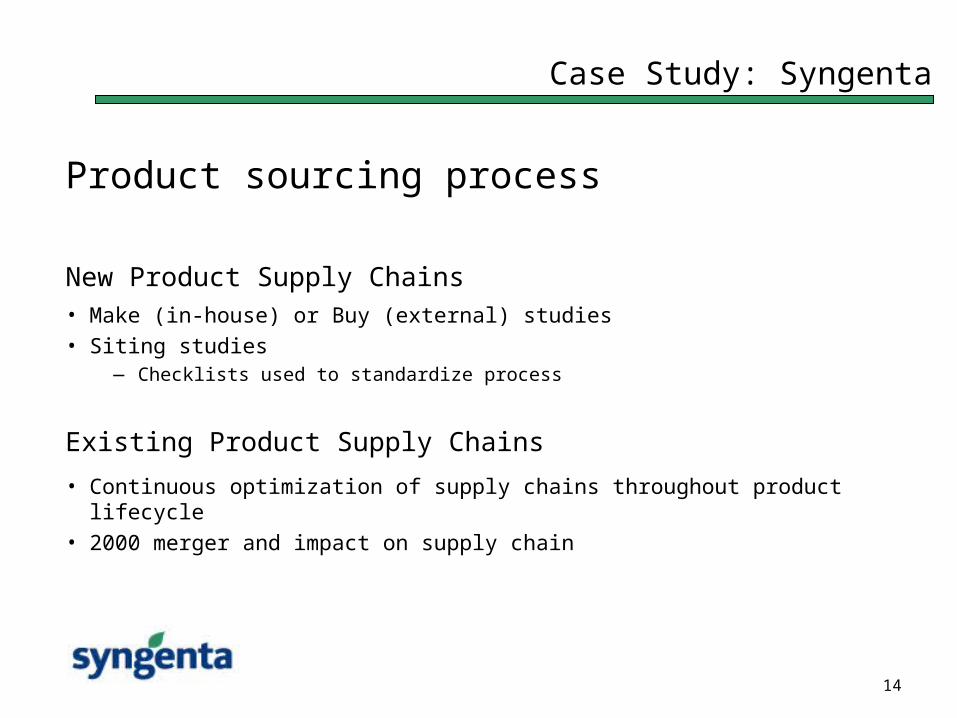
Product sourcing process
New Product Supply Chains• Make (in-house) or Buy (external) studies• Siting studies
— Checklists used to standardize process
Existing Product Supply Chains• Continuous optimization of supply chains throughout product lifecycle• 2000 merger and impact on supply chain
15
Case Study: Syngenta
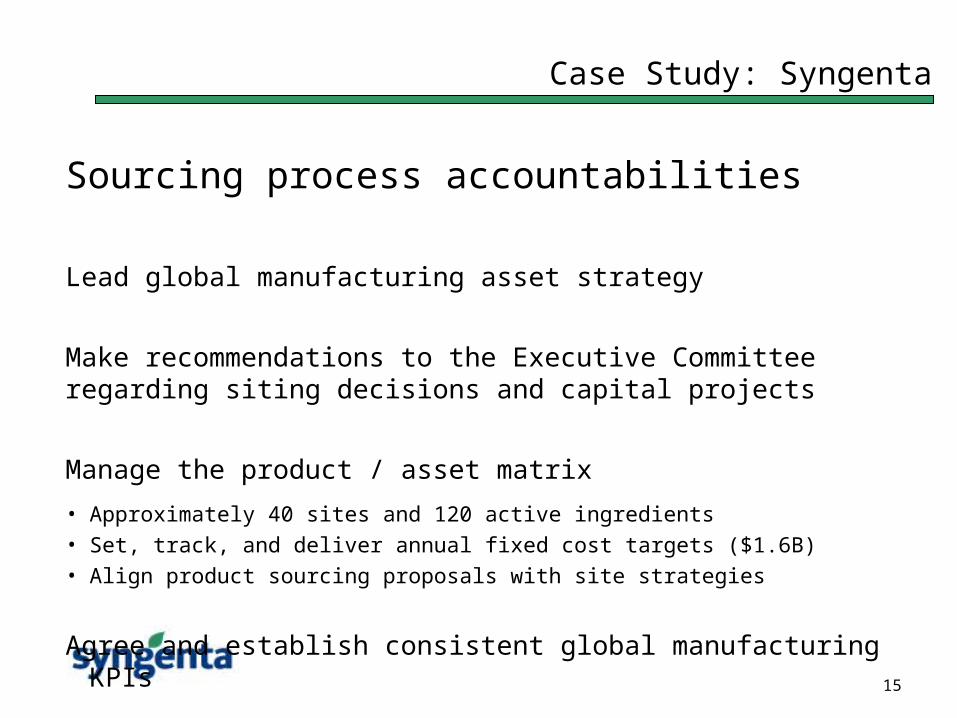
Sourcing process accountabilities
Lead global manufacturing asset strategy
Make recommendations to the Executive Committee regarding siting decisions and capital projects
Manage the product / asset matrix• Approximately 40 sites and 120 active ingredients• Set, track, and deliver annual fixed cost targets ($1.6B)• Align product sourcing proposals with site strategies
Agree and establish consistent global manufacturing KPIs
16
Case Study: Syngenta
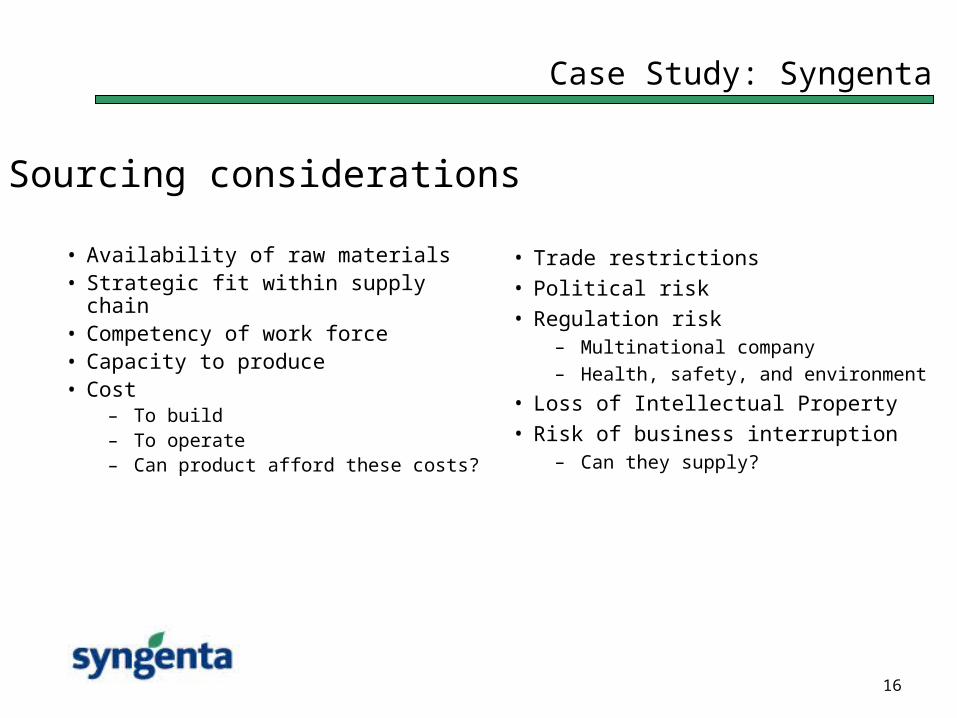
• Availability of raw materials• Strategic fit within supply chain• Competency of work force• Capacity to produce• Cost
– To build– To operate– Can product afford these costs?
• Trade restrictions
• Political risk
• Regulation risk– Multinational company– Health, safety, and environment
• Loss of Intellectual Property
• Risk of business interruption– Can they supply?
Sourcing considerations
17
Case Study: Syngenta
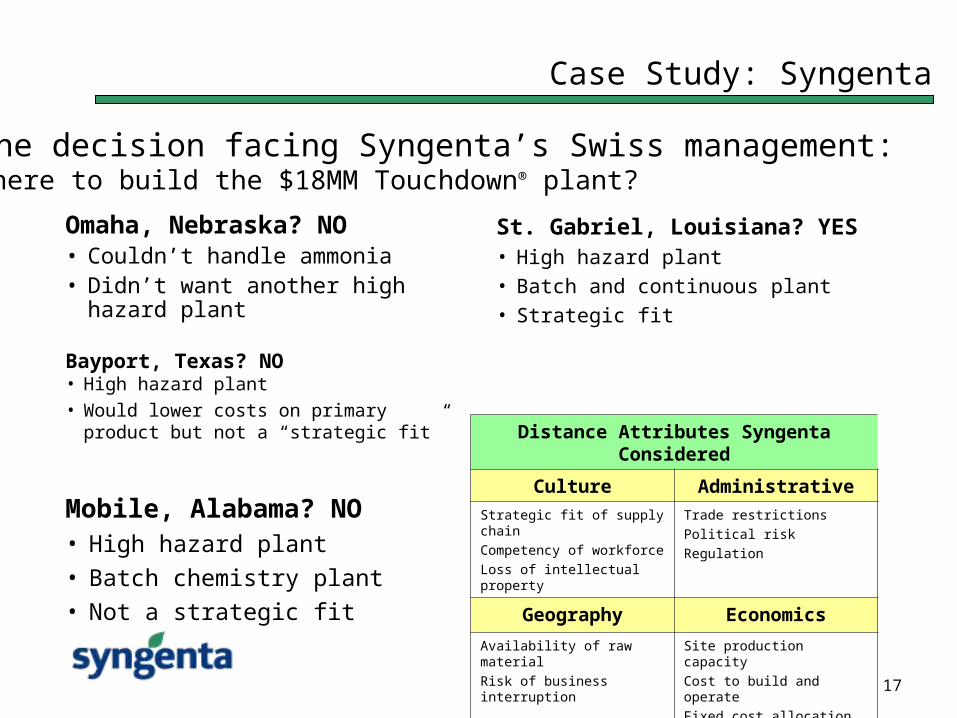
Omaha, Nebraska? NO• Couldn’t handle ammonia• Didn’t want another high hazard
plant
Mobile, Alabama? NO• High hazard plant
• Batch chemistry plant
• Not a strategic fit
The decision facing Syngenta’s Swiss management:Where to build the $18MM Touchdown® plant?
Bayport, Texas? NO• High hazard plant
• Would lower costs on primary product but not a “strategic fit”
St. Gabriel, Louisiana? YES• High hazard plant
• Batch and continuous plant
• Strategic fit
Distance Attributes Syngenta Considered
Culture Administrative
Strategic fit of supply chain
Competency of workforce
Loss of intellectual property
Trade restrictions
Political risk
Regulation
Geography Economics
Availability of raw material
Risk of business interruption
Site production capacity
Cost to build and operate
Fixed cost allocation
18
Case Study: GE
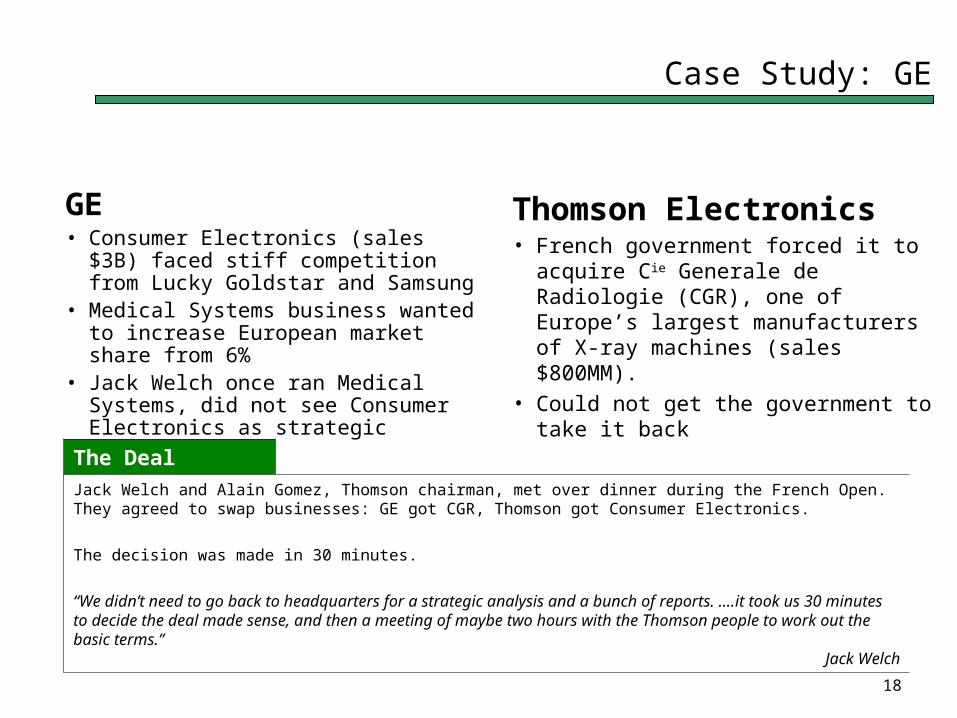
GE• Consumer Electronics (sales $3B) faced
stiff competition from Lucky Goldstar and Samsung
• Medical Systems business wanted to increase European market share from 6%
• Jack Welch once ran Medical Systems, did not see Consumer Electronics as strategic
Thomson Electronics• French government forced it to acquire Cie
Generale de Radiologie (CGR), one of Europe’s largest manufacturers of X-ray machines (sales $800MM).
• Could not get the government to take it back
The Deal
Jack Welch and Alain Gomez, Thomson chairman, met over dinner during the French Open. They agreed to swap businesses: GE got CGR, Thomson got Consumer Electronics.
The decision was made in 30 minutes.
“We didn’t need to go back to headquarters for a strategic analysis and a bunch of reports. ….it took us 30 minutes to decide the deal made sense, and then a meeting of maybe two hours with the Thomson people to work out the basic terms.”
Jack Welch
19
Case Study: GE
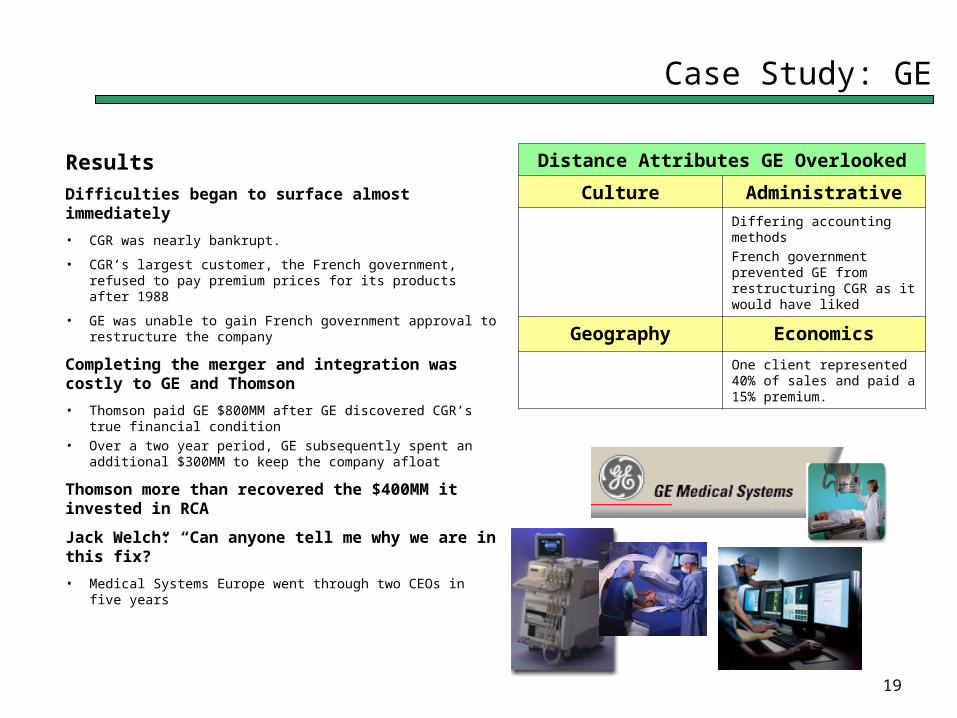
Distance Attributes GE Overlooked
Culture Administrative
Differing accounting methods
French government prevented GE from restructuring CGR as it would have liked
Geography Economics
One client represented 40% of sales and paid a 15% premium.
Results
Difficulties began to surface almost immediately
• CGR was nearly bankrupt.
• CGR’s largest customer, the French government, refused to pay premium prices for its products after 1988
• GE was unable to gain French government approval to restructure the company
Completing the merger and integration was costly to GE and Thomson
• Thomson paid GE $800MM after GE discovered CGR’s true financial condition
• Over a two year period, GE subsequently spent an additional $300MM to keep the company afloat
Thomson more than recovered the $400MM it invested in RCA
Jack Welch: “Can anyone tell me why we are in this fix?”
• Medical Systems Europe went through two CEOs in five years
20
Case Study: Vivendi
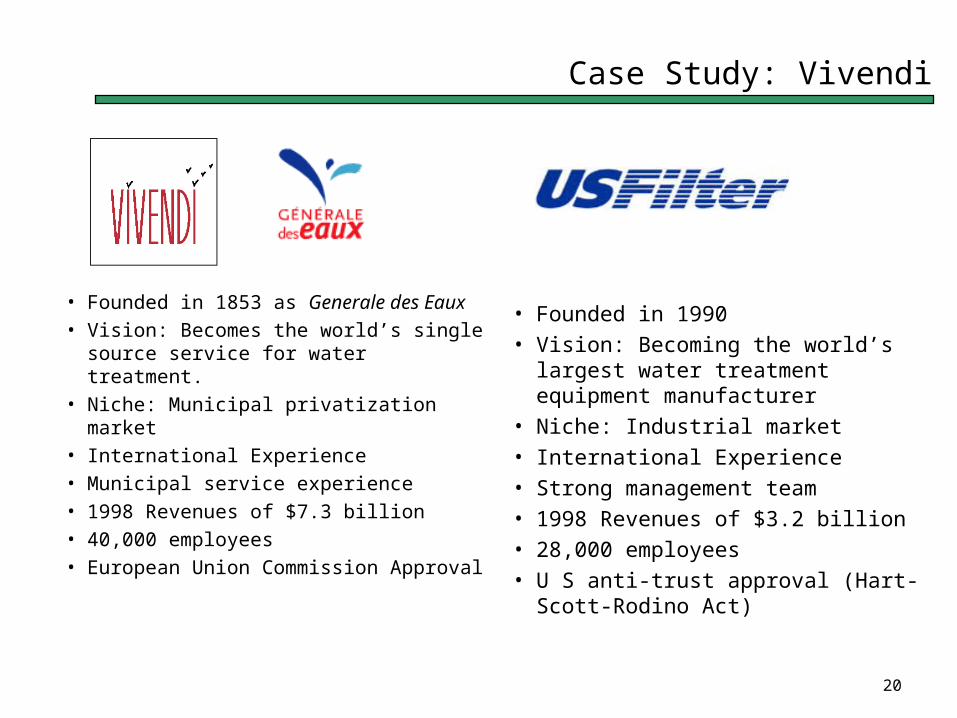
• Founded in 1853 as Generale des Eaux• Vision: Becomes the world’s single
source service for water treatment.• Niche: Municipal privatization market• International Experience• Municipal service experience• 1998 Revenues of $7.3 billion• 40,000 employees• European Union Commission Approval
• Founded in 1990• Vision: Becoming the world’s largest
water treatment equipment manufacturer• Niche: Industrial market• International Experience• Strong management team• 1998 Revenues of $3.2 billion• 28,000 employees• U S anti-trust approval (Hart-Scott-Rodino
Act)
21
Case Study: Vivendi
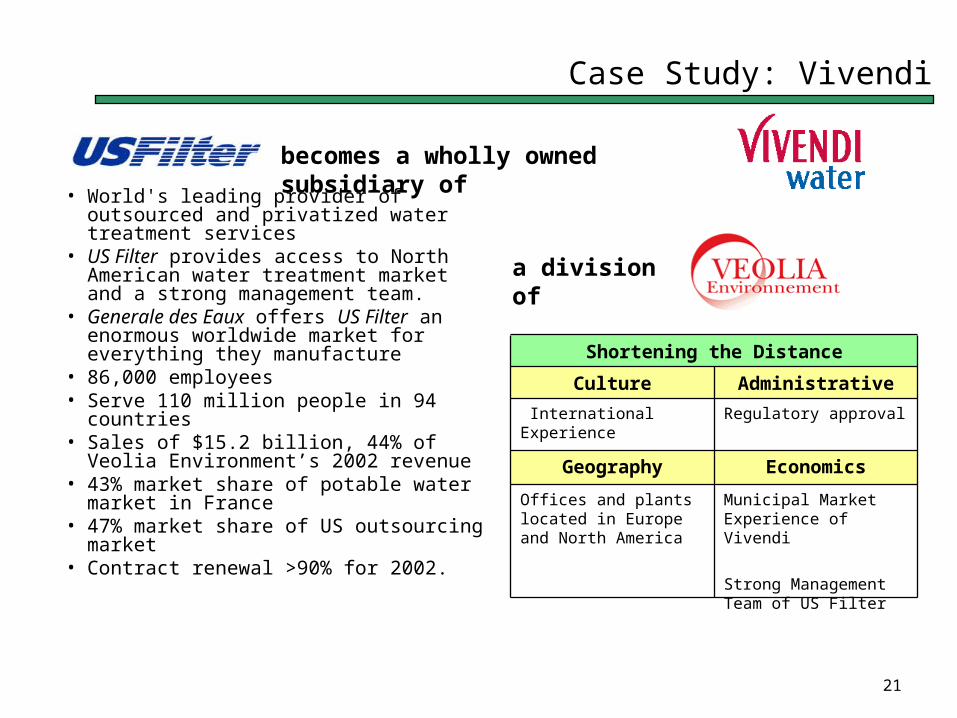
becomes a wholly owned subsidiary of
• World's leading provider of outsourced and privatized water treatment services
• US Filter provides access to North American water treatment market and a strong management team.
• Generale des Eaux offers US Filter an enormous worldwide market for everything they manufacture
• 86,000 employees• Serve 110 million people in 94 countries• Sales of $15.2 billion, 44% of Veolia
Environment’s 2002 revenue • 43% market share of potable water
market in France• 47% market share of US outsourcing
market• Contract renewal >90% for 2002.
Shortening the Distance
Regulatory approval International Experience
Municipal Market Experience of Vivendi
Strong Management Team of US Filter
Offices and plants located in Europe and North America
EconomicsGeography
AdministrativeCulture
a division of
22
Conclusion
The FDI decision making process is not uniform when applied to the global market. Regional economic and political issues influence FDI decisions.
Investments are often made without fully investigating non-economic factors that can significantly affect the investment’s return.
The FDI fitness and CAGE FDI frameworks can be used to ensure often overlooked aspects of a potential market are considered.

23
Appendix
24
References
1. Laura Alfaro, “Foreign Direct Investment”, Harvard Business School, October 2002
2. US Department of Treasury, “Foreign Portfolio Investment Benchmark Surveys”, www.ustreas.gov/tic/fpis.html
3. US Department of Commerce, Bureau of Economic Analysis, www.bea.gov
4. “The 2002 State New Economy Index”, Progressive Policy Institute, www.neweconomyindex.org
5. “Growth Across Borders: Strategic Challenges of International Expansion”, Corporate Strategy Board, October 2001
6. “FDI Confidence Index: September 2002”, A.T. Kearney
7. “Foreign Direct Investment And Its Determinants In Emerging Economies”, African Economic Policy Paper, Saskia K.S. Wilhelms, July 1998
8. Pankaj Ghemawat, “Distance Still Matters: The Hard Reality of Global Expansion”, Harvard Business Review, September 2001
9. Jeffrey Frankel and Andrew Rose, “An Estimate Of The Effect Of Common Currencies On Trade And Income”, Draft paper, February 2002
25
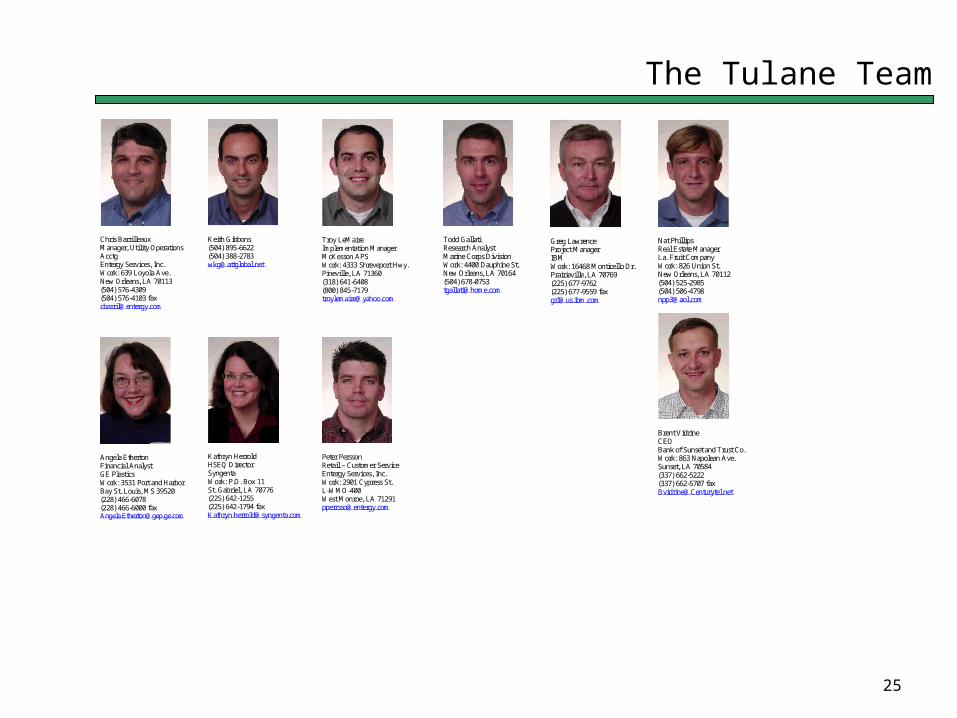
The Tulane Team
Chris Barrilleaux Manager, Utility Operations Acctg Entergy Services, Inc. Work: 639 Loyola Ave. New Orleans, LA 70113 (504) 576-4309 (504) 576-4103 fax [email protected]
Keith Gibbons (504) 895-6622 (504) 388-2783 [email protected]
Troy LeMaire Implementation Manager McKesson APS Work: 4333 Shreveport Hwy. Pineville, LA 71360 (318) 641-6408 (800) 845-7179 [email protected]
Angela Etherton Financial Analyst GE Plastics Work: 3531 Port and Harbor Bay St. Louis, MS 39520 (228) 466-6078 (228) 466-6000 fax [email protected]
Kathryn Herrold HSEQ Director Syngenta Work: P.O. Box 11 St. Gabriel, LA 70776 (225) 642-1255 (225) 642-1794 fax [email protected]
Peter Persson Retail – Customer Service Entergy Services, Inc. Work: 2901 Cypress St. L-WMO-400 West Monroe, LA 71291 [email protected]
Todd Gallati Research Analyst Marine Corps Division Work: 4400 Dauphine St. New Orleans, LA 70164 (504) 678-0753 [email protected]
Greg Lawrence Project Manager IBM Work: 16468 Monticello Dr. Prairieville, LA 70769 (225) 677-9762 (225) 677-9559 fax [email protected]
Nat Phillips Real Estate Manager La. Fruit Company Work: 826 Union St. New Orleans, LA 70112 (504) 525-2985 (504) 506-4798 [email protected]
Brent Vidrine CEO Bank of Sunset and Trust Co. Work: 863 Napolean Ave. Sunset, LA 70584 (337) 662-5222 (337) 662-5707 fax [email protected]
26
Additional Slides
The following slides expand upon the preceding discussion
Pages 26-28: FDI Investment in the United States
Pages 29-31: FDI Fitness
Page 32: CAGE Framework Case Study: Star TV
27
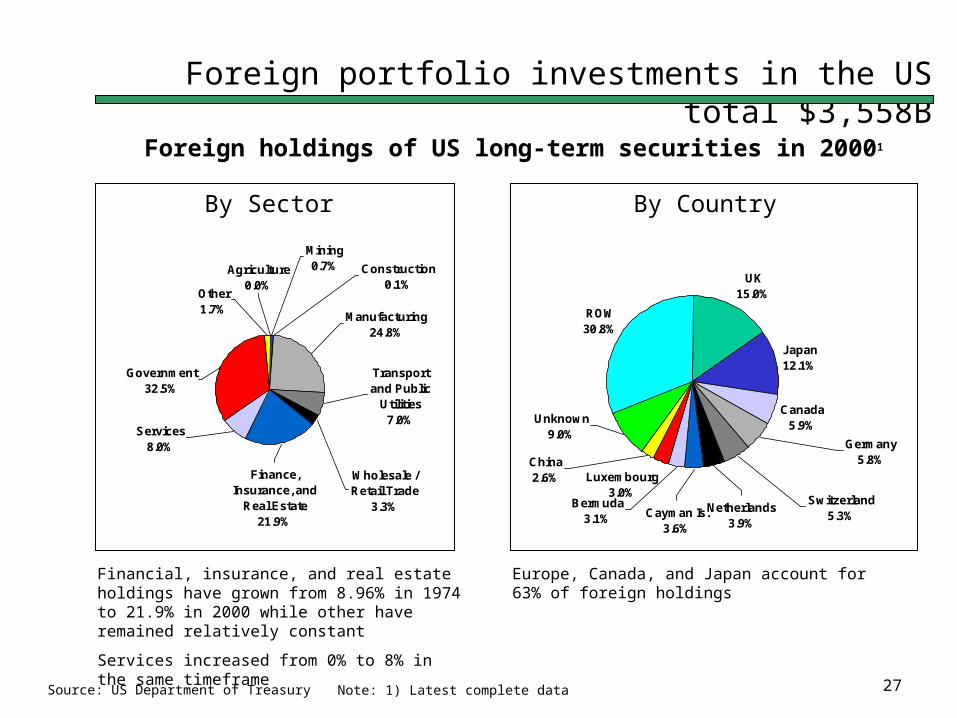
Foreign portfolio investments in the US total $3,558B
Foreign holdings of US long-term securities in 20001
UK15.0%
Japan12.1%
Canada5.9%
Luxembourg3.0%
ROW30.8%
Bermuda3.1%
China2.6%
Unknown9.0%
Switzerland5.3%
Germany5.8%
Netherlands3.9%
Cayman Is.3.6%
Europe, Canada, and Japan account for 63% of foreign holdings
By Sector By Country
Source: US Department of Treasury
Finance, Insurance, and
Real Estate21.9%
Wholesale / Retail Trade
3.3%
Manufacturing24.8%
Transport and Public
Utilities7.0%
Other1.7%
Services8.0%
Government32.5%
Construction0.1%
Agriculture0.0%
Mining0.7%
Financial, insurance, and real estate holdings have grown from 8.96% in 1974 to 21.9% in 2000 while other have remained relatively constant
Services increased from 0% to 8% in the same timeframe
Note: 1) Latest complete data
28
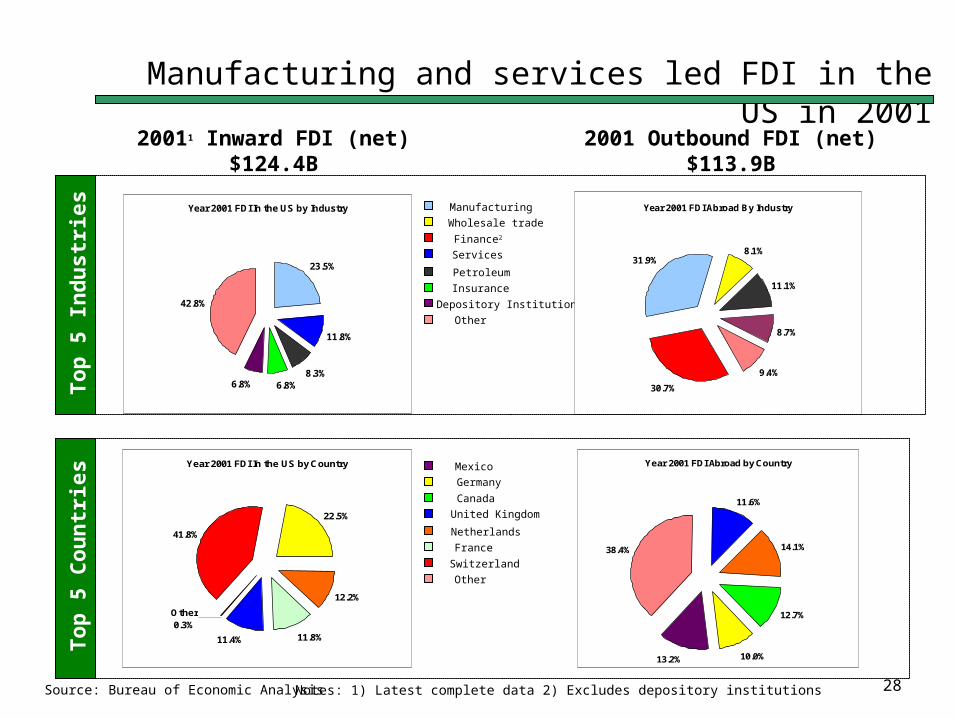
Manufacturing and services led FDI in the US in 2001
Year 2001 FDI In the US by Industry
23.5%
11.8%
8.3%6.8%6.8%
42.8%
Mexico
Germany
Canada
United Kingdom
Netherlands
France
Switzerland
Other
Manufacturing
Wholesale trade
Finance2
Services
Petroleum
Insurance
Depository Institutions
Other
Source: Bureau of Economic Analysis
20011 Inward FDI (net)$124.4B
2001 Outbound FDI (net)$113.9B
Year 2001 FDI Abroad By Industry
30.7%
31.9%8.1%
11.1%
8.7%
9.4%
Year 2001 FDI Abroad by Country
11.6%
14.1%
12.7%
10.0%13.2%
38.4%
Year 2001 FDI In the US by Country
41.8%
22.5%
12.2%
11.8%11.4%
Other0.3%
Notes: 1) Latest complete data 2) Excludes depository institutions
To
p 5
Ind
ust
ries
To
p 5
Co
un
trie
s
29
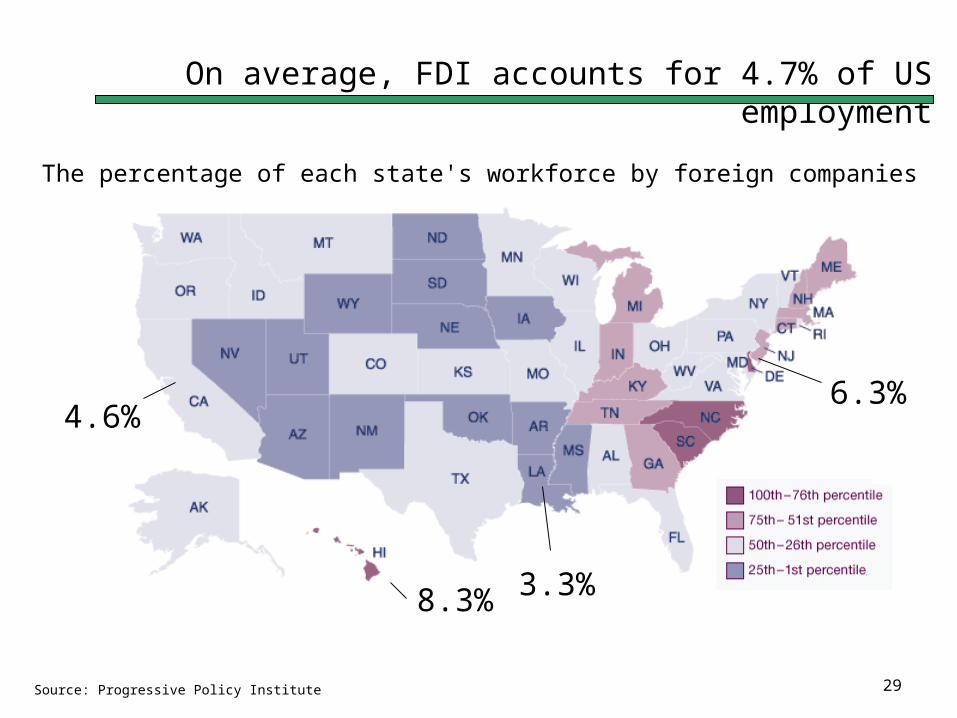
On average, FDI accounts for 4.7% of US employment
The percentage of each state's workforce by foreign companies
8.3%
4.6%6.3%
3.3%
Source: Progressive Policy Institute
30
Concept of Institutional FDI Fitness
FDI Fitness indicates a country’s ability to attract, absorb, and retain FDI
• Supplemental framework for assessing FDI nation candidates• Demonstrates country’s adaptability to economic or market driven changes• Fitness theory suggests that abundant natural resources do not automatically mean a
country is a good FDI candidate• Foreign investor’s highly value flexibility rather than an intransigent environment• FDI fitness is grounded in a nation’s institutions
FDI Fitness Institutions:
• Government• Markets• Education• Socioculture
31
Institutional Fitness Pyramid
Government FitnessLegislative Executive Judiciary
Market FitnessGoods Services Capital Linkages
Educational Fitness
Sociocultural Fitness
More D
iffusion
Incr
easi
ng C
once
ntra
tion
Institutional Fitness Pyramid
Source: “FDI and Its Determinants in Emerging Economies,” Saskia Wilhelms, July 1998
32
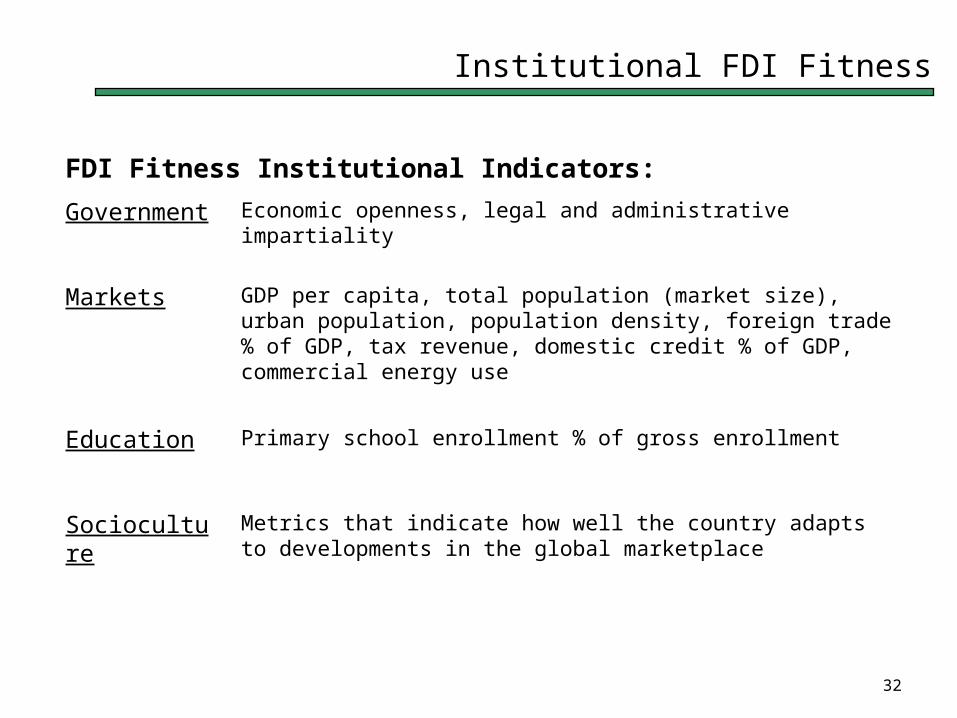
Institutional FDI Fitness
FDI Fitness Institutional Indicators:
Government Economic openness, legal and administrative impartiality
Markets GDP per capita, total population (market size), urban population, population density, foreign trade % of GDP, tax revenue, domestic credit % of GDP, commercial energy use
Education Primary school enrollment % of gross enrollment
Socioculture Metrics that indicate how well the country adapts to developments in the global marketplace
33
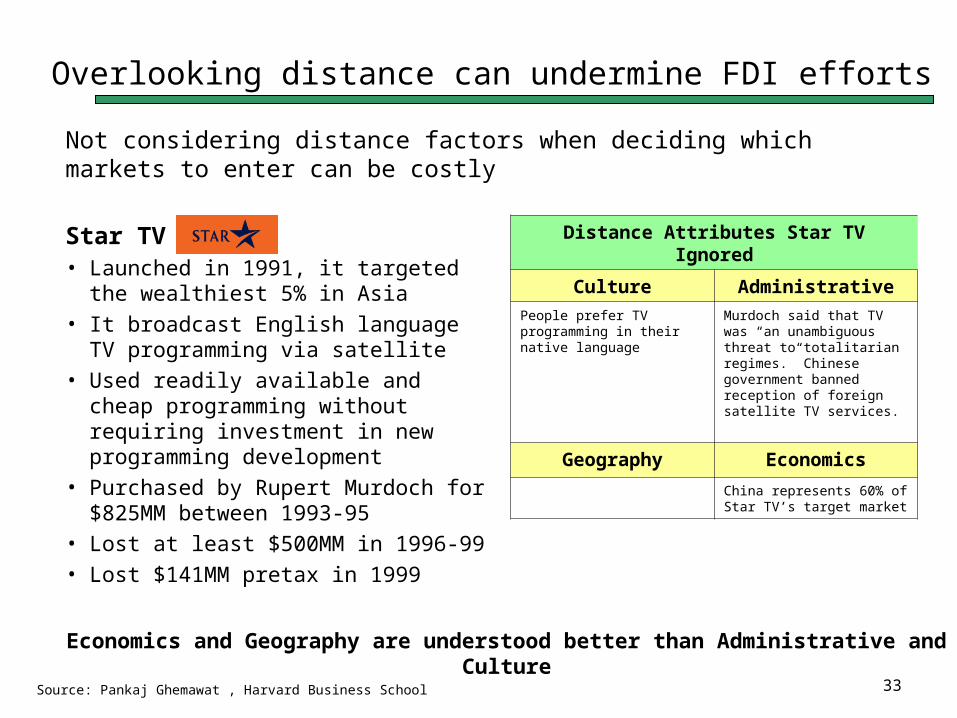
Overlooking distance can undermine FDI efforts
Source: Pankaj Ghemawat , Harvard Business School
Not considering distance factors when deciding which markets to enter can be costly
Star TV• Launched in 1991, it targeted the
wealthiest 5% in Asia• It broadcast English language TV
programming via satellite• Used readily available and cheap
programming without requiring investment in new programming development
• Purchased by Rupert Murdoch for $825MM between 1993-95
• Lost at least $500MM in 1996-99• Lost $141MM pretax in 1999
Distance Attributes Star TV Ignored
Culture Administrative
People prefer TV programming in their native language
Murdoch said that TV was “an unambiguous threat to totalitarian regimes.” Chinese government banned reception of foreign satellite TV services.
Geography Economics
China represents 60% of Star TV’s target market
Economics and Geography are understood better than Administrative and Culture


![Archivio Salvatore Rattu - Disegni architettonici ......[Rattu1964] Salvatore Rattu, Istituto per minorati psichici in Nuoro, Milano, Grafica Gallati, 1964 [Rattu1953] Salvatore Rattu,](https://img.pdfslide.net/doc/110x75/602a62f016ffd7336f42ea5c/archivio-salvatore-rattu-disegni-architettonici-rattu1964-salvatore.jpg)
![[1] Tosi D, Macchi EG, Gallati M, Braschi G, Cigada A ...€¦ · Web viewThe specific objective of the frameworks is the optimal integration of the local energy resources using](https://img.pdfslide.net/doc/110x75/5b73a4ec7f8b9a0c418e00e6/1-tosi-d-macchi-eg-gallati-m-braschi-g-cigada-a-web-viewthe-specific.jpg)
![Archivio Salvatore Rattu - Disegni architettonici: Inventario … · 2018. 7. 26. · [Rattu1964] Salvatore Rattu, Istituto per minorati psichici in Nuoro, Milano, Grafica Gallati,](https://img.pdfslide.net/doc/110x75/611ccf3a37547244861596b0/archivio-salvatore-rattu-disegni-architettonici-inventario-2018-7-26-rattu1964.jpg)