Embed Size (px)
Citation preview
GLOBAL EDUCATION DIGEST 2007Comparing Education Statistics Across the World
� ������ ������
The Global Education Digest (GED) 2007 presents a wide range of UNESCO education indicators that can be used to assess progress towards Education for All and Millennium Development Goals. These cross-nationally comparable indicators also provide benchmarks for the overall performance of national education systems.
The Digest provides data for the school year ending in 2005 or the latest year available. It includes new estimates for education expenditure by region and adds a new indicator of per pupil expenditure based on purchasing power parities. For comparisons over time, key indicators are also presented for 1999.
The 2007 edition of the GED focuses on the theme of financing education systems. The analytical overview surveys a range of global benchmarks for public spending on education, examines equity issues such as the distribution of funding by education level, and shows differences among countries in terms of the sources and uses of funds for education.
The UNESCO Institute for Statistics (UIS) is the statistical office of the United Nations Educational, Scientific and Cultural Organization (UNESCO) and is the UN depository for comparable statistics in the fields of education, science and technology, and culture and communication.
To access online resources related to the GED – including the statistical tables, time series data for years between 1999 and 2005, accompanying metadata and other materials – please consult: www.uis.unesco.org/publications/GED2007.
To order the interactive database on CD-Rom, please contact: [email protected].
UNESCO Institute for StatisticsP.O. Box 6128, Succursale Centre-VilleMontreal, Quebec H3C 3J7Canada
INS
TIT
UT
E
for
ST
AT
IST
ICS
UN
ES
CO
GLO
BAL ED
UC
ATIO
N D
IGEST 2007: Com
paring Education Statistics Across the World
UN
ES
CO
INS
TIT
UT
E for S
TA
TIS
TIC
S
GLOBAL EDUCATION DIGEST 2 0 0 7
Comparing Education Statistics Across the World
][
UNESCO Institute for StatisticsMontreal, 2007
3
Foreword
The authors are responsible for the choice and the presentation of the facts contained in this book and for the opinions expressed therein which are not necessarily those of UNESCO and do not commit the Organization.
The designations employed and the presentation of material throughout this publication do not imply the expression of any opinion whatsoever on the part of UNESCO concerning the legal status of any country, territory, city or area or of its authorities or concerning the delimitation of its frontiers or boundaries.
To access the electronic version of data tables, see www.uis.unesco.org/publications/GED2007.
UNESCO
The constitution of the United Nations Educational, Scientific and Cultural Organization (UNESCO) was adopted by 20 countries at the London Conference in November 1945 and entered into effect on 4 November 1946. The Organization currently has 192 Member States and six Associate Members.
The main objective of UNESCO is to contribute to peace and security in the world by promoting collaboration among nations through education, science, culture and communication in order to foster universal respect for justice, the rule of law, and human rights and fundamental freedoms that are affirmed for the peoples of the world, without distinction of race, sex, language or religion, by the Charter of the United Nations.
To fulfill its mandate, UNESCO performs five principal functions: 1) prospective studies on education, science, culture and communication for tomorrow’s world; 2) the advancement, transfer and sharing of knowledge through research, training and teaching activities; 3) standard-setting actions for the preparation and adoption of internal instruments and statutory recommendations; 4) expertise through technical co-operation to Member States for their development policies and projects; and 5) the exchange of specialised information.
UNESCO is headquartered in Paris, France.
The UNESCO Institute for Statistics
The UNESCO Institute for Statistics (UIS) is the statistical office of UNESCO and is the UN depository for global statistics in the fields of education, science and technology, culture and communication.
The UIS was established in 1999. It was created to improve UNESCO’s statistical programme and to develop and deliver the timely, accurate and policy-relevant statistics needed in today’s increasingly complex and rapidly changing social, political and economic environments.
The UIS is based in Montreal, Canada.
Published in 2007 by:
UNESCO Institute for Statistics
P.O. Box 6128, Succursale Centre-Ville
Montreal, Quebec H3C 3J7
Canada
Tel: (1 514) 343-6880
Fax: (1 514) 343-5740
Email: [email protected]
http://www.uis.unesco.org
© UNESCO-UIS 2007
Ref: UIS/SD/07-01
ISBN: 978-92-9189-044-6
Design: Sabine Lebeau / les souris zélées
Photo credits: Julien Mailler, Tatsuo Fukutomi, Crissie Hardy, Mae Gammino
Printing: Tri-Graphic Printing Limited
3
Foreword Foreword
The analysis in this year’s Global Education Digest (GED) focuses on the financing of education, especially at the primary level. As national policymakers set goals and objectives for their education systems, such as expanding access or improving quality, they need to consider the resources required and weigh them against other needs. Increasingly, policymakers look to international comparisons for guidance in whether they are investing sufficient levels of resources in education and whether they are using these resources efficiently and effectively.
As stated by the international community in the Dakar Framework for Action, “no country shall be thwarted from meeting the [EFA] goals due to lack of resources” (Education for All Forum, 2000). In response, national governments, international organizations and donors must assess the gap in levels of resources currently invested in EFA and those required to actually achieve the goals. In particular, there is significant interest in benchmarking government efforts to provide universal primary education.
The role of public financing of education is crucial. For most countries, the state plays the predominant role in the management and financing of the education system. How governments fund educational institutions is central to a number of important policy debates that have gained greater attention in the last decade, such as decentralisation and privatisation.
For this analysis, the UNESCO Institute for Statistics (UIS) draws on a wide range of data and highlights where additional information is needed to better monitor progress and guide policy decisions. It surveys how much governments invest in education, both in relation to their national income and in terms of absolute levels of expenditure. It presents new indicators to analyse spending levels across countries, most notably by reporting on expenditure in purchasing power parities. This allows for greater comparability across countries than the use of market exchange rates by reflecting actual price structures for education provision in countries.
The analysis finds that global spending on education is concentrated in a handful of more-developed countries. For example, the United States, which is home to just 4% of the world’s population aged 5 to 25 years, accounts for more than one-quarter of the global education budget. The United States spends almost as much as that of all governments in six regions combined: the Arab States, Central and Eastern Europe, Central Asia, Latin America and the Caribbean, South and West Asia and sub-Saharan Africa. At the same time, governments in sub-Saharan Africa spend only 2.4% of the world’s education resources for 15% of the school-age population. According
4 5
to estimates, the education budget of a single country like France, Germany or Italy outweighs the education expenditure in the entire sub-Saharan African region combined.
But the inequalities are even sharper within countries because children and young people do not have equal access to education. Some children never enter school and therefore receive no benefit from public funding for education. According to entry rates, one out of three children in sub-Saharan countries does not have access to school and, thus, public resources for education. Many other children enter school but then drop out before completing primary education. So they only benefit from a few years of public spending. On the other hand, the small group of students who go on to secondary or tertiary education receive the greatest benefit from public education funds.
International financial statistics are often criticized for shortcomings in comparability. While there is still much room for improvement, the UIS has reinforced initiatives with individual Member States to improve the quality of these data, particularly in terms of public expenditure on education. The UIS has made greater efforts to document data sources underlying finance indicators and to identify problems with definitions, as well as data gaps and areas requiring further development.
Moreover, the UIS collects data to monitor progress towards the international education-related targets, such as EFA and the Millennium Development Goals. The Institute undertakes a number of activities across countries which seek to improve the timeliness, comparability, completeness and reliability of data. For example, a series of regional workshops on education statistics are taking place in 2007 for statisticians and policymakers in Member States. These intensive exchanges lead to improvements in the scope and comparability of data by implementing international measurement standards.
This report is complemented by an interactive database which is accessible on-line at www.uis.unesco.org/publications/GED2007 or on CD-ROM (see section on On-line Resources). The database contains additional indicators and time series that are not presented in the print version of the Digest. Key indicators in the on-line database are updated regularly and provide access to the most timely international education data available.
Hendrik van der PolDirectorUNESCO Institute for Statistics
4 5
Contents
Foreword 3
Acknowledgements 6
Costs and commitments in financing Education for All 7
Reader’s guide 55
Statistical tables 59
1. Pre-primary education / ISCED 0 / Enrolment and teaching staff 60
2. Primary education / ISCED 1 / New entrants 70
3. Primary education / ISCED 1 / Enrolment and teaching staff 80
4. Measures of progression and completion in primary education / ISCED 1 90
5. Secondary education / ISCED 2 and 3 / Enrolment and repeaters / 2005 100
6. Secondary and post-secondary non-tertiary education / ISCED 2, 3 and 4 / 110Teaching staff and post-secondary non-tertiary enrolment / 2005
7. Upper secondary (ISCED 3) graduation and entry to tertiary (ISCED 5) education / 1202005 (selected countries)
8. Tertiary education / ISCED 5 and 6 / Enrolment and teaching staff 124
9. Internationally mobile students in tertiary education by host country and 134region of origin / 2005 (countries having more than 1000 mobile students)
10. International flows of mobile students in tertiary education / 2005 138
11. Tertiary education / ISCED 5 and 6 / Graduates by field of education / 2005 144
12. School life expectancy 154
13. Public expenditure on education and expenditure on education by nature 164of spending / Financial year ending in 2005 or latest year available
14. Expenditure on educational institutions as a percentage of gross domestic product / 174Financial year ending in 2005 or latest year available
15. Adult and youth literacy / 1995-2005 184
ANNEX A / Glossary 191
ANNEX B / Definitions of indicators 196
ANNEX C / International Standard Classification of Education (ISCED97) 200
ANNEX D / Regions 202
ANNEX E / On-line resources 205
ANNEX F / UIS publications 206
6 7
This Global Education Digest is based on data provided by the countries or territories covered in this publication. We would like to express our gratitude to all those statisticians who, in each country and territory, took the time to respond to the UIS, UOE or WEI questionnaires as well as our requests for clarification. We would also like to express our thanks to the international organizations, in particular the United Nations Statistics and Population Divisions, the World Bank, the Organisation for Economic Co-operation and Development (OECD), Eurostat and other specialised institutions, that supplied additional information and statistics to complement those gathered directly by the UIS.
This publication is possible thanks to the work of a number of staff members of the UIS.
The overall preparation of the data presented in this report was the responsibility of Juan Cruz Perusia, under the supervision of Alison Kennedy and Michael Bruneforth, and with the collaboration of a team consisting of: Aurélie Acoca, Saïd Belkachla, Hugo Castellano Tolmos, Ghania Djafri, Léandre Francisco, Monica Githaiga, Tin Nam Ho, Olivier Labé, Anne-Marie Lacasse, Weixin Lu, Lucy Hong Mei, Saïd Ould Voffal, John Pacifico, José Pessoa, Pascale Ratovondrahona, Ioulia Sementchouk and Anuja Singh.
The overview chapter was prepared by Michael Bruneforth and Albert Motivans and edited by Amy Otchet. Others providing inputs to the chapter were: Yanhong Zhang, Keith Hinchliffe, Serge Peano and Aurélie Acoca. We also thank the anonymous reviewers of the chapter.
Katja Frostell and Ian Denison coordinated the content and production of the Digest in print, and Brian Buffett and Adriano Miele managed the production of the CD-ROM. Thanks also go to the other staff of the UIS who made contributions to the Digest.
Acknowledgements
6 7
INTRODUCTION
The financing of Education for All (EFA) has become a key issue in national and international efforts to achieve universal primary education by 2015. Basic education is widely recognised as an essential human right and a key to poverty alleviation and sustainable human development. Yet, some governments are unable to provide sufficient resources to provide free basic education for all. This, in turn, has highlighted the role of the international donor community in closing the gap. Measures must first better assess the capacity of governments (and societies) to mobilise needed resources. They must also reflect the demographic constraints and policy trade-offs that influence a government’s ability to achieve EFA goals.
A number of studies have sought to identify country characteristics which are associated with progress towards education goals. These studies repeatedly stress the importance of ensuring a sufficient and stable source of funding for education (Colclough with Lewin, 1993; Mehrotra, 1998; Bruns, Mingat and Rakotomalala, 2003). Countries with relatively high primary gross enrolment ratios and primary completion rates generally devote a greater share of national income or government budgets to public primary education. In addition, expenditure per primary pupil also tends to be in the middle of the range (relative to GDP per capita). However, the level of public funding alone does not indicate good outcomes. Successful governments also find a balance between private and public education costs as they improve efficiency and prioritise primary school expenditure (Colclough and Al-Sammarai, 2000).
For most countries, the state plays the predominant role in the management and financing of the education system, especially at the primary level. Governments must often make difficult decisions about mobilising and allocating these resources, especially in light of rising demand from other public service sectors, such as infrastructure or health care. There is also competition within the education system. For example, universities and secondary schools often vie for the same funding as primary schools.
Policymakers also face other trade-offs when setting goals for their education systems. Would resources be better spent expanding access to schooling or improving the quality of instruction? And what levels of funding are required? Cross-national comparisons can help authorities to assess whether they are adequately investing in education and using these resources in the most effective, efficient and equitable manner.
It is difficult to link resource levels to potential educational outcomes. It is clearly not enough to simply change spending patterns to bring about a desired outcome. Education financing must be used in an effective and efficient manner for positive change. Moreover, system-level indicators (such as spending as a share of national income or GDP) do not provide a clear picture of the effective use of resources and their impact on learning. Thus, it is important to combine these indicators with measures of system performance and learning outcomes to provide greater insight.
This overview looks at four major funding issues for policymakers. The first section reviews overall levels of education funding across the world and how levels in certain countries compare to those of others with similar economic resources and student populations.
Costs and commitments in financing Education for All
8
C O S T S A N D C O M M I T M E N T S I N F I N A N C I N G E D U C A T I O N F O R A L L
9
G L O B A L E D U C A T I O N D I G E S T 2 0 0 7 C O M P A R I N G E D U C A T I O N S T A T I S T I C S A R O U N D T H E W O R L D
The discussion in Section 2 focuses on the costs of education in absolute and relative terms across countries. Policymakers must examine the mix of investment at different levels of education. This section looks at whether resources are concentrated in expanding access to primary education for a broader segment of the population or if the priority is higher education, where a much narrower part of the population benefits from public investment.
Section 3 presents some of the constraints and opportunities to financing primary education for all. It examines trends in demographics, education participation and progression in order to analyse the factors which influence current and future patterns of education spending.
Section 4 addresses another key concern for policymakers: the mix of public and private funding for education. It analyses the available comparative evidence on private contributions to financing education systems, the prevalence of public and privately-funded institutions, and the use of state subsidies for educational institutions through households and individuals.
1. MEASURING AVAILABLE RESOURCES AND GOVERNMENT COMMITMENT
As stated by the international community in the Dakar Framework for Action, “no country shall be thwarted from meeting the [EFA] goals due to lack of resources” (Education for All Forum, 2000). In response, national governments, international organizations and donors must assess the levels of resources currently invested in EFA and those required to actually achieve the goals. In particular, there is growing attention to benchmarking the efforts by governments in terms of resources devoted to universal primary education.
This section looks at two main indicators used to measure government commitment to education. The first consists of education expenditure as a share of national wealth or gross domestic product (GDP) per capita. This represents
the available resources for education in the broadest sense. It is then possible to better gauge government commitment by the second indicator, which represents the share of the total public budget devoted to education. It reflects the commitment of governments to education and the extent to which the sector can compete with other public spending priorities.
It is important to recognise that these indicators only reflect public education expenditure – not private investment. Only one-quarter of the world’s countries are able to provide internationally comparable data on private education expenditure (see Statistical Table 14). They are typically among the world’s most-developed countries. Section 4 presents a more detailed perspective on the entire range of funding sources.
In this section, patterns of government spending on education for 136 countries with available data are presented. The focus shifts from patterns in overall spending on education to the specific commitment of governments for funding primary education.
Government spending on education - Global and regional averages
The overall level of funding for education is an important issue facing policymakers. Is there sufficient funding to provide children with a good quality education? How much do countries with similar economic resources and student populations invest in education? Global and regional averages for education indicators help to provide a context for analysing country-level data.
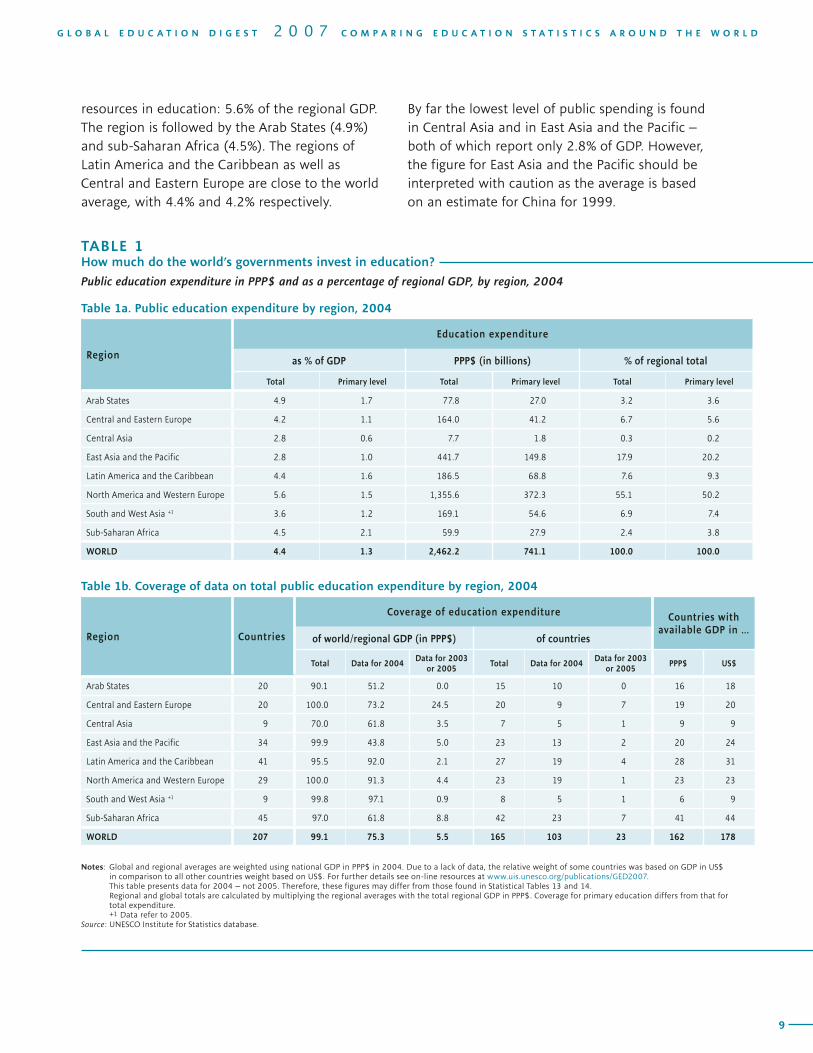
Table 1 shows that governments of the world invested the equivalent of PPP$ 2.5 trillion in education in 2004. This figure represents 4.4% of global GDP in PPP$. (See Box 1 for an explanation of PPP dollars, which are the basis for all regional figures.)
Governments in North America and Western Europe invested the highest shares of national
8
C O S T S A N D C O M M I T M E N T S I N F I N A N C I N G E D U C A T I O N F O R A L L
9
G L O B A L E D U C A T I O N D I G E S T 2 0 0 7 C O M P A R I N G E D U C A T I O N S T A T I S T I C S A R O U N D T H E W O R L D
resources in education: 5.6% of the regional GDP. The region is followed by the Arab States (4.9%) and sub-Saharan Africa (4.5%). The regions of Latin America and the Caribbean as well as Central and Eastern Europe are close to the world average, with 4.4% and 4.2% respectively.
By far the lowest level of public spending is found in Central Asia and in East Asia and the Pacific – both of which report only 2.8% of GDP. However, the figure for East Asia and the Pacific should be interpreted with caution as the average is based on an estimate for China for 1999.
TABLE 1How much do the world’s governments invest in education?
Public education expenditure in PPP$ and as a percentage of regional GDP, by region, 2004
Table 1a. Public education expenditure by region, 2004
Region
Education expenditure
as % of GDP PPP$ (in billions) % of regional total
Total Primary level Total Primary level Total Primary level
Arab States 4.9 1.7 77.8 27.0 3.2 3.6
Central and Eastern Europe 4.2 1.1 164.0 41.2 6.7 5.6
Central Asia 2.8 0.6 7.7 1.8 0.3 0.2
East Asia and the Pacific 2.8 1.0 441.7 149.8 17.9 20.2
Latin America and the Caribbean 4.4 1.6 186.5 68.8 7.6 9.3
North America and Western Europe 5.6 1.5 1,355.6 372.3 55.1 50.2
South and West Asia +1 3.6 1.2 169.1 54.6 6.9 7.4
Sub-Saharan Africa 4.5 2.1 59.9 27.9 2.4 3.8
WORLD 4.4 1.3 2,462.2 741.1 100.0 100.0
Table 1b. Coverage of data on total public education expenditure by region, 2004
Region Countries
Coverage of education expenditure Countries with available GDP in …
of world/regional GDP (in PPP$) of countries
Total Data for 2004Data for 2003
or 2005Total Data for 2004
Data for 2003 or 2005
PPP$ US$
Arab States 20 90.1 51.2 0.0 15 10 0 16 18
Central and Eastern Europe 20 100.0 73.2 24.5 20 9 7 19 20
Central Asia 9 70.0 61.8 3.5 7 5 1 9 9
East Asia and the Pacific 34 99.9 43.8 5.0 23 13 2 20 24
Latin America and the Caribbean 41 95.5 92.0 2.1 27 19 4 28 31
North America and Western Europe 29 100.0 91.3 4.4 23 19 1 23 23
South and West Asia +1 9 99.8 97.1 0.9 8 5 1 6 9
Sub-Saharan Africa 45 97.0 61.8 8.8 42 23 7 41 44
WORLD 207 99.1 75.3 5.5 165 103 23 162 178
Notes: Global and regional averages are weighted using national GDP in PPP$ in 2004. Due to a lack of data, the relative weight of some countries was based on GDP in US$ in comparison to all other countries weight based on US$. For further details see on-line resources at www.uis.unesco.org/publications/GED2007.
This table presents data for 2004 – not 2005. Therefore, these figures may differ from those found in Statistical Tables 13 and 14. Regional and global totals are calculated by multiplying the regional averages with the total regional GDP in PPP$. Coverage for primary education differs from that for
total expenditure.+1 Data refer to 2005.
Source: UNESCO Institute for Statistics database.
10
C O S T S A N D C O M M I T M E N T S I N F I N A N C I N G E D U C A T I O N F O R A L L
11
G L O B A L E D U C A T I O N D I G E S T 2 0 0 7 C O M P A R I N G E D U C A T I O N S T A T I S T I C S A R O U N D T H E W O R L D
Differences across countries in public education expenditure as a percentage of GDP are enormous. Governments investing high levels in education spend 8 to 20 times more than low-spending countries in relative terms. In 11 countries, public expenditure on education is only 2% of GDP or lower: United Arab Emirates (1.3%) and Qatar (1.6%) in the Arab States; Indonesia (0.9%) and Cambodia (1.9%) in East Asia and the Pacifi c; the Dominican Republic (1.8%) and Bermuda (1.9%) in the Caribbean; and Equatorial Guinea (0.6%), Cameroon (1.8%), Zambia (2.0%), Gambia (2.0%) and Guinea (2.0%) in sub-Saharan Africa. None of
the countries in Central and Eastern Europe, Central Asia, Latin America, North America and Western Europe or South and West Asia refl ect such low rates of public investment.
On the other hand, public expenditure exceeds 8% of GDP in 10 countries: Vanuatu (9.6%) and Marshall Islands (11.8%) in East Asia and the Pacifi c; Saint Vincent and the Grenadines (8.2%), Guyana (8.5%), Saint Kitts and Nevis (9.3%) and Cuba (9.8%) in the Caribbean; Iceland (8.1%) and Denmark (8.5%) in Western Europe; and Botswana (10.7%) and Lesotho (13.4%) in sub-Saharan Africa. (See Statistical Table 13.)
BOX 1 What are PPP dollars?
In order to compare the absolute costs per student or the magnitude of national education budgets, it is essential to convert local currencies into a single standard. Results can vary widely according to the method of calculation used. In most cases, national currencies are based on the U.S. dollar at the market exchange rate.
Yet, it is widely accepted that purchasing power parities (PPP) better refl ect the real value of educational investments made by governments and families. PPPs are rates of currency conversion which eliminate differences in price levels among countries. This means that a given sum of money, when converted into U.S. dollars at PPP rates, will buy the same basket of goods and services in all countries.
On the basis of PPPs, the global education budget in 2004 was worth the equivalent of $2.46 trillion. This fi gure would fall to 1.97 trillion if converted into U.S. dollars on the basis of market exchange rates. From a policymaking perspective, this difference may not be signifi cant. However, the choice of conversion technique can seriously distort regional and national comparisons, especially when considering inequalities among countries. For example, the educational budget for sub-Saharan Africa in US$ represents just 1.1% of the global total, compared to 2.4% in PPP$.
The consequences may be even greater when comparing absolute expenditure per student. To evaluate the value of educational resources, it is essential to consider the purchasing power of these funds rather than the international market price. For example, annual expenditure per primary student in Guatemala and Kenya appear to be identical at US$ 105. But in effect, that same amount of spending will buy pupils in Kenya PPP$ 252 worth of goods and services, compared to just PPP$ 202 in Guatemala.
10
C O S T S A N D C O M M I T M E N T S I N F I N A N C I N G E D U C A T I O N F O R A L L
11
G L O B A L E D U C A T I O N D I G E S T 2 0 0 7 C O M P A R I N G E D U C A T I O N S T A T I S T I C S A R O U N D T H E W O R L D
How do the global distributions of public education expenditure, national income and population compare?
Global distribution of public expenditure on education, GDP and population aged 5 to 25 years, by region and for selected countries, 2004
FIGURE 1
��� ������ ��� ��� ��� ��� ���
����
������ ���
��� ��� ���
����
����
�
��
��
��
��
��
��
�����
�����
������
�����
������
�������������
�������
�����
�
������
�����������
�����������������
����������
����������
�������������
����������������
���������������
������������
���������������������
�����
����������
�������
������
�������������������������
������������������������������������������������� ������������������������ �����������������������������
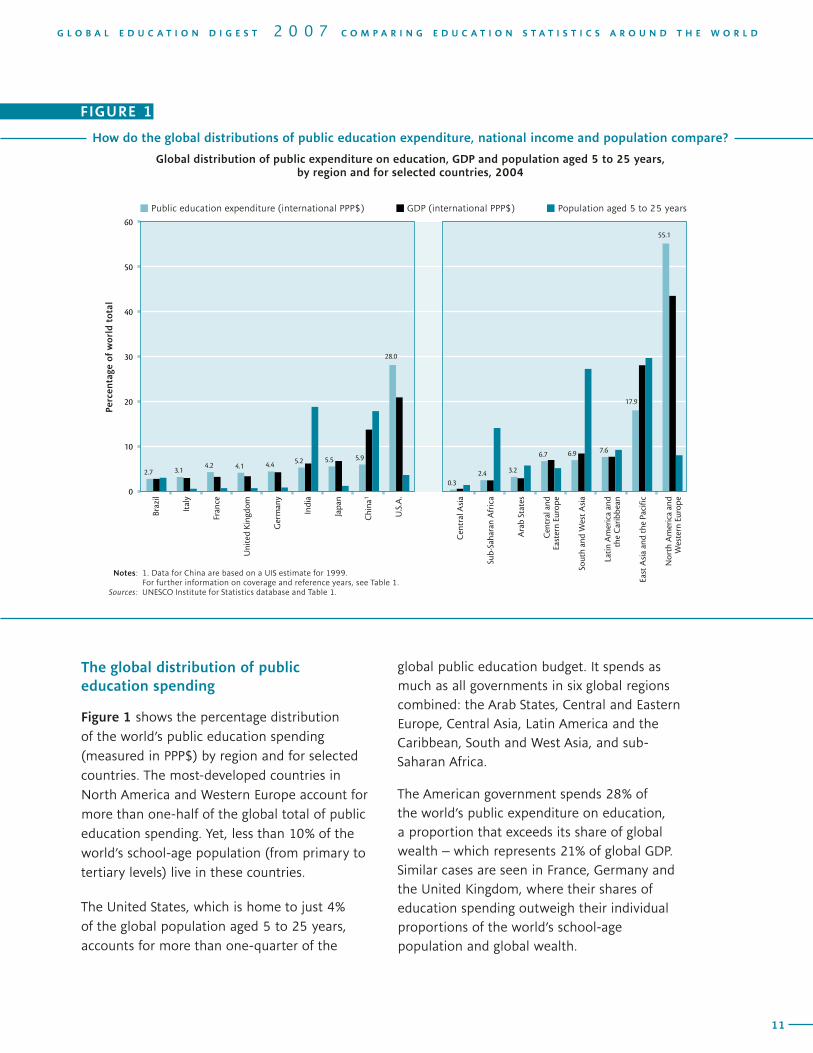
The global distribution of public education spending
Figure 1 shows the percentage distribution of the world’s public education spending (measured in PPP$) by region and for selected countries. The most-developed countries in North America and Western Europe account for more than one-half of the global total of public education spending. Yet, less than 10% of the world’s school-age population (from primary to tertiary levels) live in these countries.
The United States, which is home to just 4% of the global population aged 5 to 25 years, accounts for more than one-quarter of the
global public education budget. It spends as much as all governments in six global regions combined: the Arab States, Central and Eastern Europe, Central Asia, Latin America and the Caribbean, South and West Asia, and sub-Saharan Africa.
The American government spends 28% of the world’s public expenditure on education, a proportion that exceeds its share of global wealth – which represents 21% of global GDP. Similar cases are seen in France, Germany and the United Kingdom, where their shares of education spending outweigh their individual proportions of the world’s school-age population and global wealth.
Notes: 1. Data for China are based on a UIS estimate for 1999. For further information on coverage and reference years, see Table 1. Sources: UNESCO Institute for Statistics database and Table 1.
12
C O S T S A N D C O M M I T M E N T S I N F I N A N C I N G E D U C A T I O N F O R A L L
13
G L O B A L E D U C A T I O N D I G E S T 2 0 0 7 C O M P A R I N G E D U C A T I O N S T A T I S T I C S A R O U N D T H E W O R L D
A very different situation emerges in East Asia and the Pacific, which has the second-highest share of global public spending on education, at 18%. These governments invest less in education than their share of global wealth (28%) and the school-age population (29%). More than one-half of the region’s education spending is attributed to China (home to 17% of the world’s school-age population) and Japan (approximately 1% of this population). It is important to note that the regional figure is based on 1999 estimates for China, because more recent data are not available.
In Latin America and the Caribbean, there is a balance across education spending (8% of the global total), the regional share of the world’s children and young people (9%) and global wealth (8%). The opposite scenario is found in South and West Asia, where 7% of the world’s public education resources are spent on 28% of the school-age population.
The greatest imbalance is found in sub-Saharan Africa, where only 2.4% of the world’s education resources are devoted to 15% of the school-age population. According to estimates, the education budget of a single country like France, Germany or Italy outweighs the education expenditure of all sub-Saharan African governments combined.
Public education funds and the overall size of public budgets
To gauge public commitment to education, the previous discussion focused on the size of education budgets in relation to a country’s ability to generate wealth (GDP). It is also useful to compare the share of education budgets with the overall state budget. This breakdown highlights the relative importance attached to education compared to other priorities, such as health care or military defense.
The size of available public resources varies considerably across countries. Total public budgets reported by countries range from less than 10% of the national GDP in the United Arab Emirates to over 50% in countries such as Belarus, Cuba, Denmark, Jamaica, the Marshall Islands, Saint Kitts and Nevis, and Sweden. Government spending reaches over one-half of the level of national income in 15 countries. The highest shares of public spending relative to GDP are found in the Marshall Islands (75%), Saint Kitts and Nevis (74%), Jamaica (60%), Cuba (59%), Guyana (58%), Sweden (57%) and Denmark (56%).
At the other end of the spectrum, available public resources are far more limited in the United Arab Emirates, where government spending accounts for just 5% of GDP, followed by Madagascar (13%), Azerbaijan (13%), Zambia (13%) and Oman (15%).
The share of public resources that are invested in education also varies across countries. For example, less than 5% of public expenditure goes to education in Equatorial Guinea, while close to 30% is spent in Lesotho and Kenya.
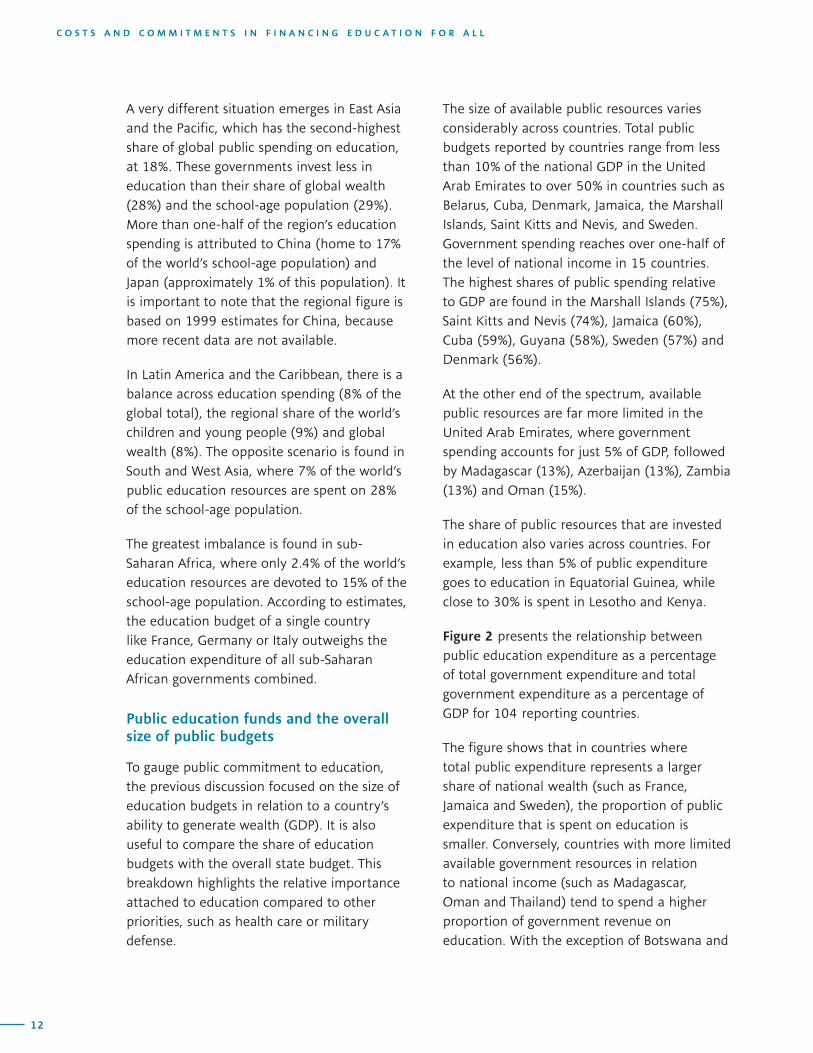
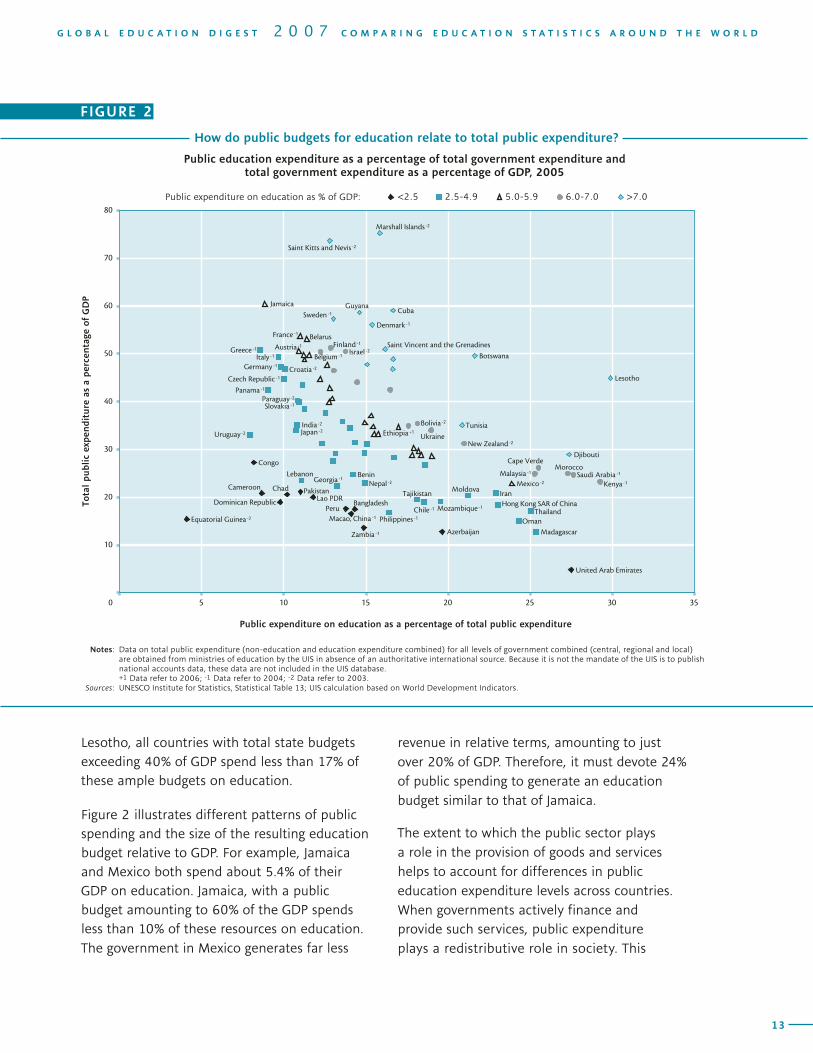
Figure 2 presents the relationship between public education expenditure as a percentage of total government expenditure and total government expenditure as a percentage of GDP for 104 reporting countries.
The figure shows that in countries where total public expenditure represents a larger share of national wealth (such as France, Jamaica and Sweden), the proportion of public expenditure that is spent on education is smaller. Conversely, countries with more limited available government resources in relation to national income (such as Madagascar, Oman and Thailand) tend to spend a higher proportion of government revenue on education. With the exception of Botswana and
12
C O S T S A N D C O M M I T M E N T S I N F I N A N C I N G E D U C A T I O N F O R A L L
13
G L O B A L E D U C A T I O N D I G E S T 2 0 0 7 C O M P A R I N G E D U C A T I O N S T A T I S T I C S A R O U N D T H E W O R L D
Lesotho, all countries with total state budgets exceeding 40% of GDP spend less than 17% of these ample budgets on education.
Figure 2 illustrates different patterns of public spending and the size of the resulting education budget relative to GDP. For example, Jamaica and Mexico both spend about 5.4% of their GDP on education. Jamaica, with a public budget amounting to 60% of the GDP spends less than 10% of these resources on education. The government in Mexico generates far less
revenue in relative terms, amounting to just over 20% of GDP. Therefore, it must devote 24% of public spending to generate an education budget similar to that of Jamaica.
The extent to which the public sector plays a role in the provision of goods and services helps to account for differences in public education expenditure levels across countries. When governments actively finance and provide such services, public expenditure plays a redistributive role in society. This
How do public budgets for education relate to total public expenditure?
Public education expenditure as a percentage of total government expenditure and total government expenditure as a percentage of GDP, 2005
���������� ������ ��
������ ���� ��������
��������
��������� ��������
������ ��
����
�����
��������
������ ����� ��
��� �������
����������
����������
�������
������� ��
����������� ��
������� ��
����������
����� ��
����� ��
�����
����������
����
����� ��
���������� ��
����� ��
������ ��
���� ���� ��� �� �������������
�������
������ ��
�������� ���������� ��
����� �������� ��������� �� ������� ��
����� ��
����
�������
������ ��
������� �������� �� �������
�������� ��
���������
�������� ��
������� ��
���������� ������� ��
������� ��
���� �����
����� ��
������������ ������ ��
������ ��
�������
������ ��
��������
����� ������� ��� ��� ����������
������
������� ��
����� ����� ��� ����� ��
����
��������
�������� ������� ��
�������
��
��
��
��
��
��
��
��
� � �� �� �� �� �� ��
���������������������������������������������������������������������������
��������
����
����
����������������
����
����
�������
�������������������������������������������� ������������������������� ����
Notes: Data on total public expenditure (non-education and education expenditure combined) for all levels of government combined (central, regional and local) are obtained from ministries of education by the UIS in absence of an authoritative international source. Because it is not the mandate of the UIS is to publish national accounts data, these data are not included in the UIS database.
+1 Data refer to 2006; -1 Data refer to 2004; -2 Data refer to 2003. Sources: UNESCO Institute for Statistics, Statistical Table 13; UIS calculation based on World Development Indicators.
FIGURE 2
14
C O S T S A N D C O M M I T M E N T S I N F I N A N C I N G E D U C A T I O N F O R A L L
15
G L O B A L E D U C A T I O N D I G E S T 2 0 0 7 C O M P A R I N G E D U C A T I O N S T A T I S T I C S A R O U N D T H E W O R L D
role is partially reflected by the overall size of available public resources. In countries where this role is weak (e.g. no infrastructure for tax collection), there is less revenue to redistribute through the funding of public services. Since, in some of these cases, education systems represent one of the few public services provided by the government, education expenditure is likely to make up a large share of the total.
Changes in national income, public expenditure and education expenditure since 1999
How has public education expenditure changed in real terms since 1999? Is it linked to changes in the levels of GDP or total public budgets? For a number of countries, it is possible to examine how education funding levels have changed in relation to trends in available resources (e.g. national income and state budgets).
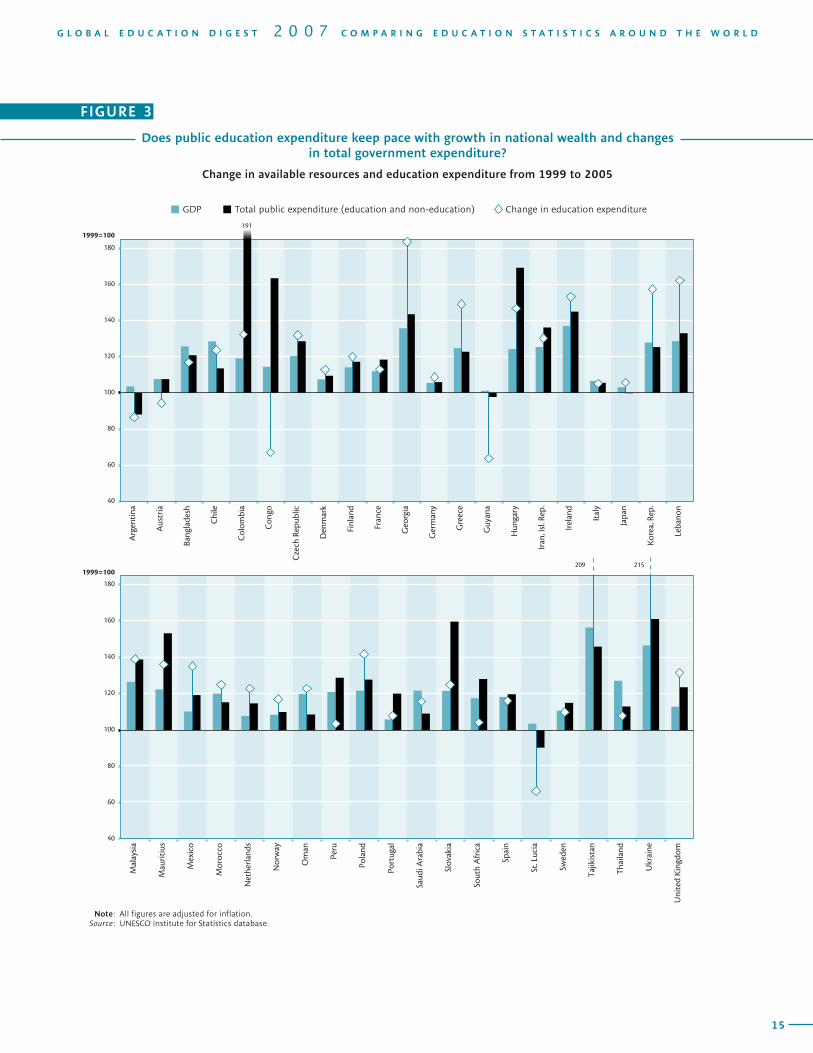
Figure 3 shows trends since 1999 in GDP growth, total public spending and public education expenditure for 41 countries with available data. The change in actual education spending in absolute values for 2005 is adjusted for inflation.
Since 1999, national GDP grew in all countries presented, especially in Central and Eastern Europe, Central Asia, South and West Asia and East Asia. Yet, it grew only marginally for some more-developed countries (e.g. Argentina, Austria, Denmark, Germany, Italy, Japan and Portugal).
Thus, the rise in national income in many countries could potentially lead to more resources for education. But this ultimately depends on a government’s ability to mobilise additional revenue, which almost all countries succeeded to do, except for Argentina, Guyana and Saint Lucia.
In a number of countries, public budgets grew more slowly than GDP. This is the case for Argentina and Chile, for example, where public budgets lagged behind the rise in GDP by more than 10 percentage points since 1999. To the contrary, public revenues grew faster than the economy in 25 out of the 41 countries presented and by more than 30 percentage points in Colombia, Congo, Hungary, Mauritius and Slovakia. A combination of growth in public budgets and the share devoted to education in Georgia, Tajikistan and Ukraine led to the greatest increase in education expenditure worldwide, over 80% since 1999.
The widespread growth in GDP and the even more rapid growth in public expenditure provided a good basis for expanding education budgets in many countries. In general, growth in the economy and public expenditures corresponded to increased education expenditures. Thus, while available resources help to define the parameters for public education spending, the political will to redistribute income and allocate investment in the sector differs broadly across countries.
In Bangladesh, Finland, Malaysia and Spain, education expenditure rose in parallel to total budgets, i.e. the share of public budgets spent on education did not change compared to 1999, but education expenditure grew by over 15% due to the absolute increase in state budgets.
In Colombia, Hungary and Mauritius, education spending grew by more than 25%, yet public budgets in total grew 17 to 58 percentage points faster than that.
The situation was most dramatic in Congo, Guyana and Saint Lucia, where education spending decreased in real terms by one-third compared to 1999, even though public budgets remained steady.
14
C O S T S A N D C O M M I T M E N T S I N F I N A N C I N G E D U C A T I O N F O R A L L
15
G L O B A L E D U C A T I O N D I G E S T 2 0 0 7 C O M P A R I N G E D U C A T I O N S T A T I S T I C S A R O U N D T H E W O R L D
Does public education expenditure keep pace with growth in national wealth and changes in total government expenditure?
Change in available resources and education expenditure from 1999 to 2005
FIGURE 3
Note: All figures are adjusted for inflation. Source: UNESCO Institute for Statistics database.
��
��
��
���
���
���
���
���
���������
�������
����������
�����
�����
���
�����
�����
����
����
�������
�������
������
�������
�������
������
������
�������
�������������
�������
�����
�����
����������
�������
��������
��������
���
��� ���
��
��
��
���
���
���
���
���
��������
���������
������
�������
�����������
������
����
����
������
��������
������
�����
��������
�����������
�����
��������
������
����������
��������
�������
�������������
������������������������������������������������������ �����������������������������������
16
C O S T S A N D C O M M I T M E N T S I N F I N A N C I N G E D U C A T I O N F O R A L L
17
G L O B A L E D U C A T I O N D I G E S T 2 0 0 7 C O M P A R I N G E D U C A T I O N S T A T I S T I C S A R O U N D T H E W O R L D
Investment in primary education
This section has sought to provide a broad perspective on efforts to fund education systems in general. It will now examine investment at the primary level, which is the focus of several international education goals.
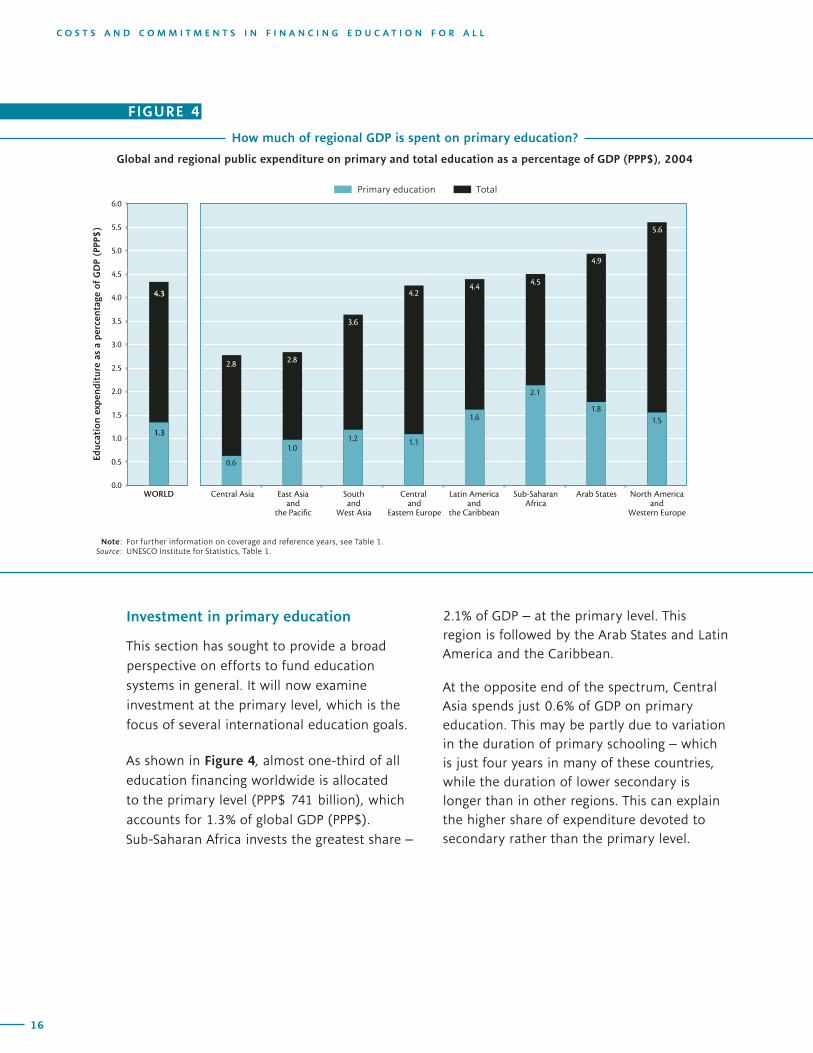
As shown in Figure 4, almost one-third of all education financing worldwide is allocated to the primary level (PPP$ 741 billion), which accounts for 1.3% of global GDP (PPP$). Sub-Saharan Africa invests the greatest share –
2.1% of GDP – at the primary level. This region is followed by the Arab States and Latin America and the Caribbean.
At the opposite end of the spectrum, Central Asia spends just 0.6% of GDP on primary education. This may be partly due to variation in the duration of primary schooling – which is just four years in many of these countries, while the duration of lower secondary is longer than in other regions. This can explain the higher share of expenditure devoted to secondary rather than the primary level.
Which countries spend the highest or lowest share of public education expenditure on primary education?
Public expenditure on primary education as a percentage of total public expenditure on education, by country, 2005
How much of regional GDP is spent on primary education?
Global and regional public expenditure on primary and total education as a percentage of GDP (PPP$), 2004
Note: For further information on coverage and reference years, see Table 1. Source: UNESCO Institute for Statistics, Table 1.
���
���
���
���
���
���
���
���
���
���
���
���
���
����� ������� ���� ���� �������
��� �������
��������
���� ����
����������
������� ������
����� ����������
��� ���������
�����������������
���� ������ ����� ����������
������� ������
�����
����
����
�������������������
�����
������������
��
����������������������
���
���
���
������ ���
���
���
������
��� ���
���
������ ���
���
���
FIGURE 4
16
C O S T S A N D C O M M I T M E N T S I N F I N A N C I N G E D U C A T I O N F O R A L L
17
G L O B A L E D U C A T I O N D I G E S T 2 0 0 7 C O M P A R I N G E D U C A T I O N S T A T I S T I C S A R O U N D T H E W O R L D
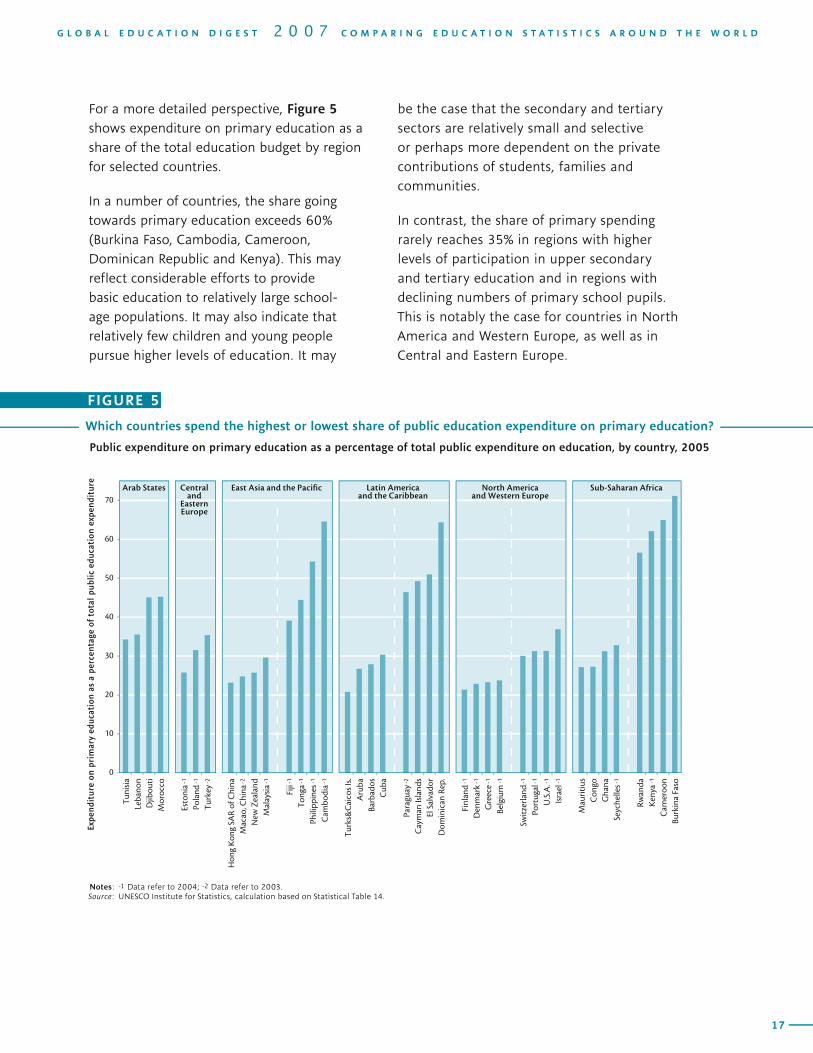
For a more detailed perspective, Figure 5 shows expenditure on primary education as a share of the total education budget by region for selected countries.
In a number of countries, the share going towards primary education exceeds 60% (Burkina Faso, Cambodia, Cameroon, Dominican Republic and Kenya). This may refl ect considerable efforts to provide basic education to relatively large school-age populations. It may also indicate that relatively few children and young people pursue higher levels of education. It may
Which countries spend the highest or lowest share of public education expenditure on primary education?
Public expenditure on primary education as a percentage of total public expenditure on education, by country, 2005
�
��
��
��
��
��
��
��
�������
�������
��������
�������
���������
������
��
������
��
������������������
�����������
��
���
�������
����������
������
�������
�����������
��
���
�������
���������������
�����
��������
����
��������
��
������
�������
����������
���
������
����
���������
���������
��������
�������
��
�����������
��
��������
��
��������
������
��
���������
�����
�����
������������
������
�����
��
���
�����
�����������
����
�����
����������������
���������������
����
����
������
�����
��������
�����������
������
�� ���� ������ ����������
�������������
���� ���� ��� ��� ������� ����� ���������� ��� ���������
����� ���������� ������� ������
����������� ������
Notes: -1 Data refer to 2004; -2 Data refer to 2003. Source: UNESCO Institute for Statistics, calculation based on Statistical Table 14.
be the case that the secondary and tertiary sectors are relatively small and selective or perhaps more dependent on the private contributions of students, families and communities.
In contrast, the share of primary spending rarely reaches 35% in regions with higher levels of participation in upper secondary and tertiary education and in regions with declining numbers of primary school pupils. This is notably the case for countries in North America and Western Europe, as well as in Central and Eastern Europe.
FIGURE 5
18
C O S T S A N D C O M M I T M E N T S I N F I N A N C I N G E D U C A T I O N F O R A L L
19
G L O B A L E D U C A T I O N D I G E S T 2 0 0 7 C O M P A R I N G E D U C A T I O N S T A T I S T I C S A R O U N D T H E W O R L D
2. MEASURING THE PUBLIC COSTS OF PRIMARY EDUCATION
The allocation of public budgets is ultimately the result of competing demands for limited resources. Policymakers must constantly seek a balance in the face of changing contexts: how much does the school system need and how much can the government afford to invest? Countries with rising demand for education are compelled to keep costs per student low. But other governments are less constrained by this demographic pressure and can, therefore, seek to improve the quality of education provision more broadly.
To explore these policy choices, this section will present indicators that refl ect both perspectives: the cost of educating a student and the resources (per student) invested in the education system.
Expenditure per primary student
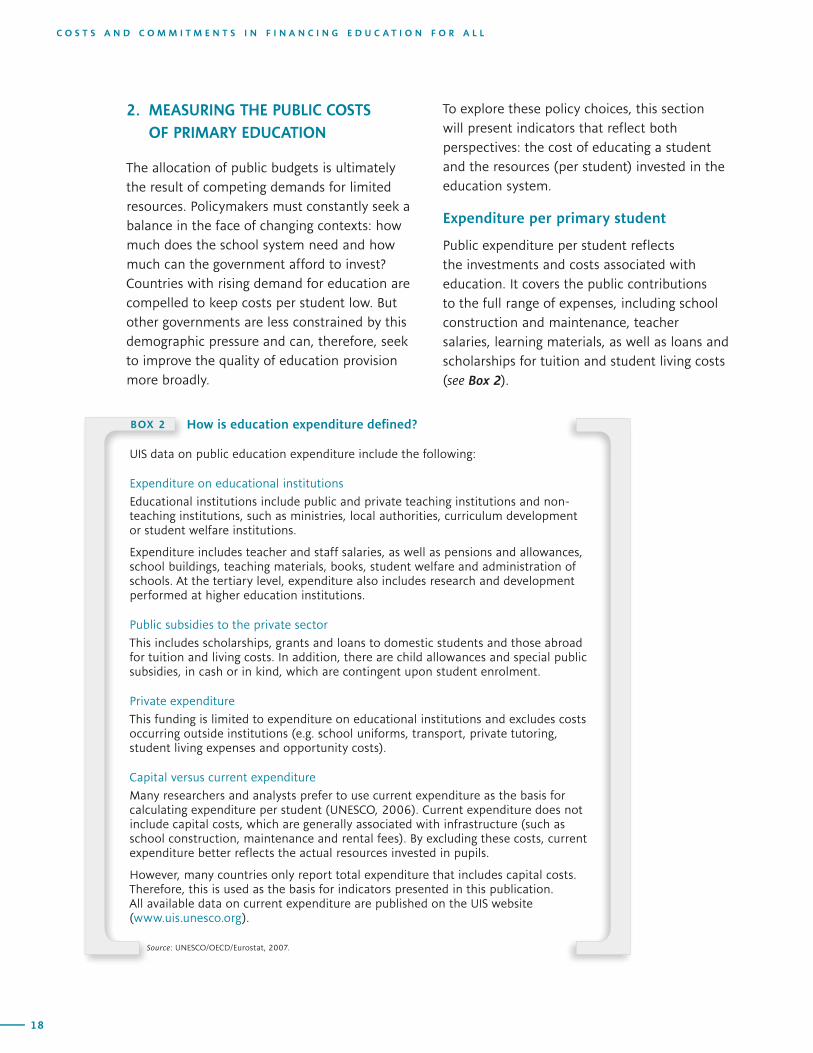
Public expenditure per student refl ects the investments and costs associated with education. It covers the public contributions to the full range of expenses, including school construction and maintenance, teacher salaries, learning materials, as well as loans and scholarships for tuition and student living costs (see Box 2).
BOX 2 How is education expenditure defi ned?
UIS data on public education expenditure include the following:
Expenditure on educational institutions
Educational institutions include public and private teaching institutions and non-teaching institutions, such as ministries, local authorities, curriculum development or student welfare institutions.
Expenditure includes teacher and staff salaries, as well as pensions and allowances, school buildings, teaching materials, books, student welfare and administration of schools. At the tertiary level, expenditure also includes research and development performed at higher education institutions.
Public subsidies to the private sector
This includes scholarships, grants and loans to domestic students and those abroad for tuition and living costs. In addition, there are child allowances and special public subsidies, in cash or in kind, which are contingent upon student enrolment.
Private expenditure
This funding is limited to expenditure on educational institutions and excludes costs occurring outside institutions (e.g. school uniforms, transport, private tutoring, student living expenses and opportunity costs).
Capital versus current expenditure
Many researchers and analysts prefer to use current expenditure as the basis for calculating expenditure per student (UNESCO, 2006). Current expenditure does not include capital costs, which are generally associated with infrastructure (such as school construction, maintenance and rental fees). By excluding these costs, current expenditure better refl ects the actual resources invested in pupils.
However, many countries only report total expenditure that includes capital costs. Therefore, this is used as the basis for indicators presented in this publication. All available data on current expenditure are published on the UIS website (www.uis.unesco.org).
Source: UNESCO/OECD/Eurostat, 2007.
18
C O S T S A N D C O M M I T M E N T S I N F I N A N C I N G E D U C A T I O N F O R A L L
19
G L O B A L E D U C A T I O N D I G E S T 2 0 0 7 C O M P A R I N G E D U C A T I O N S T A T I S T I C S A R O U N D T H E W O R L D
But how can one compare costs per student among countries where there are different currencies and prices? By expressing expenditure as a percentage of GDP per capita, education budgets can be compared in relation to national income level, which is a proxy for a country’s ability to generate education financing. It is also possible to directly compare the purchasing power of the funding provided for education annually through the use of international PPP$ (see Box 1).
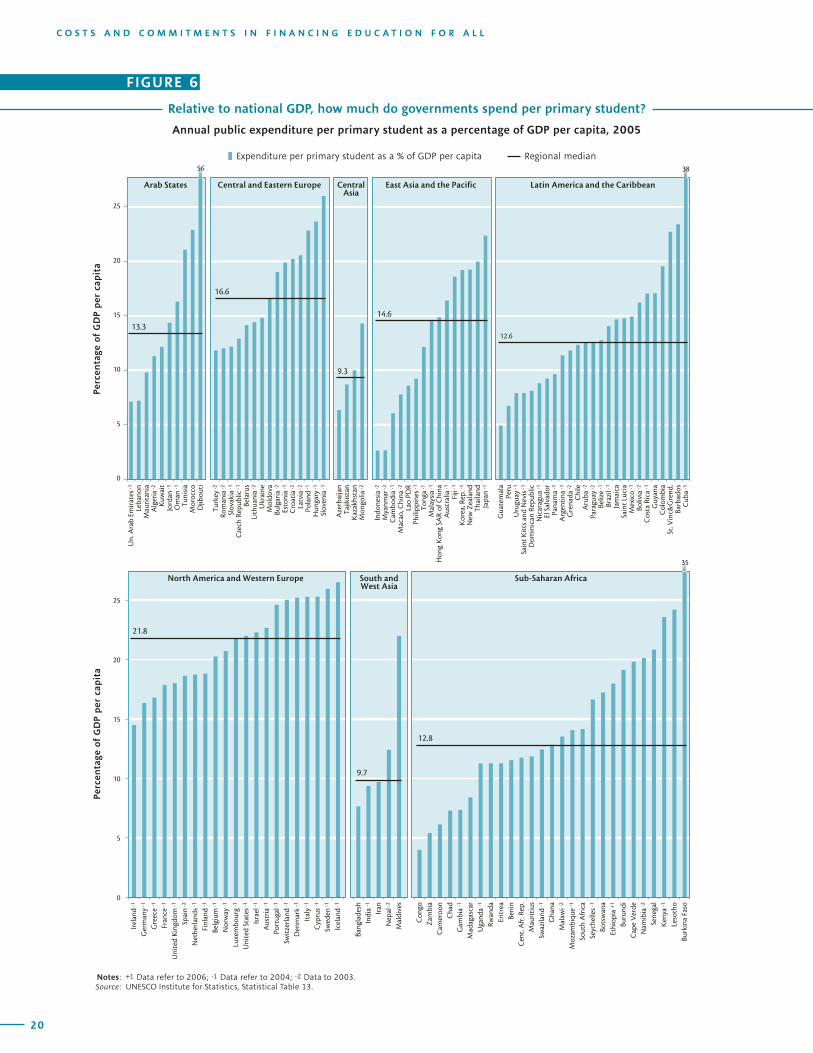
Figure 6 shows annual public expenditure per primary student as a percentage of GDP per capita for 122 countries with available data. There are large gaps between countries: 10 to 20 times more resources are allocated per student in high-spending countries than in those spending the least in relative terms. From a regional perspective, Central Asia has the lowest median of 9%, followed by South and West Asia at 10%
1.
In sub-Saharan Africa, the median expenditure per primary student was almost 13% of GDP per capita. But costs across countries in the region vary by almost a factor of ten: from 4% in the Congo to 35% in Burkina Faso.
A similar regional median (13%) was found in the Arab States and Latin America and the Caribbean. In the first region, expenditure ranges from 7% in Lebanon and the United Arab Emirates to 23% in Morocco and even 56% in Djibouti, which has the highest share of spending per primary student worldwide. In the second region, values span from 5% in Guatemala to 38% in Cuba.
The East Asia and the Pacific region has a median of 15%, with two countries reporting the lowest spending levels in the world. Indonesia and Myanmar invest just 3% of per capita national income annually per primary student. In contrast, costs are at least five times higher – ranging from 15% to 22% – in Australia,
Fiji, Hong Kong Special Administrative Region of China, Japan, Malaysia, New Zealand, the Republic of Korea and Thailand.
In contrast, countries in North America and Western Europe tend to spend close to a regional median of 22%. A similar pattern is also found in Central and Eastern Europe, where the median is 17%. Iceland invests the greatest share per primary student, with 27% of GDP per capita, followed closely by Cyprus, Denmark, Italy, Slovenia, Sweden and Switzerland. Even countries that fall below the median – namely the Czech Republic, Romania, Slovakia and Turkey – still make significant annual investments per primary student of about 12% to 13% of GDP per capita.
The cost differences among countries tend to rise with higher levels of education. Annual public expenditure per secondary student ranges from 3% to 5% of GDP per capita in Cameroon, Guatemala, Indonesia, Lao PDR and Myanmar. In contrast, the costs of educating a secondary student account for 40% to 50% of GDP per capita in Botswana, Cyprus, Cuba, Lesotho and Mozambique. Moreover, Burundi and Djibouti report the highest relative costs at 73% and 80% of GDP per capita respectively (see Statistical Table 13).
The gap widens even more dramatically at the tertiary level. Annual public spending on a tertiary student ranges from 6% of GDP per capita in Kazakhstan and 9% in the Republic of Korea and Peru to 1105% (or more than 11 times the level of GDP per capita) in Lesotho.
Yet, low public expenditure does not necessarily mean that schools or universities are under-resourced. In many countries, the contributions of students, families and others are extremely important, especially at the tertiary level, as the example of the Republic of Korea shows.
1 Due to limited data coverage at the country level, it is not possible to calculate regional averages. However, the median provides a good indication of regional patterns in education spending.
20
C O S T S A N D C O M M I T M E N T S I N F I N A N C I N G E D U C A T I O N F O R A L L
21
G L O B A L E D U C A T I O N D I G E S T 2 0 0 7 C O M P A R I N G E D U C A T I O N S T A T I S T I C S A R O U N D T H E W O R L D
Relative to national GDP, how much do governments spend per primary student?
Annual public expenditure per primary student as a percentage of GDP per capita, 2005
FIGURE 6
13.3
16.6
9.3
14.6
12.6
0
5
10
15
20
25
Fiji
-1
Un.
Ara
b Em
irat
es -1
Leba
non
Mau
rita
nia
Alg
eria
-2
Kuw
ait
Jord
an -1
Om
an -1
Tuni
sia
Mor
occo
Djib
outi
Turk
ey -2
Rom
ania
-2
Slov
akia
-1
Cze
ch R
epub
lic -1
Bela
rus
Lith
uani
a -2
Ukr
aine
Mol
dova
Bulg
aria
-2
Esto
nia
-1
Cro
atia
-2
Latv
ia -2
Pola
nd -1
Hun
gary
-1
Slov
enia
-1
Aze
rbai
jan
Tajik
ista
nK
azak
hsta
nM
ongo
lia -2
Indo
nesi
a -2
Mya
nmar
-2
Cam
bodi
a -1
Mac
ao, C
hina
-2
Lao
PDR
Phili
ppin
es -1
Ton
ga -1
Mal
aysi
a -1
Hon
g K
ong
SAR
of C
hina
Aus
tral
ia -1
Kor
ea, R
ep. -
1
New
Zea
land
Thai
land
Japa
n -1
Gua
tem
ala
Peru
Uru
guay
-1
Sain
t K
itts
and
Nev
is -1
Dom
inic
an R
epub
licN
icar
agua
-1
El S
alva
dor
Pana
ma
-1
Arg
enti
na -1
Gre
nada
-2
Chi
leA
ruba
-2
Para
guay
-2
Beliz
e -1
Braz
il -1
Jam
aica
Sain
t Lu
cia
Mex
ico
-1
Boliv
ia -2
Cos
ta R
ica
-1
Guy
ana
Col
ombi
aSt
. Vin
c&G
rend
.Ba
rbad
osC
uba
-1
Perc
enta
ge o
f G
DP
per
cap
ita
Regional median
12.8
9.7
21.8
0
5
10
15
20
25
Irel
and
-1
Ger
man
y -1
Gre
ece
-1
Fran
ce -1
Uni
ted
Kin
gdom
-1
Spai
n -2
Net
herl
ands
-1
Finl
and
-1
Belg
ium
-1
Nor
way
-1
Luxe
mbo
urg
-1
Uni
ted
Stat
es -1
Isra
el -1
Aus
tria
-1
Port
ugal
-1
Swit
zerl
and
-1
Den
mar
k -1
Ital
y -1
Cyp
rus -
1
Swed
en -1
Icel
and
-1
Bang
lade
shIn
dia
-1
Iran
Nep
al -2
Mal
dive
s
Con
goZ
ambi
aC
amer
oon
Cha
dG
ambi
a -1
Mad
agas
car
Uga
nda
-1
Rwan
daEr
itre
aBe
nin
Cen
t. A
fr. R
ep.
Mau
riti
usSw
azila
nd -1
Gha
naM
alaw
i -2
Moz
ambi
que
-1
Sout
h A
fric
aSe
yche
lles -
1
Bots
wan
aEt
hiop
ia +
1
Buru
ndi
Cap
e V
erde
Nam
ibia
-2
Sene
gal
Ken
ya -1
Leso
tho
Burk
ina
Faso
Perc
enta
ge o
f G
DP
per
cap
ita
Arab States Central and Eastern Europe CentralAsia
East Asia and the Pacific Latin America and the Caribbean
North America and Western Europe South andWest Asia
Sub-Saharan Africa
Expenditure per primary student as a % of GDP per capita56 38
35
Notes: +1 Data refer to 2006; -1 Data refer to 2004; -2 Data to 2003. Source: UNESCO Institute for Statistics, Statistical Table 13.

20
C O S T S A N D C O M M I T M E N T S I N F I N A N C I N G E D U C A T I O N F O R A L L
21
G L O B A L E D U C A T I O N D I G E S T 2 0 0 7 C O M P A R I N G E D U C A T I O N S T A T I S T I C S A R O U N D T H E W O R L D
At the other extreme, the cost of educating a tertiary student is high in Djibouti, where annual per student investment represents 505% of GDP per capita, followed by Botswana (480%), Mozambique (435%) and Rwanda (409%).
It is important to consider that expenditure may be overstated for countries that subsidise internationally mobile students. For example, more than one-half of all tertiary students go abroad in Belize, Botswana, Gambia and Lesotho at considerable cost to the state (see Statistical Table 10).
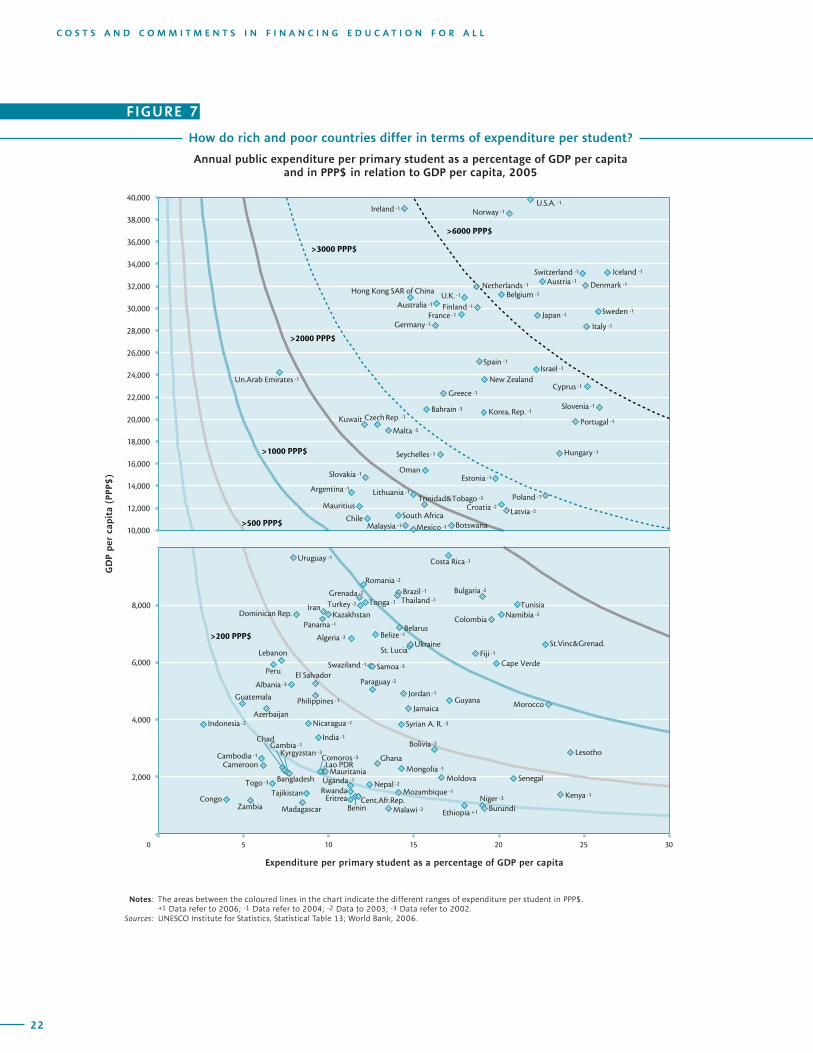
Even when taking into account differences in national income when comparing expenditure per student across countries, the results show that poorer countries tend to provide substantially less funding per student than richer countries. Figure 7 shows the relationship between annual expenditure per primary student expressed as a percentage of GDP per capita and the level of GDP per capita.
With the exception of the United Arab Emirates, all countries with a GDP per capita above PPP$ 10,000 annually spend at least 11% of GDP per primary student. With the notable exceptions of Burkina Faso (35%) and Djibouti (56%), all countries that spend more than 25% of GDP per capita per primary student are relatively rich with a GDP per capita above PPP$ 20,000.
Thus, annual spending on primary students in poorer countries represents a relatively smaller share of an already low level of GDP per capita. Figure 7 shows how this double effect amounts to very high differences in the funds invested in education across countries.
Purchasing power of education resources
The previous indicator reflects spending patterns in relative terms, but it is revealing to also consider the absolute values of these investments. By converting expenditure per student into PPP$, it is possible to compare the purchasing power of these resources in absolute terms (see Box 1 and Statistical Table 13).
For example, Hungary, Kenya, Morocco and Poland spend about 23% of GDP per capita annually per primary student. Yet, the purchasing power of these investments varies considerably: the same share of resources will provide PPP$ 250 worth of goods and services to a student in Kenya, compared to PPP$ 1,010 in Morocco or PPP$ 3,980 in Hungary.
Four countries invest less than PPP$ 100 annually per student: Congo (42), Zambia (56), Madagascar (76) and Indonesia (89). Purchasing power per primary student is also extremely low (ranging from 114 to 147) in Benin, Burundi, Cambodia, Central African Republic, Chad, Eritrea, Gambia and Tajikistan.
Developed countries have the highest absolute levels of education expenditure. Luxembourg spends the equivalent of PPP$ 15,237 per primary student, though this is linked to support for tertiary students who follow programmes in other countries. Investments in Denmark, Iceland, Switzerland and the United States range from PPP$ 8,040 to PPP$ 8,760 annually.
Hong Kong Special Administrative Region of China reported annual spending of PPP$ 4,630 per primary student, followed by Israel (5,440) and Cyprus (5,770). The next group of countries reports PPP$ 1,700 to PPP$ 2,900 and includes: Croatia, Estonia, Kuwait, Latvia, Seychelles, Tunisia and the United Arab Emirates.
22
C O S T S A N D C O M M I T M E N T S I N F I N A N C I N G E D U C A T I O N F O R A L L
23
G L O B A L E D U C A T I O N D I G E S T 2 0 0 7 C O M P A R I N G E D U C A T I O N S T A T I S T I C S A R O U N D T H E W O R L D
How do rich and poor countries differ in terms of expenditure per student?
Annual public expenditure per primary student as a percentage of GDP per capita and in PPP$ in relation to GDP per capita, 2005
Notes: The areas between the coloured lines in the chart indicate the different ranges of expenditure per student in PPP$. +1 Data refer to 2006; -1 Data refer to 2004; -2 Data to 2003; -3 Data refer to 2002. Sources: UNESCO Institute for Statistics, Statistical Table 13; World Bank, 2006.
����� ����
����� ����
����� ����
����� ����
������� �������� ��
��������� ��
���������
������
�������� ��
�����
��������� ��
����� ��
����� ������
��������� ��
������� ��
�������� ��
���� ���� ��� �� �����
��������������� ��
������� ��
����
������� ��
��������� ��
���������� ��
������ ��
������ ��
���� ��
����� ��
����������� ��
������� ��
������ ���� ��
��� �������
������� ��
������� ��
������� ��
������ ��
������ �������� ��
������ ��
����� ��
������� ��
������ ��
������� ��
�������� ��
����������� ��
������� ��
����� ��
������ ��
������ ��
�������� ��
������� ��
���� ����
���� ����
��������� ��
�����
���������
������
�������� ��
��������
����������
���� ��
����
�������
���������� ��
���������� ��
����������
������� ��
������� ��
��������� ����
����������
����������
��������� ��
����������� ��
�� ��������
����� ��
������ ��
����
��� ���������� ��
����������
����������
������ ��
�������������
������� ��
������������������
������� ��
������ ��
������� ��
����� ��
����� ��
��������� �� ����� ��
�������� ��
������ ��
�����
������ ��
������ ��
���������� ��
�������
������ �� �� ��
�������� ��
������ ��
�������
��� ������������
������ ��
������� ��
�������
����� ���� ��
������
��������
�������� ��
���� ��
�������� ��
����� ��
�������
��������
���� �����
�������� ��
������� ��
�������
�������
���������������
�������
����� ��
�������
������
������
������
������
������
������
������
������
������
������
������
������
������
������
������
������
�����
�����
�����
�����
� � �� �� �� �� ��
�����������������������������������������������������������������
�����������
��������
��
FIGURE 7
22
C O S T S A N D C O M M I T M E N T S I N F I N A N C I N G E D U C A T I O N F O R A L L
23
G L O B A L E D U C A T I O N D I G E S T 2 0 0 7 C O M P A R I N G E D U C A T I O N S T A T I S T I C S A R O U N D T H E W O R L D
Any discussion on the absolute levels of education investments must also consider the impact of private contributions. In many less-developed countries, parents and communities directly pay for teacher salaries. In addition, schools often rely on tuition and other types of fees in diverse countries. For example, public investment per primary student is PPP$ 1,557 in Chile. However this figure would rise by one-third to PPP$ 2,120 if private spending was included (UNESCO-UIS/WEI, 2007).
Inequalities in the distribution of public education expenditure within countries
As shown in Figure 7, public spending on education varies widely across countries of the world, reflecting great divides in national wealth. Yet, these imbalances pale in comparison with those facing children and young adults in countries with limited resources. It is tempting to assume that resources are allocated evenly among young people, but the opposite is true: disparities within countries are stronger than those between them.
Two factors contribute to the inequalities within countries. First of all, children and young people do not have equal access to education. Some children never enter school and, therefore, receive no benefit from public funding for education. In Djibouti, for example, only 43% of children who are expected to enter primary school actually do.
Gross intake ratios are low in many sub-Saharan countries, such as Eritrea (50%), Niger (58%), the Central African Republic (59%), Congo (62%), Mali (64%) and the Democratic Republic of the Congo (67%). This suggests that in these countries one out of three children is currently denied access to school and, consequently, public resources for education (see Statistical Table 2).
Other children enter school but then drop out before completing their primary education. Therefore, they only benefit from a few years of public spending. This is the case for three out of four primary students in Uganda and Chad, where survival rates to the last grade of primary are 25% and 26% respectively. At least every second child starting primary school drops out in Benin, Madagascar, Malawi, Mauritania, Mozambique, Rwanda and Turks and Caicos Islands (see Statistical Table 4 for primary school survival rates).
On the other hand, students who continue to secondary or tertiary education derive much greater benefit from public education funds. The varying extent of these benefits is amplified by the increase in costs when students reach higher levels of education. Typically, expenditure per primary student is substantially lower than that at the secondary or tertiary level.
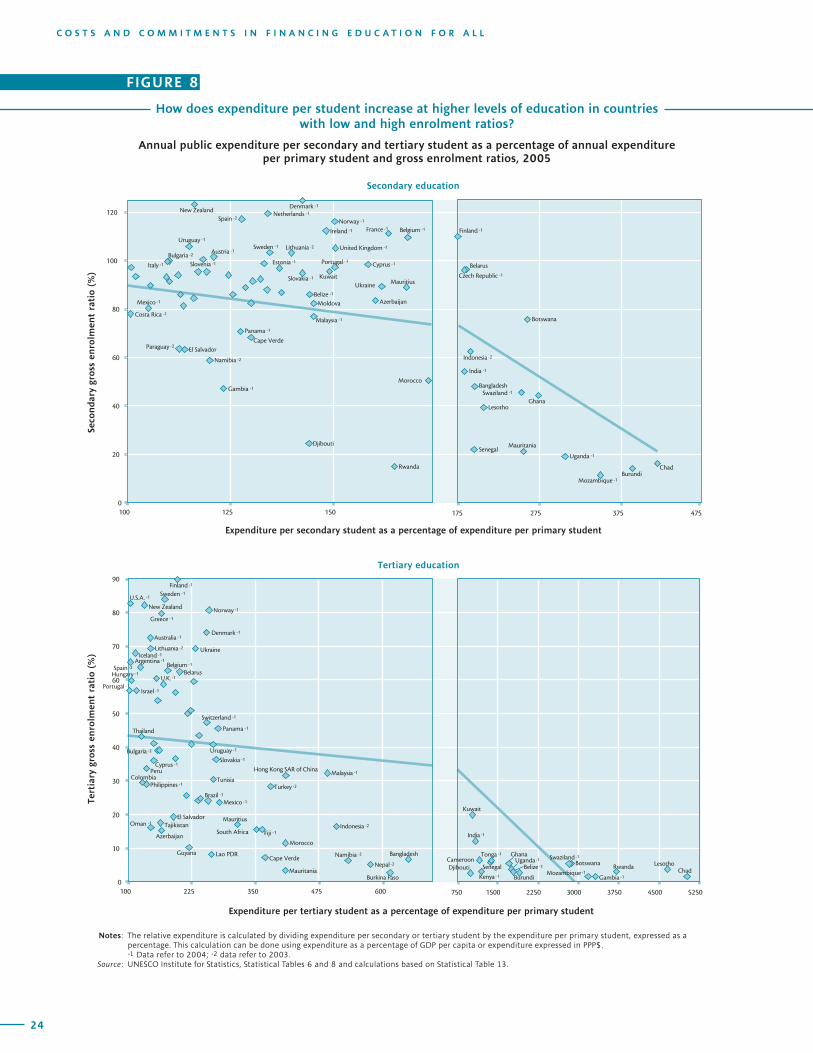
Figure 8 compares the annual cost per secondary and tertiary student relative to that of a primary student with corresponding participation rates. It shows that, for most countries with low participation rates, both levels of education follow a similar pattern of large cost increases relative to primary education. Therefore, these governments invest the most in the relatively few students who continue their education.
For example, it costs twice as much to educate a secondary student than a primary student in Burundi, Chad, Ghana, Lesotho, Mauritania, Mozambique, Swaziland and Uganda. Yet, less than one-half of the school-age children actually benefit from the increased investment, with gross enrolment ratios below 50% in these countries.
24
C O S T S A N D C O M M I T M E N T S I N F I N A N C I N G E D U C A T I O N F O R A L L
25
G L O B A L E D U C A T I O N D I G E S T 2 0 0 7 C O M P A R I N G E D U C A T I O N S T A T I S T I C S A R O U N D T H E W O R L D
How does expenditure per student increase at higher levels of education in countries with low and high enrolment ratios?
Annual public expenditure per secondary and tertiary student as a percentage of annual expenditure per primary student and gross enrolment ratios, 2005
FIGURE 8
������������������������������������������������������������������������������������
����
����������
����
����
������������
�
������������������������������������������������������������������������������������
������������
�������
����
����������
�
�������������������
������������������
�
��
��
��
��
���
���
�
��
��
��
��
��
��
��
��
��
��� ��� ��� ��� ��� ��� ���� ���� ���� ���� ���� ����
��� ��� ��� ��� ��� ��� ���
����� ���� ��
������ ��
����� ���������� ��
�������� �� �� ��������
������� ��
��� �������
�������� ��
������� ��
������� ��
������ ��
������ ��
����� ��
���� �����
������� ��
����������� ��
������ �� ��������� ��
������� ��
�������� ��
��������
������ ��
�������
�������� ��
������� ��
������
�������� ��
������ ��
������ ������� ��
������ ��
����������
�������
������ ��
������
���������
������� �� ������� ��
�������
����������
����������
��������� ��
�������
������� ��
�������
������� ��
���������
�������
����������
������ ��
���� ��
������ ��
�������� ��
�������� ��
�������� ��
������� ��
��������� ��
��������� ��
������ ��
������ ��
���� ���� ��� �� ���������
���� �����
����������
����� ��
������ ��
������ ��
����� ������
������� ��
������ ��
��� �������
�������
������� ��
�� ��������
����������� ��
�������� ��
������ ��
������ ��
������� ��
����������� ��
���� ��
������
������� ��
��������
���� ��
��������� ��
������ ��
����� ��
������� ����
��������
��� ��� ����� ��
����� �� ������ ���������� ������ ��
������
������
����� ��
������� �������������������������� ��
�����������
�����������
���������� ��
������ ��
�����
��������
����������
��������� ��
�������
����������
�������
��������� ��
����� �������� ��
����� ��
�������
��������� ��
���������� ��
��������
Notes: The relative expenditure is calculated by dividing expenditure per secondary or tertiary student by the expenditure per primary student, expressed as a percentage. This calculation can be done using expenditure as a percentage of GDP per capita or expenditure expressed in PPP$.
-1 Data refer to 2004; -2 data refer to 2003. Source: UNESCO Institute for Statistics, Statistical Tables 6 and 8 and calculations based on Statistical Table 13.
24
C O S T S A N D C O M M I T M E N T S I N F I N A N C I N G E D U C A T I O N F O R A L L
25
G L O B A L E D U C A T I O N D I G E S T 2 0 0 7 C O M P A R I N G E D U C A T I O N S T A T I S T I C S A R O U N D T H E W O R L D
Most other countries with enrolment ratios below 70% also show signifi cant changes in the annual cost per student. Exceptions to this pattern are Cape Verde, El Salvador, Gambia, Namibia and Paraguay, where the cost of educating a secondary student is just 30% more than for a primary student. Differences in expenditure are slightly higher, but still moderate, in Djibouti, Morocco and Rwanda.
The differences in spending fall considerably in countries with high enrolment ratios (above 80%). A secondary student rarely costs more than 1.5 times that of a primary student. Exceptions to this pattern are found in Azerbaijan, Belarus, Belgium, Czech Republic, Finland, France, Mauritius and Ukraine, where expenditure per student is up to 1.8 times higher at the secondary level than the primary level.
The association between education spending and participation levels is even more marked at the tertiary level, where expenditure per student tends to rise dramatically. In countries with gross tertiary enrolment ratios above 35%, the annual public funds used to educate a tertiary student never exceeds 275% (or 2.75 times) the amount spent per primary student. Yet, in countries with tertiary enrolment ratios below 10%, the spending gap explodes: annual spending is between 5 and 50 times (5000%) more for a tertiary student than a primary student.
However, as mentioned above, it is important to consider that expenditure per tertiary student may be overstated for countries that subsidise
internationally mobile students, namely Belize, Botswana, Gambia and Lesotho. Unfortunately, the exact number of mobile students receiving state subsidies is unavailable. But, in the unlikely event that all mobile students are subsidised by their countries of origin, expenditure per tertiary student (at home and abroad) would still range from 8 to 30 times (800% and 3000%) more than the annual expenditure per primary student in these countries.
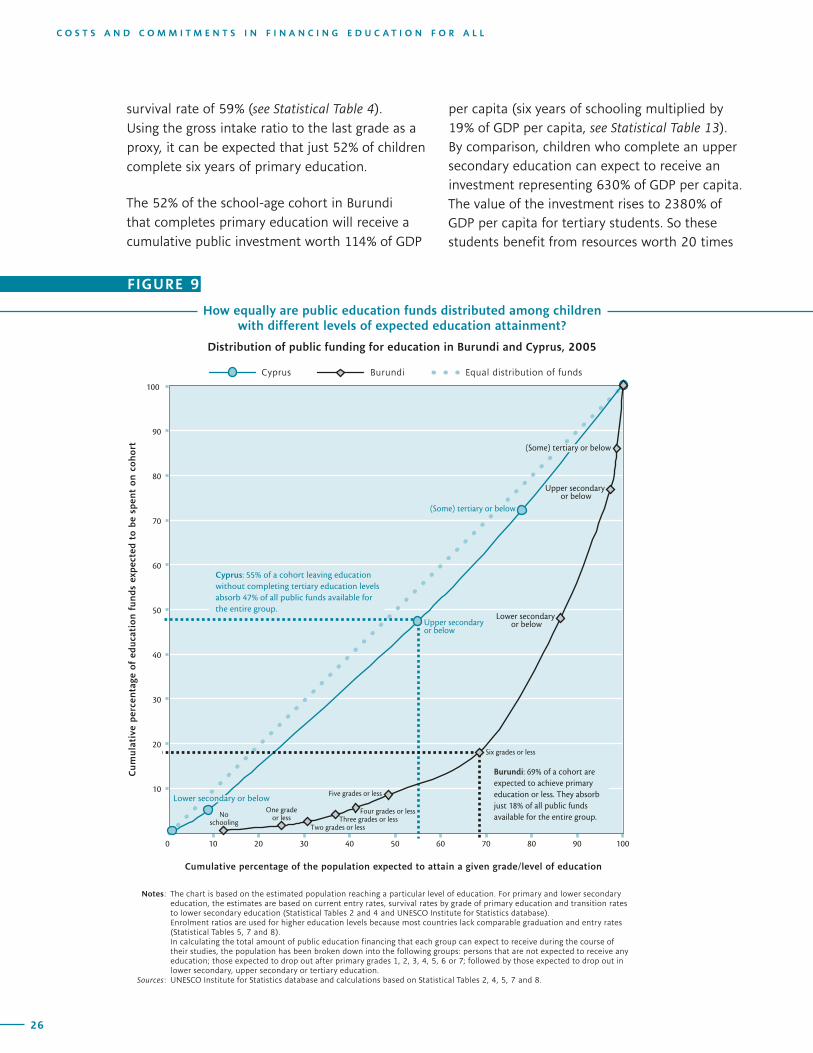
The inequities in access to public education funding are even more extreme in countries with scarce resources. The contrasting examples of Burundi and Cyprus illustrate internal disparities in how countries allocate funds across different levels of education through the use of the Lorentz curve (see notes in Box 3).
Figure 9 compares the distribution of public funding for Burundi to that of Cyprus. Cyprus reports high education spending in relation to its share of the school-age population and a very equal distribution of funds within the country. On the contrary, Burundi has a small education budget relative to its large school-age population and distributes the funds in a very unequal manner.
In Burundi, about 88% of primary school-age children enter this level of education (see Statistical Table 2). Right from the start, this means that about one in ten children will probably never benefi t from any public education funding. Of those who enter primary school, 41% drop out before reaching the last grade, indicated by a
BOX 3 The Lorentz curve
Using the Lorentz curve, countries are ordered by their public education spending per school-age person. The horizontal axis presents the cumulative percentage of the youth population for each country, while the vertical axis represents the respective cumulative percentages of government spending on education.
26
C O S T S A N D C O M M I T M E N T S I N F I N A N C I N G E D U C A T I O N F O R A L L
27
G L O B A L E D U C A T I O N D I G E S T 2 0 0 7 C O M P A R I N G E D U C A T I O N S T A T I S T I C S A R O U N D T H E W O R L D
survival rate of 59% (see Statistical Table 4). Using the gross intake ratio to the last grade as a proxy, it can be expected that just 52% of children complete six years of primary education.
The 52% of the school-age cohort in Burundi that completes primary education will receive a cumulative public investment worth 114% of GDP
per capita (six years of schooling multiplied by 19% of GDP per capita, see Statistical Table 13). By comparison, children who complete an upper secondary education can expect to receive an investment representing 630% of GDP per capita. The value of the investment rises to 2380% of GDP per capita for tertiary students. So these students benefit from resources worth 20 times
How equally are public education funds distributed among children with different levels of expected education attainment?
Distribution of public funding for education in Burundi and Cyprus, 2005
FIGURE 9
��
��
��
��
��
��
��
��
��
���
� �� �� �� �� �� �� �� �� �� ���
�������������������������������������������������������������������������������������������
����������
������
�����
������
���
�������������
���
������������
�������������
�����������
����� ����������� �����
����� ����������� �����
���������������������������
�������� ��� �� � ������ ����������� �� ������� ���������������� �� ����� ���� ���������� ��� �� ��� ������ �������������� ��� ��� ������ ������
����� ����������� �����
��� ������ �� ����
���� ������ �� ����
���� ������ �� ��������� ������ �� ����
��� ������ �� ����
��� ������� ����
������ �������� �� �����
������� ��� �� � ������ ������� ���������������� ���������� �������� ��������� ������������ ��� �� ��� ������ ����� ��������� ������ ������ ������
�������
����� ��������� �� �����
������ �������� �� �����
������
Notes: The chart is based on the estimated population reaching a particular level of education. For primary and lower secondary education, the estimates are based on current entry rates, survival rates by grade of primary education and transition rates to lower secondary education (Statistical Tables 2 and 4 and UNESCO Institute for Statistics database).
Enrolment ratios are used for higher education levels because most countries lack comparable graduation and entry rates (Statistical Tables 5, 7 and 8).
In calculating the total amount of public education financing that each group can expect to receive during the course of their studies, the population has been broken down into the following groups: persons that are not expected to receive any education; those expected to drop out after primary grades 1, 2, 3, 4, 5, 6 or 7; followed by those expected to drop out in lower secondary, upper secondary or tertiary education.
Sources: UNESCO Institute for Statistics database and calculations based on Statistical Tables 2, 4, 5, 7 and 8.
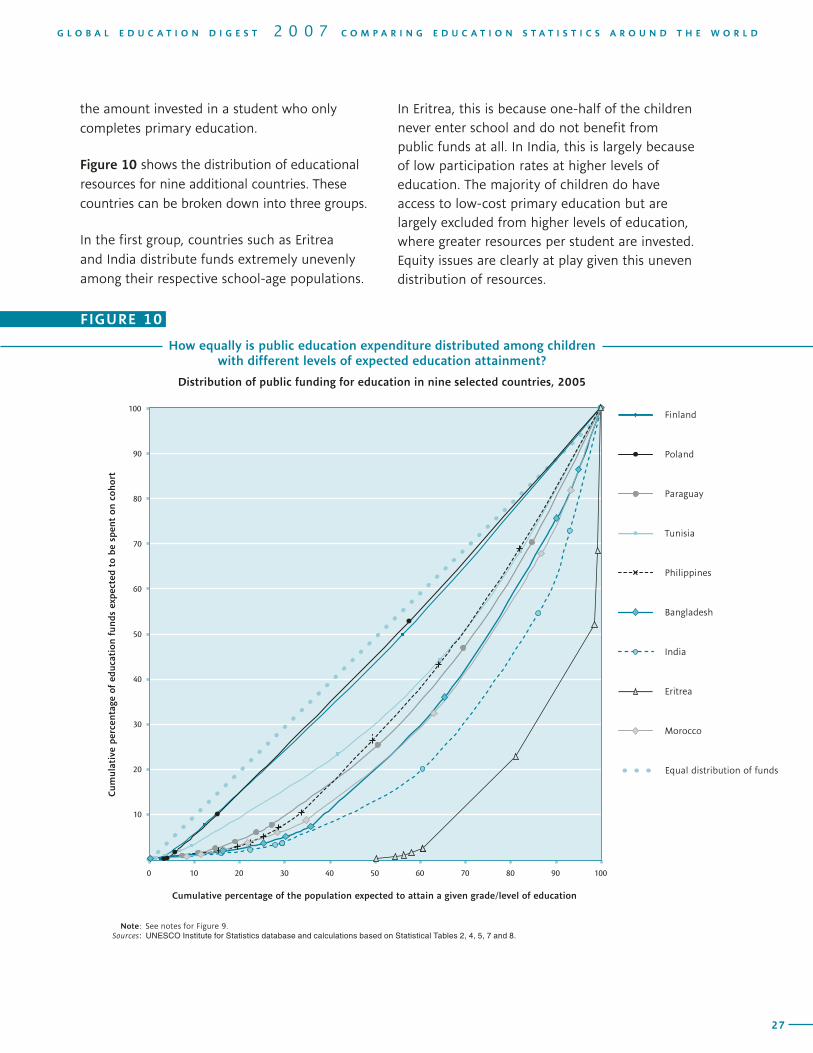
26
C O S T S A N D C O M M I T M E N T S I N F I N A N C I N G E D U C A T I O N F O R A L L
27
G L O B A L E D U C A T I O N D I G E S T 2 0 0 7 C O M P A R I N G E D U C A T I O N S T A T I S T I C S A R O U N D T H E W O R L D
the amount invested in a student who only completes primary education.
Figure 10 shows the distribution of educational resources for nine additional countries. These countries can be broken down into three groups.
In the first group, countries such as Eritrea and India distribute funds extremely unevenly among their respective school-age populations.
In Eritrea, this is because one-half of the children never enter school and do not benefit from public funds at all. In India, this is largely because of low participation rates at higher levels of education. The majority of children do have access to low-cost primary education but are largely excluded from higher levels of education, where greater resources per student are invested. Equity issues are clearly at play given this uneven distribution of resources.
How equally is public education expenditure distributed among children with different levels of expected education attainment?
Distribution of public funding for education in nine selected countries, 2005
���������������������������
��
��
��
��
��
��
��
��
��
���
� �� �� �� �� �� �� �� �� �� ���
�������������������������������������������������������������������������������������������
����������
������
�����
������
���
����
���������
������
���������
������
����
���
�������
������
��������
�������
�����������
�����
�������
����������
�������
Note: See notes for Figure 9. Sources: UNESCO Institute for Statistics database and calculations based on Statistical Tables 2, 4, 5, 7 and 8.
FIGURE 10
28
C O S T S A N D C O M M I T M E N T S I N F I N A N C I N G E D U C A T I O N F O R A L L
29
G L O B A L E D U C A T I O N D I G E S T 2 0 0 7 C O M P A R I N G E D U C A T I O N S T A T I S T I C S A R O U N D T H E W O R L D
In the second group, almost all children complete primary and secondary schooling. Yet, in countries like Bangladesh and Paraguay, costs still vary considerably by level of education. However, equity issues may not be the only concern. It appears that there may be efficiency problems in the school system when there are large differences in spending across different levels of education.
Finally, in countries such as Finland and Poland, the cost differences do not seem to reflect disparities in terms of equity. Basically, the high enrolment rates at higher levels of education ensure that most children will benefit from the increased funding at some point in their school career. These countries might, however, question the efficiency of investing disproportionately at the end of a student's school career. Some of these resources might be better targeted on under-performing students in their early years of schooling.
It must be noted that the data available do not provide the same detail for higher levels of education than for primary education and, therefore, miss some of the distribution effects related to dropout during the course of secondary or tertiary studies. They also do not reflect cost differences across different fields of studies or universities.
3. CHALLENGES AND OPPORTUNITIES FOR FINANCING EDUCATION FOR ALL
Many countries aim to meet their commitment to universal primary education (UPE) by improving the coverage and quality of educational provision. However, they face very different contexts which underlie the potential to finance these goals. This section examines two inter-related factors that
influence education resource and spending issues: the demand for primary education and the internal efficiency of education provision. At the level of the education system, they represent important contexts for resource mobilisation and allocation which, in turn, shape the challenges and opportunities to improve the delivery of education services.
The demand for primary education stems from population growth and efforts to expand school systems in order to serve all school-aged children. This section examines the relative burden of youth populations across countries and changes over time in their absolute numbers. It also examines how broader demographic trends shape demand for education before projecting the required investments for countries seeking to ensure primary education for all children by 2015. In short, how much will it cost to achieve UPE in relation to current levels of expenditure?
The next step lies in evaluating how education systems use existing resources to deliver primary schooling. The organization and structure of education systems have an important impact on costs and resources. This discussion falls more within the scope of policymaking than population growth because it involves national schooling traditions and practices. It will examine how two measures of internal efficiency – student progression and completion of primary education – relate to financial resources for education. It is important to note that these measures reflect the efficiency, but not the effectiveness, of schooling systems (i.e. whether children attain basic skills and competencies).
A few country examples are presented in order to better illustrate how financial and demographic constraints shape the challenges and opportunities to achieve UPE.
28
C O S T S A N D C O M M I T M E N T S I N F I N A N C I N G E D U C A T I O N F O R A L L
29
G L O B A L E D U C A T I O N D I G E S T 2 0 0 7 C O M P A R I N G E D U C A T I O N S T A T I S T I C S A R O U N D T H E W O R L D
Population growth, universal primary education and related resources
The share of the school-age population is an important determinant of resource levels for education. The school-age dependency ratio reflects a country’s share of the population which is not of age to work and pay taxes yet is the target of public education expenditure. The higher the ratio, the smaller the number of taxpayers to provide funds for the population in need of education. An overall dependency ratio would also include those considered beyond the age to work and, thus, in need of social support.
The variation in the level of spending on primary education, shown in earlier sections, is largely due to differences in the relative size of the youth population. A country with a large proportion of school-age children will spend a higher share of its resources on education than a country with fewer children given equivalent unit costs.
That is, of course, if most school-age children actually receive educational services. This remains a distant goal in a number of countries. Indeed, education finance indicators also reflect the variation in primary participation rates: a country serving almost all of its primary school-age children can be expected to spend a higher relative share of its resources than one which provides schooling for only one-half of its school-age cohort.
Figure 11 illustrates demographic pressure and the education system’s ability to respond by showing the relationship between the share of the school-age cohort among the total population and current capacity to provide primary education. System capacity is reflected by the gross enrolment ratio (GER) which represents the proportion of students, regardless of their age, relative to the school-age population. A GER of 100% means that the
education system has the theoretical capacity to cover the entire school-age population, though the indicator often exceeds 100% due to, for example, students who repeat grades. The GER is used here to assess system capacity rather than coverage of the school-age population, which is better reflected by net enrolment rates.
The figure shows that, among countries with relatively sufficient capacity, there is wide variation in the share of the school-age population. It can range from about 4% in countries such as Bulgaria and Latvia, to almost 20% in Mozambique, Swaziland and Zambia. It should be noted, however, that some of the variation is due to the fact that the duration of primary schooling (and thus the size of the age cohort) can range between four and seven years.
Nevertheless, every country in which youth make up less than 12% of the population has sufficient (or nearly so) capacity to meet the demand for primary education. Some countries, such as Brazil, have a relatively low youth population share but a high GER, which indicates the prevalence of grade repetition leading to over-age children enrolled in primary schools.
In countries with youth populations exceeding 12% of the total, enrolment ratios become much more varied. Djibouti and Gabon have similar shares of school-age children (16%), yet there is a large gap in their GERs, reported at 40% and 130% respectively. Very low or very high GERs reflect problems in education provision linked to either limited access or high rates of grade repetition.
The following countries have managed to provide sufficient education opportunities for their proportionately large school-age populations (13% to 18%): Belize, Gabon, Lesotho, Madagascar, Malawi, Nepal and Rwanda. These governments have been able to make significant investments to ensure that the
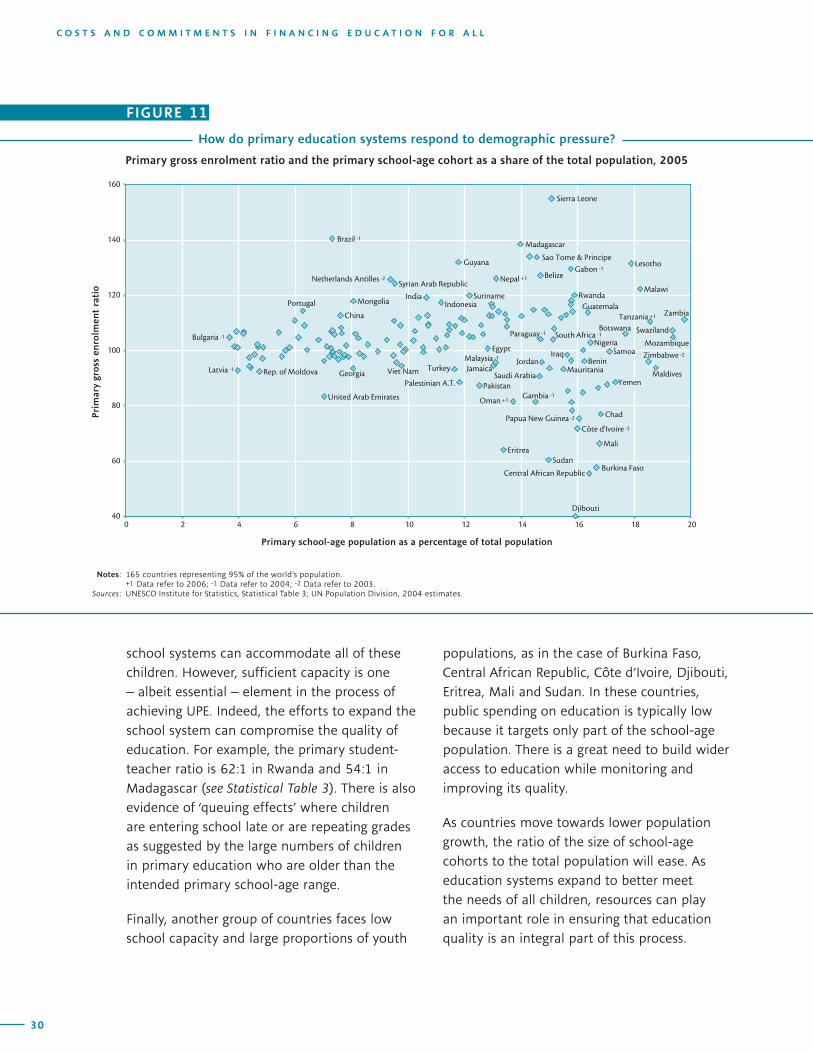
30
C O S T S A N D C O M M I T M E N T S I N F I N A N C I N G E D U C A T I O N F O R A L L
31
G L O B A L E D U C A T I O N D I G E S T 2 0 0 7 C O M P A R I N G E D U C A T I O N S T A T I S T I C S A R O U N D T H E W O R L D
school systems can accommodate all of these children. However, sufficient capacity is one – albeit essential – element in the process of achieving UPE. Indeed, the efforts to expand the school system can compromise the quality of education. For example, the primary student-teacher ratio is 62:1 in Rwanda and 54:1 in Madagascar (see Statistical Table 3). There is also evidence of ‘queuing effects’ where children are entering school late or are repeating grades as suggested by the large numbers of children in primary education who are older than the intended primary school-age range.
Finally, another group of countries faces low school capacity and large proportions of youth
populations, as in the case of Burkina Faso, Central African Republic, Côte d’Ivoire, Djibouti, Eritrea, Mali and Sudan. In these countries, public spending on education is typically low because it targets only part of the school-age population. There is a great need to build wider access to education while monitoring and improving its quality.
As countries move towards lower population growth, the ratio of the size of school-age cohorts to the total population will ease. As education systems expand to better meet the needs of all children, resources can play an important role in ensuring that education quality is an integral part of this process.
How do primary education systems respond to demographic pressure?
Primary gross enrolment ratio and the primary school-age cohort as a share of the total population, 2005
FIGURE 11
������
������ ���� ��������
����
����������� ����
������� ����
����������
�������
������
����
����� ��� ������ ��
������ ��
������ �����
����������
�����
���������
����������
��������
������
�������
���������������
����� ��
����� ������
����� ��
������� ������� ��������
�������� ��
�������� ��
�����
��������
�����
�������� ��
���� �������� ��
������
�����
��������
����������� ��
�������������
���� ��
������ ���� ��������
�������� ��
�������� ���������
�����
��� ���� � ��������
������ ��
�����������������
�������
�����
���� ���
��������
����������� �������� ��
������
��������
�������
�������� ��
���� �� ������������� ��
��
��
��
���
���
���
���
� � � � � �� �� �� �� �� ��
�����������������������������������������������������������������
����
��������
����
����
���������
Notes: 165 countries representing 95% of the world’s population. +1 Data refer to 2006; -1 Data refer to 2004; -2 Data refer to 2003. Sources: UNESCO Institute for Statistics, Statistical Table 3; UN Population Division, 2004 estimates.
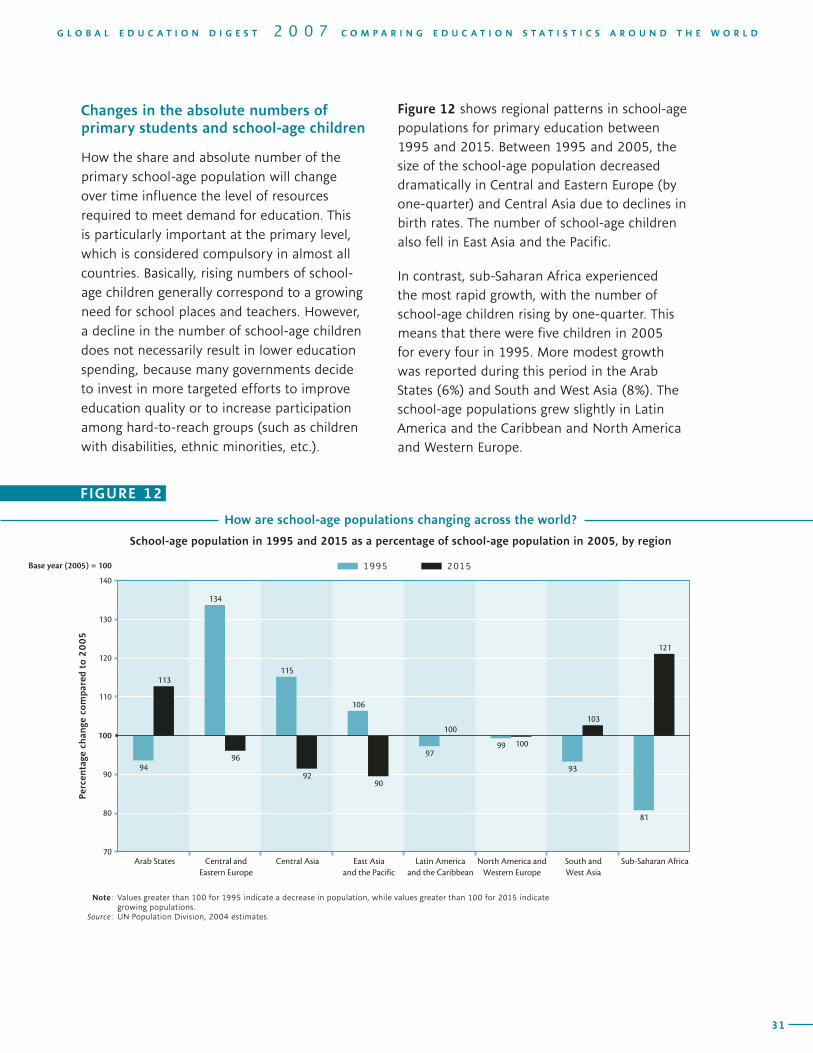
30
C O S T S A N D C O M M I T M E N T S I N F I N A N C I N G E D U C A T I O N F O R A L L
31
G L O B A L E D U C A T I O N D I G E S T 2 0 0 7 C O M P A R I N G E D U C A T I O N S T A T I S T I C S A R O U N D T H E W O R L D
Changes in the absolute numbers of primary students and school-age children
How the share and absolute number of the primary school-age population will change over time influence the level of resources required to meet demand for education. This is particularly important at the primary level, which is considered compulsory in almost all countries. Basically, rising numbers of school-age children generally correspond to a growing need for school places and teachers. However, a decline in the number of school-age children does not necessarily result in lower education spending, because many governments decide to invest in more targeted efforts to improve education quality or to increase participation among hard-to-reach groups (such as children with disabilities, ethnic minorities, etc.).
Figure 12 shows regional patterns in school-age populations for primary education between 1995 and 2015. Between 1995 and 2005, the size of the school-age population decreased dramatically in Central and Eastern Europe (by one-quarter) and Central Asia due to declines in birth rates. The number of school-age children also fell in East Asia and the Pacific.
In contrast, sub-Saharan Africa experienced the most rapid growth, with the number of school-age children rising by one-quarter. This means that there were five children in 2005 for every four in 1995. More modest growth was reported during this period in the Arab States (6%) and South and West Asia (8%). The school-age populations grew slightly in Latin America and the Caribbean and North America and Western Europe.
��
����
��
��
��
����
���
���
���
���
���
������
���
��
��
��
���
���
���
���
���
���� ������ ������� ���������� ������
������� ���� ���� ������� ��� �������
����� ���������� ��� ���������
����� ������� ���������� ������
����� ������� ����
����������� ������
������
����
�����
������
�����
��������
���� ���� ������ � ��� ���� ����
How are school-age populations changing across the world?
School-age population in 1995 and 2015 as a percentage of school-age population in 2005, by region
Note: Values greater than 100 for 1995 indicate a decrease in population, while values greater than 100 for 2015 indicate growing populations.
Source: UN Population Division, 2004 estimates.
FIGURE 12
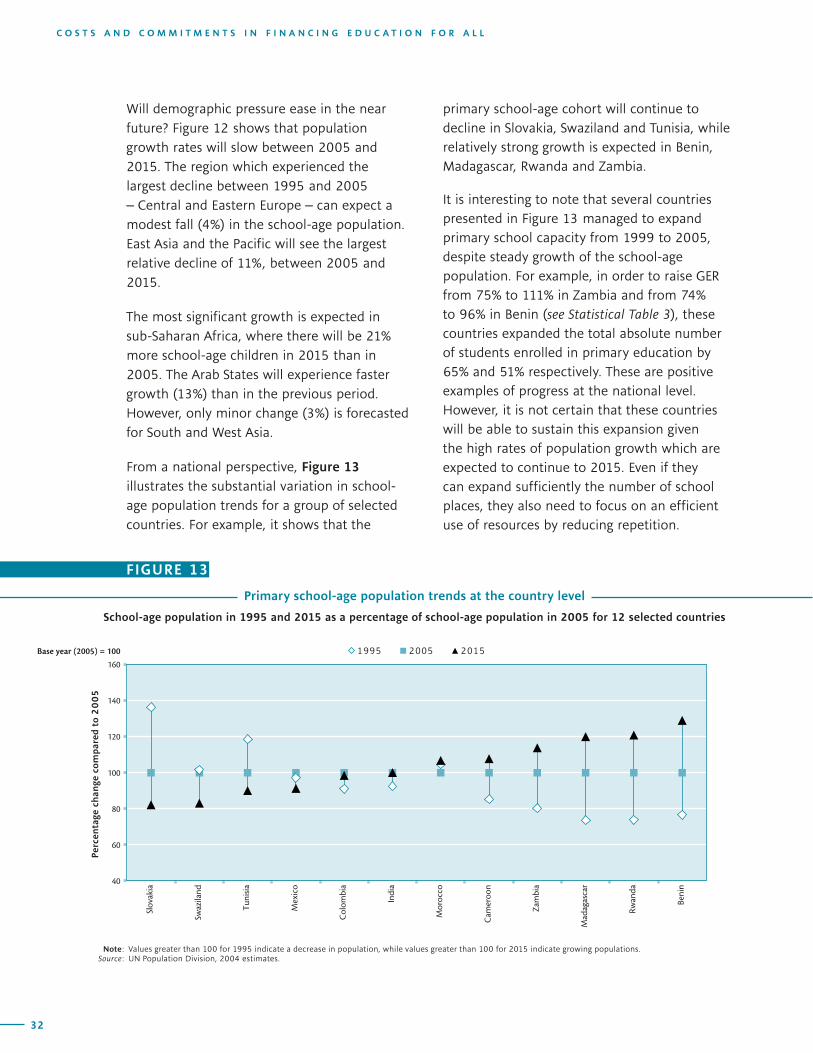
32
C O S T S A N D C O M M I T M E N T S I N F I N A N C I N G E D U C A T I O N F O R A L L
33
G L O B A L E D U C A T I O N D I G E S T 2 0 0 7 C O M P A R I N G E D U C A T I O N S T A T I S T I C S A R O U N D T H E W O R L D
Will demographic pressure ease in the near future? Figure 12 shows that population growth rates will slow between 2005 and 2015. The region which experienced the largest decline between 1995 and 2005 – Central and Eastern Europe – can expect a modest fall (4%) in the school-age population. East Asia and the Pacific will see the largest relative decline of 11%, between 2005 and 2015.
The most significant growth is expected in sub-Saharan Africa, where there will be 21% more school-age children in 2015 than in 2005. The Arab States will experience faster growth (13%) than in the previous period. However, only minor change (3%) is forecasted for South and West Asia.
From a national perspective, Figure 13 illustrates the substantial variation in school-age population trends for a group of selected countries. For example, it shows that the
primary school-age cohort will continue to decline in Slovakia, Swaziland and Tunisia, while relatively strong growth is expected in Benin, Madagascar, Rwanda and Zambia.
It is interesting to note that several countries presented in Figure 13 managed to expand primary school capacity from 1999 to 2005, despite steady growth of the school-age population. For example, in order to raise GER from 75% to 111% in Zambia and from 74% to 96% in Benin (see Statistical Table 3), these countries expanded the total absolute number of students enrolled in primary education by 65% and 51% respectively. These are positive examples of progress at the national level. However, it is not certain that these countries will be able to sustain this expansion given the high rates of population growth which are expected to continue to 2015. Even if they can expand sufficiently the number of school places, they also need to focus on an efficient use of resources by reducing repetition.
Primary school-age population trends at the country level
School-age population in 1995 and 2015 as a percentage of school-age population in 2005 for 12 selected countries
FIGURE 13
��
��
��
���
���
���
���
����
����
�������
��
�������
���
���
�����
���
�����
�����
��
���
����
�
���
���
���
�������
����
��
�����
������
����
�����
������
�����
��������
�������� �������� ���� ������ � ���
Note: Values greater than 100 for 1995 indicate a decrease in population, while values greater than 100 for 2015 indicate growing populations. Source: UN Population Division, 2004 estimates.
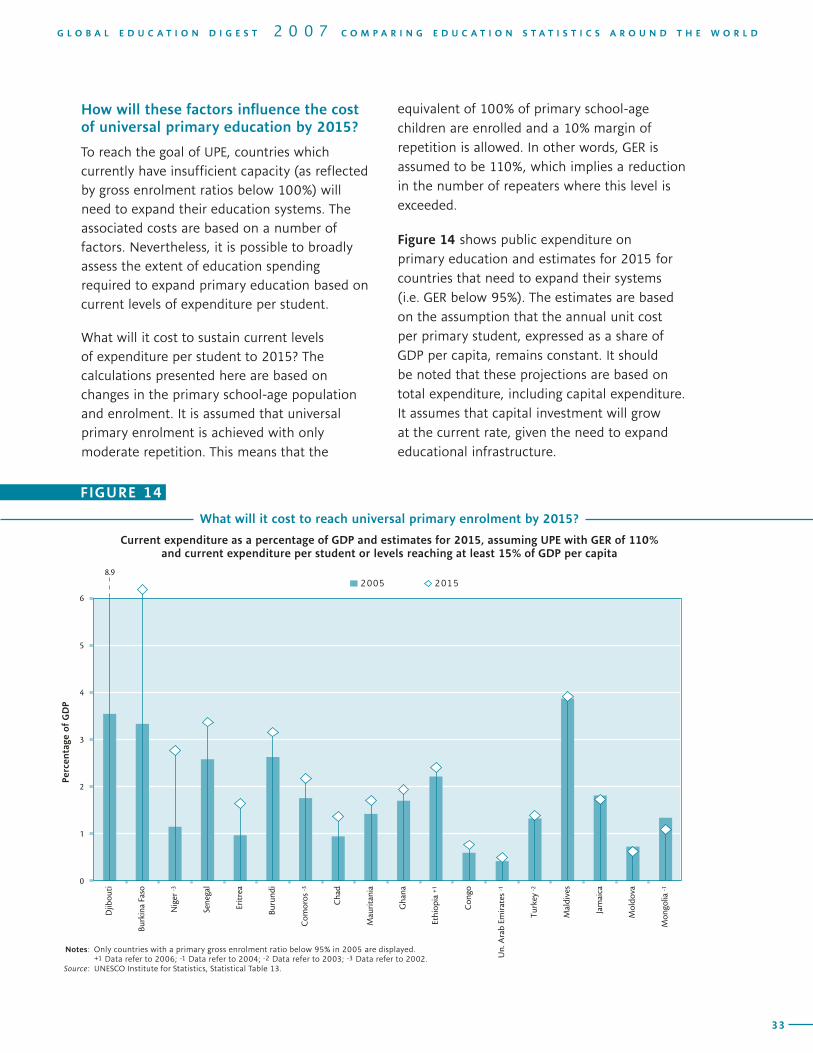
32
C O S T S A N D C O M M I T M E N T S I N F I N A N C I N G E D U C A T I O N F O R A L L
33
G L O B A L E D U C A T I O N D I G E S T 2 0 0 7 C O M P A R I N G E D U C A T I O N S T A T I S T I C S A R O U N D T H E W O R L D
How will these factors influence the cost of universal primary education by 2015?
To reach the goal of UPE, countries which currently have insufficient capacity (as reflected by gross enrolment ratios below 100%) will need to expand their education systems. The associated costs are based on a number of factors. Nevertheless, it is possible to broadly assess the extent of education spending required to expand primary education based on current levels of expenditure per student.
What will it cost to sustain current levels of expenditure per student to 2015? The calculations presented here are based on changes in the primary school-age population and enrolment. It is assumed that universal primary enrolment is achieved with only moderate repetition. This means that the
equivalent of 100% of primary school-age children are enrolled and a 10% margin of repetition is allowed. In other words, GER is assumed to be 110%, which implies a reduction in the number of repeaters where this level is exceeded.
Figure 14 shows public expenditure on primary education and estimates for 2015 for countries that need to expand their systems (i.e. GER below 95%). The estimates are based on the assumption that the annual unit cost per primary student, expressed as a share of GDP per capita, remains constant. It should be noted that these projections are based on total expenditure, including capital expenditure. It assumes that capital investment will grow at the current rate, given the need to expand educational infrastructure.
�
�
�
�
�
�
�
����
����
�����������
�����
��
������
����
����
���
�������
������
�
���
����
��
���
�
���
�����
��
���
��
���
��
���
������
��������
������
��
��������
�������
�����
��
���
�����
��
������
����
��������
������� ����
What will it cost to reach universal primary enrolment by 2015?
Current expenditure as a percentage of GDP and estimates for 2015, assuming UPE with GER of 110% and current expenditure per student or levels reaching at least 15% of GDP per capita
Notes: Only countries with a primary gross enrolment ratio below 95% in 2005 are displayed. +1 Data refer to 2006; -1 Data refer to 2004; -2 Data refer to 2003; -3 Data refer to 2002. Source: UNESCO Institute for Statistics, Statistical Table 13.
FIGURE 14
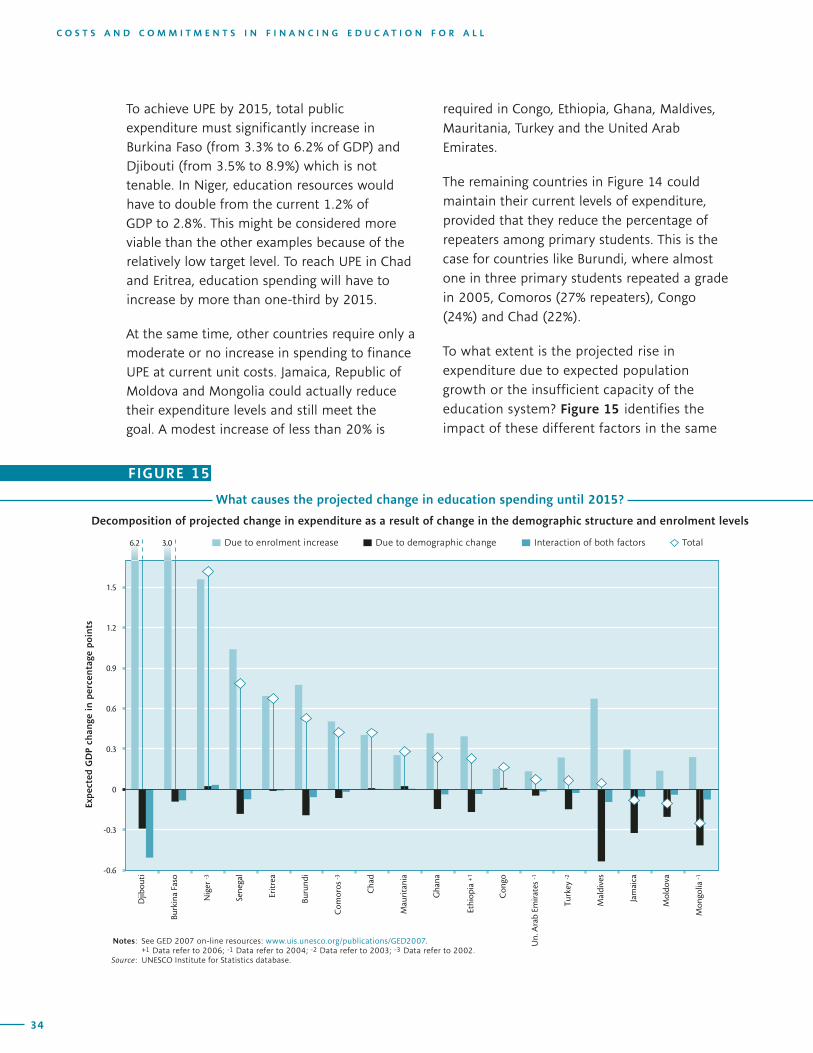
34
C O S T S A N D C O M M I T M E N T S I N F I N A N C I N G E D U C A T I O N F O R A L L
35
G L O B A L E D U C A T I O N D I G E S T 2 0 0 7 C O M P A R I N G E D U C A T I O N S T A T I S T I C S A R O U N D T H E W O R L D
To achieve UPE by 2015, total public expenditure must significantly increase in Burkina Faso (from 3.3% to 6.2% of GDP) and Djibouti (from 3.5% to 8.9%) which is not tenable. In Niger, education resources would have to double from the current 1.2% of GDP to 2.8%. This might be considered more viable than the other examples because of the relatively low target level. To reach UPE in Chad and Eritrea, education spending will have to increase by more than one-third by 2015.
At the same time, other countries require only a moderate or no increase in spending to finance UPE at current unit costs. Jamaica, Republic of Moldova and Mongolia could actually reduce their expenditure levels and still meet the goal. A modest increase of less than 20% is
required in Congo, Ethiopia, Ghana, Maldives, Mauritania, Turkey and the United Arab Emirates.
The remaining countries in Figure 14 could maintain their current levels of expenditure, provided that they reduce the percentage of repeaters among primary students. This is the case for countries like Burundi, where almost one in three primary students repeated a grade in 2005, Comoros (27% repeaters), Congo (24%) and Chad (22%).
To what extent is the projected rise in expenditure due to expected population growth or the insufficient capacity of the education system? Figure 15 identifies the impact of these different factors in the same
-0.6
-0.3
0
0.3
0.6
0.9
1.2
1.5
Djib
outi
Burk
ina
Faso
Nig
er -3
Con
go
Un.
Ara
b Em
irat
es -1
Turk
ey -2
Mal
dive
s
Jam
aica
Mol
dova
Mon
golia
-1
Exp
ecte
d G
DP
chan
ge i
n p
erce
nta
ge p
oin
ts
Ethi
opia
+1
Sene
gal
Erit
rea
Buru
ndi
Com
oros
-3
Cha
d
Mau
rita
nia
Gha
na
Interaction of both factorsDue to enrolment increase Due to demographic change Total6.2 3.0
What causes the projected change in education spending until 2015?
Decomposition of projected change in expenditure as a result of change in the demographic structure and enrolment levels
FIGURE 15
Notes: See GED 2007 on-line resources: www.uis.unesco.org/publications/GED2007. +1 Data refer to 2006; -1 Data refer to 2004; -2 Data refer to 2003; -3 Data refer to 2002. Source: UNESCO Institute for Statistics database.
34
C O S T S A N D C O M M I T M E N T S I N F I N A N C I N G E D U C A T I O N F O R A L L
35
G L O B A L E D U C A T I O N D I G E S T 2 0 0 7 C O M P A R I N G E D U C A T I O N S T A T I S T I C S A R O U N D T H E W O R L D
group of countries presented in the previous graph. First, it illustrates the increase in spending (expressed in percentage points of GDP) needed for gross enrolment ratios to reach 110%, based on the current share of the school-age population. For comparative purposes, the figure shows the spending levels required to accommodate changes in the school-age population while assuming that enrolment ratios remain the same. The combined effect of both factors is illustrated also in the figure, while the diamond summarises the total projected change.
In most countries, a decrease in the share of the primary school-age population eases the financial strain involved in providing UPE. In countries such as Jamaica, Maldives, Mongolia, the Republic of Moldova and Turkey, population growth rates are so low that governments can actually maintain or decrease expenditure as a percentage of GDP, while expanding the coverage or capacity of education systems. The absolute number of children may not actually fall, but it is nevertheless growing slower than the rest of the population. This has the effect of reducing the school-age dependency ratio.
It is important to note that these models, which are driven by numbers of students, do not take into account education quality. The initial drive to expand education systems to reach all school-age children is often associated with reduced education quality. But to achieve UPE, the challenge lies not just in enrolling children in school but ensuring that they successfully complete their education.
The efficient use of resources to deliver primary schooling
Education costs are influenced by how efficiently education is provided. The discussion will turn now to student progression and completion, and the financial implications associated with children who start school but repeat grades. The indicators presented reflect how resources invested in primary education relate to the efficiency of primary schools, but do not examine the effectiveness of education systems, i.e. whether they are delivering good learning outcomes.
Figure 16 shows the relationship between system capacity and school completion through the use of proxies. The proxy for system capacity is the gross enrolment ratio: the benchmark of 110% indicates a sufficient level to enrol the school-age population and accommodate students who repeat grades. Higher GERs are typically due to the high share of repeaters (the ratio rises with the number of students older than the intended age range for primary school). Lower GERs indicate that the education system does not have the capacity to enrol the whole school-age population.
The proxy for primary completion rates is the gross intake ratio to the last grade of primary, which represents the proportion of the school-age population who complete primary education at the intended graduation age.
There are basically two groups of countries facing problems related to resources. The first group can be characterised by insufficient levels of capacity and low completion rates. Many
What causes the projected change in education spending until 2015?
Decomposition of projected change in expenditure as a result of change in the demographic structure and enrolment levels
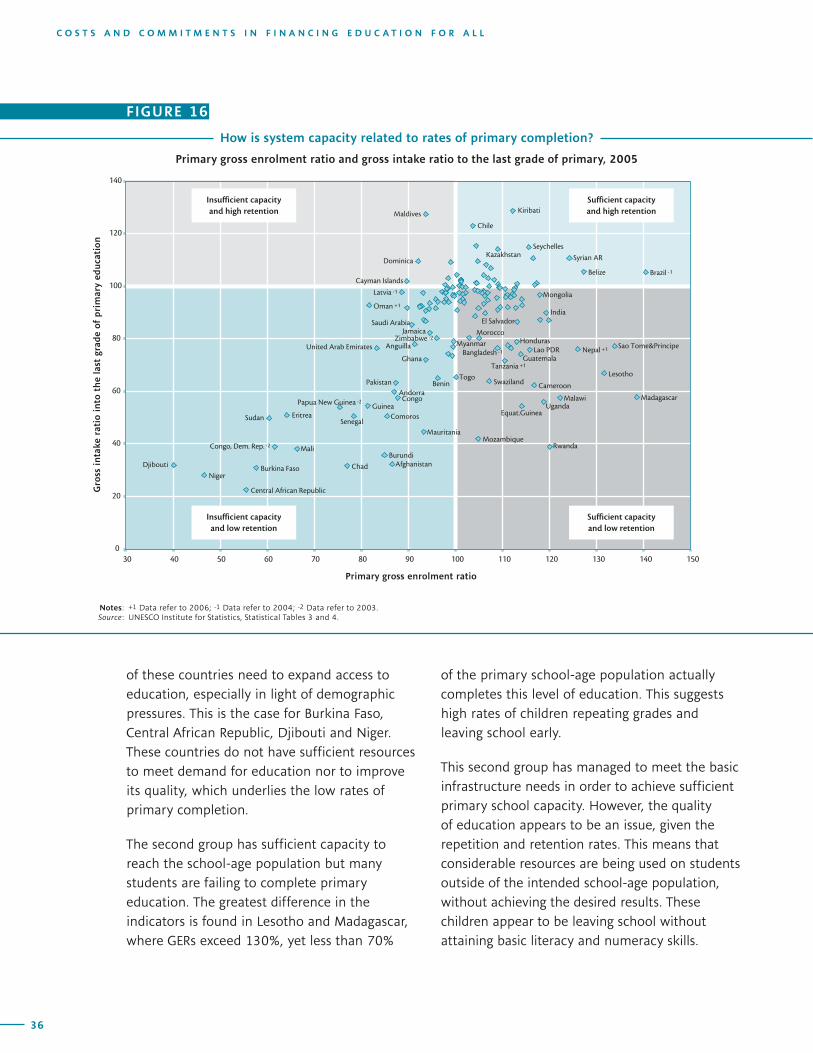
36
C O S T S A N D C O M M I T M E N T S I N F I N A N C I N G E D U C A T I O N F O R A L L
37
G L O B A L E D U C A T I O N D I G E S T 2 0 0 7 C O M P A R I N G E D U C A T I O N S T A T I S T I C S A R O U N D T H E W O R L D
of these countries need to expand access to education, especially in light of demographic pressures. This is the case for Burkina Faso, Central African Republic, Djibouti and Niger. These countries do not have sufficient resources to meet demand for education nor to improve its quality, which underlies the low rates of primary completion.
The second group has sufficient capacity to reach the school-age population but many students are failing to complete primary education. The greatest difference in the indicators is found in Lesotho and Madagascar, where GERs exceed 130%, yet less than 70%
of the primary school-age population actually completes this level of education. This suggests high rates of children repeating grades and leaving school early.
This second group has managed to meet the basic infrastructure needs in order to achieve sufficient primary school capacity. However, the quality of education appears to be an issue, given the repetition and retention rates. This means that considerable resources are being used on students outside of the intended school-age population, without achieving the desired results. These children appear to be leaving school without attaining basic literacy and numeracy skills.
�
��
��
��
��
���
���
���
�� �� �� �� �� �� �� ��� ��� ��� ��� ��� ���
�����������������������������
������������
����������������������������������������
���
����
������������ ����������� ��� ���������
���������� ����������� ��� ���������
���������� ����������� ���� ���������
������������ ����������� ���� ���������
������� ������� ��������
������������ ���� ������������ �����������
����������������� ���� ���� �� ������
��������������������
����� ���������������������
����� ��� ������ ��
������������������ ������
����������� �����������������
���������������� ������������������ �������
�������� ������� ���������
��� ��� ����� ������������ �������� ���� �������� ��� ���������������������
����������������������� ���������
����� ������ �� �������������
������ ��
���� ��
��������
������ ������������� ��������
�������� ������ ����������������������
�����
�������� ��������
�������
How is system capacity related to rates of primary completion?
Primary gross enrolment ratio and gross intake ratio to the last grade of primary, 2005
FIGURE 16
Notes: +1 Data refer to 2006; -1 Data refer to 2004; -2 Data refer to 2003. Source: UNESCO Institute for Statistics, Statistical Tables 3 and 4.
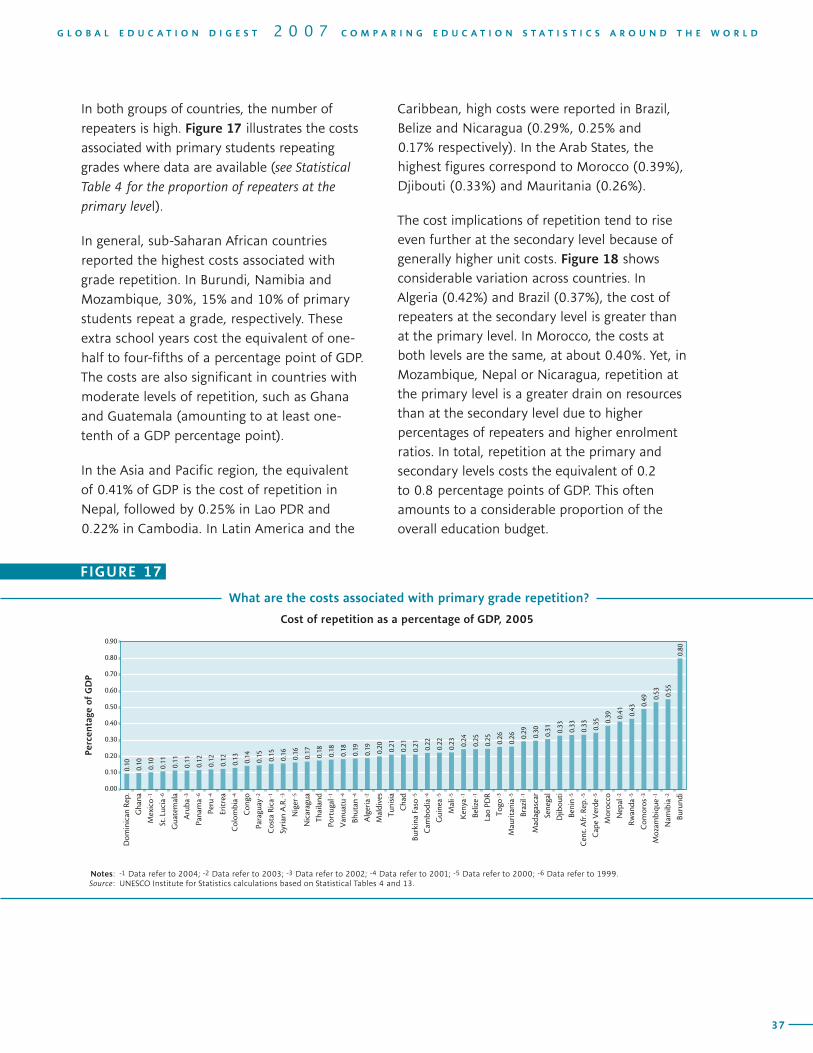
36
C O S T S A N D C O M M I T M E N T S I N F I N A N C I N G E D U C A T I O N F O R A L L
37
G L O B A L E D U C A T I O N D I G E S T 2 0 0 7 C O M P A R I N G E D U C A T I O N S T A T I S T I C S A R O U N D T H E W O R L D
In both groups of countries, the number of repeaters is high. Figure 17 illustrates the costs associated with primary students repeating grades where data are available (see Statistical Table 4 for the proportion of repeaters at the primary level).
In general, sub-Saharan African countries reported the highest costs associated with grade repetition. In Burundi, Namibia and Mozambique, 30%, 15% and 10% of primary students repeat a grade, respectively. These extra school years cost the equivalent of one-half to four-fifths of a percentage point of GDP. The costs are also significant in countries with moderate levels of repetition, such as Ghana and Guatemala (amounting to at least one-tenth of a GDP percentage point).
In the Asia and Pacific region, the equivalent of 0.41% of GDP is the cost of repetition in Nepal, followed by 0.25% in Lao PDR and 0.22% in Cambodia. In Latin America and the
Caribbean, high costs were reported in Brazil, Belize and Nicaragua (0.29%, 0.25% and 0.17% respectively). In the Arab States, the highest figures correspond to Morocco (0.39%), Djibouti (0.33%) and Mauritania (0.26%).
The cost implications of repetition tend to rise even further at the secondary level because of generally higher unit costs. Figure 18 shows considerable variation across countries. In Algeria (0.42%) and Brazil (0.37%), the cost of repeaters at the secondary level is greater than at the primary level. In Morocco, the costs at both levels are the same, at about 0.40%. Yet, in Mozambique, Nepal or Nicaragua, repetition at the primary level is a greater drain on resources than at the secondary level due to higher percentages of repeaters and higher enrolment ratios. In total, repetition at the primary and secondary levels costs the equivalent of 0.2 to 0.8 percentage points of GDP. This often amounts to a considerable proportion of the overall education budget.
����
���� ���� ���� ����
����
����
����
���� ���� ����
���� ����
���� ���� ���� ���� ����
����
����
���� ���� ����
����
���� ����
����
���� ����
����
���� ����
���� ���� ���� ���� ����
����
���� ���� ��
�� ���� ����
���� ��
�� ����
����
����
����
����
����
����
����
����
����
����
����
���
������
����
���
��
���
���
��
������
����
���
������
�����
��
����
����
����
��
�������
�����
�����
���
��
������
����
���
������
��
�����
�������
�����
��
�������
��
��������
������
����
���
����
��
����
����
�������
��
�������
�
�������
���
�
���������
����
���
�������
�����
���
������
���
����
��������
�����
�
����
��
���
�����
����
��������
���
������
�
����
���
����
����
�����
��
���
�������
�����
���
������
��
���
����
���
����
����
����
���
����
��
���
������
���
���
����
��
������
�
������
����
�������
What are the costs associated with primary grade repetition?
Cost of repetition as a percentage of GDP, 2005
Notes: -1 Data refer to 2004; -2 Data refer to 2003; -3 Data refer to 2002; -4 Data refer to 2001; -5 Data refer to 2000; -6 Data refer to 1999. Source: UNESCO Institute for Statistics calculations based on Statistical Tables 4 and 13.
FIGURE 17
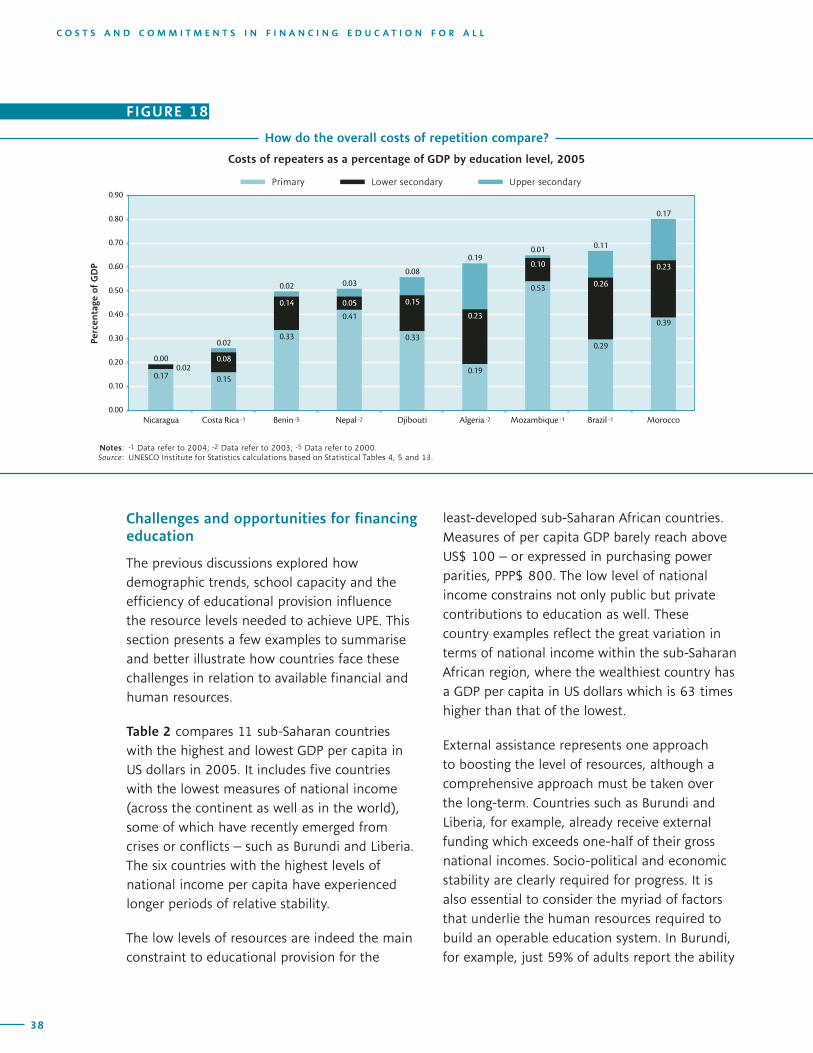
38
C O S T S A N D C O M M I T M E N T S I N F I N A N C I N G E D U C A T I O N F O R A L L
39
G L O B A L E D U C A T I O N D I G E S T 2 0 0 7 C O M P A R I N G E D U C A T I O N S T A T I S T I C S A R O U N D T H E W O R L D
Challenges and opportunities for financing education
The previous discussions explored how demographic trends, school capacity and the efficiency of educational provision influence the resource levels needed to achieve UPE. This section presents a few examples to summarise and better illustrate how countries face these challenges in relation to available financial and human resources.
Table 2 compares 11 sub-Saharan countries with the highest and lowest GDP per capita in US dollars in 2005. It includes five countries with the lowest measures of national income (across the continent as well as in the world), some of which have recently emerged from crises or conflicts – such as Burundi and Liberia. The six countries with the highest levels of national income per capita have experienced longer periods of relative stability.
The low levels of resources are indeed the main constraint to educational provision for the
least-developed sub-Saharan African countries. Measures of per capita GDP barely reach above US$ 100 – or expressed in purchasing power parities, PPP$ 800. The low level of national income constrains not only public but private contributions to education as well. These country examples reflect the great variation in terms of national income within the sub-Saharan African region, where the wealthiest country has a GDP per capita in US dollars which is 63 times higher than that of the lowest.
External assistance represents one approach to boosting the level of resources, although a comprehensive approach must be taken over the long-term. Countries such as Burundi and Liberia, for example, already receive external funding which exceeds one-half of their gross national incomes. Socio-political and economic stability are clearly required for progress. It is also essential to consider the myriad of factors that underlie the human resources required to build an operable education system. In Burundi, for example, just 59% of adults report the ability
����
����
����
����
����
����
����
����
����
����
��������� ����� ���� �� ����� �� ����� �� �������� ������� �� ���������� �� ������ �� �������
������
����
�������
������� ��������������� ���������������
���� ����
����
����
����
����
����
����
����
����
���� ���� ����
����
����
����
��������
��������
����
����
����
���� ����
����
����
How do the overall costs of repetition compare?
Costs of repeaters as a percentage of GDP by education level, 2005
FIGURE 18
Notes: -1 Data refer to 2004; -2 Data refer to 2003; -5 Data refer to 2000. Source: UNESCO Institute for Statistics calculations based on Statistical Tables 4, 5 and 13.
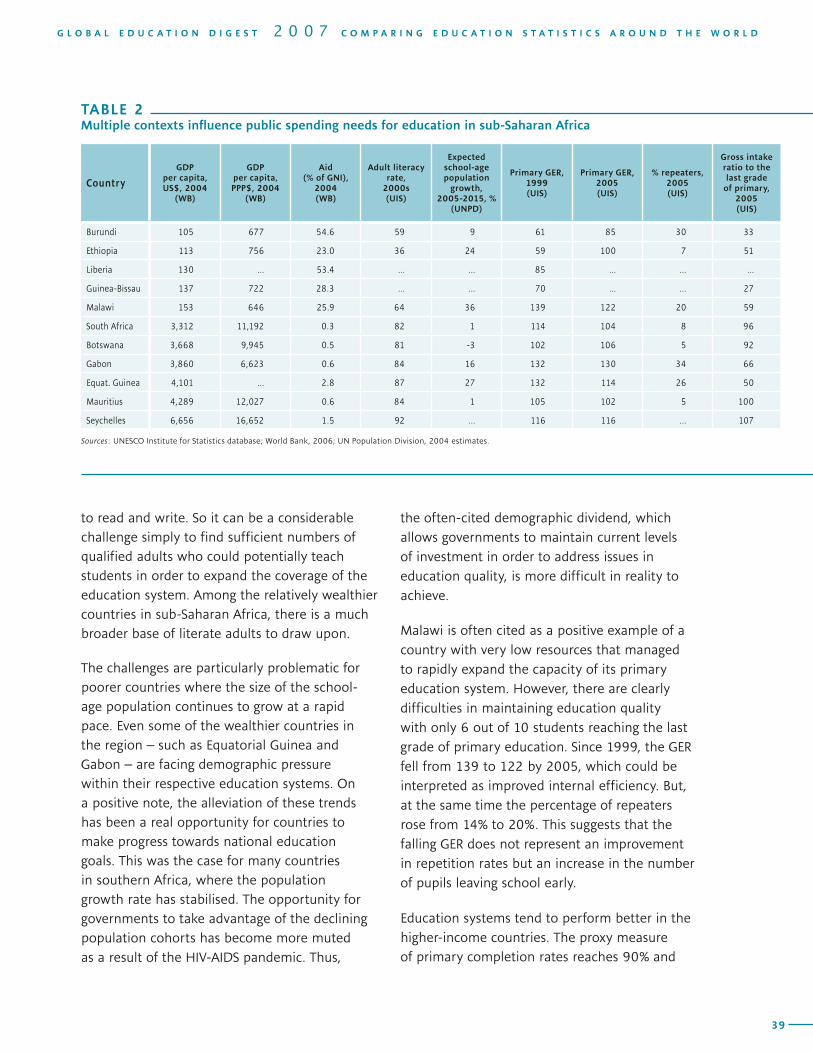
38
C O S T S A N D C O M M I T M E N T S I N F I N A N C I N G E D U C A T I O N F O R A L L
39
G L O B A L E D U C A T I O N D I G E S T 2 0 0 7 C O M P A R I N G E D U C A T I O N S T A T I S T I C S A R O U N D T H E W O R L D
to read and write. So it can be a considerable challenge simply to find sufficient numbers of qualified adults who could potentially teach students in order to expand the coverage of the education system. Among the relatively wealthier countries in sub-Saharan Africa, there is a much broader base of literate adults to draw upon.
The challenges are particularly problematic for poorer countries where the size of the school-age population continues to grow at a rapid pace. Even some of the wealthier countries in the region – such as Equatorial Guinea and Gabon – are facing demographic pressure within their respective education systems. On a positive note, the alleviation of these trends has been a real opportunity for countries to make progress towards national education goals. This was the case for many countries in southern Africa, where the population growth rate has stabilised. The opportunity for governments to take advantage of the declining population cohorts has become more muted as a result of the HIV-AIDS pandemic. Thus,
TABLE 2Multiple contexts influence public spending needs for education in sub-Saharan Africa
Country
GDP per capita, US$, 2004
(WB)
GDP per capita, PPP$, 2004
(WB)
Aid (% of GNI),
2004(WB)
Adult literacy rate,
2000s(UIS)
Expected school-age population
growth, 2005-2015, %
(UNPD)
Primary GER, 1999(UIS)
Primary GER, 2005(UIS)
% repeaters, 2005(UIS)
Gross intake ratio to the last grade
of primary, 2005(UIS)
Burundi 105 677 54.6 59 9 61 85 30 33
Ethiopia 113 756 23.0 36 24 59 100 7 51
Liberia 130 … 53.4 … … 85 … … …
Guinea-Bissau 137 722 28.3 … … 70 … … 27
Malawi 153 646 25.9 64 36 139 122 20 59
South Africa 3,312 11,192 0.3 82 1 114 104 8 96
Botswana 3,668 9,945 0.5 81 -3 102 106 5 92
Gabon 3,860 6,623 0.6 84 16 132 130 34 66
Equat. Guinea 4,101 … 2.8 87 27 132 114 26 50
Mauritius 4,289 12,027 0.6 84 1 105 102 5 100
Seychelles 6,656 16,652 1.5 92 … 116 116 … 107
Sources: UNESCO Institute for Statistics database; World Bank, 2006; UN Population Division, 2004 estimates.
the often-cited demographic dividend, which allows governments to maintain current levels of investment in order to address issues in education quality, is more difficult in reality to achieve.
Malawi is often cited as a positive example of a country with very low resources that managed to rapidly expand the capacity of its primary education system. However, there are clearly difficulties in maintaining education quality with only 6 out of 10 students reaching the last grade of primary education. Since 1999, the GER fell from 139 to 122 by 2005, which could be interpreted as improved internal efficiency. But, at the same time the percentage of repeaters rose from 14% to 20%. This suggests that the falling GER does not represent an improvement in repetition rates but an increase in the number of pupils leaving school early.
Education systems tend to perform better in the higher-income countries. The proxy measure of primary completion rates reaches 90% and
40
C O S T S A N D C O M M I T M E N T S I N F I N A N C I N G E D U C A T I O N F O R A L L
41
G L O B A L E D U C A T I O N D I G E S T 2 0 0 7 C O M P A R I N G E D U C A T I O N S T A T I S T I C S A R O U N D T H E W O R L D
higher in this group, with the exceptions of Equatorial Guinea and Gabon. The availability of resources in these two countries presents an opportunity that should be matched by higher levels of outputs. For example, at a lower level of national income per capita, almost all children reach the last grade of primary education in Botswana. But in this respect, these countries are not achieving the performance expected given the level of national income. Greater efforts are clearly needed.
4. SOURCES AND FLOWS OF EDUCATION FUNDING
As noted at the outset, international debates concerning education financing have focused largely on public expenditure by governments and, to some extent, development agencies and donors. This is especially true for efforts to determine the resources required to achieve Education for All or the education-related targets of the Millennium Development Goals. In this context, the public sector focus is justified for it is the government’s responsibility to provide access to compulsory or basic education. However, public funds reflect only part of what society as a whole invests in education.
The private sector – including individual students, households and organised groups – plays a significant role in financing schooling at all levels in many countries. However, the level of this investment is often difficult to identify and compare across countries. Many countries provide estimates of the amounts spent by households on education. But, they employ different definitions of ‘education costs’ and a variety of data sources, ranging from national accounts to household and school surveys.
Despite these limitations, the available data reveal considerable differences in private contributions to educational institutions across countries and by education levels. It also illustrates the extent to which private and public sources of education funding are intertwined. In many countries, a proportion of public funding goes towards private schools. At the same time, many public schools rely considerably on the private contributions of families (namely tuition fees). In addition, governments also indirectly fund educational institutions by providing subsidies to households.
This final section reviews existing data in order to provide a more comprehensive view of the different sources of education funding. It will highlight the links between the level of private contributions, prevalence of private provision and use of state subsidies to households. A further analysis of these issues by level of education brings out important policy dimensions. The ultimate aim is to provide a more complete picture of what society invests in education in order to better understand the cost and equity implications of attaining international education goals.
What a society invests in education
It is essential to consider all sources of funding for education and measure this investment using a consistent framework. To do so, it is necessary to identify what is meant by sources, flows and destinations of funding (see Figure 19). There are three main sources of funding for education: the public sector, the private sector and international sources. Public sector expenditure refers to funds spent by governments on educational institutions. This source can be further divided into responsibilities by different levels of government (e.g. central, regional and local).
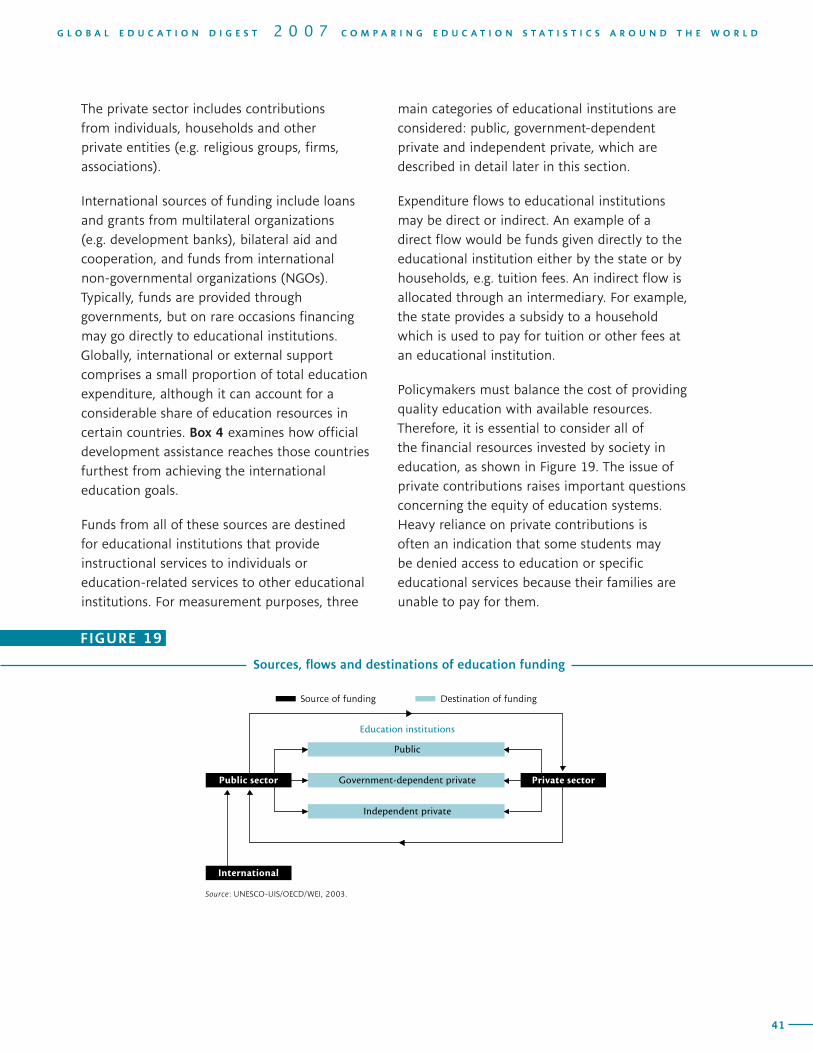
40
C O S T S A N D C O M M I T M E N T S I N F I N A N C I N G E D U C A T I O N F O R A L L
41
G L O B A L E D U C A T I O N D I G E S T 2 0 0 7 C O M P A R I N G E D U C A T I O N S T A T I S T I C S A R O U N D T H E W O R L D
The private sector includes contributions from individuals, households and other private entities (e.g. religious groups, firms, associations).
International sources of funding include loans and grants from multilateral organizations (e.g. development banks), bilateral aid and cooperation, and funds from international non-governmental organizations (NGOs). Typically, funds are provided through governments, but on rare occasions financing may go directly to educational institutions. Globally, international or external support comprises a small proportion of total education expenditure, although it can account for a considerable share of education resources in certain countries. Box 4 examines how official development assistance reaches those countries furthest from achieving the international education goals.
Funds from all of these sources are destined for educational institutions that provide instructional services to individuals or education-related services to other educational institutions. For measurement purposes, three
��������� ������������
������
�������������������� �������
����������� �������
�������������
���������������������������������������
������ ������ ������� ������
Sources, flows and destinations of education funding
Source: UNESCO-UIS/OECD/WEI, 2003.
FIGURE 19
main categories of educational institutions are considered: public, government-dependent private and independent private, which are described in detail later in this section.
Expenditure flows to educational institutions may be direct or indirect. An example of a direct flow would be funds given directly to the educational institution either by the state or by households, e.g. tuition fees. An indirect flow is allocated through an intermediary. For example, the state provides a subsidy to a household which is used to pay for tuition or other fees at an educational institution.
Policymakers must balance the cost of providing quality education with available resources. Therefore, it is essential to consider all of the financial resources invested by society in education, as shown in Figure 19. The issue of private contributions raises important questions concerning the equity of education systems. Heavy reliance on private contributions is often an indication that some students may be denied access to education or specific educational services because their families are unable to pay for them.
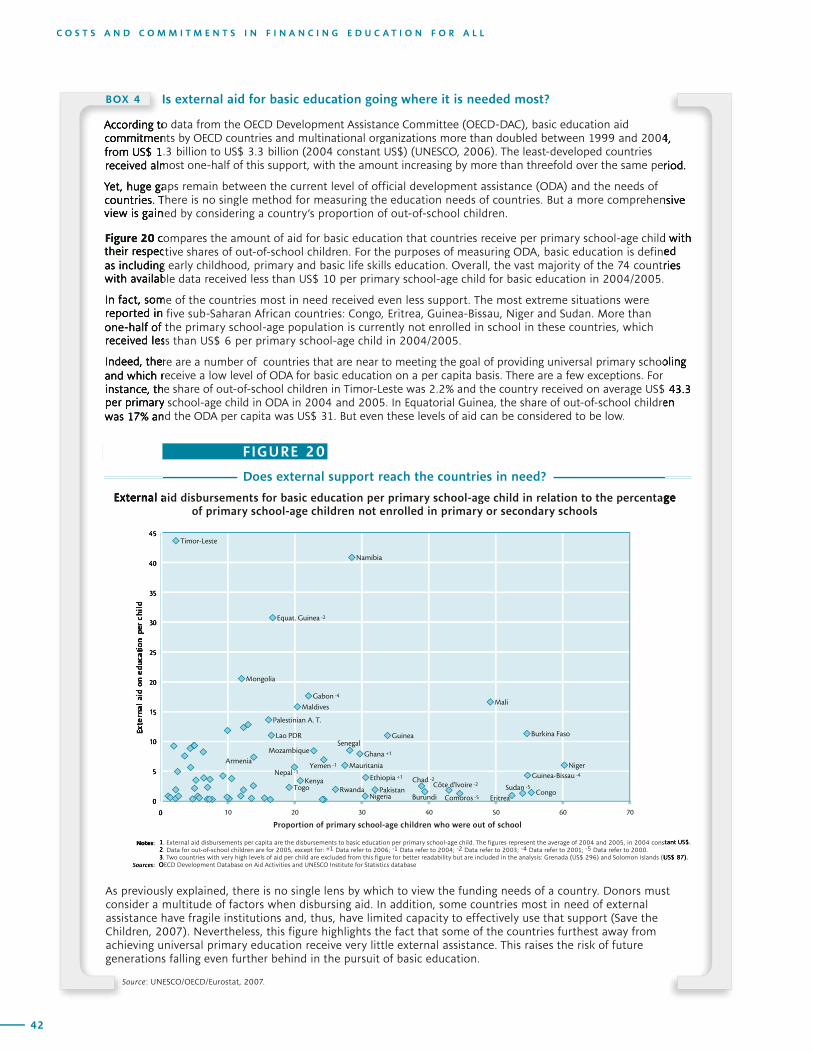
42
C O S T S A N D C O M M I T M E N T S I N F I N A N C I N G E D U C A T I O N F O R A L L
43
G L O B A L E D U C A T I O N D I G E S T 2 0 0 7 C O M P A R I N G E D U C A T I O N S T A T I S T I C S A R O U N D T H E W O R L D
1. External aid disbursements per capita are the disbursements to basic education per primary school-age child. The fi gures represent the average of 2004 and 2005, in 2004 constant US$. 2. Data for out-of-school children are for 2005, except for: +1 Data refer to 2006; -1 Data refer to 2004; -2 Data refer to 2003; -4 Data refer to 2001; -5 Data refer to 2000.3. Two countries with very high levels of aid per child are excluded from this fi gure for better readability but are included in the analysis: Grenada (US$ 296) and Solomon Islands (US$ 87).OECD Development Database on Aid Activities and UNESCO Institute for Statistics database.
FIGURE 20
Does external support reach the countries in need?
External aid disbursements for basic education per primary school-age child in relation to the percentage of primary school-age children not enrolled in primary or secondary schools
� �� �� �� �� �� �� ��
����������������������������������������������������������������
�������
����� ��
����
�����������
�������
������
����������� �� ��
���������������
���������� ��
�������
����������
��������
����������
������������
����� ��
��� ���
������������������ ��
������
����� ��
����� ��
�������� ��
������ ������ ��
���� �������� �������
������� ��
���� ��
�������
������� ����
�������
Is external aid for basic education going where it is needed most?
According to data from the OECD Development Assistance Committee (OECD-DAC), basic education aid commitments by OECD countries and multinational organizations more than doubled between 1999 and 2004, from US$ 1.3 billion to US$ 3.3 billion (2004 constant US$) (UNESCO, 2006). The least-developed countries received almost one-half of this support, with the amount increasing by more than threefold over the same period.
Yet, huge gaps remain between the current level of offi cial development assistance (ODA) and the needs of countries. There is no single method for measuring the education needs of countries. But a more comprehensive view is gained by considering a country’s proportion of out-of-school children.
compares the amount of aid for basic education that countries receive per primary school-age child with their respective shares of out-of-school children. For the purposes of measuring ODA, basic education is defi ned as including early childhood, primary and basic life skills education. Overall, the vast majority of the 74 countries with available data received less than US$ 10 per primary school-age child for basic education in 2004/2005.
In fact, some of the countries most in need received even less support. The most extreme situations were reported in fi ve sub-Saharan African countries: Congo, Eritrea, Guinea-Bissau, Niger and Sudan. More than one-half of the primary school-age population is currently not enrolled in school in these countries, which received less than US$ 6 per primary school-age child in 2004/2005.
Indeed, there are a number of countries that are near to meeting the goal of providing universal primary schooling and which receive a low level of ODA for basic education on a per capita basis. There are a few exceptions. For instance, the share of out-of-school children in Timor-Leste was 2.2% and the country received on average US$ 43.3 per primary school-age child in ODA in 2004 and 2005. In Equatorial Guinea, the share of out-of-school children was 17% and the ODA per capita was US$ 31. But even these levels of aid can be considered to be low.
Notes: 1. External aid disbursements per capita are the disbursements to basic education per primary school-age child. The fi gures represent the average of 2004 and 2005, in 2004 constant US$. 2. Data for out-of-school children are for 2005, except for: 3. Two countries with very high levels of aid per child are excluded from this fi gure for better readability but are included in the analysis: Grenada (US$ 296) and Solomon Islands (US$ 87).
Sources: OECD Development Database on Aid Activities and UNESCO Institute for Statistics database.
External aid disbursements for basic education per primary school-age child in relation to the percentage
�
�
��
��
��
��
��
��
��
��
�
������
�������
�����
����
���
�����
According to data from the OECD Development Assistance Committee (OECD-DAC), basic education aid commitments by OECD countries and multinational organizations more than doubled between 1999 and 2004, from US$ 1.3 billion to US$ 3.3 billion (2004 constant US$) (UNESCO, 2006). The least-developed countries received almost one-half of this support, with the amount increasing by more than threefold over the same period.
Yet, huge gaps remain between the current level of offi cial development assistance (ODA) and the needs of countries. There is no single method for measuring the education needs of countries. But a more comprehensive view is gained by considering a country’s proportion of out-of-school children.
Figure 20 compares the amount of aid for basic education that countries receive per primary school-age child with their respective shares of out-of-school children. For the purposes of measuring ODA, basic education is defi ned as including early childhood, primary and basic life skills education. Overall, the vast majority of the 74 countries with available data received less than US$ 10 per primary school-age child for basic education in 2004/2005.
In fact, some of the countries most in need received even less support. The most extreme situations were reported in fi ve sub-Saharan African countries: Congo, Eritrea, Guinea-Bissau, Niger and Sudan. More than one-half of the primary school-age population is currently not enrolled in school in these countries, which received less than US$ 6 per primary school-age child in 2004/2005.
Indeed, there are a number of countries that are near to meeting the goal of providing universal primary schooling and which receive a low level of ODA for basic education on a per capita basis. There are a few exceptions. For instance, the share of out-of-school children in Timor-Leste was 2.2% and the country received on average US$ 43.3 per primary school-age child in ODA in 2004 and 2005. In Equatorial Guinea, the share of out-of-school children was 17% and the ODA per capita was US$ 31. But even these levels of aid can be considered to be low.
BOX 4
1. External aid disbursements per capita are the disbursements to basic education per primary school-age child. The fi gures represent the average of 2004 and 2005, in 2004 constant US$.
3. Two countries with very high levels of aid per child are excluded from this fi gure for better readability but are included in the analysis: Grenada (US$ 296) and Solomon Islands (US$ 87).
External aid disbursements for basic education per primary school-age child in relation to the percentage
commitments by OECD countries and multinational organizations more than doubled between 1999 and 2004,
received almost one-half of this support, with the amount increasing by more than threefold over the same period.
countries. There is no single method for measuring the education needs of countries. But a more comprehensive
compares the amount of aid for basic education that countries receive per primary school-age child with their respective shares of out-of-school children. For the purposes of measuring ODA, basic education is defi ned as including early childhood, primary and basic life skills education. Overall, the vast majority of the 74 countries
Indeed, there are a number of countries that are near to meeting the goal of providing universal primary schooling
instance, the share of out-of-school children in Timor-Leste was 2.2% and the country received on average US$ 43.3 per primary school-age child in ODA in 2004 and 2005. In Equatorial Guinea, the share of out-of-school children
As previously explained, there is no single lens by which to view the funding needs of a country. Donors must consider a multitude of factors when disbursing aid. In addition, some countries most in need of external assistance have fragile institutions and, thus, have limited capacity to effectively use that support (Save the Children, 2007). Nevertheless, this fi gure highlights the fact that some of the countries furthest away from achieving universal primary education receive very little external assistance. This raises the risk of future generations falling even further behind in the pursuit of basic education.
Source: UNESCO/OECD/Eurostat, 2007.

42
C O S T S A N D C O M M I T M E N T S I N F I N A N C I N G E D U C A T I O N F O R A L L
43
G L O B A L E D U C A T I O N D I G E S T 2 0 0 7 C O M P A R I N G E D U C A T I O N S T A T I S T I C S A R O U N D T H E W O R L D
Figure 21 presents public and private expenditure on education institutions as a percentage of GDP for 47 countries with available data. There is considerable variation, especially in terms of total spending (combining public and private funds). Cuba and Guyana invest more in education proportionately (9.9% and 8.9% of GDP respectively) than the top spenders among more-developed countries, such as Denmark, New Zealand, the Republic of Korea, Sweden and the United States, which range from 6.8% to 8.0% of GDP. In contrast, Indonesia and Uruguay reported the lowest levels of total education expenditure at 1.5% and 2.9% respectively.
In 14 of the 47 reporting countries, private spending on education exceeds 1% of GDP. It exceeds 2% in Israel (2.1), the United States (2.4), Colombia (2.8), the Republic of Korea (2.9) and Chile (3.1). In relative terms, private
�
�
�
�
�
��
����
�������
�������
��
����������
����
�����
���������
����������������
��������
��
���������
��
�������
���������
��
�������
��������
��
�����
����
����
��
�������
�������
���������
�����������
�����������
��
���
�����
��
�������
��
�������
��
���
����
��
��������
��
������
��
���������
��
��������
��
������
��
�����
���������
��
������
��
���������
��������
���
���
��������
��
��������
�����
������
��
���
�������
�������
�
������������
���������
�����
���
��������
������
��
������
���
�
������
����
�������
����������������������������������� ���������������������������������� ������������������������������������������������������������
spending accounts for more than 10% of total education expenditure in more than one-half of the countries. The share rises to one-third or more in Chile, Colombia, Indonesia, the Republic of Korea and Lao PDR.
Private expenditure as a share of GDP varies by level of education (see Statistical Table 14). According to international conventions and legislation in many countries, the primary level of education should be provided free of charge. Nonetheless, private expenditure for primary schools exceeds 0.4% of GDP in five countries: Paraguay (0.4%), the Lao PDR (0.4%), Chile (0.6%), India (0.6%) and Nicaragua (1.2%). While the highest shares of private expenditure for primary education are found in less-developed countries, the highest levels of private expenditure for tertiary education are found in more-developed countries. The share for tertiary education exceeds 0.8% of GDP in six
Who pays for education?
Public and private expenditure on educational institutions, 2005
Notes: Subsidies are calculated as the difference between public expenditure on institutions and total public expenditure. -1 Data refer to 2004; -2 Data refer to 2003. Source: UNESCO Institute for Statistics, Statistical Tables 13 and 14.
FIGURE 21
44
C O S T S A N D C O M M I T M E N T S I N F I N A N C I N G E D U C A T I O N F O R A L L
45
G L O B A L E D U C A T I O N D I G E S T 2 0 0 7 C O M P A R I N G E D U C A T I O N S T A T I S T I C S A R O U N D T H E W O R L D
countries, namely Japan (0.8%), Australia (0.8%), the Republic of Moldova (1.4%), Chile (1.7%), the Republic of Korea (1.9%) and the United States (1.9%).
The role of government in education financing appears to be stronger in more developed countries than those less developed. In wealthier countries, taxpayers generally support basic education provision, while students and their families pay relatively less directly to public educational institutions providing basic education (although costs may be much higher for privately-operated schools). In many less-developed countries, students, households and communities must often assume greater responsibility for the diverse costs associated with schooling – such as school fees, textbook provision, contributions to teacher-related costs and parent-student associations.
Apart from varying government roles in financing education, the large differences in the share of total expenditure can be attributed to several other factors. First, there may simply be low levels of public spending for education. Second, there may be a greater volume of public subsidies to the private sector. Third, there may be greater private sector provision of education, especially at the tertiary level, with little or no direct state support. Finally, households may be expected to pay relatively high costs (fees or tuition) for public provision.
The case of Chile is of particular interest. The level of government spending is relatively low – 3.3% of GDP – comparable to Japan (3.5%) and Turkey (3.6%). However, the extremely high level of private funding (accounting for 48% of the total) pushes total education spending to 6.4%, which is comparable to the levels reported by Barbados (6.2), Mexico (6.4) and Sweden (6.8).
Figure 21 also highlights the levels of public subsidies to households (primarily for tuition
and student living costs), which are indicated by diamonds. However, this is a difficult area to measure, and these figures may represent an underestimate of the real value of education spending flows which are provided to educational institutions via households. The use of subsidies is most apparent in the Netherlands (0.6% of GDP), Sweden (0.9%), New Zealand (1.0%) and Denmark (1.6%).
The role of the private sector
In striving to achieve the education targets of EFA and MDGs, governments have pledged to provide compulsory primary education of good quality and free of charge. Tremendous efforts were made in recent years by some developing countries, particularly in sub-Saharan Africa, to abolish fees in public primary schools. However, a very different context surrounds tertiary education. In light of the high rates of returns for individuals who attain tertiary education, private contributions to higher levels of education can be desirable, as long as equity issues are addressed through targeted programmes.
In many countries, individuals and families assume many costs for schooling, particularly – but not only – at higher levels of education. Private expenditure encompasses any direct payment to an educational institution, such as fees associated with tuition, educational services, as well as other welfare services provided to students by and at educational institutions (see Box 5). In general, most private spending goes towards private institutions, although a proportion is also spent on public schools.
Figure 22 presents the relative size of public and private funds for education by level. There are large differences in household expenditure per primary, secondary and post-secondary non-tertiary students combined across countries. Nicaragua reports the highest share
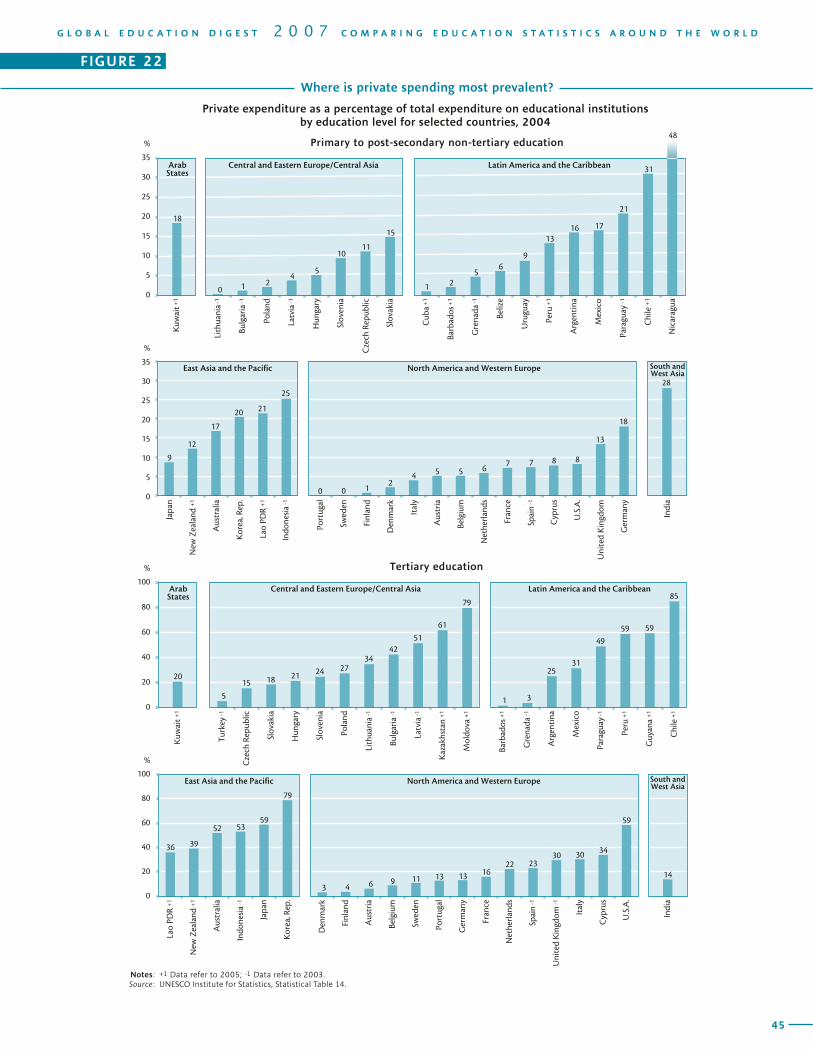
44
C O S T S A N D C O M M I T M E N T S I N F I N A N C I N G E D U C A T I O N F O R A L L
45
G L O B A L E D U C A T I O N D I G E S T 2 0 0 7 C O M P A R I N G E D U C A T I O N S T A T I S T I C S A R O U N D T H E W O R L D
South andWest Asia
South andWest Asia
Kuw
ait +
1
Lith
uani
a -1
Bulg
aria
-1
Pola
nd
Latv
ia -1
Hun
gary
Slov
enia
Cze
ch R
epub
lic
Slov
akia
Cub
a +
1
Barb
ados
+1
Gre
nada
-1
Beliz
e
Uru
guay
Peru
+1
Nic
arag
ua
Arg
enti
na
Mex
ico
Para
guay
-1
Chi
le +
1
%
Kuw
ait +
1
Turk
ey -1
Cze
ch R
epub
lic
Slov
akia
Hun
gary
Slov
enia
Pola
nd
Lith
uani
a -1
Bulg
aria
-1
Latv
ia -1
Kaz
akhs
tan
+1
Mol
dova
+1
Barb
ados
+1
Gre
nada
-1
Arg
enti
na
Mex
ico
Para
guay
-1
Peru
+1
Guy
ana
+1
Chi
le +
1
%
18
0 1 24
5
1011
15
1 25
69
1316 17
21
31
20
5
15 18 21 24 2734
4251
61
79
1 3
2531
4959 59
85
36 39
52 5359
79
3 4 6 9 11 13 13 1622 23
30 30 34
59
14
48
0
5
10
15
20
25
30
35
0
20
40
60
80
100
0
20
40
60
80
100
Lao
PDR
+1
New
Zea
land
+1
Aus
tral
ia
Indo
nesi
a -1
Japa
n
Kor
ea, R
ep.
Den
mar
k
Finl
and
Aus
tria
Belg
ium
Swed
en
Port
ugal
Ger
man
y
Fran
ce
Net
herl
ands
Spai
n -1
Uni
ted
Kin
gdom
-1
Ital
y
Cyp
rus
U.S
.A.
Indi
a
%
9
12
17
20 21
25
0 0 12
4 5 5 67 7 8 8
13
18
28
0
5
10
15
20
25
30
35
Japa
n
New
Zea
land
+1
Aus
tral
ia
Kor
ea, R
ep.
Lao
PDR
+1
Indo
nesi
a -1
Port
ugal
Swed
en
Finl
and
Den
mar
k
Ital
y
Aus
tria
Belg
ium
Net
herl
ands
Fran
ce
Spai
n -1
Cyp
rus
U.S
.A.
Uni
ted
Kin
gdom
Ger
man
y
Indi
a
%
Latin America and the CaribbeanCentral and Eastern Europe/Central AsiaArabStates
Latin America and the CaribbeanCentral and Eastern Europe/Central AsiaArabStates
North America and Western EuropeEast Asia and the Pacific
North America and Western EuropeEast Asia and the Pacific
Primary to post-secondary non-tertiary education
Tertiary education
Where is private spending most prevalent?
Private expenditure as a percentage of total expenditure on educational institutions by education level for selected countries, 2004
Notes: +1 Data refer to 2005; -1 Data refer to 2003. Source: UNESCO Institute for Statistics, Statistical Table 14.
FIGURE 22
46
C O S T S A N D C O M M I T M E N T S I N F I N A N C I N G E D U C A T I O N F O R A L L
47
G L O B A L E D U C A T I O N D I G E S T 2 0 0 7 C O M P A R I N G E D U C A T I O N S T A T I S T I C S A R O U N D T H E W O R L D
(48%) of private contributions to primary, secondary and post-secondary non-tertiary education, followed by Chile (31%), India (28%), Indonesia (25%) and Lao PDR (21%). In contrast, the share of private expenditure is marginal (below 1%) in Lithuania, Portugal and Sweden.
Overall, countries tend to rely less on private funding for primary to post-secondary non-tertiary education than at the tertiary level. Indeed, the share of private funding rises sharply at the tertiary level. In Chile, 85% of tertiary funding is private, and the share exceeds 75% in the Republic of Moldova and the Republic of Korea. In 11 out of 41 countries reporting data, 50% or more of tertiary funding is private. In Italy and the United States, the proportion of private spending on tertiary education is almost five and six times higher, respectively, than at the primary to post-secondary non-tertiary levels of education combined. In the case of India, the share of private expenditure is relatively low at the tertiary level (14% of the total), where education typically benefits better-off families, while household contributions to primary and secondary education are twice as high (28%).
The balance between public and private expenditure must be closely monitored. As previously stated, systems that are overly-reliant on private contributions, especially at the primary level of education, raise the risk of excluding students from poorer families.
Private provision and education expenditure
This section discusses the range of characteristics of private schools and presents data on participation levels relative to public schools for a selected group of countries. The level of private education provision partly explains the variation in levels of private spending on education across countries, which is illustrated in Figure 22.
In policy debates, public and private schools are often represented as a clear dichotomy. Yet, in reality, the boundaries between public and private sectors are blurred. In terms of funding, some private schools receive public funds, which in some countries contribute to the provision of basic education. On the other hand, public – as well as private – institutions can require payment of tuition fees and other costs.
The term private sector encompasses very different types of institutions. It is often assumed that for-profit companies account for the largest share of private education provision. Yet, the opposite is true with mostly non-profit civil society organizations involved in most countries. Many private schools are run by religious organizations, while others respond to specific preferences of parents and students (e.g. linguistic, ethnic, college preparatory). In addition, some private schools are designed for communities under-served by public education systems. There are also a complex set of relationships between the state and education provider in terms of financial and regulatory requirements.
In order to compare schools around the world, UNESCO distinguishes between public and private education according to whether a public agency or a private entity has ultimate control over the institution, regardless of the source of funds. Ultimate control is decided with reference to who has the power to determine the general policies and activities of the institution and to appoint the officers who manage it.
Understanding the funding of schools is crucial for an informed debate. Private schools are, therefore, further classified into government-dependent and independent institutions. In the case of government-dependent private schools, governments provide the majority of the budget
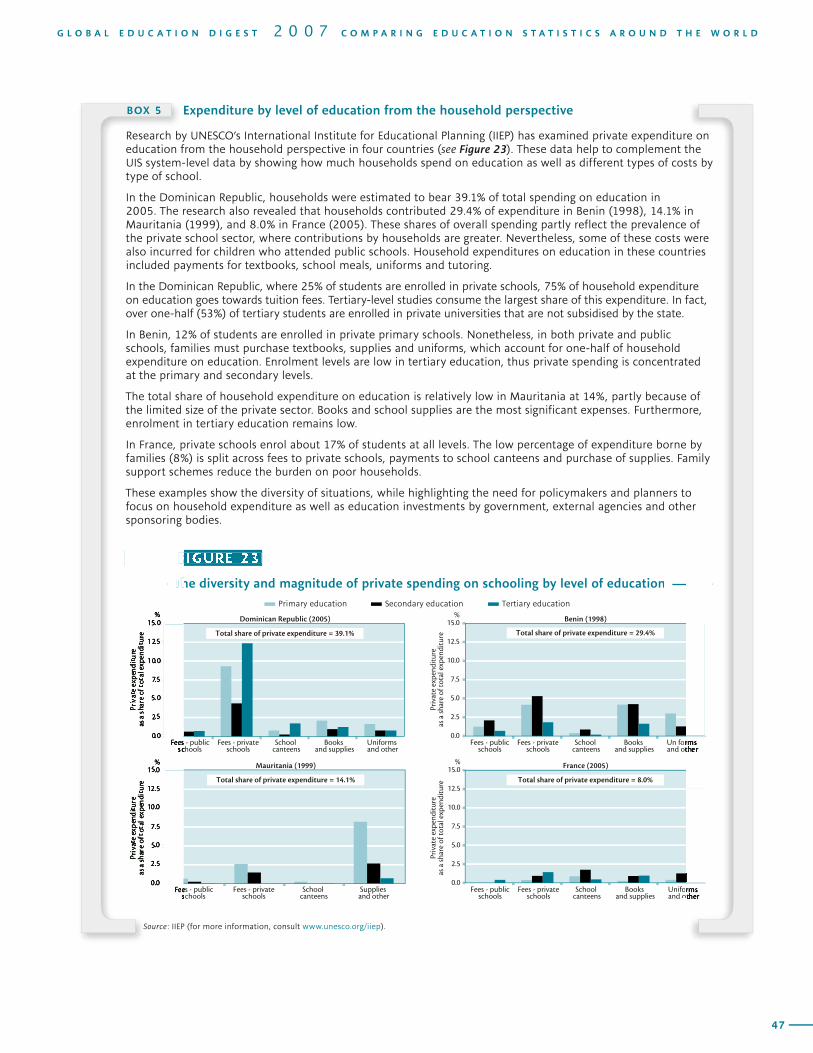
46
C O S T S A N D C O M M I T M E N T S I N F I N A N C I N G E D U C A T I O N F O R A L L
47
G L O B A L E D U C A T I O N D I G E S T 2 0 0 7 C O M P A R I N G E D U C A T I O N S T A T I S T I C S A R O U N D T H E W O R L D
���
���
���
���
����
����
����
���
���
���
���
����
����
����
�
�
� � ������������
���� � ��������������
��������������
�������� ��������
����������� �����
���� � �������������
���� � ��������������
��������������
�������� ��������
�������� ���� �
���� � �������������
���� � ��������������
��������������
�������� ��������
�������� ���� ��
�� � �������������
���� � ��������������
��������������
����������� �����
����� ��������������� �������� ������
������ ���������������� ������
����������������� ������������������� ������������������
����� ����� �� ������� ����������� � �����
����� ����� �� ������� ����������� � ��������� ����� �� ������� ����������� � �����
����� ����� �� ������� ����������� � �����
�������������
�����
��������������������������
�������������
�����
��������������������������
FIGURE 23
The diversity and magnitude of private spending on schooling by level of education
���
���
���
���
����
����
����
���
���
���
���
����
����
����
�
�
������
����
�������������
�����
��������������������������
�������������
�����
��������������������������
FIGURE 23 FIGURE 23
The diversity and magnitude of private spending on schooling by level of educationThe diversity and magnitude of private spending on schooling by level of education
BOX 5
�������
�������
Source: IIEP (for more information, consult www.unesco.org/iiep).
Expenditure by level of education from the household perspective
Research by UNESCO’s International Institute for Educational Planning (IIEP) has examined private expenditure on education from the household perspective in four countries (see Figure 23). These data help to complement the UIS system-level data by showing how much households spend on education as well as different types of costs by type of school.
In the Dominican Republic, households were estimated to bear 39.1% of total spending on education in 2005. The research also revealed that households contributed 29.4% of expenditure in Benin (1998), 14.1% in Mauritania (1999), and 8.0% in France (2005). These shares of overall spending partly refl ect the prevalence of the private school sector, where contributions by households are greater. Nevertheless, some of these costs were also incurred for children who attended public schools. Household expenditures on education in these countries included payments for textbooks, school meals, uniforms and tutoring.
In the Dominican Republic, where 25% of students are enrolled in private schools, 75% of household expenditure on education goes towards tuition fees. Tertiary-level studies consume the largest share of this expenditure. In fact, over one-half (53%) of tertiary students are enrolled in private universities that are not subsidised by the state.
In Benin, 12% of students are enrolled in private primary schools. Nonetheless, in both private and public schools, families must purchase textbooks, supplies and uniforms, which account for one-half of household expenditure on education. Enrolment levels are low in tertiary education, thus private spending is concentrated at the primary and secondary levels.
The total share of household expenditure on education is relatively low in Mauritania at 14%, partly because of the limited size of the private sector. Books and school supplies are the most signifi cant expenses. Furthermore, enrolment in tertiary education remains low.
In France, private schools enrol about 17% of students at all levels. The low percentage of expenditure borne by families (8%) is split across fees to private schools, payments to school canteens and purchase of supplies. Family support schemes reduce the burden on poor households.
These examples show the diversity of situations, while highlighting the need for policymakers and planners to focus on household expenditure as well as education investments by government, external agencies and other sponsoring bodies.
48
C O S T S A N D C O M M I T M E N T S I N F I N A N C I N G E D U C A T I O N F O R A L L
49
G L O B A L E D U C A T I O N D I G E S T 2 0 0 7 C O M P A R I N G E D U C A T I O N S T A T I S T I C S A R O U N D T H E W O R L D
for schools that are managed by communities, individuals and private entities (e.g. religious organizations). These government contributions typically cover the costs of teacher salaries. Independent private schools generate a majority of their own budget, either by charging fees or by relying on other private entities for funding.
It is useful to consider the type of school when examining private contributions to education. In general, fees tend to be lower (or less common) in public schools and government-dependent schools than in independent private schools, especially at lower levels of education. In independent private schools, students and their families may pay for the full cost of provision (including teacher salaries and other costs). Tuition and other fees can range widely in government-dependent private schools, which in a number of countries may even provide free education.
In some countries, the state sets tuition fees for both public and private schools. In others, fees are regulated for public schools but not the private sector. In addition, parent-teacher associations often play an important role in setting fee structures, collecting payments from households and, sometimes, allocating expenditure at the primary and secondary levels.
Statistical Tables 1, 3, 5 and 8 show data on enrolment in private schools for over 170 countries. In order to illustrate the distribution of enrolment across different types of educational institutions, Figure 24 shows data for 28 countries selected to illustrate the relative importance of the private sector as a provider of education.
In almost one-half of this geographically diverse group of countries and territories, the proportion of private primary enrolment
exceeds 10%. Macao (China) had the largest proportion of private enrolment at 96%. In countries with a high share of private enrolment at this level, government-dependent schools are typically the main provider of private education.
In Zimbabwe more than 8 out of 10 children were enrolled in government-dependent primary schools that are managed at the community level. The case of Zimbabwe highlights the role of community schools in government strategies to widen educational opportunities (UNESCO-UIS/OECD/WEI, 2003). Such community schools, organized as government-dependent private schools, are found in a number of countries. They represent an attempt to meet excess demand for basic education and are operated with the support and active involvement of the local community. The government pays teacher salaries and provides small grants, while local communities cover costs above that amount. In Zimbabwe, these schools are usually located in rural and remote locations which have traditionally been under-served and disadvantaged in terms of available resources.
At the secondary level, private provision is generally more widespread and there is greater diversity among the different types of providers than at the primary level. Figure 24 shows that at least one in four secondary students is enrolled in private schools in 7 of the 28 countries. There are countries (e.g. Romania, the Russian Federation) where private schools are basically non-existent, but at the same time, government financial support for private secondary provision is strong in countries such as Chile, the Netherlands and the Republic of Korea.
Religious schools offer primary- and secondary-level education with an emphasis on religious content. In some cases they are not licensed or supervised by the state. In Indonesia, more than
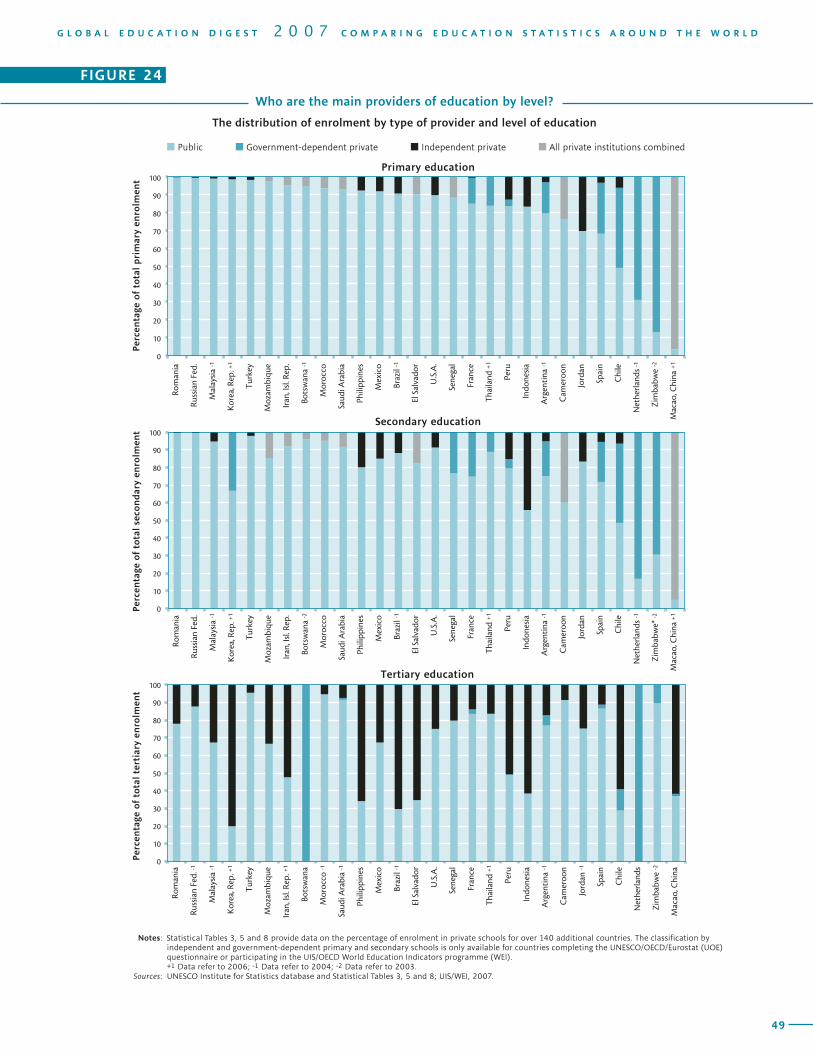
48
C O S T S A N D C O M M I T M E N T S I N F I N A N C I N G E D U C A T I O N F O R A L L
49
G L O B A L E D U C A T I O N D I G E S T 2 0 0 7 C O M P A R I N G E D U C A T I O N S T A T I S T I C S A R O U N D T H E W O R L D
�
��
��
��
��
��
��
��
��
��
����������
�����������
����������
�����������
�
������
�����
�����
�������������
����������
�������
�����������
�����������
������
��������
����������
������
�������
������
��������
��
����
���������
���������
��
���
�����
������
�����
�����
�������������
�������
���
�����������
��
�
��
��
��
��
��
��
��
��
��
���
�������
�����������
����������
�����������
�
������
�����
�����
�������������
����������
�������
�����������
�����������
������
��������
����������
������
�������
������
��������
��
����
���������
���������
��
���
�����
������
�����
�����
�������������
�������
����
�����������
��
�
��
��
��
��
��
��
��
��
��
���
�������
�����������
��
����������
�����������
�
������
�����
�����
��������������
�
��������
�������
��
�������������
�����������
������
��������
����������
������
�������
������
��������
��
����
���������
���������
��
���
�����
������
��
�����
�����
�����������
�������
���
�����������
��������������������������������������� ���������������������������� ���������������������
����
����
��������������������
����
���
�����������������
������
����
��������������
��������
����
���
������������������
������
����
�����������������������
����
�
�������������������
Who are the main providers of education by level?
The distribution of enrolment by type of provider and level of education
Notes: Statistical Tables 3, 5 and 8 provide data on the percentage of enrolment in private schools for over 140 additional countries. The classification by independent and government-dependent primary and secondary schools is only available for countries completing the UNESCO/OECD/Eurostat (UOE) questionnaire or participating in the UIS/OECD World Education Indicators programme (WEI).
+1 Data refer to 2006; -1 Data refer to 2004; -2 Data refer to 2003. Sources: UNESCO Institute for Statistics database and Statistical Tables 3, 5 and 8; UIS/WEI, 2007.
FIGURE 24
50
C O S T S A N D C O M M I T M E N T S I N F I N A N C I N G E D U C A T I O N F O R A L L
51
G L O B A L E D U C A T I O N D I G E S T 2 0 0 7 C O M P A R I N G E D U C A T I O N S T A T I S T I C S A R O U N D T H E W O R L D
one-quarter of lower secondary students and more than one-half of upper secondary students are enrolled in Koranic schools (UNESCO-UIS/OECD/WEI, 2003). In the Philippines, more than 4 in 10 private secondary schools are operated by religious orders of the Catholic Church or by the Association of Christian Schools and Colleges (Ibid). Private religious schools are mainly financed by student fees and, to some extent, by contributions from religious communities and associations.
Tertiary education has a very different profile compared to other levels of education. In general, private enrolment is higher and government support is lower than for other education levels. In 16 out of the 28 countries with available data, at least 1 out of 4 students attends a private institution. In 13 of these countries, the majority of tertiary students are enrolled in independent private institutions. The countries with the highest shares of private tertiary enrolment are the Netherlands (100%), Botswana (100%), Republic of Korea (80%), Chile (71%) and Brazil (70%).
In 24 of these 28 countries, private tertiary institutions are mainly independent. They operate with less than one-half of their core funding provided by the state. This means that access to tertiary education programmes can be highly stratified by those who can afford the costs of tuition and related living expenses (which are not necessarily reflected by educational expenditure statistics). Private tertiary provision is government-funded in only four countries: Botswana, the Netherlands, Senegal and Zimbabwe. In Argentina, Chile, France, Macao (China), Spain and Saudi Arabia, both forms of private institutions exist, but more students are enrolled in independent institutions (see Figure 24).
Over the entire education system, the most common scenario is that the share of private enrolment is relatively low for compulsory education but increases at the tertiary level. This is partly linked to the perception that tertiary education provides greater returns to individuals (in the form of a higher earning potential) than to society as a whole. Consequently, some governments assign greater responsibility for the funding of tertiary education to individuals and households. Once again, this situation can raise issues of equity if sufficient mechanisms are not in place for disadvantaged students.
In another model, the state plays the main role of provider across all education levels. This occurs in Morocco, Romania, the Russian Federation, Saudi Arabia and Turkey, where traditionally public services – such as education provision – were more strongly perceived as a government responsibility. In these countries, private enrolment is practically non-existent at the primary and secondary levels and relatively low for tertiary education.
Although infrequent, the private sector can play a major role across all education levels. In this scenario, the government generally provides significant support to private institutions, as in the cases of Chile and the Netherlands. Yet, the levels of support can vary. In the Netherlands, government support for the private sector rises at higher education levels. But the opposite is true in Chile, where private financing expands at the tertiary level.
There is a final example to consider, which consists of high levels of private provision at primary and secondary levels (typically with government support) and much lower
50
C O S T S A N D C O M M I T M E N T S I N F I N A N C I N G E D U C A T I O N F O R A L L
51
G L O B A L E D U C A T I O N D I G E S T 2 0 0 7 C O M P A R I N G E D U C A T I O N S T A T I S T I C S A R O U N D T H E W O R L D
shares at the tertiary level. This suggests an under-resourced basic education system, where the private sector plays a big role in education provision. However, the extremely limited tertiary sector is almost entirely dependent on state support. This pattern is found in Zimbabwe and Cameroon.
Public funding mechanisms for education
There are different routes for public funding of education, as noted in the model of education financing (Figure 19). Various types of mechanisms are used to channel public funds directly to public and private educational institutions and indirectly through students and their families.
In the majority of countries, almost all education funds are used to pay directly for public institutions. Yet, alternative mechanisms are also common where funds are provided directly to private institutions. One rationale for direct public support for private education is related to meeting excess demand for education. Examples of community schools or the subcontracting of educational services to private schools are examples of public-private partnerships
In the small number of countries where data are available, the main flow of funding for primary and secondary education comes directly from governments to public institutions. There are, however, exceptions – such as in Chile (40%), India (28%) and Argentina (13%) – where a substantial share of the public education budget is channelled to private institutions (UNESCO-UIS/WEI, 2007). In Chile, this is largely due to a school voucher system that allows families to choose between public and private schools. In India, it is the result of a system by which the government
contracts private schools to help meet demand for schooling exceeding the public system.
Governments in North America and Western Europe generally rely on a range of different funding mechanisms for primary and secondary education. In particular, 18 out of 25 countries use at least 3% of public funds to support private primary and secondary institutions (9% of the budget on average) (UNESCO-UIS/WEI, 2007). These transfers constitute the main funding mechanism in Belgium, accounting for 53% of the budget for primary to post-secondary non-tertiary education (Ibid).
At the tertiary level of education, public funding for private institutions is less common than at lower levels. Again, Argentina (5% of public funds), India (13%) and Chile (30%) fund private higher education institutions. Direct funding of private tertiary institutions is more common in North America and Western Europe, though still rare at lower levels of education.
An important channel to finance education is through subsidies to households and students, provided in the form of scholarships, grants and loans. Subsidies assist households and students to cover education-related costs that often occur outside schools (e.g. living expenses). Governments finance institutions indirectly for several reasons. First, in countries that rely heavily on households and students to finance education, subsidies are crucial to improve access to education for disadvantaged families. Indirect financing also helps to create competition across institutions or to send students abroad for tertiary studies.
At the primary level, several countries use funds to indirectly support primary students, for example in Bangladesh, Bulgaria and
52
C O S T S A N D C O M M I T M E N T S I N F I N A N C I N G E D U C A T I O N F O R A L L
53
G L O B A L E D U C A T I O N D I G E S T 2 0 0 7 C O M P A R I N G E D U C A T I O N S T A T I S T I C S A R O U N D T H E W O R L D
Madagascar (see Figure 25). But overall, the primary channel for funding is directly from the
state to educational institutions.
At the secondary level, the picture changes
somewhat with a larger group of countries
providing subsidies to students. This is especially prevalent in: Bulgaria, Latvia and Slovenia in
Central and Eastern Europe; Australia, New Zealand and Tonga in East Asia and the Pacific;
Bangladesh in South Asia; Côte d’Ivoire, Lesotho
and Rwanda in sub-Saharan Africa; Costa Rica, Guatemala and Jamaica in Latin America
and the Caribbean; and Denmark, Ireland, Lichtenstein, Netherlands, Norway and Sweden in North America and Western Europe.
At the tertiary level, there is greater variation in the flows of funding with respect to the
provision of grants, transfers and loans to households and students to help defray costs. Public subsidies to students represent 1% or
less of public tertiary education budgets in many countries, such as Bolivia, Chad and
Mauritania. Other countries fund a substantial share of education expenditure through subsidies: Lesotho (63%), Botswana (62%),
Gambia (58%) and Cape Verde (57%). Small states (e.g. Monaco, Saint Vincent and the Grenadines, and the Turks and Caicos Islands) are often without tertiary institutions and direct all of their public expenditure to students who pursue their studies abroad.
Private funding of education inevitably raises questions concerning equity. At the tertiary level, private contributions (and private providers) are much more prominent. Thus, the issue of equal access to secondary and tertiary education should be considered relatively more important in countries with high levels of socioeconomic disparities.
A high share of private funding, especially at the tertiary level, can potentially be offset by sufficient mechanisms to prevent exclusion from education. In particular, it is important to consider government subsidies, in the form of student grants or loans, when evaluating a system’s capacity to address equity issues at higher levels of education. The level of private contributions to education is an important factor that demands additional research related to household costs and decisions about continuing education.
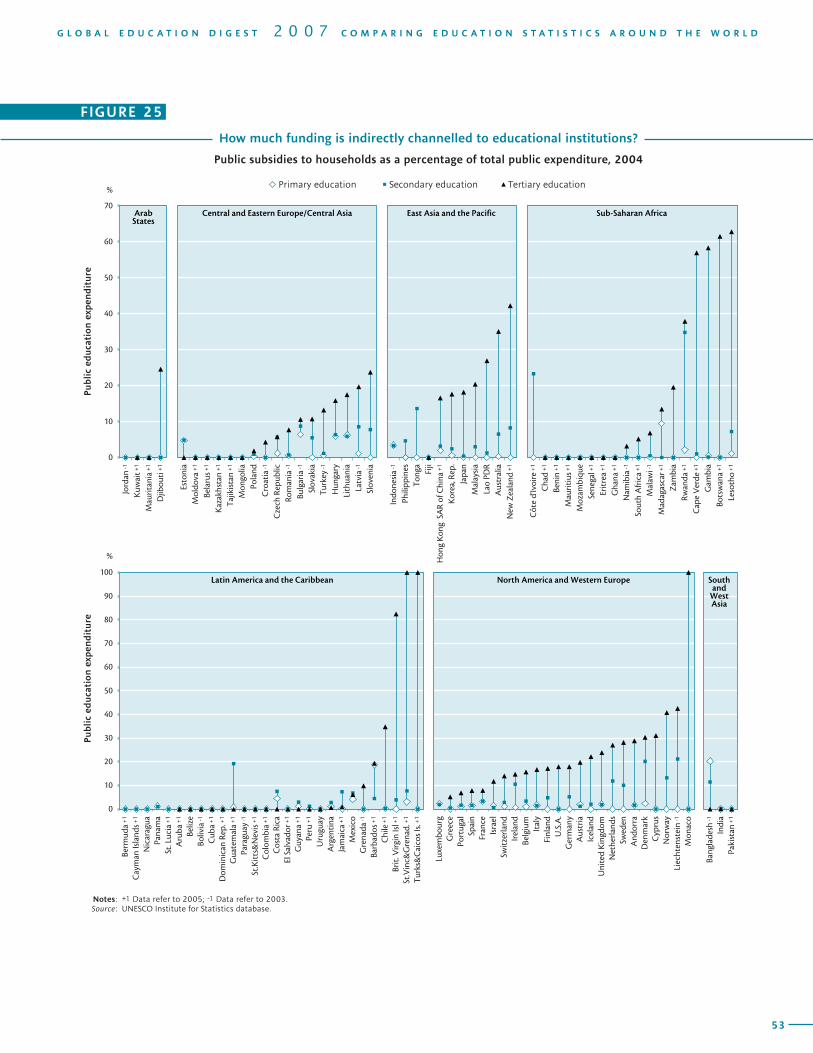
52
C O S T S A N D C O M M I T M E N T S I N F I N A N C I N G E D U C A T I O N F O R A L L
53
G L O B A L E D U C A T I O N D I G E S T 2 0 0 7 C O M P A R I N G E D U C A T I O N S T A T I S T I C S A R O U N D T H E W O R L D
������
��
���
����
�
����������
��
������
����
�������
�����
����
��������
�
������������
������������
���
�����
������
�������
��
�����
����
����
�������
��
��������
��
��������
������
��
���
����
���������
������
��
��������
����
�������
�������
����
�����
����
���
����
���
��������
��
����������
�����
��������
�����
����������
���
�������
��
������������
��
������
�������
����������
�
�����
����
���������
�
���������
�����
��
���
����
��
�������������
�����
���
�����������
�
���
���
������
��
���������
��
���
���
����������
���������
�
��
��
��
��
��
��
��
� ����������������� ������������������� ������������������
����
�����
������
������
���
���������
������
��������
��
�����
��
������
�������
��
���
���
���
������
����
��
�����������
��������
��
��������������
��
�����
�����
���������
����������
��
��������
����
��
�������
���������
�������
��
������
�������
��
��������
��
�����
��
������
���������
�
��������
�������
��
������
����������
�
�������
���
������
��������
�����
������
������
�����������
�������
�������
�����
�������
������
�������
�������
�������
�������������
����������
���
����
���
����
�������
������
������
���������������
���
���
����������
��
�����
��������
��
�
��
��
��
��
��
��
��
��
��
���
�
����� ������� ��� ��� ���������
������� ��� ������� �������������� ��������������
��������
��������
����� ������� ��� ������� ������
���� ���� ��� ��� ������� ����������� ������
���������
���
����
����
��������
���������
���
����
����
��������
How much funding is indirectly channelled to educational institutions?
Public subsidies to households as a percentage of total public expenditure, 2004
Notes: +1 Data refer to 2005; -1 Data refer to 2003. Source: UNESCO Institute for Statistics database.
FIGURE 25
54
C O S T S A N D C O M M I T M E N T S I N F I N A N C I N G E D U C A T I O N F O R A L L
55
REFERENCES
Bruns, Barbara, A. Mingat and R. Rakotomalala (2003). A Chance for Every Child. Washington,D.C.: The World Bank.
Colclough, Christopher and S. Al-Samarrai (2000). Achieving Schooling for All: Budgetary Expenditures on Education in Sub-Saharan Africa and South Asia, World Development, Vol. 28 (11).
Colclough, Christopher with K. Lewin (1993). Educating All the Children; Strategies for Primary Education in Developing Countries. Oxford:OxfordUniversityPress.
Education for All Forum (2000). The Dakar Framework for Action: Education for All. Paris: Education for All Forum.
Mehrotra, Santosh (1998). Education for All: Policy Lessons from High-Achieving Countries, Journal International Review of Education, Volume 44, Numbers 5-6.
Save the Children, (2007). Last in Line, Last in School: How Donors are Failing Children in Conflict-Affected Fragile States. Cambridge: International Save the Children Alliance.
UNESCO (2006). EFA Global Monitoring Report 2007. Education for All: Strong Foundations. Paris: UNESCO.
UNESCO/OECD/Eurostat (2007). UOE Data Collection on Education Systems, Volume 1, Montreal: UNESCO Institute for Statistics, Paris: OECD and Luxembourg: Eurostat.
UNESCO-UIS/OECD/WEI (2003). Financing Education: Investments and Returns, Montreal: UNESCO Institute for Statistics.
UNESCO-UIS/WEI (2007). Education Counts: Benchmarking Progress in 19 WEI Countries. World Education Indicators 2007. Montreal: UNESCO Institute for Statistics.
World Bank (2006). World Development Indicators.Washington,D.C.: The World Bank.
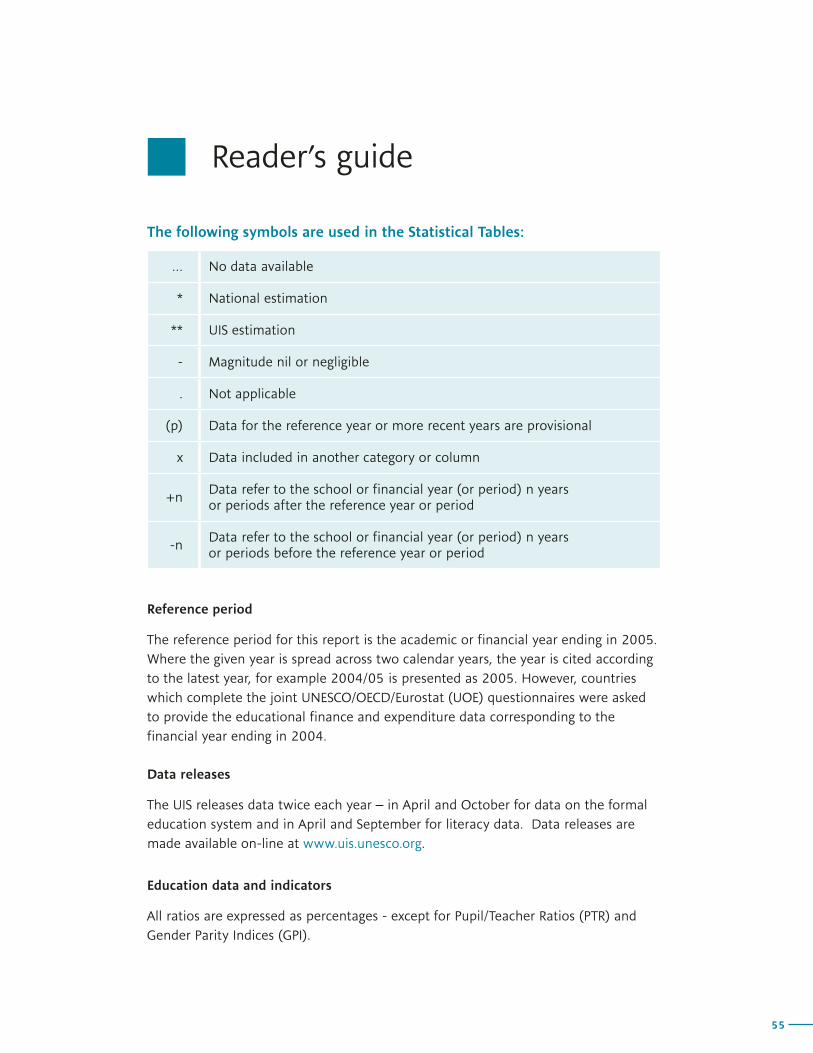
54
C O S T S A N D C O M M I T M E N T S I N F I N A N C I N G E D U C A T I O N F O R A L L
55
Reader’s guide
The following symbols are used in the Statistical Tables:
… No data available
* National estimation
** UIS estimation
- Magnitude nil or negligible
. Not applicable
(p) Data for the reference year or more recent years are provisional
x Data included in another category or column
+nData refer to the school or financial year (or period) n years or periods after the reference year or period
-nData refer to the school or financial year (or period) n years or periods before the reference year or period
Reference period
The reference period for this report is the academic or financial year ending in 2005. Where the given year is spread across two calendar years, the year is cited according to the latest year, for example 2004/05 is presented as 2005. However, countries which complete the joint UNESCO/OECD/Eurostat (UOE) questionnaires were asked to provide the educational finance and expenditure data corresponding to the financial year ending in 2004.
Data releases
The UIS releases data twice each year – in April and October for data on the formal education system and in April and September for literacy data. Data releases are made available on-line at www.uis.unesco.org.
Education data and indicators
All ratios are expressed as percentages - except for Pupil/Teacher Ratios (PTR) and Gender Parity Indices (GPI).
56 57
Regional averages are based on publishable data and estimates, as well as non-publishable estimates, for each country within a given region. Where the non-publishable estimates cover more than 25% of the school-age population in the region, the regional average is regarded as a UIS estimate and is marked with **. No regional averages are provided where the non-publishable estimates cover more than 75% of the school-age population.
Net enrolment rates and/or intake rates have not been produced for some countries due to the lack of reliable age by grade data.
There are cases where an indicator theoretically should not exceed 100 (one example being the net enrolment rate), but data inconsistencies may have nonetheless resulted in the indicator exceeding the theoretical limit. In those cases “capping” has been applied, while maintaining the gender ratio (see Annex A).
Due to rounding, Gender Parity Indices (GPI) cannot be derived from the preceding columns.
Percentage of females (%F) is included to provide the reader with information on the proportion of girls enrolled with respect to total enrolment in education. For information on gender equality, please refer to the GPI column.
Timor-Leste was recognised as an independent state on 20 May 2002. Data for previous years were not included in the data submissions for Indonesia.
Data for China do not include data for the two Special Administrative Regions: Hong Kong and Macao.
Serbia and Montenegro: Data in this report were gathered through a UIS survey during 2006, at which time Serbia and Montenegro were considered to be a single Member State of UNESCO and thus are presented as such in all tables. After declaration of its status as an independent state, Montenegro became UNESCO’s 192nd Member State on 1 March 2007. Therefore, future editions of the Global Education Digest will present data for the two Member States separately.
Finance
Expenditures on pre-primary education and/or from international sources – which are often comparatively small – have been treated as negligible in cases where data were in fact missing. In these cases, the totals presented may have been under-estimated. The countries affected can be identified by an examination of the data presented in Statistical Table 14.
Data on GDP and GNI are World Bank estimates as of August 2006. GDP estimates for Andorra, Anguilla, Aruba, Bermuda, Cayman Islands, Cuba, Iraq, Monaco, Montserrat, Oman, Turks and Caicos and United Arab Emirates were provided by the national authorities.
56 57
Literacy
Statistical Table 15 provides the latest available observed data for each respective country. These data are obtained from national censuses and/or surveys that were undertaken during the period 1995-2005 unless otherwise indicated. The literacy and illiteracy rates reflect observed national data, while the counts of the literate or illiterate populations are derived from the most recent UN population estimates.
Information about the criteria used for selecting international literacy data or the methodology are available on the UIS website at www.uis.unesco.org. Please refer to the list of literacy definitions and other information contained in the metadata table when interpreting the data.
Population
Population data are derived from the United Nations Population Division (UNPD) 2004 Revision. UNPD does not provide data by single year of age for countries with a total population of less than 80,000. Where no UNPD estimates were provided, national data or UIS estimates are used where available.
Population-based indicators are listed as missing (…) where there are no population data available.
Bhutan: Population-based indicators have been omitted due to serious concerns about the coherence between enrolment and population data.
Cyprus: Enrolment data for Cyprus do not include schools in the area of the island not controlled by the government. The population data used for the calculation of indicators were provided by the government of Cyprus and only cover the population living in the government-controlled area.
Republic of Moldova: Enrolment data do not cover the region of Transnitria, so population data for this region were excluded in order to calculate the population-based indicators.
Palestinian Autonomous Territories: Enrolment data for the Palestinian Autonomous Territories do not include data for East Jerusalem, whereas the population data do. Indicators are not internationally comparable and should be interpreted with caution.
Serbia and Montenegro: Enrolment data cover the republics of Serbia and Montenegro, but not Kosovo, so national population data for the same areas were used.
United Republic of Tanzania: Enrolment data do not cover Zanzibar, whereas the population data do. The population of Zanzibar is approximately 3% of the total population of Tanzania. Indicators should be interpreted with caution.
R E A D E R ’ S G U I D E

59
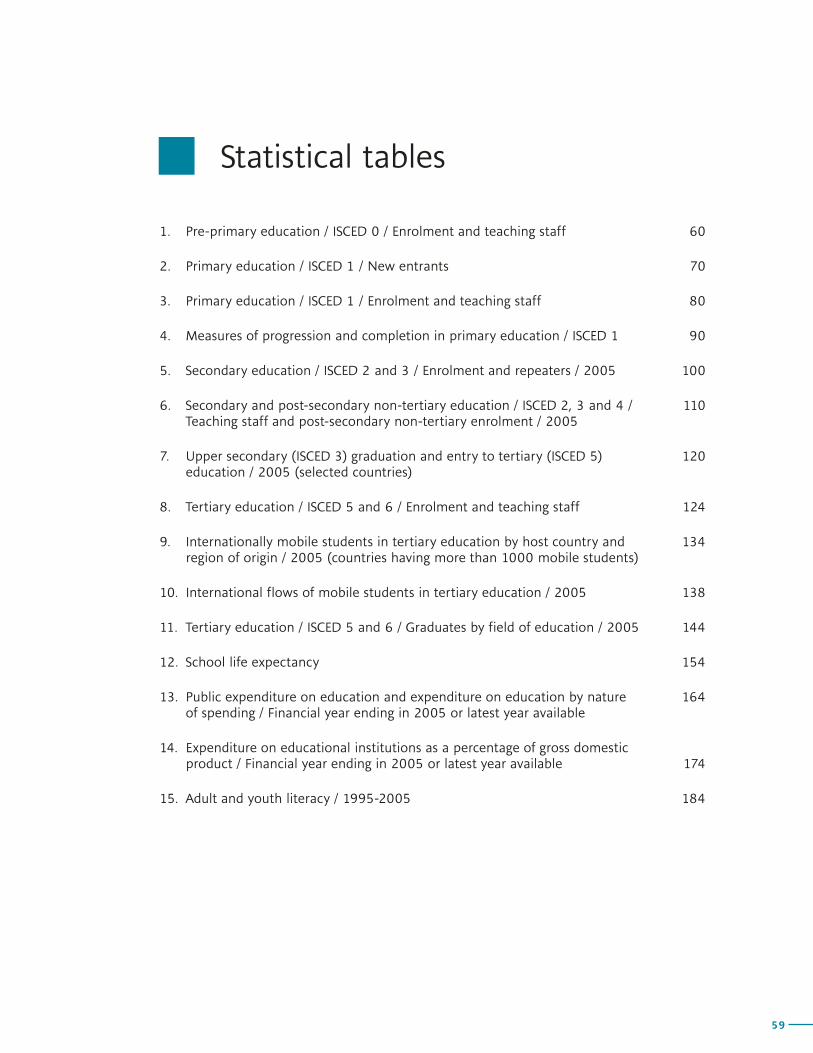
59
Statistical tables
1. Pre-primary education / ISCED 0 / Enrolment and teaching staff 60
2. Primary education / ISCED 1 / New entrants 70
3. Primary education / ISCED 1 / Enrolment and teaching staff 80
4. Measures of progression and completion in primary education / ISCED 1 90
5. Secondary education / ISCED 2 and 3 / Enrolment and repeaters / 2005 100
6. Secondary and post-secondary non-tertiary education / ISCED 2, 3 and 4 / 110Teaching staff and post-secondary non-tertiary enrolment / 2005
7. Upper secondary (ISCED 3) graduation and entry to tertiary (ISCED 5) 120education / 2005 (selected countries)
8. Tertiary education / ISCED 5 and 6 / Enrolment and teaching staff 124
9. Internationally mobile students in tertiary education by host country and 134region of origin / 2005 (countries having more than 1000 mobile students)
10. International flows of mobile students in tertiary education / 2005 138
11. Tertiary education / ISCED 5 and 6 / Graduates by field of education / 2005 144
12. School life expectancy 154
13. Public expenditure on education and expenditure on education by nature 164of spending / Financial year ending in 2005 or latest year available
14. Expenditure on educational institutions as a percentage of gross domestic product / Financial year ending in 2005 or latest year available 174
15. Adult and youth literacy / 1995-2005 184
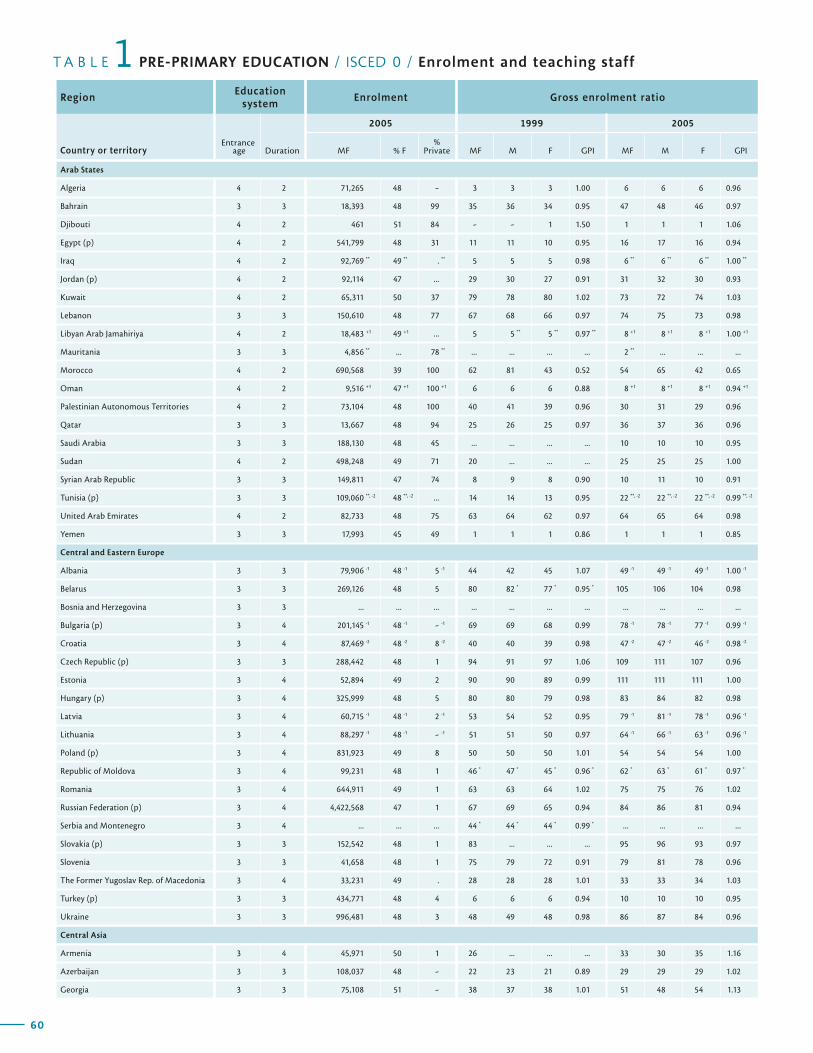
T A B L E PRE-PRIMARY EDUCATION / ISCED 0 / Enrolment and teaching staff1Region
Education system
Enrolment Gross enrolment ratio
Country or territoryEntrance
age Duration
2005 1999 2005
MF % F%
Private MF M F GPI MF M F GPI
60
Net enrolment rateTeaching
staffTrained teachers
(%)
Pupil/teacher
ratioRegion
1999 2005 2005 20052005
Country or territoryMF M F GPI MF M F GPI MF % F MF M F
61
G L O B A L E D U C A T I O N D I G E S T 2 0 0 7 C O M P A R I N G E D U C A T I O N S T A T I S T I C S A R O U N D T H E W O R L D
Arab States
Algeria 4 2 71,265 48 - 3 3 3 1.00 6 6 6 0.96
Bahrain 3 3 18,393 48 99 35 36 34 0.95 47 48 46 0.97
Djibouti 4 2 461 51 84 - - 1 1.50 1 1 1 1.06
Egypt (p) 4 2 541,799 48 31 11 11 10 0.95 16 17 16 0.94
Iraq 4 2 92,769 ** 49 ** . ** 5 5 5 0.98 6 ** 6 ** 6 ** 1.00 **
Jordan (p) 4 2 92,114 47 ... 29 30 27 0.91 31 32 30 0.93
Kuwait 4 2 65,311 50 37 79 78 80 1.02 73 72 74 1.03
Lebanon 3 3 150,610 48 77 67 68 66 0.97 74 75 73 0.98
Libyan Arab Jamahiriya 4 2 18,483 +1 49 +1 ... 5 5 ** 5 ** 0.97 ** 8 +1 8 +1 8 +1 1.00 +1
Mauritania 3 3 4,856 ** ... 78 ** ... ... ... ... 2 ** ... ... ...
Morocco 4 2 690,568 39 100 62 81 43 0.52 54 65 42 0.65
Oman 4 2 9,516 +1 47 +1 100 +1 6 6 6 0.88 8 +1 8 +1 8 +1 0.94 +1
Palestinian Autonomous Territories 4 2 73,104 48 100 40 41 39 0.96 30 31 29 0.96
Qatar 3 3 13,667 48 94 25 26 25 0.97 36 37 36 0.96
Saudi Arabia 3 3 188,130 48 45 ... ... ... ... 10 10 10 0.95
Sudan 4 2 498,248 49 71 20 ... ... ... 25 25 25 1.00
Syrian Arab Republic 3 3 149,811 47 74 8 9 8 0.90 10 11 10 0.91
Tunisia (p) 3 3 109,060 **, -2 48 **, -2 ... 14 14 13 0.95 22 **, -2 22 **, -2 22 **, -2 0.99 **, -2
United Arab Emirates 4 2 82,733 48 75 63 64 62 0.97 64 65 64 0.98
Yemen 3 3 17,993 45 49 1 1 1 0.86 1 1 1 0.85
Central and Eastern Europe
Albania 3 3 79,906 -1 48 -1 5 -1 44 42 45 1.07 49 -1 49 -1 49 -1 1.00 -1
Belarus 3 3 269,126 48 5 80 82 * 77 * 0.95 * 105 106 104 0.98
Bosnia and Herzegovina 3 3 ... ... ... ... ... ... ... ... ... ... ...
Bulgaria (p) 3 4 201,145 -1 48 -1 - -1 69 69 68 0.99 78 -1 78 -1 77 -1 0.99 -1
Croatia 3 4 87,469 -2 48 -2 8 -2 40 40 39 0.98 47 -2 47 -2 46 -2 0.98 -2
Czech Republic (p) 3 3 288,442 48 1 94 91 97 1.06 109 111 107 0.96
Estonia 3 4 52,894 49 2 90 90 89 0.99 111 111 111 1.00
Hungary (p) 3 4 325,999 48 5 80 80 79 0.98 83 84 82 0.98
Latvia 3 4 60,715 -1 48 -1 2 -1 53 54 52 0.95 79 -1 81 -1 78 -1 0.96 -1
Lithuania 3 4 88,297 -1 48 -1 - -1 51 51 50 0.97 64 -1 66 -1 63 -1 0.96 -1
Poland (p) 3 4 831,923 49 8 50 50 50 1.01 54 54 54 1.00
Republic of Moldova 3 4 99,231 48 1 46 * 47 * 45 * 0.96 * 62 * 63 * 61 * 0.97 *
Romania 3 4 644,911 49 1 63 63 64 1.02 75 75 76 1.02
Russian Federation (p) 3 4 4,422,568 47 1 67 69 65 0.94 84 86 81 0.94
Serbia and Montenegro 3 4 ... ... ... 44 * 44 * 44 * 0.99 * ... ... ... ...
Slovakia (p) 3 3 152,542 48 1 83 ... ... ... 95 96 93 0.97
Slovenia 3 3 41,658 48 1 75 79 72 0.91 79 81 78 0.96
The Former Yugoslav Rep. of Macedonia 3 4 33,231 49 . 28 28 28 1.01 33 33 34 1.03
Turkey (p) 3 3 434,771 48 4 6 6 6 0.94 10 10 10 0.95
Ukraine 3 3 996,481 48 3 48 49 48 0.98 86 87 84 0.96
Central Asia
Armenia 3 4 45,971 50 1 26 ... ... ... 33 30 35 1.16
Azerbaijan 3 3 108,037 48 - 22 23 21 0.89 29 29 29 1.02
Georgia 3 3 75,108 51 - 38 37 38 1.01 51 48 54 1.13
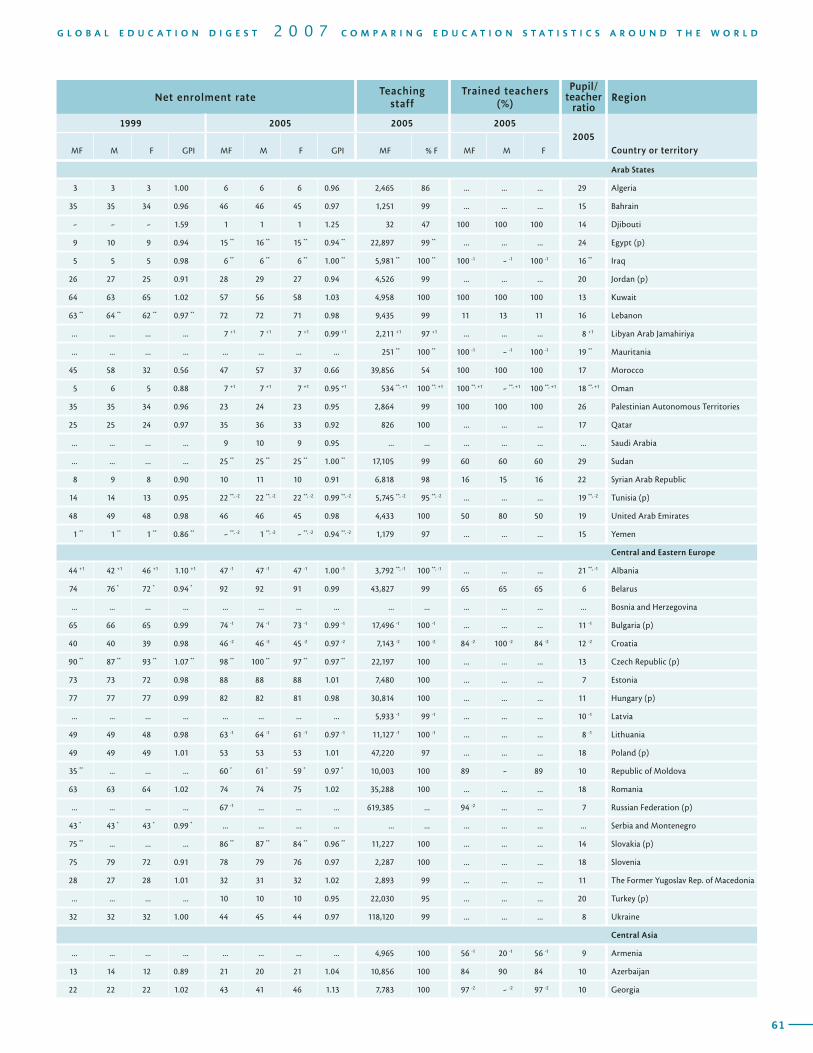
T A B L E PRE-PRIMARY EDUCATION / ISCED 0 / Enrolment and teaching staff1Region
Education system
Enrolment Gross enrolment ratio
Country or territoryEntrance
age Duration
2005 1999 2005
MF % F%
Private MF M F GPI MF M F GPI
60
Net enrolment rateTeaching
staffTrained teachers
(%)
Pupil/teacher
ratioRegion
1999 2005 2005 20052005
Country or territoryMF M F GPI MF M F GPI MF % F MF M F
61
G L O B A L E D U C A T I O N D I G E S T 2 0 0 7 C O M P A R I N G E D U C A T I O N S T A T I S T I C S A R O U N D T H E W O R L D
Arab States
3 3 3 1.00 6 6 6 0.96 2,465 86 ... ... ... 29 Algeria
35 35 34 0.96 46 46 45 0.97 1,251 99 ... ... ... 15 Bahrain
- - - 1.59 1 1 1 1.25 32 47 100 100 100 14 Djibouti
9 10 9 0.94 15 ** 16 ** 15 ** 0.94 ** 22,897 99 ** ... ... ... 24 Egypt (p)
5 5 5 0.98 6 ** 6 ** 6 ** 1.00 ** 5,981 ** 100 ** 100 -1 - -1 100 -1 16 ** Iraq
26 27 25 0.91 28 29 27 0.94 4,526 99 ... ... ... 20 Jordan (p)
64 63 65 1.02 57 56 58 1.03 4,958 100 100 100 100 13 Kuwait
63 ** 64 ** 62 ** 0.97 ** 72 72 71 0.98 9,435 99 11 13 11 16 Lebanon
... ... ... ... 7 +1 7 +1 7 +1 0.99 +1 2,211 +1 97 +1 ... ... ... 8 +1 Libyan Arab Jamahiriya
... ... ... ... ... ... ... ... 251 ** 100 ** 100 -1 - -1 100 -1 19 ** Mauritania
45 58 32 0.56 47 57 37 0.66 39,856 54 100 100 100 17 Morocco
5 6 5 0.88 7 +1 7 +1 7 +1 0.95 +1 534 **, +1 100 **, +1 100 **, +1 - **, +1 100 **, +1 18 **, +1 Oman
35 35 34 0.96 23 24 23 0.95 2,864 99 100 100 100 26 Palestinian Autonomous Territories
25 25 24 0.97 35 36 33 0.92 826 100 ... ... ... 17 Qatar
... ... ... ... 9 10 9 0.95 ... ... ... ... ... ... Saudi Arabia
... ... ... ... 25 ** 25 ** 25 ** 1.00 ** 17,105 99 60 60 60 29 Sudan
8 9 8 0.90 10 11 10 0.91 6,818 98 16 15 16 22 Syrian Arab Republic
14 14 13 0.95 22 **, -2 22 **, -2 22 **, -2 0.99 **, -2 5,745 **, -2 95 **, -2 ... ... ... 19 **, -2 Tunisia (p)
48 49 48 0.98 46 46 45 0.98 4,433 100 50 80 50 19 United Arab Emirates
1 ** 1 ** 1 ** 0.86 ** - **, -2 1 **, -2 - **, -2 0.94 **, -2 1,179 97 ... ... ... 15 Yemen
Central and Eastern Europe
44 +1 42 +1 46 +1 1.10 +1 47 -1 47 -1 47 -1 1.00 -1 3,792 **, -1 100 **, -1 ... ... ... 21 **, -1 Albania
74 76 * 72 * 0.94 * 92 92 91 0.99 43,827 99 65 65 65 6 Belarus
... ... ... ... ... ... ... ... ... ... ... ... ... ... Bosnia and Herzegovina
65 66 65 0.99 74 -1 74 -1 73 -1 0.99 -1 17,496 -1 100 -1 ... ... ... 11 -1 Bulgaria (p)
40 40 39 0.98 46 -2 46 -2 45 -2 0.97 -2 7,143 -2 100 -2 84 -2 100 -2 84 -2 12 -2 Croatia
90 ** 87 ** 93 ** 1.07 ** 98 ** 100 ** 97 ** 0.97 ** 22,197 100 ... ... ... 13 Czech Republic (p)
73 73 72 0.98 88 88 88 1.01 7,480 100 ... ... ... 7 Estonia
77 77 77 0.99 82 82 81 0.98 30,814 100 ... ... ... 11 Hungary (p)
... ... ... ... ... ... ... ... 5,933 -1 99 -1 ... ... ... 10 -1 Latvia
49 49 48 0.98 63 -1 64 -1 61 -1 0.97 -1 11,127 -1 100 -1 ... ... ... 8 -1 Lithuania
49 49 49 1.01 53 53 53 1.01 47,220 97 ... ... ... 18 Poland (p)
35 ** ... ... ... 60 * 61 * 59 * 0.97 * 10,003 100 89 - 89 10 Republic of Moldova
63 63 64 1.02 74 74 75 1.02 35,288 100 ... ... ... 18 Romania
... ... ... ... 67 -1 ... ... ... 619,385 ... 94 -2 ... ... 7 Russian Federation (p)
43 * 43 * 43 * 0.99 * ... ... ... ... ... ... ... ... ... ... Serbia and Montenegro
75 ** ... ... ... 86 ** 87 ** 84 ** 0.96 ** 11,227 100 ... ... ... 14 Slovakia (p)
75 79 72 0.91 78 79 76 0.97 2,287 100 ... ... ... 18 Slovenia
28 27 28 1.01 32 31 32 1.02 2,893 99 ... ... ... 11 The Former Yugoslav Rep. of Macedonia
... ... ... ... 10 10 10 0.95 22,030 95 ... ... ... 20 Turkey (p)
32 32 32 1.00 44 45 44 0.97 118,120 99 ... ... ... 8 Ukraine
Central Asia
... ... ... ... ... ... ... ... 4,965 100 56 -1 20 -1 56 -1 9 Armenia
13 14 12 0.89 21 20 21 1.04 10,856 100 84 90 84 10 Azerbaijan
22 22 22 1.02 43 41 46 1.13 7,783 100 97 -2 - -2 97 -2 10 Georgia
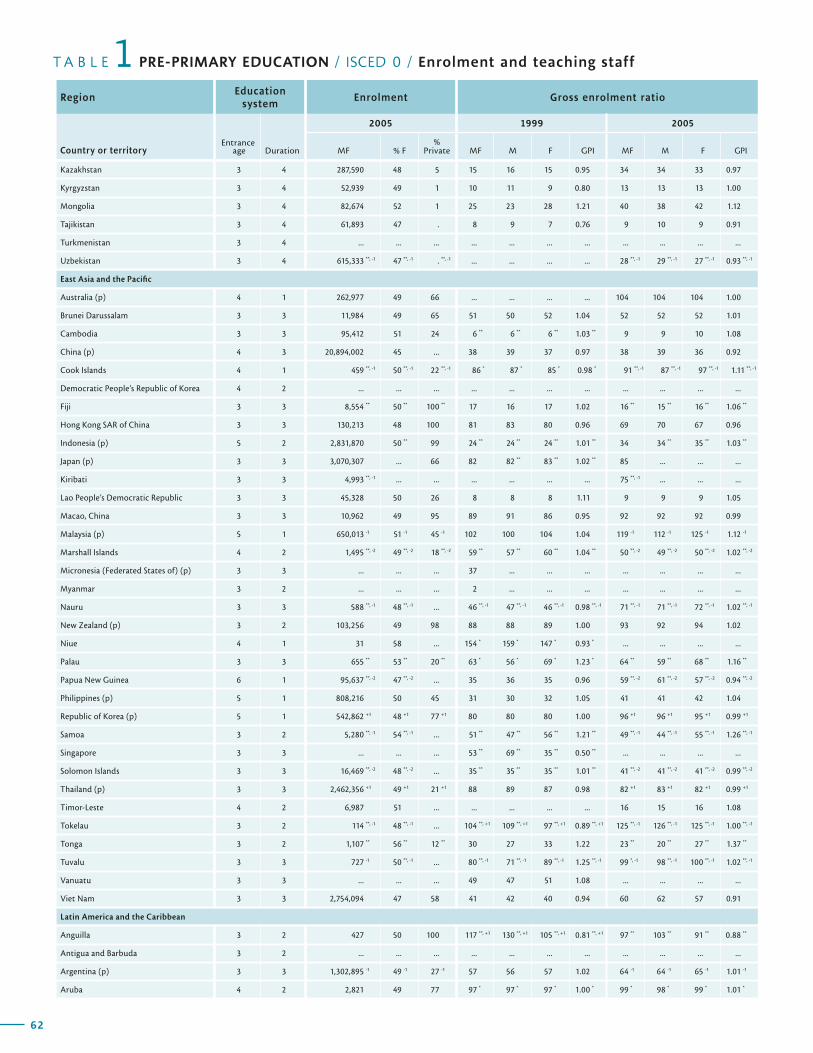
T A B L E PRE-PRIMARY EDUCATION / ISCED 0 / Enrolment and teaching staff1Region
Education system
Enrolment Gross enrolment ratio
Country or territoryEntrance
age Duration
2005 1999 2005
MF % F%
Private MF M F GPI MF M F GPI
62
Net enrolment rateTeaching
staffTrained teachers
(%)
Pupil/teacher
ratioRegion
1999 2005 2005 20052005
Country or territoryMF M F GPI MF M F GPI MF % F MF M F
63
G L O B A L E D U C A T I O N D I G E S T 2 0 0 7 C O M P A R I N G E D U C A T I O N S T A T I S T I C S A R O U N D T H E W O R L D
Kazakhstan 3 4 287,590 48 5 15 16 15 0.95 34 34 33 0.97
Kyrgyzstan 3 4 52,939 49 1 10 11 9 0.80 13 13 13 1.00
Mongolia 3 4 82,674 52 1 25 23 28 1.21 40 38 42 1.12
Tajikistan 3 4 61,893 47 . 8 9 7 0.76 9 10 9 0.91
Turkmenistan 3 4 ... ... ... ... ... ... ... ... ... ... ...
Uzbekistan 3 4 615,333 **, -1 47 **, -1 . **, -1 ... ... ... ... 28 **, -1 29 **, -1 27 **, -1 0.93 **, -1
East Asia and the Pacific
Australia (p) 4 1 262,977 49 66 ... ... ... ... 104 104 104 1.00
Brunei Darussalam 3 3 11,984 49 65 51 50 52 1.04 52 52 52 1.01
Cambodia 3 3 95,412 51 24 6 ** 6 ** 6 ** 1.03 ** 9 9 10 1.08
China (p) 4 3 20,894,002 45 ... 38 39 37 0.97 38 39 36 0.92
Cook Islands 4 1 459 **, -1 50 **, -1 22 **, -1 86 * 87 * 85 * 0.98 * 91 **, -1 87 **, -1 97 **, -1 1.11 **, -1
Democratic People’s Republic of Korea 4 2 ... ... ... ... ... ... ... ... ... ... ...
Fiji 3 3 8,554 ** 50 ** 100 ** 17 16 17 1.02 16 ** 15 ** 16 ** 1.06 **
Hong Kong SAR of China 3 3 130,213 48 100 81 83 80 0.96 69 70 67 0.96
Indonesia (p) 5 2 2,831,870 50 ** 99 24 ** 24 ** 24 ** 1.01 ** 34 34 ** 35 ** 1.03 **
Japan (p) 3 3 3,070,307 ... 66 82 82 ** 83 ** 1.02 ** 85 ... ... ...
Kiribati 3 3 4,993 **, -1 ... ... ... ... ... ... 75 **, -1 ... ... ...
Lao People’s Democratic Republic 3 3 45,328 50 26 8 8 8 1.11 9 9 9 1.05
Macao, China 3 3 10,962 49 95 89 91 86 0.95 92 92 92 0.99
Malaysia (p) 5 1 650,013 -1 51 -1 45 -1 102 100 104 1.04 119 -1 112 -1 125 -1 1.12 -1
Marshall Islands 4 2 1,495 **, -2 49 **, -2 18 **, -2 59 ** 57 ** 60 ** 1.04 ** 50 **, -2 49 **, -2 50 **, -2 1.02 **, -2
Micronesia (Federated States of) (p) 3 3 ... ... ... 37 ... ... ... ... ... ... ...
Myanmar 3 2 ... ... ... 2 ... ... ... ... ... ... ...
Nauru 3 3 588 **, -1 48 **, -1 ... 46 **, -1 47 **, -1 46 **, -1 0.98 **, -1 71 **, -1 71 **, -1 72 **, -1 1.02 **, -1
New Zealand (p) 3 2 103,256 49 98 88 88 89 1.00 93 92 94 1.02
Niue 4 1 31 58 ... 154 * 159 * 147 * 0.93 * ... ... ... ...
Palau 3 3 655 ** 53 ** 20 ** 63 * 56 * 69 * 1.23 * 64 ** 59 ** 68 ** 1.16 **
Papua New Guinea 6 1 95,637 **, -2 47 **, -2 ... 35 36 35 0.96 59 **, -2 61 **, -2 57 **, -2 0.94 **, -2
Philippines (p) 5 1 808,216 50 45 31 30 32 1.05 41 41 42 1.04
Republic of Korea (p) 5 1 542,862 +1 48 +1 77 +1 80 80 80 1.00 96 +1 96 +1 95 +1 0.99 +1
Samoa 3 2 5,280 **, -1 54 **, -1 ... 51 ** 47 ** 56 ** 1.21 ** 49 **, -1 44 **, -1 55 **, -1 1.26 **, -1
Singapore 3 3 ... ... ... 53 ** 69 ** 35 ** 0.50 ** ... ... ... ...
Solomon Islands 3 3 16,469 **, -2 48 **, -2 ... 35 ** 35 ** 35 ** 1.01 ** 41 **, -2 41 **, -2 41 **, -2 0.99 **, -2
Thailand (p) 3 3 2,462,356 +1 49 +1 21 +1 88 89 87 0.98 82 +1 83 +1 82 +1 0.99 +1
Timor-Leste 4 2 6,987 51 ... ... ... ... ... 16 15 16 1.08
Tokelau 3 2 114 **, -1 48 **, -1 ... 104 **, +1 109 **, +1 97 **, +1 0.89 **, +1 125 **, -1 126 **, -1 125 **, -1 1.00 **, -1
Tonga 3 2 1,107 ** 56 ** 12 ** 30 27 33 1.22 23 ** 20 ** 27 ** 1.37 **
Tuvalu 3 3 727 -1 50 **, -1 ... 80 **, -1 71 **, -1 89 **, -1 1.25 **, -1 99 *, -1 98 **, -1 100 **, -1 1.02 **, -1
Vanuatu 3 3 ... ... ... 49 47 51 1.08 ... ... ... ...
Viet Nam 3 3 2,754,094 47 58 41 42 40 0.94 60 62 57 0.91
Latin America and the Caribbean
Anguilla 3 2 427 50 100 117 **, +1 130 **, +1 105 **, +1 0.81 **, +1 97 ** 103 ** 91 ** 0.88 **
Antigua and Barbuda 3 2 ... ... ... ... ... ... ... ... ... ... ...
Argentina (p) 3 3 1,302,895 -1 49 -1 27 -1 57 56 57 1.02 64 -1 64 -1 65 -1 1.01 -1
Aruba 4 2 2,821 49 77 97 * 97 * 97 * 1.00 * 99 * 98 * 99 * 1.01 *

T A B L E PRE-PRIMARY EDUCATION / ISCED 0 / Enrolment and teaching staff1Region
Education system
Enrolment Gross enrolment ratio
Country or territoryEntrance
age Duration
2005 1999 2005
MF % F%
Private MF M F GPI MF M F GPI
62
Net enrolment rateTeaching
staffTrained teachers
(%)
Pupil/teacher
ratioRegion
1999 2005 2005 20052005
Country or territoryMF M F GPI MF M F GPI MF % F MF M F
63
G L O B A L E D U C A T I O N D I G E S T 2 0 0 7 C O M P A R I N G E D U C A T I O N S T A T I S T I C S A R O U N D T H E W O R L D
9 +1 9 +1 8 +1 0.94 +1 33 33 33 0.97 26,798 99 ... ... ... 11 Kazakhstan
7 7 * 6 * 0.80 * 10 10 10 1.00 2,333 99 38 39 38 23 Kyrgyzstan
23 21 25 1.21 35 ... ... ... 3,424 89 ... ... ... 24 Mongolia
7 ... ... ... 7 7 7 0.93 4,475 100 74 - 74 14 Tajikistan
... ... ... ... ... ... ... ... ... ... ... ... ... ... Turkmenistan
... ... ... ... 21 -2 ... ... ... 64,114 **, -1 95 **, -1 100 -2 100 -2 100 -2 10 **, -1 Uzbekistan
East Asia and the Pacific
... ... ... ... 62 62 62 1.00 ... ... ... ... ... ... Australia (p)
... ... ... ... 47 47 48 1.01 623 96 64 96 63 19 Brunei Darussalam
5 ** 5 ** 5 ** 1.03 ** 9 8 9 1.09 3,869 99 ... ... ... 25 Cambodia
... ... ... ... ... ... ... ... 741,064 97 ... ... ... 28 China (p)
90 *, -1 97 *, -1 83 *, -1 0.85 *, -1 ... ... ... ... 26 -2 100 -2 ... ... ... 18 -2 Cook Islands
... ... ... ... ... ... ... ... ... ... ... ... ... ... Democratic People’s Republic of Korea
... ... ... ... 14 ** 14 ** 15 ** 1.06 ** 410 ** 99 ** ... ... ... 21 ** Fiji
... ... ... ... 63 64 61 0.96 8,298 99 92 57 93 16 Hong Kong SAR of China
... ... ... ... 24 ** 23 ** 24 ** 1.03 ** 181,839 98 ** ... ... ... 16 Indonesia (p)
82 82 ** 83 ** 1.02 ** 85 ... ... ... 105,262 98 ** ... ... ... 29 Japan (p)
... ... ... ... ... ... ... ... ... ... ... ... ... ... Kiribati
7 7 8 1.12 8 8 9 1.05 2,764 99 82 61 82 16 Lao People’s Democratic Republic
82 83 80 0.97 86 86 86 0.99 454 99 98 75 98 24 Macao, China
80 78 81 1.03 74 -1 72 -1 76 -1 1.07 -1 28,522 -1 96 -1 ... ... ... 23 -1 Malaysia (p)
... ... ... ... ... ... ... ... 126 **, -2 60 **, -2 ... ... ... 12 **, -2 Marshall Islands
... ... ... ... ... ... ... ... ... ... ... ... ... ... Micronesia (Federated States of) (p)
... ... ... ... ... ... ... ... ... ... ... ... ... ... Myanmar
... ... ... ... ... ... ... ... 44 **, -1 100 **, -1 ... ... ... 13 **, -1 Nauru
87 87 87 1.00 92 90 93 1.02 7,071 99 ... ... ... 15 New Zealand (p)
... ... ... ... ... ... ... ... ... ... ... ... ... ... Niue
... ... ... ... ... ... ... ... ... ... ... ... ... ... Palau
... ... ... ... ... ... ... ... 2,712 **, -2 37 **, -2 ... ... ... 35 **, -2 Papua New Guinea
24 ** 25 ** 24 ** 0.99 ** 33 33 32 0.97 24,065 97 ... ... ... 34 Philippines (p)
44 44 44 1.02 51 +1 51 +1 51 +1 1.00 +1 26,871 +1 99 +1 ... ... ... 20 +1 Republic of Korea (p)
38 ** 37 ** 40 ** 1.09 ** ... ... ... ... 127 **, -1 94 **, -1 ... ... ... 42 **, -1 Samoa
... ... ... ... ... ... ... ... ... ... ... ... ... ... Singapore
... ... ... ... ... ... ... ... ... ... ... ... ... ... Solomon Islands
... ... ... ... 76 +1 76 +1 75 +1 0.99 +1 98,764 +1 78 +1 ... ... ... 25 +1 Thailand (p)
... ... ... ... ... ... ... ... 237 97 ... ... ... 29 Timor-Leste
... ... ... ... ... ... ... ... 8 **, -1 100 **, -1 ... ... ... 14 **, -1 Tokelau
22 14 30 2.12 ... ... ... ... ... ... ... ... ... ... Tonga
80 **, -1 71 **, -1 89 **, -1 1.25 **, -1 ... ... ... ... ... ... ... ... ... ... Tuvalu
49 47 51 1.08 ... ... ... ... ... ... ... ... ... ... Vanuatu
40 ... ... ... ... ... ... ... 155,699 98 ... ... ... 18 Viet Nam
Latin America and the Caribbean
90 **, +1 ... ... ... 93 ** 100 ** 88 ** 0.88 ** 41 100 49 - 49 10 Anguilla
... ... ... ... ... ... ... ... ... ... ... ... ... ... Antigua and Barbuda
56 56 57 1.03 64 -1 64 -1 64 -1 1.01 -1 53,402 **, -2 97 **, -2 ... ... ... 24 **, -2 Argentina (p)
95 * 94 * 95 * 1.01 * 97 * 96 * 97 * 1.01 * 144 99 100 100 100 20 Aruba
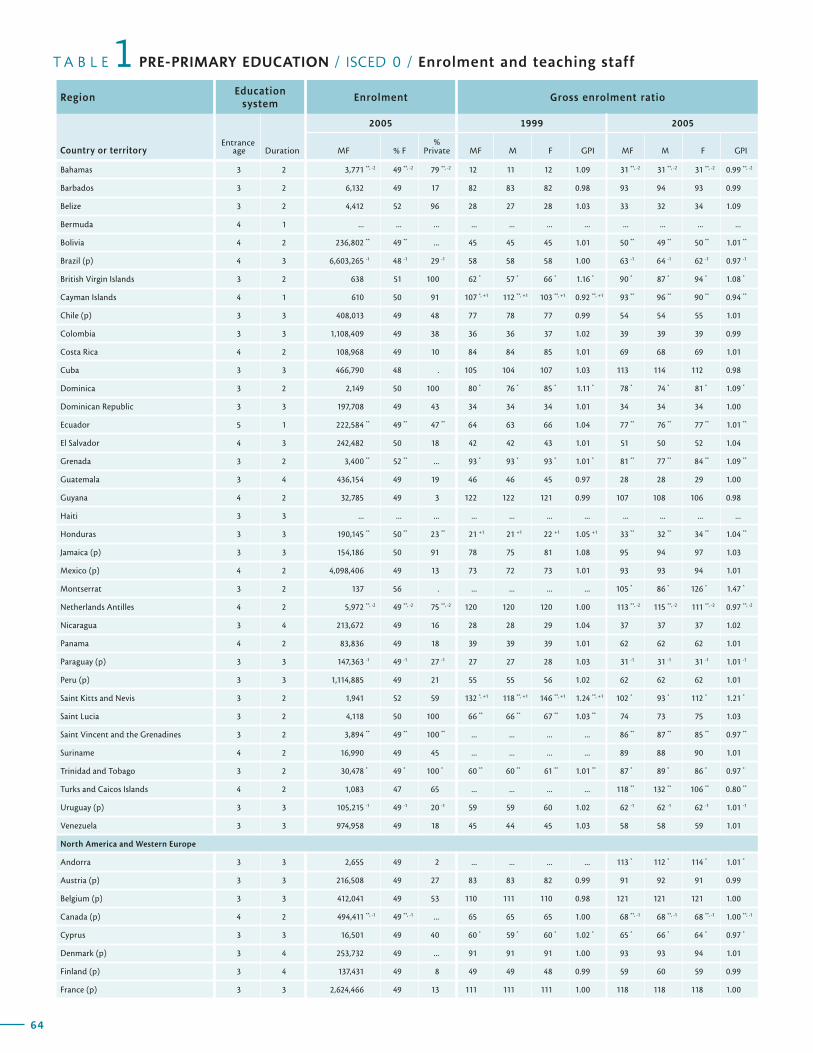
T A B L E PRE-PRIMARY EDUCATION / ISCED 0 / Enrolment and teaching staff1Region
Education system
Enrolment Gross enrolment ratio
Country or territoryEntrance
age Duration
2005 1999 2005
MF % F%
Private MF M F GPI MF M F GPI
64
Net enrolment rateTeaching
staffTrained teachers
(%)
Pupil/teacher
ratioRegion
1999 2005 2005 20052005
Country or territoryMF M F GPI MF M F GPI MF % F MF M F
65
G L O B A L E D U C A T I O N D I G E S T 2 0 0 7 C O M P A R I N G E D U C A T I O N S T A T I S T I C S A R O U N D T H E W O R L D
Bahamas 3 2 3,771 **, -2 49 **, -2 79 **, -2 12 11 12 1.09 31 **, -2 31 **, -2 31 **, -2 0.99 **, -2
Barbados 3 2 6,132 49 17 82 83 82 0.98 93 94 93 0.99
Belize 3 2 4,412 52 96 28 27 28 1.03 33 32 34 1.09
Bermuda 4 1 ... ... ... ... ... ... ... ... ... ... ...
Bolivia 4 2 236,802 ** 49 ** ... 45 45 45 1.01 50 ** 49 ** 50 ** 1.01 **
Brazil (p) 4 3 6,603,265 -1 48 -1 29 -1 58 58 58 1.00 63 -1 64 -1 62 -1 0.97 -1
British Virgin Islands 3 2 638 51 100 62 * 57 * 66 * 1.16 * 90 * 87 * 94 * 1.08 *
Cayman Islands 4 1 610 50 91 107 *, +1 112 **, +1 103 **, +1 0.92 **, +1 93 ** 96 ** 90 ** 0.94 **
Chile (p) 3 3 408,013 49 48 77 78 77 0.99 54 54 55 1.01
Colombia 3 3 1,108,409 49 38 36 36 37 1.02 39 39 39 0.99
Costa Rica 4 2 108,968 49 10 84 84 85 1.01 69 68 69 1.01
Cuba 3 3 466,790 48 . 105 104 107 1.03 113 114 112 0.98
Dominica 3 2 2,149 50 100 80 * 76 * 85 * 1.11 * 78 * 74 * 81 * 1.09 *
Dominican Republic 3 3 197,708 49 43 34 34 34 1.01 34 34 34 1.00
Ecuador 5 1 222,584 ** 49 ** 47 ** 64 63 66 1.04 77 ** 76 ** 77 ** 1.01 **
El Salvador 4 3 242,482 50 18 42 42 43 1.01 51 50 52 1.04
Grenada 3 2 3,400 ** 52 ** ... 93 * 93 * 93 * 1.01 * 81 ** 77 ** 84 ** 1.09 **
Guatemala 3 4 436,154 49 19 46 46 45 0.97 28 28 29 1.00
Guyana 4 2 32,785 49 3 122 122 121 0.99 107 108 106 0.98
Haiti 3 3 ... ... ... ... ... ... ... ... ... ... ...
Honduras 3 3 190,145 ** 50 ** 23 ** 21 +1 21 +1 22 +1 1.05 +1 33 ** 32 ** 34 ** 1.04 **
Jamaica (p) 3 3 154,186 50 91 78 75 81 1.08 95 94 97 1.03
Mexico (p) 4 2 4,098,406 49 13 73 72 73 1.01 93 93 94 1.01
Montserrat 3 2 137 56 . ... ... ... ... 105 * 86 * 126 * 1.47 *
Netherlands Antilles 4 2 5,972 **, -2 49 **, -2 75 **, -2 120 120 120 1.00 113 **, -2 115 **, -2 111 **, -2 0.97 **, -2
Nicaragua 3 4 213,672 49 16 28 28 29 1.04 37 37 37 1.02
Panama 4 2 83,836 49 18 39 39 39 1.01 62 62 62 1.01
Paraguay (p) 3 3 147,363 -1 49 -1 27 -1 27 27 28 1.03 31 -1 31 -1 31 -1 1.01 -1
Peru (p) 3 3 1,114,885 49 21 55 55 56 1.02 62 62 62 1.01
Saint Kitts and Nevis 3 2 1,941 52 59 132 *, +1 118 **, +1 146 **, +1 1.24 **, +1 102 * 93 * 112 * 1.21 *
Saint Lucia 3 2 4,118 50 100 66 ** 66 ** 67 ** 1.03 ** 74 73 75 1.03
Saint Vincent and the Grenadines 3 2 3,894 ** 49 ** 100 ** ... ... ... ... 86 ** 87 ** 85 ** 0.97 **
Suriname 4 2 16,990 49 45 ... ... ... ... 89 88 90 1.01
Trinidad and Tobago 3 2 30,478 * 49 * 100 * 60 ** 60 ** 61 ** 1.01 ** 87 * 89 * 86 * 0.97 *
Turks and Caicos Islands 4 2 1,083 47 65 ... ... ... ... 118 ** 132 ** 106 ** 0.80 **
Uruguay (p) 3 3 105,215 -1 49 -1 20 -1 59 59 60 1.02 62 -1 62 -1 62 -1 1.01 -1
Venezuela 3 3 974,958 49 18 45 44 45 1.03 58 58 59 1.01
North America and Western Europe
Andorra 3 3 2,655 49 2 ... ... ... ... 113 * 112 * 114 * 1.01 *
Austria (p) 3 3 216,508 49 27 83 83 82 0.99 91 92 91 0.99
Belgium (p) 3 3 412,041 49 53 110 111 110 0.98 121 121 121 1.00
Canada (p) 4 2 494,411 **, -1 49 **, -1 ... 65 65 65 1.00 68 **, -1 68 **, -1 68 **, -1 1.00 **, -1
Cyprus 3 3 16,501 49 40 60 * 59 * 60 * 1.02 * 65 * 66 * 64 * 0.97 *
Denmark (p) 3 4 253,732 49 ... 91 91 91 1.00 93 93 94 1.01
Finland (p) 3 4 137,431 49 8 49 49 48 0.99 59 60 59 0.99
France (p) 3 3 2,624,466 49 13 111 111 111 1.00 118 118 118 1.00
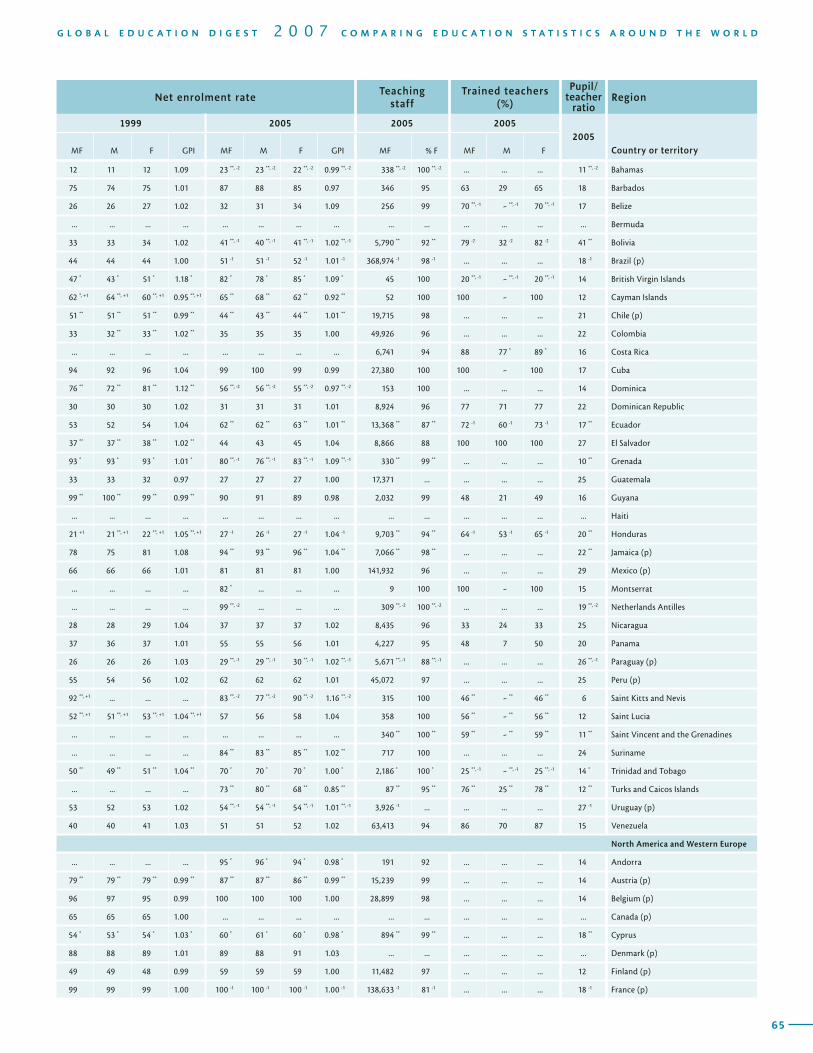
T A B L E PRE-PRIMARY EDUCATION / ISCED 0 / Enrolment and teaching staff1Region
Education system
Enrolment Gross enrolment ratio
Country or territoryEntrance
age Duration
2005 1999 2005
MF % F%
Private MF M F GPI MF M F GPI
64
Net enrolment rateTeaching
staffTrained teachers
(%)
Pupil/teacher
ratioRegion
1999 2005 2005 20052005
Country or territoryMF M F GPI MF M F GPI MF % F MF M F
65
G L O B A L E D U C A T I O N D I G E S T 2 0 0 7 C O M P A R I N G E D U C A T I O N S T A T I S T I C S A R O U N D T H E W O R L D
12 11 12 1.09 23 **, -2 23 **, -2 22 **, -2 0.99 **, -2 338 **, -2 100 **, -2 ... ... ... 11 **, -2 Bahamas
75 74 75 1.01 87 88 85 0.97 346 95 63 29 65 18 Barbados
26 26 27 1.02 32 31 34 1.09 256 99 70 **, -1 - **, -1 70 **, -1 17 Belize
... ... ... ... ... ... ... ... ... ... ... ... ... ... Bermuda
33 33 34 1.02 41 **, -1 40 **, -1 41 **, -1 1.02 **, -1 5,790 ** 92 ** 79 -2 32 -2 82 -2 41 ** Bolivia
44 44 44 1.00 51 -1 51 -1 52 -1 1.01 -1 368,974 -1 98 -1 ... ... ... 18 -1 Brazil (p)
47 * 43 * 51 * 1.18 * 82 * 78 * 85 * 1.09 * 45 100 20 **, -1 - **, -1 20 **, -1 14 British Virgin Islands
62 *, +1 64 **, +1 60 **, +1 0.95 **, +1 65 ** 68 ** 62 ** 0.92 ** 52 100 100 - 100 12 Cayman Islands
51 ** 51 ** 51 ** 0.99 ** 44 ** 43 ** 44 ** 1.01 ** 19,715 98 ... ... ... 21 Chile (p)
33 32 ** 33 ** 1.02 ** 35 35 35 1.00 49,926 96 ... ... ... 22 Colombia
... ... ... ... ... ... ... ... 6,741 94 88 77 * 89 * 16 Costa Rica
94 92 96 1.04 99 100 99 0.99 27,380 100 100 - 100 17 Cuba
76 ** 72 ** 81 ** 1.12 ** 56 **, -2 56 **, -2 55 **, -2 0.97 **, -2 153 100 ... ... ... 14 Dominica
30 30 30 1.02 31 31 31 1.01 8,924 96 77 71 77 22 Dominican Republic
53 52 54 1.04 62 ** 62 ** 63 ** 1.01 ** 13,368 ** 87 ** 72 -1 60 -1 73 -1 17 ** Ecuador
37 ** 37 ** 38 ** 1.02 ** 44 43 45 1.04 8,866 88 100 100 100 27 El Salvador
93 * 93 * 93 * 1.01 * 80 **, -1 76 **, -1 83 **, -1 1.09 **, -1 330 ** 99 ** ... ... ... 10 ** Grenada
33 33 32 0.97 27 27 27 1.00 17,371 ... ... ... ... 25 Guatemala
99 ** 100 ** 99 ** 0.99 ** 90 91 89 0.98 2,032 99 48 21 49 16 Guyana
... ... ... ... ... ... ... ... ... ... ... ... ... ... Haiti
21 +1 21 **, +1 22 **, +1 1.05 **, +1 27 -1 26 -1 27 -1 1.04 -1 9,703 ** 94 ** 64 -1 53 -1 65 -1 20 ** Honduras
78 75 81 1.08 94 ** 93 ** 96 ** 1.04 ** 7,066 ** 98 ** ... ... ... 22 ** Jamaica (p)
66 66 66 1.01 81 81 81 1.00 141,932 96 ... ... ... 29 Mexico (p)
... ... ... ... 82 * ... ... ... 9 100 100 - 100 15 Montserrat
... ... ... ... 99 **, -2 ... ... ... 309 **, -2 100 **, -2 ... ... ... 19 **, -2 Netherlands Antilles
28 28 29 1.04 37 37 37 1.02 8,435 96 33 24 33 25 Nicaragua
37 36 37 1.01 55 55 56 1.01 4,227 95 48 7 50 20 Panama
26 26 26 1.03 29 **, -1 29 **, -1 30 **, -1 1.02 **, -1 5,671 **, -1 88 **, -1 ... ... ... 26 **, -1 Paraguay (p)
55 54 56 1.02 62 62 62 1.01 45,072 97 ... ... ... 25 Peru (p)
92 **, +1 ... ... ... 83 **, -2 77 **, -2 90 **, -2 1.16 **, -2 315 100 46 ** - ** 46 ** 6 Saint Kitts and Nevis
52 **, +1 51 **, +1 53 **, +1 1.04 **, +1 57 56 58 1.04 358 100 56 ** - ** 56 ** 12 Saint Lucia
... ... ... ... ... ... ... ... 340 ** 100 ** 59 ** - ** 59 ** 11 ** Saint Vincent and the Grenadines
... ... ... ... 84 ** 83 ** 85 ** 1.02 ** 717 100 ... ... ... 24 Suriname
50 ** 49 ** 51 ** 1.04 ** 70 * 70 * 70 * 1.00 * 2,186 * 100 * 25 **, -1 - **, -1 25 **, -1 14 * Trinidad and Tobago
... ... ... ... 73 ** 80 ** 68 ** 0.85 ** 87 ** 95 ** 76 ** 25 ** 78 ** 12 ** Turks and Caicos Islands
53 52 53 1.02 54 **, -1 54 **, -1 54 **, -1 1.01 **, -1 3,926 -1 ... ... ... ... 27 -1 Uruguay (p)
40 40 41 1.03 51 51 52 1.02 63,413 94 86 70 87 15 Venezuela
North America and Western Europe
... ... ... ... 95 * 96 * 94 * 0.98 * 191 92 ... ... ... 14 Andorra
79 ** 79 ** 79 ** 0.99 ** 87 ** 87 ** 86 ** 0.99 ** 15,239 99 ... ... ... 14 Austria (p)
96 97 95 0.99 100 100 100 1.00 28,899 98 ... ... ... 14 Belgium (p)
65 65 65 1.00 ... ... ... ... ... ... ... ... ... ... Canada (p)
54 * 53 * 54 * 1.03 * 60 * 61 * 60 * 0.98 * 894 ** 99 ** ... ... ... 18 ** Cyprus
88 88 89 1.01 89 88 91 1.03 ... ... ... ... ... ... Denmark (p)
49 49 48 0.99 59 59 59 1.00 11,482 97 ... ... ... 12 Finland (p)
99 99 99 1.00 100 -1 100 -1 100 -1 1.00 -1 138,633 -1 81 -1 ... ... ... 18 -1 France (p)
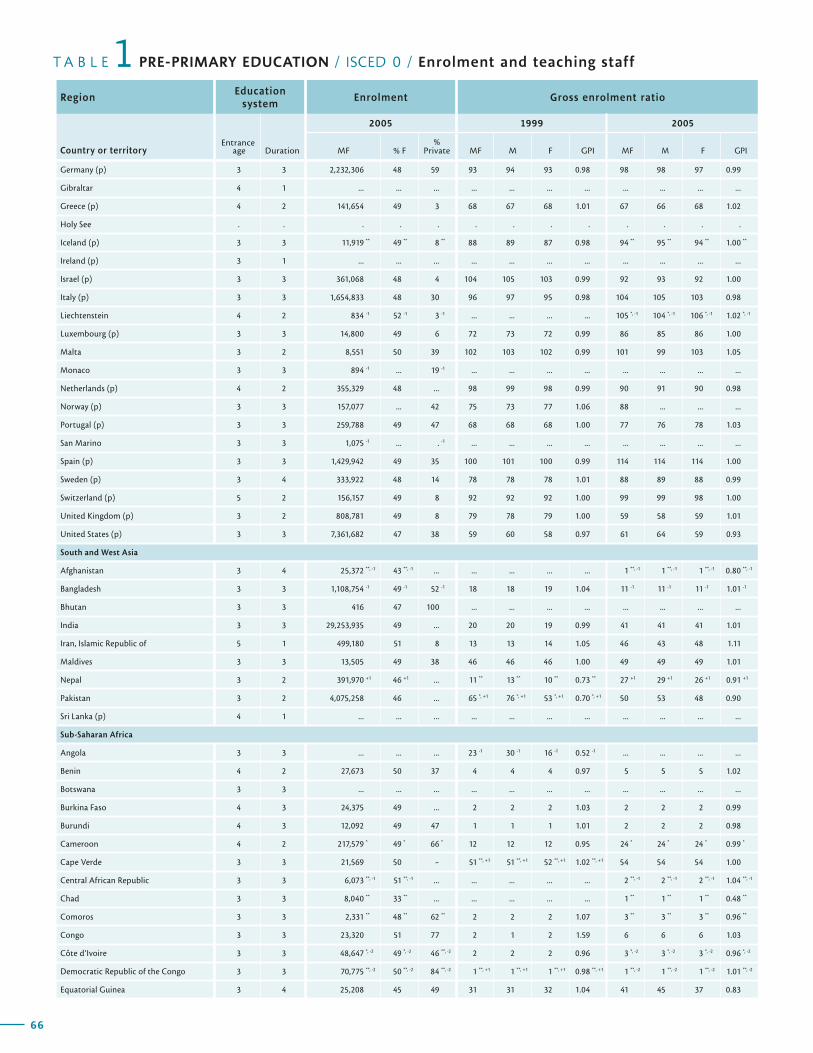
T A B L E PRE-PRIMARY EDUCATION / ISCED 0 / Enrolment and teaching staff1Region
Education system
Enrolment Gross enrolment ratio
Country or territoryEntrance
age Duration
2005 1999 2005
MF % F%
Private MF M F GPI MF M F GPI
66
Net enrolment rateTeaching
staffTrained teachers
(%)
Pupil/teacher
ratioRegion
1999 2005 2005 20052005
Country or territoryMF M F GPI MF M F GPI MF % F MF M F
67
G L O B A L E D U C A T I O N D I G E S T 2 0 0 7 C O M P A R I N G E D U C A T I O N S T A T I S T I C S A R O U N D T H E W O R L D
Germany (p) 3 3 2,232,306 48 59 93 94 93 0.98 98 98 97 0.99
Gibraltar 4 1 ... ... ... ... ... ... ... ... ... ... ...
Greece (p) 4 2 141,654 49 3 68 67 68 1.01 67 66 68 1.02
Holy See . . . . . . . . . . . . .
Iceland (p) 3 3 11,919 ** 49 ** 8 ** 88 89 87 0.98 94 ** 95 ** 94 ** 1.00 **
Ireland (p) 3 1 ... ... ... ... ... ... ... ... ... ... ...
Israel (p) 3 3 361,068 48 4 104 105 103 0.99 92 93 92 1.00
Italy (p) 3 3 1,654,833 48 30 96 97 95 0.98 104 105 103 0.98
Liechtenstein 4 2 834 -1 52 -1 3 -1 ... ... ... ... 105 *, -1 104 *, -1 106 *, -1 1.02 *, -1
Luxembourg (p) 3 3 14,800 49 6 72 73 72 0.99 86 85 86 1.00
Malta 3 2 8,551 50 39 102 103 102 0.99 101 99 103 1.05
Monaco 3 3 894 -1 ... 19 -1 ... ... ... ... ... ... ... ...
Netherlands (p) 4 2 355,329 48 ... 98 99 98 0.99 90 91 90 0.98
Norway (p) 3 3 157,077 ... 42 75 73 77 1.06 88 ... ... ...
Portugal (p) 3 3 259,788 49 47 68 68 68 1.00 77 76 78 1.03
San Marino 3 3 1,075 -1 ... . -1 ... ... ... ... ... ... ... ...
Spain (p) 3 3 1,429,942 49 35 100 101 100 0.99 114 114 114 1.00
Sweden (p) 3 4 333,922 48 14 78 78 78 1.01 88 89 88 0.99
Switzerland (p) 5 2 156,157 49 8 92 92 92 1.00 99 99 98 1.00
United Kingdom (p) 3 2 808,781 49 8 79 78 79 1.00 59 58 59 1.01
United States (p) 3 3 7,361,682 47 38 59 60 58 0.97 61 64 59 0.93
South and West Asia
Afghanistan 3 4 25,372 **, -1 43 **, -1 ... ... ... ... ... 1 **, -1 1 **, -1 1 **, -1 0.80 **, -1
Bangladesh 3 3 1,108,754 -1 49 -1 52 -1 18 18 19 1.04 11 -1 11 -1 11 -1 1.01 -1
Bhutan 3 3 416 47 100 ... ... ... ... ... ... ... ...
India 3 3 29,253,935 49 ... 20 20 19 0.99 41 41 41 1.01
Iran, Islamic Republic of 5 1 499,180 51 8 13 13 14 1.05 46 43 48 1.11
Maldives 3 3 13,505 49 38 46 46 46 1.00 49 49 49 1.01
Nepal 3 2 391,970 +1 46 +1 ... 11 ** 13 ** 10 ** 0.73 ** 27 +1 29 +1 26 +1 0.91 +1
Pakistan 3 2 4,075,258 46 ... 65 *, +1 76 *, +1 53 *, +1 0.70 *, +1 50 53 48 0.90
Sri Lanka (p) 4 1 ... ... ... ... ... ... ... ... ... ... ...
Sub-Saharan Africa
Angola 3 3 ... ... ... 23 -1 30 -1 16 -1 0.52 -1 ... ... ... ...
Benin 4 2 27,673 50 37 4 4 4 0.97 5 5 5 1.02
Botswana 3 3 ... ... ... ... ... ... ... ... ... ... ...
Burkina Faso 4 3 24,375 49 ... 2 2 2 1.03 2 2 2 0.99
Burundi 4 3 12,092 49 47 1 1 1 1.01 2 2 2 0.98
Cameroon 4 2 217,579 * 49 * 66 * 12 12 12 0.95 24 * 24 * 24 * 0.99 *
Cape Verde 3 3 21,569 50 - 51 **, +1 51 **, +1 52 **, +1 1.02 **, +1 54 54 54 1.00
Central African Republic 3 3 6,073 **, -1 51 **, -1 ... ... ... ... ... 2 **, -1 2 **, -1 2 **, -1 1.04 **, -1
Chad 3 3 8,040 ** 33 ** ... ... ... ... ... 1 ** 1 ** 1 ** 0.48 **
Comoros 3 3 2,331 ** 48 ** 62 ** 2 2 2 1.07 3 ** 3 ** 3 ** 0.96 **
Congo 3 3 23,320 51 77 2 1 2 1.59 6 6 6 1.03
Côte d’Ivoire 3 3 48,647 *, -2 49 *, -2 46 **, -2 2 2 2 0.96 3 *, -2 3 *, -2 3 *, -2 0.96 *, -2
Democratic Republic of the Congo 3 3 70,775 **, -2 50 **, -2 84 **, -2 1 **, +1 1 **, +1 1 **, +1 0.98 **, +1 1 **, -2 1 **, -2 1 **, -2 1.01 **, -2
Equatorial Guinea 3 4 25,208 45 49 31 31 32 1.04 41 45 37 0.83
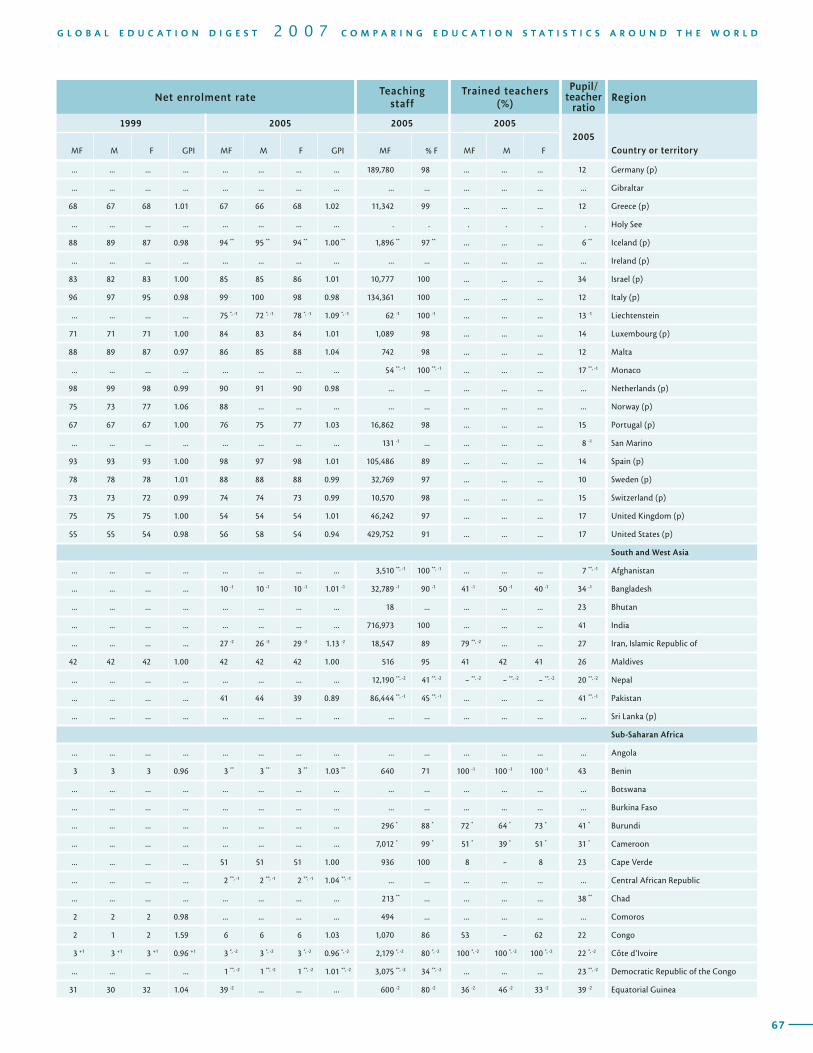
T A B L E PRE-PRIMARY EDUCATION / ISCED 0 / Enrolment and teaching staff1Region
Education system
Enrolment Gross enrolment ratio
Country or territoryEntrance
age Duration
2005 1999 2005
MF % F%
Private MF M F GPI MF M F GPI
66
Net enrolment rateTeaching
staffTrained teachers
(%)
Pupil/teacher
ratioRegion
1999 2005 2005 20052005
Country or territoryMF M F GPI MF M F GPI MF % F MF M F
67
G L O B A L E D U C A T I O N D I G E S T 2 0 0 7 C O M P A R I N G E D U C A T I O N S T A T I S T I C S A R O U N D T H E W O R L D
... ... ... ... ... ... ... ... 189,780 98 ... ... ... 12 Germany (p)
... ... ... ... ... ... ... ... ... ... ... ... ... ... Gibraltar
68 67 68 1.01 67 66 68 1.02 11,342 99 ... ... ... 12 Greece (p)
... ... ... ... ... ... ... ... . . . . . . Holy See
88 89 87 0.98 94 ** 95 ** 94 ** 1.00 ** 1,896 ** 97 ** ... ... ... 6 ** Iceland (p)
... ... ... ... ... ... ... ... ... ... ... ... ... ... Ireland (p)
83 82 83 1.00 85 85 86 1.01 10,777 100 ... ... ... 34 Israel (p)
96 97 95 0.98 99 100 98 0.98 134,361 100 ... ... ... 12 Italy (p)
... ... ... ... 75 *, -1 72 *, -1 78 *, -1 1.09 *, -1 62 -1 100 -1 ... ... ... 13 -1 Liechtenstein
71 71 71 1.00 84 83 84 1.01 1,089 98 ... ... ... 14 Luxembourg (p)
88 89 87 0.97 86 85 88 1.04 742 98 ... ... ... 12 Malta
... ... ... ... ... ... ... ... 54 **, -1 100 **, -1 ... ... ... 17 **, -1 Monaco
98 99 98 0.99 90 91 90 0.98 ... ... ... ... ... ... Netherlands (p)
75 73 77 1.06 88 ... ... ... ... ... ... ... ... ... Norway (p)
67 67 67 1.00 76 75 77 1.03 16,862 98 ... ... ... 15 Portugal (p)
... ... ... ... ... ... ... ... 131 -1 ... ... ... ... 8 -1 San Marino
93 93 93 1.00 98 97 98 1.01 105,486 89 ... ... ... 14 Spain (p)
78 78 78 1.01 88 88 88 0.99 32,769 97 ... ... ... 10 Sweden (p)
73 73 72 0.99 74 74 73 0.99 10,570 98 ... ... ... 15 Switzerland (p)
75 75 75 1.00 54 54 54 1.01 46,242 97 ... ... ... 17 United Kingdom (p)
55 55 54 0.98 56 58 54 0.94 429,752 91 ... ... ... 17 United States (p)
South and West Asia
... ... ... ... ... ... ... ... 3,510 **, -1 100 **, -1 ... ... ... 7 **, -1 Afghanistan
... ... ... ... 10 -1 10 -1 10 -1 1.01 -1 32,789 -1 90 -1 41 -1 50 -1 40 -1 34 -1 Bangladesh
... ... ... ... ... ... ... ... 18 ... ... ... ... 23 Bhutan
... ... ... ... ... ... ... ... 716,973 100 ... ... ... 41 India
... ... ... ... 27 -2 26 -2 29 -2 1.13 -2 18,547 89 79 **, -2 ... ... 27 Iran, Islamic Republic of
42 42 42 1.00 42 42 42 1.00 516 95 41 42 41 26 Maldives
... ... ... ... ... ... ... ... 12,190 **, -2 41 **, -2 - **, -2 - **, -2 - **, -2 20 **, -2 Nepal
... ... ... ... 41 44 39 0.89 86,444 **, -1 45 **, -1 ... ... ... 41 **, -1 Pakistan
... ... ... ... ... ... ... ... ... ... ... ... ... ... Sri Lanka (p)
Sub-Saharan Africa
... ... ... ... ... ... ... ... ... ... ... ... ... ... Angola
3 3 3 0.96 3 ** 3 ** 3 ** 1.03 ** 640 71 100 -1 100 -1 100 -1 43 Benin
... ... ... ... ... ... ... ... ... ... ... ... ... ... Botswana
... ... ... ... ... ... ... ... ... ... ... ... ... ... Burkina Faso
... ... ... ... ... ... ... ... 296 * 88 * 72 * 64 * 73 * 41 * Burundi
... ... ... ... ... ... ... ... 7,012 * 99 * 51 * 39 * 51 * 31 * Cameroon
... ... ... ... 51 51 51 1.00 936 100 8 - 8 23 Cape Verde
... ... ... ... 2 **, -1 2 **, -1 2 **, -1 1.04 **, -1 ... ... ... ... ... ... Central African Republic
... ... ... ... ... ... ... ... 213 ** ... ... ... ... 38 ** Chad
2 2 2 0.98 ... ... ... ... 494 ... ... ... ... ... Comoros
2 1 2 1.59 6 6 6 1.03 1,070 86 53 - 62 22 Congo
3 +1 3 +1 3 +1 0.96 +1 3 *, -2 3 *, -2 3 *, -2 0.96 *, -2 2,179 *, -2 80 *, -2 100 *, -2 100 *, -2 100 *, -2 22 *, -2 Côte d’Ivoire
... ... ... ... 1 **, -2 1 **, -2 1 **, -2 1.01 **, -2 3,075 **, -2 34 **, -2 ... ... ... 23 **, -2 Democratic Republic of the Congo
31 30 32 1.04 39 -2 ... ... ... 600 -2 80 -2 36 -2 46 -2 33 -2 39 -2 Equatorial Guinea
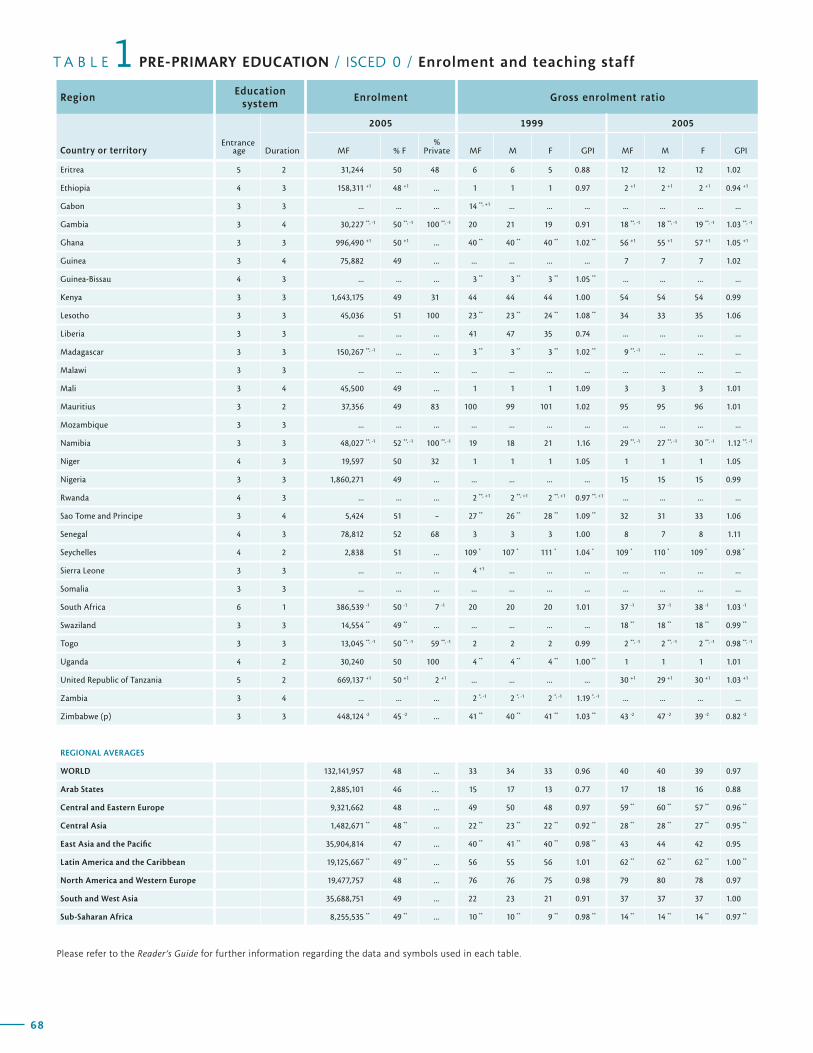
T A B L E PRE-PRIMARY EDUCATION / ISCED 0 / Enrolment and teaching staff1Region
Education system
Enrolment Gross enrolment ratio
Country or territoryEntrance
age Duration
2005 1999 2005
MF % F%
Private MF M F GPI MF M F GPI
68
Net enrolment rateTeaching
staffTrained teachers
(%)
Pupil/teacher
ratioRegion
1999 2005 2005 20052005
Country or territoryMF M F GPI MF M F GPI MF % F MF M F
69
G L O B A L E D U C A T I O N D I G E S T 2 0 0 7 C O M P A R I N G E D U C A T I O N S T A T I S T I C S A R O U N D T H E W O R L D
Eritrea 5 2 31,244 50 48 6 6 5 0.88 12 12 12 1.02
Ethiopia 4 3 158,311 +1 48 +1 ... 1 1 1 0.97 2 +1 2 +1 2 +1 0.94 +1
Gabon 3 3 ... ... ... 14 **, +1 ... ... ... ... ... ... ...
Gambia 3 4 30,227 **, -1 50 **, -1 100 **, -1 20 21 19 0.91 18 **, -1 18 **, -1 19 **, -1 1.03 **, -1
Ghana 3 3 996,490 +1 50 +1 ... 40 ** 40 ** 40 ** 1.02 ** 56 +1 55 +1 57 +1 1.05 +1
Guinea 3 4 75,882 49 ... ... ... ... ... 7 7 7 1.02
Guinea-Bissau 4 3 ... ... ... 3 ** 3 ** 3 ** 1.05 ** ... ... ... ...
Kenya 3 3 1,643,175 49 31 44 44 44 1.00 54 54 54 0.99
Lesotho 3 3 45,036 51 100 23 ** 23 ** 24 ** 1.08 ** 34 33 35 1.06
Liberia 3 3 ... ... ... 41 47 35 0.74 ... ... ... ...
Madagascar 3 3 150,267 **, -1 ... ... 3 ** 3 ** 3 ** 1.02 ** 9 **, -1 ... ... ...
Malawi 3 3 ... ... ... ... ... ... ... ... ... ... ...
Mali 3 4 45,500 49 ... 1 1 1 1.09 3 3 3 1.01
Mauritius 3 2 37,356 49 83 100 99 101 1.02 95 95 96 1.01
Mozambique 3 3 ... ... ... ... ... ... ... ... ... ... ...
Namibia 3 3 48,027 **, -1 52 **, -1 100 **, -1 19 18 21 1.16 29 **, -1 27 **, -1 30 **, -1 1.12 **, -1
Niger 4 3 19,597 50 32 1 1 1 1.05 1 1 1 1.05
Nigeria 3 3 1,860,271 49 ... ... ... ... ... 15 15 15 0.99
Rwanda 4 3 ... ... ... 2 **, +1 2 **, +1 2 **, +1 0.97 **, +1 ... ... ... ...
Sao Tome and Principe 3 4 5,424 51 - 27 ** 26 ** 28 ** 1.09 ** 32 31 33 1.06
Senegal 4 3 78,812 52 68 3 3 3 1.00 8 7 8 1.11
Seychelles 4 2 2,838 51 ... 109 * 107 * 111 * 1.04 * 109 * 110 * 109 * 0.98 *
Sierra Leone 3 3 ... ... ... 4 +1 ... ... ... ... ... ... ...
Somalia 3 3 ... ... ... ... ... ... ... ... ... ... ...
South Africa 6 1 386,539 -1 50 -1 7 -1 20 20 20 1.01 37 -1 37 -1 38 -1 1.03 -1
Swaziland 3 3 14,554 ** 49 ** ... ... ... ... ... 18 ** 18 ** 18 ** 0.99 **
Togo 3 3 13,045 **, -1 50 **, -1 59 **, -1 2 2 2 0.99 2 **, -1 2 **, -1 2 **, -1 0.98 **, -1
Uganda 4 2 30,240 50 100 4 ** 4 ** 4 ** 1.00 ** 1 1 1 1.01
United Republic of Tanzania 5 2 669,137 +1 50 +1 2 +1 ... ... ... ... 30 +1 29 +1 30 +1 1.03 +1
Zambia 3 4 ... ... ... 2 *, -1 2 *, -1 2 *, -1 1.19 *, -1 ... ... ... ...
Zimbabwe (p) 3 3 448,124 -2 45 -2 ... 41 ** 40 ** 41 ** 1.03 ** 43 -2 47 -2 39 -2 0.82 -2
REGIONAL AVERAGES
WORLD 132,141,957 48 ... 33 34 33 0.96 40 40 39 0.97
Arab States 2,885,101 46 … 15 17 13 0.77 17 18 16 0.88
Central and Eastern Europe 9,321,662 48 ... 49 50 48 0.97 59 ** 60 ** 57 ** 0.96 **
Central Asia 1,482,671 ** 48 ** ... 22 ** 23 ** 22 ** 0.92 ** 28 ** 28 ** 27 ** 0.95 **
East Asia and the Pacific 35,904,814 47 ... 40 ** 41 ** 40 ** 0.98 ** 43 44 42 0.95
Latin America and the Caribbean 19,125,667 ** 49 ** ... 56 55 56 1.01 62 ** 62 ** 62 ** 1.00 **
North America and Western Europe 19,477,757 48 ... 76 76 75 0.98 79 80 78 0.97
South and West Asia 35,688,751 49 ... 22 23 21 0.91 37 37 37 1.00
Sub-Saharan Africa 8,255,535 ** 49 ** ... 10 ** 10 ** 9 ** 0.98 ** 14 ** 14 ** 14 ** 0.97 **
Please refer to the Reader’s Guide for further information regarding the data and symbols used in each table.
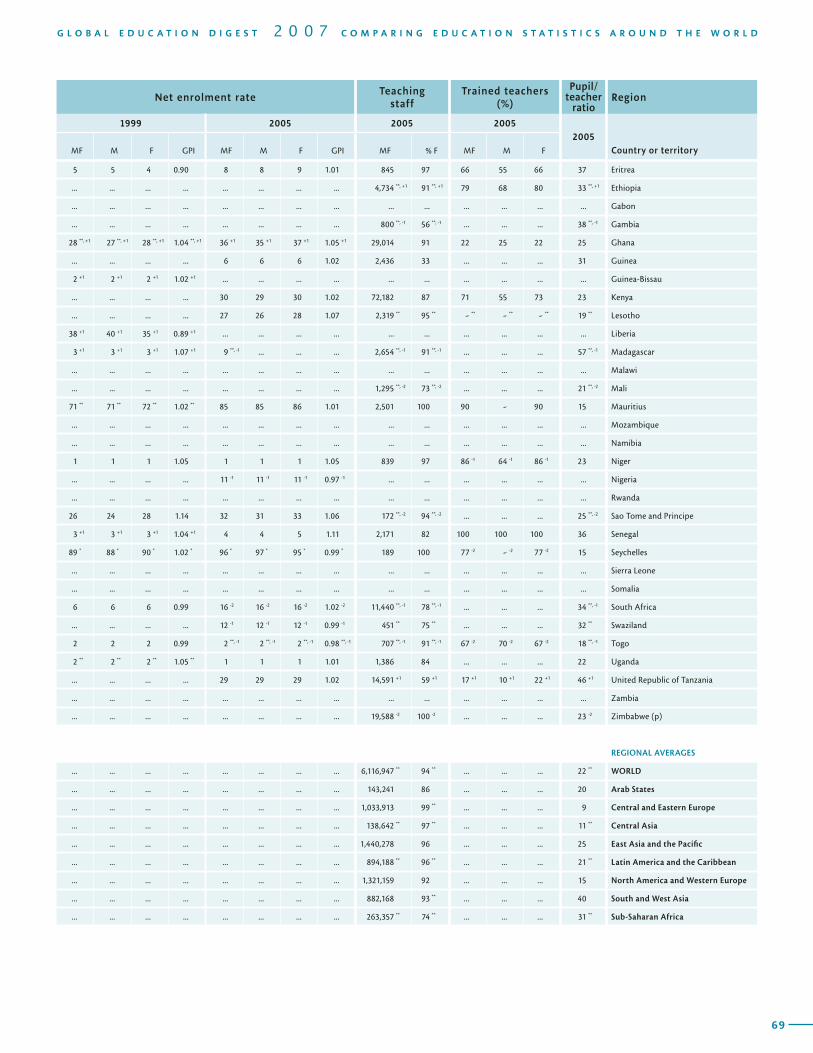
T A B L E PRE-PRIMARY EDUCATION / ISCED 0 / Enrolment and teaching staff1Region
Education system
Enrolment Gross enrolment ratio
Country or territoryEntrance
age Duration
2005 1999 2005
MF % F%
Private MF M F GPI MF M F GPI
68
Net enrolment rateTeaching
staffTrained teachers
(%)
Pupil/teacher
ratioRegion
1999 2005 2005 20052005
Country or territoryMF M F GPI MF M F GPI MF % F MF M F
69
G L O B A L E D U C A T I O N D I G E S T 2 0 0 7 C O M P A R I N G E D U C A T I O N S T A T I S T I C S A R O U N D T H E W O R L D
5 5 4 0.90 8 8 9 1.01 845 97 66 55 66 37 Eritrea
... ... ... ... ... ... ... ... 4,734 **, +1 91 **, +1 79 68 80 33 **, +1 Ethiopia
... ... ... ... ... ... ... ... ... ... ... ... ... ... Gabon
... ... ... ... ... ... ... ... 800 **, -1 56 **, -1 ... ... ... 38 **, -1 Gambia
28 **, +1 27 **, +1 28 **, +1 1.04 **, +1 36 +1 35 +1 37 +1 1.05 +1 29,014 91 22 25 22 25 Ghana
... ... ... ... 6 6 6 1.02 2,436 33 ... ... ... 31 Guinea
2 +1 2 +1 2 +1 1.02 +1 ... ... ... ... ... ... ... ... ... ... Guinea-Bissau
... ... ... ... 30 29 30 1.02 72,182 87 71 55 73 23 Kenya
... ... ... ... 27 26 28 1.07 2,319 ** 95 ** - ** - ** - ** 19 ** Lesotho
38 +1 40 +1 35 +1 0.89 +1 ... ... ... ... ... ... ... ... ... ... Liberia
3 +1 3 +1 3 +1 1.07 +1 9 **, -1 ... ... ... 2,654 **, -1 91 **, -1 ... ... ... 57 **, -1 Madagascar
... ... ... ... ... ... ... ... ... ... ... ... ... ... Malawi
... ... ... ... ... ... ... ... 1,295 **, -2 73 **, -2 ... ... ... 21 **, -2 Mali
71 ** 71 ** 72 ** 1.02 ** 85 85 86 1.01 2,501 100 90 - 90 15 Mauritius
... ... ... ... ... ... ... ... ... ... ... ... ... ... Mozambique
... ... ... ... ... ... ... ... ... ... ... ... ... ... Namibia
1 1 1 1.05 1 1 1 1.05 839 97 86 -1 64 -1 86 -1 23 Niger
... ... ... ... 11 -1 11 -1 11 -1 0.97 -1 ... ... ... ... ... ... Nigeria
... ... ... ... ... ... ... ... ... ... ... ... ... ... Rwanda
26 24 28 1.14 32 31 33 1.06 172 **, -2 94 **, -2 ... ... ... 25 **, -2 Sao Tome and Principe
3 +1 3 +1 3 +1 1.04 +1 4 4 5 1.11 2,171 82 100 100 100 36 Senegal
89 * 88 * 90 * 1.02 * 96 * 97 * 95 * 0.99 * 189 100 77 -2 - -2 77 -2 15 Seychelles
... ... ... ... ... ... ... ... ... ... ... ... ... ... Sierra Leone
... ... ... ... ... ... ... ... ... ... ... ... ... ... Somalia
6 6 6 0.99 16 -2 16 -2 16 -2 1.02 -2 11,440 **, -1 78 **, -1 ... ... ... 34 **, -1 South Africa
... ... ... ... 12 -1 12 -1 12 -1 0.99 -1 451 ** 75 ** ... ... ... 32 ** Swaziland
2 2 2 0.99 2 **, -1 2 **, -1 2 **, -1 0.98 **, -1 707 **, -1 91 **, -1 67 -2 70 -2 67 -2 18 **, -1 Togo
2 ** 2 ** 2 ** 1.05 ** 1 1 1 1.01 1,386 84 ... ... ... 22 Uganda
... ... ... ... 29 29 29 1.02 14,591 +1 59 +1 17 +1 10 +1 22 +1 46 +1 United Republic of Tanzania
... ... ... ... ... ... ... ... ... ... ... ... ... ... Zambia
... ... ... ... ... ... ... ... 19,588 -2 100 -2 ... ... ... 23 -2 Zimbabwe (p)
REGIONAL AVERAGES
... ... ... ... ... ... ... ... 6,116,947 ** 94 ** ... ... ... 22 ** WORLD
... ... ... ... ... ... ... ... 143,241 86 ... ... ... 20 Arab States
... ... ... ... ... ... ... ... 1,033,913 99 ** ... ... ... 9 Central and Eastern Europe
... ... ... ... ... ... ... ... 138,642 ** 97 ** ... ... ... 11 ** Central Asia
... ... ... ... ... ... ... ... 1,440,278 96 ... ... ... 25 East Asia and the Pacific
... ... ... ... ... ... ... ... 894,188 ** 96 ** ... ... ... 21 ** Latin America and the Caribbean
... ... ... ... ... ... ... ... 1,321,159 92 ... ... ... 15 North America and Western Europe
... ... ... ... ... ... ... ... 882,168 93 ** ... ... ... 40 South and West Asia
... ... ... ... ... ... ... ... 263,357 ** 74 ** ... ... ... 31 ** Sub-Saharan Africa
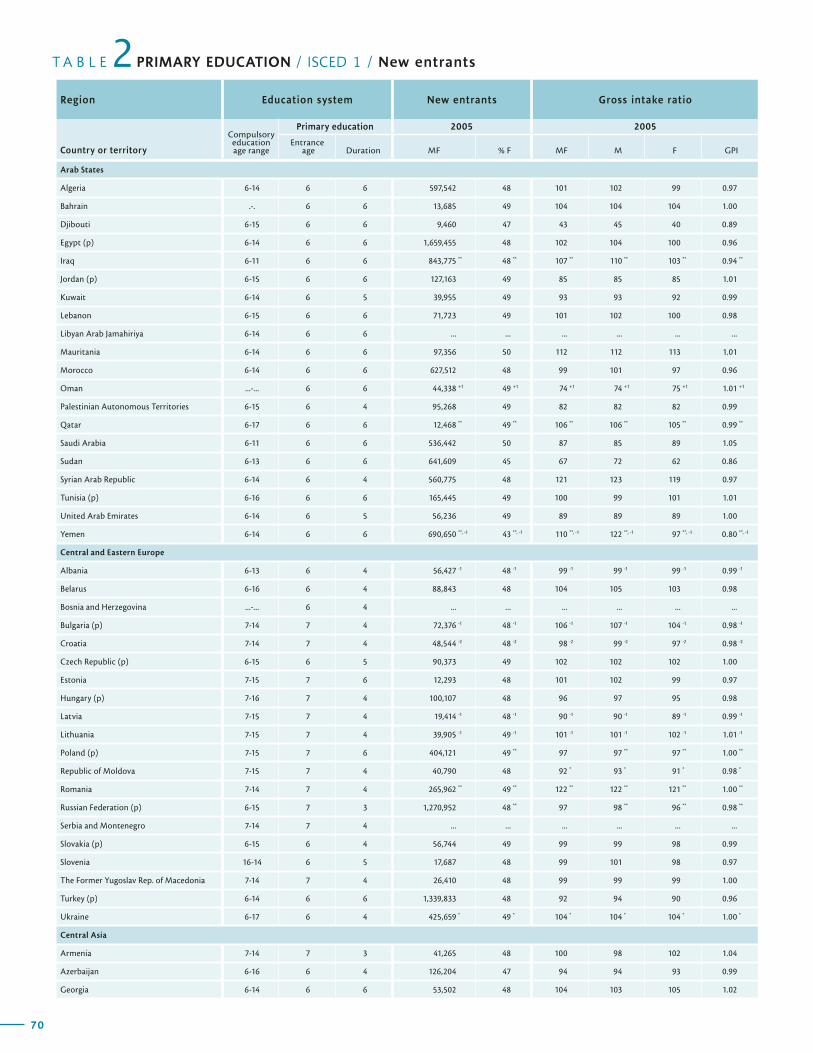
70
T A B L E PRIMARY EDUCATION / ISCED 1 / New entrants2Region Education system New entrants Gross intake ratio
Country or territory
Compulsory education age range
Primary education 2005 2005
Entrance age Duration MF % F MF M F GPI
71
G L O B A L E D U C A T I O N D I G E S T 2 0 0 7 C O M P A R I N G E D U C A T I O N S T A T I S T I C S A R O U N D T H E W O R L D
Net intake rateNew entrants to primary
education with ECCE experience (%)
Region
1999 2005 2005
Country or territoryMF M F MF M F MF M F
Arab States
Algeria 6-14 6 6 597,542 48 101 102 99 0.97
Bahrain .-. 6 6 13,685 49 104 104 104 1.00
Djibouti 6-15 6 6 9,460 47 43 45 40 0.89
Egypt (p) 6-14 6 6 1,659,455 48 102 104 100 0.96
Iraq 6-11 6 6 843,775 ** 48 ** 107 ** 110 ** 103 ** 0.94 **
Jordan (p) 6-15 6 6 127,163 49 85 85 85 1.01
Kuwait 6-14 6 5 39,955 49 93 93 92 0.99
Lebanon 6-15 6 6 71,723 49 101 102 100 0.98
Libyan Arab Jamahiriya 6-14 6 6 ... ... ... ... ... ...
Mauritania 6-14 6 6 97,356 50 112 112 113 1.01
Morocco 6-14 6 6 627,512 48 99 101 97 0.96
Oman ...-... 6 6 44,338 +1 49 +1 74 +1 74 +1 75 +1 1.01 +1
Palestinian Autonomous Territories 6-15 6 4 95,268 49 82 82 82 0.99
Qatar 6-17 6 6 12,468 ** 49 ** 106 ** 106 ** 105 ** 0.99 **
Saudi Arabia 6-11 6 6 536,442 50 87 85 89 1.05
Sudan 6-13 6 6 641,609 45 67 72 62 0.86
Syrian Arab Republic 6-14 6 4 560,775 48 121 123 119 0.97
Tunisia (p) 6-16 6 6 165,445 49 100 99 101 1.01
United Arab Emirates 6-14 6 5 56,236 49 89 89 89 1.00
Yemen 6-14 6 6 690,650 **, -1 43 **, -1 110 **, -1 122 **, -1 97 **, -1 0.80 **, -1
Central and Eastern Europe
Albania 6-13 6 4 56,427 -1 48 -1 99 -1 99 -1 99 -1 0.99 -1
Belarus 6-16 6 4 88,843 48 104 105 103 0.98
Bosnia and Herzegovina ...-... 6 4 ... ... ... ... ... ...
Bulgaria (p) 7-14 7 4 72,376 -1 48 -1 106 -1 107 -1 104 -1 0.98 -1
Croatia 7-14 7 4 48,544 -2 48 -2 98 -2 99 -2 97 -2 0.98 -2
Czech Republic (p) 6-15 6 5 90,373 49 102 102 102 1.00
Estonia 7-15 7 6 12,293 48 101 102 99 0.97
Hungary (p) 7-16 7 4 100,107 48 96 97 95 0.98
Latvia 7-15 7 4 19,414 -1 48 -1 90 -1 90 -1 89 -1 0.99 -1
Lithuania 7-15 7 4 39,905 -1 49 -1 101 -1 101 -1 102 -1 1.01 -1
Poland (p) 7-15 7 6 404,121 49 ** 97 97 ** 97 ** 1.00 **
Republic of Moldova 7-15 7 4 40,790 48 92 * 93 * 91 * 0.98 *
Romania 7-14 7 4 265,962 ** 49 ** 122 ** 122 ** 121 ** 1.00 **
Russian Federation (p) 6-15 7 3 1,270,952 48 ** 97 98 ** 96 ** 0.98 **
Serbia and Montenegro 7-14 7 4 ... ... ... ... ... ...
Slovakia (p) 6-15 6 4 56,744 49 99 99 98 0.99
Slovenia 16-14 6 5 17,687 48 99 101 98 0.97
The Former Yugoslav Rep. of Macedonia 7-14 7 4 26,410 48 99 99 99 1.00
Turkey (p) 6-14 6 6 1,339,833 48 92 94 90 0.96
Ukraine 6-17 6 4 425,659 * 49 * 104 * 104 * 104 * 1.00 *
Central Asia
Armenia 7-14 7 3 41,265 48 100 98 102 1.04
Azerbaijan 6-16 6 4 126,204 47 94 94 93 0.99
Georgia 6-14 6 6 53,502 48 104 103 105 1.02
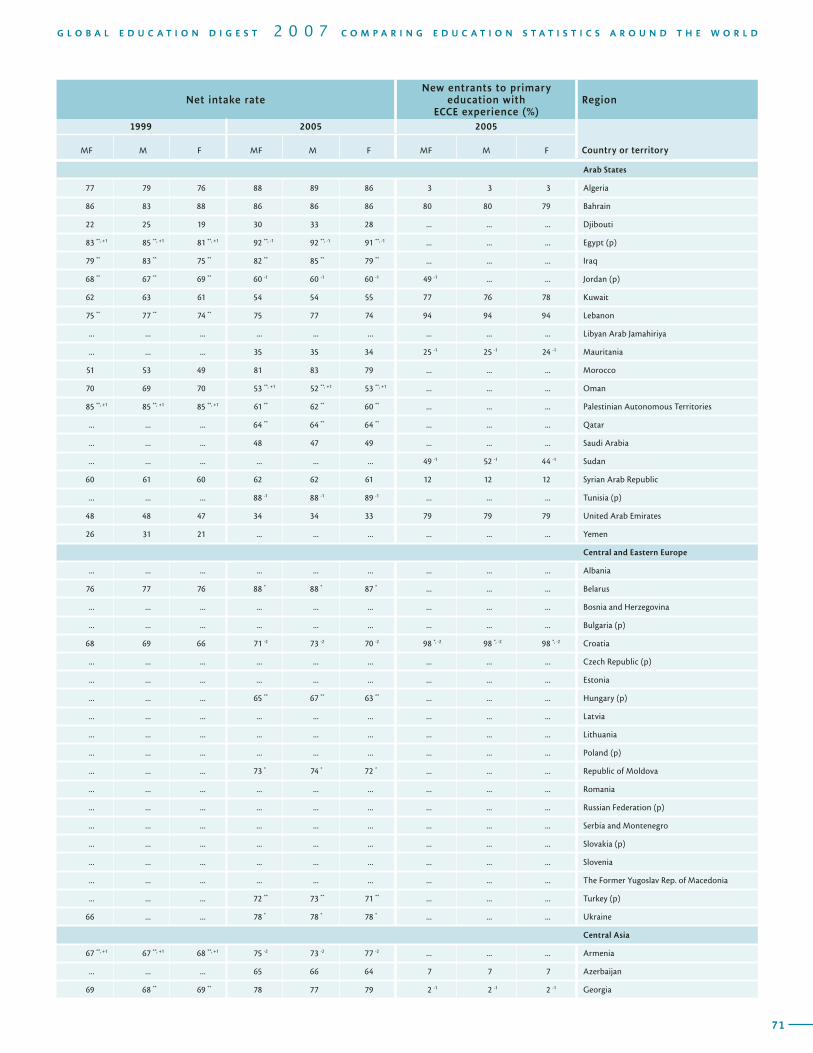
70
T A B L E PRIMARY EDUCATION / ISCED 1 / New entrants2Region Education system New entrants Gross intake ratio
Country or territory
Compulsory education age range
Primary education 2005 2005
Entrance age Duration MF % F MF M F GPI
71
G L O B A L E D U C A T I O N D I G E S T 2 0 0 7 C O M P A R I N G E D U C A T I O N S T A T I S T I C S A R O U N D T H E W O R L D
Net intake rateNew entrants to primary
education with ECCE experience (%)
Region
1999 2005 2005
Country or territoryMF M F MF M F MF M F
Arab States
77 79 76 88 89 86 3 3 3 Algeria
86 83 88 86 86 86 80 80 79 Bahrain
22 25 19 30 33 28 ... ... ... Djibouti
83 **, +1 85 **, +1 81 **, +1 92 **, -1 92 **, -1 91 **, -1 ... ... ... Egypt (p)
79 ** 83 ** 75 ** 82 ** 85 ** 79 ** ... ... ... Iraq
68 ** 67 ** 69 ** 60 -1 60 -1 60 -1 49 -1 ... ... Jordan (p)
62 63 61 54 54 55 77 76 78 Kuwait
75 ** 77 ** 74 ** 75 77 74 94 94 94 Lebanon
... ... ... ... ... ... ... ... ... Libyan Arab Jamahiriya
... ... ... 35 35 34 25 -1 25 -1 24 -1 Mauritania
51 53 49 81 83 79 ... ... ... Morocco
70 69 70 53 **, +1 52 **, +1 53 **, +1 ... ... ... Oman
85 **, +1 85 **, +1 85 **, +1 61 ** 62 ** 60 ** ... ... ... Palestinian Autonomous Territories
... ... ... 64 ** 64 ** 64 ** ... ... ... Qatar
... ... ... 48 47 49 ... ... ... Saudi Arabia
... ... ... ... ... ... 49 -1 52 -1 44 -1 Sudan
60 61 60 62 62 61 12 12 12 Syrian Arab Republic
... ... ... 88 -1 88 -1 89 -1 ... ... ... Tunisia (p)
48 48 47 34 34 33 79 79 79 United Arab Emirates
26 31 21 ... ... ... ... ... ... Yemen
Central and Eastern Europe
... ... ... ... ... ... ... ... ... Albania
76 77 76 88 * 88 * 87 * ... ... ... Belarus
... ... ... ... ... ... ... ... ... Bosnia and Herzegovina
... ... ... ... ... ... ... ... ... Bulgaria (p)
68 69 66 71 -2 73 -2 70 -2 98 *, -2 98 *, -2 98 *, -2 Croatia
... ... ... ... ... ... ... ... ... Czech Republic (p)
... ... ... ... ... ... ... ... ... Estonia
... ... ... 65 ** 67 ** 63 ** ... ... ... Hungary (p)
... ... ... ... ... ... ... ... ... Latvia
... ... ... ... ... ... ... ... ... Lithuania
... ... ... ... ... ... ... ... ... Poland (p)
... ... ... 73 * 74 * 72 * ... ... ... Republic of Moldova
... ... ... ... ... ... ... ... ... Romania
... ... ... ... ... ... ... ... ... Russian Federation (p)
... ... ... ... ... ... ... ... ... Serbia and Montenegro
... ... ... ... ... ... ... ... ... Slovakia (p)
... ... ... ... ... ... ... ... ... Slovenia
... ... ... ... ... ... ... ... ... The Former Yugoslav Rep. of Macedonia
... ... ... 72 ** 73 ** 71 ** ... ... ... Turkey (p)
66 ... ... 78 * 78 * 78 * ... ... ... Ukraine
Central Asia
67 **, +1 67 **, +1 68 **, +1 75 -2 73 -2 77 -2 ... ... ... Armenia
... ... ... 65 66 64 7 7 7 Azerbaijan
69 68 ** 69 ** 78 77 79 2 -1 2 -1 2 -1 Georgia
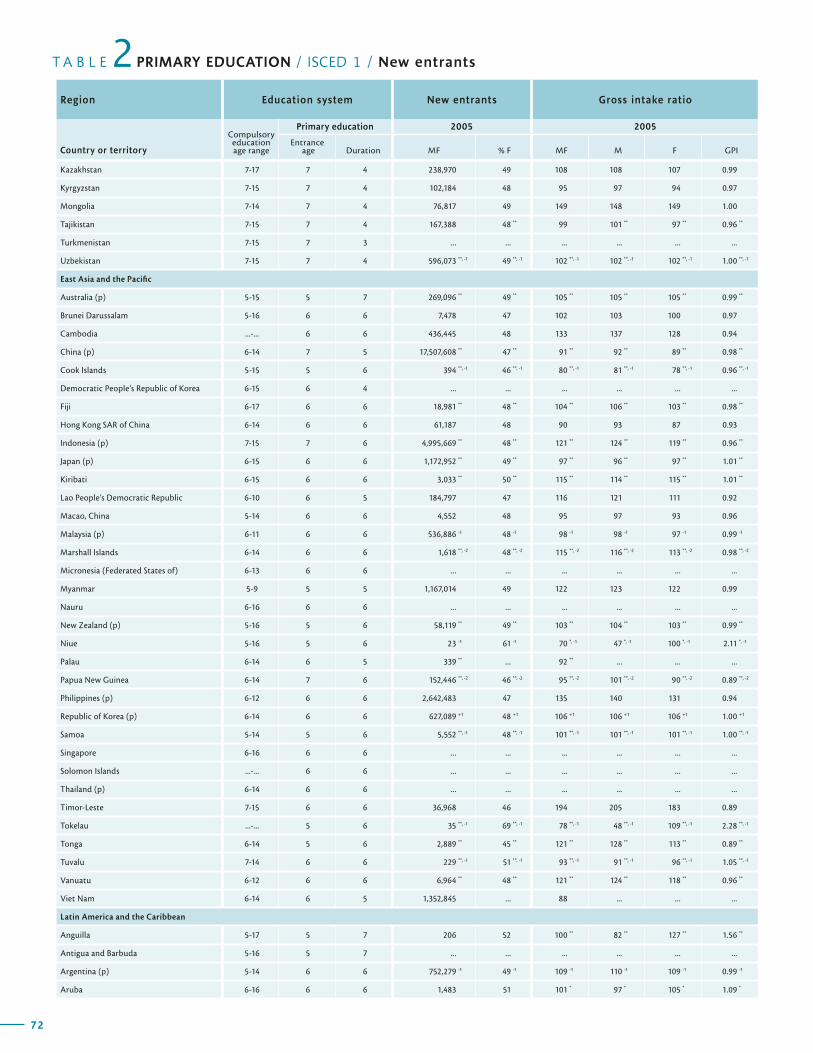
72
T A B L E PRIMARY EDUCATION / ISCED 1 / New entrants2Region Education system New entrants Gross intake ratio
Country or territory
Compulsory education age range
Primary education 2005 2005
Entrance age Duration MF % F MF M F GPI
73
G L O B A L E D U C A T I O N D I G E S T 2 0 0 7 C O M P A R I N G E D U C A T I O N S T A T I S T I C S A R O U N D T H E W O R L D
Net intake rateNew entrants to primary
education with ECCE experience (%)
Region
1999 2005 2005
Country or territoryMF M F MF M F MF M F
Kazakhstan 7-17 7 4 238,970 49 108 108 107 0.99
Kyrgyzstan 7-15 7 4 102,184 48 95 97 94 0.97
Mongolia 7-14 7 4 76,817 49 149 148 149 1.00
Tajikistan 7-15 7 4 167,388 48 ** 99 101 ** 97 ** 0.96 **
Turkmenistan 7-15 7 3 ... ... ... ... ... ...
Uzbekistan 7-15 7 4 596,073 **, -1 49 **, -1 102 **, -1 102 **, -1 102 **, -1 1.00 **, -1
East Asia and the Pacific
Australia (p) 5-15 5 7 269,096 ** 49 ** 105 ** 105 ** 105 ** 0.99 **
Brunei Darussalam 5-16 6 6 7,478 47 102 103 100 0.97
Cambodia ...-... 6 6 436,445 48 133 137 128 0.94
China (p) 6-14 7 5 17,507,608 ** 47 ** 91 ** 92 ** 89 ** 0.98 **
Cook Islands 5-15 5 6 394 **, -1 46 **, -1 80 **, -1 81 **, -1 78 **, -1 0.96 **, -1
Democratic People’s Republic of Korea 6-15 6 4 ... ... ... ... ... ...
Fiji 6-17 6 6 18,981 ** 48 ** 104 ** 106 ** 103 ** 0.98 **
Hong Kong SAR of China 6-14 6 6 61,187 48 90 93 87 0.93
Indonesia (p) 7-15 7 6 4,995,669 ** 48 ** 121 ** 124 ** 119 ** 0.96 **
Japan (p) 6-15 6 6 1,172,952 ** 49 ** 97 ** 96 ** 97 ** 1.01 **
Kiribati 6-15 6 6 3,033 ** 50 ** 115 ** 114 ** 115 ** 1.01 **
Lao People’s Democratic Republic 6-10 6 5 184,797 47 116 121 111 0.92
Macao, China 5-14 6 6 4,552 48 95 97 93 0.96
Malaysia (p) 6-11 6 6 536,886 -1 48 -1 98 -1 98 -1 97 -1 0.99 -1
Marshall Islands 6-14 6 6 1,618 **, -2 48 **, -2 115 **, -2 116 **, -2 113 **, -2 0.98 **, -2
Micronesia (Federated States of) 6-13 6 6 ... ... ... ... ... ...
Myanmar 5-9 5 5 1,167,014 49 122 123 122 0.99
Nauru 6-16 6 6 ... ... ... ... ... ...
New Zealand (p) 5-16 5 6 58,119 ** 49 ** 103 ** 104 ** 103 ** 0.99 **
Niue 5-16 5 6 23 -1 61 -1 70 *, -1 47 *, -1 100 *, -1 2.11 *, -1
Palau 6-14 6 5 339 ** ... 92 ** ... ... ...
Papua New Guinea 6-14 7 6 152,446 **, -2 46 **, -2 95 **, -2 101 **, -2 90 **, -2 0.89 **, -2
Philippines (p) 6-12 6 6 2,642,483 47 135 140 131 0.94
Republic of Korea (p) 6-14 6 6 627,089 +1 48 +1 106 +1 106 +1 106 +1 1.00 +1
Samoa 5-14 5 6 5,552 **, -1 48 **, -1 101 **, -1 101 **, -1 101 **, -1 1.00 **, -1
Singapore 6-16 6 6 ... ... ... ... ... ...
Solomon Islands ...-... 6 6 ... ... ... ... ... ...
Thailand (p) 6-14 6 6 ... ... ... ... ... ...
Timor-Leste 7-15 6 6 36,968 46 194 205 183 0.89
Tokelau ...-... 5 6 35 **, -1 69 **, -1 78 **, -1 48 **, -1 109 **, -1 2.28 **, -1
Tonga 6-14 5 6 2,889 ** 45 ** 121 ** 128 ** 113 ** 0.89 **
Tuvalu 7-14 6 6 229 **, -1 51 **, -1 93 **, -1 91 **, -1 96 **, -1 1.05 **, -1
Vanuatu 6-12 6 6 6,964 ** 48 ** 121 ** 124 ** 118 ** 0.96 **
Viet Nam 6-14 6 5 1,352,845 ... 88 ... ... ...
Latin America and the Caribbean
Anguilla 5-17 5 7 206 52 100 ** 82 ** 127 ** 1.56 **
Antigua and Barbuda 5-16 5 7 ... ... ... ... ... ...
Argentina (p) 5-14 6 6 752,279 -1 49 -1 109 -1 110 -1 109 -1 0.99 -1
Aruba 6-16 6 6 1,483 51 101 * 97 * 105 * 1.09 *
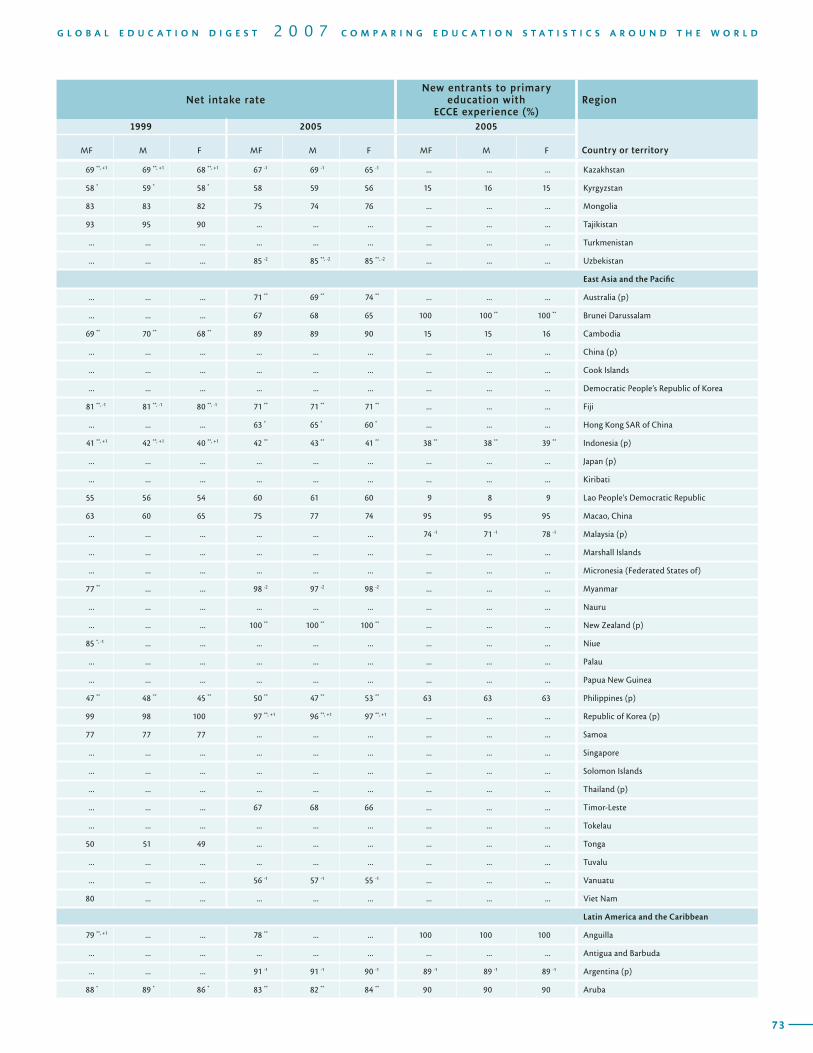
72
T A B L E PRIMARY EDUCATION / ISCED 1 / New entrants2Region Education system New entrants Gross intake ratio
Country or territory
Compulsory education age range
Primary education 2005 2005
Entrance age Duration MF % F MF M F GPI
73
G L O B A L E D U C A T I O N D I G E S T 2 0 0 7 C O M P A R I N G E D U C A T I O N S T A T I S T I C S A R O U N D T H E W O R L D
Net intake rateNew entrants to primary
education with ECCE experience (%)
Region
1999 2005 2005
Country or territoryMF M F MF M F MF M F
69 **, +1 69 **, +1 68 **, +1 67 -1 69 -1 65 -1 ... ... ... Kazakhstan
58 * 59 * 58 * 58 59 56 15 16 15 Kyrgyzstan
83 83 82 75 74 76 ... ... ... Mongolia
93 95 90 ... ... ... ... ... ... Tajikistan
... ... ... ... ... ... ... ... ... Turkmenistan
... ... ... 85 -2 85 **, -2 85 **, -2 ... ... ... Uzbekistan
East Asia and the Pacific
... ... ... 71 ** 69 ** 74 ** ... ... ... Australia (p)
... ... ... 67 68 65 100 100 ** 100 ** Brunei Darussalam
69 ** 70 ** 68 ** 89 89 90 15 15 16 Cambodia
... ... ... ... ... ... ... ... ... China (p)
... ... ... ... ... ... ... ... ... Cook Islands
... ... ... ... ... ... ... ... ... Democratic People’s Republic of Korea
81 **, -1 81 **, -1 80 **, -1 71 ** 71 ** 71 ** ... ... ... Fiji
... ... ... 63 * 65 * 60 * ... ... ... Hong Kong SAR of China
41 **, +1 42 **, +1 40 **, +1 42 ** 43 ** 41 ** 38 ** 38 ** 39 ** Indonesia (p)
... ... ... ... ... ... ... ... ... Japan (p)
... ... ... ... ... ... ... ... ... Kiribati
55 56 54 60 61 60 9 8 9 Lao People’s Democratic Republic
63 60 65 75 77 74 95 95 95 Macao, China
... ... ... ... ... ... 74 -1 71 -1 78 -1 Malaysia (p)
... ... ... ... ... ... ... ... ... Marshall Islands
... ... ... ... ... ... ... ... ... Micronesia (Federated States of)
77 ** ... ... 98 -2 97 -2 98 -2 ... ... ... Myanmar
... ... ... ... ... ... ... ... ... Nauru
... ... ... 100 ** 100 ** 100 ** ... ... ... New Zealand (p)
85 *, -1 ... ... ... ... ... ... ... ... Niue
... ... ... ... ... ... ... ... ... Palau
... ... ... ... ... ... ... ... ... Papua New Guinea
47 ** 48 ** 45 ** 50 ** 47 ** 53 ** 63 63 63 Philippines (p)
99 98 100 97 **, +1 96 **, +1 97 **, +1 ... ... ... Republic of Korea (p)
77 77 77 ... ... ... ... ... ... Samoa
... ... ... ... ... ... ... ... ... Singapore
... ... ... ... ... ... ... ... ... Solomon Islands
... ... ... ... ... ... ... ... ... Thailand (p)
... ... ... 67 68 66 ... ... ... Timor-Leste
... ... ... ... ... ... ... ... ... Tokelau
50 51 49 ... ... ... ... ... ... Tonga
... ... ... ... ... ... ... ... ... Tuvalu
... ... ... 56 -1 57 -1 55 -1 ... ... ... Vanuatu
80 ... ... ... ... ... ... ... ... Viet Nam
Latin America and the Caribbean
79 **, +1 ... ... 78 ** ... ... 100 100 100 Anguilla
... ... ... ... ... ... ... ... ... Antigua and Barbuda
... ... ... 91 -1 91 -1 90 -1 89 -1 89 -1 89 -1 Argentina (p)
88 * 89 * 86 * 83 ** 82 ** 84 ** 90 90 90 Aruba
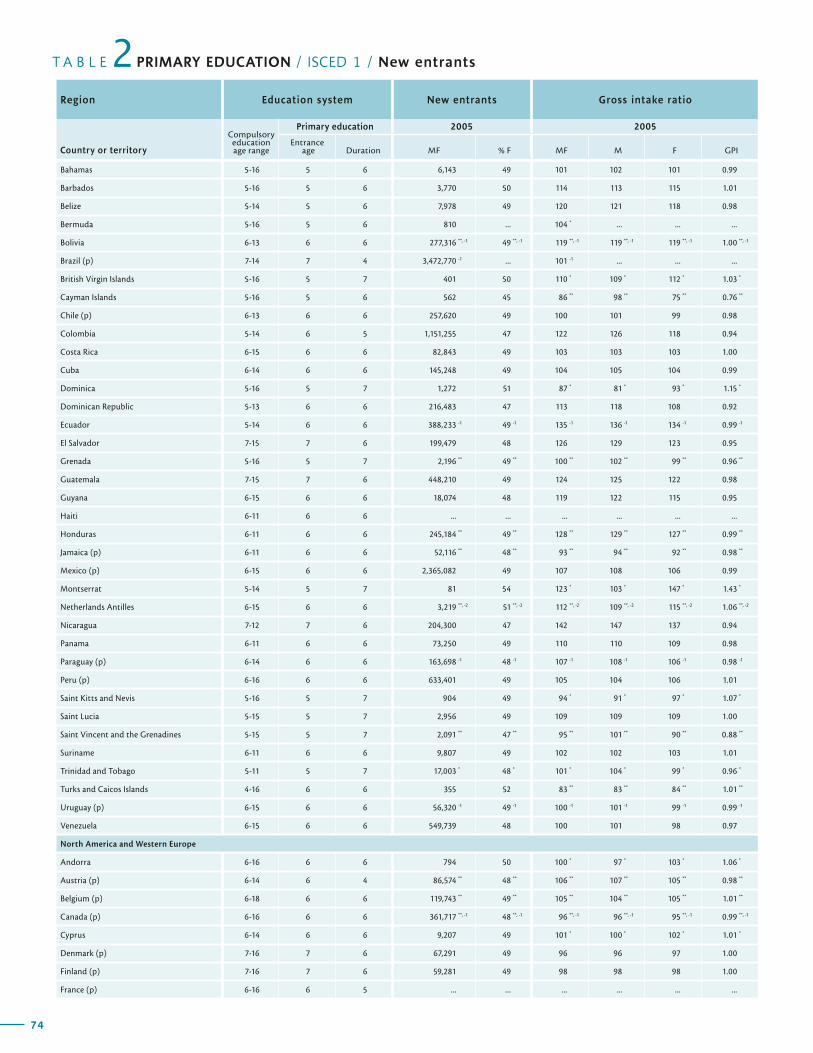
74
T A B L E PRIMARY EDUCATION / ISCED 1 / New entrants2Region Education system New entrants Gross intake ratio
Country or territory
Compulsory education age range
Primary education 2005 2005
Entrance age Duration MF % F MF M F GPI
75
G L O B A L E D U C A T I O N D I G E S T 2 0 0 7 C O M P A R I N G E D U C A T I O N S T A T I S T I C S A R O U N D T H E W O R L D
Net intake rateNew entrants to primary
education with ECCE experience (%)
Region
1999 2005 2005
Country or territoryMF M F MF M F MF M F
Bahamas 5-16 5 6 6,143 49 101 102 101 0.99
Barbados 5-16 5 6 3,770 50 114 113 115 1.01
Belize 5-14 5 6 7,978 49 120 121 118 0.98
Bermuda 5-16 5 6 810 ... 104 * ... ... ...
Bolivia 6-13 6 6 277,316 **, -1 49 **, -1 119 **, -1 119 **, -1 119 **, -1 1.00 **, -1
Brazil (p) 7-14 7 4 3,472,770 -1 ... 101 -1 ... ... ...
British Virgin Islands 5-16 5 7 401 50 110 * 109 * 112 * 1.03 *
Cayman Islands 5-16 5 6 562 45 86 ** 98 ** 75 ** 0.76 **
Chile (p) 6-13 6 6 257,620 49 100 101 99 0.98
Colombia 5-14 6 5 1,151,255 47 122 126 118 0.94
Costa Rica 6-15 6 6 82,843 49 103 103 103 1.00
Cuba 6-14 6 6 145,248 49 104 105 104 0.99
Dominica 5-16 5 7 1,272 51 87 * 81 * 93 * 1.15 *
Dominican Republic 5-13 6 6 216,483 47 113 118 108 0.92
Ecuador 5-14 6 6 388,233 -1 49 -1 135 -1 136 -1 134 -1 0.99 -1
El Salvador 7-15 7 6 199,479 48 126 129 123 0.95
Grenada 5-16 5 7 2,196 ** 49 ** 100 ** 102 ** 99 ** 0.96 **
Guatemala 7-15 7 6 448,210 49 124 125 122 0.98
Guyana 6-15 6 6 18,074 48 119 122 115 0.95
Haiti 6-11 6 6 ... ... ... ... ... ...
Honduras 6-11 6 6 245,184 ** 49 ** 128 ** 129 ** 127 ** 0.99 **
Jamaica (p) 6-11 6 6 52,116 ** 48 ** 93 ** 94 ** 92 ** 0.98 **
Mexico (p) 6-15 6 6 2,365,082 49 107 108 106 0.99
Montserrat 5-14 5 7 81 54 123 * 103 * 147 * 1.43 *
Netherlands Antilles 6-15 6 6 3,219 **, -2 51 **, -2 112 **, -2 109 **, -2 115 **, -2 1.06 **, -2
Nicaragua 7-12 7 6 204,300 47 142 147 137 0.94
Panama 6-11 6 6 73,250 49 110 110 109 0.98
Paraguay (p) 6-14 6 6 163,698 -1 48 -1 107 -1 108 -1 106 -1 0.98 -1
Peru (p) 6-16 6 6 633,401 49 105 104 106 1.01
Saint Kitts and Nevis 5-16 5 7 904 49 94 * 91 * 97 * 1.07 *
Saint Lucia 5-15 5 7 2,956 49 109 109 109 1.00
Saint Vincent and the Grenadines 5-15 5 7 2,091 ** 47 ** 95 ** 101 ** 90 ** 0.88 **
Suriname 6-11 6 6 9,807 49 102 102 103 1.01
Trinidad and Tobago 5-11 5 7 17,003 * 48 * 101 * 104 * 99 * 0.96 *
Turks and Caicos Islands 4-16 6 6 355 52 83 ** 83 ** 84 ** 1.01 **
Uruguay (p) 6-15 6 6 56,320 -1 49 -1 100 -1 101 -1 99 -1 0.99 -1
Venezuela 6-15 6 6 549,739 48 100 101 98 0.97
North America and Western Europe
Andorra 6-16 6 6 794 50 100 * 97 * 103 * 1.06 *
Austria (p) 6-14 6 4 86,574 ** 48 ** 106 ** 107 ** 105 ** 0.98 **
Belgium (p) 6-18 6 6 119,743 ** 49 ** 105 ** 104 ** 105 ** 1.01 **
Canada (p) 6-16 6 6 361,717 **, -1 48 **, -1 96 **, -1 96 **, -1 95 **, -1 0.99 **, -1
Cyprus 6-14 6 6 9,207 49 101 * 100 * 102 * 1.01 *
Denmark (p) 7-16 7 6 67,291 49 96 96 97 1.00
Finland (p) 7-16 7 6 59,281 49 98 98 98 1.00
France (p) 6-16 6 5 ... ... ... ... ... ...

74
T A B L E PRIMARY EDUCATION / ISCED 1 / New entrants2Region Education system New entrants Gross intake ratio
Country or territory
Compulsory education age range
Primary education 2005 2005
Entrance age Duration MF % F MF M F GPI
75
G L O B A L E D U C A T I O N D I G E S T 2 0 0 7 C O M P A R I N G E D U C A T I O N S T A T I S T I C S A R O U N D T H E W O R L D
Net intake rateNew entrants to primary
education with ECCE experience (%)
Region
1999 2005 2005
Country or territoryMF M F MF M F MF M F
84 85 83 69 68 71 ... ... ... Bahamas
85 ** 86 ** 85 ** 99 100 98 100 100 100 Barbados
79 ** 80 ** 77 ** 65 ** 66 ** 64 ** ... ... ... Belize
... ... ... ... ... ... ... ... ... Bermuda
69 ** 68 ** 69 ** 71 **, -1 71 **, -1 71 **, -1 63 -2 62 -2 63 -2 Bolivia
... ... ... ... ... ... ... ... ... Brazil (p)
73 ** 70 ** 76 ** 70 ** 66 ** 74 ** 97 99 96 British Virgin Islands
62 *, +1 56 **, +1 68 **, +1 48 ** 54 ** 43 ** 93 93 93 Cayman Islands
... ... ... ... ... ... ... ... ... Chile (p)
58 ** 60 ** 57 ** ... ... ... ... ... ... Colombia
... ... ... ... ... ... 87 86 88 Costa Rica
97 ** 100 ** 95 ** 100 100 99 99 99 100 Cuba
80 * 83 * 78 * 46 *, -1 46 *, -1 46 *, -1 100 -1 100 -1 100 -1 Dominica
60 60 60 75 75 76 ... ... ... Dominican Republic
84 83 84 85 ** 85 ** 85 ** 55 -1 54 -1 56 -1 Ecuador
35 **, -1 15 **, -1 56 **, -1 62 62 62 ... ... ... El Salvador
... ... ... 61 **, -2 60 **, -2 61 **, -2 ... ... ... Grenada
57 59 54 69 70 68 ... ... ... Guatemala
90 ** 88 ** 91 ** 99 **, -2 100 **, -2 98 **, -2 73 70 76 Guyana
... ... ... ... ... ... ... ... ... Haiti
49 +1 49 +1 49 +1 60 -1 59 -1 61 -1 ... ... ... Honduras
77 **, +1 75 **, +1 79 **, +1 75 ** 74 ** 76 ** ... ... ... Jamaica (p)
87 87 87 88 -1 88 -1 87 -1 ... ... ... Mexico (p)
... ... ... 56 ** 42 ** 73 ** 78 114 48 Montserrat
80 ** 75 ** 84 ** ... ... ... ... ... ... Netherlands Antilles
41 42 40 38 40 37 45 45 45 Nicaragua
84 ** 84 ** 84 ** 88 **, -1 87 **, -1 89 **, -1 67 66 68 Panama
... ... ... ... ... ... 75 -1 74 -1 76 -1 Paraguay (p)
79 79 80 76 75 76 58 58 57 Peru (p)
82 *, +1 79 *, +1 84 *, +1 66 **, -1 66 **, -1 67 **, -1 ... ... ... Saint Kitts and Nevis
69 ** 69 ** 68 ** 76 77 76 ... ... ... Saint Lucia
... ... ... 62 ** 66 ** 58 ** 100 ** 100 ** 100 ** Saint Vincent and the Grenadines
... ... ... 63 58 68 100 100 100 Suriname
69 69 70 68 *, -1 68 *, -1 68 *, -1 81 *, -1 80 *, -1 82 *, -1 Trinidad and Tobago
... ... ... 54 ** 57 ** 51 ** 100 101 100 Turks and Caicos Islands
... ... ... - -1 - -1 - -1 95 -1 95 -1 95 -1 Uruguay (p)
60 ** 60 ** 61 ** 60 60 60 ... ... ... Venezuela
North America and Western Europe
... ... ... 47 * 48 * 46 * ... ... ... Andorra
... ... ... ... ... ... ... ... ... Austria (p)
... ... ... ... ... ... ... ... ... Belgium (p)
... ... ... ... ... ... ... ... ... Canada (p)
... ... ... ... ... ... ... ... ... Cyprus
86 +1 85 +1 88 +1 72 68 76 ... ... ... Denmark (p)
... ... ... 93 ** 91 ** 95 ** ... ... ... Finland (p)
... ... ... ... ... ... ... ... ... France (p)
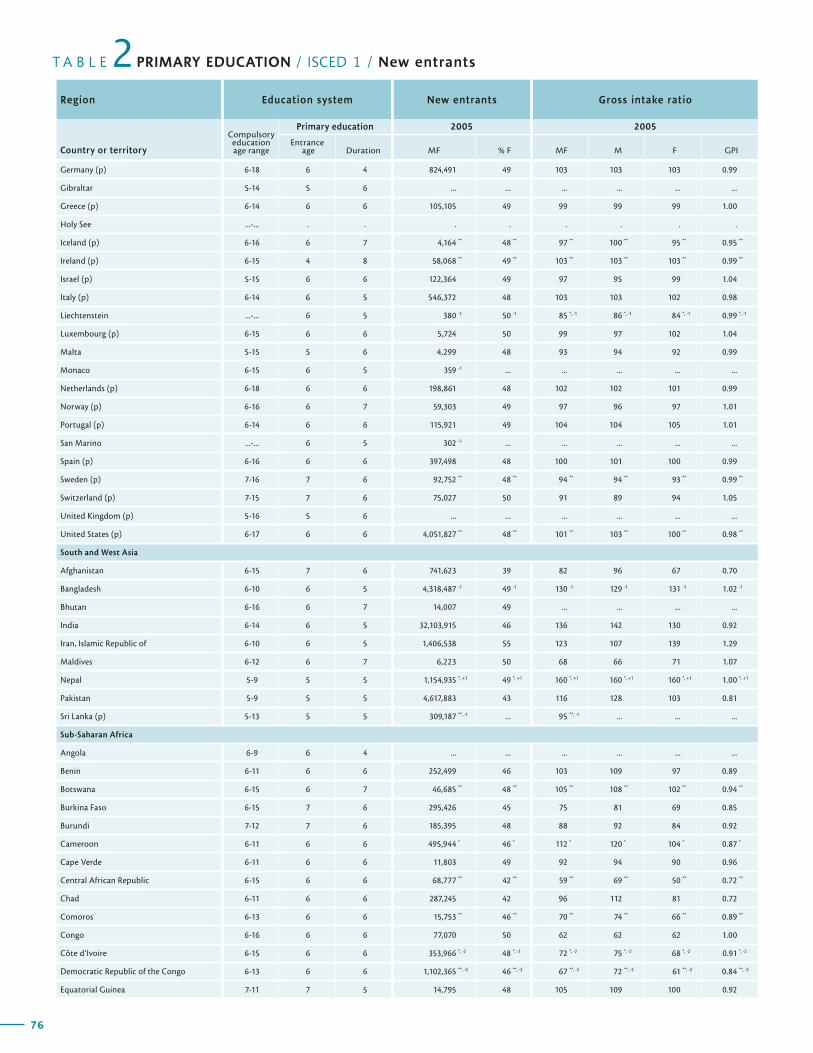
76
T A B L E PRIMARY EDUCATION / ISCED 1 / New entrants2Region Education system New entrants Gross intake ratio
Country or territory
Compulsory education age range
Primary education 2005 2005
Entrance age Duration MF % F MF M F GPI
77
G L O B A L E D U C A T I O N D I G E S T 2 0 0 7 C O M P A R I N G E D U C A T I O N S T A T I S T I C S A R O U N D T H E W O R L D
Net intake rateNew entrants to primary
education with ECCE experience (%)
Region
1999 2005 2005
Country or territoryMF M F MF M F MF M F
Germany (p) 6-18 6 4 824,491 49 103 103 103 0.99
Gibraltar 5-14 5 6 ... ... ... ... ... ...
Greece (p) 6-14 6 6 105,105 49 99 99 99 1.00
Holy See ...-... . . . . . . . .
Iceland (p) 6-16 6 7 4,164 ** 48 ** 97 ** 100 ** 95 ** 0.95 **
Ireland (p) 6-15 4 8 58,068 ** 49 ** 103 ** 103 ** 103 ** 0.99 **
Israel (p) 5-15 6 6 122,364 49 97 95 99 1.04
Italy (p) 6-14 6 5 546,372 48 103 103 102 0.98
Liechtenstein ...-... 6 5 380 -1 50 -1 85 *, -1 86 *, -1 84 *, -1 0.99 *, -1
Luxembourg (p) 6-15 6 6 5,724 50 99 97 102 1.04
Malta 5-15 5 6 4,299 48 93 94 92 0.99
Monaco 6-15 6 5 359 -1 ... ... ... ... ...
Netherlands (p) 6-18 6 6 198,861 48 102 102 101 0.99
Norway (p) 6-16 6 7 59,303 49 97 96 97 1.01
Portugal (p) 6-14 6 6 115,921 49 104 104 105 1.01
San Marino ...-... 6 5 302 -1 ... ... ... ... ...
Spain (p) 6-16 6 6 397,498 48 100 101 100 0.99
Sweden (p) 7-16 7 6 92,752 ** 48 ** 94 ** 94 ** 93 ** 0.99 **
Switzerland (p) 7-15 7 6 75,027 50 91 89 94 1.05
United Kingdom (p) 5-16 5 6 ... ... ... ... ... ...
United States (p) 6-17 6 6 4,051,827 ** 48 ** 101 ** 103 ** 100 ** 0.98 **
South and West Asia
Afghanistan 6-15 7 6 741,623 39 82 96 67 0.70
Bangladesh 6-10 6 5 4,318,487 -1 49 -1 130 -1 129 -1 131 -1 1.02 -1
Bhutan 6-16 6 7 14,007 49 ... ... ... ...
India 6-14 6 5 32,103,915 46 136 142 130 0.92
Iran, Islamic Republic of 6-10 6 5 1,406,538 55 123 107 139 1.29
Maldives 6-12 6 7 6,223 50 68 66 71 1.07
Nepal 5-9 5 5 1,154,935 *, +1 49 *, +1 160 *, +1 160 *, +1 160 *, +1 1.00 *, +1
Pakistan 5-9 5 5 4,617,883 43 116 128 103 0.81
Sri Lanka (p) 5-13 5 5 309,187 **, -1 ... 95 **, -1 ... ... ...
Sub-Saharan Africa
Angola 6-9 6 4 ... ... ... ... ... ...
Benin 6-11 6 6 252,499 46 103 109 97 0.89
Botswana 6-15 6 7 46,685 ** 48 ** 105 ** 108 ** 102 ** 0.94 **
Burkina Faso 6-15 7 6 295,426 45 75 81 69 0.85
Burundi 7-12 7 6 185,395 48 88 92 84 0.92
Cameroon 6-11 6 6 495,944 * 46 * 112 * 120 * 104 * 0.87 *
Cape Verde 6-11 6 6 11,803 49 92 94 90 0.96
Central African Republic 6-15 6 6 68,777 ** 42 ** 59 ** 69 ** 50 ** 0.72 **
Chad 6-11 6 6 287,245 42 96 112 81 0.72
Comoros 6-13 6 6 15,753 ** 46 ** 70 ** 74 ** 66 ** 0.89 **
Congo 6-16 6 6 77,070 50 62 62 62 1.00
Côte d’Ivoire 6-15 6 6 353,966 *, -2 48 *, -2 72 *, -2 75 *, -2 68 *, -2 0.91 *, -2
Democratic Republic of the Congo 6-13 6 6 1,102,365 **, -2 46 **, -2 67 **, -2 72 **, -2 61 **, -2 0.84 **, -2
Equatorial Guinea 7-11 7 5 14,795 48 105 109 100 0.92
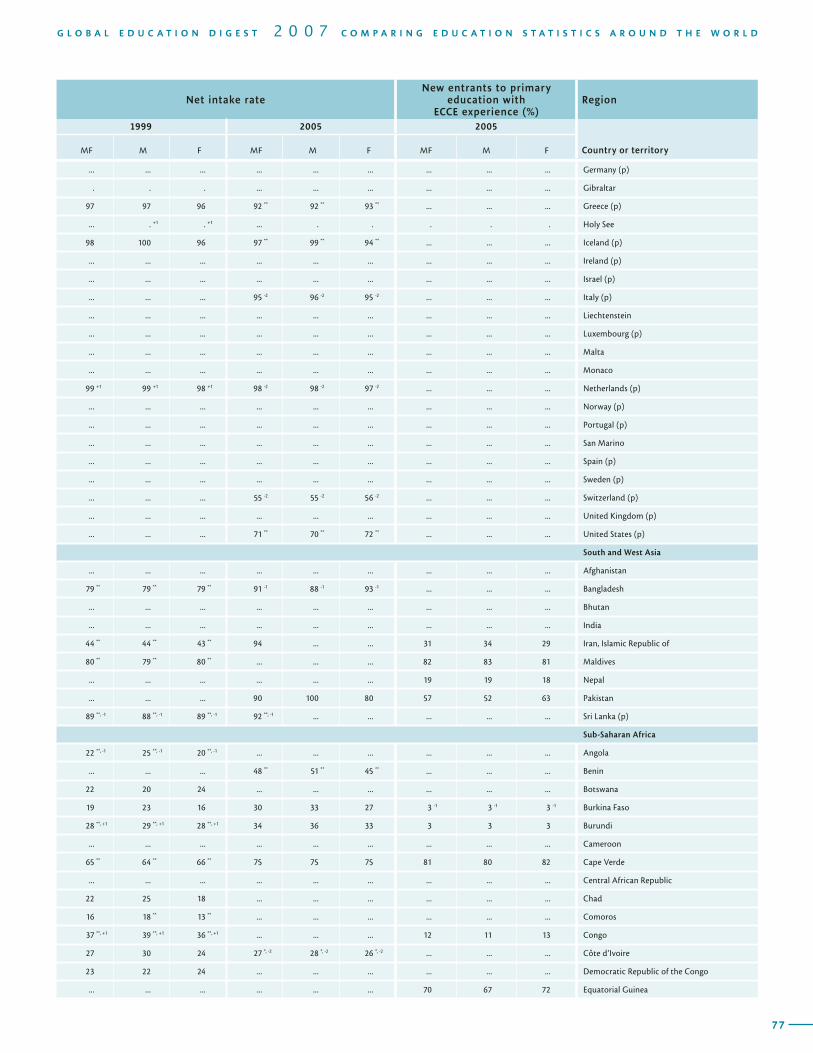
76
T A B L E PRIMARY EDUCATION / ISCED 1 / New entrants2Region Education system New entrants Gross intake ratio
Country or territory
Compulsory education age range
Primary education 2005 2005
Entrance age Duration MF % F MF M F GPI
77
G L O B A L E D U C A T I O N D I G E S T 2 0 0 7 C O M P A R I N G E D U C A T I O N S T A T I S T I C S A R O U N D T H E W O R L D
Net intake rateNew entrants to primary
education with ECCE experience (%)
Region
1999 2005 2005
Country or territoryMF M F MF M F MF M F
... ... ... ... ... ... ... ... ... Germany (p)
. . . ... ... ... ... ... ... Gibraltar
97 97 96 92 ** 92 ** 93 ** ... ... ... Greece (p)
... . +1 . +1 ... . . . . . Holy See
98 100 96 97 ** 99 ** 94 ** ... ... ... Iceland (p)
... ... ... ... ... ... ... ... ... Ireland (p)
... ... ... ... ... ... ... ... ... Israel (p)
... ... ... 95 -2 96 -2 95 -2 ... ... ... Italy (p)
... ... ... ... ... ... ... ... ... Liechtenstein
... ... ... ... ... ... ... ... ... Luxembourg (p)
... ... ... ... ... ... ... ... ... Malta
... ... ... ... ... ... ... ... ... Monaco
99 +1 99 +1 98 +1 98 -2 98 -2 97 -2 ... ... ... Netherlands (p)
... ... ... ... ... ... ... ... ... Norway (p)
... ... ... ... ... ... ... ... ... Portugal (p)
... ... ... ... ... ... ... ... ... San Marino
... ... ... ... ... ... ... ... ... Spain (p)
... ... ... ... ... ... ... ... ... Sweden (p)
... ... ... 55 -2 55 -2 56 -2 ... ... ... Switzerland (p)
... ... ... ... ... ... ... ... ... United Kingdom (p)
... ... ... 71 ** 70 ** 72 ** ... ... ... United States (p)
South and West Asia
... ... ... ... ... ... ... ... ... Afghanistan
79 ** 79 ** 79 ** 91 -1 88 -1 93 -1 ... ... ... Bangladesh
... ... ... ... ... ... ... ... ... Bhutan
... ... ... ... ... ... ... ... ... India
44 ** 44 ** 43 ** 94 ... ... 31 34 29 Iran, Islamic Republic of
80 ** 79 ** 80 ** ... ... ... 82 83 81 Maldives
... ... ... ... ... ... 19 19 18 Nepal
... ... ... 90 100 80 57 52 63 Pakistan
89 **, -1 88 **, -1 89 **, -1 92 **, -1 ... ... ... ... ... Sri Lanka (p)
Sub-Saharan Africa
22 **, -1 25 **, -1 20 **, -1 ... ... ... ... ... ... Angola
... ... ... 48 ** 51 ** 45 ** ... ... ... Benin
22 20 24 ... ... ... ... ... ... Botswana
19 23 16 30 33 27 3 -1 3 -1 3 -1 Burkina Faso
28 **, +1 29 **, +1 28 **, +1 34 36 33 3 3 3 Burundi
... ... ... ... ... ... ... ... ... Cameroon
65 ** 64 ** 66 ** 75 75 75 81 80 82 Cape Verde
... ... ... ... ... ... ... ... ... Central African Republic
22 25 18 ... ... ... ... ... ... Chad
16 18 ** 13 ** ... ... ... ... ... ... Comoros
37 **, +1 39 **, +1 36 **, +1 ... ... ... 12 11 13 Congo
27 30 24 27 *, -2 28 *, -2 26 *, -2 ... ... ... Côte d’Ivoire
23 22 24 ... ... ... ... ... ... Democratic Republic of the Congo
... ... ... ... ... ... 70 67 72 Equatorial Guinea
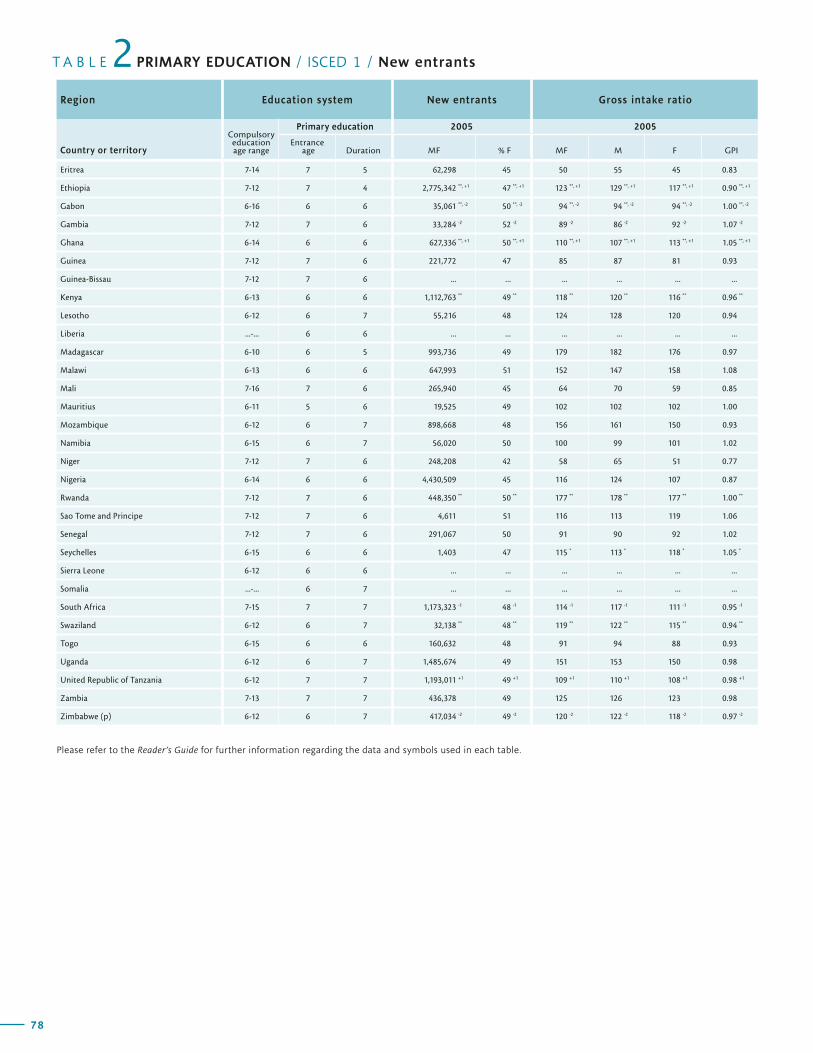
78
T A B L E PRIMARY EDUCATION / ISCED 1 / New entrants2Region Education system New entrants Gross intake ratio
Country or territory
Compulsory education age range
Primary education 2005 2005
Entrance age Duration MF % F MF M F GPI
79
G L O B A L E D U C A T I O N D I G E S T 2 0 0 7 C O M P A R I N G E D U C A T I O N S T A T I S T I C S A R O U N D T H E W O R L D
Net intake rateNew entrants to primary
education with ECCE experience (%)
Region
1999 2005 2005
Country or territoryMF M F MF M F MF M F
Eritrea 7-14 7 5 62,298 45 50 55 45 0.83
Ethiopia 7-12 7 4 2,775,342 **, +1 47 **, +1 123 **, +1 129 **, +1 117 **, +1 0.90 **, +1
Gabon 6-16 6 6 35,061 **, -2 50 **, -2 94 **, -2 94 **, -2 94 **, -2 1.00 **, -2
Gambia 7-12 7 6 33,284 -2 52 -2 89 -2 86 -2 92 -2 1.07 -2
Ghana 6-14 6 6 627,336 **, +1 50 **, +1 110 **, +1 107 **, +1 113 **, +1 1.05 **, +1
Guinea 7-12 7 6 221,772 47 85 87 81 0.93
Guinea-Bissau 7-12 7 6 ... ... ... ... ... ...
Kenya 6-13 6 6 1,112,763 ** 49 ** 118 ** 120 ** 116 ** 0.96 **
Lesotho 6-12 6 7 55,216 48 124 128 120 0.94
Liberia ...-... 6 6 ... ... ... ... ... ...
Madagascar 6-10 6 5 993,736 49 179 182 176 0.97
Malawi 6-13 6 6 647,993 51 152 147 158 1.08
Mali 7-16 7 6 265,940 45 64 70 59 0.85
Mauritius 6-11 5 6 19,525 49 102 102 102 1.00
Mozambique 6-12 6 7 898,668 48 156 161 150 0.93
Namibia 6-15 6 7 56,020 50 100 99 101 1.02
Niger 7-12 7 6 248,208 42 58 65 51 0.77
Nigeria 6-14 6 6 4,430,509 45 116 124 107 0.87
Rwanda 7-12 7 6 448,350 ** 50 ** 177 ** 178 ** 177 ** 1.00 **
Sao Tome and Principe 7-12 7 6 4,611 51 116 113 119 1.06
Senegal 7-12 7 6 291,067 50 91 90 92 1.02
Seychelles 6-15 6 6 1,403 47 115 * 113 * 118 * 1.05 *
Sierra Leone 6-12 6 6 ... ... ... ... ... ...
Somalia ...-... 6 7 ... ... ... ... ... ...
South Africa 7-15 7 7 1,173,323 -1 48 -1 114 -1 117 -1 111 -1 0.95 -1
Swaziland 6-12 6 7 32,138 ** 48 ** 119 ** 122 ** 115 ** 0.94 **
Togo 6-15 6 6 160,632 48 91 94 88 0.93
Uganda 6-12 6 7 1,485,674 49 151 153 150 0.98
United Republic of Tanzania 6-12 7 7 1,193,011 +1 49 +1 109 +1 110 +1 108 +1 0.98 +1
Zambia 7-13 7 7 436,378 49 125 126 123 0.98
Zimbabwe (p) 6-12 6 7 417,034 -2 49 -2 120 -2 122 -2 118 -2 0.97 -2
Please refer to the Reader’s Guide for further information regarding the data and symbols used in each table.
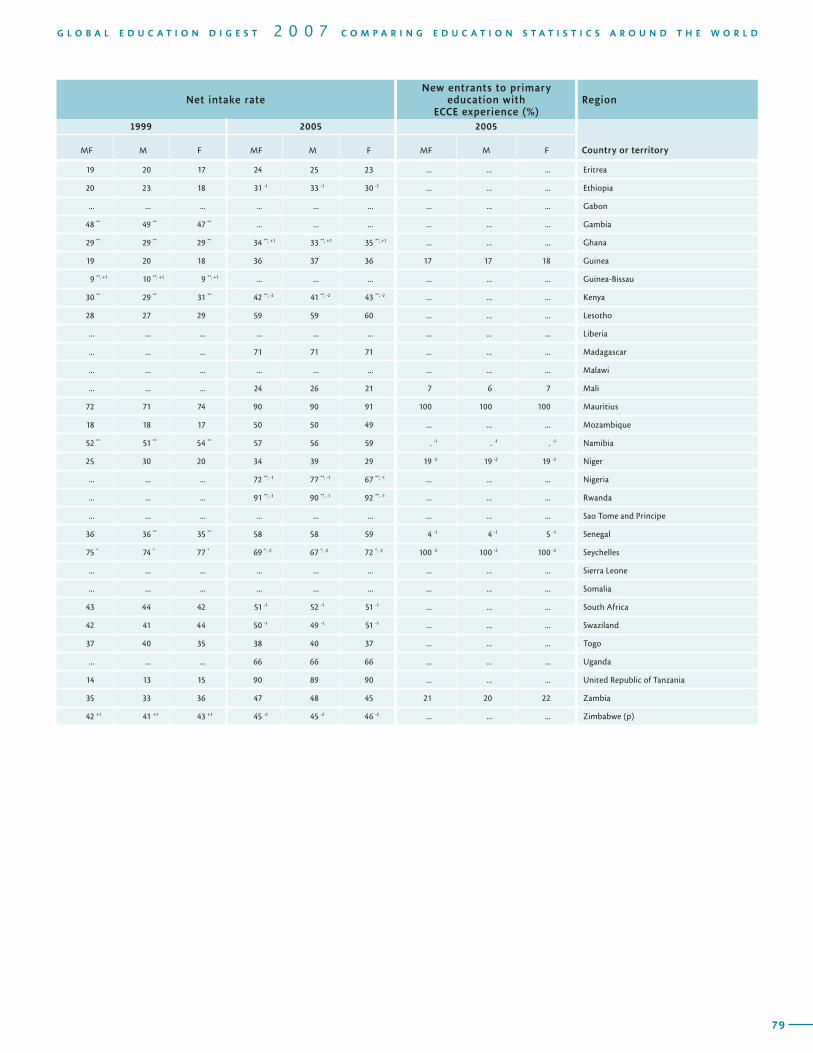
78
T A B L E PRIMARY EDUCATION / ISCED 1 / New entrants2Region Education system New entrants Gross intake ratio
Country or territory
Compulsory education age range
Primary education 2005 2005
Entrance age Duration MF % F MF M F GPI
79
G L O B A L E D U C A T I O N D I G E S T 2 0 0 7 C O M P A R I N G E D U C A T I O N S T A T I S T I C S A R O U N D T H E W O R L D
Net intake rateNew entrants to primary
education with ECCE experience (%)
Region
1999 2005 2005
Country or territoryMF M F MF M F MF M F
19 20 17 24 25 23 ... ... ... Eritrea
20 23 18 31 -1 33 -1 30 -1 ... ... ... Ethiopia
... ... ... ... ... ... ... ... ... Gabon
48 ** 49 ** 47 ** ... ... ... ... ... ... Gambia
29 ** 29 ** 29 ** 34 **, +1 33 **, +1 35 **, +1 ... ... ... Ghana
19 20 18 36 37 36 17 17 18 Guinea
9 **, +1 10 **, +1 9 **, +1 ... ... ... ... ... ... Guinea-Bissau
30 ** 29 ** 31 ** 42 **, -2 41 **, -2 43 **, -2 ... ... ... Kenya
28 27 29 59 59 60 ... ... ... Lesotho
... ... ... ... ... ... ... ... ... Liberia
... ... ... 71 71 71 ... ... ... Madagascar
... ... ... ... ... ... ... ... ... Malawi
... ... ... 24 26 21 7 6 7 Mali
72 71 74 90 90 91 100 100 100 Mauritius
18 18 17 50 50 49 ... ... ... Mozambique
52 ** 51 ** 54 ** 57 56 59 . -1 . -1 . -1 Namibia
25 30 20 34 39 29 19 -2 19 -2 19 -2 Niger
... ... ... 72 **, -1 77 **, -1 67 **, -1 ... ... ... Nigeria
... ... ... 91 **, -1 90 **, -1 92 **, -1 ... ... ... Rwanda
... ... ... ... ... ... ... ... ... Sao Tome and Principe
36 36 ** 35 ** 58 58 59 4 -1 4 -1 5 -1 Senegal
75 * 74 * 77 * 69 *, -2 67 *, -2 72 *, -2 100 -2 100 -2 100 -2 Seychelles
... ... ... ... ... ... ... ... ... Sierra Leone
... ... ... ... ... ... ... ... ... Somalia
43 44 42 51 -1 52 -1 51 -1 ... ... ... South Africa
42 41 44 50 -1 49 -1 51 -1 ... ... ... Swaziland
37 40 35 38 40 37 ... ... ... Togo
... ... ... 66 66 66 ... ... ... Uganda
14 13 15 90 89 90 ... ... ... United Republic of Tanzania
35 33 36 47 48 45 21 20 22 Zambia
42 +1 41 +1 43 +1 45 -2 45 -2 46 -2 ... ... ... Zimbabwe (p)

80
Region Enrolment Gross enrolment ratio
Country or territory
2005 1999 2005
MF % F % Private MF M F GPI MF M F GPI
T A B L E PRIMARY EDUCATION / ISCED 1 / Enrolment and teaching staff3
81
G L O B A L E D U C A T I O N D I G E S T 2 0 0 7 C O M P A R I N G E D U C A T I O N S T A T I S T I C S A R O U N D T H E W O R L D
Region Enrolment Gross enrolment ratio
Country or territory
2005 1999 2005
MF % F % Private MF M F GPI MF M F GPI
Net enrolment rate Teaching staffTrained teachers
(%)
Pupil/teacher
ratioRegion
1999 2005 2005 20052005
Country or territoryMF M F GPI MF M F GPI MF % F MF M F
Arab States
Algeria 4,361,744 47 - 105 110 100 0.91 112 116 107 0.93
Bahrain 83,299 49 24 105 105 105 1.01 104 105 104 0.99
Djibouti 50,651 45 15 35 40 29 0.71 40 44 36 0.82
Egypt 9,563,627 47 7 101 ** 106 ** 97 ** 0.91 ** 101 104 97 0.94
Iraq 4,430,267 ** 44 ** . ** 92 101 83 0.82 98 ** 108 ** 89 ** 0.83 **
Jordan 804,904 49 30 99 99 99 1.00 96 95 96 1.01
Kuwait 202,826 48 33 100 99 101 1.01 98 99 97 0.98
Lebanon 452,607 48 66 115 117 112 0.95 106 108 105 0.97
Libyan Arab Jamahiriya 710,198 +1 49 +1 ... 114 115 113 0.98 106 +1 106 +1 105 +1 0.99 +1
Mauritania 443,615 50 8 87 89 84 0.94 93 93 94 1.01
Morocco 4,022,600 46 7 87 96 78 0.81 105 111 99 0.89
Oman 287,938 +1 49 +1 5 +1 91 92 89 0.97 82 +1 81 +1 82 +1 1.01 +1
Palestinian Autonomous Territories 387,138 49 9 106 106 107 1.01 89 89 88 0.99
Qatar 69,991 49 45 105 107 103 0.96 106 106 106 0.99
Saudi Arabia 3,263,648 49 7 ... ... ... ... 91 91 91 1.00
Sudan 3,278,090 46 5 51 ** 55 ** 47 ** 0.85 ** 60 65 56 0.87
Syrian Arab Republic 2,252,145 48 4 102 107 98 0.92 124 127 121 0.95
Tunisia 1,184,301 48 1 114 117 111 0.95 109 111 108 0.97
United Arab Emirates 262,807 48 61 90 91 89 0.97 83 85 82 0.97
Yemen 3,219,554 42 2 73 93 52 0.56 89 101 75 0.74
Central and Eastern Europe
Albania 250,487 -1 48 -1 4 -1 110 111 109 0.98 106 -1 106 -1 105 -1 0.99 -1
Belarus 379,577 48 - 109 110 108 0.98 101 103 100 0.97
Bosnia and Herzegovina ... ... ... ... ... ... ... ... ... ... ...
Bulgaria 314,221 -1 48 -1 - -1 106 107 104 0.97 105 -1 106 -1 104 -1 0.98 -1
Croatia 192,004 -2 49 -2 - -2 92 93 92 0.98 94 -2 95 -2 94 -2 0.99 -2
Czech Republic 502,831 48 1 104 104 103 0.99 101 102 100 0.98
Estonia 85,539 48 2 102 104 100 0.97 100 102 99 0.97
Hungary 430,561 48 6 102 102 101 0.98 98 99 97 0.98
Latvia 92,453 -1 48 -1 1 -1 99 100 98 0.98 93 -1 94 -1 91 -1 0.97 -1
Lithuania 170,216 -1 49 -1 - -1 103 104 102 0.98 97 -1 98 -1 97 -1 0.99 -1
Poland 2,723,661 49 2 98 99 97 0.98 98 98 98 0.99
Republic of Moldova 184,159 48 1 95 * 95 * 95 * 1.00 * 92 * 93 * 92 * 0.99 *
Romania 969,185 48 - 105 105 104 0.98 107 108 106 0.99
Russian Federation 5,308,605 49 - 100 100 99 0.99 129 129 128 1.00
Serbia and Montenegro ... ... ... 104 * 105 * 103 * 0.99 * ... ... ... ...
Slovakia 242,459 48 5 103 103 102 0.99 99 99 98 0.99
Slovenia 93,156 48 - 101 102 100 0.99 101 102 100 0.99
The Former Yugoslav Rep. of Macedonia 110,149 48 . 101 102 100 0.98 98 98 98 1.00
Turkey 7,947,603 ** 48 ** 2 ** 96 **, +1 101 **, +1 91 **, +1 0.91 **, +1 93 ** 96 ** 91 ** 0.95 **
Ukraine 1,945,715 49 1 105 106 105 0.99 107 107 107 1.00
Central Asia
Armenia 125,149 48 1 92 **, +1 92 **, +1 92 **, +1 1.00 **, +1 94 92 96 1.04
Azerbaijan 568,097 48 - 94 94 94 1.00 96 97 95 0.98
Georgia 337,071 48 3 98 98 98 1.00 94 93 94 1.01
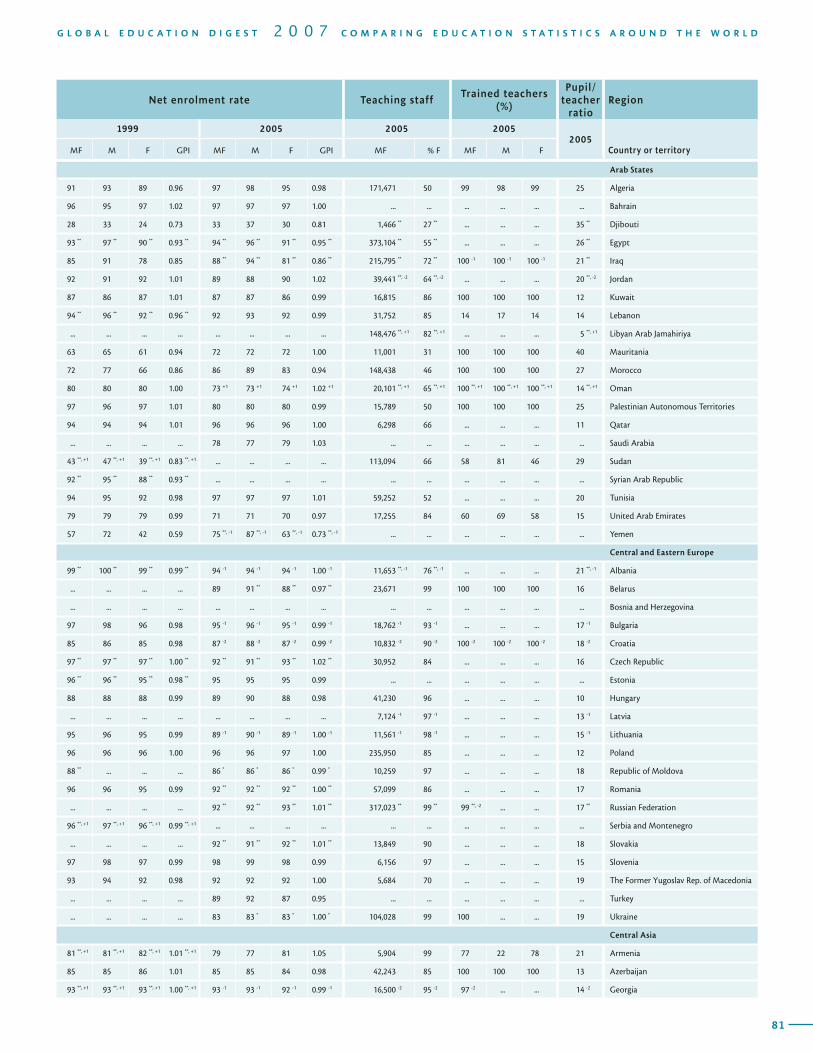
80
Region Enrolment Gross enrolment ratio
Country or territory
2005 1999 2005
MF % F % Private MF M F GPI MF M F GPI
T A B L E PRIMARY EDUCATION / ISCED 1 / Enrolment and teaching staff3
81
G L O B A L E D U C A T I O N D I G E S T 2 0 0 7 C O M P A R I N G E D U C A T I O N S T A T I S T I C S A R O U N D T H E W O R L D
Region Enrolment Gross enrolment ratio
Country or territory
2005 1999 2005
MF % F % Private MF M F GPI MF M F GPI
Net enrolment rate Teaching staffTrained teachers
(%)
Pupil/teacher
ratioRegion
1999 2005 2005 20052005
Country or territoryMF M F GPI MF M F GPI MF % F MF M F
Arab States
91 93 89 0.96 97 98 95 0.98 171,471 50 99 98 99 25 Algeria
96 95 97 1.02 97 97 97 1.00 ... ... ... ... ... ... Bahrain
28 33 24 0.73 33 37 30 0.81 1,466 ** 27 ** ... ... ... 35 ** Djibouti
93 ** 97 ** 90 ** 0.93 ** 94 ** 96 ** 91 ** 0.95 ** 373,104 ** 55 ** ... ... ... 26 ** Egypt
85 91 78 0.85 88 ** 94 ** 81 ** 0.86 ** 215,795 ** 72 ** 100 -1 100 -1 100 -1 21 ** Iraq
92 91 92 1.01 89 88 90 1.02 39,441 **, -2 64 **, -2 ... ... ... 20 **, -2 Jordan
87 86 87 1.01 87 87 86 0.99 16,815 86 100 100 100 12 Kuwait
94 ** 96 ** 92 ** 0.96 ** 92 93 92 0.99 31,752 85 14 17 14 14 Lebanon
... ... ... ... ... ... ... ... 148,476 **, +1 82 **, +1 ... ... ... 5 **, +1 Libyan Arab Jamahiriya
63 65 61 0.94 72 72 72 1.00 11,001 31 100 100 100 40 Mauritania
72 77 66 0.86 86 89 83 0.94 148,438 46 100 100 100 27 Morocco
80 80 80 1.00 73 +1 73 +1 74 +1 1.02 +1 20,101 **, +1 65 **, +1 100 **, +1 100 **, +1 100 **, +1 14 **, +1 Oman
97 96 97 1.01 80 80 80 0.99 15,789 50 100 100 100 25 Palestinian Autonomous Territories
94 94 94 1.01 96 96 96 1.00 6,298 66 ... ... ... 11 Qatar
... ... ... ... 78 77 79 1.03 ... ... ... ... ... ... Saudi Arabia
43 **, +1 47 **, +1 39 **, +1 0.83 **, +1 ... ... ... ... 113,094 66 58 81 46 29 Sudan
92 ** 95 ** 88 ** 0.93 ** ... ... ... ... ... ... ... ... ... ... Syrian Arab Republic
94 95 92 0.98 97 97 97 1.01 59,252 52 ... ... ... 20 Tunisia
79 79 79 0.99 71 71 70 0.97 17,255 84 60 69 58 15 United Arab Emirates
57 72 42 0.59 75 **, -1 87 **, -1 63 **, -1 0.73 **, -1 ... ... ... ... ... ... Yemen
Central and Eastern Europe
99 ** 100 ** 99 ** 0.99 ** 94 -1 94 -1 94 -1 1.00 -1 11,653 **, -1 76 **, -1 ... ... ... 21 **, -1 Albania
... ... ... ... 89 91 ** 88 ** 0.97 ** 23,671 99 100 100 100 16 Belarus
... ... ... ... ... ... ... ... ... ... ... ... ... ... Bosnia and Herzegovina
97 98 96 0.98 95 -1 96 -1 95 -1 0.99 -1 18,762 -1 93 -1 ... ... ... 17 -1 Bulgaria
85 86 85 0.98 87 -2 88 -2 87 -2 0.99 -2 10,832 -2 90 -2 100 -2 100 -2 100 -2 18 -2 Croatia
97 ** 97 ** 97 ** 1.00 ** 92 ** 91 ** 93 ** 1.02 ** 30,952 84 ... ... ... 16 Czech Republic
96 ** 96 ** 95 ** 0.98 ** 95 95 95 0.99 ... ... ... ... ... ... Estonia
88 88 88 0.99 89 90 88 0.98 41,230 96 ... ... ... 10 Hungary
... ... ... ... ... ... ... ... 7,124 -1 97 -1 ... ... ... 13 -1 Latvia
95 96 95 0.99 89 -1 90 -1 89 -1 1.00 -1 11,561 -1 98 -1 ... ... ... 15 -1 Lithuania
96 96 96 1.00 96 96 97 1.00 235,950 85 ... ... ... 12 Poland
88 ** ... ... ... 86 * 86 * 86 * 0.99 * 10,259 97 ... ... ... 18 Republic of Moldova
96 96 95 0.99 92 ** 92 ** 92 ** 1.00 ** 57,099 86 ... ... ... 17 Romania
... ... ... ... 92 ** 92 ** 93 ** 1.01 ** 317,023 ** 99 ** 99 **, -2 ... ... 17 ** Russian Federation
96 **, +1 97 **, +1 96 **, +1 0.99 **, +1 ... ... ... ... ... ... ... ... ... ... Serbia and Montenegro
... ... ... ... 92 ** 91 ** 92 ** 1.01 ** 13,849 90 ... ... ... 18 Slovakia
97 98 97 0.99 98 99 98 0.99 6,156 97 ... ... ... 15 Slovenia
93 94 92 0.98 92 92 92 1.00 5,684 70 ... ... ... 19 The Former Yugoslav Rep. of Macedonia
... ... ... ... 89 92 87 0.95 ... ... ... ... ... ... Turkey
... ... ... ... 83 83 * 83 * 1.00 * 104,028 99 100 ... ... 19 Ukraine
Central Asia
81 **, +1 81 **, +1 82 **, +1 1.01 **, +1 79 77 81 1.05 5,904 99 77 22 78 21 Armenia
85 85 86 1.01 85 85 84 0.98 42,243 85 100 100 100 13 Azerbaijan
93 **, +1 93 **, +1 93 **, +1 1.00 **, +1 93 -1 93 -1 92 -1 0.99 -1 16,500 -2 95 -2 97 -2 ... ... 14 -2 Georgia
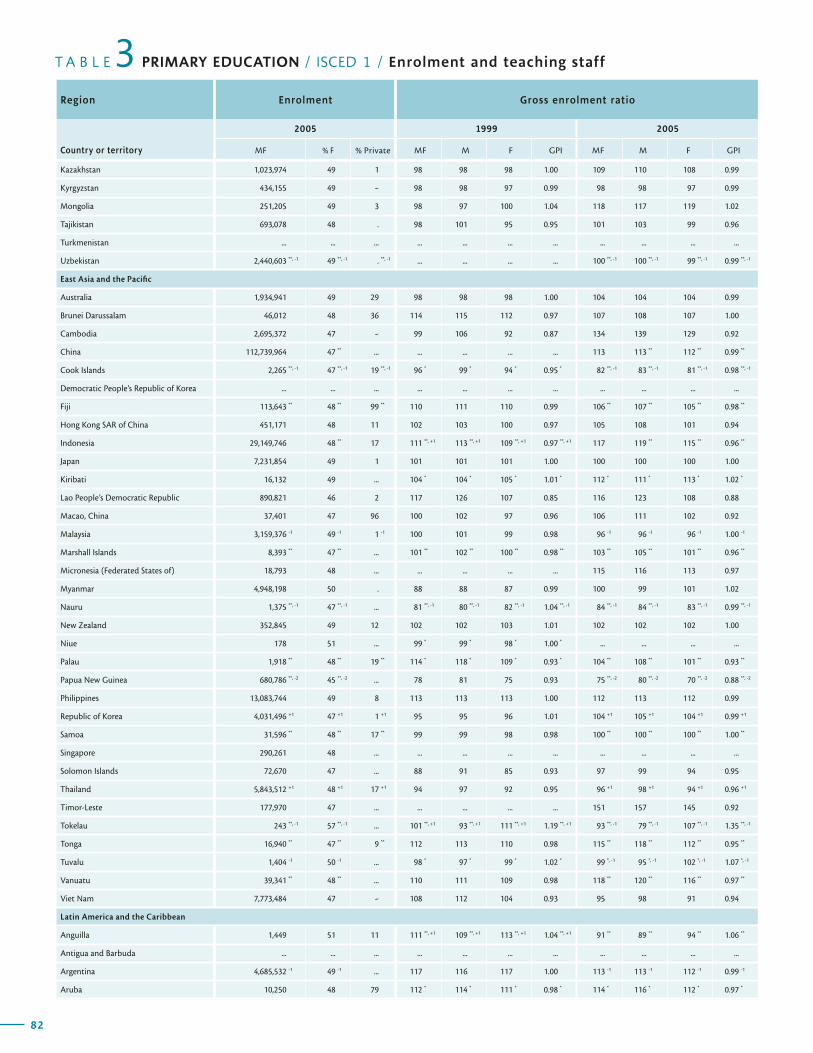
82
Region Enrolment Gross enrolment ratio
Country or territory
2005 1999 2005
MF % F % Private MF M F GPI MF M F GPI
T A B L E PRIMARY EDUCATION / ISCED 1 / Enrolment and teaching staff3
83
G L O B A L E D U C A T I O N D I G E S T 2 0 0 7 C O M P A R I N G E D U C A T I O N S T A T I S T I C S A R O U N D T H E W O R L D
Region Enrolment Gross enrolment ratio
Country or territory
2005 1999 2005
MF % F % Private MF M F GPI MF M F GPI
Net enrolment rate Teaching staffTrained teachers
(%)
Pupil/teacher
ratioRegion
1999 2005 2005 20052005
Country or territoryMF M F GPI MF M F GPI MF % F MF M F
Kazakhstan 1,023,974 49 1 98 98 98 1.00 109 110 108 0.99
Kyrgyzstan 434,155 49 - 98 98 97 0.99 98 98 97 0.99
Mongolia 251,205 49 3 98 97 100 1.04 118 117 119 1.02
Tajikistan 693,078 48 . 98 101 95 0.95 101 103 99 0.96
Turkmenistan ... ... ... ... ... ... ... ... ... ... ...
Uzbekistan 2,440,603 **, -1 49 **, -1 . **, -1 ... ... ... ... 100 **, -1 100 **, -1 99 **, -1 0.99 **, -1
East Asia and the Pacific
Australia 1,934,941 49 29 98 98 98 1.00 104 104 104 0.99
Brunei Darussalam 46,012 48 36 114 115 112 0.97 107 108 107 1.00
Cambodia 2,695,372 47 - 99 106 92 0.87 134 139 129 0.92
China 112,739,964 47 ** ... ... ... ... ... 113 113 ** 112 ** 0.99 **
Cook Islands 2,265 **, -1 47 **, -1 19 **, -1 96 * 99 * 94 * 0.95 * 82 **, -1 83 **, -1 81 **, -1 0.98 **, -1
Democratic People’s Republic of Korea ... ... ... ... ... ... ... ... ... ... ...
Fiji 113,643 ** 48 ** 99 ** 110 111 110 0.99 106 ** 107 ** 105 ** 0.98 **
Hong Kong SAR of China 451,171 48 11 102 103 100 0.97 105 108 101 0.94
Indonesia 29,149,746 48 ** 17 111 **, +1 113 **, +1 109 **, +1 0.97 **, +1 117 119 ** 115 ** 0.96 **
Japan 7,231,854 49 1 101 101 101 1.00 100 100 100 1.00
Kiribati 16,132 49 ... 104 * 104 * 105 * 1.01 * 112 * 111 * 113 * 1.02 *
Lao People’s Democratic Republic 890,821 46 2 117 126 107 0.85 116 123 108 0.88
Macao, China 37,401 47 96 100 102 97 0.96 106 111 102 0.92
Malaysia 3,159,376 -1 49 -1 1 -1 100 101 99 0.98 96 -1 96 -1 96 -1 1.00 -1
Marshall Islands 8,393 ** 47 ** ... 101 ** 102 ** 100 ** 0.98 ** 103 ** 105 ** 101 ** 0.96 **
Micronesia (Federated States of) 18,793 48 ... ... ... ... ... 115 116 113 0.97
Myanmar 4,948,198 50 . 88 88 87 0.99 100 99 101 1.02
Nauru 1,375 **, -1 47 **, -1 ... 81 **, -1 80 **, -1 82 **, -1 1.04 **, -1 84 **, -1 84 **, -1 83 **, -1 0.99 **, -1
New Zealand 352,845 49 12 102 102 103 1.01 102 102 102 1.00
Niue 178 51 ... 99 * 99 * 98 * 1.00 * ... ... ... ...
Palau 1,918 ** 48 ** 19 ** 114 * 118 * 109 * 0.93 * 104 ** 108 ** 101 ** 0.93 **
Papua New Guinea 680,786 **, -2 45 **, -2 ... 78 81 75 0.93 75 **, -2 80 **, -2 70 **, -2 0.88 **, -2
Philippines 13,083,744 49 8 113 113 113 1.00 112 113 112 0.99
Republic of Korea 4,031,496 +1 47 +1 1 +1 95 95 96 1.01 104 +1 105 +1 104 +1 0.99 +1
Samoa 31,596 ** 48 ** 17 ** 99 99 98 0.98 100 ** 100 ** 100 ** 1.00 **
Singapore 290,261 48 ... ... ... ... ... ... ... ... ...
Solomon Islands 72,670 47 ... 88 91 85 0.93 97 99 94 0.95
Thailand 5,843,512 +1 48 +1 17 +1 94 97 92 0.95 96 +1 98 +1 94 +1 0.96 +1
Timor-Leste 177,970 47 ... ... ... ... ... 151 157 145 0.92
Tokelau 243 **, -1 57 **, -1 ... 101 **, +1 93 **, +1 111 **, +1 1.19 **, +1 93 **, -1 79 **, -1 107 **, -1 1.35 **, -1
Tonga 16,940 ** 47 ** 9 ** 112 113 110 0.98 115 ** 118 ** 112 ** 0.95 **
Tuvalu 1,404 -1 50 -1 ... 98 * 97 * 99 * 1.02 * 99 *, -1 95 *, -1 102 *, -1 1.07 *, -1
Vanuatu 39,341 ** 48 ** ... 110 111 109 0.98 118 ** 120 ** 116 ** 0.97 **
Viet Nam 7,773,484 47 - 108 112 104 0.93 95 98 91 0.94
Latin America and the Caribbean
Anguilla 1,449 51 11 111 **, +1 109 **, +1 113 **, +1 1.04 **, +1 91 ** 89 ** 94 ** 1.06 **
Antigua and Barbuda ... ... ... ... ... ... ... ... ... ... ...
Argentina 4,685,532 -1 49 -1 ... 117 116 117 1.00 113 -1 113 -1 112 -1 0.99 -1
Aruba 10,250 48 79 112 * 114 * 111 * 0.98 * 114 * 116 * 112 * 0.97 *
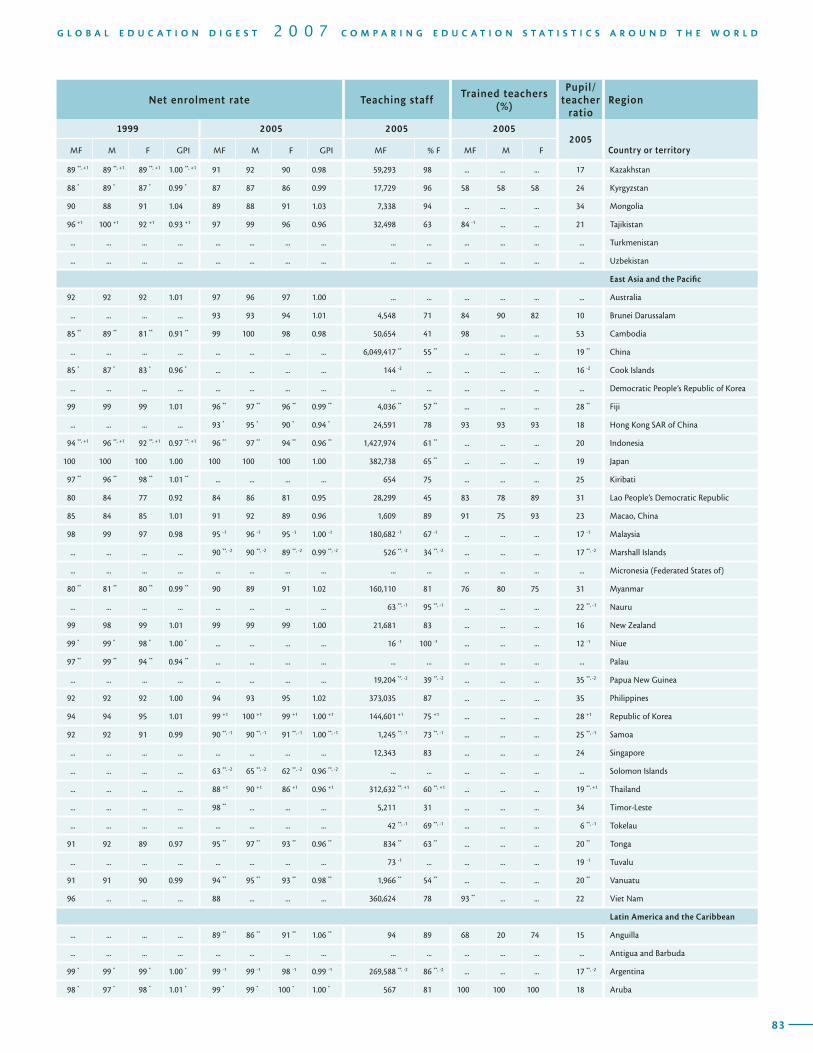
82
Region Enrolment Gross enrolment ratio
Country or territory
2005 1999 2005
MF % F % Private MF M F GPI MF M F GPI
T A B L E PRIMARY EDUCATION / ISCED 1 / Enrolment and teaching staff3
83
G L O B A L E D U C A T I O N D I G E S T 2 0 0 7 C O M P A R I N G E D U C A T I O N S T A T I S T I C S A R O U N D T H E W O R L D
Region Enrolment Gross enrolment ratio
Country or territory
2005 1999 2005
MF % F % Private MF M F GPI MF M F GPI
Net enrolment rate Teaching staffTrained teachers
(%)
Pupil/teacher
ratioRegion
1999 2005 2005 20052005
Country or territoryMF M F GPI MF M F GPI MF % F MF M F
89 **, +1 89 **, +1 89 **, +1 1.00 **, +1 91 92 90 0.98 59,293 98 ... ... ... 17 Kazakhstan
88 * 89 * 87 * 0.99 * 87 87 86 0.99 17,729 96 58 58 58 24 Kyrgyzstan
90 88 91 1.04 89 88 91 1.03 7,338 94 ... ... ... 34 Mongolia
96 +1 100 +1 92 +1 0.93 +1 97 99 96 0.96 32,498 63 84 -1 ... ... 21 Tajikistan
... ... ... ... ... ... ... ... ... ... ... ... ... ... Turkmenistan
... ... ... ... ... ... ... ... ... ... ... ... ... ... Uzbekistan
East Asia and the Pacific
92 92 92 1.01 97 96 97 1.00 ... ... ... ... ... ... Australia
... ... ... ... 93 93 94 1.01 4,548 71 84 90 82 10 Brunei Darussalam
85 ** 89 ** 81 ** 0.91 ** 99 100 98 0.98 50,654 41 98 ... ... 53 Cambodia
... ... ... ... ... ... ... ... 6,049,417 ** 55 ** ... ... ... 19 ** China
85 * 87 * 83 * 0.96 * ... ... ... ... 144 -2 ... ... ... ... 16 -2 Cook Islands
... ... ... ... ... ... ... ... ... ... ... ... ... ... Democratic People’s Republic of Korea
99 99 99 1.01 96 ** 97 ** 96 ** 0.99 ** 4,036 ** 57 ** ... ... ... 28 ** Fiji
... ... ... ... 93 * 95 * 90 * 0.94 * 24,591 78 93 93 93 18 Hong Kong SAR of China
94 **, +1 96 **, +1 92 **, +1 0.97 **, +1 96 ** 97 ** 94 ** 0.96 ** 1,427,974 61 ** ... ... ... 20 Indonesia
100 100 100 1.00 100 100 100 1.00 382,738 65 ** ... ... ... 19 Japan
97 ** 96 ** 98 ** 1.01 ** ... ... ... ... 654 75 ... ... ... 25 Kiribati
80 84 77 0.92 84 86 81 0.95 28,299 45 83 78 89 31 Lao People’s Democratic Republic
85 84 85 1.01 91 92 89 0.96 1,609 89 91 75 93 23 Macao, China
98 99 97 0.98 95 -1 96 -1 95 -1 1.00 -1 180,682 -1 67 -1 ... ... ... 17 -1 Malaysia
... ... ... ... 90 **, -2 90 **, -2 89 **, -2 0.99 **, -2 526 **, -2 34 **, -2 ... ... ... 17 **, -2 Marshall Islands
... ... ... ... ... ... ... ... ... ... ... ... ... ... Micronesia (Federated States of)
80 ** 81 ** 80 ** 0.99 ** 90 89 91 1.02 160,110 81 76 80 75 31 Myanmar
... ... ... ... ... ... ... ... 63 **, -1 95 **, -1 ... ... ... 22 **, -1 Nauru
99 98 99 1.01 99 99 99 1.00 21,681 83 ... ... ... 16 New Zealand
99 * 99 * 98 * 1.00 * ... ... ... ... 16 -1 100 -1 ... ... ... 12 -1 Niue
97 ** 99 ** 94 ** 0.94 ** ... ... ... ... ... ... ... ... ... ... Palau
... ... ... ... ... ... ... ... 19,204 **, -2 39 **, -2 ... ... ... 35 **, -2 Papua New Guinea
92 92 92 1.00 94 93 95 1.02 373,035 87 ... ... ... 35 Philippines
94 94 95 1.01 99 +1 100 +1 99 +1 1.00 +1 144,601 +1 75 +1 ... ... ... 28 +1 Republic of Korea
92 92 91 0.99 90 **, -1 90 **, -1 91 **, -1 1.00 **, -1 1,245 **, -1 73 **, -1 ... ... ... 25 **, -1 Samoa
... ... ... ... ... ... ... ... 12,343 83 ... ... ... 24 Singapore
... ... ... ... 63 **, -2 65 **, -2 62 **, -2 0.96 **, -2 ... ... ... ... ... ... Solomon Islands
... ... ... ... 88 +1 90 +1 86 +1 0.96 +1 312,632 **, +1 60 **, +1 ... ... ... 19 **, +1 Thailand
... ... ... ... 98 ** ... ... ... 5,211 31 ... ... ... 34 Timor-Leste
... ... ... ... ... ... ... ... 42 **, -1 69 **, -1 ... ... ... 6 **, -1 Tokelau
91 92 89 0.97 95 ** 97 ** 93 ** 0.96 ** 834 ** 63 ** ... ... ... 20 ** Tonga
... ... ... ... ... ... ... ... 73 -1 ... ... ... ... 19 -1 Tuvalu
91 91 90 0.99 94 ** 95 ** 93 ** 0.98 ** 1,966 ** 54 ** ... ... ... 20 ** Vanuatu
96 ... ... ... 88 ... ... ... 360,624 78 93 ** ... ... 22 Viet Nam
Latin America and the Caribbean
... ... ... ... 89 ** 86 ** 91 ** 1.06 ** 94 89 68 20 74 15 Anguilla
... ... ... ... ... ... ... ... ... ... ... ... ... ... Antigua and Barbuda
99 * 99 * 99 * 1.00 * 99 -1 99 -1 98 -1 0.99 -1 269,588 **, -2 86 **, -2 ... ... ... 17 **, -2 Argentina
98 * 97 * 98 * 1.01 * 99 * 99 * 100 * 1.00 * 567 81 100 100 100 18 Aruba
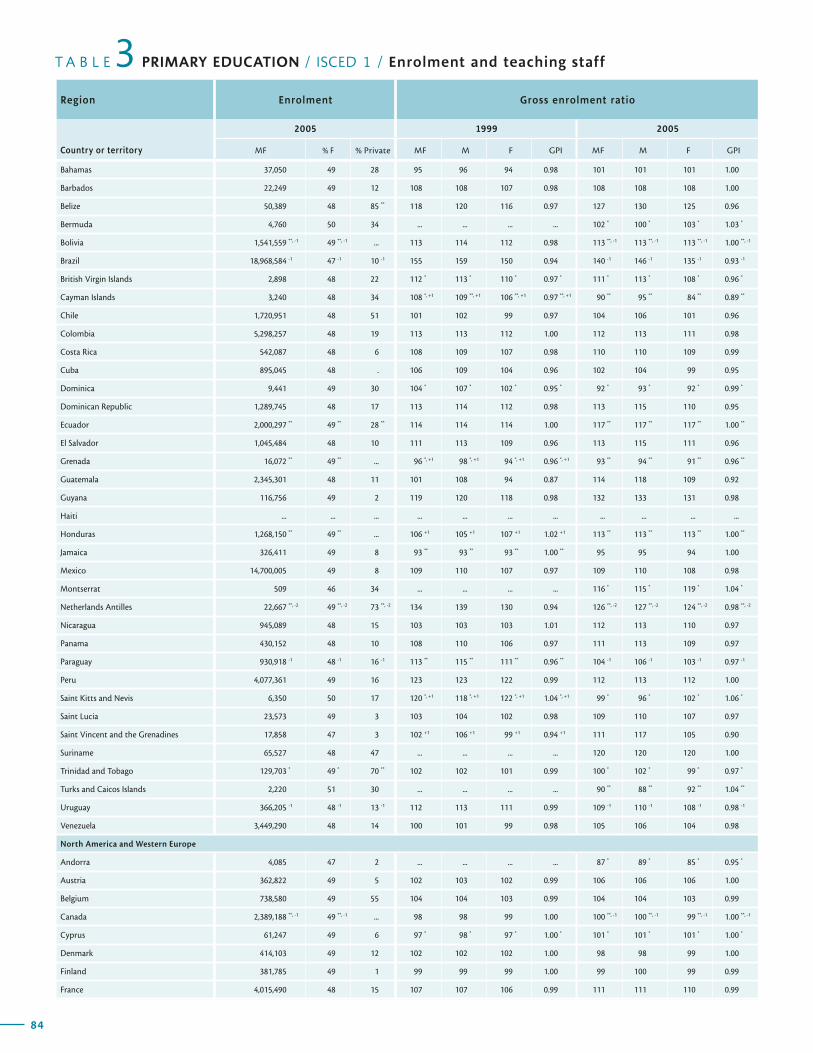
84
Region Enrolment Gross enrolment ratio
Country or territory
2005 1999 2005
MF % F % Private MF M F GPI MF M F GPI
T A B L E PRIMARY EDUCATION / ISCED 1 / Enrolment and teaching staff3
85
G L O B A L E D U C A T I O N D I G E S T 2 0 0 7 C O M P A R I N G E D U C A T I O N S T A T I S T I C S A R O U N D T H E W O R L D
Region Enrolment Gross enrolment ratio
Country or territory
2005 1999 2005
MF % F % Private MF M F GPI MF M F GPI
Net enrolment rate Teaching staffTrained teachers
(%)
Pupil/teacher
ratioRegion
1999 2005 2005 20052005
Country or territoryMF M F GPI MF M F GPI MF % F MF M F
Bahamas 37,050 49 28 95 96 94 0.98 101 101 101 1.00
Barbados 22,249 49 12 108 108 107 0.98 108 108 108 1.00
Belize 50,389 48 85 ** 118 120 116 0.97 127 130 125 0.96
Bermuda 4,760 50 34 ... ... ... ... 102 * 100 * 103 * 1.03 *
Bolivia 1,541,559 **, -1 49 **, -1 ... 113 114 112 0.98 113 **, -1 113 **, -1 113 **, -1 1.00 **, -1
Brazil 18,968,584 -1 47 -1 10 -1 155 159 150 0.94 140 -1 146 -1 135 -1 0.93 -1
British Virgin Islands 2,898 48 22 112 * 113 * 110 * 0.97 * 111 * 113 * 108 * 0.96 *
Cayman Islands 3,240 48 34 108 *, +1 109 **, +1 106 **, +1 0.97 **, +1 90 ** 95 ** 84 ** 0.89 **
Chile 1,720,951 48 51 101 102 99 0.97 104 106 101 0.96
Colombia 5,298,257 48 19 113 113 112 1.00 112 113 111 0.98
Costa Rica 542,087 48 6 108 109 107 0.98 110 110 109 0.99
Cuba 895,045 48 . 106 109 104 0.96 102 104 99 0.95
Dominica 9,441 49 30 104 * 107 * 102 * 0.95 * 92 * 93 * 92 * 0.99 *
Dominican Republic 1,289,745 48 17 113 114 112 0.98 113 115 110 0.95
Ecuador 2,000,297 ** 49 ** 28 ** 114 114 114 1.00 117 ** 117 ** 117 ** 1.00 **
El Salvador 1,045,484 48 10 111 113 109 0.96 113 115 111 0.96
Grenada 16,072 ** 49 ** ... 96 *, +1 98 *, +1 94 *, +1 0.96 *, +1 93 ** 94 ** 91 ** 0.96 **
Guatemala 2,345,301 48 11 101 108 94 0.87 114 118 109 0.92
Guyana 116,756 49 2 119 120 118 0.98 132 133 131 0.98
Haiti ... ... ... ... ... ... ... ... ... ... ...
Honduras 1,268,150 ** 49 ** ... 106 +1 105 +1 107 +1 1.02 +1 113 ** 113 ** 113 ** 1.00 **
Jamaica 326,411 49 8 93 ** 93 ** 93 ** 1.00 ** 95 95 94 1.00
Mexico 14,700,005 49 8 109 110 107 0.97 109 110 108 0.98
Montserrat 509 46 34 ... ... ... ... 116 * 115 * 119 * 1.04 *
Netherlands Antilles 22,667 **, -2 49 **, -2 73 **, -2 134 139 130 0.94 126 **, -2 127 **, -2 124 **, -2 0.98 **, -2
Nicaragua 945,089 48 15 103 103 103 1.01 112 113 110 0.97
Panama 430,152 48 10 108 110 106 0.97 111 113 109 0.97
Paraguay 930,918 -1 48 -1 16 -1 113 ** 115 ** 111 ** 0.96 ** 104 -1 106 -1 103 -1 0.97 -1
Peru 4,077,361 49 16 123 123 122 0.99 112 113 112 1.00
Saint Kitts and Nevis 6,350 50 17 120 *, +1 118 *, +1 122 *, +1 1.04 *, +1 99 * 96 * 102 * 1.06 *
Saint Lucia 23,573 49 3 103 104 102 0.98 109 110 107 0.97
Saint Vincent and the Grenadines 17,858 47 3 102 +1 106 +1 99 +1 0.94 +1 111 117 105 0.90
Suriname 65,527 48 47 ... ... ... ... 120 120 120 1.00
Trinidad and Tobago 129,703 * 49 * 70 ** 102 102 101 0.99 100 * 102 * 99 * 0.97 *
Turks and Caicos Islands 2,220 51 30 ... ... ... ... 90 ** 88 ** 92 ** 1.04 **
Uruguay 366,205 -1 48 -1 13 -1 112 113 111 0.99 109 -1 110 -1 108 -1 0.98 -1
Venezuela 3,449,290 48 14 100 101 99 0.98 105 106 104 0.98
North America and Western Europe
Andorra 4,085 47 2 ... ... ... ... 87 * 89 * 85 * 0.95 *
Austria 362,822 49 5 102 103 102 0.99 106 106 106 1.00
Belgium 738,580 49 55 104 104 103 0.99 104 104 103 0.99
Canada 2,389,188 **, -1 49 **, -1 ... 98 98 99 1.00 100 **, -1 100 **, -1 99 **, -1 1.00 **, -1
Cyprus 61,247 49 6 97 * 98 * 97 * 1.00 * 101 * 101 * 101 * 1.00 *
Denmark 414,103 49 12 102 102 102 1.00 98 98 99 1.00
Finland 381,785 49 1 99 99 99 1.00 99 100 99 0.99
France 4,015,490 48 15 107 107 106 0.99 111 111 110 0.99
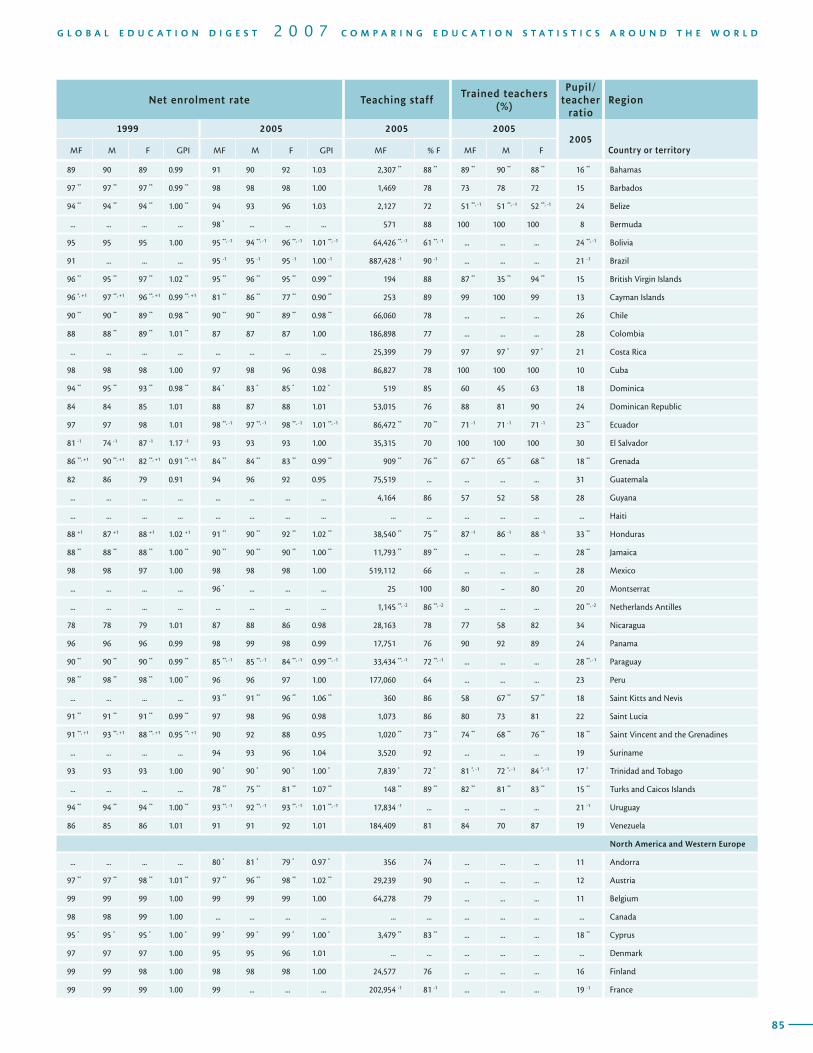
84
Region Enrolment Gross enrolment ratio
Country or territory
2005 1999 2005
MF % F % Private MF M F GPI MF M F GPI
T A B L E PRIMARY EDUCATION / ISCED 1 / Enrolment and teaching staff3
85
G L O B A L E D U C A T I O N D I G E S T 2 0 0 7 C O M P A R I N G E D U C A T I O N S T A T I S T I C S A R O U N D T H E W O R L D
Region Enrolment Gross enrolment ratio
Country or territory
2005 1999 2005
MF % F % Private MF M F GPI MF M F GPI
Net enrolment rate Teaching staffTrained teachers
(%)
Pupil/teacher
ratioRegion
1999 2005 2005 20052005
Country or territoryMF M F GPI MF M F GPI MF % F MF M F
89 90 89 0.99 91 90 92 1.03 2,307 ** 88 ** 89 ** 90 ** 88 ** 16 ** Bahamas
97 ** 97 ** 97 ** 0.99 ** 98 98 98 1.00 1,469 78 73 78 72 15 Barbados
94 ** 94 ** 94 ** 1.00 ** 94 93 96 1.03 2,127 72 51 **, -1 51 **, -1 52 **, -1 24 Belize
... ... ... ... 98 * ... ... ... 571 88 100 100 100 8 Bermuda
95 95 95 1.00 95 **, -1 94 **, -1 96 **, -1 1.01 **, -1 64,426 **, -1 61 **, -1 ... ... ... 24 **, -1 Bolivia
91 ... ... ... 95 -1 95 -1 95 -1 1.00 -1 887,428 -1 90 -1 ... ... ... 21 -1 Brazil
96 ** 95 ** 97 ** 1.02 ** 95 ** 96 ** 95 ** 0.99 ** 194 88 87 ** 35 ** 94 ** 15 British Virgin Islands
96 *, +1 97 **, +1 96 **, +1 0.99 **, +1 81 ** 86 ** 77 ** 0.90 ** 253 89 99 100 99 13 Cayman Islands
90 ** 90 ** 89 ** 0.98 ** 90 ** 90 ** 89 ** 0.98 ** 66,060 78 ... ... ... 26 Chile
88 88 ** 89 ** 1.01 ** 87 87 87 1.00 186,898 77 ... ... ... 28 Colombia
... ... ... ... ... ... ... ... 25,399 79 97 97 * 97 * 21 Costa Rica
98 98 98 1.00 97 98 96 0.98 86,827 78 100 100 100 10 Cuba
94 ** 95 ** 93 ** 0.98 ** 84 * 83 * 85 * 1.02 * 519 85 60 45 63 18 Dominica
84 84 85 1.01 88 87 88 1.01 53,015 76 88 81 90 24 Dominican Republic
97 97 98 1.01 98 **, -1 97 **, -1 98 **, -1 1.01 **, -1 86,472 ** 70 ** 71 -1 71 -1 71 -1 23 ** Ecuador
81 -1 74 -1 87 -1 1.17 -1 93 93 93 1.00 35,315 70 100 100 100 30 El Salvador
86 **, +1 90 **, +1 82 **, +1 0.91 **, +1 84 ** 84 ** 83 ** 0.99 ** 909 ** 76 ** 67 ** 65 ** 68 ** 18 ** Grenada
82 86 79 0.91 94 96 92 0.95 75,519 ... ... ... ... 31 Guatemala
... ... ... ... ... ... ... ... 4,164 86 57 52 58 28 Guyana
... ... ... ... ... ... ... ... ... ... ... ... ... ... Haiti
88 +1 87 +1 88 +1 1.02 +1 91 ** 90 ** 92 ** 1.02 ** 38,540 ** 75 ** 87 -1 86 -1 88 -1 33 ** Honduras
88 ** 88 ** 88 ** 1.00 ** 90 ** 90 ** 90 ** 1.00 ** 11,793 ** 89 ** ... ... ... 28 ** Jamaica
98 98 97 1.00 98 98 98 1.00 519,112 66 ... ... ... 28 Mexico
... ... ... ... 96 * ... ... ... 25 100 80 - 80 20 Montserrat
... ... ... ... ... ... ... ... 1,145 **, -2 86 **, -2 ... ... ... 20 **, -2 Netherlands Antilles
78 78 79 1.01 87 88 86 0.98 28,163 78 77 58 82 34 Nicaragua
96 96 96 0.99 98 99 98 0.99 17,751 76 90 92 89 24 Panama
90 ** 90 ** 90 ** 0.99 ** 85 **, -1 85 **, -1 84 **, -1 0.99 **, -1 33,434 **, -1 72 **, -1 ... ... ... 28 **, -1 Paraguay
98 ** 98 ** 98 ** 1.00 ** 96 96 97 1.00 177,060 64 ... ... ... 23 Peru
... ... ... ... 93 ** 91 ** 96 ** 1.06 ** 360 86 58 67 ** 57 ** 18 Saint Kitts and Nevis
91 ** 91 ** 91 ** 0.99 ** 97 98 96 0.98 1,073 86 80 73 81 22 Saint Lucia
91 **, +1 93 **, +1 88 **, +1 0.95 **, +1 90 92 88 0.95 1,020 ** 73 ** 74 ** 68 ** 76 ** 18 ** Saint Vincent and the Grenadines
... ... ... ... 94 93 96 1.04 3,520 92 ... ... ... 19 Suriname
93 93 93 1.00 90 * 90 * 90 * 1.00 * 7,839 * 72 * 81 *, -1 72 *, -1 84 *, -1 17 * Trinidad and Tobago
... ... ... ... 78 ** 75 ** 81 ** 1.07 ** 148 ** 89 ** 82 ** 81 ** 83 ** 15 ** Turks and Caicos Islands
94 ** 94 ** 94 ** 1.00 ** 93 **, -1 92 **, -1 93 **, -1 1.01 **, -1 17,834 -1 ... ... ... ... 21 -1 Uruguay
86 85 86 1.01 91 91 92 1.01 184,409 81 84 70 87 19 Venezuela
North America and Western Europe
... ... ... ... 80 * 81 * 79 * 0.97 * 356 74 ... ... ... 11 Andorra
97 ** 97 ** 98 ** 1.01 ** 97 ** 96 ** 98 ** 1.02 ** 29,239 90 ... ... ... 12 Austria
99 99 99 1.00 99 99 99 1.00 64,278 79 ... ... ... 11 Belgium
98 98 99 1.00 ... ... ... ... ... ... ... ... ... ... Canada
95 * 95 * 95 * 1.00 * 99 * 99 * 99 * 1.00 * 3,479 ** 83 ** ... ... ... 18 ** Cyprus
97 97 97 1.00 95 95 96 1.01 ... ... ... ... ... ... Denmark
99 99 98 1.00 98 98 98 1.00 24,577 76 ... ... ... 16 Finland
99 99 99 1.00 99 ... ... ... 202,954 -1 81 -1 ... ... ... 19 -1 France
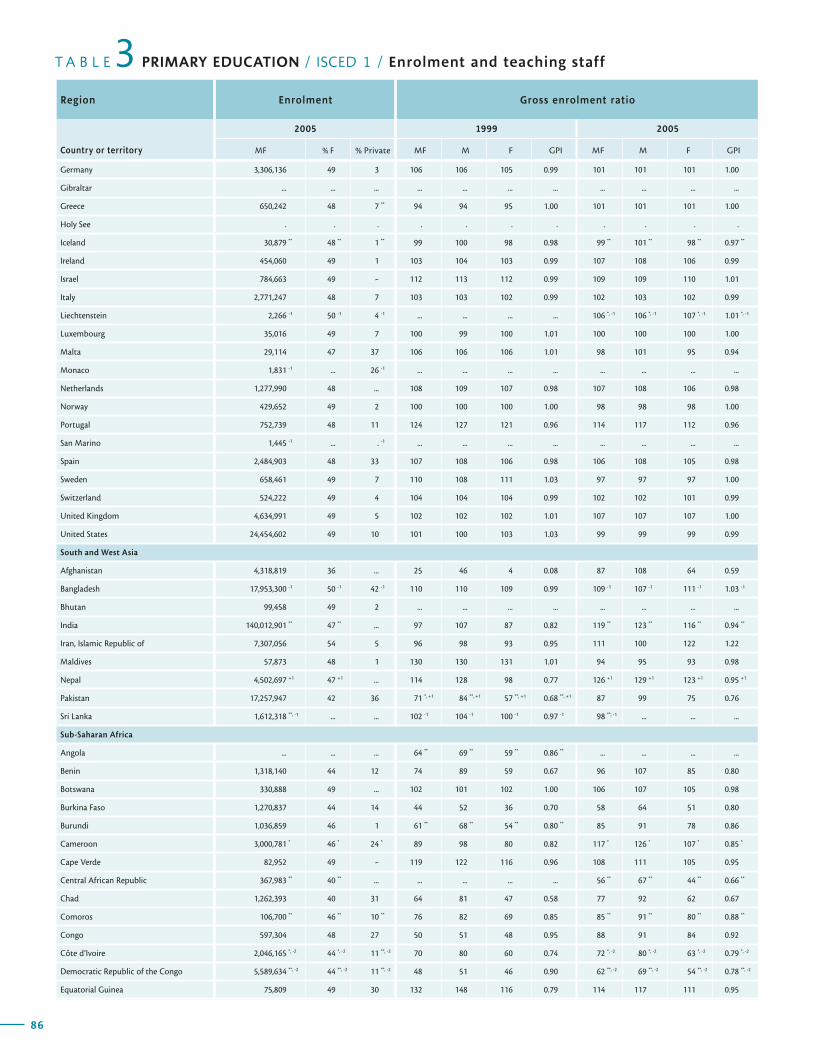
86
Region Enrolment Gross enrolment ratio
Country or territory
2005 1999 2005
MF % F % Private MF M F GPI MF M F GPI
T A B L E PRIMARY EDUCATION / ISCED 1 / Enrolment and teaching staff3
87
G L O B A L E D U C A T I O N D I G E S T 2 0 0 7 C O M P A R I N G E D U C A T I O N S T A T I S T I C S A R O U N D T H E W O R L D
Region Enrolment Gross enrolment ratio
Country or territory
2005 1999 2005
MF % F % Private MF M F GPI MF M F GPI
Net enrolment rate Teaching staffTrained teachers
(%)
Pupil/teacher
ratioRegion
1999 2005 2005 20052005
Country or territoryMF M F GPI MF M F GPI MF % F MF M F
Germany 3,306,136 49 3 106 106 105 0.99 101 101 101 1.00
Gibraltar ... ... ... ... ... ... ... ... ... ... ...
Greece 650,242 48 7 ** 94 94 95 1.00 101 101 101 1.00
Holy See . . . . . . . . . . .
Iceland 30,879 ** 48 ** 1 ** 99 100 98 0.98 99 ** 101 ** 98 ** 0.97 **
Ireland 454,060 49 1 103 104 103 0.99 107 108 106 0.99
Israel 784,663 49 - 112 113 112 0.99 109 109 110 1.01
Italy 2,771,247 48 7 103 103 102 0.99 102 103 102 0.99
Liechtenstein 2,266 -1 50 -1 4 -1 ... ... ... ... 106 *, -1 106 *, -1 107 *, -1 1.01 *, -1
Luxembourg 35,016 49 7 100 99 100 1.01 100 100 100 1.00
Malta 29,114 47 37 106 106 106 1.01 98 101 95 0.94
Monaco 1,831 -1 ... 26 -1 ... ... ... ... ... ... ... ...
Netherlands 1,277,990 48 ... 108 109 107 0.98 107 108 106 0.98
Norway 429,652 49 2 100 100 100 1.00 98 98 98 1.00
Portugal 752,739 48 11 124 127 121 0.96 114 117 112 0.96
San Marino 1,445 -1 ... . -1 ... ... ... ... ... ... ... ...
Spain 2,484,903 48 33 107 108 106 0.98 106 108 105 0.98
Sweden 658,461 49 7 110 108 111 1.03 97 97 97 1.00
Switzerland 524,222 49 4 104 104 104 0.99 102 102 101 0.99
United Kingdom 4,634,991 49 5 102 102 102 1.01 107 107 107 1.00
United States 24,454,602 49 10 101 100 103 1.03 99 99 99 0.99
South and West Asia
Afghanistan 4,318,819 36 ... 25 46 4 0.08 87 108 64 0.59
Bangladesh 17,953,300 -1 50 -1 42 -1 110 110 109 0.99 109 -1 107 -1 111 -1 1.03 -1
Bhutan 99,458 49 2 ... ... ... ... ... ... ... ...
India 140,012,901 ** 47 ** ... 97 107 87 0.82 119 ** 123 ** 116 ** 0.94 **
Iran, Islamic Republic of 7,307,056 54 5 96 98 93 0.95 111 100 122 1.22
Maldives 57,873 48 1 130 130 131 1.01 94 95 93 0.98
Nepal 4,502,697 +1 47 +1 ... 114 128 98 0.77 126 +1 129 +1 123 +1 0.95 +1
Pakistan 17,257,947 42 36 71 *, +1 84 **, +1 57 **, +1 0.68 **, +1 87 99 75 0.76
Sri Lanka 1,612,318 **, -1 ... ... 102 -1 104 -1 100 -1 0.97 -1 98 **, -1 ... ... ...
Sub-Saharan Africa
Angola ... ... ... 64 ** 69 ** 59 ** 0.86 ** ... ... ... ...
Benin 1,318,140 44 12 74 89 59 0.67 96 107 85 0.80
Botswana 330,888 49 ... 102 101 102 1.00 106 107 105 0.98
Burkina Faso 1,270,837 44 14 44 52 36 0.70 58 64 51 0.80
Burundi 1,036,859 46 1 61 ** 68 ** 54 ** 0.80 ** 85 91 78 0.86
Cameroon 3,000,781 * 46 * 24 * 89 98 80 0.82 117 * 126 * 107 * 0.85 *
Cape Verde 82,952 49 - 119 122 116 0.96 108 111 105 0.95
Central African Republic 367,983 ** 40 ** ... ... ... ... ... 56 ** 67 ** 44 ** 0.66 **
Chad 1,262,393 40 31 64 81 47 0.58 77 92 62 0.67
Comoros 106,700 ** 46 ** 10 ** 76 82 69 0.85 85 ** 91 ** 80 ** 0.88 **
Congo 597,304 48 27 50 51 48 0.95 88 91 84 0.92
Côte d’Ivoire 2,046,165 *, -2 44 *, -2 11 **, -2 70 80 60 0.74 72 *, -2 80 *, -2 63 *, -2 0.79 *, -2
Democratic Republic of the Congo 5,589,634 **, -2 44 **, -2 11 **, -2 48 51 46 0.90 62 **, -2 69 **, -2 54 **, -2 0.78 **, -2
Equatorial Guinea 75,809 49 30 132 148 116 0.79 114 117 111 0.95
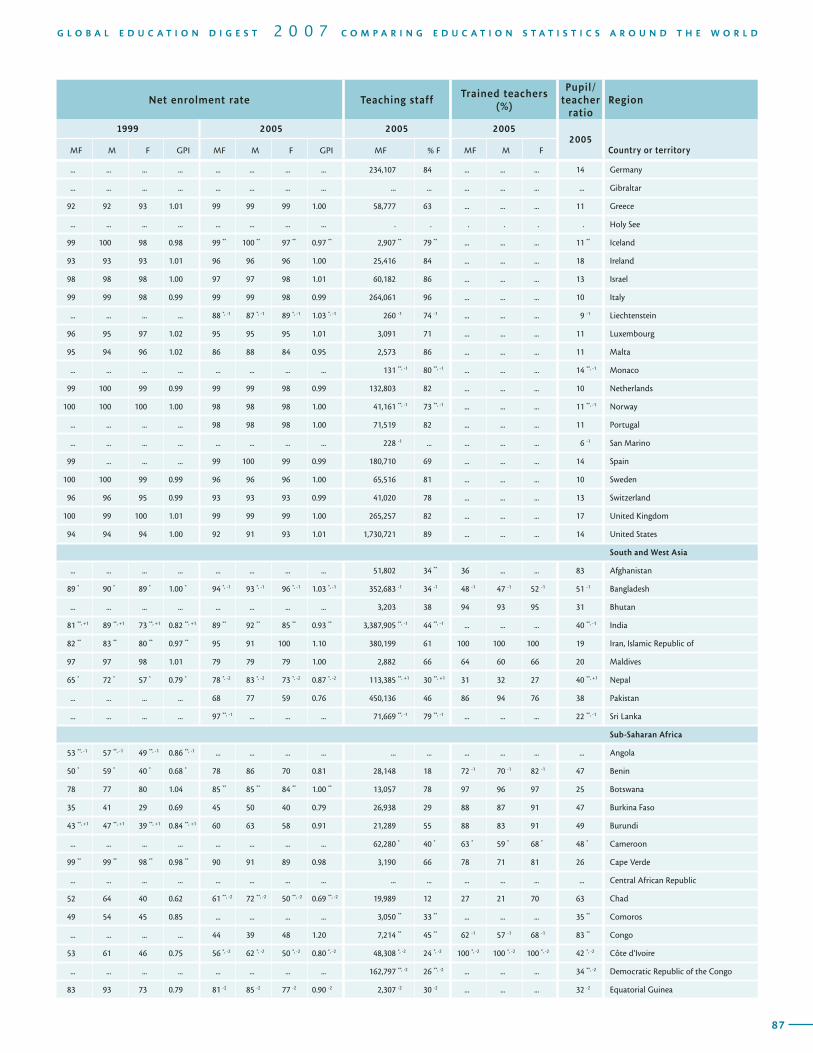
86
Region Enrolment Gross enrolment ratio
Country or territory
2005 1999 2005
MF % F % Private MF M F GPI MF M F GPI
T A B L E PRIMARY EDUCATION / ISCED 1 / Enrolment and teaching staff3
87
G L O B A L E D U C A T I O N D I G E S T 2 0 0 7 C O M P A R I N G E D U C A T I O N S T A T I S T I C S A R O U N D T H E W O R L D
Region Enrolment Gross enrolment ratio
Country or territory
2005 1999 2005
MF % F % Private MF M F GPI MF M F GPI
Net enrolment rate Teaching staffTrained teachers
(%)
Pupil/teacher
ratioRegion
1999 2005 2005 20052005
Country or territoryMF M F GPI MF M F GPI MF % F MF M F
... ... ... ... ... ... ... ... 234,107 84 ... ... ... 14 Germany
... ... ... ... ... ... ... ... ... ... ... ... ... ... Gibraltar
92 92 93 1.01 99 99 99 1.00 58,777 63 ... ... ... 11 Greece
... ... ... ... ... ... ... ... . . . . . . Holy See
99 100 98 0.98 99 ** 100 ** 97 ** 0.97 ** 2,907 ** 79 ** ... ... ... 11 ** Iceland
93 93 93 1.01 96 96 96 1.00 25,416 84 ... ... ... 18 Ireland
98 98 98 1.00 97 97 98 1.01 60,182 86 ... ... ... 13 Israel
99 99 98 0.99 99 99 98 0.99 264,061 96 ... ... ... 10 Italy
... ... ... ... 88 *, -1 87 *, -1 89 *, -1 1.03 *, -1 260 -1 74 -1 ... ... ... 9 -1 Liechtenstein
96 95 97 1.02 95 95 95 1.01 3,091 71 ... ... ... 11 Luxembourg
95 94 96 1.02 86 88 84 0.95 2,573 86 ... ... ... 11 Malta
... ... ... ... ... ... ... ... 131 **, -1 80 **, -1 ... ... ... 14 **, -1 Monaco
99 100 99 0.99 99 99 98 0.99 132,803 82 ... ... ... 10 Netherlands
100 100 100 1.00 98 98 98 1.00 41,161 **, -1 73 **, -1 ... ... ... 11 **, -1 Norway
... ... ... ... 98 98 98 1.00 71,519 82 ... ... ... 11 Portugal
... ... ... ... ... ... ... ... 228 -1 ... ... ... ... 6 -1 San Marino
99 ... ... ... 99 100 99 0.99 180,710 69 ... ... ... 14 Spain
100 100 99 0.99 96 96 96 1.00 65,516 81 ... ... ... 10 Sweden
96 96 95 0.99 93 93 93 0.99 41,020 78 ... ... ... 13 Switzerland
100 99 100 1.01 99 99 99 1.00 265,257 82 ... ... ... 17 United Kingdom
94 94 94 1.00 92 91 93 1.01 1,730,721 89 ... ... ... 14 United States
South and West Asia
... ... ... ... ... ... ... ... 51,802 34 ** 36 ... ... 83 Afghanistan
89 * 90 * 89 * 1.00 * 94 *, -1 93 *, -1 96 *, -1 1.03 *, -1 352,683 -1 34 -1 48 -1 47 -1 52 -1 51 -1 Bangladesh
... ... ... ... ... ... ... ... 3,203 38 94 93 95 31 Bhutan
81 **, +1 89 **, +1 73 **, +1 0.82 **, +1 89 ** 92 ** 85 ** 0.93 ** 3,387,905 **, -1 44 **, -1 ... ... ... 40 **, -1 India
82 ** 83 ** 80 ** 0.97 ** 95 91 100 1.10 380,199 61 100 100 100 19 Iran, Islamic Republic of
97 97 98 1.01 79 79 79 1.00 2,882 66 64 60 66 20 Maldives
65 * 72 * 57 * 0.79 * 78 *, -2 83 *, -2 73 *, -2 0.87 *, -2 113,385 **, +1 30 **, +1 31 32 27 40 **, +1 Nepal
... ... ... ... 68 77 59 0.76 450,136 46 86 94 76 38 Pakistan
... ... ... ... 97 **, -1 ... ... ... 71,669 **, -1 79 **, -1 ... ... ... 22 **, -1 Sri Lanka
Sub-Saharan Africa
53 **, -1 57 **, -1 49 **, -1 0.86 **, -1 ... ... ... ... ... ... ... ... ... ... Angola
50 * 59 * 40 * 0.68 * 78 86 70 0.81 28,148 18 72 -1 70 -1 82 -1 47 Benin
78 77 80 1.04 85 ** 85 ** 84 ** 1.00 ** 13,057 78 97 96 97 25 Botswana
35 41 29 0.69 45 50 40 0.79 26,938 29 88 87 91 47 Burkina Faso
43 **, +1 47 **, +1 39 **, +1 0.84 **, +1 60 63 58 0.91 21,289 55 88 83 91 49 Burundi
... ... ... ... ... ... ... ... 62,280 * 40 * 63 * 59 * 68 * 48 * Cameroon
99 ** 99 ** 98 ** 0.98 ** 90 91 89 0.98 3,190 66 78 71 81 26 Cape Verde
... ... ... ... ... ... ... ... ... ... ... ... ... ... Central African Republic
52 64 40 0.62 61 **, -2 72 **, -2 50 **, -2 0.69 **, -2 19,989 12 27 21 70 63 Chad
49 54 45 0.85 ... ... ... ... 3,050 ** 33 ** ... ... ... 35 ** Comoros
... ... ... ... 44 39 48 1.20 7,214 ** 45 ** 62 -1 57 -1 68 -1 83 ** Congo
53 61 46 0.75 56 *, -2 62 *, -2 50 *, -2 0.80 *, -2 48,308 *, -2 24 *, -2 100 *, -2 100 *, -2 100 *, -2 42 *, -2 Côte d’Ivoire
... ... ... ... ... ... ... ... 162,797 **, -2 26 **, -2 ... ... ... 34 **, -2 Democratic Republic of the Congo
83 93 73 0.79 81 -2 85 -2 77 -2 0.90 -2 2,307 -2 30 -2 ... ... ... 32 -2 Equatorial Guinea
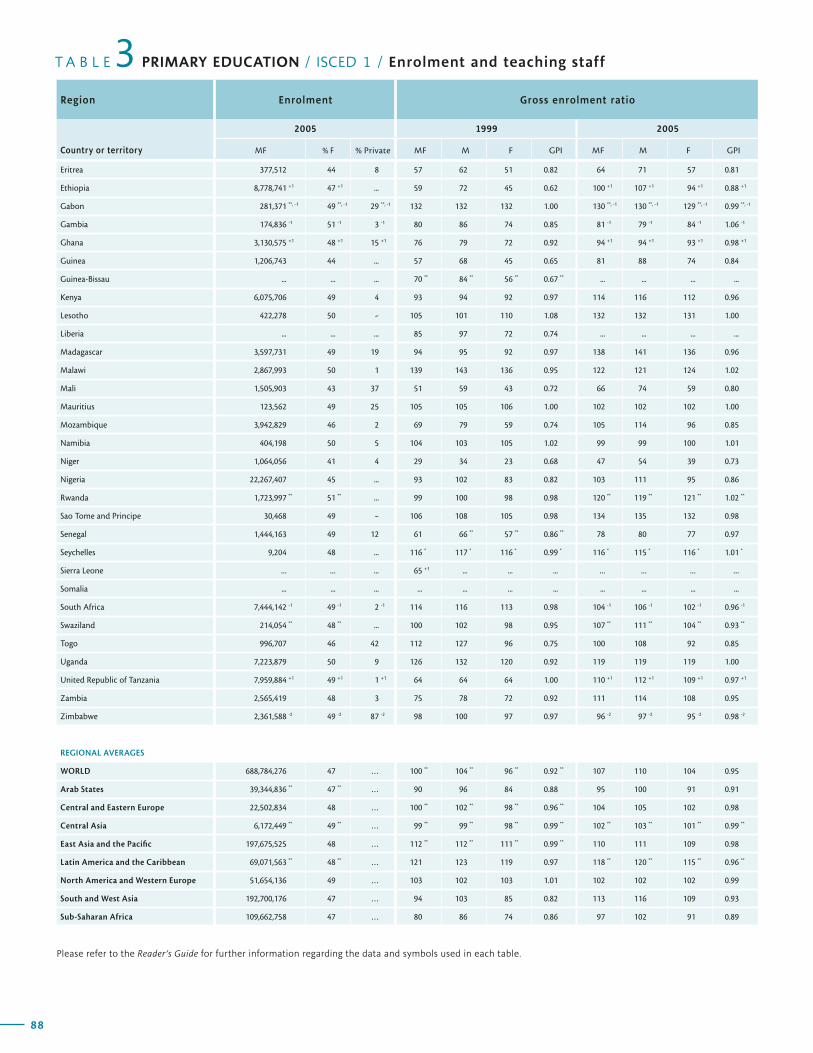
88
Region Enrolment Gross enrolment ratio
Country or territory
2005 1999 2005
MF % F % Private MF M F GPI MF M F GPI
T A B L E PRIMARY EDUCATION / ISCED 1 / Enrolment and teaching staff3
89
G L O B A L E D U C A T I O N D I G E S T 2 0 0 7 C O M P A R I N G E D U C A T I O N S T A T I S T I C S A R O U N D T H E W O R L D
Region Enrolment Gross enrolment ratio
Country or territory
2005 1999 2005
MF % F % Private MF M F GPI MF M F GPI
Net enrolment rate Teaching staffTrained teachers
(%)
Pupil/teacher
ratioRegion
1999 2005 2005 20052005
Country or territoryMF M F GPI MF M F GPI MF % F MF M F
Eritrea 377,512 44 8 57 62 51 0.82 64 71 57 0.81
Ethiopia 8,778,741 +1 47 +1 ... 59 72 45 0.62 100 +1 107 +1 94 +1 0.88 +1
Gabon 281,371 **, -1 49 **, -1 29 **, -1 132 132 132 1.00 130 **, -1 130 **, -1 129 **, -1 0.99 **, -1
Gambia 174,836 -1 51 -1 3 -1 80 86 74 0.85 81 -1 79 -1 84 -1 1.06 -1
Ghana 3,130,575 +1 48 +1 15 +1 76 79 72 0.92 94 +1 94 +1 93 +1 0.98 +1
Guinea 1,206,743 44 ... 57 68 45 0.65 81 88 74 0.84
Guinea-Bissau ... ... ... 70 ** 84 ** 56 ** 0.67 ** ... ... ... ...
Kenya 6,075,706 49 4 93 94 92 0.97 114 116 112 0.96
Lesotho 422,278 50 - 105 101 110 1.08 132 132 131 1.00
Liberia ... ... ... 85 97 72 0.74 ... ... ... ...
Madagascar 3,597,731 49 19 94 95 92 0.97 138 141 136 0.96
Malawi 2,867,993 50 1 139 143 136 0.95 122 121 124 1.02
Mali 1,505,903 43 37 51 59 43 0.72 66 74 59 0.80
Mauritius 123,562 49 25 105 105 106 1.00 102 102 102 1.00
Mozambique 3,942,829 46 2 69 79 59 0.74 105 114 96 0.85
Namibia 404,198 50 5 104 103 105 1.02 99 99 100 1.01
Niger 1,064,056 41 4 29 34 23 0.68 47 54 39 0.73
Nigeria 22,267,407 45 ... 93 102 83 0.82 103 111 95 0.86
Rwanda 1,723,997 ** 51 ** ... 99 100 98 0.98 120 ** 119 ** 121 ** 1.02 **
Sao Tome and Principe 30,468 49 - 106 108 105 0.98 134 135 132 0.98
Senegal 1,444,163 49 12 61 66 ** 57 ** 0.86 ** 78 80 77 0.97
Seychelles 9,204 48 ... 116 * 117 * 116 * 0.99 * 116 * 115 * 116 * 1.01 *
Sierra Leone ... ... ... 65 +1 ... ... ... ... ... ... ...
Somalia ... ... ... ... ... ... ... ... ... ... ...
South Africa 7,444,142 -1 49 -1 2 -1 114 116 113 0.98 104 -1 106 -1 102 -1 0.96 -1
Swaziland 214,054 ** 48 ** ... 100 102 98 0.95 107 ** 111 ** 104 ** 0.93 **
Togo 996,707 46 42 112 127 96 0.75 100 108 92 0.85
Uganda 7,223,879 50 9 126 132 120 0.92 119 119 119 1.00
United Republic of Tanzania 7,959,884 +1 49 +1 1 +1 64 64 64 1.00 110 +1 112 +1 109 +1 0.97 +1
Zambia 2,565,419 48 3 75 78 72 0.92 111 114 108 0.95
Zimbabwe 2,361,588 -2 49 -2 87 -2 98 100 97 0.97 96 -2 97 -2 95 -2 0.98 -2
REGIONAL AVERAGES
WORLD 688,784,276 47 … 100 ** 104 ** 96 ** 0.92 ** 107 110 104 0.95
Arab States 39,344,836 ** 47 ** … 90 96 84 0.88 95 100 91 0.91
Central and Eastern Europe 22,502,834 48 … 100 ** 102 ** 98 ** 0.96 ** 104 105 102 0.98
Central Asia 6,172,449 ** 49 ** … 99 ** 99 ** 98 ** 0.99 ** 102 ** 103 ** 101 ** 0.99 **
East Asia and the Pacific 197,675,525 48 … 112 ** 112 ** 111 ** 0.99 ** 110 111 109 0.98
Latin America and the Caribbean 69,071,563 ** 48 ** … 121 123 119 0.97 118 ** 120 ** 115 ** 0.96 **
North America and Western Europe 51,654,136 49 … 103 102 103 1.01 102 102 102 0.99
South and West Asia 192,700,176 47 … 94 103 85 0.82 113 116 109 0.93
Sub-Saharan Africa 109,662,758 47 … 80 86 74 0.86 97 102 91 0.89
Please refer to the Reader’s Guide for further information regarding the data and symbols used in each table.
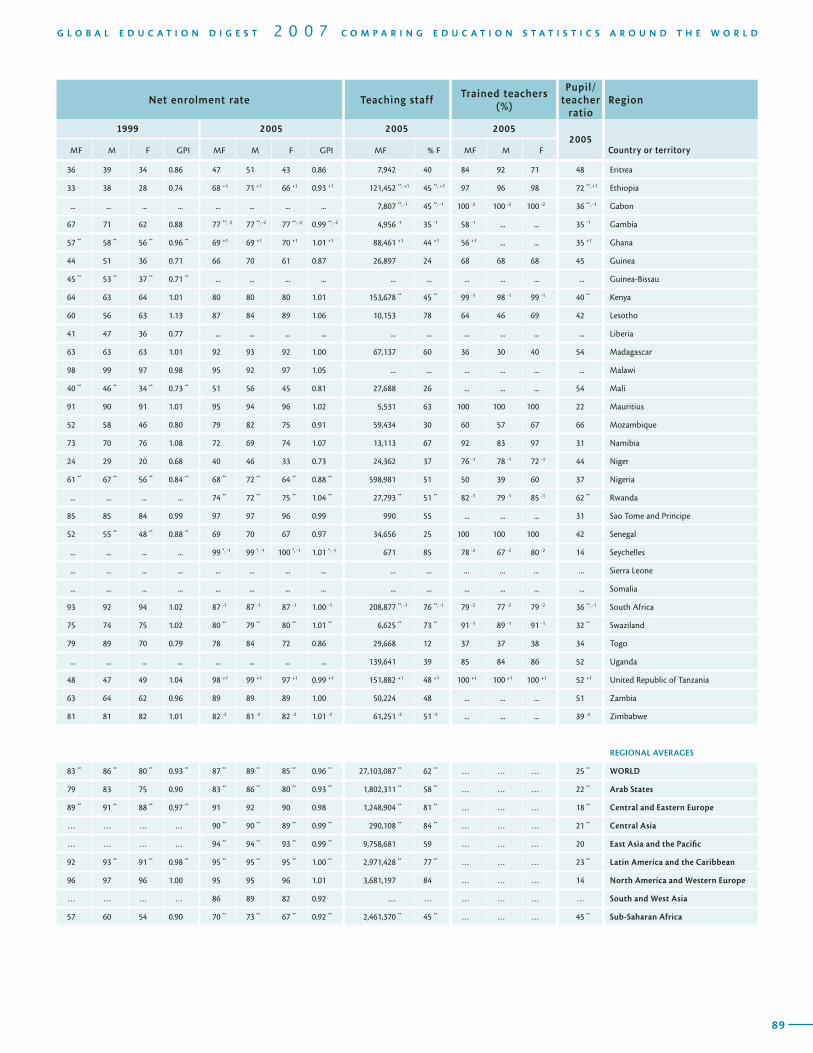
88
Region Enrolment Gross enrolment ratio
Country or territory
2005 1999 2005
MF % F % Private MF M F GPI MF M F GPI
T A B L E PRIMARY EDUCATION / ISCED 1 / Enrolment and teaching staff3
89
G L O B A L E D U C A T I O N D I G E S T 2 0 0 7 C O M P A R I N G E D U C A T I O N S T A T I S T I C S A R O U N D T H E W O R L D
Region Enrolment Gross enrolment ratio
Country or territory
2005 1999 2005
MF % F % Private MF M F GPI MF M F GPI
Net enrolment rate Teaching staffTrained teachers
(%)
Pupil/teacher
ratioRegion
1999 2005 2005 20052005
Country or territoryMF M F GPI MF M F GPI MF % F MF M F
36 39 34 0.86 47 51 43 0.86 7,942 40 84 92 71 48 Eritrea
33 38 28 0.74 68 +1 71 +1 66 +1 0.93 +1 121,452 **, +1 45 **, +1 97 96 98 72 **, +1 Ethiopia
... ... ... ... ... ... ... ... 7,807 **, -1 45 **, -1 100 -2 100 -2 100 -2 36 **, -1 Gabon
67 71 62 0.88 77 **, -2 77 **, -2 77 **, -2 0.99 **, -2 4,956 -1 35 -1 58 -1 ... ... 35 -1 Gambia
57 ** 58 ** 56 ** 0.96 ** 69 +1 69 +1 70 +1 1.01 +1 88,461 +1 44 +1 56 +1 ... ... 35 +1 Ghana
44 51 36 0.71 66 70 61 0.87 26,897 24 68 68 68 45 Guinea
45 ** 53 ** 37 ** 0.71 ** ... ... ... ... ... ... ... ... ... ... Guinea-Bissau
64 63 64 1.01 80 80 80 1.01 153,678 ** 45 ** 99 -1 98 -1 99 -1 40 ** Kenya
60 56 63 1.13 87 84 89 1.06 10,153 78 64 46 69 42 Lesotho
41 47 36 0.77 ... ... ... ... ... ... ... ... ... ... Liberia
63 63 63 1.01 92 93 92 1.00 67,137 60 36 30 40 54 Madagascar
98 99 97 0.98 95 92 97 1.05 ... ... ... ... ... ... Malawi
40 ** 46 ** 34 ** 0.73 ** 51 56 45 0.81 27,688 26 ... ... ... 54 Mali
91 90 91 1.01 95 94 96 1.02 5,531 63 100 100 100 22 Mauritius
52 58 46 0.80 79 82 75 0.91 59,434 30 60 57 67 66 Mozambique
73 70 76 1.08 72 69 74 1.07 13,113 67 92 83 97 31 Namibia
24 29 20 0.68 40 46 33 0.73 24,362 37 76 -1 78 -1 72 -1 44 Niger
61 ** 67 ** 56 ** 0.84 ** 68 ** 72 ** 64 ** 0.88 ** 598,981 51 50 39 60 37 Nigeria
... ... ... ... 74 ** 72 ** 75 ** 1.04 ** 27,793 ** 51 ** 82 -1 79 -1 85 -1 62 ** Rwanda
85 85 84 0.99 97 97 96 0.99 990 55 ... ... ... 31 Sao Tome and Principe
52 55 ** 48 ** 0.88 ** 69 70 67 0.97 34,656 25 100 100 100 42 Senegal
... ... ... ... 99 *, -1 99 *, -1 100 *, -1 1.01 *, -1 671 85 78 -2 67 -2 80 -2 14 Seychelles
... ... ... ... ... ... ... ... ... ... ... ... ... ... Sierra Leone
... ... ... ... ... ... ... ... ... ... ... ... ... ... Somalia
93 92 94 1.02 87 -1 87 -1 87 -1 1.00 -1 208,877 **, -1 76 **, -1 79 -2 77 -2 79 -2 36 **, -1 South Africa
75 74 75 1.02 80 ** 79 ** 80 ** 1.01 ** 6,625 ** 73 ** 91 -1 89 -1 91 -1 32 ** Swaziland
79 89 70 0.79 78 84 72 0.86 29,668 12 37 37 38 34 Togo
... ... ... ... ... ... ... ... 139,641 39 85 84 86 52 Uganda
48 47 49 1.04 98 +1 99 +1 97 +1 0.99 +1 151,882 +1 48 +1 100 +1 100 +1 100 +1 52 +1 United Republic of Tanzania
63 64 62 0.96 89 89 89 1.00 50,224 48 ... ... ... 51 Zambia
81 81 82 1.01 82 -2 81 -2 82 -2 1.01 -2 61,251 -2 51 -2 ... ... ... 39 -2 Zimbabwe
REGIONAL AVERAGES
83 ** 86 ** 80 ** 0.93 ** 87 ** 89 ** 85 ** 0.96 ** 27,103,087 ** 62 ** … … … 25 ** WORLD
79 83 75 0.90 83 ** 86 ** 80 ** 0.93 ** 1,802,311 ** 58 ** … … … 22 ** Arab States
89 ** 91 ** 88 ** 0.97 ** 91 92 90 0.98 1,248,904 ** 81 ** … … … 18 ** Central and Eastern Europe
… … … … 90 ** 90 ** 89 ** 0.99 ** 290,108 ** 84 ** … … … 21 ** Central Asia
… … … … 94 ** 94 ** 93 ** 0.99 ** 9,758,681 59 … … … 20 East Asia and the Pacific
92 93 ** 91 ** 0.98 ** 95 ** 95 ** 95 ** 1.00 ** 2,971,428 ** 77 ** … … … 23 ** Latin America and the Caribbean
96 97 96 1.00 95 95 96 1.01 3,681,197 84 … … … 14 North America and Western Europe
… … … … 86 89 82 0.92 … … … … … … South and West Asia
57 60 54 0.90 70 ** 73 ** 67 ** 0.92 ** 2,461,370 ** 45 ** … … … 45 ** Sub-Saharan Africa
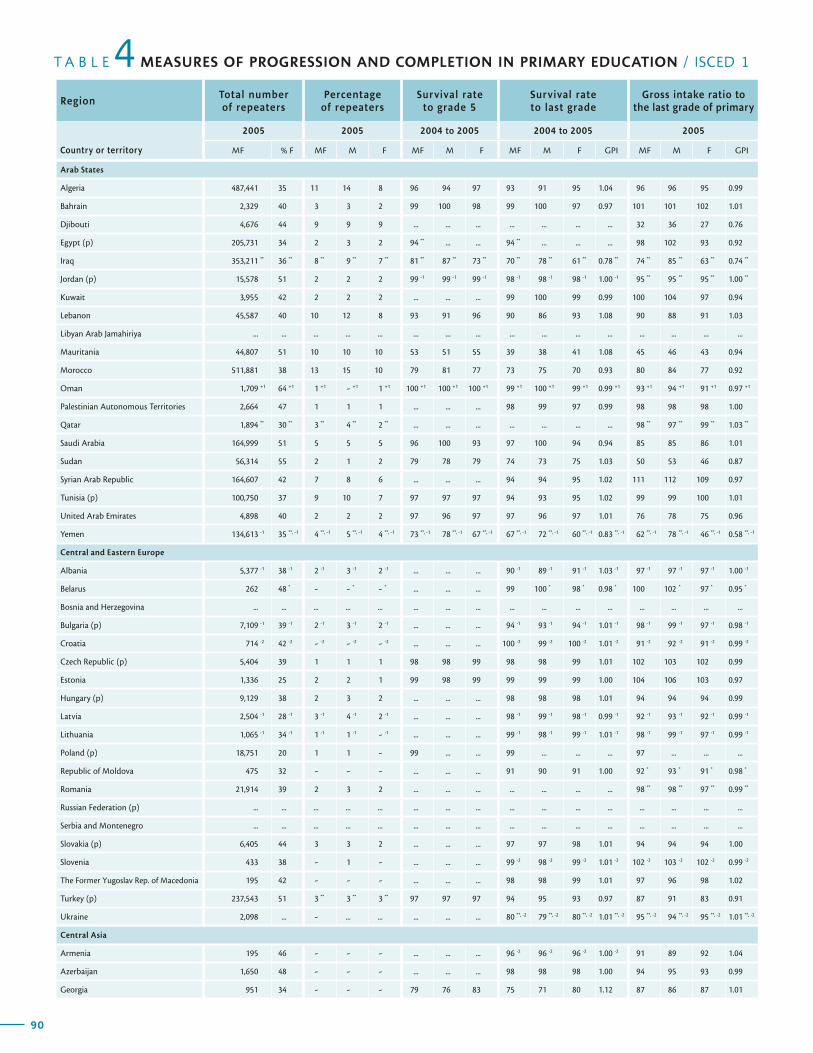
90
T A B L E MEASURES OF PROGRESSION AND COMPLETION IN PRIMARY EDUCATION / ISCED 1
RegionTotal number of repeaters
Percentage of repeaters
Survival rate to grade 5
Survival rate to last grade
Gross intake ratio to the last grade of primary
Country or territory
2005 2005 2004 to 2005 2004 to 2005 2005
MF % F MF M F MF M F MF M F GPI MF M F GPI
4
91
G L O B A L E D U C A T I O N D I G E S T 2 0 0 7 C O M P A R I N G E D U C A T I O N S T A T I S T I C S A R O U N D T H E W O R L D
Expected gross intake ratio to the last grade
of primary
Gross primary graduation ratio
Expected gross primary graduation ratio
Transition rate from primary to secondary
(general programmes)Region
2005 2005 2005 2004 to 2005
Country or territoryMF M F GPI MF M F GPI MF M F GPI MF M F GPI
Arab States
Algeria 487,441 35 11 14 8 96 94 97 93 91 95 1.04 96 96 95 0.99
Bahrain 2,329 40 3 3 2 99 100 98 99 100 97 0.97 101 101 102 1.01
Djibouti 4,676 44 9 9 9 ... ... ... ... ... ... ... 32 36 27 0.76
Egypt (p) 205,731 34 2 3 2 94 ** ... ... 94 ** ... ... ... 98 102 93 0.92
Iraq 353,211 ** 36 ** 8 ** 9 ** 7 ** 81 ** 87 ** 73 ** 70 ** 78 ** 61 ** 0.78 ** 74 ** 85 ** 63 ** 0.74 **
Jordan (p) 15,578 51 2 2 2 99 -1 99 -1 99 -1 98 -1 98 -1 98 -1 1.00 -1 95 ** 95 ** 95 ** 1.00 **
Kuwait 3,955 42 2 2 2 ... ... ... 99 100 99 0.99 100 104 97 0.94
Lebanon 45,587 40 10 12 8 93 91 96 90 86 93 1.08 90 88 91 1.03
Libyan Arab Jamahiriya ... ... ... ... ... ... ... ... ... ... ... ... ... ... ... ...
Mauritania 44,807 51 10 10 10 53 51 55 39 38 41 1.08 45 46 43 0.94
Morocco 511,881 38 13 15 10 79 81 77 73 75 70 0.93 80 84 77 0.92
Oman 1,709 +1 64 +1 1 +1 - +1 1 +1 100 +1 100 +1 100 +1 99 +1 100 +1 99 +1 0.99 +1 93 +1 94 +1 91 +1 0.97 +1
Palestinian Autonomous Territories 2,664 47 1 1 1 ... ... ... 98 99 97 0.99 98 98 98 1.00
Qatar 1,894 ** 30 ** 3 ** 4 ** 2 ** ... ... ... ... ... ... ... 98 ** 97 ** 99 ** 1.03 **
Saudi Arabia 164,999 51 5 5 5 96 100 93 97 100 94 0.94 85 85 86 1.01
Sudan 56,314 55 2 1 2 79 78 79 74 73 75 1.03 50 53 46 0.87
Syrian Arab Republic 164,607 42 7 8 6 ... ... ... 94 94 95 1.02 111 112 109 0.97
Tunisia (p) 100,750 37 9 10 7 97 97 97 94 93 95 1.02 99 99 100 1.01
United Arab Emirates 4,898 40 2 2 2 97 96 97 97 96 97 1.01 76 78 75 0.96
Yemen 134,613 -1 35 **, -1 4 **, -1 5 **, -1 4 **, -1 73 **, -1 78 **, -1 67 **, -1 67 **, -1 72 **, -1 60 **, -1 0.83 **, -1 62 **, -1 78 **, -1 46 **, -1 0.58 **, -1
Central and Eastern Europe
Albania 5,377 -1 38 -1 2 -1 3 -1 2 -1 ... ... ... 90 -1 89 -1 91 -1 1.03 -1 97 -1 97 -1 97 -1 1.00 -1
Belarus 262 48 * - - * - * ... ... ... 99 100 * 98 * 0.98 * 100 102 * 97 * 0.95 *
Bosnia and Herzegovina ... ... ... ... ... ... ... ... ... ... ... ... ... ... ... ...
Bulgaria (p) 7,109 -1 39 -1 2 -1 3 -1 2 -1 ... ... ... 94 -1 93 -1 94 -1 1.01 -1 98 -1 99 -1 97 -1 0.98 -1
Croatia 714 -2 42 -2 - -2 - -2 - -2 ... ... ... 100 -2 99 -2 100 -2 1.01 -2 91 -2 92 -2 91 -2 0.99 -2
Czech Republic (p) 5,404 39 1 1 1 98 98 99 98 98 99 1.01 102 103 102 0.99
Estonia 1,336 25 2 2 1 99 98 99 99 99 99 1.00 104 106 103 0.97
Hungary (p) 9,129 38 2 3 2 ... ... ... 98 98 98 1.01 94 94 94 0.99
Latvia 2,504 -1 28 -1 3 -1 4 -1 2 -1 ... ... ... 98 -1 99 -1 98 -1 0.99 -1 92 -1 93 -1 92 -1 0.99 -1
Lithuania 1,065 -1 34 -1 1 -1 1 -1 - -1 ... ... ... 99 -1 98 -1 99 -1 1.01 -1 98 -1 99 -1 97 -1 0.99 -1
Poland (p) 18,751 20 1 1 - 99 ... ... 99 ... ... ... 97 ... ... ...
Republic of Moldova 475 32 - - - ... ... ... 91 90 91 1.00 92 * 93 * 91 * 0.98 *
Romania 21,914 39 2 3 2 ... ... ... ... ... ... ... 98 ** 98 ** 97 ** 0.99 **
Russian Federation (p) ... ... ... ... ... ... ... ... ... ... ... ... ... ... ... ...
Serbia and Montenegro ... ... ... ... ... ... ... ... ... ... ... ... ... ... ... ...
Slovakia (p) 6,405 44 3 3 2 ... ... ... 97 97 98 1.01 94 94 94 1.00
Slovenia 433 38 - 1 - ... ... ... 99 -2 98 -2 99 -2 1.01 -2 102 -2 103 -2 102 -2 0.99 -2
The Former Yugoslav Rep. of Macedonia 195 42 - - - ... ... ... 98 98 99 1.01 97 96 98 1.02
Turkey (p) 237,543 51 3 ** 3 ** 3 ** 97 97 97 94 95 93 0.97 87 91 83 0.91
Ukraine 2,098 ... - ... ... ... ... ... 80 **, -2 79 **, -2 80 **, -2 1.01 **, -2 95 **, -2 94 **, -2 95 **, -2 1.01 **, -2
Central Asia
Armenia 195 46 - - - ... ... ... 96 -2 96 -2 96 -2 1.00 -2 91 89 92 1.04
Azerbaijan 1,650 48 - - - ... ... ... 98 98 98 1.00 94 95 93 0.99
Georgia 951 34 - - - 79 76 83 75 71 80 1.12 87 86 87 1.01
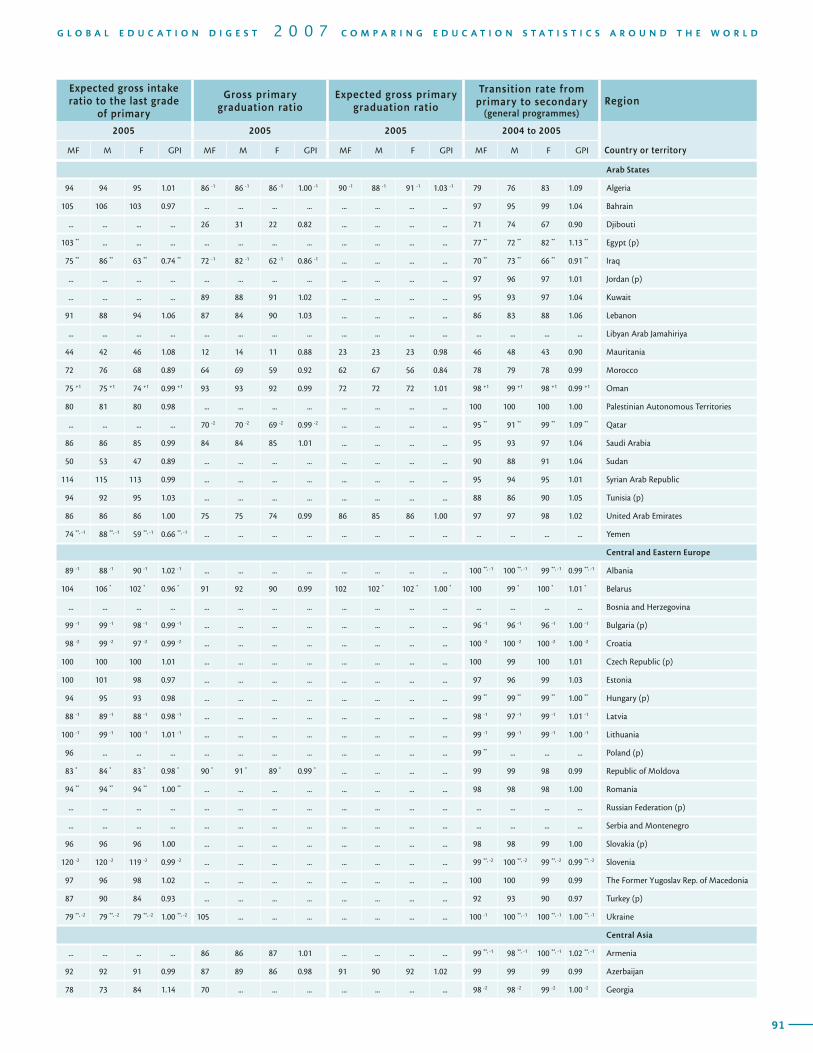
90
T A B L E MEASURES OF PROGRESSION AND COMPLETION IN PRIMARY EDUCATION / ISCED 1
RegionTotal number of repeaters
Percentage of repeaters
Survival rate to grade 5
Survival rate to last grade
Gross intake ratio to the last grade of primary
Country or territory
2005 2005 2004 to 2005 2004 to 2005 2005
MF % F MF M F MF M F MF M F GPI MF M F GPI
4
91
G L O B A L E D U C A T I O N D I G E S T 2 0 0 7 C O M P A R I N G E D U C A T I O N S T A T I S T I C S A R O U N D T H E W O R L D
Expected gross intake ratio to the last grade
of primary
Gross primary graduation ratio
Expected gross primary graduation ratio
Transition rate from primary to secondary
(general programmes)Region
2005 2005 2005 2004 to 2005
Country or territoryMF M F GPI MF M F GPI MF M F GPI MF M F GPI
Arab States
94 94 95 1.01 86 -1 86 -1 86 -1 1.00 -1 90 -1 88 -1 91 -1 1.03 -1 79 76 83 1.09 Algeria
105 106 103 0.97 ... ... ... ... ... ... ... ... 97 95 99 1.04 Bahrain
... ... ... ... 26 31 22 0.82 ... ... ... ... 71 74 67 0.90 Djibouti
103 ** ... ... ... ... ... ... ... ... ... ... ... 77 ** 72 ** 82 ** 1.13 ** Egypt (p)
75 ** 86 ** 63 ** 0.74 ** 72 -1 82 -1 62 -1 0.86 -1 ... ... ... ... 70 ** 73 ** 66 ** 0.91 ** Iraq
... ... ... ... ... ... ... ... ... ... ... ... 97 96 97 1.01 Jordan (p)
... ... ... ... 89 88 91 1.02 ... ... ... ... 95 93 97 1.04 Kuwait
91 88 94 1.06 87 84 90 1.03 ... ... ... ... 86 83 88 1.06 Lebanon
... ... ... ... ... ... ... ... ... ... ... ... ... ... ... ... Libyan Arab Jamahiriya
44 42 46 1.08 12 14 11 0.88 23 23 23 0.98 46 48 43 0.90 Mauritania
72 76 68 0.89 64 69 59 0.92 62 67 56 0.84 78 79 78 0.99 Morocco
75 +1 75 +1 74 +1 0.99 +1 93 93 92 0.99 72 72 72 1.01 98 +1 99 +1 98 +1 0.99 +1 Oman
80 81 80 0.98 ... ... ... ... ... ... ... ... 100 100 100 1.00 Palestinian Autonomous Territories
... ... ... ... 70 -2 70 -2 69 -2 0.99 -2 ... ... ... ... 95 ** 91 ** 99 ** 1.09 ** Qatar
86 86 85 0.99 84 84 85 1.01 ... ... ... ... 95 93 97 1.04 Saudi Arabia
50 53 47 0.89 ... ... ... ... ... ... ... ... 90 88 91 1.04 Sudan
114 115 113 0.99 ... ... ... ... ... ... ... ... 95 94 95 1.01 Syrian Arab Republic
94 92 95 1.03 ... ... ... ... ... ... ... ... 88 86 90 1.05 Tunisia (p)
86 86 86 1.00 75 75 74 0.99 86 85 86 1.00 97 97 98 1.02 United Arab Emirates
74 **, -1 88 **, -1 59 **, -1 0.66 **, -1 ... ... ... ... ... ... ... ... ... ... ... ... Yemen
Central and Eastern Europe
89 -1 88 -1 90 -1 1.02 -1 ... ... ... ... ... ... ... ... 100 **, -1 100 **, -1 99 **, -1 0.99 **, -1 Albania
104 106 * 102 * 0.96 * 91 92 90 0.99 102 102 * 102 * 1.00 * 100 99 * 100 * 1.01 * Belarus
... ... ... ... ... ... ... ... ... ... ... ... ... ... ... ... Bosnia and Herzegovina
99 -1 99 -1 98 -1 0.99 -1 ... ... ... ... ... ... ... ... 96 -1 96 -1 96 -1 1.00 -1 Bulgaria (p)
98 -2 99 -2 97 -2 0.99 -2 ... ... ... ... ... ... ... ... 100 -2 100 -2 100 -2 1.00 -2 Croatia
100 100 100 1.01 ... ... ... ... ... ... ... ... 100 99 100 1.01 Czech Republic (p)
100 101 98 0.97 ... ... ... ... ... ... ... ... 97 96 99 1.03 Estonia
94 95 93 0.98 ... ... ... ... ... ... ... ... 99 ** 99 ** 99 ** 1.00 ** Hungary (p)
88 -1 89 -1 88 -1 0.98 -1 ... ... ... ... ... ... ... ... 98 -1 97 -1 99 -1 1.01 -1 Latvia
100 -1 99 -1 100 -1 1.01 -1 ... ... ... ... ... ... ... ... 99 -1 99 -1 99 -1 1.00 -1 Lithuania
96 ... ... ... ... ... ... ... ... ... ... ... 99 ** ... ... ... Poland (p)
83 * 84 * 83 * 0.98 * 90 * 91 * 89 * 0.99 * ... ... ... ... 99 99 98 0.99 Republic of Moldova
94 ** 94 ** 94 ** 1.00 ** ... ... ... ... ... ... ... ... 98 98 98 1.00 Romania
... ... ... ... ... ... ... ... ... ... ... ... ... ... ... ... Russian Federation (p)
... ... ... ... ... ... ... ... ... ... ... ... ... ... ... ... Serbia and Montenegro
96 96 96 1.00 ... ... ... ... ... ... ... ... 98 98 99 1.00 Slovakia (p)
120 -2 120 -2 119 -2 0.99 -2 ... ... ... ... ... ... ... ... 99 **, -2 100 **, -2 99 **, -2 0.99 **, -2 Slovenia
97 96 98 1.02 ... ... ... ... ... ... ... ... 100 100 99 0.99 The Former Yugoslav Rep. of Macedonia
87 90 84 0.93 ... ... ... ... ... ... ... ... 92 93 90 0.97 Turkey (p)
79 **, -2 79 **, -2 79 **, -2 1.00 **, -2 105 ... ... ... ... ... ... ... 100 -1 100 **, -1 100 **, -1 1.00 **, -1 Ukraine
Central Asia
... ... ... ... 86 86 87 1.01 ... ... ... ... 99 **, -1 98 **, -1 100 **, -1 1.02 **, -1 Armenia
92 92 91 0.99 87 89 86 0.98 91 90 92 1.02 99 99 99 0.99 Azerbaijan
78 73 84 1.14 70 ... ... ... ... ... ... ... 98 -2 98 -2 99 -2 1.00 -2 Georgia
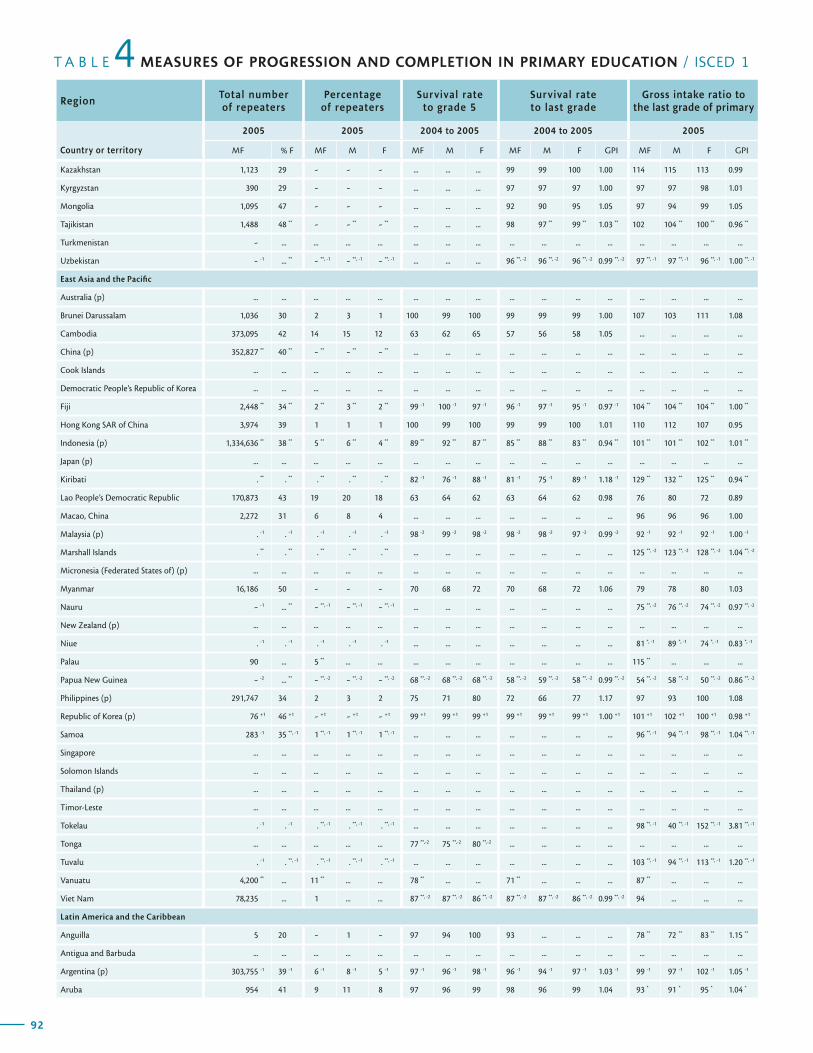
92
T A B L E MEASURES OF PROGRESSION AND COMPLETION IN PRIMARY EDUCATION / ISCED 1
RegionTotal number of repeaters
Percentage of repeaters
Survival rate to grade 5
Survival rate to last grade
Gross intake ratio to the last grade of primary
Country or territory
2005 2005 2004 to 2005 2004 to 2005 2005
MF % F MF M F MF M F MF M F GPI MF M F GPI
4
93
G L O B A L E D U C A T I O N D I G E S T 2 0 0 7 C O M P A R I N G E D U C A T I O N S T A T I S T I C S A R O U N D T H E W O R L D
Expected gross intake ratio to the last grade
of primary
Gross primary graduation ratio
Expected gross primary graduation ratio
Transition rate from primary to secondary
(general programmes)Region
2005 2005 2005 2004 to 2005
Country or territoryMF M F GPI MF M F GPI MF M F GPI MF M F GPI
Kazakhstan 1,123 29 - - - ... ... ... 99 99 100 1.00 114 115 113 0.99
Kyrgyzstan 390 29 - - - ... ... ... 97 97 97 1.00 97 97 98 1.01
Mongolia 1,095 47 - - - ... ... ... 92 90 95 1.05 97 94 99 1.05
Tajikistan 1,488 48 ** - - ** - ** ... ... ... 98 97 ** 99 ** 1.03 ** 102 104 ** 100 ** 0.96 **
Turkmenistan - ... ... ... ... ... ... ... ... ... ... ... ... ... ... ...
Uzbekistan - -1 ... ** - **, -1 - **, -1 - **, -1 ... ... ... 96 **, -2 96 **, -2 96 **, -2 0.99 **, -2 97 **, -1 97 **, -1 96 **, -1 1.00 **, -1
East Asia and the Pacific
Australia (p) ... ... ... ... ... ... ... ... ... ... ... ... ... ... ... ...
Brunei Darussalam 1,036 30 2 3 1 100 99 100 99 99 99 1.00 107 103 111 1.08
Cambodia 373,095 42 14 15 12 63 62 65 57 56 58 1.05 ... ... ... ...
China (p) 352,827 ** 40 ** - ** - ** - ** ... ... ... ... ... ... ... ... ... ... ...
Cook Islands ... ... ... ... ... ... ... ... ... ... ... ... ... ... ... ...
Democratic People’s Republic of Korea ... ... ... ... ... ... ... ... ... ... ... ... ... ... ... ...
Fiji 2,448 ** 34 ** 2 ** 3 ** 2 ** 99 -1 100 -1 97 -1 96 -1 97 -1 95 -1 0.97 -1 104 ** 104 ** 104 ** 1.00 **
Hong Kong SAR of China 3,974 39 1 1 1 100 99 100 99 99 100 1.01 110 112 107 0.95
Indonesia (p) 1,334,636 ** 38 ** 5 ** 6 ** 4 ** 89 ** 92 ** 87 ** 85 ** 88 ** 83 ** 0.94 ** 101 ** 101 ** 102 ** 1.01 **
Japan (p) ... ... ... ... ... ... ... ... ... ... ... ... ... ... ... ...
Kiribati . ** . ** . ** . ** . ** 82 -1 76 -1 88 -1 81 -1 75 -1 89 -1 1.18 -1 129 ** 132 ** 125 ** 0.94 **
Lao People’s Democratic Republic 170,873 43 19 20 18 63 64 62 63 64 62 0.98 76 80 72 0.89
Macao, China 2,272 31 6 8 4 ... ... ... ... ... ... ... 96 96 96 1.00
Malaysia (p) . -1 . -1 . -1 . -1 . -1 98 -2 99 -2 98 -2 98 -2 98 -2 97 -2 0.99 -2 92 -1 92 -1 92 -1 1.00 -1
Marshall Islands . ** . ** . ** . ** . ** ... ... ... ... ... ... ... 125 **, -2 123 **, -2 128 **, -2 1.04 **, -2
Micronesia (Federated States of) (p) ... ... ... ... ... ... ... ... ... ... ... ... ... ... ... ...
Myanmar 16,186 50 - - - 70 68 72 70 68 72 1.06 79 78 80 1.03
Nauru - -1 ... ** - **, -1 - **, -1 - **, -1 ... ... ... ... ... ... ... 75 **, -2 76 **, -2 74 **, -2 0.97 **, -2
New Zealand (p) ... ... ... ... ... ... ... ... ... ... ... ... ... ... ... ...
Niue . -1 . -1 . -1 . -1 . -1 ... ... ... ... ... ... ... 81 *, -1 89 *, -1 74 *, -1 0.83 *, -1
Palau 90 ... 5 ** ... ... ... ... ... ... ... ... ... 115 ** ... ... ...
Papua New Guinea - -2 ... ** - **, -2 - **, -2 - **, -2 68 **, -2 68 **, -2 68 **, -2 58 **, -2 59 **, -2 58 **, -2 0.99 **, -2 54 **, -2 58 **, -2 50 **, -2 0.86 **, -2
Philippines (p) 291,747 34 2 3 2 75 71 80 72 66 77 1.17 97 93 100 1.08
Republic of Korea (p) 76 +1 46 +1 - +1 - +1 - +1 99 +1 99 +1 99 +1 99 +1 99 +1 99 +1 1.00 +1 101 +1 102 +1 100 +1 0.98 +1
Samoa 283 -1 35 **, -1 1 **, -1 1 **, -1 1 **, -1 ... ... ... ... ... ... ... 96 **, -1 94 **, -1 98 **, -1 1.04 **, -1
Singapore ... ... ... ... ... ... ... ... ... ... ... ... ... ... ... ...
Solomon Islands ... ... ... ... ... ... ... ... ... ... ... ... ... ... ... ...
Thailand (p) ... ... ... ... ... ... ... ... ... ... ... ... ... ... ... ...
Timor-Leste ... ... ... ... ... ... ... ... ... ... ... ... ... ... ... ...
Tokelau . -1 . -1 . **, -1 . **, -1 . **, -1 ... ... ... ... ... ... ... 98 **, -1 40 **, -1 152 **, -1 3.81 **, -1
Tonga ... ... ... ... ... 77 **,-2 75 **,-2 80 **,-2 ... ... ... ... ... ... ... ...
Tuvalu . -1 . **, -1 . **, -1 . **, -1 . **, -1 ... ... ... ... ... ... ... 103 **, -1 94 **, -1 113 **, -1 1.20 **, -1
Vanuatu 4,200 ** ... 11 ** ... ... 78 ** ... ... 71 ** ... ... ... 87 ** ... ... ...
Viet Nam 78,235 ... 1 ... ... 87 **, -2 87 **, -2 86 **, -2 87 **, -2 87 **, -2 86 **, -2 0.99 **, -2 94 ... ... ...
Latin America and the Caribbean
Anguilla 5 20 - 1 - 97 94 100 93 ... ... ... 78 ** 72 ** 83 ** 1.15 **
Antigua and Barbuda ... ... ... ... ... ... ... ... ... ... ... ... ... ... ... ...
Argentina (p) 303,755 -1 39 -1 6 -1 8 -1 5 -1 97 -1 96 -1 98 -1 96 -1 94 -1 97 -1 1.03 -1 99 -1 97 -1 102 -1 1.05 -1
Aruba 954 41 9 11 8 97 96 99 98 96 99 1.04 93 * 91 * 95 * 1.04 *
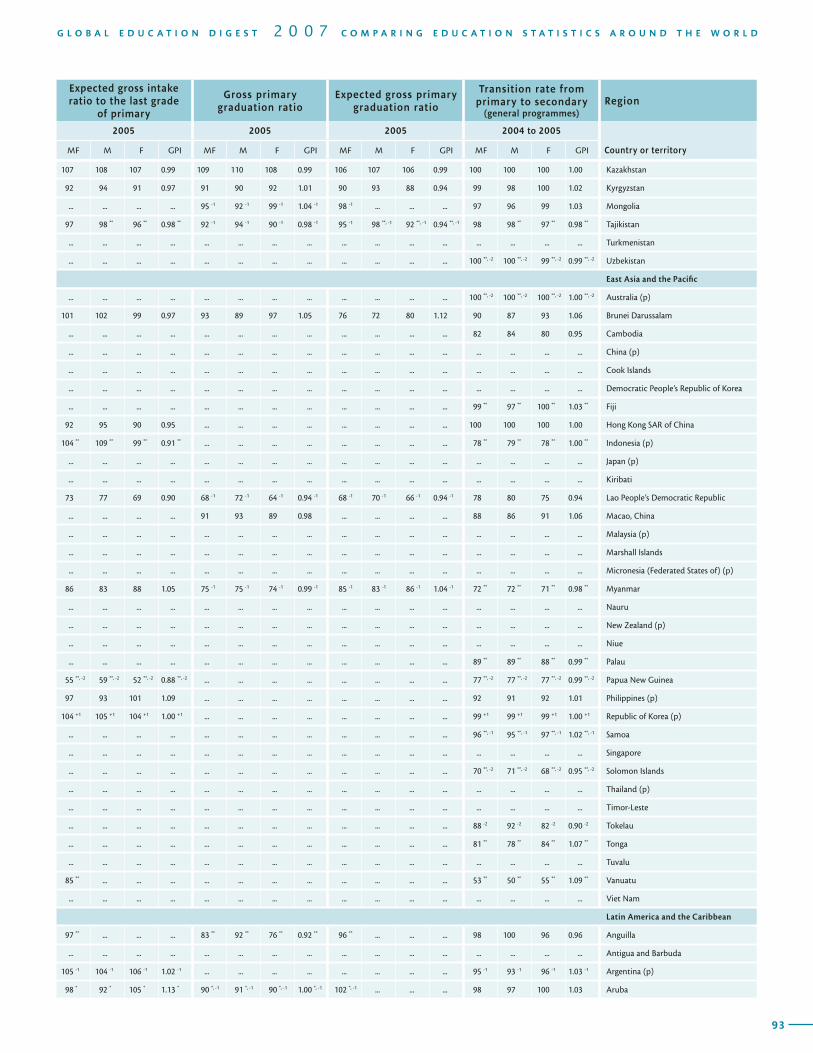
92
T A B L E MEASURES OF PROGRESSION AND COMPLETION IN PRIMARY EDUCATION / ISCED 1
RegionTotal number of repeaters
Percentage of repeaters
Survival rate to grade 5
Survival rate to last grade
Gross intake ratio to the last grade of primary
Country or territory
2005 2005 2004 to 2005 2004 to 2005 2005
MF % F MF M F MF M F MF M F GPI MF M F GPI
4
93
G L O B A L E D U C A T I O N D I G E S T 2 0 0 7 C O M P A R I N G E D U C A T I O N S T A T I S T I C S A R O U N D T H E W O R L D
Expected gross intake ratio to the last grade
of primary
Gross primary graduation ratio
Expected gross primary graduation ratio
Transition rate from primary to secondary
(general programmes)Region
2005 2005 2005 2004 to 2005
Country or territoryMF M F GPI MF M F GPI MF M F GPI MF M F GPI
107 108 107 0.99 109 110 108 0.99 106 107 106 0.99 100 100 100 1.00 Kazakhstan
92 94 91 0.97 91 90 92 1.01 90 93 88 0.94 99 98 100 1.02 Kyrgyzstan
... ... ... ... 95 -1 92 -1 99 -1 1.04 -1 98 -1 ... ... ... 97 96 99 1.03 Mongolia
97 98 ** 96 ** 0.98 ** 92 -1 94 -1 90 -1 0.98 -1 95 -1 98 **, -1 92 **, -1 0.94 **, -1 98 98 ** 97 ** 0.98 ** Tajikistan
... ... ... ... ... ... ... ... ... ... ... ... ... ... ... ... Turkmenistan
... ... ... ... ... ... ... ... ... ... ... ... 100 **, -2 100 **, -2 99 **, -2 0.99 **, -2 Uzbekistan
East Asia and the Pacific
... ... ... ... ... ... ... ... ... ... ... ... 100 **, -2 100 **, -2 100 **, -2 1.00 **, -2 Australia (p)
101 102 99 0.97 93 89 97 1.05 76 72 80 1.12 90 87 93 1.06 Brunei Darussalam
... ... ... ... ... ... ... ... ... ... ... ... 82 84 80 0.95 Cambodia
... ... ... ... ... ... ... ... ... ... ... ... ... ... ... ... China (p)
... ... ... ... ... ... ... ... ... ... ... ... ... ... ... ... Cook Islands
... ... ... ... ... ... ... ... ... ... ... ... ... ... ... ... Democratic People’s Republic of Korea
... ... ... ... ... ... ... ... ... ... ... ... 99 ** 97 ** 100 ** 1.03 ** Fiji
92 95 90 0.95 ... ... ... ... ... ... ... ... 100 100 100 1.00 Hong Kong SAR of China
104 ** 109 ** 99 ** 0.91 ** ... ... ... ... ... ... ... ... 78 ** 79 ** 78 ** 1.00 ** Indonesia (p)
... ... ... ... ... ... ... ... ... ... ... ... ... ... ... ... Japan (p)
... ... ... ... ... ... ... ... ... ... ... ... ... ... ... ... Kiribati
73 77 69 0.90 68 -1 72 -1 64 -1 0.94 -1 68 -1 70 -1 66 -1 0.94 -1 78 80 75 0.94 Lao People’s Democratic Republic
... ... ... ... 91 93 89 0.98 ... ... ... ... 88 86 91 1.06 Macao, China
... ... ... ... ... ... ... ... ... ... ... ... ... ... ... ... Malaysia (p)
... ... ... ... ... ... ... ... ... ... ... ... ... ... ... ... Marshall Islands
... ... ... ... ... ... ... ... ... ... ... ... ... ... ... ... Micronesia (Federated States of) (p)
86 83 88 1.05 75 -1 75 -1 74 -1 0.99 -1 85 -1 83 -1 86 -1 1.04 -1 72 ** 72 ** 71 ** 0.98 ** Myanmar
... ... ... ... ... ... ... ... ... ... ... ... ... ... ... ... Nauru
... ... ... ... ... ... ... ... ... ... ... ... ... ... ... ... New Zealand (p)
... ... ... ... ... ... ... ... ... ... ... ... ... ... ... ... Niue
... ... ... ... ... ... ... ... ... ... ... ... 89 ** 89 ** 88 ** 0.99 ** Palau
55 **, -2 59 **, -2 52 **, -2 0.88 **, -2 ... ... ... ... ... ... ... ... 77 **, -2 77 **, -2 77 **, -2 0.99 **, -2 Papua New Guinea
97 93 101 1.09 ... ... ... ... ... ... ... ... 92 91 92 1.01 Philippines (p)
104 +1 105 +1 104 +1 1.00 +1 ... ... ... ... ... ... ... ... 99 +1 99 +1 99 +1 1.00 +1 Republic of Korea (p)
... ... ... ... ... ... ... ... ... ... ... ... 96 **, -1 95 **, -1 97 **, -1 1.02 **, -1 Samoa
... ... ... ... ... ... ... ... ... ... ... ... ... ... ... ... Singapore
... ... ... ... ... ... ... ... ... ... ... ... 70 **, -2 71 **, -2 68 **, -2 0.95 **, -2 Solomon Islands
... ... ... ... ... ... ... ... ... ... ... ... ... ... ... ... Thailand (p)
... ... ... ... ... ... ... ... ... ... ... ... ... ... ... ... Timor-Leste
... ... ... ... ... ... ... ... ... ... ... ... 88 -2 92 -2 82 -2 0.90 -2 Tokelau
... ... ... ... ... ... ... ... ... ... ... ... 81 ** 78 ** 84 ** 1.07 ** Tonga
... ... ... ... ... ... ... ... ... ... ... ... ... ... ... ... Tuvalu
85 ** ... ... ... ... ... ... ... ... ... ... ... 53 ** 50 ** 55 ** 1.09 ** Vanuatu
... ... ... ... ... ... ... ... ... ... ... ... ... ... ... ... Viet Nam
Latin America and the Caribbean
97 ** ... ... ... 83 ** 92 ** 76 ** 0.92 ** 96 ** ... ... ... 98 100 96 0.96 Anguilla
... ... ... ... ... ... ... ... ... ... ... ... ... ... ... ... Antigua and Barbuda
105 -1 104 -1 106 -1 1.02 -1 ... ... ... ... ... ... ... ... 95 -1 93 -1 96 -1 1.03 -1 Argentina (p)
98 * 92 * 105 * 1.13 * 90 *, -1 91 *, -1 90 *, -1 1.00 *, -1 102 *, -1 ... ... ... 98 97 100 1.03 Aruba
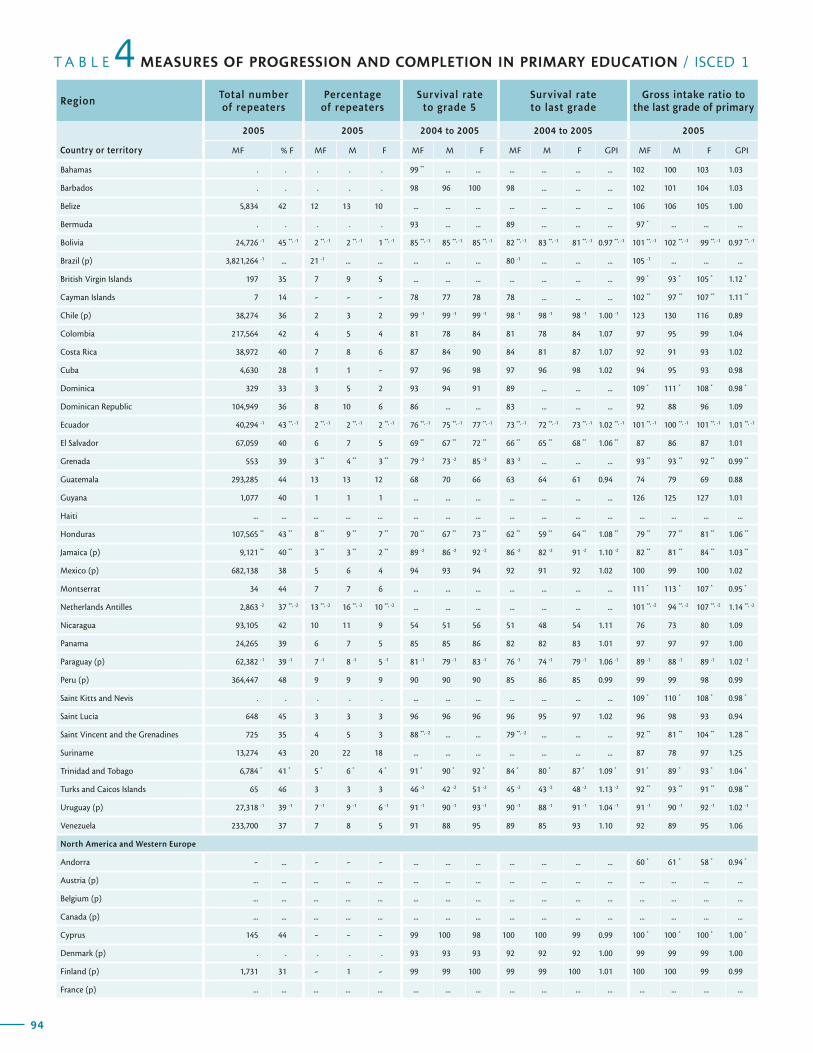
94
T A B L E MEASURES OF PROGRESSION AND COMPLETION IN PRIMARY EDUCATION / ISCED 1
RegionTotal number of repeaters
Percentage of repeaters
Survival rate to grade 5
Survival rate to last grade
Gross intake ratio to the last grade of primary
Country or territory
2005 2005 2004 to 2005 2004 to 2005 2005
MF % F MF M F MF M F MF M F GPI MF M F GPI
4
95
G L O B A L E D U C A T I O N D I G E S T 2 0 0 7 C O M P A R I N G E D U C A T I O N S T A T I S T I C S A R O U N D T H E W O R L D
Expected gross intake ratio to the last grade
of primary
Gross primary graduation ratio
Expected gross primary graduation ratio
Transition rate from primary to secondary
(general programmes)Region
2005 2005 2005 2004 to 2005
Country or territoryMF M F GPI MF M F GPI MF M F GPI MF M F GPI
Bahamas . . . . . 99 ** ... ... ... ... ... ... 102 100 103 1.03
Barbados . . . . . 98 96 100 98 ... ... ... 102 101 104 1.03
Belize 5,834 42 12 13 10 ... ... ... ... ... ... ... 106 106 105 1.00
Bermuda . . . . . 93 ... ... 89 ... ... ... 97 * ... ... ...
Bolivia 24,726 -1 45 **, -1 2 **, -1 2 **, -1 1 **, -1 85 **, -1 85 **, -1 85 **, -1 82 **, -1 83 **, -1 81 **, -1 0.97 **, -1 101 **, -1 102 **, -1 99 **, -1 0.97 **, -1
Brazil (p) 3,821,264 -1 ... 21 -1 ... ... ... ... ... 80 -1 ... ... ... 105 -1 ... ... ...
British Virgin Islands 197 35 7 9 5 ... ... ... ... ... ... ... 99 * 93 * 105 * 1.12 *
Cayman Islands 7 14 - - - 78 77 78 78 ... ... ... 102 ** 97 ** 107 ** 1.11 **
Chile (p) 38,274 36 2 3 2 99 -1 99 -1 99 -1 98 -1 98 -1 98 -1 1.00 -1 123 130 116 0.89
Colombia 217,564 42 4 5 4 81 78 84 81 78 84 1.07 97 95 99 1.04
Costa Rica 38,972 40 7 8 6 87 84 90 84 81 87 1.07 92 91 93 1.02
Cuba 4,630 28 1 1 - 97 96 98 97 96 98 1.02 94 95 93 0.98
Dominica 329 33 3 5 2 93 94 91 89 ... ... ... 109 * 111 * 108 * 0.98 *
Dominican Republic 104,949 36 8 10 6 86 ... ... 83 ... ... ... 92 88 96 1.09
Ecuador 40,294 -1 43 **, -1 2 **, -1 2 **, -1 2 **, -1 76 **, -1 75 **, -1 77 **, -1 73 **, -1 72 **, -1 73 **, -1 1.02 **, -1 101 **, -1 100 **, -1 101 **, -1 1.01 **, -1
El Salvador 67,059 40 6 7 5 69 ** 67 ** 72 ** 66 ** 65 ** 68 ** 1.06 ** 87 86 87 1.01
Grenada 553 39 3 ** 4 ** 3 ** 79 -2 73 -2 85 -2 83 -2 ... ... ... 93 ** 93 ** 92 ** 0.99 **
Guatemala 293,285 44 13 13 12 68 70 66 63 64 61 0.94 74 79 69 0.88
Guyana 1,077 40 1 1 1 ... ... ... ... ... ... ... 126 125 127 1.01
Haiti ... ... ... ... ... ... ... ... ... ... ... ... ... ... ... ...
Honduras 107,565 ** 43 ** 8 ** 9 ** 7 ** 70 ** 67 ** 73 ** 62 ** 59 ** 64 ** 1.08 ** 79 ** 77 ** 81 ** 1.06 **
Jamaica (p) 9,121 ** 40 ** 3 ** 3 ** 2 ** 89 -2 86 -2 92 -2 86 -2 82 -2 91 -2 1.10 -2 82 ** 81 ** 84 ** 1.03 **
Mexico (p) 682,138 38 5 6 4 94 93 94 92 91 92 1.02 100 99 100 1.02
Montserrat 34 44 7 7 6 ... ... ... ... ... ... ... 111 * 113 * 107 * 0.95 *
Netherlands Antilles 2,863 -2 37 **, -2 13 **, -2 16 **, -2 10 **, -2 ... ... ... ... ... ... ... 101 **, -2 94 **, -2 107 **, -2 1.14 **, -2
Nicaragua 93,105 42 10 11 9 54 51 56 51 48 54 1.11 76 73 80 1.09
Panama 24,265 39 6 7 5 85 85 86 82 82 83 1.01 97 97 97 1.00
Paraguay (p) 62,382 -1 39 -1 7 -1 8 -1 5 -1 81 -1 79 -1 83 -1 76 -1 74 -1 79 -1 1.06 -1 89 -1 88 -1 89 -1 1.02 -1
Peru (p) 364,447 48 9 9 9 90 90 90 85 86 85 0.99 99 99 98 0.99
Saint Kitts and Nevis . . . . . ... ... ... ... ... ... ... 109 * 110 * 108 * 0.98 *
Saint Lucia 648 45 3 3 3 96 96 96 96 95 97 1.02 96 98 93 0.94
Saint Vincent and the Grenadines 725 35 4 5 3 88 **, -2 ... ... 79 **, -2 ... ... ... 92 ** 81 ** 104 ** 1.28 **
Suriname 13,274 43 20 22 18 ... ... ... ... ... ... ... 87 78 97 1.25
Trinidad and Tobago 6,784 * 41 * 5 * 6 * 4 * 91 * 90 * 92 * 84 * 80 * 87 * 1.09 * 91 * 89 * 93 * 1.04 *
Turks and Caicos Islands 65 46 3 3 3 46 -2 42 -2 51 -2 45 -2 43 -2 48 -2 1.13 -2 92 ** 93 ** 91 ** 0.98 **
Uruguay (p) 27,318 -1 39 -1 7 -1 9 -1 6 -1 91 -1 90 -1 93 -1 90 -1 88 -1 91 -1 1.04 -1 91 -1 90 -1 92 -1 1.02 -1
Venezuela 233,700 37 7 8 5 91 88 95 89 85 93 1.10 92 89 95 1.06
North America and Western Europe
Andorra - ... - - - ... ... ... ... ... ... ... 60 * 61 * 58 * 0.94 *
Austria (p) ... ... ... ... ... ... ... ... ... ... ... ... ... ... ... ...
Belgium (p) ... ... ... ... ... ... ... ... ... ... ... ... ... ... ... ...
Canada (p) ... ... ... ... ... ... ... ... ... ... ... ... ... ... ... ...
Cyprus 145 44 - - - 99 100 98 100 100 99 0.99 100 * 100 * 100 * 1.00 *
Denmark (p) . . . . . 93 93 93 92 92 92 1.00 99 99 99 1.00
Finland (p) 1,731 31 - 1 - 99 99 100 99 99 100 1.01 100 100 99 0.99
France (p) ... ... ... ... ... ... ... ... ... ... ... ... ... ... ... ...
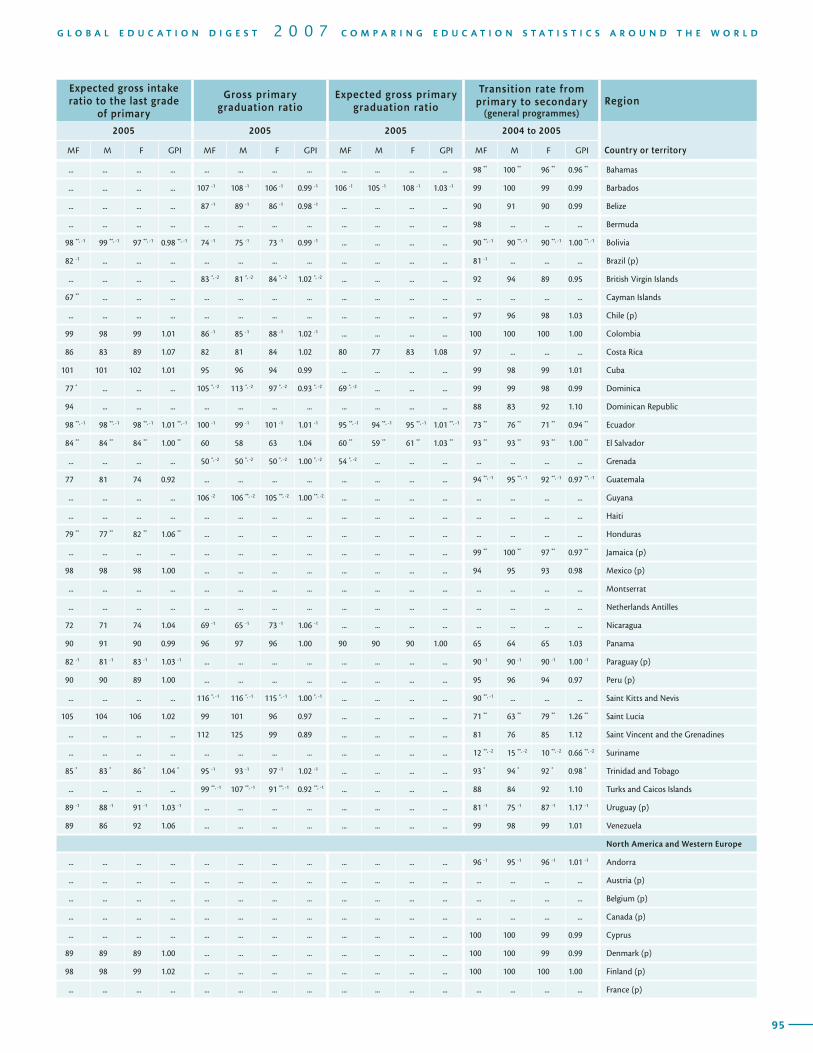
94
T A B L E MEASURES OF PROGRESSION AND COMPLETION IN PRIMARY EDUCATION / ISCED 1
RegionTotal number of repeaters
Percentage of repeaters
Survival rate to grade 5
Survival rate to last grade
Gross intake ratio to the last grade of primary
Country or territory
2005 2005 2004 to 2005 2004 to 2005 2005
MF % F MF M F MF M F MF M F GPI MF M F GPI
4
95
G L O B A L E D U C A T I O N D I G E S T 2 0 0 7 C O M P A R I N G E D U C A T I O N S T A T I S T I C S A R O U N D T H E W O R L D
Expected gross intake ratio to the last grade
of primary
Gross primary graduation ratio
Expected gross primary graduation ratio
Transition rate from primary to secondary
(general programmes)Region
2005 2005 2005 2004 to 2005
Country or territoryMF M F GPI MF M F GPI MF M F GPI MF M F GPI
... ... ... ... ... ... ... ... ... ... ... ... 98 ** 100 ** 96 ** 0.96 ** Bahamas
... ... ... ... 107 -1 108 -1 106 -1 0.99 -1 106 -1 105 -1 108 -1 1.03 -1 99 100 99 0.99 Barbados
... ... ... ... 87 -1 89 -1 86 -1 0.98 -1 ... ... ... ... 90 91 90 0.99 Belize
... ... ... ... ... ... ... ... ... ... ... ... 98 ... ... ... Bermuda
98 **, -1 99 **, -1 97 **, -1 0.98 **, -1 74 -1 75 -1 73 -1 0.99 -1 ... ... ... ... 90 **, -1 90 **, -1 90 **, -1 1.00 **, -1 Bolivia
82 -1 ... ... ... ... ... ... ... ... ... ... ... 81 -1 ... ... ... Brazil (p)
... ... ... ... 83 *, -2 81 *, -2 84 *, -2 1.02 *, -2 ... ... ... ... 92 94 89 0.95 British Virgin Islands
67 ** ... ... ... ... ... ... ... ... ... ... ... ... ... ... ... Cayman Islands
... ... ... ... ... ... ... ... ... ... ... ... 97 96 98 1.03 Chile (p)
99 98 99 1.01 86 -1 85 -1 88 -1 1.02 -1 ... ... ... ... 100 100 100 1.00 Colombia
86 83 89 1.07 82 81 84 1.02 80 77 83 1.08 97 ... ... ... Costa Rica
101 101 102 1.01 95 96 94 0.99 ... ... ... ... 99 98 99 1.01 Cuba
77 * ... ... ... 105 *, -2 113 *, -2 97 *, -2 0.93 *, -2 69 *, -2 ... ... ... 99 99 98 0.99 Dominica
94 ... ... ... ... ... ... ... ... ... ... ... 88 83 92 1.10 Dominican Republic
98 **, -1 98 **, -1 98 **, -1 1.01 **, -1 100 -1 99 -1 101 -1 1.01 -1 95 **, -1 94 **, -1 95 **, -1 1.01 **, -1 73 ** 76 ** 71 ** 0.94 ** Ecuador
84 ** 84 ** 84 ** 1.00 ** 60 58 63 1.04 60 ** 59 ** 61 ** 1.03 ** 93 ** 93 ** 93 ** 1.00 ** El Salvador
... ... ... ... 50 *, -2 50 *, -2 50 *, -2 1.00 *, -2 54 *, -2 ... ... ... ... ... ... ... Grenada
77 81 74 0.92 ... ... ... ... ... ... ... ... 94 **, -1 95 **, -1 92 **, -1 0.97 **, -1 Guatemala
... ... ... ... 106 -2 106 **, -2 105 **, -2 1.00 **, -2 ... ... ... ... ... ... ... ... Guyana
... ... ... ... ... ... ... ... ... ... ... ... ... ... ... ... Haiti
79 ** 77 ** 82 ** 1.06 ** ... ... ... ... ... ... ... ... ... ... ... ... Honduras
... ... ... ... ... ... ... ... ... ... ... ... 99 ** 100 ** 97 ** 0.97 ** Jamaica (p)
98 98 98 1.00 ... ... ... ... ... ... ... ... 94 95 93 0.98 Mexico (p)
... ... ... ... ... ... ... ... ... ... ... ... ... ... ... ... Montserrat
... ... ... ... ... ... ... ... ... ... ... ... ... ... ... ... Netherlands Antilles
72 71 74 1.04 69 -1 65 -1 73 -1 1.06 -1 ... ... ... ... ... ... ... ... Nicaragua
90 91 90 0.99 96 97 96 1.00 90 90 90 1.00 65 64 65 1.03 Panama
82 -1 81 -1 83 -1 1.03 -1 ... ... ... ... ... ... ... ... 90 -1 90 -1 90 -1 1.00 -1 Paraguay (p)
90 90 89 1.00 ... ... ... ... ... ... ... ... 95 96 94 0.97 Peru (p)
... ... ... ... 116 *, -1 116 *, -1 115 *, -1 1.00 *, -1 ... ... ... ... 90 **, -1 ... ... ... Saint Kitts and Nevis
105 104 106 1.02 99 101 96 0.97 ... ... ... ... 71 ** 63 ** 79 ** 1.26 ** Saint Lucia
... ... ... ... 112 125 99 0.89 ... ... ... ... 81 76 85 1.12 Saint Vincent and the Grenadines
... ... ... ... ... ... ... ... ... ... ... ... 12 **, -2 15 **, -2 10 **, -2 0.66 **, -2 Suriname
85 * 83 * 86 * 1.04 * 95 -1 93 -1 97 -1 1.02 -1 ... ... ... ... 93 * 94 * 92 * 0.98 * Trinidad and Tobago
... ... ... ... 99 **, -1 107 **, -1 91 **, -1 0.92 **, -1 ... ... ... ... 88 84 92 1.10 Turks and Caicos Islands
89 -1 88 -1 91 -1 1.03 -1 ... ... ... ... ... ... ... ... 81 -1 75 -1 87 -1 1.17 -1 Uruguay (p)
89 86 92 1.06 ... ... ... ... ... ... ... ... 99 98 99 1.01 Venezuela
North America and Western Europe
... ... ... ... ... ... ... ... ... ... ... ... 96 -1 95 -1 96 -1 1.01 -1 Andorra
... ... ... ... ... ... ... ... ... ... ... ... ... ... ... ... Austria (p)
... ... ... ... ... ... ... ... ... ... ... ... ... ... ... ... Belgium (p)
... ... ... ... ... ... ... ... ... ... ... ... ... ... ... ... Canada (p)
... ... ... ... ... ... ... ... ... ... ... ... 100 100 99 0.99 Cyprus
89 89 89 1.00 ... ... ... ... ... ... ... ... 100 100 99 0.99 Denmark (p)
98 98 99 1.02 ... ... ... ... ... ... ... ... 100 100 100 1.00 Finland (p)
... ... ... ... ... ... ... ... ... ... ... ... ... ... ... ... France (p)
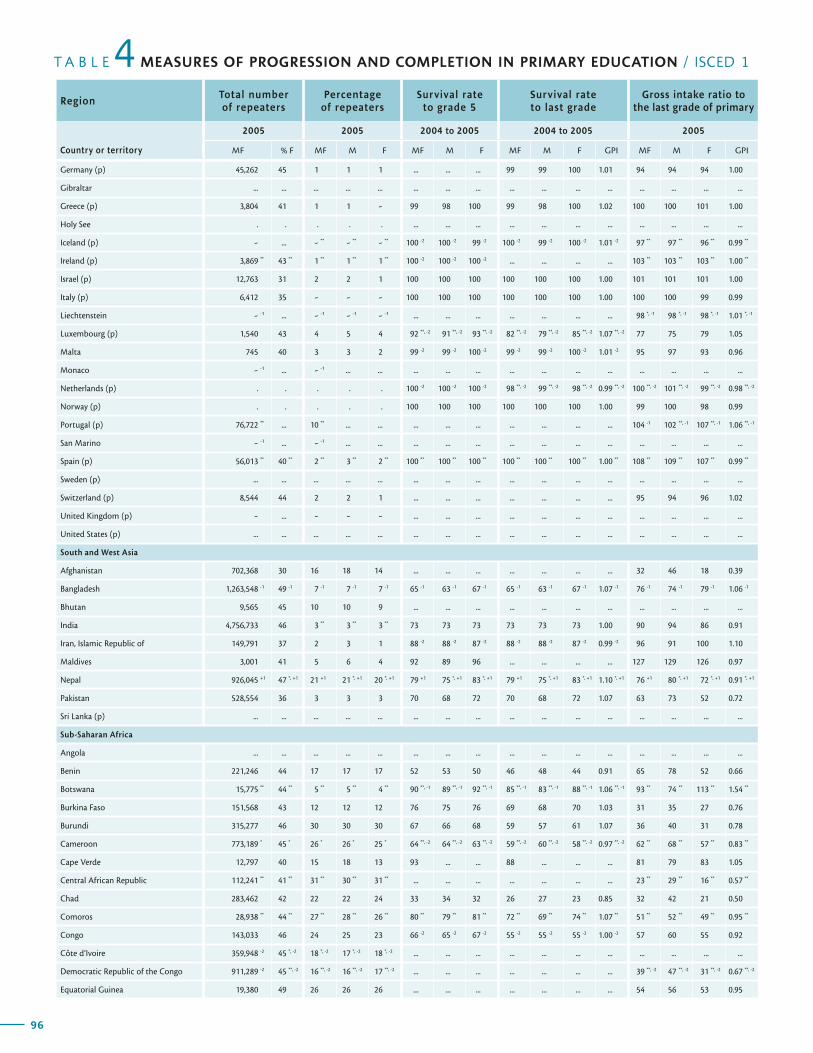
96
T A B L E MEASURES OF PROGRESSION AND COMPLETION IN PRIMARY EDUCATION / ISCED 1
RegionTotal number of repeaters
Percentage of repeaters
Survival rate to grade 5
Survival rate to last grade
Gross intake ratio to the last grade of primary
Country or territory
2005 2005 2004 to 2005 2004 to 2005 2005
MF % F MF M F MF M F MF M F GPI MF M F GPI
4
97
G L O B A L E D U C A T I O N D I G E S T 2 0 0 7 C O M P A R I N G E D U C A T I O N S T A T I S T I C S A R O U N D T H E W O R L D
Expected gross intake ratio to the last grade
of primary
Gross primary graduation ratio
Expected gross primary graduation ratio
Transition rate from primary to secondary
(general programmes)Region
2005 2005 2005 2004 to 2005
Country or territoryMF M F GPI MF M F GPI MF M F GPI MF M F GPI
Germany (p) 45,262 45 1 1 1 ... ... ... 99 99 100 1.01 94 94 94 1.00
Gibraltar ... ... ... ... ... ... ... ... ... ... ... ... ... ... ... ...
Greece (p) 3,804 41 1 1 - 99 98 100 99 98 100 1.02 100 100 101 1.00
Holy See . . . . . ... ... ... ... ... ... ... ... ... ... ...
Iceland (p) - ... - ** - ** - ** 100 -2 100 -2 99 -2 100 -2 99 -2 100 -2 1.01 -2 97 ** 97 ** 96 ** 0.99 **
Ireland (p) 3,869 ** 43 ** 1 ** 1 ** 1 ** 100 -2 100 -2 100 -2 ... ... ... ... 103 ** 103 ** 103 ** 1.00 **
Israel (p) 12,763 31 2 2 1 100 100 100 100 100 100 1.00 101 101 101 1.00
Italy (p) 6,412 35 - - - 100 100 100 100 100 100 1.00 100 100 99 0.99
Liechtenstein - -1 ... - -1 - -1 - -1 ... ... ... ... ... ... ... 98 *, -1 98 *, -1 98 *, -1 1.01 *, -1
Luxembourg (p) 1,540 43 4 5 4 92 **, -2 91 **, -2 93 **, -2 82 **, -2 79 **, -2 85 **, -2 1.07 **, -2 77 75 79 1.05
Malta 745 40 3 3 2 99 -2 99 -2 100 -2 99 -2 99 -2 100 -2 1.01 -2 95 97 93 0.96
Monaco - -1 ... - -1 ... ... ... ... ... ... ... ... ... ... ... ... ...
Netherlands (p) . . . . . 100 -2 100 -2 100 -2 98 **, -2 99 **, -2 98 **, -2 0.99 **, -2 100 **, -2 101 **, -2 99 **, -2 0.98 **, -2
Norway (p) . . . . . 100 100 100 100 100 100 1.00 99 100 98 0.99
Portugal (p) 76,722 ** ... 10 ** ... ... ... ... ... ... ... ... ... 104 -1 102 **, -1 107 **, -1 1.06 **, -1
San Marino - -1 ... - -1 ... ... ... ... ... ... ... ... ... ... ... ... ...
Spain (p) 56,013 ** 40 ** 2 ** 3 ** 2 ** 100 ** 100 ** 100 ** 100 ** 100 ** 100 ** 1.00 ** 108 ** 109 ** 107 ** 0.99 **
Sweden (p) ... ... ... ... ... ... ... ... ... ... ... ... ... ... ... ...
Switzerland (p) 8,544 44 2 2 1 ... ... ... ... ... ... ... 95 94 96 1.02
United Kingdom (p) - ... - - - ... ... ... ... ... ... ... ... ... ... ...
United States (p) ... ... ... ... ... ... ... ... ... ... ... ... ... ... ... ...
South and West Asia
Afghanistan 702,368 30 16 18 14 ... ... ... ... ... ... ... 32 46 18 0.39
Bangladesh 1,263,548 -1 49 -1 7 -1 7 -1 7 -1 65 -1 63 -1 67 -1 65 -1 63 -1 67 -1 1.07 -1 76 -1 74 -1 79 -1 1.06 -1
Bhutan 9,565 45 10 10 9 ... ... ... ... ... ... ... ... ... ... ...
India 4,756,733 46 3 ** 3 ** 3 ** 73 73 73 73 73 73 1.00 90 94 86 0.91
Iran, Islamic Republic of 149,791 37 2 3 1 88 -2 88 -2 87 -2 88 -2 88 -2 87 -2 0.99 -2 96 91 100 1.10
Maldives 3,001 41 5 6 4 92 89 96 ... ... ... ... 127 129 126 0.97
Nepal 926,045 +1 47 *, +1 21 +1 21 *, +1 20 *, +1 79 +1 75 *, +1 83 *, +1 79 +1 75 *, +1 83 *, +1 1.10 *, +1 76 +1 80 *, +1 72 *, +1 0.91 *, +1
Pakistan 528,554 36 3 3 3 70 68 72 70 68 72 1.07 63 73 52 0.72
Sri Lanka (p) ... ... ... ... ... ... ... ... ... ... ... ... ... ... ... ...
Sub-Saharan Africa
Angola ... ... ... ... ... ... ... ... ... ... ... ... ... ... ... ...
Benin 221,246 44 17 17 17 52 53 50 46 48 44 0.91 65 78 52 0.66
Botswana 15,775 ** 44 ** 5 ** 5 ** 4 ** 90 **, -1 89 **, -1 92 **, -1 85 **, -1 83 **, -1 88 **, -1 1.06 **, -1 93 ** 74 ** 113 ** 1.54 **
Burkina Faso 151,568 43 12 12 12 76 75 76 69 68 70 1.03 31 35 27 0.76
Burundi 315,277 46 30 30 30 67 66 68 59 57 61 1.07 36 40 31 0.78
Cameroon 773,189 * 45 * 26 * 26 * 25 * 64 **, -2 64 **, -2 63 **, -2 59 **, -2 60 **, -2 58 **, -2 0.97 **, -2 62 ** 68 ** 57 ** 0.83 **
Cape Verde 12,797 40 15 18 13 93 ... ... 88 ... ... ... 81 79 83 1.05
Central African Republic 112,241 ** 41 ** 31 ** 30 ** 31 ** ... ... ... ... ... ... ... 23 ** 29 ** 16 ** 0.57 **
Chad 283,462 42 22 22 24 33 34 32 26 27 23 0.85 32 42 21 0.50
Comoros 28,938 ** 44 ** 27 ** 28 ** 26 ** 80 ** 79 ** 81 ** 72 ** 69 ** 74 ** 1.07 ** 51 ** 52 ** 49 ** 0.95 **
Congo 143,033 46 24 25 23 66 -2 65 -2 67 -2 55 -2 55 -2 55 -2 1.00 -2 57 60 55 0.92
Côte d’Ivoire 359,948 -2 45 *, -2 18 *, -2 17 *, -2 18 *, -2 ... ... ... ... ... ... ... ... ... ... ...
Democratic Republic of the Congo 911,289 -2 45 **, -2 16 **, -2 16 **, -2 17 **, -2 ... ... ... ... ... ... ... 39 **, -2 47 **, -2 31 **, -2 0.67 **, -2
Equatorial Guinea 19,380 49 26 26 26 ... ... ... ... ... ... ... 54 56 53 0.95
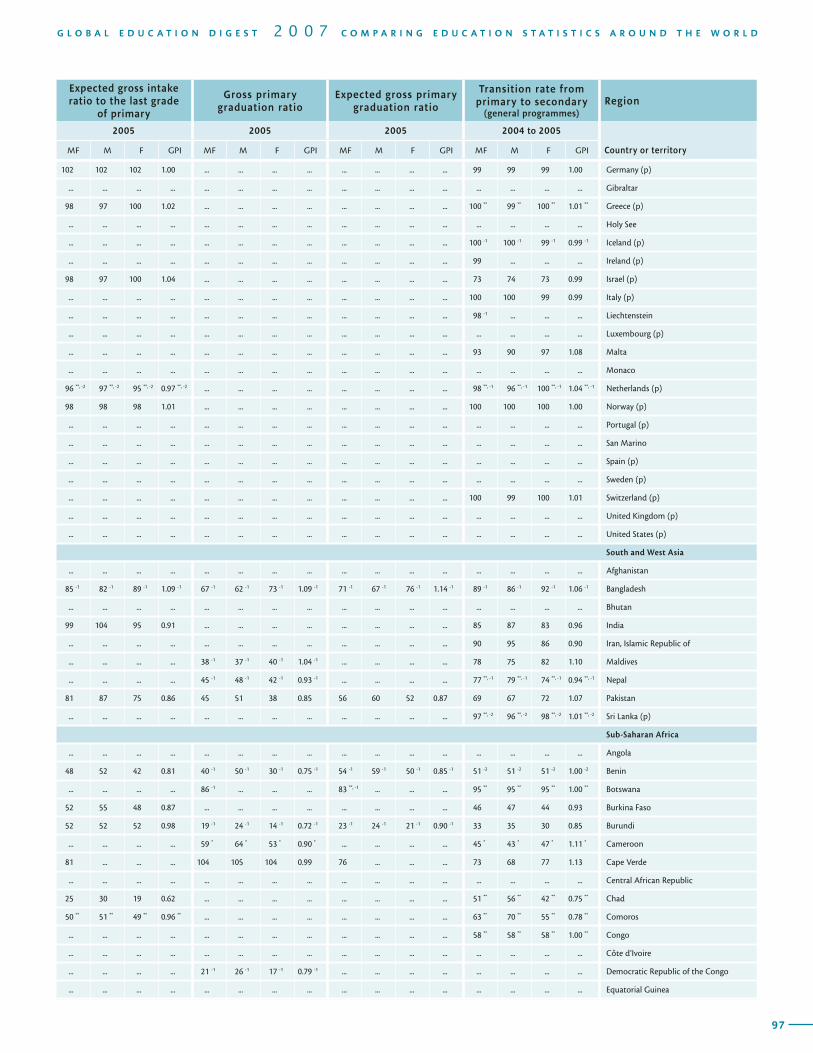
96
T A B L E MEASURES OF PROGRESSION AND COMPLETION IN PRIMARY EDUCATION / ISCED 1
RegionTotal number of repeaters
Percentage of repeaters
Survival rate to grade 5
Survival rate to last grade
Gross intake ratio to the last grade of primary
Country or territory
2005 2005 2004 to 2005 2004 to 2005 2005
MF % F MF M F MF M F MF M F GPI MF M F GPI
4
97
G L O B A L E D U C A T I O N D I G E S T 2 0 0 7 C O M P A R I N G E D U C A T I O N S T A T I S T I C S A R O U N D T H E W O R L D
Expected gross intake ratio to the last grade
of primary
Gross primary graduation ratio
Expected gross primary graduation ratio
Transition rate from primary to secondary
(general programmes)Region
2005 2005 2005 2004 to 2005
Country or territoryMF M F GPI MF M F GPI MF M F GPI MF M F GPI
102 102 102 1.00 ... ... ... ... ... ... ... ... 99 99 99 1.00 Germany (p)
... ... ... ... ... ... ... ... ... ... ... ... ... ... ... ... Gibraltar
98 97 100 1.02 ... ... ... ... ... ... ... ... 100 ** 99 ** 100 ** 1.01 ** Greece (p)
... ... ... ... ... ... ... ... ... ... ... ... ... ... ... ... Holy See
... ... ... ... ... ... ... ... ... ... ... ... 100 -1 100 -1 99 -1 0.99 -1 Iceland (p)
... ... ... ... ... ... ... ... ... ... ... ... 99 ... ... ... Ireland (p)
98 97 100 1.04 ... ... ... ... ... ... ... ... 73 74 73 0.99 Israel (p)
... ... ... ... ... ... ... ... ... ... ... ... 100 100 99 0.99 Italy (p)
... ... ... ... ... ... ... ... ... ... ... ... 98 -1 ... ... ... Liechtenstein
... ... ... ... ... ... ... ... ... ... ... ... ... ... ... ... Luxembourg (p)
... ... ... ... ... ... ... ... ... ... ... ... 93 90 97 1.08 Malta
... ... ... ... ... ... ... ... ... ... ... ... ... ... ... ... Monaco
96 **, -2 97 **, -2 95 **, -2 0.97 **, -2 ... ... ... ... ... ... ... ... 98 **, -1 96 **, -1 100 **, -1 1.04 **, -1 Netherlands (p)
98 98 98 1.01 ... ... ... ... ... ... ... ... 100 100 100 1.00 Norway (p)
... ... ... ... ... ... ... ... ... ... ... ... ... ... ... ... Portugal (p)
... ... ... ... ... ... ... ... ... ... ... ... ... ... ... ... San Marino
... ... ... ... ... ... ... ... ... ... ... ... ... ... ... ... Spain (p)
... ... ... ... ... ... ... ... ... ... ... ... ... ... ... ... Sweden (p)
... ... ... ... ... ... ... ... ... ... ... ... 100 99 100 1.01 Switzerland (p)
... ... ... ... ... ... ... ... ... ... ... ... ... ... ... ... United Kingdom (p)
... ... ... ... ... ... ... ... ... ... ... ... ... ... ... ... United States (p)
South and West Asia
... ... ... ... ... ... ... ... ... ... ... ... ... ... ... ... Afghanistan
85 -1 82 -1 89 -1 1.09 -1 67 -1 62 -1 73 -1 1.09 -1 71 -1 67 -1 76 -1 1.14 -1 89 -1 86 -1 92 -1 1.06 -1 Bangladesh
... ... ... ... ... ... ... ... ... ... ... ... ... ... ... ... Bhutan
99 104 95 0.91 ... ... ... ... ... ... ... ... 85 87 83 0.96 India
... ... ... ... ... ... ... ... ... ... ... ... 90 95 86 0.90 Iran, Islamic Republic of
... ... ... ... 38 -1 37 -1 40 -1 1.04 -1 ... ... ... ... 78 75 82 1.10 Maldives
... ... ... ... 45 -1 48 -1 42 -1 0.93 -1 ... ... ... ... 77 **, -1 79 **, -1 74 **, -1 0.94 **, -1 Nepal
81 87 75 0.86 45 51 38 0.85 56 60 52 0.87 69 67 72 1.07 Pakistan
... ... ... ... ... ... ... ... ... ... ... ... 97 **, -2 96 **, -2 98 **, -2 1.01 **, -2 Sri Lanka (p)
Sub-Saharan Africa
... ... ... ... ... ... ... ... ... ... ... ... ... ... ... ... Angola
48 52 42 0.81 40 -1 50 -1 30 -1 0.75 -1 54 -1 59 -1 50 -1 0.85 -1 51 -2 51 -2 51 -2 1.00 -2 Benin
... ... ... ... 86 -1 ... ... ... 83 **, -1 ... ... ... 95 ** 95 ** 95 ** 1.00 ** Botswana
52 55 48 0.87 ... ... ... ... ... ... ... ... 46 47 44 0.93 Burkina Faso
52 52 52 0.98 19 -1 24 -1 14 -1 0.72 -1 23 -1 24 -1 21 -1 0.90 -1 33 35 30 0.85 Burundi
... ... ... ... 59 * 64 * 53 * 0.90 * ... ... ... ... 45 * 43 * 47 * 1.11 * Cameroon
81 ... ... ... 104 105 104 0.99 76 ... ... ... 73 68 77 1.13 Cape Verde
... ... ... ... ... ... ... ... ... ... ... ... ... ... ... ... Central African Republic
25 30 19 0.62 ... ... ... ... ... ... ... ... 51 ** 56 ** 42 ** 0.75 ** Chad
50 ** 51 ** 49 ** 0.96 ** ... ... ... ... ... ... ... ... 63 ** 70 ** 55 ** 0.78 ** Comoros
... ... ... ... ... ... ... ... ... ... ... ... 58 ** 58 ** 58 ** 1.00 ** Congo
... ... ... ... ... ... ... ... ... ... ... ... ... ... ... ... Côte d’Ivoire
... ... ... ... 21 -1 26 -1 17 -1 0.79 -1 ... ... ... ... ... ... ... ... Democratic Republic of the Congo
... ... ... ... ... ... ... ... ... ... ... ... ... ... ... ... Equatorial Guinea
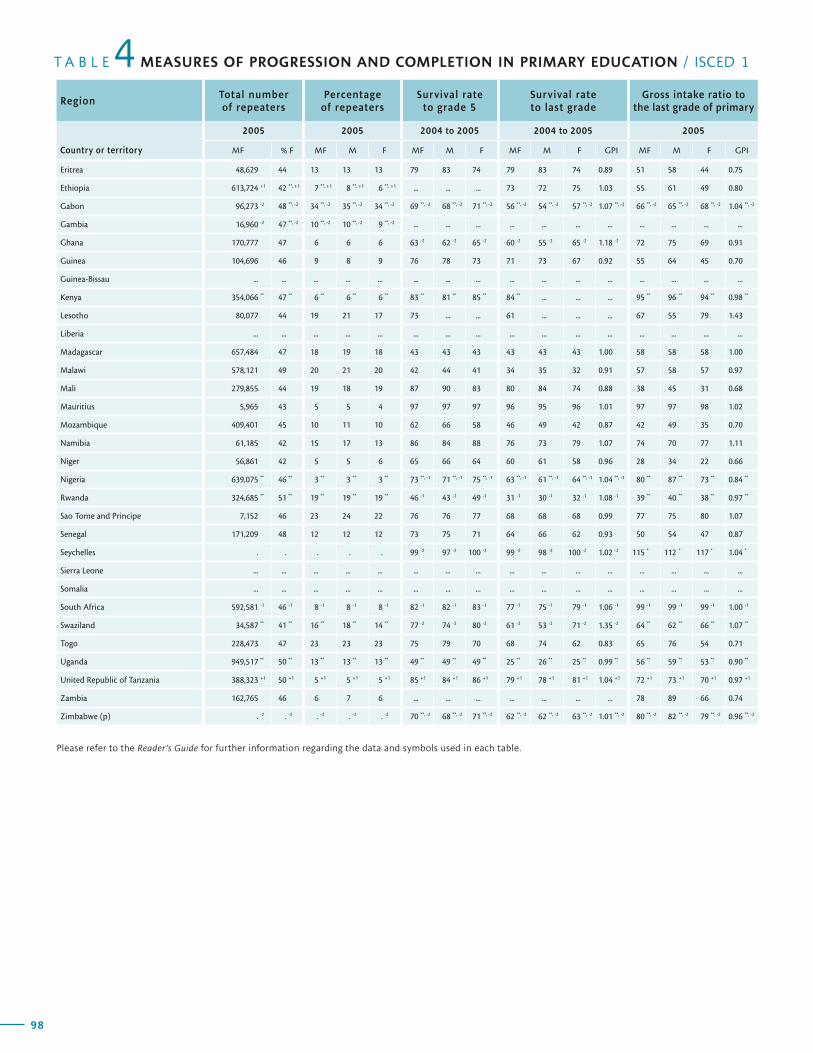
98
T A B L E MEASURES OF PROGRESSION AND COMPLETION IN PRIMARY EDUCATION / ISCED 1
RegionTotal number of repeaters
Percentage of repeaters
Survival rate to grade 5
Survival rate to last grade
Gross intake ratio to the last grade of primary
Country or territory
2005 2005 2004 to 2005 2004 to 2005 2005
MF % F MF M F MF M F MF M F GPI MF M F GPI
4
99
G L O B A L E D U C A T I O N D I G E S T 2 0 0 7 C O M P A R I N G E D U C A T I O N S T A T I S T I C S A R O U N D T H E W O R L D
Expected gross intake ratio to the last grade
of primary
Gross primary graduation ratio
Expected gross primary graduation ratio
Transition rate from primary to secondary
(general programmes)Region
2005 2005 2005 2004 to 2005
Country or territoryMF M F GPI MF M F GPI MF M F GPI MF M F GPI
Eritrea 48,629 44 13 13 13 79 83 74 79 83 74 0.89 51 58 44 0.75
Ethiopia 613,724 +1 42 **, +1 7 **, +1 8 **, +1 6 **, +1 ... ... ... 73 72 75 1.03 55 61 49 0.80
Gabon 96,273 -2 48 **, -2 34 **, -2 35 **, -2 34 **, -2 69 **, -2 68 **, -2 71 **, -2 56 **, -2 54 **, -2 57 **, -2 1.07 **, -2 66 **, -2 65 **, -2 68 **, -2 1.04 **, -2
Gambia 16,960 -2 47 **, -2 10 **, -2 10 **, -2 9 **, -2 ... ... ... ... ... ... ... ... ... ... ...
Ghana 170,777 47 6 6 6 63 -2 62 -2 65 -2 60 -2 55 -2 65 -2 1.18 -2 72 75 69 0.91
Guinea 104,696 46 9 8 9 76 78 73 71 73 67 0.92 55 64 45 0.70
Guinea-Bissau ... ... ... ... ... ... ... ... ... ... ... ... ... ... ... ...
Kenya 354,066 ** 47 ** 6 ** 6 ** 6 ** 83 ** 81 ** 85 ** 84 ** ... ... ... 95 ** 96 ** 94 ** 0.98 **
Lesotho 80,077 44 19 21 17 73 ... ... 61 ... ... ... 67 55 79 1.43
Liberia ... ... ... ... ... ... ... ... ... ... ... ... ... ... ... ...
Madagascar 657,484 47 18 19 18 43 43 43 43 43 43 1.00 58 58 58 1.00
Malawi 578,121 49 20 21 20 42 44 41 34 35 32 0.91 57 58 57 0.97
Mali 279,855 44 19 18 19 87 90 83 80 84 74 0.88 38 45 31 0.68
Mauritius 5,965 43 5 5 4 97 97 97 96 95 96 1.01 97 97 98 1.02
Mozambique 409,401 45 10 11 10 62 66 58 46 49 42 0.87 42 49 35 0.70
Namibia 61,185 42 15 17 13 86 84 88 76 73 79 1.07 74 70 77 1.11
Niger 56,861 42 5 5 6 65 66 64 60 61 58 0.96 28 34 22 0.66
Nigeria 639,075 ** 46 ** 3 ** 3 ** 3 ** 73 **, -1 71 **, -1 75 **, -1 63 **, -1 61 **, -1 64 **, -1 1.04 **, -1 80 ** 87 ** 73 ** 0.84 **
Rwanda 324,685 ** 51 ** 19 ** 19 ** 19 ** 46 -1 43 -1 49 -1 31 -1 30 -1 32 -1 1.08 -1 39 ** 40 ** 38 ** 0.97 **
Sao Tome and Principe 7,152 46 23 24 22 76 76 77 68 68 68 0.99 77 75 80 1.07
Senegal 171,209 48 12 12 12 73 75 71 64 66 62 0.93 50 54 47 0.87
Seychelles . . . . . 99 -2 97 -2 100 -2 99 -2 98 -2 100 -2 1.02 -2 115 * 112 * 117 * 1.04 *
Sierra Leone ... ... ... ... ... ... ... ... ... ... ... ... ... ... ... ...
Somalia ... ... ... ... ... ... ... ... ... ... ... ... ... ... ... ...
South Africa 592,581 -1 46 -1 8 -1 8 -1 8 -1 82 -1 82 -1 83 -1 77 -1 75 -1 79 -1 1.06 -1 99 -1 99 -1 99 -1 1.00 -1
Swaziland 34,587 ** 41 ** 16 ** 18 ** 14 ** 77 -2 74 -2 80 -2 61 -2 53 -2 71 -2 1.35 -2 64 ** 62 ** 66 ** 1.07 **
Togo 228,473 47 23 23 23 75 79 70 68 74 62 0.83 65 76 54 0.71
Uganda 949,517 ** 50 ** 13 ** 13 ** 13 ** 49 ** 49 ** 49 ** 25 ** 26 ** 25 ** 0.99 ** 56 ** 59 ** 53 ** 0.90 **
United Republic of Tanzania 388,323 +1 50 +1 5 +1 5 +1 5 +1 85 +1 84 +1 86 +1 79 +1 78 +1 81 +1 1.04 +1 72 +1 73 +1 70 +1 0.97 +1
Zambia 162,765 46 6 7 6 ... ... ... ... ... ... ... 78 89 66 0.74
Zimbabwe (p) . -2 . -2 . -2 . -2 . -2 70 **, -2 68 **, -2 71 **, -2 62 **, -2 62 **, -2 63 **, -2 1.01 **, -2 80 **, -2 82 **, -2 79 **, -2 0.96 **, -2
Please refer to the Reader’s Guide for further information regarding the data and symbols used in each table.
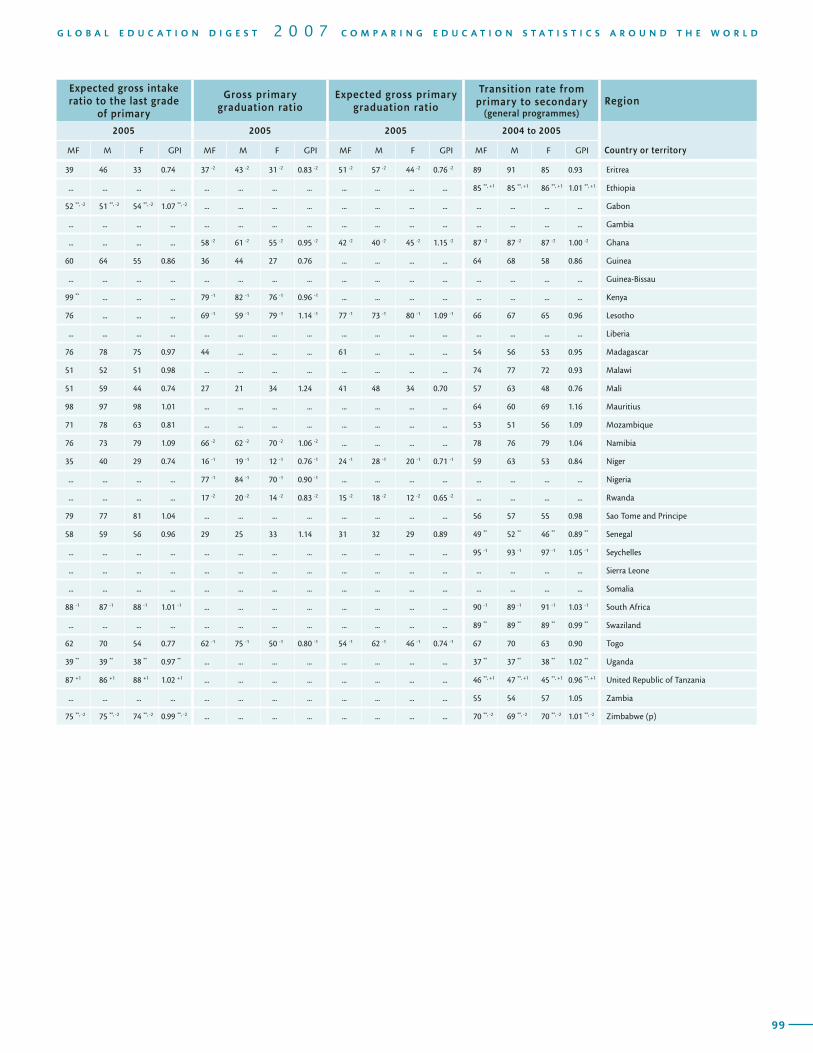
98
T A B L E MEASURES OF PROGRESSION AND COMPLETION IN PRIMARY EDUCATION / ISCED 1
RegionTotal number of repeaters
Percentage of repeaters
Survival rate to grade 5
Survival rate to last grade
Gross intake ratio to the last grade of primary
Country or territory
2005 2005 2004 to 2005 2004 to 2005 2005
MF % F MF M F MF M F MF M F GPI MF M F GPI
4
99
G L O B A L E D U C A T I O N D I G E S T 2 0 0 7 C O M P A R I N G E D U C A T I O N S T A T I S T I C S A R O U N D T H E W O R L D
Expected gross intake ratio to the last grade
of primary
Gross primary graduation ratio
Expected gross primary graduation ratio
Transition rate from primary to secondary
(general programmes)Region
2005 2005 2005 2004 to 2005
Country or territoryMF M F GPI MF M F GPI MF M F GPI MF M F GPI
39 46 33 0.74 37 -2 43 -2 31 -2 0.83 -2 51 -2 57 -2 44 -2 0.76 -2 89 91 85 0.93 Eritrea
... ... ... ... ... ... ... ... ... ... ... ... 85 **, +1 85 **, +1 86 **, +1 1.01 **, +1 Ethiopia
52 **, -2 51 **, -2 54 **, -2 1.07 **, -2 ... ... ... ... ... ... ... ... ... ... ... ... Gabon
... ... ... ... ... ... ... ... ... ... ... ... ... ... ... ... Gambia
... ... ... ... 58 -2 61 -2 55 -2 0.95 -2 42 -2 40 -2 45 -2 1.15 -2 87 -2 87 -2 87 -2 1.00 -2 Ghana
60 64 55 0.86 36 44 27 0.76 ... ... ... ... 64 68 58 0.86 Guinea
... ... ... ... ... ... ... ... ... ... ... ... ... ... ... ... Guinea-Bissau
99 ** ... ... ... 79 -1 82 -1 76 -1 0.96 -1 ... ... ... ... ... ... ... ... Kenya
76 ... ... ... 69 -1 59 -1 79 -1 1.14 -1 77 -1 73 -1 80 -1 1.09 -1 66 67 65 0.96 Lesotho
... ... ... ... ... ... ... ... ... ... ... ... ... ... ... ... Liberia
76 78 75 0.97 44 ... ... ... 61 ... ... ... 54 56 53 0.95 Madagascar
51 52 51 0.98 ... ... ... ... ... ... ... ... 74 77 72 0.93 Malawi
51 59 44 0.74 27 21 34 1.24 41 48 34 0.70 57 63 48 0.76 Mali
98 97 98 1.01 ... ... ... ... ... ... ... ... 64 60 69 1.16 Mauritius
71 78 63 0.81 ... ... ... ... ... ... ... ... 53 51 56 1.09 Mozambique
76 73 79 1.09 66 -2 62 -2 70 -2 1.06 -2 ... ... ... ... 78 76 79 1.04 Namibia
35 40 29 0.74 16 -1 19 -1 12 -1 0.76 -1 24 -1 28 -1 20 -1 0.71 -1 59 63 53 0.84 Niger
... ... ... ... 77 -1 84 -1 70 -1 0.90 -1 ... ... ... ... ... ... ... ... Nigeria
... ... ... ... 17 -2 20 -2 14 -2 0.83 -2 15 -2 18 -2 12 -2 0.65 -2 ... ... ... ... Rwanda
79 77 81 1.04 ... ... ... ... ... ... ... ... 56 57 55 0.98 Sao Tome and Principe
58 59 56 0.96 29 25 33 1.14 31 32 29 0.89 49 ** 52 ** 46 ** 0.89 ** Senegal
... ... ... ... ... ... ... ... ... ... ... ... 95 -1 93 -1 97 -1 1.05 -1 Seychelles
... ... ... ... ... ... ... ... ... ... ... ... ... ... ... ... Sierra Leone
... ... ... ... ... ... ... ... ... ... ... ... ... ... ... ... Somalia
88 -1 87 -1 88 -1 1.01 -1 ... ... ... ... ... ... ... ... 90 -1 89 -1 91 -1 1.03 -1 South Africa
... ... ... ... ... ... ... ... ... ... ... ... 89 ** 89 ** 89 ** 0.99 ** Swaziland
62 70 54 0.77 62 -1 75 -1 50 -1 0.80 -1 54 -1 62 -1 46 -1 0.74 -1 67 70 63 0.90 Togo
39 ** 39 ** 38 ** 0.97 ** ... ... ... ... ... ... ... ... 37 ** 37 ** 38 ** 1.02 ** Uganda
87 +1 86 +1 88 +1 1.02 +1 ... ... ... ... ... ... ... ... 46 **, +1 47 **, +1 45 **, +1 0.96 **, +1 United Republic of Tanzania
... ... ... ... ... ... ... ... ... ... ... ... 55 54 57 1.05 Zambia
75 **, -2 75 **, -2 74 **, -2 0.99 **, -2 ... ... ... ... ... ... ... ... 70 **, -2 69 **, -2 70 **, -2 1.01 **, -2 Zimbabwe (p)
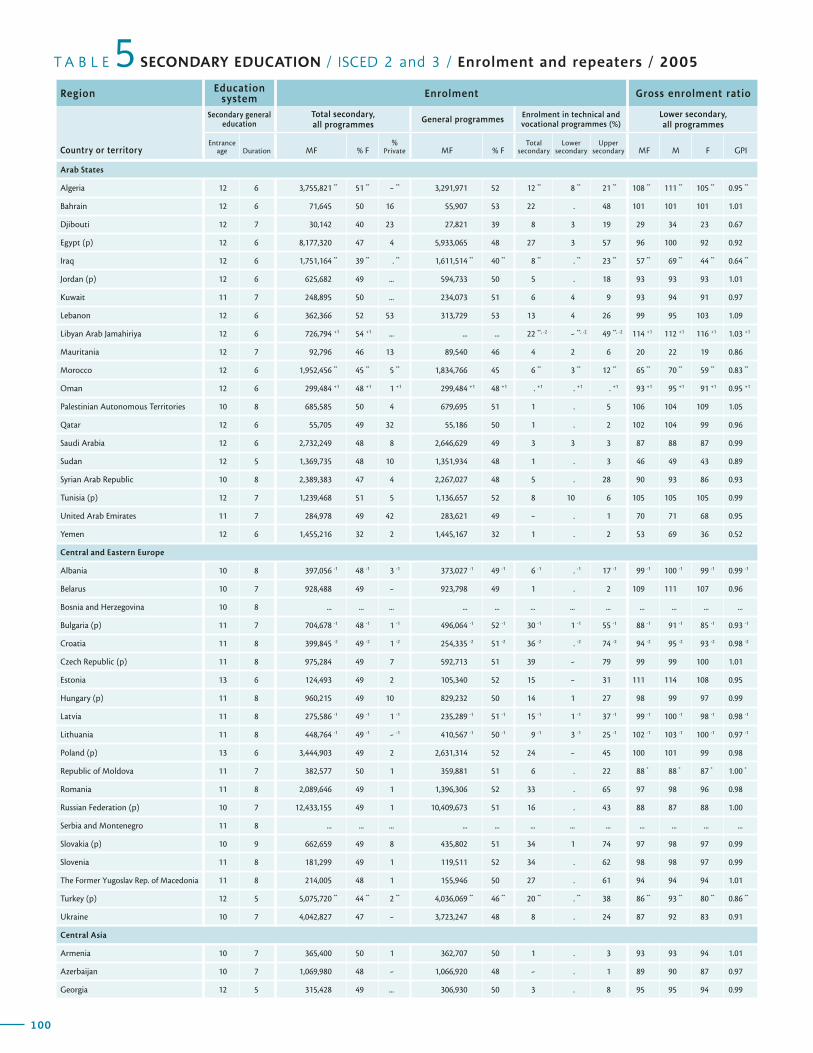
100
T A B L E SECONDARY EDUCATION / ISCED 2 and 3 / Enrolment and repeaters / 20055Region Education
system Enrolment Gross enrolment ratio
Country or territory
Secondary general education
Total secondary, all programmes
General programmes Enrolment in technical and vocational programmes (%)
Lower secondary, all programmes
Entrance age Duration MF % F
%Private MF % F
Total secondary
Lower secondary
Upper secondary MF M F GPI
101
G L O B A L E D U C A T I O N D I G E S T 2 0 0 7 C O M P A R I N G E D U C A T I O N S T A T I S T I C S A R O U N D T H E W O R L D
Gross enrolment ratio Gross enrolment ratio Net enrolment ratePercentage
of repeatersRegion
Upper secondary, all programmes
Total secondary, all programmes
Total secondary, all programmes
Total secondary, general programmes
Country or territoryMF M F GPI MF M F GPI MF M F GPI MF M F
Arab States
Algeria 12 6 3,755,821 ** 51 ** - ** 3,291,971 52 12 ** 8 ** 21 ** 108 ** 111 ** 105 ** 0.95 **
Bahrain 12 6 71,645 50 16 55,907 53 22 . 48 101 101 101 1.01
Djibouti 12 7 30,142 40 23 27,821 39 8 3 19 29 34 23 0.67
Egypt (p) 12 6 8,177,320 47 4 5,933,065 48 27 3 57 96 100 92 0.92
Iraq 12 6 1,751,164 ** 39 ** . ** 1,611,514 ** 40 ** 8 ** . ** 23 ** 57 ** 69 ** 44 ** 0.64 **
Jordan (p) 12 6 625,682 49 ... 594,733 50 5 . 18 93 93 93 1.01
Kuwait 11 7 248,895 50 ... 234,073 51 6 4 9 93 94 91 0.97
Lebanon 12 6 362,366 52 53 313,729 53 13 4 26 99 95 103 1.09
Libyan Arab Jamahiriya 12 6 726,794 +1 54 +1 ... ... ... 22 **, -2 - **, -2 49 **, -2 114 +1 112 +1 116 +1 1.03 +1
Mauritania 12 7 92,796 46 13 89,540 46 4 2 6 20 22 19 0.86
Morocco 12 6 1,952,456 ** 45 ** 5 ** 1,834,766 45 6 ** 3 ** 12 ** 65 ** 70 ** 59 ** 0.83 **
Oman 12 6 299,484 +1 48 +1 1 +1 299,484 +1 48 +1 . +1 . +1 . +1 93 +1 95 +1 91 +1 0.95 +1
Palestinian Autonomous Territories 10 8 685,585 50 4 679,695 51 1 . 5 106 104 109 1.05
Qatar 12 6 55,705 49 32 55,186 50 1 . 2 102 104 99 0.96
Saudi Arabia 12 6 2,732,249 48 8 2,646,629 49 3 3 3 87 88 87 0.99
Sudan 12 5 1,369,735 48 10 1,351,934 48 1 . 3 46 49 43 0.89
Syrian Arab Republic 10 8 2,389,383 47 4 2,267,027 48 5 . 28 90 93 86 0.93
Tunisia (p) 12 7 1,239,468 51 5 1,136,657 52 8 10 6 105 105 105 0.99
United Arab Emirates 11 7 284,978 49 42 283,621 49 - . 1 70 71 68 0.95
Yemen 12 6 1,455,216 32 2 1,445,167 32 1 . 2 53 69 36 0.52
Central and Eastern Europe
Albania 10 8 397,056 -1 48 -1 3 -1 373,027 -1 49 -1 6 -1 . -1 17 -1 99 -1 100 -1 99 -1 0.99 -1
Belarus 10 7 928,488 49 - 923,798 49 1 . 2 109 111 107 0.96
Bosnia and Herzegovina 10 8 ... ... ... ... ... ... ... ... ... ... ... ...
Bulgaria (p) 11 7 704,678 -1 48 -1 1 -1 496,064 -1 52 -1 30 -1 1 -1 55 -1 88 -1 91 -1 85 -1 0.93 -1
Croatia 11 8 399,845 -2 49 -2 1 -2 254,335 -2 51 -2 36 -2 . -2 74 -2 94 -2 95 -2 93 -2 0.98 -2
Czech Republic (p) 11 8 975,284 49 7 592,713 51 39 - 79 99 99 100 1.01
Estonia 13 6 124,493 49 2 105,340 52 15 - 31 111 114 108 0.95
Hungary (p) 11 8 960,215 49 10 829,232 50 14 1 27 98 99 97 0.99
Latvia 11 8 275,586 -1 49 -1 1 -1 235,289 -1 51 -1 15 -1 1 -1 37 -1 99 -1 100 -1 98 -1 0.98 -1
Lithuania 11 8 448,764 -1 49 -1 - -1 410,567 -1 50 -1 9 -1 3 -1 25 -1 102 -1 103 -1 100 -1 0.97 -1
Poland (p) 13 6 3,444,903 49 2 2,631,314 52 24 - 45 100 101 99 0.98
Republic of Moldova 11 7 382,577 50 1 359,881 51 6 . 22 88 * 88 * 87 * 1.00 *
Romania 11 8 2,089,646 49 1 1,396,306 52 33 . 65 97 98 96 0.98
Russian Federation (p) 10 7 12,433,155 49 1 10,409,673 51 16 . 43 88 87 88 1.00
Serbia and Montenegro 11 8 ... ... ... ... ... ... ... ... ... ... ... ...
Slovakia (p) 10 9 662,659 49 8 435,802 51 34 1 74 97 98 97 0.99
Slovenia 11 8 181,299 49 1 119,511 52 34 . 62 98 98 97 0.99
The Former Yugoslav Rep. of Macedonia 11 8 214,005 48 1 155,946 50 27 . 61 94 94 94 1.01
Turkey (p) 12 5 5,075,720 ** 44 ** 2 ** 4,036,069 ** 46 ** 20 ** . ** 38 86 ** 93 ** 80 ** 0.86 **
Ukraine 10 7 4,042,827 47 - 3,723,247 48 8 . 24 87 92 83 0.91
Central Asia
Armenia 10 7 365,400 50 1 362,707 50 1 . 3 93 93 94 1.01
Azerbaijan 10 7 1,069,980 48 - 1,066,920 48 - . 1 89 90 87 0.97
Georgia 12 5 315,428 49 ... 306,930 50 3 . 8 95 95 94 0.99
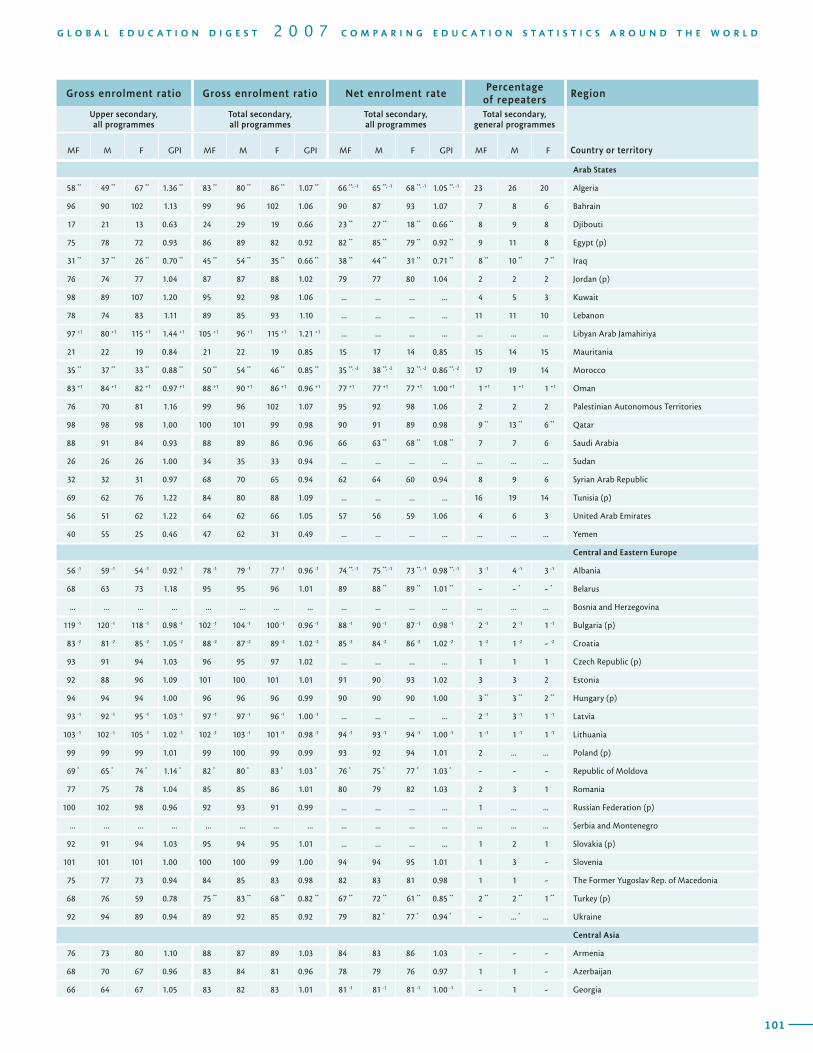
100
T A B L E SECONDARY EDUCATION / ISCED 2 and 3 / Enrolment and repeaters / 20055Region Education
system Enrolment Gross enrolment ratio
Country or territory
Secondary general education
Total secondary, all programmes
General programmes Enrolment in technical and vocational programmes (%)
Lower secondary, all programmes
Entrance age Duration MF % F
%Private MF % F
Total secondary
Lower secondary
Upper secondary MF M F GPI
101
G L O B A L E D U C A T I O N D I G E S T 2 0 0 7 C O M P A R I N G E D U C A T I O N S T A T I S T I C S A R O U N D T H E W O R L D
Gross enrolment ratio Gross enrolment ratio Net enrolment ratePercentage
of repeatersRegion
Upper secondary, all programmes
Total secondary, all programmes
Total secondary, all programmes
Total secondary, general programmes
Country or territoryMF M F GPI MF M F GPI MF M F GPI MF M F
Arab States
58 ** 49 ** 67 ** 1.36 ** 83 ** 80 ** 86 ** 1.07 ** 66 **, -1 65 **, -1 68 **, -1 1.05 **, -1 23 26 20 Algeria
96 90 102 1.13 99 96 102 1.06 90 87 93 1.07 7 8 6 Bahrain
17 21 13 0.63 24 29 19 0.66 23 ** 27 ** 18 ** 0.66 ** 8 9 8 Djibouti
75 78 72 0.93 86 89 82 0.92 82 ** 85 ** 79 ** 0.92 ** 9 11 8 Egypt (p)
31 ** 37 ** 26 ** 0.70 ** 45 ** 54 ** 35 ** 0.66 ** 38 ** 44 ** 31 ** 0.71 ** 8 ** 10 ** 7 ** Iraq
76 74 77 1.04 87 87 88 1.02 79 77 80 1.04 2 2 2 Jordan (p)
98 89 107 1.20 95 92 98 1.06 ... ... ... ... 4 5 3 Kuwait
78 74 83 1.11 89 85 93 1.10 ... ... ... ... 11 11 10 Lebanon
97 +1 80 +1 115 +1 1.44 +1 105 +1 96 +1 115 +1 1.21 +1 ... ... ... ... ... ... ... Libyan Arab Jamahiriya
21 22 19 0.84 21 22 19 0.85 15 17 14 0.85 15 14 15 Mauritania
35 ** 37 ** 33 ** 0.88 ** 50 ** 54 ** 46 ** 0.85 ** 35 **, -2 38 **, -2 32 **, -2 0.86 **, -2 17 19 14 Morocco
83 +1 84 +1 82 +1 0.97 +1 88 +1 90 +1 86 +1 0.96 +1 77 +1 77 +1 77 +1 1.00 +1 1 +1 1 +1 1 +1 Oman
76 70 81 1.16 99 96 102 1.07 95 92 98 1.06 2 2 2 Palestinian Autonomous Territories
98 98 98 1.00 100 101 99 0.98 90 91 89 0.98 9 ** 13 ** 6 ** Qatar
88 91 84 0.93 88 89 86 0.96 66 63 ** 68 ** 1.08 ** 7 7 6 Saudi Arabia
26 26 26 1.00 34 35 33 0.94 ... ... ... ... ... ... ... Sudan
32 32 31 0.97 68 70 65 0.94 62 64 60 0.94 8 9 6 Syrian Arab Republic
69 62 76 1.22 84 80 88 1.09 ... ... ... ... 16 19 14 Tunisia (p)
56 51 62 1.22 64 62 66 1.05 57 56 59 1.06 4 6 3 United Arab Emirates
40 55 25 0.46 47 62 31 0.49 ... ... ... ... ... ... ... Yemen
Central and Eastern Europe
56 -1 59 -1 54 -1 0.92 -1 78 -1 79 -1 77 -1 0.96 -1 74 **, -1 75 **, -1 73 **, -1 0.98 **, -1 3 -1 4 -1 3 -1 Albania
68 63 73 1.18 95 95 96 1.01 89 88 ** 89 ** 1.01 ** - - * - * Belarus
... ... ... ... ... ... ... ... ... ... ... ... ... ... ... Bosnia and Herzegovina
119 -1 120 -1 118 -1 0.98 -1 102 -1 104 -1 100 -1 0.96 -1 88 -1 90 -1 87 -1 0.98 -1 2 -1 2 -1 1 -1 Bulgaria (p)
83 -2 81 -2 85 -2 1.05 -2 88 -2 87 -2 89 -2 1.02 -2 85 -2 84 -2 86 -2 1.02 -2 1 -2 1 -2 - -2 Croatia
93 91 94 1.03 96 95 97 1.02 ... ... ... ... 1 1 1 Czech Republic (p)
92 88 96 1.09 101 100 101 1.01 91 90 93 1.02 3 3 2 Estonia
94 94 94 1.00 96 96 96 0.99 90 90 90 1.00 3 ** 3 ** 2 ** Hungary (p)
93 -1 92 -1 95 -1 1.03 -1 97 -1 97 -1 96 -1 1.00 -1 ... ... ... ... 2 -1 3 -1 1 -1 Latvia
103 -1 102 -1 105 -1 1.02 -1 102 -1 103 -1 101 -1 0.98 -1 94 -1 93 -1 94 -1 1.00 -1 1 -1 1 -1 1 -1 Lithuania
99 99 99 1.01 99 100 99 0.99 93 92 94 1.01 2 ... ... Poland (p)
69 * 65 * 74 * 1.14 * 82 * 80 * 83 * 1.03 * 76 * 75 * 77 * 1.03 * - - - Republic of Moldova
77 75 78 1.04 85 85 86 1.01 80 79 82 1.03 2 3 1 Romania
100 102 98 0.96 92 93 91 0.99 ... ... ... ... 1 ... ... Russian Federation (p)
... ... ... ... ... ... ... ... ... ... ... ... ... ... ... Serbia and Montenegro
92 91 94 1.03 95 94 95 1.01 ... ... ... ... 1 2 1 Slovakia (p)
101 101 101 1.00 100 100 99 1.00 94 94 95 1.01 1 3 - Slovenia
75 77 73 0.94 84 85 83 0.98 82 83 81 0.98 1 1 - The Former Yugoslav Rep. of Macedonia
68 76 59 0.78 75 ** 83 ** 68 ** 0.82 ** 67 ** 72 ** 61 ** 0.85 ** 2 ** 2 ** 1 ** Turkey (p)
92 94 89 0.94 89 92 85 0.92 79 82 * 77 * 0.94 * - ... * ... Ukraine
Central Asia
76 73 80 1.10 88 87 89 1.03 84 83 86 1.03 - - - Armenia
68 70 67 0.96 83 84 81 0.96 78 79 76 0.97 1 1 - Azerbaijan
66 64 67 1.05 83 82 83 1.01 81 -1 81 -1 81 -1 1.00 -1 - 1 - Georgia
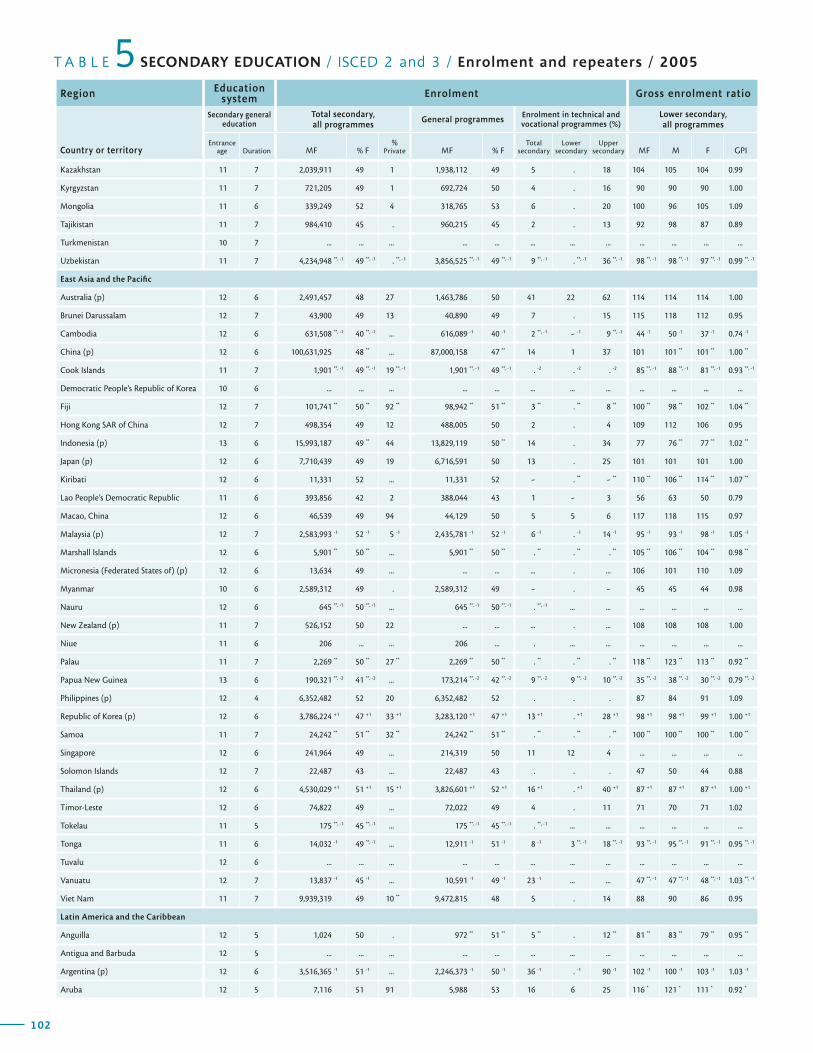
102
T A B L E SECONDARY EDUCATION / ISCED 2 and 3 / Enrolment and repeaters / 20055Region Education
system Enrolment Gross enrolment ratio
Country or territory
Secondary general education
Total secondary, all programmes
General programmes Enrolment in technical and vocational programmes (%)
Lower secondary, all programmes
Entrance age Duration MF % F
%Private MF % F
Total secondary
Lower secondary
Upper secondary MF M F GPI
103
G L O B A L E D U C A T I O N D I G E S T 2 0 0 7 C O M P A R I N G E D U C A T I O N S T A T I S T I C S A R O U N D T H E W O R L D
Gross enrolment ratio Gross enrolment ratio Net enrolment ratePercentage
of repeatersRegion
Upper secondary, all programmes
Total secondary, all programmes
Total secondary, all programmes
Total secondary, general programmes
Country or territoryMF M F GPI MF M F GPI MF M F GPI MF M F
Kazakhstan 11 7 2,039,911 49 1 1,938,112 49 5 . 18 104 105 104 0.99
Kyrgyzstan 11 7 721,205 49 1 692,724 50 4 . 16 90 90 90 1.00
Mongolia 11 6 339,249 52 4 318,765 53 6 . 20 100 96 105 1.09
Tajikistan 11 7 984,410 45 . 960,215 45 2 . 13 92 98 87 0.89
Turkmenistan 10 7 ... ... ... ... ... ... ... ... ... ... ... ...
Uzbekistan 11 7 4,234,948 **, -1 49 **, -1 . **, -1 3,856,525 **, -1 49 **, -1 9 **, -1 . **, -1 36 **, -1 98 **, -1 98 **, -1 97 **, -1 0.99 **, -1
East Asia and the Pacific
Australia (p) 12 6 2,491,457 48 27 1,463,786 50 41 22 62 114 114 114 1.00
Brunei Darussalam 12 7 43,900 49 13 40,890 49 7 . 15 115 118 112 0.95
Cambodia 12 6 631,508 **, -1 40 **, -1 ... 616,089 -1 40 -1 2 **, -1 - -1 9 **, -1 44 -1 50 -1 37 -1 0.74 -1
China (p) 12 6 100,631,925 48 ** ... 87,000,158 47 ** 14 1 37 101 101 ** 101 ** 1.00 **
Cook Islands 11 7 1,901 **, -1 49 **, -1 19 **, -1 1,901 **, -1 49 **, -1 . -2 . -2 . -2 85 **, -1 88 **, -1 81 **, -1 0.93 **, -1
Democratic People’s Republic of Korea 10 6 ... ... ... ... ... ... ... ... ... ... ... ...
Fiji 12 7 101,741 ** 50 ** 92 ** 98,942 ** 51 ** 3 ** . ** 8 ** 100 ** 98 ** 102 ** 1.04 **
Hong Kong SAR of China 12 7 498,354 49 12 488,005 50 2 . 4 109 112 106 0.95
Indonesia (p) 13 6 15,993,187 49 ** 44 13,829,119 50 ** 14 . 34 77 76 ** 77 ** 1.02 **
Japan (p) 12 6 7,710,439 49 19 6,716,591 50 13 . 25 101 101 101 1.00
Kiribati 12 6 11,331 52 ... 11,331 52 - . ** - ** 110 ** 106 ** 114 ** 1.07 **
Lao People’s Democratic Republic 11 6 393,856 42 2 388,044 43 1 - 3 56 63 50 0.79
Macao, China 12 6 46,539 49 94 44,129 50 5 5 6 117 118 115 0.97
Malaysia (p) 12 7 2,583,993 -1 52 -1 5 -1 2,435,781 -1 52 -1 6 -1 . -1 14 -1 95 -1 93 -1 98 -1 1.05 -1
Marshall Islands 12 6 5,901 ** 50 ** ... 5,901 ** 50 ** . ** . ** . ** 105 ** 106 ** 104 ** 0.98 **
Micronesia (Federated States of) (p) 12 6 13,634 49 ... ... ... ... . ... 106 101 110 1.09
Myanmar 10 6 2,589,312 49 . 2,589,312 49 - . - 45 45 44 0.98
Nauru 12 6 645 **, -1 50 **, -1 ... 645 **, -1 50 **, -1 . **, -1 ... ... ... ... ... ...
New Zealand (p) 11 7 526,152 50 22 ... ... ... . ... 108 108 108 1.00
Niue 11 6 206 ... ... 206 ... . ... ... ... ... ... ...
Palau 11 7 2,269 ** 50 ** 27 ** 2,269 ** 50 ** . ** . ** . ** 118 ** 123 ** 113 ** 0.92 **
Papua New Guinea 13 6 190,321 **, -2 41 **, -2 ... 173,214 **, -2 42 **, -2 9 **, -2 9 **, -2 10 **, -2 35 **, -2 38 **, -2 30 **, -2 0.79 **, -2
Philippines (p) 12 4 6,352,482 52 20 6,352,482 52 . . . 87 84 91 1.09
Republic of Korea (p) 12 6 3,786,224 +1 47 +1 33 +1 3,283,120 +1 47 +1 13 +1 . +1 28 +1 98 +1 98 +1 99 +1 1.00 +1
Samoa 11 7 24,242 ** 51 ** 32 ** 24,242 ** 51 ** . ** . ** . ** 100 ** 100 ** 100 ** 1.00 **
Singapore 12 6 241,964 49 ... 214,319 50 11 12 4 ... ... ... ...
Solomon Islands 12 7 22,487 43 ... 22,487 43 . . . 47 50 44 0.88
Thailand (p) 12 6 4,530,029 +1 51 +1 15 +1 3,826,601 +1 52 +1 16 +1 . +1 40 +1 87 +1 87 +1 87 +1 1.00 +1
Timor-Leste 12 6 74,822 49 ... 72,022 49 4 . 11 71 70 71 1.02
Tokelau 11 5 175 **, -1 45 **, -1 ... 175 **, -1 45 **, -1 . **, -1 ... ... ... ... ... ...
Tonga 11 6 14,032 -1 49 **, -1 ... 12,911 -1 51 -1 8 -1 3 **, -1 18 **, -1 93 **, -1 95 **, -1 91 **, -1 0.95 **, -1
Tuvalu 12 6 ... ... ... ... ... ... ... ... ... ... ... ...
Vanuatu 12 7 13,837 -1 45 -1 ... 10,591 -1 49 -1 23 -1 ... ... 47 **, -1 47 **, -1 48 **, -1 1.03 **, -1
Viet Nam 11 7 9,939,319 49 10 ** 9,472,815 48 5 . 14 88 90 86 0.95
Latin America and the Caribbean
Anguilla 12 5 1,024 50 . 972 ** 51 ** 5 ** . 12 ** 81 ** 83 ** 79 ** 0.95 **
Antigua and Barbuda 12 5 ... ... ... ... ... ... ... ... ... ... ... ...
Argentina (p) 12 6 3,516,365 -1 51 -1 ... 2,246,373 -1 50 -1 36 -1 . -1 90 -1 102 -1 100 -1 103 -1 1.03 -1
Aruba 12 5 7,116 51 91 5,988 53 16 6 25 116 * 121 * 111 * 0.92 *
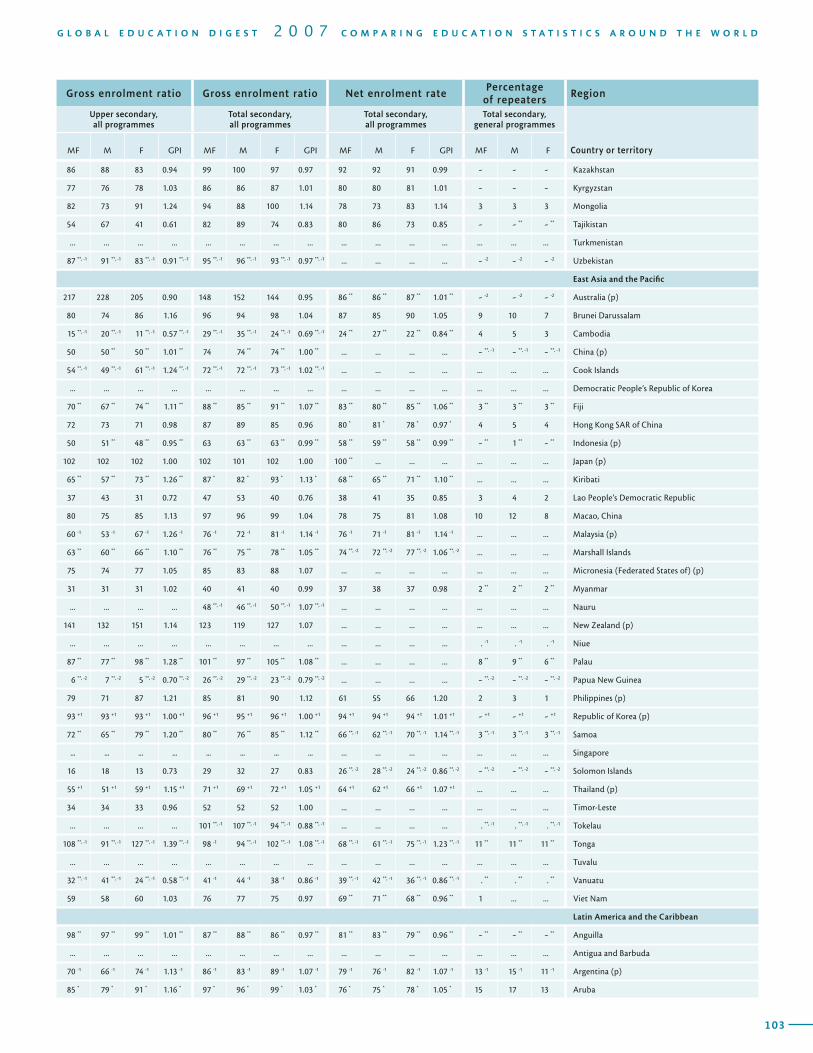
102
T A B L E SECONDARY EDUCATION / ISCED 2 and 3 / Enrolment and repeaters / 20055Region Education
system Enrolment Gross enrolment ratio
Country or territory
Secondary general education
Total secondary, all programmes
General programmes Enrolment in technical and vocational programmes (%)
Lower secondary, all programmes
Entrance age Duration MF % F
%Private MF % F
Total secondary
Lower secondary
Upper secondary MF M F GPI
103
G L O B A L E D U C A T I O N D I G E S T 2 0 0 7 C O M P A R I N G E D U C A T I O N S T A T I S T I C S A R O U N D T H E W O R L D
Gross enrolment ratio Gross enrolment ratio Net enrolment ratePercentage
of repeatersRegion
Upper secondary, all programmes
Total secondary, all programmes
Total secondary, all programmes
Total secondary, general programmes
Country or territoryMF M F GPI MF M F GPI MF M F GPI MF M F
86 88 83 0.94 99 100 97 0.97 92 92 91 0.99 - - - Kazakhstan
77 76 78 1.03 86 86 87 1.01 80 80 81 1.01 - - - Kyrgyzstan
82 73 91 1.24 94 88 100 1.14 78 73 83 1.14 3 3 3 Mongolia
54 67 41 0.61 82 89 74 0.83 80 86 73 0.85 - - ** - ** Tajikistan
... ... ... ... ... ... ... ... ... ... ... ... ... ... ... Turkmenistan
87 **, -1 91 **, -1 83 **, -1 0.91 **, -1 95 **, -1 96 **, -1 93 **, -1 0.97 **, -1 ... ... ... ... - -2 - -2 - -2 Uzbekistan
East Asia and the Pacific
217 228 205 0.90 148 152 144 0.95 86 ** 86 ** 87 ** 1.01 ** - -2 - -2 - -2 Australia (p)
80 74 86 1.16 96 94 98 1.04 87 85 90 1.05 9 10 7 Brunei Darussalam
15 **, -1 20 **, -1 11 **, -1 0.57 **, -1 29 **, -1 35 **, -1 24 **, -1 0.69 **, -1 24 ** 27 ** 22 ** 0.84 ** 4 5 3 Cambodia
50 50 ** 50 ** 1.01 ** 74 74 ** 74 ** 1.00 ** ... ... ... ... - **, -1 - **, -1 - **, -1 China (p)
54 **, -1 49 **, -1 61 **, -1 1.24 **, -1 72 **, -1 72 **, -1 73 **, -1 1.02 **, -1 ... ... ... ... ... ... ... Cook Islands
... ... ... ... ... ... ... ... ... ... ... ... ... ... ... Democratic People’s Republic of Korea
70 ** 67 ** 74 ** 1.11 ** 88 ** 85 ** 91 ** 1.07 ** 83 ** 80 ** 85 ** 1.06 ** 3 ** 3 ** 3 ** Fiji
72 73 71 0.98 87 89 85 0.96 80 * 81 * 78 * 0.97 * 4 5 4 Hong Kong SAR of China
50 51 ** 48 ** 0.95 ** 63 63 ** 63 ** 0.99 ** 58 ** 59 ** 58 ** 0.99 ** - ** 1 ** - ** Indonesia (p)
102 102 102 1.00 102 101 102 1.00 100 ** ... ... ... ... ... ... Japan (p)
65 ** 57 ** 73 ** 1.26 ** 87 * 82 * 93 * 1.13 * 68 ** 65 ** 71 ** 1.10 ** ... ... ... Kiribati
37 43 31 0.72 47 53 40 0.76 38 41 35 0.85 3 4 2 Lao People’s Democratic Republic
80 75 85 1.13 97 96 99 1.04 78 75 81 1.08 10 12 8 Macao, China
60 -1 53 -1 67 -1 1.26 -1 76 -1 72 -1 81 -1 1.14 -1 76 -1 71 -1 81 -1 1.14 -1 ... ... ... Malaysia (p)
63 ** 60 ** 66 ** 1.10 ** 76 ** 75 ** 78 ** 1.05 ** 74 **, -2 72 **, -2 77 **, -2 1.06 **, -2 ... ... ... Marshall Islands
75 74 77 1.05 85 83 88 1.07 ... ... ... ... ... ... ... Micronesia (Federated States of) (p)
31 31 31 1.02 40 41 40 0.99 37 38 37 0.98 2 ** 2 ** 2 ** Myanmar
... ... ... ... 48 **, -1 46 **, -1 50 **, -1 1.07 **, -1 ... ... ... ... ... ... ... Nauru
141 132 151 1.14 123 119 127 1.07 ... ... ... ... ... ... ... New Zealand (p)
... ... ... ... ... ... ... ... ... ... ... ... . -1 . -1 . -1 Niue
87 ** 77 ** 98 ** 1.28 ** 101 ** 97 ** 105 ** 1.08 ** ... ... ... ... 8 ** 9 ** 6 ** Palau
6 **, -2 7 **, -2 5 **, -2 0.70 **, -2 26 **, -2 29 **, -2 23 **, -2 0.79 **, -2 ... ... ... ... - **, -2 - **, -2 - **, -2 Papua New Guinea
79 71 87 1.21 85 81 90 1.12 61 55 66 1.20 2 3 1 Philippines (p)
93 +1 93 +1 93 +1 1.00 +1 96 +1 95 +1 96 +1 1.00 +1 94 +1 94 +1 94 +1 1.01 +1 - +1 - +1 - +1 Republic of Korea (p)
72 ** 65 ** 79 ** 1.20 ** 80 ** 76 ** 85 ** 1.12 ** 66 **, -1 62 **, -1 70 **, -1 1.14 **, -1 3 **, -1 3 **, -1 3 **, -1 Samoa
... ... ... ... ... ... ... ... ... ... ... ... ... ... ... Singapore
16 18 13 0.73 29 32 27 0.83 26 **, -2 28 **, -2 24 **, -2 0.86 **, -2 - **, -2 - **, -2 - **, -2 Solomon Islands
55 +1 51 +1 59 +1 1.15 +1 71 +1 69 +1 72 +1 1.05 +1 64 +1 62 +1 66 +1 1.07 +1 ... ... ... Thailand (p)
34 34 33 0.96 52 52 52 1.00 ... ... ... ... ... ... ... Timor-Leste
... ... ... ... 101 **, -1 107 **, -1 94 **, -1 0.88 **, -1 ... ... ... ... . **, -1 . **, -1 . **, -1 Tokelau
108 **, -1 91 **, -1 127 **, -1 1.39 **, -1 98 -1 94 **, -1 102 **, -1 1.08 **, -1 68 **, -1 61 **, -1 75 **, -1 1.23 **, -1 11 ** 11 ** 11 ** Tonga
... ... ... ... ... ... ... ... ... ... ... ... ... ... ... Tuvalu
32 **, -1 41 **, -1 24 **, -1 0.58 **, -1 41 -1 44 -1 38 -1 0.86 -1 39 **, -1 42 **, -1 36 **, -1 0.86 **, -1 . ** . ** . ** Vanuatu
59 58 60 1.03 76 77 75 0.97 69 ** 71 ** 68 ** 0.96 ** 1 ... ... Viet Nam
Latin America and the Caribbean
98 ** 97 ** 99 ** 1.01 ** 87 ** 88 ** 86 ** 0.97 ** 81 ** 83 ** 79 ** 0.96 ** - ** - ** - ** Anguilla
... ... ... ... ... ... ... ... ... ... ... ... ... ... ... Antigua and Barbuda
70 -1 66 -1 74 -1 1.13 -1 86 -1 83 -1 89 -1 1.07 -1 79 -1 76 -1 82 -1 1.07 -1 13 -1 15 -1 11 -1 Argentina (p)
85 * 79 * 91 * 1.16 * 97 * 96 * 99 * 1.03 * 76 * 75 * 78 * 1.05 * 15 17 13 Aruba
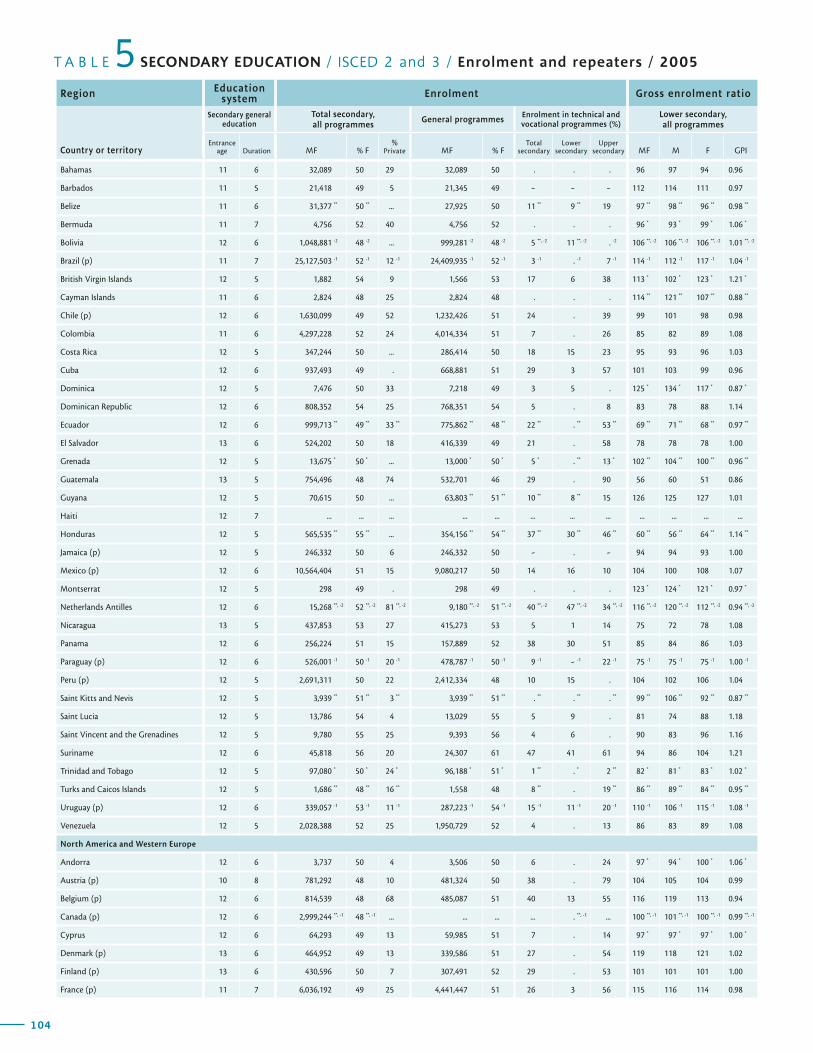
104
T A B L E SECONDARY EDUCATION / ISCED 2 and 3 / Enrolment and repeaters / 20055Region Education
system Enrolment Gross enrolment ratio
Country or territory
Secondary general education
Total secondary, all programmes
General programmes Enrolment in technical and vocational programmes (%)
Lower secondary, all programmes
Entrance age Duration MF % F
%Private MF % F
Total secondary
Lower secondary
Upper secondary MF M F GPI
105
G L O B A L E D U C A T I O N D I G E S T 2 0 0 7 C O M P A R I N G E D U C A T I O N S T A T I S T I C S A R O U N D T H E W O R L D
Gross enrolment ratio Gross enrolment ratio Net enrolment ratePercentage
of repeatersRegion
Upper secondary, all programmes
Total secondary, all programmes
Total secondary, all programmes
Total secondary, general programmes
Country or territoryMF M F GPI MF M F GPI MF M F GPI MF M F
Bahamas 11 6 32,089 50 29 32,089 50 . . . 96 97 94 0.96
Barbados 11 5 21,418 49 5 21,345 49 - - - 112 114 111 0.97
Belize 11 6 31,377 ** 50 ** ... 27,925 50 11 ** 9 ** 19 97 ** 98 ** 96 ** 0.98 **
Bermuda 11 7 4,756 52 40 4,756 52 . . . 96 * 93 * 99 * 1.06 *
Bolivia 12 6 1,048,881 -2 48 -2 ... 999,281 -2 48 -2 5 **, -2 11 **, -2 . -2 106 **, -2 106 **, -2 106 **, -2 1.01 **, -2
Brazil (p) 11 7 25,127,503 -1 52 -1 12 -1 24,409,935 -1 52 -1 3 -1 . -1 7 -1 114 -1 112 -1 117 -1 1.04 -1
British Virgin Islands 12 5 1,882 54 9 1,566 53 17 6 38 113 * 102 * 123 * 1.21 *
Cayman Islands 11 6 2,824 48 25 2,824 48 . . . 114 ** 121 ** 107 ** 0.88 **
Chile (p) 12 6 1,630,099 49 52 1,232,426 51 24 . 39 99 101 98 0.98
Colombia 11 6 4,297,228 52 24 4,014,334 51 7 . 26 85 82 89 1.08
Costa Rica 12 5 347,244 50 ... 286,414 50 18 15 23 95 93 96 1.03
Cuba 12 6 937,493 49 . 668,881 51 29 3 57 101 103 99 0.96
Dominica 12 5 7,476 50 33 7,218 49 3 5 . 125 * 134 * 117 * 0.87 *
Dominican Republic 12 6 808,352 54 25 768,351 54 5 . 8 83 78 88 1.14
Ecuador 12 6 999,713 ** 49 ** 33 ** 775,862 ** 48 ** 22 ** . ** 53 ** 69 ** 71 ** 68 ** 0.97 **
El Salvador 13 6 524,202 50 18 416,339 49 21 . 58 78 78 78 1.00
Grenada 12 5 13,675 * 50 * ... 13,000 * 50 * 5 * . ** 13 * 102 ** 104 ** 100 ** 0.96 **
Guatemala 13 5 754,496 48 74 532,701 46 29 . 90 56 60 51 0.86
Guyana 12 5 70,615 50 ... 63,803 ** 51 ** 10 ** 8 ** 15 126 125 127 1.01
Haiti 12 7 ... ... ... ... ... ... ... ... ... ... ... ...
Honduras 12 5 565,535 ** 55 ** ... 354,156 ** 54 ** 37 ** 30 ** 46 ** 60 ** 56 ** 64 ** 1.14 **
Jamaica (p) 12 5 246,332 50 6 246,332 50 - . - 94 94 93 1.00
Mexico (p) 12 6 10,564,404 51 15 9,080,217 50 14 16 10 104 100 108 1.07
Montserrat 12 5 298 49 . 298 49 . . . 123 * 124 * 121 * 0.97 *
Netherlands Antilles 12 6 15,268 **, -2 52 **, -2 81 **, -2 9,180 **, -2 51 **, -2 40 **, -2 47 **, -2 34 **, -2 116 **, -2 120 **, -2 112 **, -2 0.94 **, -2
Nicaragua 13 5 437,853 53 27 415,273 53 5 1 14 75 72 78 1.08
Panama 12 6 256,224 51 15 157,889 52 38 30 51 85 84 86 1.03
Paraguay (p) 12 6 526,001 -1 50 -1 20 -1 478,787 -1 50 -1 9 -1 - -1 22 -1 75 -1 75 -1 75 -1 1.00 -1
Peru (p) 12 5 2,691,311 50 22 2,412,334 48 10 15 . 104 102 106 1.04
Saint Kitts and Nevis 12 5 3,939 ** 51 ** 3 ** 3,939 ** 51 ** . ** . ** . ** 99 ** 106 ** 92 ** 0.87 **
Saint Lucia 12 5 13,786 54 4 13,029 55 5 9 . 81 74 88 1.18
Saint Vincent and the Grenadines 12 5 9,780 55 25 9,393 56 4 6 . 90 83 96 1.16
Suriname 12 6 45,818 56 20 24,307 61 47 41 61 94 86 104 1.21
Trinidad and Tobago 12 5 97,080 * 50 * 24 * 96,188 * 51 * 1 ** . * 2 ** 82 * 81 * 83 * 1.02 *
Turks and Caicos Islands 12 5 1,686 ** 48 ** 16 ** 1,558 48 8 ** . 19 ** 86 ** 89 ** 84 ** 0.95 **
Uruguay (p) 12 6 339,057 -1 53 -1 11 -1 287,223 -1 54 -1 15 -1 11 -1 20 -1 110 -1 106 -1 115 -1 1.08 -1
Venezuela 12 5 2,028,388 52 25 1,950,729 52 4 . 13 86 83 89 1.08
North America and Western Europe
Andorra 12 6 3,737 50 4 3,506 50 6 . 24 97 * 94 * 100 * 1.06 *
Austria (p) 10 8 781,292 48 10 481,324 50 38 . 79 104 105 104 0.99
Belgium (p) 12 6 814,539 48 68 485,087 51 40 13 55 116 119 113 0.94
Canada (p) 12 6 2,999,244 **, -1 48 **, -1 ... ... ... ... . **, -1 ... 100 **, -1 101 **, -1 100 **, -1 0.99 **, -1
Cyprus 12 6 64,293 49 13 59,985 51 7 . 14 97 * 97 * 97 * 1.00 *
Denmark (p) 13 6 464,952 49 13 339,586 51 27 . 54 119 118 121 1.02
Finland (p) 13 6 430,596 50 7 307,491 52 29 . 53 101 101 101 1.00
France (p) 11 7 6,036,192 49 25 4,441,447 51 26 3 56 115 116 114 0.98
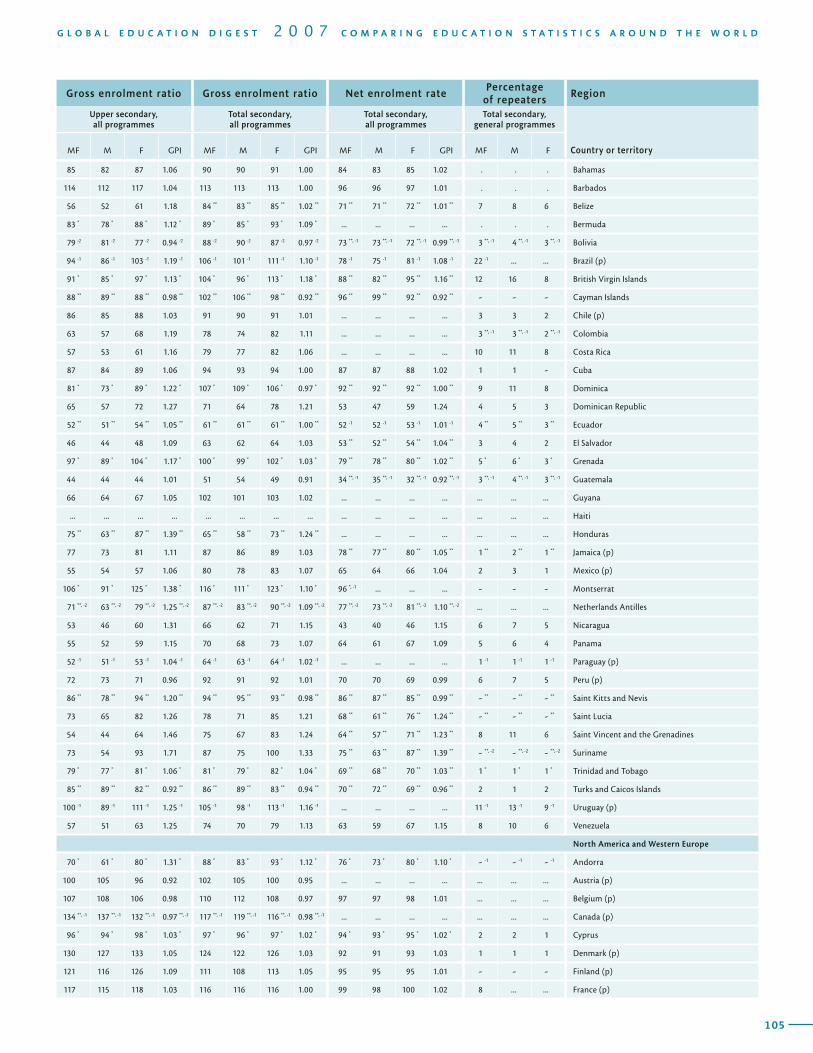
104
T A B L E SECONDARY EDUCATION / ISCED 2 and 3 / Enrolment and repeaters / 20055Region Education
system Enrolment Gross enrolment ratio
Country or territory
Secondary general education
Total secondary, all programmes
General programmes Enrolment in technical and vocational programmes (%)
Lower secondary, all programmes
Entrance age Duration MF % F
%Private MF % F
Total secondary
Lower secondary
Upper secondary MF M F GPI
105
G L O B A L E D U C A T I O N D I G E S T 2 0 0 7 C O M P A R I N G E D U C A T I O N S T A T I S T I C S A R O U N D T H E W O R L D
Gross enrolment ratio Gross enrolment ratio Net enrolment ratePercentage
of repeatersRegion
Upper secondary, all programmes
Total secondary, all programmes
Total secondary, all programmes
Total secondary, general programmes
Country or territoryMF M F GPI MF M F GPI MF M F GPI MF M F
85 82 87 1.06 90 90 91 1.00 84 83 85 1.02 . . . Bahamas
114 112 117 1.04 113 113 113 1.00 96 96 97 1.01 . . . Barbados
56 52 61 1.18 84 ** 83 ** 85 ** 1.02 ** 71 ** 71 ** 72 ** 1.01 ** 7 8 6 Belize
83 * 78 * 88 * 1.12 * 89 * 85 * 93 * 1.09 * ... ... ... ... . . . Bermuda
79 -2 81 -2 77 -2 0.94 -2 88 -2 90 -2 87 -2 0.97 -2 73 **, -1 73 **, -1 72 **, -1 0.99 **, -1 3 **, -1 4 **, -1 3 **, -1 Bolivia
94 -1 86 -1 103 -1 1.19 -1 106 -1 101 -1 111 -1 1.10 -1 78 -1 75 -1 81 -1 1.08 -1 22 -1 ... ... Brazil (p)
91 * 85 * 97 * 1.13 * 104 * 96 * 113 * 1.18 * 88 ** 82 ** 95 ** 1.16 ** 12 16 8 British Virgin Islands
88 ** 89 ** 88 ** 0.98 ** 102 ** 106 ** 98 ** 0.92 ** 96 ** 99 ** 92 ** 0.92 ** - - - Cayman Islands
86 85 88 1.03 91 90 91 1.01 ... ... ... ... 3 3 2 Chile (p)
63 57 68 1.19 78 74 82 1.11 ... ... ... ... 3 **, -1 3 **, -1 2 **, -1 Colombia
57 53 61 1.16 79 77 82 1.06 ... ... ... ... 10 11 8 Costa Rica
87 84 89 1.06 94 93 94 1.00 87 87 88 1.02 1 1 - Cuba
81 * 73 * 89 * 1.22 * 107 * 109 * 106 * 0.97 * 92 ** 92 ** 92 ** 1.00 ** 9 11 8 Dominica
65 57 72 1.27 71 64 78 1.21 53 47 59 1.24 4 5 3 Dominican Republic
52 ** 51 ** 54 ** 1.05 ** 61 ** 61 ** 61 ** 1.00 ** 52 -1 52 -1 53 -1 1.01 -1 4 ** 5 ** 3 ** Ecuador
46 44 48 1.09 63 62 64 1.03 53 ** 52 ** 54 ** 1.04 ** 3 4 2 El Salvador
97 * 89 * 104 * 1.17 * 100 * 99 * 102 * 1.03 * 79 ** 78 ** 80 ** 1.02 ** 5 * 6 * 3 * Grenada
44 44 44 1.01 51 54 49 0.91 34 **, -1 35 **, -1 32 **, -1 0.92 **, -1 3 **, -1 4 **, -1 3 **, -1 Guatemala
66 64 67 1.05 102 101 103 1.02 ... ... ... ... ... ... ... Guyana
... ... ... ... ... ... ... ... ... ... ... ... ... ... ... Haiti
75 ** 63 ** 87 ** 1.39 ** 65 ** 58 ** 73 ** 1.24 ** ... ... ... ... ... ... ... Honduras
77 73 81 1.11 87 86 89 1.03 78 ** 77 ** 80 ** 1.05 ** 1 ** 2 ** 1 ** Jamaica (p)
55 54 57 1.06 80 78 83 1.07 65 64 66 1.04 2 3 1 Mexico (p)
106 * 91 * 125 * 1.38 * 116 * 111 * 123 * 1.10 * 96 *, -1 ... ... ... - - - Montserrat
71 **, -2 63 **, -2 79 **, -2 1.25 **, -2 87 **, -2 83 **, -2 90 **, -2 1.09 **, -2 77 **, -2 73 **, -2 81 **, -2 1.10 **, -2 ... ... ... Netherlands Antilles
53 46 60 1.31 66 62 71 1.15 43 40 46 1.15 6 7 5 Nicaragua
55 52 59 1.15 70 68 73 1.07 64 61 67 1.09 5 6 4 Panama
52 -1 51 -1 53 -1 1.04 -1 64 -1 63 -1 64 -1 1.02 -1 ... ... ... ... 1 -1 1 -1 1 -1 Paraguay (p)
72 73 71 0.96 92 91 92 1.01 70 70 69 0.99 6 7 5 Peru (p)
86 ** 78 ** 94 ** 1.20 ** 94 ** 95 ** 93 ** 0.98 ** 86 ** 87 ** 85 ** 0.99 ** - ** - ** - ** Saint Kitts and Nevis
73 65 82 1.26 78 71 85 1.21 68 ** 61 ** 76 ** 1.24 ** - ** - ** - ** Saint Lucia
54 44 64 1.46 75 67 83 1.24 64 ** 57 ** 71 ** 1.23 ** 8 11 6 Saint Vincent and the Grenadines
73 54 93 1.71 87 75 100 1.33 75 ** 63 ** 87 ** 1.39 ** - **, -2 - **, -2 - **, -2 Suriname
79 * 77 * 81 * 1.06 * 81 * 79 * 82 * 1.04 * 69 ** 68 ** 70 ** 1.03 ** 1 * 1 * 1 * Trinidad and Tobago
85 ** 89 ** 82 ** 0.92 ** 86 ** 89 ** 83 ** 0.94 ** 70 ** 72 ** 69 ** 0.96 ** 2 1 2 Turks and Caicos Islands
100 -1 89 -1 111 -1 1.25 -1 105 -1 98 -1 113 -1 1.16 -1 ... ... ... ... 11 -1 13 -1 9 -1 Uruguay (p)
57 51 63 1.25 74 70 79 1.13 63 59 67 1.15 8 10 6 Venezuela
North America and Western Europe
70 * 61 * 80 * 1.31 * 88 * 83 * 93 * 1.12 * 76 * 73 * 80 * 1.10 * - -1 - -1 - -1 Andorra
100 105 96 0.92 102 105 100 0.95 ... ... ... ... ... ... ... Austria (p)
107 108 106 0.98 110 112 108 0.97 97 97 98 1.01 ... ... ... Belgium (p)
134 **, -1 137 **, -1 132 **, -1 0.97 **, -1 117 **, -1 119 **, -1 116 **, -1 0.98 **, -1 ... ... ... ... ... ... ... Canada (p)
96 * 94 * 98 * 1.03 * 97 * 96 * 97 * 1.02 * 94 * 93 * 95 * 1.02 * 2 2 1 Cyprus
130 127 133 1.05 124 122 126 1.03 92 91 93 1.03 1 1 1 Denmark (p)
121 116 126 1.09 111 108 113 1.05 95 95 95 1.01 - - - Finland (p)
117 115 118 1.03 116 116 116 1.00 99 98 100 1.02 8 ... ... France (p)

106
T A B L E SECONDARY EDUCATION / ISCED 2 and 3 / Enrolment and repeaters / 20055Region Education
system Enrolment Gross enrolment ratio
Country or territory
Secondary general education
Total secondary, all programmes
General programmes Enrolment in technical and vocational programmes (%)
Lower secondary, all programmes
Entrance age Duration MF % F
%Private MF % F
Total secondary
Lower secondary
Upper secondary MF M F GPI
107
G L O B A L E D U C A T I O N D I G E S T 2 0 0 7 C O M P A R I N G E D U C A T I O N S T A T I S T I C S A R O U N D T H E W O R L D
Gross enrolment ratio Gross enrolment ratio Net enrolment ratePercentage
of repeatersRegion
Upper secondary, all programmes
Total secondary, all programmes
Total secondary, all programmes
Total secondary, general programmes
Country or territoryMF M F GPI MF M F GPI MF M F GPI MF M F
Germany (p) 10 9 8,267,636 48 8 6,477,468 50 22 1 60 102 103 102 1.00
Gibraltar 11 4 ... ... ... ... ... ... ... ... ... ... ... ...
Greece (p) 12 6 715,537 48 6 578,203 50 19 . 36 99 101 98 0.97
Holy See . 3 . . . . . . . . . . . .
Iceland (p) 13 7 32,888 ** 50 ** 4 ** 25,583 ** 52 ** 22 ** . ** 39 ** 105 ** 105 ** 105 ** 1.00 **
Ireland (p) 12 5 317,337 51 1 266,835 50 16 2 33 106 104 108 1.04
Israel (p) 12 6 610,341 49 - 485,782 50 20 - 35 77 77 77 1.00
Italy (p) 11 8 4,507,408 48 5 2,837,999 53 37 . 61 106 107 104 0.97
Liechtenstein 11 7 3,273 -1 45 -1 4 -1 1,975 -1 50 -1 36 -1 3 -1 72 -1 104 *, -1 101 *, -1 106 *, -1 1.05 *, -1
Luxembourg (p) 12 7 35,946 50 18 24,611 51 32 . 62 102 101 103 1.03
Malta 11 7 38,961 49 29 34,603 51 11 . 42 104 101 107 1.06
Monaco 11 7 3,078 -1 ... 23 -1 2,600 -1 ... 16 -1 . -1 36 -1 ... ... ... ...
Netherlands (p) 12 6 1,410,249 48 ... 684,909 51 51 38 68 130 133 127 0.96
Norway (p) 13 6 403,026 49 7 271,099 51 33 . 61 102 102 102 1.00
Portugal (p) 12 6 669,529 51 15 559,226 53 16 3 33 110 108 112 1.03
San Marino 11 8 ... ... ... ... ... ... . -1 ... ... ... ... ...
Spain (p) 12 6 3,107,816 50 28 2,620,502 50 16 - 43 122 123 122 1.00
Sweden (p) 13 6 735,494 49 10 534,159 50 27 . 58 104 104 104 1.00
Switzerland (p) 13 7 574,783 47 7 395,219 51 31 . 65 112 111 113 1.01
United Kingdom (p) 11 7 5,747,422 49 30 ** 4,414,562 49 23 . 39 103 103 102 1.00
United States (p) 12 6 24,431,934 49 9 24,431,934 49 . . . 102 103 101 0.98
South and West Asia
Afghanistan 13 6 651,453 23 ... 642,442 24 1 . 5 22 32 11 0.35
Bangladesh 11 7 10,354,760 -1 50 -1 96 -1 10,186,996 -1 50 -1 2 -1 . -1 4 -1 64 -1 61 -1 68 -1 1.10 -1
Bhutan 13 6 42,144 47 8 41,514 47 1 . 8 ... ... ... ...
India 11 7 89,461,794 43 ... 87,982,408 ** 43 ** 2 ** 1 ** 2 75 80 68 0.85
Iran, Islamic Republic of 11 7 9,942,201 47 8 ** 9,066,387 48 9 . 16 86 90 82 0.91
Maldives 13 5 28,878 **, -1 52 **, -1 11 **, -1 27,763 -1 53 -1 4 **, -1 . -1 41 **, -1 108 -1 98 -1 118 -1 1.20 -1
Nepal 10 7 1,983,561 **, +1 45 **, +1 ... 1,961,973 +1 46 +1 1 **, +1 . +1 4 **, +1 66 +1 70 +1 63 +1 0.89 +1
Pakistan 10 7 7,244,911 41 25 7,090,683 41 2 - 19 33 38 28 0.73
Sri Lanka (p) 10 8 2,332,326 **, -1 49 **, -1 ... ... ... ... . **, -1 ... 95 **, -1 94 **, -1 97 **, -1 1.04 **, -1
Sub-Saharan Africa
Angola 10 7 ... ... ... ... ... ... ... ... ... ... ... ...
Benin 12 7 435,449 ** 35 ** 25 ** 377,618 34 13 ** 3 ** 43 ** 41 ** 51 ** 30 ** 0.58 **
Botswana 13 5 169,727 **, -1 51 **, -1 ... 158,558 -1 52 -1 7 **, -1 . -1 21 **, -1 87 -1 84 -1 89 -1 1.07 -1
Burkina Faso 13 7 295,412 41 39 272,980 40 8 3 26 19 22 16 0.73
Burundi 13 7 173,717 ** 43 ** 12 ** 159,240 42 8 ** 3 ** 26 ** 17 ** 20 ** 15 ** 0.76 **
Cameroon 12 7 1,197,505 * 44 * 40 * 816,070 * 48 * 32 * 22 ** 51 ** 49 ** 52 ** 47 ** 0.91 **
Cape Verde 12 6 51,672 52 - 49,010 52 5 3 10 90 87 92 1.06
Central African Republic 12 7 ... ... ... ... ... ... ... ... ... ... ... ...
Chad 12 7 236,754 ** 25 ** ... 233,433 ** 25 ** 1 ** - ** 5 ** 19 ** 28 ** 10 ** 0.35 **
Comoros 12 7 43,349 ** 43 ** 41 ** 43,181 ** 43 ** - ** . ** 1 ** 41 ** 47 ** 35 ** 0.75 **
Congo 12 7 235,294 **, -1 46 **, -1 22 **, -1 191,857 -1 45 -1 18 **, -1 10 -1 47 **, -1 50 -1 53 -1 47 -1 0.88 -1
Côte d’Ivoire 12 7 ... ... ... ... ... ... ... ... ... ... ... ...
Democratic Republic of the Congo 12 6 1,655,023 **, -2 37 **, -2 ... 1,212,184 **, -2 36 **, -2 27 **, -2 16 **, -2 36 **, -2 30 **, -2 37 **, -2 23 **, -2 0.63 **, -2
Equatorial Guinea 12 7 ... ... ... ... ... ... ... ... ... ... ... ...
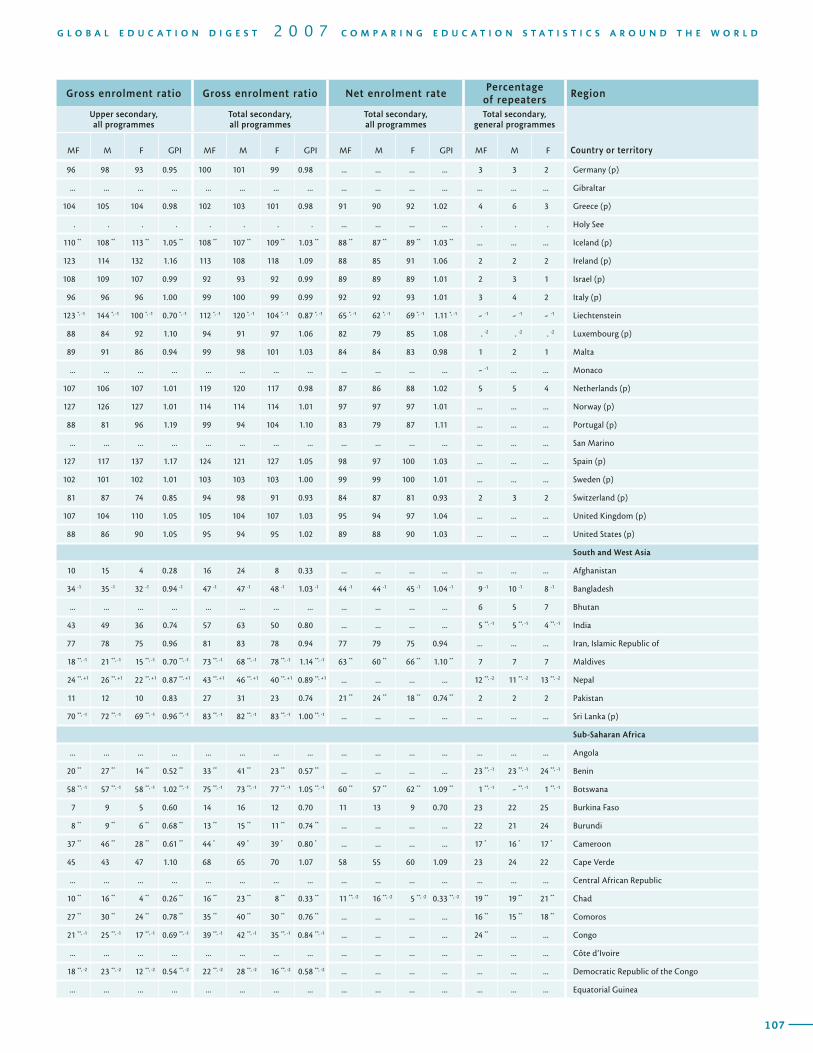
106
T A B L E SECONDARY EDUCATION / ISCED 2 and 3 / Enrolment and repeaters / 20055Region Education
system Enrolment Gross enrolment ratio
Country or territory
Secondary general education
Total secondary, all programmes
General programmes Enrolment in technical and vocational programmes (%)
Lower secondary, all programmes
Entrance age Duration MF % F
%Private MF % F
Total secondary
Lower secondary
Upper secondary MF M F GPI
107
G L O B A L E D U C A T I O N D I G E S T 2 0 0 7 C O M P A R I N G E D U C A T I O N S T A T I S T I C S A R O U N D T H E W O R L D
Gross enrolment ratio Gross enrolment ratio Net enrolment ratePercentage
of repeatersRegion
Upper secondary, all programmes
Total secondary, all programmes
Total secondary, all programmes
Total secondary, general programmes
Country or territoryMF M F GPI MF M F GPI MF M F GPI MF M F
96 98 93 0.95 100 101 99 0.98 ... ... ... ... 3 3 2 Germany (p)
... ... ... ... ... ... ... ... ... ... ... ... ... ... ... Gibraltar
104 105 104 0.98 102 103 101 0.98 91 90 92 1.02 4 6 3 Greece (p)
. . . . . . . . ... ... ... ... . . . Holy See
110 ** 108 ** 113 ** 1.05 ** 108 ** 107 ** 109 ** 1.03 ** 88 ** 87 ** 89 ** 1.03 ** ... ... ... Iceland (p)
123 114 132 1.16 113 108 118 1.09 88 85 91 1.06 2 2 2 Ireland (p)
108 109 107 0.99 92 93 92 0.99 89 89 89 1.01 2 3 1 Israel (p)
96 96 96 1.00 99 100 99 0.99 92 92 93 1.01 3 4 2 Italy (p)
123 *, -1 144 *, -1 100 *, -1 0.70 *, -1 112 *, -1 120 *, -1 104 *, -1 0.87 *, -1 65 *, -1 62 *, -1 69 *, -1 1.11 *, -1 - -1 - -1 - -1 Liechtenstein
88 84 92 1.10 94 91 97 1.06 82 79 85 1.08 . -2 . -2 . -2 Luxembourg (p)
89 91 86 0.94 99 98 101 1.03 84 84 83 0.98 1 2 1 Malta
... ... ... ... ... ... ... ... ... ... ... ... - -1 ... ... Monaco
107 106 107 1.01 119 120 117 0.98 87 86 88 1.02 5 5 4 Netherlands (p)
127 126 127 1.01 114 114 114 1.01 97 97 97 1.01 ... ... ... Norway (p)
88 81 96 1.19 99 94 104 1.10 83 79 87 1.11 ... ... ... Portugal (p)
... ... ... ... ... ... ... ... ... ... ... ... ... ... ... San Marino
127 117 137 1.17 124 121 127 1.05 98 97 100 1.03 ... ... ... Spain (p)
102 101 102 1.01 103 103 103 1.00 99 99 100 1.01 ... ... ... Sweden (p)
81 87 74 0.85 94 98 91 0.93 84 87 81 0.93 2 3 2 Switzerland (p)
107 104 110 1.05 105 104 107 1.03 95 94 97 1.04 ... ... ... United Kingdom (p)
88 86 90 1.05 95 94 95 1.02 89 88 90 1.03 ... ... ... United States (p)
South and West Asia
10 15 4 0.28 16 24 8 0.33 ... ... ... ... ... ... ... Afghanistan
34 -1 35 -1 32 -1 0.94 -1 47 -1 47 -1 48 -1 1.03 -1 44 -1 44 -1 45 -1 1.04 -1 9 -1 10 -1 8 -1 Bangladesh
... ... ... ... ... ... ... ... ... ... ... ... 6 5 7 Bhutan
43 49 36 0.74 57 63 50 0.80 ... ... ... ... 5 **, -1 5 **, -1 4 **, -1 India
77 78 75 0.96 81 83 78 0.94 77 79 75 0.94 ... ... ... Iran, Islamic Republic of
18 **, -1 21 **, -1 15 **, -1 0.70 **, -1 73 **, -1 68 **, -1 78 **, -1 1.14 **, -1 63 ** 60 ** 66 ** 1.10 ** 7 7 7 Maldives
24 **, +1 26 **, +1 22 **, +1 0.87 **, +1 43 **, +1 46 **, +1 40 **, +1 0.89 **, +1 ... ... ... ... 12 **, -2 11 **, -2 13 **, -2 Nepal
11 12 10 0.83 27 31 23 0.74 21 ** 24 ** 18 ** 0.74 ** 2 2 2 Pakistan
70 **, -1 72 **, -1 69 **, -1 0.96 **, -1 83 **, -1 82 **, -1 83 **, -1 1.00 **, -1 ... ... ... ... ... ... ... Sri Lanka (p)
Sub-Saharan Africa
... ... ... ... ... ... ... ... ... ... ... ... ... ... ... Angola
20 ** 27 ** 14 ** 0.52 ** 33 ** 41 ** 23 ** 0.57 ** ... ... ... ... 23 **, -1 23 **, -1 24 **, -1 Benin
58 **, -1 57 **, -1 58 **, -1 1.02 **, -1 75 **, -1 73 **, -1 77 **, -1 1.05 **, -1 60 ** 57 ** 62 ** 1.09 ** 1 **, -1 - **, -1 1 **, -1 Botswana
7 9 5 0.60 14 16 12 0.70 11 13 9 0.70 23 22 25 Burkina Faso
8 ** 9 ** 6 ** 0.68 ** 13 ** 15 ** 11 ** 0.74 ** ... ... ... ... 22 21 24 Burundi
37 ** 46 ** 28 ** 0.61 ** 44 * 49 * 39 * 0.80 * ... ... ... ... 17 * 16 * 17 * Cameroon
45 43 47 1.10 68 65 70 1.07 58 55 60 1.09 23 24 22 Cape Verde
... ... ... ... ... ... ... ... ... ... ... ... ... ... ... Central African Republic
10 ** 16 ** 4 ** 0.26 ** 16 ** 23 ** 8 ** 0.33 ** 11 **, -2 16 **, -2 5 **, -2 0.33 **, -2 19 ** 19 ** 21 ** Chad
27 ** 30 ** 24 ** 0.78 ** 35 ** 40 ** 30 ** 0.76 ** ... ... ... ... 16 ** 15 ** 18 ** Comoros
21 **, -1 25 **, -1 17 **, -1 0.69 **, -1 39 **, -1 42 **, -1 35 **, -1 0.84 **, -1 ... ... ... ... 24 ** ... ... Congo
... ... ... ... ... ... ... ... ... ... ... ... ... ... ... Côte d’Ivoire
18 **, -2 23 **, -2 12 **, -2 0.54 **, -2 22 **, -2 28 **, -2 16 **, -2 0.58 **, -2 ... ... ... ... ... ... ... Democratic Republic of the Congo
... ... ... ... ... ... ... ... ... ... ... ... ... ... ... Equatorial Guinea
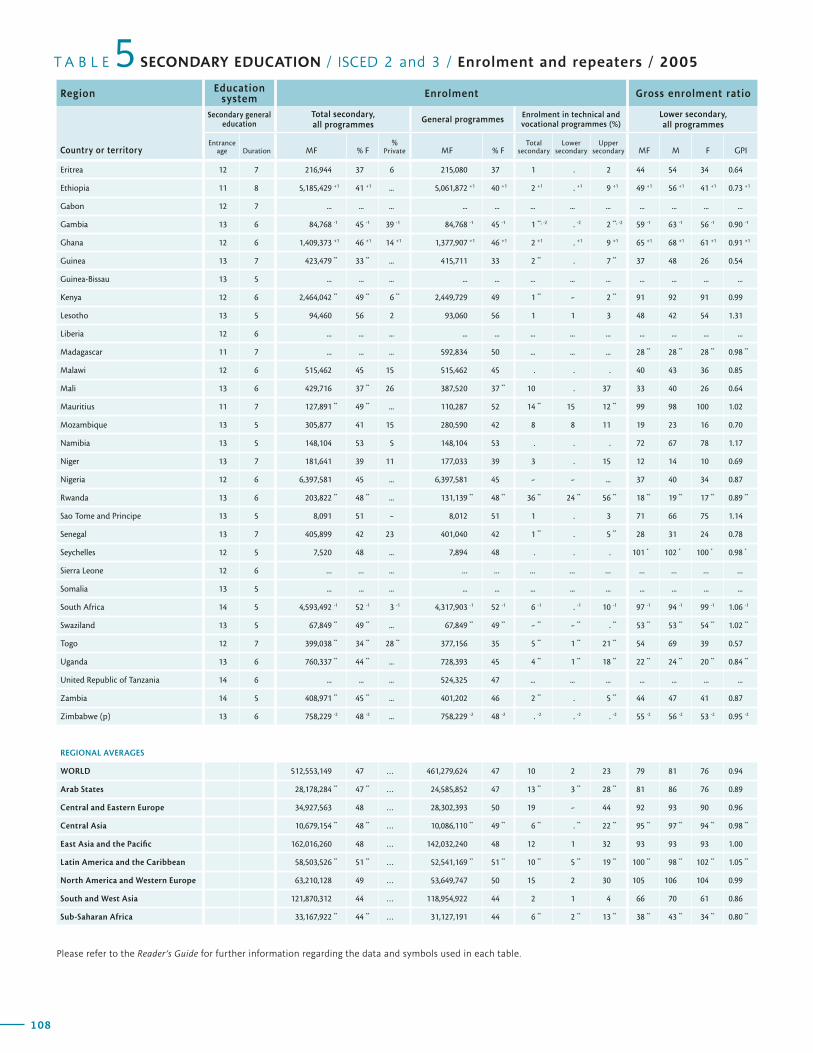
108
T A B L E SECONDARY EDUCATION / ISCED 2 and 3 / Enrolment and repeaters / 20055Region Education
system Enrolment Gross enrolment ratio
Country or territory
Secondary general education
Total secondary, all programmes
General programmes Enrolment in technical and vocational programmes (%)
Lower secondary, all programmes
Entrance age Duration MF % F
%Private MF % F
Total secondary
Lower secondary
Upper secondary MF M F GPI
109
G L O B A L E D U C A T I O N D I G E S T 2 0 0 7 C O M P A R I N G E D U C A T I O N S T A T I S T I C S A R O U N D T H E W O R L D
Gross enrolment ratio Gross enrolment ratio Net enrolment ratePercentage
of repeatersRegion
Upper secondary, all programmes
Total secondary, all programmes
Total secondary, all programmes
Total secondary, general programmes
Country or territoryMF M F GPI MF M F GPI MF M F GPI MF M F
Eritrea 12 7 216,944 37 6 215,080 37 1 . 2 44 54 34 0.64
Ethiopia 11 8 5,185,429 +1 41 +1 ... 5,061,872 +1 40 +1 2 +1 . +1 9 +1 49 +1 56 +1 41 +1 0.73 +1
Gabon 12 7 ... ... ... ... ... ... ... ... ... ... ... ...
Gambia 13 6 84,768 -1 45 -1 39 -1 84,768 -1 45 -1 1 **, -2 . -2 2 **, -2 59 -1 63 -1 56 -1 0.90 -1
Ghana 12 6 1,409,373 +1 46 +1 14 +1 1,377,907 +1 46 +1 2 +1 . +1 9 +1 65 +1 68 +1 61 +1 0.91 +1
Guinea 13 7 423,479 ** 33 ** ... 415,711 33 2 ** . 7 ** 37 48 26 0.54
Guinea-Bissau 13 5 ... ... ... ... ... ... ... ... ... ... ... ...
Kenya 12 6 2,464,042 ** 49 ** 6 ** 2,449,729 49 1 ** - 2 ** 91 92 91 0.99
Lesotho 13 5 94,460 56 2 93,060 56 1 1 3 48 42 54 1.31
Liberia 12 6 ... ... ... ... ... ... ... ... ... ... ... ...
Madagascar 11 7 ... ... ... 592,834 50 ... ... ... 28 ** 28 ** 28 ** 0.98 **
Malawi 12 6 515,462 45 15 515,462 45 . . . 40 43 36 0.85
Mali 13 6 429,716 37 ** 26 387,520 37 ** 10 . 37 33 40 26 0.64
Mauritius 11 7 127,891 ** 49 ** ... 110,287 52 14 ** 15 12 ** 99 98 100 1.02
Mozambique 13 5 305,877 41 15 280,590 42 8 8 11 19 23 16 0.70
Namibia 13 5 148,104 53 5 148,104 53 . . . 72 67 78 1.17
Niger 13 7 181,641 39 11 177,033 39 3 . 15 12 14 10 0.69
Nigeria 12 6 6,397,581 45 ... 6,397,581 45 - - ... 37 40 34 0.87
Rwanda 13 6 203,822 ** 48 ** ... 131,139 ** 48 ** 36 ** 24 ** 56 ** 18 ** 19 ** 17 ** 0.89 **
Sao Tome and Principe 13 5 8,091 51 - 8,012 51 1 . 3 71 66 75 1.14
Senegal 13 7 405,899 42 23 401,040 42 1 ** . 5 ** 28 31 24 0.78
Seychelles 12 5 7,520 48 ... 7,894 48 . . . 101 * 102 * 100 * 0.98 *
Sierra Leone 12 6 ... ... ... ... ... ... ... ... ... ... ... ...
Somalia 13 5 ... ... ... ... ... ... ... ... ... ... ... ...
South Africa 14 5 4,593,492 -1 52 -1 3 -1 4,317,903 -1 52 -1 6 -1 . -1 10 -1 97 -1 94 -1 99 -1 1.06 -1
Swaziland 13 5 67,849 ** 49 ** ... 67,849 ** 49 ** - ** - ** . ** 53 ** 53 ** 54 ** 1.02 **
Togo 12 7 399,038 ** 34 ** 28 ** 377,156 35 5 ** 1 ** 21 ** 54 69 39 0.57
Uganda 13 6 760,337 ** 44 ** ... 728,393 45 4 ** 1 ** 18 ** 22 ** 24 ** 20 ** 0.84 **
United Republic of Tanzania 14 6 ... ... ... 524,325 47 ... ... ... ... ... ... ...
Zambia 14 5 408,971 ** 45 ** ... 401,202 46 2 ** . 5 ** 44 47 41 0.87
Zimbabwe (p) 13 6 758,229 -2 48 -2 ... 758,229 -2 48 -2 . -2 . -2 . -2 55 -2 56 -2 53 -2 0.95 -2
REGIONAL AVERAGES
WORLD 512,553,149 47 … 461,279,624 47 10 2 23 79 81 76 0.94
Arab States 28,178,284 ** 47 ** … 24,585,852 47 13 ** 3 ** 28 ** 81 86 76 0.89
Central and Eastern Europe 34,927,563 48 … 28,302,393 50 19 - 44 92 93 90 0.96
Central Asia 10,679,154 ** 48 ** … 10,086,110 ** 49 ** 6 ** . ** 22 ** 95 ** 97 ** 94 ** 0.98 **
East Asia and the Pacific 162,016,260 48 … 142,032,240 48 12 1 32 93 93 93 1.00
Latin America and the Caribbean 58,503,526 ** 51 ** … 52,541,169 ** 51 ** 10 ** 5 ** 19 ** 100 ** 98 ** 102 ** 1.05 **
North America and Western Europe 63,210,128 49 … 53,649,747 50 15 2 30 105 106 104 0.99
South and West Asia 121,870,312 44 … 118,954,922 44 2 1 4 66 70 61 0.86
Sub-Saharan Africa 33,167,922 ** 44 ** … 31,127,191 44 6 ** 2 ** 13 ** 38 ** 43 ** 34 ** 0.80 **
Please refer to the Reader’s Guide for further information regarding the data and symbols used in each table.
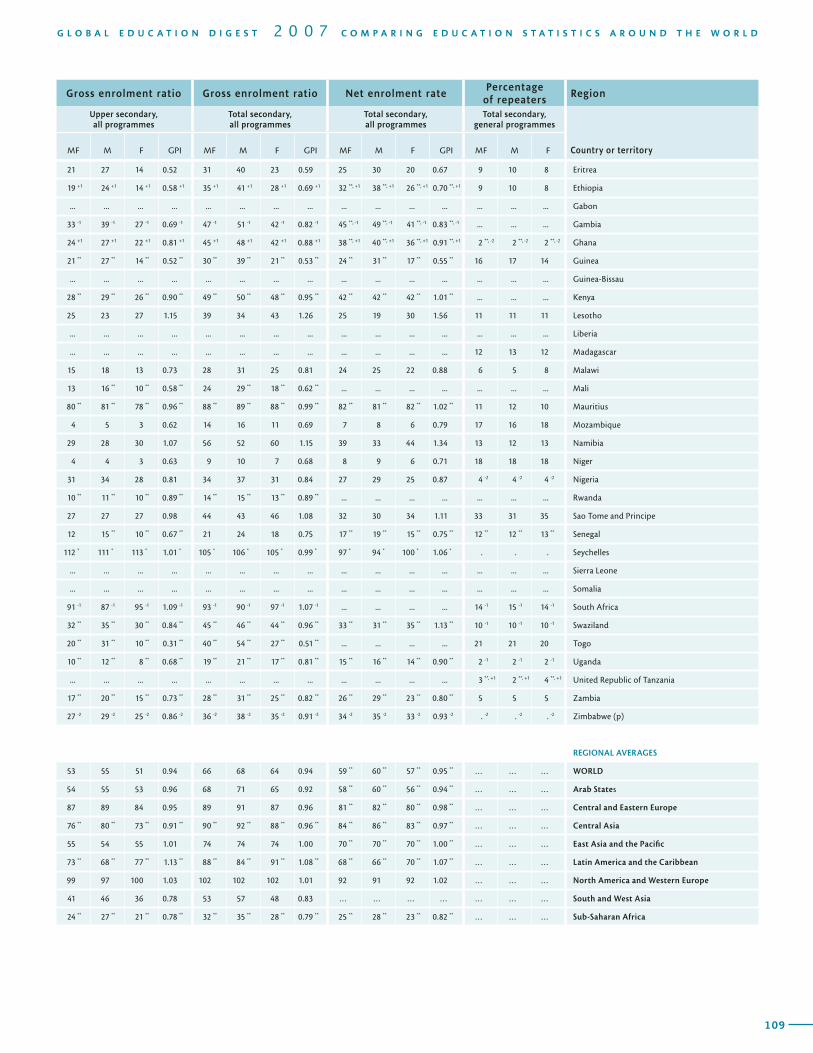
108
T A B L E SECONDARY EDUCATION / ISCED 2 and 3 / Enrolment and repeaters / 20055Region Education
system Enrolment Gross enrolment ratio
Country or territory
Secondary general education
Total secondary, all programmes
General programmes Enrolment in technical and vocational programmes (%)
Lower secondary, all programmes
Entrance age Duration MF % F
%Private MF % F
Total secondary
Lower secondary
Upper secondary MF M F GPI
109
G L O B A L E D U C A T I O N D I G E S T 2 0 0 7 C O M P A R I N G E D U C A T I O N S T A T I S T I C S A R O U N D T H E W O R L D
Gross enrolment ratio Gross enrolment ratio Net enrolment ratePercentage
of repeatersRegion
Upper secondary, all programmes
Total secondary, all programmes
Total secondary, all programmes
Total secondary, general programmes
Country or territoryMF M F GPI MF M F GPI MF M F GPI MF M F
21 27 14 0.52 31 40 23 0.59 25 30 20 0.67 9 10 8 Eritrea
19 +1 24 +1 14 +1 0.58 +1 35 +1 41 +1 28 +1 0.69 +1 32 **, +1 38 **, +1 26 **, +1 0.70 **, +1 9 10 8 Ethiopia
... ... ... ... ... ... ... ... ... ... ... ... ... ... ... Gabon
33 -1 39 -1 27 -1 0.69 -1 47 -1 51 -1 42 -1 0.82 -1 45 **, -1 49 **, -1 41 **, -1 0.83 **, -1 ... ... ... Gambia
24 +1 27 +1 22 +1 0.81 +1 45 +1 48 +1 42 +1 0.88 +1 38 **, +1 40 **, +1 36 **, +1 0.91 **, +1 2 **, -2 2 **, -2 2 **, -2 Ghana
21 ** 27 ** 14 ** 0.52 ** 30 ** 39 ** 21 ** 0.53 ** 24 ** 31 ** 17 ** 0.55 ** 16 17 14 Guinea
... ... ... ... ... ... ... ... ... ... ... ... ... ... ... Guinea-Bissau
28 ** 29 ** 26 ** 0.90 ** 49 ** 50 ** 48 ** 0.95 ** 42 ** 42 ** 42 ** 1.01 ** ... ... ... Kenya
25 23 27 1.15 39 34 43 1.26 25 19 30 1.56 11 11 11 Lesotho
... ... ... ... ... ... ... ... ... ... ... ... ... ... ... Liberia
... ... ... ... ... ... ... ... ... ... ... ... 12 13 12 Madagascar
15 18 13 0.73 28 31 25 0.81 24 25 22 0.88 6 5 8 Malawi
13 16 ** 10 ** 0.58 ** 24 29 ** 18 ** 0.62 ** ... ... ... ... ... ... ... Mali
80 ** 81 ** 78 ** 0.96 ** 88 ** 89 ** 88 ** 0.99 ** 82 ** 81 ** 82 ** 1.02 ** 11 12 10 Mauritius
4 5 3 0.62 14 16 11 0.69 7 8 6 0.79 17 16 18 Mozambique
29 28 30 1.07 56 52 60 1.15 39 33 44 1.34 13 12 13 Namibia
4 4 3 0.63 9 10 7 0.68 8 9 6 0.71 18 18 18 Niger
31 34 28 0.81 34 37 31 0.84 27 29 25 0.87 4 -2 4 -2 4 -2 Nigeria
10 ** 11 ** 10 ** 0.89 ** 14 ** 15 ** 13 ** 0.89 ** ... ... ... ... ... ... ... Rwanda
27 27 27 0.98 44 43 46 1.08 32 30 34 1.11 33 31 35 Sao Tome and Principe
12 15 ** 10 ** 0.67 ** 21 24 18 0.75 17 ** 19 ** 15 ** 0.75 ** 12 ** 12 ** 13 ** Senegal
112 * 111 * 113 * 1.01 * 105 * 106 * 105 * 0.99 * 97 * 94 * 100 * 1.06 * . . . Seychelles
... ... ... ... ... ... ... ... ... ... ... ... ... ... ... Sierra Leone
... ... ... ... ... ... ... ... ... ... ... ... ... ... ... Somalia
91 -1 87 -1 95 -1 1.09 -1 93 -1 90 -1 97 -1 1.07 -1 ... ... ... ... 14 -1 15 -1 14 -1 South Africa
32 ** 35 ** 30 ** 0.84 ** 45 ** 46 ** 44 ** 0.96 ** 33 ** 31 ** 35 ** 1.13 ** 10 -1 10 -1 10 -1 Swaziland
20 ** 31 ** 10 ** 0.31 ** 40 ** 54 ** 27 ** 0.51 ** ... ... ... ... 21 21 20 Togo
10 ** 12 ** 8 ** 0.68 ** 19 ** 21 ** 17 ** 0.81 ** 15 ** 16 ** 14 ** 0.90 ** 2 -1 2 -1 2 -1 Uganda
... ... ... ... ... ... ... ... ... ... ... ... 3 **, +1 2 **, +1 4 **, +1 United Republic of Tanzania
17 ** 20 ** 15 ** 0.73 ** 28 ** 31 ** 25 ** 0.82 ** 26 ** 29 ** 23 ** 0.80 ** 5 5 5 Zambia
27 -2 29 -2 25 -2 0.86 -2 36 -2 38 -2 35 -2 0.91 -2 34 -2 35 -2 33 -2 0.93 -2 . -2 . -2 . -2 Zimbabwe (p)
REGIONAL AVERAGES
53 55 51 0.94 66 68 64 0.94 59 ** 60 ** 57 ** 0.95 ** … … … WORLD
54 55 53 0.96 68 71 65 0.92 58 ** 60 ** 56 ** 0.94 ** … … … Arab States
87 89 84 0.95 89 91 87 0.96 81 ** 82 ** 80 ** 0.98 ** … … … Central and Eastern Europe
76 ** 80 ** 73 ** 0.91 ** 90 ** 92 ** 88 ** 0.96 ** 84 ** 86 ** 83 ** 0.97 ** … … … Central Asia
55 54 55 1.01 74 74 74 1.00 70 ** 70 ** 70 ** 1.00 ** … … … East Asia and the Pacific
73 ** 68 ** 77 ** 1.13 ** 88 ** 84 ** 91 ** 1.08 ** 68 ** 66 ** 70 ** 1.07 ** … … … Latin America and the Caribbean
99 97 100 1.03 102 102 102 1.01 92 91 92 1.02 … … … North America and Western Europe
41 46 36 0.78 53 57 48 0.83 … … … … … … … South and West Asia
24 ** 27 ** 21 ** 0.78 ** 32 ** 35 ** 28 ** 0.79 ** 25 ** 28 ** 23 ** 0.82 ** … … … Sub-Saharan Africa
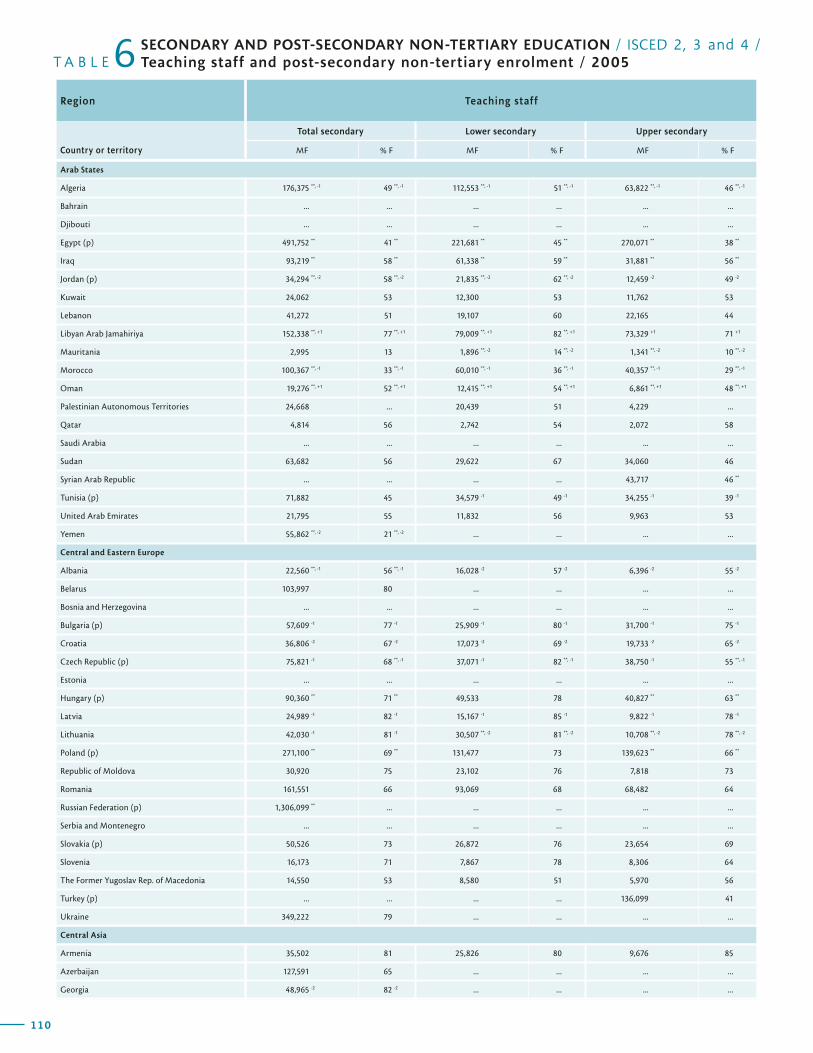
110
T A B L E 6Region Teaching staff
Country or territory
Total secondary Lower secondary Upper secondary
MF % F MF % F MF % F
SECONDARY AND POST-SECONDARY NON-TERTIARY EDUCATION / ISCED 2, 3 and 4 / Teaching staff and post-secondary non-tertiary enrolment / 2005
111
G L O B A L E D U C A T I O N D I G E S T 2 0 0 7 C O M P A R I N G E D U C A T I O N S T A T I S T I C S A R O U N D T H E W O R L D
Trained teachers (%) Pupil/teacher ratioPost-secondary
non-tertiary education (ISCED4)
Region
Total secondary Total secondary
Lower secondary
Upper secondary
Enrolment
Country or territoryMF M F MF % F
Arab States
Algeria 176,375 **, -1 49 **, -1 112,553 **, -1 51 **, -1 63,822 **, -1 46 **, -1
Bahrain ... ... ... ... ... ...
Djibouti ... ... ... ... ... ...
Egypt (p) 491,752 ** 41 ** 221,681 ** 45 ** 270,071 ** 38 **
Iraq 93,219 ** 58 ** 61,338 ** 59 ** 31,881 ** 56 **
Jordan (p) 34,294 **, -2 58 **, -2 21,835 **, -2 62 **, -2 12,459 -2 49 -2
Kuwait 24,062 53 12,300 53 11,762 53
Lebanon 41,272 51 19,107 60 22,165 44
Libyan Arab Jamahiriya 152,338 **, +1 77 **, +1 79,009 **, +1 82 **, +1 73,329 +1 71 +1
Mauritania 2,995 13 1,896 **, -2 14 **, -2 1,341 **, -2 10 **, -2
Morocco 100,367 **, -1 33 **, -1 60,010 **, -1 36 **, -1 40,357 **, -1 29 **, -1
Oman 19,276 **, +1 52 **, +1 12,415 **, +1 54 **, +1 6,861 **, +1 48 **, +1
Palestinian Autonomous Territories 24,668 ... 20,439 51 4,229 ...
Qatar 4,814 56 2,742 54 2,072 58
Saudi Arabia ... ... ... ... ... ...
Sudan 63,682 56 29,622 67 34,060 46
Syrian Arab Republic ... ... ... ... 43,717 46 **
Tunisia (p) 71,882 45 34,579 -1 49 -1 34,255 -1 39 -1
United Arab Emirates 21,795 55 11,832 56 9,963 53
Yemen 55,862 **, -2 21 **, -2 ... ... ... ...
Central and Eastern Europe
Albania 22,560 **, -1 56 **, -1 16,028 -2 57 -2 6,396 -2 55 -2
Belarus 103,997 80 ... ... ... ...
Bosnia and Herzegovina ... ... ... ... ... ...
Bulgaria (p) 57,609 -1 77 -1 25,909 -1 80 -1 31,700 -1 75 -1
Croatia 36,806 -2 67 -2 17,073 -2 69 -2 19,733 -2 65 -2
Czech Republic (p) 75,821 -1 68 **, -1 37,071 -1 82 **, -1 38,750 -1 55 **, -1
Estonia ... ... ... ... ... ...
Hungary (p) 90,360 ** 71 ** 49,533 78 40,827 ** 63 **
Latvia 24,989 -1 82 -1 15,167 -1 85 -1 9,822 -1 78 -1
Lithuania 42,030 -1 81 -1 30,507 **, -2 81 **, -2 10,708 **, -2 78 **, -2
Poland (p) 271,100 ** 69 ** 131,477 73 139,623 ** 66 **
Republic of Moldova 30,920 75 23,102 76 7,818 73
Romania 161,551 66 93,069 68 68,482 64
Russian Federation (p) 1,306,099 ** ... ... ... ... ...
Serbia and Montenegro ... ... ... ... ... ...
Slovakia (p) 50,526 73 26,872 76 23,654 69
Slovenia 16,173 71 7,867 78 8,306 64
The Former Yugoslav Rep. of Macedonia 14,550 53 8,580 51 5,970 56
Turkey (p) ... ... ... ... 136,099 41
Ukraine 349,222 79 ... ... ... ...
Central Asia
Armenia 35,502 81 25,826 80 9,676 85
Azerbaijan 127,591 65 ... ... ... ...
Georgia 48,965 -2 82 -2 ... ... ... ...
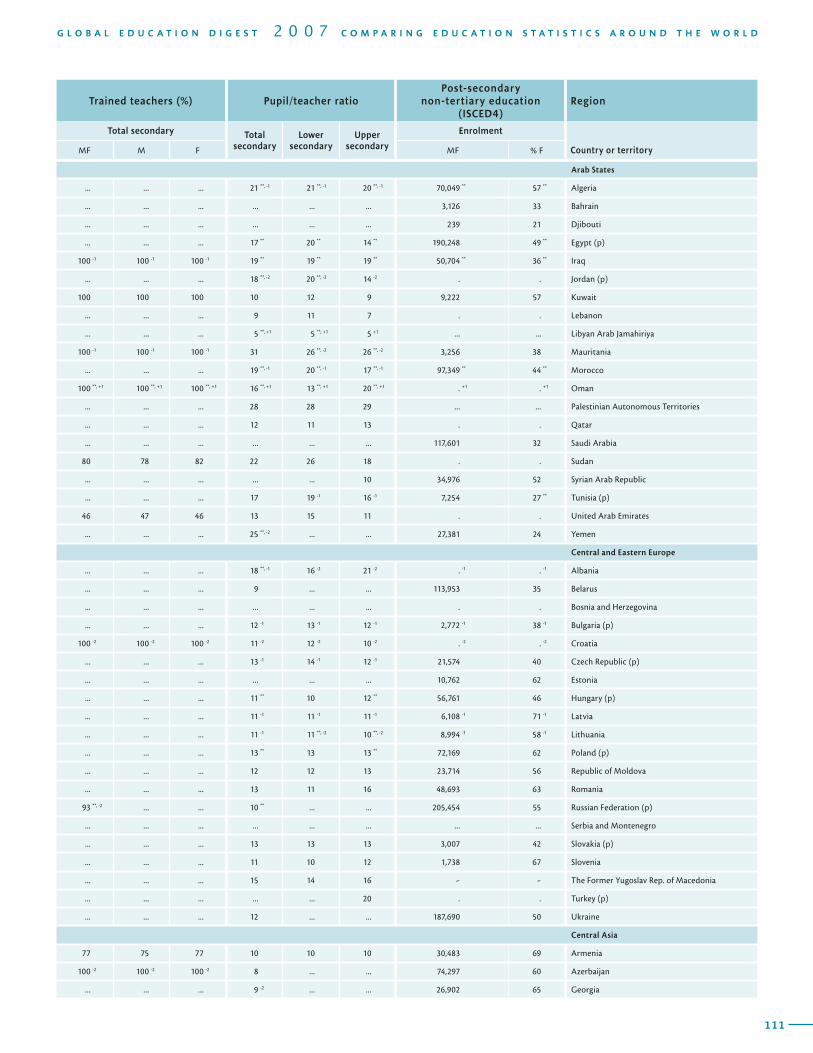
110
T A B L E 6Region Teaching staff
Country or territory
Total secondary Lower secondary Upper secondary
MF % F MF % F MF % F
SECONDARY AND POST-SECONDARY NON-TERTIARY EDUCATION / ISCED 2, 3 and 4 / Teaching staff and post-secondary non-tertiary enrolment / 2005
111
G L O B A L E D U C A T I O N D I G E S T 2 0 0 7 C O M P A R I N G E D U C A T I O N S T A T I S T I C S A R O U N D T H E W O R L D
Trained teachers (%) Pupil/teacher ratioPost-secondary
non-tertiary education (ISCED4)
Region
Total secondary Total secondary
Lower secondary
Upper secondary
Enrolment
Country or territoryMF M F MF % F
Arab States
... ... ... 21 **, -1 21 **, -1 20 **, -1 70,049 ** 57 ** Algeria
... ... ... ... ... ... 3,126 33 Bahrain
... ... ... ... ... ... 239 21 Djibouti
... ... ... 17 ** 20 ** 14 ** 190,248 49 ** Egypt (p)
100 -1 100 -1 100 -1 19 ** 19 ** 19 ** 50,704 ** 36 ** Iraq
... ... ... 18 **, -2 20 **, -2 14 -2 . . Jordan (p)
100 100 100 10 12 9 9,222 57 Kuwait
... ... ... 9 11 7 . . Lebanon
... ... ... 5 **, +1 5 **, +1 5 +1 ... ... Libyan Arab Jamahiriya
100 -1 100 -1 100 -1 31 26 **, -2 26 **, -2 3,256 38 Mauritania
... ... ... 19 **, -1 20 **, -1 17 **, -1 97,349 ** 44 ** Morocco
100 **, +1 100 **, +1 100 **, +1 16 **, +1 13 **, +1 20 **, +1 . +1 . +1 Oman
... ... ... 28 28 29 ... ... Palestinian Autonomous Territories
... ... ... 12 11 13 . . Qatar
... ... ... ... ... ... 117,601 32 Saudi Arabia
80 78 82 22 26 18 . . Sudan
... ... ... ... ... 10 34,976 52 Syrian Arab Republic
... ... ... 17 19 -1 16 -1 7,254 27 ** Tunisia (p)
46 47 46 13 15 11 . . United Arab Emirates
... ... ... 25 **, -2 ... ... 27,381 24 Yemen
Central and Eastern Europe
... ... ... 18 **, -1 16 -2 21 -2 . -1 . -1 Albania
... ... ... 9 ... ... 113,953 35 Belarus
... ... ... ... ... ... . . Bosnia and Herzegovina
... ... ... 12 -1 13 -1 12 -1 2,772 -1 38 -1 Bulgaria (p)
100 -2 100 -2 100 -2 11 -2 12 -2 10 -2 . -2 . -2 Croatia
... ... ... 13 -1 14 -1 12 -1 21,574 40 Czech Republic (p)
... ... ... ... ... ... 10,762 62 Estonia
... ... ... 11 ** 10 12 ** 56,761 46 Hungary (p)
... ... ... 11 -1 11 -1 11 -1 6,108 -1 71 -1 Latvia
... ... ... 11 -1 11 **, -2 10 **, -2 8,994 -1 58 -1 Lithuania
... ... ... 13 ** 13 13 ** 72,169 62 Poland (p)
... ... ... 12 12 13 23,714 56 Republic of Moldova
... ... ... 13 11 16 48,693 63 Romania
93 **, -2 ... ... 10 ** ... ... 205,454 55 Russian Federation (p)
... ... ... ... ... ... ... ... Serbia and Montenegro
... ... ... 13 13 13 3,007 42 Slovakia (p)
... ... ... 11 10 12 1,738 67 Slovenia
... ... ... 15 14 16 - - The Former Yugoslav Rep. of Macedonia
... ... ... ... ... 20 . . Turkey (p)
... ... ... 12 ... ... 187,690 50 Ukraine
Central Asia
77 75 77 10 10 10 30,483 69 Armenia
100 -2 100 -2 100 -2 8 ... ... 74,297 60 Azerbaijan
... ... ... 9 -2 ... ... 26,902 65 Georgia
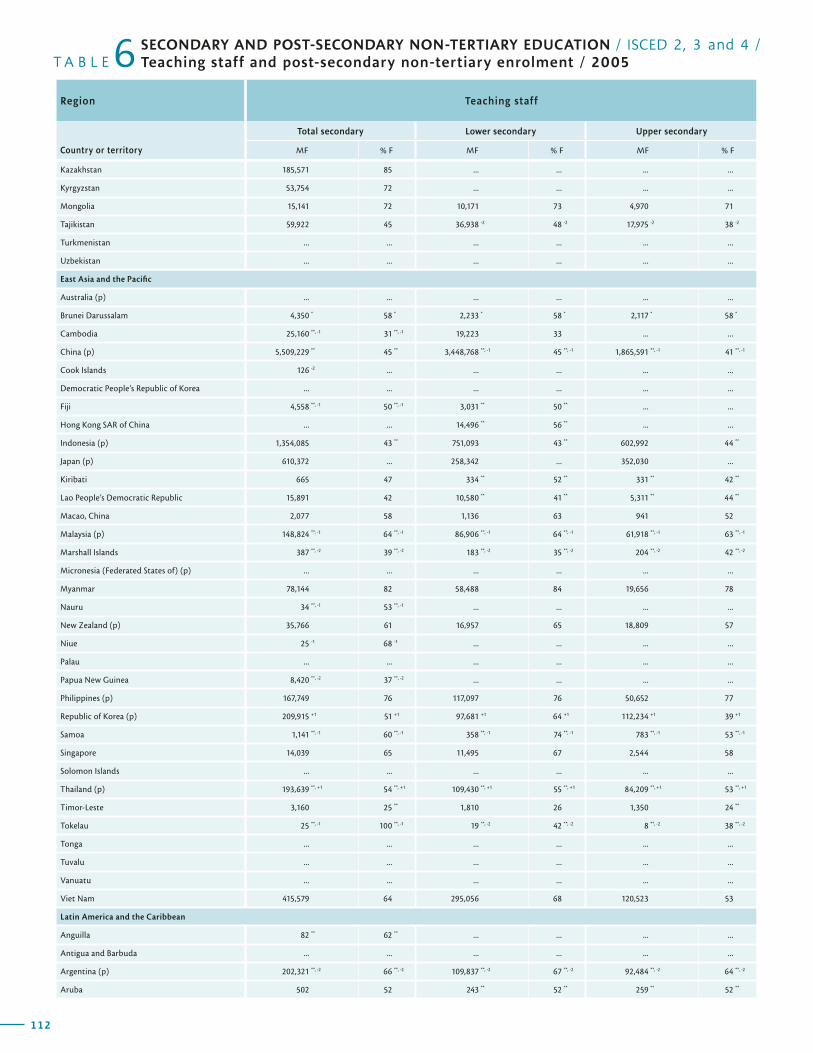
112
T A B L E 6Region Teaching staff
Country or territory
Total secondary Lower secondary Upper secondary
MF % F MF % F MF % F
SECONDARY AND POST-SECONDARY NON-TERTIARY EDUCATION / ISCED 2, 3 and 4 / Teaching staff and post-secondary non-tertiary enrolment / 2005
113
G L O B A L E D U C A T I O N D I G E S T 2 0 0 7 C O M P A R I N G E D U C A T I O N S T A T I S T I C S A R O U N D T H E W O R L D
Trained teachers (%) Pupil/teacher ratioPost-secondary
non-tertiary education (ISCED4)
Region
Total secondary Total secondary
Lower secondary
Upper secondary
Enrolment
Country or territoryMF M F MF % F
Kazakhstan 185,571 85 ... ... ... ...
Kyrgyzstan 53,754 72 ... ... ... ...
Mongolia 15,141 72 10,171 73 4,970 71
Tajikistan 59,922 45 36,938 -2 48 -2 17,975 -2 38 -2
Turkmenistan ... ... ... ... ... ...
Uzbekistan ... ... ... ... ... ...
East Asia and the Pacific
Australia (p) ... ... ... ... ... ...
Brunei Darussalam 4,350 * 58 * 2,233 * 58 * 2,117 * 58 *
Cambodia 25,160 **, -1 31 **, -1 19,223 33 ... ...
China (p) 5,509,229 ** 45 ** 3,448,768 **, -1 45 **, -1 1,865,591 **, -1 41 **, -1
Cook Islands 126 -2 ... ... ... ... ...
Democratic People’s Republic of Korea ... ... ... ... ... ...
Fiji 4,558 **, -1 50 **, -1 3,031 ** 50 ** ... ...
Hong Kong SAR of China ... ... 14,496 ** 56 ** ... ...
Indonesia (p) 1,354,085 43 ** 751,093 43 ** 602,992 44 **
Japan (p) 610,372 ... 258,342 ... 352,030 ...
Kiribati 665 47 334 ** 52 ** 331 ** 42 **
Lao People’s Democratic Republic 15,891 42 10,580 ** 41 ** 5,311 ** 44 **
Macao, China 2,077 58 1,136 63 941 52
Malaysia (p) 148,824 **, -1 64 **, -1 86,906 **, -1 64 **, -1 61,918 **, -1 63 **, -1
Marshall Islands 387 **, -2 39 **, -2 183 **, -2 35 **, -2 204 **, -2 42 **, -2
Micronesia (Federated States of) (p) ... ... ... ... ... ...
Myanmar 78,144 82 58,488 84 19,656 78
Nauru 34 **, -1 53 **, -1 ... ... ... ...
New Zealand (p) 35,766 61 16,957 65 18,809 57
Niue 25 -1 68 -1 ... ... ... ...
Palau ... ... ... ... ... ...
Papua New Guinea 8,420 **, -2 37 **, -2 ... ... ... ...
Philippines (p) 167,749 76 117,097 76 50,652 77
Republic of Korea (p) 209,915 +1 51 +1 97,681 +1 64 +1 112,234 +1 39 +1
Samoa 1,141 **, -1 60 **, -1 358 **, -1 74 **, -1 783 **, -1 53 **, -1
Singapore 14,039 65 11,495 67 2,544 58
Solomon Islands ... ... ... ... ... ...
Thailand (p) 193,639 **, +1 54 **, +1 109,430 **, +1 55 **, +1 84,209 **, +1 53 **, +1
Timor-Leste 3,160 25 ** 1,810 26 1,350 24 **
Tokelau 25 **, -1 100 **, -1 19 **, -2 42 **, -2 8 **, -2 38 **, -2
Tonga ... ... ... ... ... ...
Tuvalu ... ... ... ... ... ...
Vanuatu ... ... ... ... ... ...
Viet Nam 415,579 64 295,056 68 120,523 53
Latin America and the Caribbean
Anguilla 82 ** 62 ** ... ... ... ...
Antigua and Barbuda ... ... ... ... ... ...
Argentina (p) 202,321 **, -2 66 **, -2 109,837 **, -2 67 **, -2 92,484 **, -2 64 **, -2
Aruba 502 52 243 ** 52 ** 259 ** 52 **
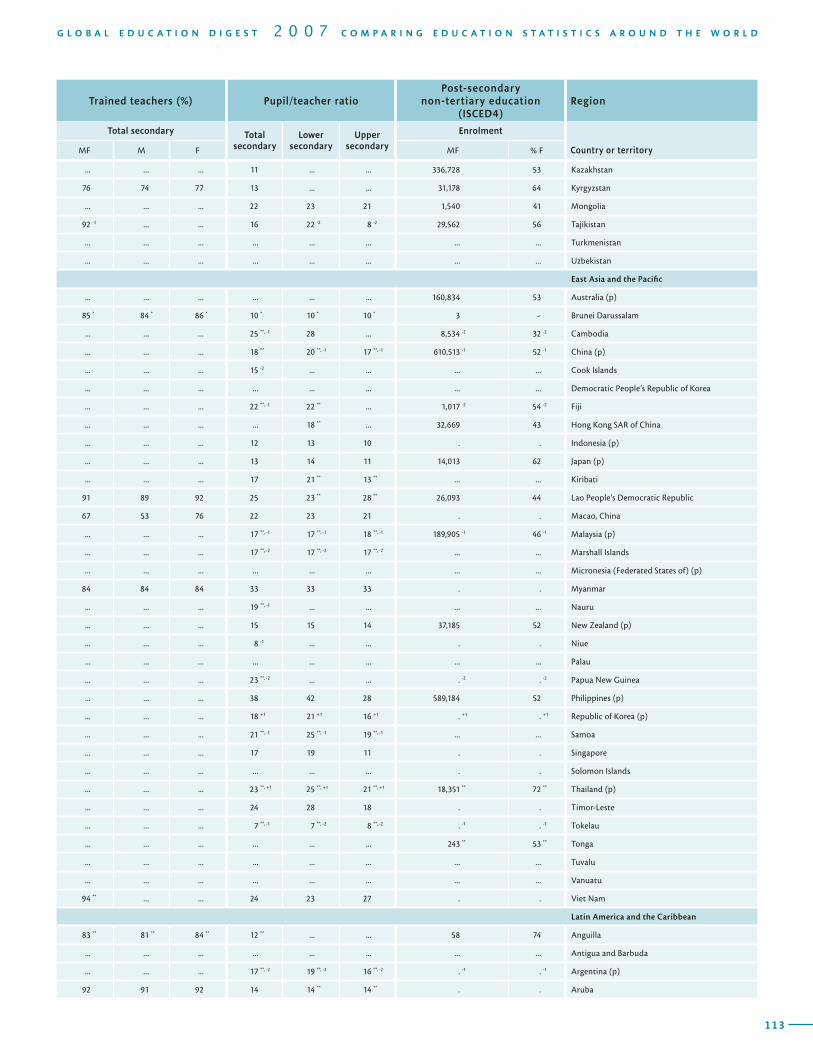
112
T A B L E 6Region Teaching staff
Country or territory
Total secondary Lower secondary Upper secondary
MF % F MF % F MF % F
SECONDARY AND POST-SECONDARY NON-TERTIARY EDUCATION / ISCED 2, 3 and 4 / Teaching staff and post-secondary non-tertiary enrolment / 2005
113
G L O B A L E D U C A T I O N D I G E S T 2 0 0 7 C O M P A R I N G E D U C A T I O N S T A T I S T I C S A R O U N D T H E W O R L D
Trained teachers (%) Pupil/teacher ratioPost-secondary
non-tertiary education (ISCED4)
Region
Total secondary Total secondary
Lower secondary
Upper secondary
Enrolment
Country or territoryMF M F MF % F
... ... ... 11 ... ... 336,728 53 Kazakhstan
76 74 77 13 ... ... 31,178 64 Kyrgyzstan
... ... ... 22 23 21 1,540 41 Mongolia
92 -1 ... ... 16 22 -2 8 -2 29,562 56 Tajikistan
... ... ... ... ... ... ... ... Turkmenistan
... ... ... ... ... ... ... ... Uzbekistan
East Asia and the Pacific
... ... ... ... ... ... 160,834 53 Australia (p)
85 * 84 * 86 * 10 * 10 * 10 * 3 - Brunei Darussalam
... ... ... 25 **, -1 28 ... 8,534 -2 32 -2 Cambodia
... ... ... 18 ** 20 **, -1 17 **, -1 610,513 -1 52 -1 China (p)
... ... ... 15 -2 ... ... ... ... Cook Islands
... ... ... ... ... ... ... ... Democratic People’s Republic of Korea
... ... ... 22 **, -1 22 ** ... 1,017 -2 54 -2 Fiji
... ... ... ... 18 ** ... 32,669 43 Hong Kong SAR of China
... ... ... 12 13 10 . . Indonesia (p)
... ... ... 13 14 11 14,013 62 Japan (p)
... ... ... 17 21 ** 13 ** ... ... Kiribati
91 89 92 25 23 ** 28 ** 26,093 44 Lao People’s Democratic Republic
67 53 76 22 23 21 . . Macao, China
... ... ... 17 **, -1 17 **, -1 18 **, -1 189,905 -1 46 -1 Malaysia (p)
... ... ... 17 **, -2 17 **, -2 17 **, -2 ... ... Marshall Islands
... ... ... ... ... ... ... ... Micronesia (Federated States of) (p)
84 84 84 33 33 33 . . Myanmar
... ... ... 19 **, -1 ... ... ... ... Nauru
... ... ... 15 15 14 37,185 52 New Zealand (p)
... ... ... 8 -1 ... ... . . Niue
... ... ... ... ... ... ... ... Palau
... ... ... 23 **, -2 ... ... . -2 . -2 Papua New Guinea
... ... ... 38 42 28 589,184 52 Philippines (p)
... ... ... 18 +1 21 +1 16 +1 . +1 . +1 Republic of Korea (p)
... ... ... 21 **, -1 25 **, -1 19 **, -1 ... ... Samoa
... ... ... 17 19 11 . . Singapore
... ... ... ... ... ... . . Solomon Islands
... ... ... 23 **, +1 25 **, +1 21 **, +1 18,351 ** 72 ** Thailand (p)
... ... ... 24 28 18 . . Timor-Leste
... ... ... 7 **, -1 7 **, -2 8 **, -2 . -1 . -1 Tokelau
... ... ... ... ... ... 243 ** 53 ** Tonga
... ... ... ... ... ... ... ... Tuvalu
... ... ... ... ... ... ... ... Vanuatu
94 ** ... ... 24 23 27 . . Viet Nam
Latin America and the Caribbean
83 ** 81 ** 84 ** 12 ** ... ... 58 74 Anguilla
... ... ... ... ... ... ... ... Antigua and Barbuda
... ... ... 17 **, -2 19 **, -2 16 **, -2 . -1 . -1 Argentina (p)
92 91 92 14 14 ** 14 ** . . Aruba

114
T A B L E 6Region Teaching staff
Country or territory
Total secondary Lower secondary Upper secondary
MF % F MF % F MF % F
SECONDARY AND POST-SECONDARY NON-TERTIARY EDUCATION / ISCED 2, 3 and 4 / Teaching staff and post-secondary non-tertiary enrolment / 2005
115
G L O B A L E D U C A T I O N D I G E S T 2 0 0 7 C O M P A R I N G E D U C A T I O N S T A T I S T I C S A R O U N D T H E W O R L D
Trained teachers (%) Pupil/teacher ratioPost-secondary
non-tertiary education (ISCED4)
Region
Total secondary Total secondary
Lower secondary
Upper secondary
Enrolment
Country or territoryMF M F MF % F
Bahamas 2,365 73 1,030 77 1,335 69
Barbados 1,348 ** 57 ** 785 ** 57 ** 563 ** 57 **
Belize 1,680 ** 64 ** 1,270 ** 64 ** 410 ** 63 **
Bermuda 682 67 323 69 359 65
Bolivia 44,904 **, -1 53 **, -1 19,460 **, -1 61 **, -1 25,444 **, -1 47 **, -1
Brazil (p) 1,570,514 -1 80 -1 945,340 -1 87 -1 625,174 -1 70 -1
British Virgin Islands 203 67 121 67 82 68
Cayman Islands 275 ** 52 ** 140 61 135 ** 44 **
Chile (p) 65,813 63 23,241 78 42,572 54
Colombia 164,194 52 121,849 **, -1 52 **, -1 42,491 **, -1 50 **, -1
Costa Rica 16,355 **, -2 54 **, -2 11,382 **, -2 54 **, -2 4,973 **, -2 55 **, -2
Cuba 84,827 55 46,352 64 38,475 46
Dominica 496 58 355 57 141 62
Dominican Republic 30,583 62 12,394 76 18,189 52
Ecuador 74,923 ** 49 ** 43,893 ** 50 ** 31,027 ** 48 **
El Salvador 21,083 49 13,236 53 7,847 44
Grenada 886 59 611 60 275 57
Guatemala 47,904 ... 29,828 ... 18,076 ...
Guyana 3,915 ** 63 ** 2,901 ** 64 ** 1,014 ** 63 **
Haiti ... ... ... ... ... ...
Honduras 16,989 ** 55 ** 11,492 ** 56 ** 5,493 ** 52 **
Jamaica (p) 13,336 ** 68 ** ... ... ... ...
Mexico (p) 593,451 47 356,540 49 236,911 43
Montserrat 26 65 17 ** 65 ** 9 ** 67 **
Netherlands Antilles 1,181 **, -2 55 **, -2 762 **, -2 58 **, -2 419 **, -2 49 **, -2
Nicaragua 12,980 57 8,668 56 4,312 59
Panama 16,392 57 9,522 60 6,870 54
Paraguay (p) 44,440 **, -1 62 **, -1 20,335 -2 64 -2 22,828 -2 61 -2
Peru (p) 160,856 44 ... ... ... ...
Saint Kitts and Nevis 397 ** 60 ** 246 ** 60 ** 151 ** 60 **
Saint Lucia 803 63 523 ** 63 ** 280 ** 63 **
Saint Vincent and the Grenadines 547 58 396 ** 57 ** 151 ** 60 **
Suriname 3,296 62 1,962 67 1,334 56
Trinidad and Tobago 5,896 ** 62 ** 3,441 ** 62 ** 2,455 ** 62 **
Turks and Caicos Islands 186 ** 62 ** 114 ** 61 ** 72 ** 64 **
Uruguay (p) 23,403 -2 ... 13,409 -1 ... 4,840 -1 ...
Venezuela 187,737 63 115,665 65 72,072 60
North America and Western Europe
Andorra 482 59 414 61 68 51
Austria (p) 71,135 61 42,402 68 28,733 51
Belgium (p) 81,130 ** 57 ** 36,425 -2 58 -2 ... ...
Canada (p) ... ... ... ... ... ...
Cyprus 5,715 ** 60 ** 2,795 -1 67 -1 2,941 -1 53 -1
Denmark (p) ... ... ... ... ... ...
Finland (p) 34,733 ** 67 ** 20,861 72 13,872 ** 59 **
France (p) 511,278 -1 59 -1 244,652 -1 65 -1 266,626 -1 53 -1
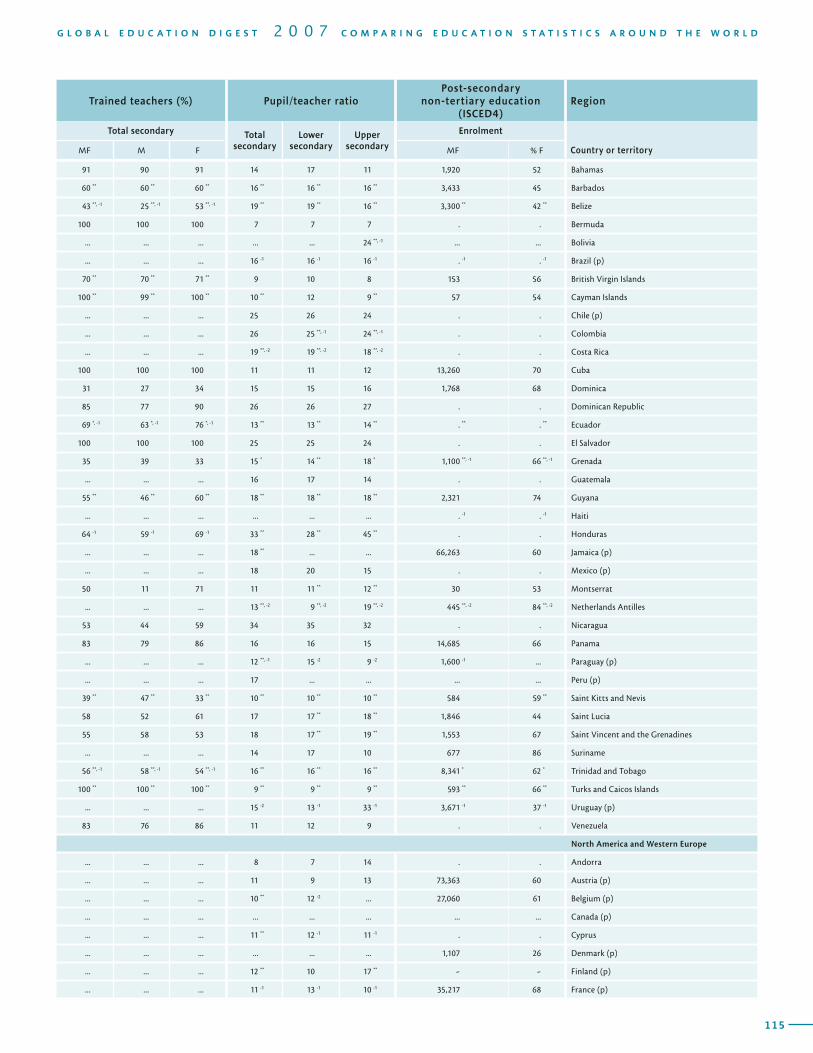
114
T A B L E 6Region Teaching staff
Country or territory
Total secondary Lower secondary Upper secondary
MF % F MF % F MF % F
SECONDARY AND POST-SECONDARY NON-TERTIARY EDUCATION / ISCED 2, 3 and 4 / Teaching staff and post-secondary non-tertiary enrolment / 2005
115
G L O B A L E D U C A T I O N D I G E S T 2 0 0 7 C O M P A R I N G E D U C A T I O N S T A T I S T I C S A R O U N D T H E W O R L D
Trained teachers (%) Pupil/teacher ratioPost-secondary
non-tertiary education (ISCED4)
Region
Total secondary Total secondary
Lower secondary
Upper secondary
Enrolment
Country or territoryMF M F MF % F
91 90 91 14 17 11 1,920 52 Bahamas
60 ** 60 ** 60 ** 16 ** 16 ** 16 ** 3,433 45 Barbados
43 **, -1 25 **, -1 53 **, -1 19 ** 19 ** 16 ** 3,300 ** 42 ** Belize
100 100 100 7 7 7 . . Bermuda
... ... ... ... ... 24 **, -1 ... ... Bolivia
... ... ... 16 -1 16 -1 16 -1 . -1 . -1 Brazil (p)
70 ** 70 ** 71 ** 9 10 8 153 56 British Virgin Islands
100 ** 99 ** 100 ** 10 ** 12 9 ** 57 54 Cayman Islands
... ... ... 25 26 24 . . Chile (p)
... ... ... 26 25 **, -1 24 **, -1 . . Colombia
... ... ... 19 **, -2 19 **, -2 18 **, -2 . . Costa Rica
100 100 100 11 11 12 13,260 70 Cuba
31 27 34 15 15 16 1,768 68 Dominica
85 77 90 26 26 27 . . Dominican Republic
69 *, -1 63 *, -1 76 *, -1 13 ** 13 ** 14 ** . ** . ** Ecuador
100 100 100 25 25 24 . . El Salvador
35 39 33 15 * 14 ** 18 * 1,100 **, -1 66 **, -1 Grenada
... ... ... 16 17 14 . . Guatemala
55 ** 46 ** 60 ** 18 ** 18 ** 18 ** 2,321 74 Guyana
... ... ... ... ... ... . -1 . -1 Haiti
64 -1 59 -1 69 -1 33 ** 28 ** 45 ** . . Honduras
... ... ... 18 ** ... ... 66,263 60 Jamaica (p)
... ... ... 18 20 15 . . Mexico (p)
50 11 71 11 11 ** 12 ** 30 53 Montserrat
... ... ... 13 **, -2 9 **, -2 19 **, -2 445 **, -2 84 **, -2 Netherlands Antilles
53 44 59 34 35 32 . . Nicaragua
83 79 86 16 16 15 14,685 66 Panama
... ... ... 12 **, -1 15 -2 9 -2 1,600 -1 ... Paraguay (p)
... ... ... 17 ... ... ... ... Peru (p)
39 ** 47 ** 33 ** 10 ** 10 ** 10 ** 584 59 ** Saint Kitts and Nevis
58 52 61 17 17 ** 18 ** 1,846 44 Saint Lucia
55 58 53 18 17 ** 19 ** 1,553 67 Saint Vincent and the Grenadines
... ... ... 14 17 10 677 86 Suriname
56 **, -1 58 **, -1 54 **, -1 16 ** 16 ** 16 ** 8,341 * 62 * Trinidad and Tobago
100 ** 100 ** 100 ** 9 ** 9 ** 9 ** 593 ** 66 ** Turks and Caicos Islands
... ... ... 15 -2 13 -1 33 -1 3,671 -1 37 -1 Uruguay (p)
83 76 86 11 12 9 . . Venezuela
North America and Western Europe
... ... ... 8 7 14 . . Andorra
... ... ... 11 9 13 73,363 60 Austria (p)
... ... ... 10 ** 12 -2 ... 27,060 61 Belgium (p)
... ... ... ... ... ... ... ... Canada (p)
... ... ... 11 ** 12 -1 11 -1 . . Cyprus
... ... ... ... ... ... 1,107 26 Denmark (p)
... ... ... 12 ** 10 17 ** - - Finland (p)
... ... ... 11 -1 13 -1 10 -1 35,217 68 France (p)
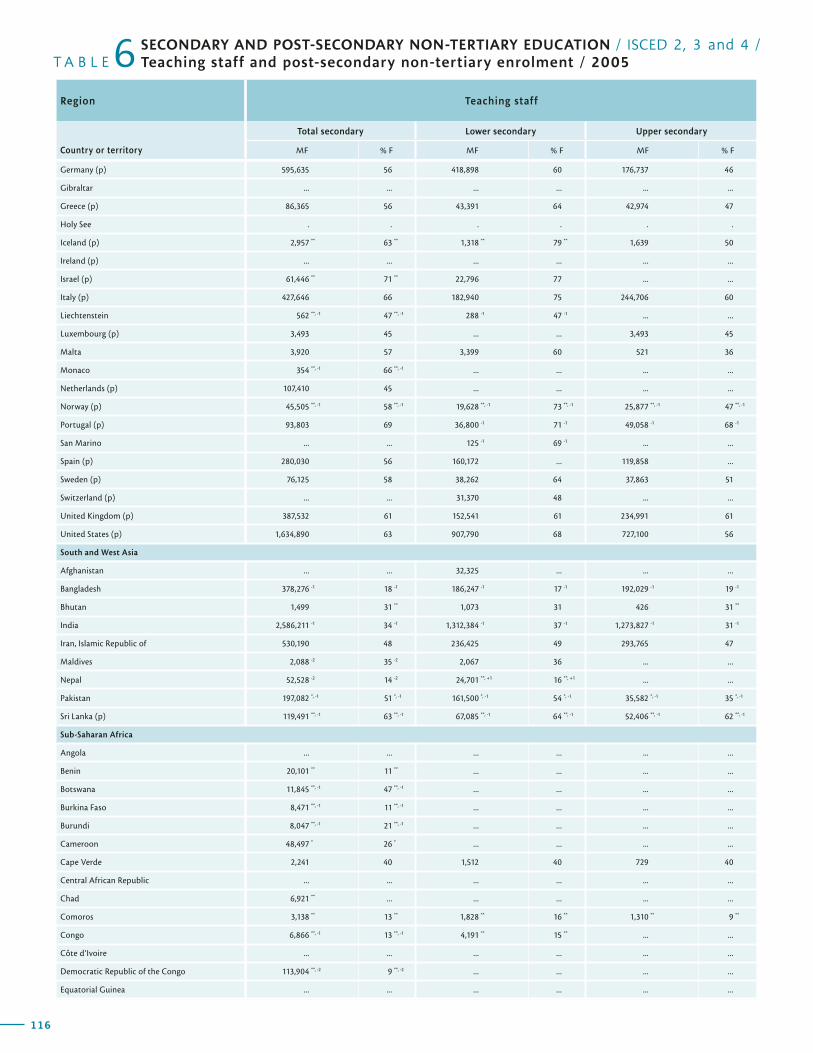
116
T A B L E 6Region Teaching staff
Country or territory
Total secondary Lower secondary Upper secondary
MF % F MF % F MF % F
SECONDARY AND POST-SECONDARY NON-TERTIARY EDUCATION / ISCED 2, 3 and 4 / Teaching staff and post-secondary non-tertiary enrolment / 2005
117
G L O B A L E D U C A T I O N D I G E S T 2 0 0 7 C O M P A R I N G E D U C A T I O N S T A T I S T I C S A R O U N D T H E W O R L D
Trained teachers (%) Pupil/teacher ratioPost-secondary
non-tertiary education (ISCED4)
Region
Total secondary Total secondary
Lower secondary
Upper secondary
Enrolment
Country or territoryMF M F MF % F
Germany (p) 595,635 56 418,898 60 176,737 46
Gibraltar ... ... ... ... ... ...
Greece (p) 86,365 56 43,391 64 42,974 47
Holy See . . . . . .
Iceland (p) 2,957 ** 63 ** 1,318 ** 79 ** 1,639 50
Ireland (p) ... ... ... ... ... ...
Israel (p) 61,446 ** 71 ** 22,796 77 ... ...
Italy (p) 427,646 66 182,940 75 244,706 60
Liechtenstein 562 **, -1 47 **, -1 288 -1 47 -1 ... ...
Luxembourg (p) 3,493 45 ... ... 3,493 45
Malta 3,920 57 3,399 60 521 36
Monaco 354 **, -1 66 **, -1 ... ... ... ...
Netherlands (p) 107,410 45 ... ... ... ...
Norway (p) 45,505 **, -1 58 **, -1 19,628 **, -1 73 **, -1 25,877 **, -1 47 **, -1
Portugal (p) 93,803 69 36,800 -1 71 -1 49,058 -1 68 -1
San Marino ... ... 125 -1 69 -1 ... ...
Spain (p) 280,030 56 160,172 ... 119,858 ...
Sweden (p) 76,125 58 38,262 64 37,863 51
Switzerland (p) ... ... 31,370 48 ... ...
United Kingdom (p) 387,532 61 152,541 61 234,991 61
United States (p) 1,634,890 63 907,790 68 727,100 56
South and West Asia
Afghanistan ... ... 32,325 ... ... ...
Bangladesh 378,276 -1 18 -1 186,247 -1 17 -1 192,029 -1 19 -1
Bhutan 1,499 31 ** 1,073 31 426 31 **
India 2,586,211 -1 34 -1 1,312,384 -1 37 -1 1,273,827 -1 31 -1
Iran, Islamic Republic of 530,190 48 236,425 49 293,765 47
Maldives 2,088 -2 35 -2 2,067 36 ... ...
Nepal 52,528 -2 14 -2 24,701 **, +1 16 **, +1 ... ...
Pakistan 197,082 *, -1 51 *, -1 161,500 *, -1 54 *, -1 35,582 *, -1 35 *, -1
Sri Lanka (p) 119,491 **, -1 63 **, -1 67,085 **, -1 64 **, -1 52,406 **, -1 62 **, -1
Sub-Saharan Africa
Angola ... ... ... ... ... ...
Benin 20,101 ** 11 ** ... ... ... ...
Botswana 11,845 **, -1 47 **, -1 ... ... ... ...
Burkina Faso 8,471 **, -1 11 **, -1 ... ... ... ...
Burundi 8,047 **, -1 21 **, -1 ... ... ... ...
Cameroon 48,497 * 26 * ... ... ... ...
Cape Verde 2,241 40 1,512 40 729 40
Central African Republic ... ... ... ... ... ...
Chad 6,921 ** ... ... ... ... ...
Comoros 3,138 ** 13 ** 1,828 ** 16 ** 1,310 ** 9 **
Congo 6,866 **, -1 13 **, -1 4,191 ** 15 ** ... ...
Côte d’Ivoire ... ... ... ... ... ...
Democratic Republic of the Congo 113,904 **, -2 9 **, -2 ... ... ... ...
Equatorial Guinea ... ... ... ... ... ...
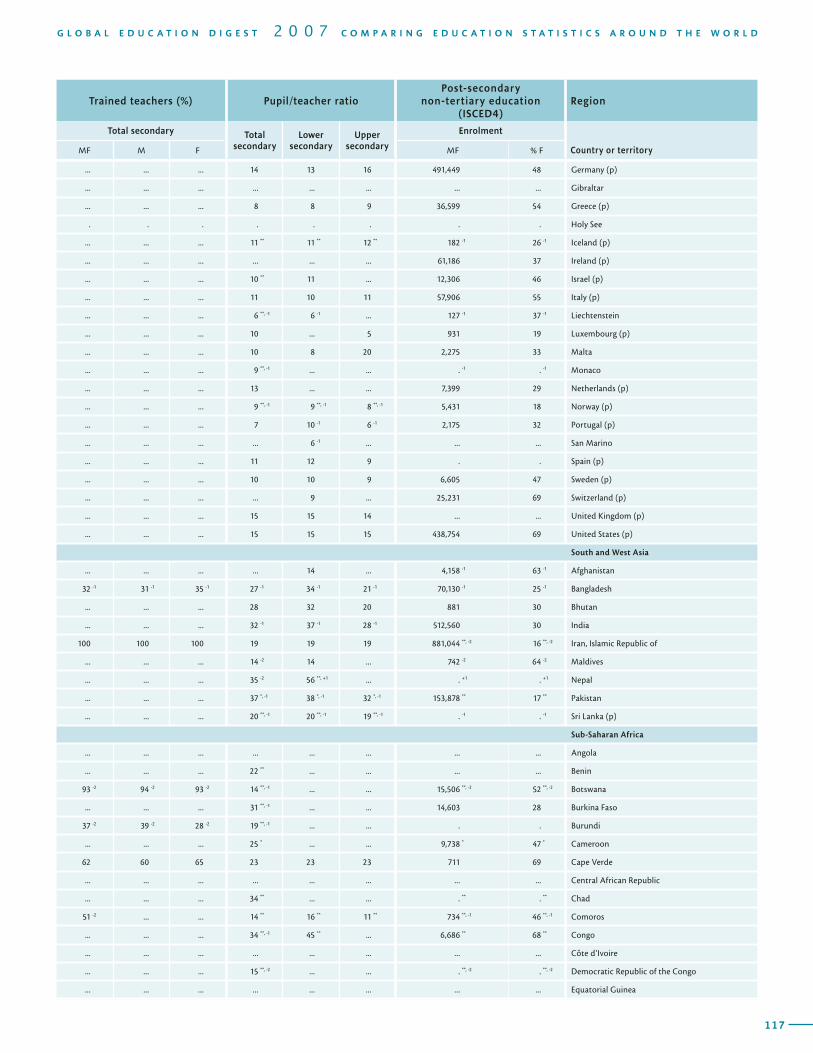
116
T A B L E 6Region Teaching staff
Country or territory
Total secondary Lower secondary Upper secondary
MF % F MF % F MF % F
SECONDARY AND POST-SECONDARY NON-TERTIARY EDUCATION / ISCED 2, 3 and 4 / Teaching staff and post-secondary non-tertiary enrolment / 2005
117
G L O B A L E D U C A T I O N D I G E S T 2 0 0 7 C O M P A R I N G E D U C A T I O N S T A T I S T I C S A R O U N D T H E W O R L D
Trained teachers (%) Pupil/teacher ratioPost-secondary
non-tertiary education (ISCED4)
Region
Total secondary Total secondary
Lower secondary
Upper secondary
Enrolment
Country or territoryMF M F MF % F
... ... ... 14 13 16 491,449 48 Germany (p)
... ... ... ... ... ... ... ... Gibraltar
... ... ... 8 8 9 36,599 54 Greece (p)
. . . . . . . . Holy See
... ... ... 11 ** 11 ** 12 ** 182 -1 26 -1 Iceland (p)
... ... ... ... ... ... 61,186 37 Ireland (p)
... ... ... 10 ** 11 ... 12,306 46 Israel (p)
... ... ... 11 10 11 57,906 55 Italy (p)
... ... ... 6 **, -1 6 -1 ... 127 -1 37 -1 Liechtenstein
... ... ... 10 ... 5 931 19 Luxembourg (p)
... ... ... 10 8 20 2,275 33 Malta
... ... ... 9 **, -1 ... ... . -1 . -1 Monaco
... ... ... 13 ... ... 7,399 29 Netherlands (p)
... ... ... 9 **, -1 9 **, -1 8 **, -1 5,431 18 Norway (p)
... ... ... 7 10 -1 6 -1 2,175 32 Portugal (p)
... ... ... ... 6 -1 ... ... ... San Marino
... ... ... 11 12 9 . . Spain (p)
... ... ... 10 10 9 6,605 47 Sweden (p)
... ... ... ... 9 ... 25,231 69 Switzerland (p)
... ... ... 15 15 14 ... ... United Kingdom (p)
... ... ... 15 15 15 438,754 69 United States (p)
South and West Asia
... ... ... ... 14 ... 4,158 -1 63 -1 Afghanistan
32 -1 31 -1 35 -1 27 -1 34 -1 21 -1 70,130 -1 25 -1 Bangladesh
... ... ... 28 32 20 881 30 Bhutan
... ... ... 32 -1 37 -1 28 -1 512,560 30 India
100 100 100 19 19 19 881,044 **, -2 16 **, -2 Iran, Islamic Republic of
... ... ... 14 -2 14 ... 742 -2 64 -2 Maldives
... ... ... 35 -2 56 **, +1 ... . +1 . +1 Nepal
... ... ... 37 *, -1 38 *, -1 32 *, -1 153,878 ** 17 ** Pakistan
... ... ... 20 **, -1 20 **, -1 19 **, -1 . -1 . -1 Sri Lanka (p)
Sub-Saharan Africa
... ... ... ... ... ... ... ... Angola
... ... ... 22 ** ... ... ... ... Benin
93 -2 94 -2 93 -2 14 **, -1 ... ... 15,506 **, -2 52 **, -2 Botswana
... ... ... 31 **, -1 ... ... 14,603 28 Burkina Faso
37 -2 39 -2 28 -2 19 **, -1 ... ... . . Burundi
... ... ... 25 * ... ... 9,738 * 47 * Cameroon
62 60 65 23 23 23 711 69 Cape Verde
... ... ... ... ... ... ... ... Central African Republic
... ... ... 34 ** ... ... . ** . ** Chad
51 -2 ... ... 14 ** 16 ** 11 ** 734 **, -1 46 **, -1 Comoros
... ... ... 34 **, -1 45 ** ... 6,686 ** 68 ** Congo
... ... ... ... ... ... ... ... Côte d’Ivoire
... ... ... 15 **, -2 ... ... . **, -2 . **, -2 Democratic Republic of the Congo
... ... ... ... ... ... ... ... Equatorial Guinea
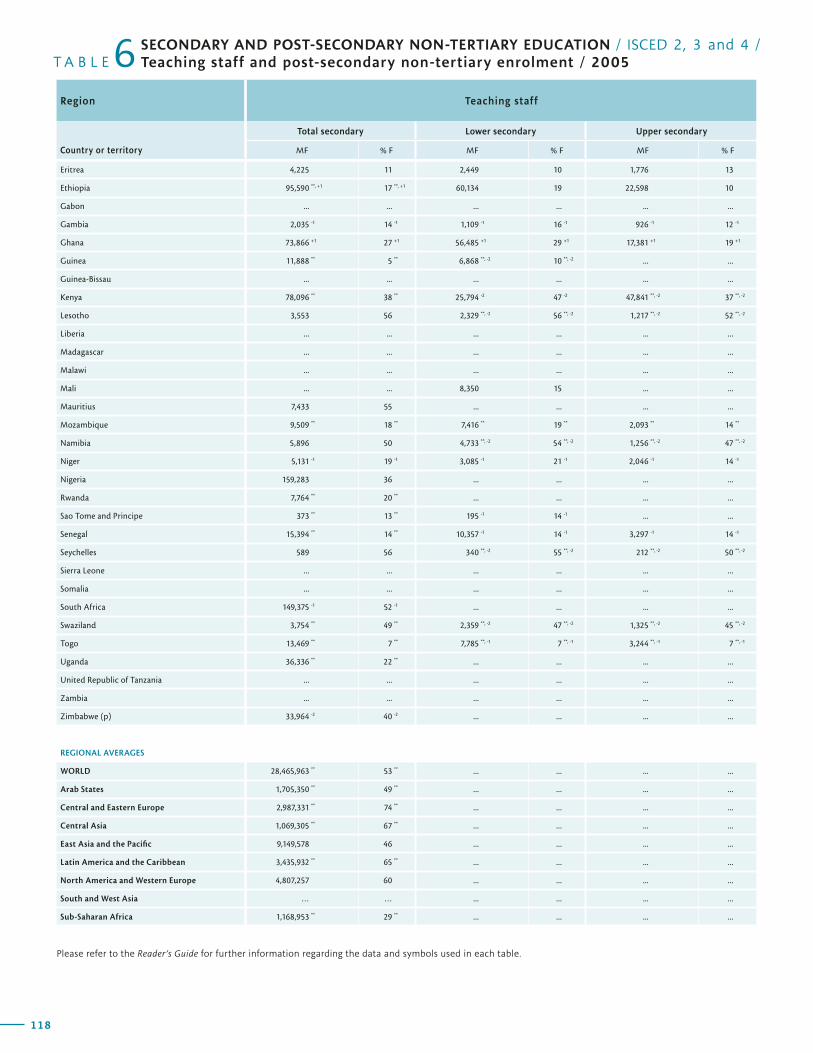
118
T A B L E 6Region Teaching staff
Country or territory
Total secondary Lower secondary Upper secondary
MF % F MF % F MF % F
SECONDARY AND POST-SECONDARY NON-TERTIARY EDUCATION / ISCED 2, 3 and 4 / Teaching staff and post-secondary non-tertiary enrolment / 2005
119
G L O B A L E D U C A T I O N D I G E S T 2 0 0 7 C O M P A R I N G E D U C A T I O N S T A T I S T I C S A R O U N D T H E W O R L D
Trained teachers (%) Pupil/teacher ratioPost-secondary
non-tertiary education (ISCED4)
Region
Total secondary Total secondary
Lower secondary
Upper secondary
Enrolment
Country or territoryMF M F MF % F
Eritrea 4,225 11 2,449 10 1,776 13
Ethiopia 95,590 **, +1 17 **, +1 60,134 19 22,598 10
Gabon ... ... ... ... ... ...
Gambia 2,035 -1 14 -1 1,109 -1 16 -1 926 -1 12 -1
Ghana 73,866 +1 27 +1 56,485 +1 29 +1 17,381 +1 19 +1
Guinea 11,888 ** 5 ** 6,868 **, -2 10 **, -2 ... ...
Guinea-Bissau ... ... ... ... ... ...
Kenya 78,096 ** 38 ** 25,794 -2 47 -2 47,841 **, -2 37 **, -2
Lesotho 3,553 56 2,329 **, -2 56 **, -2 1,217 **, -2 52 **, -2
Liberia ... ... ... ... ... ...
Madagascar ... ... ... ... ... ...
Malawi ... ... ... ... ... ...
Mali ... ... 8,350 15 ... ...
Mauritius 7,433 55 ... ... ... ...
Mozambique 9,509 ** 18 ** 7,416 ** 19 ** 2,093 ** 14 **
Namibia 5,896 50 4,733 **, -2 54 **, -2 1,256 **, -2 47 **, -2
Niger 5,131 -1 19 -1 3,085 -1 21 -1 2,046 -1 14 -1
Nigeria 159,283 36 ... ... ... ...
Rwanda 7,764 ** 20 ** ... ... ... ...
Sao Tome and Principe 373 ** 13 ** 195 -1 14 -1 ... ...
Senegal 15,394 ** 14 ** 10,357 -1 14 -1 3,297 -1 14 -1
Seychelles 589 56 340 **, -2 55 **, -2 212 **, -2 50 **, -2
Sierra Leone ... ... ... ... ... ...
Somalia ... ... ... ... ... ...
South Africa 149,375 -1 52 -1 ... ... ... ...
Swaziland 3,754 ** 49 ** 2,359 **, -2 47 **, -2 1,325 **, -2 45 **, -2
Togo 13,469 ** 7 ** 7,785 **, -1 7 **, -1 3,244 **, -1 7 **, -1
Uganda 36,336 ** 22 ** ... ... ... ...
United Republic of Tanzania ... ... ... ... ... ...
Zambia ... ... ... ... ... ...
Zimbabwe (p) 33,964 -2 40 -2 ... ... ... ...
REGIONAL AVERAGES
WORLD 28,465,963 ** 53 ** ... ... ... ...
Arab States 1,705,350 ** 49 ** ... ... ... ...
Central and Eastern Europe 2,987,331 ** 74 ** ... ... ... ...
Central Asia 1,069,305 ** 67 ** ... ... ... ...
East Asia and the Pacific 9,149,578 46 ... ... ... ...
Latin America and the Caribbean 3,435,932 ** 65 ** ... ... ... ...
North America and Western Europe 4,807,257 60 ... ... ... ...
South and West Asia … … ... ... ... ...
Sub-Saharan Africa 1,168,953 ** 29 ** ... ... ... ...
Please refer to the Reader’s Guide for further information regarding the data and symbols used in each table.
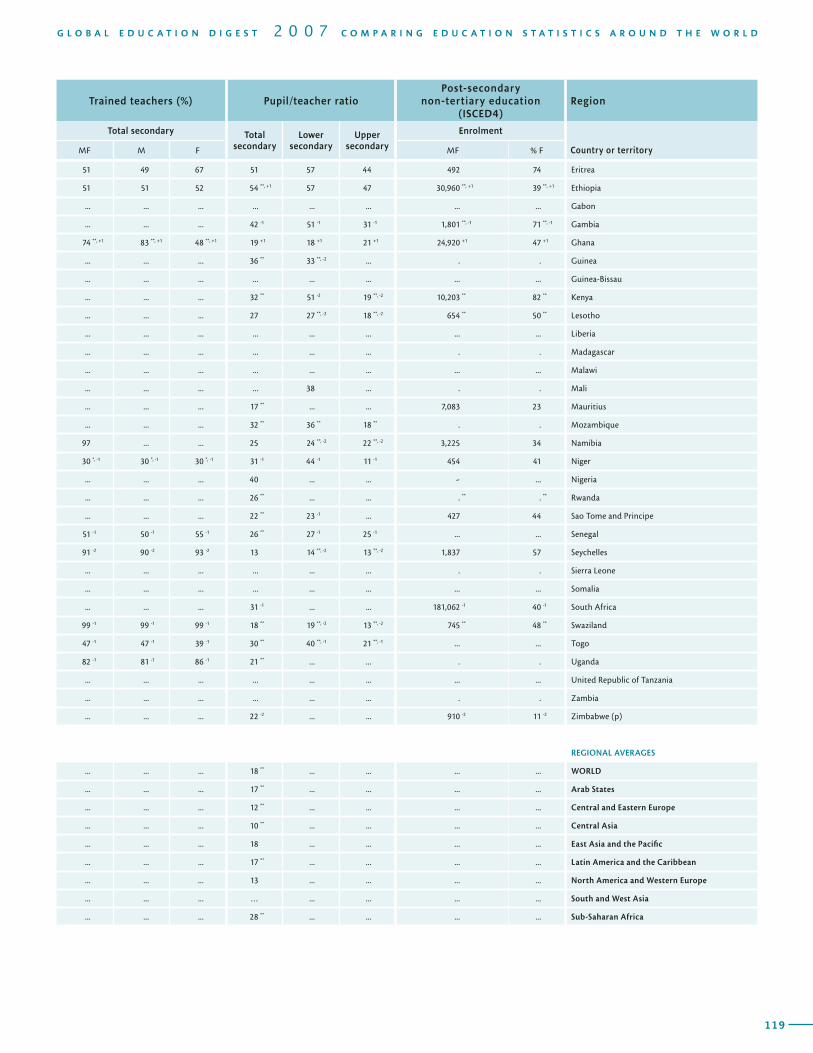
118
T A B L E 6Region Teaching staff
Country or territory
Total secondary Lower secondary Upper secondary
MF % F MF % F MF % F
SECONDARY AND POST-SECONDARY NON-TERTIARY EDUCATION / ISCED 2, 3 and 4 / Teaching staff and post-secondary non-tertiary enrolment / 2005
119
G L O B A L E D U C A T I O N D I G E S T 2 0 0 7 C O M P A R I N G E D U C A T I O N S T A T I S T I C S A R O U N D T H E W O R L D
Trained teachers (%) Pupil/teacher ratioPost-secondary
non-tertiary education (ISCED4)
Region
Total secondary Total secondary
Lower secondary
Upper secondary
Enrolment
Country or territoryMF M F MF % F
51 49 67 51 57 44 492 74 Eritrea
51 51 52 54 **, +1 57 47 30,960 **, +1 39 **, +1 Ethiopia
... ... ... ... ... ... ... ... Gabon
... ... ... 42 -1 51 -1 31 -1 1,801 **, -1 71 **, -1 Gambia
74 **, +1 83 **, +1 48 **, +1 19 +1 18 +1 21 +1 24,920 +1 47 +1 Ghana
... ... ... 36 ** 33 **, -2 ... . . Guinea
... ... ... ... ... ... ... ... Guinea-Bissau
... ... ... 32 ** 51 -2 19 **, -2 10,203 ** 82 ** Kenya
... ... ... 27 27 **, -2 18 **, -2 654 ** 50 ** Lesotho
... ... ... ... ... ... ... ... Liberia
... ... ... ... ... ... . . Madagascar
... ... ... ... ... ... ... ... Malawi
... ... ... ... 38 ... . . Mali
... ... ... 17 ** ... ... 7,083 23 Mauritius
... ... ... 32 ** 36 ** 18 ** . . Mozambique
97 ... ... 25 24 **, -2 22 **, -2 3,225 34 Namibia
30 *, -1 30 *, -1 30 *, -1 31 -1 44 -1 11 -1 454 41 Niger
... ... ... 40 ... ... - ... Nigeria
... ... ... 26 ** ... ... . ** . ** Rwanda
... ... ... 22 ** 23 -1 ... 427 44 Sao Tome and Principe
51 -1 50 -1 55 -1 26 ** 27 -1 25 -1 ... ... Senegal
91 -2 90 -2 93 -2 13 14 **, -2 13 **, -2 1,837 57 Seychelles
... ... ... ... ... ... . . Sierra Leone
... ... ... ... ... ... ... ... Somalia
... ... ... 31 -1 ... ... 181,062 -1 40 -1 South Africa
99 -1 99 -1 99 -1 18 ** 19 **, -2 13 **, -2 745 ** 48 ** Swaziland
47 -1 47 -1 39 -1 30 ** 40 **, -1 21 **, -1 ... ... Togo
82 -1 81 -1 86 -1 21 ** ... ... . . Uganda
... ... ... ... ... ... ... ... United Republic of Tanzania
... ... ... ... ... ... . . Zambia
... ... ... 22 -2 ... ... 910 -2 11 -2 Zimbabwe (p)
REGIONAL AVERAGES
... ... ... 18 ** ... ... ... ... WORLD
... ... ... 17 ** ... ... ... ... Arab States
... ... ... 12 ** ... ... ... ... Central and Eastern Europe
... ... ... 10 ** ... ... ... ... Central Asia
... ... ... 18 ... ... ... ... East Asia and the Pacific
... ... ... 17 ** ... ... ... ... Latin America and the Caribbean
... ... ... 13 ... ... ... ... North America and Western Europe
... ... ... … ... ... ... ... South and West Asia
... ... ... 28 ** ... ... ... ... Sub-Saharan Africa
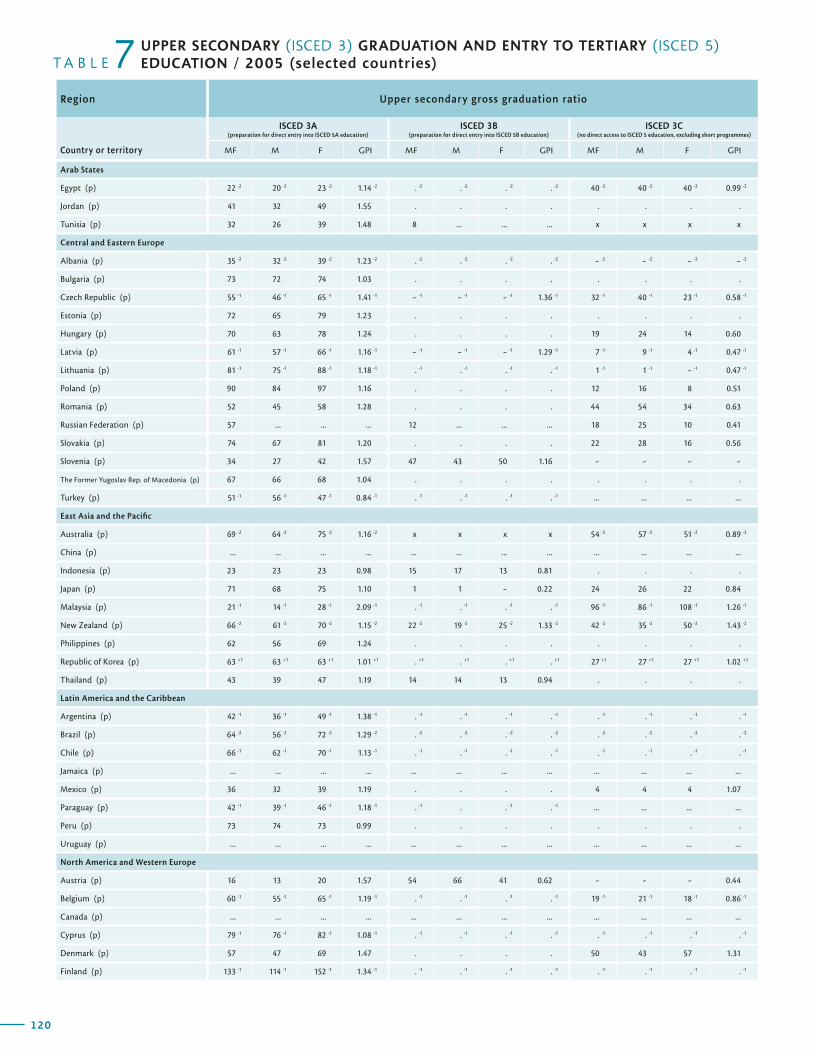
120
T A B L E 7Region Upper secondary gross graduation ratio
Country or territory
ISCED 3A(preparation for direct entry into ISCED 5A education)
ISCED 3B(preparation for direct entry into ISCED 5B education)
ISCED 3C(no direct access to ISCED 5 education, excluding short programmes)
MF M F GPI MF M F GPI MF M F GPI
UPPER SECONDARY (ISCED 3) GRADUATION AND ENTRY TO TERTIARY (ISCED 5) EDUCATION / 2005 (selected countries)
121
G L O B A L E D U C A T I O N D I G E S T 2 0 0 7 C O M P A R I N G E D U C A T I O N S T A T I S T I C S A R O U N D T H E W O R L D
Gross entry ratio to tertiary education Region
ISCED 5A ISCED 5B
Country or territoryMF M F GPI MF M F GPI
Arab States
Egypt (p) 22 -2 20 -2 23 -2 1.14 -2 . -2 . -2 . -2 . -2 40 -2 40 -2 40 -2 0.99 -2
Jordan (p) 41 32 49 1.55 . . . . . . . .
Tunisia (p) 32 26 39 1.48 8 ... ... ... x x x x
Central and Eastern Europe
Albania (p) 35 -2 32 -2 39 -2 1.23 -2 . -2 . -2 . -2 . -2 - -2 - -2 - -2 - -2
Bulgaria (p) 73 72 74 1.03 . . . . . . . .
Czech Republic (p) 55 -1 46 -1 65 -1 1.41 -1 - -1 - -1 - -1 1.36 -1 32 -1 40 -1 23 -1 0.58 -1
Estonia (p) 72 65 79 1.23 . . . . . . . .
Hungary (p) 70 63 78 1.24 . . . . 19 24 14 0.60
Latvia (p) 61 -1 57 -1 66 -1 1.16 -1 - -1 - -1 - -1 1.29 -1 7 -1 9 -1 4 -1 0.47 -1
Lithuania (p) 81 -1 75 -1 88 -1 1.18 -1 . -1 . -1 . -1 . -1 1 -1 1 -1 - -1 0.47 -1
Poland (p) 90 84 97 1.16 . . . . 12 16 8 0.51
Romania (p) 52 45 58 1.28 . . . . 44 54 34 0.63
Russian Federation (p) 57 ... ... ... 12 ... ... ... 18 25 10 0.41
Slovakia (p) 74 67 81 1.20 . . . . 22 28 16 0.56
Slovenia (p) 34 27 42 1.57 47 43 50 1.16 - - - -
The Former Yugoslav Rep. of Macedonia (p) 67 66 68 1.04 . . . . . . . .
Turkey (p) 51 -1 56 -1 47 -1 0.84 -1 . -1 . -1 . -1 . -1 ... ... ... ...
East Asia and the Pacific
Australia (p) 69 -2 64 -2 75 -2 1.16 -2 x x x x 54 -2 57 -2 51 -2 0.89 -2
China (p) ... ... ... ... ... ... ... ... ... ... ... ...
Indonesia (p) 23 23 23 0.98 15 17 13 0.81 . . . .
Japan (p) 71 68 75 1.10 1 1 - 0.22 24 26 22 0.84
Malaysia (p) 21 -1 14 -1 28 -1 2.09 -1 . -1 . -1 . -1 . -1 96 -1 86 -1 108 -1 1.26 -1
New Zealand (p) 66 -2 61 -2 70 -2 1.15 -2 22 -2 19 -2 25 -2 1.33 -2 42 -2 35 -2 50 -2 1.43 -2
Philippines (p) 62 56 69 1.24 . . . . . . . .
Republic of Korea (p) 63 +1 63 +1 63 +1 1.01 +1 . +1 . +1 . +1 . +1 27 +1 27 +1 27 +1 1.02 +1
Thailand (p) 43 39 47 1.19 14 14 13 0.94 . . . .
Latin America and the Caribbean
Argentina (p) 42 -1 36 -1 49 -1 1.38 -1 . -1 . -1 . -1 . -1 . -1 . -1 . -1 . -1
Brazil (p) 64 -2 56 -2 72 -2 1.29 -2 . -2 . -2 . -2 . -2 . -2 . -2 . -2 . -2
Chile (p) 66 -1 62 -1 70 -1 1.13 -1 . -1 . -1 . -1 . -1 . -1 . -1 . -1 . -1
Jamaica (p) ... ... ... ... ... ... ... ... ... ... ... ...
Mexico (p) 36 32 39 1.19 . . . . 4 4 4 1.07
Paraguay (p) 42 -1 39 -1 46 -1 1.18 -1 . -1 . . -1 . -1 ... ... ... ...
Peru (p) 73 74 73 0.99 . . . . . . . .
Uruguay (p) ... ... ... ... ... ... ... ... ... ... ... ...
North America and Western Europe
Austria (p) 16 13 20 1.57 54 66 41 0.62 - - - 0.44
Belgium (p) 60 -1 55 -1 65 -1 1.19 -1 . -1 . -1 . -1 . -1 19 -1 21 -1 18 -1 0.86 -1
Canada (p) ... ... ... ... ... ... ... ... ... ... ... ...
Cyprus (p) 79 -1 76 -1 82 -1 1.08 -1 . -1 . -1 . -1 . -1 . -1 . -1 . -1 . -1
Denmark (p) 57 47 69 1.47 . . . . 50 43 57 1.31
Finland (p) 133 -1 114 -1 152 -1 1.34 -1 . -1 . -1 . -1 . -1 . -1 . -1 . -1 . -1
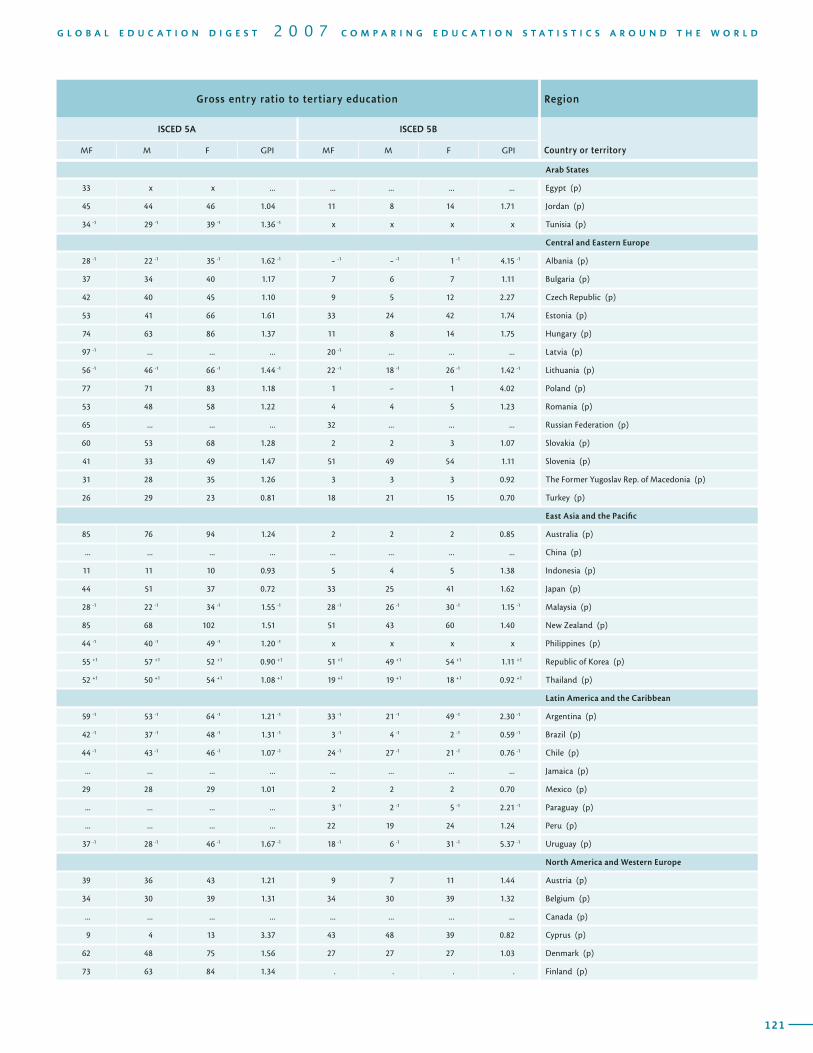
120
T A B L E 7Region Upper secondary gross graduation ratio
Country or territory
ISCED 3A(preparation for direct entry into ISCED 5A education)
ISCED 3B(preparation for direct entry into ISCED 5B education)
ISCED 3C(no direct access to ISCED 5 education, excluding short programmes)
MF M F GPI MF M F GPI MF M F GPI
UPPER SECONDARY (ISCED 3) GRADUATION AND ENTRY TO TERTIARY (ISCED 5) EDUCATION / 2005 (selected countries)
121
G L O B A L E D U C A T I O N D I G E S T 2 0 0 7 C O M P A R I N G E D U C A T I O N S T A T I S T I C S A R O U N D T H E W O R L D
Gross entry ratio to tertiary education Region
ISCED 5A ISCED 5B
Country or territoryMF M F GPI MF M F GPI
Arab States
33 x x ... ... ... ... ... Egypt (p)
45 44 46 1.04 11 8 14 1.71 Jordan (p)
34 -1 29 -1 39 -1 1.36 -1 x x x x Tunisia (p)
Central and Eastern Europe
28 -1 22 -1 35 -1 1.62 -1 - -1 - -1 1 -1 4.15 -1 Albania (p)
37 34 40 1.17 7 6 7 1.11 Bulgaria (p)
42 40 45 1.10 9 5 12 2.27 Czech Republic (p)
53 41 66 1.61 33 24 42 1.74 Estonia (p)
74 63 86 1.37 11 8 14 1.75 Hungary (p)
97 -1 ... ... ... 20 -1 ... ... ... Latvia (p)
56 -1 46 -1 66 -1 1.44 -1 22 -1 18 -1 26 -1 1.42 -1 Lithuania (p)
77 71 83 1.18 1 - 1 4.02 Poland (p)
53 48 58 1.22 4 4 5 1.23 Romania (p)
65 ... ... ... 32 ... ... ... Russian Federation (p)
60 53 68 1.28 2 2 3 1.07 Slovakia (p)
41 33 49 1.47 51 49 54 1.11 Slovenia (p)
31 28 35 1.26 3 3 3 0.92 The Former Yugoslav Rep. of Macedonia (p)
26 29 23 0.81 18 21 15 0.70 Turkey (p)
East Asia and the Pacific
85 76 94 1.24 2 2 2 0.85 Australia (p)
... ... ... ... ... ... ... ... China (p)
11 11 10 0.93 5 4 5 1.38 Indonesia (p)
44 51 37 0.72 33 25 41 1.62 Japan (p)
28 -1 22 -1 34 -1 1.55 -1 28 -1 26 -1 30 -1 1.15 -1 Malaysia (p)
85 68 102 1.51 51 43 60 1.40 New Zealand (p)
44 -1 40 -1 49 -1 1.20 -1 x x x x Philippines (p)
55 +1 57 +1 52 +1 0.90 +1 51 +1 49 +1 54 +1 1.11 +1 Republic of Korea (p)
52 +1 50 +1 54 +1 1.08 +1 19 +1 19 +1 18 +1 0.92 +1 Thailand (p)
Latin America and the Caribbean
59 -1 53 -1 64 -1 1.21 -1 33 -1 21 -1 49 -1 2.30 -1 Argentina (p)
42 -1 37 -1 48 -1 1.31 -1 3 -1 4 -1 2 -1 0.59 -1 Brazil (p)
44 -1 43 -1 46 -1 1.07 -1 24 -1 27 -1 21 -1 0.76 -1 Chile (p)
... ... ... ... ... ... ... ... Jamaica (p)
29 28 29 1.01 2 2 2 0.70 Mexico (p)
... ... ... ... 3 -1 2 -1 5 -1 2.21 -1 Paraguay (p)
... ... ... ... 22 19 24 1.24 Peru (p)
37 -1 28 -1 46 -1 1.67 -1 18 -1 6 -1 31 -1 5.37 -1 Uruguay (p)
North America and Western Europe
39 36 43 1.21 9 7 11 1.44 Austria (p)
34 30 39 1.31 34 30 39 1.32 Belgium (p)
... ... ... ... ... ... ... ... Canada (p)
9 4 13 3.37 43 48 39 0.82 Cyprus (p)
62 48 75 1.56 27 27 27 1.03 Denmark (p)
73 63 84 1.34 . . . . Finland (p)
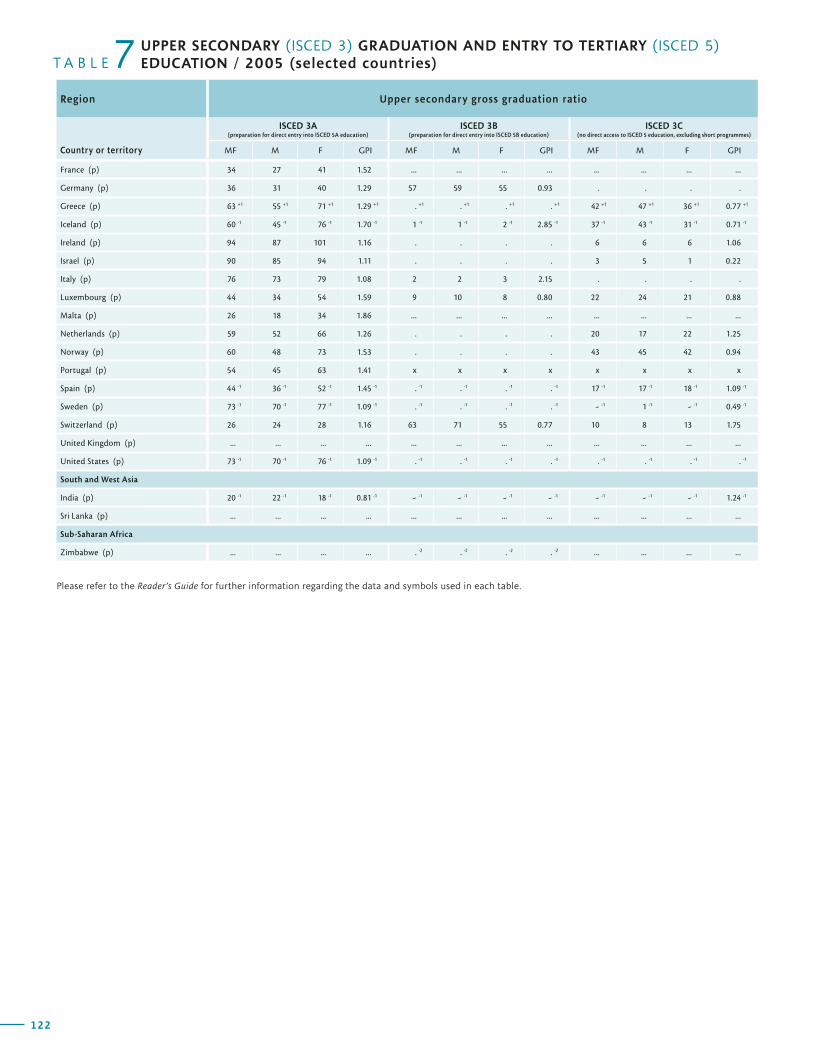
122
T A B L E 7Region Upper secondary gross graduation ratio
Country or territory
ISCED 3A(preparation for direct entry into ISCED 5A education)
ISCED 3B(preparation for direct entry into ISCED 5B education)
ISCED 3C(no direct access to ISCED 5 education, excluding short programmes)
MF M F GPI MF M F GPI MF M F GPI
UPPER SECONDARY (ISCED 3) GRADUATION AND ENTRY TO TERTIARY (ISCED 5) EDUCATION / 2005 (selected countries)
123
G L O B A L E D U C A T I O N D I G E S T 2 0 0 7 C O M P A R I N G E D U C A T I O N S T A T I S T I C S A R O U N D T H E W O R L D
Gross entry ratio to tertiary education Region
ISCED 5A ISCED 5B
Country or territoryMF M F GPI MF M F GPI
France (p) 34 27 41 1.52 ... ... ... ... ... ... ... ...
Germany (p) 36 31 40 1.29 57 59 55 0.93 . . . .
Greece (p) 63 +1 55 +1 71 +1 1.29 +1 . +1 . +1 . +1 . +1 42 +1 47 +1 36 +1 0.77 +1
Iceland (p) 60 -1 45 -1 76 -1 1.70 -1 1 -1 1 -1 2 -1 2.85 -1 37 -1 43 -1 31 -1 0.71 -1
Ireland (p) 94 87 101 1.16 . . . . 6 6 6 1.06
Israel (p) 90 85 94 1.11 . . . . 3 5 1 0.22
Italy (p) 76 73 79 1.08 2 2 3 2.15 . . . .
Luxembourg (p) 44 34 54 1.59 9 10 8 0.80 22 24 21 0.88
Malta (p) 26 18 34 1.86 ... ... ... ... ... ... ... ...
Netherlands (p) 59 52 66 1.26 . . . . 20 17 22 1.25
Norway (p) 60 48 73 1.53 . . . . 43 45 42 0.94
Portugal (p) 54 45 63 1.41 x x x x x x x x
Spain (p) 44 -1 36 -1 52 -1 1.45 -1 . -1 . -1 . -1 . -1 17 -1 17 -1 18 -1 1.09 -1
Sweden (p) 73 -1 70 -1 77 -1 1.09 -1 . -1 . -1 . -1 . -1 - -1 1 -1 - -1 0.49 -1
Switzerland (p) 26 24 28 1.16 63 71 55 0.77 10 8 13 1.75
United Kingdom (p) ... ... ... ... ... ... ... ... ... ... ... ...
United States (p) 73 -1 70 -1 76 -1 1.09 -1 . -1 . -1 . -1 . -1 . -1 . -1 . -1 . -1
South and West Asia
India (p) 20 -1 22 -1 18 -1 0.81 -1 - -1 - -1 - -1 - -1 - -1 - -1 - -1 1.24 -1
Sri Lanka (p) ... ... ... ... ... ... ... ... ... ... ... ...
Sub-Saharan Africa
Zimbabwe (p) ... ... ... ... . -2 . -2 . -2 . -2 ... ... ... ...
Please refer to the Reader’s Guide for further information regarding the data and symbols used in each table.
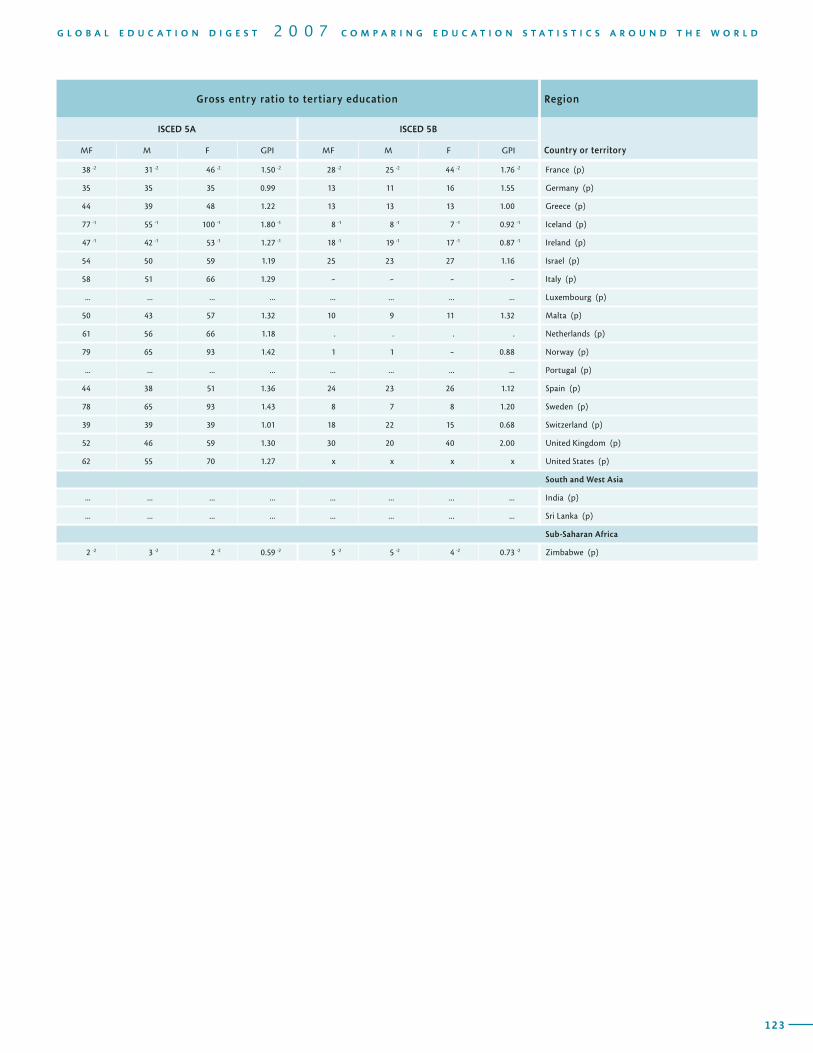
122
T A B L E 7Region Upper secondary gross graduation ratio
Country or territory
ISCED 3A(preparation for direct entry into ISCED 5A education)
ISCED 3B(preparation for direct entry into ISCED 5B education)
ISCED 3C(no direct access to ISCED 5 education, excluding short programmes)
MF M F GPI MF M F GPI MF M F GPI
UPPER SECONDARY (ISCED 3) GRADUATION AND ENTRY TO TERTIARY (ISCED 5) EDUCATION / 2005 (selected countries)
123
G L O B A L E D U C A T I O N D I G E S T 2 0 0 7 C O M P A R I N G E D U C A T I O N S T A T I S T I C S A R O U N D T H E W O R L D
Gross entry ratio to tertiary education Region
ISCED 5A ISCED 5B
Country or territoryMF M F GPI MF M F GPI
38 -2 31 -2 46 -2 1.50 -2 28 -2 25 -2 44 -2 1.76 -2 France (p)
35 35 35 0.99 13 11 16 1.55 Germany (p)
44 39 48 1.22 13 13 13 1.00 Greece (p)
77 -1 55 -1 100 -1 1.80 -1 8 -1 8 -1 7 -1 0.92 -1 Iceland (p)
47 -1 42 -1 53 -1 1.27 -1 18 -1 19 -1 17 -1 0.87 -1 Ireland (p)
54 50 59 1.19 25 23 27 1.16 Israel (p)
58 51 66 1.29 - - - - Italy (p)
... ... ... ... ... ... ... ... Luxembourg (p)
50 43 57 1.32 10 9 11 1.32 Malta (p)
61 56 66 1.18 . . . . Netherlands (p)
79 65 93 1.42 1 1 - 0.88 Norway (p)
... ... ... ... ... ... ... ... Portugal (p)
44 38 51 1.36 24 23 26 1.12 Spain (p)
78 65 93 1.43 8 7 8 1.20 Sweden (p)
39 39 39 1.01 18 22 15 0.68 Switzerland (p)
52 46 59 1.30 30 20 40 2.00 United Kingdom (p)
62 55 70 1.27 x x x x United States (p)
South and West Asia
... ... ... ... ... ... ... ... India (p)
... ... ... ... ... ... ... ... Sri Lanka (p)
Sub-Saharan Africa
2 -2 3 -2 2 -2 0.59 -2 5 -2 5 -2 4 -2 0.73 -2 Zimbabwe (p)
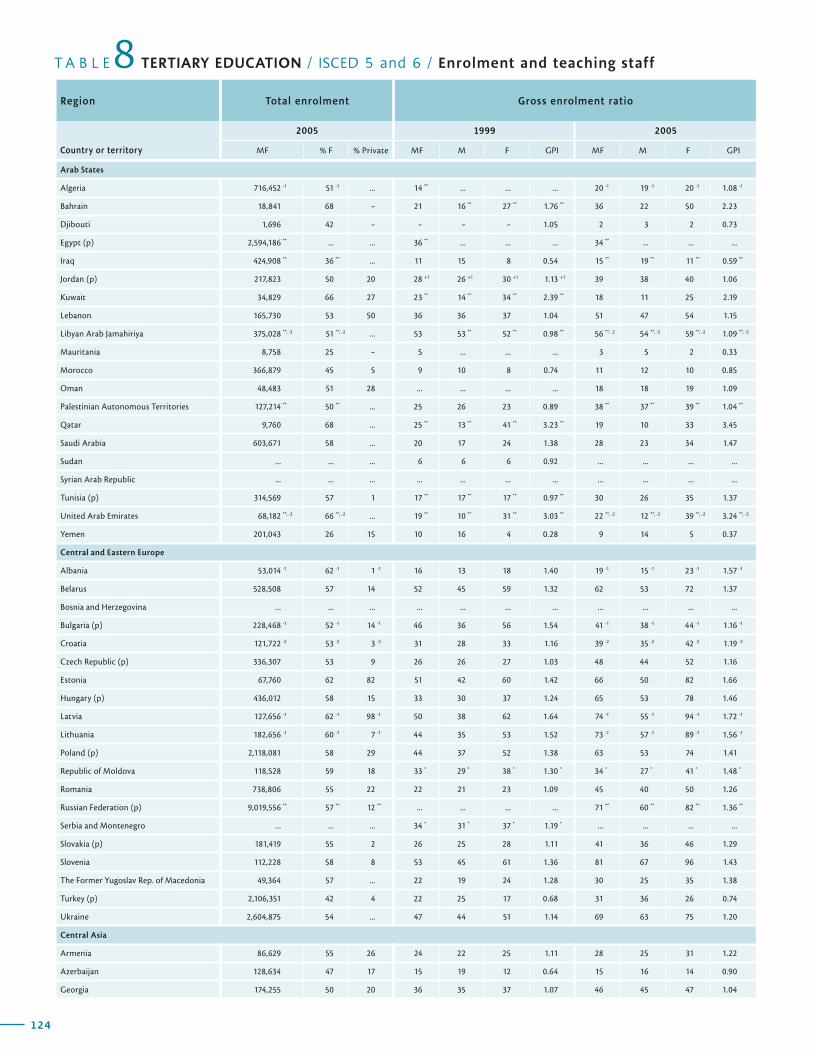
124
T A B L E TERTIARY EDUCATION / ISCED 5 and 6 / Enrolment and teaching staff 8Region Total enrolment Gross enrolment ratio
Country or territory
2005 1999 2005
MF % F % Private MF M F GPI MF M F GPI
125
G L O B A L E D U C A T I O N D I G E S T 2 0 0 7 C O M P A R I N G E D U C A T I O N S T A T I S T I C S A R O U N D T H E W O R L D
Distribution of students by ISCED level (%)
Female students by ISCED level (%)
Gross graduation ratio, ISCED 5A, first degree
Teaching staff Region
2005 2005 2005 2005
Country or territory5A 5B 6 5A 5B 6 MF M F GPI MF % F
Arab States
Algeria 716,452 -1 51 -1 ... 14 ** ... ... ... 20 -1 19 -1 20 -1 1.08 -1
Bahrain 18,841 68 - 21 16 ** 27 ** 1.76 ** 36 22 50 2.23
Djibouti 1,696 42 - - - - 1.05 2 3 2 0.73
Egypt (p) 2,594,186 ** ... ... 36 ** ... ... ... 34 ** ... ... ...
Iraq 424,908 ** 36 ** ... 11 15 8 0.54 15 ** 19 ** 11 ** 0.59 **
Jordan (p) 217,823 50 20 28 +1 26 +1 30 +1 1.13 +1 39 38 40 1.06
Kuwait 34,829 66 27 23 ** 14 ** 34 ** 2.39 ** 18 11 25 2.19
Lebanon 165,730 53 50 36 36 37 1.04 51 47 54 1.15
Libyan Arab Jamahiriya 375,028 **, -2 51 **, -2 ... 53 53 ** 52 ** 0.98 ** 56 **, -2 54 **, -2 59 **, -2 1.09 **, -2
Mauritania 8,758 25 - 5 ... ... ... 3 5 2 0.33
Morocco 366,879 45 5 9 10 8 0.74 11 12 10 0.85
Oman 48,483 51 28 ... ... ... ... 18 18 19 1.09
Palestinian Autonomous Territories 127,214 ** 50 ** ... 25 26 23 0.89 38 ** 37 ** 39 ** 1.04 **
Qatar 9,760 68 ... 25 ** 13 ** 41 ** 3.23 ** 19 10 33 3.45
Saudi Arabia 603,671 58 ... 20 17 24 1.38 28 23 34 1.47
Sudan ... ... ... 6 6 6 0.92 ... ... ... ...
Syrian Arab Republic ... ... ... ... ... ... ... ... ... ... ...
Tunisia (p) 314,569 57 1 17 ** 17 ** 17 ** 0.97 ** 30 26 35 1.37
United Arab Emirates 68,182 **, -2 66 **, -2 ... 19 ** 10 ** 31 ** 3.03 ** 22 **, -2 12 **, -2 39 **, -2 3.24 **, -2
Yemen 201,043 26 15 10 16 4 0.28 9 14 5 0.37
Central and Eastern Europe
Albania 53,014 -1 62 -1 1 -1 16 13 18 1.40 19 -1 15 -1 23 -1 1.57 -1
Belarus 528,508 57 14 52 45 59 1.32 62 53 72 1.37
Bosnia and Herzegovina ... ... ... ... ... ... ... ... ... ... ...
Bulgaria (p) 228,468 -1 52 -1 14 -1 46 36 56 1.54 41 -1 38 -1 44 -1 1.16 -1
Croatia 121,722 -2 53 -2 3 -2 31 28 33 1.16 39 -2 35 -2 42 -2 1.19 -2
Czech Republic (p) 336,307 53 9 26 26 27 1.03 48 44 52 1.16
Estonia 67,760 62 82 51 42 60 1.42 66 50 82 1.66
Hungary (p) 436,012 58 15 33 30 37 1.24 65 53 78 1.46
Latvia 127,656 -1 62 -1 98 -1 50 38 62 1.64 74 -1 55 -1 94 -1 1.72 -1
Lithuania 182,656 -1 60 -1 7 -1 44 35 53 1.52 73 -1 57 -1 89 -1 1.56 -1
Poland (p) 2,118,081 58 29 44 37 52 1.38 63 53 74 1.41
Republic of Moldova 118,528 59 18 33 * 29 * 38 * 1.30 * 34 * 27 * 41 * 1.48 *
Romania 738,806 55 22 22 21 23 1.09 45 40 50 1.26
Russian Federation (p) 9,019,556 ** 57 ** 12 ** ... ... ... ... 71 ** 60 ** 82 ** 1.36 **
Serbia and Montenegro ... ... ... 34 * 31 * 37 * 1.19 * ... ... ... ...
Slovakia (p) 181,419 55 2 26 25 28 1.11 41 36 46 1.29
Slovenia 112,228 58 8 53 45 61 1.36 81 67 96 1.43
The Former Yugoslav Rep. of Macedonia 49,364 57 ... 22 19 24 1.28 30 25 35 1.38
Turkey (p) 2,106,351 42 4 22 25 17 0.68 31 36 26 0.74
Ukraine 2,604,875 54 ... 47 44 51 1.14 69 63 75 1.20
Central Asia
Armenia 86,629 55 26 24 22 25 1.11 28 25 31 1.22
Azerbaijan 128,634 47 17 15 19 12 0.64 15 16 14 0.90
Georgia 174,255 50 20 36 35 37 1.07 46 45 47 1.04
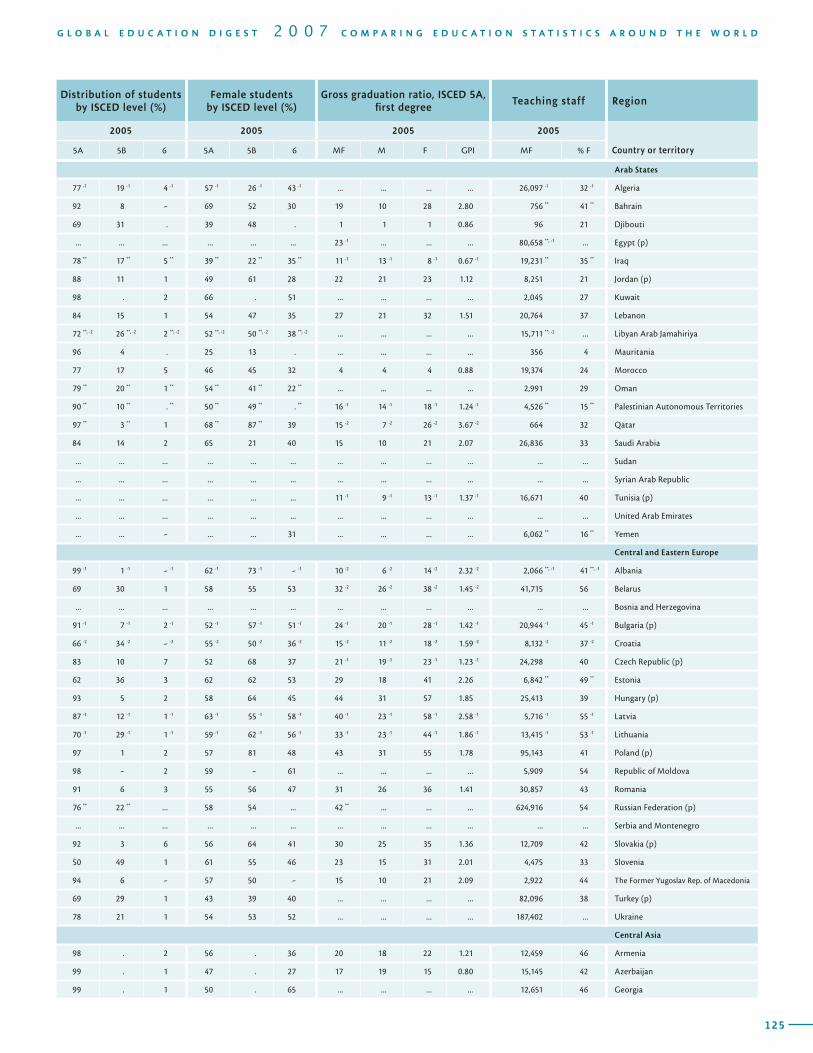
124
T A B L E TERTIARY EDUCATION / ISCED 5 and 6 / Enrolment and teaching staff 8Region Total enrolment Gross enrolment ratio
Country or territory
2005 1999 2005
MF % F % Private MF M F GPI MF M F GPI
125
G L O B A L E D U C A T I O N D I G E S T 2 0 0 7 C O M P A R I N G E D U C A T I O N S T A T I S T I C S A R O U N D T H E W O R L D
Distribution of students by ISCED level (%)
Female students by ISCED level (%)
Gross graduation ratio, ISCED 5A, first degree
Teaching staff Region
2005 2005 2005 2005
Country or territory5A 5B 6 5A 5B 6 MF M F GPI MF % F
Arab States
77 -1 19 -1 4 -1 57 -1 26 -1 43 -1 ... ... ... ... 26,097 -1 32 -1 Algeria
92 8 - 69 52 30 19 10 28 2.80 756 ** 41 ** Bahrain
69 31 . 39 48 . 1 1 1 0.86 96 21 Djibouti
... ... ... ... ... ... 23 -1 ... ... ... 80,658 **, -1 ... Egypt (p)
78 ** 17 ** 5 ** 39 ** 22 ** 35 ** 11 -1 13 -1 8 -1 0.67 -1 19,231 ** 35 ** Iraq
88 11 1 49 61 28 22 21 23 1.12 8,251 21 Jordan (p)
98 . 2 66 . 51 ... ... ... ... 2,045 27 Kuwait
84 15 1 54 47 35 27 21 32 1.51 20,764 37 Lebanon
72 **, -2 26 **, -2 2 **, -2 52 **, -2 50 **, -2 38 **, -2 ... ... ... ... 15,711 **, -2 ... Libyan Arab Jamahiriya
96 4 . 25 13 . ... ... ... ... 356 4 Mauritania
77 17 5 46 45 32 4 4 4 0.88 19,374 24 Morocco
79 ** 20 ** 1 ** 54 ** 41 ** 22 ** ... ... ... ... 2,991 29 Oman
90 ** 10 ** . ** 50 ** 49 ** . ** 16 -1 14 -1 18 -1 1.24 -1 4,526 ** 15 ** Palestinian Autonomous Territories
97 ** 3 ** 1 68 ** 87 ** 39 15 -2 7 -2 26 -2 3.67 -2 664 32 Qatar
84 14 2 65 21 40 15 10 21 2.07 26,836 33 Saudi Arabia
... ... ... ... ... ... ... ... ... ... ... ... Sudan
... ... ... ... ... ... ... ... ... ... ... ... Syrian Arab Republic
... ... ... ... ... ... 11 -1 9 -1 13 -1 1.37 -1 16,671 40 Tunisia (p)
... ... ... ... ... ... ... ... ... ... ... ... United Arab Emirates
... ... - ... ... 31 ... ... ... ... 6,062 ** 16 ** Yemen
Central and Eastern Europe
99 -1 1 -1 - -1 62 -1 73 -1 - -1 10 -2 6 -2 14 -2 2.32 -2 2,066 **, -1 41 **, -1 Albania
69 30 1 58 55 53 32 -2 26 -2 38 -2 1.45 -2 41,715 56 Belarus
... ... ... ... ... ... ... ... ... ... ... ... Bosnia and Herzegovina
91 -1 7 -1 2 -1 52 -1 57 -1 51 -1 24 -1 20 -1 28 -1 1.42 -1 20,944 -1 45 -1 Bulgaria (p)
66 -2 34 -2 - -2 55 -2 50 -2 36 -2 15 -2 11 -2 18 -2 1.59 -2 8,132 -2 37 -2 Croatia
83 10 7 52 68 37 21 -1 19 -1 23 -1 1.23 -1 24,298 40 Czech Republic (p)
62 36 3 62 62 53 29 18 41 2.26 6,842 ** 49 ** Estonia
93 5 2 58 64 45 44 31 57 1.85 25,413 39 Hungary (p)
87 -1 12 -1 1 -1 63 -1 55 -1 58 -1 40 -1 23 -1 58 -1 2.58 -1 5,716 -1 55 -1 Latvia
70 -1 29 -1 1 -1 59 -1 62 -1 56 -1 33 -1 23 -1 44 -1 1.86 -1 13,415 -1 53 -1 Lithuania
97 1 2 57 81 48 43 31 55 1.78 95,143 41 Poland (p)
98 - 2 59 - 61 ... ... ... ... 5,909 54 Republic of Moldova
91 6 3 55 56 47 31 26 36 1.41 30,857 43 Romania
76 ** 22 ** ... 58 54 ... 42 ** ... ... ... 624,916 54 Russian Federation (p)
... ... ... ... ... ... ... ... ... ... ... ... Serbia and Montenegro
92 3 6 56 64 41 30 25 35 1.36 12,709 42 Slovakia (p)
50 49 1 61 55 46 23 15 31 2.01 4,475 33 Slovenia
94 6 - 57 50 - 15 10 21 2.09 2,922 44 The Former Yugoslav Rep. of Macedonia
69 29 1 43 39 40 ... ... ... ... 82,096 38 Turkey (p)
78 21 1 54 53 52 ... ... ... ... 187,402 ... Ukraine
Central Asia
98 . 2 56 . 36 20 18 22 1.21 12,459 46 Armenia
99 . 1 47 . 27 17 19 15 0.80 15,145 42 Azerbaijan
99 . 1 50 . 65 ... ... ... ... 12,651 46 Georgia
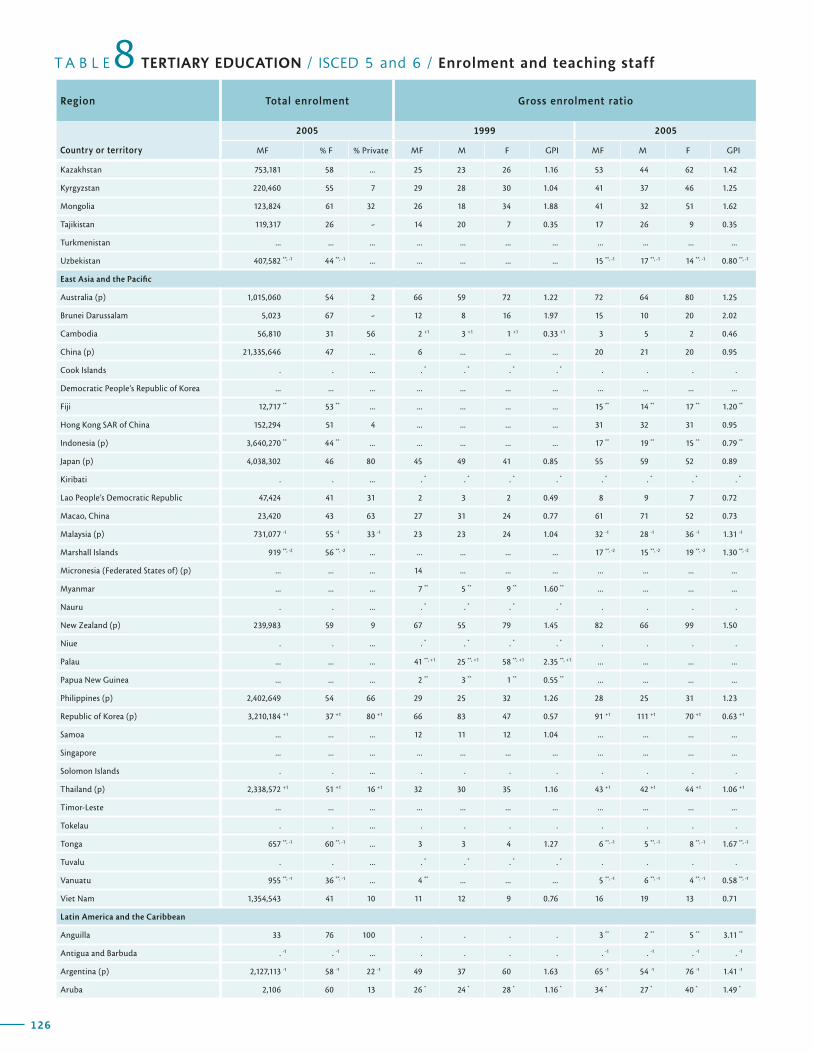
126
T A B L E TERTIARY EDUCATION / ISCED 5 and 6 / Enrolment and teaching staff 8Region Total enrolment Gross enrolment ratio
Country or territory
2005 1999 2005
MF % F % Private MF M F GPI MF M F GPI
127
G L O B A L E D U C A T I O N D I G E S T 2 0 0 7 C O M P A R I N G E D U C A T I O N S T A T I S T I C S A R O U N D T H E W O R L D
Distribution of students by ISCED level (%)
Female students by ISCED level (%)
Gross graduation ratio, ISCED 5A, first degree
Teaching staff Region
2005 2005 2005 2005
Country or territory5A 5B 6 5A 5B 6 MF M F GPI MF % F
Kazakhstan 753,181 58 ... 25 23 26 1.16 53 44 62 1.42
Kyrgyzstan 220,460 55 7 29 28 30 1.04 41 37 46 1.25
Mongolia 123,824 61 32 26 18 34 1.88 41 32 51 1.62
Tajikistan 119,317 26 - 14 20 7 0.35 17 26 9 0.35
Turkmenistan ... ... ... ... ... ... ... ... ... ... ...
Uzbekistan 407,582 **, -1 44 **, -1 ... ... ... ... ... 15 **, -1 17 **, -1 14 **, -1 0.80 **, -1
East Asia and the Pacific
Australia (p) 1,015,060 54 2 66 59 72 1.22 72 64 80 1.25
Brunei Darussalam 5,023 67 - 12 8 16 1.97 15 10 20 2.02
Cambodia 56,810 31 56 2 +1 3 +1 1 +1 0.33 +1 3 5 2 0.46
China (p) 21,335,646 47 ... 6 ... ... ... 20 21 20 0.95
Cook Islands . . ... . * . * . * . * . . . .
Democratic People’s Republic of Korea ... ... ... ... ... ... ... ... ... ... ...
Fiji 12,717 ** 53 ** ... ... ... ... ... 15 ** 14 ** 17 ** 1.20 **
Hong Kong SAR of China 152,294 51 4 ... ... ... ... 31 32 31 0.95
Indonesia (p) 3,640,270 ** 44 ** ... ... ... ... ... 17 ** 19 ** 15 ** 0.79 **
Japan (p) 4,038,302 46 80 45 49 41 0.85 55 59 52 0.89
Kiribati . . ... . * . * . * . * . * . * . * . *
Lao People’s Democratic Republic 47,424 41 31 2 3 2 0.49 8 9 7 0.72
Macao, China 23,420 43 63 27 31 24 0.77 61 71 52 0.73
Malaysia (p) 731,077 -1 55 -1 33 -1 23 23 24 1.04 32 -1 28 -1 36 -1 1.31 -1
Marshall Islands 919 **, -2 56 **, -2 ... ... ... ... ... 17 **, -2 15 **, -2 19 **, -2 1.30 **, -2
Micronesia (Federated States of) (p) ... ... ... 14 ... ... ... ... ... ... ...
Myanmar ... ... ... 7 ** 5 ** 9 ** 1.60 ** ... ... ... ...
Nauru . . ... . * . * . * . * . . . .
New Zealand (p) 239,983 59 9 67 55 79 1.45 82 66 99 1.50
Niue . . ... . * . * . * . * . . . .
Palau ... ... ... 41 **, +1 25 **, +1 58 **, +1 2.35 **, +1 ... ... ... ...
Papua New Guinea ... ... ... 2 ** 3 ** 1 ** 0.55 ** ... ... ... ...
Philippines (p) 2,402,649 54 66 29 25 32 1.26 28 25 31 1.23
Republic of Korea (p) 3,210,184 +1 37 +1 80 +1 66 83 47 0.57 91 +1 111 +1 70 +1 0.63 +1
Samoa ... ... ... 12 11 12 1.04 ... ... ... ...
Singapore ... ... ... ... ... ... ... ... ... ... ...
Solomon Islands . . ... . . . . . . . .
Thailand (p) 2,338,572 +1 51 +1 16 +1 32 30 35 1.16 43 +1 42 +1 44 +1 1.06 +1
Timor-Leste ... ... ... ... ... ... ... ... ... ... ...
Tokelau . . ... . . . . . . . .
Tonga 657 **, -1 60 **, -1 ... 3 3 4 1.27 6 **, -1 5 **, -1 8 **, -1 1.67 **, -1
Tuvalu . . ... . * . * . * . * . . . .
Vanuatu 955 **, -1 36 **, -1 ... 4 ** ... ... ... 5 **, -1 6 **, -1 4 **, -1 0.58 **, -1
Viet Nam 1,354,543 41 10 11 12 9 0.76 16 19 13 0.71
Latin America and the Caribbean
Anguilla 33 76 100 . . . . 3 ** 2 ** 5 ** 3.11 **
Antigua and Barbuda . -1 . -1 ... . . . . . -1 . -1 . -1 . -1
Argentina (p) 2,127,113 -1 58 -1 22 -1 49 37 60 1.63 65 -1 54 -1 76 -1 1.41 -1
Aruba 2,106 60 13 26 * 24 * 28 * 1.16 * 34 * 27 * 40 * 1.49 *
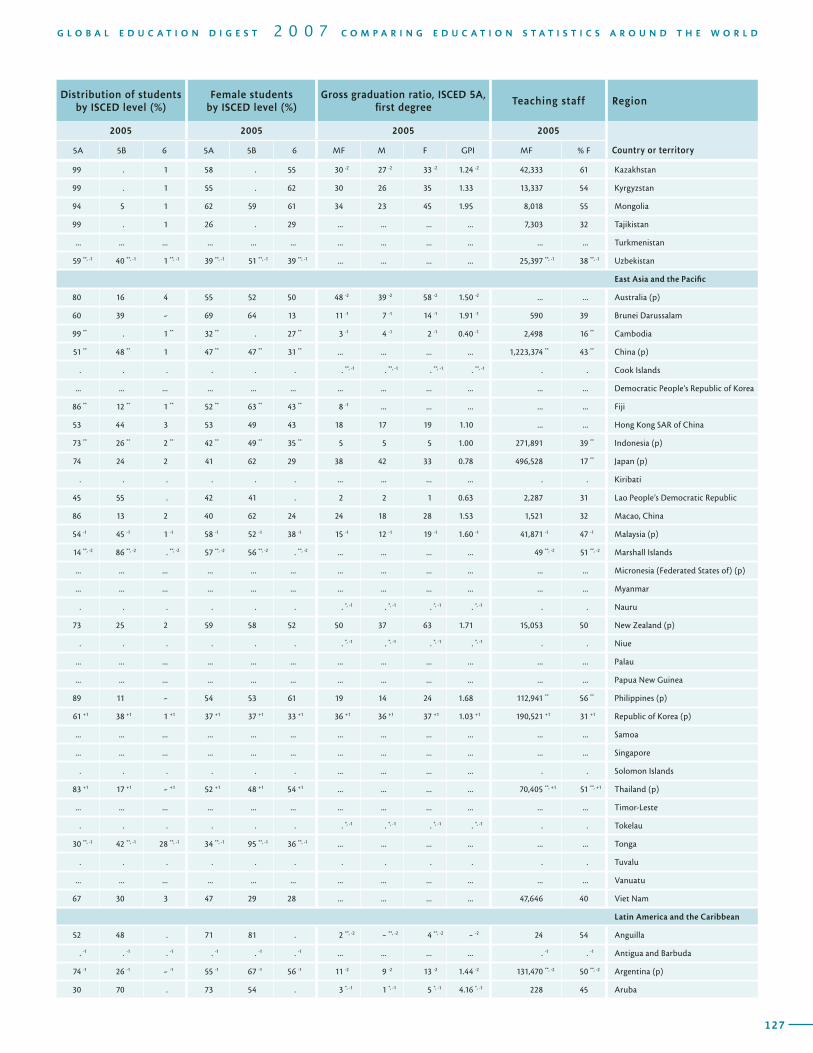
126
T A B L E TERTIARY EDUCATION / ISCED 5 and 6 / Enrolment and teaching staff 8Region Total enrolment Gross enrolment ratio
Country or territory
2005 1999 2005
MF % F % Private MF M F GPI MF M F GPI
127
G L O B A L E D U C A T I O N D I G E S T 2 0 0 7 C O M P A R I N G E D U C A T I O N S T A T I S T I C S A R O U N D T H E W O R L D
Distribution of students by ISCED level (%)
Female students by ISCED level (%)
Gross graduation ratio, ISCED 5A, first degree
Teaching staff Region
2005 2005 2005 2005
Country or territory5A 5B 6 5A 5B 6 MF M F GPI MF % F
99 . 1 58 . 55 30 -2 27 -2 33 -2 1.24 -2 42,333 61 Kazakhstan
99 . 1 55 . 62 30 26 35 1.33 13,337 54 Kyrgyzstan
94 5 1 62 59 61 34 23 45 1.95 8,018 55 Mongolia
99 . 1 26 . 29 ... ... ... ... 7,303 32 Tajikistan
... ... ... ... ... ... ... ... ... ... ... ... Turkmenistan
59 **, -1 40 **, -1 1 **, -1 39 **, -1 51 **, -1 39 **, -1 ... ... ... ... 25,397 **, -1 38 **, -1 Uzbekistan
East Asia and the Pacific
80 16 4 55 52 50 48 -2 39 -2 58 -2 1.50 -2 ... ... Australia (p)
60 39 - 69 64 13 11 -1 7 -1 14 -1 1.91 -1 590 39 Brunei Darussalam
99 ** . 1 ** 32 ** . 27 ** 3 -1 4 -1 2 -1 0.40 -1 2,498 16 ** Cambodia
51 ** 48 ** 1 47 ** 47 ** 31 ** ... ... ... ... 1,223,374 ** 43 ** China (p)
. . . . . . . **, -1 . **, -1 . **, -1 . **, -1 . . Cook Islands
... ... ... ... ... ... ... ... ... ... ... ... Democratic People’s Republic of Korea
86 ** 12 ** 1 ** 52 ** 63 ** 43 ** 8 -1 ... ... ... ... ... Fiji
53 44 3 53 49 43 18 17 19 1.10 ... ... Hong Kong SAR of China
73 ** 26 ** 2 ** 42 ** 49 ** 35 ** 5 5 5 1.00 271,891 39 ** Indonesia (p)
74 24 2 41 62 29 38 42 33 0.78 496,528 17 ** Japan (p)
. . . . . . ... ... ... ... . . Kiribati
45 55 . 42 41 . 2 2 1 0.63 2,287 31 Lao People’s Democratic Republic
86 13 2 40 62 24 24 18 28 1.53 1,521 32 Macao, China
54 -1 45 -1 1 -1 58 -1 52 -1 38 -1 15 -1 12 -1 19 -1 1.60 -1 41,871 -1 47 -1 Malaysia (p)
14 **, -2 86 **, -2 . **, -2 57 **, -2 56 **, -2 . **, -2 ... ... ... ... 49 **, -2 51 **, -2 Marshall Islands
... ... ... ... ... ... ... ... ... ... ... ... Micronesia (Federated States of) (p)
... ... ... ... ... ... ... ... ... ... ... ... Myanmar
. . . . . . . *, -1 . *, -1 . *, -1 . *, -1 . . Nauru
73 25 2 59 58 52 50 37 63 1.71 15,053 50 New Zealand (p)
. . . . . . . *, -1 . *, -1 . *, -1 . *, -1 . . Niue
... ... ... ... ... ... ... ... ... ... ... ... Palau
... ... ... ... ... ... ... ... ... ... ... ... Papua New Guinea
89 11 - 54 53 61 19 14 24 1.68 112,941 ** 56 ** Philippines (p)
61 +1 38 +1 1 +1 37 +1 37 +1 33 +1 36 +1 36 +1 37 +1 1.03 +1 190,521 +1 31 +1 Republic of Korea (p)
... ... ... ... ... ... ... ... ... ... ... ... Samoa
... ... ... ... ... ... ... ... ... ... ... ... Singapore
. . . . . . ... ... ... ... . . Solomon Islands
83 +1 17 +1 - +1 52 +1 48 +1 54 +1 ... ... ... ... 70,405 **, +1 51 **, +1 Thailand (p)
... ... ... ... ... ... ... ... ... ... ... ... Timor-Leste
. . . . . . . *, -1 . *, -1 . *, -1 . *, -1 . . Tokelau
30 **, -1 42 **, -1 28 **, -1 34 **, -1 95 **, -1 36 **, -1 ... ... ... ... ... ... Tonga
. . . . . . . . . . . . Tuvalu
... ... ... ... ... ... ... ... ... ... ... ... Vanuatu
67 30 3 47 29 28 ... ... ... ... 47,646 40 Viet Nam
Latin America and the Caribbean
52 48 . 71 81 . 2 **, -2 - **, -2 4 **, -2 - -2 24 54 Anguilla
. -1 . -1 . -1 . -1 . -1 . -1 ... ... ... ... . -1 . -1 Antigua and Barbuda
74 -1 26 -1 - -1 55 -1 67 -1 56 -1 11 -2 9 -2 13 -2 1.44 -2 131,470 **, -2 50 **, -2 Argentina (p)
30 70 . 73 54 . 3 *, -1 1 *, -1 5 *, -1 4.16 *, -1 228 45 Aruba
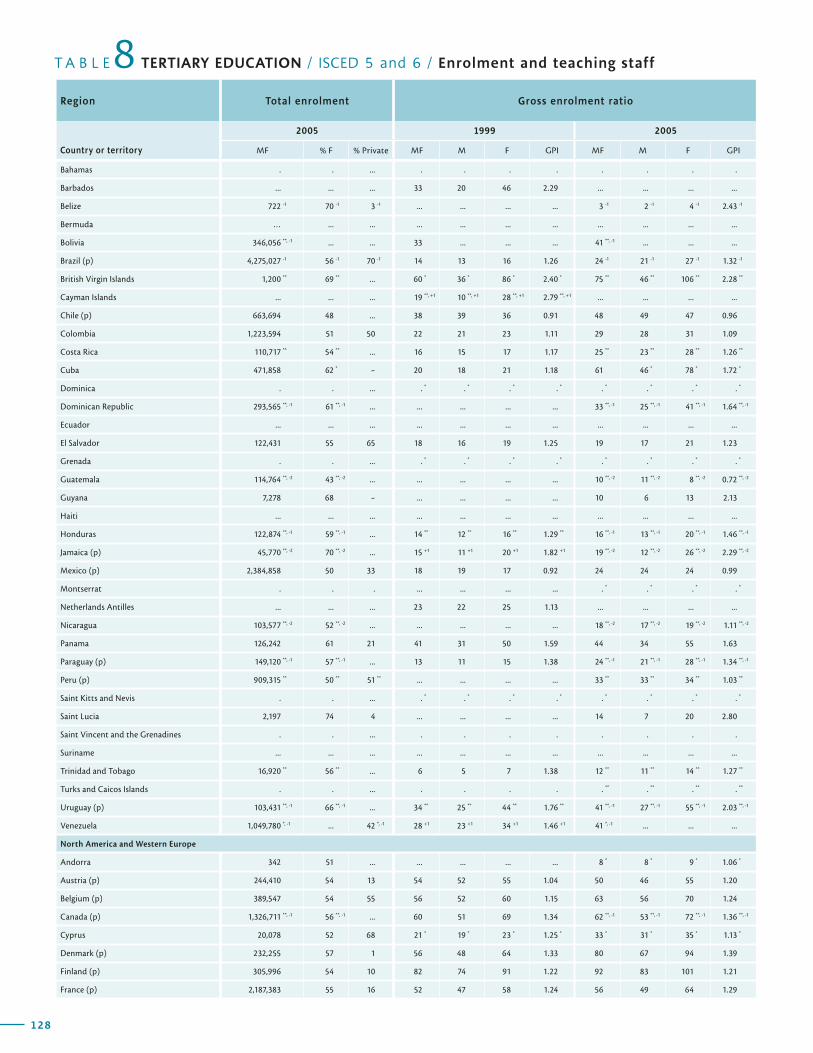
128
T A B L E TERTIARY EDUCATION / ISCED 5 and 6 / Enrolment and teaching staff 8Region Total enrolment Gross enrolment ratio
Country or territory
2005 1999 2005
MF % F % Private MF M F GPI MF M F GPI
129
G L O B A L E D U C A T I O N D I G E S T 2 0 0 7 C O M P A R I N G E D U C A T I O N S T A T I S T I C S A R O U N D T H E W O R L D
Distribution of students by ISCED level (%)
Female students by ISCED level (%)
Gross graduation ratio, ISCED 5A, first degree
Teaching staff Region
2005 2005 2005 2005
Country or territory5A 5B 6 5A 5B 6 MF M F GPI MF % F
Bahamas . . ... . . . . . . . .
Barbados ... ... ... 33 20 46 2.29 ... ... ... ...
Belize 722 -1 70 -1 3 -1 ... ... ... ... 3 -1 2 -1 4 -1 2.43 -1
Bermuda … ... ... ... ... ... ... ... ... ... ...
Bolivia 346,056 **, -1 ... ... 33 ... ... ... 41 **, -1 ... ... ...
Brazil (p) 4,275,027 -1 56 -1 70 -1 14 13 16 1.26 24 -1 21 -1 27 -1 1.32 -1
British Virgin Islands 1,200 ** 69 ** ... 60 * 36 * 86 * 2.40 * 75 ** 46 ** 106 ** 2.28 **
Cayman Islands ... ... ... 19 **, +1 10 **, +1 28 **, +1 2.79 **, +1 ... ... ... ...
Chile (p) 663,694 48 ... 38 39 36 0.91 48 49 47 0.96
Colombia 1,223,594 51 50 22 21 23 1.11 29 28 31 1.09
Costa Rica 110,717 ** 54 ** ... 16 15 17 1.17 25 ** 23 ** 28 ** 1.26 **
Cuba 471,858 62 * - 20 18 21 1.18 61 46 * 78 * 1.72 *
Dominica . . ... . * . * . * . * . * . * . * . *
Dominican Republic 293,565 **, -1 61 **, -1 ... ... ... ... ... 33 **, -1 25 **, -1 41 **, -1 1.64 **, -1
Ecuador ... ... ... ... ... ... ... ... ... ... ...
El Salvador 122,431 55 65 18 16 19 1.25 19 17 21 1.23
Grenada . . ... . * . * . * . * . * . * . * . *
Guatemala 114,764 **, -2 43 **, -2 ... ... ... ... ... 10 **, -2 11 **, -2 8 **, -2 0.72 **, -2
Guyana 7,278 68 - ... ... ... ... 10 6 13 2.13
Haiti ... ... ... ... ... ... ... ... ... ... ...
Honduras 122,874 **, -1 59 **, -1 ... 14 ** 12 ** 16 ** 1.29 ** 16 **, -1 13 **, -1 20 **, -1 1.46 **, -1
Jamaica (p) 45,770 **, -2 70 **, -2 ... 15 +1 11 +1 20 +1 1.82 +1 19 **, -2 12 **, -2 26 **, -2 2.29 **, -2
Mexico (p) 2,384,858 50 33 18 19 17 0.92 24 24 24 0.99
Montserrat . . . ... ... ... ... . * . * . * . *
Netherlands Antilles ... ... ... 23 22 25 1.13 ... ... ... ...
Nicaragua 103,577 **, -2 52 **, -2 ... ... ... ... ... 18 **, -2 17 **, -2 19 **, -2 1.11 **, -2
Panama 126,242 61 21 41 31 50 1.59 44 34 55 1.63
Paraguay (p) 149,120 **, -1 57 **, -1 ... 13 11 15 1.38 24 **, -1 21 **, -1 28 **, -1 1.34 **, -1
Peru (p) 909,315 ** 50 ** 51 ** ... ... ... ... 33 ** 33 ** 34 ** 1.03 **
Saint Kitts and Nevis . . ... . * . * . * . * . * . * . * . *
Saint Lucia 2,197 74 4 ... ... ... ... 14 7 20 2.80
Saint Vincent and the Grenadines . . ... . . . . . . . .
Suriname ... ... ... ... ... ... ... ... ... ... ...
Trinidad and Tobago 16,920 ** 56 ** ... 6 5 7 1.38 12 ** 11 ** 14 ** 1.27 **
Turks and Caicos Islands . . ... . . . . . ** . ** . ** . **
Uruguay (p) 103,431 **, -1 66 **, -1 ... 34 ** 25 ** 44 ** 1.76 ** 41 **, -1 27 **, -1 55 **, -1 2.03 **, -1
Venezuela 1,049,780 *, -1 ... 42 *, -1 28 +1 23 +1 34 +1 1.46 +1 41 *, -1 ... ... ...
North America and Western Europe
Andorra 342 51 ... ... ... ... ... 8 * 8 * 9 * 1.06 *
Austria (p) 244,410 54 13 54 52 55 1.04 50 46 55 1.20
Belgium (p) 389,547 54 55 56 52 60 1.15 63 56 70 1.24
Canada (p) 1,326,711 **, -1 56 **, -1 ... 60 51 69 1.34 62 **, -1 53 **, -1 72 **, -1 1.36 **, -1
Cyprus 20,078 52 68 21 * 19 * 23 * 1.25 * 33 * 31 * 35 * 1.13 *
Denmark (p) 232,255 57 1 56 48 64 1.33 80 67 94 1.39
Finland (p) 305,996 54 10 82 74 91 1.22 92 83 101 1.21
France (p) 2,187,383 55 16 52 47 58 1.24 56 49 64 1.29
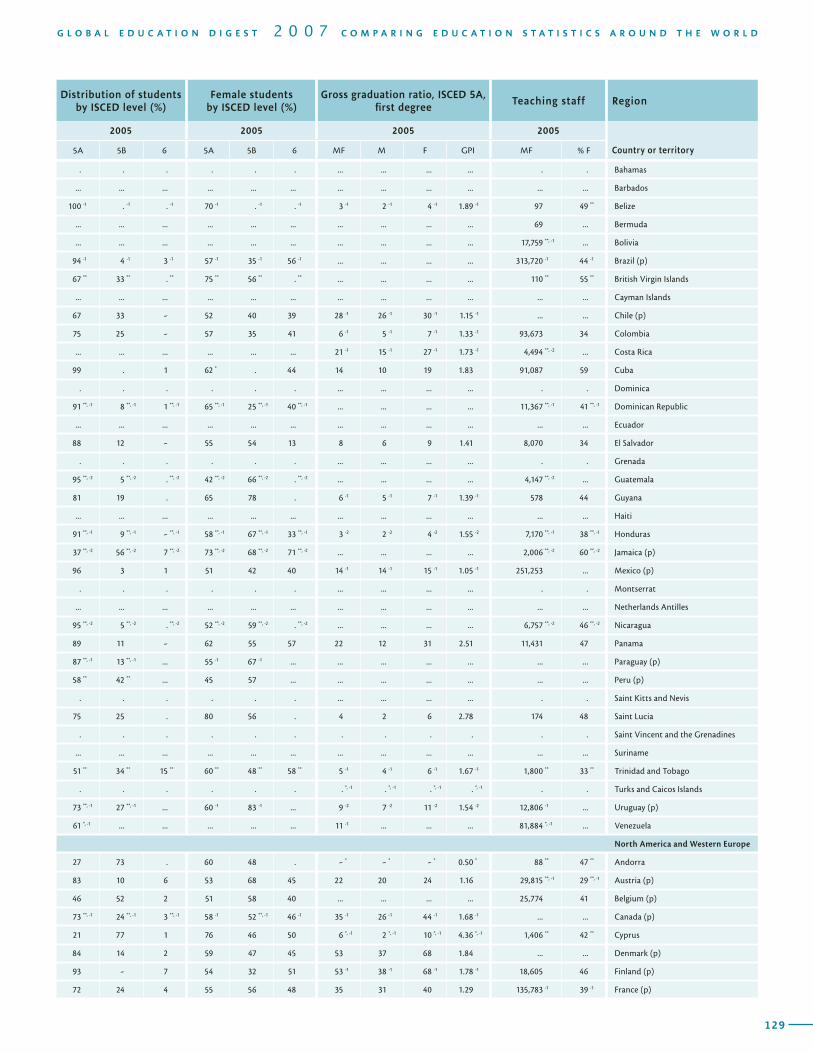
128
T A B L E TERTIARY EDUCATION / ISCED 5 and 6 / Enrolment and teaching staff 8Region Total enrolment Gross enrolment ratio
Country or territory
2005 1999 2005
MF % F % Private MF M F GPI MF M F GPI
129
G L O B A L E D U C A T I O N D I G E S T 2 0 0 7 C O M P A R I N G E D U C A T I O N S T A T I S T I C S A R O U N D T H E W O R L D
Distribution of students by ISCED level (%)
Female students by ISCED level (%)
Gross graduation ratio, ISCED 5A, first degree
Teaching staff Region
2005 2005 2005 2005
Country or territory5A 5B 6 5A 5B 6 MF M F GPI MF % F
. . . . . . ... ... ... ... . . Bahamas
... ... ... ... ... ... ... ... ... ... ... ... Barbados
100 -1 . -1 . -1 70 -1 . -1 . -1 3 -1 2 -1 4 -1 1.89 -1 97 49 ** Belize
... ... ... ... ... ... ... ... ... ... 69 ... Bermuda
... ... ... ... ... ... ... ... ... ... 17,759 **, -1 ... Bolivia
94 -1 4 -1 3 -1 57 -1 35 -1 56 -1 ... ... ... ... 313,720 -1 44 -1 Brazil (p)
67 ** 33 ** . ** 75 ** 56 ** . ** ... ... ... ... 110 ** 55 ** British Virgin Islands
... ... ... ... ... ... ... ... ... ... ... ... Cayman Islands
67 33 - 52 40 39 28 -1 26 -1 30 -1 1.15 -1 ... ... Chile (p)
75 25 - 57 35 41 6 -1 5 -1 7 -1 1.33 -1 93,673 34 Colombia
... ... ... ... ... ... 21 -1 15 -1 27 -1 1.73 -1 4,494 **, -2 ... Costa Rica
99 . 1 62 * . 44 14 10 19 1.83 91,087 59 Cuba
. . . . . . ... ... ... ... . . Dominica
91 **, -1 8 **, -1 1 **, -1 65 **, -1 25 **, -1 40 **, -1 ... ... ... ... 11,367 **, -1 41 **, -1 Dominican Republic
... ... ... ... ... ... ... ... ... ... ... ... Ecuador
88 12 - 55 54 13 8 6 9 1.41 8,070 34 El Salvador
. . . . . . ... ... ... ... . . Grenada
95 **, -2 5 **, -2 . **, -2 42 **, -2 66 **, -2 . **, -2 ... ... ... ... 4,147 **, -2 ... Guatemala
81 19 . 65 78 . 6 -1 5 -1 7 -1 1.39 -1 578 44 Guyana
... ... ... ... ... ... ... ... ... ... ... ... Haiti
91 **, -1 9 **, -1 - **, -1 58 **, -1 67 **, -1 33 **, -1 3 -2 2 -2 4 -2 1.55 -2 7,170 **, -1 38 **, -1 Honduras
37 **, -2 56 **, -2 7 **, -2 73 **, -2 68 **, -2 71 **, -2 ... ... ... ... 2,006 **, -2 60 **, -2 Jamaica (p)
96 3 1 51 42 40 14 -1 14 -1 15 -1 1.05 -1 251,253 ... Mexico (p)
. . . . . . ... ... ... ... . . Montserrat
... ... ... ... ... ... ... ... ... ... ... ... Netherlands Antilles
95 **, -2 5 **, -2 . **, -2 52 **, -2 59 **, -2 . **, -2 ... ... ... ... 6,757 **, -2 46 **, -2 Nicaragua
89 11 - 62 55 57 22 12 31 2.51 11,431 47 Panama
87 **, -1 13 **, -1 ... 55 -1 67 -1 ... ... ... ... ... ... ... Paraguay (p)
58 ** 42 ** ... 45 57 ... ... ... ... ... ... ... Peru (p)
. . . . . . ... ... ... ... . . Saint Kitts and Nevis
75 25 . 80 56 . 4 2 6 2.78 174 48 Saint Lucia
. . . . . . . . . . . . Saint Vincent and the Grenadines
... ... ... ... ... ... ... ... ... ... ... ... Suriname
51 ** 34 ** 15 ** 60 ** 48 ** 58 ** 5 -1 4 -1 6 -1 1.67 -1 1,800 ** 33 ** Trinidad and Tobago
. . . . . . . *, -1 . *, -1 . *, -1 . *, -1 . . Turks and Caicos Islands
73 **, -1 27 **, -1 ... 60 -1 83 -1 ... 9 -2 7 -2 11 -2 1.54 -2 12,806 -1 ... Uruguay (p)
61 *, -1 ... ... ... ... ... 11 -1 ... ... ... 81,884 *, -1 ... Venezuela
North America and Western Europe
27 73 . 60 48 . - * - * - * 0.50 * 88 ** 47 ** Andorra
83 10 6 53 68 45 22 20 24 1.16 29,815 **, -1 29 **, -1 Austria (p)
46 52 2 51 58 40 ... ... ... ... 25,774 41 Belgium (p)
73 **, -1 24 **, -1 3 **, -1 58 -1 52 **, -1 46 -1 35 -1 26 -1 44 -1 1.68 -1 ... ... Canada (p)
21 77 1 76 46 50 6 *, -1 2 *, -1 10 *, -1 4.36 *, -1 1,406 ** 42 ** Cyprus
84 14 2 59 47 45 53 37 68 1.84 ... ... Denmark (p)
93 - 7 54 32 51 53 -1 38 -1 68 -1 1.78 -1 18,605 46 Finland (p)
72 24 4 55 56 48 35 31 40 1.29 135,783 -1 39 -1 France (p)
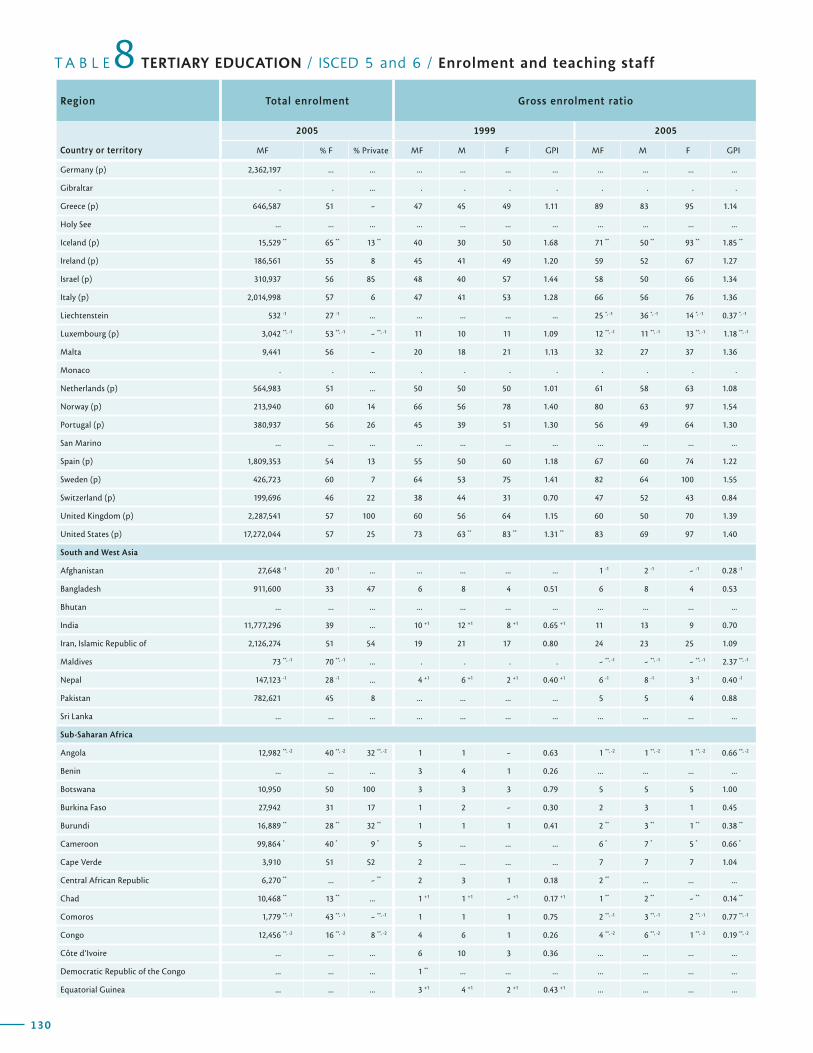
130
T A B L E TERTIARY EDUCATION / ISCED 5 and 6 / Enrolment and teaching staff 8Region Total enrolment Gross enrolment ratio
Country or territory
2005 1999 2005
MF % F % Private MF M F GPI MF M F GPI
131
G L O B A L E D U C A T I O N D I G E S T 2 0 0 7 C O M P A R I N G E D U C A T I O N S T A T I S T I C S A R O U N D T H E W O R L D
Distribution of students by ISCED level (%)
Female students by ISCED level (%)
Gross graduation ratio, ISCED 5A, first degree
Teaching staff Region
2005 2005 2005 2005
Country or territory5A 5B 6 5A 5B 6 MF M F GPI MF % F
Germany (p) 2,362,197 ... ... ... ... ... ... ... ... ... ...
Gibraltar . . ... . . . . . . . .
Greece (p) 646,587 51 - 47 45 49 1.11 89 83 95 1.14
Holy See ... ... ... ... ... ... ... ... ... ... ...
Iceland (p) 15,529 ** 65 ** 13 ** 40 30 50 1.68 71 ** 50 ** 93 ** 1.85 **
Ireland (p) 186,561 55 8 45 41 49 1.20 59 52 67 1.27
Israel (p) 310,937 56 85 48 40 57 1.44 58 50 66 1.34
Italy (p) 2,014,998 57 6 47 41 53 1.28 66 56 76 1.36
Liechtenstein 532 -1 27 -1 ... ... ... ... ... 25 *, -1 36 *, -1 14 *, -1 0.37 *, -1
Luxembourg (p) 3,042 **, -1 53 **, -1 - **, -1 11 10 11 1.09 12 **, -1 11 **, -1 13 **, -1 1.18 **, -1
Malta 9,441 56 - 20 18 21 1.13 32 27 37 1.36
Monaco . . ... . . . . . . . .
Netherlands (p) 564,983 51 ... 50 50 50 1.01 61 58 63 1.08
Norway (p) 213,940 60 14 66 56 78 1.40 80 63 97 1.54
Portugal (p) 380,937 56 26 45 39 51 1.30 56 49 64 1.30
San Marino ... ... ... ... ... ... ... ... ... ... ...
Spain (p) 1,809,353 54 13 55 50 60 1.18 67 60 74 1.22
Sweden (p) 426,723 60 7 64 53 75 1.41 82 64 100 1.55
Switzerland (p) 199,696 46 22 38 44 31 0.70 47 52 43 0.84
United Kingdom (p) 2,287,541 57 100 60 56 64 1.15 60 50 70 1.39
United States (p) 17,272,044 57 25 73 63 ** 83 ** 1.31 ** 83 69 97 1.40
South and West Asia
Afghanistan 27,648 -1 20 -1 ... ... ... ... ... 1 -1 2 -1 - -1 0.28 -1
Bangladesh 911,600 33 47 6 8 4 0.51 6 8 4 0.53
Bhutan ... ... ... ... ... ... ... ... ... ... ...
India 11,777,296 39 ... 10 +1 12 +1 8 +1 0.65 +1 11 13 9 0.70
Iran, Islamic Republic of 2,126,274 51 54 19 21 17 0.80 24 23 25 1.09
Maldives 73 **, -1 70 **, -1 ... . . . . - **, -1 - **, -1 - **, -1 2.37 **, -1
Nepal 147,123 -1 28 -1 ... 4 +1 6 +1 2 +1 0.40 +1 6 -1 8 -1 3 -1 0.40 -1
Pakistan 782,621 45 8 ... ... ... ... 5 5 4 0.88
Sri Lanka ... ... ... ... ... ... ... ... ... ... ...
Sub-Saharan Africa
Angola 12,982 **, -2 40 **, -2 32 **, -2 1 1 - 0.63 1 **, -2 1 **, -2 1 **, -2 0.66 **, -2
Benin ... ... ... 3 4 1 0.26 ... ... ... ...
Botswana 10,950 50 100 3 3 3 0.79 5 5 5 1.00
Burkina Faso 27,942 31 17 1 2 - 0.30 2 3 1 0.45
Burundi 16,889 ** 28 ** 32 ** 1 1 1 0.41 2 ** 3 ** 1 ** 0.38 **
Cameroon 99,864 * 40 * 9 * 5 ... ... ... 6 * 7 * 5 * 0.66 *
Cape Verde 3,910 51 52 2 ... ... ... 7 7 7 1.04
Central African Republic 6,270 ** ... - ** 2 3 1 0.18 2 ** ... ... ...
Chad 10,468 ** 13 ** ... 1 +1 1 +1 - +1 0.17 +1 1 ** 2 ** - ** 0.14 **
Comoros 1,779 **, -1 43 **, -1 - **, -1 1 1 1 0.75 2 **, -1 3 **, -1 2 **, -1 0.77 **, -1
Congo 12,456 **, -2 16 **, -2 8 **, -2 4 6 1 0.26 4 **, -2 6 **, -2 1 **, -2 0.19 **, -2
Côte d’Ivoire ... ... ... 6 10 3 0.36 ... ... ... ...
Democratic Republic of the Congo ... ... ... 1 ** ... ... ... ... ... ... ...
Equatorial Guinea ... ... ... 3 +1 4 +1 2 +1 0.43 +1 ... ... ... ...

130
T A B L E TERTIARY EDUCATION / ISCED 5 and 6 / Enrolment and teaching staff 8Region Total enrolment Gross enrolment ratio
Country or territory
2005 1999 2005
MF % F % Private MF M F GPI MF M F GPI
131
G L O B A L E D U C A T I O N D I G E S T 2 0 0 7 C O M P A R I N G E D U C A T I O N S T A T I S T I C S A R O U N D T H E W O R L D
Distribution of students by ISCED level (%)
Female students by ISCED level (%)
Gross graduation ratio, ISCED 5A, first degree
Teaching staff Region
2005 2005 2005 2005
Country or territory5A 5B 6 5A 5B 6 MF M F GPI MF % F
... ... ... 48 60 ... 21 20 21 1.07 287,251 34 Germany (p)
. . . . . . . -2 . -2 . -2 . -2 . . Gibraltar
61 35 3 53 49 43 23 16 31 1.97 27,161 36 Greece (p)
... ... ... ... ... ... ... ... ... ... ... ... Holy See
95 ** 5 ** - ** 65 ** 49 ** 54 ** 53 -1 33 -1 72 -1 2.19 -1 1,782 45 Iceland (p)
67 30 3 58 49 48 41 33 50 1.51 11,628 39 Ireland (p)
80 17 3 57 54 52 34 26 42 1.60 ... ... Israel (p)
97 1 2 57 60 51 48 40 56 1.41 94,371 34 Italy (p)
100 -1 . -1 - -1 27 -1 . -1 - -1 9 *, -1 14 *, -1 5 *, -1 0.38 *, -1 ... ... Liechtenstein
60 **, -1 40 **, -1 1 **, -1 54 **, -1 52 **, -1 52 **, -1 ... ... ... ... ... ... Luxembourg (p)
85 14 1 56 57 30 26 20 32 1.56 825 23 ** Malta
. . . . . . . -1 . -1 . -1 . -1 . . Monaco
99 . 1 51 . 41 46 -1 39 -1 53 -1 1.35 -1 44,656 35 Netherlands (p)
97 1 2 60 57 43 47 32 62 1.92 18,425 **, -1 37 **, -1 Norway (p)
94 1 5 56 56 56 37 24 51 2.14 36,773 42 Portugal (p)
... ... ... ... ... . ... ... ... ... ... ... San Marino
82 14 4 54 51 51 36 -1 28 -1 44 -1 1.57 -1 144,973 39 Spain (p)
91 4 5 61 50 48 48 -1 35 -1 61 -1 1.76 -1 37,684 43 Sweden (p)
73 18 8 48 41 39 27 27 27 1.00 34,076 32 Switzerland (p)
73 23 4 55 66 44 40 34 46 1.34 122,305 40 United Kingdom (p)
77 21 2 57 60 51 ... ... ... ... 1,208,213 43 United States (p)
South and West Asia
... ... ... ... ... ... ... ... ... ... 1,781 -1 12 -1 Afghanistan
91 9 - 35 20 28 5 -2 7 -2 4 -2 0.55 -2 52,297 15 Bangladesh
... ... ... ... ... ... ... ... ... ... ... ... Bhutan
100 . - 39 . 41 ... ... ... ... 538,769 -1 40 -1 India
71 28 1 55 41 25 13 12 15 1.24 115,340 19 Iran, Islamic Republic of
. **, -1 100 **, -1 . **, -1 . **, -1 70 **, -1 . **, -1 . -2 . -2 . -2 . -2 39 -2 67 -2 Maldives
99 **, -1 . **, -1 1 **, -1 28 **, -1 . **, -1 23 **, -1 ... ... ... ... ... ... Nepal
97 2 1 46 29 28 ... ... ... ... 69,298 * 17 * Pakistan
... ... ... ... ... ... ... ... ... ... ... ... Sri Lanka
Sub-Saharan Africa
100 **, -2 . **, -2 - **, -2 40 **, -2 . **, -2 - **, -2 ... ... ... ... ... ... Angola
... ... ... ... ... ... ... ... ... ... ... ... Benin
94 6 - 52 16 - ... ... ... ... 529 37 Botswana
... ... ... ... ... ... ... ... ... ... 1,984 6 Burkina Faso
33 ** 67 ** - ** 25 ** 29 ** 19 ** - -1 1 -1 - -1 0.34 -1 719 ** 14 ** Burundi
... ... ... ... ... ... ... ... ... ... 3,173 ... Cameroon
100 . - 51 . 63 ... ... ... ... 485 41 Cape Verde
... ... ... ... ... ... ... ... ... ... ... ... Central African Republic
... ... ... ... ... ... ... ... ... ... 1,100 ** 3 ** Chad
68 **, -1 32 **, -1 . **, -1 39 **, -1 52 **, -1 . **, -1 - -2 - -2 - -2 - -2 130 **, -1 15 **, -1 Comoros
84 **, -2 15 **, -2 1 **, -2 16 **, -2 13 **, -2 31 **, -2 ... ... ... ... 894 **, -2 ... Congo
... ... ... ... ... ... ... ... ... ... ... ... Côte d’Ivoire
... ... ... ... ... ... ... ... ... ... ... ... Democratic Republic of the Congo
... ... ... ... ... ... ... ... ... ... ... ... Equatorial Guinea
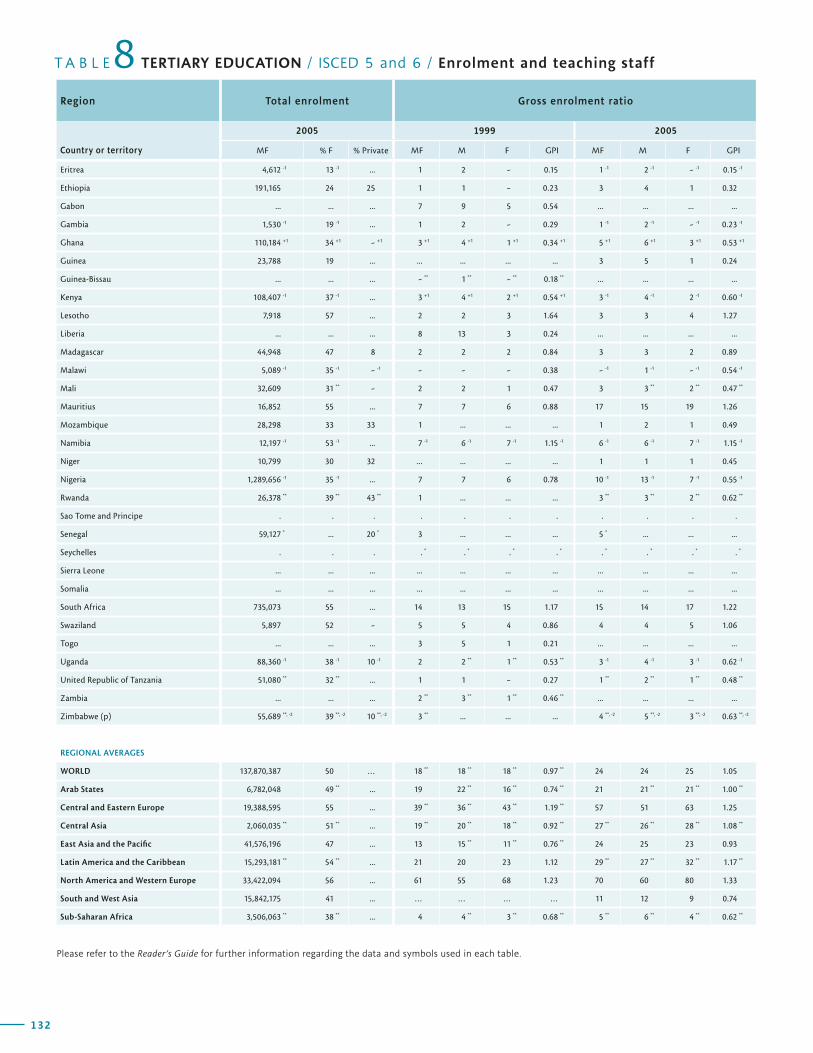
132
T A B L E TERTIARY EDUCATION / ISCED 5 and 6 / Enrolment and teaching staff 8Region Total enrolment Gross enrolment ratio
Country or territory
2005 1999 2005
MF % F % Private MF M F GPI MF M F GPI
133
G L O B A L E D U C A T I O N D I G E S T 2 0 0 7 C O M P A R I N G E D U C A T I O N S T A T I S T I C S A R O U N D T H E W O R L D
Distribution of students by ISCED level (%)
Female students by ISCED level (%)
Gross graduation ratio, ISCED 5A, first degree
Teaching staff Region
2005 2005 2005 2005
Country or territory5A 5B 6 5A 5B 6 MF M F GPI MF % F
Eritrea 4,612 -1 13 -1 ... 1 2 - 0.15 1 -1 2 -1 - -1 0.15 -1
Ethiopia 191,165 24 25 1 1 - 0.23 3 4 1 0.32
Gabon ... ... ... 7 9 5 0.54 ... ... ... ...
Gambia 1,530 -1 19 -1 ... 1 2 - 0.29 1 -1 2 -1 - -1 0.23 -1
Ghana 110,184 +1 34 +1 - +1 3 +1 4 +1 1 +1 0.34 +1 5 +1 6 +1 3 +1 0.53 +1
Guinea 23,788 19 ... ... ... ... ... 3 5 1 0.24
Guinea-Bissau ... ... ... - ** 1 ** - ** 0.18 ** ... ... ... ...
Kenya 108,407 -1 37 -1 ... 3 +1 4 +1 2 +1 0.54 +1 3 -1 4 -1 2 -1 0.60 -1
Lesotho 7,918 57 ... 2 2 3 1.64 3 3 4 1.27
Liberia ... ... ... 8 13 3 0.24 ... ... ... ...
Madagascar 44,948 47 8 2 2 2 0.84 3 3 2 0.89
Malawi 5,089 -1 35 -1 - -1 - - - 0.38 - -1 1 -1 - -1 0.54 -1
Mali 32,609 31 ** - 2 2 1 0.47 3 3 ** 2 ** 0.47 **
Mauritius 16,852 55 ... 7 7 6 0.88 17 15 19 1.26
Mozambique 28,298 33 33 1 ... ... ... 1 2 1 0.49
Namibia 12,197 -1 53 -1 ... 7 -1 6 -1 7 -1 1.15 -1 6 -1 6 -1 7 -1 1.15 -1
Niger 10,799 30 32 ... ... ... ... 1 1 1 0.45
Nigeria 1,289,656 -1 35 -1 ... 7 7 6 0.78 10 -1 13 -1 7 -1 0.55 -1
Rwanda 26,378 ** 39 ** 43 ** 1 ... ... ... 3 ** 3 ** 2 ** 0.62 **
Sao Tome and Principe . . . . . . . . . . .
Senegal 59,127 * ... 20 * 3 ... ... ... 5 * ... ... ...
Seychelles . . . . * . * . * . * . * . * . * . *
Sierra Leone ... ... ... ... ... ... ... ... ... ... ...
Somalia ... ... ... ... ... ... ... ... ... ... ...
South Africa 735,073 55 ... 14 13 15 1.17 15 14 17 1.22
Swaziland 5,897 52 - 5 5 4 0.86 4 4 5 1.06
Togo ... ... ... 3 5 1 0.21 ... ... ... ...
Uganda 88,360 -1 38 -1 10 -1 2 2 ** 1 ** 0.53 ** 3 -1 4 -1 3 -1 0.62 -1
United Republic of Tanzania 51,080 ** 32 ** ... 1 1 - 0.27 1 ** 2 ** 1 ** 0.48 **
Zambia ... ... ... 2 ** 3 ** 1 ** 0.46 ** ... ... ... ...
Zimbabwe (p) 55,689 **, -2 39 **, -2 10 **, -2 3 ** ... ... ... 4 **, -2 5 **, -2 3 **, -2 0.63 **, -2
REGIONAL AVERAGES
WORLD 137,870,387 50 … 18 ** 18 ** 18 ** 0.97 ** 24 24 25 1.05
Arab States 6,782,048 49 ** ... 19 22 ** 16 ** 0.74 ** 21 21 ** 21 ** 1.00 **
Central and Eastern Europe 19,388,595 55 ... 39 ** 36 ** 43 ** 1.19 ** 57 51 63 1.25
Central Asia 2,060,035 ** 51 ** ... 19 ** 20 ** 18 ** 0.92 ** 27 ** 26 ** 28 ** 1.08 **
East Asia and the Pacific 41,576,196 47 ... 13 15 ** 11 ** 0.76 ** 24 25 23 0.93
Latin America and the Caribbean 15,293,181 ** 54 ** ... 21 20 23 1.12 29 ** 27 ** 32 ** 1.17 **
North America and Western Europe 33,422,094 56 ... 61 55 68 1.23 70 60 80 1.33
South and West Asia 15,842,175 41 ... … … … … 11 12 9 0.74
Sub-Saharan Africa 3,506,063 ** 38 ** ... 4 4 ** 3 ** 0.68 ** 5 ** 6 ** 4 ** 0.62 **
Please refer to the Reader’s Guide for further information regarding the data and symbols used in each table.
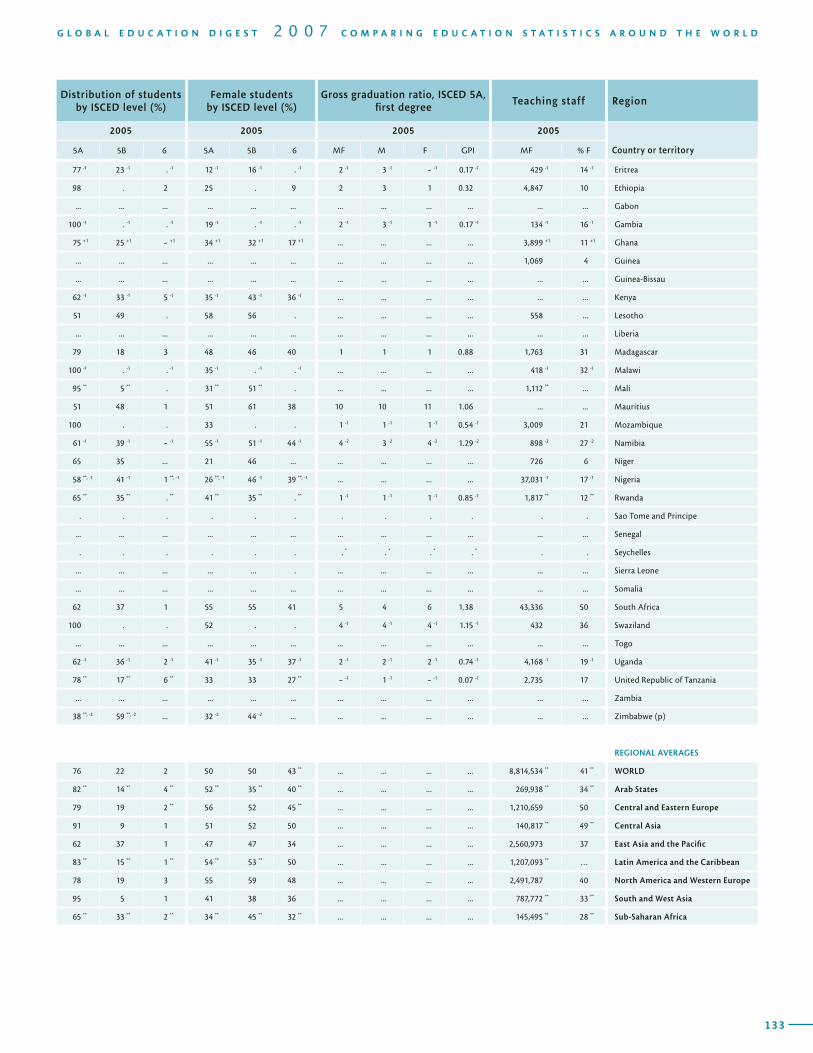
132
T A B L E TERTIARY EDUCATION / ISCED 5 and 6 / Enrolment and teaching staff 8Region Total enrolment Gross enrolment ratio
Country or territory
2005 1999 2005
MF % F % Private MF M F GPI MF M F GPI
133
G L O B A L E D U C A T I O N D I G E S T 2 0 0 7 C O M P A R I N G E D U C A T I O N S T A T I S T I C S A R O U N D T H E W O R L D
Distribution of students by ISCED level (%)
Female students by ISCED level (%)
Gross graduation ratio, ISCED 5A, first degree
Teaching staff Region
2005 2005 2005 2005
Country or territory5A 5B 6 5A 5B 6 MF M F GPI MF % F
77 -1 23 -1 . -1 12 -1 16 -1 . -1 2 -1 3 -1 - -1 0.17 -1 429 -1 14 -1 Eritrea
98 . 2 25 . 9 2 3 1 0.32 4,847 10 Ethiopia
... ... ... ... ... ... ... ... ... ... ... ... Gabon
100 -1 . -1 . -1 19 -1 . -1 . -1 2 -1 3 -1 1 -1 0.17 -1 134 -1 16 -1 Gambia
75 +1 25 +1 - +1 34 +1 32 +1 17 +1 ... ... ... ... 3,899 +1 11 +1 Ghana
... ... ... ... ... ... ... ... ... ... 1,069 4 Guinea
... ... ... ... ... ... ... ... ... ... ... ... Guinea-Bissau
62 -1 33 -1 5 -1 35 -1 43 -1 36 -1 ... ... ... ... ... ... Kenya
51 49 . 58 56 . ... ... ... ... 558 ... Lesotho
... ... ... ... ... ... ... ... ... ... ... ... Liberia
79 18 3 48 46 40 1 1 1 0.88 1,763 31 Madagascar
100 -1 . -1 . -1 35 -1 . -1 . -1 ... ... ... ... 418 -1 32 -1 Malawi
95 ** 5 ** . 31 ** 51 ** . ... ... ... ... 1,112 ** ... Mali
51 48 1 51 61 38 10 10 11 1.06 ... ... Mauritius
100 . . 33 . . 1 -1 1 -1 1 -1 0.54 -1 3,009 21 Mozambique
61 -1 39 -1 - -1 55 -1 51 -1 44 -1 4 -2 3 -2 4 -2 1.29 -2 898 -2 27 -2 Namibia
65 35 ... 21 46 ... ... ... ... ... 726 6 Niger
58 **, -1 41 -1 1 **, -1 26 **, -1 46 -1 39 **, -1 ... ... ... ... 37,031 -1 17 -1 Nigeria
65 ** 35 ** . ** 41 ** 35 ** . ** 1 -1 1 -1 1 -1 0.85 -1 1,817 ** 12 ** Rwanda
. . . . . . . . . . . . Sao Tome and Principe
... ... ... ... ... ... ... ... ... ... ... ... Senegal
. . . . . . . * . * . * . * . . Seychelles
... ... ... ... ... . ... ... ... ... ... ... Sierra Leone
... ... ... ... ... ... ... ... ... ... ... ... Somalia
62 37 1 55 55 41 5 4 6 1.38 43,336 50 South Africa
100 . . 52 . . 4 -1 4 -1 4 -1 1.15 -1 432 36 Swaziland
... ... ... ... ... ... ... ... ... ... ... ... Togo
62 -1 36 -1 2 -1 41 -1 35 -1 37 -1 2 -1 2 -1 2 -1 0.74 -1 4,168 -1 19 -1 Uganda
78 ** 17 ** 6 ** 33 33 27 ** - -1 1 -1 - -1 0.07 -1 2,735 17 United Republic of Tanzania
... ... ... ... ... ... ... ... ... ... ... ... Zambia
38 **, -2 59 **, -2 ... 32 -2 44 -2 ... ... ... ... ... ... ... Zimbabwe (p)
REGIONAL AVERAGES
76 22 2 50 50 43 ** ... ... ... ... 8,814,534 ** 41 ** WORLD
82 ** 14 ** 4 ** 52 ** 35 ** 40 ** ... ... ... ... 269,938 ** 34 ** Arab States
79 19 2 ** 56 52 45 ** ... ... ... ... 1,210,659 50 Central and Eastern Europe
91 9 1 51 52 50 ... ... ... ... 140,817 ** 49 ** Central Asia
62 37 1 47 47 34 ... ... ... ... 2,560,973 37 East Asia and the Pacific
83 ** 15 ** 1 ** 54 ** 53 ** 50 ... ... ... ... 1,207,093 ** … Latin America and the Caribbean
78 19 3 55 59 48 ... ... ... ... 2,491,787 40 North America and Western Europe
95 5 1 41 38 36 ... ... ... ... 787,772 ** 33 ** South and West Asia
65 ** 33 ** 2 ** 34 ** 45 ** 32 ** ... ... ... ... 145,495 ** 28 ** Sub-Saharan Africa
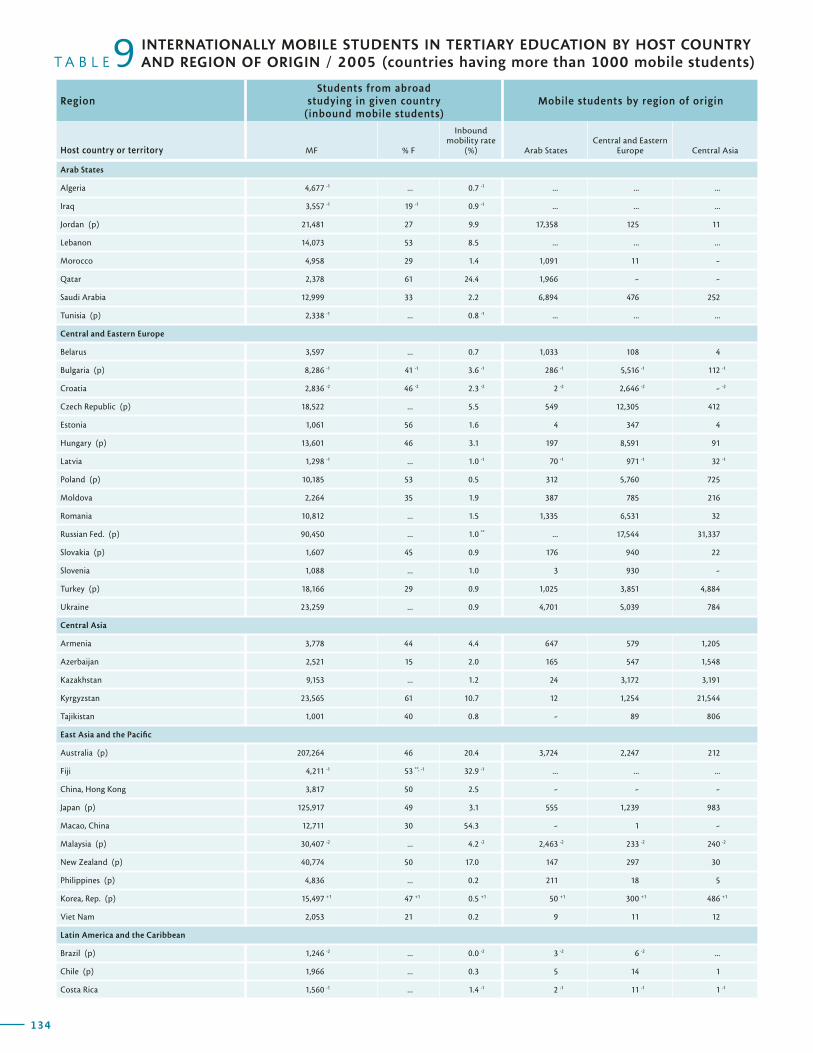
134
T A B L E 9Region
Students from abroad studying in given country
(inbound mobile students)Mobile students by region of origin
Host country or territory MF % F
Inbound mobility rate
(%) Arab States Central and Eastern
Europe Central Asia
INTERNATIONALLY MOBILE STUDENTS IN TERTIARY EDUCATION BY HOST COUNTRY AND REGION OF ORIGIN / 2005 (countries having more than 1000 mobile students)
135
G L O B A L E D U C A T I O N D I G E S T 2 0 0 7 C O M P A R I N G E D U C A T I O N S T A T I S T I C S A R O U N D T H E W O R L D
Mobile students by region of origin Region
East Asia and the Pacific
Latin America and the Caribbean
North America and Western Europe
South and West Asia Sub-Saharan Africa Unspecified Host country or territory
Arab States
Algeria 4,677 -1 ... 0.7 -1 ... ... ...
Iraq 3,557 -1 19 -1 0.9 -1 ... ... ...
Jordan (p) 21,481 27 9.9 17,358 125 11
Lebanon 14,073 53 8.5 ... ... ...
Morocco 4,958 29 1.4 1,091 11 -
Qatar 2,378 61 24.4 1,966 - -
Saudi Arabia 12,999 33 2.2 6,894 476 252
Tunisia (p) 2,338 -1 ... 0.8 -1 ... ... ...
Central and Eastern Europe
Belarus 3,597 ... 0.7 1,033 108 4
Bulgaria (p) 8,286 -1 41 -1 3.6 -1 286 -1 5,516 -1 112 -1
Croatia 2,836 -2 46 -2 2.3 -2 2 -2 2,646 -2 - -2
Czech Republic (p) 18,522 ... 5.5 549 12,305 412
Estonia 1,061 56 1.6 4 347 4
Hungary (p) 13,601 46 3.1 197 8,591 91
Latvia 1,298 -1 ... 1.0 -1 70 -1 971 -1 32 -1
Poland (p) 10,185 53 0.5 312 5,760 725
Moldova 2,264 35 1.9 387 785 216
Romania 10,812 ... 1.5 1,335 6,531 32
Russian Fed. (p) 90,450 ... 1.0 ** ... 17,544 31,337
Slovakia (p) 1,607 45 0.9 176 940 22
Slovenia 1,088 ... 1.0 3 930 -
Turkey (p) 18,166 29 0.9 1,025 3,851 4,884
Ukraine 23,259 ... 0.9 4,701 5,039 784
Central Asia
Armenia 3,778 44 4.4 647 579 1,205
Azerbaijan 2,521 15 2.0 165 547 1,548
Kazakhstan 9,153 ... 1.2 24 3,172 3,191
Kyrgyzstan 23,565 61 10.7 12 1,254 21,544
Tajikistan 1,001 40 0.8 - 89 806
East Asia and the Pacific
Australia (p) 207,264 46 20.4 3,724 2,247 212
Fiji 4,211 -1 53 **, -1 32.9 -1 ... ... ...
China, Hong Kong 3,817 50 2.5 - - -
Japan (p) 125,917 49 3.1 555 1,239 983
Macao, China 12,711 30 54.3 - 1 -
Malaysia (p) 30,407 -2 ... 4.2 -2 2,463 -2 233 -2 240 -2
New Zealand (p) 40,774 50 17.0 147 297 30
Philippines (p) 4,836 ... 0.2 211 18 5
Korea, Rep. (p) 15,497 +1 47 +1 0.5 +1 50 +1 300 +1 486 +1
Viet Nam 2,053 21 0.2 9 11 12
Latin America and the Caribbean
Brazil (p) 1,246 -2 ... 0.0 -2 3 -2 6 -2 ...
Chile (p) 1,966 ... 0.3 5 14 1
Costa Rica 1,560 -1 ... 1.4 -1 2 -1 11 -1 1 -1
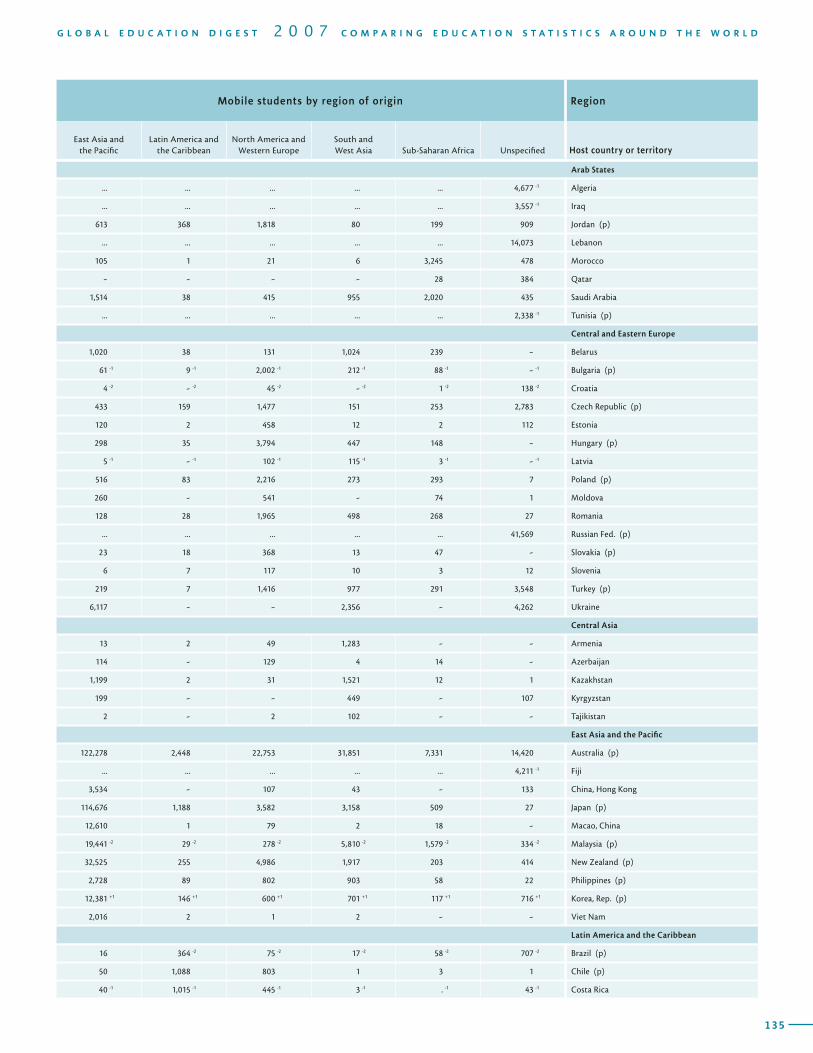
134
T A B L E 9Region
Students from abroad studying in given country
(inbound mobile students)Mobile students by region of origin
Host country or territory MF % F
Inbound mobility rate
(%) Arab States Central and Eastern
Europe Central Asia
INTERNATIONALLY MOBILE STUDENTS IN TERTIARY EDUCATION BY HOST COUNTRY AND REGION OF ORIGIN / 2005 (countries having more than 1000 mobile students)
135
G L O B A L E D U C A T I O N D I G E S T 2 0 0 7 C O M P A R I N G E D U C A T I O N S T A T I S T I C S A R O U N D T H E W O R L D
Mobile students by region of origin Region
East Asia and the Pacific
Latin America and the Caribbean
North America and Western Europe
South and West Asia Sub-Saharan Africa Unspecified Host country or territory
Arab States
... ... ... ... ... 4,677 -1 Algeria
... ... ... ... ... 3,557 -1 Iraq
613 368 1,818 80 199 909 Jordan (p)
... ... ... ... ... 14,073 Lebanon
105 1 21 6 3,245 478 Morocco
- - - - 28 384 Qatar
1,514 38 415 955 2,020 435 Saudi Arabia
... ... ... ... ... 2,338 -1 Tunisia (p)
Central and Eastern Europe
1,020 38 131 1,024 239 - Belarus
61 -1 9 -1 2,002 -1 212 -1 88 -1 - -1 Bulgaria (p)
4 -2 - -2 45 -2 - -2 1 -2 138 -2 Croatia
433 159 1,477 151 253 2,783 Czech Republic (p)
120 2 458 12 2 112 Estonia
298 35 3,794 447 148 - Hungary (p)
5 -1 - -1 102 -1 115 -1 3 -1 - -1 Latvia
516 83 2,216 273 293 7 Poland (p)
260 - 541 - 74 1 Moldova
128 28 1,965 498 268 27 Romania
... ... ... ... ... 41,569 Russian Fed. (p)
23 18 368 13 47 - Slovakia (p)
6 7 117 10 3 12 Slovenia
219 7 1,416 977 291 3,548 Turkey (p)
6,117 - - 2,356 - 4,262 Ukraine
Central Asia
13 2 49 1,283 - - Armenia
114 - 129 4 14 - Azerbaijan
1,199 2 31 1,521 12 1 Kazakhstan
199 - - 449 - 107 Kyrgyzstan
2 - 2 102 - - Tajikistan
East Asia and the Pacific
122,278 2,448 22,753 31,851 7,331 14,420 Australia (p)
... ... ... ... ... 4,211 -1 Fiji
3,534 - 107 43 - 133 China, Hong Kong
114,676 1,188 3,582 3,158 509 27 Japan (p)
12,610 1 79 2 18 - Macao, China
19,441 -2 29 -2 278 -2 5,810 -2 1,579 -2 334 -2 Malaysia (p)
32,525 255 4,986 1,917 203 414 New Zealand (p)
2,728 89 802 903 58 22 Philippines (p)
12,381 +1 146 +1 600 +1 701 +1 117 +1 716 +1 Korea, Rep. (p)
2,016 2 1 2 - - Viet Nam
Latin America and the Caribbean
16 364 -2 75 -2 17 -2 58 -2 707 -2 Brazil (p)
50 1,088 803 1 3 1 Chile (p)
40 -1 1,015 -1 445 -1 3 -1 . -1 43 -1 Costa Rica
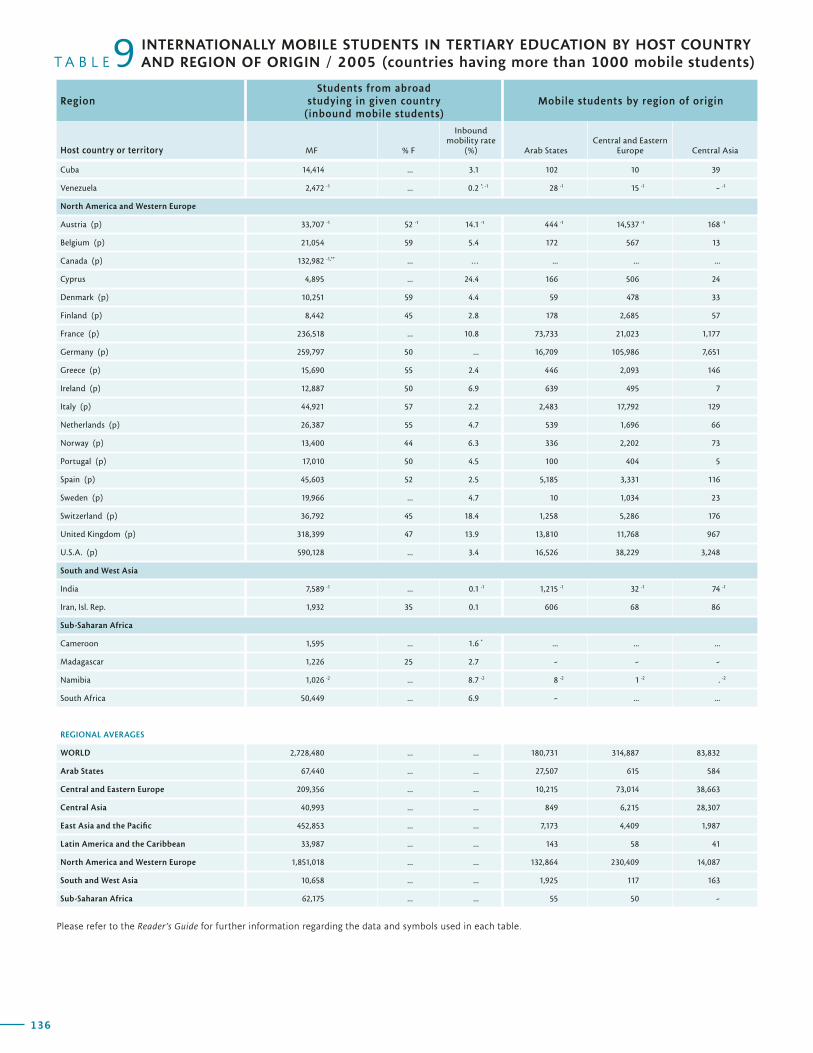
136
T A B L E 9Region
Students from abroad studying in given country
(inbound mobile students)Mobile students by region of origin
Host country or territory MF % F
Inbound mobility rate
(%) Arab States Central and Eastern
Europe Central Asia
INTERNATIONALLY MOBILE STUDENTS IN TERTIARY EDUCATION BY HOST COUNTRY AND REGION OF ORIGIN / 2005 (countries having more than 1000 mobile students)
137
G L O B A L E D U C A T I O N D I G E S T 2 0 0 7 C O M P A R I N G E D U C A T I O N S T A T I S T I C S A R O U N D T H E W O R L D
Mobile students by region of origin Region
East Asia and the Pacific
Latin America and the Caribbean
North America and Western Europe
South and West Asia Sub-Saharan Africa Unspecified Host country or territory
Cuba 14,414 ... 3.1 102 10 39
Venezuela 2,472 -1 ... 0.2 *, -1 28 -1 15 -1 - -1
North America and Western Europe
Austria (p) 33,707 -1 52 -1 14.1 -1 444 -1 14,537 -1 168 -1
Belgium (p) 21,054 59 5.4 172 567 13
Canada (p) 132,982 -1,** ... … ... ... ...
Cyprus 4,895 ... 24.4 166 506 24
Denmark (p) 10,251 59 4.4 59 478 33
Finland (p) 8,442 45 2.8 178 2,685 57
France (p) 236,518 ... 10.8 73,733 21,023 1,177
Germany (p) 259,797 50 ... 16,709 105,986 7,651
Greece (p) 15,690 55 2.4 446 2,093 146
Ireland (p) 12,887 50 6.9 639 495 7
Italy (p) 44,921 57 2.2 2,483 17,792 129
Netherlands (p) 26,387 55 4.7 539 1,696 66
Norway (p) 13,400 44 6.3 336 2,202 73
Portugal (p) 17,010 50 4.5 100 404 5
Spain (p) 45,603 52 2.5 5,185 3,331 116
Sweden (p) 19,966 ... 4.7 10 1,034 23
Switzerland (p) 36,792 45 18.4 1,258 5,286 176
United Kingdom (p) 318,399 47 13.9 13,810 11,768 967
U.S.A. (p) 590,128 ... 3.4 16,526 38,229 3,248
South and West Asia
India 7,589 -1 ... 0.1 -1 1,215 -1 32 -1 74 -1
Iran, Isl. Rep. 1,932 35 0.1 606 68 86
Sub-Saharan Africa
Cameroon 1,595 ... 1.6 * ... ... ...
Madagascar 1,226 25 2.7 - - -
Namibia 1,026 -2 ... 8.7 -2 8 -2 1 -2 . -2
South Africa 50,449 ... 6.9 - ... ...
REGIONAL AVERAGES
WORLD 2,728,480 ... ... 180,731 314,887 83,832
Arab States 67,440 ... ... 27,507 615 584
Central and Eastern Europe 209,356 ... ... 10,215 73,014 38,663
Central Asia 40,993 ... ... 849 6,215 28,307
East Asia and the Pacific 452,853 ... ... 7,173 4,409 1,987
Latin America and the Caribbean 33,987 ... ... 143 58 41
North America and Western Europe 1,851,018 ... ... 132,864 230,409 14,087
South and West Asia 10,658 ... ... 1,925 117 163
Sub-Saharan Africa 62,175 ... ... 55 50 -
Please refer to the Reader’s Guide for further information regarding the data and symbols used in each table.
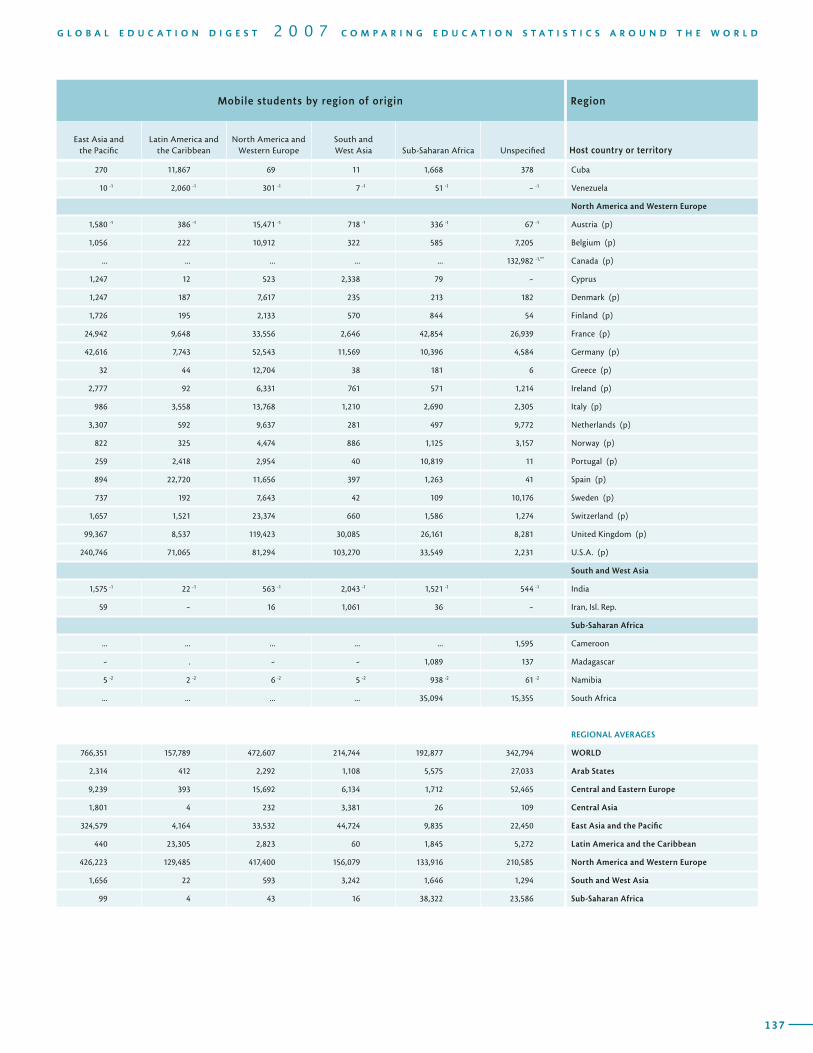
136
T A B L E 9Region
Students from abroad studying in given country
(inbound mobile students)Mobile students by region of origin
Host country or territory MF % F
Inbound mobility rate
(%) Arab States Central and Eastern
Europe Central Asia
INTERNATIONALLY MOBILE STUDENTS IN TERTIARY EDUCATION BY HOST COUNTRY AND REGION OF ORIGIN / 2005 (countries having more than 1000 mobile students)
137
G L O B A L E D U C A T I O N D I G E S T 2 0 0 7 C O M P A R I N G E D U C A T I O N S T A T I S T I C S A R O U N D T H E W O R L D
Mobile students by region of origin Region
East Asia and the Pacific
Latin America and the Caribbean
North America and Western Europe
South and West Asia Sub-Saharan Africa Unspecified Host country or territory
270 11,867 69 11 1,668 378 Cuba
10 -1 2,060 -1 301 -1 7 -1 51 -1 - -1 Venezuela
North America and Western Europe
1,580 -1 386 -1 15,471 -1 718 -1 336 -1 67 -1 Austria (p)
1,056 222 10,912 322 585 7,205 Belgium (p)
... ... ... ... ... 132,982 -1,** Canada (p)
1,247 12 523 2,338 79 - Cyprus
1,247 187 7,617 235 213 182 Denmark (p)
1,726 195 2,133 570 844 54 Finland (p)
24,942 9,648 33,556 2,646 42,854 26,939 France (p)
42,616 7,743 52,543 11,569 10,396 4,584 Germany (p)
32 44 12,704 38 181 6 Greece (p)
2,777 92 6,331 761 571 1,214 Ireland (p)
986 3,558 13,768 1,210 2,690 2,305 Italy (p)
3,307 592 9,637 281 497 9,772 Netherlands (p)
822 325 4,474 886 1,125 3,157 Norway (p)
259 2,418 2,954 40 10,819 11 Portugal (p)
894 22,720 11,656 397 1,263 41 Spain (p)
737 192 7,643 42 109 10,176 Sweden (p)
1,657 1,521 23,374 660 1,586 1,274 Switzerland (p)
99,367 8,537 119,423 30,085 26,161 8,281 United Kingdom (p)
240,746 71,065 81,294 103,270 33,549 2,231 U.S.A. (p)
South and West Asia
1,575 -1 22 -1 563 -1 2,043 -1 1,521 -1 544 -1 India
59 - 16 1,061 36 - Iran, Isl. Rep.
Sub-Saharan Africa
... ... ... ... ... 1,595 Cameroon
- . - - 1,089 137 Madagascar
5 -2 2 -2 6 -2 5 -2 938 -2 61 -2 Namibia
... ... ... ... 35,094 15,355 South Africa
REGIONAL AVERAGES
766,351 157,789 472,607 214,744 192,877 342,794 WORLD
2,314 412 2,292 1,108 5,575 27,033 Arab States
9,239 393 15,692 6,134 1,712 52,465 Central and Eastern Europe
1,801 4 232 3,381 26 109 Central Asia
324,579 4,164 33,532 44,724 9,835 22,450 East Asia and the Pacific
440 23,305 2,823 60 1,845 5,272 Latin America and the Caribbean
426,223 129,485 417,400 156,079 133,916 210,585 North America and Western Europe
1,656 22 593 3,242 1,646 1,294 South and West Asia
99 4 43 16 38,322 23,586 Sub-Saharan Africa
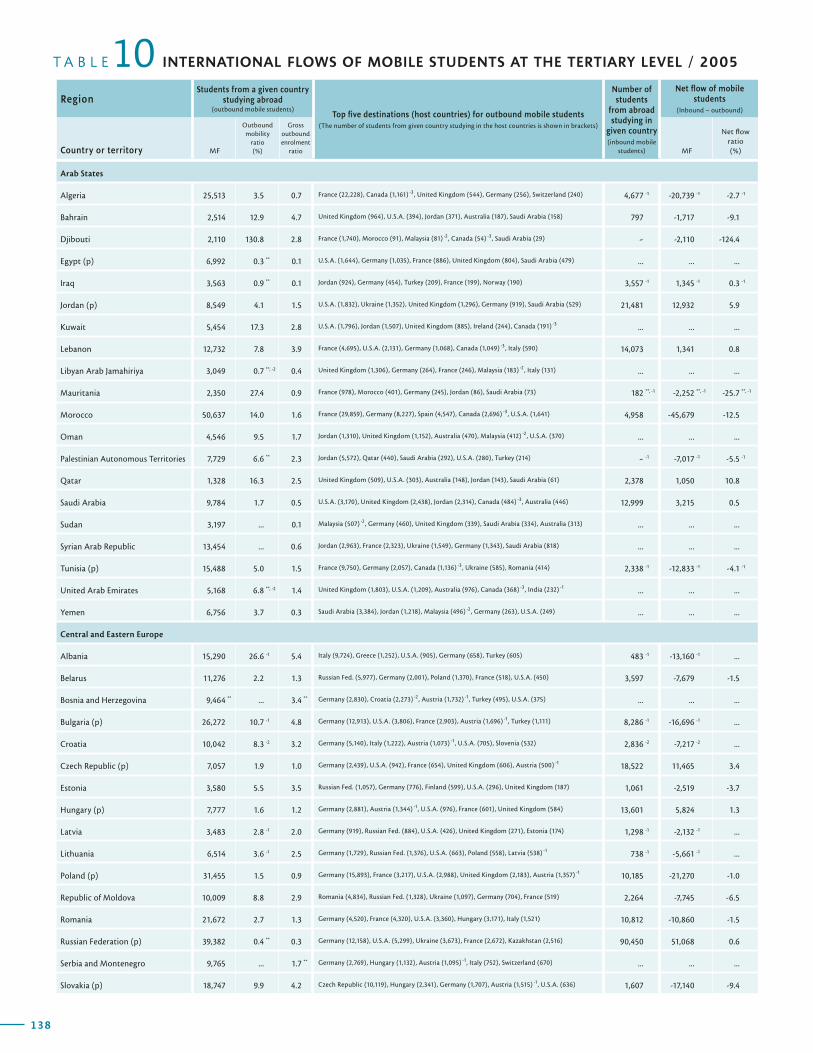
138
T A B L E INTERNATIONAL FLOWS OF MOBILE STUDENTS AT THE TERTIARY LEVEL / 200510Region
Students from a given country studying abroad
(outbound mobile students)Top five destinations (host countries) for outbound mobile students
(The number of students from given country studying in the host countries is shown in brackets)
Number of students
from abroad studying in
given country (inbound mobile
students)
Net flow of mobile students
(Inbound – outbound)
Country or territory MF
Outbound mobility
ratio (%)
Gross outbound enrolment
ratio MF
Net flow ratio (%)
139
G L O B A L E D U C A T I O N D I G E S T 2 0 0 7 C O M P A R I N G E D U C A T I O N S T A T I S T I C S A R O U N D T H E W O R L D
RegionStudents from a given country
studying abroad (outbound mobile students)
Top five destinations (host countries) for outbound mobile students (The number of students from given country studying in the host countries is shown in brackets)
Number of students
from abroad studying in
given country (inbound mobile
students)
Net flow of mobile students
(Inbound – outbound)
Country or territory MF
Outbound mobility
ratio (%)
Gross outbound enrolment
ratio MF
Net flow ratio (%)
Arab States
Algeria 25,513 3.5 0.7
Bahrain 2,514 12.9 4.7
Djibouti 2,110 130.8 2.8
Egypt (p) 6,992 0.3 ** 0.1
Iraq 3,563 0.9 ** 0.1
Jordan (p) 8,549 4.1 1.5
Kuwait 5,454 17.3 2.8
Lebanon 12,732 7.8 3.9
Libyan Arab Jamahiriya 3,049 0.7 **, -2 0.4
Mauritania 2,350 27.4 0.9
Morocco 50,637 14.0 1.6
Oman 4,546 9.5 1.7
Palestinian Autonomous Territories 7,729 6.6 ** 2.3
Qatar 1,328 16.3 2.5
Saudi Arabia 9,784 1.7 0.5
Sudan 3,197 ... 0.1
Syrian Arab Republic 13,454 ... 0.6
Tunisia (p) 15,488 5.0 1.5
United Arab Emirates 5,168 6.8 **, -2 1.4
Yemen 6,756 3.7 0.3
Central and Eastern Europe
Albania 15,290 26.6 -1 5.4
Belarus 11,276 2.2 1.3
Bosnia and Herzegovina 9,464 ** ... 3.4 **
Bulgaria (p) 26,272 10.7 -1 4.8
Croatia 10,042 8.3 -2 3.2
Czech Republic (p) 7,057 1.9 1.0
Estonia 3,580 5.5 3.5
Hungary (p) 7,777 1.6 1.2
Latvia 3,483 2.8 -1 2.0
Lithuania 6,514 3.6 -1 2.5
Poland (p) 31,455 1.5 0.9
Republic of Moldova 10,009 8.8 2.9
Romania 21,672 2.7 1.3
Russian Federation (p) 39,382 0.4 ** 0.3
Serbia and Montenegro 9,765 ... 1.7 **
Slovakia (p) 18,747 9.9 4.2
France (22,228), Canada (1,161) -3 , United Kingdom (544), Germany (256), Switzerland (240)
United Kingdom (964), U.S.A. (394), Jordan (371), Australia (187), Saudi Arabia (158)
France (1,740), Morocco (91), Malaysia (81) -2 , Canada (54) -3 , Saudi Arabia (29)
U.S.A. (1,644), Germany (1,035), France (886), United Kingdom (804), Saudi Arabia (479)
Jordan (924), Germany (454), Turkey (209), France (199), Norway (190)
U.S.A. (1,832), Ukraine (1,352), United Kingdom (1,296), Germany (919), Saudi Arabia (529)
U.S.A. (1,796), Jordan (1,507), United Kingdom (885), Ireland (244), Canada (191) -3
France (4,695), U.S.A. (2,131), Germany (1,068), Canada (1,049) -3 , Italy (590)
United Kingdom (1,306), Germany (264), France (246), Malaysia (183) -2 , Italy (131)
France (978), Morocco (401), Germany (245), Jordan (86), Saudi Arabia (73)
France (29,859), Germany (8,227), Spain (4,547), Canada (2,696) -3 , U.S.A. (1,641)
Jordan (1,310), United Kingdom (1,152), Australia (470), Malaysia (412) -2 , U.S.A. (370)
Jordan (5,572), Qatar (440), Saudi Arabia (292), U.S.A. (280), Turkey (214)
United Kingdom (509), U.S.A. (303), Australia (148), Jordan (143), Saudi Arabia (61)
U.S.A. (3,170), United Kingdom (2,438), Jordan (2,314), Canada (484) -3 , Australia (446)
Malaysia (507) -2 , Germany (460), United Kingdom (339), Saudi Arabia (334), Australia (313)
Jordan (2,963), France (2,323), Ukraine (1,549), Germany (1,343), Saudi Arabia (818)
France (9,750), Germany (2,057), Canada (1,136) -3 , Ukraine (585), Romania (414)
United Kingdom (1,803), U.S.A. (1,209), Australia (976), Canada (368) -3 , India (232) -1
Saudi Arabia (3,384), Jordan (1,218), Malaysia (496) -2 , Germany (263), U.S.A. (249)
Italy (9,724), Greece (1,252), U.S.A. (905), Germany (658), Turkey (605)
Russian Fed. (5,977), Germany (2,001), Poland (1,370), France (518), U.S.A. (450)
Germany (2,830), Croatia (2,273) -2 , Austria (1,732) -1, Turkey (495), U.S.A. (375)
Germany (12,913), U.S.A. (3,806), France (2,903), Austria (1,696) -1, Turkey (1,111)
Germany (5,140), Italy (1,222), Austria (1,073) -1, U.S.A. (705), Slovenia (532)
Germany (2,439), U.S.A. (942), France (654), United Kingdom (606), Austria (500) -1
Russian Fed. (1,057), Germany (776), Finland (599), U.S.A. (296), United Kingdom (187)
Germany (2,881), Austria (1,344) -1, U.S.A. (976), France (601), United Kingdom (584)
Germany (919), Russian Fed. (884), U.S.A. (426), United Kingdom (271), Estonia (174)
Germany (1,729), Russian Fed. (1,376), U.S.A. (663), Poland (558), Latvia (538) -1
Germany (15,893), France (3,217), U.S.A. (2,988), United Kingdom (2,183), Austria (1,357) -1
Romania (4,834), Russian Fed. (1,328), Ukraine (1,097), Germany (704), France (519)
Germany (4,520), France (4,320), U.S.A. (3,360), Hungary (3,171), Italy (1,521)
Germany (12,158), U.S.A. (5,299), Ukraine (3,673), France (2,672), Kazakhstan (2,516)
Germany (2,769), Hungary (1,132), Austria (1,095) -1, Italy (752), Switzerland (670)
Czech Republic (10,119), Hungary (2,341), Germany (1,707), Austria (1,515) -1, U.S.A. (636)
4,677 -1 -20,739 -1 -2.7 -1
797 -1,717 -9.1
- -2,110 -124.4
... ... ...
3,557 -1 1,345 -1 0.3 -1
21,481 12,932 5.9
... ... ...
14,073 1,341 0.8
... ... ...
182 **, -1 -2,252 **, -1 -25.7 **, -1
4,958 -45,679 -12.5
... ... ...
- -1 -7,017 -1 -5.5 -1
2,378 1,050 10.8
12,999 3,215 0.5
... ... ...
... ... ...
2,338 -1 -12,833 -1 -4.1 -1
... ... ...
... ... ...
483 -1 -13,160 -1 ...
3,597 -7,679 -1.5
... ... ...
8,286 -1 -16,696 -1 ...
2,836 -2 -7,217 -2 ...
18,522 11,465 3.4
1,061 -2,519 -3.7
13,601 5,824 1.3
1,298 -1 -2,132 -1 ...
738 -1 -5,661 -1 ...
10,185 -21,270 -1.0
2,264 -7,745 -6.5
10,812 -10,860 -1.5
90,450 51,068 0.6
... ... ...
1,607 -17,140 -9.4
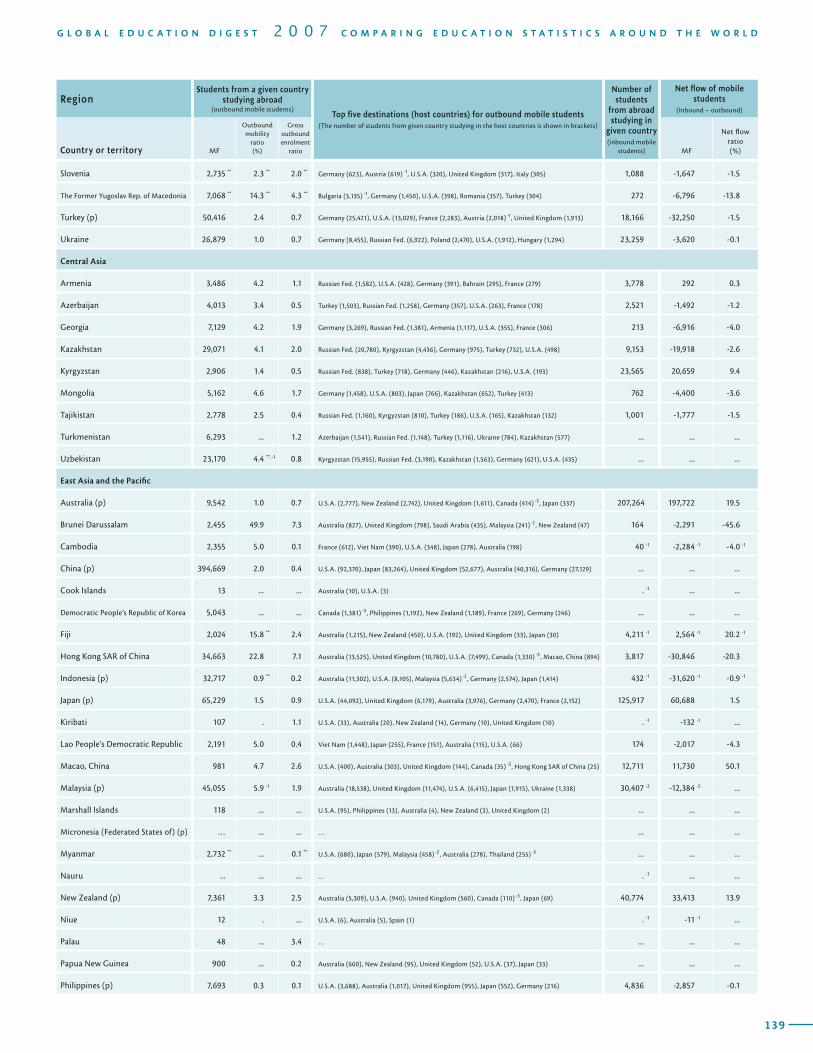
138
T A B L E INTERNATIONAL FLOWS OF MOBILE STUDENTS AT THE TERTIARY LEVEL / 200510Region
Students from a given country studying abroad
(outbound mobile students)Top five destinations (host countries) for outbound mobile students
(The number of students from given country studying in the host countries is shown in brackets)
Number of students
from abroad studying in
given country (inbound mobile
students)
Net flow of mobile students
(Inbound – outbound)
Country or territory MF
Outbound mobility
ratio (%)
Gross outbound enrolment
ratio MF
Net flow ratio (%)
139
G L O B A L E D U C A T I O N D I G E S T 2 0 0 7 C O M P A R I N G E D U C A T I O N S T A T I S T I C S A R O U N D T H E W O R L D
RegionStudents from a given country
studying abroad (outbound mobile students)
Top five destinations (host countries) for outbound mobile students (The number of students from given country studying in the host countries is shown in brackets)
Number of students
from abroad studying in
given country (inbound mobile
students)
Net flow of mobile students
(Inbound – outbound)
Country or territory MF
Outbound mobility
ratio (%)
Gross outbound enrolment
ratio MF
Net flow ratio (%)
Slovenia 2,735 ** 2.3 ** 2.0 **
The Former Yugoslav Rep. of Macedonia 7,068 ** 14.3 ** 4.3 **
Turkey (p) 50,416 2.4 0.7
Ukraine 26,879 1.0 0.7
Central Asia
Armenia 3,486 4.2 1.1
Azerbaijan 4,013 3.4 0.5
Georgia 7,129 4.2 1.9
Kazakhstan 29,071 4.1 2.0
Kyrgyzstan 2,906 1.4 0.5
Mongolia 5,162 4.6 1.7
Tajikistan 2,778 2.5 0.4
Turkmenistan 6,293 ... 1.2
Uzbekistan 23,170 4.4 **, -1 0.8
East Asia and the Pacific
Australia (p) 9,542 1.0 0.7
Brunei Darussalam 2,455 49.9 7.3
Cambodia 2,355 5.0 0.1
China (p) 394,669 2.0 0.4
Cook Islands 13 ... ...
Democratic People’s Republic of Korea 5,043 ... ...
Fiji 2,024 15.8 ** 2.4
Hong Kong SAR of China 34,663 22.8 7.1
Indonesia (p) 32,717 0.9 ** 0.2
Japan (p) 65,229 1.5 0.9
Kiribati 107 . 1.1
Lao People’s Democratic Republic 2,191 5.0 0.4
Macao, China 981 4.7 2.6
Malaysia (p) 45,055 5.9 -1 1.9
Marshall Islands 118 ... ...
Micronesia (Federated States of) (p) … ... ...
Myanmar 2,732 ** ... 0.1 **
Nauru ... ... ...
New Zealand (p) 7,361 3.3 2.5
Niue 12 . ...
Palau 48 ... 3.4
Papua New Guinea 900 ... 0.2
Philippines (p) 7,693 0.3 0.1
Germany (623), Austria (619) -1, U.S.A. (320), United Kingdom (317), Italy (305)
Bulgaria (3,135) -1, Germany (1,450), U.S.A. (398), Romania (357), Turkey (304)
Germany (25,421), U.S.A. (13,029), France (2,283), Austria (2,018) -1, United Kingdom (1,913)
Germany (8,455), Russian Fed. (6,922), Poland (2,470), U.S.A. (1,912), Hungary (1,294)
Russian Fed. (1,582), U.S.A. (428), Germany (391), Bahrain (295), France (279)
Turkey (1,503), Russian Fed. (1,258), Germany (357), U.S.A. (263), France (178)
Germany (3,269), Russian Fed. (1,381), Armenia (1,117), U.S.A. (355), France (306)
Russian Fed. (20,780), Kyrgyzstan (4,436), Germany (975), Turkey (732), U.S.A. (498)
Russian Fed. (838), Turkey (718), Germany (446), Kazakhstan (216), U.S.A. (193)
Germany (1,458), U.S.A. (803), Japan (766), Kazakhstan (652), Turkey (413)
Russian Fed. (1,160), Kyrgyzstan (810), Turkey (186), U.S.A. (165), Kazakhstan (132)
Azerbaijan (1,541), Russian Fed. (1,148), Turkey (1,116), Ukraine (784), Kazakhstan (577)
Kyrgyzstan (15,955), Russian Fed. (3,190), Kazakhstan (1,563), Germany (621), U.S.A. (435)
U.S.A. (2,777), New Zealand (2,742), United Kingdom (1,611), Canada (414) -3 , Japan (337)
Australia (827), United Kingdom (798), Saudi Arabia (435), Malaysia (241) -2 , New Zealand (47)
France (612), Viet Nam (390), U.S.A. (348), Japan (278), Australia (198)
U.S.A. (92,370), Japan (83,264), United Kingdom (52,677), Australia (40,316), Germany (27,129)
Australia (10), U.S.A. (3)
Canada (1,381) -3 , Philippines (1,192), New Zealand (1,189), France (269), Germany (246)
Australia (1,215), New Zealand (450), U.S.A. (192), United Kingdom (33), Japan (30)
Australia (13,525), United Kingdom (10,780), U.S.A. (7,499), Canada (1,330) -3 , Macao, China (894)
Australia (11,302), U.S.A. (8,105), Malaysia (5,634) -2 , Germany (2,574), Japan (1,414)
U.S.A. (44,092), United Kingdom (6,179), Australia (3,976), Germany (2,470), France (2,152)
U.S.A. (33), Australia (20), New Zealand (14), Germany (10), United Kingdom (10)
Viet Nam (1,448), Japan (255), France (151), Australia (115), U.S.A. (66)
U.S.A. (400), Australia (303), United Kingdom (144), Canada (35) -3 , Hong Kong SAR of China (25)
Australia (18,538), United Kingdom (11,474), U.S.A. (6,415), Japan (1,915), Ukraine (1,338)
U.S.A. (95), Philippines (13), Australia (4), New Zealand (3), United Kingdom (2)
…
U.S.A. (680), Japan (579), Malaysia (458) -2 , Australia (278), Thailand (255) -3
…
Australia (5,309), U.S.A. (940), United Kingdom (560), Canada (110) -3 , Japan (69)
U.S.A. (6), Australia (5), Spain (1)
…
Australia (660), New Zealand (95), United Kingdom (52), U.S.A. (37), Japan (33)
U.S.A. (3,688), Australia (1,017), United Kingdom (955), Japan (552), Germany (216)
1,088 -1,647 -1.5
272 -6,796 -13.8
18,166 -32,250 -1.5
23,259 -3,620 -0.1
3,778 292 0.3
2,521 -1,492 -1.2
213 -6,916 -4.0
9,153 -19,918 -2.6
23,565 20,659 9.4
762 -4,400 -3.6
1,001 -1,777 -1.5
... ... ...
... ... ...
207,264 197,722 19.5
164 -2,291 -45.6
40 -1 -2,284 -1 -4.0 -1
... ... ...
. -1 ... ...
... ... ...
4,211 -1 2,564 -1 20.2 -1
3,817 -30,846 -20.3
432 -1 -31,620 -1 -0.9 -1
125,917 60,688 1.5
. -1 -132 -1 ...
174 -2,017 -4.3
12,711 11,730 50.1
30,407 -2 -12,384 -2 ...
... ... ...
... ... ...
... ... ...
. -1 ... ...
40,774 33,413 13.9
. -1 -11 -1 ...
... ... ...
... ... ...
4,836 -2,857 -0.1
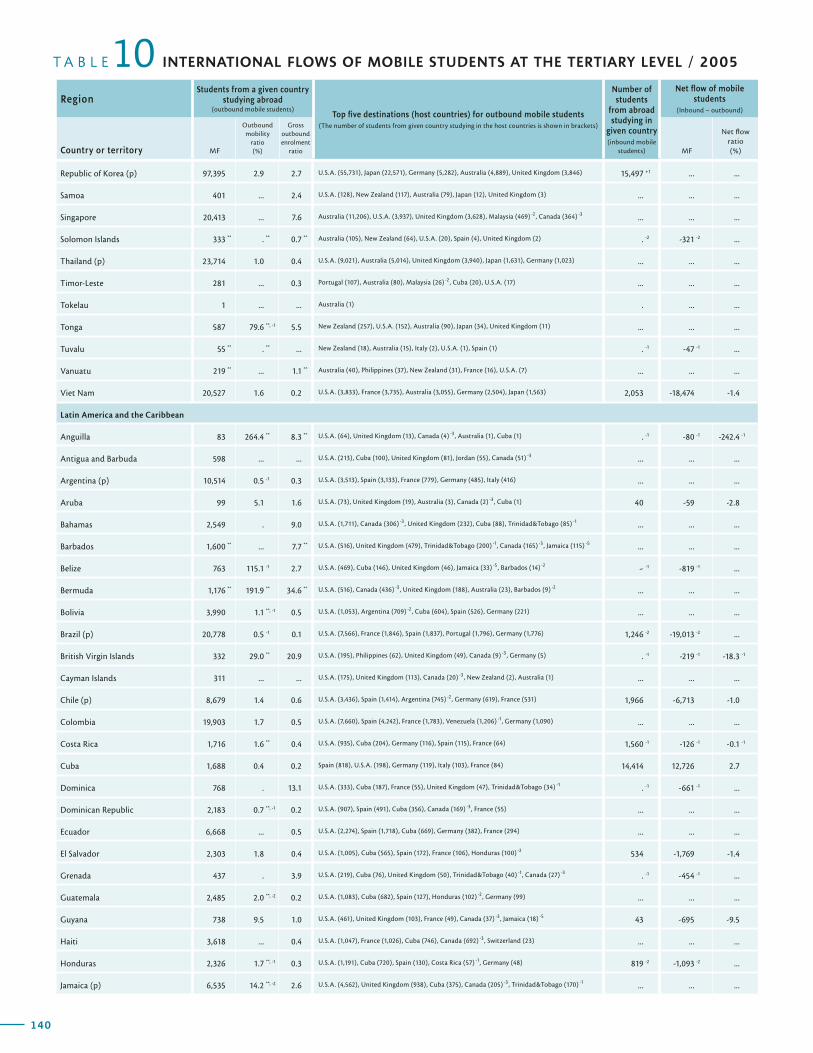
140
T A B L E INTERNATIONAL FLOWS OF MOBILE STUDENTS AT THE TERTIARY LEVEL / 200510Region
Students from a given country studying abroad
(outbound mobile students)Top five destinations (host countries) for outbound mobile students
(The number of students from given country studying in the host countries is shown in brackets)
Number of students
from abroad studying in
given country (inbound mobile
students)
Net flow of mobile students
(Inbound – outbound)
Country or territory MF
Outbound mobility
ratio (%)
Gross outbound enrolment
ratio MF
Net flow ratio (%)
141
G L O B A L E D U C A T I O N D I G E S T 2 0 0 7 C O M P A R I N G E D U C A T I O N S T A T I S T I C S A R O U N D T H E W O R L D
RegionStudents from a given country
studying abroad (outbound mobile students)
Top five destinations (host countries) for outbound mobile students (The number of students from given country studying in the host countries is shown in brackets)
Number of students
from abroad studying in
given country (inbound mobile
students)
Net flow of mobile students
(Inbound – outbound)
Country or territory MF
Outbound mobility
ratio (%)
Gross outbound enrolment
ratio MF
Net flow ratio (%)
Republic of Korea (p) 97,395 2.9 2.7
Samoa 401 ... 2.4
Singapore 20,413 ... 7.6
Solomon Islands 333 ** . ** 0.7 **
Thailand (p) 23,714 1.0 0.4
Timor-Leste 281 ... 0.3
Tokelau 1 ... ...
Tonga 587 79.6 **, -1 5.5
Tuvalu 55 ** . ** ...
Vanuatu 219 ** ... 1.1 **
Viet Nam 20,527 1.6 0.2
Latin America and the Caribbean
Anguilla 83 264.4 ** 8.3 **
Antigua and Barbuda 598 ... ...
Argentina (p) 10,514 0.5 -1 0.3
Aruba 99 5.1 1.6
Bahamas 2,549 . 9.0
Barbados 1,600 ** ... 7.7 **
Belize 763 115.1 -1 2.7
Bermuda 1,176 ** 191.9 ** 34.6 **
Bolivia 3,990 1.1 **, -1 0.5
Brazil (p) 20,778 0.5 -1 0.1
British Virgin Islands 332 29.0 ** 20.9
Cayman Islands 311 ... ...
Chile (p) 8,679 1.4 0.6
Colombia 19,903 1.7 0.5
Costa Rica 1,716 1.6 ** 0.4
Cuba 1,688 0.4 0.2
Dominica 768 . 13.1
Dominican Republic 2,183 0.7 **, -1 0.2
Ecuador 6,668 ... 0.5
El Salvador 2,303 1.8 0.4
Grenada 437 . 3.9
Guatemala 2,485 2.0 **, -2 0.2
Guyana 738 9.5 1.0
Haiti 3,618 ... 0.4
Honduras 2,326 1.7 **, -1 0.3
Jamaica (p) 6,535 14.2 **, -2 2.6
U.S.A. (55,731), Japan (22,571), Germany (5,282), Australia (4,889), United Kingdom (3,846)
U.S.A. (128), New Zealand (117), Australia (79), Japan (12), United Kingdom (3)
Australia (11,206), U.S.A. (3,937), United Kingdom (3,628), Malaysia (469) -2 , Canada (364) -3
Australia (105), New Zealand (64), U.S.A. (20), Spain (4), United Kingdom (2)
U.S.A. (9,021), Australia (5,014), United Kingdom (3,940), Japan (1,631), Germany (1,023)
Portugal (107), Australia (80), Malaysia (26) -2 , Cuba (20), U.S.A. (17)
Australia (1)
New Zealand (257), U.S.A. (152), Australia (90), Japan (34), United Kingdom (11)
New Zealand (18), Australia (15), Italy (2), U.S.A. (1), Spain (1)
Australia (40), Philippines (37), New Zealand (31), France (16), U.S.A. (7)
U.S.A. (3,833), France (3,735), Australia (3,055), Germany (2,504), Japan (1,563)
U.S.A. (64), United Kingdom (13), Canada (4) -3 , Australia (1), Cuba (1)
U.S.A. (213), Cuba (100), United Kingdom (81), Jordan (55), Canada (51) -3
U.S.A. (3,513), Spain (3,133), France (779), Germany (485), Italy (416)
U.S.A. (73), United Kingdom (19), Australia (3), Canada (2) -3 , Cuba (1)
U.S.A. (1,711), Canada (306) -3 , United Kingdom (232), Cuba (88), Trinidad&Tobago (85) -1
U.S.A. (516), United Kingdom (479), Trinidad&Tobago (200) -1, Canada (165) -3 , Jamaica (115) -5
U.S.A. (469), Cuba (146), United Kingdom (46), Jamaica (33) -5 , Barbados (14) -2
U.S.A. (516), Canada (436) -3 , United Kingdom (188), Australia (23), Barbados (9) -2
U.S.A. (1,053), Argentina (709) -2 , Cuba (604), Spain (526), Germany (221)
U.S.A. (7,566), France (1,846), Spain (1,837), Portugal (1,796), Germany (1,776)
U.S.A. (195), Philippines (62), United Kingdom (49), Canada (9) -3 , Germany (5)
U.S.A. (175), United Kingdom (113), Canada (20) -3 , New Zealand (2), Australia (1)
U.S.A. (3,436), Spain (1,414), Argentina (745) -2 , Germany (619), France (531)
U.S.A. (7,660), Spain (4,242), France (1,783), Venezuela (1,206) -1, Germany (1,090)
U.S.A. (935), Cuba (204), Germany (116), Spain (115), France (64)
Spain (818), U.S.A. (198), Germany (119), Italy (103), France (84)
U.S.A. (333), Cuba (187), France (55), United Kingdom (47), Trinidad&Tobago (34) -1
U.S.A. (907), Spain (491), Cuba (356), Canada (169) -3 , France (55)
U.S.A. (2,274), Spain (1,718), Cuba (669), Germany (382), France (294)
U.S.A. (1,005), Cuba (565), Spain (172), France (106), Honduras (100) -2
U.S.A. (219), Cuba (76), United Kingdom (50), Trinidad&Tobago (40) -1, Canada (27) -3
U.S.A. (1,083), Cuba (682), Spain (127), Honduras (102) -2 , Germany (99)
U.S.A. (461), United Kingdom (103), France (49), Canada (37) -3 , Jamaica (18) -5
U.S.A. (1,047), France (1,026), Cuba (746), Canada (692) -3 , Switzerland (23)
U.S.A. (1,191), Cuba (720), Spain (130), Costa Rica (57) -1, Germany (48)
U.S.A. (4,562), United Kingdom (938), Cuba (375), Canada (205) -3 , Trinidad&Tobago (170) -1
15,497 +1 ... ...
... ... ...
... ... ...
. -2 -321 -2 ...
... ... ...
... ... ...
. ... ...
... ... ...
. -1 -47 -1 ...
... ... ...
2,053 -18,474 -1.4
. -1 -80 -1 -242.4 -1
... ... ...
... ... ...
40 -59 -2.8
... ... ...
... ... ...
- -1 -819 -1 ...
... ... ...
... ... ...
1,246 -2 -19,013 -2 ...
. -1 -219 -1 -18.3 -1
... ... ...
1,966 -6,713 -1.0
... ... ...
1,560 -1 -126 -1 -0.1 -1
14,414 12,726 2.7
. -1 -661 -1 ...
... ... ...
... ... ...
534 -1,769 -1.4
. -1 -454 -1 ...
... ... ...
43 -695 -9.5
... ... ...
819 -2 -1,093 -2 ...
... ... ...
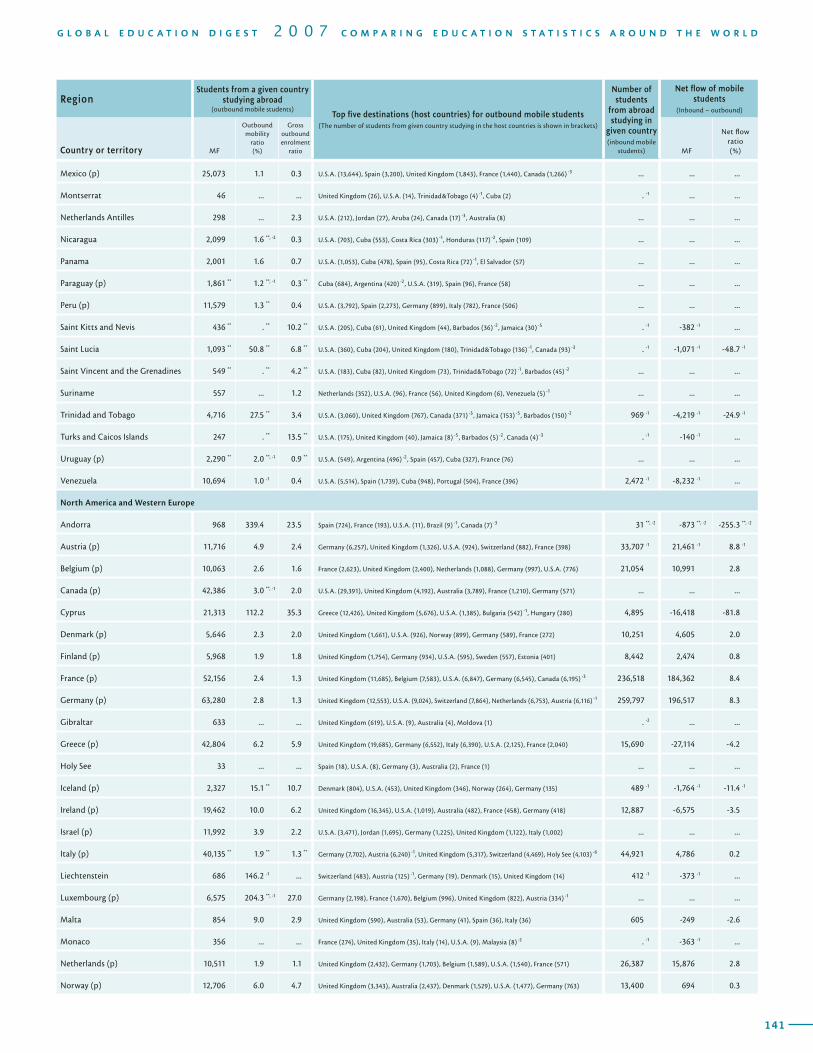
140
T A B L E INTERNATIONAL FLOWS OF MOBILE STUDENTS AT THE TERTIARY LEVEL / 200510Region
Students from a given country studying abroad
(outbound mobile students)Top five destinations (host countries) for outbound mobile students
(The number of students from given country studying in the host countries is shown in brackets)
Number of students
from abroad studying in
given country (inbound mobile
students)
Net flow of mobile students
(Inbound – outbound)
Country or territory MF
Outbound mobility
ratio (%)
Gross outbound enrolment
ratio MF
Net flow ratio (%)
141
G L O B A L E D U C A T I O N D I G E S T 2 0 0 7 C O M P A R I N G E D U C A T I O N S T A T I S T I C S A R O U N D T H E W O R L D
RegionStudents from a given country
studying abroad (outbound mobile students)
Top five destinations (host countries) for outbound mobile students (The number of students from given country studying in the host countries is shown in brackets)
Number of students
from abroad studying in
given country (inbound mobile
students)
Net flow of mobile students
(Inbound – outbound)
Country or territory MF
Outbound mobility
ratio (%)
Gross outbound enrolment
ratio MF
Net flow ratio (%)
Mexico (p) 25,073 1.1 0.3
Montserrat 46 ... ...
Netherlands Antilles 298 ... 2.3
Nicaragua 2,099 1.6 **, -2 0.3
Panama 2,001 1.6 0.7
Paraguay (p) 1,861 ** 1.2 **, -1 0.3 **
Peru (p) 11,579 1.3 ** 0.4
Saint Kitts and Nevis 436 ** . ** 10.2 **
Saint Lucia 1,093 ** 50.8 ** 6.8 **
Saint Vincent and the Grenadines 549 ** . ** 4.2 **
Suriname 557 ... 1.2
Trinidad and Tobago 4,716 27.5 ** 3.4
Turks and Caicos Islands 247 . ** 13.5 **
Uruguay (p) 2,290 ** 2.0 **, -1 0.9 **
Venezuela 10,694 1.0 -1 0.4
North America and Western Europe
Andorra 968 339.4 23.5
Austria (p) 11,716 4.9 2.4
Belgium (p) 10,063 2.6 1.6
Canada (p) 42,386 3.0 **, -1 2.0
Cyprus 21,313 112.2 35.3
Denmark (p) 5,646 2.3 2.0
Finland (p) 5,968 1.9 1.8
France (p) 52,156 2.4 1.3
Germany (p) 63,280 2.8 1.3
Gibraltar 633 ... ...
Greece (p) 42,804 6.2 5.9
Holy See 33 ... ...
Iceland (p) 2,327 15.1 ** 10.7
Ireland (p) 19,462 10.0 6.2
Israel (p) 11,992 3.9 2.2
Italy (p) 40,135 ** 1.9 ** 1.3 **
Liechtenstein 686 146.2 -1 ...
Luxembourg (p) 6,575 204.3 **, -1 27.0
Malta 854 9.0 2.9
Monaco 356 ... ...
Netherlands (p) 10,511 1.9 1.1
Norway (p) 12,706 6.0 4.7
U.S.A. (13,644), Spain (3,200), United Kingdom (1,843), France (1,440), Canada (1,266) -3
United Kingdom (26), U.S.A. (14), Trinidad&Tobago (4) -1, Cuba (2)
U.S.A. (212), Jordan (27), Aruba (24), Canada (17) -3 , Australia (8)
U.S.A. (703), Cuba (553), Costa Rica (303) -1, Honduras (117) -2 , Spain (109)
U.S.A. (1,053), Cuba (478), Spain (95), Costa Rica (72) -1, El Salvador (57)
Cuba (684), Argentina (420) -2 , U.S.A. (319), Spain (96), France (58)
U.S.A. (3,792), Spain (2,273), Germany (899), Italy (782), France (506)
U.S.A. (205), Cuba (61), United Kingdom (44), Barbados (36) -2 , Jamaica (30) -5
U.S.A. (360), Cuba (204), United Kingdom (180), Trinidad&Tobago (136) -1, Canada (93) -3
U.S.A. (183), Cuba (82), United Kingdom (73), Trinidad&Tobago (72) -1, Barbados (45) -2
Netherlands (352), U.S.A. (96), France (56), United Kingdom (6), Venezuela (5) -1
U.S.A. (3,060), United Kingdom (767), Canada (371) -3 , Jamaica (153) -5 , Barbados (150) -2
U.S.A. (175), United Kingdom (40), Jamaica (8) -5 , Barbados (5) -2 , Canada (4) -3
U.S.A. (549), Argentina (496) -2 , Spain (457), Cuba (327), France (76)
U.S.A. (5,514), Spain (1,739), Cuba (948), Portugal (504), France (396)
Spain (724), France (193), U.S.A. (11), Brazil (9) -1, Canada (7) -3
Germany (6,257), United Kingdom (1,326), U.S.A. (924), Switzerland (882), France (398)
France (2,623), United Kingdom (2,400), Netherlands (1,088), Germany (997), U.S.A. (776)
U.S.A. (29,391), United Kingdom (4,192), Australia (3,789), France (1,210), Germany (571)
Greece (12,426), United Kingdom (5,676), U.S.A. (1,385), Bulgaria (542) -1, Hungary (280)
United Kingdom (1,661), U.S.A. (926), Norway (899), Germany (589), France (272)
United Kingdom (1,754), Germany (934), U.S.A. (595), Sweden (557), Estonia (401)
United Kingdom (11,685), Belgium (7,583), U.S.A. (6,847), Germany (6,545), Canada (6,195) -3
United Kingdom (12,553), U.S.A. (9,024), Switzerland (7,864), Netherlands (6,753), Austria (6,116) -1
United Kingdom (619), U.S.A. (9), Australia (4), Moldova (1)
United Kingdom (19,685), Germany (6,552), Italy (6,390), U.S.A. (2,125), France (2,040)
Spain (18), U.S.A. (8), Germany (3), Australia (2), France (1)
Denmark (804), U.S.A. (453), United Kingdom (346), Norway (264), Germany (135)
United Kingdom (16,345), U.S.A. (1,019), Australia (482), France (458), Germany (418)
U.S.A. (3,471), Jordan (1,695), Germany (1,225), United Kingdom (1,122), Italy (1,002)
Germany (7,702), Austria (6,240) -1, United Kingdom (5,317), Switzerland (4,469), Holy See (4,103) -6
Switzerland (483), Austria (125) -1, Germany (19), Denmark (15), United Kingdom (14)
Germany (2,198), France (1,670), Belgium (996), United Kingdom (822), Austria (334) -1
United Kingdom (590), Australia (53), Germany (41), Spain (36), Italy (36)
France (274), United Kingdom (35), Italy (14), U.S.A. (9), Malaysia (8) -2
United Kingdom (2,432), Germany (1,703), Belgium (1,589), U.S.A. (1,540), France (571)
United Kingdom (3,343), Australia (2,437), Denmark (1,529), U.S.A. (1,477), Germany (763)
... ... ...
. -1 ... ...
... ... ...
... ... ...
... ... ...
... ... ...
... ... ...
. -1 -382 -1 ...
. -1 -1,071 -1 -48.7 -1
... ... ...
... ... ...
969 -1 -4,219 -1 -24.9 -1
. -1 -140 -1 ...
... ... ...
2,472 -1 -8,232 -1 ...
31 **, -2 -873 **, -2 -255.3 **, -2
33,707 -1 21,461 -1 8.8 -1
21,054 10,991 2.8
... ... ...
4,895 -16,418 -81.8
10,251 4,605 2.0
8,442 2,474 0.8
236,518 184,362 8.4
259,797 196,517 8.3
. -2 ... ...
15,690 -27,114 -4.2
... ... ...
489 -1 -1,764 -1 -11.4 -1
12,887 -6,575 -3.5
... ... ...
44,921 4,786 0.2
412 -1 -373 -1 ...
... ... ...
605 -249 -2.6
. -1 -363 -1 ...
26,387 15,876 2.8
13,400 694 0.3

142
T A B L E INTERNATIONAL FLOWS OF MOBILE STUDENTS AT THE TERTIARY LEVEL / 200510Region
Students from a given country studying abroad
(outbound mobile students)Top five destinations (host countries) for outbound mobile students
(The number of students from given country studying in the host countries is shown in brackets)
Number of students
from abroad studying in
given country (inbound mobile
students)
Net flow of mobile students
(Inbound – outbound)
Country or territory MF
Outbound mobility
ratio (%)
Gross outbound enrolment
ratio MF
Net flow ratio (%)
143
G L O B A L E D U C A T I O N D I G E S T 2 0 0 7 C O M P A R I N G E D U C A T I O N S T A T I S T I C S A R O U N D T H E W O R L D
RegionStudents from a given country
studying abroad (outbound mobile students)
Top five destinations (host countries) for outbound mobile students (The number of students from given country studying in the host countries is shown in brackets)
Number of students
from abroad studying in
given country (inbound mobile
students)
Net flow of mobile students
(Inbound – outbound)
Country or territory MF
Outbound mobility
ratio (%)
Gross outbound enrolment
ratio MF
Net flow ratio (%)
Portugal (p) 12,646 3.1 1.9
San Marino 871 ... ...
Spain (p) 24,958 1.3 0.9
Sweden (p) 13,602 3.3 2.6
Switzerland (p) 9,781 5.0 2.3
United Kingdom (p) 26,102 1.2 0.7
United States (p) 46,289 0.3 0.2
South and West Asia
Afghanistan 3,288 10.8 -1 0.1
Bangladesh 14,513 1.7 0.1
Bhutan 601 ** ... ...
India 139,356 1.2 0.1
Iran, Islamic Republic of 19,262 1.0 0.2
Maldives 1,016 -2 1,391.8 -2 3.1 -2
Nepal 8,884 5.3 -1 0.3
Pakistan 21,172 2.9 0.1
Sri Lanka (p) 10,449 ... 0.6
Sub-Saharan Africa
Angola 7,010 45.9 **, -2 0.4
Benin 3,414 ... 0.4
Botswana 9,246 87.3 4.3
Burkina Faso 1,841 7.1 0.2
Burundi 794 ** 5.5 ** 0.1 **
Cameroon 15,523 16.5 0.9
Cape Verde 4,293 117.3 7.6
Central African Republic 839 13.9 ** 0.2
Chad 2,103 -1 21.7 -1 0.3 -1
Comoros 2,599 148.8 **, -1 3.2
Congo 4,594 37.6 **, -2 1.3
Côte d’Ivoire 5,902 ... 0.3
Democratic Republic of the Congo 3,106 ... 0.1
Equatorial Guinea 933 ... 2.1
Eritrea 891 17.3 -1 0.2
Ethiopia 3,625 2.0 0.1
Gabon 3,857 ... 2.9
Gambia 954 66.5 -1 0.7
Ghana 8,336 7.4 0.4
Guinea 3,328 14.6 0.4
United Kingdom (2,785), France (2,554), Spain (2,292), Germany (1,746), U.S.A. (890)
Italy (789), Malta (47), United Kingdom (16), Holy See (4) -6 , Venezuela (3) -1
United Kingdom (6,001), Germany (5,669), U.S.A. (3,668), France (3,448), Switzerland (1,649)
United Kingdom (3,431), U.S.A. (3,244), Norway (1,130), Australia (1,100), Germany (772)
Germany (2,167), United Kingdom (1,501), France (1,471), U.S.A. (1,422), Italy (1,057)
U.S.A. (8,602), Australia (5,412), France (2,299), Germany (1,962), Denmark (1,394)
United Kingdom (14,385), Canada (7,225) -3 , Australia (3,935), Germany (3,363), France (2,429)
Iran, Isl. Rep. (953), Germany (735), Turkey (230), Saudi Arabia (193), U.S.A. (162)
Australia (3,606), U.S.A. (2,881), Malaysia (2,136) -2 , United Kingdom (1,947), Japan (1,110)
India (174) -1, Australia (165), U.S.A. (73), Japan (56), Thailand (28) -3
U.S.A. (84,044), Australia (22,039), United Kingdom (16,685), Germany (4,339), New Zealand (1,563)
Germany (4,412), U.S.A. (2,351), United Kingdom (1,752), France (1,491), Ukraine (1,230)
Malaysia (562) -2 , Australia (227), United Kingdom (152), New Zealand (51), Saudi Arabia (25)
U.S.A. (5,077), Australia (727), India (681) -1, United Kingdom (458), Japan (457)
U.S.A. (6,576), United Kingdom (6,547), Australia (1,545), Germany (1,262), Malaysia (1,159) -2
Australia (2,726), United Kingdom (2,419), U.S.A. (2,081), Japan (765), Malaysia (381) -2
Portugal (4,258), South Africa (992), U.S.A. (450), Namibia (354) -2 , United Kingdom (193)
France (2,340), Canada (202) -3 , U.S.A. (188), Germany (185), Morocco (165)
South Africa (6,889), Australia (765), United Kingdom (688), U.S.A. (353), Malaysia (160) -2
France (853), U.S.A. (289), Morocco (204), Canada (160) -3 , Germany (113)
France (193), Canada (131) -3 , U.S.A. (86), Germany (37), Holy See (37) -6
Germany (5,393), France (5,043), U.S.A. (1,425), Italy (1,364), Canada (491) -3
Portugal (3,835), Cuba (137), France (133), Spain (56), U.S.A. (42)
France (671), Canada (35) -3 , U.S.A. (33), Cameroon (18) -1, United Kingdom (17)
Cameroon (1,165) -1, France (439), Morocco (148), Canada (89) -3 , U.S.A. (78)
France (1,131), Madagascar (1,089), Morocco (223), Saudi Arabia (44), Malaysia (25) -2
France (3,066), Canada (276) -3 , Morocco (233), Italy (169), Germany (110)
France (3,816), U.S.A. (650), Canada (483) -3 , Germany (249), Morocco (237)
France (807), South Africa (671), U.S.A. (337), Burundi (276) -3 , Canada (152) -3
Spain (528), Cuba (191), U.S.A. (109), France (27), Morocco (20)
U.S.A. (203), Jordan (108), Germany (102), Italy (91), Saudi Arabia (88)
U.S.A. (1,179), Germany (523), India (351) -1, United Kingdom (235), Norway (227)
France (2,998), Canada (260) -3 , Germany (164), U.S.A. (151), Morocco (123)
U.S.A. (465), United Kingdom (339), Saudi Arabia (29), Canada (17) -3 , Germany (15)
U.S.A. (3,252), United Kingdom (3,035), Germany (621), Canada (274) -3 , Finland (131)
France (1,499), Morocco (329), U.S.A. (235), Germany (231), Canada (207) -3
17,010 4,364 1.1
... ... ...
45,603 20,645 1.1
19,966 6,364 1.5
36,792 27,011 13.5
318,399 292,297 12.8
590,128 543,839 3.1
... ... ...
748 -13,765 -1.5
... ... ...
7,589 -1 -117,853 -1 -1.0 -1
1,932 -17,330 -0.8
- -2 -1,016 -2 -1391.8 -2
... ... ...
389 -2 -18,240 -2 -2.3 -2
- -2 -9,666 -2 ...
... ... ...
... ... ...
654 -8,592 -78.5
880 -961 -3.4
... ... ...
1,595 -13,928 -13.9
... ... ...
... ... ...
... ... ...
... ... ...
52 -1 -4,531 -1 ...
... ... ...
... ... ...
... ... ...
... ... ...
... ... ...
... ... ...
- -1 -982 -1 ...
... ... ...
513 ** -2,815 ** -11.8 **
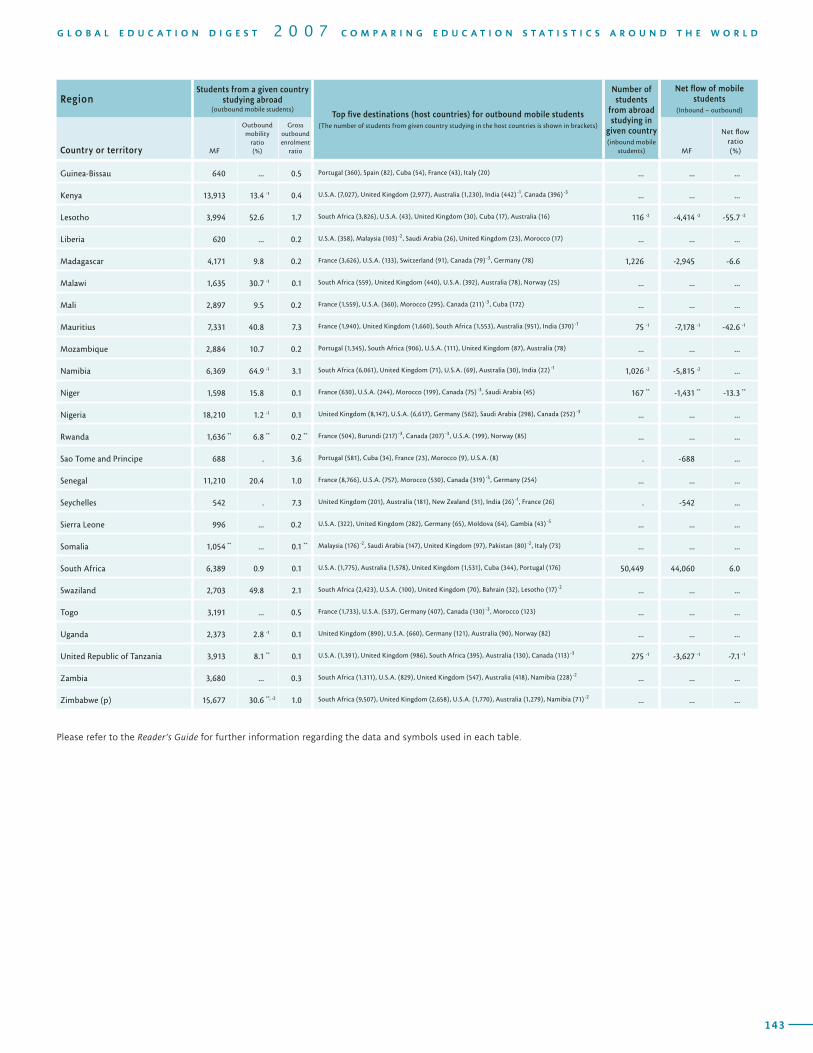
142
T A B L E INTERNATIONAL FLOWS OF MOBILE STUDENTS AT THE TERTIARY LEVEL / 200510Region
Students from a given country studying abroad
(outbound mobile students)Top five destinations (host countries) for outbound mobile students
(The number of students from given country studying in the host countries is shown in brackets)
Number of students
from abroad studying in
given country (inbound mobile
students)
Net flow of mobile students
(Inbound – outbound)
Country or territory MF
Outbound mobility
ratio (%)
Gross outbound enrolment
ratio MF
Net flow ratio (%)
143
G L O B A L E D U C A T I O N D I G E S T 2 0 0 7 C O M P A R I N G E D U C A T I O N S T A T I S T I C S A R O U N D T H E W O R L D
RegionStudents from a given country
studying abroad (outbound mobile students)
Top five destinations (host countries) for outbound mobile students (The number of students from given country studying in the host countries is shown in brackets)
Number of students
from abroad studying in
given country (inbound mobile
students)
Net flow of mobile students
(Inbound – outbound)
Country or territory MF
Outbound mobility
ratio (%)
Gross outbound enrolment
ratio MF
Net flow ratio (%)
Guinea-Bissau 640 ... 0.5
Kenya 13,913 13.4 -1 0.4
Lesotho 3,994 52.6 1.7
Liberia 620 ... 0.2
Madagascar 4,171 9.8 0.2
Malawi 1,635 30.7 -1 0.1
Mali 2,897 9.5 0.2
Mauritius 7,331 40.8 7.3
Mozambique 2,884 10.7 0.2
Namibia 6,369 64.9 -1 3.1
Niger 1,598 15.8 0.1
Nigeria 18,210 1.2 -1 0.1
Rwanda 1,636 ** 6.8 ** 0.2 **
Sao Tome and Principe 688 . 3.6
Senegal 11,210 20.4 1.0
Seychelles 542 . 7.3
Sierra Leone 996 ... 0.2
Somalia 1,054 ** ... 0.1 **
South Africa 6,389 0.9 0.1
Swaziland 2,703 49.8 2.1
Togo 3,191 ... 0.5
Uganda 2,373 2.8 -1 0.1
United Republic of Tanzania 3,913 8.1 ** 0.1
Zambia 3,680 ... 0.3
Zimbabwe (p) 15,677 30.6 **, -2 1.0
Portugal (360), Spain (82), Cuba (54), France (43), Italy (20)
U.S.A. (7,027), United Kingdom (2,977), Australia (1,230), India (442) -1, Canada (396) -3
South Africa (3,826), U.S.A. (43), United Kingdom (30), Cuba (17), Australia (16)
U.S.A. (358), Malaysia (103) -2 , Saudi Arabia (26), United Kingdom (23), Morocco (17)
France (3,626), U.S.A. (133), Switzerland (91), Canada (79) -3 , Germany (78)
South Africa (559), United Kingdom (440), U.S.A. (392), Australia (78), Norway (25)
France (1,559), U.S.A. (360), Morocco (295), Canada (211) -3 , Cuba (172)
France (1,940), United Kingdom (1,660), South Africa (1,553), Australia (951), India (370) -1
Portugal (1,345), South Africa (906), U.S.A. (111), United Kingdom (87), Australia (78)
South Africa (6,061), United Kingdom (71), U.S.A. (69), Australia (30), India (22) -1
France (630), U.S.A. (244), Morocco (199), Canada (75) -3 , Saudi Arabia (45)
United Kingdom (8,147), U.S.A. (6,617), Germany (562), Saudi Arabia (298), Canada (252) -3
France (504), Burundi (217) -3 , Canada (207) -3 , U.S.A. (199), Norway (85)
Portugal (581), Cuba (34), France (23), Morocco (9), U.S.A. (8)
France (8,766), U.S.A. (757), Morocco (530), Canada (319) -3 , Germany (254)
United Kingdom (201), Australia (181), New Zealand (31), India (26) -1, France (26)
U.S.A. (322), United Kingdom (282), Germany (65), Moldova (64), Gambia (43) -5
Malaysia (176) -2 , Saudi Arabia (147), United Kingdom (97), Pakistan (80) -2 , Italy (73)
U.S.A. (1,775), Australia (1,578), United Kingdom (1,531), Cuba (344), Portugal (176)
South Africa (2,423), U.S.A. (100), United Kingdom (70), Bahrain (32), Lesotho (17) -2
France (1,733), U.S.A. (537), Germany (407), Canada (130) -3 , Morocco (123)
United Kingdom (890), U.S.A. (660), Germany (121), Australia (90), Norway (82)
U.S.A. (1,391), United Kingdom (986), South Africa (395), Australia (130), Canada (113) -3
South Africa (1,311), U.S.A. (829), United Kingdom (547), Australia (418), Namibia (228) -2
South Africa (9,507), United Kingdom (2,658), U.S.A. (1,770), Australia (1,279), Namibia (71) -2
... ... ...
... ... ...
116 -2 -4,414 -2 -55.7 -2
... ... ...
1,226 -2,945 -6.6
... ... ...
... ... ...
75 -1 -7,178 -1 -42.6 -1
... ... ...
1,026 -2 -5,815 -2 ...
167 ** -1,431 ** -13.3 **
... ... ...
... ... ...
. -688 ...
... ... ...
. -542 ...
... ... ...
... ... ...
50,449 44,060 6.0
... ... ...
... ... ...
... ... ...
275 -1 -3,627 -1 -7.1 -1
... ... ...
... ... ...
Please refer to the Reader’s Guide for further information regarding the data and symbols used in each table.
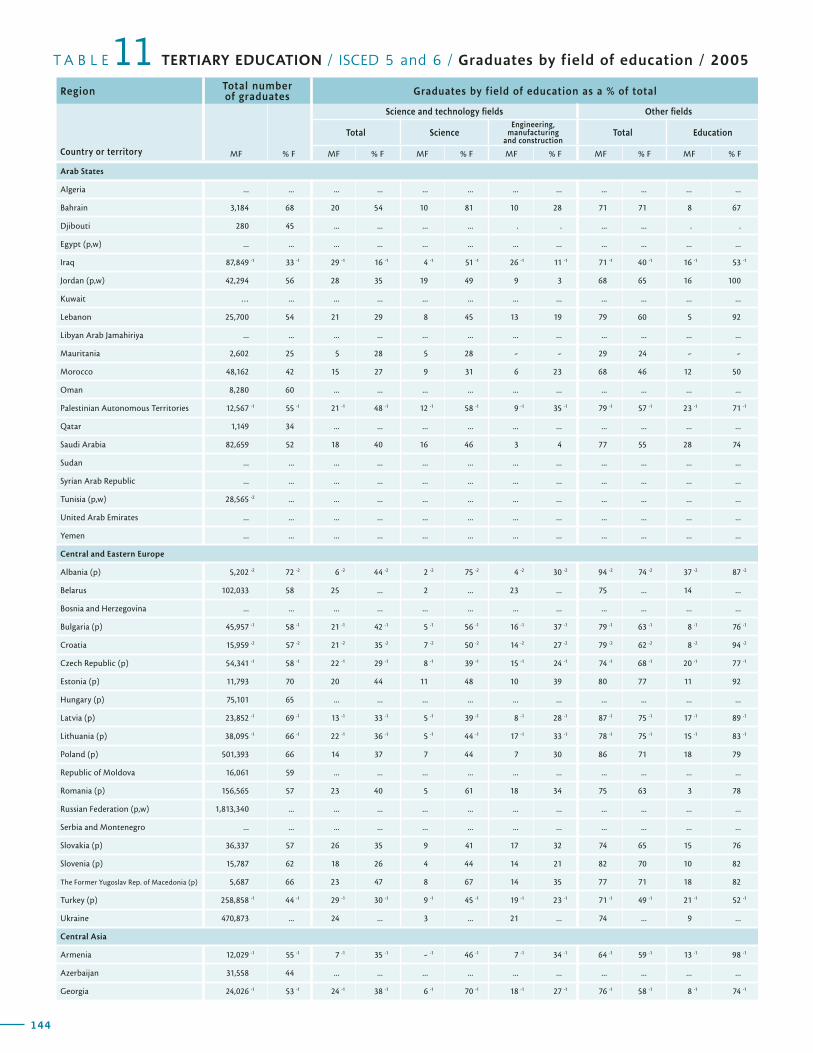
144
T A B L E TERTIARY EDUCATION / ISCED 5 and 6 / Graduates by field of education / 200511Region Total number
of graduates Graduates by field of education as a % of total
Country or territory MF % F
Science and technology fields Other fields
Total ScienceEngineering,
manufacturing and construction
Total Education
MF % F MF % F MF % F MF % F MF % F
145
G L O B A L E D U C A T I O N D I G E S T 2 0 0 7 C O M P A R I N G E D U C A T I O N S T A T I S T I C S A R O U N D T H E W O R L D
Graduates by field of education as a % of total Region
Other fieldsNot known or unspecified
Country or territory
Humanities and arts Social science, business and law Agriculture Health and welfare Services
MF % F MF % F MF % F MF % F MF % F MF % F
Arab States
Algeria ... ... ... ... ... ... ... ... ... ... ... ...
Bahrain 3,184 68 20 54 10 81 10 28 71 71 8 67
Djibouti 280 45 ... ... ... ... . . ... ... . .
Egypt (p,w) ... ... ... ... ... ... ... ... ... ... ... ...
Iraq 87,849 -1 33 -1 29 -1 16 -1 4 -1 51 -1 26 -1 11 -1 71 -1 40 -1 16 -1 53 -1
Jordan (p,w) 42,294 56 28 35 19 49 9 3 68 65 16 100
Kuwait … ... ... ... ... ... ... ... ... ... ... ...
Lebanon 25,700 54 21 29 8 45 13 19 79 60 5 92
Libyan Arab Jamahiriya ... ... ... ... ... ... ... ... ... ... ... ...
Mauritania 2,602 25 5 28 5 28 - - 29 24 - -
Morocco 48,162 42 15 27 9 31 6 23 68 46 12 50
Oman 8,280 60 ... ... ... ... ... ... ... ... ... ...
Palestinian Autonomous Territories 12,567 -1 55 -1 21 -1 48 -1 12 -1 58 -1 9 -1 35 -1 79 -1 57 -1 23 -1 71 -1
Qatar 1,149 34 ... ... ... ... ... ... ... ... ... ...
Saudi Arabia 82,659 52 18 40 16 46 3 4 77 55 28 74
Sudan ... ... ... ... ... ... ... ... ... ... ... ...
Syrian Arab Republic ... ... ... ... ... ... ... ... ... ... ... ...
Tunisia (p,w) 28,565 -2 ... ... ... ... ... ... ... ... ... ... ...
United Arab Emirates ... ... ... ... ... ... ... ... ... ... ... ...
Yemen ... ... ... ... ... ... ... ... ... ... ... ...
Central and Eastern Europe
Albania (p) 5,202 -2 72 -2 6 -2 44 -2 2 -2 75 -2 4 -2 30 -2 94 -2 74 -2 37 -2 87 -2
Belarus 102,033 58 25 ... 2 ... 23 ... 75 ... 14 ...
Bosnia and Herzegovina ... ... ... ... ... ... ... ... ... ... ... ...
Bulgaria (p) 45,957 -1 58 -1 21 -1 42 -1 5 -1 56 -1 16 -1 37 -1 79 -1 63 -1 8 -1 76 -1
Croatia 15,959 -2 57 -2 21 -2 35 -2 7 -2 50 -2 14 -2 27 -2 79 -2 62 -2 8 -2 94 -2
Czech Republic (p) 54,341 -1 58 -1 22 -1 29 -1 8 -1 39 -1 15 -1 24 -1 74 -1 68 -1 20 -1 77 -1
Estonia (p) 11,793 70 20 44 11 48 10 39 80 77 11 92
Hungary (p) 75,101 65 ... ... ... ... ... ... ... ... ... ...
Latvia (p) 23,852 -1 69 -1 13 -1 33 -1 5 -1 39 -1 8 -1 28 -1 87 -1 75 -1 17 -1 89 -1
Lithuania (p) 38,095 -1 66 -1 22 -1 36 -1 5 -1 44 -1 17 -1 33 -1 78 -1 75 -1 15 -1 83 -1
Poland (p) 501,393 66 14 37 7 44 7 30 86 71 18 79
Republic of Moldova 16,061 59 ... ... ... ... ... ... ... ... ... ...
Romania (p) 156,565 57 23 40 5 61 18 34 75 63 3 78
Russian Federation (p,w) 1,813,340 ... ... ... ... ... ... ... ... ... ... ...
Serbia and Montenegro ... ... ... ... ... ... ... ... ... ... ... ...
Slovakia (p) 36,337 57 26 35 9 41 17 32 74 65 15 76
Slovenia (p) 15,787 62 18 26 4 44 14 21 82 70 10 82
The Former Yugoslav Rep. of Macedonia (p) 5,687 66 23 47 8 67 14 35 77 71 18 82
Turkey (p) 258,858 -1 44 -1 29 -1 30 -1 9 -1 45 -1 19 -1 23 -1 71 -1 49 -1 21 -1 52 -1
Ukraine 470,873 ... 24 ... 3 ... 21 ... 74 ... 9 ...
Central Asia
Armenia 12,029 -1 55 -1 7 -1 35 -1 - -1 46 -1 7 -1 34 -1 64 -1 59 -1 13 -1 98 -1
Azerbaijan 31,558 44 ... ... ... ... ... ... ... ... ... ...
Georgia 24,026 -1 53 -1 24 -1 38 -1 6 -1 70 -1 18 -1 27 -1 76 -1 58 -1 8 -1 74 -1

144
T A B L E TERTIARY EDUCATION / ISCED 5 and 6 / Graduates by field of education / 200511Region Total number
of graduates Graduates by field of education as a % of total
Country or territory MF % F
Science and technology fields Other fields
Total ScienceEngineering,
manufacturing and construction
Total Education
MF % F MF % F MF % F MF % F MF % F
145
G L O B A L E D U C A T I O N D I G E S T 2 0 0 7 C O M P A R I N G E D U C A T I O N S T A T I S T I C S A R O U N D T H E W O R L D
Graduates by field of education as a % of total Region
Other fieldsNot known or unspecified
Country or territory
Humanities and arts Social science, business and law Agriculture Health and welfare Services
MF % F MF % F MF % F MF % F MF % F MF % F
Arab States
... ... ... ... ... ... ... ... ... ... ... ... Algeria
9 85 40 64 . . 10 85 5 76 9 77 Bahrain
... ... ... ... . . . . ... ... ... ... Djibouti
... ... ... ... ... ... ... ... ... ... ... ... Egypt (p,w)
10 -1 42 -1 20 -1 35 -1 3 -1 26 -1 10 -1 37 -1 10 -1 37 -1 - -1 - -1 Iraq
10 90 28 44 2 60 11 48 - 63 4 57 Jordan (p,w)
... ... ... ... ... ... ... ... ... ... ... ... Kuwait
16 72 44 53 - 43 11 67 3 35 - - Lebanon
... ... ... ... ... ... ... ... ... ... ... ... Libyan Arab Jamahiriya
12 25 17 23 - - - - - - 66 25 Mauritania
18 53 31 39 1 19 5 59 1 56 17 41 Morocco
... ... ... ... ... ... ... ... ... ... ... ... Oman
17 -1 55 -1 32 -1 47 -1 - -1 22 -1 7 -1 63 -1 - -1 - -1 - -1 - -1 Palestinian Autonomous Territories
... ... ... ... ... ... ... ... ... ... ... ... Qatar
30 46 13 40 - - 5 45 - 100 5 57 Saudi Arabia
... ... ... ... ... ... ... ... ... ... ... ... Sudan
... ... ... ... ... ... ... ... ... ... ... ... Syrian Arab Republic
... ... ... ... ... ... ... ... ... ... 100 -2 ... Tunisia (p,w)
... ... ... ... ... ... ... ... ... ... ... ... United Arab Emirates
... ... ... ... ... ... ... ... ... ... ... ... Yemen
Central and Eastern Europe
11 -2 77 -2 25 -2 66 -2 8 -2 47 -2 11 -2 74 -2 3 -2 38 -2 - -2 - -2 Albania (p)
5 ... 37 ... 9 ... 7 ... 3 ... - ... Belarus
... ... ... ... ... ... ... ... ... ... ... ... Bosnia and Herzegovina
8 -1 65 -1 48 -1 62 -1 2 -1 43 -1 6 -1 70 -1 7 -1 49 -1 - -1 - -1 Bulgaria (p)
11 -2 75 -2 31 -2 66 -2 4 -2 45 -2 9 -2 74 -2 15 -2 26 -2 - -2 - -2 Croatia
8 -1 62 -1 28 -1 63 -1 3 -1 55 -1 11 -1 80 -1 4 -1 47 -1 3 -1 32 -1 Czech Republic (p)
11 82 37 72 2 56 11 92 8 59 - - Estonia (p)
... ... ... ... ... ... ... ... ... ... ... ... Hungary (p)
6 -1 82 -1 55 -1 71 -1 1 -1 49 -1 4 -1 85 -1 4 -1 45 -1 - -1 - -1 Latvia (p)
7 -1 77 -1 39 -1 72 -1 3 -1 55 -1 11 -1 84 -1 3 -1 54 -1 - -1 - -1 Lithuania (p)
7 77 46 69 2 60 7 69 6 56 - - Poland (p)
... ... ... ... ... ... ... ... ... ... ... ... Republic of Moldova
10 68 46 63 2 40 11 62 3 52 2 43 Romania (p)
... ... ... ... ... ... ... ... ... ... ... ... Russian Federation (p,w)
... ... ... ... ... ... ... ... ... ... ... ... Serbia and Montenegro
6 55 29 62 4 42 14 80 7 41 - - Slovakia (p)
5 73 45 68 2 56 11 85 7 43 - - Slovenia (p)
13 75 27 68 4 38 10 77 6 53 - - The Former Yugoslav Rep. of Macedonia (p)
7 -1 59 -1 27 -1 48 -1 4 -1 39 -1 8 -1 62 -1 6 -1 26 -1 - -1 - -1 Turkey (p)
5 ... 42 ... 5 ... 8 ... 5 ... 2 ... Ukraine
Central Asia
3 -1 65 -1 34 -1 48 -1 2 -1 45 -1 9 -1 56 -1 3 -1 12 -1 29 -1 52 -1 Armenia
... ... ... ... ... ... ... ... ... ... ... ... Azerbaijan
23 -1 78 -1 32 -1 40 -1 3 -1 26 -1 10 -1 74 -1 2 -1 19 -1 - -1 20 -1 Georgia
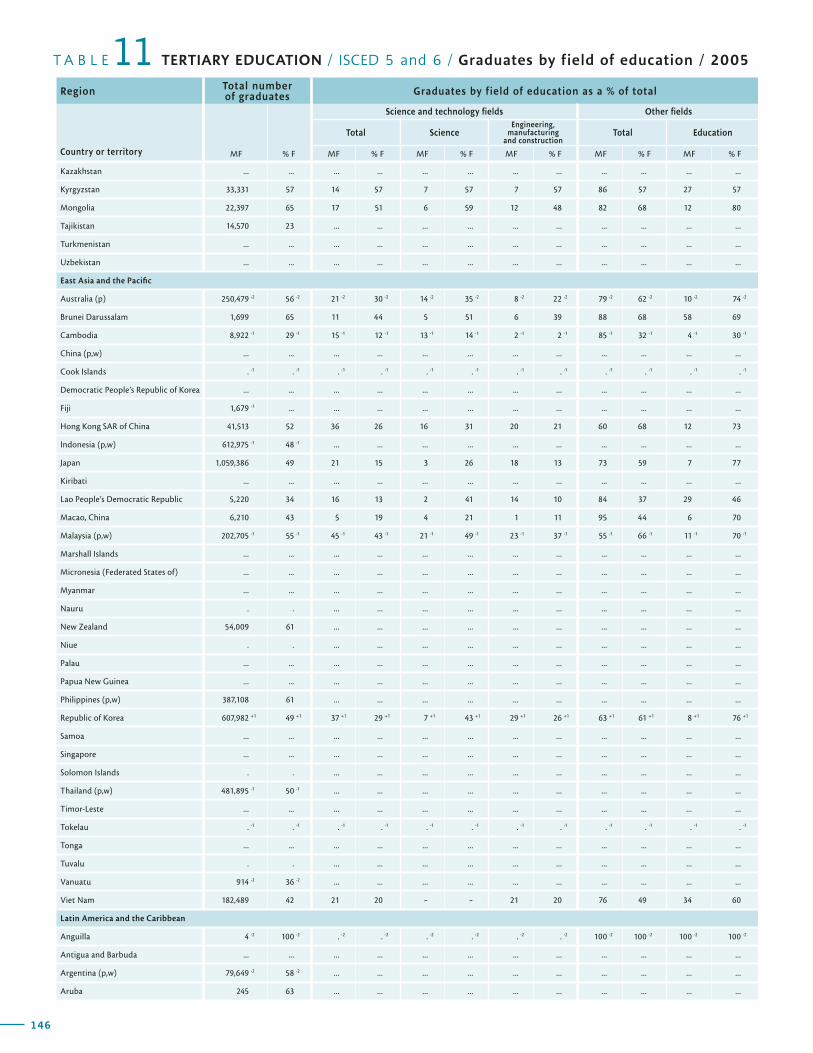
146
T A B L E TERTIARY EDUCATION / ISCED 5 and 6 / Graduates by field of education / 200511Region Total number
of graduates Graduates by field of education as a % of total
Country or territory MF % F
Science and technology fields Other fields
Total ScienceEngineering,
manufacturing and construction
Total Education
MF % F MF % F MF % F MF % F MF % F
147
G L O B A L E D U C A T I O N D I G E S T 2 0 0 7 C O M P A R I N G E D U C A T I O N S T A T I S T I C S A R O U N D T H E W O R L D
Graduates by field of education as a % of total Region
Other fieldsNot known or unspecified
Country or territory
Humanities and arts Social science, business and law Agriculture Health and welfare Services
MF % F MF % F MF % F MF % F MF % F MF % F
Kazakhstan ... ... ... ... ... ... ... ... ... ... ... ...
Kyrgyzstan 33,331 57 14 57 7 57 7 57 86 57 27 57
Mongolia 22,397 65 17 51 6 59 12 48 82 68 12 80
Tajikistan 14,570 23 ... ... ... ... ... ... ... ... ... ...
Turkmenistan ... ... ... ... ... ... ... ... ... ... ... ...
Uzbekistan ... ... ... ... ... ... ... ... ... ... ... ...
East Asia and the Pacific
Australia (p) 250,479 -2 56 -2 21 -2 30 -2 14 -2 35 -2 8 -2 22 -2 79 -2 62 -2 10 -2 74 -2
Brunei Darussalam 1,699 65 11 44 5 51 6 39 88 68 58 69
Cambodia 8,922 -1 29 -1 15 -1 12 -1 13 -1 14 -1 2 -1 2 -1 85 -1 32 -1 4 -1 30 -1
China (p,w) ... ... ... ... ... ... ... ... ... ... ... ...
Cook Islands . -1 . -1 . -1 . -1 . -1 . -1 . -1 . -1 . -1 . -1 . -1 . -1
Democratic People’s Republic of Korea ... ... ... ... ... ... ... ... ... ... ... ...
Fiji 1,679 -1 ... ... ... ... ... ... ... ... ... ... ...
Hong Kong SAR of China 41,513 52 36 26 16 31 20 21 60 68 12 73
Indonesia (p,w) 612,975 -1 48 -1 ... ... ... ... ... ... ... ... ... ...
Japan 1,059,386 49 21 15 3 26 18 13 73 59 7 77
Kiribati ... ... ... ... ... ... ... ... ... ... ... ...
Lao People’s Democratic Republic 5,220 34 16 13 2 41 14 10 84 37 29 46
Macao, China 6,210 43 5 19 4 21 1 11 95 44 6 70
Malaysia (p,w) 202,705 -1 55 -1 45 -1 43 -1 21 -1 49 -1 23 -1 37 -1 55 -1 66 -1 11 -1 70 -1
Marshall Islands ... ... ... ... ... ... ... ... ... ... ... ...
Micronesia (Federated States of) ... ... ... ... ... ... ... ... ... ... ... ...
Myanmar ... ... ... ... ... ... ... ... ... ... ... ...
Nauru . . ... ... ... ... ... ... ... ... ... ...
New Zealand 54,009 61 ... ... ... ... ... ... ... ... ... ...
Niue . . ... ... ... ... ... ... ... ... ... ...
Palau ... ... ... ... ... ... ... ... ... ... ... ...
Papua New Guinea ... ... ... ... ... ... ... ... ... ... ... ...
Philippines (p,w) 387,108 61 ... ... ... ... ... ... ... ... ... ...
Republic of Korea 607,982 +1 49 +1 37 +1 29 +1 7 +1 43 +1 29 +1 26 +1 63 +1 61 +1 8 +1 76 +1
Samoa ... ... ... ... ... ... ... ... ... ... ... ...
Singapore ... ... ... ... ... ... ... ... ... ... ... ...
Solomon Islands . . ... ... ... ... ... ... ... ... ... ...
Thailand (p,w) 481,895 -1 50 -1 ... ... ... ... ... ... ... ... ... ...
Timor-Leste ... ... ... ... ... ... ... ... ... ... ... ...
Tokelau . -1 . -1 . -1 . -1 . -1 . -1 . -1 . -1 . -1 . -1 . -1 . -1
Tonga ... ... ... ... ... ... ... ... ... ... ... ...
Tuvalu . . ... ... ... ... ... ... ... ... ... ...
Vanuatu 914 -2 36 -2 ... ... ... ... ... ... ... ... ... ...
Viet Nam 182,489 42 21 20 - - 21 20 76 49 34 60
Latin America and the Caribbean
Anguilla 4 -2 100 -2 . -2 . -2 . -2 . -2 . -2 . -2 100 -2 100 -2 100 -2 100 -2
Antigua and Barbuda ... ... ... ... ... ... ... ... ... ... ... ...
Argentina (p,w) 79,649 -2 58 -2 ... ... ... ... ... ... ... ... ... ...
Aruba 245 63 ... ... ... ... ... ... ... ... ... ...
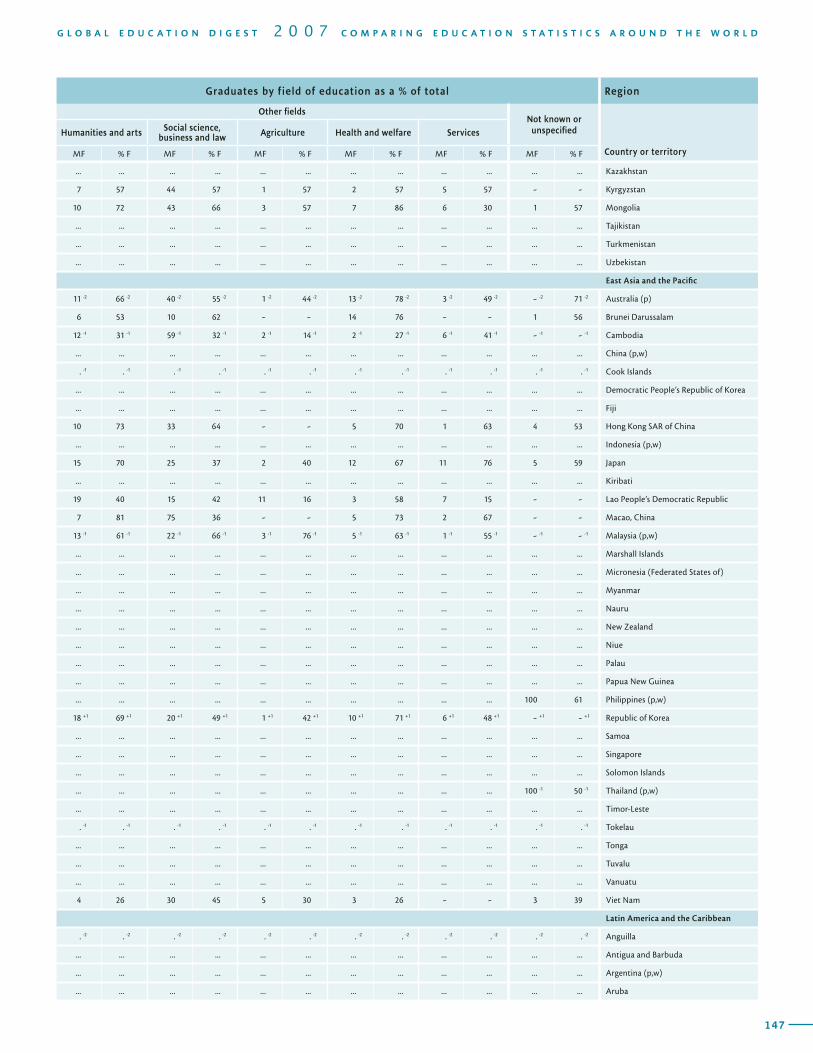
146
T A B L E TERTIARY EDUCATION / ISCED 5 and 6 / Graduates by field of education / 200511Region Total number
of graduates Graduates by field of education as a % of total
Country or territory MF % F
Science and technology fields Other fields
Total ScienceEngineering,
manufacturing and construction
Total Education
MF % F MF % F MF % F MF % F MF % F
147
G L O B A L E D U C A T I O N D I G E S T 2 0 0 7 C O M P A R I N G E D U C A T I O N S T A T I S T I C S A R O U N D T H E W O R L D
Graduates by field of education as a % of total Region
Other fieldsNot known or unspecified
Country or territory
Humanities and arts Social science, business and law Agriculture Health and welfare Services
MF % F MF % F MF % F MF % F MF % F MF % F
... ... ... ... ... ... ... ... ... ... ... ... Kazakhstan
7 57 44 57 1 57 2 57 5 57 - - Kyrgyzstan
10 72 43 66 3 57 7 86 6 30 1 57 Mongolia
... ... ... ... ... ... ... ... ... ... ... ... Tajikistan
... ... ... ... ... ... ... ... ... ... ... ... Turkmenistan
... ... ... ... ... ... ... ... ... ... ... ... Uzbekistan
East Asia and the Pacific
11 -2 66 -2 40 -2 55 -2 1 -2 44 -2 13 -2 78 -2 3 -2 49 -2 - -2 71 -2 Australia (p)
6 53 10 62 - - 14 76 - - 1 56 Brunei Darussalam
12 -1 31 -1 59 -1 32 -1 2 -1 14 -1 2 -1 27 -1 6 -1 41 -1 - -1 - -1 Cambodia
... ... ... ... ... ... ... ... ... ... ... ... China (p,w)
. -1 . -1 . -1 . -1 . -1 . -1 . -1 . -1 . -1 . -1 . -1 . -1 Cook Islands
... ... ... ... ... ... ... ... ... ... ... ... Democratic People’s Republic of Korea
... ... ... ... ... ... ... ... ... ... ... ... Fiji
10 73 33 64 - - 5 70 1 63 4 53 Hong Kong SAR of China
... ... ... ... ... ... ... ... ... ... ... ... Indonesia (p,w)
15 70 25 37 2 40 12 67 11 76 5 59 Japan
... ... ... ... ... ... ... ... ... ... ... ... Kiribati
19 40 15 42 11 16 3 58 7 15 - - Lao People’s Democratic Republic
7 81 75 36 - - 5 73 2 67 - - Macao, China
13 -1 61 -1 22 -1 66 -1 3 -1 76 -1 5 -1 63 -1 1 -1 55 -1 - -1 - -1 Malaysia (p,w)
... ... ... ... ... ... ... ... ... ... ... ... Marshall Islands
... ... ... ... ... ... ... ... ... ... ... ... Micronesia (Federated States of)
... ... ... ... ... ... ... ... ... ... ... ... Myanmar
... ... ... ... ... ... ... ... ... ... ... ... Nauru
... ... ... ... ... ... ... ... ... ... ... ... New Zealand
... ... ... ... ... ... ... ... ... ... ... ... Niue
... ... ... ... ... ... ... ... ... ... ... ... Palau
... ... ... ... ... ... ... ... ... ... ... ... Papua New Guinea
... ... ... ... ... ... ... ... ... ... 100 61 Philippines (p,w)
18 +1 69 +1 20 +1 49 +1 1 +1 42 +1 10 +1 71 +1 6 +1 48 +1 - +1 - +1 Republic of Korea
... ... ... ... ... ... ... ... ... ... ... ... Samoa
... ... ... ... ... ... ... ... ... ... ... ... Singapore
... ... ... ... ... ... ... ... ... ... ... ... Solomon Islands
... ... ... ... ... ... ... ... ... ... 100 -1 50 -1 Thailand (p,w)
... ... ... ... ... ... ... ... ... ... ... ... Timor-Leste
. -1 . -1 . -1 . -1 . -1 . -1 . -1 . -1 . -1 . -1 . -1 . -1 Tokelau
... ... ... ... ... ... ... ... ... ... ... ... Tonga
... ... ... ... ... ... ... ... ... ... ... ... Tuvalu
... ... ... ... ... ... ... ... ... ... ... ... Vanuatu
4 26 30 45 5 30 3 26 - - 3 39 Viet Nam
Latin America and the Caribbean
. -2 . -2 . -2 . -2 . -2 . -2 . -2 . -2 . -2 . -2 . -2 . -2 Anguilla
... ... ... ... ... ... ... ... ... ... ... ... Antigua and Barbuda
... ... ... ... ... ... ... ... ... ... ... ... Argentina (p,w)
... ... ... ... ... ... ... ... ... ... ... ... Aruba
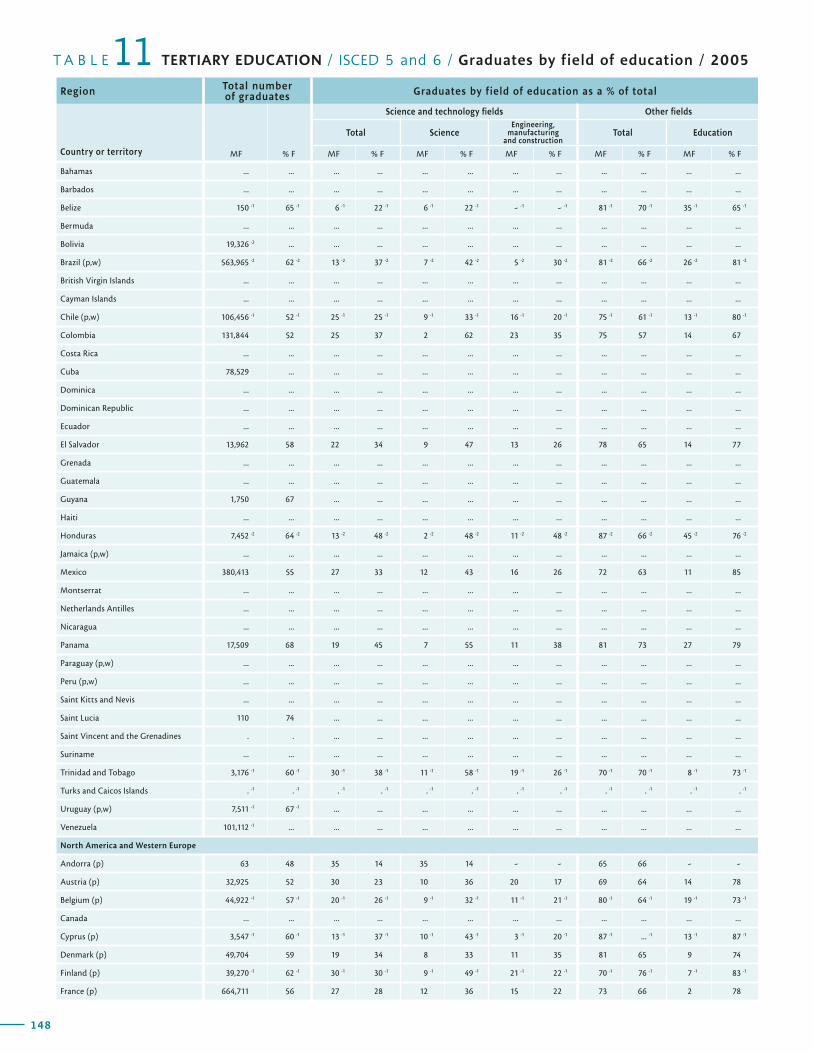
148
T A B L E TERTIARY EDUCATION / ISCED 5 and 6 / Graduates by field of education / 200511Region Total number
of graduates Graduates by field of education as a % of total
Country or territory MF % F
Science and technology fields Other fields
Total ScienceEngineering,
manufacturing and construction
Total Education
MF % F MF % F MF % F MF % F MF % F
149
G L O B A L E D U C A T I O N D I G E S T 2 0 0 7 C O M P A R I N G E D U C A T I O N S T A T I S T I C S A R O U N D T H E W O R L D
Graduates by field of education as a % of total Region
Other fieldsNot known or unspecified
Country or territory
Humanities and arts Social science, business and law Agriculture Health and welfare Services
MF % F MF % F MF % F MF % F MF % F MF % F
Bahamas ... ... ... ... ... ... ... ... ... ... ... ...
Barbados ... ... ... ... ... ... ... ... ... ... ... ...
Belize 150 -1 65 -1 6 -1 22 -1 6 -1 22 -1 - -1 - -1 81 -1 70 -1 35 -1 65 -1
Bermuda ... ... ... ... ... ... ... ... ... ... ... ...
Bolivia 19,326 -2 ... ... ... ... ... ... ... ... ... ... ...
Brazil (p,w) 563,965 -2 62 -2 13 -2 37 -2 7 -2 42 -2 5 -2 30 -2 81 -2 66 -2 26 -2 81 -2
British Virgin Islands ... ... ... ... ... ... ... ... ... ... ... ...
Cayman Islands ... ... ... ... ... ... ... ... ... ... ... ...
Chile (p,w) 106,456 -1 52 -1 25 -1 25 -1 9 -1 33 -1 16 -1 20 -1 75 -1 61 -1 13 -1 80 -1
Colombia 131,844 52 25 37 2 62 23 35 75 57 14 67
Costa Rica ... ... ... ... ... ... ... ... ... ... ... ...
Cuba 78,529 ... ... ... ... ... ... ... ... ... ... ...
Dominica ... ... ... ... ... ... ... ... ... ... ... ...
Dominican Republic ... ... ... ... ... ... ... ... ... ... ... ...
Ecuador ... ... ... ... ... ... ... ... ... ... ... ...
El Salvador 13,962 58 22 34 9 47 13 26 78 65 14 77
Grenada ... ... ... ... ... ... ... ... ... ... ... ...
Guatemala ... ... ... ... ... ... ... ... ... ... ... ...
Guyana 1,750 67 ... ... ... ... ... ... ... ... ... ...
Haiti ... ... ... ... ... ... ... ... ... ... ... ...
Honduras 7,452 -2 64 -2 13 -2 48 -2 2 -2 48 -2 11 -2 48 -2 87 -2 66 -2 45 -2 76 -2
Jamaica (p,w) ... ... ... ... ... ... ... ... ... ... ... ...
Mexico 380,413 55 27 33 12 43 16 26 72 63 11 85
Montserrat ... ... ... ... ... ... ... ... ... ... ... ...
Netherlands Antilles ... ... ... ... ... ... ... ... ... ... ... ...
Nicaragua ... ... ... ... ... ... ... ... ... ... ... ...
Panama 17,509 68 19 45 7 55 11 38 81 73 27 79
Paraguay (p,w) ... ... ... ... ... ... ... ... ... ... ... ...
Peru (p,w) ... ... ... ... ... ... ... ... ... ... ... ...
Saint Kitts and Nevis ... ... ... ... ... ... ... ... ... ... ... ...
Saint Lucia 110 74 ... ... ... ... ... ... ... ... ... ...
Saint Vincent and the Grenadines . . ... ... ... ... ... ... ... ... ... ...
Suriname ... ... ... ... ... ... ... ... ... ... ... ...
Trinidad and Tobago 3,176 -1 60 -1 30 -1 38 -1 11 -1 58 -1 19 -1 26 -1 70 -1 70 -1 8 -1 73 -1
Turks and Caicos Islands . -1 . -1 . -1 . -1 . -1 . -1 . -1 . -1 . -1 . -1 . -1 . -1
Uruguay (p,w) 7,511 -1 67 -1 ... ... ... ... ... ... ... ... ... ...
Venezuela 101,112 -1 ... ... ... ... ... ... ... ... ... ... ...
North America and Western Europe
Andorra (p) 63 48 35 14 35 14 - - 65 66 - -
Austria (p) 32,925 52 30 23 10 36 20 17 69 64 14 78
Belgium (p) 44,922 -1 57 -1 20 -1 26 -1 9 -1 32 -1 11 -1 21 -1 80 -1 64 -1 19 -1 73 -1
Canada ... ... ... ... ... ... ... ... ... ... ... ...
Cyprus (p) 3,547 -1 60 -1 13 -1 37 -1 10 -1 43 -1 3 -1 20 -1 87 -1 ... -1 13 -1 87 -1
Denmark (p) 49,704 59 19 34 8 33 11 35 81 65 9 74
Finland (p) 39,270 -1 62 -1 30 -1 30 -1 9 -1 49 -1 21 -1 22 -1 70 -1 76 -1 7 -1 83 -1
France (p) 664,711 56 27 28 12 36 15 22 73 66 2 78

148
T A B L E TERTIARY EDUCATION / ISCED 5 and 6 / Graduates by field of education / 200511Region Total number
of graduates Graduates by field of education as a % of total
Country or territory MF % F
Science and technology fields Other fields
Total ScienceEngineering,
manufacturing and construction
Total Education
MF % F MF % F MF % F MF % F MF % F
149
G L O B A L E D U C A T I O N D I G E S T 2 0 0 7 C O M P A R I N G E D U C A T I O N S T A T I S T I C S A R O U N D T H E W O R L D
Graduates by field of education as a % of total Region
Other fieldsNot known or unspecified
Country or territory
Humanities and arts Social science, business and law Agriculture Health and welfare Services
MF % F MF % F MF % F MF % F MF % F MF % F
... ... ... ... ... ... ... ... ... ... ... ... Bahamas
... ... ... ... ... ... ... ... ... ... ... ... Barbados
- -1 - -1 45 -1 72 -1 - -1 - -1 2 -1 100 -1 - -1 - -1 13 -1 53 -1 Belize
... ... ... ... ... ... ... ... ... ... ... ... Bermuda
... ... ... ... ... ... ... ... ... ... ... ... Bolivia
3 -2 67 -2 36 -2 54 -2 2 -2 42 -2 12 -2 73 -2 2 -2 70 -2 6 -2 56 -2 Brazil (p,w)
... ... ... ... ... ... ... ... ... ... ... ... British Virgin Islands
... ... ... ... ... ... ... ... ... ... ... ... Cayman Islands
5 -1 59 -1 34 -1 54 -1 4 -1 38 -1 12 -1 77 -1 6 -1 47 -1 - -1 - -1 Chile (p,w)
3 51 48 52 1 37 9 73 - - - - Colombia
... ... ... ... ... ... ... ... ... ... ... ... Costa Rica
... ... ... ... ... ... ... ... ... ... ... ... Cuba
... ... ... ... ... ... ... ... ... ... ... ... Dominica
... ... ... ... ... ... ... ... ... ... ... ... Dominican Republic
... ... ... ... ... ... ... ... ... ... ... ... Ecuador
2 67 44 58 1 27 17 75 . . . . El Salvador
... ... ... ... ... ... ... ... ... ... ... ... Grenada
... ... ... ... ... ... ... ... ... ... ... ... Guatemala
... ... ... ... ... ... ... ... ... ... ... ... Guyana
... ... ... ... ... ... ... ... ... ... ... ... Haiti
1 -2 30 -2 29 -2 59 -2 6 -2 29 -2 5 -2 70 -2 1 -2 78 -2 - -2 - -2 Honduras
... ... ... ... ... ... ... ... ... ... ... ... Jamaica (p,w)
4 58 44 59 2 33 8 64 3 61 1 56 Mexico
... ... ... ... ... ... ... ... ... ... ... ... Montserrat
... ... ... ... ... ... ... ... ... ... ... ... Netherlands Antilles
... ... ... ... ... ... ... ... ... ... ... ... Nicaragua
4 69 36 69 1 35 9 81 4 64 - - Panama
... ... ... ... ... ... ... ... ... ... ... ... Paraguay (p,w)
... ... ... ... ... ... ... ... ... ... ... ... Peru (p,w)
... ... ... ... ... ... ... ... ... ... ... ... Saint Kitts and Nevis
... ... ... ... ... ... ... ... ... ... ... ... Saint Lucia
... ... ... ... ... ... ... ... ... ... ... ... Saint Vincent and the Grenadines
... ... ... ... ... ... ... ... ... ... ... ... Suriname
7 -1 78 -1 34 -1 71 -1 3 -1 60 -1 12 -1 62 -1 6 -1 73 -1 ... ... Trinidad and Tobago
. -1 . -1 . -1 . -1 . -1 . -1 . -1 . -1 . -1 . -1 . -1 . -1 Turks and Caicos Islands
... ... ... ... ... ... ... ... ... ... 100 -1 67 -1 Uruguay (p,w)
... ... ... ... ... ... ... ... ... ... ... ... Venezuela
North America and Western Europe
- - 44 57 - - 21 85 - - - - Andorra (p)
9 64 30 58 3 40 10 69 3 65 - 31 Austria (p)
10 -1 62 -1 30 -1 54 -1 1 -1 52 -1 18 -1 77 -1 1 -1 42 -1 - -1 - -1 Belgium (p)
... ... ... ... ... ... ... ... ... ... ... ... Canada
8 -1 ... 38 -1 66 -1 1 -1 ... 5 -1 74 -1 22 -1 38 -1 ... ... Cyprus (p)
13 66 29 52 2 40 24 84 3 18 ... ... Denmark (p)
13 -1 74 -1 23 -1 71 -1 2 -1 50 -1 19 -1 85 -1 6 -1 72 -1 - -1 - -1 Finland (p)
12 72 42 64 1 50 12 71 4 49 - - France (p)
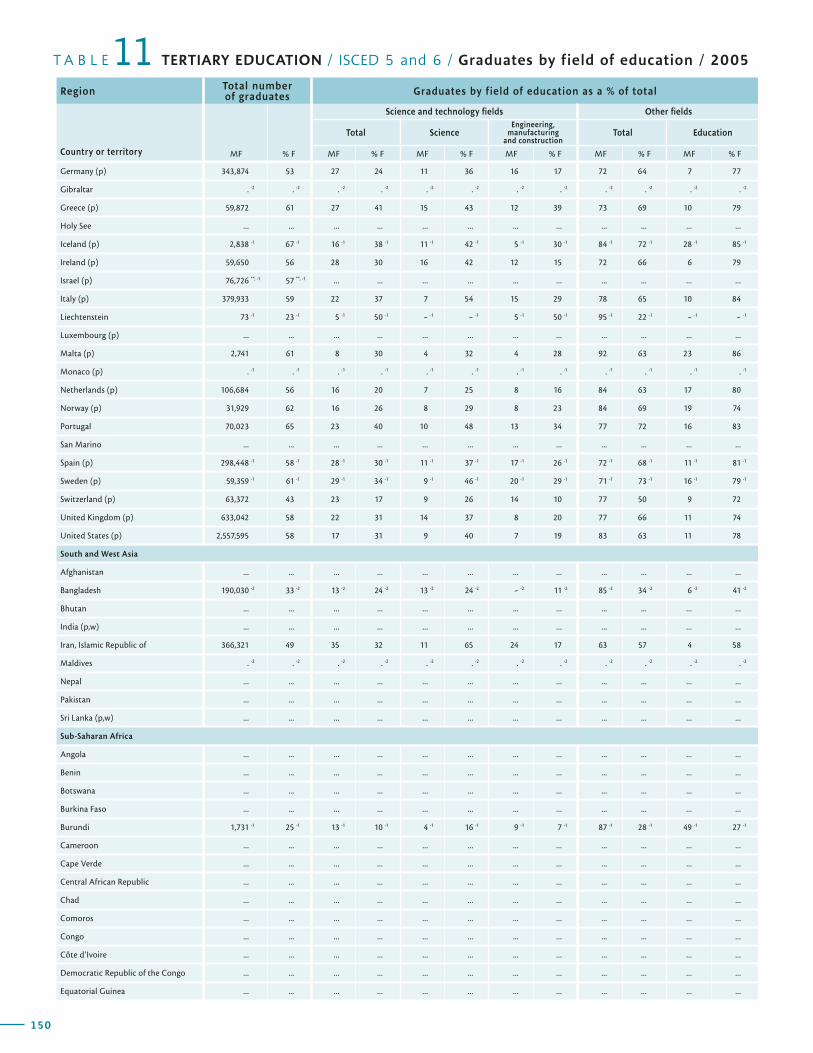
150
T A B L E TERTIARY EDUCATION / ISCED 5 and 6 / Graduates by field of education / 200511Region Total number
of graduates Graduates by field of education as a % of total
Country or territory MF % F
Science and technology fields Other fields
Total ScienceEngineering,
manufacturing and construction
Total Education
MF % F MF % F MF % F MF % F MF % F
151
G L O B A L E D U C A T I O N D I G E S T 2 0 0 7 C O M P A R I N G E D U C A T I O N S T A T I S T I C S A R O U N D T H E W O R L D
Graduates by field of education as a % of total Region
Other fieldsNot known or unspecified
Country or territory
Humanities and arts Social science, business and law Agriculture Health and welfare Services
MF % F MF % F MF % F MF % F MF % F MF % F
Germany (p) 343,874 53 27 24 11 36 16 17 72 64 7 77
Gibraltar . -2 . -2 . -2 . -2 . -2 . -2 . -2 . -2 . -2 . -2 . -2 . -2
Greece (p) 59,872 61 27 41 15 43 12 39 73 69 10 79
Holy See ... ... ... ... ... ... ... ... ... ... ... ...
Iceland (p) 2,838 -1 67 -1 16 -1 38 -1 11 -1 42 -1 5 -1 30 -1 84 -1 72 -1 28 -1 85 -1
Ireland (p) 59,650 56 28 30 16 42 12 15 72 66 6 79
Israel (p) 76,726 **, -1 57 **, -1 ... ... ... ... ... ... ... ... ... ...
Italy (p) 379,933 59 22 37 7 54 15 29 78 65 10 84
Liechtenstein 73 -1 23 -1 5 -1 50 -1 - -1 - -1 5 -1 50 -1 95 -1 22 -1 - -1 - -1
Luxembourg (p) ... ... ... ... ... ... ... ... ... ... ... ...
Malta (p) 2,741 61 8 30 4 32 4 28 92 63 23 86
Monaco (p) . -1 . -1 . -1 . -1 . -1 . -1 . -1 . -1 . -1 . -1 . -1 . -1
Netherlands (p) 106,684 56 16 20 7 25 8 16 84 63 17 80
Norway (p) 31,929 62 16 26 8 29 8 23 84 69 19 74
Portugal 70,023 65 23 40 10 48 13 34 77 72 16 83
San Marino ... ... ... ... ... ... ... ... ... ... ... ...
Spain (p) 298,448 -1 58 -1 28 -1 30 -1 11 -1 37 -1 17 -1 26 -1 72 -1 68 -1 11 -1 81 -1
Sweden (p) 59,359 -1 61 -1 29 -1 34 -1 9 -1 46 -1 20 -1 29 -1 71 -1 73 -1 16 -1 79 -1
Switzerland (p) 63,372 43 23 17 9 26 14 10 77 50 9 72
United Kingdom (p) 633,042 58 22 31 14 37 8 20 77 66 11 74
United States (p) 2,557,595 58 17 31 9 40 7 19 83 63 11 78
South and West Asia
Afghanistan ... ... ... ... ... ... ... ... ... ... ... ...
Bangladesh 190,030 -2 33 -2 13 -2 24 -2 13 -2 24 -2 - -2 11 -2 85 -2 34 -2 6 -2 41 -2
Bhutan ... ... ... ... ... ... ... ... ... ... ... ...
India (p,w) ... ... ... ... ... ... ... ... ... ... ... ...
Iran, Islamic Republic of 366,321 49 35 32 11 65 24 17 63 57 4 58
Maldives . -2 . -2 . -2 . -2 . -2 . -2 . -2 . -2 . -2 . -2 . -2 . -2
Nepal ... ... ... ... ... ... ... ... ... ... ... ...
Pakistan ... ... ... ... ... ... ... ... ... ... ... ...
Sri Lanka (p,w) ... ... ... ... ... ... ... ... ... ... ... ...
Sub-Saharan Africa
Angola ... ... ... ... ... ... ... ... ... ... ... ...
Benin ... ... ... ... ... ... ... ... ... ... ... ...
Botswana ... ... ... ... ... ... ... ... ... ... ... ...
Burkina Faso ... ... ... ... ... ... ... ... ... ... ... ...
Burundi 1,731 -1 25 -1 13 -1 10 -1 4 -1 16 -1 9 -1 7 -1 87 -1 28 -1 49 -1 27 -1
Cameroon ... ... ... ... ... ... ... ... ... ... ... ...
Cape Verde ... ... ... ... ... ... ... ... ... ... ... ...
Central African Republic ... ... ... ... ... ... ... ... ... ... ... ...
Chad ... ... ... ... ... ... ... ... ... ... ... ...
Comoros ... ... ... ... ... ... ... ... ... ... ... ...
Congo ... ... ... ... ... ... ... ... ... ... ... ...
Côte d’Ivoire ... ... ... ... ... ... ... ... ... ... ... ...
Democratic Republic of the Congo ... ... ... ... ... ... ... ... ... ... ... ...
Equatorial Guinea ... ... ... ... ... ... ... ... ... ... ... ...
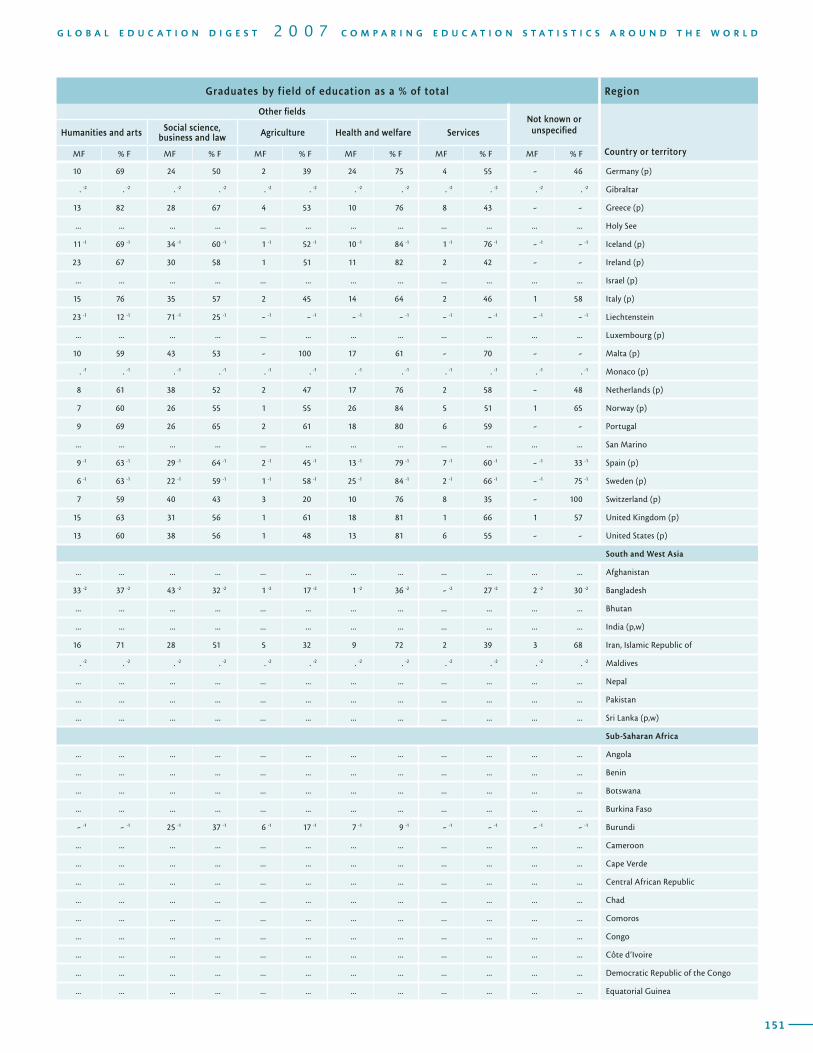
150
T A B L E TERTIARY EDUCATION / ISCED 5 and 6 / Graduates by field of education / 200511Region Total number
of graduates Graduates by field of education as a % of total
Country or territory MF % F
Science and technology fields Other fields
Total ScienceEngineering,
manufacturing and construction
Total Education
MF % F MF % F MF % F MF % F MF % F
151
G L O B A L E D U C A T I O N D I G E S T 2 0 0 7 C O M P A R I N G E D U C A T I O N S T A T I S T I C S A R O U N D T H E W O R L D
Graduates by field of education as a % of total Region
Other fieldsNot known or unspecified
Country or territory
Humanities and arts Social science, business and law Agriculture Health and welfare Services
MF % F MF % F MF % F MF % F MF % F MF % F
10 69 24 50 2 39 24 75 4 55 - 46 Germany (p)
. -2 . -2 . -2 . -2 . -2 . -2 . -2 . -2 . -2 . -2 . -2 . -2 Gibraltar
13 82 28 67 4 53 10 76 8 43 - - Greece (p)
... ... ... ... ... ... ... ... ... ... ... ... Holy See
11 -1 69 -1 34 -1 60 -1 1 -1 52 -1 10 -1 84 -1 1 -1 76 -1 - -1 - -1 Iceland (p)
23 67 30 58 1 51 11 82 2 42 - - Ireland (p)
... ... ... ... ... ... ... ... ... ... ... ... Israel (p)
15 76 35 57 2 45 14 64 2 46 1 58 Italy (p)
23 -1 12 -1 71 -1 25 -1 - -1 - -1 - -1 - -1 - -1 - -1 - -1 - -1 Liechtenstein
... ... ... ... ... ... ... ... ... ... ... ... Luxembourg (p)
10 59 43 53 - 100 17 61 - 70 - - Malta (p)
. -1 . -1 . -1 . -1 . -1 . -1 . -1 . -1 . -1 . -1 . -1 . -1 Monaco (p)
8 61 38 52 2 47 17 76 2 58 - 48 Netherlands (p)
7 60 26 55 1 55 26 84 5 51 1 65 Norway (p)
9 69 26 65 2 61 18 80 6 59 - - Portugal
... ... ... ... ... ... ... ... ... ... ... ... San Marino
9 -1 63 -1 29 -1 64 -1 2 -1 45 -1 13 -1 79 -1 7 -1 60 -1 - -1 33 -1 Spain (p)
6 -1 63 -1 22 -1 59 -1 1 -1 58 -1 25 -1 84 -1 2 -1 66 -1 - -1 75 -1 Sweden (p)
7 59 40 43 3 20 10 76 8 35 - 100 Switzerland (p)
15 63 31 56 1 61 18 81 1 66 1 57 United Kingdom (p)
13 60 38 56 1 48 13 81 6 55 - - United States (p)
South and West Asia
... ... ... ... ... ... ... ... ... ... ... ... Afghanistan
33 -2 37 -2 43 -2 32 -2 1 -2 17 -2 1 -2 36 -2 - -2 27 -2 2 -2 30 -2 Bangladesh
... ... ... ... ... ... ... ... ... ... ... ... Bhutan
... ... ... ... ... ... ... ... ... ... ... ... India (p,w)
16 71 28 51 5 32 9 72 2 39 3 68 Iran, Islamic Republic of
. -2 . -2 . -2 . -2 . -2 . -2 . -2 . -2 . -2 . -2 . -2 . -2 Maldives
... ... ... ... ... ... ... ... ... ... ... ... Nepal
... ... ... ... ... ... ... ... ... ... ... ... Pakistan
... ... ... ... ... ... ... ... ... ... ... ... Sri Lanka (p,w)
Sub-Saharan Africa
... ... ... ... ... ... ... ... ... ... ... ... Angola
... ... ... ... ... ... ... ... ... ... ... ... Benin
... ... ... ... ... ... ... ... ... ... ... ... Botswana
... ... ... ... ... ... ... ... ... ... ... ... Burkina Faso
- -1 - -1 25 -1 37 -1 6 -1 17 -1 7 -1 9 -1 - -1 - -1 - -1 - -1 Burundi
... ... ... ... ... ... ... ... ... ... ... ... Cameroon
... ... ... ... ... ... ... ... ... ... ... ... Cape Verde
... ... ... ... ... ... ... ... ... ... ... ... Central African Republic
... ... ... ... ... ... ... ... ... ... ... ... Chad
... ... ... ... ... ... ... ... ... ... ... ... Comoros
... ... ... ... ... ... ... ... ... ... ... ... Congo
... ... ... ... ... ... ... ... ... ... ... ... Côte d’Ivoire
... ... ... ... ... ... ... ... ... ... ... ... Democratic Republic of the Congo
... ... ... ... ... ... ... ... ... ... ... ... Equatorial Guinea
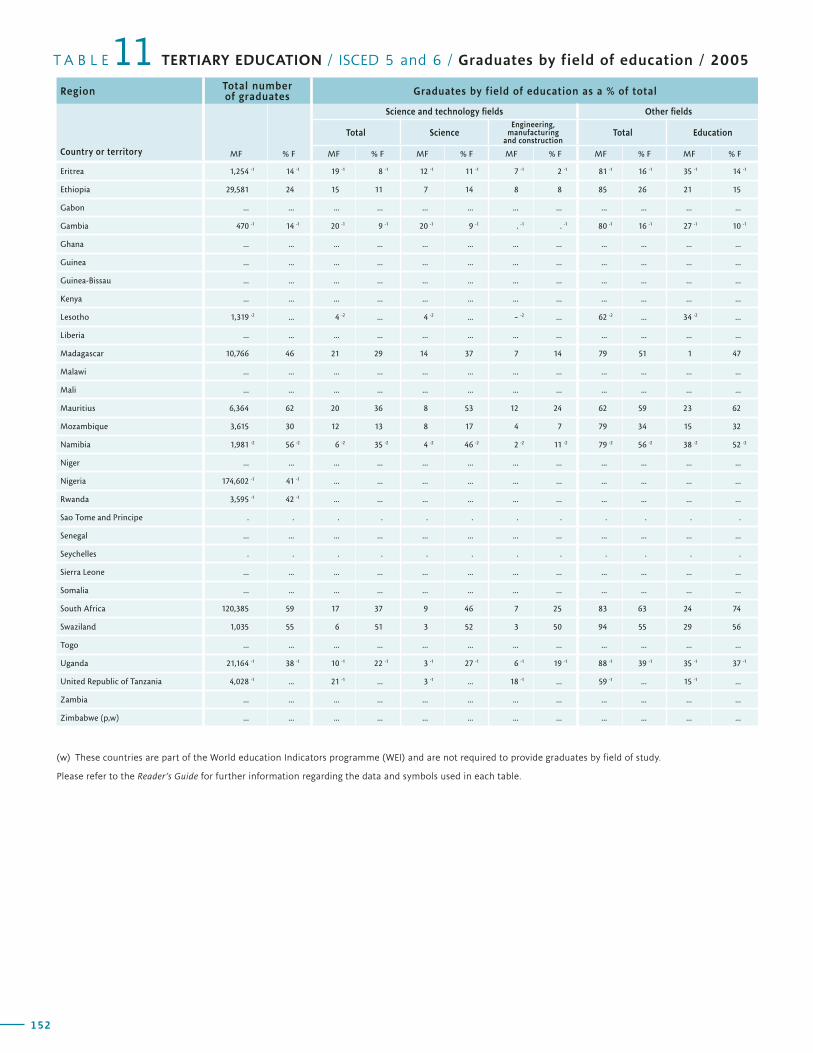
152
T A B L E TERTIARY EDUCATION / ISCED 5 and 6 / Graduates by field of education / 200511Region Total number
of graduates Graduates by field of education as a % of total
Country or territory MF % F
Science and technology fields Other fields
Total ScienceEngineering,
manufacturing and construction
Total Education
MF % F MF % F MF % F MF % F MF % F
153
G L O B A L E D U C A T I O N D I G E S T 2 0 0 7 C O M P A R I N G E D U C A T I O N S T A T I S T I C S A R O U N D T H E W O R L D
Graduates by field of education as a % of total Region
Other fieldsNot known or unspecified
Country or territory
Humanities and arts Social science, business and law Agriculture Health and welfare Services
MF % F MF % F MF % F MF % F MF % F MF % F
Eritrea 1,254 -1 14 -1 19 -1 8 -1 12 -1 11 -1 7 -1 2 -1 81 -1 16 -1 35 -1 14 -1
Ethiopia 29,581 24 15 11 7 14 8 8 85 26 21 15
Gabon ... ... ... ... ... ... ... ... ... ... ... ...
Gambia 470 -1 14 -1 20 -1 9 -1 20 -1 9 -1 . -1 . -1 80 -1 16 -1 27 -1 10 -1
Ghana ... ... ... ... ... ... ... ... ... ... ... ...
Guinea ... ... ... ... ... ... ... ... ... ... ... ...
Guinea-Bissau ... ... ... ... ... ... ... ... ... ... ... ...
Kenya ... ... ... ... ... ... ... ... ... ... ... ...
Lesotho 1,319 -2 ... 4 -2 ... 4 -2 ... - -2 ... 62 -2 ... 34 -2 ...
Liberia ... ... ... ... ... ... ... ... ... ... ... ...
Madagascar 10,766 46 21 29 14 37 7 14 79 51 1 47
Malawi ... ... ... ... ... ... ... ... ... ... ... ...
Mali ... ... ... ... ... ... ... ... ... ... ... ...
Mauritius 6,364 62 20 36 8 53 12 24 62 59 23 62
Mozambique 3,615 30 12 13 8 17 4 7 79 34 15 32
Namibia 1,981 -2 56 -2 6 -2 35 -2 4 -2 46 -2 2 -2 11 -2 79 -2 56 -2 38 -2 52 -2
Niger ... ... ... ... ... ... ... ... ... ... ... ...
Nigeria 174,602 -1 41 -1 ... ... ... ... ... ... ... ... ... ...
Rwanda 3,595 -1 42 -1 ... ... ... ... ... ... ... ... ... ...
Sao Tome and Principe . . . . . . . . . . . .
Senegal ... ... ... ... ... ... ... ... ... ... ... ...
Seychelles . . . . . . . . . . . .
Sierra Leone ... ... ... ... ... ... ... ... ... ... ... ...
Somalia ... ... ... ... ... ... ... ... ... ... ... ...
South Africa 120,385 59 17 37 9 46 7 25 83 63 24 74
Swaziland 1,035 55 6 51 3 52 3 50 94 55 29 56
Togo ... ... ... ... ... ... ... ... ... ... ... ...
Uganda 21,164 -1 38 -1 10 -1 22 -1 3 -1 27 -1 6 -1 19 -1 88 -1 39 -1 35 -1 37 -1
United Republic of Tanzania 4,028 -1 ... 21 -1 ... 3 -1 ... 18 -1 ... 59 -1 ... 15 -1 ...
Zambia ... ... ... ... ... ... ... ... ... ... ... ...
Zimbabwe (p,w) ... ... ... ... ... ... ... ... ... ... ... ...
(w) These countries are part of the World education Indicators programme (WEI) and are not required to provide graduates by field of study.
Please refer to the Reader’s Guide for further information regarding the data and symbols used in each table.
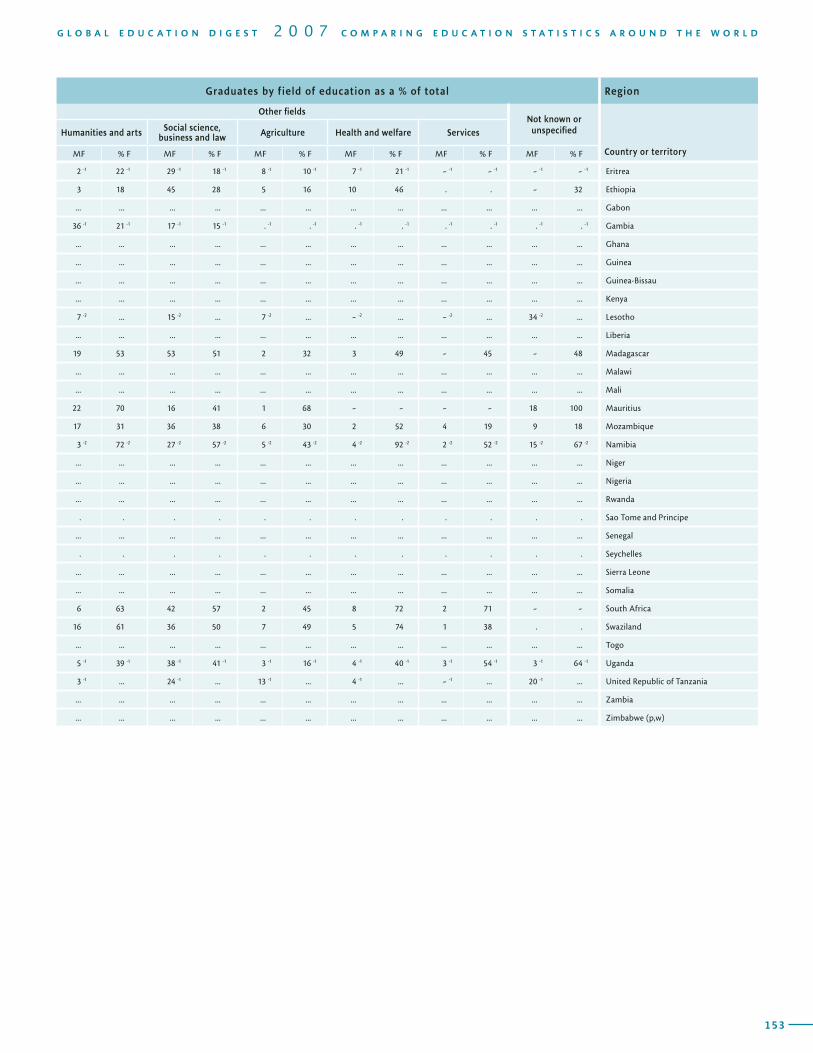
152
T A B L E TERTIARY EDUCATION / ISCED 5 and 6 / Graduates by field of education / 200511Region Total number
of graduates Graduates by field of education as a % of total
Country or territory MF % F
Science and technology fields Other fields
Total ScienceEngineering,
manufacturing and construction
Total Education
MF % F MF % F MF % F MF % F MF % F
153
G L O B A L E D U C A T I O N D I G E S T 2 0 0 7 C O M P A R I N G E D U C A T I O N S T A T I S T I C S A R O U N D T H E W O R L D
Graduates by field of education as a % of total Region
Other fieldsNot known or unspecified
Country or territory
Humanities and arts Social science, business and law Agriculture Health and welfare Services
MF % F MF % F MF % F MF % F MF % F MF % F
2 -1 22 -1 29 -1 18 -1 8 -1 10 -1 7 -1 21 -1 - -1 - -1 - -1 - -1 Eritrea
3 18 45 28 5 16 10 46 . . - 32 Ethiopia
... ... ... ... ... ... ... ... ... ... ... ... Gabon
36 -1 21 -1 17 -1 15 -1 . -1 . -1 . -1 . -1 . -1 . -1 . -1 . -1 Gambia
... ... ... ... ... ... ... ... ... ... ... ... Ghana
... ... ... ... ... ... ... ... ... ... ... ... Guinea
... ... ... ... ... ... ... ... ... ... ... ... Guinea-Bissau
... ... ... ... ... ... ... ... ... ... ... ... Kenya
7 -2 ... 15 -2 ... 7 -2 ... - -2 ... - -2 ... 34 -2 ... Lesotho
... ... ... ... ... ... ... ... ... ... ... ... Liberia
19 53 53 51 2 32 3 49 - 45 - 48 Madagascar
... ... ... ... ... ... ... ... ... ... ... ... Malawi
... ... ... ... ... ... ... ... ... ... ... ... Mali
22 70 16 41 1 68 - - - - 18 100 Mauritius
17 31 36 38 6 30 2 52 4 19 9 18 Mozambique
3 -2 72 -2 27 -2 57 -2 5 -2 43 -2 4 -2 92 -2 2 -2 52 -2 15 -2 67 -2 Namibia
... ... ... ... ... ... ... ... ... ... ... ... Niger
... ... ... ... ... ... ... ... ... ... ... ... Nigeria
... ... ... ... ... ... ... ... ... ... ... ... Rwanda
. . . . . . . . . . . . Sao Tome and Principe
... ... ... ... ... ... ... ... ... ... ... ... Senegal
. . . . . . . . . . . . Seychelles
... ... ... ... ... ... ... ... ... ... ... ... Sierra Leone
... ... ... ... ... ... ... ... ... ... ... ... Somalia
6 63 42 57 2 45 8 72 2 71 - - South Africa
16 61 36 50 7 49 5 74 1 38 . . Swaziland
... ... ... ... ... ... ... ... ... ... ... ... Togo
5 -1 39 -1 38 -1 41 -1 3 -1 16 -1 4 -1 40 -1 3 -1 54 -1 3 -1 64 -1 Uganda
3 -1 ... 24 -1 ... 13 -1 ... 4 -1 ... - -1 ... 20 -1 ... United Republic of Tanzania
... ... ... ... ... ... ... ... ... ... ... ... Zambia
... ... ... ... ... ... ... ... ... ... ... ... Zimbabwe (p,w)
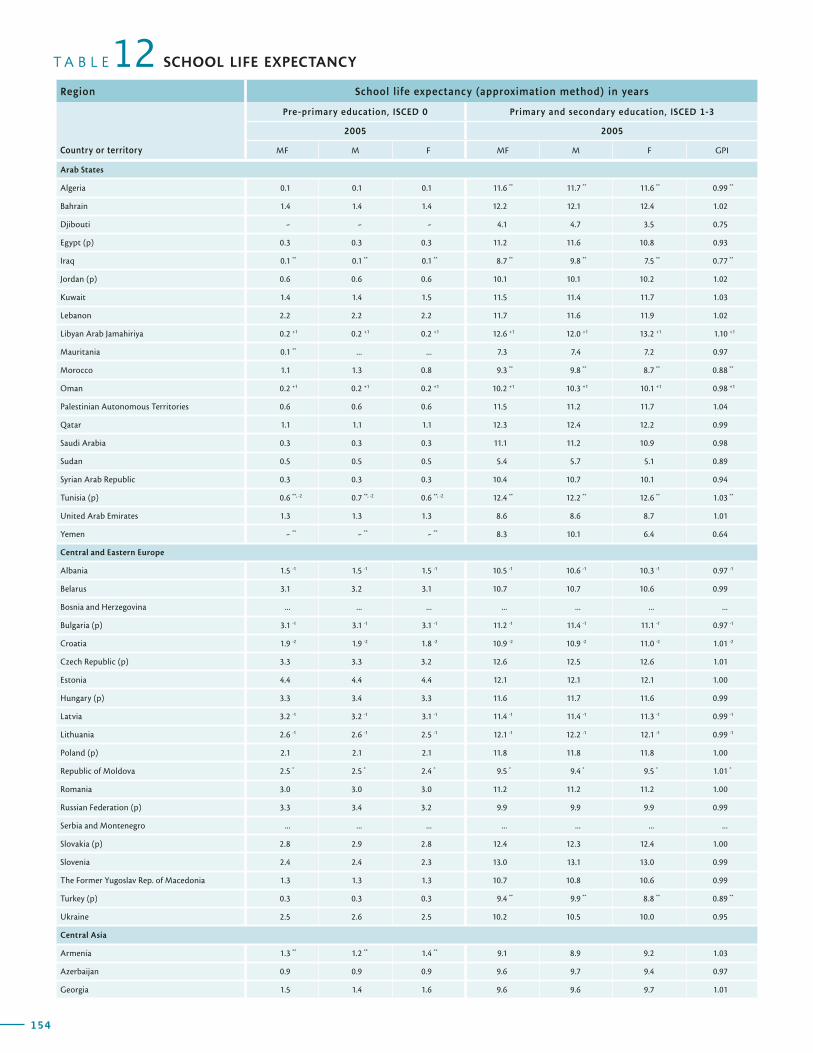
154
T A B L E SCHOOL LIFE EXPECTANCY12Region School life expectancy (approximation method) in years
Country or territory
Pre-primary education, ISCED 0 Primary and secondary education, ISCED 1-3
2005 2005
MF M F MF M F GPI
155
G L O B A L E D U C A T I O N D I G E S T 2 0 0 7 C O M P A R I N G E D U C A T I O N S T A T I S T I C S A R O U N D T H E W O R L D
School life expectancy (approximation method) in years Region
Primary to tertiary education, ISCED 1-6
Country or territory
1999 2005
MF M F GPI MF M F GPI
Arab States
Algeria 0.1 0.1 0.1 11.6 ** 11.7 ** 11.6 ** 0.99 **
Bahrain 1.4 1.4 1.4 12.2 12.1 12.4 1.02
Djibouti - - - 4.1 4.7 3.5 0.75
Egypt (p) 0.3 0.3 0.3 11.2 11.6 10.8 0.93
Iraq 0.1 ** 0.1 ** 0.1 ** 8.7 ** 9.8 ** 7.5 ** 0.77 **
Jordan (p) 0.6 0.6 0.6 10.1 10.1 10.2 1.02
Kuwait 1.4 1.4 1.5 11.5 11.4 11.7 1.03
Lebanon 2.2 2.2 2.2 11.7 11.6 11.9 1.02
Libyan Arab Jamahiriya 0.2 +1 0.2 +1 0.2 +1 12.6 +1 12.0 +1 13.2 +1 1.10 +1
Mauritania 0.1 ** ... ... 7.3 7.4 7.2 0.97
Morocco 1.1 1.3 0.8 9.3 ** 9.8 ** 8.7 ** 0.88 **
Oman 0.2 +1 0.2 +1 0.2 +1 10.2 +1 10.3 +1 10.1 +1 0.98 +1
Palestinian Autonomous Territories 0.6 0.6 0.6 11.5 11.2 11.7 1.04
Qatar 1.1 1.1 1.1 12.3 12.4 12.2 0.99
Saudi Arabia 0.3 0.3 0.3 11.1 11.2 10.9 0.98
Sudan 0.5 0.5 0.5 5.4 5.7 5.1 0.89
Syrian Arab Republic 0.3 0.3 0.3 10.4 10.7 10.1 0.94
Tunisia (p) 0.6 **, -2 0.7 **, -2 0.6 **, -2 12.4 ** 12.2 ** 12.6 ** 1.03 **
United Arab Emirates 1.3 1.3 1.3 8.6 8.6 8.7 1.01
Yemen - ** - ** - ** 8.3 10.1 6.4 0.64
Central and Eastern Europe
Albania 1.5 -1 1.5 -1 1.5 -1 10.5 -1 10.6 -1 10.3 -1 0.97 -1
Belarus 3.1 3.2 3.1 10.7 10.7 10.6 0.99
Bosnia and Herzegovina ... ... ... ... ... ... ...
Bulgaria (p) 3.1 -1 3.1 -1 3.1 -1 11.2 -1 11.4 -1 11.1 -1 0.97 -1
Croatia 1.9 -2 1.9 -2 1.8 -2 10.9 -2 10.9 -2 11.0 -2 1.01 -2
Czech Republic (p) 3.3 3.3 3.2 12.6 12.5 12.6 1.01
Estonia 4.4 4.4 4.4 12.1 12.1 12.1 1.00
Hungary (p) 3.3 3.4 3.3 11.6 11.7 11.6 0.99
Latvia 3.2 -1 3.2 -1 3.1 -1 11.4 -1 11.4 -1 11.3 -1 0.99 -1
Lithuania 2.6 -1 2.6 -1 2.5 -1 12.1 -1 12.2 -1 12.1 -1 0.99 -1
Poland (p) 2.1 2.1 2.1 11.8 11.8 11.8 1.00
Republic of Moldova 2.5 * 2.5 * 2.4 * 9.5 * 9.4 * 9.5 * 1.01 *
Romania 3.0 3.0 3.0 11.2 11.2 11.2 1.00
Russian Federation (p) 3.3 3.4 3.2 9.9 9.9 9.9 0.99
Serbia and Montenegro ... ... ... ... ... ... ...
Slovakia (p) 2.8 2.9 2.8 12.4 12.3 12.4 1.00
Slovenia 2.4 2.4 2.3 13.0 13.1 13.0 0.99
The Former Yugoslav Rep. of Macedonia 1.3 1.3 1.3 10.7 10.8 10.6 0.99
Turkey (p) 0.3 0.3 0.3 9.4 ** 9.9 ** 8.8 ** 0.89 **
Ukraine 2.5 2.6 2.5 10.2 10.5 10.0 0.95
Central Asia
Armenia 1.3 ** 1.2 ** 1.4 ** 9.1 8.9 9.2 1.03
Azerbaijan 0.9 0.9 0.9 9.6 9.7 9.4 0.97
Georgia 1.5 1.4 1.6 9.6 9.6 9.7 1.01
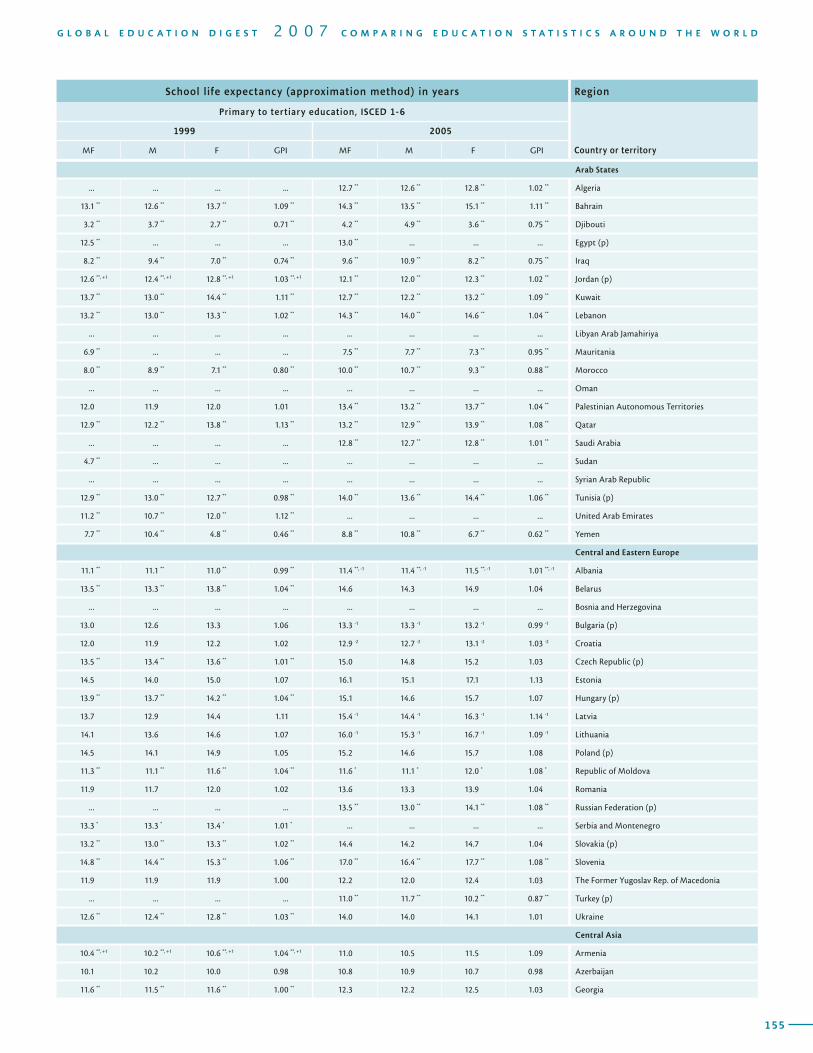
154
T A B L E SCHOOL LIFE EXPECTANCY12Region School life expectancy (approximation method) in years
Country or territory
Pre-primary education, ISCED 0 Primary and secondary education, ISCED 1-3
2005 2005
MF M F MF M F GPI
155
G L O B A L E D U C A T I O N D I G E S T 2 0 0 7 C O M P A R I N G E D U C A T I O N S T A T I S T I C S A R O U N D T H E W O R L D
School life expectancy (approximation method) in years Region
Primary to tertiary education, ISCED 1-6
Country or territory
1999 2005
MF M F GPI MF M F GPI
Arab States
... ... ... ... 12.7 ** 12.6 ** 12.8 ** 1.02 ** Algeria
13.1 ** 12.6 ** 13.7 ** 1.09 ** 14.3 ** 13.5 ** 15.1 ** 1.11 ** Bahrain
3.2 ** 3.7 ** 2.7 ** 0.71 ** 4.2 ** 4.9 ** 3.6 ** 0.75 ** Djibouti
12.5 ** ... ... ... 13.0 ** ... ... ... Egypt (p)
8.2 ** 9.4 ** 7.0 ** 0.74 ** 9.6 ** 10.9 ** 8.2 ** 0.75 ** Iraq
12.6 **, +1 12.4 **, +1 12.8 **, +1 1.03 **, +1 12.1 ** 12.0 ** 12.3 ** 1.02 ** Jordan (p)
13.7 ** 13.0 ** 14.4 ** 1.11 ** 12.7 ** 12.2 ** 13.2 ** 1.09 ** Kuwait
13.2 ** 13.0 ** 13.3 ** 1.02 ** 14.3 ** 14.0 ** 14.6 ** 1.04 ** Lebanon
... ... ... ... ... ... ... ... Libyan Arab Jamahiriya
6.9 ** ... ... ... 7.5 ** 7.7 ** 7.3 ** 0.95 ** Mauritania
8.0 ** 8.9 ** 7.1 ** 0.80 ** 10.0 ** 10.7 ** 9.3 ** 0.88 ** Morocco
... ... ... ... ... ... ... ... Oman
12.0 11.9 12.0 1.01 13.4 ** 13.2 ** 13.7 ** 1.04 ** Palestinian Autonomous Territories
12.9 ** 12.2 ** 13.8 ** 1.13 ** 13.2 ** 12.9 ** 13.9 ** 1.08 ** Qatar
... ... ... ... 12.8 ** 12.7 ** 12.8 ** 1.01 ** Saudi Arabia
4.7 ** ... ... ... ... ... ... ... Sudan
... ... ... ... ... ... ... ... Syrian Arab Republic
12.9 ** 13.0 ** 12.7 ** 0.98 ** 14.0 ** 13.6 ** 14.4 ** 1.06 ** Tunisia (p)
11.2 ** 10.7 ** 12.0 ** 1.12 ** ... ... ... ... United Arab Emirates
7.7 ** 10.4 ** 4.8 ** 0.46 ** 8.8 ** 10.8 ** 6.7 ** 0.62 ** Yemen
Central and Eastern Europe
11.1 ** 11.1 ** 11.0 ** 0.99 ** 11.4 **, -1 11.4 **, -1 11.5 **, -1 1.01 **, -1 Albania
13.5 ** 13.3 ** 13.8 ** 1.04 ** 14.6 14.3 14.9 1.04 Belarus
... ... ... ... ... ... ... ... Bosnia and Herzegovina
13.0 12.6 13.3 1.06 13.3 -1 13.3 -1 13.2 -1 0.99 -1 Bulgaria (p)
12.0 11.9 12.2 1.02 12.9 -2 12.7 -2 13.1 -2 1.03 -2 Croatia
13.5 ** 13.4 ** 13.6 ** 1.01 ** 15.0 14.8 15.2 1.03 Czech Republic (p)
14.5 14.0 15.0 1.07 16.1 15.1 17.1 1.13 Estonia
13.9 ** 13.7 ** 14.2 ** 1.04 ** 15.1 14.6 15.7 1.07 Hungary (p)
13.7 12.9 14.4 1.11 15.4 -1 14.4 -1 16.3 -1 1.14 -1 Latvia
14.1 13.6 14.6 1.07 16.0 -1 15.3 -1 16.7 -1 1.09 -1 Lithuania
14.5 14.1 14.9 1.05 15.2 14.6 15.7 1.08 Poland (p)
11.3 ** 11.1 ** 11.6 ** 1.04 ** 11.6 * 11.1 * 12.0 * 1.08 * Republic of Moldova
11.9 11.7 12.0 1.02 13.6 13.3 13.9 1.04 Romania
... ... ... ... 13.5 ** 13.0 ** 14.1 ** 1.08 ** Russian Federation (p)
13.3 * 13.3 * 13.4 * 1.01 * ... ... ... ... Serbia and Montenegro
13.2 ** 13.0 ** 13.3 ** 1.02 ** 14.4 14.2 14.7 1.04 Slovakia (p)
14.8 ** 14.4 ** 15.3 ** 1.06 ** 17.0 ** 16.4 ** 17.7 ** 1.08 ** Slovenia
11.9 11.9 11.9 1.00 12.2 12.0 12.4 1.03 The Former Yugoslav Rep. of Macedonia
... ... ... ... 11.0 ** 11.7 ** 10.2 ** 0.87 ** Turkey (p)
12.6 ** 12.4 ** 12.8 ** 1.03 ** 14.0 14.0 14.1 1.01 Ukraine
Central Asia
10.4 **, +1 10.2 **, +1 10.6 **, +1 1.04 **, +1 11.0 10.5 11.5 1.09 Armenia
10.1 10.2 10.0 0.98 10.8 10.9 10.7 0.98 Azerbaijan
11.6 ** 11.5 ** 11.6 ** 1.00 ** 12.3 12.2 12.5 1.03 Georgia
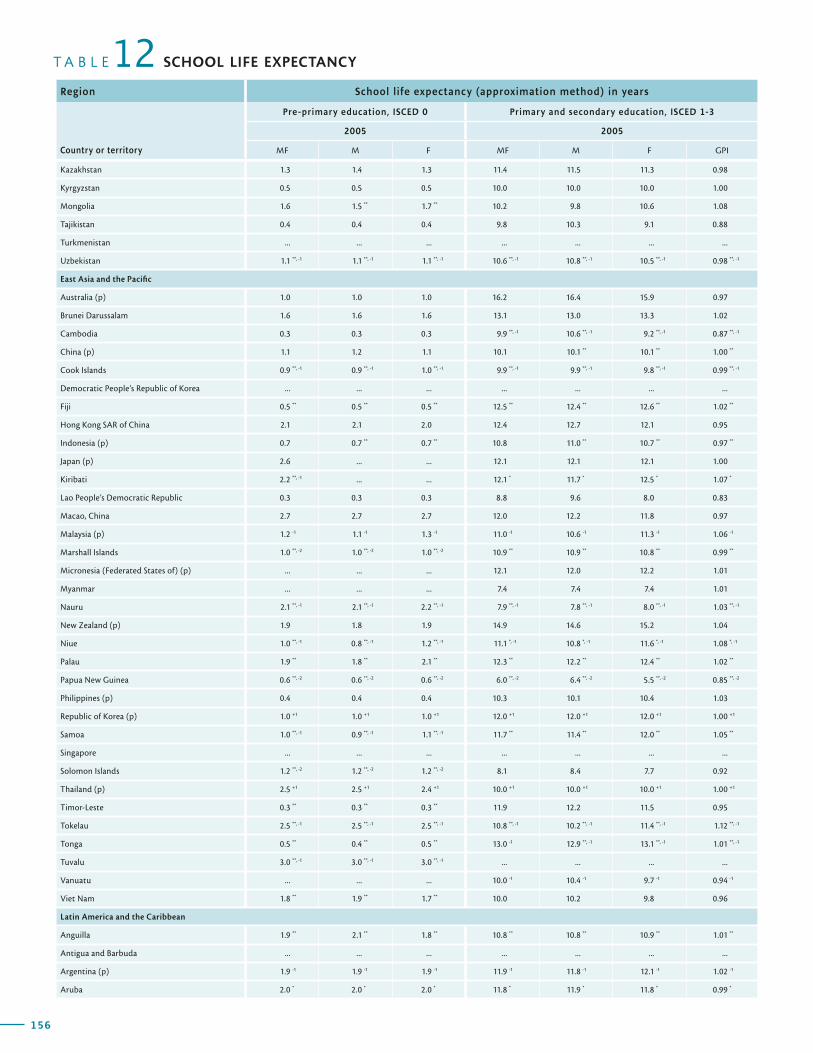
156
T A B L E SCHOOL LIFE EXPECTANCY12Region School life expectancy (approximation method) in years
Country or territory
Pre-primary education, ISCED 0 Primary and secondary education, ISCED 1-3
2005 2005
MF M F MF M F GPI
157
G L O B A L E D U C A T I O N D I G E S T 2 0 0 7 C O M P A R I N G E D U C A T I O N S T A T I S T I C S A R O U N D T H E W O R L D
School life expectancy (approximation method) in years Region
Primary to tertiary education, ISCED 1-6
Country or territory
1999 2005
MF M F GPI MF M F GPI
Kazakhstan 1.3 1.4 1.3 11.4 11.5 11.3 0.98
Kyrgyzstan 0.5 0.5 0.5 10.0 10.0 10.0 1.00
Mongolia 1.6 1.5 ** 1.7 ** 10.2 9.8 10.6 1.08
Tajikistan 0.4 0.4 0.4 9.8 10.3 9.1 0.88
Turkmenistan ... ... ... ... ... ... ...
Uzbekistan 1.1 **, -1 1.1 **, -1 1.1 **, -1 10.6 **, -1 10.8 **, -1 10.5 **, -1 0.98 **, -1
East Asia and the Pacific
Australia (p) 1.0 1.0 1.0 16.2 16.4 15.9 0.97
Brunei Darussalam 1.6 1.6 1.6 13.1 13.0 13.3 1.02
Cambodia 0.3 0.3 0.3 9.9 **, -1 10.6 **, -1 9.2 **, -1 0.87 **, -1
China (p) 1.1 1.2 1.1 10.1 10.1 ** 10.1 ** 1.00 **
Cook Islands 0.9 **, -1 0.9 **, -1 1.0 **, -1 9.9 **, -1 9.9 **, -1 9.8 **, -1 0.99 **, -1
Democratic People’s Republic of Korea ... ... ... ... ... ... ...
Fiji 0.5 ** 0.5 ** 0.5 ** 12.5 ** 12.4 ** 12.6 ** 1.02 **
Hong Kong SAR of China 2.1 2.1 2.0 12.4 12.7 12.1 0.95
Indonesia (p) 0.7 0.7 ** 0.7 ** 10.8 11.0 ** 10.7 ** 0.97 **
Japan (p) 2.6 ... ... 12.1 12.1 12.1 1.00
Kiribati 2.2 **, -1 ... ... 12.1 * 11.7 * 12.5 * 1.07 *
Lao People’s Democratic Republic 0.3 0.3 0.3 8.8 9.6 8.0 0.83
Macao, China 2.7 2.7 2.7 12.0 12.2 11.8 0.97
Malaysia (p) 1.2 -1 1.1 -1 1.3 -1 11.0 -1 10.6 -1 11.3 -1 1.06 -1
Marshall Islands 1.0 **, -2 1.0 **, -2 1.0 **, -2 10.9 ** 10.9 ** 10.8 ** 0.99 **
Micronesia (Federated States of) (p) ... ... ... 12.1 12.0 12.2 1.01
Myanmar ... ... ... 7.4 7.4 7.4 1.01
Nauru 2.1 **, -1 2.1 **, -1 2.2 **, -1 7.9 **, -1 7.8 **, -1 8.0 **, -1 1.03 **, -1
New Zealand (p) 1.9 1.8 1.9 14.9 14.6 15.2 1.04
Niue 1.0 **, -1 0.8 **, -1 1.2 **, -1 11.1 *, -1 10.8 *, -1 11.6 *, -1 1.08 *, -1
Palau 1.9 ** 1.8 ** 2.1 ** 12.3 ** 12.2 ** 12.4 ** 1.02 **
Papua New Guinea 0.6 **, -2 0.6 **, -2 0.6 **, -2 6.0 **, -2 6.4 **, -2 5.5 **, -2 0.85 **, -2
Philippines (p) 0.4 0.4 0.4 10.3 10.1 10.4 1.03
Republic of Korea (p) 1.0 +1 1.0 +1 1.0 +1 12.0 +1 12.0 +1 12.0 +1 1.00 +1
Samoa 1.0 **, -1 0.9 **, -1 1.1 **, -1 11.7 ** 11.4 ** 12.0 ** 1.05 **
Singapore ... ... ... ... ... ... ...
Solomon Islands 1.2 **, -2 1.2 **, -2 1.2 **, -2 8.1 8.4 7.7 0.92
Thailand (p) 2.5 +1 2.5 +1 2.4 +1 10.0 +1 10.0 +1 10.0 +1 1.00 +1
Timor-Leste 0.3 ** 0.3 ** 0.3 ** 11.9 12.2 11.5 0.95
Tokelau 2.5 **, -1 2.5 **, -1 2.5 **, -1 10.8 **, -1 10.2 **, -1 11.4 **, -1 1.12 **, -1
Tonga 0.5 ** 0.4 ** 0.5 ** 13.0 -1 12.9 **, -1 13.1 **, -1 1.01 **, -1
Tuvalu 3.0 **, -1 3.0 **, -1 3.0 **, -1 ... ... ... ...
Vanuatu ... ... ... 10.0 -1 10.4 -1 9.7 -1 0.94 -1
Viet Nam 1.8 ** 1.9 ** 1.7 ** 10.0 10.2 9.8 0.96
Latin America and the Caribbean
Anguilla 1.9 ** 2.1 ** 1.8 ** 10.8 ** 10.8 ** 10.9 ** 1.01 **
Antigua and Barbuda ... ... ... ... ... ... ...
Argentina (p) 1.9 -1 1.9 -1 1.9 -1 11.9 -1 11.8 -1 12.1 -1 1.02 -1
Aruba 2.0 * 2.0 * 2.0 * 11.8 * 11.9 * 11.8 * 0.99 *
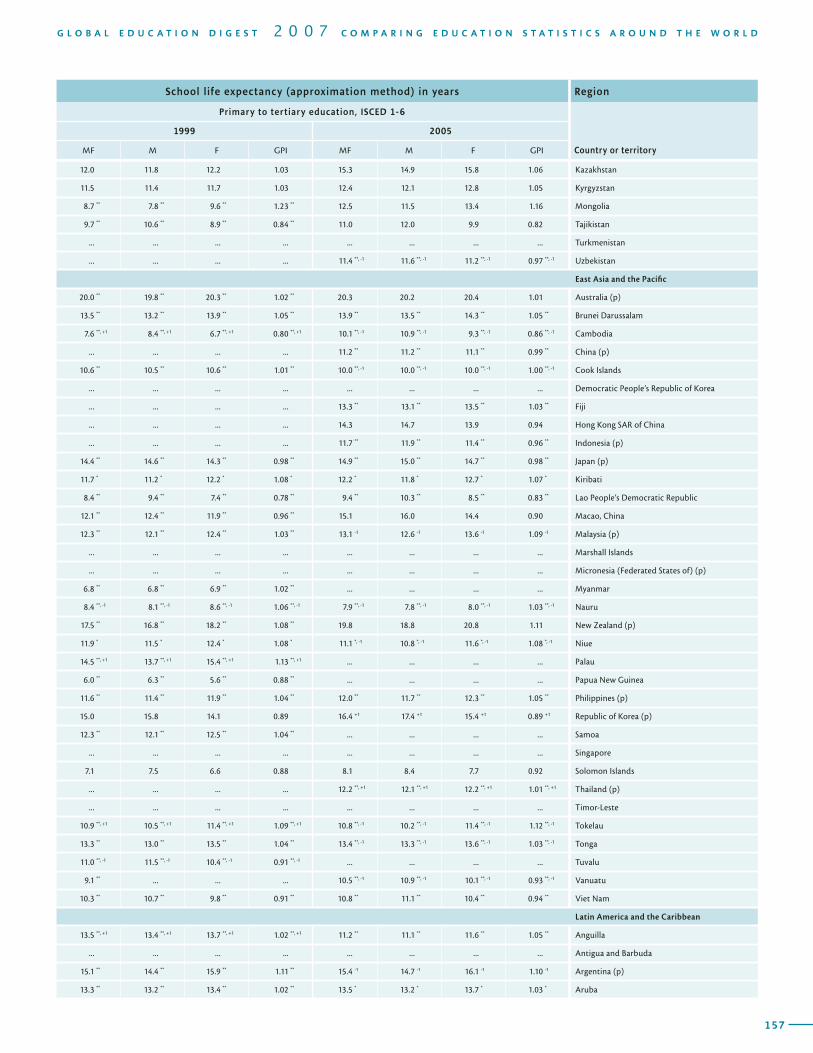
156
T A B L E SCHOOL LIFE EXPECTANCY12Region School life expectancy (approximation method) in years
Country or territory
Pre-primary education, ISCED 0 Primary and secondary education, ISCED 1-3
2005 2005
MF M F MF M F GPI
157
G L O B A L E D U C A T I O N D I G E S T 2 0 0 7 C O M P A R I N G E D U C A T I O N S T A T I S T I C S A R O U N D T H E W O R L D
School life expectancy (approximation method) in years Region
Primary to tertiary education, ISCED 1-6
Country or territory
1999 2005
MF M F GPI MF M F GPI
12.0 11.8 12.2 1.03 15.3 14.9 15.8 1.06 Kazakhstan
11.5 11.4 11.7 1.03 12.4 12.1 12.8 1.05 Kyrgyzstan
8.7 ** 7.8 ** 9.6 ** 1.23 ** 12.5 11.5 13.4 1.16 Mongolia
9.7 ** 10.6 ** 8.9 ** 0.84 ** 11.0 12.0 9.9 0.82 Tajikistan
... ... ... ... ... ... ... ... Turkmenistan
... ... ... ... 11.4 **, -1 11.6 **, -1 11.2 **, -1 0.97 **, -1 Uzbekistan
East Asia and the Pacific
20.0 ** 19.8 ** 20.3 ** 1.02 ** 20.3 20.2 20.4 1.01 Australia (p)
13.5 ** 13.2 ** 13.9 ** 1.05 ** 13.9 ** 13.5 ** 14.3 ** 1.05 ** Brunei Darussalam
7.6 **, +1 8.4 **, +1 6.7 **, +1 0.80 **, +1 10.1 **, -1 10.9 **, -1 9.3 **, -1 0.86 **, -1 Cambodia
... ... ... ... 11.2 ** 11.2 ** 11.1 ** 0.99 ** China (p)
10.6 ** 10.5 ** 10.6 ** 1.01 ** 10.0 **, -1 10.0 **, -1 10.0 **, -1 1.00 **, -1 Cook Islands
... ... ... ... ... ... ... ... Democratic People’s Republic of Korea
... ... ... ... 13.3 ** 13.1 ** 13.5 ** 1.03 ** Fiji
... ... ... ... 14.3 14.7 13.9 0.94 Hong Kong SAR of China
... ... ... ... 11.7 ** 11.9 ** 11.4 ** 0.96 ** Indonesia (p)
14.4 ** 14.6 ** 14.3 ** 0.98 ** 14.9 ** 15.0 ** 14.7 ** 0.98 ** Japan (p)
11.7 * 11.2 * 12.2 * 1.08 * 12.2 * 11.8 * 12.7 * 1.07 * Kiribati
8.4 ** 9.4 ** 7.4 ** 0.78 ** 9.4 ** 10.3 ** 8.5 ** 0.83 ** Lao People’s Democratic Republic
12.1 ** 12.4 ** 11.9 ** 0.96 ** 15.1 16.0 14.4 0.90 Macao, China
12.3 ** 12.1 ** 12.4 ** 1.03 ** 13.1 -1 12.6 -1 13.6 -1 1.09 -1 Malaysia (p)
... ... ... ... ... ... ... ... Marshall Islands
... ... ... ... ... ... ... ... Micronesia (Federated States of) (p)
6.8 ** 6.8 ** 6.9 ** 1.02 ** ... ... ... ... Myanmar
8.4 **, -1 8.1 **, -1 8.6 **, -1 1.06 **, -1 7.9 **, -1 7.8 **, -1 8.0 **, -1 1.03 **, -1 Nauru
17.5 ** 16.8 ** 18.2 ** 1.08 ** 19.8 18.8 20.8 1.11 New Zealand (p)
11.9 * 11.5 * 12.4 * 1.08 * 11.1 *, -1 10.8 *, -1 11.6 *, -1 1.08 *, -1 Niue
14.5 **, +1 13.7 **, +1 15.4 **, +1 1.13 **, +1 ... ... ... ... Palau
6.0 ** 6.3 ** 5.6 ** 0.88 ** ... ... ... ... Papua New Guinea
11.6 ** 11.4 ** 11.9 ** 1.04 ** 12.0 ** 11.7 ** 12.3 ** 1.05 ** Philippines (p)
15.0 15.8 14.1 0.89 16.4 +1 17.4 +1 15.4 +1 0.89 +1 Republic of Korea (p)
12.3 ** 12.1 ** 12.5 ** 1.04 ** ... ... ... ... Samoa
... ... ... ... ... ... ... ... Singapore
7.1 7.5 6.6 0.88 8.1 8.4 7.7 0.92 Solomon Islands
... ... ... ... 12.2 **, +1 12.1 **, +1 12.2 **, +1 1.01 **, +1 Thailand (p)
... ... ... ... ... ... ... ... Timor-Leste
10.9 **, +1 10.5 **, +1 11.4 **, +1 1.09 **, +1 10.8 **, -1 10.2 **, -1 11.4 **, -1 1.12 **, -1 Tokelau
13.3 ** 13.0 ** 13.5 ** 1.04 ** 13.4 **, -1 13.3 **, -1 13.6 **, -1 1.03 **, -1 Tonga
11.0 **, -1 11.5 **, -1 10.4 **, -1 0.91 **, -1 ... ... ... ... Tuvalu
9.1 ** ... ... ... 10.5 **, -1 10.9 **, -1 10.1 **, -1 0.93 **, -1 Vanuatu
10.3 ** 10.7 ** 9.8 ** 0.91 ** 10.8 ** 11.1 ** 10.4 ** 0.94 ** Viet Nam
Latin America and the Caribbean
13.5 **, +1 13.4 **, +1 13.7 **, +1 1.02 **, +1 11.2 ** 11.1 ** 11.6 ** 1.05 ** Anguilla
... ... ... ... ... ... ... ... Antigua and Barbuda
15.1 ** 14.4 ** 15.9 ** 1.11 ** 15.4 -1 14.7 -1 16.1 -1 1.10 -1 Argentina (p)
13.3 ** 13.2 ** 13.4 ** 1.02 ** 13.5 * 13.2 * 13.7 * 1.03 * Aruba
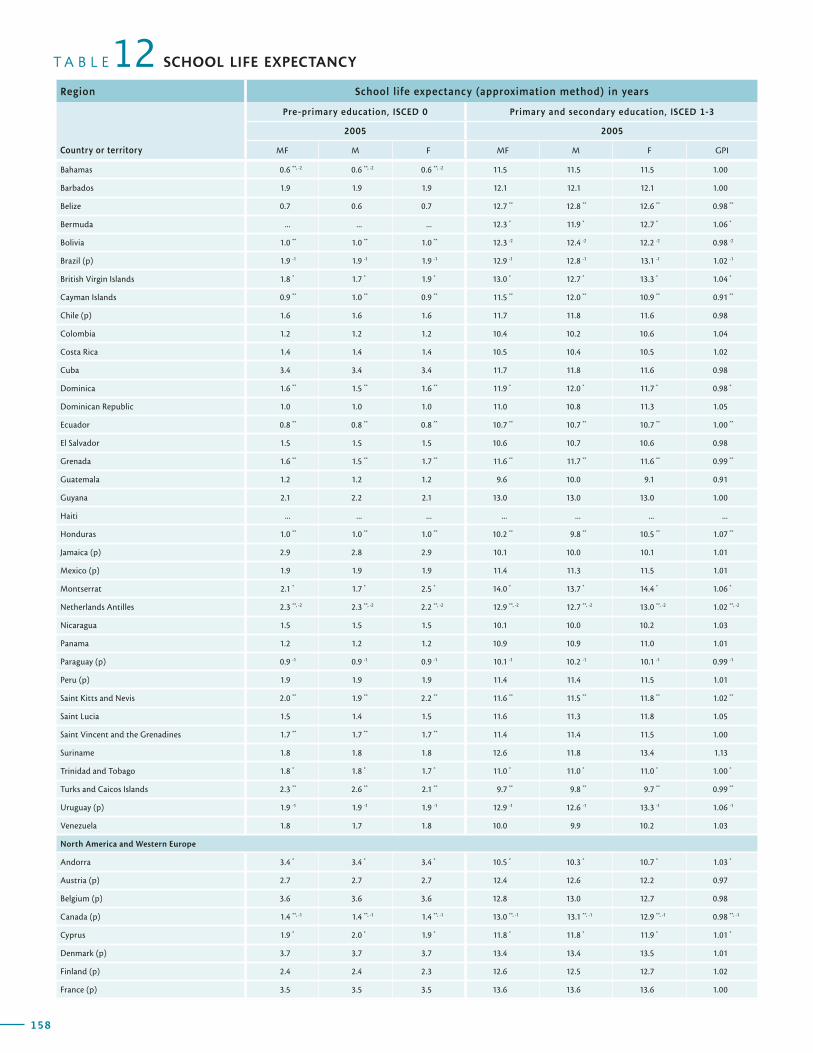
158
T A B L E SCHOOL LIFE EXPECTANCY12Region School life expectancy (approximation method) in years
Country or territory
Pre-primary education, ISCED 0 Primary and secondary education, ISCED 1-3
2005 2005
MF M F MF M F GPI
159
G L O B A L E D U C A T I O N D I G E S T 2 0 0 7 C O M P A R I N G E D U C A T I O N S T A T I S T I C S A R O U N D T H E W O R L D
School life expectancy (approximation method) in years Region
Primary to tertiary education, ISCED 1-6
Country or territory
1999 2005
MF M F GPI MF M F GPI
Bahamas 0.6 **, -2 0.6 **, -2 0.6 **, -2 11.5 11.5 11.5 1.00
Barbados 1.9 1.9 1.9 12.1 12.1 12.1 1.00
Belize 0.7 0.6 0.7 12.7 ** 12.8 ** 12.6 ** 0.98 **
Bermuda ... ... ... 12.3 * 11.9 * 12.7 * 1.06 *
Bolivia 1.0 ** 1.0 ** 1.0 ** 12.3 -2 12.4 -2 12.2 -2 0.98 -2
Brazil (p) 1.9 -1 1.9 -1 1.9 -1 12.9 -1 12.8 -1 13.1 -1 1.02 -1
British Virgin Islands 1.8 * 1.7 * 1.9 * 13.0 * 12.7 * 13.3 * 1.04 *
Cayman Islands 0.9 ** 1.0 ** 0.9 ** 11.5 ** 12.0 ** 10.9 ** 0.91 **
Chile (p) 1.6 1.6 1.6 11.7 11.8 11.6 0.98
Colombia 1.2 1.2 1.2 10.4 10.2 10.6 1.04
Costa Rica 1.4 1.4 1.4 10.5 10.4 10.5 1.02
Cuba 3.4 3.4 3.4 11.7 11.8 11.6 0.98
Dominica 1.6 ** 1.5 ** 1.6 ** 11.9 * 12.0 * 11.7 * 0.98 *
Dominican Republic 1.0 1.0 1.0 11.0 10.8 11.3 1.05
Ecuador 0.8 ** 0.8 ** 0.8 ** 10.7 ** 10.7 ** 10.7 ** 1.00 **
El Salvador 1.5 1.5 1.5 10.6 10.7 10.6 0.98
Grenada 1.6 ** 1.5 ** 1.7 ** 11.6 ** 11.7 ** 11.6 ** 0.99 **
Guatemala 1.2 1.2 1.2 9.6 10.0 9.1 0.91
Guyana 2.1 2.2 2.1 13.0 13.0 13.0 1.00
Haiti ... ... ... ... ... ... ...
Honduras 1.0 ** 1.0 ** 1.0 ** 10.2 ** 9.8 ** 10.5 ** 1.07 **
Jamaica (p) 2.9 2.8 2.9 10.1 10.0 10.1 1.01
Mexico (p) 1.9 1.9 1.9 11.4 11.3 11.5 1.01
Montserrat 2.1 * 1.7 * 2.5 * 14.0 * 13.7 * 14.4 * 1.06 *
Netherlands Antilles 2.3 **, -2 2.3 **, -2 2.2 **, -2 12.9 **, -2 12.7 **, -2 13.0 **, -2 1.02 **, -2
Nicaragua 1.5 1.5 1.5 10.1 10.0 10.2 1.03
Panama 1.2 1.2 1.2 10.9 10.9 11.0 1.01
Paraguay (p) 0.9 -1 0.9 -1 0.9 -1 10.1 -1 10.2 -1 10.1 -1 0.99 -1
Peru (p) 1.9 1.9 1.9 11.4 11.4 11.5 1.01
Saint Kitts and Nevis 2.0 ** 1.9 ** 2.2 ** 11.6 ** 11.5 ** 11.8 ** 1.02 **
Saint Lucia 1.5 1.4 1.5 11.6 11.3 11.8 1.05
Saint Vincent and the Grenadines 1.7 ** 1.7 ** 1.7 ** 11.4 11.4 11.5 1.00
Suriname 1.8 1.8 1.8 12.6 11.8 13.4 1.13
Trinidad and Tobago 1.8 * 1.8 * 1.7 * 11.0 * 11.0 * 11.0 * 1.00 *
Turks and Caicos Islands 2.3 ** 2.6 ** 2.1 ** 9.7 ** 9.8 ** 9.7 ** 0.99 **
Uruguay (p) 1.9 -1 1.9 -1 1.9 -1 12.9 -1 12.6 -1 13.3 -1 1.06 -1
Venezuela 1.8 1.7 1.8 10.0 9.9 10.2 1.03
North America and Western Europe
Andorra 3.4 * 3.4 * 3.4 * 10.5 * 10.3 * 10.7 * 1.03 *
Austria (p) 2.7 2.7 2.7 12.4 12.6 12.2 0.97
Belgium (p) 3.6 3.6 3.6 12.8 13.0 12.7 0.98
Canada (p) 1.4 **, -1 1.4 **, -1 1.4 **, -1 13.0 **, -1 13.1 **, -1 12.9 **, -1 0.98 **, -1
Cyprus 1.9 * 2.0 * 1.9 * 11.8 * 11.8 * 11.9 * 1.01 *
Denmark (p) 3.7 3.7 3.7 13.4 13.4 13.5 1.01
Finland (p) 2.4 2.4 2.3 12.6 12.5 12.7 1.02
France (p) 3.5 3.5 3.5 13.6 13.6 13.6 1.00
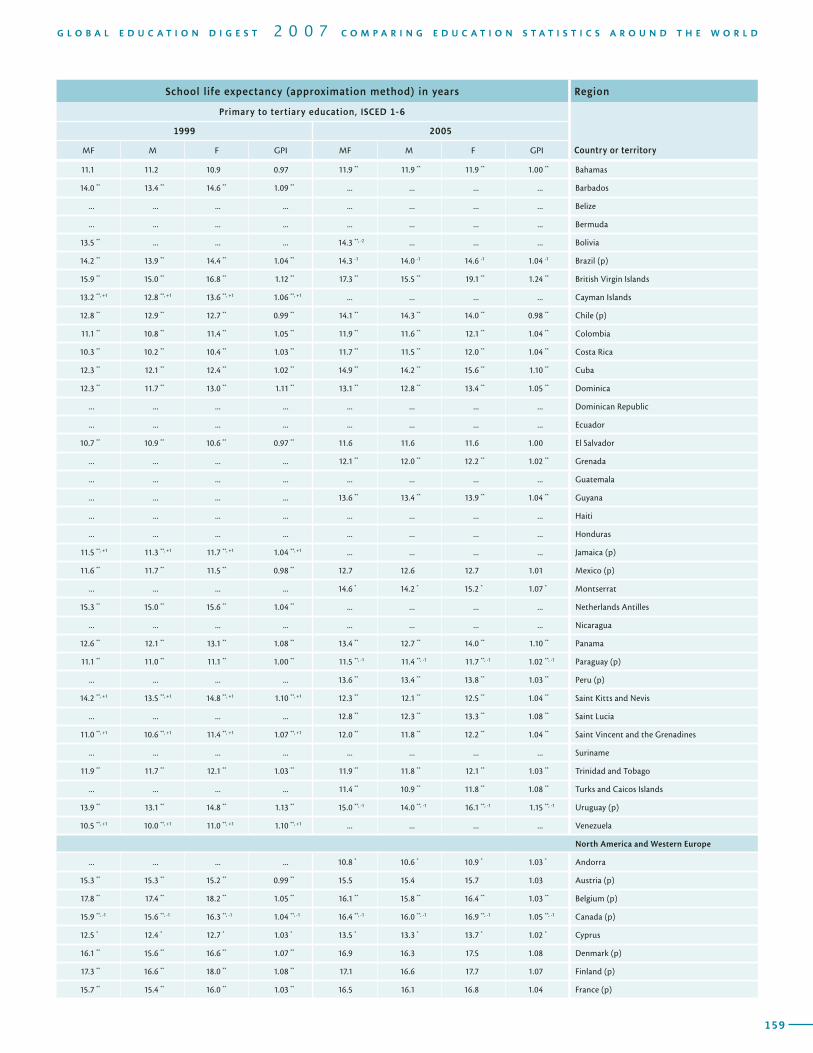
158
T A B L E SCHOOL LIFE EXPECTANCY12Region School life expectancy (approximation method) in years
Country or territory
Pre-primary education, ISCED 0 Primary and secondary education, ISCED 1-3
2005 2005
MF M F MF M F GPI
159
G L O B A L E D U C A T I O N D I G E S T 2 0 0 7 C O M P A R I N G E D U C A T I O N S T A T I S T I C S A R O U N D T H E W O R L D
School life expectancy (approximation method) in years Region
Primary to tertiary education, ISCED 1-6
Country or territory
1999 2005
MF M F GPI MF M F GPI
11.1 11.2 10.9 0.97 11.9 ** 11.9 ** 11.9 ** 1.00 ** Bahamas
14.0 ** 13.4 ** 14.6 ** 1.09 ** ... ... ... ... Barbados
... ... ... ... ... ... ... ... Belize
... ... ... ... ... ... ... ... Bermuda
13.5 ** ... ... ... 14.3 **, -2 ... ... ... Bolivia
14.2 ** 13.9 ** 14.4 ** 1.04 ** 14.3 -1 14.0 -1 14.6 -1 1.04 -1 Brazil (p)
15.9 ** 15.0 ** 16.8 ** 1.12 ** 17.3 ** 15.5 ** 19.1 ** 1.24 ** British Virgin Islands
13.2 **, +1 12.8 **, +1 13.6 **, +1 1.06 **, +1 ... ... ... ... Cayman Islands
12.8 ** 12.9 ** 12.7 ** 0.99 ** 14.1 ** 14.3 ** 14.0 ** 0.98 ** Chile (p)
11.1 ** 10.8 ** 11.4 ** 1.05 ** 11.9 ** 11.6 ** 12.1 ** 1.04 ** Colombia
10.3 ** 10.2 ** 10.4 ** 1.03 ** 11.7 ** 11.5 ** 12.0 ** 1.04 ** Costa Rica
12.3 ** 12.1 ** 12.4 ** 1.02 ** 14.9 ** 14.2 ** 15.6 ** 1.10 ** Cuba
12.3 ** 11.7 ** 13.0 ** 1.11 ** 13.1 ** 12.8 ** 13.4 ** 1.05 ** Dominica
... ... ... ... ... ... ... ... Dominican Republic
... ... ... ... ... ... ... ... Ecuador
10.7 ** 10.9 ** 10.6 ** 0.97 ** 11.6 11.6 11.6 1.00 El Salvador
... ... ... ... 12.1 ** 12.0 ** 12.2 ** 1.02 ** Grenada
... ... ... ... ... ... ... ... Guatemala
... ... ... ... 13.6 ** 13.4 ** 13.9 ** 1.04 ** Guyana
... ... ... ... ... ... ... ... Haiti
... ... ... ... ... ... ... ... Honduras
11.5 **, +1 11.3 **, +1 11.7 **, +1 1.04 **, +1 ... ... ... ... Jamaica (p)
11.6 ** 11.7 ** 11.5 ** 0.98 ** 12.7 12.6 12.7 1.01 Mexico (p)
... ... ... ... 14.6 * 14.2 * 15.2 * 1.07 * Montserrat
15.3 ** 15.0 ** 15.6 ** 1.04 ** ... ... ... ... Netherlands Antilles
... ... ... ... ... ... ... ... Nicaragua
12.6 ** 12.1 ** 13.1 ** 1.08 ** 13.4 ** 12.7 ** 14.0 ** 1.10 ** Panama
11.1 ** 11.0 ** 11.1 ** 1.00 ** 11.5 **, -1 11.4 **, -1 11.7 **, -1 1.02 **, -1 Paraguay (p)
... ... ... ... 13.6 ** 13.4 ** 13.8 ** 1.03 ** Peru (p)
14.2 **, +1 13.5 **, +1 14.8 **, +1 1.10 **, +1 12.3 ** 12.1 ** 12.5 ** 1.04 ** Saint Kitts and Nevis
... ... ... ... 12.8 ** 12.3 ** 13.3 ** 1.08 ** Saint Lucia
11.0 **, +1 10.6 **, +1 11.4 **, +1 1.07 **, +1 12.0 ** 11.8 ** 12.2 ** 1.04 ** Saint Vincent and the Grenadines
... ... ... ... ... ... ... ... Suriname
11.9 ** 11.7 ** 12.1 ** 1.03 ** 11.9 ** 11.8 ** 12.1 ** 1.03 ** Trinidad and Tobago
... ... ... ... 11.4 ** 10.9 ** 11.8 ** 1.08 ** Turks and Caicos Islands
13.9 ** 13.1 ** 14.8 ** 1.13 ** 15.0 **, -1 14.0 **, -1 16.1 **, -1 1.15 **, -1 Uruguay (p)
10.5 **, +1 10.0 **, +1 11.0 **, +1 1.10 **, +1 ... ... ... ... Venezuela
North America and Western Europe
... ... ... ... 10.8 * 10.6 * 10.9 * 1.03 * Andorra
15.3 ** 15.3 ** 15.2 ** 0.99 ** 15.5 15.4 15.7 1.03 Austria (p)
17.8 ** 17.4 ** 18.2 ** 1.05 ** 16.1 ** 15.8 ** 16.4 ** 1.03 ** Belgium (p)
15.9 **, -1 15.6 **, -1 16.3 **, -1 1.04 **, -1 16.4 **, -1 16.0 **, -1 16.9 **, -1 1.05 **, -1 Canada (p)
12.5 * 12.4 * 12.7 * 1.03 * 13.5 * 13.3 * 13.7 * 1.02 * Cyprus
16.1 ** 15.6 ** 16.6 ** 1.07 ** 16.9 16.3 17.5 1.08 Denmark (p)
17.3 ** 16.6 ** 18.0 ** 1.08 ** 17.1 16.6 17.7 1.07 Finland (p)
15.7 ** 15.4 ** 16.0 ** 1.03 ** 16.5 16.1 16.8 1.04 France (p)
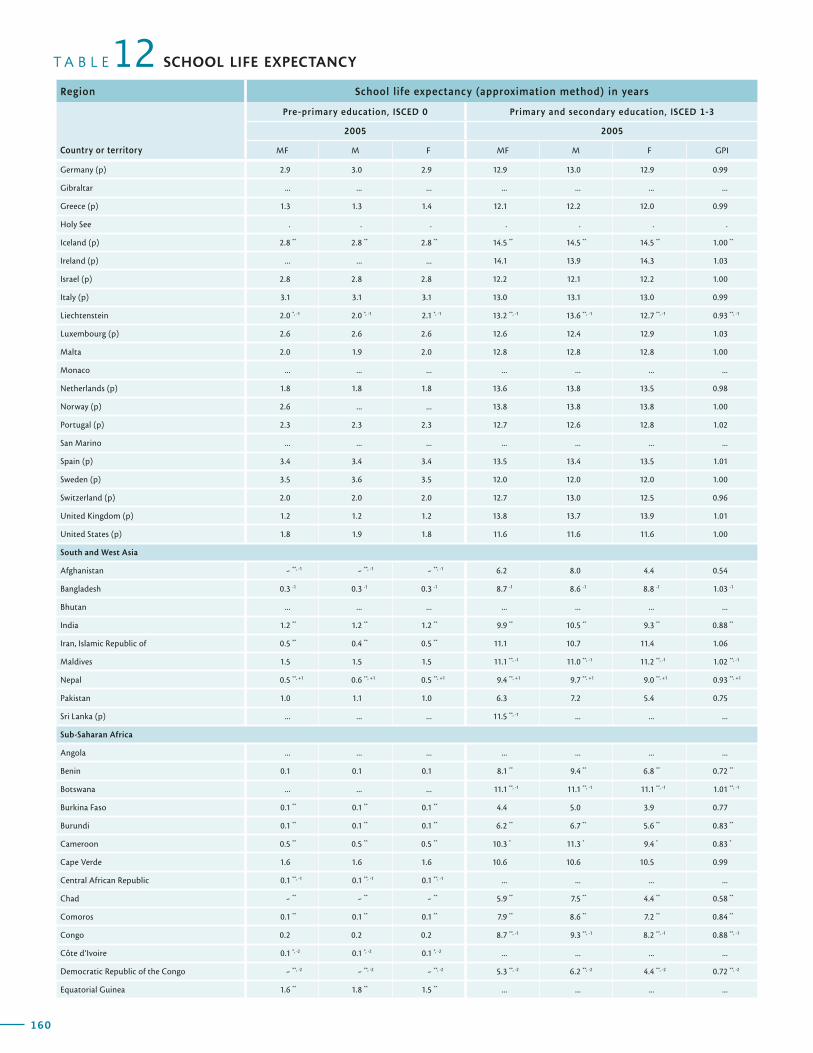
160
T A B L E SCHOOL LIFE EXPECTANCY12Region School life expectancy (approximation method) in years
Country or territory
Pre-primary education, ISCED 0 Primary and secondary education, ISCED 1-3
2005 2005
MF M F MF M F GPI
161
G L O B A L E D U C A T I O N D I G E S T 2 0 0 7 C O M P A R I N G E D U C A T I O N S T A T I S T I C S A R O U N D T H E W O R L D
School life expectancy (approximation method) in years Region
Primary to tertiary education, ISCED 1-6
Country or territory
1999 2005
MF M F GPI MF M F GPI
Germany (p) 2.9 3.0 2.9 12.9 13.0 12.9 0.99
Gibraltar ... ... ... ... ... ... ...
Greece (p) 1.3 1.3 1.4 12.1 12.2 12.0 0.99
Holy See . . . . . . .
Iceland (p) 2.8 ** 2.8 ** 2.8 ** 14.5 ** 14.5 ** 14.5 ** 1.00 **
Ireland (p) ... ... ... 14.1 13.9 14.3 1.03
Israel (p) 2.8 2.8 2.8 12.2 12.1 12.2 1.00
Italy (p) 3.1 3.1 3.1 13.0 13.1 13.0 0.99
Liechtenstein 2.0 *, -1 2.0 *, -1 2.1 *, -1 13.2 **, -1 13.6 **, -1 12.7 **, -1 0.93 **, -1
Luxembourg (p) 2.6 2.6 2.6 12.6 12.4 12.9 1.03
Malta 2.0 1.9 2.0 12.8 12.8 12.8 1.00
Monaco ... ... ... ... ... ... ...
Netherlands (p) 1.8 1.8 1.8 13.6 13.8 13.5 0.98
Norway (p) 2.6 ... ... 13.8 13.8 13.8 1.00
Portugal (p) 2.3 2.3 2.3 12.7 12.6 12.8 1.02
San Marino ... ... ... ... ... ... ...
Spain (p) 3.4 3.4 3.4 13.5 13.4 13.5 1.01
Sweden (p) 3.5 3.6 3.5 12.0 12.0 12.0 1.00
Switzerland (p) 2.0 2.0 2.0 12.7 13.0 12.5 0.96
United Kingdom (p) 1.2 1.2 1.2 13.8 13.7 13.9 1.01
United States (p) 1.8 1.9 1.8 11.6 11.6 11.6 1.00
South and West Asia
Afghanistan - **, -1 - **, -1 - **, -1 6.2 8.0 4.4 0.54
Bangladesh 0.3 -1 0.3 -1 0.3 -1 8.7 -1 8.6 -1 8.8 -1 1.03 -1
Bhutan ... ... ... ... ... ... ...
India 1.2 ** 1.2 ** 1.2 ** 9.9 ** 10.5 ** 9.3 ** 0.88 **
Iran, Islamic Republic of 0.5 ** 0.4 ** 0.5 ** 11.1 10.7 11.4 1.06
Maldives 1.5 1.5 1.5 11.1 **, -1 11.0 **, -1 11.2 **, -1 1.02 **, -1
Nepal 0.5 **, +1 0.6 **, +1 0.5 **, +1 9.4 **, +1 9.7 **, +1 9.0 **, +1 0.93 **, +1
Pakistan 1.0 1.1 1.0 6.3 7.2 5.4 0.75
Sri Lanka (p) ... ... ... 11.5 **, -1 ... ... ...
Sub-Saharan Africa
Angola ... ... ... ... ... ... ...
Benin 0.1 0.1 0.1 8.1 ** 9.4 ** 6.8 ** 0.72 **
Botswana ... ... ... 11.1 **, -1 11.1 **, -1 11.1 **, -1 1.01 **, -1
Burkina Faso 0.1 ** 0.1 ** 0.1 ** 4.4 5.0 3.9 0.77
Burundi 0.1 ** 0.1 ** 0.1 ** 6.2 ** 6.7 ** 5.6 ** 0.83 **
Cameroon 0.5 ** 0.5 ** 0.5 ** 10.3 * 11.3 * 9.4 * 0.83 *
Cape Verde 1.6 1.6 1.6 10.6 10.6 10.5 0.99
Central African Republic 0.1 **, -1 0.1 **, -1 0.1 **, -1 ... ... ... ...
Chad - ** - ** - ** 5.9 ** 7.5 ** 4.4 ** 0.58 **
Comoros 0.1 ** 0.1 ** 0.1 ** 7.9 ** 8.6 ** 7.2 ** 0.84 **
Congo 0.2 0.2 0.2 8.7 **, -1 9.3 **, -1 8.2 **, -1 0.88 **, -1
Côte d’Ivoire 0.1 *, -2 0.1 *, -2 0.1 *, -2 ... ... ... ...
Democratic Republic of the Congo - **, -2 - **, -2 - **, -2 5.3 **, -2 6.2 **, -2 4.4 **, -2 0.72 **, -2
Equatorial Guinea 1.6 ** 1.8 ** 1.5 ** ... ... ... ...
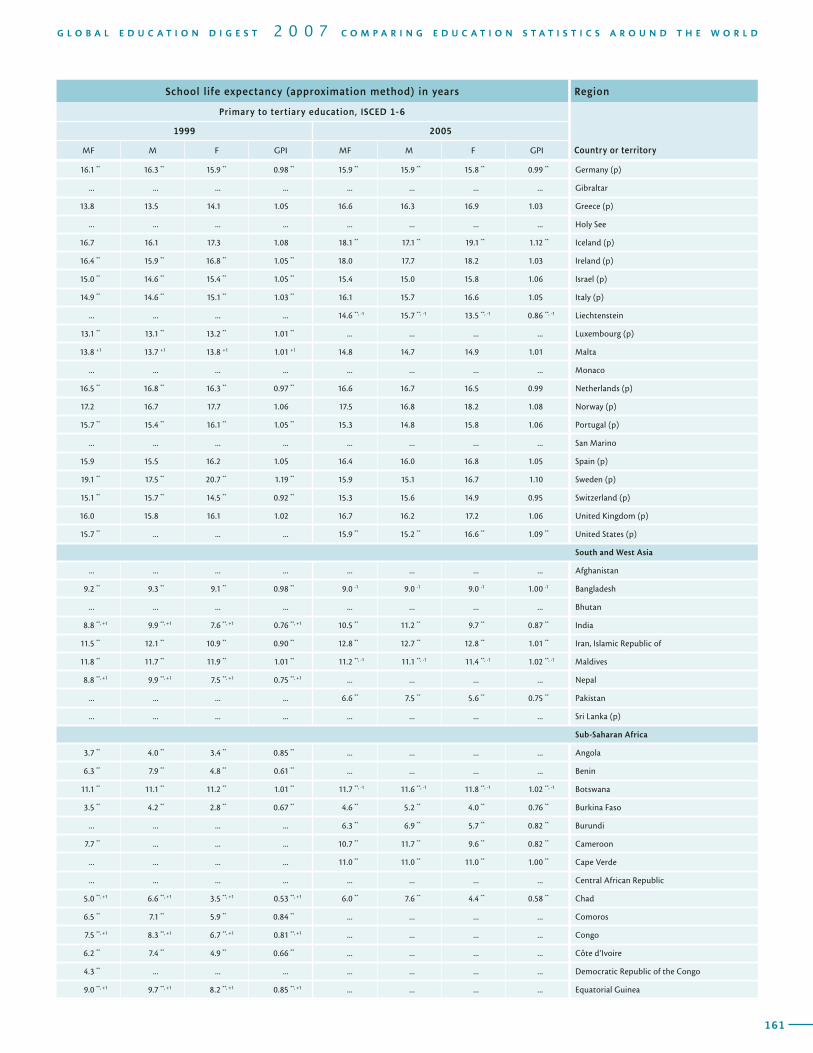
160
T A B L E SCHOOL LIFE EXPECTANCY12Region School life expectancy (approximation method) in years
Country or territory
Pre-primary education, ISCED 0 Primary and secondary education, ISCED 1-3
2005 2005
MF M F MF M F GPI
161
G L O B A L E D U C A T I O N D I G E S T 2 0 0 7 C O M P A R I N G E D U C A T I O N S T A T I S T I C S A R O U N D T H E W O R L D
School life expectancy (approximation method) in years Region
Primary to tertiary education, ISCED 1-6
Country or territory
1999 2005
MF M F GPI MF M F GPI
16.1 ** 16.3 ** 15.9 ** 0.98 ** 15.9 ** 15.9 ** 15.8 ** 0.99 ** Germany (p)
... ... ... ... ... ... ... ... Gibraltar
13.8 13.5 14.1 1.05 16.6 16.3 16.9 1.03 Greece (p)
... ... ... ... ... ... ... ... Holy See
16.7 16.1 17.3 1.08 18.1 ** 17.1 ** 19.1 ** 1.12 ** Iceland (p)
16.4 ** 15.9 ** 16.8 ** 1.05 ** 18.0 17.7 18.2 1.03 Ireland (p)
15.0 ** 14.6 ** 15.4 ** 1.05 ** 15.4 15.0 15.8 1.06 Israel (p)
14.9 ** 14.6 ** 15.1 ** 1.03 ** 16.1 15.7 16.6 1.05 Italy (p)
... ... ... ... 14.6 **, -1 15.7 **, -1 13.5 **, -1 0.86 **, -1 Liechtenstein
13.1 ** 13.1 ** 13.2 ** 1.01 ** ... ... ... ... Luxembourg (p)
13.8 +1 13.7 +1 13.8 +1 1.01 +1 14.8 14.7 14.9 1.01 Malta
... ... ... ... ... ... ... ... Monaco
16.5 ** 16.8 ** 16.3 ** 0.97 ** 16.6 16.7 16.5 0.99 Netherlands (p)
17.2 16.7 17.7 1.06 17.5 16.8 18.2 1.08 Norway (p)
15.7 ** 15.4 ** 16.1 ** 1.05 ** 15.3 14.8 15.8 1.06 Portugal (p)
... ... ... ... ... ... ... ... San Marino
15.9 15.5 16.2 1.05 16.4 16.0 16.8 1.05 Spain (p)
19.1 ** 17.5 ** 20.7 ** 1.19 ** 15.9 15.1 16.7 1.10 Sweden (p)
15.1 ** 15.7 ** 14.5 ** 0.92 ** 15.3 15.6 14.9 0.95 Switzerland (p)
16.0 15.8 16.1 1.02 16.7 16.2 17.2 1.06 United Kingdom (p)
15.7 ** ... ... ... 15.9 ** 15.2 ** 16.6 ** 1.09 ** United States (p)
South and West Asia
... ... ... ... ... ... ... ... Afghanistan
9.2 ** 9.3 ** 9.1 ** 0.98 ** 9.0 -1 9.0 -1 9.0 -1 1.00 -1 Bangladesh
... ... ... ... ... ... ... ... Bhutan
8.8 **, +1 9.9 **, +1 7.6 **, +1 0.76 **, +1 10.5 ** 11.2 ** 9.7 ** 0.87 ** India
11.5 ** 12.1 ** 10.9 ** 0.90 ** 12.8 ** 12.7 ** 12.8 ** 1.01 ** Iran, Islamic Republic of
11.8 ** 11.7 ** 11.9 ** 1.01 ** 11.2 **, -1 11.1 **, -1 11.4 **, -1 1.02 **, -1 Maldives
8.8 **, +1 9.9 **, +1 7.5 **, +1 0.75 **, +1 ... ... ... ... Nepal
... ... ... ... 6.6 ** 7.5 ** 5.6 ** 0.75 ** Pakistan
... ... ... ... ... ... ... ... Sri Lanka (p)
Sub-Saharan Africa
3.7 ** 4.0 ** 3.4 ** 0.85 ** ... ... ... ... Angola
6.3 ** 7.9 ** 4.8 ** 0.61 ** ... ... ... ... Benin
11.1 ** 11.1 ** 11.2 ** 1.01 ** 11.7 **, -1 11.6 **, -1 11.8 **, -1 1.02 **, -1 Botswana
3.5 ** 4.2 ** 2.8 ** 0.67 ** 4.6 ** 5.2 ** 4.0 ** 0.76 ** Burkina Faso
... ... ... ... 6.3 ** 6.9 ** 5.7 ** 0.82 ** Burundi
7.7 ** ... ... ... 10.7 ** 11.7 ** 9.6 ** 0.82 ** Cameroon
... ... ... ... 11.0 ** 11.0 ** 11.0 ** 1.00 ** Cape Verde
... ... ... ... ... ... ... ... Central African Republic
5.0 **, +1 6.6 **, +1 3.5 **, +1 0.53 **, +1 6.0 ** 7.6 ** 4.4 ** 0.58 ** Chad
6.5 ** 7.1 ** 5.9 ** 0.84 ** ... ... ... ... Comoros
7.5 **, +1 8.3 **, +1 6.7 **, +1 0.81 **, +1 ... ... ... ... Congo
6.2 ** 7.4 ** 4.9 ** 0.66 ** ... ... ... ... Côte d’Ivoire
4.3 ** ... ... ... ... ... ... ... Democratic Republic of the Congo
9.0 **, +1 9.7 **, +1 8.2 **, +1 0.85 **, +1 ... ... ... ... Equatorial Guinea
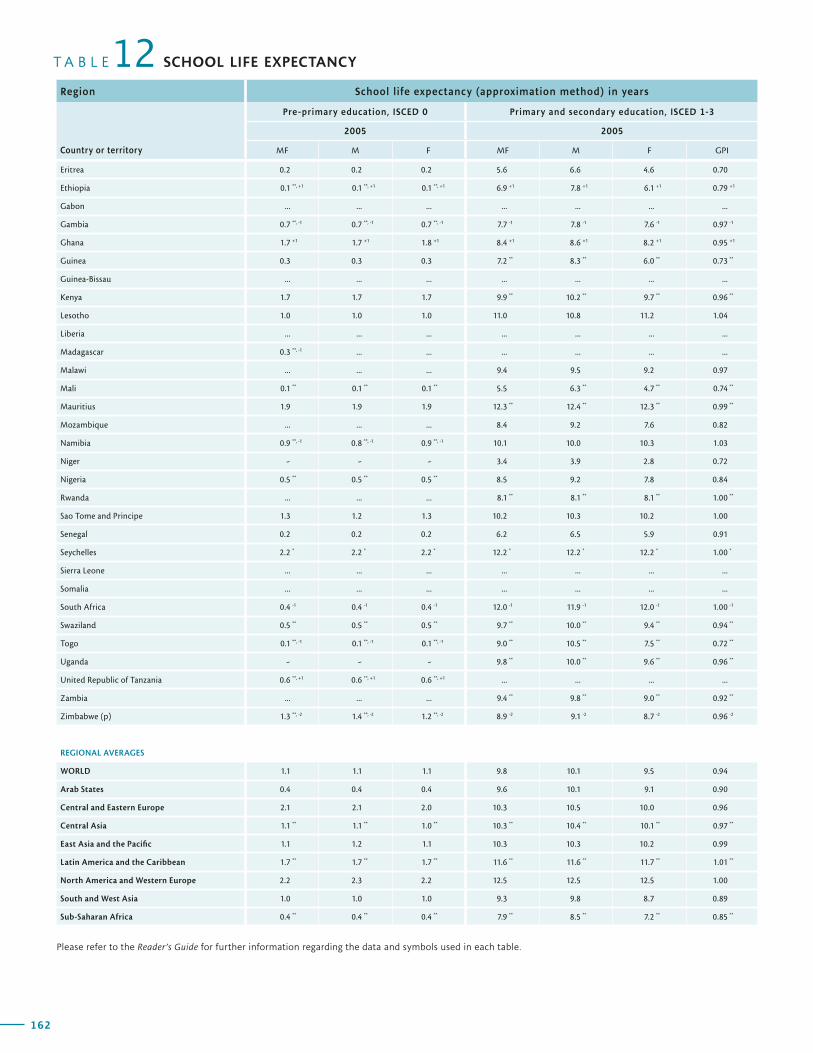
162
T A B L E SCHOOL LIFE EXPECTANCY12Region School life expectancy (approximation method) in years
Country or territory
Pre-primary education, ISCED 0 Primary and secondary education, ISCED 1-3
2005 2005
MF M F MF M F GPI
163
G L O B A L E D U C A T I O N D I G E S T 2 0 0 7 C O M P A R I N G E D U C A T I O N S T A T I S T I C S A R O U N D T H E W O R L D
School life expectancy (approximation method) in years Region
Primary to tertiary education, ISCED 1-6
Country or territory
1999 2005
MF M F GPI MF M F GPI
Eritrea 0.2 0.2 0.2 5.6 6.6 4.6 0.70
Ethiopia 0.1 **, +1 0.1 **, +1 0.1 **, +1 6.9 +1 7.8 +1 6.1 +1 0.79 +1
Gabon ... ... ... ... ... ... ...
Gambia 0.7 **, -1 0.7 **, -1 0.7 **, -1 7.7 -1 7.8 -1 7.6 -1 0.97 -1
Ghana 1.7 +1 1.7 +1 1.8 +1 8.4 +1 8.6 +1 8.2 +1 0.95 +1
Guinea 0.3 0.3 0.3 7.2 ** 8.3 ** 6.0 ** 0.73 **
Guinea-Bissau ... ... ... ... ... ... ...
Kenya 1.7 1.7 1.7 9.9 ** 10.2 ** 9.7 ** 0.96 **
Lesotho 1.0 1.0 1.0 11.0 10.8 11.2 1.04
Liberia ... ... ... ... ... ... ...
Madagascar 0.3 **, -1 ... ... ... ... ... ...
Malawi ... ... ... 9.4 9.5 9.2 0.97
Mali 0.1 ** 0.1 ** 0.1 ** 5.5 6.3 ** 4.7 ** 0.74 **
Mauritius 1.9 1.9 1.9 12.3 ** 12.4 ** 12.3 ** 0.99 **
Mozambique ... ... ... 8.4 9.2 7.6 0.82
Namibia 0.9 **, -1 0.8 **, -1 0.9 **, -1 10.1 10.0 10.3 1.03
Niger - - - 3.4 3.9 2.8 0.72
Nigeria 0.5 ** 0.5 ** 0.5 ** 8.5 9.2 7.8 0.84
Rwanda ... ... ... 8.1 ** 8.1 ** 8.1 ** 1.00 **
Sao Tome and Principe 1.3 1.2 1.3 10.2 10.3 10.2 1.00
Senegal 0.2 0.2 0.2 6.2 6.5 5.9 0.91
Seychelles 2.2 * 2.2 * 2.2 * 12.2 * 12.2 * 12.2 * 1.00 *
Sierra Leone ... ... ... ... ... ... ...
Somalia ... ... ... ... ... ... ...
South Africa 0.4 -1 0.4 -1 0.4 -1 12.0 -1 11.9 -1 12.0 -1 1.00 -1
Swaziland 0.5 ** 0.5 ** 0.5 ** 9.7 ** 10.0 ** 9.4 ** 0.94 **
Togo 0.1 **, -1 0.1 **, -1 0.1 **, -1 9.0 ** 10.5 ** 7.5 ** 0.72 **
Uganda - - - 9.8 ** 10.0 ** 9.6 ** 0.96 **
United Republic of Tanzania 0.6 **, +1 0.6 **, +1 0.6 **, +1 ... ... ... ...
Zambia ... ... ... 9.4 ** 9.8 ** 9.0 ** 0.92 **
Zimbabwe (p) 1.3 **, -2 1.4 **, -2 1.2 **, -2 8.9 -2 9.1 -2 8.7 -2 0.96 -2
REGIONAL AVERAGES
WORLD 1.1 1.1 1.1 9.8 10.1 9.5 0.94
Arab States 0.4 0.4 0.4 9.6 10.1 9.1 0.90
Central and Eastern Europe 2.1 2.1 2.0 10.3 10.5 10.0 0.96
Central Asia 1.1 ** 1.1 ** 1.0 ** 10.3 ** 10.4 ** 10.1 ** 0.97 **
East Asia and the Pacific 1.1 1.2 1.1 10.3 10.3 10.2 0.99
Latin America and the Caribbean 1.7 ** 1.7 ** 1.7 ** 11.6 ** 11.6 ** 11.7 ** 1.01 **
North America and Western Europe 2.2 2.3 2.2 12.5 12.5 12.5 1.00
South and West Asia 1.0 1.0 1.0 9.3 9.8 8.7 0.89
Sub-Saharan Africa 0.4 ** 0.4 ** 0.4 ** 7.9 ** 8.5 ** 7.2 ** 0.85 **
Please refer to the Reader’s Guide for further information regarding the data and symbols used in each table.
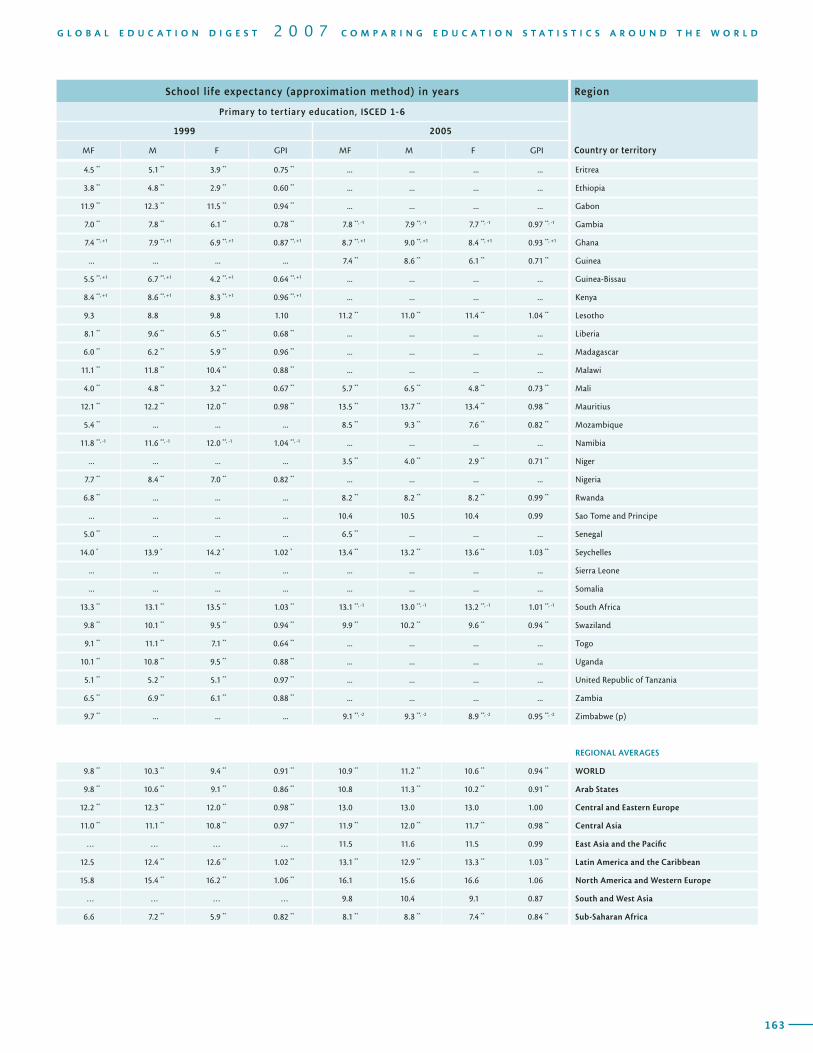
162
T A B L E SCHOOL LIFE EXPECTANCY12Region School life expectancy (approximation method) in years
Country or territory
Pre-primary education, ISCED 0 Primary and secondary education, ISCED 1-3
2005 2005
MF M F MF M F GPI
163
G L O B A L E D U C A T I O N D I G E S T 2 0 0 7 C O M P A R I N G E D U C A T I O N S T A T I S T I C S A R O U N D T H E W O R L D
School life expectancy (approximation method) in years Region
Primary to tertiary education, ISCED 1-6
Country or territory
1999 2005
MF M F GPI MF M F GPI
4.5 ** 5.1 ** 3.9 ** 0.75 ** ... ... ... ... Eritrea
3.8 ** 4.8 ** 2.9 ** 0.60 ** ... ... ... ... Ethiopia
11.9 ** 12.3 ** 11.5 ** 0.94 ** ... ... ... ... Gabon
7.0 ** 7.8 ** 6.1 ** 0.78 ** 7.8 **, -1 7.9 **, -1 7.7 **, -1 0.97 **, -1 Gambia
7.4 **, +1 7.9 **, +1 6.9 **, +1 0.87 **, +1 8.7 **, +1 9.0 **, +1 8.4 **, +1 0.93 **, +1 Ghana
... ... ... ... 7.4 ** 8.6 ** 6.1 ** 0.71 ** Guinea
5.5 **, +1 6.7 **, +1 4.2 **, +1 0.64 **, +1 ... ... ... ... Guinea-Bissau
8.4 **, +1 8.6 **, +1 8.3 **, +1 0.96 **, +1 ... ... ... ... Kenya
9.3 8.8 9.8 1.10 11.2 ** 11.0 ** 11.4 ** 1.04 ** Lesotho
8.1 ** 9.6 ** 6.5 ** 0.68 ** ... ... ... ... Liberia
6.0 ** 6.2 ** 5.9 ** 0.96 ** ... ... ... ... Madagascar
11.1 ** 11.8 ** 10.4 ** 0.88 ** ... ... ... ... Malawi
4.0 ** 4.8 ** 3.2 ** 0.67 ** 5.7 ** 6.5 ** 4.8 ** 0.73 ** Mali
12.1 ** 12.2 ** 12.0 ** 0.98 ** 13.5 ** 13.7 ** 13.4 ** 0.98 ** Mauritius
5.4 ** ... ... ... 8.5 ** 9.3 ** 7.6 ** 0.82 ** Mozambique
11.8 **, -1 11.6 **, -1 12.0 **, -1 1.04 **, -1 ... ... ... ... Namibia
... ... ... ... 3.5 ** 4.0 ** 2.9 ** 0.71 ** Niger
7.7 ** 8.4 ** 7.0 ** 0.82 ** ... ... ... ... Nigeria
6.8 ** ... ... ... 8.2 ** 8.2 ** 8.2 ** 0.99 ** Rwanda
... ... ... ... 10.4 10.5 10.4 0.99 Sao Tome and Principe
5.0 ** ... ... ... 6.5 ** ... ... ... Senegal
14.0 * 13.9 * 14.2 * 1.02 * 13.4 ** 13.2 ** 13.6 ** 1.03 ** Seychelles
... ... ... ... ... ... ... ... Sierra Leone
... ... ... ... ... ... ... ... Somalia
13.3 ** 13.1 ** 13.5 ** 1.03 ** 13.1 **, -1 13.0 **, -1 13.2 **, -1 1.01 **, -1 South Africa
9.8 ** 10.1 ** 9.5 ** 0.94 ** 9.9 ** 10.2 ** 9.6 ** 0.94 ** Swaziland
9.1 ** 11.1 ** 7.1 ** 0.64 ** ... ... ... ... Togo
10.1 ** 10.8 ** 9.5 ** 0.88 ** ... ... ... ... Uganda
5.1 ** 5.2 ** 5.1 ** 0.97 ** ... ... ... ... United Republic of Tanzania
6.5 ** 6.9 ** 6.1 ** 0.88 ** ... ... ... ... Zambia
9.7 ** ... ... ... 9.1 **, -2 9.3 **, -2 8.9 **, -2 0.95 **, -2 Zimbabwe (p)
REGIONAL AVERAGES
9.8 ** 10.3 ** 9.4 ** 0.91 ** 10.9 ** 11.2 ** 10.6 ** 0.94 ** WORLD
9.8 ** 10.6 ** 9.1 ** 0.86 ** 10.8 11.3 ** 10.2 ** 0.91 ** Arab States
12.2 ** 12.3 ** 12.0 ** 0.98 ** 13.0 13.0 13.0 1.00 Central and Eastern Europe
11.0 ** 11.1 ** 10.8 ** 0.97 ** 11.9 ** 12.0 ** 11.7 ** 0.98 ** Central Asia
… … … … 11.5 11.6 11.5 0.99 East Asia and the Pacific
12.5 12.4 ** 12.6 ** 1.02 ** 13.1 ** 12.9 ** 13.3 ** 1.03 ** Latin America and the Caribbean
15.8 15.4 ** 16.2 ** 1.06 ** 16.1 15.6 16.6 1.06 North America and Western Europe
… … … … 9.8 10.4 9.1 0.87 South and West Asia
6.6 7.2 ** 5.9 ** 0.82 ** 8.1 ** 8.8 ** 7.4 ** 0.84 ** Sub-Saharan Africa
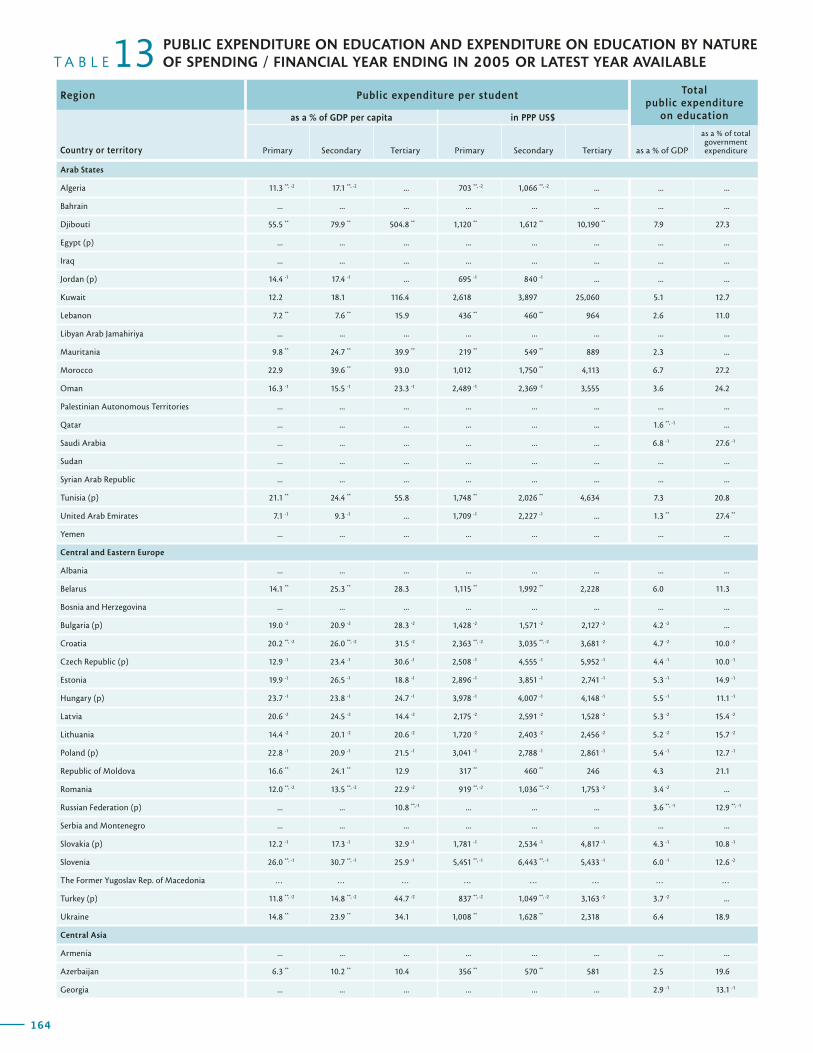
164
Region Public expenditure per student Total public expenditure
on education
Country or territory
as a % of GDP per capita in PPP US$
Primary Secondary Tertiary Primary Secondary Tertiary as a % of GDP
as a % of total government expenditure
T A B L E 13 PUBLIC EXPENDITURE ON EDUCATION AND EXPENDITURE ON EDUCATION BY NATURE OF SPENDING / FINANCIAL YEAR ENDING IN 2005 OR LATEST YEAR AVAILABLE
165
G L O B A L E D U C A T I O N D I G E S T 2 0 0 7 C O M P A R I N G E D U C A T I O N S T A T I S T I C S A R O U N D T H E W O R L D
Region Public expenditure per student Total public expenditure
on education
Country or territory
as a % of GDP per capita in PPP US$
Primary Secondary Tertiary Primary Secondary Tertiary as a % of GDP
as a % of total government expenditure
Educational expenditure by nature of spending as a % of total educational expenditure in public institutions
Region
Primary, secondary and post-secondary non-tertiary Tertiary
Country or territorySalaries, all staff Other current Total current Capital
Salaries, all staff Other current Total current Capital
Arab States
Algeria 11.3 **, -2 17.1 **, -2 ... 703 **, -2 1,066 **, -2 ... ... ...
Bahrain ... ... ... ... ... ... ... ...
Djibouti 55.5 ** 79.9 ** 504.8 ** 1,120 ** 1,612 ** 10,190 ** 7.9 27.3
Egypt (p) ... ... ... ... ... ... ... ...
Iraq ... ... ... ... ... ... ... ...
Jordan (p) 14.4 -1 17.4 -1 ... 695 -1 840 -1 ... ... ...
Kuwait 12.2 18.1 116.4 2,618 3,897 25,060 5.1 12.7
Lebanon 7.2 ** 7.6 ** 15.9 436 ** 460 ** 964 2.6 11.0
Libyan Arab Jamahiriya ... ... ... ... ... ... ... ...
Mauritania 9.8 ** 24.7 ** 39.9 ** 219 ** 549 ** 889 2.3 ...
Morocco 22.9 39.6 ** 93.0 1,012 1,750 ** 4,113 6.7 27.2
Oman 16.3 -1 15.5 -1 23.3 -1 2,489 -1 2,369 -1 3,555 3.6 24.2
Palestinian Autonomous Territories ... ... ... ... ... ... ... ...
Qatar ... ... ... ... ... ... 1.6 **, -1 ...
Saudi Arabia ... ... ... ... ... ... 6.8 -1 27.6 -1
Sudan ... ... ... ... ... ... ... ...
Syrian Arab Republic ... ... ... ... ... ... ... ...
Tunisia (p) 21.1 ** 24.4 ** 55.8 1,748 ** 2,026 ** 4,634 7.3 20.8
United Arab Emirates 7.1 -1 9.3 -1 ... 1,709 -1 2,227 -1 ... 1.3 ** 27.4 **
Yemen ... ... ... ... ... ... ... ...
Central and Eastern Europe
Albania ... ... ... ... ... ... ... ...
Belarus 14.1 ** 25.3 ** 28.3 1,115 ** 1,992 ** 2,228 6.0 11.3
Bosnia and Herzegovina ... ... ... ... ... ... ... ...
Bulgaria (p) 19.0 -2 20.9 -2 28.3 -2 1,428 -2 1,571 -2 2,127 -2 4.2 -2 ...
Croatia 20.2 **, -2 26.0 **, -2 31.5 -2 2,363 **, -2 3,035 **, -2 3,681 -2 4.7 -2 10.0 -2
Czech Republic (p) 12.9 -1 23.4 -1 30.6 -1 2,508 -1 4,555 -1 5,952 -1 4.4 -1 10.0 -1
Estonia 19.9 -1 26.5 -1 18.8 -1 2,896 -1 3,851 -1 2,741 -1 5.3 -1 14.9 -1
Hungary (p) 23.7 -1 23.8 -1 24.7 -1 3,978 -1 4,007 -1 4,148 -1 5.5 -1 11.1 -1
Latvia 20.6 -2 24.5 -2 14.4 -2 2,175 -2 2,591 -2 1,528 -2 5.3 -2 15.4 -2
Lithuania 14.4 -2 20.1 -2 20.6 -2 1,720 -2 2,403 -2 2,456 -2 5.2 -2 15.7 -2
Poland (p) 22.8 -1 20.9 -1 21.5 -1 3,041 -1 2,788 -1 2,861 -1 5.4 -1 12.7 -1
Republic of Moldova 16.6 ** 24.1 ** 12.9 317 ** 460 ** 246 4.3 21.1
Romania 12.0 **, -2 13.5 **, -2 22.9 -2 919 **, -2 1,036 **, -2 1,753 -2 3.4 -2 ...
Russian Federation (p) ... ... 10.8 **,-1 ... ... ... 3.6 **, -1 12.9 **, -1
Serbia and Montenegro ... ... ... ... ... ... ... ...
Slovakia (p) 12.2 -1 17.3 -1 32.9 -1 1,781 -1 2,534 -1 4,817 -1 4.3 -1 10.8 -1
Slovenia 26.0 **, -1 30.7 **, -1 25.9 -1 5,451 **, -1 6,443 **, -1 5,433 -1 6.0 -1 12.6 -2
The Former Yugoslav Rep. of Macedonia … … … … … … … …
Turkey (p) 11.8 **, -2 14.8 **, -2 44.7 -2 837 **, -2 1,049 **, -2 3,163 -2 3.7 -2 ...
Ukraine 14.8 ** 23.9 ** 34.1 1,008 ** 1,628 ** 2,318 6.4 18.9
Central Asia
Armenia ... ... ... ... ... ... ... ...
Azerbaijan 6.3 ** 10.2 ** 10.4 356 ** 570 ** 581 2.5 19.6
Georgia ... ... ... ... ... ... 2.9 -1 13.1 -1
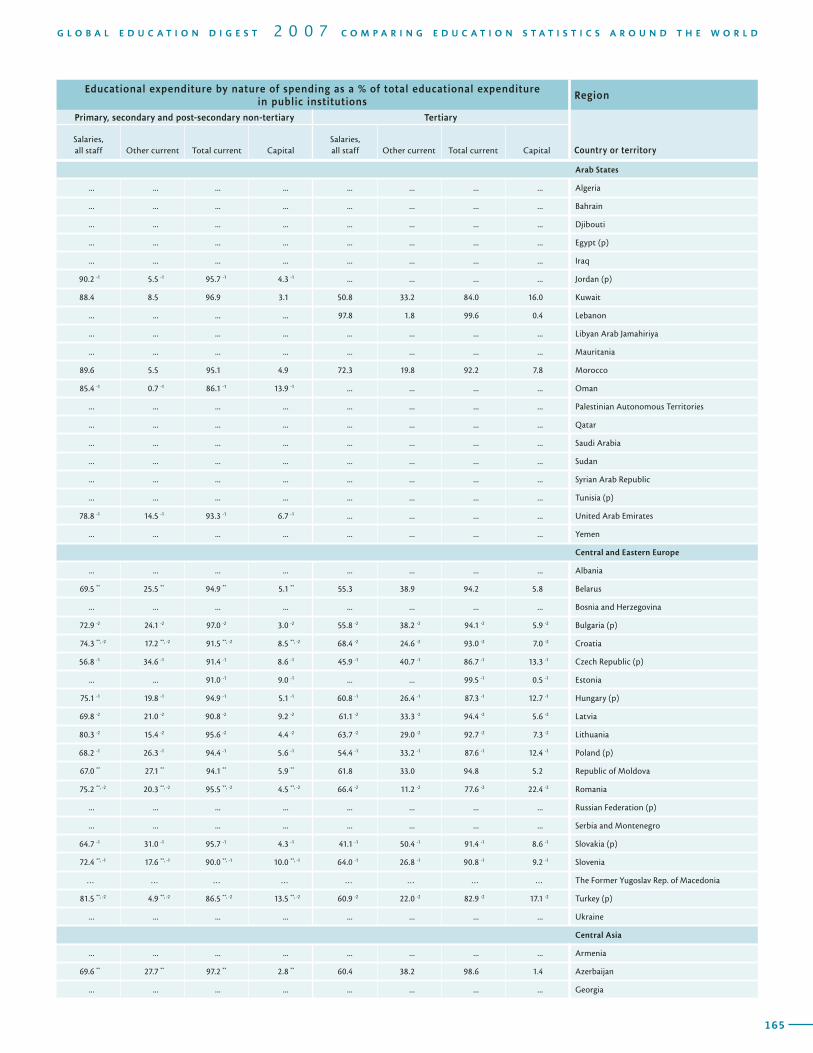
164
Region Public expenditure per student Total public expenditure
on education
Country or territory
as a % of GDP per capita in PPP US$
Primary Secondary Tertiary Primary Secondary Tertiary as a % of GDP
as a % of total government expenditure
T A B L E 13 PUBLIC EXPENDITURE ON EDUCATION AND EXPENDITURE ON EDUCATION BY NATURE OF SPENDING / FINANCIAL YEAR ENDING IN 2005 OR LATEST YEAR AVAILABLE
165
G L O B A L E D U C A T I O N D I G E S T 2 0 0 7 C O M P A R I N G E D U C A T I O N S T A T I S T I C S A R O U N D T H E W O R L D
Region Public expenditure per student Total public expenditure
on education
Country or territory
as a % of GDP per capita in PPP US$
Primary Secondary Tertiary Primary Secondary Tertiary as a % of GDP
as a % of total government expenditure
Educational expenditure by nature of spending as a % of total educational expenditure in public institutions
Region
Primary, secondary and post-secondary non-tertiary Tertiary
Country or territorySalaries, all staff Other current Total current Capital
Salaries, all staff Other current Total current Capital
Arab States
... ... ... ... ... ... ... ... Algeria
... ... ... ... ... ... ... ... Bahrain
... ... ... ... ... ... ... ... Djibouti
... ... ... ... ... ... ... ... Egypt (p)
... ... ... ... ... ... ... ... Iraq
90.2 -1 5.5 -1 95.7 -1 4.3 -1 ... ... ... ... Jordan (p)
88.4 8.5 96.9 3.1 50.8 33.2 84.0 16.0 Kuwait
... ... ... ... 97.8 1.8 99.6 0.4 Lebanon
... ... ... ... ... ... ... ... Libyan Arab Jamahiriya
... ... ... ... ... ... ... ... Mauritania
89.6 5.5 95.1 4.9 72.3 19.8 92.2 7.8 Morocco
85.4 -1 0.7 -1 86.1 -1 13.9 -1 ... ... ... ... Oman
... ... ... ... ... ... ... ... Palestinian Autonomous Territories
... ... ... ... ... ... ... ... Qatar
... ... ... ... ... ... ... ... Saudi Arabia
... ... ... ... ... ... ... ... Sudan
... ... ... ... ... ... ... ... Syrian Arab Republic
... ... ... ... ... ... ... ... Tunisia (p)
78.8 -1 14.5 -1 93.3 -1 6.7 -1 ... ... ... ... United Arab Emirates
... ... ... ... ... ... ... ... Yemen
Central and Eastern Europe
... ... ... ... ... ... ... ... Albania
69.5 ** 25.5 ** 94.9 ** 5.1 ** 55.3 38.9 94.2 5.8 Belarus
... ... ... ... ... ... ... ... Bosnia and Herzegovina
72.9 -2 24.1 -2 97.0 -2 3.0 -2 55.8 -2 38.2 -2 94.1 -2 5.9 -2 Bulgaria (p)
74.3 **, -2 17.2 **, -2 91.5 **, -2 8.5 **, -2 68.4 -2 24.6 -2 93.0 -2 7.0 -2 Croatia
56.8 -1 34.6 -1 91.4 -1 8.6 -1 45.9 -1 40.7 -1 86.7 -1 13.3 -1 Czech Republic (p)
... ... 91.0 -1 9.0 -1 ... ... 99.5 -1 0.5 -1 Estonia
75.1 -1 19.8 -1 94.9 -1 5.1 -1 60.8 -1 26.4 -1 87.3 -1 12.7 -1 Hungary (p)
69.8 -2 21.0 -2 90.8 -2 9.2 -2 61.1 -2 33.3 -2 94.4 -2 5.6 -2 Latvia
80.3 -2 15.4 -2 95.6 -2 4.4 -2 63.7 -2 29.0 -2 92.7 -2 7.3 -2 Lithuania
68.2 -1 26.3 -1 94.4 -1 5.6 -1 54.4 -1 33.2 -1 87.6 -1 12.4 -1 Poland (p)
67.0 ** 27.1 ** 94.1 ** 5.9 ** 61.8 33.0 94.8 5.2 Republic of Moldova
75.2 **, -2 20.3 **, -2 95.5 **, -2 4.5 **, -2 66.4 -2 11.2 -2 77.6 -2 22.4 -2 Romania
... ... ... ... ... ... ... ... Russian Federation (p)
... ... ... ... ... ... ... ... Serbia and Montenegro
64.7 -1 31.0 -1 95.7 -1 4.3 -1 41.1 -1 50.4 -1 91.4 -1 8.6 -1 Slovakia (p)
72.4 **, -1 17.6 **, -1 90.0 **, -1 10.0 **, -1 64.0 -1 26.8 -1 90.8 -1 9.2 -1 Slovenia
… … … … … … … … The Former Yugoslav Rep. of Macedonia
81.5 **, -2 4.9 **, -2 86.5 **, -2 13.5 **, -2 60.9 -2 22.0 -2 82.9 -2 17.1 -2 Turkey (p)
... ... ... ... ... ... ... ... Ukraine
Central Asia
... ... ... ... ... ... ... ... Armenia
69.6 ** 27.7 ** 97.2 ** 2.8 ** 60.4 38.2 98.6 1.4 Azerbaijan
... ... ... ... ... ... ... ... Georgia
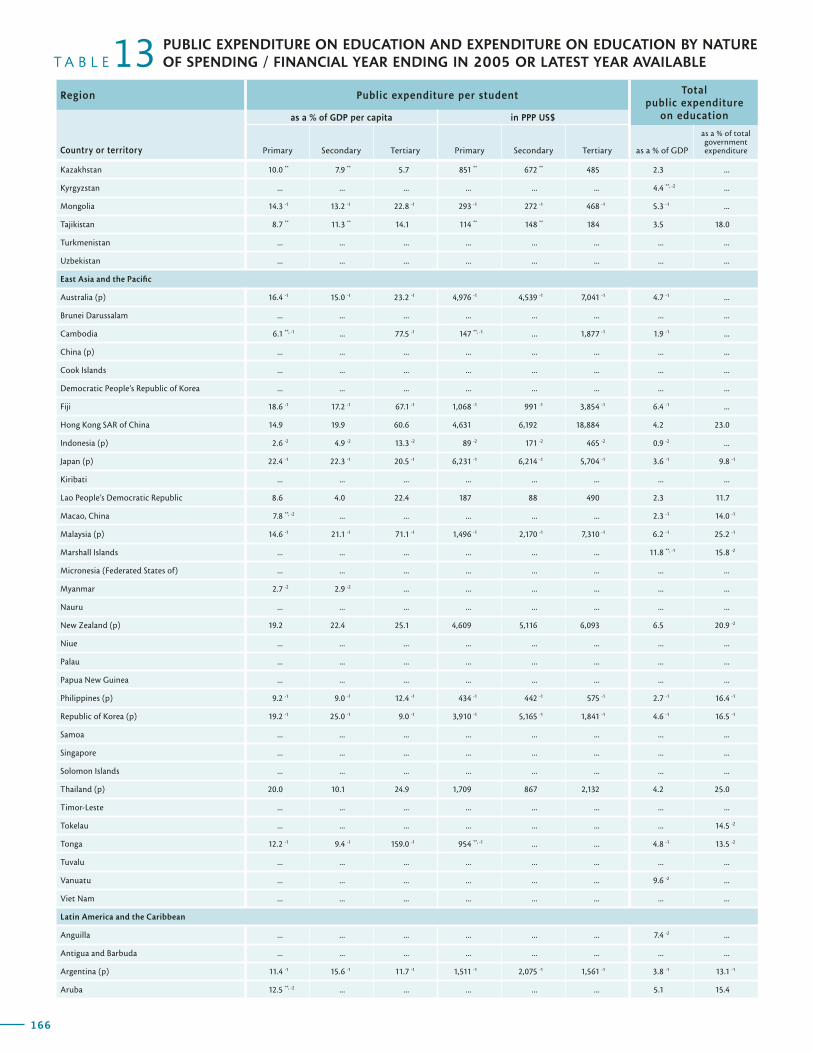
166
Region Public expenditure per student Total public expenditure
on education
Country or territory
as a % of GDP per capita in PPP US$
Primary Secondary Tertiary Primary Secondary Tertiary as a % of GDP
as a % of total government expenditure
T A B L E 13 PUBLIC EXPENDITURE ON EDUCATION AND EXPENDITURE ON EDUCATION BY NATURE OF SPENDING / FINANCIAL YEAR ENDING IN 2005 OR LATEST YEAR AVAILABLE
167
G L O B A L E D U C A T I O N D I G E S T 2 0 0 7 C O M P A R I N G E D U C A T I O N S T A T I S T I C S A R O U N D T H E W O R L D
Region Public expenditure per student Total public expenditure
on education
Country or territory
as a % of GDP per capita in PPP US$
Primary Secondary Tertiary Primary Secondary Tertiary as a % of GDP
as a % of total government expenditure
Educational expenditure by nature of spending as a % of total educational expenditure in public institutions
Region
Primary, secondary and post-secondary non-tertiary Tertiary
Country or territorySalaries, all staff Other current Total current Capital
Salaries, all staff Other current Total current Capital
Kazakhstan 10.0 ** 7.9 ** 5.7 851 ** 672 ** 485 2.3 ...
Kyrgyzstan ... ... ... ... ... ... 4.4 **, -2 ...
Mongolia 14.3 -1 13.2 -1 22.8 -1 293 -1 272 -1 468 -1 5.3 -1 ...
Tajikistan 8.7 ** 11.3 ** 14.1 114 ** 148 ** 184 3.5 18.0
Turkmenistan ... ... ... ... ... ... ... ...
Uzbekistan ... ... ... ... ... ... ... ...
East Asia and the Pacific
Australia (p) 16.4 -1 15.0 -1 23.2 -1 4,976 -1 4,539 -1 7,041 -1 4.7 -1 ...
Brunei Darussalam ... ... ... ... ... ... ... ...
Cambodia 6.1 **, -1 ... 77.5 -1 147 **, -1 ... 1,877 -1 1.9 -1 ...
China (p) ... ... ... ... ... ... ... ...
Cook Islands ... ... ... ... ... ... ... ...
Democratic People’s Republic of Korea ... ... ... ... ... ... ... ...
Fiji 18.6 -1 17.2 -1 67.1 -1 1,068 -1 991 -1 3,854 -1 6.4 -1 ...
Hong Kong SAR of China 14.9 19.9 60.6 4,631 6,192 18,884 4.2 23.0
Indonesia (p) 2.6 -2 4.9 -2 13.3 -2 89 -2 171 -2 465 -2 0.9 -2 ...
Japan (p) 22.4 -1 22.3 -1 20.5 -1 6,231 -1 6,214 -1 5,704 -1 3.6 -1 9.8 -1
Kiribati ... ... ... ... ... ... ... ...
Lao People’s Democratic Republic 8.6 4.0 22.4 187 88 490 2.3 11.7
Macao, China 7.8 **, -2 ... ... ... ... ... 2.3 -1 14.0 -1
Malaysia (p) 14.6 -1 21.1 -1 71.1 -1 1,496 -1 2,170 -1 7,310 -1 6.2 -1 25.2 -1
Marshall Islands ... ... ... ... ... ... 11.8 **, -1 15.8 -2
Micronesia (Federated States of) ... ... ... ... ... ... ... ...
Myanmar 2.7 -2 2.9 -2 ... ... ... ... ... ...
Nauru ... ... ... ... ... ... ... ...
New Zealand (p) 19.2 22.4 25.1 4,609 5,116 6,093 6.5 20.9 -2
Niue ... ... ... ... ... ... ... ...
Palau ... ... ... ... ... ... ... ...
Papua New Guinea ... ... ... ... ... ... ... ...
Philippines (p) 9.2 -1 9.0 -1 12.4 -1 434 -1 442 -1 575 -1 2.7 -1 16.4 -1
Republic of Korea (p) 19.2 -1 25.0 -1 9.0 -1 3,910 -1 5,165 -1 1,841 -1 4.6 -1 16.5 -1
Samoa ... ... ... ... ... ... ... ...
Singapore ... ... ... ... ... ... ... ...
Solomon Islands ... ... ... ... ... ... ... ...
Thailand (p) 20.0 10.1 24.9 1,709 867 2,132 4.2 25.0
Timor-Leste ... ... ... ... ... ... ... ...
Tokelau ... ... ... ... ... ... ... 14.5 -2
Tonga 12.2 -1 9.4 -1 159.0 -1 954 **, -1 ... ... 4.8 -1 13.5 -2
Tuvalu ... ... ... ... ... ... ... ...
Vanuatu ... ... ... ... ... ... 9.6 -2 ...
Viet Nam ... ... ... ... ... ... ... ...
Latin America and the Caribbean
Anguilla ... ... ... ... ... ... 7.4 -2 ...
Antigua and Barbuda ... ... ... ... ... ... ... ...
Argentina (p) 11.4 -1 15.6 -1 11.7 -1 1,511 -1 2,075 -1 1,561 -1 3.8 -1 13.1 -1
Aruba 12.5 **, -2 ... ... ... ... ... 5.1 15.4
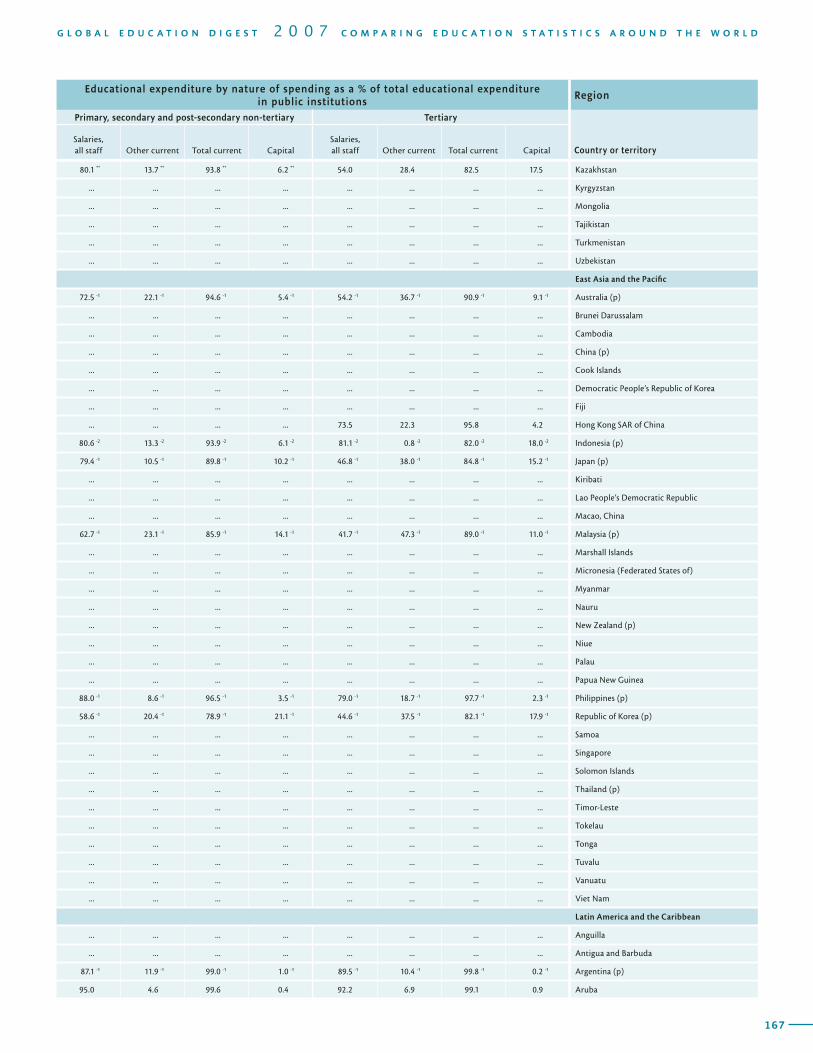
166
Region Public expenditure per student Total public expenditure
on education
Country or territory
as a % of GDP per capita in PPP US$
Primary Secondary Tertiary Primary Secondary Tertiary as a % of GDP
as a % of total government expenditure
T A B L E 13 PUBLIC EXPENDITURE ON EDUCATION AND EXPENDITURE ON EDUCATION BY NATURE OF SPENDING / FINANCIAL YEAR ENDING IN 2005 OR LATEST YEAR AVAILABLE
167
G L O B A L E D U C A T I O N D I G E S T 2 0 0 7 C O M P A R I N G E D U C A T I O N S T A T I S T I C S A R O U N D T H E W O R L D
Region Public expenditure per student Total public expenditure
on education
Country or territory
as a % of GDP per capita in PPP US$
Primary Secondary Tertiary Primary Secondary Tertiary as a % of GDP
as a % of total government expenditure
Educational expenditure by nature of spending as a % of total educational expenditure in public institutions
Region
Primary, secondary and post-secondary non-tertiary Tertiary
Country or territorySalaries, all staff Other current Total current Capital
Salaries, all staff Other current Total current Capital
80.1 ** 13.7 ** 93.8 ** 6.2 ** 54.0 28.4 82.5 17.5 Kazakhstan
... ... ... ... ... ... ... ... Kyrgyzstan
... ... ... ... ... ... ... ... Mongolia
... ... ... ... ... ... ... ... Tajikistan
... ... ... ... ... ... ... ... Turkmenistan
... ... ... ... ... ... ... ... Uzbekistan
East Asia and the Pacific
72.5 -1 22.1 -1 94.6 -1 5.4 -1 54.2 -1 36.7 -1 90.9 -1 9.1 -1 Australia (p)
... ... ... ... ... ... ... ... Brunei Darussalam
... ... ... ... ... ... ... ... Cambodia
... ... ... ... ... ... ... ... China (p)
... ... ... ... ... ... ... ... Cook Islands
... ... ... ... ... ... ... ... Democratic People’s Republic of Korea
... ... ... ... ... ... ... ... Fiji
... ... ... ... 73.5 22.3 95.8 4.2 Hong Kong SAR of China
80.6 -2 13.3 -2 93.9 -2 6.1 -2 81.1 -2 0.8 -2 82.0 -2 18.0 -2 Indonesia (p)
79.4 -1 10.5 -1 89.8 -1 10.2 -1 46.8 -1 38.0 -1 84.8 -1 15.2 -1 Japan (p)
... ... ... ... ... ... ... ... Kiribati
... ... ... ... ... ... ... ... Lao People’s Democratic Republic
... ... ... ... ... ... ... ... Macao, China
62.7 -1 23.1 -1 85.9 -1 14.1 -1 41.7 -1 47.3 -1 89.0 -1 11.0 -1 Malaysia (p)
... ... ... ... ... ... ... ... Marshall Islands
... ... ... ... ... ... ... ... Micronesia (Federated States of)
... ... ... ... ... ... ... ... Myanmar
... ... ... ... ... ... ... ... Nauru
... ... ... ... ... ... ... ... New Zealand (p)
... ... ... ... ... ... ... ... Niue
... ... ... ... ... ... ... ... Palau
... ... ... ... ... ... ... ... Papua New Guinea
88.0 -1 8.6 -1 96.5 -1 3.5 -1 79.0 -1 18.7 -1 97.7 -1 2.3 -1 Philippines (p)
58.6 -1 20.4 -1 78.9 -1 21.1 -1 44.6 -1 37.5 -1 82.1 -1 17.9 -1 Republic of Korea (p)
... ... ... ... ... ... ... ... Samoa
... ... ... ... ... ... ... ... Singapore
... ... ... ... ... ... ... ... Solomon Islands
... ... ... ... ... ... ... ... Thailand (p)
... ... ... ... ... ... ... ... Timor-Leste
... ... ... ... ... ... ... ... Tokelau
... ... ... ... ... ... ... ... Tonga
... ... ... ... ... ... ... ... Tuvalu
... ... ... ... ... ... ... ... Vanuatu
... ... ... ... ... ... ... ... Viet Nam
Latin America and the Caribbean
... ... ... ... ... ... ... ... Anguilla
... ... ... ... ... ... ... ... Antigua and Barbuda
87.1 -1 11.9 -1 99.0 -1 1.0 -1 89.5 -1 10.4 -1 99.8 -1 0.2 -1 Argentina (p)
95.0 4.6 99.6 0.4 92.2 6.9 99.1 0.9 Aruba
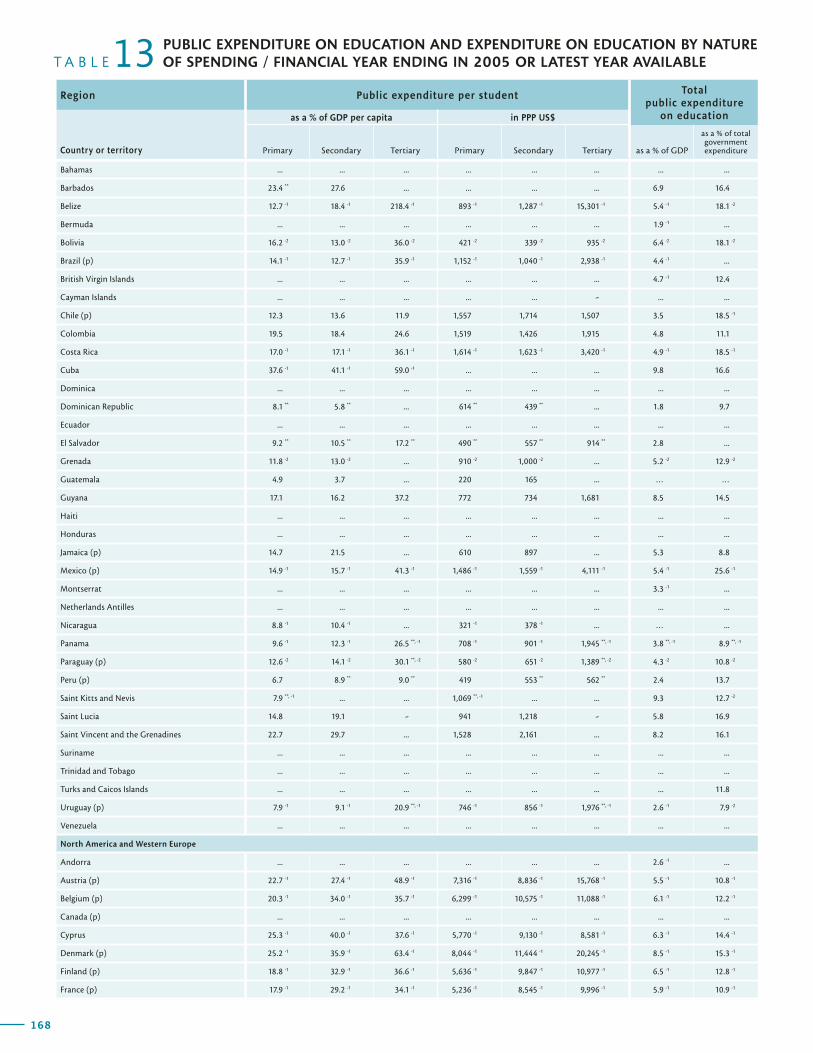
168
Region Public expenditure per student Total public expenditure
on education
Country or territory
as a % of GDP per capita in PPP US$
Primary Secondary Tertiary Primary Secondary Tertiary as a % of GDP
as a % of total government expenditure
T A B L E 13 PUBLIC EXPENDITURE ON EDUCATION AND EXPENDITURE ON EDUCATION BY NATURE OF SPENDING / FINANCIAL YEAR ENDING IN 2005 OR LATEST YEAR AVAILABLE
169
G L O B A L E D U C A T I O N D I G E S T 2 0 0 7 C O M P A R I N G E D U C A T I O N S T A T I S T I C S A R O U N D T H E W O R L D
Region Public expenditure per student Total public expenditure
on education
Country or territory
as a % of GDP per capita in PPP US$
Primary Secondary Tertiary Primary Secondary Tertiary as a % of GDP
as a % of total government expenditure
Educational expenditure by nature of spending as a % of total educational expenditure in public institutions
Region
Primary, secondary and post-secondary non-tertiary Tertiary
Country or territorySalaries, all staff Other current Total current Capital
Salaries, all staff Other current Total current Capital
Bahamas ... ... ... ... ... ... ... ...
Barbados 23.4 ** 27.6 ... ... ... ... 6.9 16.4
Belize 12.7 -1 18.4 -1 218.4 -1 893 -1 1,287 -1 15,301 -1 5.4 -1 18.1 -2
Bermuda ... ... ... ... ... ... 1.9 -1 ...
Bolivia 16.2 -2 13.0 -2 36.0 -2 421 -2 339 -2 935 -2 6.4 -2 18.1 -2
Brazil (p) 14.1 -1 12.7 -1 35.9 -1 1,152 -1 1,040 -1 2,938 -1 4.4 -1 ...
British Virgin Islands ... ... ... ... ... ... 4.7 -1 12.4
Cayman Islands ... ... ... ... ... - ... ...
Chile (p) 12.3 13.6 11.9 1,557 1,714 1,507 3.5 18.5 -1
Colombia 19.5 18.4 24.6 1,519 1,426 1,915 4.8 11.1
Costa Rica 17.0 -1 17.1 -1 36.1 -1 1,614 -1 1,623 -1 3,420 -1 4.9 -1 18.5 -1
Cuba 37.6 -1 41.1 -1 59.0 -1 ... ... ... 9.8 16.6
Dominica ... ... ... ... ... ... ... ...
Dominican Republic 8.1 ** 5.8 ** ... 614 ** 439 ** ... 1.8 9.7
Ecuador ... ... ... ... ... ... ... ...
El Salvador 9.2 ** 10.5 ** 17.2 ** 490 ** 557 ** 914 ** 2.8 ...
Grenada 11.8 -2 13.0 -2 ... 910 -2 1,000 -2 ... 5.2 -2 12.9 -2
Guatemala 4.9 3.7 ... 220 165 ... … …
Guyana 17.1 16.2 37.2 772 734 1,681 8.5 14.5
Haiti ... ... ... ... ... ... ... ...
Honduras ... ... ... ... ... ... ... ...
Jamaica (p) 14.7 21.5 ... 610 897 ... 5.3 8.8
Mexico (p) 14.9 -1 15.7 -1 41.3 -1 1,486 -1 1,559 -1 4,111 -1 5.4 -1 25.6 -1
Montserrat ... ... ... ... ... ... 3.3 -1 ...
Netherlands Antilles ... ... ... ... ... ... ... ...
Nicaragua 8.8 -1 10.4 -1 ... 321 -1 378 -1 ... … ...
Panama 9.6 -1 12.3 -1 26.5 **, -1 708 -1 901 -1 1,945 **, -1 3.8 **, -1 8.9 **, -1
Paraguay (p) 12.6 -2 14.1 -2 30.1 **, -2 580 -2 651 -2 1,389 **, -2 4.3 -2 10.8 -2
Peru (p) 6.7 8.9 ** 9.0 ** 419 553 ** 562 ** 2.4 13.7
Saint Kitts and Nevis 7.9 **, -1 ... ... 1,069 **, -1 ... ... 9.3 12.7 -2
Saint Lucia 14.8 19.1 - 941 1,218 - 5.8 16.9
Saint Vincent and the Grenadines 22.7 29.7 ... 1,528 2,161 ... 8.2 16.1
Suriname ... ... ... ... ... ... ... ...
Trinidad and Tobago ... ... ... ... ... ... ... ...
Turks and Caicos Islands ... ... ... ... ... ... ... 11.8
Uruguay (p) 7.9 -1 9.1 -1 20.9 **, -1 746 -1 856 -1 1,976 **, -1 2.6 -1 7.9 -2
Venezuela ... ... ... ... ... ... ... ...
North America and Western Europe
Andorra ... ... ... ... ... ... 2.6 -1 ...
Austria (p) 22.7 -1 27.4 -1 48.9 -1 7,316 -1 8,836 -1 15,768 -1 5.5 -1 10.8 -1
Belgium (p) 20.3 -1 34.0 -1 35.7 -1 6,299 -1 10,575 -1 11,088 -1 6.1 -1 12.2 -1
Canada (p) ... ... ... ... ... ... ... ...
Cyprus 25.3 -1 40.0 -1 37.6 -1 5,770 -1 9,130 -1 8,581 -1 6.3 -1 14.4 -1
Denmark (p) 25.2 -1 35.9 -1 63.4 -1 8,044 -1 11,444 -1 20,245 -1 8.5 -1 15.3 -1
Finland (p) 18.8 -1 32.9 -1 36.6 -1 5,636 -1 9,847 -1 10,977 -1 6.5 -1 12.8 -1
France (p) 17.9 -1 29.2 -1 34.1 -1 5,236 -1 8,545 -1 9,996 -1 5.9 -1 10.9 -1
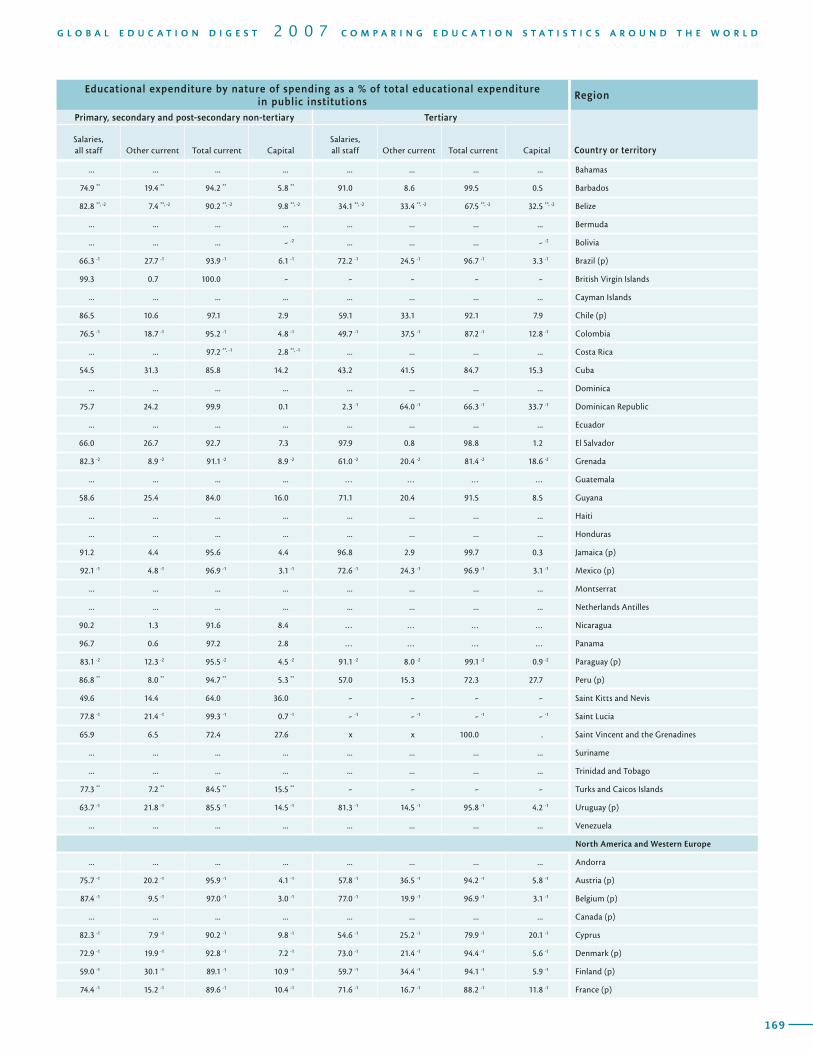
168
Region Public expenditure per student Total public expenditure
on education
Country or territory
as a % of GDP per capita in PPP US$
Primary Secondary Tertiary Primary Secondary Tertiary as a % of GDP
as a % of total government expenditure
T A B L E 13 PUBLIC EXPENDITURE ON EDUCATION AND EXPENDITURE ON EDUCATION BY NATURE OF SPENDING / FINANCIAL YEAR ENDING IN 2005 OR LATEST YEAR AVAILABLE
169
G L O B A L E D U C A T I O N D I G E S T 2 0 0 7 C O M P A R I N G E D U C A T I O N S T A T I S T I C S A R O U N D T H E W O R L D
Region Public expenditure per student Total public expenditure
on education
Country or territory
as a % of GDP per capita in PPP US$
Primary Secondary Tertiary Primary Secondary Tertiary as a % of GDP
as a % of total government expenditure
Educational expenditure by nature of spending as a % of total educational expenditure in public institutions
Region
Primary, secondary and post-secondary non-tertiary Tertiary
Country or territorySalaries, all staff Other current Total current Capital
Salaries, all staff Other current Total current Capital
... ... ... ... ... ... ... ... Bahamas
74.9 ** 19.4 ** 94.2 ** 5.8 ** 91.0 8.6 99.5 0.5 Barbados
82.8 **, -2 7.4 **, -2 90.2 **, -2 9.8 **, -2 34.1 **, -2 33.4 **, -2 67.5 **, -2 32.5 **, -2 Belize
... ... ... ... ... ... ... ... Bermuda
... ... ... - -2 ... ... ... - -2 Bolivia
66.3 -1 27.7 -1 93.9 -1 6.1 -1 72.2 -1 24.5 -1 96.7 -1 3.3 -1 Brazil (p)
99.3 0.7 100.0 - - - - - British Virgin Islands
... ... ... ... ... ... ... ... Cayman Islands
86.5 10.6 97.1 2.9 59.1 33.1 92.1 7.9 Chile (p)
76.5 -1 18.7 -1 95.2 -1 4.8 -1 49.7 -1 37.5 -1 87.2 -1 12.8 -1 Colombia
... ... 97.2 **, -1 2.8 **, -1 ... ... ... ... Costa Rica
54.5 31.3 85.8 14.2 43.2 41.5 84.7 15.3 Cuba
... ... ... ... ... ... ... ... Dominica
75.7 24.2 99.9 0.1 2.3 -1 64.0 -1 66.3 -1 33.7 -1 Dominican Republic
... ... ... ... ... ... ... ... Ecuador
66.0 26.7 92.7 7.3 97.9 0.8 98.8 1.2 El Salvador
82.3 -2 8.9 -2 91.1 -2 8.9 -2 61.0 -2 20.4 -2 81.4 -2 18.6 -2 Grenada
... ... ... ... … … … … Guatemala
58.6 25.4 84.0 16.0 71.1 20.4 91.5 8.5 Guyana
... ... ... ... ... ... ... ... Haiti
... ... ... ... ... ... ... ... Honduras
91.2 4.4 95.6 4.4 96.8 2.9 99.7 0.3 Jamaica (p)
92.1 -1 4.8 -1 96.9 -1 3.1 -1 72.6 -1 24.3 -1 96.9 -1 3.1 -1 Mexico (p)
... ... ... ... ... ... ... ... Montserrat
... ... ... ... ... ... ... ... Netherlands Antilles
90.2 1.3 91.6 8.4 … … … … Nicaragua
96.7 0.6 97.2 2.8 … … … … Panama
83.1 -2 12.3 -2 95.5 -2 4.5 -2 91.1 -2 8.0 -2 99.1 -2 0.9 -2 Paraguay (p)
86.8 ** 8.0 ** 94.7 ** 5.3 ** 57.0 15.3 72.3 27.7 Peru (p)
49.6 14.4 64.0 36.0 - - - - Saint Kitts and Nevis
77.8 -1 21.4 -1 99.3 -1 0.7 -1 - -1 - -1 - -1 - -1 Saint Lucia
65.9 6.5 72.4 27.6 x x 100.0 . Saint Vincent and the Grenadines
... ... ... ... ... ... ... ... Suriname
... ... ... ... ... ... ... ... Trinidad and Tobago
77.3 ** 7.2 ** 84.5 ** 15.5 ** - - - - Turks and Caicos Islands
63.7 -1 21.8 -1 85.5 -1 14.5 -1 81.3 -1 14.5 -1 95.8 -1 4.2 -1 Uruguay (p)
... ... ... ... ... ... ... ... Venezuela
North America and Western Europe
... ... ... ... ... ... ... ... Andorra
75.7 -1 20.2 -1 95.9 -1 4.1 -1 57.8 -1 36.5 -1 94.2 -1 5.8 -1 Austria (p)
87.4 -1 9.5 -1 97.0 -1 3.0 -1 77.0 -1 19.9 -1 96.9 -1 3.1 -1 Belgium (p)
... ... ... ... ... ... ... ... Canada (p)
82.3 -1 7.9 -1 90.2 -1 9.8 -1 54.6 -1 25.2 -1 79.9 -1 20.1 -1 Cyprus
72.9 -1 19.9 -1 92.8 -1 7.2 -1 73.0 -1 21.4 -1 94.4 -1 5.6 -1 Denmark (p)
59.0 -1 30.1 -1 89.1 -1 10.9 -1 59.7 -1 34.4 -1 94.1 -1 5.9 -1 Finland (p)
74.4 -1 15.2 -1 89.6 -1 10.4 -1 71.6 -1 16.7 -1 88.2 -1 11.8 -1 France (p)
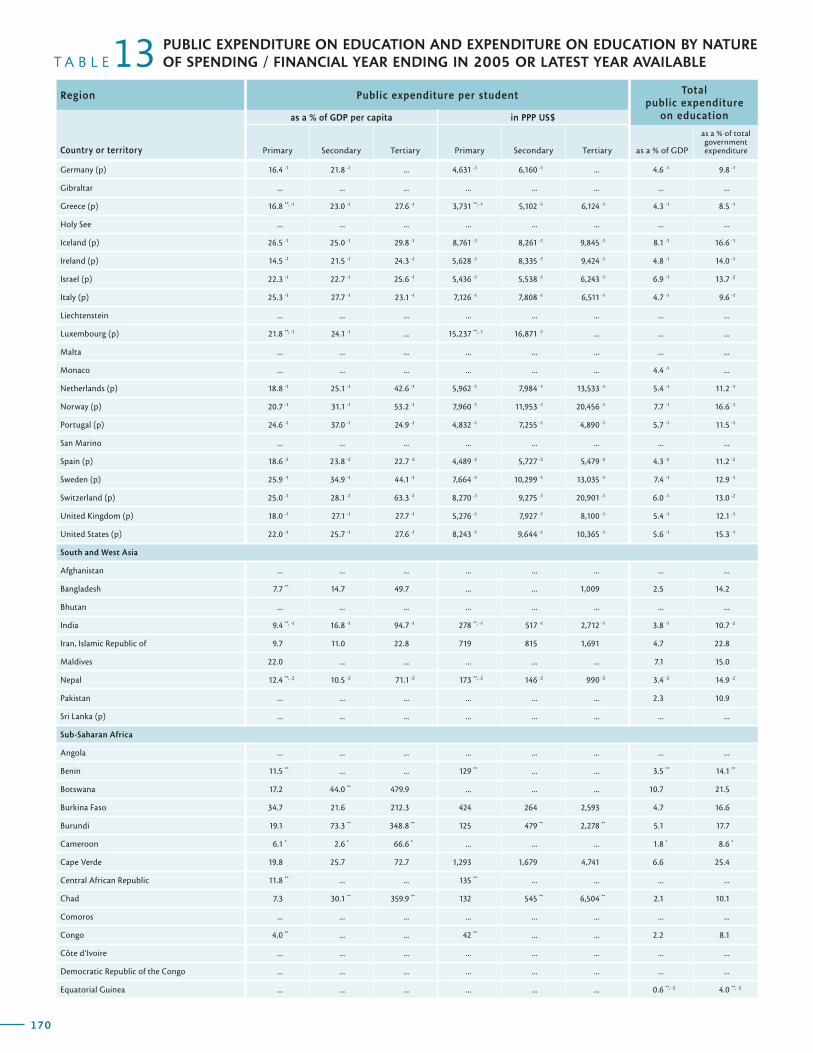
170
Region Public expenditure per student Total public expenditure
on education
Country or territory
as a % of GDP per capita in PPP US$
Primary Secondary Tertiary Primary Secondary Tertiary as a % of GDP
as a % of total government expenditure
T A B L E 13 PUBLIC EXPENDITURE ON EDUCATION AND EXPENDITURE ON EDUCATION BY NATURE OF SPENDING / FINANCIAL YEAR ENDING IN 2005 OR LATEST YEAR AVAILABLE
171
G L O B A L E D U C A T I O N D I G E S T 2 0 0 7 C O M P A R I N G E D U C A T I O N S T A T I S T I C S A R O U N D T H E W O R L D
Region Public expenditure per student Total public expenditure
on education
Country or territory
as a % of GDP per capita in PPP US$
Primary Secondary Tertiary Primary Secondary Tertiary as a % of GDP
as a % of total government expenditure
Educational expenditure by nature of spending as a % of total educational expenditure in public institutions
Region
Primary, secondary and post-secondary non-tertiary Tertiary
Country or territorySalaries, all staff Other current Total current Capital
Salaries, all staff Other current Total current Capital
Germany (p) 16.4 -1 21.8 -1 ... 4,631 -1 6,160 -1 ... 4.6 -1 9.8 -1
Gibraltar ... ... ... ... ... ... ... ...
Greece (p) 16.8 **, -1 23.0 -1 27.6 -1 3,731 **, -1 5,102 -1 6,124 -1 4.3 -1 8.5 -1
Holy See ... ... ... ... ... ... ... ...
Iceland (p) 26.5 -1 25.0 -1 29.8 -1 8,761 -1 8,261 -1 9,845 -1 8.1 -1 16.6 -1
Ireland (p) 14.5 -1 21.5 -1 24.3 -1 5,628 -1 8,335 -1 9,424 -1 4.8 -1 14.0 -1
Israel (p) 22.3 -1 22.7 -1 25.6 -1 5,436 -1 5,538 -1 6,243 -1 6.9 -1 13.7 -2
Italy (p) 25.3 -1 27.7 -1 23.1 -1 7,126 -1 7,808 -1 6,511 -1 4.7 -1 9.6 -1
Liechtenstein ... ... ... ... ... ... ... ...
Luxembourg (p) 21.8 **, -1 24.1 -1 ... 15,237 **, -1 16,871 -1 ... ... ...
Malta ... ... ... ... ... ... ... ...
Monaco ... ... ... ... ... ... 4.4 -1 ...
Netherlands (p) 18.8 -1 25.1 -1 42.6 -1 5,962 -1 7,984 -1 13,533 -1 5.4 -1 11.2 -1
Norway (p) 20.7 -1 31.1 -1 53.2 -1 7,960 -1 11,953 -1 20,456 -1 7.7 -1 16.6 -1
Portugal (p) 24.6 -1 37.0 -1 24.9 -1 4,832 -1 7,255 -1 4,890 -1 5.7 -1 11.5 -1
San Marino ... ... ... ... ... ... ... ...
Spain (p) 18.6 -2 23.8 -2 22.7 -2 4,489 -2 5,727 -2 5,479 -2 4.3 -2 11.2 -2
Sweden (p) 25.9 -1 34.9 -1 44.1 -1 7,664 -1 10,299 -1 13,035 -1 7.4 -1 12.9 -1
Switzerland (p) 25.0 -1 28.1 -1 63.3 -1 8,270 -1 9,275 -1 20,901 -1 6.0 -1 13.0 -2
United Kingdom (p) 18.0 -1 27.1 -1 27.7 -1 5,276 -1 7,927 -1 8,100 -1 5.4 -1 12.1 -1
United States (p) 22.0 -1 25.7 -1 27.6 -1 8,243 -1 9,644 -1 10,365 -1 5.6 -1 15.3 -1
South and West Asia
Afghanistan ... ... ... ... ... ... ... ...
Bangladesh 7.7 ** 14.7 49.7 ... ... 1,009 2.5 14.2
Bhutan ... ... ... ... ... ... ... ...
India 9.4 **, -1 16.8 -1 94.7 -1 278 **, -1 517 -1 2,712 -1 3.8 -1 10.7 -2
Iran, Islamic Republic of 9.7 11.0 22.8 719 815 1,691 4.7 22.8
Maldives 22.0 ... ... ... ... ... 7.1 15.0
Nepal 12.4 **, -2 10.5 -2 71.1 -2 173 **, -2 146 -2 990 -2 3.4 -2 14.9 -2
Pakistan ... ... ... ... ... ... 2.3 10.9
Sri Lanka (p) ... ... ... ... ... ... ... ...
Sub-Saharan Africa
Angola ... ... ... ... ... ... ... ...
Benin 11.5 ** ... ... 129 ** ... ... 3.5 ** 14.1 **
Botswana 17.2 44.0 ** 479.9 ... ... ... 10.7 21.5
Burkina Faso 34.7 21.6 212.3 424 264 2,593 4.7 16.6
Burundi 19.1 73.3 ** 348.8 ** 125 479 ** 2,278 ** 5.1 17.7
Cameroon 6.1 * 2.6 * 66.6 * ... ... ... 1.8 * 8.6 *
Cape Verde 19.8 25.7 72.7 1,293 1,679 4,741 6.6 25.4
Central African Republic 11.8 ** ... ... 135 ** ... ... ... ...
Chad 7.3 30.1 ** 359.9 ** 132 545 ** 6,504 ** 2.1 10.1
Comoros ... ... ... ... ... ... ... ...
Congo 4.0 ** ... ... 42 ** ... ... 2.2 8.1
Côte d’Ivoire ... ... ... ... ... ... ... ...
Democratic Republic of the Congo ... ... ... ... ... ... ... ...
Equatorial Guinea ... ... ... ... ... ... 0.6 **, -2 4.0 **, -2
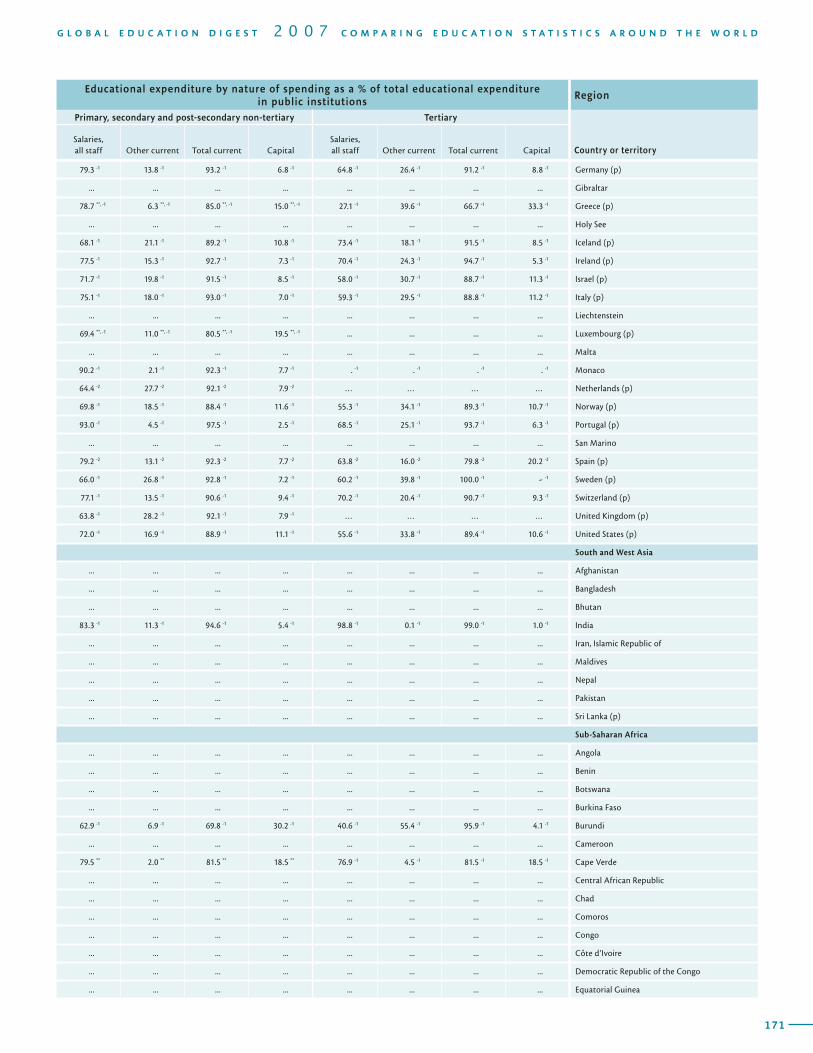
170
Region Public expenditure per student Total public expenditure
on education
Country or territory
as a % of GDP per capita in PPP US$
Primary Secondary Tertiary Primary Secondary Tertiary as a % of GDP
as a % of total government expenditure
T A B L E 13 PUBLIC EXPENDITURE ON EDUCATION AND EXPENDITURE ON EDUCATION BY NATURE OF SPENDING / FINANCIAL YEAR ENDING IN 2005 OR LATEST YEAR AVAILABLE
171
G L O B A L E D U C A T I O N D I G E S T 2 0 0 7 C O M P A R I N G E D U C A T I O N S T A T I S T I C S A R O U N D T H E W O R L D
Region Public expenditure per student Total public expenditure
on education
Country or territory
as a % of GDP per capita in PPP US$
Primary Secondary Tertiary Primary Secondary Tertiary as a % of GDP
as a % of total government expenditure
Educational expenditure by nature of spending as a % of total educational expenditure in public institutions
Region
Primary, secondary and post-secondary non-tertiary Tertiary
Country or territorySalaries, all staff Other current Total current Capital
Salaries, all staff Other current Total current Capital
79.3 -1 13.8 -1 93.2 -1 6.8 -1 64.8 -1 26.4 -1 91.2 -1 8.8 -1 Germany (p)
... ... ... ... ... ... ... ... Gibraltar
78.7 **, -1 6.3 **, -1 85.0 **, -1 15.0 **, -1 27.1 -1 39.6 -1 66.7 -1 33.3 -1 Greece (p)
... ... ... ... ... ... ... ... Holy See
68.1 -1 21.1 -1 89.2 -1 10.8 -1 73.4 -1 18.1 -1 91.5 -1 8.5 -1 Iceland (p)
77.5 -1 15.3 -1 92.7 -1 7.3 -1 70.4 -1 24.3 -1 94.7 -1 5.3 -1 Ireland (p)
71.7 -1 19.8 -1 91.5 -1 8.5 -1 58.0 -1 30.7 -1 88.7 -1 11.3 -1 Israel (p)
75.1 -1 18.0 -1 93.0 -1 7.0 -1 59.3 -1 29.5 -1 88.8 -1 11.2 -1 Italy (p)
... ... ... ... ... ... ... ... Liechtenstein
69.4 **, -1 11.0 **, -1 80.5 **, -1 19.5 **, -1 ... ... ... ... Luxembourg (p)
... ... ... ... ... ... ... ... Malta
90.2 -1 2.1 -1 92.3 -1 7.7 -1 . -1 . -1 . -1 . -1 Monaco
64.4 -2 27.7 -2 92.1 -2 7.9 -2 … … … … Netherlands (p)
69.8 -1 18.5 -1 88.4 -1 11.6 -1 55.3 -1 34.1 -1 89.3 -1 10.7 -1 Norway (p)
93.0 -1 4.5 -1 97.5 -1 2.5 -1 68.5 -1 25.1 -1 93.7 -1 6.3 -1 Portugal (p)
... ... ... ... ... ... ... ... San Marino
79.2 -2 13.1 -2 92.3 -2 7.7 -2 63.8 -2 16.0 -2 79.8 -2 20.2 -2 Spain (p)
66.0 -1 26.8 -1 92.8 -1 7.2 -1 60.2 -1 39.8 -1 100.0 -1 - -1 Sweden (p)
77.1 -1 13.5 -1 90.6 -1 9.4 -1 70.2 -1 20.4 -1 90.7 -1 9.3 -1 Switzerland (p)
63.8 -1 28.2 -1 92.1 -1 7.9 -1 … … … … United Kingdom (p)
72.0 -1 16.9 -1 88.9 -1 11.1 -1 55.6 -1 33.8 -1 89.4 -1 10.6 -1 United States (p)
South and West Asia
... ... ... ... ... ... ... ... Afghanistan
... ... ... ... ... ... ... ... Bangladesh
... ... ... ... ... ... ... ... Bhutan
83.3 -1 11.3 -1 94.6 -1 5.4 -1 98.8 -1 0.1 -1 99.0 -1 1.0 -1 India
... ... ... ... ... ... ... ... Iran, Islamic Republic of
... ... ... ... ... ... ... ... Maldives
... ... ... ... ... ... ... ... Nepal
... ... ... ... ... ... ... ... Pakistan
... ... ... ... ... ... ... ... Sri Lanka (p)
Sub-Saharan Africa
... ... ... ... ... ... ... ... Angola
... ... ... ... ... ... ... ... Benin
... ... ... ... ... ... ... ... Botswana
... ... ... ... ... ... ... ... Burkina Faso
62.9 -1 6.9 -1 69.8 -1 30.2 -1 40.6 -1 55.4 -1 95.9 -1 4.1 -1 Burundi
... ... ... ... ... ... ... ... Cameroon
79.5 ** 2.0 ** 81.5 ** 18.5 ** 76.9 -1 4.5 -1 81.5 -1 18.5 -1 Cape Verde
... ... ... ... ... ... ... ... Central African Republic
... ... ... ... ... ... ... ... Chad
... ... ... ... ... ... ... ... Comoros
... ... ... ... ... ... ... ... Congo
... ... ... ... ... ... ... ... Côte d’Ivoire
... ... ... ... ... ... ... ... Democratic Republic of the Congo
... ... ... ... ... ... ... ... Equatorial Guinea
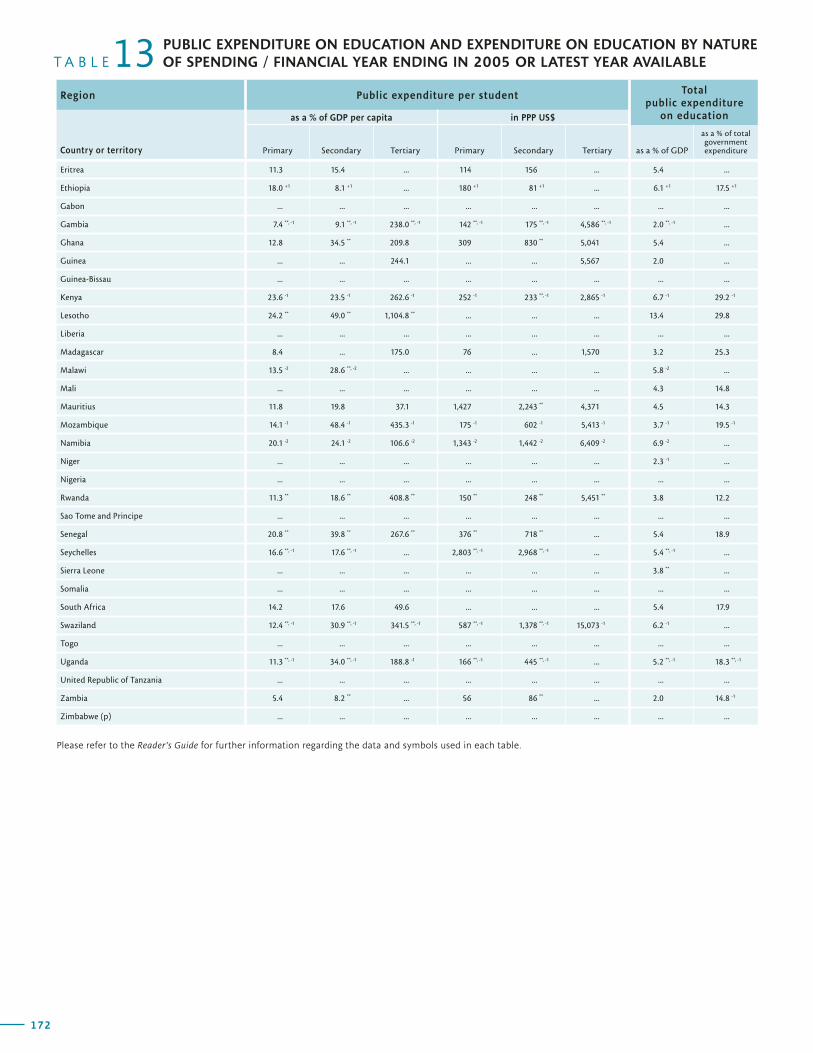
172
Region Public expenditure per student Total public expenditure
on education
Country or territory
as a % of GDP per capita in PPP US$
Primary Secondary Tertiary Primary Secondary Tertiary as a % of GDP
as a % of total government expenditure
T A B L E 13 PUBLIC EXPENDITURE ON EDUCATION AND EXPENDITURE ON EDUCATION BY NATURE OF SPENDING / FINANCIAL YEAR ENDING IN 2005 OR LATEST YEAR AVAILABLE
173
G L O B A L E D U C A T I O N D I G E S T 2 0 0 7 C O M P A R I N G E D U C A T I O N S T A T I S T I C S A R O U N D T H E W O R L D
Region Public expenditure per student Total public expenditure
on education
Country or territory
as a % of GDP per capita in PPP US$
Primary Secondary Tertiary Primary Secondary Tertiary as a % of GDP
as a % of total government expenditure
Educational expenditure by nature of spending as a % of total educational expenditure in public institutions
Region
Primary, secondary and post-secondary non-tertiary Tertiary
Country or territorySalaries, all staff Other current Total current Capital
Salaries, all staff Other current Total current Capital
Eritrea 11.3 15.4 ... 114 156 ... 5.4 ...
Ethiopia 18.0 +1 8.1 +1 ... 180 +1 81 +1 ... 6.1 +1 17.5 +1
Gabon ... ... ... ... ... ... ... ...
Gambia 7.4 **, -1 9.1 **, -1 238.0 **, -1 142 **, -1 175 **, -1 4,586 **, -1 2.0 **, -1 ...
Ghana 12.8 34.5 ** 209.8 309 830 ** 5,041 5.4 ...
Guinea ... ... 244.1 ... ... 5,567 2.0 ...
Guinea-Bissau ... ... ... ... ... ... ... ...
Kenya 23.6 -1 23.5 -1 262.6 -1 252 -1 233 **, -1 2,865 -1 6.7 -1 29.2 -1
Lesotho 24.2 ** 49.0 ** 1,104.8 ** ... ... ... 13.4 29.8
Liberia ... ... ... ... ... ... ... ...
Madagascar 8.4 ... 175.0 76 ... 1,570 3.2 25.3
Malawi 13.5 -2 28.6 **, -2 ... ... ... ... 5.8 -2 ...
Mali ... ... ... ... ... ... 4.3 14.8
Mauritius 11.8 19.8 37.1 1,427 2,243 ** 4,371 4.5 14.3
Mozambique 14.1 -1 48.4 -1 435.3 -1 175 -1 602 -1 5,413 -1 3.7 -1 19.5 -1
Namibia 20.1 -2 24.1 -2 106.6 -2 1,343 -2 1,442 -2 6,409 -2 6.9 -2 ...
Niger ... ... ... ... ... ... 2.3 -1 ...
Nigeria ... ... ... ... ... ... ... ...
Rwanda 11.3 ** 18.6 ** 408.8 ** 150 ** 248 ** 5,451 ** 3.8 12.2
Sao Tome and Principe ... ... ... ... ... ... ... ...
Senegal 20.8 ** 39.8 ** 267.6 ** 376 ** 718 ** ... 5.4 18.9
Seychelles 16.6 **, -1 17.6 **, -1 ... 2,803 **, -1 2,968 **, -1 ... 5.4 **, -1 ...
Sierra Leone ... ... ... ... ... ... 3.8 ** ...
Somalia ... ... ... ... ... ... ... ...
South Africa 14.2 17.6 49.6 ... ... ... 5.4 17.9
Swaziland 12.4 **, -1 30.9 **, -1 341.5 **, -1 587 **, -1 1,378 **, -1 15,073 -1 6.2 -1 ...
Togo ... ... ... ... ... ... ... ...
Uganda 11.3 **, -1 34.0 **, -1 188.8 -1 166 **, -1 445 **, -1 ... 5.2 **, -1 18.3 **, -1
United Republic of Tanzania ... ... ... ... ... ... ... ...
Zambia 5.4 8.2 ** ... 56 86 ** ... 2.0 14.8 -1
Zimbabwe (p) ... ... ... ... ... ... ... ...
Please refer to the Reader’s Guide for further information regarding the data and symbols used in each table.

172
Region Public expenditure per student Total public expenditure
on education
Country or territory
as a % of GDP per capita in PPP US$
Primary Secondary Tertiary Primary Secondary Tertiary as a % of GDP
as a % of total government expenditure
T A B L E 13 PUBLIC EXPENDITURE ON EDUCATION AND EXPENDITURE ON EDUCATION BY NATURE OF SPENDING / FINANCIAL YEAR ENDING IN 2005 OR LATEST YEAR AVAILABLE
173
G L O B A L E D U C A T I O N D I G E S T 2 0 0 7 C O M P A R I N G E D U C A T I O N S T A T I S T I C S A R O U N D T H E W O R L D
Region Public expenditure per student Total public expenditure
on education
Country or territory
as a % of GDP per capita in PPP US$
Primary Secondary Tertiary Primary Secondary Tertiary as a % of GDP
as a % of total government expenditure
Educational expenditure by nature of spending as a % of total educational expenditure in public institutions
Region
Primary, secondary and post-secondary non-tertiary Tertiary
Country or territorySalaries, all staff Other current Total current Capital
Salaries, all staff Other current Total current Capital
58.6 14.3 72.9 27.1 9.9 54.7 64.6 35.4 Eritrea
... ... ... ... ... ... ... ... Ethiopia
... ... ... ... ... ... ... ... Gabon
... ... ... ... ... ... ... ... Gambia
... ... ... ... ... ... ... ... Ghana
... ... ... ... ... ... ... ... Guinea
... ... ... ... ... ... ... ... Guinea-Bissau
... ... ... ... ... ... ... ... Kenya
... ... ... ... ... ... ... ... Lesotho
... ... ... ... ... ... ... ... Liberia
47.6 16.2 63.8 36.2 21.1 48.1 69.2 30.8 Madagascar
... ... ... ... ... ... ... ... Malawi
... ... ... ... ... ... ... ... Mali
... ... ... ... ... ... ... ... Mauritius
89.7 -1 7.7 -1 97.4 -1 2.6 -1 ... ... ... ... Mozambique
... ... ... ... ... ... ... ... Namibia
... ... ... ... ... ... ... ... Niger
... ... ... ... ... ... ... ... Nigeria
... ... ... ... ... ... ... ... Rwanda
... ... ... ... ... ... ... ... Sao Tome and Principe
... ... ... ... ... ... ... ... Senegal
74.0 -2 13.9 -2 88.0 -2 12.0 -2 - -2 50.0 -2 50.0 -2 50.0 -2 Seychelles
... ... ... ... ... ... ... ... Sierra Leone
... ... ... ... ... ... ... ... Somalia
85.8 10.4 96.2 3.8 9.2 90.6 99.9 0.1 South Africa
... ... ... ... ... ... ... ... Swaziland
... ... ... ... ... ... ... ... Togo
65.9 -1 8.2 -1 74.1 -1 25.9 -1 x x 75.5 -1 24.5 -1 Uganda
... ... ... ... ... ... ... ... United Republic of Tanzania
91.8 -1 7.1 -1 98.9 -1 1.1 -1 9.8 -1 85.4 -1 95.2 -1 4.8 -1 Zambia
... ... ... ... ... ... ... ... Zimbabwe (p)
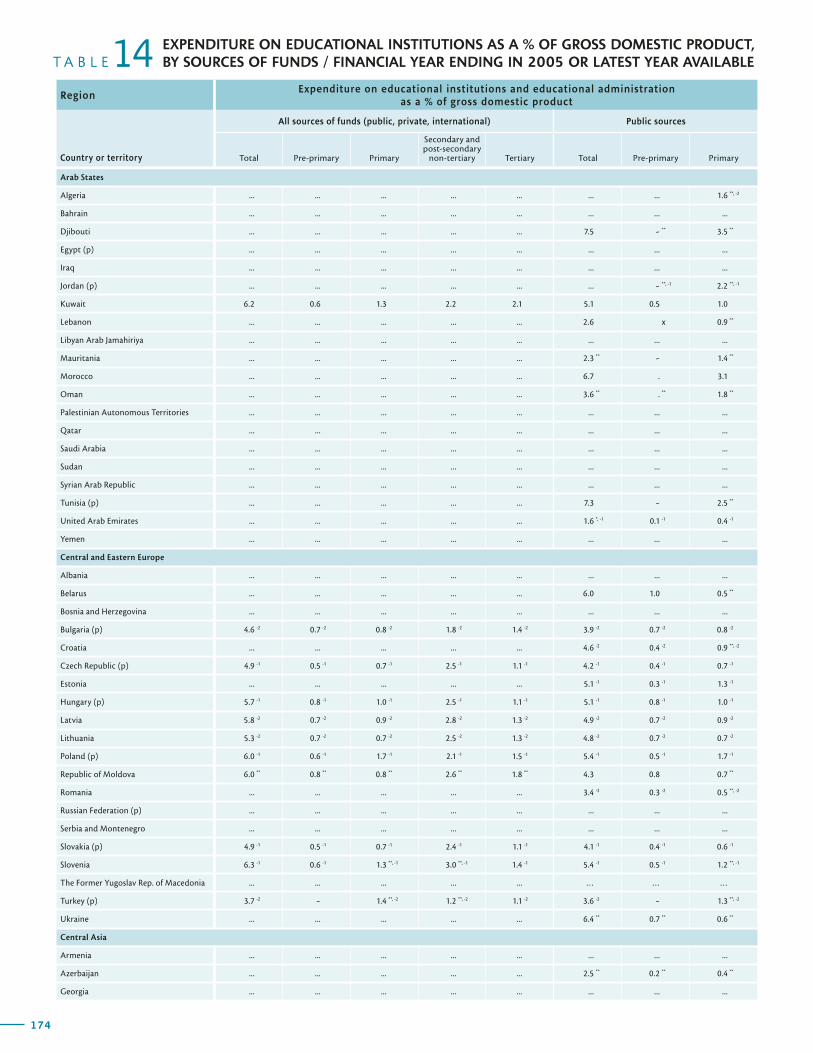
174
RegionExpenditure on educational institutions and educational administration
as a % of gross domestic product
Country or territory
All sources of funds (public, private, international) Public sources
Total Pre-primary Primary
Secondary and post-secondary
non-tertiary Tertiary Total Pre-primary Primary
T A B L E 14 EXPENDITURE ON EDUCATIONAL INSTITUTIONS AS A % OF GROSS DOMESTIC PRODUCT, BY SOURCES OF FUNDS / FINANCIAL YEAR ENDING IN 2005 OR LATEST YEAR AVAILABLE
175
G L O B A L E D U C A T I O N D I G E S T 2 0 0 7 C O M P A R I N G E D U C A T I O N S T A T I S T I C S A R O U N D T H E W O R L D
RegionExpenditure on educational institutions and educational administration
as a % of gross domestic product
Country or territory
All sources of funds (public, private, international) Public sources
Total Pre-primary Primary
Secondary and post-secondary
non-tertiary Tertiary Total Pre-primary Primary
Expenditure on educational institutions and educational administration as a % of gross domestic product
Region
Public sources Private sources International sources
Country or territory
Secondary and post-secondary
non-tertiary Tertiary Total Pre-primary Primary
Secondary and post-secondary
non-tertiary Tertiary Total
Arab States
Algeria ... ... ... ... ... ... ... 1.6 **, -2
Bahrain ... ... ... ... ... ... ... ...
Djibouti ... ... ... ... ... 7.5 - ** 3.5 **
Egypt (p) ... ... ... ... ... ... ... ...
Iraq ... ... ... ... ... ... ... ...
Jordan (p) ... ... ... ... ... ... - **, -1 2.2 **, -1
Kuwait 6.2 0.6 1.3 2.2 2.1 5.1 0.5 1.0
Lebanon ... ... ... ... ... 2.6 x 0.9 **
Libyan Arab Jamahiriya ... ... ... ... ... ... ... ...
Mauritania ... ... ... ... ... 2.3 ** - 1.4 **
Morocco ... ... ... ... ... 6.7 . 3.1
Oman ... ... ... ... ... 3.6 ** . ** 1.8 **
Palestinian Autonomous Territories ... ... ... ... ... ... ... ...
Qatar ... ... ... ... ... ... ... ...
Saudi Arabia ... ... ... ... ... ... ... ...
Sudan ... ... ... ... ... ... ... ...
Syrian Arab Republic ... ... ... ... ... ... ... ...
Tunisia (p) ... ... ... ... ... 7.3 - 2.5 **
United Arab Emirates ... ... ... ... ... 1.6 *, -1 0.1 -1 0.4 -1
Yemen ... ... ... ... ... ... ... ...
Central and Eastern Europe
Albania ... ... ... ... ... ... ... ...
Belarus ... ... ... ... ... 6.0 1.0 0.5 **
Bosnia and Herzegovina ... ... ... ... ... ... ... ...
Bulgaria (p) 4.6 -2 0.7 -2 0.8 -2 1.8 -2 1.4 -2 3.9 -2 0.7 -2 0.8 -2
Croatia ... ... ... ... ... 4.6 -2 0.4 -2 0.9 **, -2
Czech Republic (p) 4.9 -1 0.5 -1 0.7 -1 2.5 -1 1.1 -1 4.2 -1 0.4 -1 0.7 -1
Estonia ... ... ... ... ... 5.1 -1 0.3 -1 1.3 -1
Hungary (p) 5.7 -1 0.8 -1 1.0 -1 2.5 -1 1.1 -1 5.1 -1 0.8 -1 1.0 -1
Latvia 5.8 -2 0.7 -2 0.9 -2 2.8 -2 1.3 -2 4.9 -2 0.7 -2 0.9 -2
Lithuania 5.3 -2 0.7 -2 0.7 -2 2.5 -2 1.3 -2 4.8 -2 0.7 -2 0.7 -2
Poland (p) 6.0 -1 0.6 -1 1.7 -1 2.1 -1 1.5 -1 5.4 -1 0.5 -1 1.7 -1
Republic of Moldova 6.0 ** 0.8 ** 0.8 ** 2.6 ** 1.8 ** 4.3 0.8 0.7 **
Romania ... ... ... ... ... 3.4 -2 0.3 -2 0.5 **, -2
Russian Federation (p) ... ... ... ... ... ... ... ...
Serbia and Montenegro ... ... ... ... ... ... ... ...
Slovakia (p) 4.9 -1 0.5 -1 0.7 -1 2.4 -1 1.1 -1 4.1 -1 0.4 -1 0.6 -1
Slovenia 6.3 -1 0.6 -1 1.3 **, -1 3.0 **, -1 1.4 -1 5.4 -1 0.5 -1 1.2 **, -1
The Former Yugoslav Rep. of Macedonia ... ... ... ... ... … … …
Turkey (p) 3.7 -2 - 1.4 **, -2 1.2 **, -2 1.1 -2 3.6 -2 - 1.3 **, -2
Ukraine ... ... ... ... ... 6.4 ** 0.7 ** 0.6 **
Central Asia
Armenia ... ... ... ... ... ... ... ...
Azerbaijan ... ... ... ... ... 2.5 ** 0.2 ** 0.4 **
Georgia ... ... ... ... ... ... ... ...
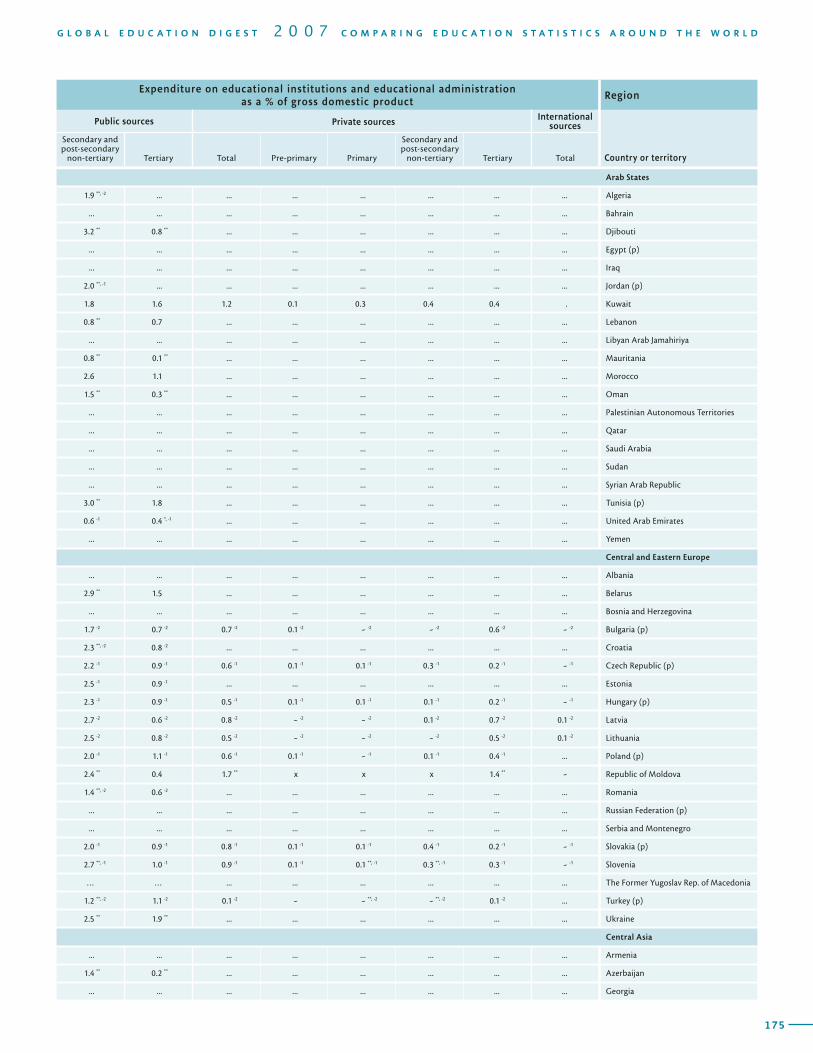
174
RegionExpenditure on educational institutions and educational administration
as a % of gross domestic product
Country or territory
All sources of funds (public, private, international) Public sources
Total Pre-primary Primary
Secondary and post-secondary
non-tertiary Tertiary Total Pre-primary Primary
T A B L E 14 EXPENDITURE ON EDUCATIONAL INSTITUTIONS AS A % OF GROSS DOMESTIC PRODUCT, BY SOURCES OF FUNDS / FINANCIAL YEAR ENDING IN 2005 OR LATEST YEAR AVAILABLE
175
G L O B A L E D U C A T I O N D I G E S T 2 0 0 7 C O M P A R I N G E D U C A T I O N S T A T I S T I C S A R O U N D T H E W O R L D
RegionExpenditure on educational institutions and educational administration
as a % of gross domestic product
Country or territory
All sources of funds (public, private, international) Public sources
Total Pre-primary Primary
Secondary and post-secondary
non-tertiary Tertiary Total Pre-primary Primary
Expenditure on educational institutions and educational administration as a % of gross domestic product
Region
Public sources Private sources International sources
Country or territory
Secondary and post-secondary
non-tertiary Tertiary Total Pre-primary Primary
Secondary and post-secondary
non-tertiary Tertiary Total
Arab States
1.9 **, -2 ... ... ... ... ... ... ... Algeria
... ... ... ... ... ... ... ... Bahrain
3.2 ** 0.8 ** ... ... ... ... ... ... Djibouti
... ... ... ... ... ... ... ... Egypt (p)
... ... ... ... ... ... ... ... Iraq
2.0 **, -1 ... ... ... ... ... ... ... Jordan (p)
1.8 1.6 1.2 0.1 0.3 0.4 0.4 . Kuwait
0.8 ** 0.7 ... ... ... ... ... ... Lebanon
... ... ... ... ... ... ... ... Libyan Arab Jamahiriya
0.8 ** 0.1 ** ... ... ... ... ... ... Mauritania
2.6 1.1 ... ... ... ... ... ... Morocco
1.5 ** 0.3 ** ... ... ... ... ... ... Oman
... ... ... ... ... ... ... ... Palestinian Autonomous Territories
... ... ... ... ... ... ... ... Qatar
... ... ... ... ... ... ... ... Saudi Arabia
... ... ... ... ... ... ... ... Sudan
... ... ... ... ... ... ... ... Syrian Arab Republic
3.0 ** 1.8 ... ... ... ... ... ... Tunisia (p)
0.6 -1 0.4 *, -1 ... ... ... ... ... ... United Arab Emirates
... ... ... ... ... ... ... ... Yemen
Central and Eastern Europe
... ... ... ... ... ... ... ... Albania
2.9 ** 1.5 ... ... ... ... ... ... Belarus
... ... ... ... ... ... ... ... Bosnia and Herzegovina
1.7 -2 0.7 -2 0.7 -2 0.1 -2 - -2 - -2 0.6 -2 - -2 Bulgaria (p)
2.3 **, -2 0.8 -2 ... ... ... ... ... ... Croatia
2.2 -1 0.9 -1 0.6 -1 0.1 -1 0.1 -1 0.3 -1 0.2 -1 - -1 Czech Republic (p)
2.5 -1 0.9 -1 ... ... ... ... ... ... Estonia
2.3 -1 0.9 -1 0.5 -1 0.1 -1 0.1 -1 0.1 -1 0.2 -1 - -1 Hungary (p)
2.7 -2 0.6 -2 0.8 -2 - -2 - -2 0.1 -2 0.7 -2 0.1 -2 Latvia
2.5 -2 0.8 -2 0.5 -2 - -2 - -2 - -2 0.5 -2 0.1 -2 Lithuania
2.0 -1 1.1 -1 0.6 -1 0.1 -1 - -1 0.1 -1 0.4 -1 ... Poland (p)
2.4 ** 0.4 1.7 ** x x x 1.4 ** - Republic of Moldova
1.4 **, -2 0.6 -2 ... ... ... ... ... ... Romania
... ... ... ... ... ... ... ... Russian Federation (p)
... ... ... ... ... ... ... ... Serbia and Montenegro
2.0 -1 0.9 -1 0.8 -1 0.1 -1 0.1 -1 0.4 -1 0.2 -1 - -1 Slovakia (p)
2.7 **, -1 1.0 -1 0.9 -1 0.1 -1 0.1 **, -1 0.3 **, -1 0.3 -1 - -1 Slovenia
… … ... ... ... ... ... ... The Former Yugoslav Rep. of Macedonia
1.2 **, -2 1.1 -2 0.1 -2 - - **, -2 - **, -2 0.1 -2 ... Turkey (p)
2.5 ** 1.9 ** ... ... ... ... ... ... Ukraine
Central Asia
... ... ... ... ... ... ... ... Armenia
1.4 ** 0.2 ** ... ... ... ... ... ... Azerbaijan
... ... ... ... ... ... ... ... Georgia
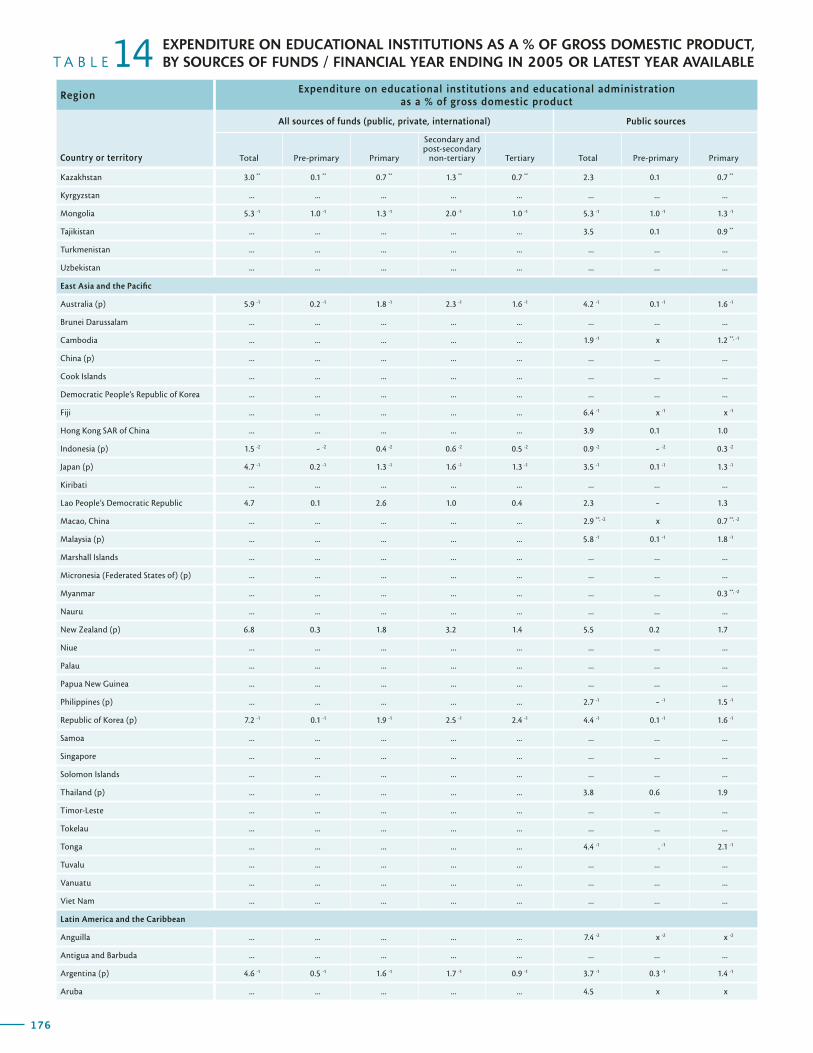
176
RegionExpenditure on educational institutions and educational administration
as a % of gross domestic product
Country or territory
All sources of funds (public, private, international) Public sources
Total Pre-primary Primary
Secondary and post-secondary
non-tertiary Tertiary Total Pre-primary Primary
T A B L E 14 EXPENDITURE ON EDUCATIONAL INSTITUTIONS AS A % OF GROSS DOMESTIC PRODUCT, BY SOURCES OF FUNDS / FINANCIAL YEAR ENDING IN 2005 OR LATEST YEAR AVAILABLE
177
G L O B A L E D U C A T I O N D I G E S T 2 0 0 7 C O M P A R I N G E D U C A T I O N S T A T I S T I C S A R O U N D T H E W O R L D
RegionExpenditure on educational institutions and educational administration
as a % of gross domestic product
Country or territory
All sources of funds (public, private, international) Public sources
Total Pre-primary Primary
Secondary and post-secondary
non-tertiary Tertiary Total Pre-primary Primary
Expenditure on educational institutions and educational administration as a % of gross domestic product
Region
Public sources Private sources International sources
Country or territory
Secondary and post-secondary
non-tertiary Tertiary Total Pre-primary Primary
Secondary and post-secondary
non-tertiary Tertiary Total
Kazakhstan 3.0 ** 0.1 ** 0.7 ** 1.3 ** 0.7 ** 2.3 0.1 0.7 **
Kyrgyzstan ... ... ... ... ... ... ... ...
Mongolia 5.3 -1 1.0 -1 1.3 -1 2.0 -1 1.0 -1 5.3 -1 1.0 -1 1.3 -1
Tajikistan ... ... ... ... ... 3.5 0.1 0.9 **
Turkmenistan ... ... ... ... ... ... ... ...
Uzbekistan ... ... ... ... ... ... ... ...
East Asia and the Pacific
Australia (p) 5.9 -1 0.2 -1 1.8 -1 2.3 -1 1.6 -1 4.2 -1 0.1 -1 1.6 -1
Brunei Darussalam ... ... ... ... ... ... ... ...
Cambodia ... ... ... ... ... 1.9 -1 x 1.2 **, -1
China (p) ... ... ... ... ... ... ... ...
Cook Islands ... ... ... ... ... ... ... ...
Democratic People’s Republic of Korea ... ... ... ... ... ... ... ...
Fiji ... ... ... ... ... 6.4 -1 x -1 x -1
Hong Kong SAR of China ... ... ... ... ... 3.9 0.1 1.0
Indonesia (p) 1.5 -2 - -2 0.4 -2 0.6 -2 0.5 -2 0.9 -2 - -2 0.3 -2
Japan (p) 4.7 -1 0.2 -1 1.3 -1 1.6 -1 1.3 -1 3.5 -1 0.1 -1 1.3 -1
Kiribati ... ... ... ... ... ... ... ...
Lao People’s Democratic Republic 4.7 0.1 2.6 1.0 0.4 2.3 - 1.3
Macao, China ... ... ... ... ... 2.9 **, -2 x 0.7 **, -2
Malaysia (p) ... ... ... ... ... 5.8 -1 0.1 -1 1.8 -1
Marshall Islands ... ... ... ... ... ... ... ...
Micronesia (Federated States of) (p) ... ... ... ... ... ... ... ...
Myanmar ... ... ... ... ... ... ... 0.3 **, -2
Nauru ... ... ... ... ... ... ... ...
New Zealand (p) 6.8 0.3 1.8 3.2 1.4 5.5 0.2 1.7
Niue ... ... ... ... ... ... ... ...
Palau ... ... ... ... ... ... ... ...
Papua New Guinea ... ... ... ... ... ... ... ...
Philippines (p) ... ... ... ... ... 2.7 -1 - -1 1.5 -1
Republic of Korea (p) 7.2 -1 0.1 -1 1.9 -1 2.5 -1 2.4 -1 4.4 -1 0.1 -1 1.6 -1
Samoa ... ... ... ... ... ... ... ...
Singapore ... ... ... ... ... ... ... ...
Solomon Islands ... ... ... ... ... ... ... ...
Thailand (p) ... ... ... ... ... 3.8 0.6 1.9
Timor-Leste ... ... ... ... ... ... ... ...
Tokelau ... ... ... ... ... ... ... ...
Tonga ... ... ... ... ... 4.4 -1 . -1 2.1 -1
Tuvalu ... ... ... ... ... ... ... ...
Vanuatu ... ... ... ... ... ... ... ...
Viet Nam ... ... ... ... ... ... ... ...
Latin America and the Caribbean
Anguilla ... ... ... ... ... 7.4 -2 x -2 x -2
Antigua and Barbuda ... ... ... ... ... ... ... ...
Argentina (p) 4.6 -1 0.5 -1 1.6 -1 1.7 -1 0.9 -1 3.7 -1 0.3 -1 1.4 -1
Aruba ... ... ... ... ... 4.5 x x
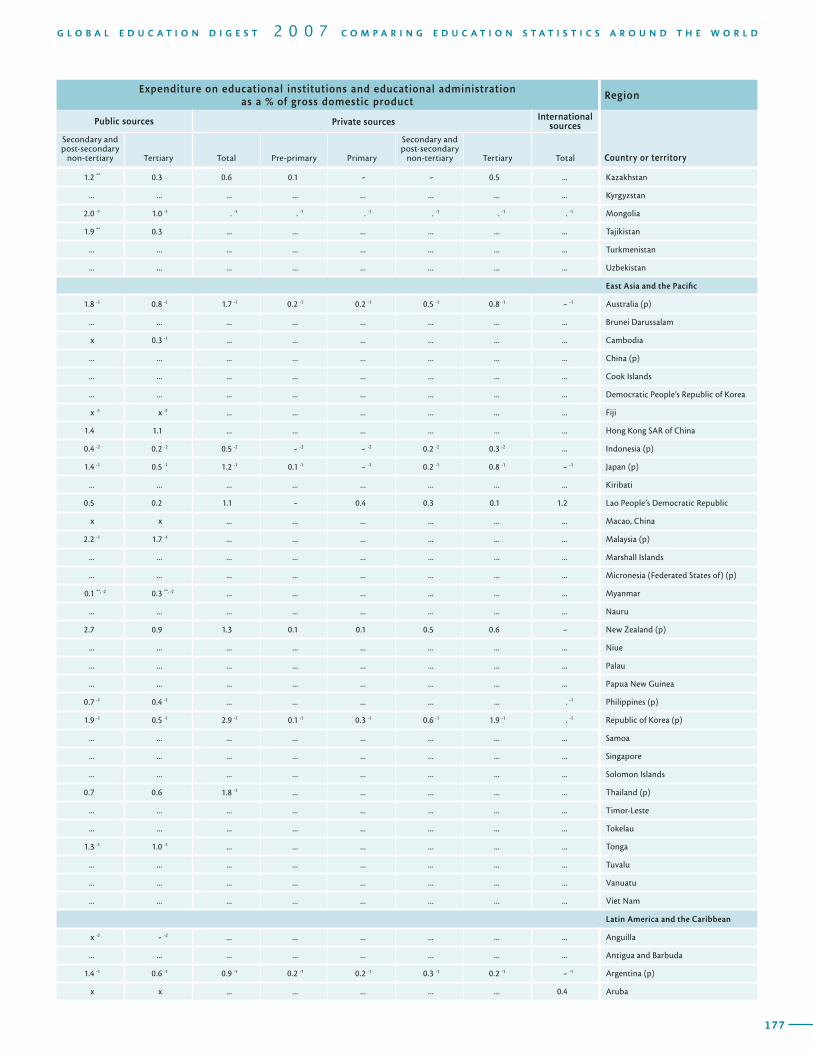
176
RegionExpenditure on educational institutions and educational administration
as a % of gross domestic product
Country or territory
All sources of funds (public, private, international) Public sources
Total Pre-primary Primary
Secondary and post-secondary
non-tertiary Tertiary Total Pre-primary Primary
T A B L E 14 EXPENDITURE ON EDUCATIONAL INSTITUTIONS AS A % OF GROSS DOMESTIC PRODUCT, BY SOURCES OF FUNDS / FINANCIAL YEAR ENDING IN 2005 OR LATEST YEAR AVAILABLE
177
G L O B A L E D U C A T I O N D I G E S T 2 0 0 7 C O M P A R I N G E D U C A T I O N S T A T I S T I C S A R O U N D T H E W O R L D
RegionExpenditure on educational institutions and educational administration
as a % of gross domestic product
Country or territory
All sources of funds (public, private, international) Public sources
Total Pre-primary Primary
Secondary and post-secondary
non-tertiary Tertiary Total Pre-primary Primary
Expenditure on educational institutions and educational administration as a % of gross domestic product
Region
Public sources Private sources International sources
Country or territory
Secondary and post-secondary
non-tertiary Tertiary Total Pre-primary Primary
Secondary and post-secondary
non-tertiary Tertiary Total
1.2 ** 0.3 0.6 0.1 - - 0.5 ... Kazakhstan
... ... ... ... ... ... ... ... Kyrgyzstan
2.0 -1 1.0 -1 . -1 . -1 . -1 . -1 . -1 . -1 Mongolia
1.9 ** 0.3 ... ... ... ... ... ... Tajikistan
... ... ... ... ... ... ... ... Turkmenistan
... ... ... ... ... ... ... ... Uzbekistan
East Asia and the Pacific
1.8 -1 0.8 -1 1.7 -1 0.2 -1 0.2 -1 0.5 -1 0.8 -1 - -1 Australia (p)
... ... ... ... ... ... ... ... Brunei Darussalam
x 0.3 -1 ... ... ... ... ... ... Cambodia
... ... ... ... ... ... ... ... China (p)
... ... ... ... ... ... ... ... Cook Islands
... ... ... ... ... ... ... ... Democratic People’s Republic of Korea
x -1 x -1 ... ... ... ... ... ... Fiji
1.4 1.1 ... ... ... ... ... ... Hong Kong SAR of China
0.4 -2 0.2 -2 0.5 -2 - -2 - -2 0.2 -2 0.3 -2 ... Indonesia (p)
1.4 -1 0.5 -1 1.2 -1 0.1 -1 - -1 0.2 -1 0.8 -1 - -1 Japan (p)
... ... ... ... ... ... ... ... Kiribati
0.5 0.2 1.1 - 0.4 0.3 0.1 1.2 Lao People’s Democratic Republic
x x ... ... ... ... ... ... Macao, China
2.2 -1 1.7 -1 ... ... ... ... ... ... Malaysia (p)
... ... ... ... ... ... ... ... Marshall Islands
... ... ... ... ... ... ... ... Micronesia (Federated States of) (p)
0.1 **, -2 0.3 **, -2 ... ... ... ... ... ... Myanmar
... ... ... ... ... ... ... ... Nauru
2.7 0.9 1.3 0.1 0.1 0.5 0.6 - New Zealand (p)
... ... ... ... ... ... ... ... Niue
... ... ... ... ... ... ... ... Palau
... ... ... ... ... ... ... ... Papua New Guinea
0.7 -1 0.4 -1 ... ... ... ... ... . -1 Philippines (p)
1.9 -1 0.5 -1 2.9 -1 0.1 -1 0.3 -1 0.6 -1 1.9 -1 . -1 Republic of Korea (p)
... ... ... ... ... ... ... ... Samoa
... ... ... ... ... ... ... ... Singapore
... ... ... ... ... ... ... ... Solomon Islands
0.7 0.6 1.8 -1 ... ... ... ... ... Thailand (p)
... ... ... ... ... ... ... ... Timor-Leste
... ... ... ... ... ... ... ... Tokelau
1.3 -1 1.0 -1 ... ... ... ... ... ... Tonga
... ... ... ... ... ... ... ... Tuvalu
... ... ... ... ... ... ... ... Vanuatu
... ... ... ... ... ... ... ... Viet Nam
Latin America and the Caribbean
x -2 - -2 ... ... ... ... ... ... Anguilla
... ... ... ... ... ... ... ... Antigua and Barbuda
1.4 -1 0.6 -1 0.9 -1 0.2 -1 0.2 -1 0.3 -1 0.2 -1 - -1 Argentina (p)
x x ... ... ... ... ... 0.4 Aruba
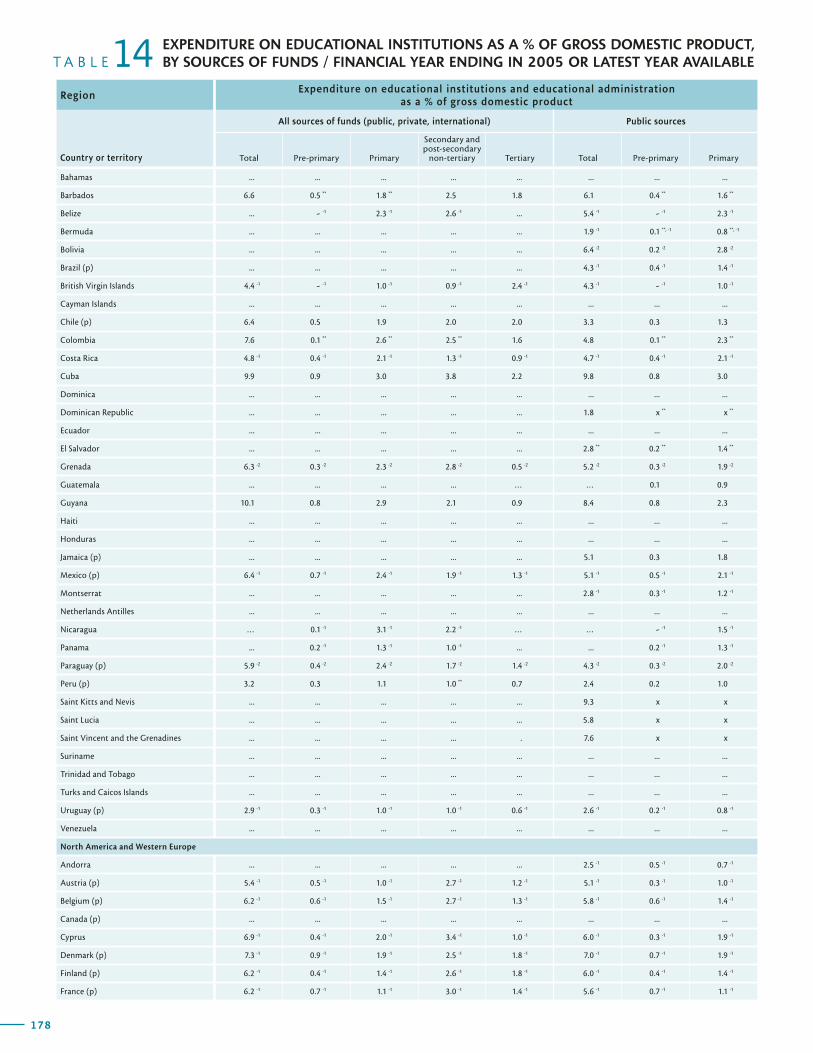
178
RegionExpenditure on educational institutions and educational administration
as a % of gross domestic product
Country or territory
All sources of funds (public, private, international) Public sources
Total Pre-primary Primary
Secondary and post-secondary
non-tertiary Tertiary Total Pre-primary Primary
T A B L E 14 EXPENDITURE ON EDUCATIONAL INSTITUTIONS AS A % OF GROSS DOMESTIC PRODUCT, BY SOURCES OF FUNDS / FINANCIAL YEAR ENDING IN 2005 OR LATEST YEAR AVAILABLE
179
G L O B A L E D U C A T I O N D I G E S T 2 0 0 7 C O M P A R I N G E D U C A T I O N S T A T I S T I C S A R O U N D T H E W O R L D
RegionExpenditure on educational institutions and educational administration
as a % of gross domestic product
Country or territory
All sources of funds (public, private, international) Public sources
Total Pre-primary Primary
Secondary and post-secondary
non-tertiary Tertiary Total Pre-primary Primary
Expenditure on educational institutions and educational administration as a % of gross domestic product
Region
Public sources Private sources International sources
Country or territory
Secondary and post-secondary
non-tertiary Tertiary Total Pre-primary Primary
Secondary and post-secondary
non-tertiary Tertiary Total
Bahamas ... ... ... ... ... ... ... ...
Barbados 6.6 0.5 ** 1.8 ** 2.5 1.8 6.1 0.4 ** 1.6 **
Belize ... - -1 2.3 -1 2.6 -1 ... 5.4 -1 - -1 2.3 -1
Bermuda ... ... ... ... ... 1.9 -1 0.1 **, -1 0.8 **, -1
Bolivia ... ... ... ... ... 6.4 -2 0.2 -2 2.8 -2
Brazil (p) ... ... ... ... ... 4.3 -1 0.4 -1 1.4 -1
British Virgin Islands 4.4 -1 - -1 1.0 -1 0.9 -1 2.4 -1 4.3 -1 - -1 1.0 -1
Cayman Islands ... ... ... ... ... ... ... ...
Chile (p) 6.4 0.5 1.9 2.0 2.0 3.3 0.3 1.3
Colombia 7.6 0.1 ** 2.6 ** 2.5 ** 1.6 4.8 0.1 ** 2.3 **
Costa Rica 4.8 -1 0.4 -1 2.1 -1 1.3 -1 0.9 -1 4.7 -1 0.4 -1 2.1 -1
Cuba 9.9 0.9 3.0 3.8 2.2 9.8 0.8 3.0
Dominica ... ... ... ... ... ... ... ...
Dominican Republic ... ... ... ... ... 1.8 x ** x **
Ecuador ... ... ... ... ... ... ... ...
El Salvador ... ... ... ... ... 2.8 ** 0.2 ** 1.4 **
Grenada 6.3 -2 0.3 -2 2.3 -2 2.8 -2 0.5 -2 5.2 -2 0.3 -2 1.9 -2
Guatemala ... ... ... ... … … 0.1 0.9
Guyana 10.1 0.8 2.9 2.1 0.9 8.4 0.8 2.3
Haiti ... ... ... ... ... ... ... ...
Honduras ... ... ... ... ... ... ... ...
Jamaica (p) ... ... ... ... ... 5.1 0.3 1.8
Mexico (p) 6.4 -1 0.7 -1 2.4 -1 1.9 -1 1.3 -1 5.1 -1 0.5 -1 2.1 -1
Montserrat ... ... ... ... ... 2.8 -1 0.3 -1 1.2 -1
Netherlands Antilles ... ... ... ... ... ... ... ...
Nicaragua … 0.1 -1 3.1 -1 2.2 -1 … … - -1 1.5 -1
Panama ... 0.2 -1 1.3 -1 1.0 -1 ... ... 0.2 -1 1.3 -1
Paraguay (p) 5.9 -2 0.4 -2 2.4 -2 1.7 -2 1.4 -2 4.3 -2 0.3 -2 2.0 -2
Peru (p) 3.2 0.3 1.1 1.0 ** 0.7 2.4 0.2 1.0
Saint Kitts and Nevis ... ... ... ... ... 9.3 x x
Saint Lucia ... ... ... ... ... 5.8 x x
Saint Vincent and the Grenadines ... ... ... ... . 7.6 x x
Suriname ... ... ... ... ... ... ... ...
Trinidad and Tobago ... ... ... ... ... ... ... ...
Turks and Caicos Islands ... ... ... ... ... ... ... ...
Uruguay (p) 2.9 -1 0.3 -1 1.0 -1 1.0 -1 0.6 -1 2.6 -1 0.2 -1 0.8 -1
Venezuela ... ... ... ... ... ... ... ...
North America and Western Europe
Andorra ... ... ... ... ... 2.5 -1 0.5 -1 0.7 -1
Austria (p) 5.4 -1 0.5 -1 1.0 -1 2.7 -1 1.2 -1 5.1 -1 0.3 -1 1.0 -1
Belgium (p) 6.2 -1 0.6 -1 1.5 -1 2.7 -1 1.3 -1 5.8 -1 0.6 -1 1.4 -1
Canada (p) ... ... ... ... ... ... ... ...
Cyprus 6.9 -1 0.4 -1 2.0 -1 3.4 -1 1.0 -1 6.0 -1 0.3 -1 1.9 -1
Denmark (p) 7.3 -1 0.9 -1 1.9 -1 2.5 -1 1.8 -1 7.0 -1 0.7 -1 1.9 -1
Finland (p) 6.2 -1 0.4 -1 1.4 -1 2.6 -1 1.8 -1 6.0 -1 0.4 -1 1.4 -1
France (p) 6.2 -1 0.7 -1 1.1 -1 3.0 -1 1.4 -1 5.6 -1 0.7 -1 1.1 -1
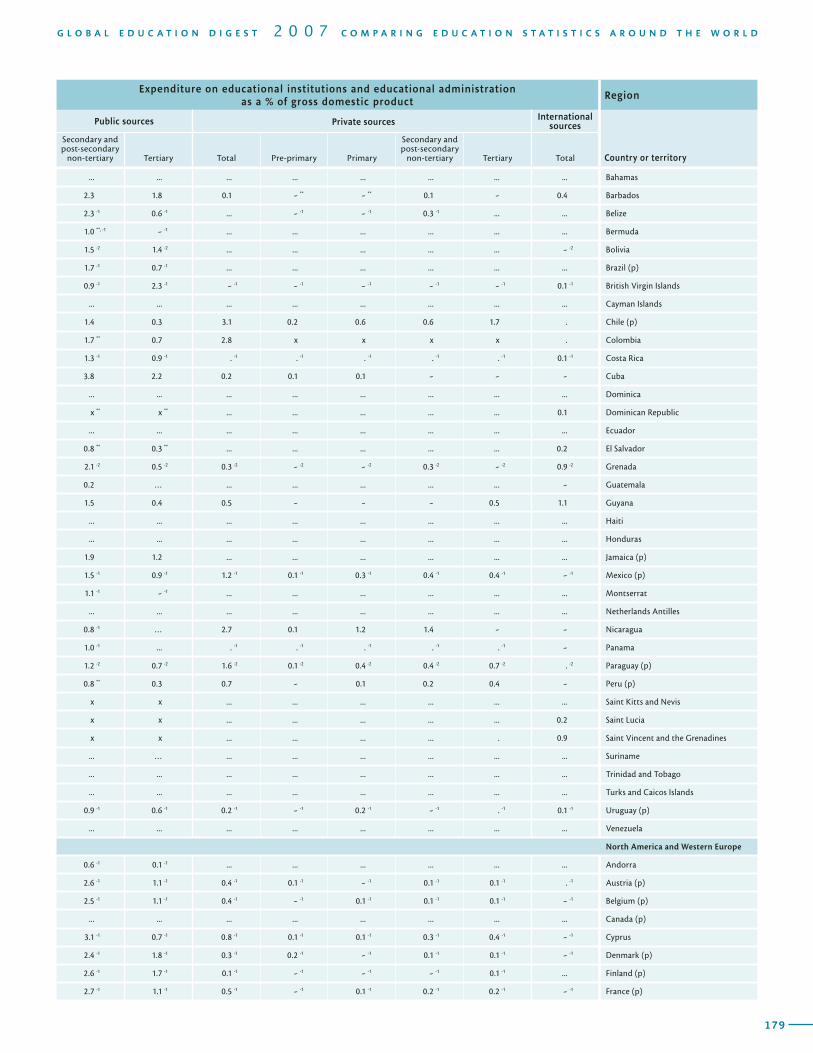
178
RegionExpenditure on educational institutions and educational administration
as a % of gross domestic product
Country or territory
All sources of funds (public, private, international) Public sources
Total Pre-primary Primary
Secondary and post-secondary
non-tertiary Tertiary Total Pre-primary Primary
T A B L E 14 EXPENDITURE ON EDUCATIONAL INSTITUTIONS AS A % OF GROSS DOMESTIC PRODUCT, BY SOURCES OF FUNDS / FINANCIAL YEAR ENDING IN 2005 OR LATEST YEAR AVAILABLE
179
G L O B A L E D U C A T I O N D I G E S T 2 0 0 7 C O M P A R I N G E D U C A T I O N S T A T I S T I C S A R O U N D T H E W O R L D
RegionExpenditure on educational institutions and educational administration
as a % of gross domestic product
Country or territory
All sources of funds (public, private, international) Public sources
Total Pre-primary Primary
Secondary and post-secondary
non-tertiary Tertiary Total Pre-primary Primary
Expenditure on educational institutions and educational administration as a % of gross domestic product
Region
Public sources Private sources International sources
Country or territory
Secondary and post-secondary
non-tertiary Tertiary Total Pre-primary Primary
Secondary and post-secondary
non-tertiary Tertiary Total
... ... ... ... ... ... ... ... Bahamas
2.3 1.8 0.1 - ** - ** 0.1 - 0.4 Barbados
2.3 -1 0.6 -1 ... - -1 - -1 0.3 -1 ... ... Belize
1.0 **, -1 - -1 ... ... ... ... ... ... Bermuda
1.5 -2 1.4 -2 ... ... ... ... ... - -2 Bolivia
1.7 -1 0.7 -1 ... ... ... ... ... ... Brazil (p)
0.9 -1 2.3 -1 - -1 - -1 - -1 - -1 - -1 0.1 -1 British Virgin Islands
... ... ... ... ... ... ... ... Cayman Islands
1.4 0.3 3.1 0.2 0.6 0.6 1.7 . Chile (p)
1.7 ** 0.7 2.8 x x x x . Colombia
1.3 -1 0.9 -1 . -1 . -1 . -1 . -1 . -1 0.1 -1 Costa Rica
3.8 2.2 0.2 0.1 0.1 - - - Cuba
... ... ... ... ... ... ... ... Dominica
x ** x ** ... ... ... ... ... 0.1 Dominican Republic
... ... ... ... ... ... ... ... Ecuador
0.8 ** 0.3 ** ... ... ... ... ... 0.2 El Salvador
2.1 -2 0.5 -2 0.3 -2 - -2 - -2 0.3 -2 - -2 0.9 -2 Grenada
0.2 … ... ... ... ... ... - Guatemala
1.5 0.4 0.5 - - - 0.5 1.1 Guyana
... ... ... ... ... ... ... ... Haiti
... ... ... ... ... ... ... ... Honduras
1.9 1.2 ... ... ... ... ... ... Jamaica (p)
1.5 -1 0.9 -1 1.2 -1 0.1 -1 0.3 -1 0.4 -1 0.4 -1 - -1 Mexico (p)
1.1 -1 - -1 ... ... ... ... ... ... Montserrat
... ... ... ... ... ... ... ... Netherlands Antilles
0.8 -1 … 2.7 0.1 1.2 1.4 - - Nicaragua
1.0 -1 ... . -1 . -1 . -1 . -1 . -1 - Panama
1.2 -2 0.7 -2 1.6 -2 0.1 -2 0.4 -2 0.4 -2 0.7 -2 . -2 Paraguay (p)
0.8 ** 0.3 0.7 - 0.1 0.2 0.4 - Peru (p)
x x ... ... ... ... ... ... Saint Kitts and Nevis
x x ... ... ... ... ... 0.2 Saint Lucia
x x ... ... ... ... . 0.9 Saint Vincent and the Grenadines
... … ... ... ... ... ... ... Suriname
... ... ... ... ... ... ... ... Trinidad and Tobago
... ... ... ... ... ... ... ... Turks and Caicos Islands
0.9 -1 0.6 -1 0.2 -1 - -1 0.2 -1 - -1 . -1 0.1 -1 Uruguay (p)
... ... ... ... ... ... ... ... Venezuela
North America and Western Europe
0.6 -1 0.1 -1 ... ... ... ... ... ... Andorra
2.6 -1 1.1 -1 0.4 -1 0.1 -1 - -1 0.1 -1 0.1 -1 . -1 Austria (p)
2.5 -1 1.1 -1 0.4 -1 - -1 0.1 -1 0.1 -1 0.1 -1 - -1 Belgium (p)
... ... ... ... ... ... ... ... Canada (p)
3.1 -1 0.7 -1 0.8 -1 0.1 -1 0.1 -1 0.3 -1 0.4 -1 - -1 Cyprus
2.4 -1 1.8 -1 0.3 -1 0.2 -1 - -1 0.1 -1 0.1 -1 - -1 Denmark (p)
2.6 -1 1.7 -1 0.1 -1 - -1 - -1 - -1 0.1 -1 ... Finland (p)
2.7 -1 1.1 -1 0.5 -1 - -1 0.1 -1 0.2 -1 0.2 -1 - -1 France (p)
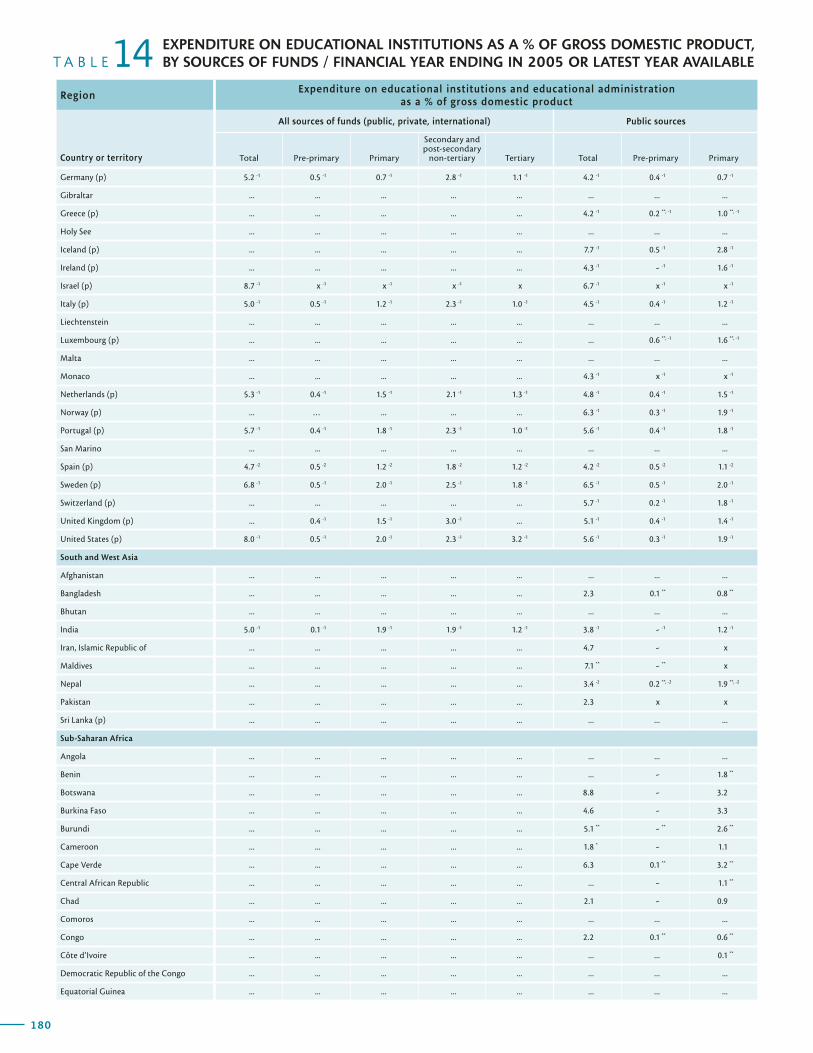
180
RegionExpenditure on educational institutions and educational administration
as a % of gross domestic product
Country or territory
All sources of funds (public, private, international) Public sources
Total Pre-primary Primary
Secondary and post-secondary
non-tertiary Tertiary Total Pre-primary Primary
T A B L E 14 EXPENDITURE ON EDUCATIONAL INSTITUTIONS AS A % OF GROSS DOMESTIC PRODUCT, BY SOURCES OF FUNDS / FINANCIAL YEAR ENDING IN 2005 OR LATEST YEAR AVAILABLE
181
G L O B A L E D U C A T I O N D I G E S T 2 0 0 7 C O M P A R I N G E D U C A T I O N S T A T I S T I C S A R O U N D T H E W O R L D
RegionExpenditure on educational institutions and educational administration
as a % of gross domestic product
Country or territory
All sources of funds (public, private, international) Public sources
Total Pre-primary Primary
Secondary and post-secondary
non-tertiary Tertiary Total Pre-primary Primary
Expenditure on educational institutions and educational administration as a % of gross domestic product
Region
Public sources Private sources International sources
Country or territory
Secondary and post-secondary
non-tertiary Tertiary Total Pre-primary Primary
Secondary and post-secondary
non-tertiary Tertiary Total
Germany (p) 5.2 -1 0.5 -1 0.7 -1 2.8 -1 1.1 -1 4.2 -1 0.4 -1 0.7 -1
Gibraltar ... ... ... ... ... ... ... ...
Greece (p) ... ... ... ... ... 4.2 -1 0.2 **, -1 1.0 **, -1
Holy See ... ... ... ... ... ... ... ...
Iceland (p) ... ... ... ... ... 7.7 -1 0.5 -1 2.8 -1
Ireland (p) ... ... ... ... ... 4.3 -1 - -1 1.6 -1
Israel (p) 8.7 -1 x -1 x -1 x -1 x 6.7 -1 x -1 x -1
Italy (p) 5.0 -1 0.5 -1 1.2 -1 2.3 -1 1.0 -1 4.5 -1 0.4 -1 1.2 -1
Liechtenstein ... ... ... ... ... ... ... ...
Luxembourg (p) ... ... ... ... ... ... 0.6 **, -1 1.6 **, -1
Malta ... ... ... ... ... ... ... ...
Monaco ... ... ... ... ... 4.3 -1 x -1 x -1
Netherlands (p) 5.3 -1 0.4 -1 1.5 -1 2.1 -1 1.3 -1 4.8 -1 0.4 -1 1.5 -1
Norway (p) ... … ... ... ... 6.3 -1 0.3 -1 1.9 -1
Portugal (p) 5.7 -1 0.4 -1 1.8 -1 2.3 -1 1.0 -1 5.6 -1 0.4 -1 1.8 -1
San Marino ... ... ... ... ... ... ... ...
Spain (p) 4.7 -2 0.5 -2 1.2 -2 1.8 -2 1.2 -2 4.2 -2 0.5 -2 1.1 -2
Sweden (p) 6.8 -1 0.5 -1 2.0 -1 2.5 -1 1.8 -1 6.5 -1 0.5 -1 2.0 -1
Switzerland (p) ... ... ... ... ... 5.7 -1 0.2 -1 1.8 -1
United Kingdom (p) ... 0.4 -1 1.5 -1 3.0 -1 ... 5.1 -1 0.4 -1 1.4 -1
United States (p) 8.0 -1 0.5 -1 2.0 -1 2.3 -1 3.2 -1 5.6 -1 0.3 -1 1.9 -1
South and West Asia
Afghanistan ... ... ... ... ... ... ... ...
Bangladesh ... ... ... ... ... 2.3 0.1 ** 0.8 **
Bhutan ... ... ... ... ... ... ... ...
India 5.0 -1 0.1 -1 1.9 -1 1.9 -1 1.2 -1 3.8 -1 - -1 1.2 -1
Iran, Islamic Republic of ... ... ... ... ... 4.7 - x
Maldives ... ... ... ... ... 7.1 ** - ** x
Nepal ... ... ... ... ... 3.4 -2 0.2 **, -2 1.9 **, -2
Pakistan ... ... ... ... ... 2.3 x x
Sri Lanka (p) ... ... ... ... ... ... ... ...
Sub-Saharan Africa
Angola ... ... ... ... ... ... ... ...
Benin ... ... ... ... ... ... - 1.8 **
Botswana ... ... ... ... ... 8.8 - 3.2
Burkina Faso ... ... ... ... ... 4.6 - 3.3
Burundi ... ... ... ... ... 5.1 ** - ** 2.6 **
Cameroon ... ... ... ... ... 1.8 * - 1.1
Cape Verde ... ... ... ... ... 6.3 0.1 ** 3.2 **
Central African Republic ... ... ... ... ... ... - 1.1 **
Chad ... ... ... ... ... 2.1 - 0.9
Comoros ... ... ... ... ... ... ... ...
Congo ... ... ... ... ... 2.2 0.1 ** 0.6 **
Côte d’Ivoire ... ... ... ... ... ... ... 0.1 **
Democratic Republic of the Congo ... ... ... ... ... ... ... ...
Equatorial Guinea ... ... ... ... ... ... ... ...
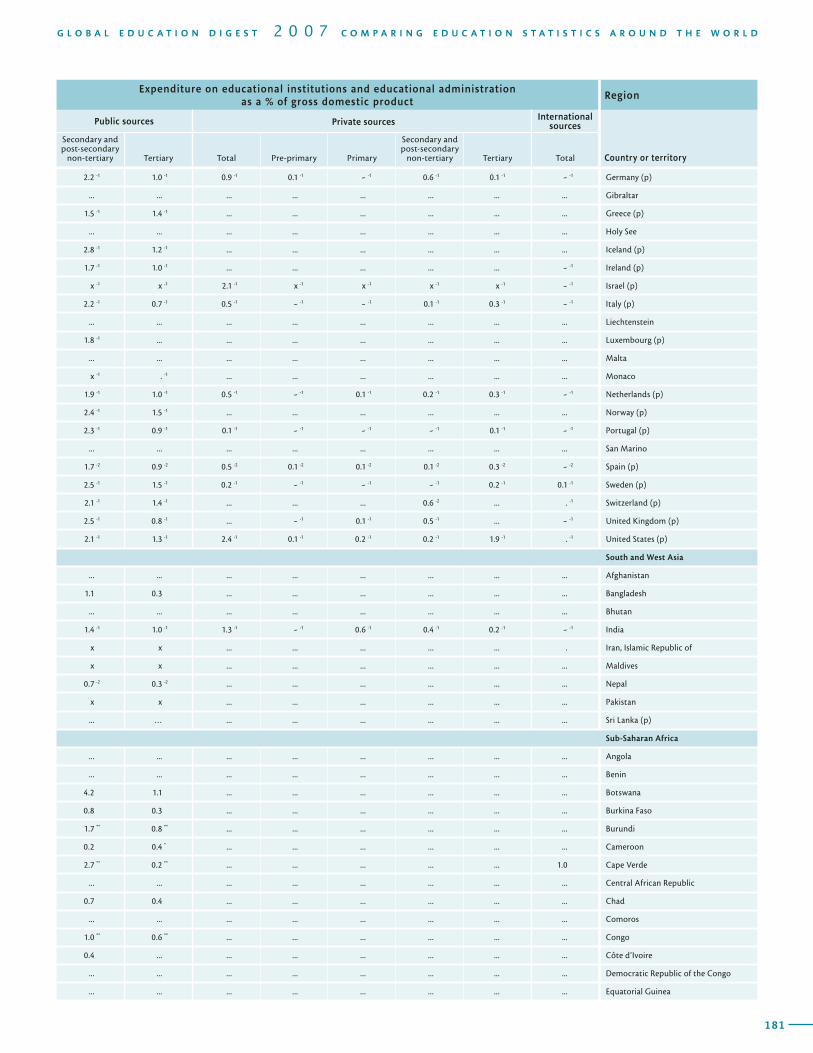
180
RegionExpenditure on educational institutions and educational administration
as a % of gross domestic product
Country or territory
All sources of funds (public, private, international) Public sources
Total Pre-primary Primary
Secondary and post-secondary
non-tertiary Tertiary Total Pre-primary Primary
T A B L E 14 EXPENDITURE ON EDUCATIONAL INSTITUTIONS AS A % OF GROSS DOMESTIC PRODUCT, BY SOURCES OF FUNDS / FINANCIAL YEAR ENDING IN 2005 OR LATEST YEAR AVAILABLE
181
G L O B A L E D U C A T I O N D I G E S T 2 0 0 7 C O M P A R I N G E D U C A T I O N S T A T I S T I C S A R O U N D T H E W O R L D
RegionExpenditure on educational institutions and educational administration
as a % of gross domestic product
Country or territory
All sources of funds (public, private, international) Public sources
Total Pre-primary Primary
Secondary and post-secondary
non-tertiary Tertiary Total Pre-primary Primary
Expenditure on educational institutions and educational administration as a % of gross domestic product
Region
Public sources Private sources International sources
Country or territory
Secondary and post-secondary
non-tertiary Tertiary Total Pre-primary Primary
Secondary and post-secondary
non-tertiary Tertiary Total
2.2 -1 1.0 -1 0.9 -1 0.1 -1 - -1 0.6 -1 0.1 -1 - -1 Germany (p)
... ... ... ... ... ... ... ... Gibraltar
1.5 -1 1.4 -1 ... ... ... ... ... ... Greece (p)
... ... ... ... ... ... ... ... Holy See
2.8 -1 1.2 -1 ... ... ... ... ... ... Iceland (p)
1.7 -1 1.0 -1 ... ... ... ... ... - -1 Ireland (p)
x -1 x -1 2.1 -1 x -1 x -1 x -1 x -1 - -1 Israel (p)
2.2 -1 0.7 -1 0.5 -1 - -1 - -1 0.1 -1 0.3 -1 - -1 Italy (p)
... ... ... ... ... ... ... ... Liechtenstein
1.8 -1 ... ... ... ... ... ... ... Luxembourg (p)
... ... ... ... ... ... ... ... Malta
x -1 . -1 ... ... ... ... ... ... Monaco
1.9 -1 1.0 -1 0.5 -1 - -1 0.1 -1 0.2 -1 0.3 -1 - -1 Netherlands (p)
2.4 -1 1.5 -1 ... ... ... ... ... ... Norway (p)
2.3 -1 0.9 -1 0.1 -1 - -1 - -1 - -1 0.1 -1 - -1 Portugal (p)
... ... ... ... ... ... ... ... San Marino
1.7 -2 0.9 -2 0.5 -2 0.1 -2 0.1 -2 0.1 -2 0.3 -2 - -2 Spain (p)
2.5 -1 1.5 -1 0.2 -1 - -1 - -1 - -1 0.2 -1 0.1 -1 Sweden (p)
2.1 -1 1.4 -1 ... ... ... 0.6 -2 ... . -1 Switzerland (p)
2.5 -1 0.8 -1 ... - -1 0.1 -1 0.5 -1 ... - -1 United Kingdom (p)
2.1 -1 1.3 -1 2.4 -1 0.1 -1 0.2 -1 0.2 -1 1.9 -1 . -1 United States (p)
South and West Asia
... ... ... ... ... ... ... ... Afghanistan
1.1 0.3 ... ... ... ... ... ... Bangladesh
... ... ... ... ... ... ... ... Bhutan
1.4 -1 1.0 -1 1.3 -1 - -1 0.6 -1 0.4 -1 0.2 -1 - -1 India
x x ... ... ... ... ... . Iran, Islamic Republic of
x x ... ... ... ... ... ... Maldives
0.7 -2 0.3 -2 ... ... ... ... ... ... Nepal
x x ... ... ... ... ... ... Pakistan
... … ... ... ... ... ... ... Sri Lanka (p)
Sub-Saharan Africa
... ... ... ... ... ... ... ... Angola
... ... ... ... ... ... ... ... Benin
4.2 1.1 ... ... ... ... ... ... Botswana
0.8 0.3 ... ... ... ... ... ... Burkina Faso
1.7 ** 0.8 ** ... ... ... ... ... ... Burundi
0.2 0.4 * ... ... ... ... ... ... Cameroon
2.7 ** 0.2 ** ... ... ... ... ... 1.0 Cape Verde
... ... ... ... ... ... ... ... Central African Republic
0.7 0.4 ... ... ... ... ... ... Chad
... ... ... ... ... ... ... ... Comoros
1.0 ** 0.6 ** ... ... ... ... ... ... Congo
0.4 ... ... ... ... ... ... ... Côte d’Ivoire
... ... ... ... ... ... ... ... Democratic Republic of the Congo
... ... ... ... ... ... ... ... Equatorial Guinea
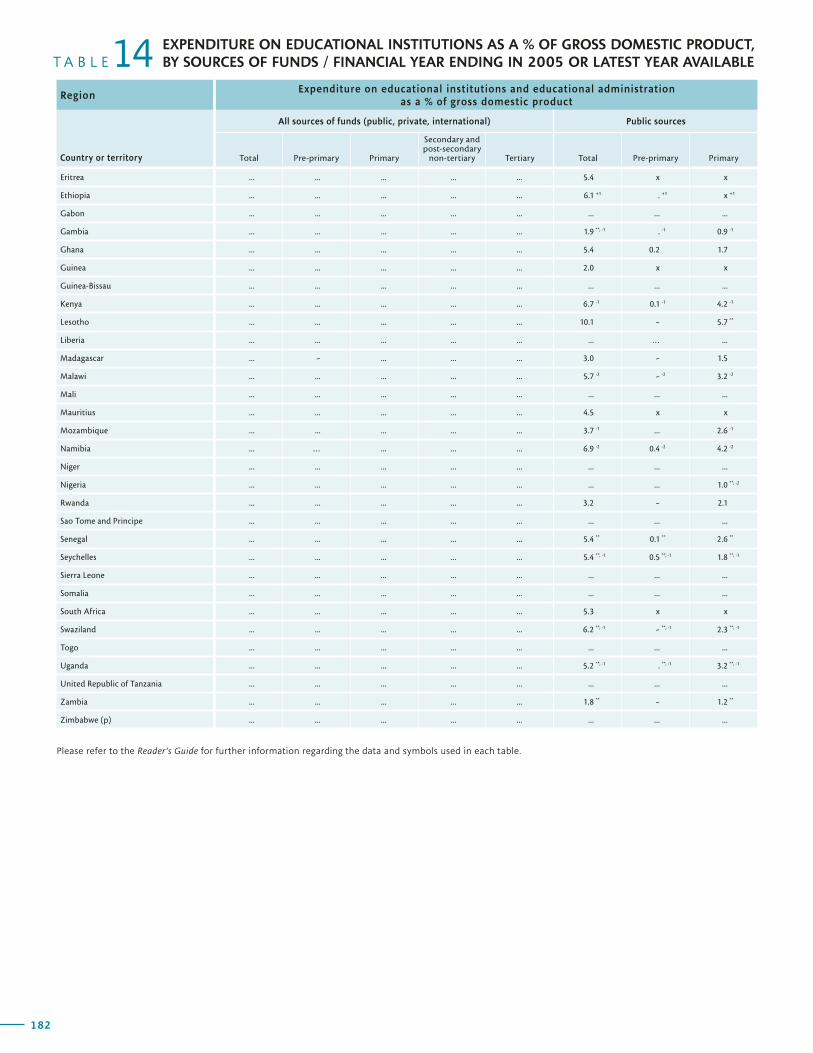
182
RegionExpenditure on educational institutions and educational administration
as a % of gross domestic product
Country or territory
All sources of funds (public, private, international) Public sources
Total Pre-primary Primary
Secondary and post-secondary
non-tertiary Tertiary Total Pre-primary Primary
T A B L E 14 EXPENDITURE ON EDUCATIONAL INSTITUTIONS AS A % OF GROSS DOMESTIC PRODUCT, BY SOURCES OF FUNDS / FINANCIAL YEAR ENDING IN 2005 OR LATEST YEAR AVAILABLE
183
G L O B A L E D U C A T I O N D I G E S T 2 0 0 7 C O M P A R I N G E D U C A T I O N S T A T I S T I C S A R O U N D T H E W O R L D
RegionExpenditure on educational institutions and educational administration
as a % of gross domestic product
Country or territory
All sources of funds (public, private, international) Public sources
Total Pre-primary Primary
Secondary and post-secondary
non-tertiary Tertiary Total Pre-primary Primary
Expenditure on educational institutions and educational administration as a % of gross domestic product
Region
Public sources Private sources International sources
Country or territory
Secondary and post-secondary
non-tertiary Tertiary Total Pre-primary Primary
Secondary and post-secondary
non-tertiary Tertiary Total
Eritrea ... ... ... ... ... 5.4 x x
Ethiopia ... ... ... ... ... 6.1 +1 . +1 x +1
Gabon ... ... ... ... ... ... ... ...
Gambia ... ... ... ... ... 1.9 **, -1 . -1 0.9 -1
Ghana ... ... ... ... ... 5.4 0.2 1.7
Guinea ... ... ... ... ... 2.0 x x
Guinea-Bissau ... ... ... ... ... ... ... ...
Kenya ... ... ... ... ... 6.7 -1 0.1 -1 4.2 -1
Lesotho ... ... ... ... ... 10.1 - 5.7 **
Liberia ... ... ... ... ... ... … ...
Madagascar ... - ... ... ... 3.0 - 1.5
Malawi ... ... ... ... ... 5.7 -2 - -2 3.2 -2
Mali ... ... ... ... ... ... ... ...
Mauritius ... ... ... ... ... 4.5 x x
Mozambique ... ... ... ... ... 3.7 -1 ... 2.6 -1
Namibia ... … ... ... ... 6.9 -2 0.4 -2 4.2 -2
Niger ... ... ... ... ... ... ... ...
Nigeria ... ... ... ... ... ... ... 1.0 **, -2
Rwanda ... ... ... ... ... 3.2 - 2.1
Sao Tome and Principe ... ... ... ... ... ... ... ...
Senegal ... ... ... ... ... 5.4 ** 0.1 ** 2.6 **
Seychelles ... ... ... ... ... 5.4 **, -1 0.5 **, -1 1.8 **, -1
Sierra Leone ... ... ... ... ... ... ... ...
Somalia ... ... ... ... ... ... ... ...
South Africa ... ... ... ... ... 5.3 x x
Swaziland ... ... ... ... ... 6.2 **, -1 - **, -1 2.3 **, -1
Togo ... ... ... ... ... ... ... ...
Uganda ... ... ... ... ... 5.2 **, -1 . **, -1 3.2 **, -1
United Republic of Tanzania ... ... ... ... ... ... ... ...
Zambia ... ... ... ... ... 1.8 ** - 1.2 **
Zimbabwe (p) ... ... ... ... ... ... ... ...
Please refer to the Reader’s Guide for further information regarding the data and symbols used in each table.

182
RegionExpenditure on educational institutions and educational administration
as a % of gross domestic product
Country or territory
All sources of funds (public, private, international) Public sources
Total Pre-primary Primary
Secondary and post-secondary
non-tertiary Tertiary Total Pre-primary Primary
T A B L E 14 EXPENDITURE ON EDUCATIONAL INSTITUTIONS AS A % OF GROSS DOMESTIC PRODUCT, BY SOURCES OF FUNDS / FINANCIAL YEAR ENDING IN 2005 OR LATEST YEAR AVAILABLE
183
G L O B A L E D U C A T I O N D I G E S T 2 0 0 7 C O M P A R I N G E D U C A T I O N S T A T I S T I C S A R O U N D T H E W O R L D
RegionExpenditure on educational institutions and educational administration
as a % of gross domestic product
Country or territory
All sources of funds (public, private, international) Public sources
Total Pre-primary Primary
Secondary and post-secondary
non-tertiary Tertiary Total Pre-primary Primary
Expenditure on educational institutions and educational administration as a % of gross domestic product
Region
Public sources Private sources International sources
Country or territory
Secondary and post-secondary
non-tertiary Tertiary Total Pre-primary Primary
Secondary and post-secondary
non-tertiary Tertiary Total
x x ... ... ... ... ... 0.8 -1 Eritrea
x +1 x +1 ... ... ... ... ... ... Ethiopia
... ... ... ... ... ... ... ... Gabon
0.7 -1 0.1 -1 ... ... ... ... ... ... Gambia
2.3 1.1 ... ... ... ... ... ... Ghana
x 0.6 ... ... ... ... ... ... Guinea
... ... ... ... ... ... ... ... Guinea-Bissau
1.6 -1 0.9 -1 3.3 **, -2 0.4 -2 0.8 -2 1.6 **, -2 0.5 **, -2 ... Kenya
2.5 ** 1.8 ** ... ... ... ... ... ... Lesotho
... ... ... ... ... ... ... ... Liberia
0.7 0.4 ... - ... ... ... 0.7 Madagascar
1.2 -2 1.0 -2 ... ... ... ... ... ... Malawi
... ... ... ... ... ... ... 1.0 Mali
x x ... ... ... ... ... ... Mauritius
0.6 -1 0.5 -1 ... ... ... ... ... ... Mozambique
1.8 -2 0.6 -2 ... ... ... ... ... ... Namibia
... ... ... ... ... ... ... ... Niger
1.6 **, -2 0.6 -2 ... ... ... ... ... ... Nigeria
0.3 0.7 ... ... ... ... ... ... Rwanda
... ... ... ... ... ... ... ... Sao Tome and Principe
1.4 ** 1.4 ** ... ... ... ... ... ... Senegal
2.2 **, -1 0.9 **, -1 ... ... ... ... ... ... Seychelles
... ... ... ... ... ... ... ... Sierra Leone
... ... ... ... ... ... ... ... Somalia
x x ... ... ... ... ... - South Africa
1.9 **, -1 1.7 **, -1 ... ... ... ... ... ... Swaziland
... ... ... ... ... ... ... ... Togo
1.3 **, -1 0.6 **, -1 ... ... ... ... ... 0.5 -1 Uganda
... ... ... ... ... ... ... ... United Republic of Tanzania
0.3 ** 0.3 ** ... ... ... ... ... 0.1 -1 Zambia
... ... ... ... ... ... ... ... Zimbabwe (p)
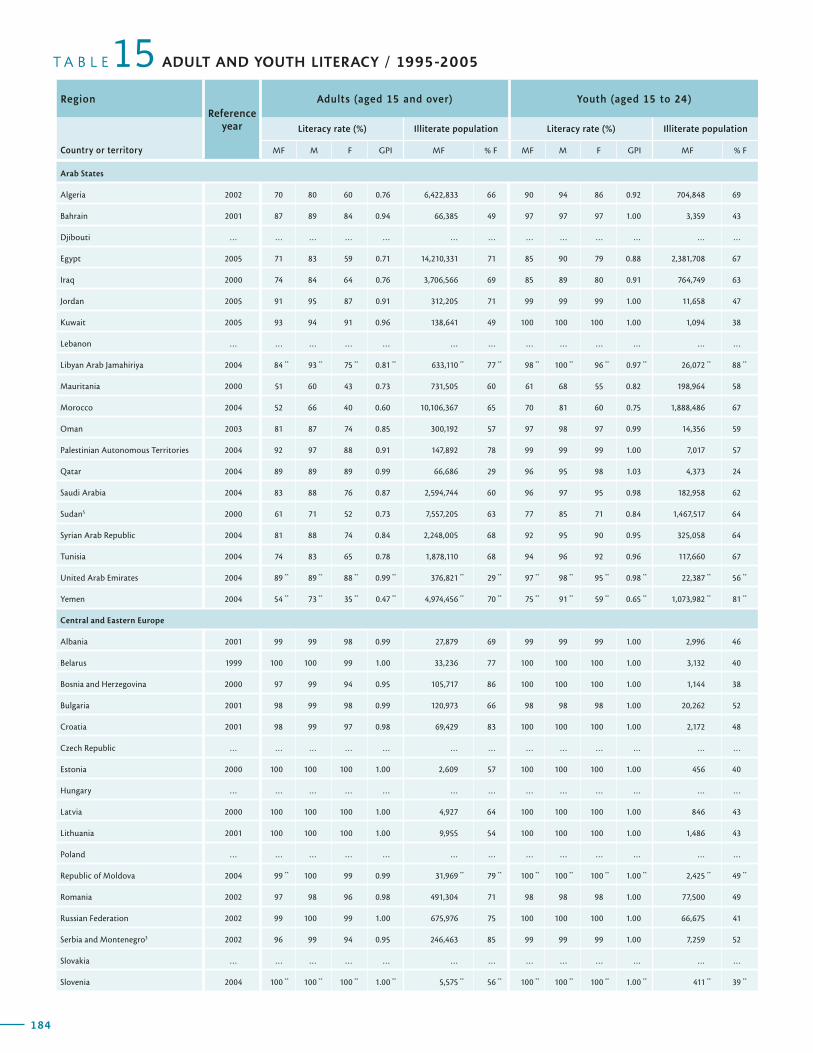
184
RegionReference
year
Adults (aged 15 and over) Youth (aged 15 to 24)
Country or territory
Literacy rate (%) Illiterate population Literacy rate (%) Illiterate population
MF M F GPI MF % F MF M F GPI MF % F
T A B L E 15 ADULT AND YOUTH LITERACY / 1995-2005
185
G L O B A L E D U C A T I O N D I G E S T 2 0 0 7 C O M P A R I N G E D U C A T I O N S T A T I S T I C S A R O U N D T H E W O R L D
RegionReference
year
Adults (aged 15 and over) Youth (aged 15 to 24)
Country or territory
Literacy rate (%) Illiterate population Literacy rate (%) Illiterate population
MF M F GPI MF % F MF M F GPI MF % F
Arab States
Algeria 2002 70 80 60 0.76 6,422,833 66 90 94 86 0.92 704,848 69
Bahrain 2001 87 89 84 0.94 66,385 49 97 97 97 1.00 3,359 43
Djibouti … … … … … … … … … … … … …
Egypt 2005 71 83 59 0.71 14,210,331 71 85 90 79 0.88 2,381,708 67
Iraq 2000 74 84 64 0.76 3,706,566 69 85 89 80 0.91 764,749 63
Jordan 2005 91 95 87 0.91 312,205 71 99 99 99 1.00 11,658 47
Kuwait 2005 93 94 91 0.96 138,641 49 100 100 100 1.00 1,094 38
Lebanon … … … … … … … … … … … … …
Libyan Arab Jamahiriya 2004 84 ** 93 ** 75 ** 0.81 ** 633,110 ** 77 ** 98 ** 100 ** 96 ** 0.97 ** 26,072 ** 88 **
Mauritania 2000 51 60 43 0.73 731,505 60 61 68 55 0.82 198,964 58
Morocco 2004 52 66 40 0.60 10,106,367 65 70 81 60 0.75 1,888,486 67
Oman 2003 81 87 74 0.85 300,192 57 97 98 97 0.99 14,356 59
Palestinian Autonomous Territories 2004 92 97 88 0.91 147,892 78 99 99 99 1.00 7,017 57
Qatar 2004 89 89 89 0.99 66,686 29 96 95 98 1.03 4,373 24
Saudi Arabia 2004 83 88 76 0.87 2,594,744 60 96 97 95 0.98 182,958 62
Sudan5 2000 61 71 52 0.73 7,557,205 63 77 85 71 0.84 1,467,517 64
Syrian Arab Republic 2004 81 88 74 0.84 2,248,005 68 92 95 90 0.95 325,058 64
Tunisia 2004 74 83 65 0.78 1,878,110 68 94 96 92 0.96 117,660 67
United Arab Emirates 2004 89 ** 89 ** 88 ** 0.99 ** 376,821 ** 29 ** 97 ** 98 ** 95 ** 0.98 ** 22,387 ** 56 **
Yemen 2004 54 ** 73 ** 35 ** 0.47 ** 4,974,456 ** 70 ** 75 ** 91 ** 59 ** 0.65 ** 1,073,982 ** 81 **
Central and Eastern Europe
Albania 2001 99 99 98 0.99 27,879 69 99 99 99 1.00 2,996 46
Belarus 1999 100 100 99 1.00 33,236 77 100 100 100 1.00 3,132 40
Bosnia and Herzegovina 2000 97 99 94 0.95 105,717 86 100 100 100 1.00 1,144 38
Bulgaria 2001 98 99 98 0.99 120,973 66 98 98 98 1.00 20,262 52
Croatia 2001 98 99 97 0.98 69,429 83 100 100 100 1.00 2,172 48
Czech Republic … … … … … … … … … … … … …
Estonia 2000 100 100 100 1.00 2,609 57 100 100 100 1.00 456 40
Hungary … … … … … … … … … … … … …
Latvia 2000 100 100 100 1.00 4,927 64 100 100 100 1.00 846 43
Lithuania 2001 100 100 100 1.00 9,955 54 100 100 100 1.00 1,486 43
Poland … … … … … … … … … … … … …
Republic of Moldova 2004 99 ** 100 99 0.99 31,969 ** 79 ** 100 ** 100 ** 100 ** 1.00 ** 2,425 ** 49 **
Romania 2002 97 98 96 0.98 491,304 71 98 98 98 1.00 77,500 49
Russian Federation 2002 99 100 99 1.00 675,976 75 100 100 100 1.00 66,675 41
Serbia and Montenegro3 2002 96 99 94 0.95 246,463 85 99 99 99 1.00 7,259 52
Slovakia … … … … … … … … … … … … …
Slovenia 2004 100 ** 100 ** 100 ** 1.00 ** 5,575 ** 56 ** 100 ** 100 ** 100 ** 1.00 ** 411 ** 39 **
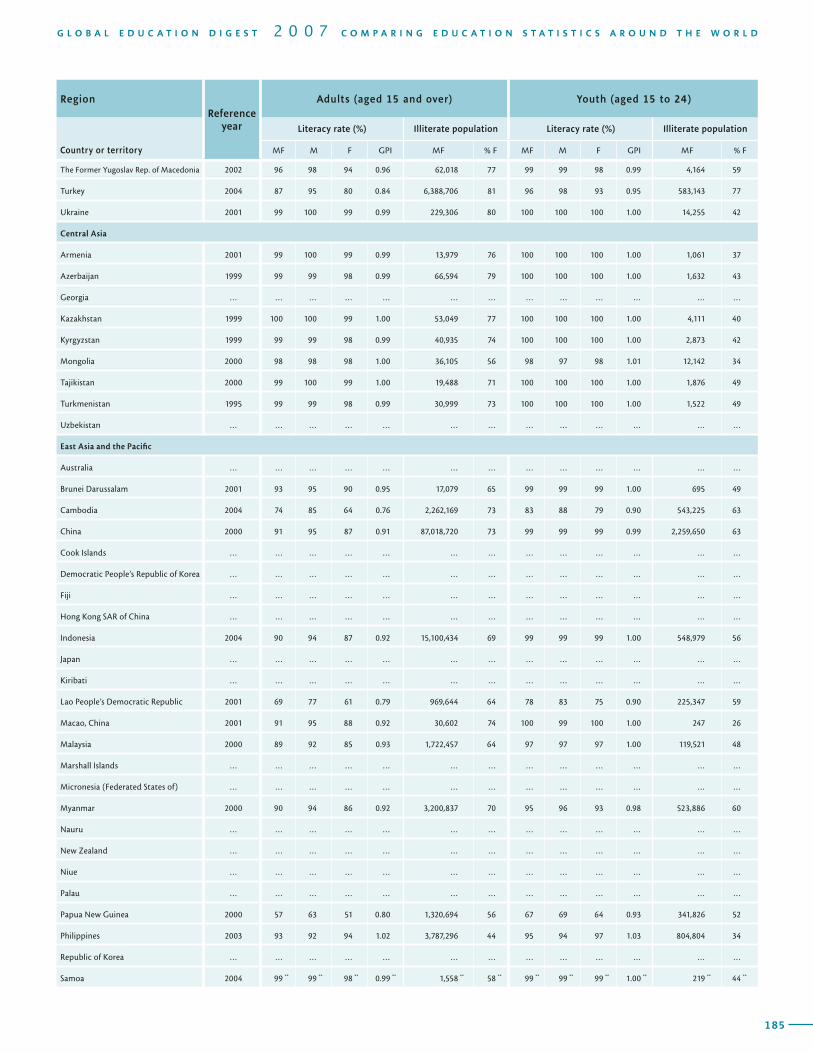
184
RegionReference
year
Adults (aged 15 and over) Youth (aged 15 to 24)
Country or territory
Literacy rate (%) Illiterate population Literacy rate (%) Illiterate population
MF M F GPI MF % F MF M F GPI MF % F
T A B L E 15 ADULT AND YOUTH LITERACY / 1995-2005
185
G L O B A L E D U C A T I O N D I G E S T 2 0 0 7 C O M P A R I N G E D U C A T I O N S T A T I S T I C S A R O U N D T H E W O R L D
RegionReference
year
Adults (aged 15 and over) Youth (aged 15 to 24)
Country or territory
Literacy rate (%) Illiterate population Literacy rate (%) Illiterate population
MF M F GPI MF % F MF M F GPI MF % F
The Former Yugoslav Rep. of Macedonia 2002 96 98 94 0.96 62,018 77 99 99 98 0.99 4,164 59
Turkey 2004 87 95 80 0.84 6,388,706 81 96 98 93 0.95 583,143 77
Ukraine 2001 99 100 99 0.99 229,306 80 100 100 100 1.00 14,255 42
Central Asia
Armenia 2001 99 100 99 0.99 13,979 76 100 100 100 1.00 1,061 37
Azerbaijan 1999 99 99 98 0.99 66,594 79 100 100 100 1.00 1,632 43
Georgia … … … … … … … … … … … … …
Kazakhstan 1999 100 100 99 1.00 53,049 77 100 100 100 1.00 4,111 40
Kyrgyzstan 1999 99 99 98 0.99 40,935 74 100 100 100 1.00 2,873 42
Mongolia 2000 98 98 98 1.00 36,105 56 98 97 98 1.01 12,142 34
Tajikistan 2000 99 100 99 1.00 19,488 71 100 100 100 1.00 1,876 49
Turkmenistan 1995 99 99 98 0.99 30,999 73 100 100 100 1.00 1,522 49
Uzbekistan … … … … … … … … … … … … …
East Asia and the Pacific
Australia … … … … … … … … … … … … …
Brunei Darussalam 2001 93 95 90 0.95 17,079 65 99 99 99 1.00 695 49
Cambodia 2004 74 85 64 0.76 2,262,169 73 83 88 79 0.90 543,225 63
China 2000 91 95 87 0.91 87,018,720 73 99 99 99 0.99 2,259,650 63
Cook Islands … … … … … … … … … … … … …
Democratic People’s Republic of Korea … … … … … … … … … … … … …
Fiji … … … … … … … … … … … … …
Hong Kong SAR of China … … … … … … … … … … … … …
Indonesia 2004 90 94 87 0.92 15,100,434 69 99 99 99 1.00 548,979 56
Japan … … … … … … … … … … … … …
Kiribati … … … … … … … … … … … … …
Lao People’s Democratic Republic 2001 69 77 61 0.79 969,644 64 78 83 75 0.90 225,347 59
Macao, China 2001 91 95 88 0.92 30,602 74 100 99 100 1.00 247 26
Malaysia 2000 89 92 85 0.93 1,722,457 64 97 97 97 1.00 119,521 48
Marshall Islands … … … … … … … … … … … … …
Micronesia (Federated States of) … … … … … … … … … … … … …
Myanmar 2000 90 94 86 0.92 3,200,837 70 95 96 93 0.98 523,886 60
Nauru … … … … … … … … … … … … …
New Zealand … … … … … … … … … … … … …
Niue … … … … … … … … … … … … …
Palau … … … … … … … … … … … … …
Papua New Guinea 2000 57 63 51 0.80 1,320,694 56 67 69 64 0.93 341,826 52
Philippines 2003 93 92 94 1.02 3,787,296 44 95 94 97 1.03 804,804 34
Republic of Korea … … … … … … … … … … … … …
Samoa 2004 99 ** 99 ** 98 ** 0.99 ** 1,558 ** 58 ** 99 ** 99 ** 99 ** 1.00 ** 219 ** 44 **
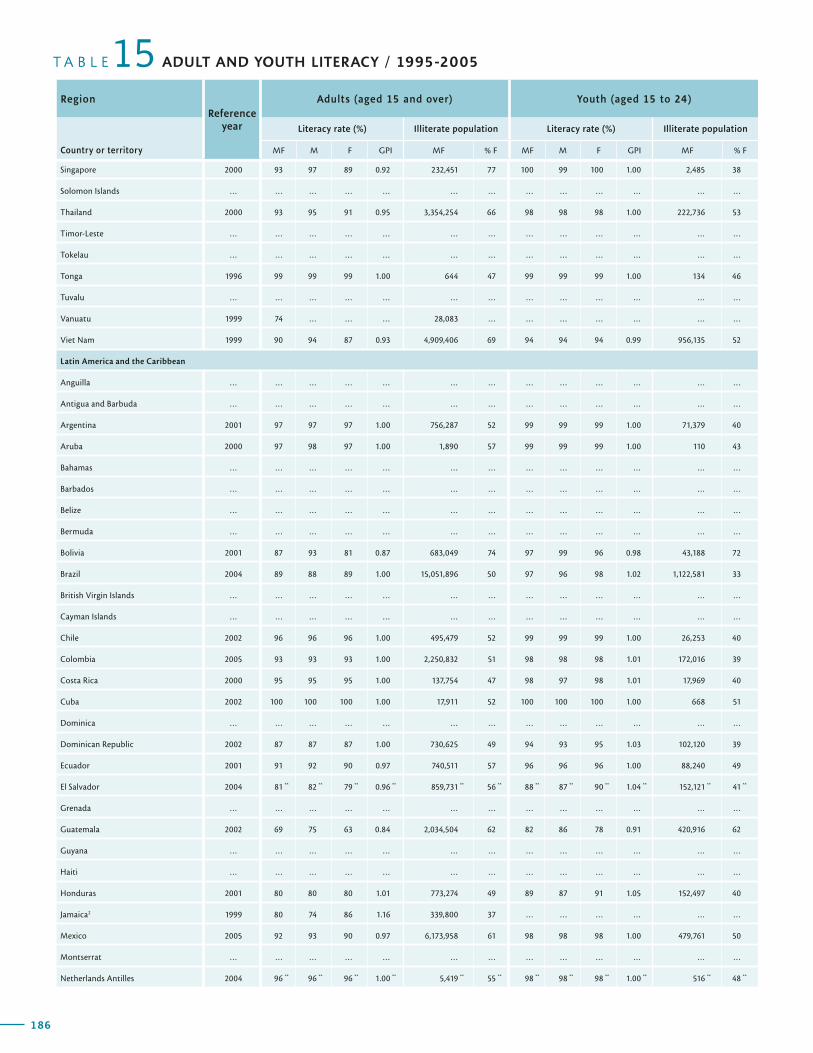
186
RegionReference
year
Adults (aged 15 and over) Youth (aged 15 to 24)
Country or territory
Literacy rate (%) Illiterate population Literacy rate (%) Illiterate population
MF M F GPI MF % F MF M F GPI MF % F
T A B L E 15 ADULT AND YOUTH LITERACY / 1995-2005
187
G L O B A L E D U C A T I O N D I G E S T 2 0 0 7 C O M P A R I N G E D U C A T I O N S T A T I S T I C S A R O U N D T H E W O R L D
RegionReference
year
Adults (aged 15 and over) Youth (aged 15 to 24)
Country or territory
Literacy rate (%) Illiterate population Literacy rate (%) Illiterate population
MF M F GPI MF % F MF M F GPI MF % F
Singapore 2000 93 97 89 0.92 232,451 77 100 99 100 1.00 2,485 38
Solomon Islands … … … … … … … … … … … … …
Thailand 2000 93 95 91 0.95 3,354,254 66 98 98 98 1.00 222,736 53
Timor-Leste … … … … … … … … … … … … …
Tokelau … … … … … … … … … … … … …
Tonga 1996 99 99 99 1.00 644 47 99 99 99 1.00 134 46
Tuvalu … … … … … … … … … … … … …
Vanuatu 1999 74 … … … 28,083 … … … … … … …
Viet Nam 1999 90 94 87 0.93 4,909,406 69 94 94 94 0.99 956,135 52
Latin America and the Caribbean
Anguilla … … … … … … … … … … … … …
Antigua and Barbuda … … … … … … … … … … … … …
Argentina 2001 97 97 97 1.00 756,287 52 99 99 99 1.00 71,379 40
Aruba 2000 97 98 97 1.00 1,890 57 99 99 99 1.00 110 43
Bahamas … … … … … … … … … … … … …
Barbados … … … … … … … … … … … … …
Belize … … … … … … … … … … … … …
Bermuda … … … … … … … … … … … … …
Bolivia 2001 87 93 81 0.87 683,049 74 97 99 96 0.98 43,188 72
Brazil 2004 89 88 89 1.00 15,051,896 50 97 96 98 1.02 1,122,581 33
British Virgin Islands … … … … … … … … … … … … …
Cayman Islands … … … … … … … … … … … … …
Chile 2002 96 96 96 1.00 495,479 52 99 99 99 1.00 26,253 40
Colombia 2005 93 93 93 1.00 2,250,832 51 98 98 98 1.01 172,016 39
Costa Rica 2000 95 95 95 1.00 137,754 47 98 97 98 1.01 17,969 40
Cuba 2002 100 100 100 1.00 17,911 52 100 100 100 1.00 668 51
Dominica … … … … … … … … … … … … …
Dominican Republic 2002 87 87 87 1.00 730,625 49 94 93 95 1.03 102,120 39
Ecuador 2001 91 92 90 0.97 740,511 57 96 96 96 1.00 88,240 49
El Salvador 2004 81 ** 82 ** 79 ** 0.96 ** 859,731 ** 56 ** 88 ** 87 ** 90 ** 1.04 ** 152,121 ** 41 **
Grenada … … … … … … … … … … … … …
Guatemala 2002 69 75 63 0.84 2,034,504 62 82 86 78 0.91 420,916 62
Guyana … … … … … … … … … … … … …
Haiti … … … … … … … … … … … … …
Honduras 2001 80 80 80 1.01 773,274 49 89 87 91 1.05 152,497 40
Jamaica2 1999 80 74 86 1.16 339,800 37 … … … … … …
Mexico 2005 92 93 90 0.97 6,173,958 61 98 98 98 1.00 479,761 50
Montserrat … … … … … … … … … … … … …
Netherlands Antilles 2004 96 ** 96 ** 96 ** 1.00 ** 5,419 ** 55 ** 98 ** 98 ** 98 ** 1.00 ** 516 ** 48 **
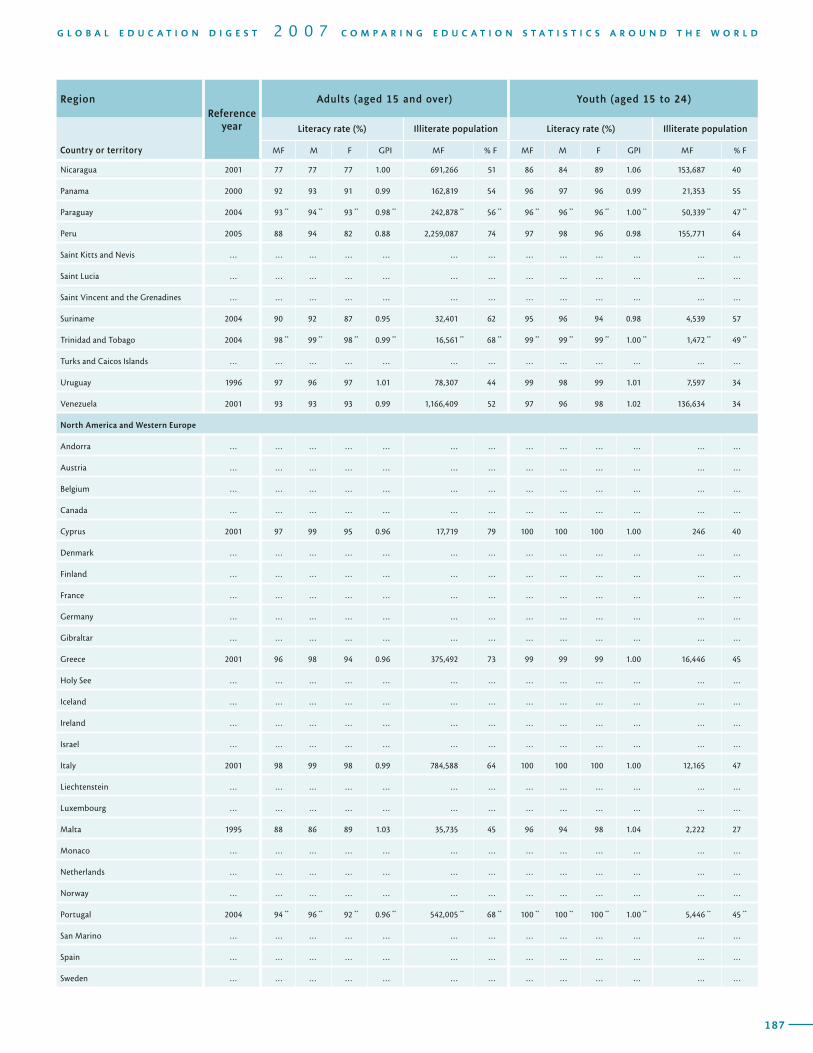
186
RegionReference
year
Adults (aged 15 and over) Youth (aged 15 to 24)
Country or territory
Literacy rate (%) Illiterate population Literacy rate (%) Illiterate population
MF M F GPI MF % F MF M F GPI MF % F
T A B L E 15 ADULT AND YOUTH LITERACY / 1995-2005
187
G L O B A L E D U C A T I O N D I G E S T 2 0 0 7 C O M P A R I N G E D U C A T I O N S T A T I S T I C S A R O U N D T H E W O R L D
RegionReference
year
Adults (aged 15 and over) Youth (aged 15 to 24)
Country or territory
Literacy rate (%) Illiterate population Literacy rate (%) Illiterate population
MF M F GPI MF % F MF M F GPI MF % F
Nicaragua 2001 77 77 77 1.00 691,266 51 86 84 89 1.06 153,687 40
Panama 2000 92 93 91 0.99 162,819 54 96 97 96 0.99 21,353 55
Paraguay 2004 93 ** 94 ** 93 ** 0.98 ** 242,878 ** 56 ** 96 ** 96 ** 96 ** 1.00 ** 50,339 ** 47 **
Peru 2005 88 94 82 0.88 2,259,087 74 97 98 96 0.98 155,771 64
Saint Kitts and Nevis … … … … … … … … … … … … …
Saint Lucia … … … … … … … … … … … … …
Saint Vincent and the Grenadines … … … … … … … … … … … … …
Suriname 2004 90 92 87 0.95 32,401 62 95 96 94 0.98 4,539 57
Trinidad and Tobago 2004 98 ** 99 ** 98 ** 0.99 ** 16,561 ** 68 ** 99 ** 99 ** 99 ** 1.00 ** 1,472 ** 49 **
Turks and Caicos Islands … … … … … … … … … … … … …
Uruguay 1996 97 96 97 1.01 78,307 44 99 98 99 1.01 7,597 34
Venezuela 2001 93 93 93 0.99 1,166,409 52 97 96 98 1.02 136,634 34
North America and Western Europe
Andorra … … … … … … … … … … … … …
Austria … … … … … … … … … … … … …
Belgium … … … … … … … … … … … … …
Canada … … … … … … … … … … … … …
Cyprus 2001 97 99 95 0.96 17,719 79 100 100 100 1.00 246 40
Denmark … … … … … … … … … … … … …
Finland … … … … … … … … … … … … …
France … … … … … … … … … … … … …
Germany … … … … … … … … … … … … …
Gibraltar … … … … … … … … … … … … …
Greece 2001 96 98 94 0.96 375,492 73 99 99 99 1.00 16,446 45
Holy See … … … … … … … … … … … … …
Iceland … … … … … … … … … … … … …
Ireland … … … … … … … … … … … … …
Israel … … … … … … … … … … … … …
Italy 2001 98 99 98 0.99 784,588 64 100 100 100 1.00 12,165 47
Liechtenstein … … … … … … … … … … … … …
Luxembourg … … … … … … … … … … … … …
Malta 1995 88 86 89 1.03 35,735 45 96 94 98 1.04 2,222 27
Monaco … … … … … … … … … … … … …
Netherlands … … … … … … … … … … … … …
Norway … … … … … … … … … … … … …
Portugal 2004 94 ** 96 ** 92 ** 0.96 ** 542,005 ** 68 ** 100 ** 100 ** 100 ** 1.00 ** 5,446 ** 45 **
San Marino … … … … … … … … … … … … …
Spain … … … … … … … … … … … … …
Sweden … … … … … … … … … … … … …
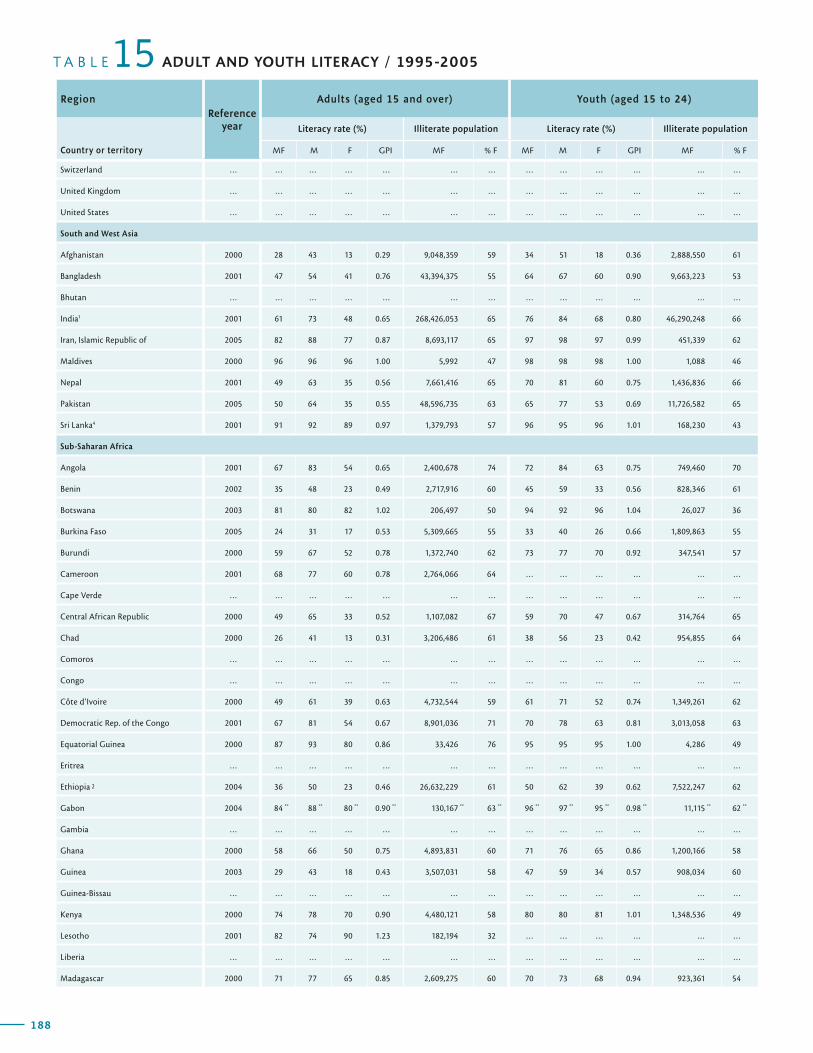
188
RegionReference
year
Adults (aged 15 and over) Youth (aged 15 to 24)
Country or territory
Literacy rate (%) Illiterate population Literacy rate (%) Illiterate population
MF M F GPI MF % F MF M F GPI MF % F
T A B L E 15 ADULT AND YOUTH LITERACY / 1995-2005
189
G L O B A L E D U C A T I O N D I G E S T 2 0 0 7 C O M P A R I N G E D U C A T I O N S T A T I S T I C S A R O U N D T H E W O R L D
RegionReference
year
Adults (aged 15 and over) Youth (aged 15 to 24)
Country or territory
Literacy rate (%) Illiterate population Literacy rate (%) Illiterate population
MF M F GPI MF % F MF M F GPI MF % F
Switzerland … … … … … … … … … … … … …
United Kingdom … … … … … … … … … … … … …
United States … … … … … … … … … … … … …
South and West Asia
Afghanistan 2000 28 43 13 0.29 9,048,359 59 34 51 18 0.36 2,888,550 61
Bangladesh 2001 47 54 41 0.76 43,394,375 55 64 67 60 0.90 9,663,223 53
Bhutan … … … … … … … … … … … … …
India1 2001 61 73 48 0.65 268,426,053 65 76 84 68 0.80 46,290,248 66
Iran, Islamic Republic of 2005 82 88 77 0.87 8,693,117 65 97 98 97 0.99 451,339 62
Maldives 2000 96 96 96 1.00 5,992 47 98 98 98 1.00 1,088 46
Nepal 2001 49 63 35 0.56 7,661,416 65 70 81 60 0.75 1,436,836 66
Pakistan 2005 50 64 35 0.55 48,596,735 63 65 77 53 0.69 11,726,582 65
Sri Lanka4 2001 91 92 89 0.97 1,379,793 57 96 95 96 1.01 168,230 43
Sub-Saharan Africa
Angola 2001 67 83 54 0.65 2,400,678 74 72 84 63 0.75 749,460 70
Benin 2002 35 48 23 0.49 2,717,916 60 45 59 33 0.56 828,346 61
Botswana 2003 81 80 82 1.02 206,497 50 94 92 96 1.04 26,027 36
Burkina Faso 2005 24 31 17 0.53 5,309,665 55 33 40 26 0.66 1,809,863 55
Burundi 2000 59 67 52 0.78 1,372,740 62 73 77 70 0.92 347,541 57
Cameroon 2001 68 77 60 0.78 2,764,066 64 … … … … … …
Cape Verde … … … … … … … … … … … … …
Central African Republic 2000 49 65 33 0.52 1,107,082 67 59 70 47 0.67 314,764 65
Chad 2000 26 41 13 0.31 3,206,486 61 38 56 23 0.42 954,855 64
Comoros … … … … … … … … … … … … …
Congo … … … … … … … … … … … … …
Côte d’Ivoire 2000 49 61 39 0.63 4,732,544 59 61 71 52 0.74 1,349,261 62
Democratic Rep. of the Congo 2001 67 81 54 0.67 8,901,036 71 70 78 63 0.81 3,013,058 63
Equatorial Guinea 2000 87 93 80 0.86 33,426 76 95 95 95 1.00 4,286 49
Eritrea … … … … … … … … … … … … …
Ethiopia 2 2004 36 50 23 0.46 26,632,229 61 50 62 39 0.62 7,522,247 62
Gabon 2004 84 ** 88 ** 80 ** 0.90 ** 130,167 ** 63 ** 96 ** 97 ** 95 ** 0.98 ** 11,115 ** 62 **
Gambia … … … … … … … … … … … … …
Ghana 2000 58 66 50 0.75 4,893,831 60 71 76 65 0.86 1,200,166 58
Guinea 2003 29 43 18 0.43 3,507,031 58 47 59 34 0.57 908,034 60
Guinea-Bissau … … … … … … … … … … … … …
Kenya 2000 74 78 70 0.90 4,480,121 58 80 80 81 1.01 1,348,536 49
Lesotho 2001 82 74 90 1.23 182,194 32 … … … … … …
Liberia … … … … … … … … … … … … …
Madagascar 2000 71 77 65 0.85 2,609,275 60 70 73 68 0.94 923,361 54
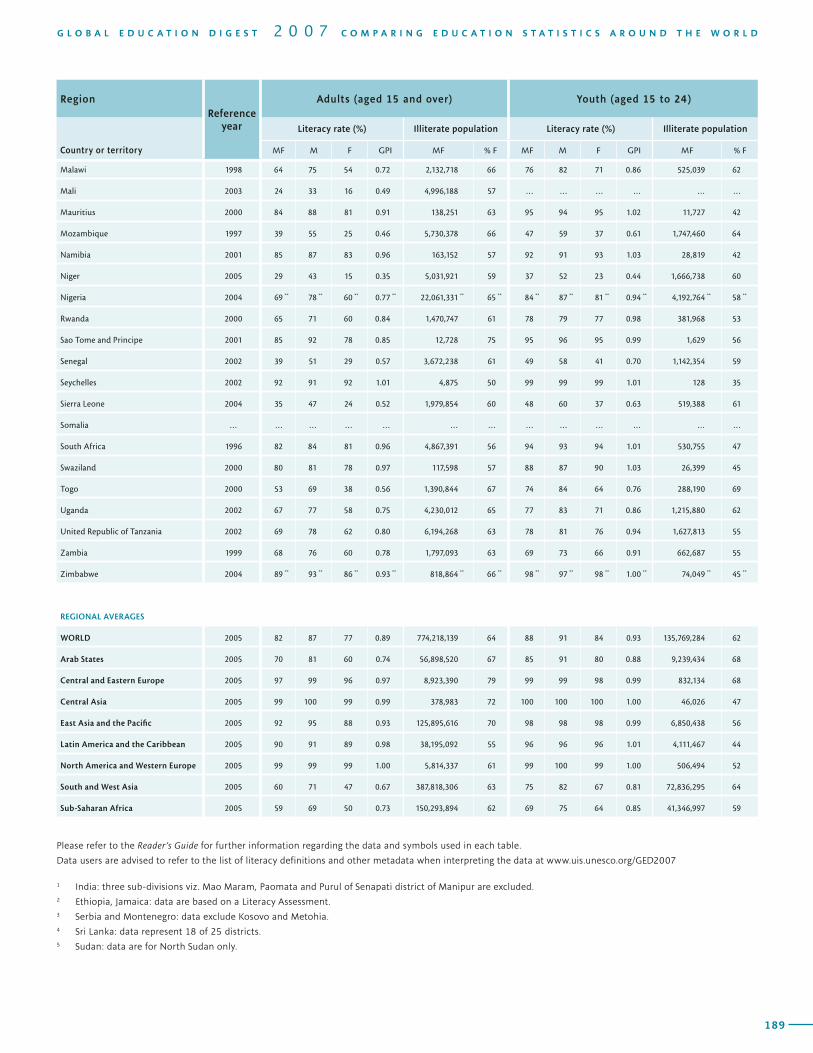
188
RegionReference
year
Adults (aged 15 and over) Youth (aged 15 to 24)
Country or territory
Literacy rate (%) Illiterate population Literacy rate (%) Illiterate population
MF M F GPI MF % F MF M F GPI MF % F
T A B L E 15 ADULT AND YOUTH LITERACY / 1995-2005
189
G L O B A L E D U C A T I O N D I G E S T 2 0 0 7 C O M P A R I N G E D U C A T I O N S T A T I S T I C S A R O U N D T H E W O R L D
RegionReference
year
Adults (aged 15 and over) Youth (aged 15 to 24)
Country or territory
Literacy rate (%) Illiterate population Literacy rate (%) Illiterate population
MF M F GPI MF % F MF M F GPI MF % F
Malawi 1998 64 75 54 0.72 2,132,718 66 76 82 71 0.86 525,039 62
Mali 2003 24 33 16 0.49 4,996,188 57 … … … … … …
Mauritius 2000 84 88 81 0.91 138,251 63 95 94 95 1.02 11,727 42
Mozambique 1997 39 55 25 0.46 5,730,378 66 47 59 37 0.61 1,747,460 64
Namibia 2001 85 87 83 0.96 163,152 57 92 91 93 1.03 28,819 42
Niger 2005 29 43 15 0.35 5,031,921 59 37 52 23 0.44 1,666,738 60
Nigeria 2004 69 ** 78 ** 60 ** 0.77 ** 22,061,331 ** 65 ** 84 ** 87 ** 81 ** 0.94 ** 4,192,764 ** 58 **
Rwanda 2000 65 71 60 0.84 1,470,747 61 78 79 77 0.98 381,968 53
Sao Tome and Principe 2001 85 92 78 0.85 12,728 75 95 96 95 0.99 1,629 56
Senegal 2002 39 51 29 0.57 3,672,238 61 49 58 41 0.70 1,142,354 59
Seychelles 2002 92 91 92 1.01 4,875 50 99 99 99 1.01 128 35
Sierra Leone 2004 35 47 24 0.52 1,979,854 60 48 60 37 0.63 519,388 61
Somalia … … … … … … … … … … … … …
South Africa 1996 82 84 81 0.96 4,867,391 56 94 93 94 1.01 530,755 47
Swaziland 2000 80 81 78 0.97 117,598 57 88 87 90 1.03 26,399 45
Togo 2000 53 69 38 0.56 1,390,844 67 74 84 64 0.76 288,190 69
Uganda 2002 67 77 58 0.75 4,230,012 65 77 83 71 0.86 1,215,880 62
United Republic of Tanzania 2002 69 78 62 0.80 6,194,268 63 78 81 76 0.94 1,627,813 55
Zambia 1999 68 76 60 0.78 1,797,093 63 69 73 66 0.91 662,687 55
Zimbabwe 2004 89 ** 93 ** 86 ** 0.93 ** 818,864 ** 66 ** 98 ** 97 ** 98 ** 1.00 ** 74,049 ** 45 **
REGIONAL AVERAGES
WORLD 2005 82 87 77 0.89 774,218,139 64 88 91 84 0.93 135,769,284 62
Arab States 2005 70 81 60 0.74 56,898,520 67 85 91 80 0.88 9,239,434 68
Central and Eastern Europe 2005 97 99 96 0.97 8,923,390 79 99 99 98 0.99 832,134 68
Central Asia 2005 99 100 99 0.99 378,983 72 100 100 100 1.00 46,026 47
East Asia and the Pacific 2005 92 95 88 0.93 125,895,616 70 98 98 98 0.99 6,850,438 56
Latin America and the Caribbean 2005 90 91 89 0.98 38,195,092 55 96 96 96 1.01 4,111,467 44
North America and Western Europe 2005 99 99 99 1.00 5,814,337 61 99 100 99 1.00 506,494 52
South and West Asia 2005 60 71 47 0.67 387,818,306 63 75 82 67 0.81 72,836,295 64
Sub-Saharan Africa 2005 59 69 50 0.73 150,293,894 62 69 75 64 0.85 41,346,997 59
Please refer to the Reader’s Guide for further information regarding the data and symbols used in each table.
Data users are advised to refer to the list of literacy definitions and other metadata when interpreting the data at www.uis.unesco.org/GED2007
1 India: three sub-divisions viz. Mao Maram, Paomata and Purul of Senapati district of Manipur are excluded.2 Ethiopia, Jamaica: data are based on a Literacy Assessment.3 Serbia and Montenegro: data exclude Kosovo and Metohia.4 Sri Lanka: data represent 18 of 25 districts. 5 Sudan: data are for North Sudan only.

191
A N N E X GlossaryA
191
A N N E X GlossaryA
Capping. Indicators that surpass a theoretical maximum of 100 are adjusted using a capping factor. Net rates in primary education are capped using a factor which takes into account the enrolment of primary school-age children in pre-primary, primary and secondary education by gender. For all other indicators regarding male, female and both sexes simultaneously, the highest value (whether that be for male or female) is set equal to 100. The other two indicators are then re-calculated so that the gender parity index of the new set of values remains the same as for the original values.
Compulsory education. Number of years or the age span during which children and young people are legally obliged to attend school.
Duration. Number of grades (years) in a given level of education.
Early Childhood Care and Education (ECCE). Programmes that, in addition to providing children with care, offer a structured and purposeful set of learning activities either in a formal institution (pre-primary or ISCED 0) or as part of a non-formal child development programme. ECCE programmes are normally designed for children aged three years or above and include organized learning activities that constitute on average the equivalent of at least two hours per day and 100 days a year.
Enrolment. Number of pupils or students officially enrolled in a given grade or level of education, regardless of age. Typically, these data are collected at the beginning of the school year.
Entrance age (theoretical). The age at which pupils or students would enter a given programme or level of education assuming they had started at the official entrance age for the lowest level of education, had studied full-time throughout and had progressed through the system without repeating or skipping a grade. Note that the theoretical entrance age to a given programme or level is often but not always the typical or most common entrance age.
Expenditure on education
Total public expenditure on education. The sum of the expenditure on education and education administration made by local, regional and national/central governments, including municipalities. Household contributions and intergovernmental transfers are excluded.
Current expenditure on education. Expenditure for goods and services consumed within the current year and which would be renewed if needed in the following year. It includes expenditure on: staff salaries, pensions and benefits; contracted or purchased services; other resources including books and teaching materials; welfare services; and other current expenditure, such as subsidies to students and households, furniture and minor equipment, minor repairs, fuel, telecommunications, travel, insurance and rents.
192 193
G L O B A L E D U C A T I O N D I G E S T 2 0 0 7 C O M P A R I N G E D U C A T I O N S T A T I S T I C S A R O U N D T H E W O R L D
Capital expenditure on education. Expenditure for assets that last longer than one year. It includes expenditure for construction, renovation and major repairs of buildings and the purchase of heavy equipment or vehicles.
Fields of education (Broad)
Science and technology fields
Science: life sciences; physical sciences; mathematics and statistics; computer sciences.
Engineering, manufacturing and construction: engineering and engineering trades; manufacturing and processing; architecture and building.
Other fields
Agriculture: agriculture, forestry and fishery; veterinary.
Education: teacher training; education science; educational assessment.
Health and welfare: medicine; medical services; nursing; dental services; social care; social work.
Humanities and arts: religion and theology; foreign languages and cultures; native languages; other humanities such as: interpretation and translation, linguistics, comparative literature, history, archaeology, philosophy, ethics. Fine arts; performing arts; graphic and audio-visual arts; design; craft skills.
Social science, business and law: social and behavioural science; journalism and information; business and administration; law.
Services: personal services; transport services; environmental protection; security services.
Basic programmes, literacy, numeracy and personal development together with programmes whose field is unknown are classified as «not known or unspecified».
Graduate. A person who has successfully completed the final year of a level or sub-level of education. In some countries completion occurs as a result of passing an examination or a series of examinations. In other countries it occurs after a requisite number of course hours have been accumulated. Sometimes both types of completion occur within a country.
Gross Domestic Product (GDP). The sum of gross value added by all resident producers in the economy, including distributive trades and transport, plus any product taxes and minus any subsidies not included in the value of the products.
Gross National Income (GNI). The sum of gross value added by all resident producers in the economy, including distributive trades and transport, plus any product taxes, minus any subsidies not included in the value of the products plus net receipts of income from abroad. Since net receipts from abroad may be positive or negative, it is possible for GNI to be greater or smaller than GDP. GNI is also referred to as Gross National Product (GNP).
G L O S S A R Y
192 193
G L O B A L E D U C A T I O N D I G E S T 2 0 0 7 C O M P A R I N G E D U C A T I O N S T A T I S T I C S A R O U N D T H E W O R L D
International Standard Classification of Education (ISCED). A classification system that provides a framework for the comprehensive statistical description of national educational systems and a methodology that translates national educational programmes into internationally comparable levels of education. The basic unit of classification in ISCED is the educational programme. ISCED also classifies programmes by field of study, programme orientation and destination.
International (or internationally mobile) students. Students who have crossed a national or territorial border for the purposes of education and are now enrolled outside their country of origin.
Literacy. The ability to read and write, with understanding, a simple statement related to one’s daily life. It involves a continuum of reading and writing skills, and often includes basic arithmetic skills (numeracy).
New entrants. Pupils or students entering a programme at a given level of education for the first time.
Net flow. Number of students from abroad (inbound students) studying in a given country minus the number of students from given country studying abroad (outbound students).
Orientation of educational programmes
General education. This type of programme is designed mainly to lead pupils to a deeper understanding of a subject or group of subjects, especially, but not necessarily, with a view to preparing pupils for further education at the same or a higher level. These programmes are typically school-based and may or may not contain vocational elements. Successful completion of these programmes may or may not lead to an academic qualification. However, they do not typically allow successful completers to enter a particular occupation or trade or class of occupations or trades without further training. General education has a technical or vocational content of less than 25%, but pre-technical/pre-vocational programmes (i.e. programmes with a technical/vocational content of more than 25% that do not lead to a labour-market relevant vocational or technical qualification) are typically reported with general programmes.
Pre-vocational or pre-technical education. Education which is mainly designed to introduce participants to the world of work and to prepare them for entry into vocational or technical education programmes. Successful completion of such programmes does not yet lead to a labour-market relevant vocational or technical qualification. For a programme to be considered as pre-vocational or pre-technical education, at least 25% of its content has to be vocational or technical.
Technical and vocational education. This type of programme is designed mainly to lead pupils to acquire the practical skills, know-how and understanding necessary for employment in a particular occupation or trade (or class of occupations or trades). Successful completion of such programmes normally leads to a labour-market relevant vocational qualification recognised by the competent authorities (e.g. Ministry of Education, employers’ associations, etc.) in the country in which it is obtained.
194 195
G L O B A L E D U C A T I O N D I G E S T 2 0 0 7 C O M P A R I N G E D U C A T I O N S T A T I S T I C S A R O U N D T H E W O R L D
Purchasing Power Parity (PPP). Purchasing power parities (PPPs) are the currency exchange rates that equalise the purchasing power of different currencies. This means that a given sum of money, when converted into US dollars at the PPP rate (PPP dollars), will buy the same basket of goods and services in all countries. In other words, PPPs are the rates of currency conversion which eliminate the differences in price levels among countries. Thus, comparisons between countries reflect only differences in the volume of goods and services purchased.
Repeaters. Pupils enrolled in the same grade for a second or further year.
School-age population. Population of the age group which corresponds to the relevant level of education as indicated by theoretical entrance age and duration.
School life expectancy. The number of years a person of school entrance age can expect to spend within the specified levels.
Students
Student/pupil. A person enrolled in an educational programme.
Full-time students. Students engaged in an educational programme for a number of hours of study statutorily regarded as full-time at the particular level of education in the given country.
Part-time students. Students whose statutory study hours are less than those required of full-time students in the given level and country.
Full-time equivalent number of students. These are generally calculated in person-years. The unit for the measurement of full-time equivalence is a full-time student. Thus, a full-time student equals one full-time equivalent. The full-time equivalence of part-time students is determined by calculating the ratio of their hours studied to the statutory hours studied by a full-time student during the school year. For example, a student who studied one-third of the statutory hours of a full-time student equals one-third of a full-time equivalent student.
Teachers
Teaching staff. Persons employed full-time or part-time in an official capacity for the purpose of guiding and directing the learning experience of pupils and students, irrespective of his/her qualification or the delivery mechanism, i.e. whether face-to-face and/or at a distance. This definition excludes educational personnel who have no active teaching duties (e.g. headmasters, headmistresses or principals who do not teach) or who work occasionally or in a voluntary capacity in educational institutions (e.g. parents).
Trained teachers. Teachers who have received the minimum organized teacher-training (pre-service or in-service) required for teaching at the relevant level in the given country.
Full-time teachers. Persons engaged in teaching for a number of hours of work statutorily regarded as full-time at the particular level of education in the given country.
G L O S S A R Y
194 195
G L O B A L E D U C A T I O N D I G E S T 2 0 0 7 C O M P A R I N G E D U C A T I O N S T A T I S T I C S A R O U N D T H E W O R L D
Part-time teachers. Teachers whose statutory working hours are less than those required of full-time teachers in the given country.
Full-time equivalent number of teachers. The equivalent is calculated in person-years. The unit for the measurement of full-time equivalence is a full-time teacher. Thus, a full-time teacher equals one full-time equivalent. The full-time equivalence of part-time teachers is determined by calculating the ratio of their hours worked to the statutory hours worked by a full-time teacher during the school year. For example, a teacher who works one-third of the statutory hours of a full-time teacher equals one-third of a full-time equivalent teacher.
196
A N N E X
197
G L O B A L E D U C A T I O N D I G E S T 2 0 0 7 C O M P A R I N G E D U C A T I O N S T A T I S T I C S A R O U N D T H E W O R L D
Definitions of indicators
Education finance
Educational expenditure by nature of spending as a % of total educational expenditure on public institutions, by level. The spending by nature (salaries, other current, total current or capital) expressed as a percentage of the expenditure for public educational institutions of the specified level. Salaries and other current add up to the total current expenditure. Public subsidies to the public sector and administrative costs should be excluded.
Public expenditure per student by level as a % of GDP per capita. Total public expenditure per student in the specified level as a percentage of GDP per capita.
Public expenditure per student by level (PPP US$). Total public expenditure per student in the specified level expressed in US dollars adjusted by purchasing power parity terms.
Expenditure on educational institutions and educational administration as a % of GDP, by source. The expenditure coming from public, private and international sources spent on a given level of education expressed as a percentage of GDP.
Total public expenditure on education as a % of GDP. Current and capital expenditures on education by local, regional and national governments expressed as a percentage of GDP.
Total public expenditure on education as a % of total government expenditure. Current and capital expenditures on education by local, regional and national governments expressed as a percentage of total government expenditure on all sectors (including health, education, social services, etc.).
Expected gross intake ratio to the last grade of primary. The number of children in a given year, regardless of age, who are expected to reach the last grade of primary education expressed as a percentage of the population at the theoretical entrance age to primary education in the same year. It is calculated by multiplying the apparent intake ratio to primary education by the probability of survival to the last grade. It estimates the future gross intake to the last grade of primary education based on current new entrants to the first grade of primary education assuming current grade transition and repetition rates remain unchanged. It therefore predicts the effect on last grade intake of current education policies on entrance to primary education and future years of schooling.
B
196
A N N E X
197
G L O B A L E D U C A T I O N D I G E S T 2 0 0 7 C O M P A R I N G E D U C A T I O N S T A T I S T I C S A R O U N D T H E W O R L D
Expected gross primary graduation ratio. The number of children in a given year, regardless of age, who are expected to graduate from primary education expressed as a percentage of the population of theoretical entrance age to primary education in the same year. It is calculated by multiplying the expected gross intake ratio to the last grade of primary by the probability that pupils reaching the last grade also graduate from it. It estimates future gross primary graduation ratios based on current new entrants to the first grade of primary education assuming current grade transition, repetition and graduation rates remain unchanged. It therefore predicts the effect on primary outputs of current education policies on entrance to primary education and future years of schooling.
Gender Parity Index (GPI). Ratio of the female-to-male values of a given indicator. A GPI of 1 indicates parity between sexes.
Gross Intake Ratio (GIR). Total number of new entrants in the first grade of primary education, regardless of age, expressed as a percentage of the population of theoretical entrance age to primary education.
Gross intake ratio to the last grade of primary. Total number of new entrants in the last grade of primary education, regardless of age, expressed as a percentage of the population of the theoretical entrance age to the last grade. It reports the current final grade intake at primary level stemming from previous years of schooling and past education policies on entrance to primary education.
Gross primary graduation ratio. Total number of graduates from the last grade of primary education, regardless of age, expressed as a percentage of the population at the theoretical graduation age. It reports the current primary outputs stemming from previous years of schooling and past education policies on entrance to primary education.
Gross entry ratio to tertiary education. Total number of new entrants to a given group of programmes (ISCED 5A or 5B), regardless of age, expressed as a percentage of the population of theoretical entrance age to those programmes.
Gross Enrolment Ratio (GER). Number of pupils enrolled in a given level of education, regardless of age, expressed as a percentage of the population in the theoretical age group for the same level of education. For the tertiary level, the population used is the five-year age group following on from the secondary school leaving age.
Gross graduation ratio. Number of graduates regardless of age in a given level or programme expressed as a percentage of the population at the theoretical graduation age for that level or programme.
Literacy rate. The number of literate persons in a given age group, expressed as a percentage of the total population in that age group. The adult literacy rate measures literacy in persons aged 15 years and above and the youth literacy rate in persons aged between 15 and 24 years.
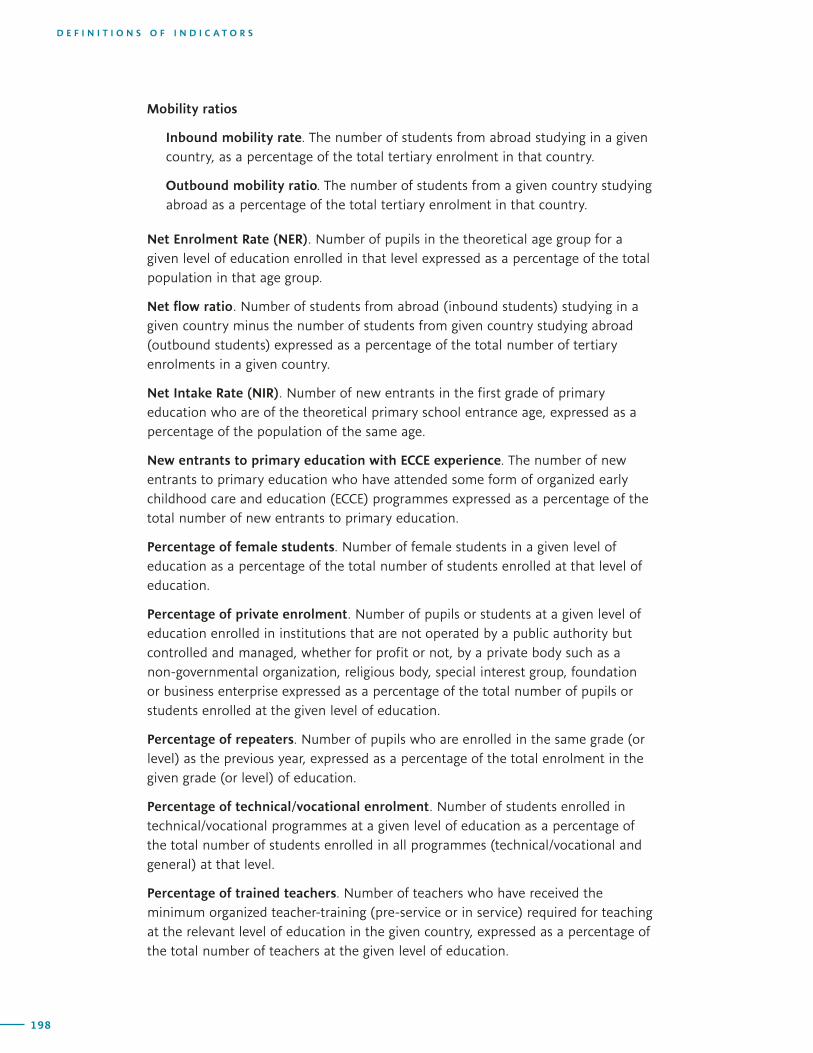
198 199
G L O B A L E D U C A T I O N D I G E S T 2 0 0 7 C O M P A R I N G E D U C A T I O N S T A T I S T I C S A R O U N D T H E W O R L D
Mobility ratios
Inbound mobility rate. The number of students from abroad studying in a given country, as a percentage of the total tertiary enrolment in that country.
Outbound mobility ratio. The number of students from a given country studying abroad as a percentage of the total tertiary enrolment in that country.
Net Enrolment Rate (NER). Number of pupils in the theoretical age group for a given level of education enrolled in that level expressed as a percentage of the total population in that age group.
Net flow ratio. Number of students from abroad (inbound students) studying in a given country minus the number of students from given country studying abroad (outbound students) expressed as a percentage of the total number of tertiary enrolments in a given country.
Net Intake Rate (NIR). Number of new entrants in the first grade of primary education who are of the theoretical primary school entrance age, expressed as a percentage of the population of the same age.
New entrants to primary education with ECCE experience. The number of new entrants to primary education who have attended some form of organized early childhood care and education (ECCE) programmes expressed as a percentage of the total number of new entrants to primary education.
Percentage of female students. Number of female students in a given level of education as a percentage of the total number of students enrolled at that level of education.
Percentage of private enrolment. Number of pupils or students at a given level of education enrolled in institutions that are not operated by a public authority but controlled and managed, whether for profit or not, by a private body such as a non-governmental organization, religious body, special interest group, foundation or business enterprise expressed as a percentage of the total number of pupils or students enrolled at the given level of education.
Percentage of repeaters. Number of pupils who are enrolled in the same grade (or level) as the previous year, expressed as a percentage of the total enrolment in the given grade (or level) of education.
Percentage of technical/vocational enrolment. Number of students enrolled in technical/vocational programmes at a given level of education as a percentage of the total number of students enrolled in all programmes (technical/vocational and general) at that level.
Percentage of trained teachers. Number of teachers who have received the minimum organized teacher-training (pre-service or in service) required for teaching at the relevant level of education in the given country, expressed as a percentage of the total number of teachers at the given level of education.
D E F I N I T I O N S O F I N D I C A T O R S
198 199
G L O B A L E D U C A T I O N D I G E S T 2 0 0 7 C O M P A R I N G E D U C A T I O N S T A T I S T I C S A R O U N D T H E W O R L D
Pupil/teacher ratio. Average number of pupils per teacher at the level of education specified in a given school year, based on headcounts for both pupils and teachers.
Regional average. The regional averages are calculated on the basis of the published data and using the best possible non-publishable estimates where no data exist. Countries are weighted with the appropriate national school-age populations.
School life expectancy, approximation method. The sum of the age-specific enrolment rates for the levels specified. To compensate for the lack of reliable data by age for tertiary the gross enrolment ratio for tertiary is multiplied by 5 and used as a proxy for the age-specific enrolment rates. At all other ISCED levels enrolment that is not distributed by age is divided by the school-age population and multiplied by the duration of the given level before being added to the sum of the age-specific enrolment rates.
Survival rates. Survival rates are calculated on the basis of the reconstructed cohort method, which uses data on enrolment and repeaters for two consecutive years. It is to be interpreted as the percentage of children who start primary education who will reach a given grade.
Transition rate from primary to secondary general education. Number of new entrants to the first grade of secondary education (general programmes only) in a given year, expressed as a percentage of the number of pupils enrolled in the final grade of primary education in the previous year.
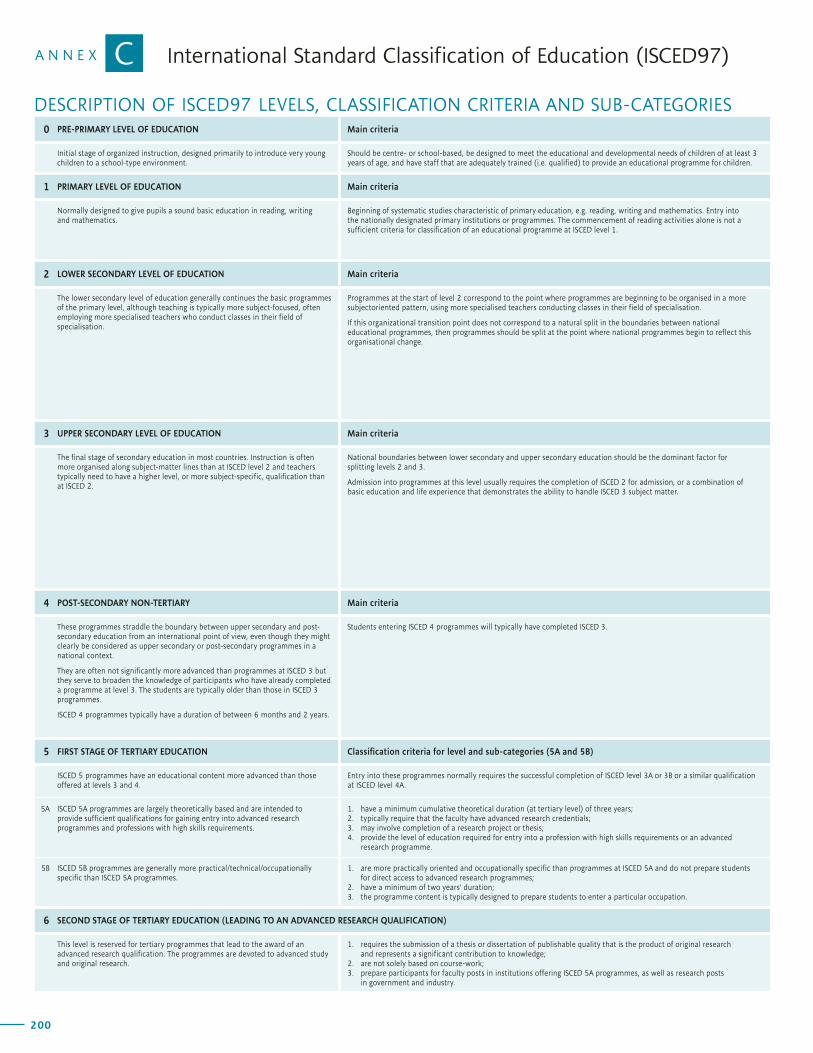
200 201
G L O B A L E D U C A T I O N D I G E S T 2 0 0 7 C O M P A R I N G E D U C A T I O N S T A T I S T I C S A R O U N D T H E W O R L D
International Standard Classification of Education (ISCED97)
0 PRE-PRIMARY LEVEL OF EDUCATION Main criteria
Initial stage of organized instruction, designed primarily to introduce very young children to a school-type environment.
Should be centre- or school-based, be designed to meet the educational and developmental needs of children of at least 3 years of age, and have staff that are adequately trained (i.e. qualified) to provide an educational programme for children.
1 PRIMARY LEVEL OF EDUCATION Main criteria
Normally designed to give pupils a sound basic education in reading, writing and mathematics.
Beginning of systematic studies characteristic of primary education, e.g. reading, writing and mathematics. Entry into the nationally designated primary institutions or programmes. The commencement of reading activities alone is not a sufficient criteria for classification of an educational programme at ISCED level 1.
2 LOWER SECONDARY LEVEL OF EDUCATION Main criteria
The lower secondary level of education generally continues the basic programmes of the primary level, although teaching is typically more subject-focused, often employing more specialised teachers who conduct classes in their field of specialisation.
Programmes at the start of level 2 correspond to the point where programmes are beginning to be organised in a more subjectoriented pattern, using more specialised teachers conducting classes in their field of specialisation.
If this organizational transition point does not correspond to a natural split in the boundaries between national educational programmes, then programmes should be split at the point where national programmes begin to reflect this organisational change.
3 UPPER SECONDARY LEVEL OF EDUCATION Main criteria
The final stage of secondary education in most countries. Instruction is often more organised along subject-matter lines than at ISCED level 2 and teachers typically need to have a higher level, or more subject-specific, qualification than at ISCED 2.
National boundaries between lower secondary and upper secondary education should be the dominant factor for splitting levels 2 and 3.
Admission into programmes at this level usually requires the completion of ISCED 2 for admission, or a combination of basic education and life experience that demonstrates the ability to handle ISCED 3 subject matter.
4 POST-SECONDARY NON-TERTIARY Main criteria
These programmes straddle the boundary between upper secondary and post-secondary education from an international point of view, even though they might clearly be considered as upper secondary or post-secondary programmes in a national context.
They are often not significantly more advanced than programmes at ISCED 3 but they serve to broaden the knowledge of participants who have already completed a programme at level 3. The students are typically older than those in ISCED 3 programmes.
ISCED 4 programmes typically have a duration of between 6 months and 2 years.
Students entering ISCED 4 programmes will typically have completed ISCED 3.
5 FIRST STAGE OF TERTIARY EDUCATION Classification criteria for level and sub-categories (5A and 5B)
ISCED 5 programmes have an educational content more advanced than those offered at levels 3 and 4.
Entry into these programmes normally requires the successful completion of ISCED level 3A or 3B or a similar qualification at ISCED level 4A.
5A ISCED 5A programmes are largely theoretically based and are intended to provide sufficient qualifications for gaining entry into advanced research programmes and professions with high skills requirements.
1. have a minimum cumulative theoretical duration (at tertiary level) of three years;2. typically require that the faculty have advanced research credentials;3. may involve completion of a research project or thesis;4. provide the level of education required for entry into a profession with high skills requirements or an advanced
research programme.
5B ISCED 5B programmes are generally more practical/technical/occupationally specific than ISCED 5A programmes.
1. are more practically oriented and occupationally specific than programmes at ISCED 5A and do not prepare students for direct access to advanced research programmes;
2. have a minimum of two years’ duration;3. the programme content is typically designed to prepare students to enter a particular occupation.
6 SECOND STAGE OF TERTIARY EDUCATION (LEADING TO AN ADVANCED RESEARCH QUALIFICATION)
This level is reserved for tertiary programmes that lead to the award of an advanced research qualification. The programmes are devoted to advanced study and original research.
1. requires the submission of a thesis or dissertation of publishable quality that is the product of original research and represents a significant contribution to knowledge;
2. are not solely based on course-work;3. prepare participants for faculty posts in institutions offering ISCED 5A programmes, as well as research posts
in government and industry.
DESCRIPTION OF ISCED97 LEVELS, CLASSIFICATION CRITERIA AND SUB-CATEGORIES
CA N N E X
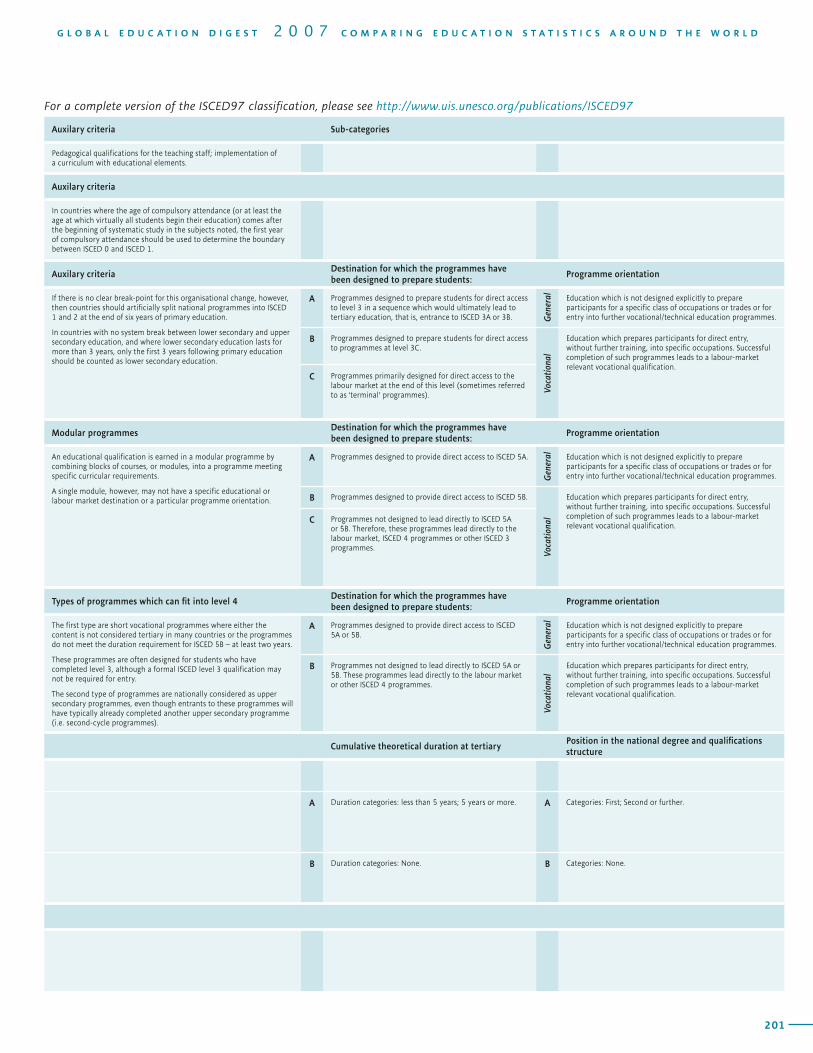
200 201
G L O B A L E D U C A T I O N D I G E S T 2 0 0 7 C O M P A R I N G E D U C A T I O N S T A T I S T I C S A R O U N D T H E W O R L D
Auxilary criteria Sub-categories
Pedagogical qualifications for the teaching staff; implementation of a curriculum with educational elements.
Auxilary criteria
In countries where the age of compulsory attendance (or at least the age at which virtually all students begin their education) comes after the beginning of systematic study in the subjects noted, the first year of compulsory attendance should be used to determine the boundary between ISCED 0 and ISCED 1.
Auxilary criteriaDestination for which the programmes have been designed to prepare students:
Programme orientation
If there is no clear break-point for this organisational change, however, then countries should artificially split national programmes into ISCED 1 and 2 at the end of six years of primary education.
In countries with no system break between lower secondary and upper secondary education, and where lower secondary education lasts for more than 3 years, only the first 3 years following primary education should be counted as lower secondary education.
A Programmes designed to prepare students for direct access to level 3 in a sequence which would ultimately lead to tertiary education, that is, entrance to ISCED 3A or 3B. G
ener
al Education which is not designed explicitly to prepare participants for a specific class of occupations or trades or for entry into further vocational/technical education programmes.
B Programmes designed to prepare students for direct access to programmes at level 3C.
Voca
tiona
l
Education which prepares participants for direct entry, without further training, into specific occupations. Successful completion of such programmes leads to a labour-market relevant vocational qualification.
C Programmes primarily designed for direct access to the labour market at the end of this level (sometimes referred to as ‘terminal’ programmes).
Modular programmesDestination for which the programmes have been designed to prepare students:
Programme orientation
An educational qualification is earned in a modular programme by combining blocks of courses, or modules, into a programme meeting specific curricular requirements.
A single module, however, may not have a specific educational or labour market destination or a particular programme orientation.
A Programmes designed to provide direct access to ISCED 5A.
Gen
eral Education which is not designed explicitly to prepare
participants for a specific class of occupations or trades or for entry into further vocational/technical education programmes.
B Programmes designed to provide direct access to ISCED 5B.
Voca
tiona
l
Education which prepares participants for direct entry, without further training, into specific occupations. Successful completion of such programmes leads to a labour-market relevant vocational qualification.
C Programmes not designed to lead directly to ISCED 5A or 5B. Therefore, these programmes lead directly to the labour market, ISCED 4 programmes or other ISCED 3 programmes.
Types of programmes which can fit into level 4Destination for which the programmes have been designed to prepare students:
Programme orientation
The first type are short vocational programmes where either the content is not considered tertiary in many countries or the programmes do not meet the duration requirement for ISCED 5B – at least two years.
These programmes are often designed for students who have completed level 3, although a formal ISCED level 3 qualification may not be required for entry.
The second type of programmes are nationally considered as upper secondary programmes, even though entrants to these programmes will have typically already completed another upper secondary programme (i.e. second-cycle programmes).
A Programmes designed to provide direct access to ISCED 5A or 5B.
Gen
eral Education which is not designed explicitly to prepare
participants for a specific class of occupations or trades or for entry into further vocational/technical education programmes.
B Programmes not designed to lead directly to ISCED 5A or 5B. These programmes lead directly to the labour market or other ISCED 4 programmes.
Voca
tiona
l
Education which prepares participants for direct entry, without further training, into specific occupations. Successful completion of such programmes leads to a labour-market relevant vocational qualification.
Cumulative theoretical duration at tertiaryPosition in the national degree and qualifications structure
A Duration categories: less than 5 years; 5 years or more. A Categories: First; Second or further.
B Duration categories: None. B Categories: None.
For a complete version of the ISCED97 classification, please see http://www.uis.unesco.org/publications/ISCED97
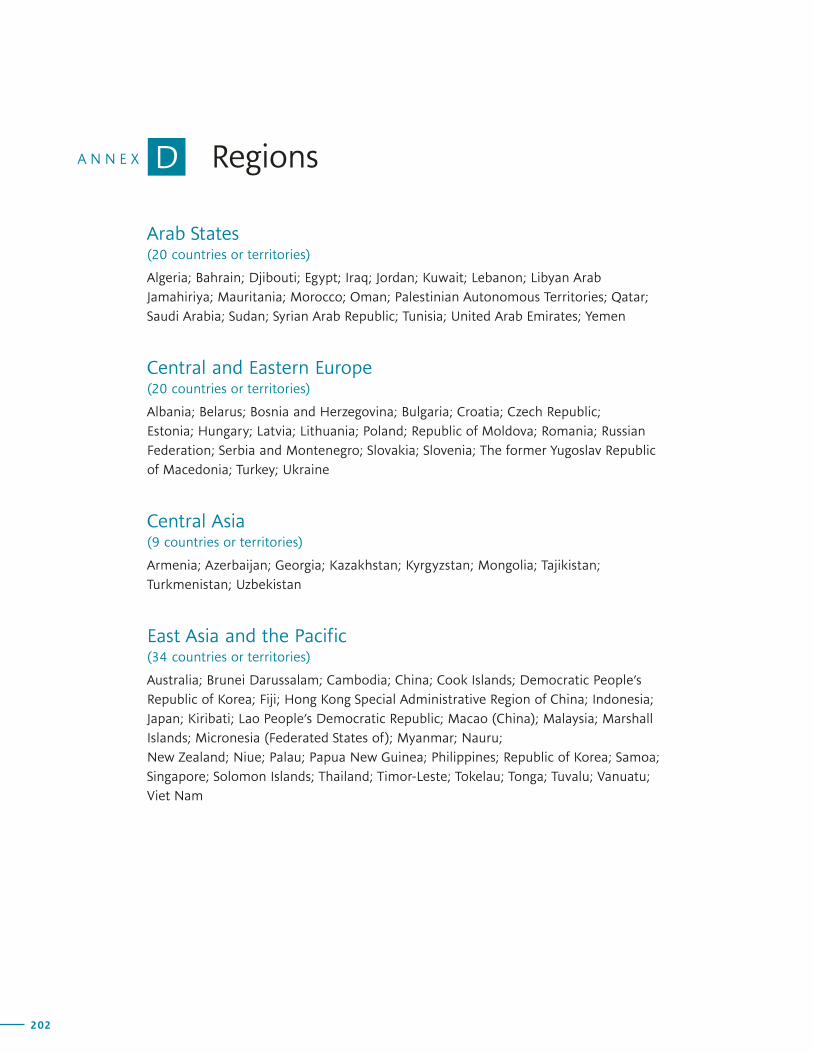
202
A N N E X
203
G L O B A L E D U C A T I O N D I G E S T 2 0 0 7 C O M P A R I N G E D U C A T I O N S T A T I S T I C S A R O U N D T H E W O R L D
Regions
Arab States (20 countries or territories)
Algeria; Bahrain; Djibouti; Egypt; Iraq; Jordan; Kuwait; Lebanon; Libyan Arab Jamahiriya; Mauritania; Morocco; Oman; Palestinian Autonomous Territories; Qatar; Saudi Arabia; Sudan; Syrian Arab Republic; Tunisia; United Arab Emirates; Yemen
Central and Eastern Europe (20 countries or territories)
Albania; Belarus; Bosnia and Herzegovina; Bulgaria; Croatia; Czech Republic; Estonia; Hungary; Latvia; Lithuania; Poland; Republic of Moldova; Romania; Russian Federation; Serbia and Montenegro; Slovakia; Slovenia; The former Yugoslav Republic of Macedonia; Turkey; Ukraine
Central Asia (9 countries or territories)
Armenia; Azerbaijan; Georgia; Kazakhstan; Kyrgyzstan; Mongolia; Tajikistan; Turkmenistan; Uzbekistan
East Asia and the Pacific (34 countries or territories)
Australia; Brunei Darussalam; Cambodia; China; Cook Islands; Democratic People’s Republic of Korea; Fiji; Hong Kong Special Administrative Region of China; Indonesia; Japan; Kiribati; Lao People’s Democratic Republic; Macao (China); Malaysia; Marshall Islands; Micronesia (Federated States of); Myanmar; Nauru; New Zealand; Niue; Palau; Papua New Guinea; Philippines; Republic of Korea; Samoa; Singapore; Solomon Islands; Thailand; Timor-Leste; Tokelau; Tonga; Tuvalu; Vanuatu; Viet Nam
D
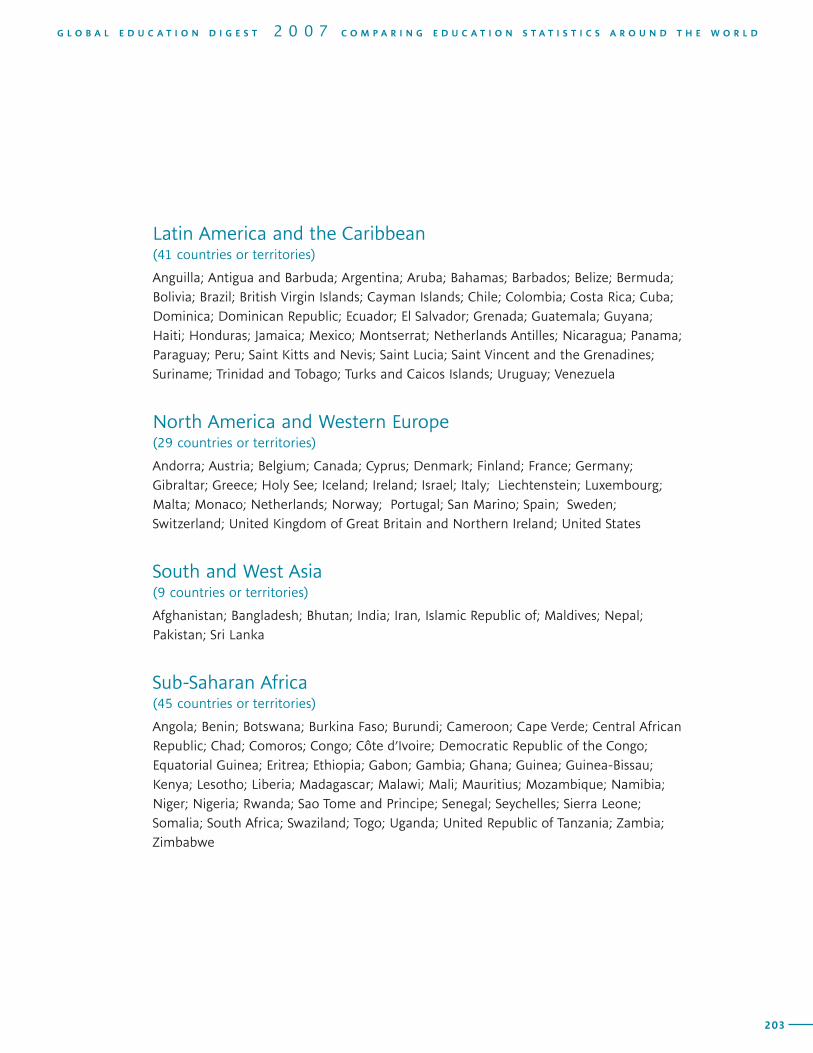
202
A N N E X
203
G L O B A L E D U C A T I O N D I G E S T 2 0 0 7 C O M P A R I N G E D U C A T I O N S T A T I S T I C S A R O U N D T H E W O R L D
Latin America and the Caribbean (41 countries or territories)
Anguilla; Antigua and Barbuda; Argentina; Aruba; Bahamas; Barbados; Belize; Bermuda; Bolivia; Brazil; British Virgin Islands; Cayman Islands; Chile; Colombia; Costa Rica; Cuba; Dominica; Dominican Republic; Ecuador; El Salvador; Grenada; Guatemala; Guyana; Haiti; Honduras; Jamaica; Mexico; Montserrat; Netherlands Antilles; Nicaragua; Panama; Paraguay; Peru; Saint Kitts and Nevis; Saint Lucia; Saint Vincent and the Grenadines; Suriname; Trinidad and Tobago; Turks and Caicos Islands; Uruguay; Venezuela
North America and Western Europe (29 countries or territories)
Andorra; Austria; Belgium; Canada; Cyprus; Denmark; Finland; France; Germany; Gibraltar; Greece; Holy See; Iceland; Ireland; Israel; Italy; Liechtenstein; Luxembourg; Malta; Monaco; Netherlands; Norway; Portugal; San Marino; Spain; Sweden; Switzerland; United Kingdom of Great Britain and Northern Ireland; United States
South and West Asia (9 countries or territories)
Afghanistan; Bangladesh; Bhutan; India; Iran, Islamic Republic of; Maldives; Nepal; Pakistan; Sri Lanka
Sub-Saharan Africa (45 countries or territories)
Angola; Benin; Botswana; Burkina Faso; Burundi; Cameroon; Cape Verde; Central African Republic; Chad; Comoros; Congo; Côte d’Ivoire; Democratic Republic of the Congo; Equatorial Guinea; Eritrea; Ethiopia; Gabon; Gambia; Ghana; Guinea; Guinea-Bissau; Kenya; Lesotho; Liberia; Madagascar; Malawi; Mali; Mauritius; Mozambique; Namibia; Niger; Nigeria; Rwanda; Sao Tome and Principe; Senegal; Seychelles; Sierra Leone; Somalia; South Africa; Swaziland; Togo; Uganda; United Republic of Tanzania; Zambia; Zimbabwe

205
205
On-line resources
WebsiteThe printed version of the Global Education Digest provides a subset of internationally comparable education data which are available from UNESCO resources. Additional resources can be accessed from the UIS website (http://www.uis.unesco.org/publications/GED2007), including an interactive database, historical time series, additional raw data and indicators and documentation, which are regularly updated.
Time seriesIndicators and raw data are provided for 1999 onwards. In addition, a selection of indicators is available according the previous ISCED classification for years between 1970 and 1997.
Additional data and indicatorsThe online version of the database contains much more data and indicators than are published in the printed version of the Global Education Digest. It covers all levels of education from pre-primary to tertiary and topics such as access, participation, progression, completion, teachers and finance, including:
• Enrolment by grade and level of education;• Repeaters by grade; and• Tertiary enrolment by fields of study, etc.
Data updatesThe full set of UIS indicators is released annually in late April. An update is made approximately six months later, providing more recent data for some countries and final revisions to others, in particular for EU and OECD countries.
DocumentationAll UIS publications are posted on the UIS website and are available in Arabic, Chinese, English, French, Russian and/or Spanish.
Alert serviceYou may subscribe to the UIS alert service in order to receive e-mail notifications of new products and reports.
CD-RomMost electronic resources and a detailed set of raw data and indicators are available on the Global Education Digest CD-Rom. To order a copy, please send your request to: [email protected].
EA N N E X
206 207
G L O B A L E D U C A T I O N D I G E S T 2 0 0 7 C O M P A R I N G E D U C A T I O N S T A T I S T I C S A R O U N D T H E W O R L D
UIS publications
Global data reports
Global Education Digest 2006 (Arabic, English, French, Russian, Spanish)
Global Education Digest 2005 (Arabic, English, French, Russian, Spanish)
Global Education Digest 2004 (Arabic, Chinese, English, French, Russian, Spanish)
Global Education Digest 2003 (Arabic, Chinese, English, French, Russian, Spanish)
Regional education data reports
Regional Report on South and East Asia, 2003 (English, French)
Regional Report on Arab States, 2002 (Arabic, English, French)
Regional Report on Sub-Saharan Africa, 2001 (English)
Regional Report on Latin America and the Caribbean, 2001 (English, French, Spanish)
Good Neighbours: Caribbean Students at the Tertiary Level of Education, 2001 (English, French)
Thematic reports
Education Counts: Benchmarking Progress in 19 WEI Countries, 2007 (English)
Education Counts: Benchmarking Progress in 19 WEI Countries, 2006 (English)
Teachers and Educational Quality: Monitoring Global Needs for 2015, 2006 (English)
Children Out of School: Measuring Exclusion from Primary Education, with UNICEF, 2005 (English, French)
International Flows of Selected Cultural Goods and Services - 1994-2003, 2005 (English, French)
Education Trends in Perspective – Analysis of the World Education Indicators, 2005 Edition, with OECD (English)
Literacy Skills for the World of Tomorrow – Further Results from PISA 2000, with OECD (English) and Executive Summary, 2003 (English, French, Spanish)
Financing Education – Investments and Returns, with OECD (English) and Executive Summary, 2002 (Arabic, Chinese, English, French, Russian, Spanish)
Teachers for Tomorrow’s Schools, with OECD (English) and Executive Summary, 2001 (Arabic, English, French, Russian, Spanish) Out of print. Available on-line in PDF format only
UIS working paper series
Education Equity and Public Policy: Comparing Results from 16 Countries (English), Working Paper No. 6, 2006
FA N N E X
206 207
G L O B A L E D U C A T I O N D I G E S T 2 0 0 7 C O M P A R I N G E D U C A T I O N S T A T I S T I C S A R O U N D T H E W O R L D
Learning Divides - Ten Policy Questions About the Performance and Equity of Schools and Schooling Systems (English), Working Paper No. 5, 2006
Where is the “Education” in Conditional Cash Transfers in Education? (English), Working Paper No. 4, 2006
Money Counts: Projecting Education Expenditures in Latin America and the Caribbean to the Year 2015 (English). Working Paper No. 3, 2005
Using International Surveys of Achievement and Literacy: A View from the Outside (English) Working Paper No. 2, 2004
Investing in the Future: Financing the Expansion of Educational Opportunity in Latin America and the Caribbean (English, Spanish). Working Paper No. 1, 2004
Technical documents
Guide to the Analysis and Use of Household Survey and Census Education Data, 2004 (English)
CD-ROMs
Interactive database of education indicators based on the Global Education Digest, 2007, 2006, 2005, 2004, 2003
All publications can be downloaded in PDF format from our website: www.uis.unesco.org
To order a print version in the language of your choice or CD-Rom, please contact us at:
UNESCO Institute for Statistics5255, avenue Decelles, 7th FloorMontreal, Quebec H3T 2B1Canada
Tel: (1 514) 343-6880Fax: (1 514) 343-5740Email: [email protected]