Embed Size (px)
Citation preview
Global Value Chain Reshoring: Overview and Impact on Trade
Jong Woo KangPrincipal Economist for Regional Cooperation and IntegrationEconomic Research and Regional Cooperation Department
Asian Development Bank
RCI-Policy Open Dialogue Webinar #22| 14 July 2021
Drivers of Supply Chain Reshoring
• Trade conflict between the United States (US) and the People’s Republic of China
(PRC) have encouraged policy makers, especially in the US, to consider reshoring
policies.
• Recent events such as the lockdowns due to the COVID-19 pandemic may cause
companies to consider reshoring their supply chains as well, although we have yet
to see the data in 2020.
2
Motivations of Reshoring
• Even before the pandemic, policy makers and businesses alike had revisited the rationale behind the
off-shoring strategy, driven mainly by cost and operational efficiency.
• (Middle-income countries) Technological progress has enabled many middle-income economies to
move up the technological ladder, and consequently to produce key intermediate goods themselves
instead of relying on foreign imports.
• (Advanced countries) The development of robotics and artificial intelligence also motivates advanced
economies to bring their production facilities closer to customers, tailoring their products to consumer
preferences.
• Concerns about the quality of products and services outsourced had also been on businesses’ minds. In
this sense, COVID-19 and the trade war have accentuated motivation for reshoring rather than
triggering it.
• After all, the reshoring trend will likely persist, although its exact form and size is difficult to predict from
the reflections on vulnerabilities of global supply chains, just-in-time inventory management systems,
and vast spillover effects of the crunch in certain segments of supply chains (e.g., recent shortages in
microchips and semiconductors).
3
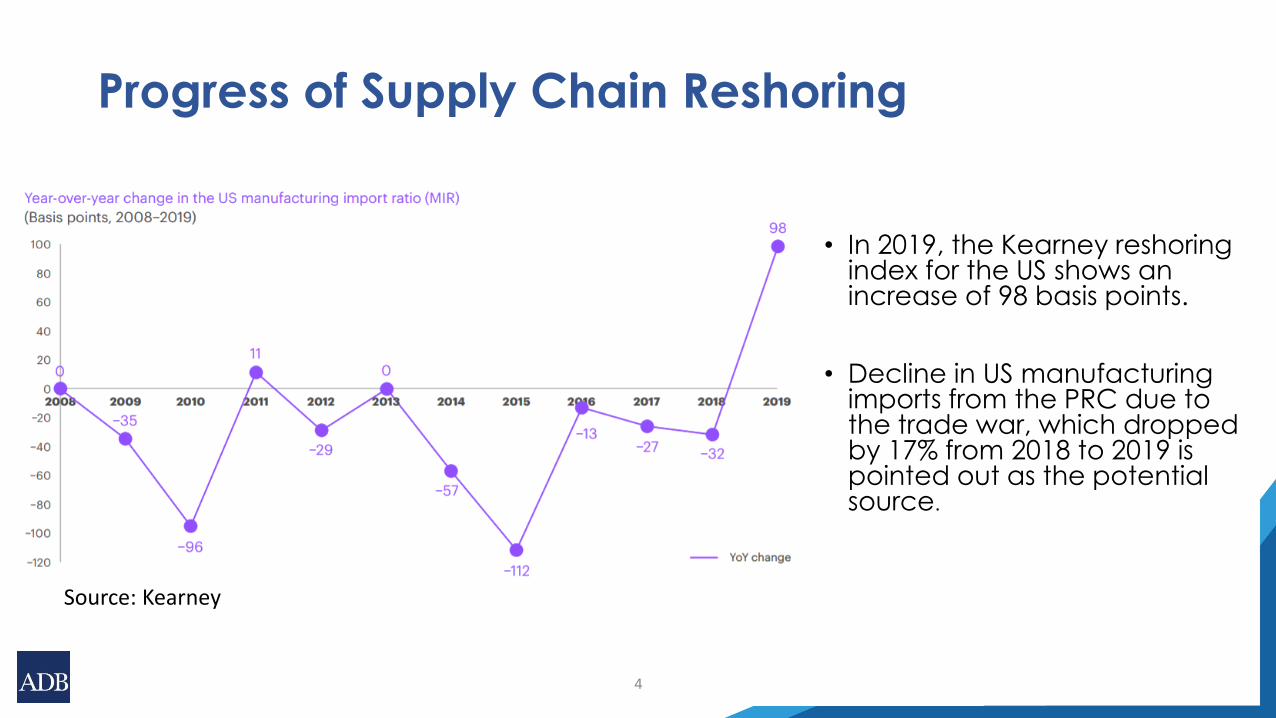
Progress of Supply Chain Reshoring
• In 2019, the Kearney reshoring index for the US shows an increase of 98 basis points.
• Decline in US manufacturing imports from the PRC due to the trade war, which dropped by 17% from 2018 to 2019 is pointed out as the potential source.
4
Source: Kearney
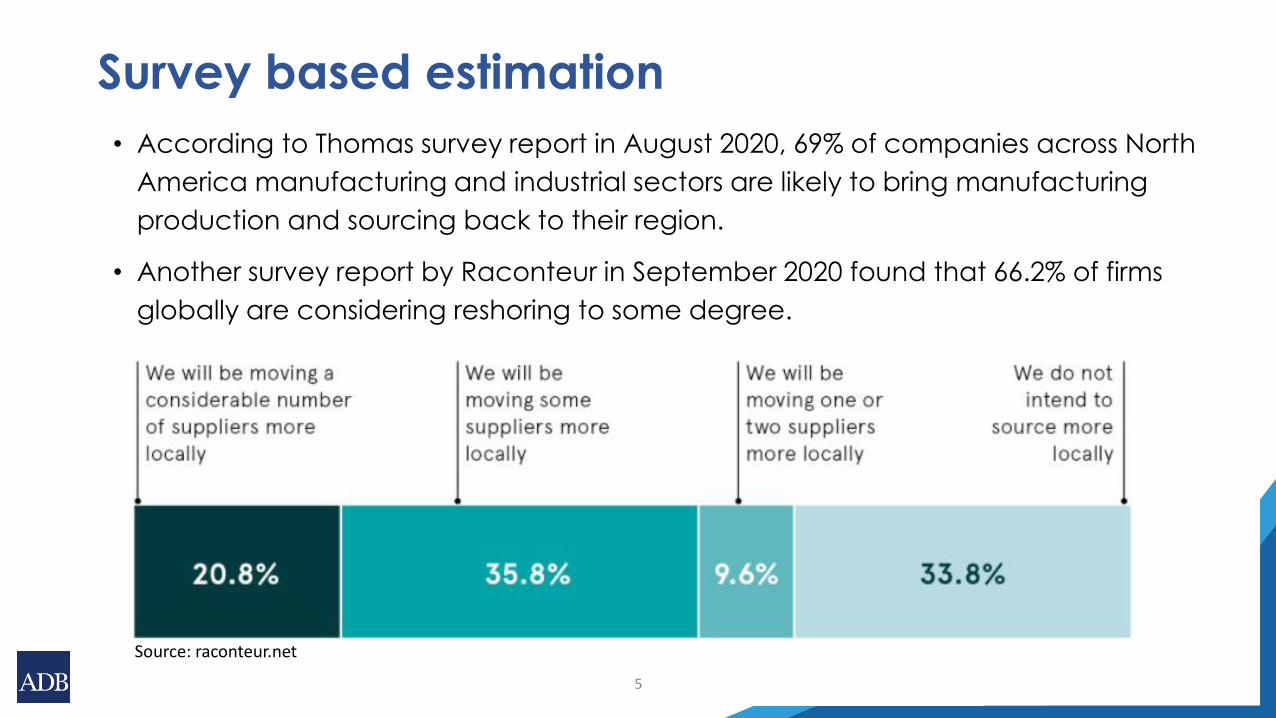
Survey based estimation
• According to Thomas survey report in August 2020, 69% of companies across North
America manufacturing and industrial sectors are likely to bring manufacturing
production and sourcing back to their region.
• Another survey report by Raconteur in September 2020 found that 66.2% of firms
globally are considering reshoring to some degree.
5
Source: raconteur.net
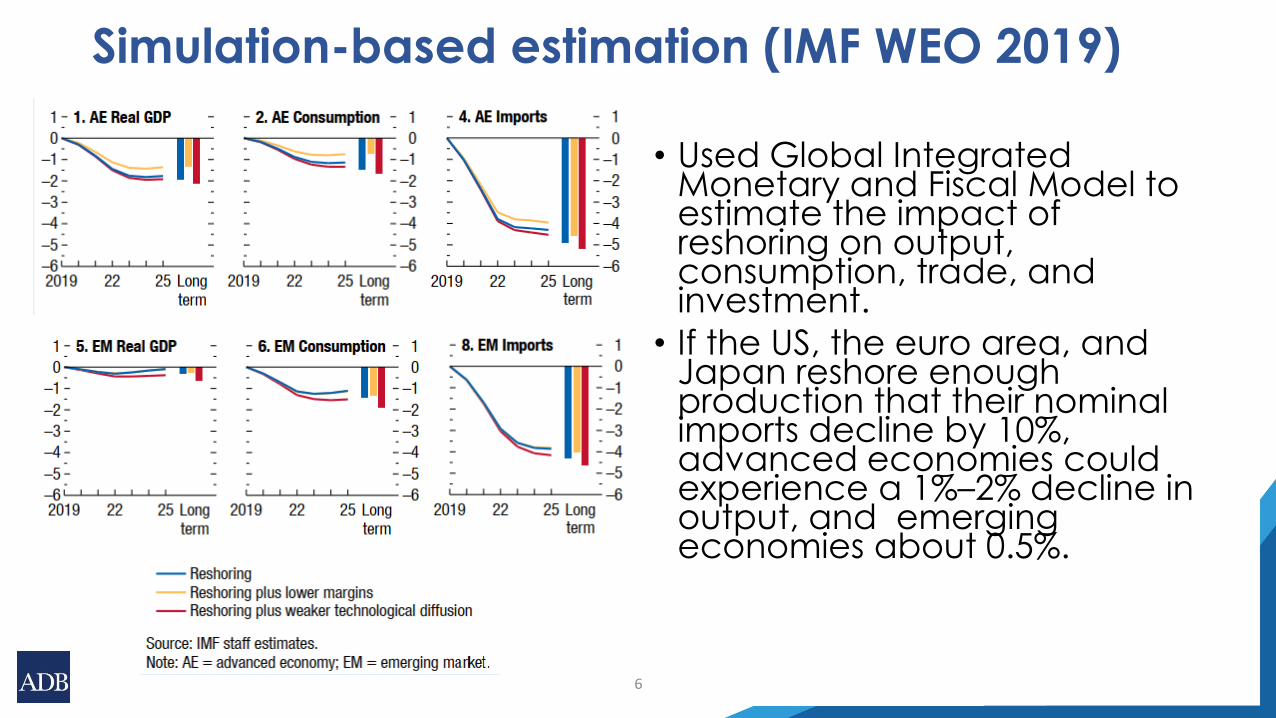
Simulation-based estimation (IMF WEO 2019)
• Used Global Integrated Monetary and Fiscal Model to estimate the impact of reshoring on output, consumption, trade, and investment.
• If the US, the euro area, and Japan reshore enough production that their nominal imports decline by 10%, advanced economies could experience a 1%–2% decline in output, and emerging economies about 0.5%.
6
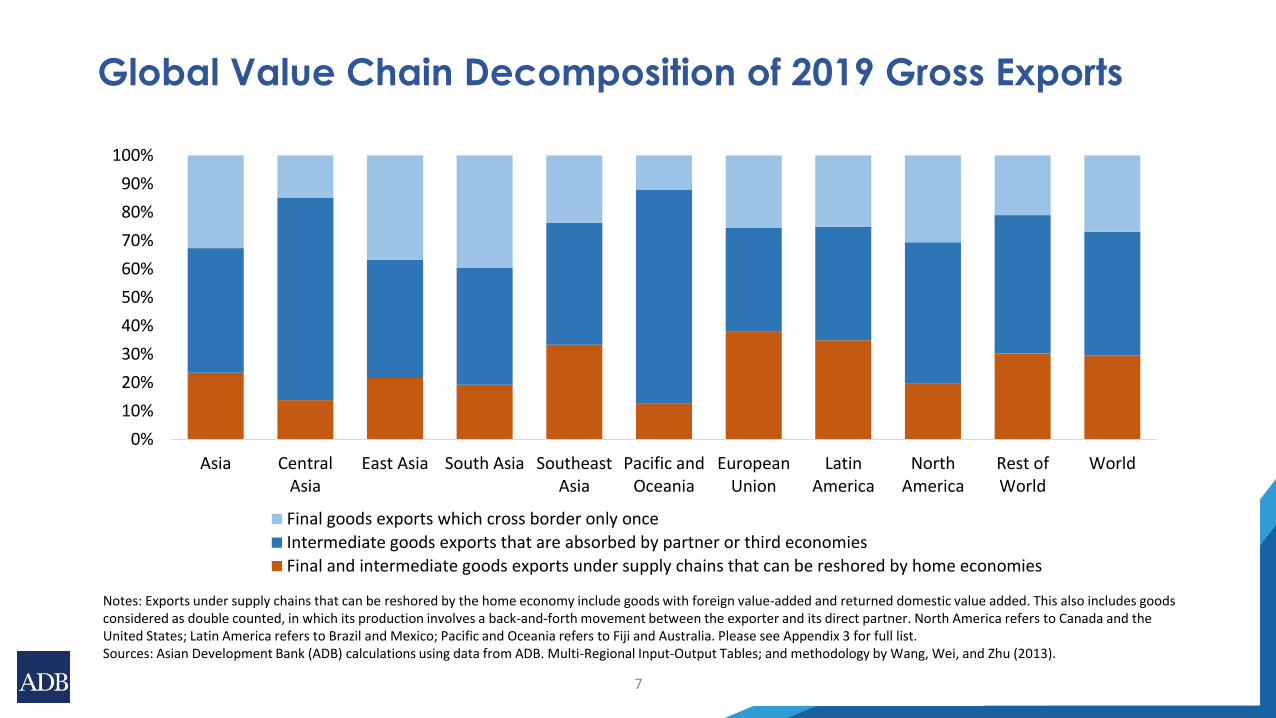
Global Value Chain Decomposition of 2019 Gross Exports
7
0%
10%
20%
30%
40%
50%
60%
70%
80%
90%
100%
Asia CentralAsia
East Asia South Asia SoutheastAsia
Pacific andOceania
EuropeanUnion
LatinAmerica
NorthAmerica
Rest ofWorld
World
Final goods exports which cross border only once
Intermediate goods exports that are absorbed by partner or third economies
Final and intermediate goods exports under supply chains that can be reshored by home economies
Notes: Exports under supply chains that can be reshored by the home economy include goods with foreign value-added and returned domestic value added. This also includes goods considered as double counted, in which its production involves a back-and-forth movement between the exporter and its direct partner. North America refers to Canada and the United States; Latin America refers to Brazil and Mexico; Pacific and Oceania refers to Fiji and Australia. Please see Appendix 3 for full list.Sources: Asian Development Bank (ADB) calculations using data from ADB. Multi-Regional Input-Output Tables; and methodology by Wang, Wei, and Zhu (2013).
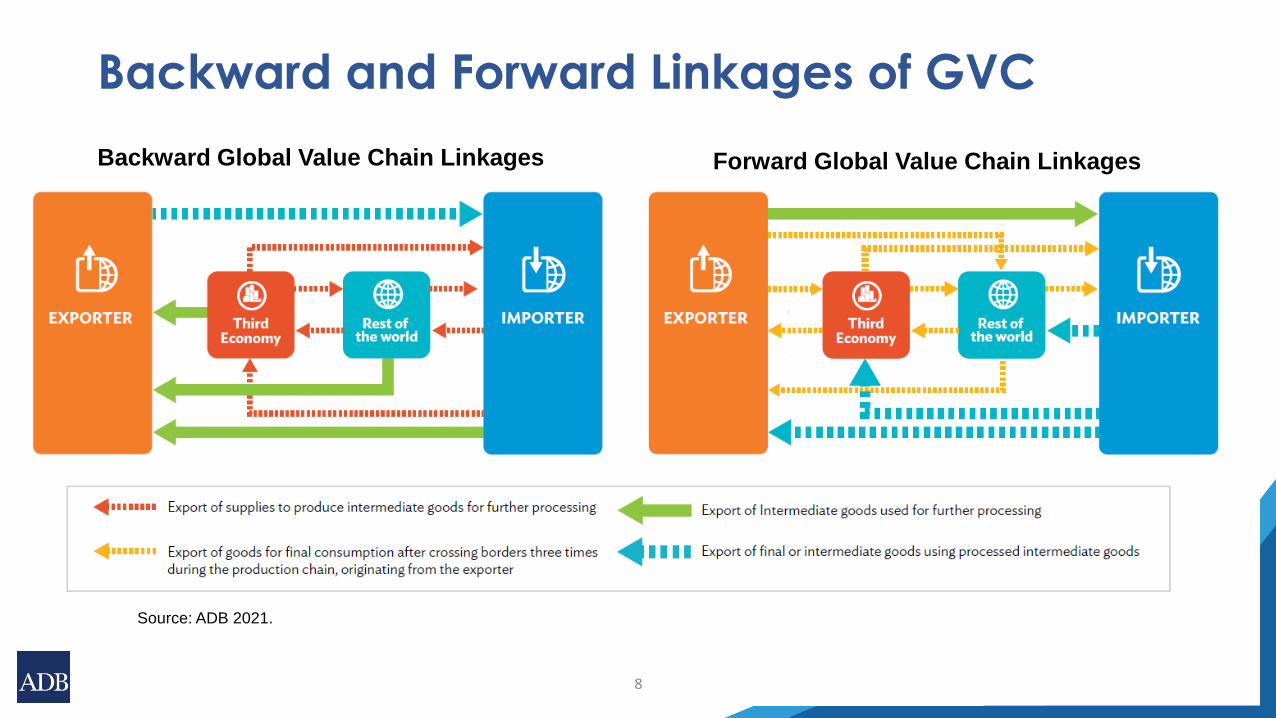
Backward and Forward Linkages of GVC
8
Backward Global Value Chain Linkages Forward Global Value Chain Linkages
Source: ADB 2021.
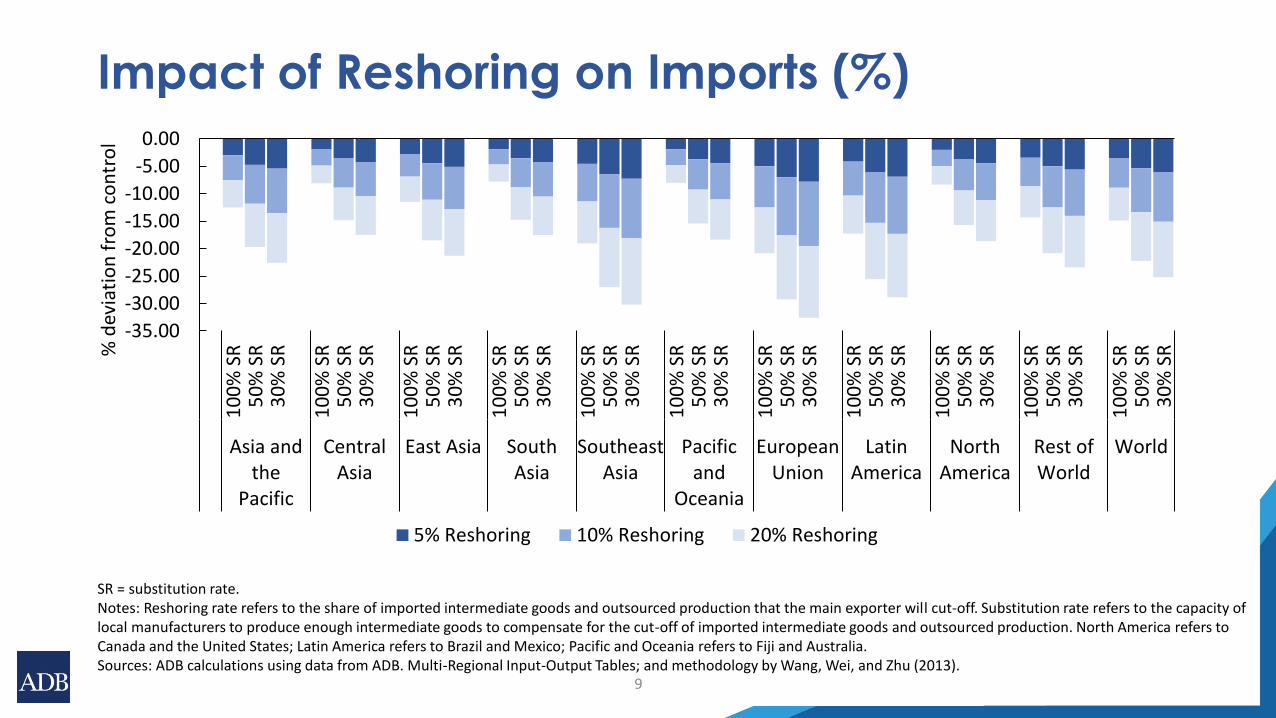
Impact of Reshoring on Imports (%)
9
-35.00
-30.00
-25.00
-20.00
-15.00
-10.00
-5.00
0.00
10
0%
SR
50
% S
R3
0%
SR
10
0%
SR
50
% S
R3
0%
SR
10
0%
SR
50
% S
R3
0%
SR
10
0%
SR
50
% S
R3
0%
SR
10
0%
SR
50
% S
R3
0%
SR
10
0%
SR
50
% S
R3
0%
SR
10
0%
SR
50
% S
R3
0%
SR
10
0%
SR
50
% S
R3
0%
SR
10
0%
SR
50
% S
R3
0%
SR
10
0%
SR
50
% S
R3
0%
SR
10
0%
SR
50
% S
R3
0%
SR
Asia andthe
Pacific
CentralAsia
East Asia SouthAsia
SoutheastAsia
Pacificand
Oceania
EuropeanUnion
LatinAmerica
NorthAmerica
Rest ofWorld
World
% d
evia
tio
n f
rom
co
ntr
ol
5% Reshoring 10% Reshoring 20% Reshoring
SR = substitution rate.Notes: Reshoring rate refers to the share of imported intermediate goods and outsourced production that the main exporter will cut-off. Substitution rate refers to the capacity of local manufacturers to produce enough intermediate goods to compensate for the cut-off of imported intermediate goods and outsourced production. North America refers to Canada and the United States; Latin America refers to Brazil and Mexico; Pacific and Oceania refers to Fiji and Australia.Sources: ADB calculations using data from ADB. Multi-Regional Input-Output Tables; and methodology by Wang, Wei, and Zhu (2013).
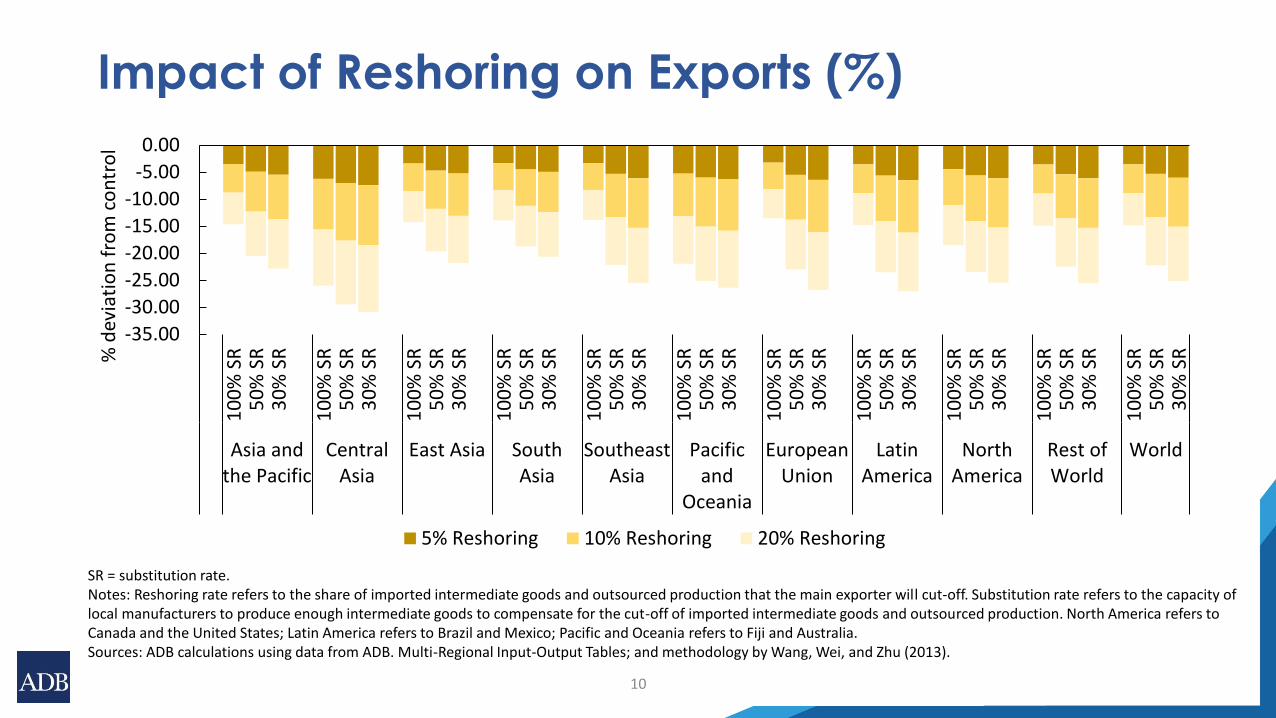
Impact of Reshoring on Exports (%)
10
-35.00
-30.00
-25.00
-20.00
-15.00
-10.00
-5.00
0.00
10
0%
SR
50
% S
R3
0%
SR
10
0%
SR
50
% S
R3
0%
SR
10
0%
SR
50
% S
R3
0%
SR
10
0%
SR
50
% S
R3
0%
SR
10
0%
SR
50
% S
R3
0%
SR
10
0%
SR
50
% S
R3
0%
SR
10
0%
SR
50
% S
R3
0%
SR
10
0%
SR
50
% S
R3
0%
SR
10
0%
SR
50
% S
R3
0%
SR
10
0%
SR
50
% S
R3
0%
SR
10
0%
SR
50
% S
R3
0%
SR
Asia andthe Pacific
CentralAsia
East Asia SouthAsia
SoutheastAsia
Pacificand
Oceania
EuropeanUnion
LatinAmerica
NorthAmerica
Rest ofWorld
World
% d
evia
tio
n f
rom
co
ntr
ol
5% Reshoring 10% Reshoring 20% Reshoring
SR = substitution rate.Notes: Reshoring rate refers to the share of imported intermediate goods and outsourced production that the main exporter will cut-off. Substitution rate refers to the capacity of local manufacturers to produce enough intermediate goods to compensate for the cut-off of imported intermediate goods and outsourced production. North America refers to Canada and the United States; Latin America refers to Brazil and Mexico; Pacific and Oceania refers to Fiji and Australia.Sources: ADB calculations using data from ADB. Multi-Regional Input-Output Tables; and methodology by Wang, Wei, and Zhu (2013).
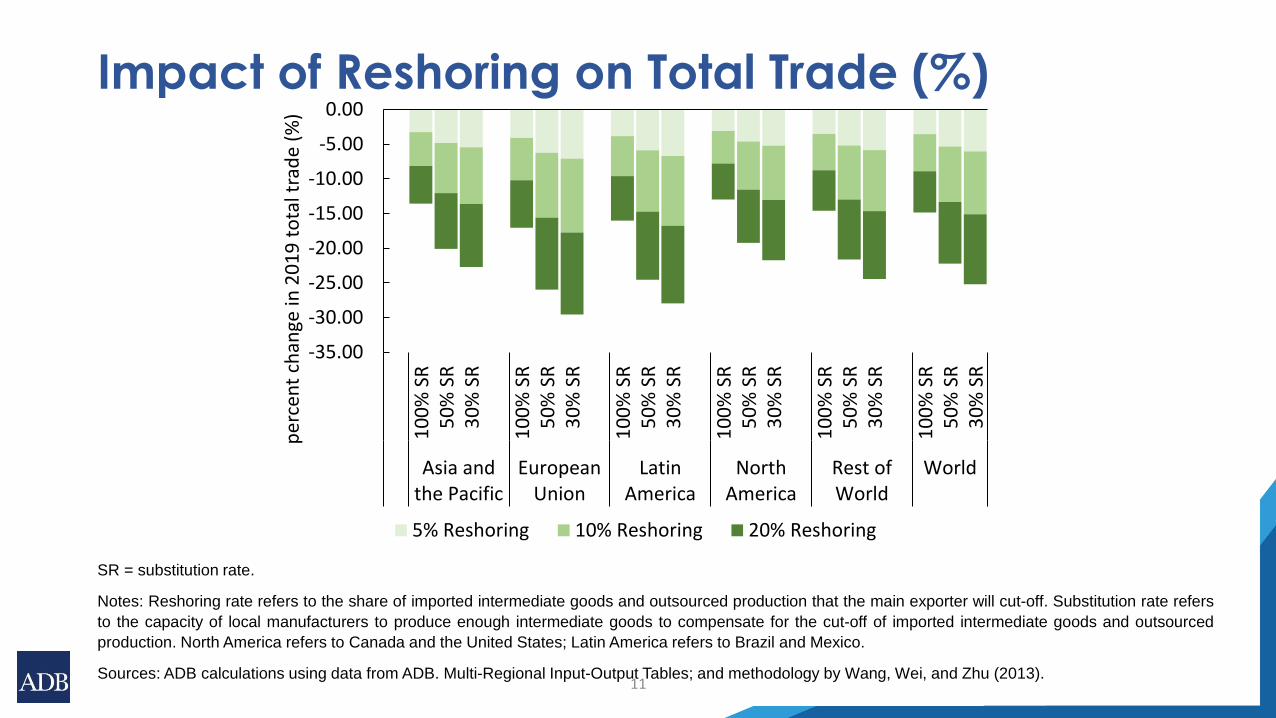
Impact of Reshoring on Total Trade (%)
11
SR = substitution rate.
Notes: Reshoring rate refers to the share of imported intermediate goods and outsourced production that the main exporter will cut-off. Substitution rate refers
to the capacity of local manufacturers to produce enough intermediate goods to compensate for the cut-off of imported intermediate goods and outsourced
production. North America refers to Canada and the United States; Latin America refers to Brazil and Mexico.
Sources: ADB calculations using data from ADB. Multi-Regional Input-Output Tables; and methodology by Wang, Wei, and Zhu (2013).
-35.00
-30.00
-25.00
-20.00
-15.00
-10.00
-5.00
0.00
10
0%
SR
50
% S
R3
0%
SR
10
0%
SR
50
% S
R3
0%
SR
10
0%
SR
50
% S
R3
0%
SR
10
0%
SR
50
% S
R3
0%
SR
10
0%
SR
50
% S
R3
0%
SR
10
0%
SR
50
% S
R3
0%
SR
Asia andthe Pacific
EuropeanUnion
LatinAmerica
NorthAmerica
Rest ofWorld
World
per
cen
t ch
ange
in 2
01
9 t
ota
l tra
de
(%)
5% Reshoring 10% Reshoring 20% Reshoring
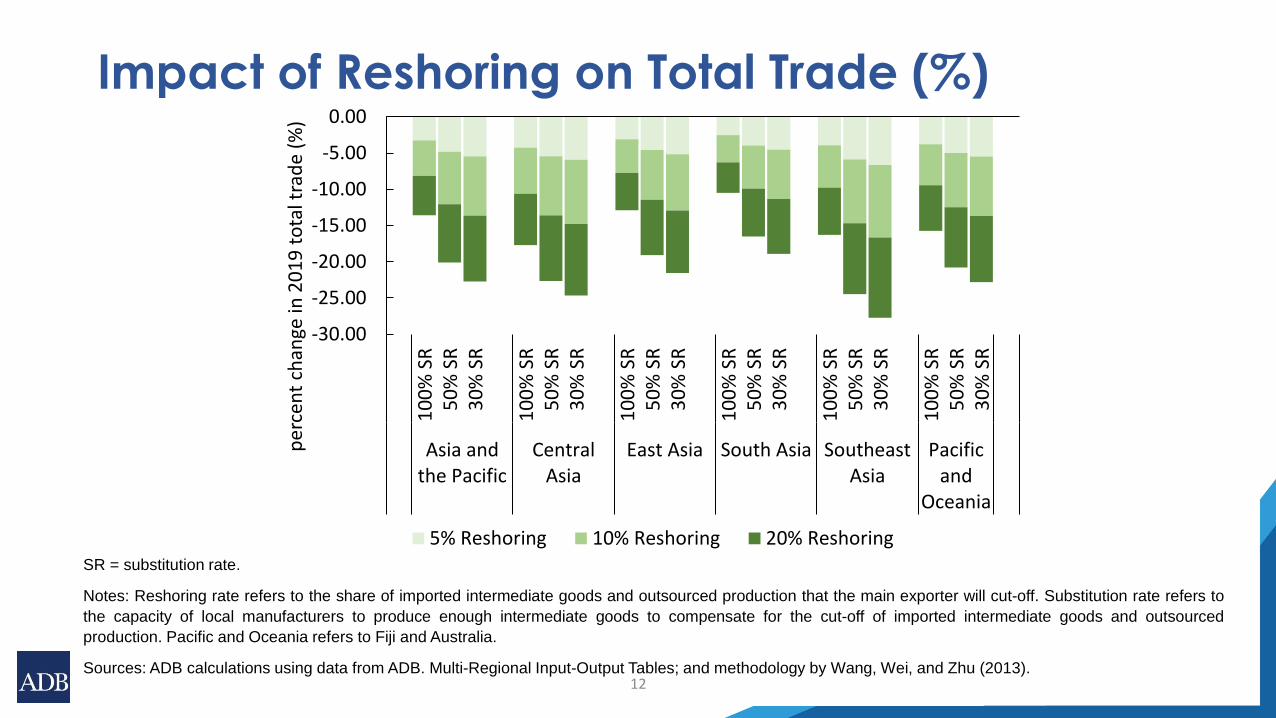
Impact of Reshoring on Total Trade (%)
12
SR = substitution rate.
Notes: Reshoring rate refers to the share of imported intermediate goods and outsourced production that the main exporter will cut-off. Substitution rate refers to
the capacity of local manufacturers to produce enough intermediate goods to compensate for the cut-off of imported intermediate goods and outsourced
production. Pacific and Oceania refers to Fiji and Australia.
Sources: ADB calculations using data from ADB. Multi-Regional Input-Output Tables; and methodology by Wang, Wei, and Zhu (2013).
-30.00
-25.00
-20.00
-15.00
-10.00
-5.00
0.00
10
0%
SR
50
% S
R3
0%
SR
10
0%
SR
50
% S
R3
0%
SR
10
0%
SR
50
% S
R3
0%
SR
10
0%
SR
50
% S
R3
0%
SR
10
0%
SR
50
% S
R3
0%
SR
10
0%
SR
50
% S
R3
0%
SR
Asia andthe Pacific
CentralAsia
East Asia South Asia SoutheastAsia
Pacificand
Oceania
per
cen
t ch
ange
in 2
01
9 t
ota
l tra
de
(%)
5% Reshoring 10% Reshoring 20% Reshoring
30
35
40
45
50
55
60
65
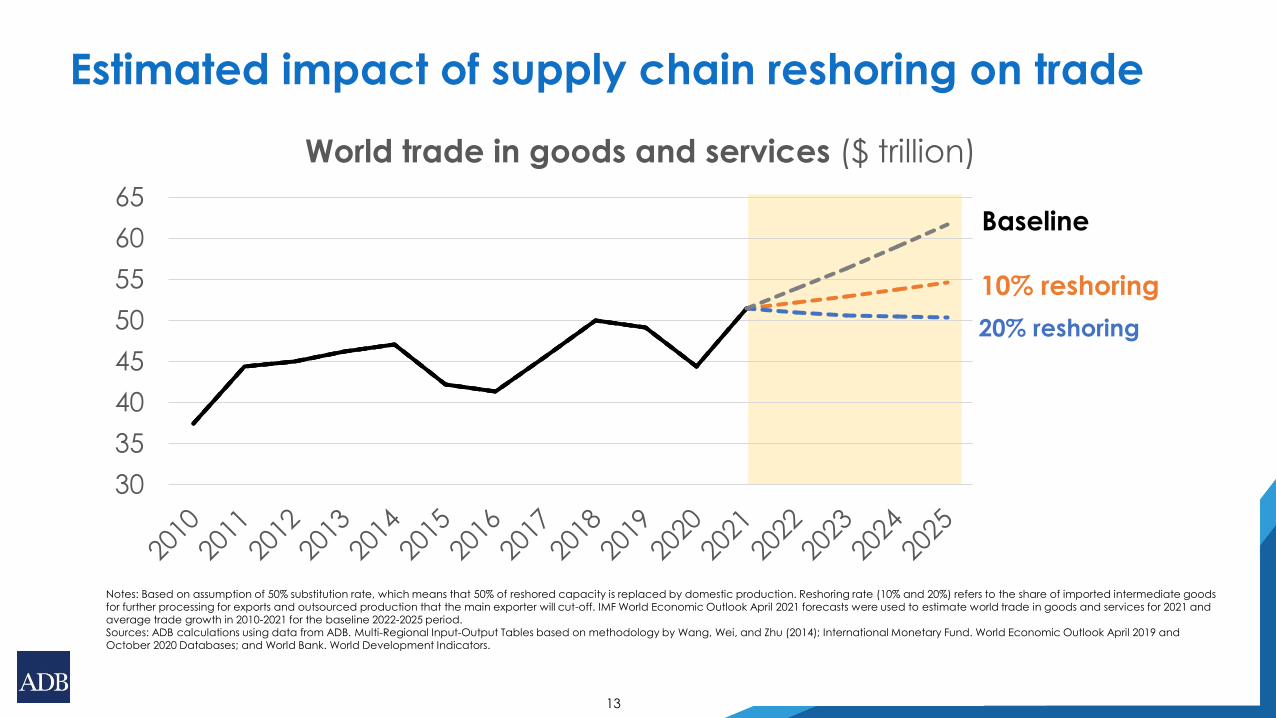
World trade in goods and services ($ trillion)
Baseline
10% reshoring
20% reshoring
Estimated impact of supply chain reshoring on trade
Notes: Based on assumption of 50% substitution rate, which means that 50% of reshored capacity is replaced by domestic production. Reshoring rate (10% and 20%) refers to the share of imported intermediate goods for further processing for exports and outsourced production that the main exporter will cut-off. IMF World Economic Outlook April 2021 forecasts were used to estimate world trade in goods and services for 2021 and average trade growth in 2010-2021 for the baseline 2022-2025 period.Sources: ADB calculations using data from ADB. Multi-Regional Input-Output Tables based on methodology by Wang, Wei, and Zhu (2014); International Monetary Fund. World Economic Outlook April 2019 and October 2020 Databases; and World Bank. World Development Indicators.
13
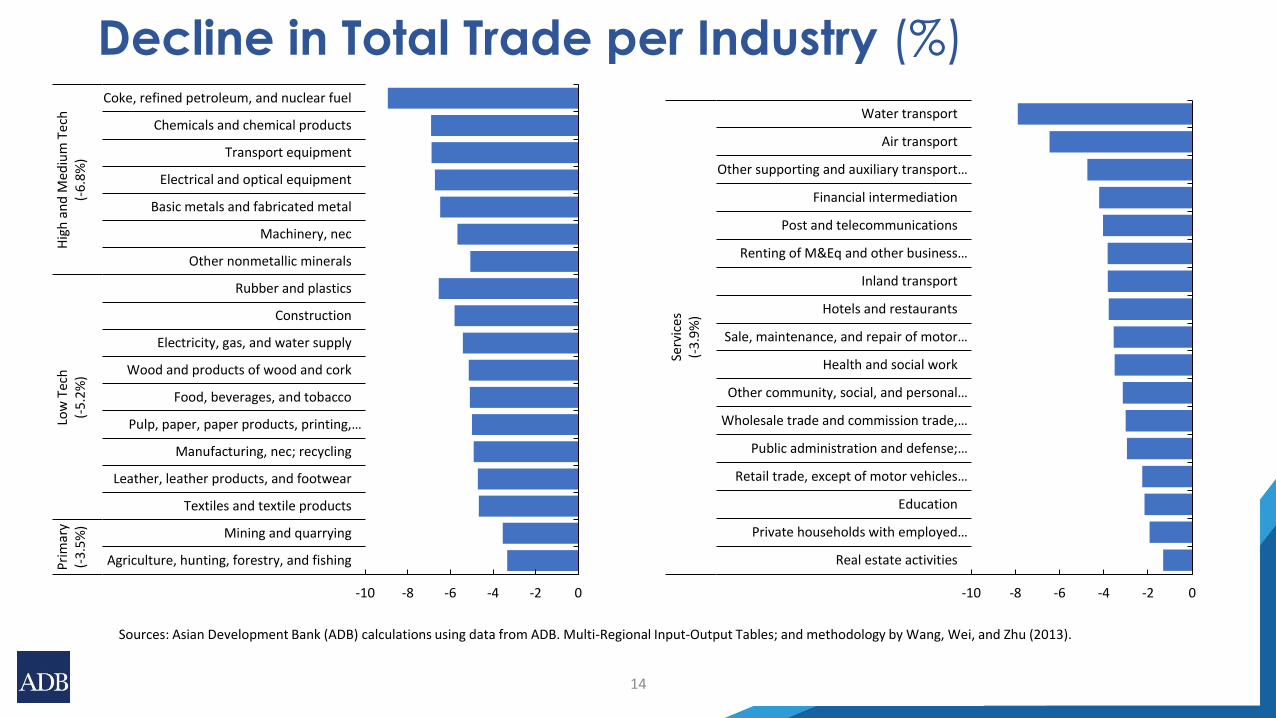
Decline in Total Trade per Industry (%)
14
Sources: Asian Development Bank (ADB) calculations using data from ADB. Multi-Regional Input-Output Tables; and methodology by Wang, Wei, and Zhu (2013).
-10 -8 -6 -4 -2 0
Agriculture, hunting, forestry, and fishing
Mining and quarrying
Textiles and textile products
Leather, leather products, and footwear
Manufacturing, nec; recycling
Pulp, paper, paper products, printing,…
Food, beverages, and tobacco
Wood and products of wood and cork
Electricity, gas, and water supply
Construction
Rubber and plastics
Other nonmetallic minerals
Machinery, nec
Basic metals and fabricated metal
Electrical and optical equipment
Transport equipment
Chemicals and chemical products
Coke, refined petroleum, and nuclear fuel
Pri
mar
y(-
3.5
%)
Low
Tec
h(-
5.2
%)
Hig
h a
nd
Med
ium
Te
ch(-
6.8
%)
-10 -8 -6 -4 -2 0
Real estate activities
Private households with employed…
Education
Retail trade, except of motor vehicles…
Public administration and defense;…
Wholesale trade and commission trade,…
Other community, social, and personal…
Health and social work
Sale, maintenance, and repair of motor…
Hotels and restaurants
Inland transport
Renting of M&Eq and other business…
Post and telecommunications
Financial intermediation
Other supporting and auxiliary transport…
Air transport
Water transport
Serv
ices
(-3
.9%
)
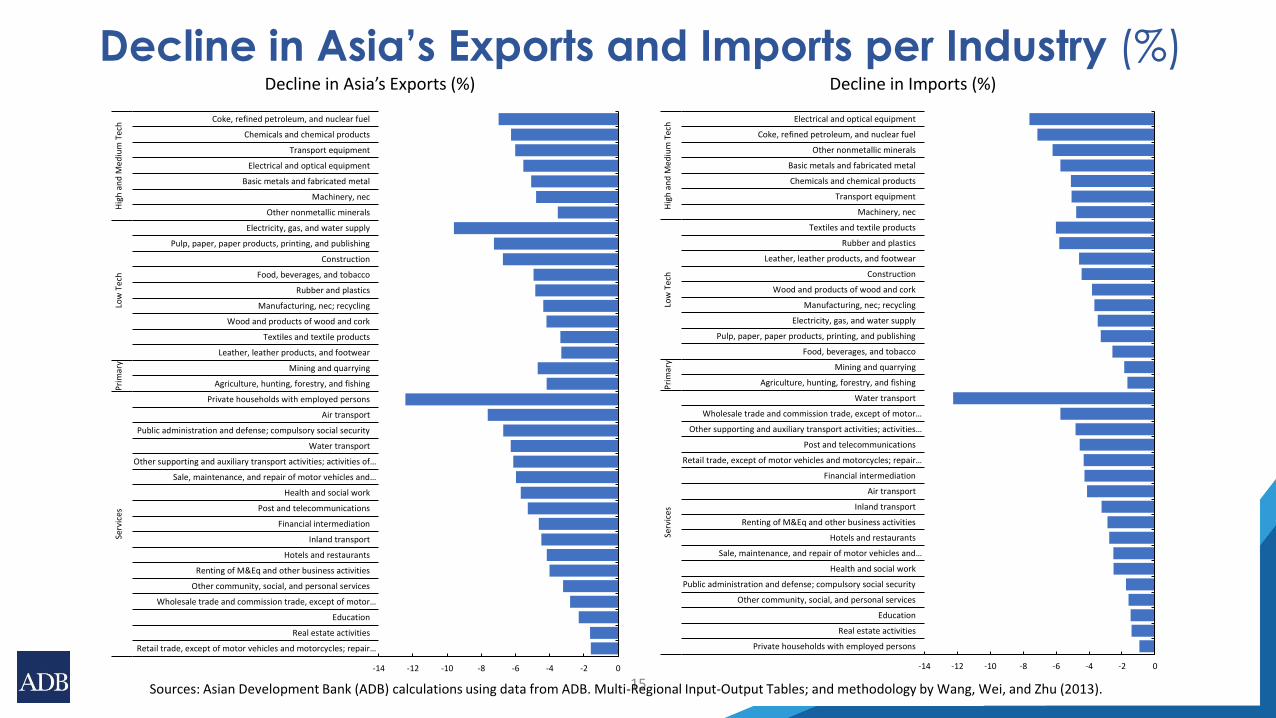
Decline in Asia’s Exports and Imports per Industry (%)
15Sources: Asian Development Bank (ADB) calculations using data from ADB. Multi-Regional Input-Output Tables; and methodology by Wang, Wei, and Zhu (2013).
-14 -12 -10 -8 -6 -4 -2 0
Private households with employed persons
Real estate activities
Education
Other community, social, and personal services
Public administration and defense; compulsory social security
Health and social work
Sale, maintenance, and repair of motor vehicles and…
Hotels and restaurants
Renting of M&Eq and other business activities
Inland transport
Air transport
Financial intermediation
Retail trade, except of motor vehicles and motorcycles; repair…
Post and telecommunications
Other supporting and auxiliary transport activities; activities…
Wholesale trade and commission trade, except of motor…
Water transport
Agriculture, hunting, forestry, and fishing
Mining and quarrying
Food, beverages, and tobacco
Pulp, paper, paper products, printing, and publishing
Electricity, gas, and water supply
Manufacturing, nec; recycling
Wood and products of wood and cork
Construction
Leather, leather products, and footwear
Rubber and plastics
Textiles and textile products
Machinery, nec
Transport equipment
Chemicals and chemical products
Basic metals and fabricated metal
Other nonmetallic minerals
Coke, refined petroleum, and nuclear fuel
Electrical and optical equipment
Serv
ices
Pri
mar
yLo
w T
ech
Hig
h a
nd
Med
ium
Tec
h
Decline in Imports (%)
-14 -12 -10 -8 -6 -4 -2 0
Retail trade, except of motor vehicles and motorcycles; repair…
Real estate activities
Education
Wholesale trade and commission trade, except of motor…
Other community, social, and personal services
Renting of M&Eq and other business activities
Hotels and restaurants
Inland transport
Financial intermediation
Post and telecommunications
Health and social work
Sale, maintenance, and repair of motor vehicles and…
Other supporting and auxiliary transport activities; activities of…
Water transport
Public administration and defense; compulsory social security
Air transport
Private households with employed persons
Agriculture, hunting, forestry, and fishing
Mining and quarrying
Leather, leather products, and footwear
Textiles and textile products
Wood and products of wood and cork
Manufacturing, nec; recycling
Rubber and plastics
Food, beverages, and tobacco
Construction
Pulp, paper, paper products, printing, and publishing
Electricity, gas, and water supply
Other nonmetallic minerals
Machinery, nec
Basic metals and fabricated metal
Electrical and optical equipment
Transport equipment
Chemicals and chemical products
Coke, refined petroleum, and nuclear fuelSe
rvic
esP
rim
ary
Low
Tec
hH
igh
an
d M
ediu
m T
ech
Decline in Asia’s Exports (%)
Conclusion
• Recent events, including trade conflicts and COVID-19 lockdowns, have prompted
policy makers and businesses to consider reshoring of supply chains to mitigate the
adverse effects of these trade shocks.
• Using the ADB’s MRIO Tables to simulate the direct and spillover effects of reshoring,
estimates suggest that reshoring by 5%–10% can lead to a 5.3% to 13.3% decrease in
global trade from its base value.
• Impact will be heterogeneous across sectors and regions depending upon the depth
of supply chain linkages.
16

Thank you!
ERCD/ERCI team
17