Embed Size (px)
Citation preview

Print Date: 20/11/17
Housing Service Performance Report - 2017-18
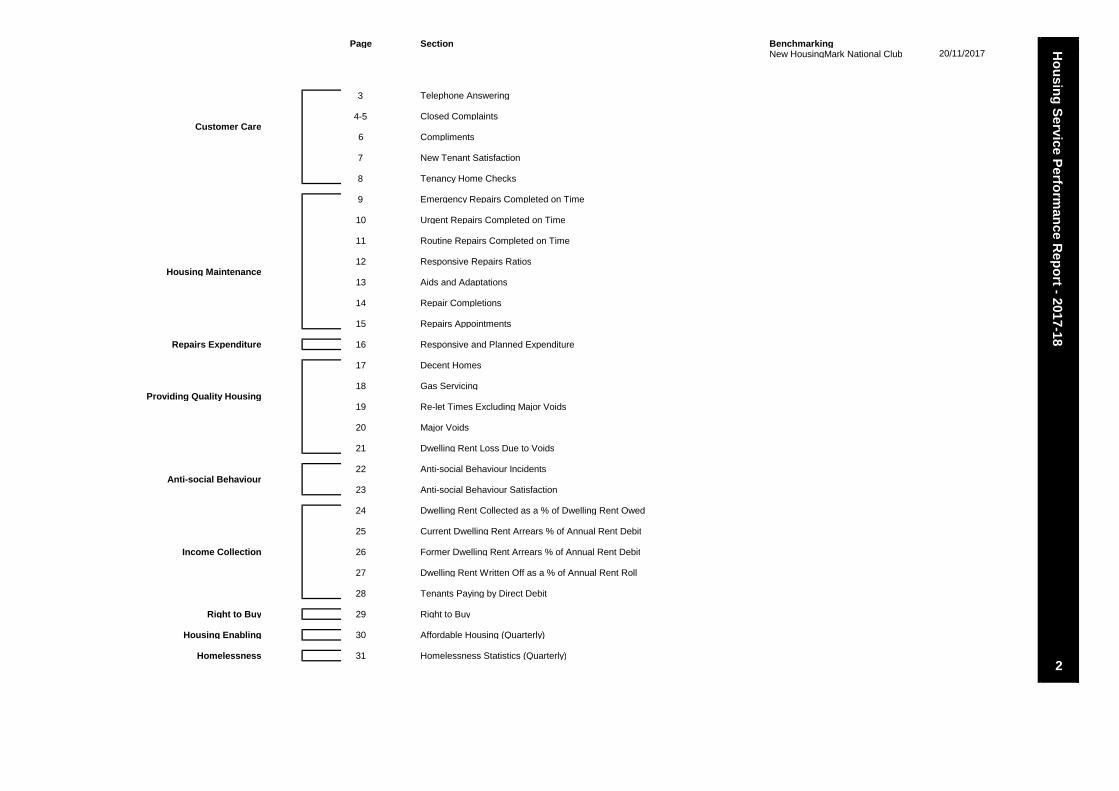
Page Section BenchmarkingNew HousingMark National Club
3 Telephone Answering
4-5 Closed ComplaintsCustomer Care
6 Compliments
7 New Tenant Satisfaction
8 Tenancy Home Checks
9 Emergency Repairs Completed on Time
10 Urgent Repairs Completed on Time
11 Routine Repairs Completed on Time
12 Responsive Repairs RatiosHousing Maintenance
13 Aids and Adaptations
14 Repair Completions
15 Repairs Appointments
Repairs Expenditure 16 Responsive and Planned Expenditure
17 Decent Homes
18 Gas ServicingProviding Quality Housing
19 Re-let Times Excluding Major Voids
20 Major Voids
21 Dwelling Rent Loss Due to Voids
22 Anti-social Behaviour IncidentsAnti-social Behaviour
23 Anti-social Behaviour Satisfaction
24 Dwelling Rent Collected as a % of Dwelling Rent Owed
25 Current Dwelling Rent Arrears % of Annual Rent Debit
Income Collection 26 Former Dwelling Rent Arrears % of Annual Rent Debit
27 Dwelling Rent Written Off as a % of Annual Rent Roll
28 Tenants Paying by Direct Debit
Right to Buy 29 Right to Buy
Housing Enabling 30 Affordable Housing (Quarterly)
Homelessness 31 Homelessness Statistics (Quarterly)
20/11/2017
2
Ho
usin
g S
ervice Perfo
rman
ce Rep
ort - 2017-18
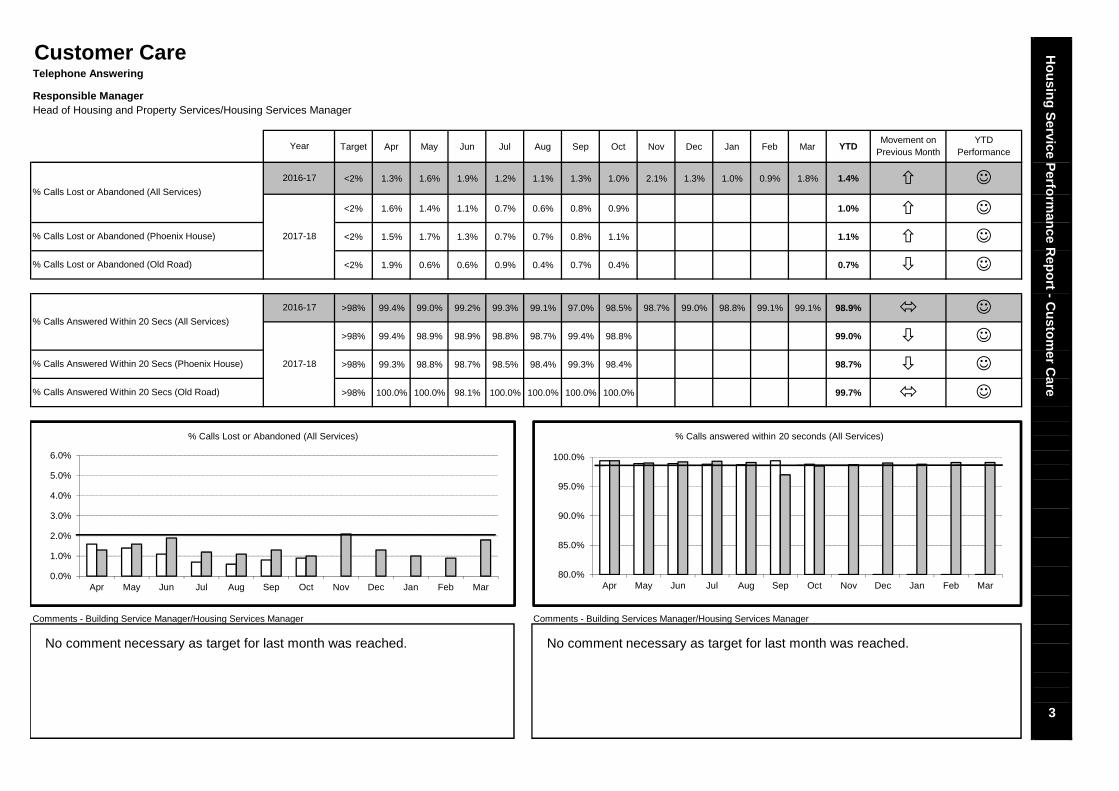
Responsible ManagerHead of Housing and Property Services/Housing Services Manager
Target Apr May Jun Jul Aug Sep Oct Nov Dec Jan Feb Mar YTD
<2% 1.3% 1.6% 1.9% 1.2% 1.1% 1.3% 1.0% 2.1% 1.3% 1.0% 0.9% 1.8% 1.4%
<2% 1.6% 1.4% 1.1% 0.7% 0.6% 0.8% 0.9% 1.0%
<2% 1.5% 1.7% 1.3% 0.7% 0.7% 0.8% 1.1% 1.1%
<2% 1.9% 0.6% 0.6% 0.9% 0.4% 0.7% 0.4% 0.7%
>98% 99.4% 99.0% 99.2% 99.3% 99.1% 97.0% 98.5% 98.7% 99.0% 98.8% 99.1% 99.1% 98.9%
>98% 99.4% 98.9% 98.9% 98.8% 98.7% 99.4% 98.8% 99.0%
>98% 99.3% 98.8% 98.7% 98.5% 98.4% 99.3% 98.4% 98.7%
>98% 100.0% 100.0% 98.1% 100.0% 100.0% 100.0% 100.0% 99.7%
Comments - Building Service Manager/Housing Services Manager Comments - Building Services Manager/Housing Services Manager
2017-18
☺
�
�
☺
2017-18
�
% Calls Answered Within 20 Secs (Old Road)
☺2016-17
�
�
� ☺
% Calls Answered Within 20 Secs (Phoenix House)
% Calls Answered Within 20 Secs (All Services)
☺
3
Movement on Previous Month
YTD Performance
☺
☺
� ☺
Ho
usin
g S
ervice Perfo
rman
ce Rep
ort - C
usto
mer C
are
% Calls Lost or Abandoned (Old Road) �
Customer Care
% Calls Lost or Abandoned (All Services)
% Calls Lost or Abandoned (Phoenix House)
2016-17
Telephone Answering
Year
No comment necessary as target for last month was reached.
0.0%
1.0%
2.0%
3.0%
4.0%
5.0%
6.0%
Apr May Jun Jul Aug Sep Oct Nov Dec Jan Feb Mar
% Calls Lost or Abandoned (All Services)
80.0%
85.0%
90.0%
95.0%
100.0%
Apr May Jun Jul Aug Sep Oct Nov Dec Jan Feb Mar
% Calls answered within 20 seconds (All Services)
No comment necessary as target for last month was reached.
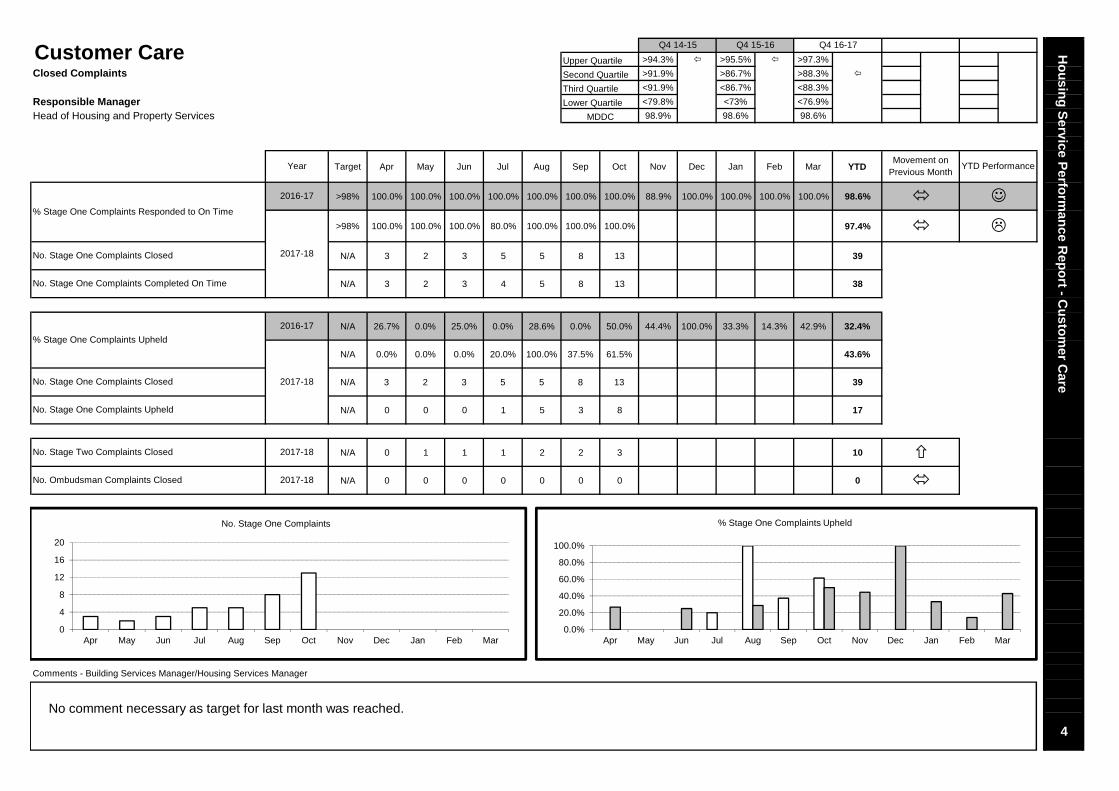
Upper Quartile >94.3% >95.5% >97.3%
Second Quartile >91.9% >86.7% >88.3%
Third Quartile <91.9% <86.7% <88.3%
Responsible Manager Lower Quartile <79.8% <73% <76.9%
Head of Housing and Property Services 98.9% 98.6% 98.6%
Target Apr May Jun Jul Aug Sep Oct Nov Dec Jan Feb Mar YTD
>98% 100.0% 100.0% 100.0% 100.0% 100.0% 100.0% 100.0% 88.9% 100.0% 100.0% 100.0% 100.0% 98.6%
>98% 100.0% 100.0% 100.0% 80.0% 100.0% 100.0% 100.0% 97.4%
N/A 3 2 3 5 5 8 13 39
N/A 3 2 3 4 5 8 13 38
N/A 26.7% 0.0% 25.0% 0.0% 28.6% 0.0% 50.0% 44.4% 100.0% 33.3% 14.3% 42.9% 32.4%
N/A 0.0% 0.0% 0.0% 20.0% 100.0% 37.5% 61.5% 43.6%
N/A 3 2 3 5 5 8 13 39
N/A 0 0 0 1 5 3 8 17
N/A 0 1 1 1 2 2 3 10
N/A 0 0 0 0 0 0 0 0
Comments - Building Services Manager/Housing Services Manager
MDDC
Q4 14-15 Q4 15-16 Q4 16-17
Movement on Previous Month
Closed Complaints
4
Ho
usin
g S
ervice Perfo
rman
ce Rep
ort - C
usto
mer C
are
�
Customer Care
�
☺
YTD Performance
�2016-17
Year
% Stage One Complaints Responded to On Time
2017-18
% Stage One Complaints Upheld
No. Stage One Complaints Closed
No. Stage One Complaints Completed On Time
2017-18No. Stage One Complaints Closed
2016-17
No. Stage One Complaints Upheld
No. Stage Two Complaints Closed
No. Ombudsman Complaints Closed
�
�
2017-18
2017-18
No comment necessary as target for last month was reached.
0.0%
20.0%
40.0%
60.0%
80.0%
100.0%
Apr May Jun Jul Aug Sep Oct Nov Dec Jan Feb Mar
% Stage One Complaints Upheld
0
4
8
12
16
20
Apr May Jun Jul Aug Sep Oct Nov Dec Jan Feb Mar
No. Stage One Complaints
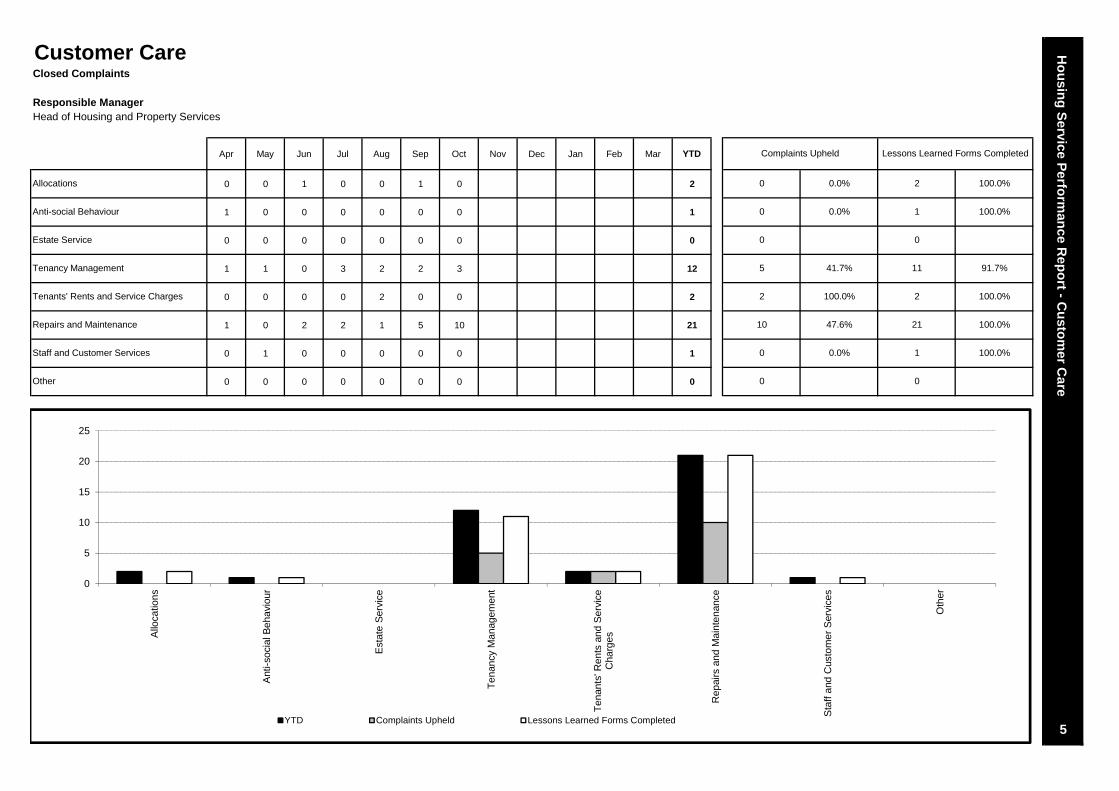
Responsible ManagerHead of Housing and Property Services
Apr May Jun Jul Aug Sep Oct Nov Dec Jan Feb Mar YTD
0 0 1 0 0 1 0 2
1 0 0 0 0 0 0 1
0 0 0 0 0 0 0 0
1 1 0 3 2 2 3 12
0 0 0 0 2 0 0 2
1 0 2 2 1 5 10 21
0 1 0 0 0 0 0 1
0 0 0 0 0 0 0 0
1
Repairs and Maintenance
100.0%
0
5
Estate Service
Anti-social Behaviour
Ho
usin
g S
ervice Perfo
rman
ce Rep
ort - C
usto
mer C
are
2
Other
100.0%
100.0%
100.0%
91.7%
Closed Complaints
1
21
2
11
Lessons Learned Forms Completed
100.0%
Staff and Customer Services
0
0
Customer Care
0
0.0%
0.0%
41.7%
100.0%
0.0%
Complaints Upheld
Allocations
Tenants' Rents and Service Charges
Tenancy Management
2
5
0
47.6%10
0
0
0
5
10
15
20
25
Allo
catio
ns
Ant
i-soc
ial B
ehav
iour
Est
ate
Ser
vice
Ten
ancy
Man
agem
ent
Ten
ants
' Ren
ts a
nd S
ervi
ceC
harg
es
Rep
airs
and
Mai
nten
ance
Sta
ff an
d C
usto
mer
Ser
vice
s
Oth
er
YTD Complaints Upheld Lessons Learned Forms Completed
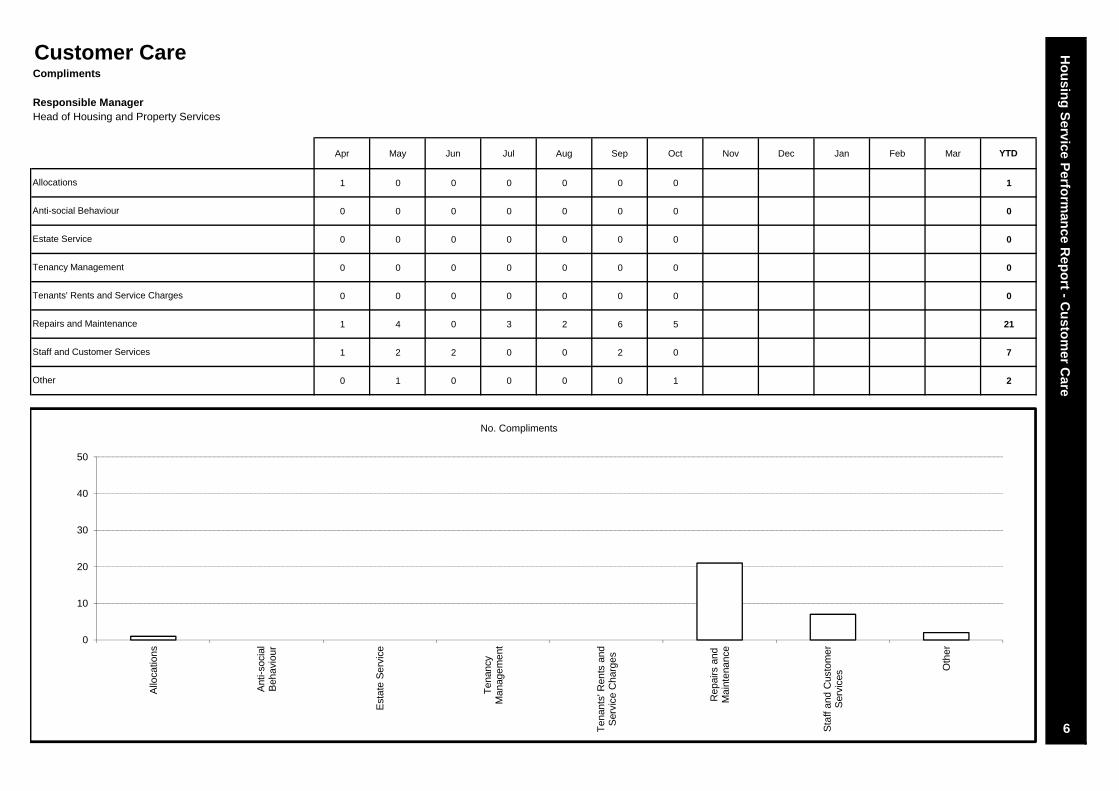
Responsible ManagerHead of Housing and Property Services
Apr May Jun Jul Aug Sep Oct Nov Dec Jan Feb Mar YTD
1 0 0 0 0 0 0 1
0 0 0 0 0 0 0 0
0 0 0 0 0 0 0 0
0 0 0 0 0 0 0 0
0 0 0 0 0 0 0 0
1 4 0 3 2 6 5 21
1 2 2 0 0 2 0 7
0 1 0 0 0 0 1 2
Tenancy Management
Compliments
6
Estate Service
Anti-social Behaviour
Ho
usin
g S
ervice Perfo
rman
ce Rep
ort - C
usto
mer C
areOther
Staff and Customer Services
Repairs and Maintenance
Customer Care
Allocations
Tenants' Rents and Service Charges
0
10
20
30
40
50
Allo
catio
ns
Ant
i-soc
ial
Beh
avio
ur
Est
ate
Ser
vice
Ten
ancy
Man
agem
ent
Ten
ants
' Ren
ts a
ndS
ervi
ce C
harg
es
Rep
airs
and
Mai
nten
ance
Sta
ff an
d C
usto
mer
Ser
vice
s Oth
er
No. Compliments
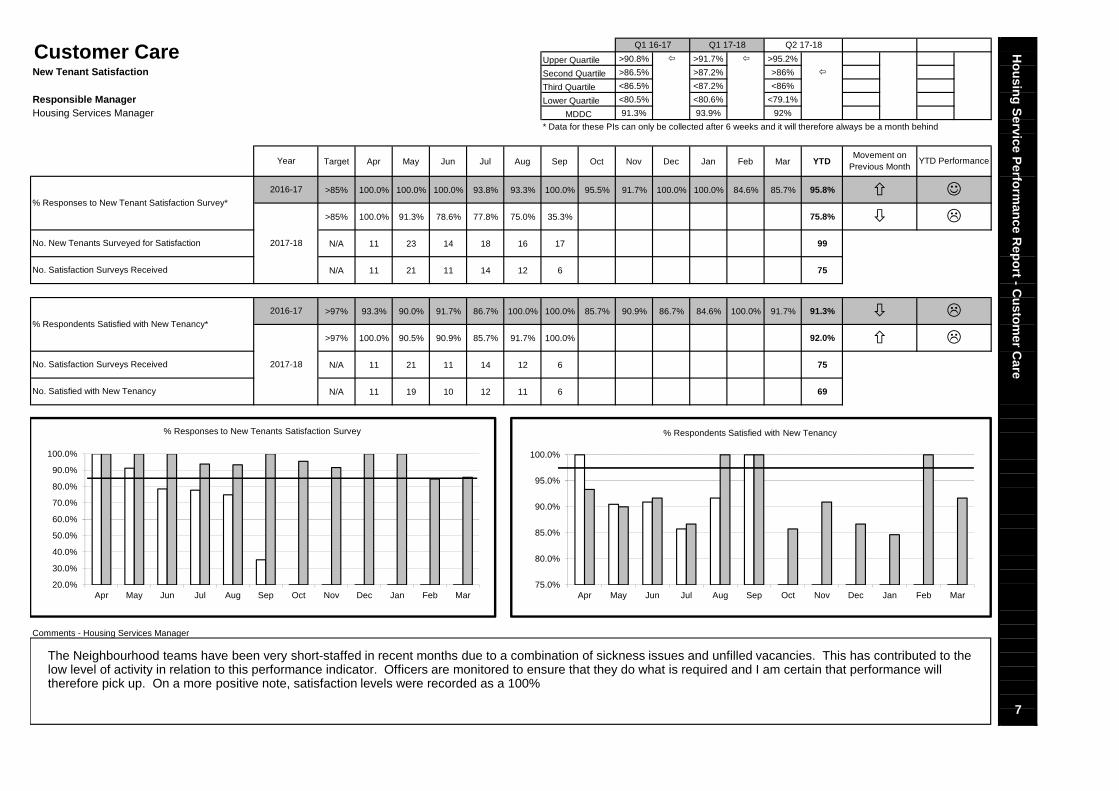
Upper Quartile >90.8% >91.7% >95.2%
Second Quartile >86.5% >87.2% >86%
Third Quartile <86.5% <87.2% <86%
Responsible Manager Lower Quartile <80.5% <80.6% <79.1%
Housing Services Manager 91.3% 93.9% 92%
* Data for these PIs can only be collected after 6 weeks and it will therefore always be a month behind
Target Apr May Jun Jul Aug Sep Oct Nov Dec Jan Feb Mar YTD
>85% 100.0% 100.0% 100.0% 93.8% 93.3% 100.0% 95.5% 91.7% 100.0% 100.0% 84.6% 85.7% 95.8%
>85% 100.0% 91.3% 78.6% 77.8% 75.0% 35.3% 75.8%
N/A 11 23 14 18 16 17 99
N/A 11 21 11 14 12 6 75
>97% 93.3% 90.0% 91.7% 86.7% 100.0% 100.0% 85.7% 90.9% 86.7% 84.6% 100.0% 91.7% 91.3%
>97% 100.0% 90.5% 90.9% 85.7% 91.7% 100.0% 92.0%
N/A 11 21 11 14 12 6 75
N/A 11 19 10 12 11 6 69
7
Ho
usin
g S
ervice Perfo
rman
ce Rep
ort - C
usto
mer C
are
New Tenant Satisfaction
YearMovement on
Previous MonthYTD Performance
☺
Customer Care
Comments - Housing Services Manager
�
� �
�
% Respondents Satisfied with New Tenancy*
2017-18
� �
No. Satisfaction Surveys Received
No. Satisfied with New Tenancy
2016-17
�
No. New Tenants Surveyed for Satisfaction
No. Satisfaction Surveys Received
% Responses to New Tenant Satisfaction Survey*
2017-18
2016-17
Q1 16-17 Q1 17-18 Q2 17-18
MDDC
The Neighbourhood teams have been very short-staffed in recent months due to a combination of sickness issues and unfilled vacancies. This has contributed to the low level of activity in relation to this performance indicator. Officers are monitored to ensure that they do what is required and I am certain that performance will therefore pick up. On a more positive note, satisfaction levels were recorded as a 100%
20.0%
30.0%
40.0%
50.0%
60.0%
70.0%
80.0%
90.0%
100.0%
Apr May Jun Jul Aug Sep Oct Nov Dec Jan Feb Mar
% Responses to New Tenants Satisfaction Survey
75.0%
80.0%
85.0%
90.0%
95.0%
100.0%
Apr May Jun Jul Aug Sep Oct Nov Dec Jan Feb Mar
% Respondents Satisfied with New Tenancy
Responsible ManagerHousing Services Manager
Apr May Jun Jul Aug Sep Oct Nov Dec Jan Feb Mar YTD
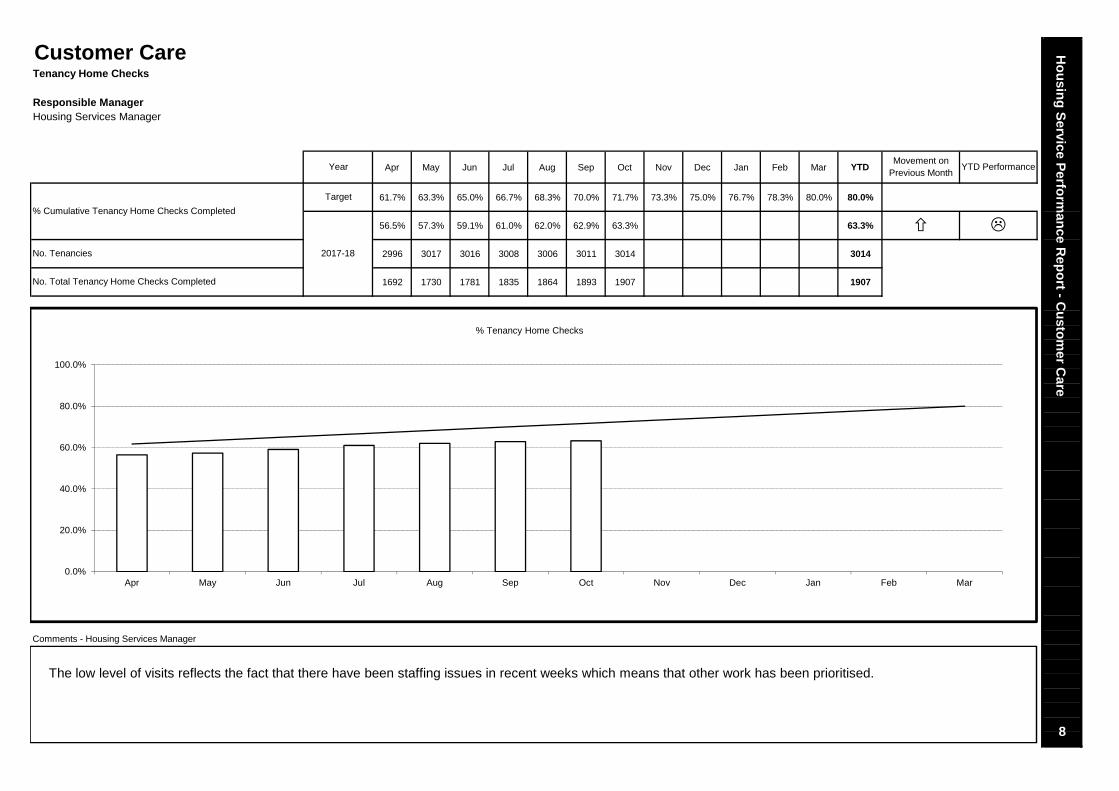
61.7% 63.3% 65.0% 66.7% 68.3% 70.0% 71.7% 73.3% 75.0% 76.7% 78.3% 80.0% 80.0%
56.5% 57.3% 59.1% 61.0% 62.0% 62.9% 63.3% 63.3%
2996 3017 3016 3008 3006 3011 3014 3014
1692 1730 1781 1835 1864 1893 1907 1907
Comments - Housing Services Manager
8
� �
No. Tenancies
No. Total Tenancy Home Checks Completed
2017-18
Customer Care Ho
usin
g S
ervice Perfo
rman
ce Rep
ort - C
usto
mer C
areTenancy Home Checks
YearMovement on
Previous MonthYTD Performance
% Cumulative Tenancy Home Checks Completed
Target
The low level of visits reflects the fact that there have been staffing issues in recent weeks which means that other work has been prioritised.
0.0%
20.0%
40.0%
60.0%
80.0%
100.0%
Apr May Jun Jul Aug Sep Oct Nov Dec Jan Feb Mar
% Tenancy Home Checks
Responsible ManagerRepairs Manager
Target Apr May Jun Jul Aug Sep Oct Nov Dec Jan Feb Mar YTD
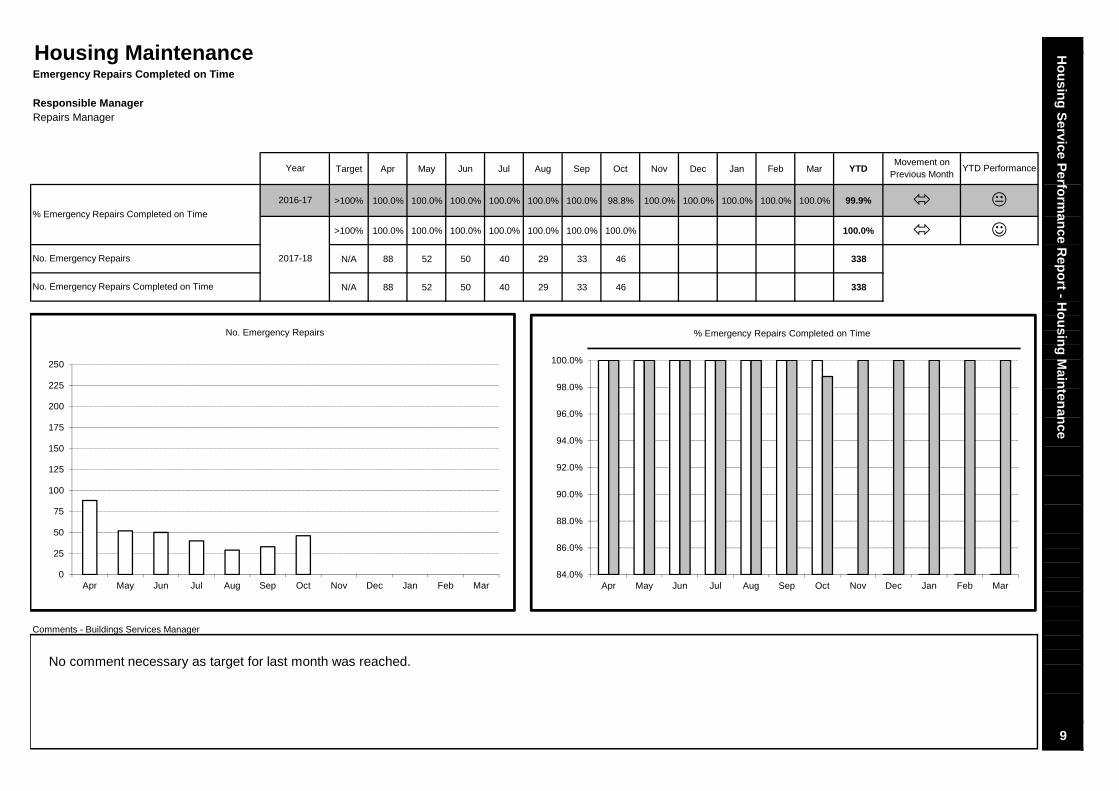
>100% 100.0% 100.0% 100.0% 100.0% 100.0% 100.0% 98.8% 100.0% 100.0% 100.0% 100.0% 100.0% 99.9%
>100% 100.0% 100.0% 100.0% 100.0% 100.0% 100.0% 100.0% 100.0%
N/A 88 52 50 40 29 33 46 338
N/A 88 52 50 40 29 33 46 338
Comments - Buildings Services Manager
Housing MaintenanceEmergency Repairs Completed on Time
�
Year
2016-17
% Emergency Repairs Completed on Time
2017-18No. Emergency Repairs
9
�
Ho
usin
g S
ervice Perfo
rman
ce Rep
ort - H
ou
sing
Main
tenan
ce
No. Emergency Repairs Completed on Time
YTD Performance
☺
Movement on Previous Month
�
No comment necessary as target for last month was reached.
84.0%
86.0%
88.0%
90.0%
92.0%
94.0%
96.0%
98.0%
100.0%
Apr May Jun Jul Aug Sep Oct Nov Dec Jan Feb Mar
% Emergency Repairs Completed on Time
0
25
50
75
100
125
150
175
200
225
250
Apr May Jun Jul Aug Sep Oct Nov Dec Jan Feb Mar
No. Emergency Repairs
Responsible Manager
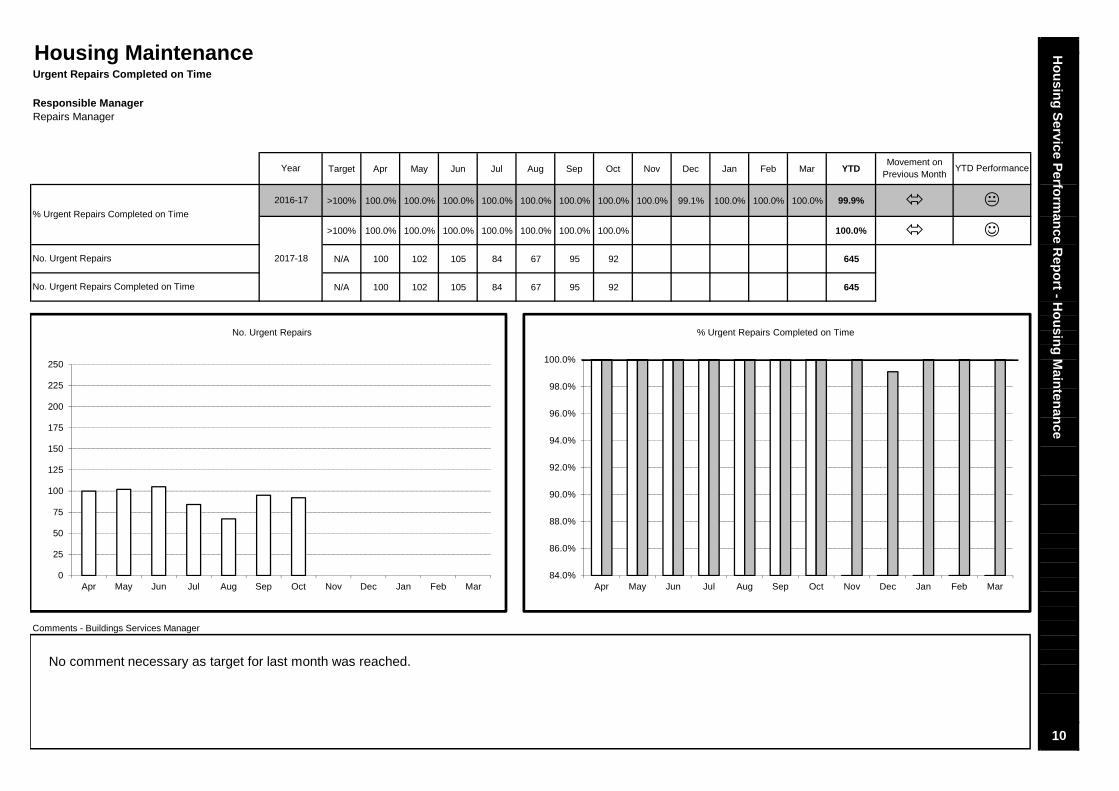
Target Apr May Jun Jul Aug Sep Oct Nov Dec Jan Feb Mar YTD
>100% 100.0% 100.0% 100.0% 100.0% 100.0% 100.0% 100.0% 100.0% 99.1% 100.0% 100.0% 100.0% 99.9%
>100% 100.0% 100.0% 100.0% 100.0% 100.0% 100.0% 100.0% 100.0%
N/A 100 102 105 84 67 95 92 645
N/A 100 102 105 84 67 95 92 645
10
YTD Performance
☺
Ho
usin
g S
ervice Perfo
rman
ce Rep
ort - H
ou
sing
Main
tenan
ce
Comments - Buildings Services Manager
�
Movement on Previous Month
�
�
No. Urgent Repairs Completed on Time
% Urgent Repairs Completed on Time
No. Urgent Repairs
Housing MaintenanceUrgent Repairs Completed on Time
2017-18
Year
2016-17
Repairs Manager
No comment necessary as target for last month was reached.
84.0%
86.0%
88.0%
90.0%
92.0%
94.0%
96.0%
98.0%
100.0%
Apr May Jun Jul Aug Sep Oct Nov Dec Jan Feb Mar
% Urgent Repairs Completed on Time
0
25
50
75
100
125
150
175
200
225
250
Apr May Jun Jul Aug Sep Oct Nov Dec Jan Feb Mar
No. Urgent Repairs

Responsible Manager
Target Apr May Jun Jul Aug Sep Oct Nov Dec Jan Feb Mar YTD
>100% 99.7% 100.0% 100.0% 99.4% 100.0% 99.7% 99.3% 99.7% 100.0% 100.0% 100.0% 99.5% 99.8%
>100% 100.0% 100.0% 100.0% 100.0% 100.0% 100.0% 100.0% 100.0%
N/A 307 313 327 350 262 279 278 2116
N/A 307 313 327 350 262 279 278 2116
Year YTD Performance
�
Comments - Buildings Services Manager
Routine Repairs Completed on Time
Repairs Manager
No. Routine Repairs Completed on Time
% Routine Repairs Completed on Time
2016-17
☺
2017-18No. Routine Repairs
11
Movement on Previous Month
Ho
usin
g S
ervice Perfo
rman
ce Rep
ort - H
ou
sing
Main
tenan
ce
�
�
Housing Maintenance
No comment necessary as target for last month was reached.
84.0%
86.0%
88.0%
90.0%
92.0%
94.0%
96.0%
98.0%
100.0%
Apr May Jun Jul Aug Sep Oct Nov Dec Jan Feb Mar
% Routine Repairs Completed on Time
0
100
200
300
400
500
600
Apr May Jun Jul Aug Sep Oct Nov Dec Jan Feb Mar
No. Routine Repairs
Responsible Manager
Target Apr May Jun Jul Aug Sep Oct Nov Dec Jan Feb Mar YTD
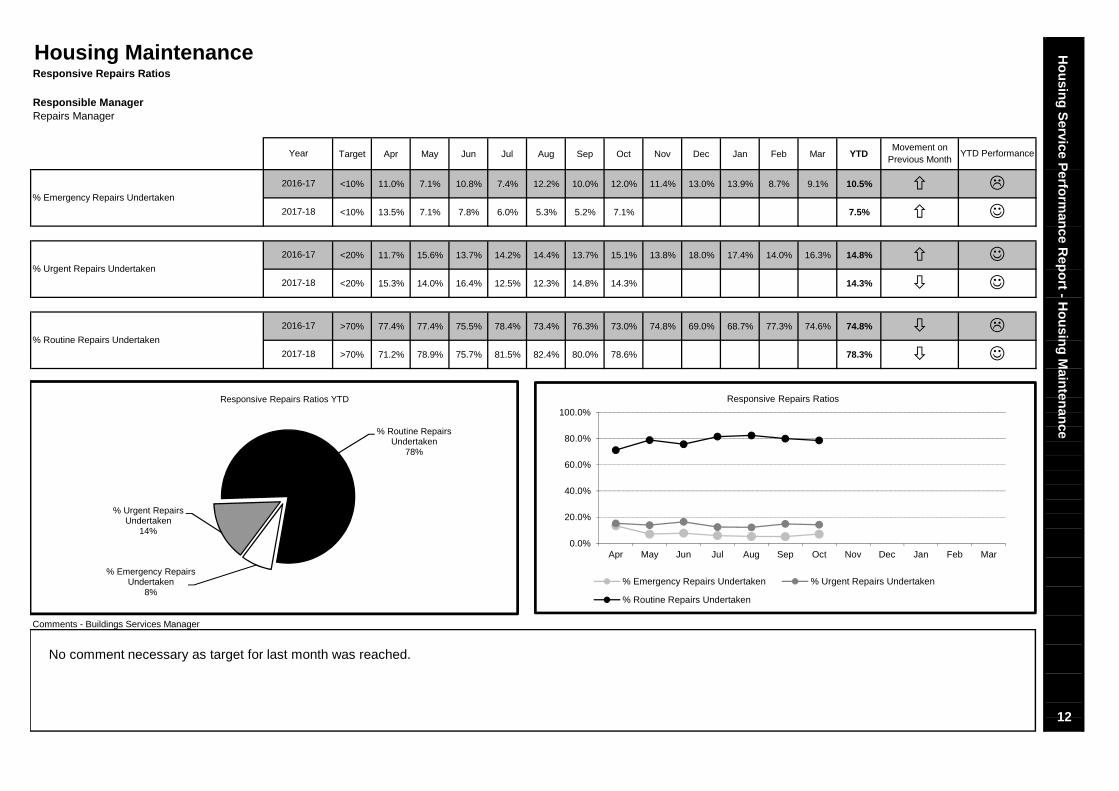
<10% 11.0% 7.1% 10.8% 7.4% 12.2% 10.0% 12.0% 11.4% 13.0% 13.9% 8.7% 9.1% 10.5%
<10% 13.5% 7.1% 7.8% 6.0% 5.3% 5.2% 7.1% 7.5%
<20% 11.7% 15.6% 13.7% 14.2% 14.4% 13.7% 15.1% 13.8% 18.0% 17.4% 14.0% 16.3% 14.8%
<20% 15.3% 14.0% 16.4% 12.5% 12.3% 14.8% 14.3% 14.3%
>70% 77.4% 77.4% 75.5% 78.4% 73.4% 76.3% 73.0% 74.8% 69.0% 68.7% 77.3% 74.6% 74.8%
>70% 71.2% 78.9% 75.7% 81.5% 82.4% 80.0% 78.6% 78.3%
YTD Performance
☺
☺�
☺
☺
Comments - Buildings Services Manager
% Routine Repairs Undertaken
2017-18
�
% Emergency Repairs Undertaken
�
�
% Urgent Repairs Undertaken
2016-17
Housing Maintenance
2016-17
Repairs Manager
2016-17
Responsive Repairs Ratios
2017-18
2017-18
12
Year
�
�
�
Ho
usin
g S
ervice Perfo
rman
ce Rep
ort - H
ou
sing
Main
tenan
ce
�
Movement on Previous Month
No comment necessary as target for last month was reached.
% Emergency Repairs Undertaken
8%
% Urgent Repairs Undertaken
14%
% Routine Repairs Undertaken
78%
Responsive Repairs Ratios YTD
0.0%
20.0%
40.0%
60.0%
80.0%
100.0%
Apr May Jun Jul Aug Sep Oct Nov Dec Jan Feb Mar
Responsive Repairs Ratios
% Emergency Repairs Undertaken % Urgent Repairs Undertaken
% Routine Repairs Undertaken

Responsible Manager
Target Apr May Jun Jul Aug Sep Oct Nov Dec Jan Feb Mar YTD
>100% 100.0% 100.0% 100.0% 100.0% 100.0% 100.0% 100.0% 100.0% 100.0% 100.0% 100.0% 100.0% 99.6%
>100% 100.0% 100.0% 100.0% 100.0% 100.0% 100.0% 100.0% 100.0%
N/A 23 30 27 22 17 19 17 155
N/A 23 30 27 22 17 19 17 155
13
Ho
usin
g S
ervice Perfo
rman
ce Rep
ort - H
ou
sing
Main
tenan
ce
� �
� ☺
Movement on Previous Month
YTD Performance
Comments - Buildings Services Manager
Repairs Manager
Year
2016-17
No. Aids and Adaptations
No. Aids and Adaptations Completed on Time
% Minor Aids and Adaptations Completed on Time
2017-18
Housing MaintenanceAids and Adaptations
No comment necessary as target for last month was reached.
60.0%
65.0%
70.0%
75.0%
80.0%
85.0%
90.0%
95.0%
100.0%
Apr May Jun Jul Aug Sep Oct Nov Dec Jan Feb Mar
% Minor Aids and Adaptations Completed on Time
0
10
20
30
40
50
60
70
Apr May Jun Jul Aug Sep Oct Nov Dec Jan Feb Mar
No. Aids and Adaptations
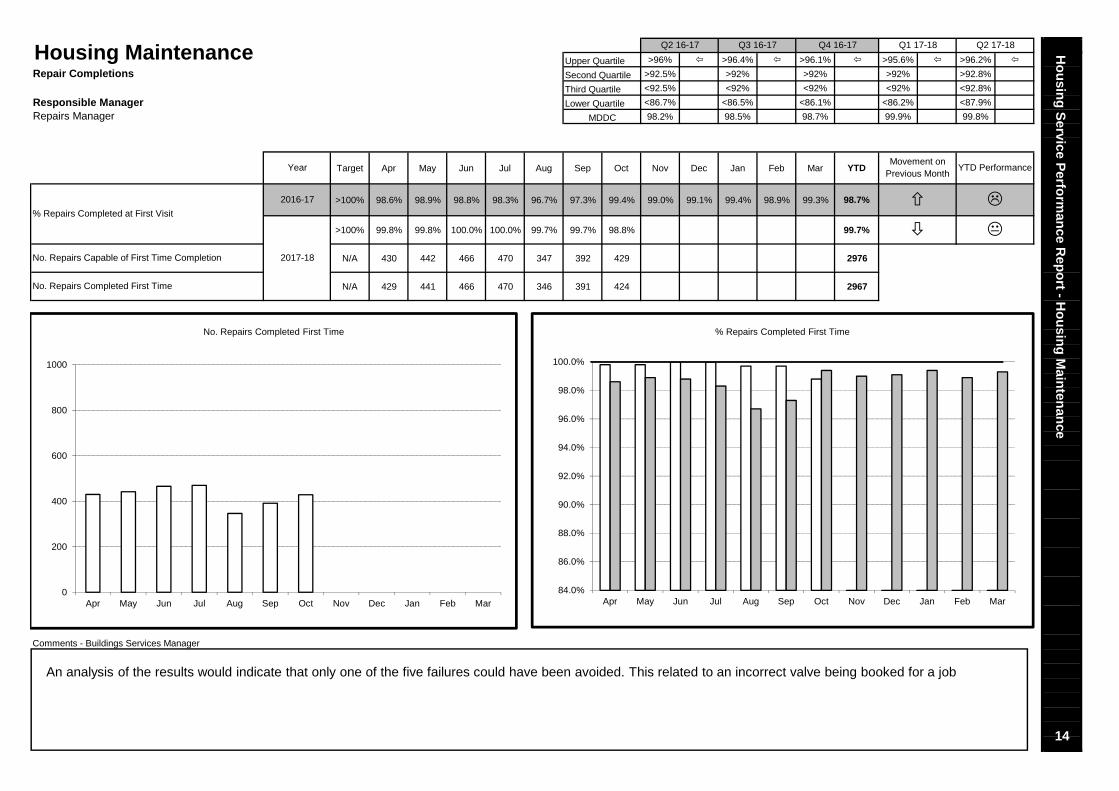
Upper Quartile >96% >96.4% >96.1% >95.6% >96.2%
Second Quartile >92.5% >92% >92% >92% >92.8%
Third Quartile <92.5% <92% <92% <92% <92.8%
Responsible Manager Lower Quartile <86.7% <86.5% <86.1% <86.2% <87.9%
98.2% 98.5% 98.7% 99.9% 99.8%
Target Apr May Jun Jul Aug Sep Oct Nov Dec Jan Feb Mar YTD
>100% 98.6% 98.9% 98.8% 98.3% 96.7% 97.3% 99.4% 99.0% 99.1% 99.4% 98.9% 99.3% 98.7%
>100% 99.8% 99.8% 100.0% 100.0% 99.7% 99.7% 98.8% 99.7%
N/A 430 442 466 470 347 392 429 2976
N/A 429 441 466 470 346 391 424 2967
Housing Maintenance
Comments - Buildings Services Manager
2017-18No. Repairs Capable of First Time Completion
No. Repairs Completed First Time
Year
2016-17
% Repairs Completed at First Visit
Repair Completions
Repairs Manager
14
� �
Ho
usin
g S
ervice Perfo
rman
ce Rep
ort - H
ou
sing
Main
tenan
ce
Movement on Previous Month
YTD Performance
��
Q2 17-18Q4 16-17 Q1 17-18Q2 16-17 Q3 16-17
MDDC
An analysis of the results would indicate that only one of the five failures could have been avoided. This related to an incorrect valve being booked for a job
84.0%
86.0%
88.0%
90.0%
92.0%
94.0%
96.0%
98.0%
100.0%
Apr May Jun Jul Aug Sep Oct Nov Dec Jan Feb Mar
% Repairs Completed First Time
0
200
400
600
800
1000
Apr May Jun Jul Aug Sep Oct Nov Dec Jan Feb Mar
No. Repairs Completed First Time
Responsible Manager
Target Apr May Jun Jul Aug Sep Oct Nov Dec Jan Feb Mar YTD
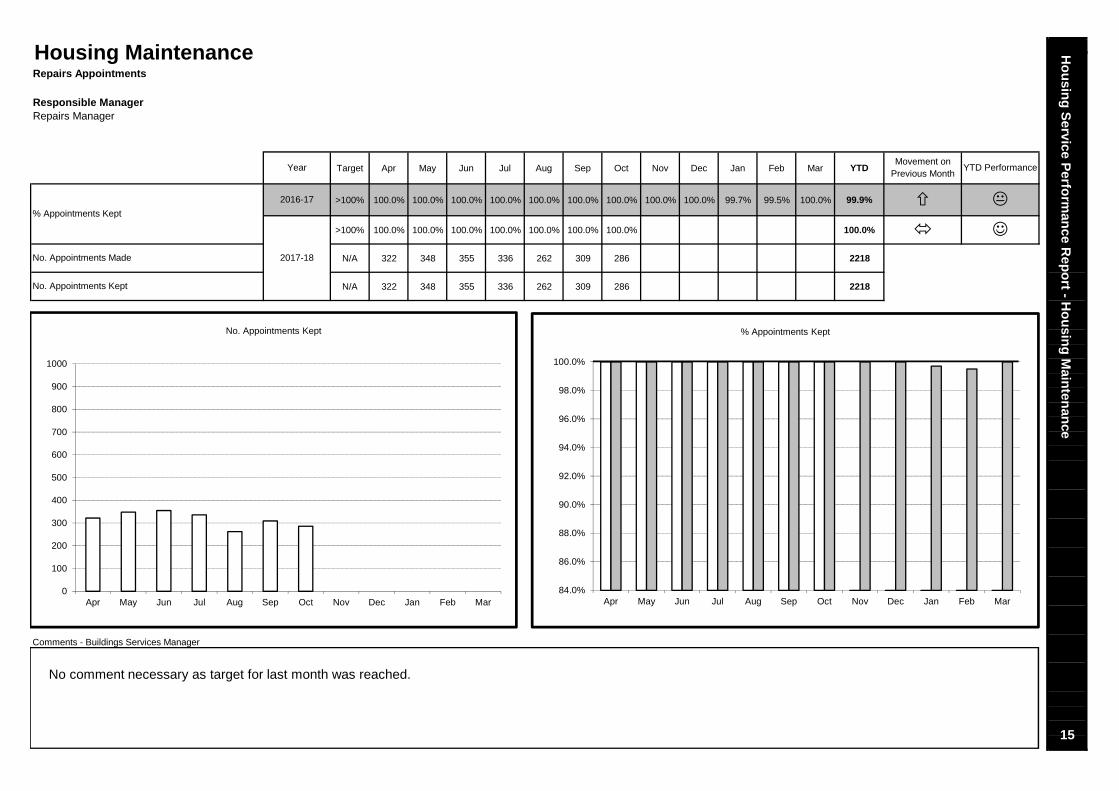
>100% 100.0% 100.0% 100.0% 100.0% 100.0% 100.0% 100.0% 100.0% 100.0% 99.7% 99.5% 100.0% 99.9%
>100% 100.0% 100.0% 100.0% 100.0% 100.0% 100.0% 100.0% 100.0%
N/A 322 348 355 336 262 309 286 2218
N/A 322 348 355 336 262 309 286 2218
Housing Maintenance
YTD PerformanceMovement on
Previous Month
��
Comments - Buildings Services Manager
% Appointments Kept
No. Appointments Made
Year
2016-17
Repairs Appointments
Repairs Manager
15
Ho
usin
g S
ervice Perfo
rman
ce Rep
ort - H
ou
sing
Main
tenan
ce
� ☺
No. Appointments Kept
2017-18
No comment necessary as target for last month was reached.
84.0%
86.0%
88.0%
90.0%
92.0%
94.0%
96.0%
98.0%
100.0%
Apr May Jun Jul Aug Sep Oct Nov Dec Jan Feb Mar
% Appointments Kept
0
100
200
300
400
500
600
700
800
900
1000
Apr May Jun Jul Aug Sep Oct Nov Dec Jan Feb Mar
No. Appointments Kept
Responsible ManagerRepairs Manager
Year Target Apr May Jun Jul Aug Sep Oct Nov Dec Jan Feb Mar YTD
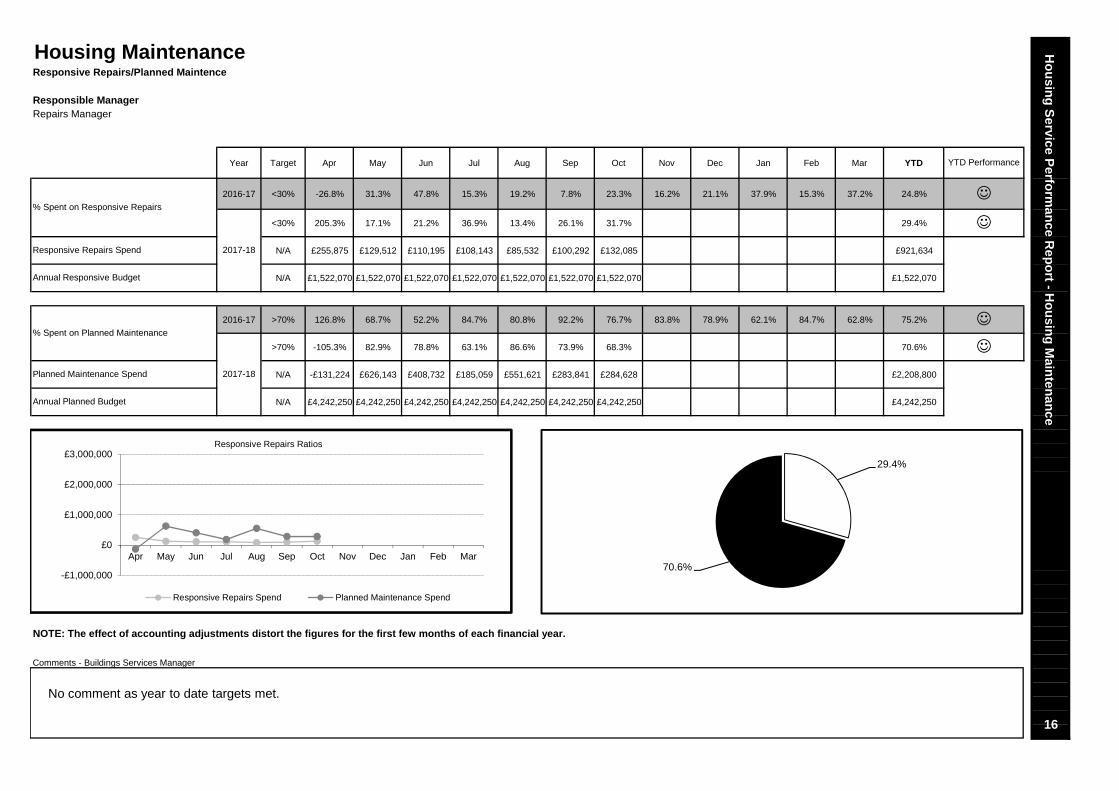
2016-17 <30% -26.8% 31.3% 47.8% 15.3% 19.2% 7.8% 23.3% 16.2% 21.1% 37.9% 15.3% 37.2% 24.8%
<30% 205.3% 17.1% 21.2% 36.9% 13.4% 26.1% 31.7% 29.4%
N/A £255,875 £129,512 £110,195 £108,143 £85,532 £100,292 £132,085 £921,634
N/A £1,522,070 £1,522,070 £1,522,070 £1,522,070 £1,522,070 £1,522,070 £1,522,070 £1,522,070
2016-17 >70% 126.8% 68.7% 52.2% 84.7% 80.8% 92.2% 76.7% 83.8% 78.9% 62.1% 84.7% 62.8% 75.2%
>70% -105.3% 82.9% 78.8% 63.1% 86.6% 73.9% 68.3% 70.6%
N/A -£131,224 £626,143 £408,732 £185,059 £551,621 £283,841 £284,628 £2,208,800
N/A £4,242,250 £4,242,250 £4,242,250 £4,242,250 £4,242,250 £4,242,250 £4,242,250 £4,242,250
NOTE: The effect of accounting adjustments distort the figures for the first few months of each financial year.
16
☺
Responsive Repairs Spend
☺
☺
2017-18
Annual Responsive Budget
2017-18
Annual Planned Budget
Housing Maintenance Ho
usin
g S
ervice Perfo
rman
ce Rep
ort - H
ou
sing
Main
tenan
ceResponsive Repairs/Planned Maintence
YTD Performance
% Spent on Responsive Repairs☺
Comments - Buildings Services Manager
Planned Maintenance Spend
% Spent on Planned Maintenance
No comment as year to date targets met.
-£1,000,000
£0
£1,000,000
£2,000,000
£3,000,000
Apr May Jun Jul Aug Sep Oct Nov Dec Jan Feb Mar
Responsive Repairs Ratios
Responsive Repairs Spend Planned Maintenance Spend
29.4%
70.6%
Responsible ManagerBuilding Surveyor
Target Apr May Jun Jul Aug Sep Oct Nov Dec Jan Feb Mar YTD
>100% 99.9% 100.0% 100.0% 100.0% 100.0% 100.0% 100.0% 100.0% 100.0% 100.0% 100.0% 100.0% 100.0%
>100% 99.9% 99.9% 100.0% 99.9% 100.0% 100.0% 100.0% 100.0%
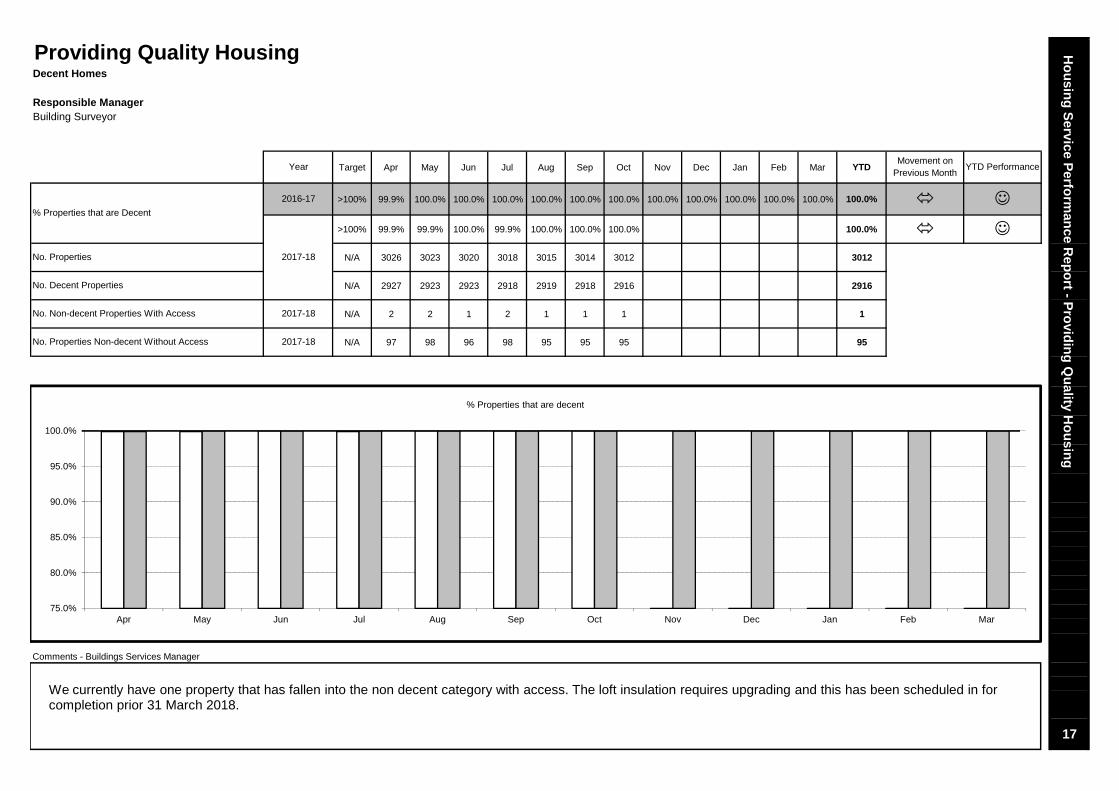
N/A 3026 3023 3020 3018 3015 3014 3012 3012
N/A 2927 2923 2923 2918 2919 2918 2916 2916
N/A 2 2 1 2 1 1 1 1
N/A 97 98 96 98 95 95 95 95No. Properties Non-decent Without Access
2016-17
Decent Homes
�
No. Decent Properties
17
� ☺
2017-18
Ho
usin
g S
ervice Perfo
rman
ce Rep
ort - P
rovid
ing
Qu
ality Ho
usin
g
Movement on Previous Month
☺
Year YTD Performance
Providing Quality Housing
No. Properties
Comments - Buildings Services Manager
2017-18
No. Non-decent Properties With Access 2017-18
% Properties that are Decent
We currently have one property that has fallen into the non decent category with access. The loft insulation requires upgrading and this has been scheduled in for completion prior 31 March 2018.
75.0%
80.0%
85.0%
90.0%
95.0%
100.0%
Apr May Jun Jul Aug Sep Oct Nov Dec Jan Feb Mar
% Properties that are decent
Upper Quartile <100% <100% <100%
Second Quartile <100% <100% <100%
Third Quartile <99.9% <99.9% <99.9%
Responsible Manager Lower Quartile <99.9% <99.9% <99.9%
Gas Database Administrator MDDC 286 294 245
Target Apr May Jun Jul Aug Sep Oct Nov Dec Jan Feb Mar YTD
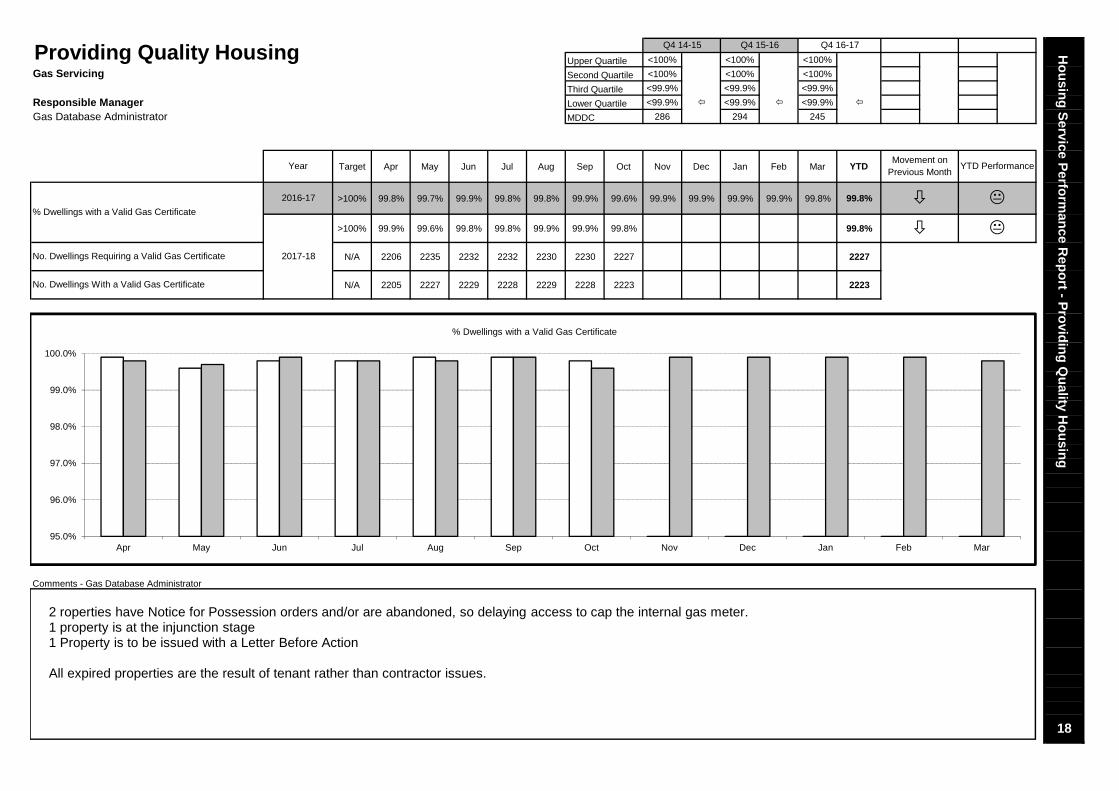
>100% 99.8% 99.7% 99.9% 99.8% 99.8% 99.9% 99.6% 99.9% 99.9% 99.9% 99.9% 99.8% 99.8%
>100% 99.9% 99.6% 99.8% 99.8% 99.9% 99.9% 99.8% 99.8%
N/A 2206 2235 2232 2232 2230 2230 2227 2227
N/A 2205 2227 2229 2228 2229 2228 2223 2223
Ho
usin
g S
ervice Perfo
rman
ce Rep
ort - P
rovid
ing
Qu
ality Ho
usin
g
18
Gas Servicing
Movement on Previous Month
YTD Performance
� �
��
Providing Quality Housing
2016-17
Comments - Gas Database Administrator
% Dwellings with a Valid Gas Certificate
No. Dwellings Requiring a Valid Gas Certificate
No. Dwellings With a Valid Gas Certificate
2017-18
Q4 14-15 Q4 15-16 Q4 16-17
Year
2 roperties have Notice for Possession orders and/or are abandoned, so delaying access to cap the internal gas meter.1 property is at the injunction stage1 Property is to be issued with a Letter Before Action
All expired properties are the result of tenant rather than contractor issues.
95.0%
96.0%
97.0%
98.0%
99.0%
100.0%
Apr May Jun Jul Aug Sep Oct Nov Dec Jan Feb Mar
% Dwellings with a Valid Gas Certificate
Upper Quartile <20 <18.99 <18.16 <18.6 <18.96
Second Quartile <25.5 <25.32 <24.24 <24.84 <24.47
Third Quartile >25.5 >25.32 >24.24 >24.84 >24.47
Responsible Manager Lower Quartile >34.13 >34 >34.05 >36.05 >34.62
Allocations Team Leader/Repairs Manager MDDC 17.01 16.15 15.50 16.13 16.60
Target Apr May Jun Jul Aug Sep Oct Nov Dec Jan Feb Mar YTD
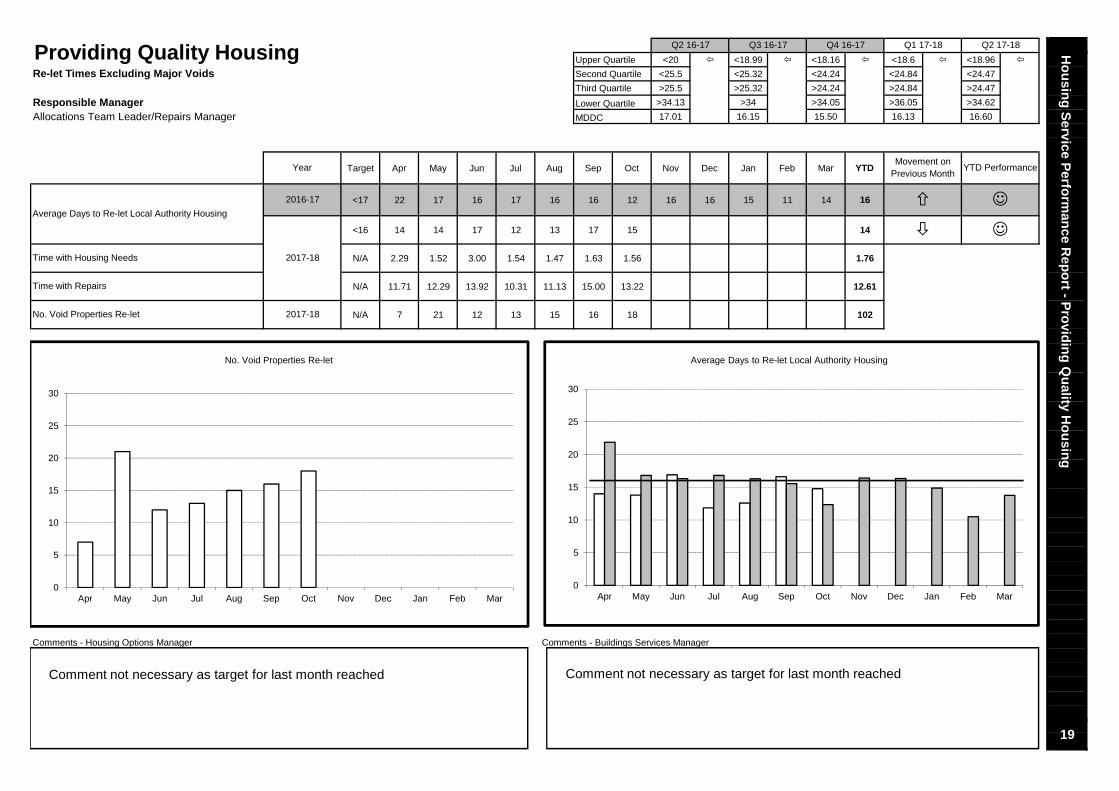
<17 22 17 16 17 16 16 12 16 16 15 11 14 16
<16 14 14 17 12 13 17 15 14
N/A 2.29 1.52 3.00 1.54 1.47 1.63 1.56 1.76
N/A 11.71 12.29 13.92 10.31 11.13 15.00 13.22 12.61
N/A 7 21 12 13 15 16 18 102
☺
YTD Performance
�
2017-18No. Void Properties Re-let
2017-18
�
Time with Housing Needs
Time with Repairs
☺
Comments - Buildings Services Manager
Year
Q4 16-17 Q1 17-18Q2 16-17 Q3 16-17 Ho
usin
g S
ervice Perfo
rman
ce Rep
ort - P
rovid
ing
Qu
ality Ho
usin
g
19
Movement on Previous Month
Comments - Housing Options Manager
Providing Quality HousingRe-let Times Excluding Major Voids
Average Days to Re-let Local Authority Housing
2016-17
Q2 17-18
Comment not necessary as target for last month reached
0
5
10
15
20
25
30
Apr May Jun Jul Aug Sep Oct Nov Dec Jan Feb Mar
Average Days to Re-let Local Authority Housing
0
5
10
15
20
25
30
Apr May Jun Jul Aug Sep Oct Nov Dec Jan Feb Mar
No. Void Properties Re-let
Comment not necessary as target for last month reached
Major Voids
Responsible ManagerRepairs Manager
Target Apr May Jun Jul Aug Sep Oct Nov Dec Jan Feb Mar YTD
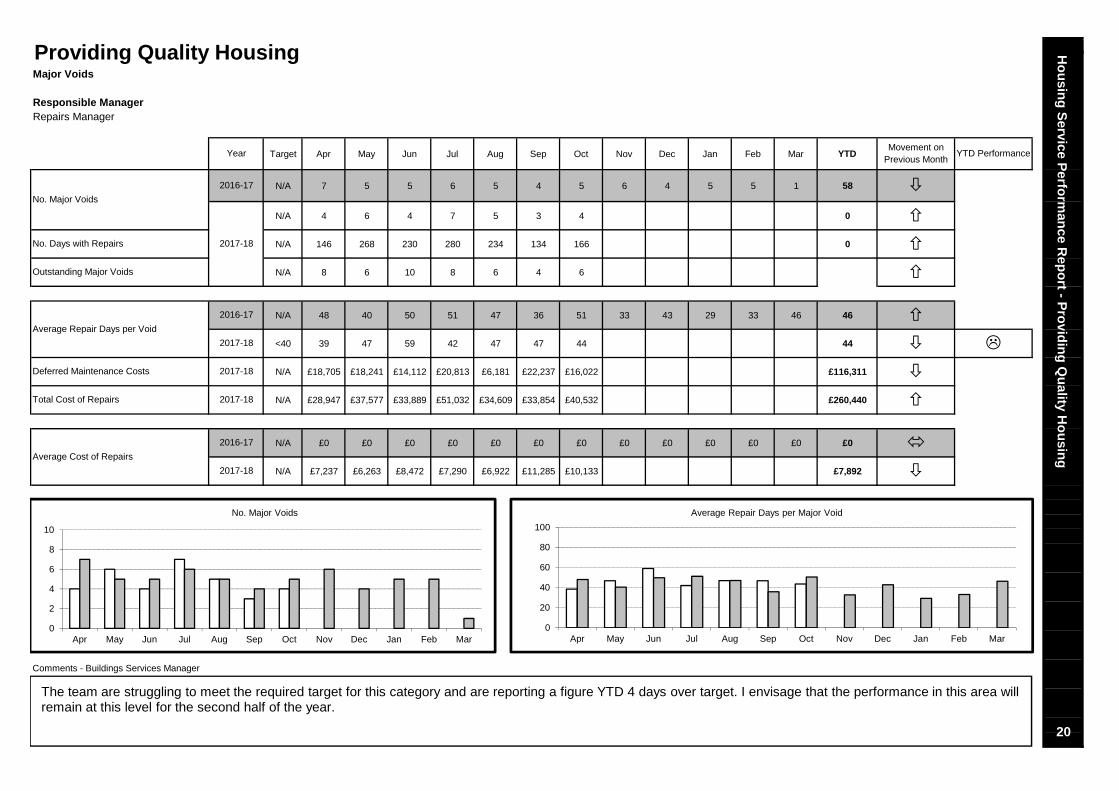
N/A 7 5 5 6 5 4 5 6 4 5 5 1 58
N/A 4 6 4 7 5 3 4 0
N/A 146 268 230 280 234 134 166 0
N/A 8 6 10 8 6 4 6
N/A 48 40 50 51 47 36 51 33 43 29 33 46 46
<40 39 47 59 42 47 47 44 44
N/A £18,705 £18,241 £14,112 £20,813 £6,181 £22,237 £16,022 £116,311
N/A £28,947 £37,577 £33,889 £51,032 £34,609 £33,854 £40,532 £260,440
N/A £0 £0 £0 £0 £0 £0 £0 £0 £0 £0 £0 £0 £0
N/A £7,237 £6,263 £8,472 £7,290 £6,922 £11,285 £10,133 £7,892
20
�
�
Movement on Previous Month
�
Ho
usin
g S
ervice Perfo
rman
ce Rep
ort - P
rovid
ing
Qu
ality Ho
usin
g
�
Providing Quality Housing
Year
�
�
2017-18
YTD Performance
�
Deferred Maintenance Costs
Comments - Buildings Services Manager
No. Days with Repairs
Average Repair Days per Void
Total Cost of Repairs
�
No. Major Voids
2017-18
Average Cost of Repairs
Outstanding Major Voids
2016-17
2016-17
�
2017-18
�
2017-18
2016-17
�2017-18
The team are struggling to meet the required target for this category and are reporting a figure YTD 4 days over target. I envisage that the performance in this area will remain at this level for the second half of the year.
0
2
4
6
8
10
Apr May Jun Jul Aug Sep Oct Nov Dec Jan Feb Mar
No. Major Voids
0
20
40
60
80
100
Apr May Jun Jul Aug Sep Oct Nov Dec Jan Feb Mar
Average Repair Days per Major Void
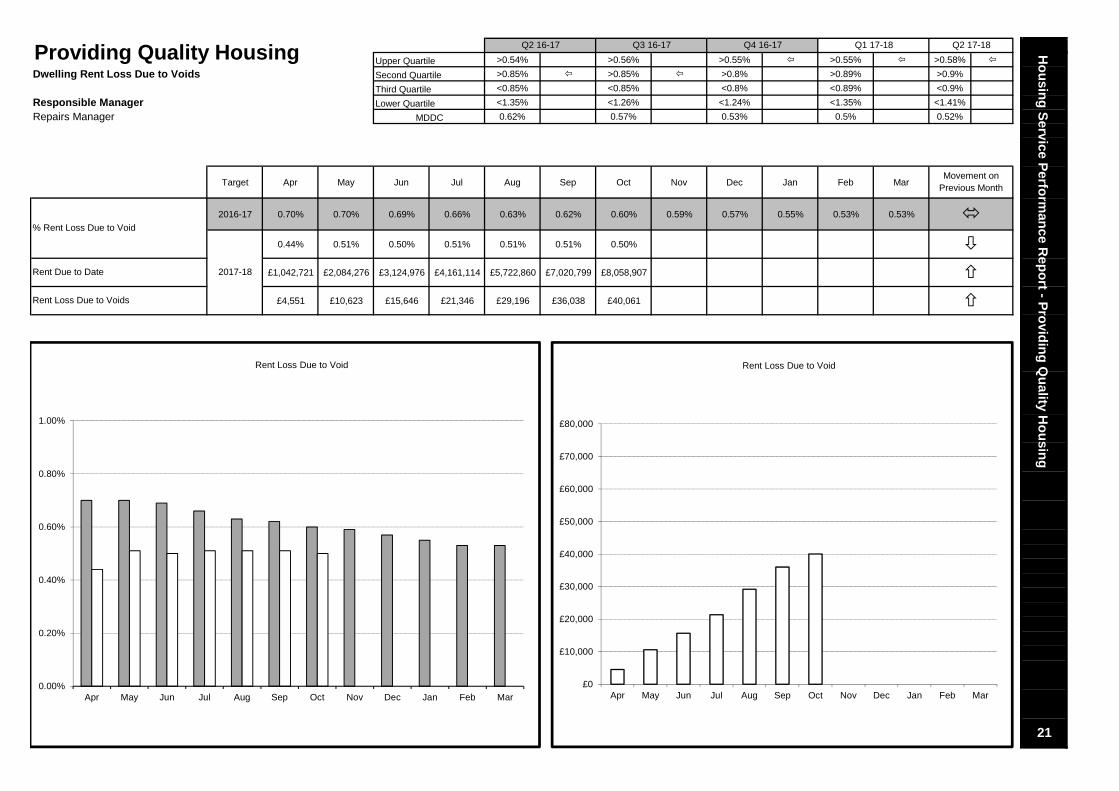
Upper Quartile >0.54% >0.56% >0.55% >0.55% >0.58%
Dwelling Rent Loss Due to Voids Second Quartile >0.85% >0.85% >0.8% >0.89% >0.9%
Third Quartile <0.85% <0.85% <0.8% <0.89% <0.9%
Responsible Manager Lower Quartile <1.35% <1.26% <1.24% <1.35% <1.41%
Repairs Manager 0.62% 0.57% 0.53% 0.5% 0.52%
Target Apr May Jun Jul Aug Sep Oct Nov Dec Jan Feb Mar
2016-17 0.70% 0.70% 0.69% 0.66% 0.63% 0.62% 0.60% 0.59% 0.57% 0.55% 0.53% 0.53%
0.44% 0.51% 0.50% 0.51% 0.51% 0.51% 0.50%
£1,042,721 £2,084,276 £3,124,976 £4,161,114 £5,722,860 £7,020,799 £8,058,907
£4,551 £10,623 £15,646 £21,346 £29,196 £36,038 £40,061
Providing Quality Housing
21
�
�
�
2017-18
% Rent Loss Due to Void
Rent Due to Date
Rent Loss Due to Voids
MDDC
Ho
usin
g S
ervice Perfo
rman
ce Rep
ort - P
rovid
ing
Qu
ality Ho
usin
g
Movement on Previous Month
Q2 16-17 Q3 16-17 Q4 16-17 Q1 17-18 Q2 17-18
�
£0
£10,000
£20,000
£30,000
£40,000
£50,000
£60,000
£70,000
£80,000
Apr May Jun Jul Aug Sep Oct Nov Dec Jan Feb Mar
Rent Loss Due to Void
0.00%
0.20%
0.40%
0.60%
0.80%
1.00%
Apr May Jun Jul Aug Sep Oct Nov Dec Jan Feb Mar
Rent Loss Due to Void
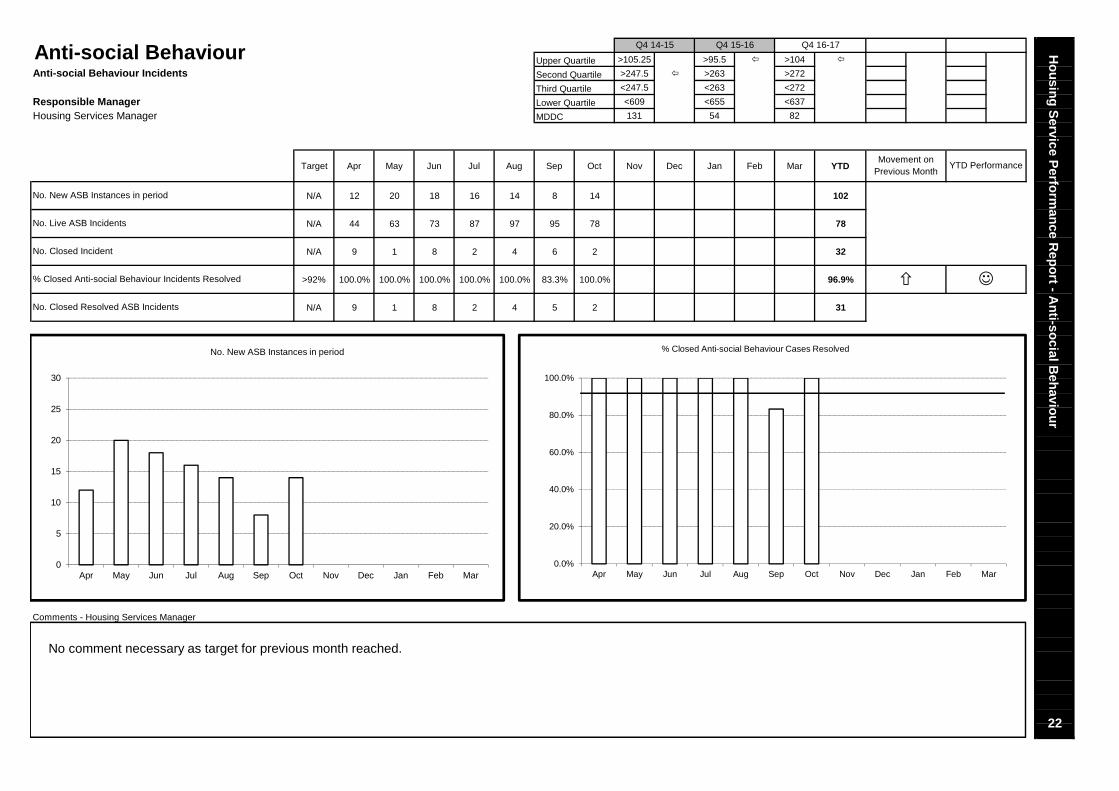
Upper Quartile >105.25 >95.5 >104
Second Quartile >247.5 >263 >272
Third Quartile <247.5 <263 <272
Responsible Manager Lower Quartile <609 <655 <637
Housing Services Manager MDDC 131 54 82
Target Apr May Jun Jul Aug Sep Oct Nov Dec Jan Feb Mar YTD
N/A 12 20 18 16 14 8 14 102
N/A 44 63 73 87 97 95 78 78
N/A 9 1 8 2 4 6 2 32
>92% 100.0% 100.0% 100.0% 100.0% 100.0% 83.3% 100.0% 96.9%
N/A 9 1 8 2 4 5 2 31
Comments - Housing Services Manager
No. Closed Resolved ASB Incidents
22
Anti-social Behaviour Ho
usin
g S
ervice Perfo
rman
ce Rep
ort - A
nti-so
cial Beh
aviou
rAnti-social Behaviour Incidents
Movement on Previous Month
Q4 16-17
YTD Performance
Q4 14-15 Q4 15-16
☺
No. New ASB Instances in period
No. Live ASB Incidents
No. Closed Incident
% Closed Anti-social Behaviour Incidents Resolved �
No comment necessary as target for previous month reached.
0.0%
20.0%
40.0%
60.0%
80.0%
100.0%
Apr May Jun Jul Aug Sep Oct Nov Dec Jan Feb Mar
% Closed Anti-social Behaviour Cases Resolved
0
5
10
15
20
25
30
Apr May Jun Jul Aug Sep Oct Nov Dec Jan Feb Mar
No. New ASB Instances in period
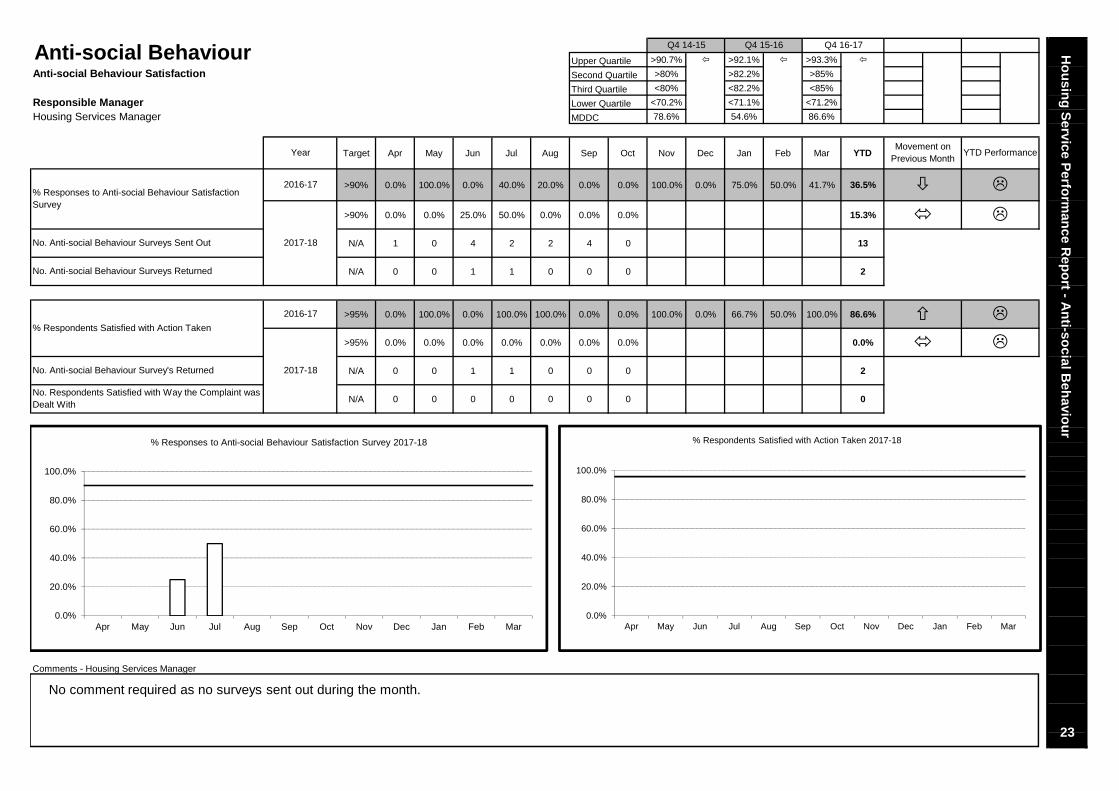
Upper Quartile >90.7% >92.1% >93.3%
Second Quartile >80% >82.2% >85%
Third Quartile <80% <82.2% <85%
Responsible Manager Lower Quartile <70.2% <71.1% <71.2%
Housing Services Manager MDDC 78.6% 54.6% 86.6%
Target Apr May Jun Jul Aug Sep Oct Nov Dec Jan Feb Mar YTD
>90% 0.0% 100.0% 0.0% 40.0% 20.0% 0.0% 0.0% 100.0% 0.0% 75.0% 50.0% 41.7% 36.5%
>90% 0.0% 0.0% 25.0% 50.0% 0.0% 0.0% 0.0% 15.3%
N/A 1 0 4 2 2 4 0 13
N/A 0 0 1 1 0 0 0 2
>95% 0.0% 100.0% 0.0% 100.0% 100.0% 0.0% 0.0% 100.0% 0.0% 66.7% 50.0% 100.0% 86.6%
>95% 0.0% 0.0% 0.0% 0.0% 0.0% 0.0% 0.0% 0.0%
N/A 0 0 1 1 0 0 0 2
N/A 0 0 0 0 0 0 0 0
Anti-social Behaviour Satisfaction
No. Anti-social Behaviour Survey's Returned
2017-18
�
Movement on Previous Month
Comments - Housing Services Manager
No. Anti-social Behaviour Surveys Sent Out
No. Anti-social Behaviour Surveys Returned
% Responses to Anti-social Behaviour Satisfaction Survey
No. Respondents Satisfied with Way the Complaint was Dealt With
�
Year
% Respondents Satisfied with Action Taken�
Q4 16-17Q4 15-16
2017-18
2016-17
2016-17
Q4 14-15
�
Anti-social Behaviour
23
� �
Ho
usin
g S
ervice Perfo
rman
ce Rep
ort - A
nti-so
cial Beh
aviou
r
YTD Performance
� �
No comment required as no surveys sent out during the month.
0.0%
20.0%
40.0%
60.0%
80.0%
100.0%
Apr May Jun Jul Aug Sep Oct Nov Dec Jan Feb Mar
% Respondents Satisfied with Action Taken 2017-18
0.0%
20.0%
40.0%
60.0%
80.0%
100.0%
Apr May Jun Jul Aug Sep Oct Nov Dec Jan Feb Mar
% Responses to Anti-social Behaviour Satisfaction Survey 2017-18
Dwelling Rent Collected as a % of Dwelling Rent Owed
Responsible ManagerHousing Services Manager
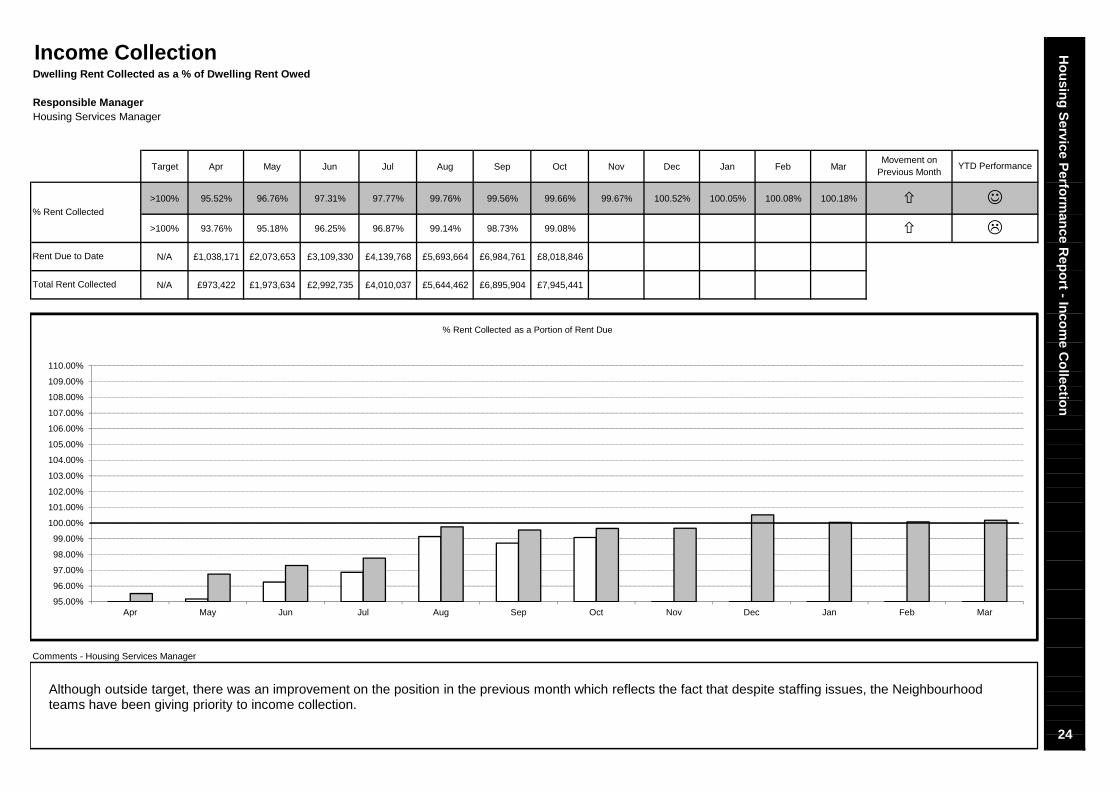
Target Apr May Jun Jul Aug Sep Oct Nov Dec Jan Feb Mar
>100% 95.52% 96.76% 97.31% 97.77% 99.76% 99.56% 99.66% 99.67% 100.52% 100.05% 100.08% 100.18%
>100% 93.76% 95.18% 96.25% 96.87% 99.14% 98.73% 99.08%
N/A £1,038,171 £2,073,653 £3,109,330 £4,139,768 £5,693,664 £6,984,761 £8,018,846
N/A £973,422 £1,973,634 £2,992,735 £4,010,037 £5,644,462 £6,895,904 £7,945,441
Ho
usin
g S
ervice Perfo
rman
ce Rep
ort - In
com
e Co
llection
24
Movement on Previous Month
YTD Performance
��
Income Collection
� ☺
Comments - Housing Services Manager
Rent Due to Date
% Rent Collected
Total Rent Collected
Although outside target, there was an improvement on the position in the previous month which reflects the fact that despite staffing issues, the Neighbourhood teams have been giving priority to income collection.
95.00%
96.00%
97.00%
98.00%
99.00%
100.00%
101.00%
102.00%
103.00%
104.00%
105.00%
106.00%
107.00%
108.00%
109.00%
110.00%
Apr May Jun Jul Aug Sep Oct Nov Dec Jan Feb Mar
% Rent Collected as a Portion of Rent Due
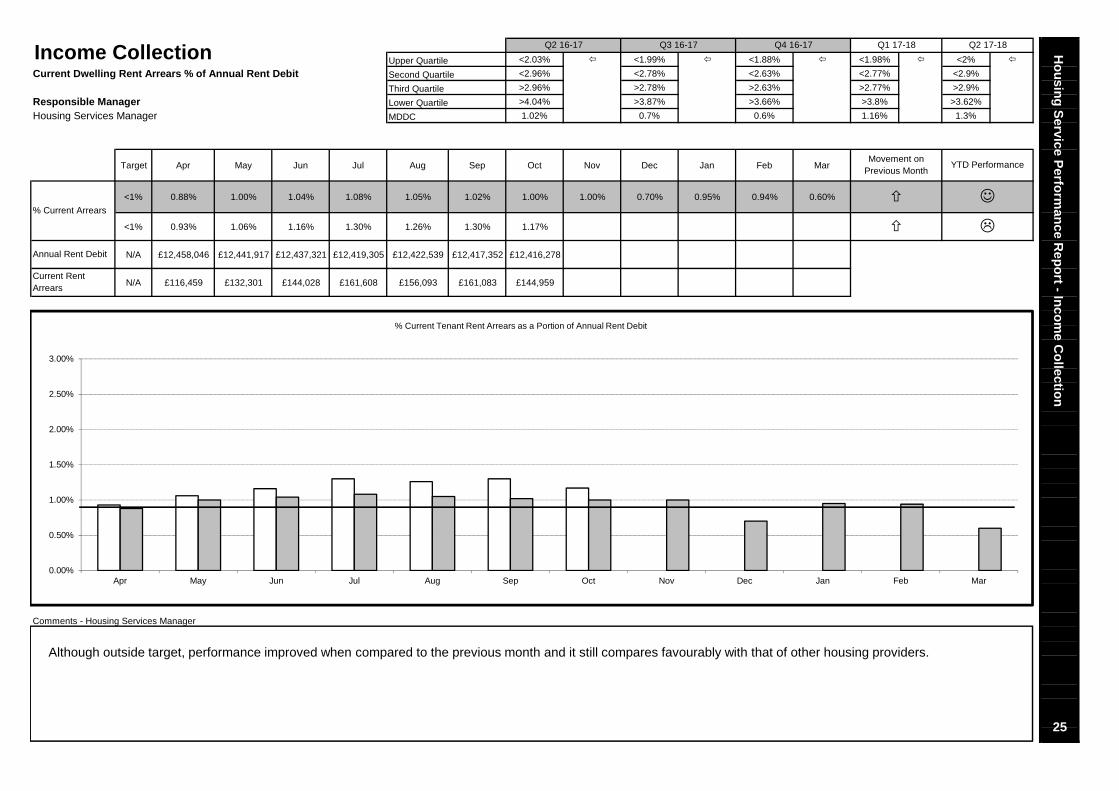
Upper Quartile <2.03% <1.99% <1.88% <1.98% <2%
Current Dwelling Rent Arrears % of Annual Rent Debit Second Quartile <2.96% <2.78% <2.63% <2.77% <2.9%
Third Quartile >2.96% >2.78% >2.63% >2.77% >2.9%
Responsible Manager Lower Quartile >4.04% >3.87% >3.66% >3.8% >3.62%
Housing Services Manager MDDC 1.02% 0.7% 0.6% 1.16% 1.3%
Target Apr May Jun Jul Aug Sep Oct Nov Dec Jan Feb Mar
<1% 0.88% 1.00% 1.04% 1.08% 1.05% 1.02% 1.00% 1.00% 0.70% 0.95% 0.94% 0.60%
<1% 0.93% 1.06% 1.16% 1.30% 1.26% 1.30% 1.17%
N/A £12,458,046 £12,441,917 £12,437,321 £12,419,305 £12,422,539 £12,417,352 £12,416,278
N/A £116,459 £132,301 £144,028 £161,608 £156,093 £161,083 £144,959
25
�
YTD Performance
Q1 17-18Q2 16-17 Q3 16-17
Movement on Previous Month
Q2 17-18
Annual Rent Debit
�
% Current Arrears
Ho
usin
g S
ervice Perfo
rman
ce Rep
ort - In
com
e Co
llection
� ☺
Comments - Housing Services Manager
Current Rent Arrears
Income Collection Q4 16-17
Although outside target, performance improved when compared to the previous month and it still compares favourably with that of other housing providers.
0.00%
0.50%
1.00%
1.50%
2.00%
2.50%
3.00%
Apr May Jun Jul Aug Sep Oct Nov Dec Jan Feb Mar
% Current Tenant Rent Arrears as a Portion of Annual Rent Debit
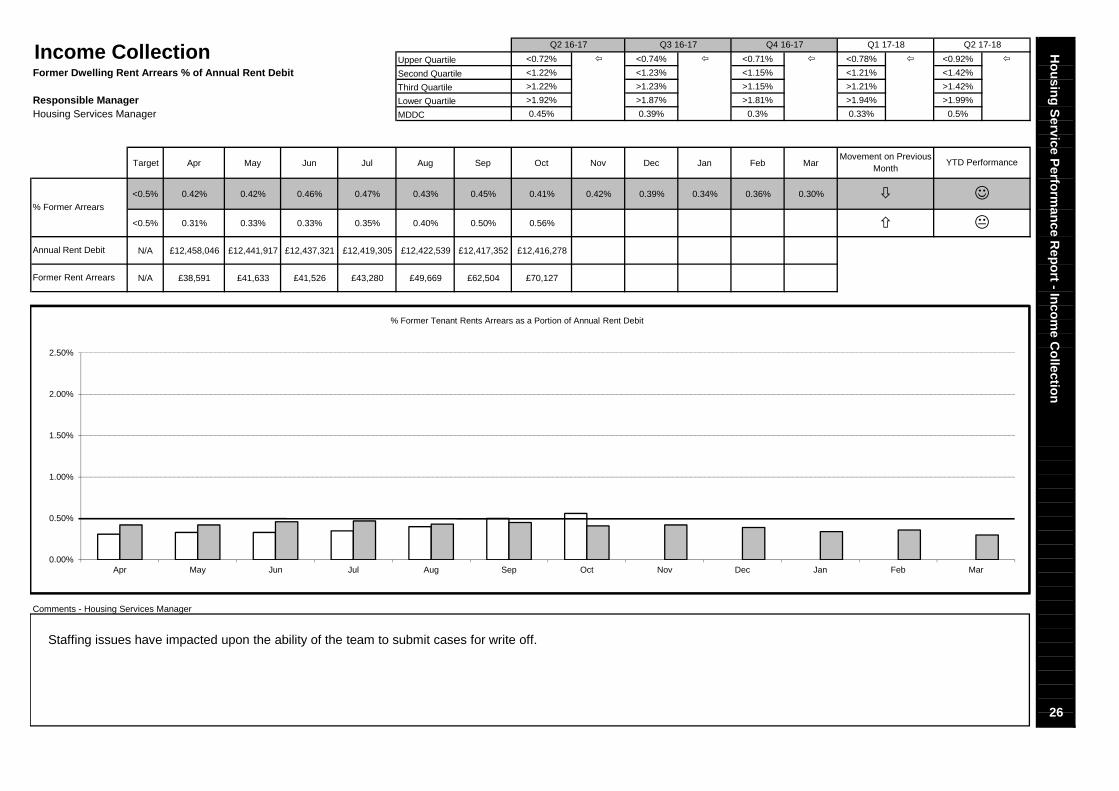
Upper Quartile <0.72% <0.74% <0.71% <0.78% <0.92%
Former Dwelling Rent Arrears % of Annual Rent Debit Second Quartile <1.22% <1.23% <1.15% <1.21% <1.42%
Third Quartile >1.22% >1.23% >1.15% >1.21% >1.42%
Responsible Manager Lower Quartile >1.92% >1.87% >1.81% >1.94% >1.99%
Housing Services Manager MDDC 0.45% 0.39% 0.3% 0.33% 0.5%
Target Apr May Jun Jul Aug Sep Oct Nov Dec Jan Feb Mar
<0.5% 0.42% 0.42% 0.46% 0.47% 0.43% 0.45% 0.41% 0.42% 0.39% 0.34% 0.36% 0.30%
<0.5% 0.31% 0.33% 0.33% 0.35% 0.40% 0.50% 0.56%
N/A £12,458,046 £12,441,917 £12,437,321 £12,419,305 £12,422,539 £12,417,352 £12,416,278
N/A £38,591 £41,633 £41,526 £43,280 £49,669 £62,504 £70,127
Q2 17-18Q4 16-17
26
�
Movement on Previous Month
YTD Performance
� ☺
Ho
usin
g S
ervice Perfo
rman
ce Rep
ort - In
com
e Co
llection
Q1 17-18Q2 16-17 Q3 16-17
Comments - Housing Services Manager
Annual Rent Debit
�
Former Rent Arrears
% Former Arrears
Income Collection
Staffing issues have impacted upon the ability of the team to submit cases for write off.
0.00%
0.50%
1.00%
1.50%
2.00%
2.50%
Apr May Jun Jul Aug Sep Oct Nov Dec Jan Feb Mar
% Former Tenant Rents Arrears as a Portion of Annual Rent Debit
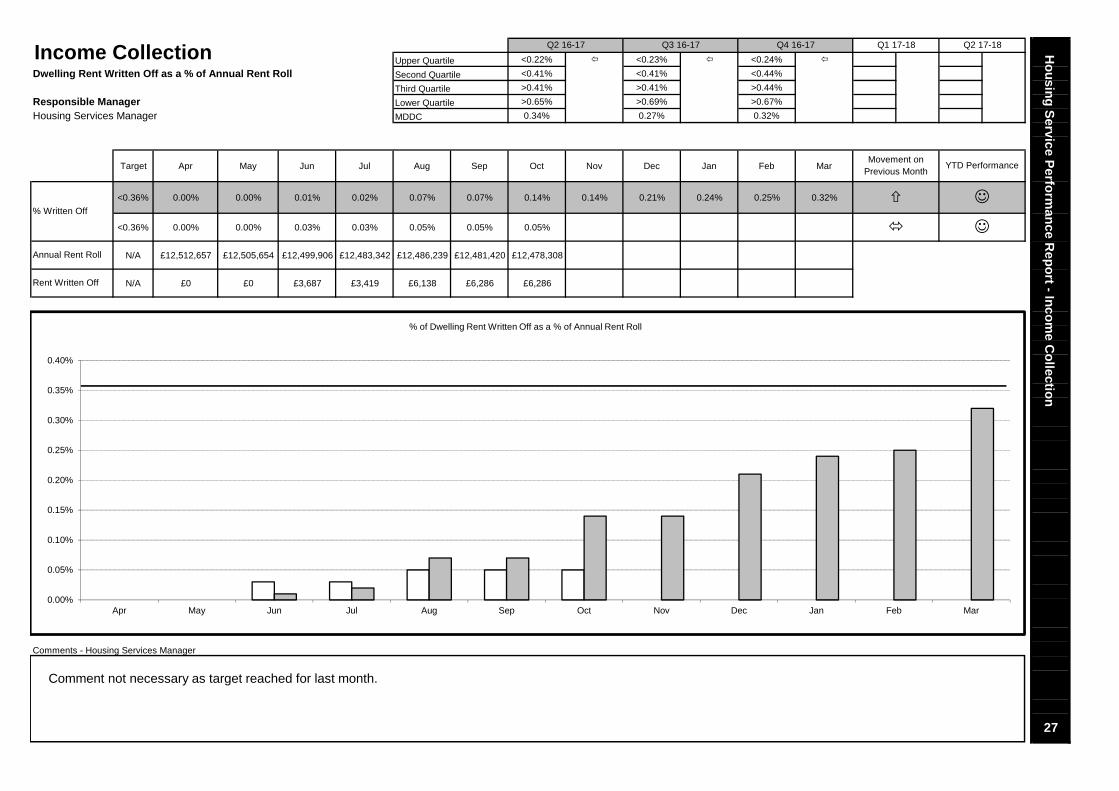
Upper Quartile <0.22% <0.23% <0.24%
Dwelling Rent Written Off as a % of Annual Rent Roll Second Quartile <0.41% <0.41% <0.44%
Third Quartile >0.41% >0.41% >0.44%
Responsible Manager Lower Quartile >0.65% >0.69% >0.67%
Housing Services Manager MDDC 0.34% 0.27% 0.32%
Target Apr May Jun Jul Aug Sep Oct Nov Dec Jan Feb Mar
<0.36% 0.00% 0.00% 0.01% 0.02% 0.07% 0.07% 0.14% 0.14% 0.21% 0.24% 0.25% 0.32%
<0.36% 0.00% 0.00% 0.03% 0.03% 0.05% 0.05% 0.05%
N/A £12,512,657 £12,505,654 £12,499,906 £12,483,342 £12,486,239 £12,481,420 £12,478,308
N/A £0 £0 £3,687 £3,419 £6,138 £6,286 £6,286
27
Movement on Previous Month
YTD Performance
� ☺
Ho
usin
g S
ervice Perfo
rman
ce Rep
ort - In
com
e Co
llection
Comments - Housing Services Manager
☺
Annual Rent Roll
�
Rent Written Off
% Written Off
Income Collection Q2 17-18Q4 16-17 Q1 17-18Q2 16-17 Q3 16-17
Comment not necessary as target reached for last month.
0.00%
0.05%
0.10%
0.15%
0.20%
0.25%
0.30%
0.35%
0.40%
Apr May Jun Jul Aug Sep Oct Nov Dec Jan Feb Mar
% of Dwelling Rent Written Off as a % of Annual Rent Roll
Tenants Paying by Direct Debit
Responsible ManagerHousing Services Manager
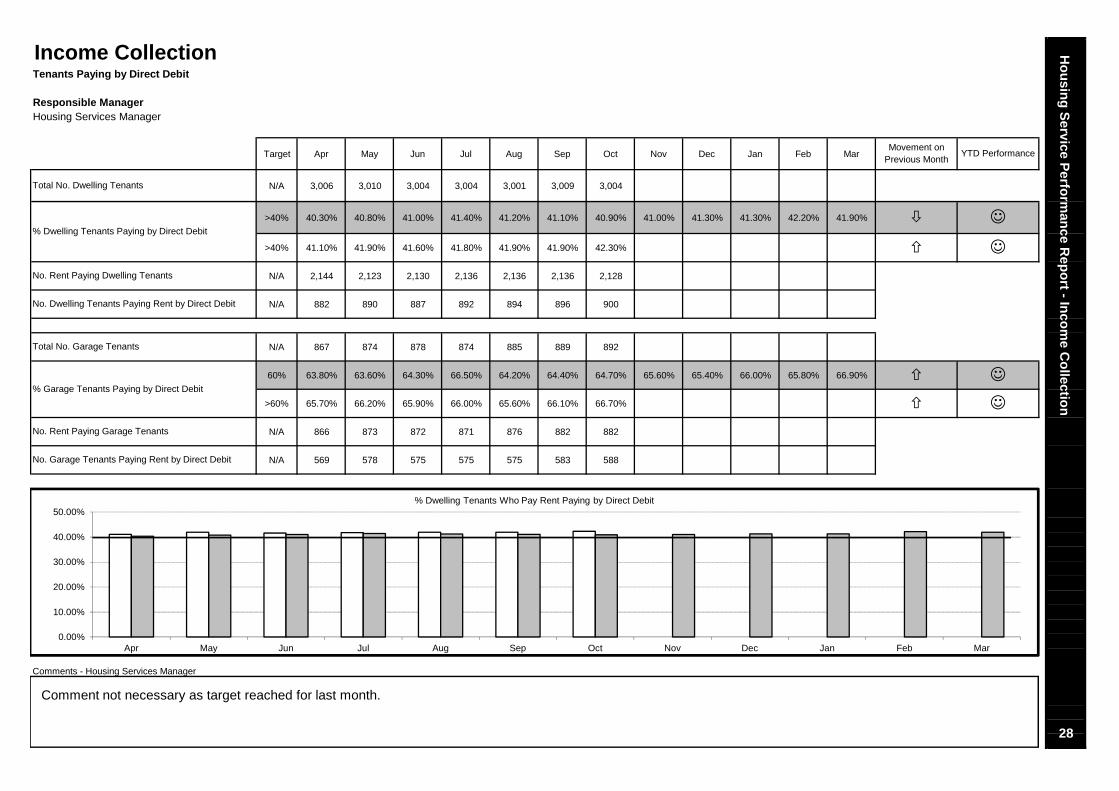
Target Apr May Jun Jul Aug Sep Oct Nov Dec Jan Feb Mar
N/A 3,006 3,010 3,004 3,004 3,001 3,009 3,004
>40% 40.30% 40.80% 41.00% 41.40% 41.20% 41.10% 40.90% 41.00% 41.30% 41.30% 42.20% 41.90%
>40% 41.10% 41.90% 41.60% 41.80% 41.90% 41.90% 42.30%
N/A 2,144 2,123 2,130 2,136 2,136 2,136 2,128
N/A 882 890 887 892 894 896 900
N/A 867 874 878 874 885 889 892
60% 63.80% 63.60% 64.30% 66.50% 64.20% 64.40% 64.70% 65.60% 65.40% 66.00% 65.80% 66.90%
>60% 65.70% 66.20% 65.90% 66.00% 65.60% 66.10% 66.70%
N/A 866 873 872 871 876 882 882
N/A 569 578 575 575 575 583 588
28
Movement on Previous Month
YTD Performance
� ☺
�
�
Ho
usin
g S
ervice Perfo
rman
ce Rep
ort - In
com
e Co
llection
Comments - Housing Services Manager
☺
No. Rent Paying Dwelling Tenants
No. Garage Tenants Paying Rent by Direct Debit
Total No. Dwelling Tenants
Total No. Garage Tenants
No. Dwelling Tenants Paying Rent by Direct Debit
% Dwelling Tenants Paying by Direct Debit
Income Collection
% Garage Tenants Paying by Direct Debit
No. Rent Paying Garage Tenants
☺
� ☺
Comment not necessary as target reached for last month.
0.00%
10.00%
20.00%
30.00%
40.00%
50.00%
Apr May Jun Jul Aug Sep Oct Nov Dec Jan Feb Mar
% Dwelling Tenants Who Pay Rent Paying by Direct Debit
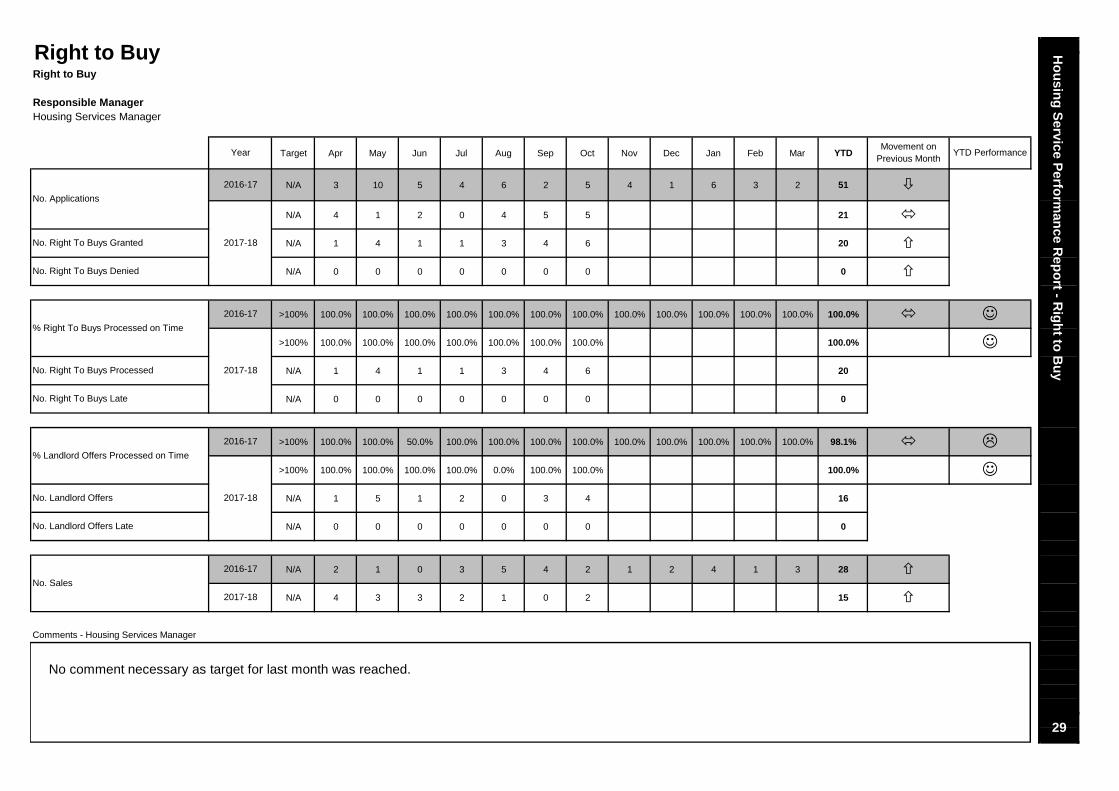
Right to Buy
Responsible ManagerHousing Services Manager
Target Apr May Jun Jul Aug Sep Oct Nov Dec Jan Feb Mar YTD
N/A 3 10 5 4 6 2 5 4 1 6 3 2 51
N/A 4 1 2 0 4 5 5 21
N/A 1 4 1 1 3 4 6 20
N/A 0 0 0 0 0 0 0 0
>100% 100.0% 100.0% 100.0% 100.0% 100.0% 100.0% 100.0% 100.0% 100.0% 100.0% 100.0% 100.0% 100.0%
>100% 100.0% 100.0% 100.0% 100.0% 100.0% 100.0% 100.0% 100.0%
N/A 1 4 1 1 3 4 6 20
N/A 0 0 0 0 0 0 0 0
>100% 100.0% 100.0% 50.0% 100.0% 100.0% 100.0% 100.0% 100.0% 100.0% 100.0% 100.0% 100.0% 98.1%
>100% 100.0% 100.0% 100.0% 100.0% 0.0% 100.0% 100.0% 100.0%
N/A 1 5 1 2 0 3 4 16
N/A 0 0 0 0 0 0 0 0
N/A 2 1 0 3 5 4 2 1 2 4 1 3 28
N/A 4 3 3 2 1 0 2 15
Comments - Housing Services Manager
☺
☺
�2016-17
2016-17
2017-18
29
�
�
�
☺
Ho
usin
g S
ervice Perfo
rman
ce Rep
ort - R
igh
t to B
uy
YTD Performance
�
Movement on Previous Month
�
�
�
Year
No. Right To Buys Granted
No. Right To Buys Denied
�
% Right To Buys Processed on Time
No. Right To Buys Late
2017-18
No. Landlord Offers
No. Landlord Offers Late
Right to Buy
No. Applications
2016-17
No. Sales
% Landlord Offers Processed on Time
2017-18
2016-17
2017-18
No. Right To Buys Processed
No comment necessary as target for last month was reached.
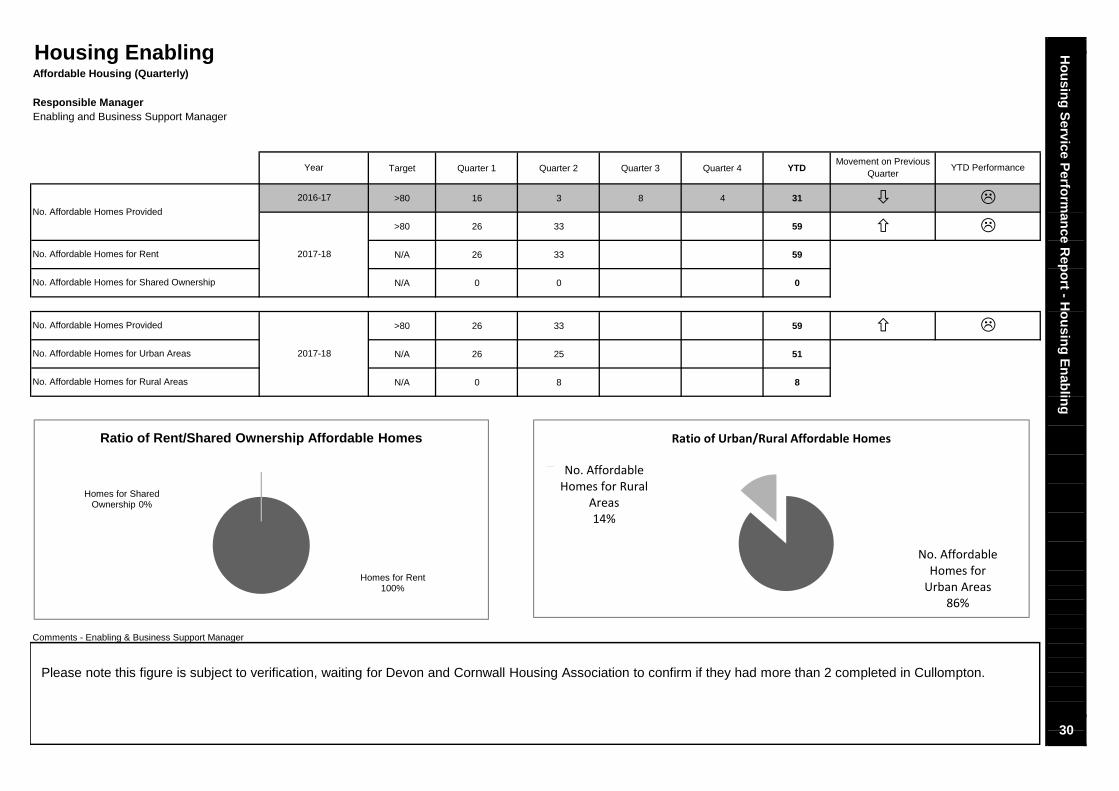
Responsible ManagerEnabling and Business Support Manager
Target Quarter 1 Quarter 2 Quarter 3 Quarter 4 YTD
>80 16 3 8 4 31
>80 26 33 59
N/A 26 33 59
N/A 0 0 0
>80 26 33 59
N/A 26 25 51
N/A 0 8 8
Housing Enabling
30
Comments - Enabling & Business Support Manager
� �
� �
No. Affordable Homes for Shared Ownership
Ho
usin
g S
ervice Perfo
rman
ce Rep
ort - H
ou
sing
En
ablin
gAffordable Housing (Quarterly)
YTD Performance
2017-18No. Affordable Homes for Rent
Movement on Previous Quarter
Year
No. Affordable Homes Provided
No. Affordable Homes Provided
No. Affordable Homes for Urban Areas 2017-18
No. Affordable Homes for Rural Areas
�2016-17 �
Please note this figure is subject to verification, waiting for Devon and Cornwall Housing Association to confirm if they had more than 2 completed in Cullompton.
Homes for Rent 100%
Homes for Shared Ownership 0%
Ratio of Rent/Shared Ownership Affordable Homes
No. Affordable
Homes for
Urban Areas
86%
No. Affordable
Homes for Rural
Areas
14%
Ratio of Urban/Rural Affordable Homes
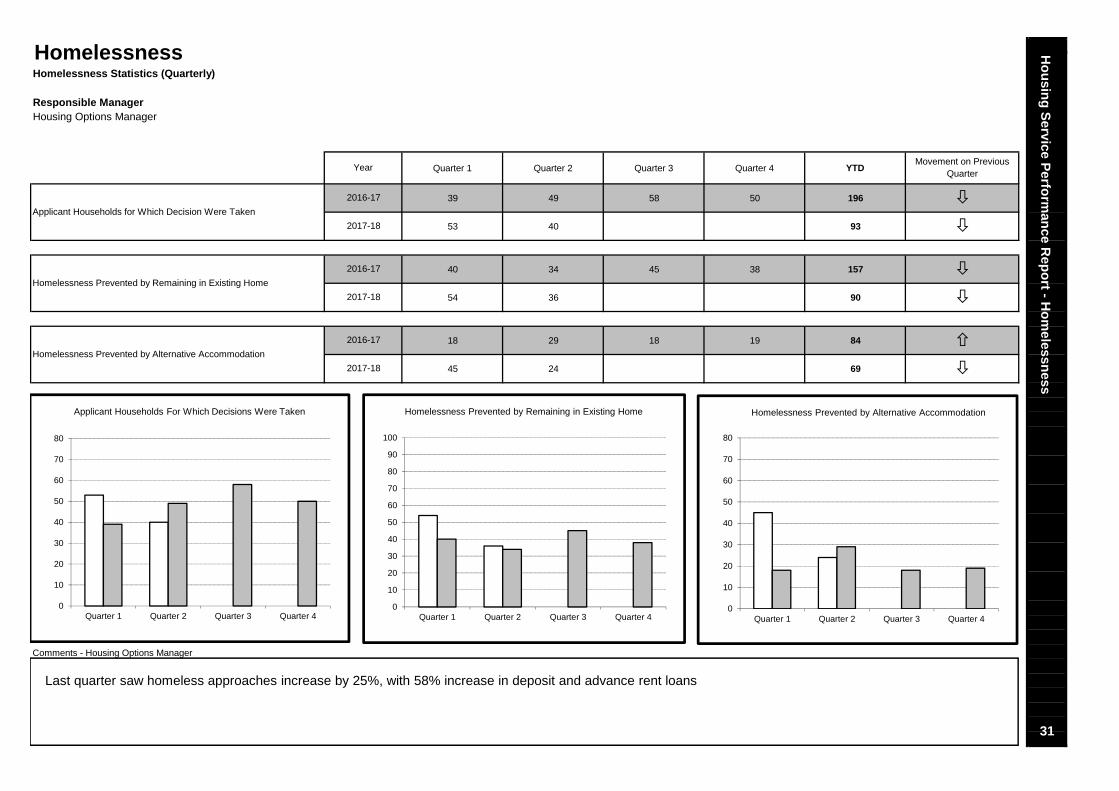
Responsible ManagerHousing Options Manager
Quarter 1 Quarter 2 Quarter 3 Quarter 4 YTD
39 49 58 50 196
53 40 93
40 34 45 38 157
54 36 90
18 29 18 19 84
45 24 692017-18 �
�2016-17
2017-18
�
Year
2016-17
2016-17
�
�
2017-18
31
Ho
usin
g S
ervice Perfo
rman
ce Rep
ort - H
om
elessness
Comments - Housing Options Manager
�
Movement on Previous Quarter
HomelessnessHomelessness Statistics (Quarterly)
Applicant Households for Which Decision Were Taken
Homelessness Prevented by Remaining in Existing Home
Homelessness Prevented by Alternative Accommodation
Last quarter saw homeless approaches increase by 25%, with 58% increase in deposit and advance rent loans
0
10
20
30
40
50
60
70
80
Quarter 1 Quarter 2 Quarter 3 Quarter 4
Applicant Households For Which Decisions Were Taken
0
10
20
30
40
50
60
70
80
90
100
Quarter 1 Quarter 2 Quarter 3 Quarter 4
Homelessness Prevented by Remaining in Existing Home
0
10
20
30
40
50
60
70
80
Quarter 1 Quarter 2 Quarter 3 Quarter 4
Homelessness Prevented by Alternative Accommodation