Embed Size (px)
Citation preview

KBC Bank & Insurance Group
Investor presentationYearend 2004
www.kbc.com
2
Contact information
Visit www.kbc.com
Investor Relations Office :
Luc CoolNele KindtMarina Kanamori
Tel. : +32 2 429 49 16 E-mail : [email protected]
Ticker codes: KBC BB (Bloomberg) KBKBT BR (Reuters)
B:KB (Datastream)
ISIN code: BE0003565737

3
Disclaimer
• THIS PRESENTATION IS PROVIDED FOR INFORMATIONAL PURPOSES ONLY AND DOES NOT CONSTITUTE AN OFFER TO SELL OR THE SOLICITATION OF AN OFFER TO BUY ANY SECURITY.
• ALTHOUGH THE STATEMENTS OF FACT IN THIS PRESENTATION HAVE BEEN OBTAINED FROM AND ARE BASED UPON SOURCES THAT KBC BELIEVES TO BE RELIABLE, KBC DO NOT GUARANTEE THEIR ACCURACY, AND ANY SUCH INFORMATION MAY BE CONDENSED OR INCOMPLETE.
• THIS PRESENTATION CONTAINS FORWARD-LOOKING STATEMENTS WITH RESPECT TO OUR STRATEGIES AND EARNINGS DEVELOPMENT BY THEIR NATURE, THESE FORWARD-LOOKING STATEMNTS INVOLVE NUMEROUS ASSUMPTIONS, UNCERTAINTIES AND OPPORTUNITIES. THE RISK EXISTS THAT THESE STATEMENTS MAY NOT BE FULFILLED AND THAT FUTURE RESULTS DIFFER MATERIALLY.
• BY RECEIVING THIS PRESENTATION EACH INVESTOR IS DEEMED TO REPRESENT THAT IT IS A SOPHISTICATED INVESTOR AND POSSESSES SUFFICIENT INVESTMENT EXPERTISE TO UNDERSTAND THE RISKS INVOLVED.

4
Table of contents
1. Company profile
2. Developments in Belgium
3. Developments in CEE
Company profile
Foto gebouw
1

6
Top-20 player in Euroland banking (*)
1 BNP Paribas (35 bn) 1 BNP Paribas (45 bn) 1 BSCH (57 bn)2 BSCH (31 bn) 2 BSCH (45 bn) 2 BNP Paribas (48 bn)3 BBVA (29 bn) 3 Deutsche Bank (38 bn) 3 BBVA (42 bn)4 Deutsche Bank (26 bn) 4 BBVA (35 bn) 4 Deutsche Bank (35 bn)5 ABN AMRO (25 bn) 5 Société Gén. (31 bn) 5 Crédit Agricole (35 bn)6 Société Gén. (24 bn) 6 ABN AMRO (30 bn) 6 Société Gén. (34 bn)7 Unicredit (24 bn) 7 Crédit Agricole (28 bn) 7 ABN AMRO (32 bn)8 Fortis (22 bn) 8 Unicredit (27 bn) 8 Unicredit (27 bn)9 Crédit Agricole (14 bn) 9 Fortis (21 bn) 9 Fortis (26 bn)
10 Dexia (14 bn) 10 Intesa BCI (18 bn) 10 Intesa BCI (21 bn)11 Intesa BCI (12 bn) 11 Dexia (16 bn) 11 Dexia (18 bn)
12 Allied Irish Banks (12 bn) 12 San Paolo IMI (15 bn) 12 KBC (18 bn)13 Bank of Ireland (10 bn) 13 KBC (11 bn) 13 San Paolo IMI (15 bn)
14 KBC (9 bn) 14 Bco Popular (11 bn) 14 Allied Irish Banks (12 bn) 15 San Paolo IMI (9 bn) 15 Allied Irish Banks (11 bn) 15 HVB (12 bn)16 Banco Popular (8 bn) 16 Bank of Ireland (11 bn) 16 Bank of Ireland (11 bn)17 HVB (7 bn) 17 HVB (10 bn) 17 Bco Popular (10 bn)18 Mediobanca (6 bn) 18 Commerzbank (9 bn) 18 Commerzbank (9 bn)19 Bca MPS (6 bn) 19 Mediobanca (7 bn) 19 BA-CA (9 bn)20 Bco Popular (5 bn) 20 Bca MPS (6 bn) 20 Mediobanca (9 bn)
Dec 2002 Dec 2003 Nov 2004
(*) DJ Euro Stoxx Banks Constituents - Ranking by Market Capitalization – Situation as at 16 Nov 2004
7
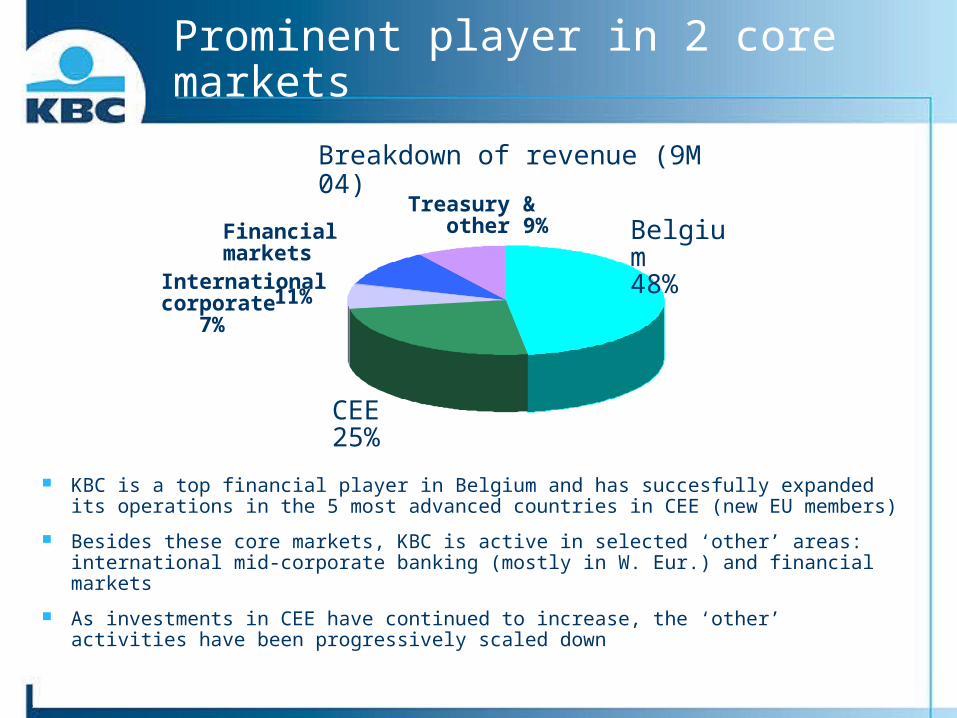
Prominent player in 2 core markets
KBC is a top financial player in Belgium and has succesfully expanded its operations in the 5 most advanced countries in CEE (new EU members)
Besides these core markets, KBC is active in selected ‘other’ areas: international mid-corporate banking (mostly in W. Eur.) and financial markets
As investments in CEE have continued to increase, the ‘other’ activities have been progressively scaled down
Breakdown of revenue (9M 04)
Treasury & other 9%
CEE25%
Belgium
48%
Financial markets 11%
International corporate 7%

8
0% 10% 20% 30%
Other
Argenta
ING
DEXIA
KBC
FORTIS
Client deposits
0% 10% 20% 30%
Other
ING
KBC
Ethias
AXA
FORTIS
Insurance premiums
0% 10% 20% 30%
Other
ING
DEXIA
FORTIS
KBC
Mutual funds
Top-3 player in Belgium
Market share: (1)
Consolidated banking landscape (80-90% of market held by Top-4)
Market highly receptive to cross-selling of AM & insurance products
KBC is particularly strong in the Northern region (one of the wealthiest regions in Europe)
(1) Figures for 2003. Sources: FEBELFIN, KBC Asset Management, Uw Vermogen (Flemish investment journal)
9
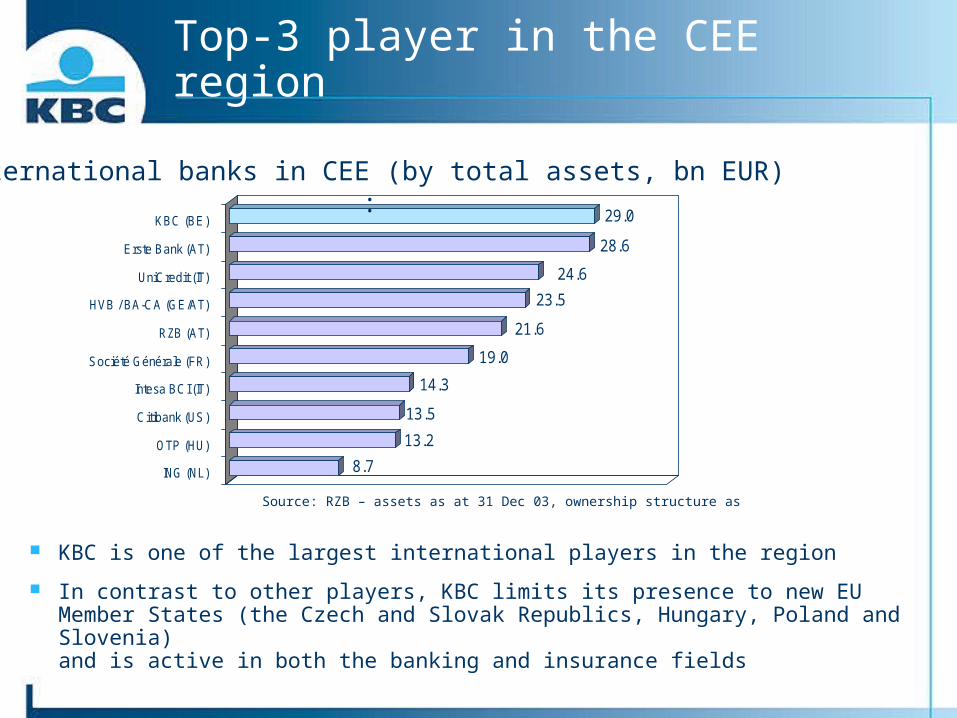
KBC is one of the largest international players in the region
In contrast to other players, KBC limits its presence to new EU Member States (the Czech and Slovak Republics, Hungary, Poland and Slovenia)and is active in both the banking and insurance fields
8.7
13.2
13.5
14.3
19.0
21.6
23.5
24.6
28.6
29.0
ING (NL)
OTP (HU)
Citibank (US)
Intesa BCI (IT)
Société Générale (FR)
RZB (AT)
HVB / BA-CA (GE/AT)
UniCredit (IT)
Erste Bank (AT)
KBC (BE)
Top-3 player in the CEE region
International banks in CEE (by total assets, bn EUR) :
Source: RZB – assets as at 31 Dec 03, ownership structure as at 30 Jun 04
10
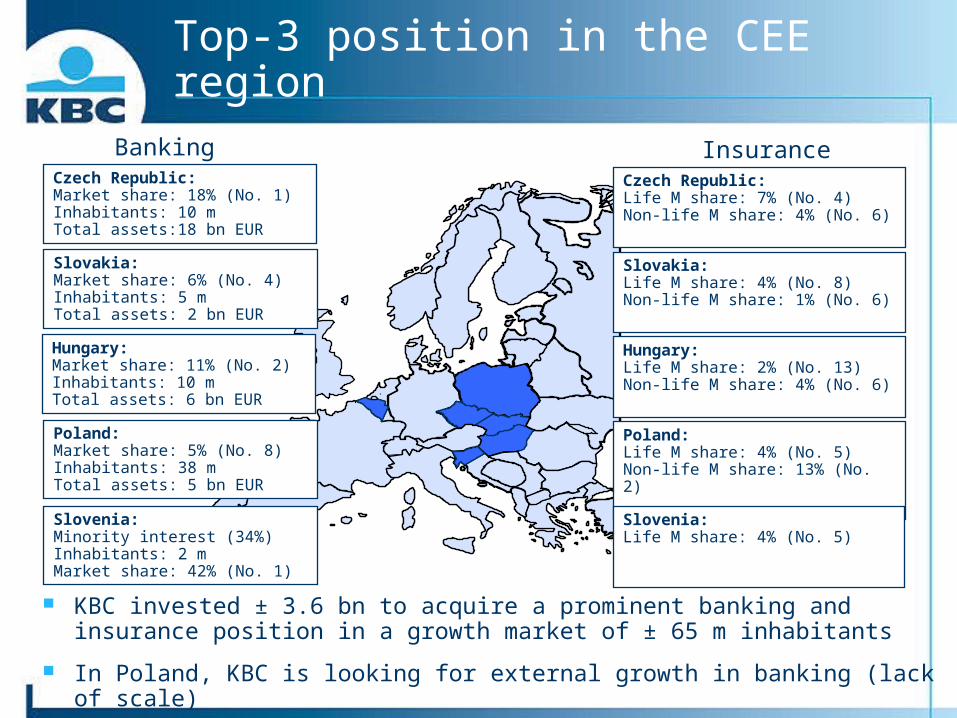
Banking Insurance
Slovakia:Market share: 6% (No. 4)Inhabitants: 5 mTotal assets: 2 bn EUR
Czech Republic:Market share: 18% (No. 1)Inhabitants: 10 mTotal assets:18 bn EUR
Poland:Market share: 5% (No. 8)Inhabitants: 38 mTotal assets: 5 bn EUR
Slovenia:Minority interest (34%)Inhabitants: 2 mMarket share: 42% (No. 1)
Czech Republic:Life M share: 7% (No. 4)Non-life M share: 4% (No. 6)
Slovakia:Life M share: 4% (No. 8)Non-life M share: 1% (No. 6)
Hungary:Life M share: 2% (No. 13)Non-life M share: 4% (No. 6)
Poland:Life M share: 4% (No. 5)Non-life M share: 13% (No. 2)
Slovenia:Life M share: 4% (No. 5)
Top-3 position in the CEE region
Hungary:Market share: 11% (No. 2)Inhabitants: 10 mTotal assets: 6 bn EUR
KBC invested ± 3.6 bn to acquire a prominent banking and insurance position in a growth market of ± 65 m inhabitants
In Poland, KBC is looking for external growth in banking (lack of scale)
Developments in Belgium
Foto gebouw
2

12
6%9% 11%
16% 16%
UK Nordic Spain Germany Belgium
2.9% 3.1% 3.7% 4.0% 4.2%5.5%
Germany NL France UK Belgium Spain
Nominal GDP growth Savings rate
Do not underestimate the market
KBC estimates, 2005 EU forecast report Spring 04, % of GDP, 2003
Belgian GDP outgrowing European average (slightly) in 2004-05 Savings ratio amongst the highest in the world
(every year, ca. 15% of disposable income flows into financial assets) Belgium’s high savings rate a key driver for sustained growth of the
financial industry

13
KBC is well positioned
AM and Life insurance markets growing at ca. 8-10% per year KBC outgrowing the market on the back of its favourable position:
Especially strong in the (wealthy) Northern region Innovative product offering in retail AM (as a result, steadily
increasing market share over the past 10 yrs. ) A differentiating bancassurance distribution model
(on the back of which life reserves grew >20% p.a. over the last 3 yrs.)
127141 146
133 139 145130
149156
143157
165
1999 2000 2001 2002 2003 3M04
145122
170153
202220
264
131118107
1999 2000 2001 2002 2003 2004e
Life insurance, written premiumsRetail AUM
CAGR KBC +10% CAGR KBC +18%1998 = 100total market (LH)vs. KBC (RH)
1998 = 100total market (LH)vs. KBC (RH)
14
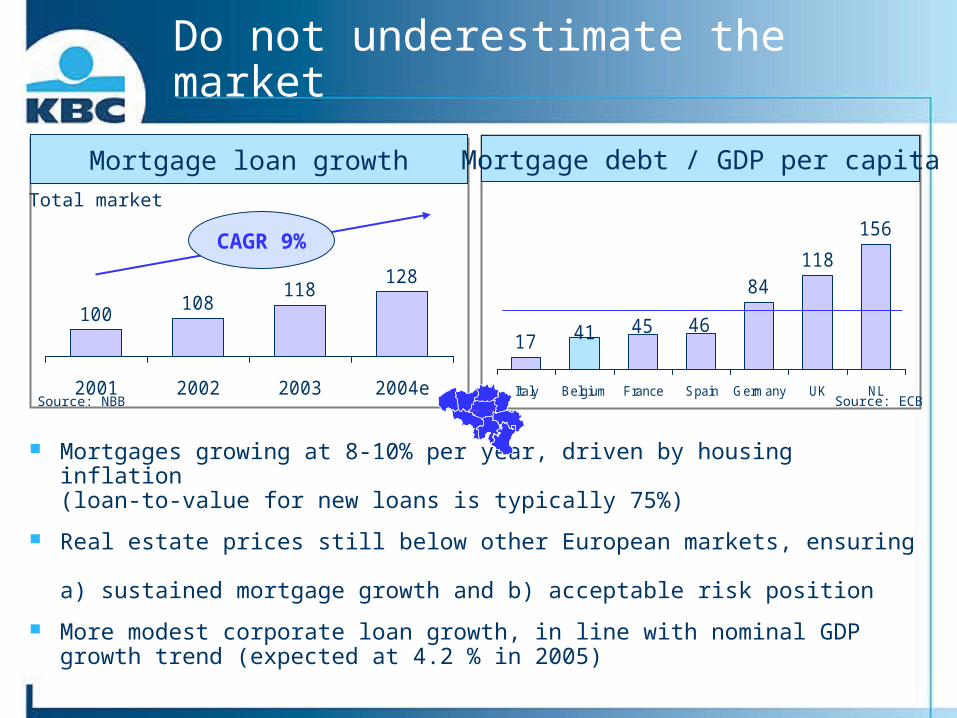
17
84118
156
464541
Italy Belgium France Spain Germany UK NL
100108
118128
2001 2002 2003 2004e
Do not underestimate the market
Mortgage loan growthTotal market
Source: ECB
CAGR 9%
Mortgage debt / GDP per capita
Mortgages growing at 8-10% per year, driven by housing inflation (loan-to-value for new loans is typically 75%)
Real estate prices still below other European markets, ensuring a) sustained mortgage growth and b) acceptable risk position
More modest corporate loan growth, in line with nominal GDP growth trend (expected at 4.2 % in 2005)
Source: NBB
15
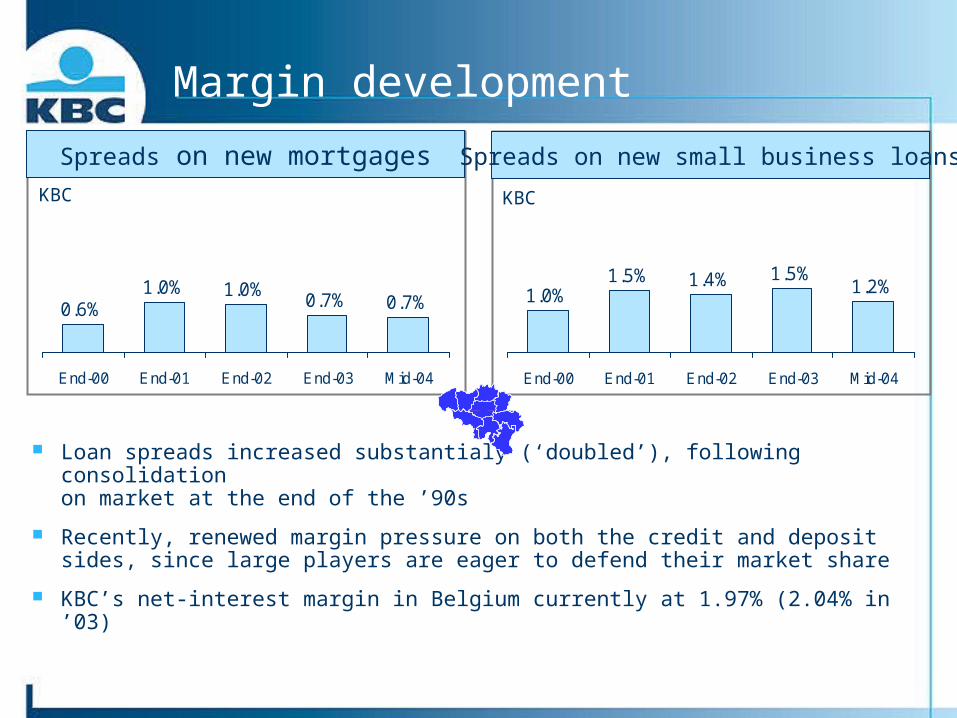
0.6%1.0% 1.0%
0.7%0.7%
End-00 End-01 End-02 End-03 Mid-04
Spreads on new mortgages
Margin development
KBC
1.0%1.5% 1.4% 1.2%
1.5%
End-00 End-01 End-02 End-03 Mid-04
Spreads on new small business loans
KBC
Loan spreads increased substantialy (‘doubled’), following consolidationon market at the end of the ’90s
Recently, renewed margin pressure on both the credit and deposit sides, since large players are eager to defend their market share
KBC’s net-interest margin in Belgium currently at 1.97% (2.04% in ’03)
16
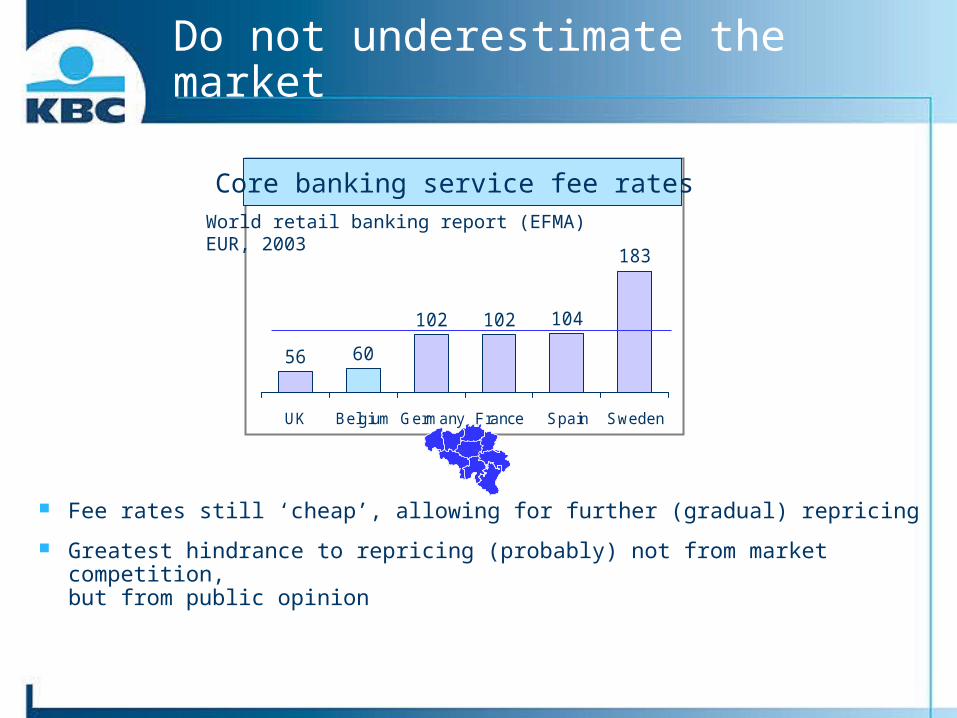
Do not underestimate the market
Fee rates still ‘cheap’, allowing for further (gradual) repricing
Greatest hindrance to repricing (probably) not from market competition, but from public opinion
56 60
102 102 104
183
UK Belgium Germany France Spain Sweden
Core banking service fee rates World retail banking report (EFMA)EUR, 2003

17
Solid credit quality
19%18%
13%11% 11%
9%8%
6%
France UK Germany Italy PortugalSpainBelgium NL
Non-secured retail loans / total loans
0.32%0.22% 0.24%
0.07%
2001 2002 2003 9M04
Loan loss charges, KBC
Market’s ‘savings culture’ implies low demand for unsecured consumer lending
Commercial loan exposure well-diversified, spanning a large number of SMEs (limited number of very large corporates)
Credit quality proven to be solid, with low loan loss charges over the cycle
Source: central banks%, 2003 KBC (net provisions to gross loans)
18
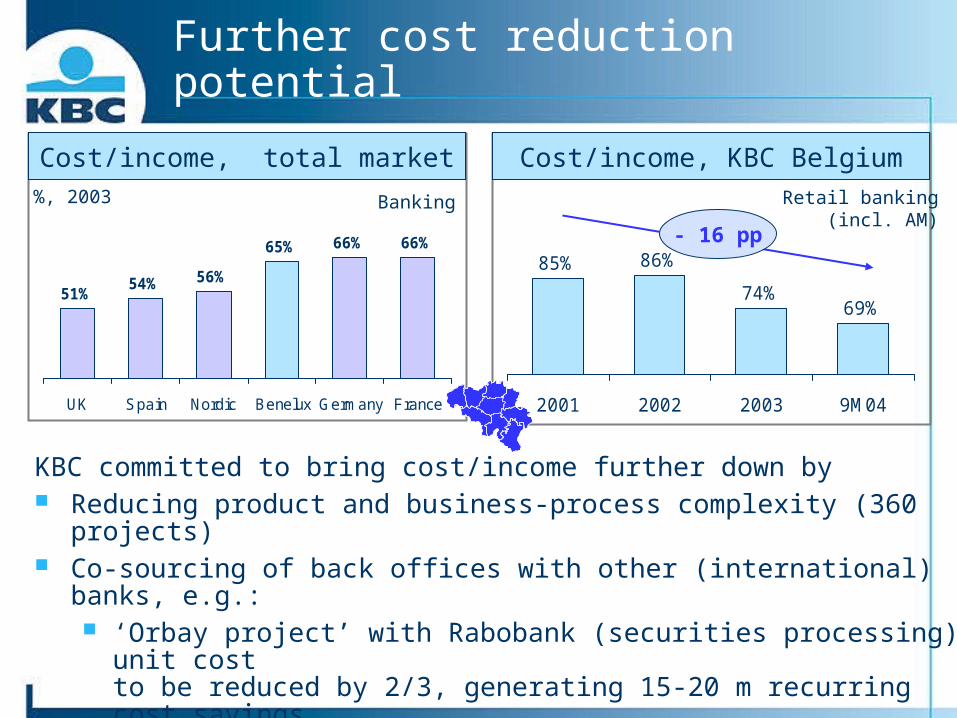
Further cost reduction potential
51%54% 56%
65% 66% 66%
UK Spain Nordic Benelux Germany France
Cost/income, total market%, 2003 Banking
85% 86%
74%69%
2001 2002 2003 9M04
Cost/income, KBC Belgium
- 16 pp
Retail banking(incl. AM)
KBC committed to bring cost/income further down by Reducing product and business-process complexity (360 projects) Co-sourcing of back offices with other (international) banks, e.g.:
‘Orbay project’ with Rabobank (securities processing): unit cost to be reduced by 2/3, generating 15-20 m recurring cost savings
‘Fin-Force project’ (cross-border payments) Similar areas
Developments in CEE
Foto gebouw
3

20
3.7% 4.7% 3.4%
4.0%4.2% 3.1%
4.2%
2.8%
CR Slovakia Hungary Poland
2005e
Above-average GDP growth
Real GDP growth + inflation - KBC estimates
6.5%8.7%
7.6% 7.3%
Nominal GDP growth in 2005 expected at ca. 7% in the region, outgrowing EU level by ca. 3.5%
GDP expected to outgrow European averages for a long time(similar to previous EU entrants)
21
73%
44% 44%34%
CR Slovakia Hungary Poland
80%63%
44% 46%
CR Slovakia Hungary Poland
1997 2003
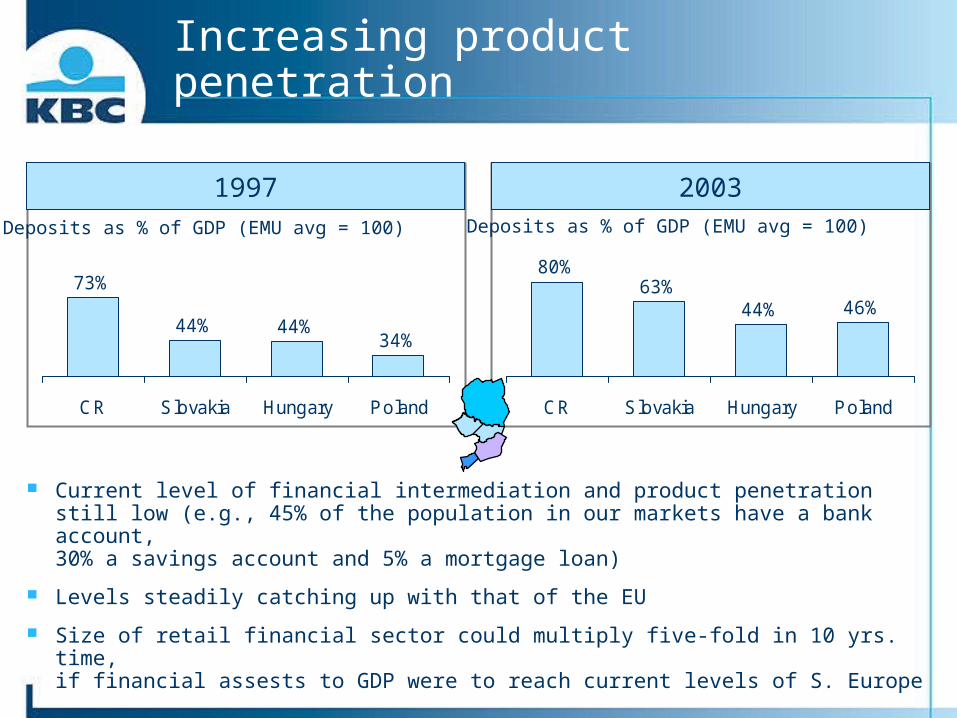
Increasing product penetration
Current level of financial intermediation and product penetration still low (e.g., 45% of the population in our markets have a bank account, 30% a savings account and 5% a mortgage loan)
Levels steadily catching up with that of the EU
Size of retail financial sector could multiply five-fold in 10 yrs. time,if financial assests to GDP were to reach current levels of S. Europe
Deposits as % of GDP (EMU avg = 100) Deposits as % of GDP (EMU avg = 100)

22
2 158
11 47413 914
1998 2002 9M03
39%
93% 90%
Czech Rep. Hungary Poland
Mortgage loan growth
Strong momentum in retail business
Mutual fund growth
CAGR +48%
Total market, 2003 Total market CEE-3, in m EUR FEFSI
Retail business growing at double-digit pace (albeit starting from a low basis), on the back of a) increasing disposable income and b) underpenetration of financial products
This explains KBC’s (and other FIs) key focus on the retail market Corporate market more mature, including corporate loan growth,
which is more in line with (higher) GDP growth trend
NBP, NMB, CNB
23
6.1%
3.1%
1.7%2.5%
1.3%1.5%
2.5%3.2%
1.7%
End-02 Mid-03 End-03 Mid-04
CRHungaryPoland
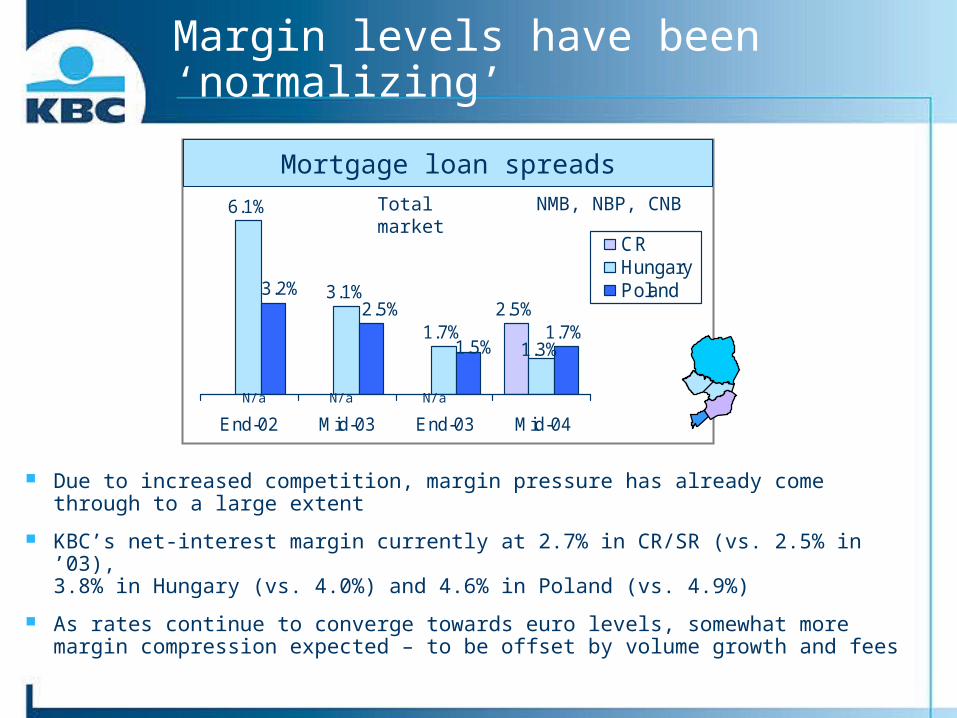
Margin levels have been ‘normalizing’
Mortgage loan spreadsNMB, NBP, CNB
N/a N/a N/a
Due to increased competition, margin pressure has already come through to a large extent
KBC’s net-interest margin currently at 2.7% in CR/SR (vs. 2.5% in ’03), 3.8% in Hungary (vs. 4.0%) and 4.6% in Poland (vs. 4.9%)
As rates continue to converge towards euro levels, somewhat more margin compression expected – to be offset by volume growth and fees
Total market
24
67%
57%
80%73% 70%
84%77%
66%63%
53%56%
70%
2002 2003 9M04 Sector2003
CR
Hungary
Poland
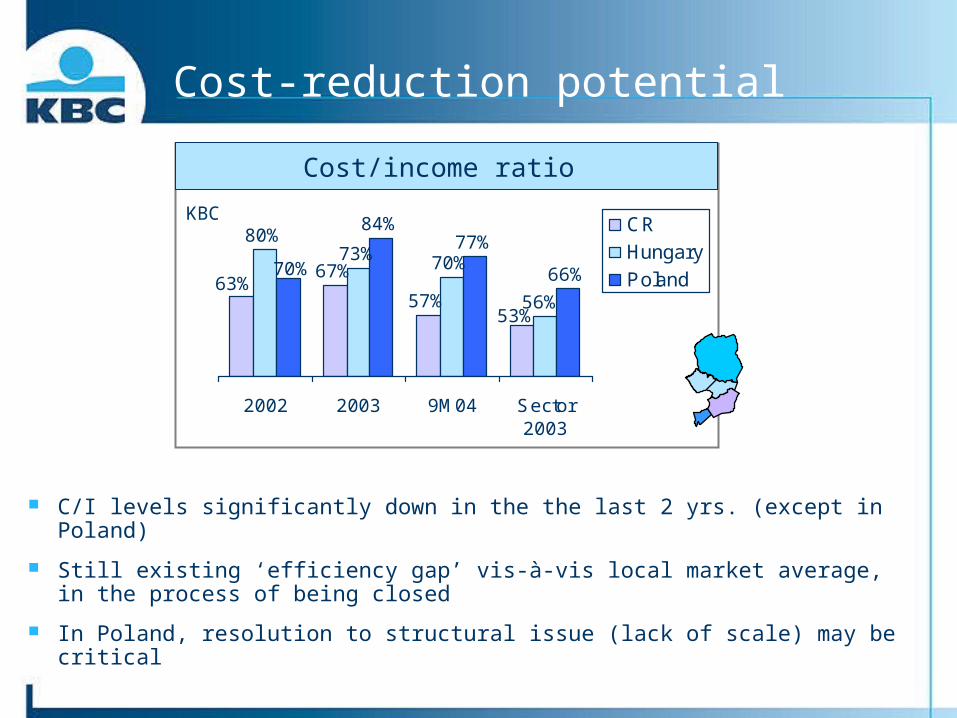
Cost/income ratio
Cost-reduction potential
KBC
C/I levels significantly down in the the last 2 yrs. (except in Poland)
Still existing ‘efficiency gap’ vis-à-vis local market average, in the process of being closed
In Poland, resolution to structural issue (lack of scale) may be critical
25
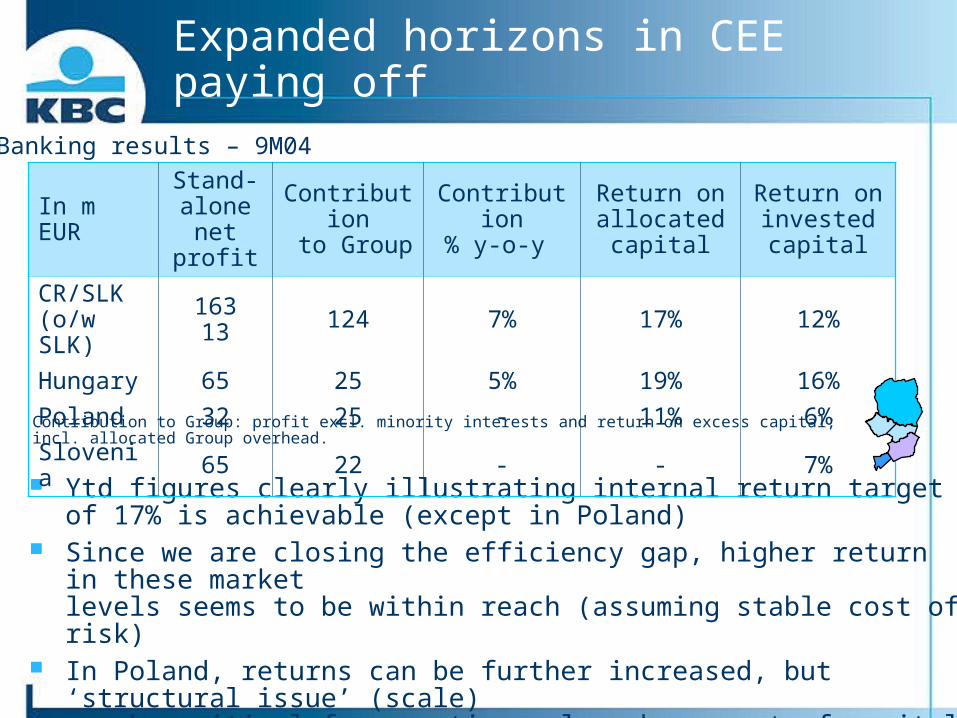
Expanded horizons in CEE paying off
Ytd figures clearly illustrating internal return target of 17% is achievable (except in Poland)
Since we are closing the efficiency gap, higher return in these market levels seems to be within reach (assuming stable cost of risk)
In Poland, returns can be further increased, but ‘structural issue’ (scale) may be critical for creating value above cost of capital
Contribution to Group: profit excl. minority interests and return on excess capital; incl. allocated Group overhead.
In m EURStand-alone
net profit
Contribution to Group
Contribution% y-o-y
Return onallocated capital
Return on invested capital
CR/SLK (o/w SLK)
16313 124 7% 17% 12%
Hungary 65 25 5% 19% 16%
Poland 32 25 - 11% 6%
Slovenia 65 22 - - 7%
Banking results – 9M04
26
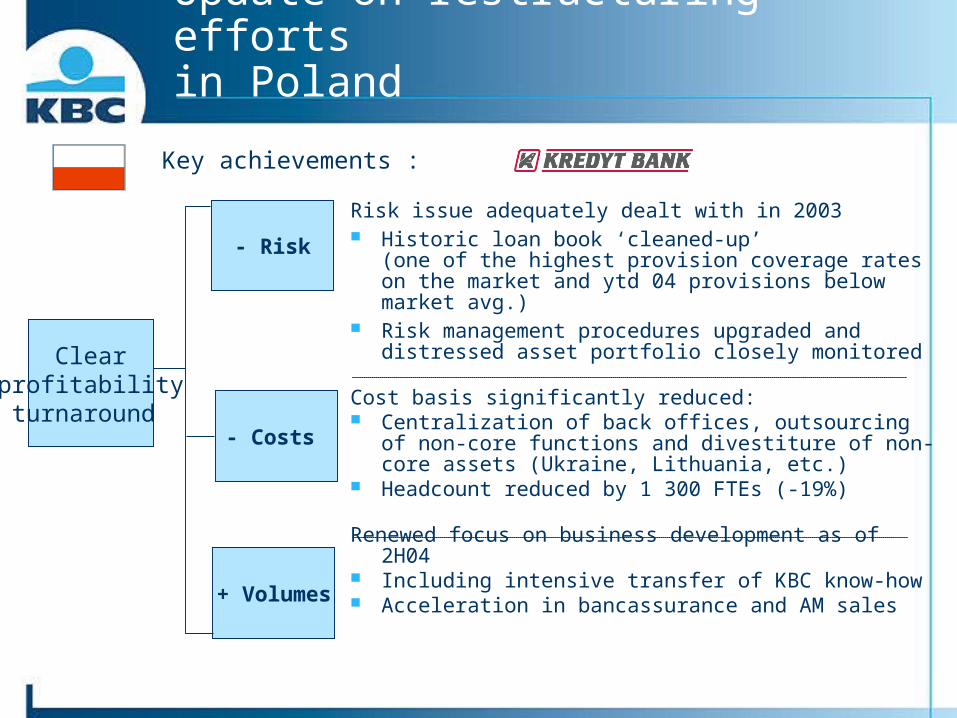
Update on restructuring efforts in Poland
Risk issue adequately dealt with in 2003 Historic loan book ‘cleaned-up’
(one of the highest provision coverage rates on the market and ytd 04 provisions below market avg.)
Risk management procedures upgraded and distressed asset portfolio closely monitored
Cost basis significantly reduced: Centralization of back offices, outsourcing
of non-core functions and divestiture of non-core assets (Ukraine, Lithuania, etc.)
Headcount reduced by 1 300 FTEs (-19%)
Renewed focus on business development as of 2H04 Including intensive transfer of KBC know-how Acceleration in bancassurance and AM sales
Key achievements :
Clearprofitabilityturnaround
- Risk
- Costs
+ Volumes

KBC Bank & Insurance Group
www.kbc.com
Foto gebouw