Embed Size (px)
Citation preview
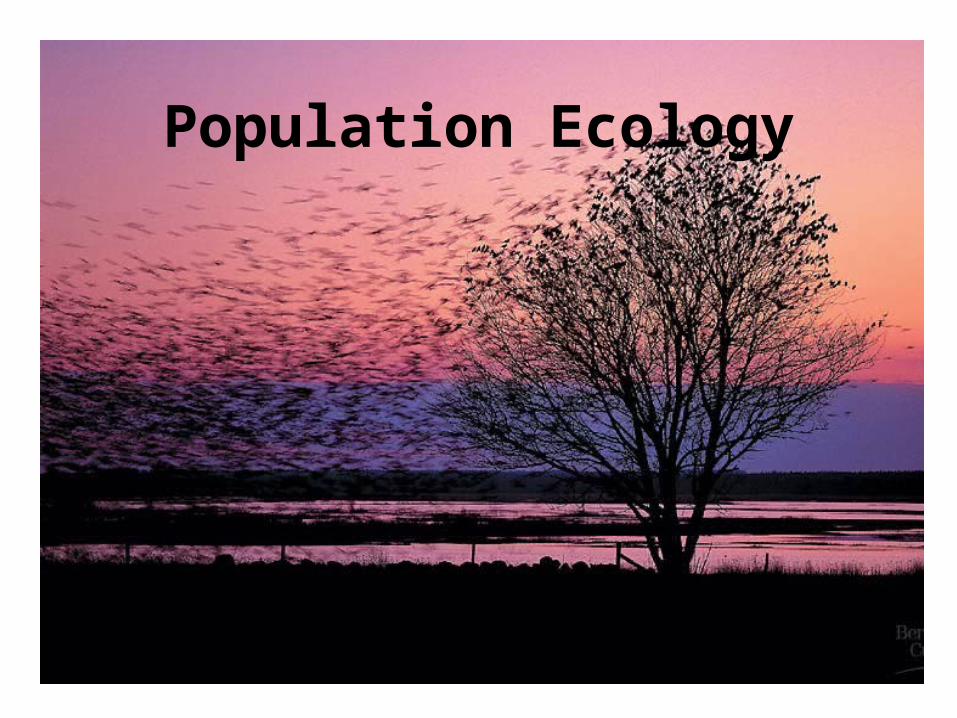
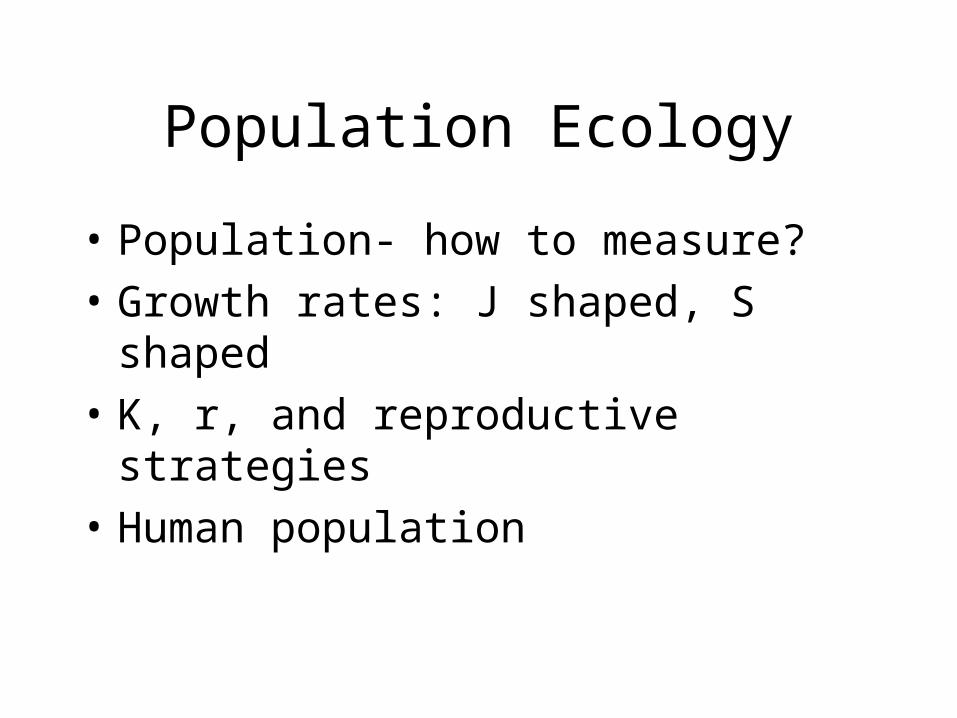
Population Ecology
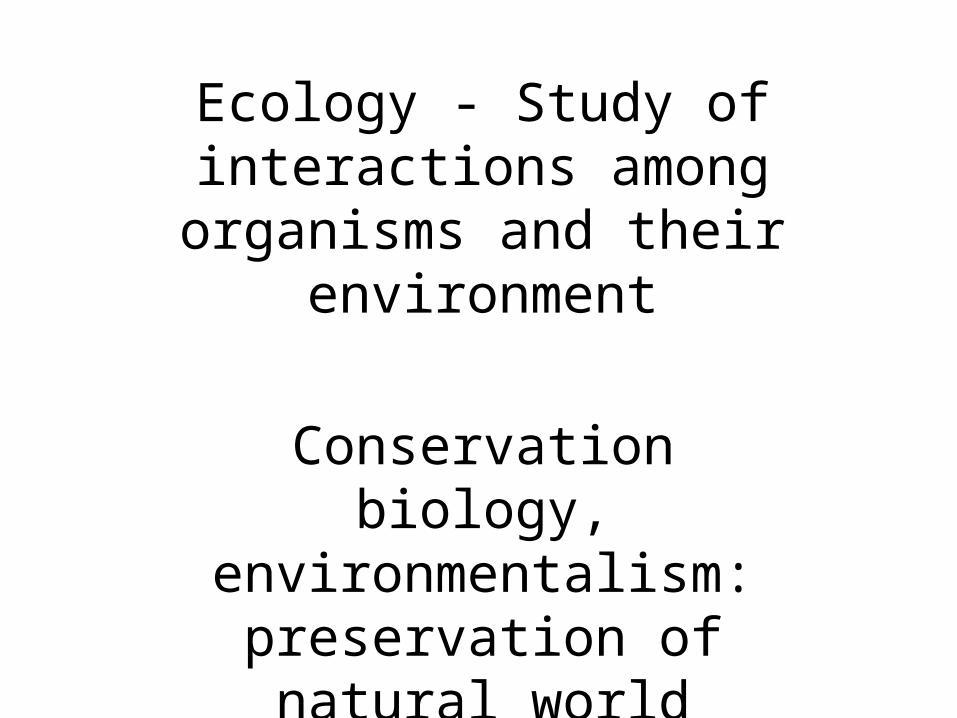
Ecology - Study of interactions among organisms and their
environment
Conservation biology, environmentalism:
preservation of natural world
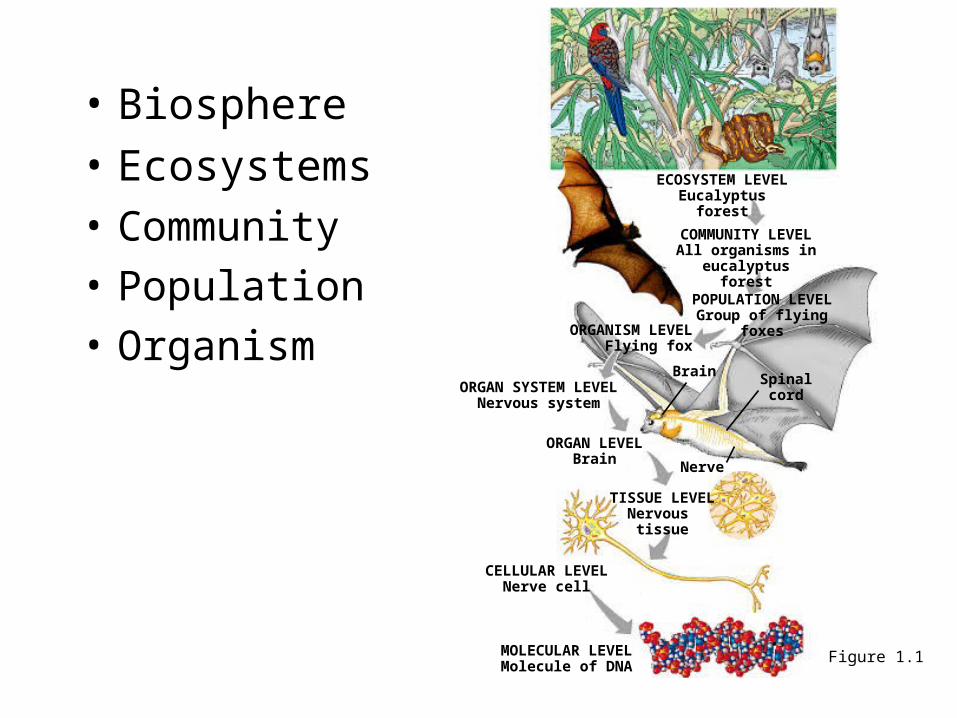
• Biosphere
• Ecosystems • Community
• Population
• Organism
ECOSYSTEM LEVELEucalyptus forest
COMMUNITY LEVELAll organisms ineucalyptus forest
POPULATION LEVELGroup of flying foxes
ORGANISM LEVELFlying fox
ORGAN SYSTEM LEVELNervous system
ORGAN LEVELBrain
Brain Spinal cord
Nerve
TISSUE LEVELNervous
tissue
CELLULAR LEVELNerve cell
MOLECULAR LEVELMolecule of DNA
Figure 1.1
Population Ecology
• Population- how to measure?
• Growth rates: J shaped, S shaped
• K, r, and reproductive strategies
• Human population
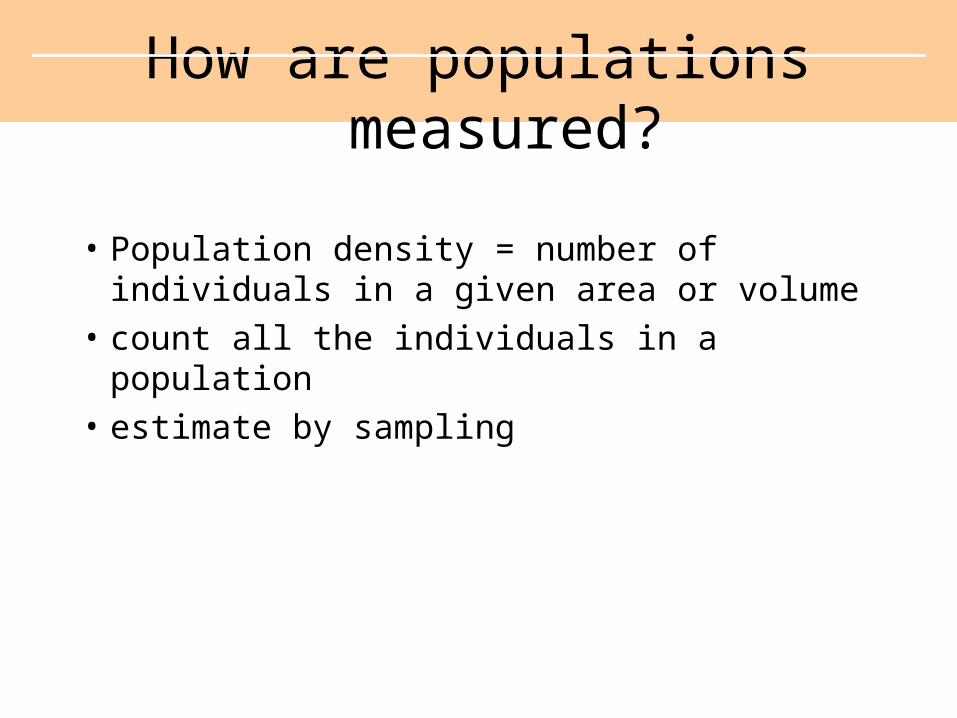
• Population density = number of individuals in a given area or volume
• count all the individuals in a population
• estimate by sampling
How are populations measured?
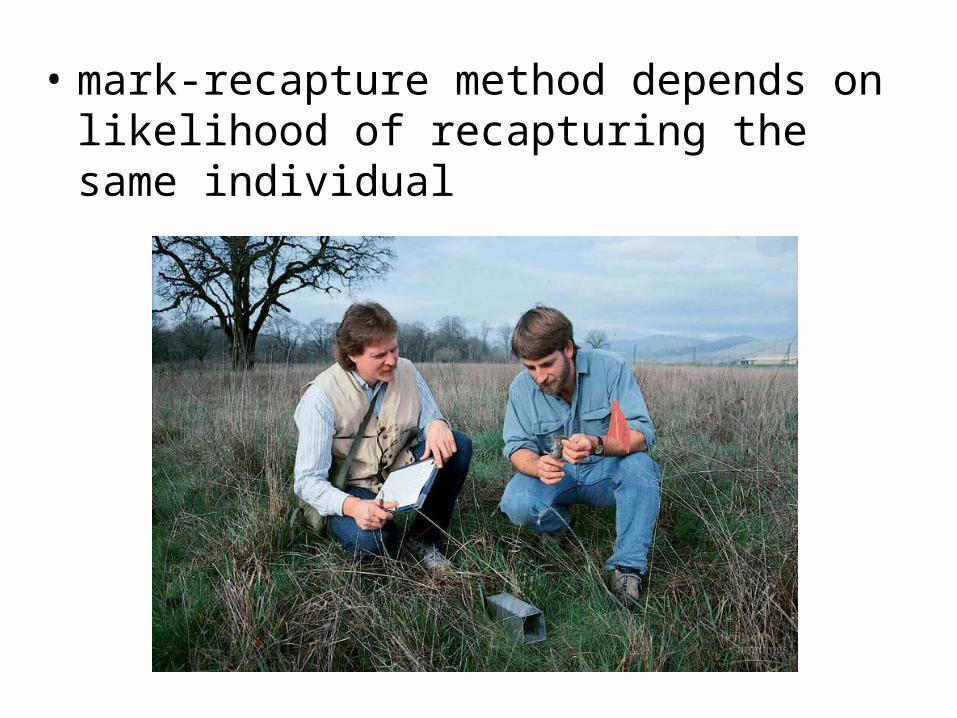
• mark-recapture method depends on likelihood of recapturing the same individual
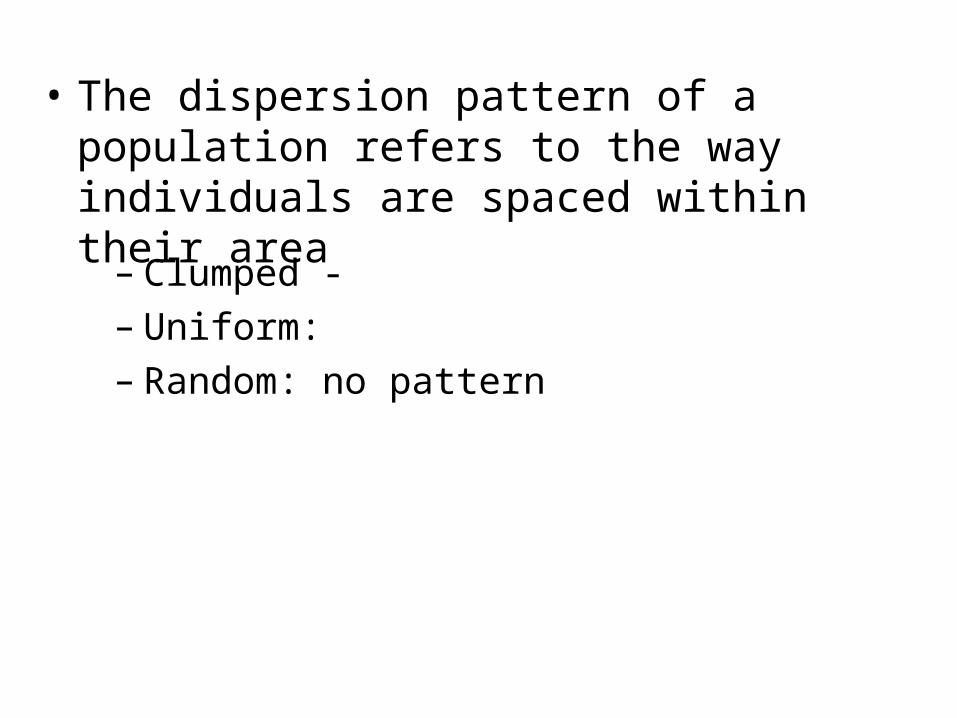
• The dispersion pattern of a population refers to the way individuals are spaced within their area
– Clumped - – Uniform: – Random: no pattern
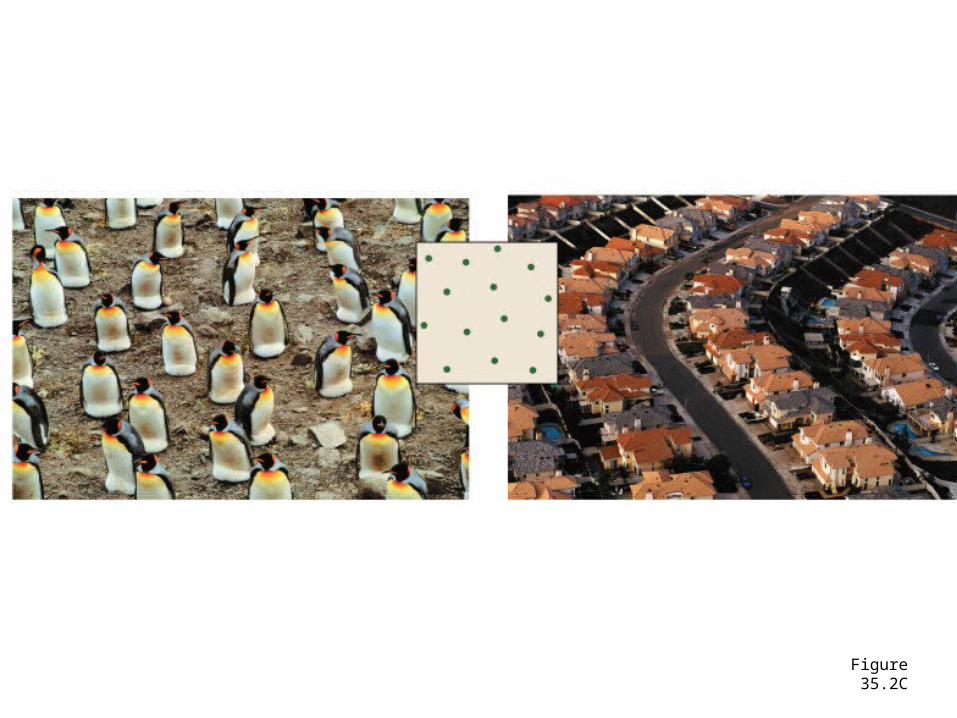
Figure 35.2C
• Idealized models describe two kinds of population growth1. exponential growth
2. logistic growth
How do populations grow?
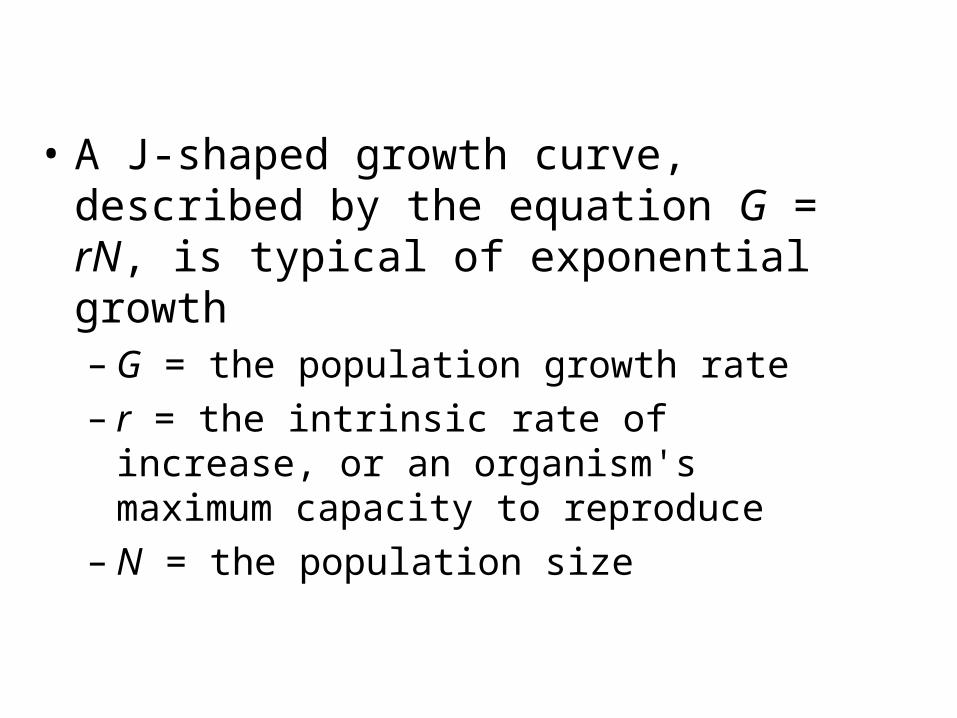
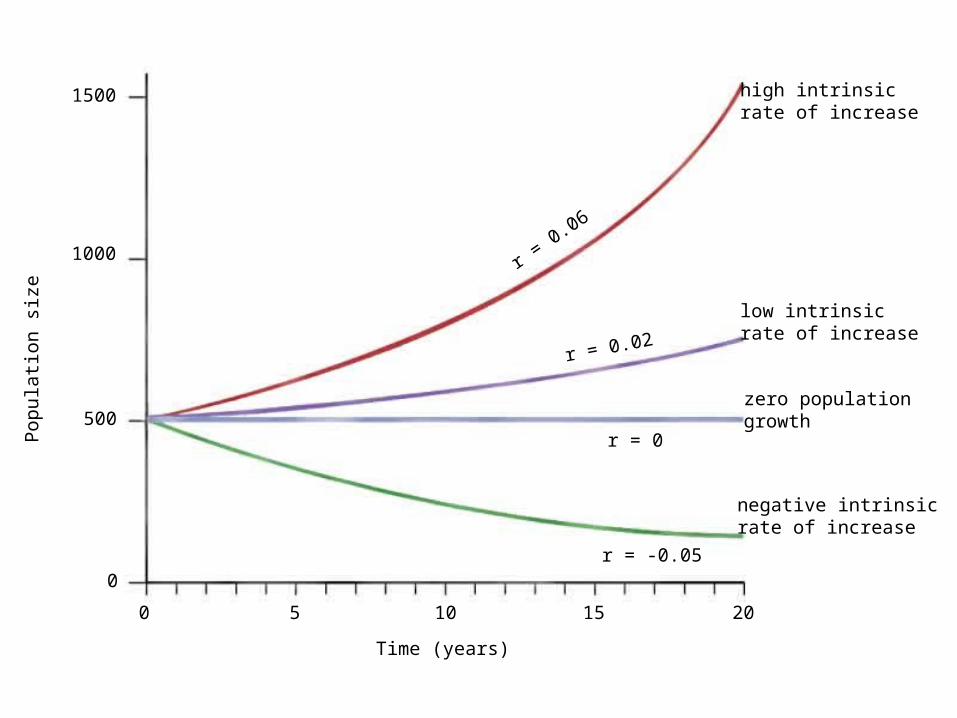
• A J-shaped growth curve, described by the equation G = rN, is typical of exponential growth– G = the population growth rate– r = the intrinsic rate of increase, or an organism's
maximum capacity to reproduce– N = the population size
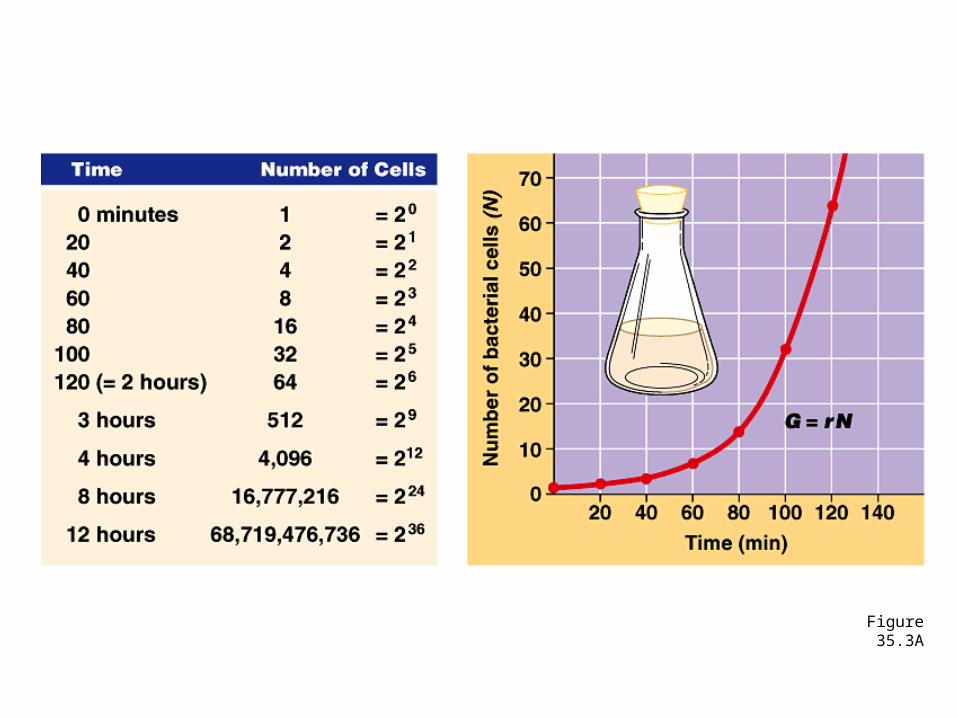
Figure 35.3A
0 5 10 15 20
0
500
1000
1500
Time (years)
Pop
ula
tion s
ize
r = 0.06
r = 0.02
r = 0
r = -0.05
high intrinsicrate of increase
low intrinsicrate of increase
zero populationgrowth
negative intrinsicrate of increase
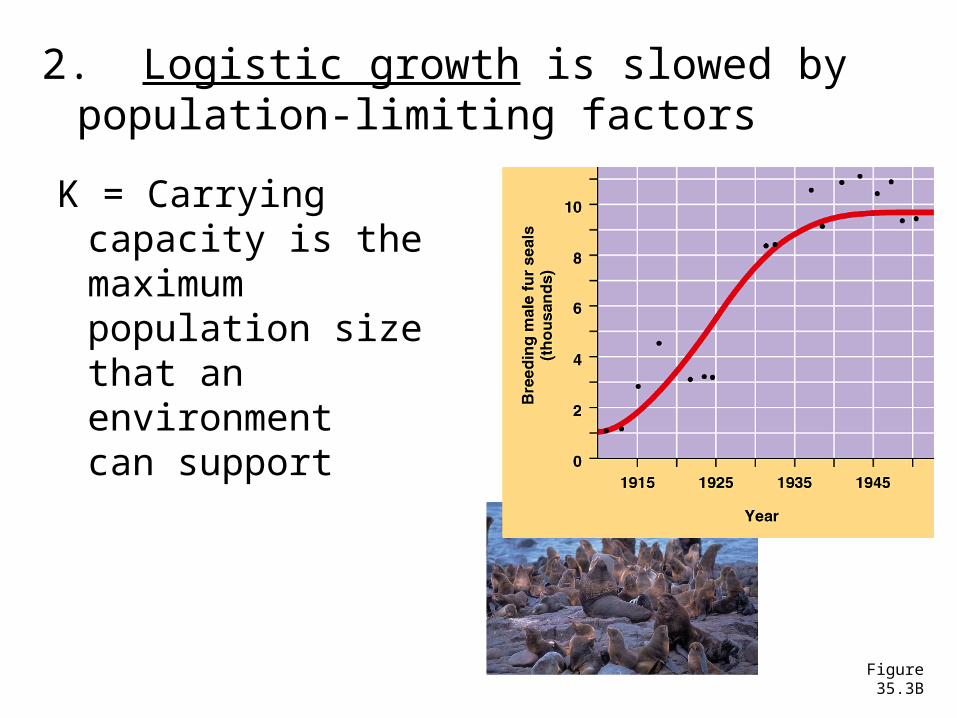
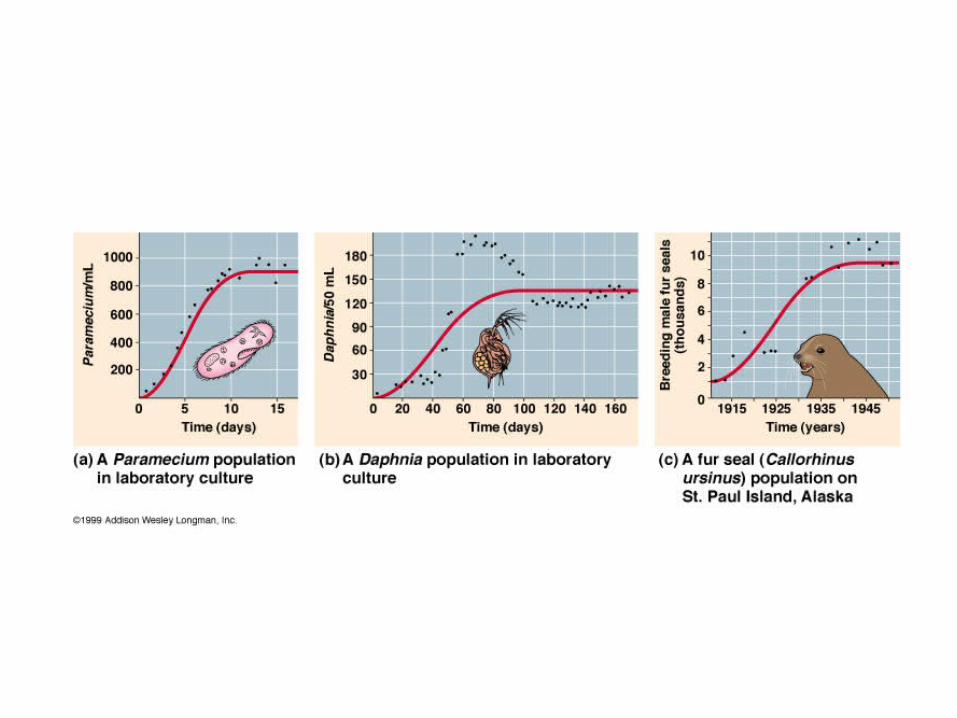
2. Logistic growth is slowed by population-limiting factors
K = Carrying capacity is the maximum population size that an environment can support
Figure 35.3B
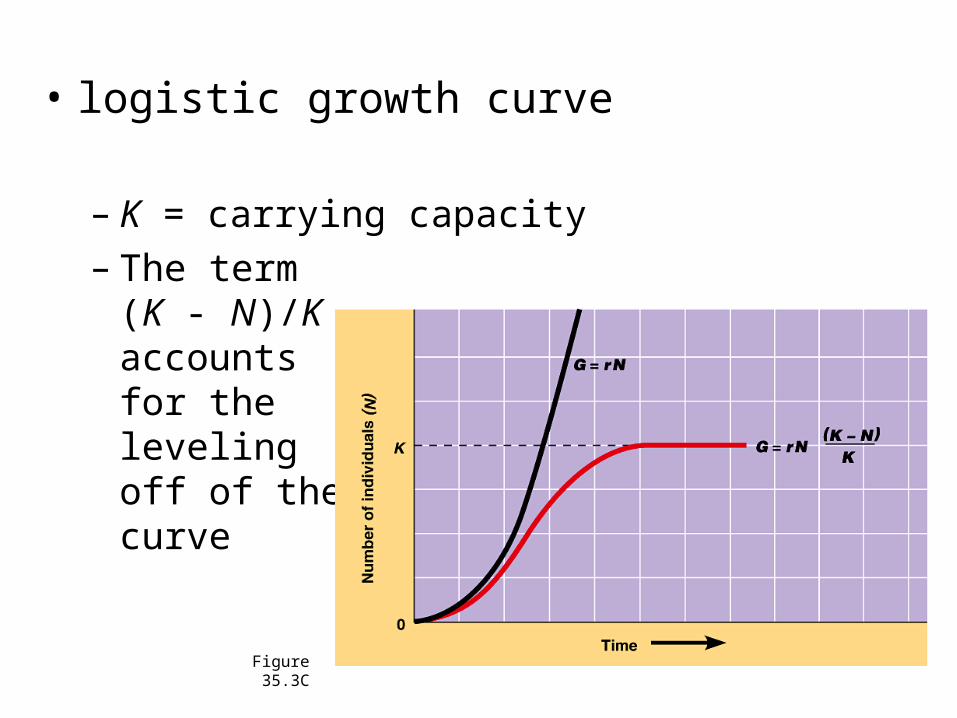
• logistic growth curve
– K = carrying capacity– The term
(K - N)/K accounts for the leveling off of the curve
Figure 35.3C
declining birth rate or increasing death rate
• The regulation of growth in a natural population is determined by several factors – limited food supply
– the buildup of toxic wastes
– increased disease
– predation
Multiple factors may limit population growth
Density Dependent Factors
• Competition
• Predation
• Parasitism
• disease
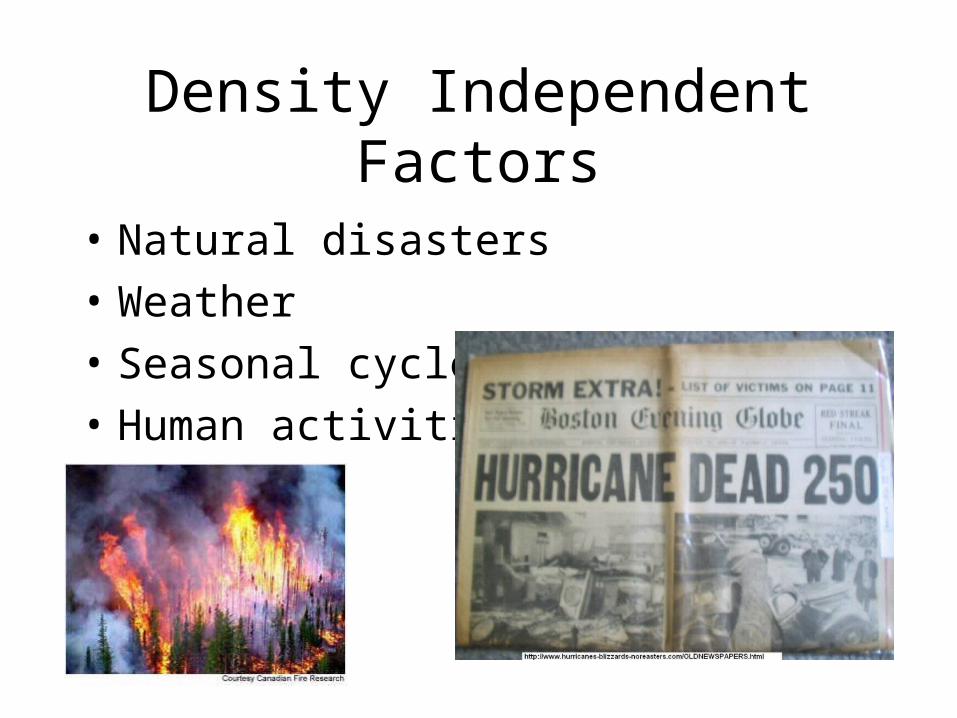
Density Independent Factors
• Natural disasters
• Weather
• Seasonal cycles
• Human activities
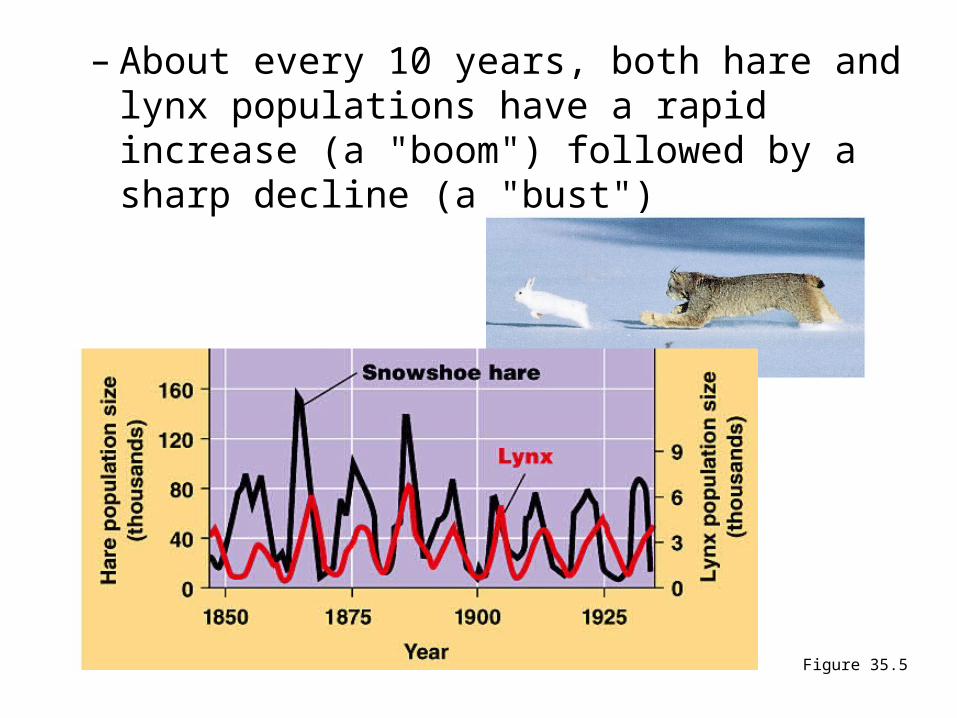
– About every 10 years, both hare and lynx populations have a rapid increase (a "boom") followed by a sharp decline (a "bust")
Figure 35.5
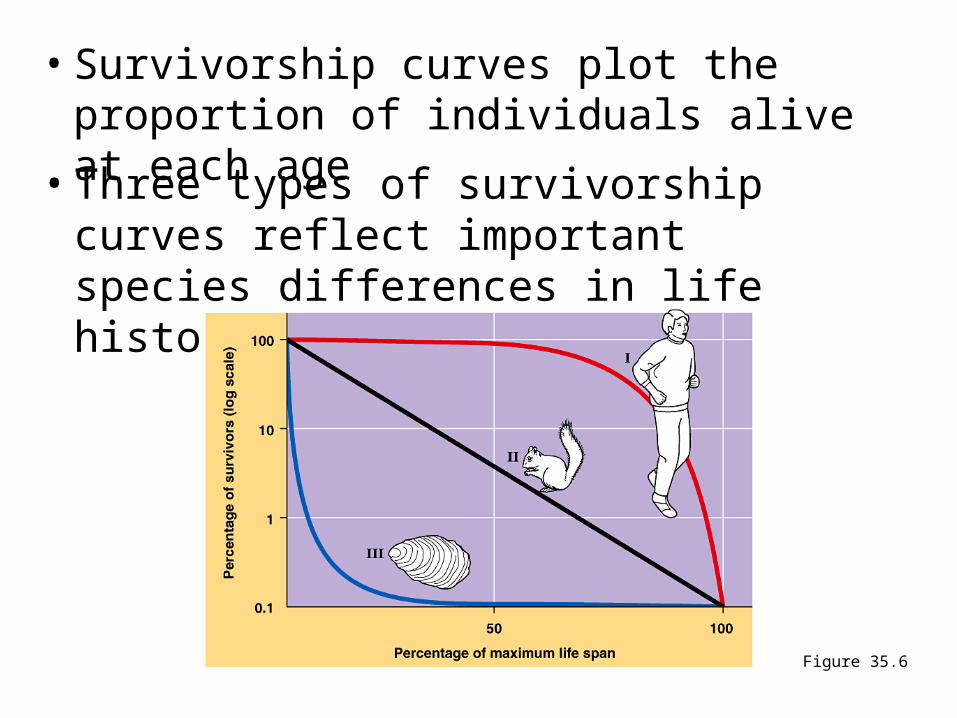
• Survivorship curves plot the proportion of individuals alive at each age
• Three types of survivorship curves reflect important species differences in life history
Figure 35.6
• An organism's life history is the series of events from birth through reproduction to death
• Life history traits include
– the age at which reproduction first occurs
– the frequency of reproduction
– the number of offspring
– the amount of parental care given
– the energy cost of reproduction
Evolution shapes life histories
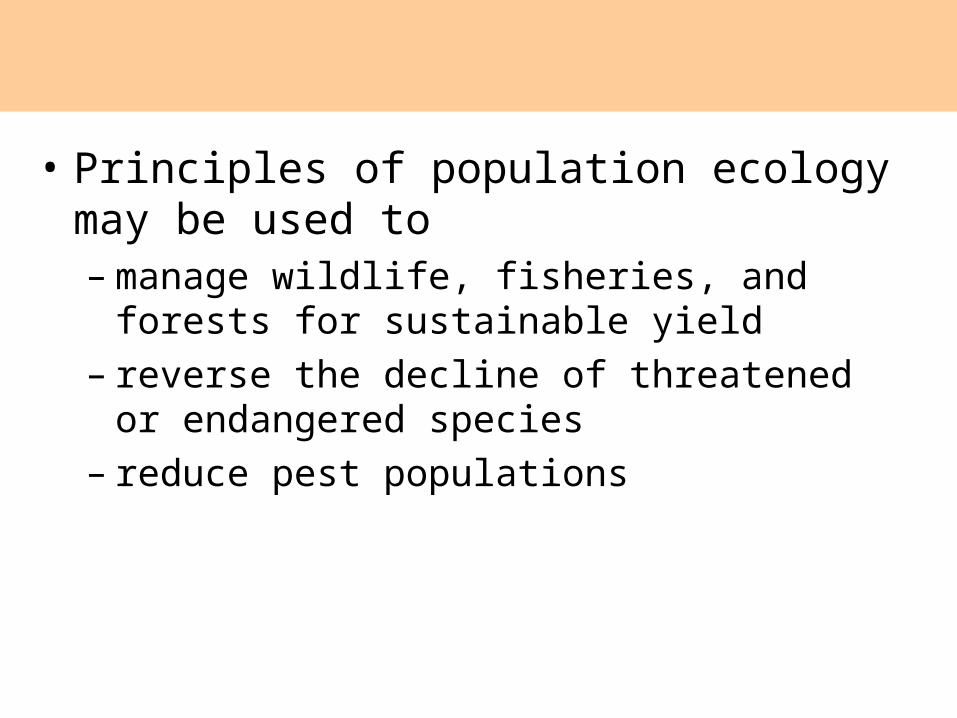
• Principles of population ecology may be used to – manage wildlife, fisheries, and forests for
sustainable yield– reverse the decline of threatened or endangered
species– reduce pest populations
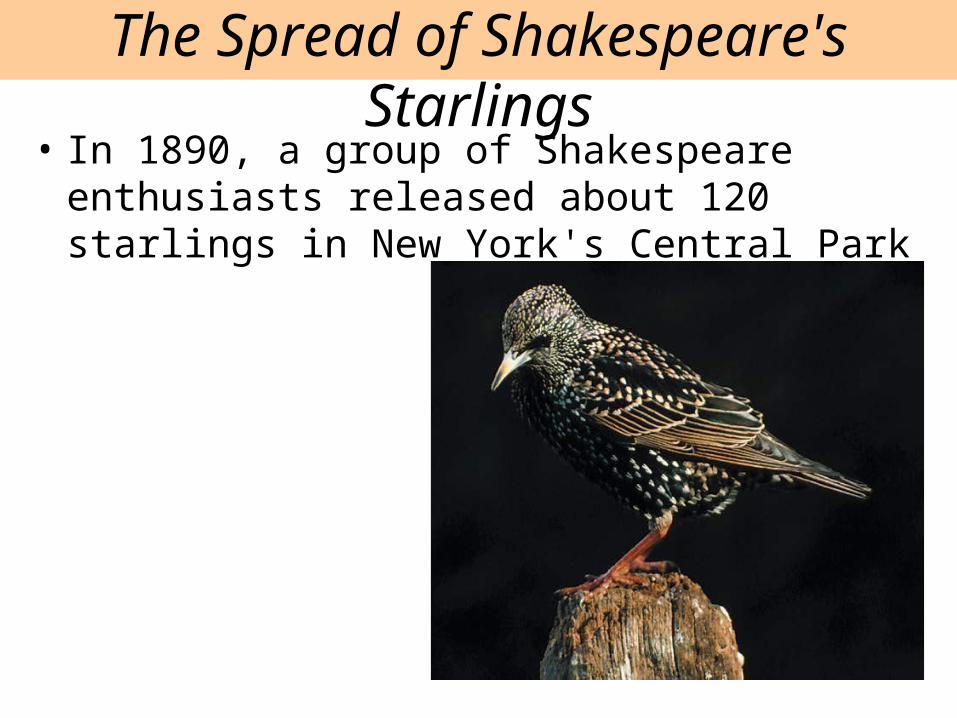
• In 1890, a group of Shakespeare enthusiasts released about 120 starlings in New York's Central Park
The Spread of Shakespeare's Starlings
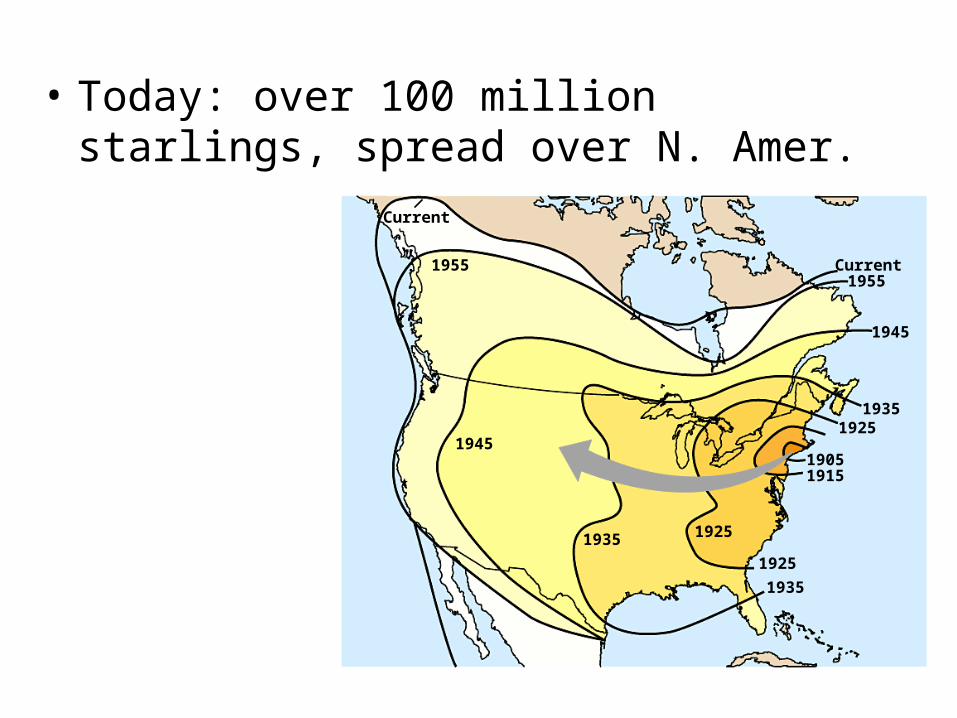
• Today: over 100 million starlings, spread over N. Amer.
Current
1955
1945
1935 1925
1925
1935
19151905
19251935
1945
1955Current
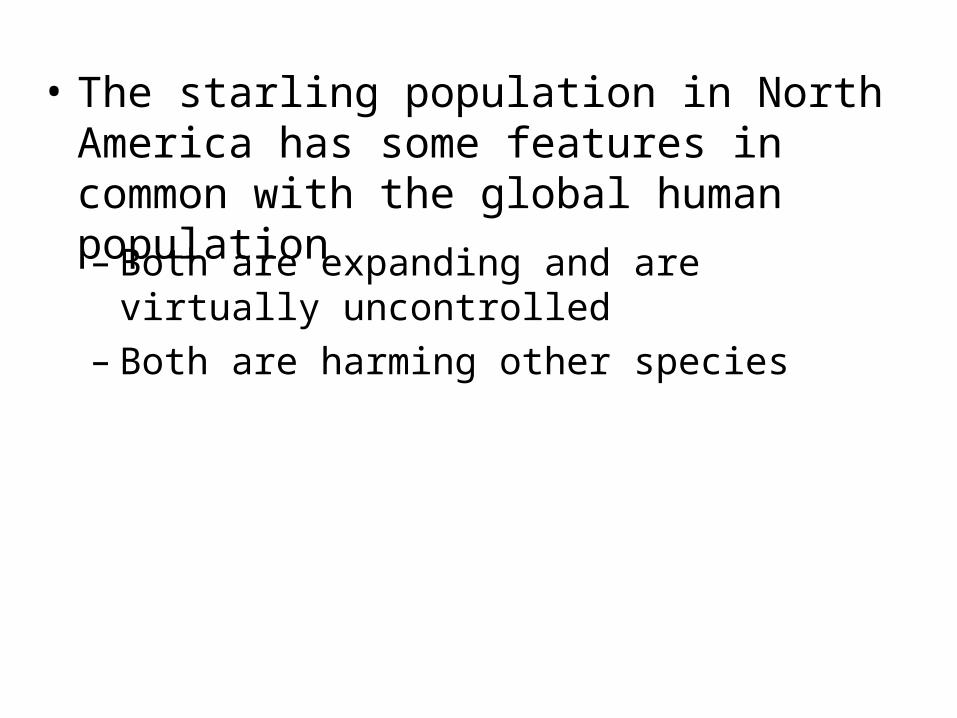
• The starling population in North America has some features in common with the global human population
– Both are expanding and are virtually uncontrolled– Both are harming other species
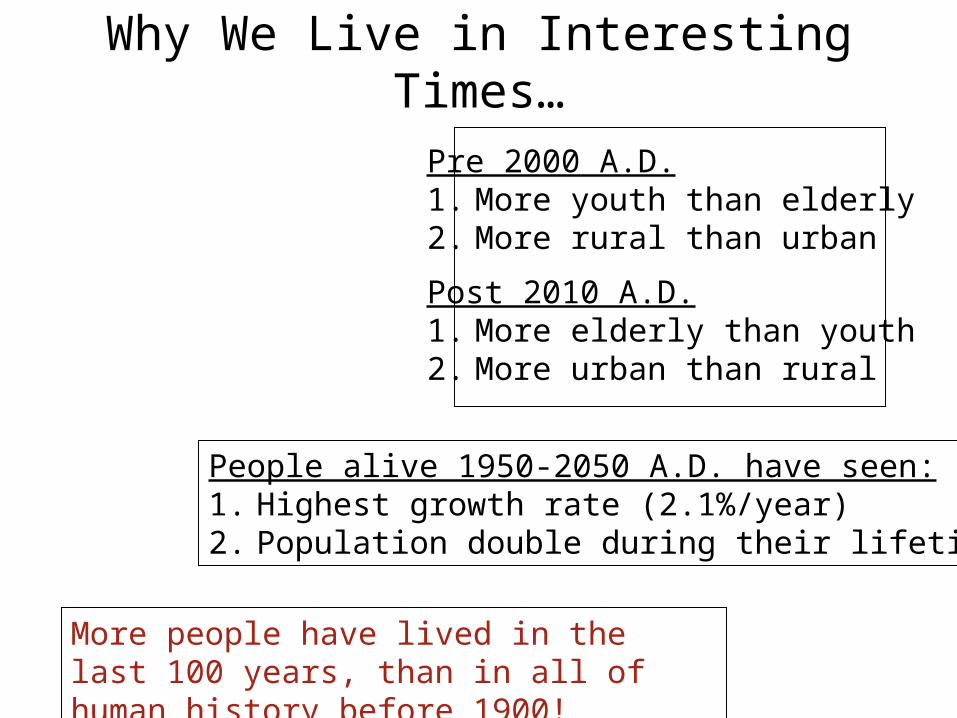
Why We Live in Interesting Times…
Pre 2000 A.D.1. More youth than elderly2. More rural than urban
Post 2010 A.D.1. More elderly than youth2. More urban than rural
People alive 1950-2050 A.D. have seen:1. Highest growth rate (2.1%/year)2. Population double during their lifetime
More people have lived in the last 100 years, than in all of human history before 1900!
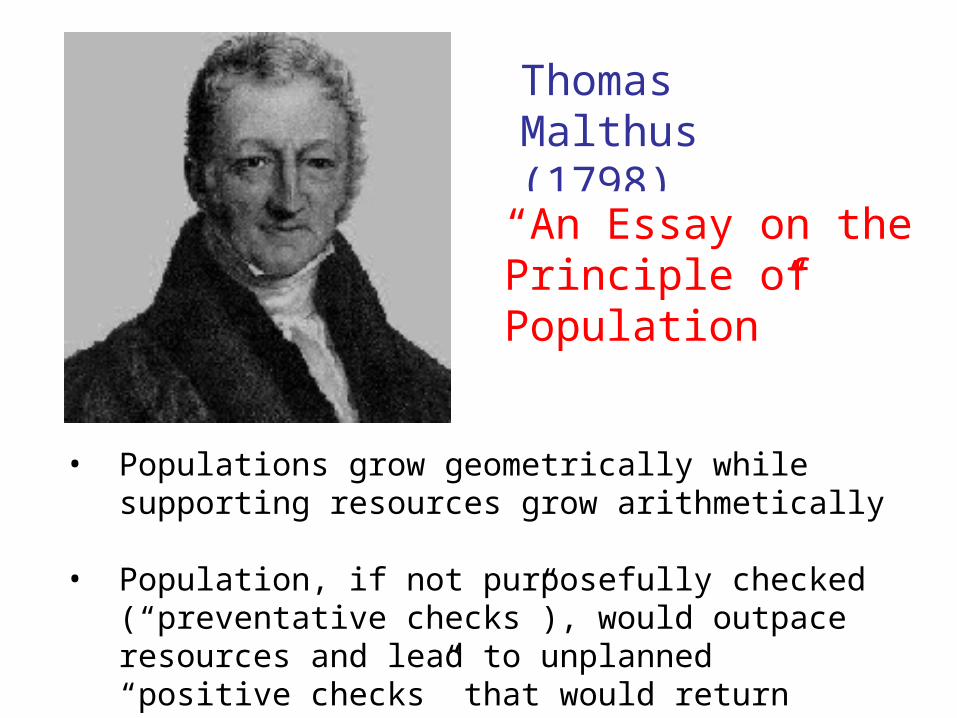
Thomas Malthus (1798)
• Populations grow geometrically while supporting resources grow arithmetically
• Population, if not purposefully checked (“preventative checks”), would outpace resources and lead to unplanned “positive checks” that would return population to sustainable levels
“An Essay on the Principle of Population”
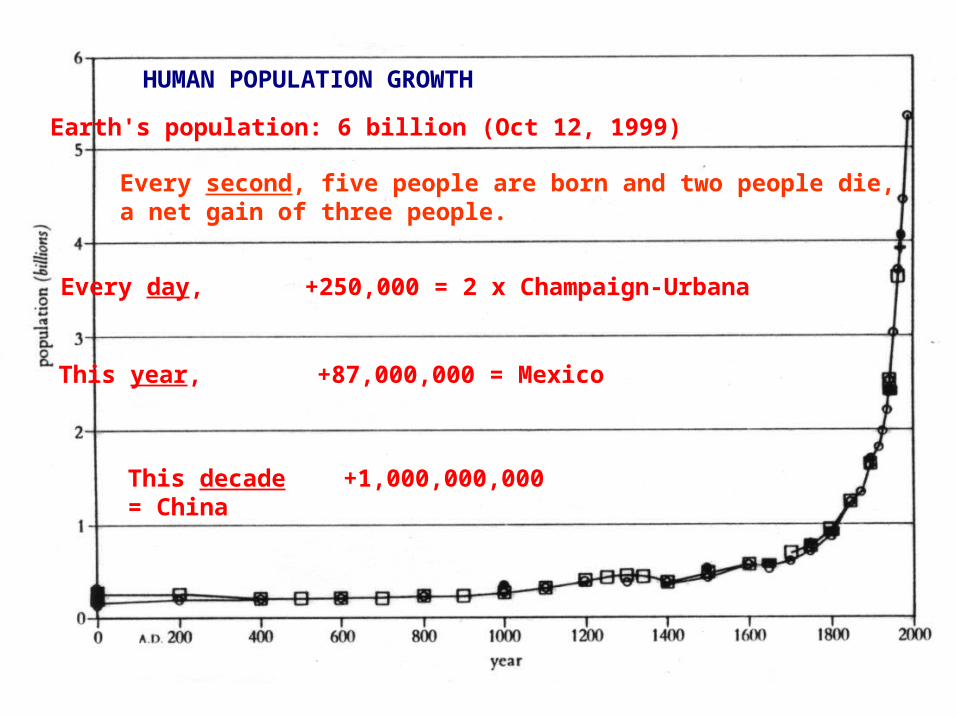
HUMAN POPULATION GROWTH
Earth's population: 6 billion (Oct 12, 1999)
Every second, five people are born and two people die, a net gain of three people.
Every day, +250,000 = 2 x Champaign-Urbana
This year, +87,000,000 = Mexico
This decade +1,000,000,000 = China
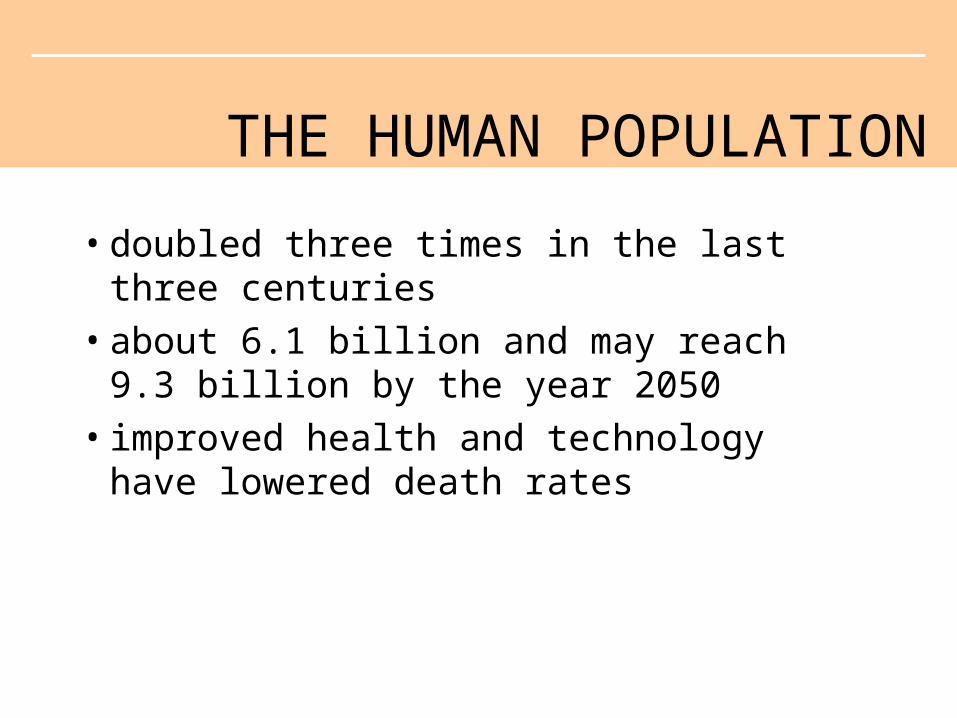
• doubled three times in the last three centuries
• about 6.1 billion and may reach 9.3 billion by the year 2050
• improved health and technology have lowered death rates
THE HUMAN POPULATION
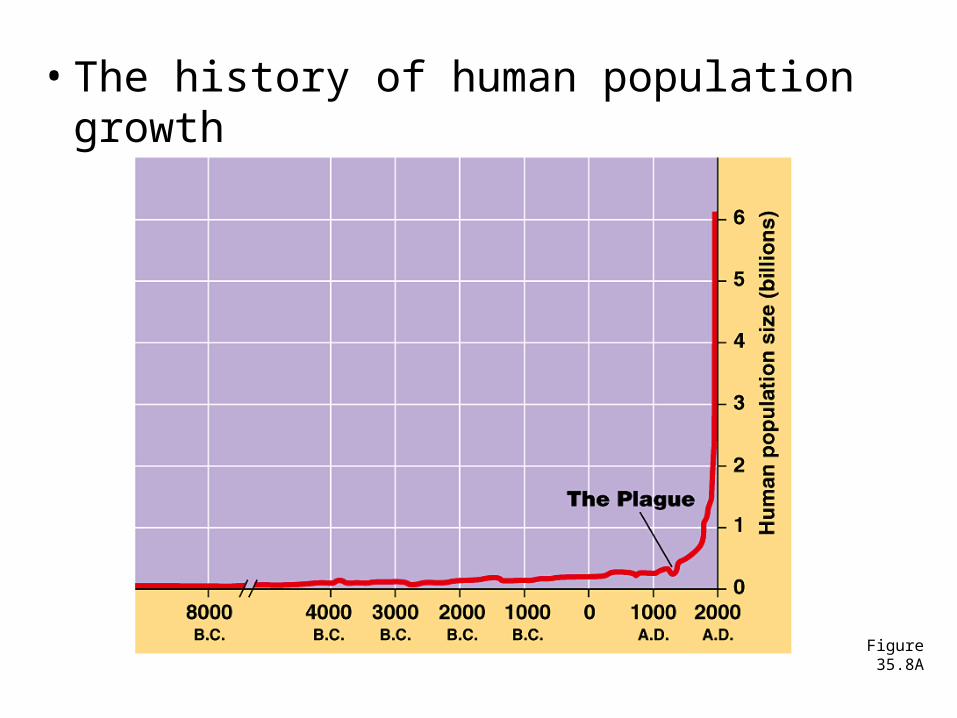
• The history of human population growth
Figure 35.8A
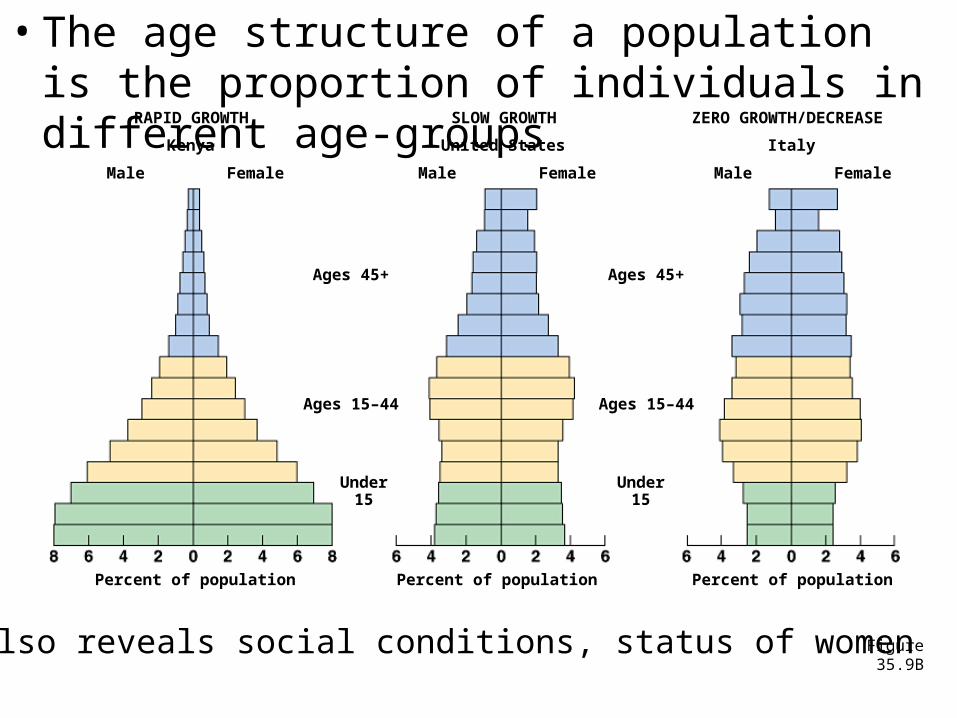
Figure 35.9B
RAPID GROWTH
Kenya
Male Female
Percent of population Percent of population Percent of population
SLOW GROWTH
United States
Male Female
ZERO GROWTH/DECREASE
Italy
Male Female
Ages 45+
Ages 15–44
Under15
Under15
Ages 45+
Ages 15–44
Also reveals social conditions, status of women
• The age structure of a population is the proportion of individuals in different age-groups
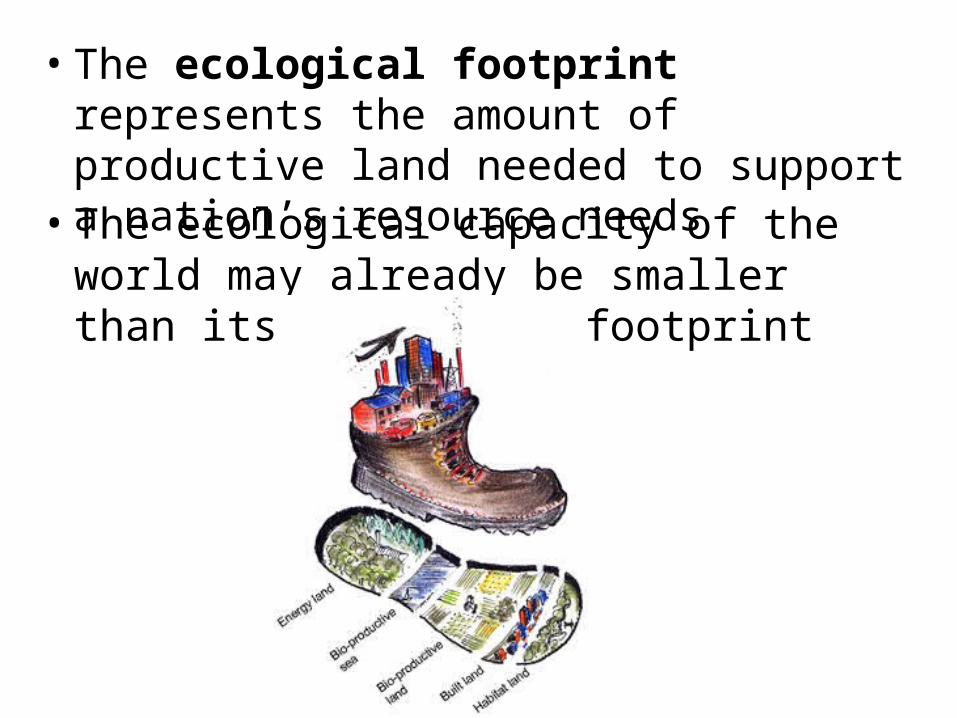
• The ecological footprint represents the amount of productive land needed to support a nation’s resource needs
• The ecological capacity of the world may already be smaller than its ecological footprint
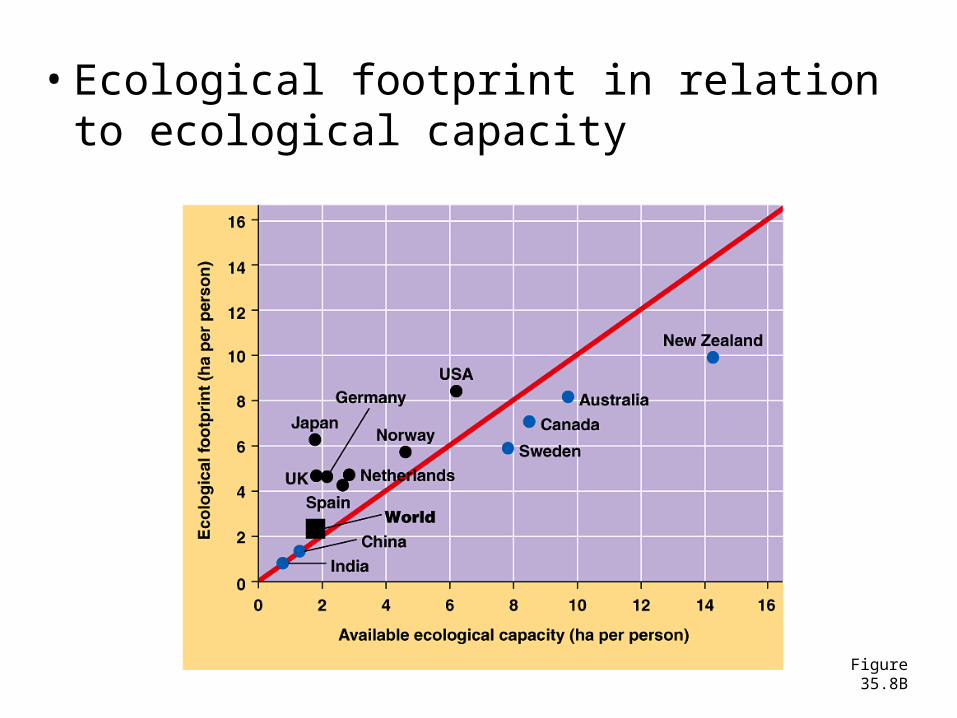
• Ecological footprint in relation to ecological capacity
Figure 35.8B
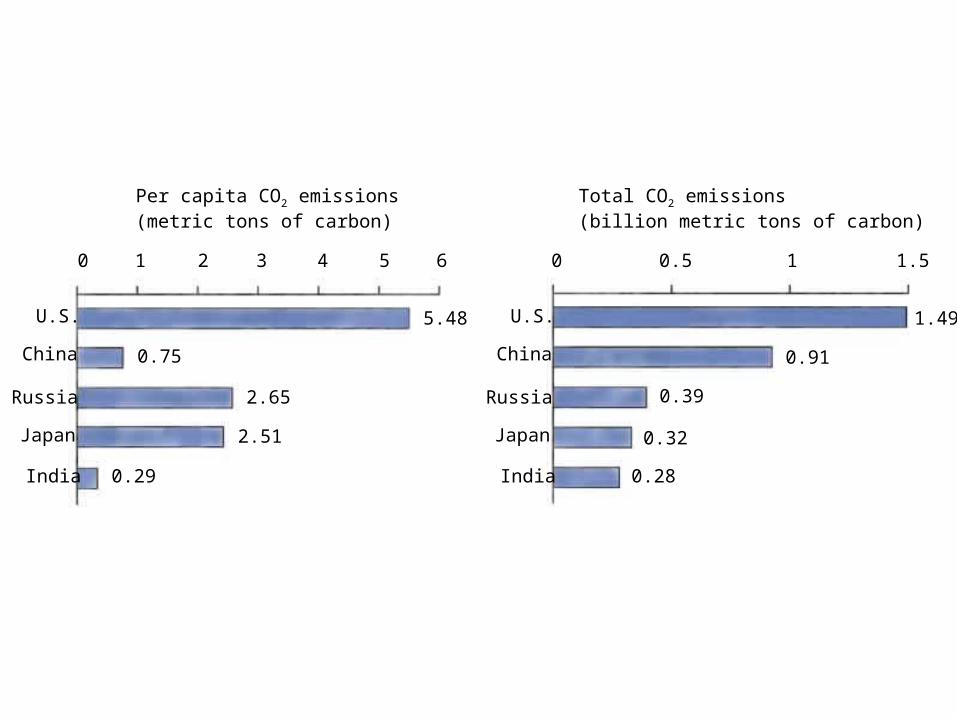
U.S.
China
India
Russia
Japan
U.S.
China
India
Russia
Japan
Per capita CO2 emissions(metric tons of carbon)
Total CO2 emissions(billion metric tons of carbon)
0 1 2 3 4 5 6 0 0.5 1 1.5
5.48
0.75
2.65
2.51
0.29
1.49
0.91
0.39
0.32
0.28
• What next?
Figure 2.10x