Embed Size (px)
Citation preview
Prepared by: Samantha R. Rosenthal, PhD, MPH, Anna Cimini, MA & Stephen L. Buka, ScD
Department of Epidemiology Brown University School of Public Health
On behalf of the Rhode Island State Epidemiology and Outcomes Workgroup
[December 2016]

INTRODUCTION
The purpose of this report is to identify and present documentation on substance use (i.e., alcohol,
tobacco, and other drugs) and mental health indicators for both adults and youth in the communities of
Rhode Island as compared to the State. In particular, we focus on demographics, prevalence indicators,
risk and protective factors, and consequences.
The report is designed to be used as a resource by various RI state agencies, such as the Department of
Behavioral Healthcare, Developmental Disabilities and Hospitals (BHDDH); the State Epidemiological
Outcomes Workgroup (SEOW); and the many community-based Substance Abuse Prevention Task Forces
in RI.
It is important to note that this is a working document. The Rhode Island Community Profiles 2016 is
understood to be an evolving document, to be improved and updated regularly both with additional
indicators and years of data, when available.
ACKNOWLEDGEMENTS
Thank you to SEOW membership and BHDDH staff. Funding for this report comes from the Substance
Abuse and Mental Health Services Administration Award number U579SP020159.
NOTE: For the purposes of this report “New Shoreham” and “Block Island” are synonymous and “Block Island” will be referenced throughout. Suggested Citation: Rosenthal SR, Cimini A, Buka SL. On behalf of the State Epidemiology and
Outcomes Workgroup of Rhode Island and the Department of Behavioral Healthcare, Developmental Disabilities and Hospitals. Rhode Island Community Profiles 2016. Cranston, RI: Department of Behavioral Healthcare, Developmental Disabilities and Hospitals, 2016.
The Brown University Team
Stephen Buka, ScD
Samantha Rosenthal, PhD, MPH
Anna Cimini, MA Department of Behavioral Healthcare, Developmental Disabilities and Hospitals
Rebecca Boss, MA, Interim Director
Elizabeth Kretchman, CPSS, Associate Administrator, Program Services and Community Engagement Unit
Linda Barovier, CPSS, Associate Administrator, Policy and Planning
Candace Rodgers, MPH, CHES, SPF-PFS Project Director
Daniel Fitzgerald, Rhode Island Prevention Coordinator
CONTENTS OF THE PROFILE
Overall Demographics
o Population per Square Mile in Rhode Island Communities o Gender Distribution in Rhode Island Communities o Age Distribution in Rhode Island Communities o Racial/Ethnic Distribution in Rhode Island Communities o Unemployment in Rhode Island Communities o Below Federal Poverty Level in Rhode Island Communities
Individual Profile
o Demographics o Prevalence – High School o Prevalence – Middle School o Risk and Protective Factors o Consequences – Overdose o Consequences – Substance Abuse Admissions o Consequences – Mental Health Admissions o Consequences – Suicidality

Source: 2014 American Communities Survey 5‐Year Aggregated Estimates
91921161211671801881892122142905045355385615886067487557918071,0081,1201,1701,2231,2371,285
1,7021,939
2,2272,312
2,8213,195
3,5203,666
5,3425,553
8,1979,652
15,043
0 2,000 4,000 6,000 8,000 10,000 12,000 14,000 16,000
FosterBlock Island
ExeterWest GreenwichLittle Compton
GlocesterRichmondHopkinton
CharlestownScituate
BurrillvilleNorth SmithfieldSouth Kingstown
TivertonJamestownCoventry
North KingstownPortsmouth
WesterlyEast Greenwich
SmithfieldRHODE ISLAND TOTAL
NarragansettLincoln
JohnstonMiddletownCumberland
WarrenBarrington
BristolWarwickCranstonNewport
East ProvidenceWest WarwickWoonsocket
North ProvidencePawtucketProvidenceCentral Falls
POPULATION PER SQUARE MILE IN RHODE ISLAND COMMUNITIES
Source: 2014 American Communities Survey 5-Year Aggregated Estimates
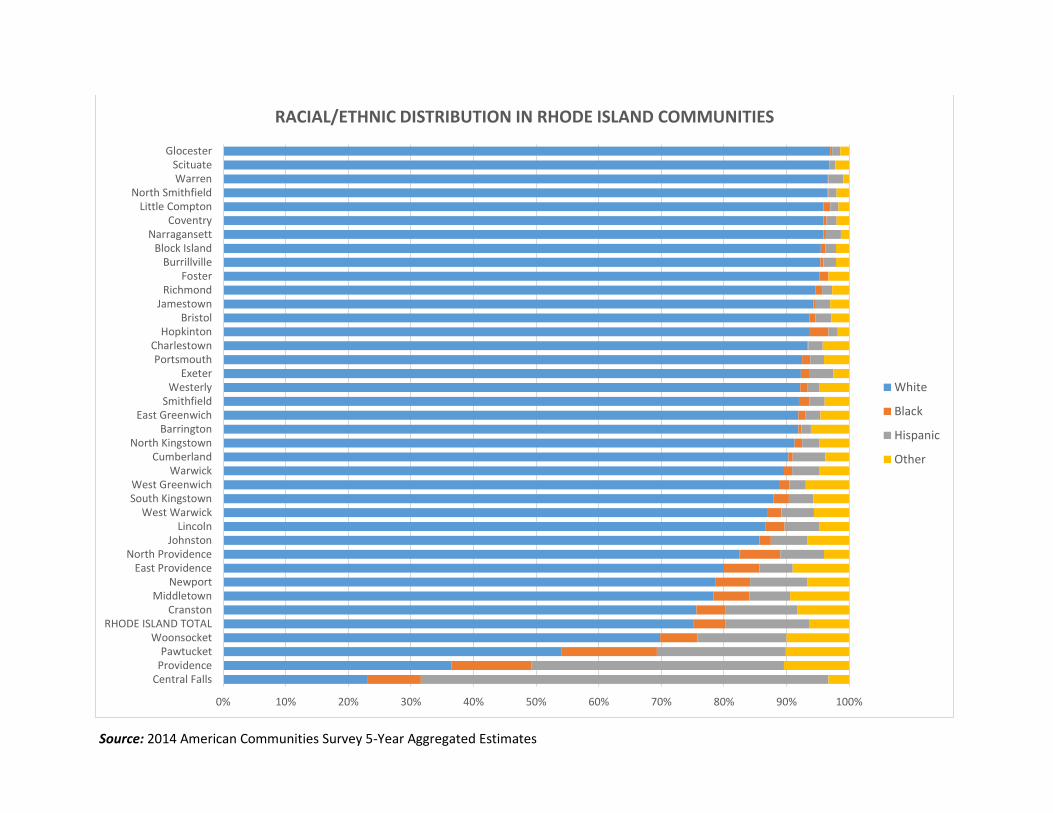
0% 10% 20% 30% 40% 50% 60% 70% 80% 90% 100%
HopkintonFoster
Central FallsCharlestown
ScituatePortsmouth
West GreenwichExeter
JamestownNarragansett
CranstonGlocester
WoonsocketWarren
NewportEast Greenwich
Block IslandPawtucket
CoventryNorth Kingstown
RHODE ISLAND TOTALLincoln
RichmondTiverton
CumberlandProvidence
MiddletownWarwick
West WarwickBristol
BurrillvilleJohnston
South KingstownBarrington
North ProvidenceEast Providence
SmithfieldWesterly
North SmithfieldLittle Compton
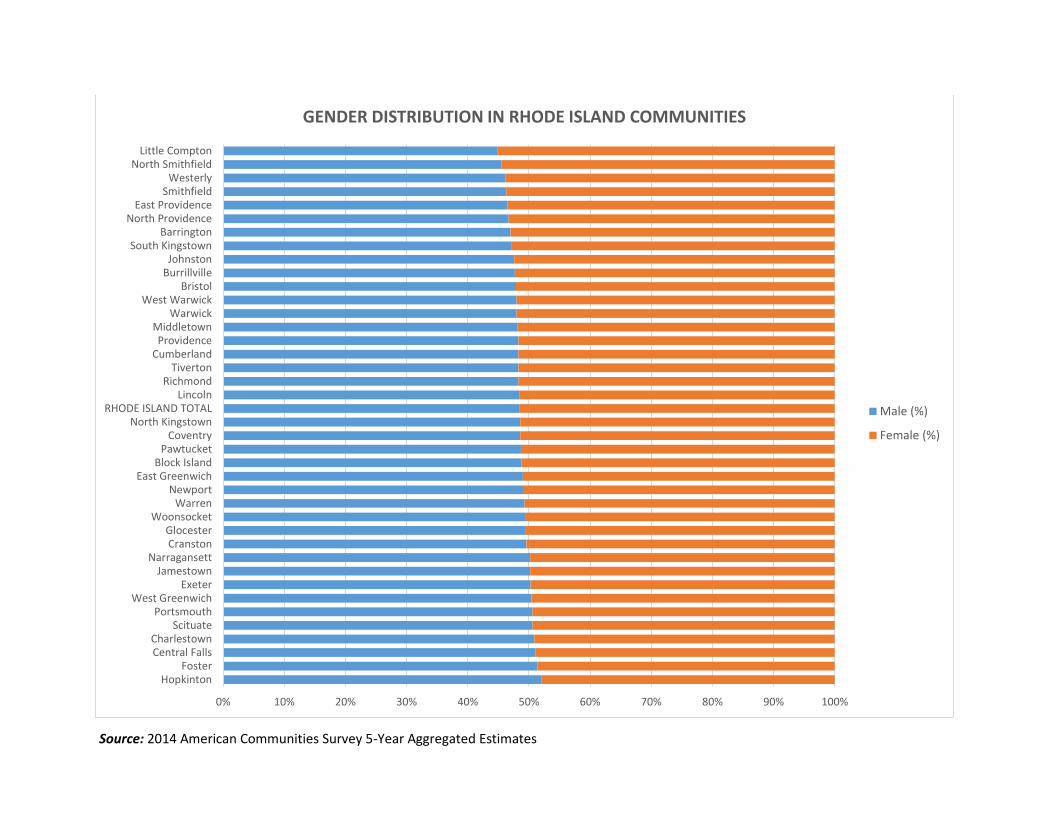
GENDER DISTRIBUTION IN RHODE ISLAND COMMUNITIES
Male (%)
Female (%)
Source: 2014 American Communities Survey 5‐Year Aggregated Estimates
0% 10% 20% 30% 40% 50% 60% 70% 80% 90% 100%
Central FallsWest Greenwich
BarringtonWoonsocketRichmond
MiddletownEast Greenwich
PawtucketProvidence
LincolnNorth KingstownEast Providence
BurrillvilleWest Warwick
WesterlyCumberland
RHODE ISLAND TOTALPortsmouth
CoventryWarren
CranstonScituateTiverton
Little ComptonGlocester
North SmithfieldCharlestown
JohnstonWarwick
HopkintonExeter
North ProvidenceSmithfieldJamestown
FosterSouth Kingstown
NewportBristol
NarragansettBlock Island
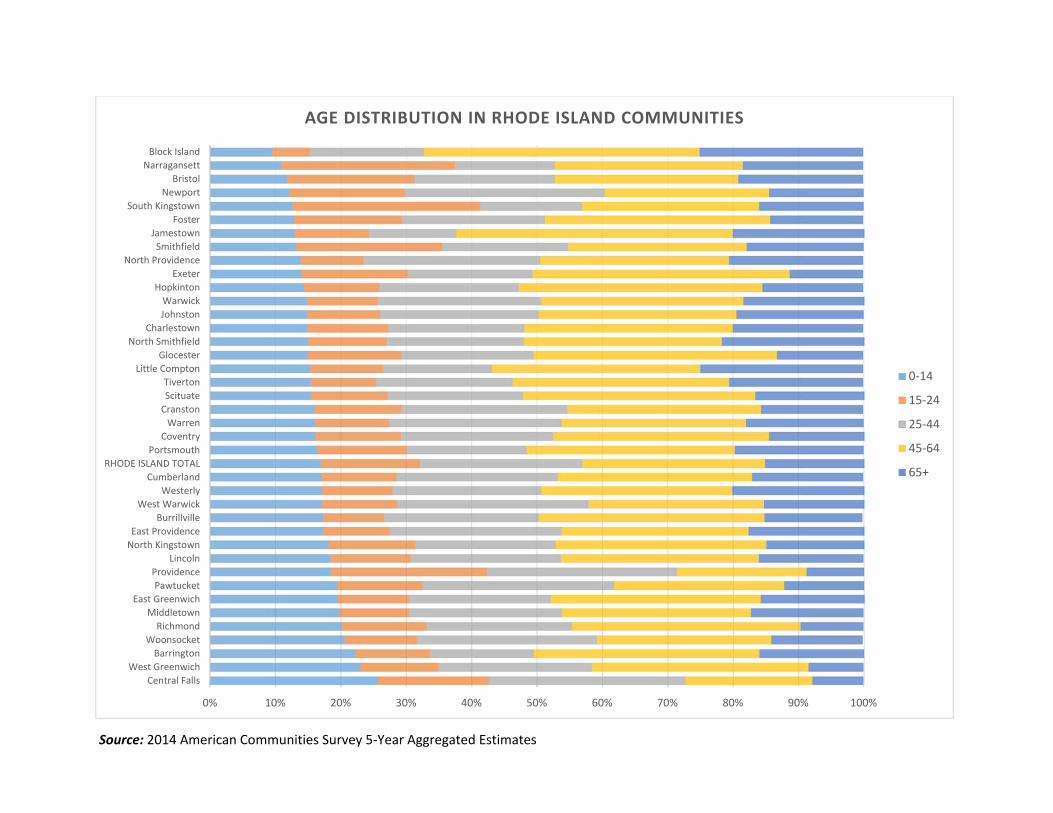
AGE DISTRIBUTION IN RHODE ISLAND COMMUNITIES
0‐14
15‐24
25‐44
45‐64
65+
Source: 2014 American Communities Survey 5-Year Aggregated Estimates
0% 10% 20% 30% 40% 50% 60% 70% 80% 90% 100%
Central FallsProvidencePawtucket
WoonsocketRHODE ISLAND TOTAL
CranstonMiddletown
NewportEast Providence
North ProvidenceJohnston
LincolnWest Warwick
South KingstownWest Greenwich
WarwickCumberland
North KingstownBarrington
East GreenwichSmithfield
WesterlyExeter
PortsmouthCharlestown
HopkintonBristol
JamestownRichmond
FosterBurrillville
Block IslandNarragansett
CoventryLittle Compton
North SmithfieldWarrenScituate
Glocester
RACIAL/ETHNIC DISTRIBUTION IN RHODE ISLAND COMMUNITIES
White
Black
Hispanic
Other
Source: 2014 American Communities Survey 5-Year Aggregated Estimates
2.40%2.60%
3.00%3.30%3.30%3.30%
3.40%3.80%
3.90%4.20%4.20%
4.30%4.40%
4.60%4.60%
4.70%4.70%
4.80%5.10%
5.20%5.20%5.20%5.20%
5.50%5.50%5.50%
5.60%5.90%
6.10%6.20%
6.40%6.80%
6.90%7.00%
7.70%7.90%
8.20%8.50%
8.80%9.30%
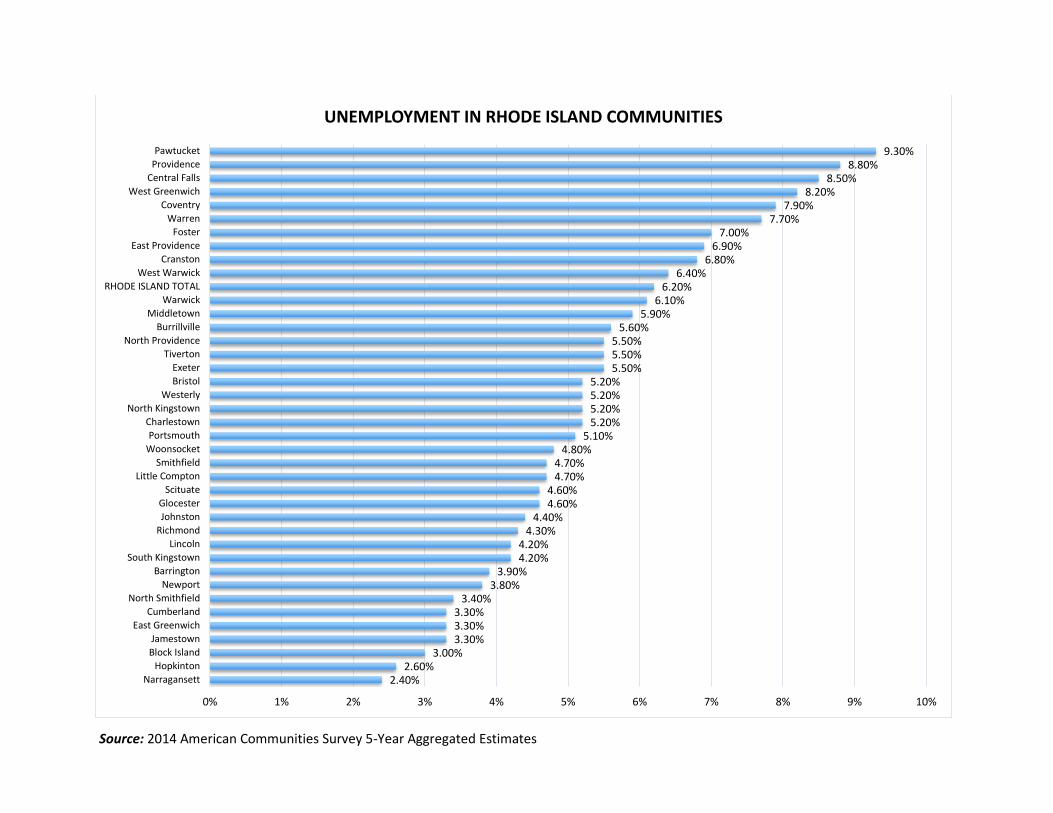
0% 1% 2% 3% 4% 5% 6% 7% 8% 9% 10%
Narragansett
Hopkinton
Block Island
Jamestown
East Greenwich
Cumberland
North Smithfield
Newport
Barrington
South Kingstown
Lincoln
Richmond
Johnston
Glocester
Scituate
Little Compton
Smithfield
Woonsocket
Portsmouth
Charlestown
North Kingstown
Westerly
Bristol
Exeter
Tiverton
North Providence
Burrillville
Middletown
Warwick
RHODE ISLAND TOTAL
West Warwick
Cranston
East Providence
Foster
Warren
Coventry
West Greenwich
Central Falls
Providence
Pawtucket
UNEMPLOYMENT IN RHODE ISLAND COMMUNITIES
Source: 2014 American Communities Survey 5-Year Aggregated Estimates
1.8%3.8%3.9%4.1%
4.6%5.0%
5.6%5.6%
6.0%6.1%6.1%6.2%
7.1%7.3%
7.9%8.0%8.2%8.3%8.3%
8.6%8.7%8.9%8.9%
9.4%10.0%10.0%
10.3%10.9%11.1%11.2%11.2%
11.5%11.5%
14.3%16.0%16.0%
21.4%26.1%
29.7%31.7%
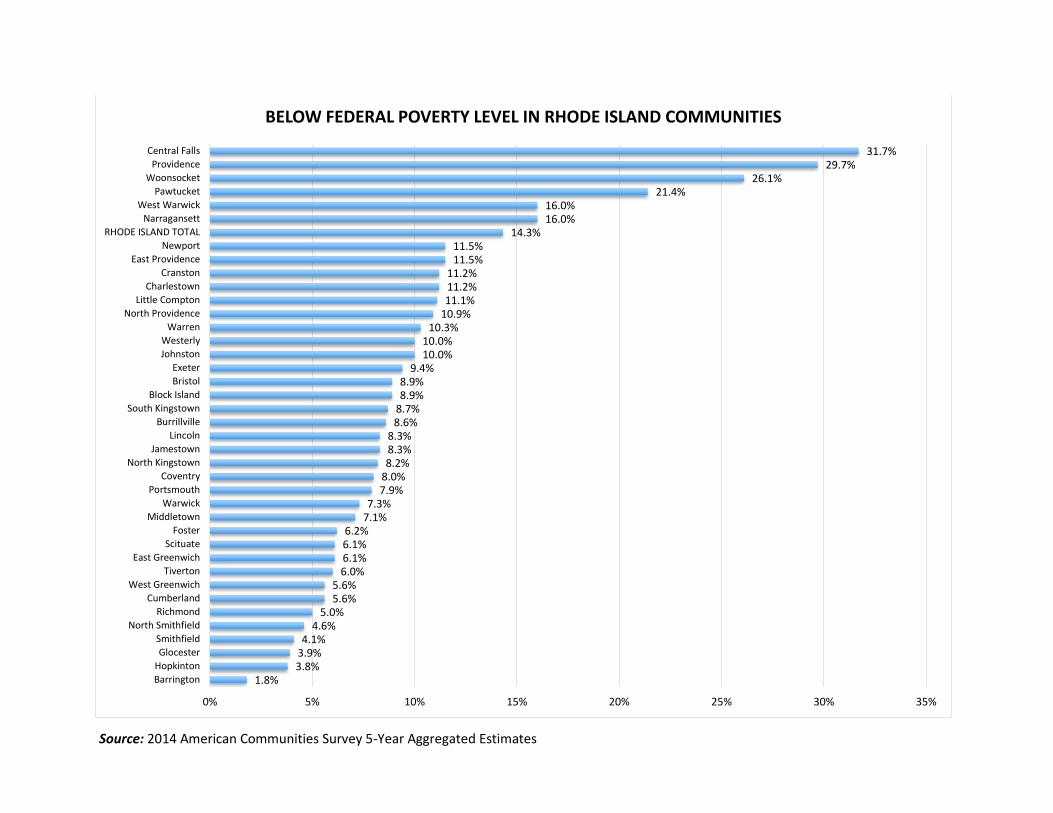
0% 5% 10% 15% 20% 25% 30% 35%
Barrington
Hopkinton
Glocester
Smithfield
North Smithfield
Richmond
Cumberland
West Greenwich
Tiverton
East Greenwich
Scituate
Foster
Middletown
Warwick
Portsmouth
Coventry
North Kingstown
Jamestown
Lincoln
Burrillville
South Kingstown
Block Island
Bristol
Exeter
Johnston
Westerly
Warren
North Providence
Little Compton
Charlestown
Cranston
East Providence
Newport
RHODE ISLAND TOTAL
Narragansett
West Warwick
Pawtucket
Woonsocket
Providence
Central Falls
BELOW FEDERAL POVERTY LEVEL IN RHODE ISLAND COMMUNITIES
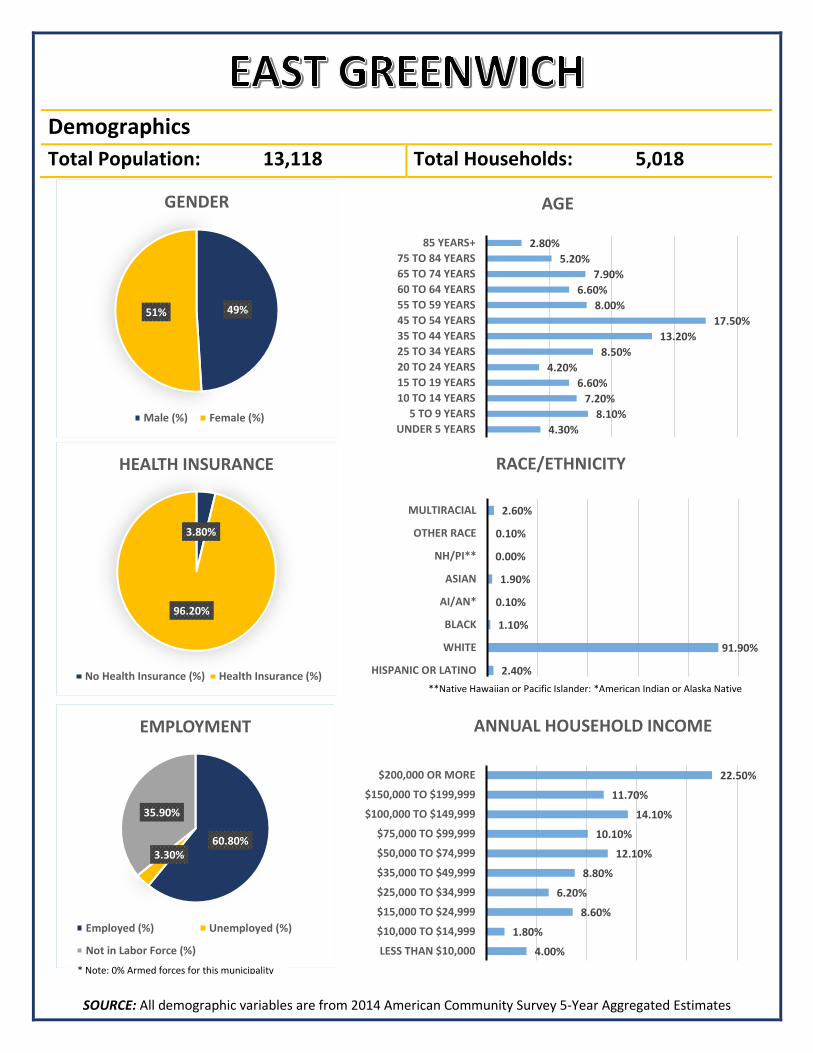
SOURCE: All demographic variables are from 2014 American Community Survey 5-Year Aggregated Estimates
2.40%
91.90%
1.10%
0.10%
1.90%
0.00%
0.10%
2.60%
HISPANIC OR LATINO
WHITE
BLACK
AI/AN*
ASIAN
NH/PI**
OTHER RACE
MULTIRACIAL
RACE/ETHNICITY
49%51%
GENDER
Male (%) Female (%)4.30%
8.10%
7.20%
6.60%
4.20%
8.50%
13.20%
17.50%
8.00%
6.60%
7.90%
5.20%
2.80%
UNDER 5 YEARS
5 TO 9 YEARS
10 TO 14 YEARS
15 TO 19 YEARS
20 TO 24 YEARS
25 TO 34 YEARS
35 TO 44 YEARS
45 TO 54 YEARS
55 TO 59 YEARS
60 TO 64 YEARS
65 TO 74 YEARS
75 TO 84 YEARS
85 YEARS+
AGE
3.80%
96.20%
HEALTH INSURANCE
No Health Insurance (%) Health Insurance (%)
60.80%3.30%
35.90%
EMPLOYMENT
Employed (%) Unemployed (%)
Not in Labor Force (%) 4.00%
1.80%
8.60%
6.20%
8.80%
12.10%
10.10%
14.10%
11.70%
22.50%
LESS THAN $10,000
$10,000 TO $14,999
$15,000 TO $24,999
$25,000 TO $34,999
$35,000 TO $49,999
$50,000 TO $74,999
$75,000 TO $99,999
$100,000 TO $149,999
$150,000 TO $199,999
$200,000 OR MORE
ANNUAL HOUSEHOLD INCOME
Demographics
Total Population: 13,118 Total Households: 5,018
**Native Hawaiian or Pacific Islander; *American Indian or Alaska Native
* Note: 0% Armed forces for this municipality
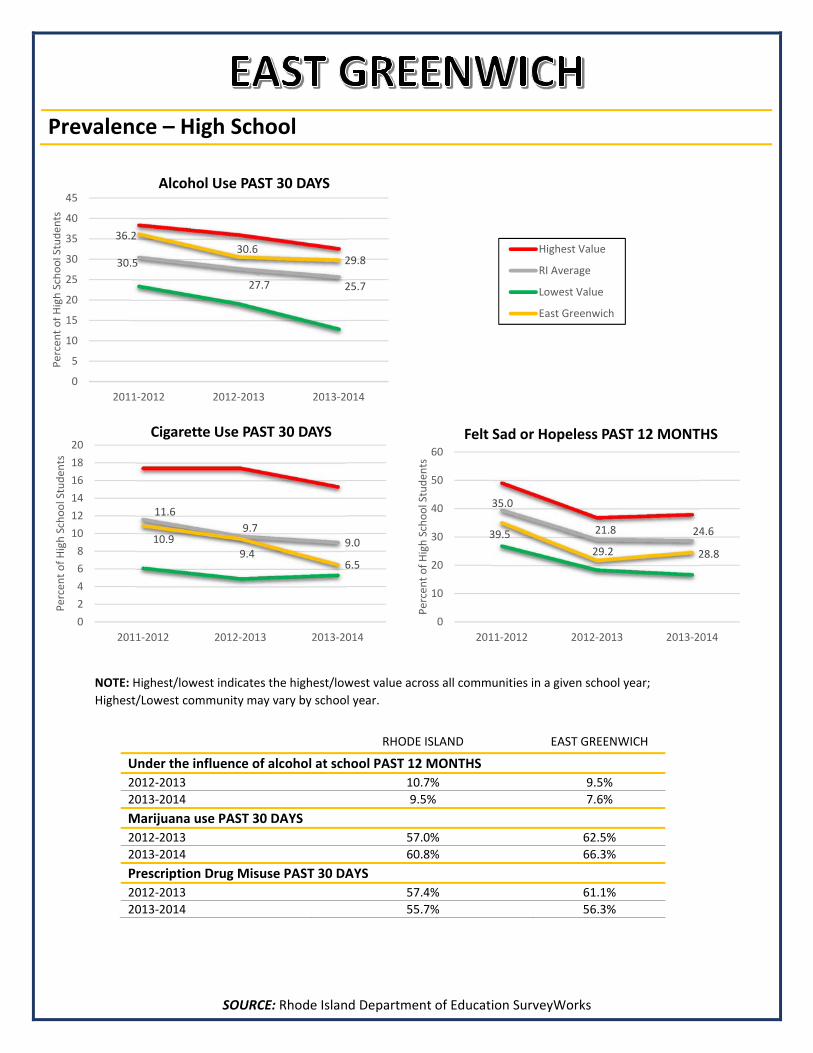
SOURCE: Rhode Island Department of Education SurveyWorks
Prevalence – High School
NOTE: Highest/lowest indicates the highest/lowest value across all communities in a given school year; Highest/Lowest community may vary by school year.
RHODE ISLAND EAST GREENWICH
Under the influence of alcohol at school PAST 12 MONTHS 2012‐2013 10.7% 9.5% 2013‐2014 9.5% 7.6% Marijuana use PAST 30 DAYS 2012‐2013 57.0% 62.5% 2013‐2014 60.8% 66.3% Prescription Drug Misuse PAST 30 DAYS 2012‐2013 57.4% 61.1% 2013‐2014 55.7% 56.3%
11.69.7
9.010.99.4
6.5
02468101214161820
2011‐2012 2012‐2013 2013‐2014
Percen
t of H
igh Scho
ol Stude
nts
Cigarette Use PAST 30 DAYS
39.529.2 28.8
35.0
21.8 24.6
0
10
20
30
40
50
60
2011‐2012 2012‐2013 2013‐2014
Percen
t of H
igh Scho
ol Stude
nts
Felt Sad or Hopeless PAST 12 MONTHS
30.5
27.7 25.7
36.230.6
29.8
0
5
10
15
20
25
30
35
40
45
2011‐2012 2012‐2013 2013‐2014
Percen
t of H
igh Scho
ol Stude
nts
Alcohol Use PAST 30 DAYS
Highest Value
RI Average
Lowest Value
East Greenwich
SOURCE: Rhode Island Department of Education SurveyWorks
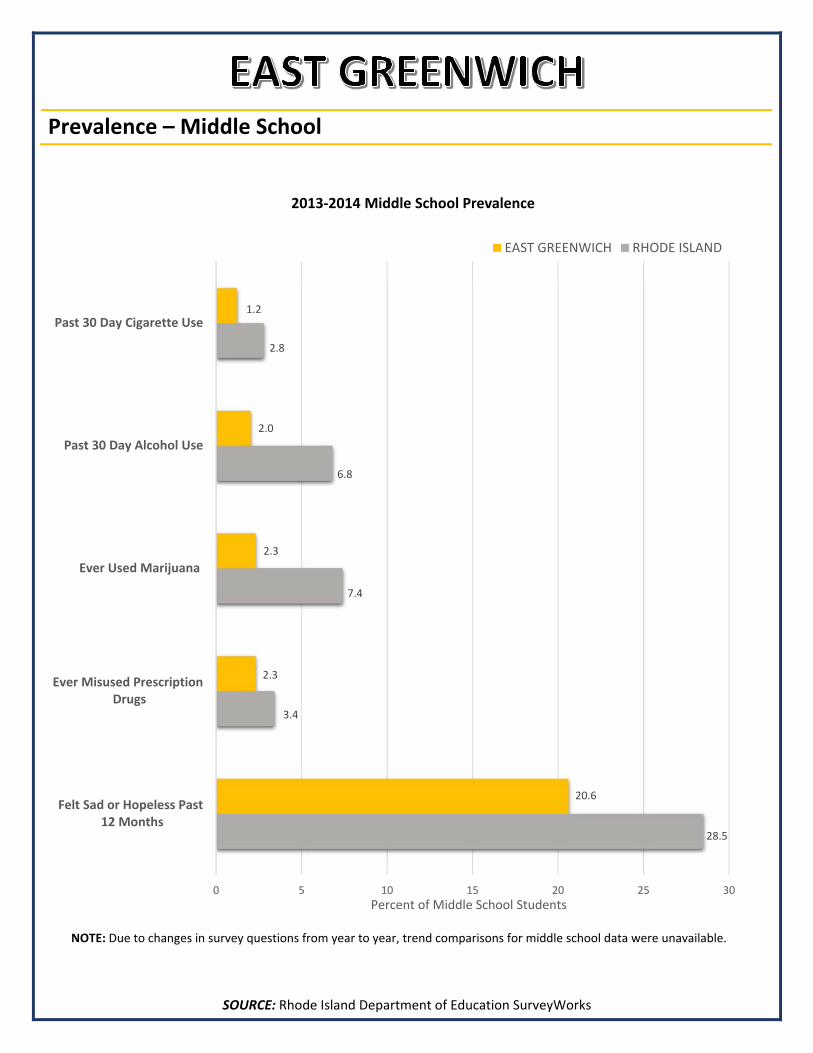
Prevalence – Middle School
NOTE: Due to changes in survey questions from year to year, trend comparisons for middle school data were unavailable.
28.5
3.4
7.4
6.8
2.8
20.6
2.3
2.3
2.0
1.2
0 5 10 15 20 25 30
Felt Sad or Hopeless Past 12 Months
Ever Misused Prescription Drugs
Ever Used Marijuana
Past 30 Day Alcohol Use
Past 30 Day Cigarette Use
Percent of Middle School Students
2013‐2014 Middle School Prevalence
EAST GREENWICH RHODE ISLAND
SOURCE: Rhode Island Department of Education SurveyWorks
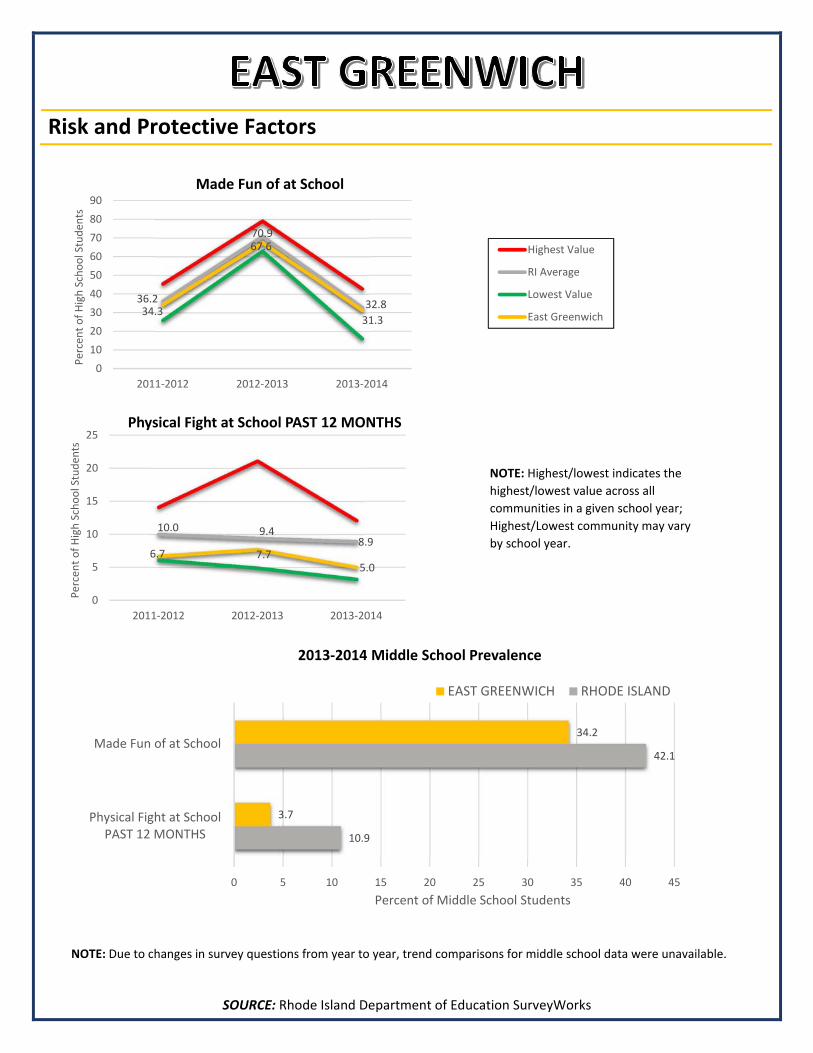
Risk and Protective Factors
NOTE: Highest/lowest indicates the highest/lowest value across all communities in a given school year; Highest/Lowest community may vary by school year.
36.2
70.9
32.834.3
67.6
31.3
0102030405060708090
2011‐2012 2012‐2013 2013‐2014
Percen
t of H
igh Scho
ol Stude
nts
Made Fun of at School
Highest Value
RI Average
Lowest Value
East Greenwich
10.0 9.48.9
6.7 7.75.0
0
5
10
15
20
25
2011‐2012 2012‐2013 2013‐2014
Percen
t of H
igh Scho
ol Stude
nts
Physical Fight at School PAST 12 MONTHS
10.9
42.1
3.7
34.2
0 5 10 15 20 25 30 35 40 45
Physical Fight at SchoolPAST 12 MONTHS
Made Fun of at School
Percent of Middle School Students
2013‐2014 Middle School Prevalence
EAST GREENWICH RHODE ISLAND
NOTE: Due to changes in survey questions from year to year, trend comparisons for middle school data were unavailable.
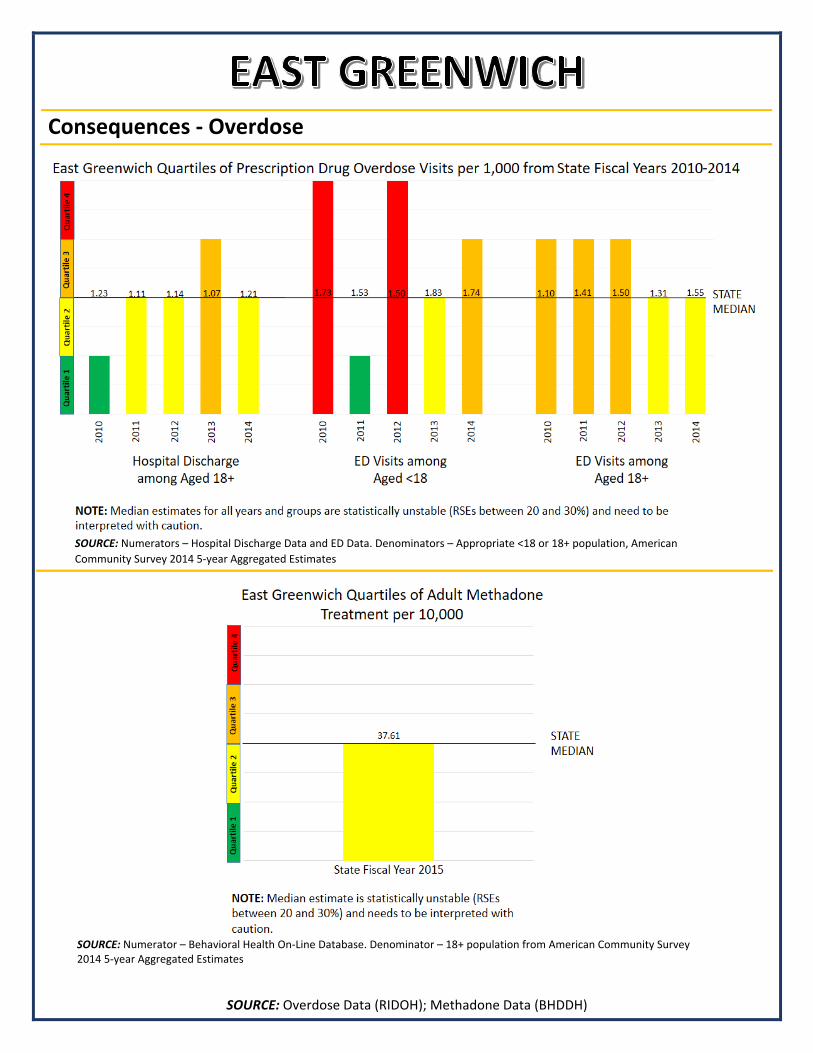
SOURCE: Overdose Data (RIDOH); Methadone Data (BHDDH)
Consequences ‐ Overdose
SOURCE: Numerators – Hospital Discharge Data and ED Data. Denominators – Appropriate <18 or 18+ population, American Community Survey 2014 5‐year Aggregated Estimates
SOURCE: Numerator – Behavioral Health On‐Line Database. Denominator – 18+ population from American Community Survey 2014 5‐year Aggregated Estimates
SOURCE: Behavioral Health On‐Line Database (BHDDH)
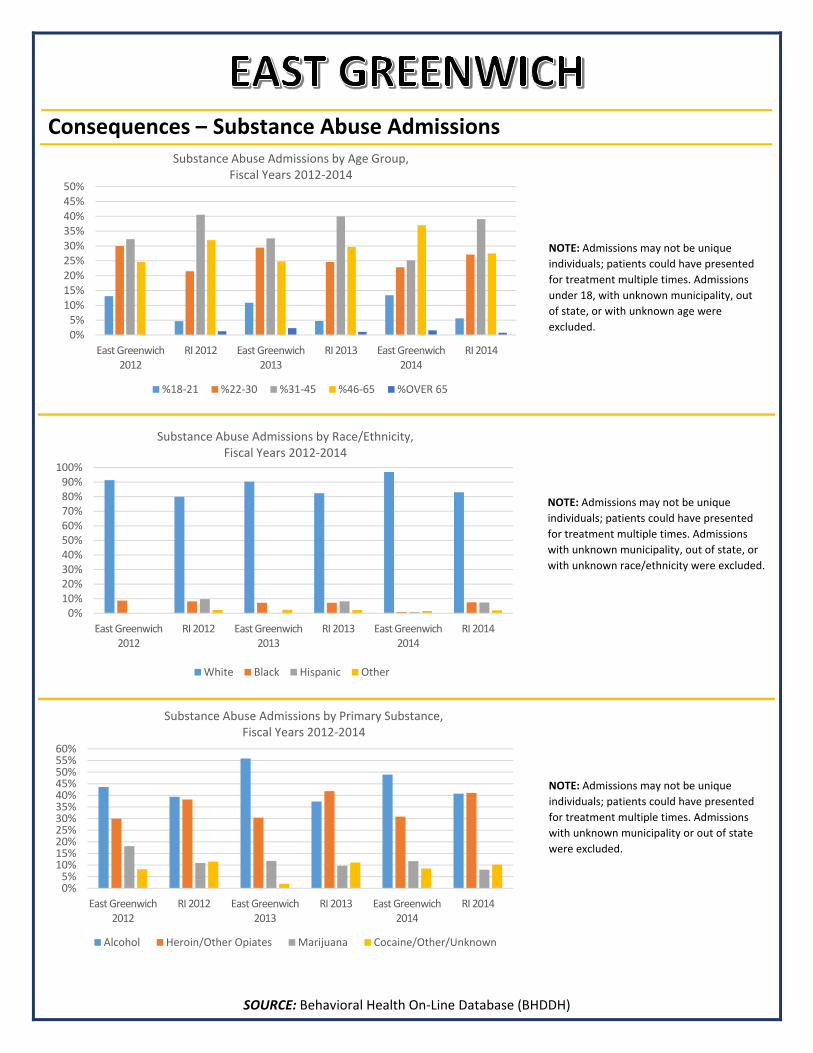
0%5%10%15%20%25%30%35%40%45%50%
East Greenwich 2012
RI 2012 East Greenwich 2013
RI 2013 East Greenwich 2014
RI 2014
Substance Abuse Admissions by Age Group, Fiscal Years 2012‐2014
%18‐21 %22‐30 %31‐45 %46‐65 %OVER 65
Consequences – Substance Abuse Admissions
0%10%20%30%40%50%60%70%80%90%100%
East Greenwich 2012
RI 2012 East Greenwich 2013
RI 2013 East Greenwich 2014
RI 2014
Substance Abuse Admissions by Race/Ethnicity, Fiscal Years 2012‐2014
White Black Hispanic Other
0%5%10%15%20%25%30%35%40%45%50%55%60%
East Greenwich 2012
RI 2012 East Greenwich 2013
RI 2013 East Greenwich 2014
RI 2014
Substance Abuse Admissions by Primary Substance, Fiscal Years 2012‐2014
Alcohol Heroin/Other Opiates Marijuana Cocaine/Other/Unknown
NOTE: Admissions may not be unique individuals; patients could have presented for treatment multiple times. Admissions under 18, with unknown municipality, out of state, or with unknown age were excluded.
NOTE: Admissions may not be unique individuals; patients could have presented for treatment multiple times. Admissions with unknown municipality, out of state, or with unknown race/ethnicity were excluded.
NOTE: Admissions may not be unique individuals; patients could have presented for treatment multiple times. Admissions with unknown municipality or out of state were excluded.
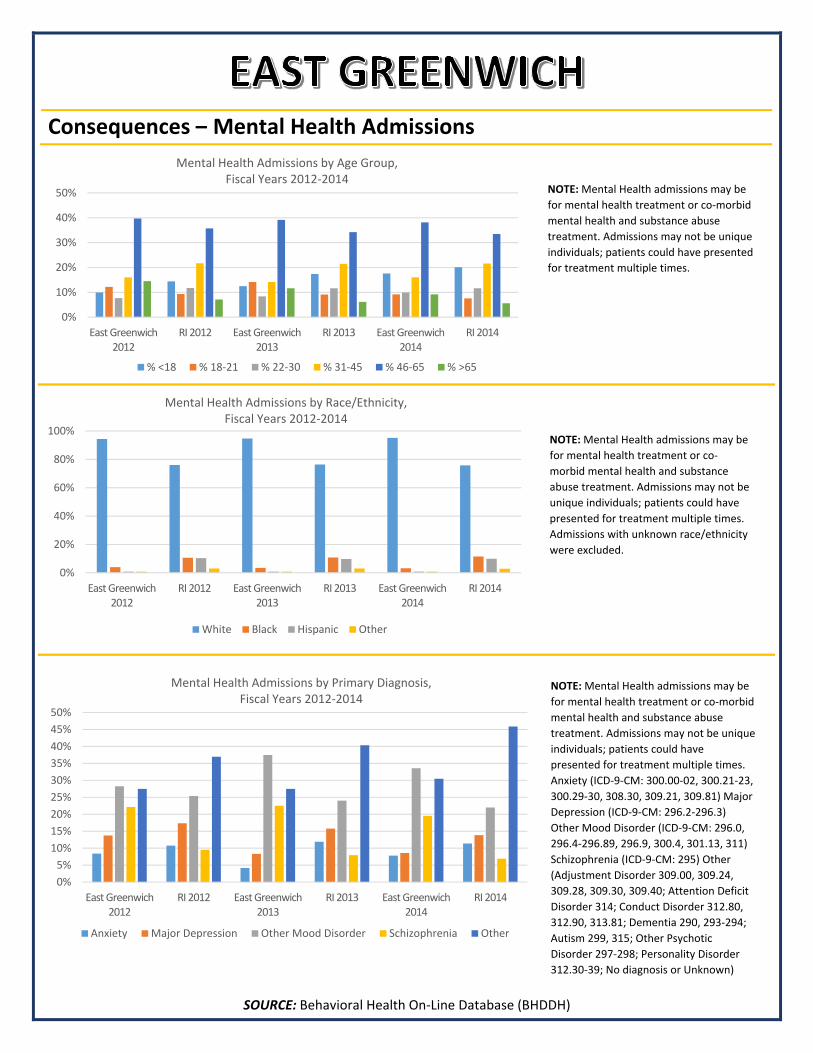
SOURCE: Behavioral Health On‐Line Database (BHDDH)
Consequences – Mental Health Admissions
0%
10%
20%
30%
40%
50%
East Greenwich 2012
RI 2012 East Greenwich 2013
RI 2013 East Greenwich 2014
RI 2014
Mental Health Admissions by Age Group, Fiscal Years 2012‐2014
% <18 % 18‐21 % 22‐30 % 31‐45 % 46‐65 % >65
0%
20%
40%
60%
80%
100%
East Greenwich 2012
RI 2012 East Greenwich 2013
RI 2013 East Greenwich 2014
RI 2014
Mental Health Admissions by Race/Ethnicity, Fiscal Years 2012‐2014
White Black Hispanic Other
0%5%10%15%20%25%30%35%40%45%50%
East Greenwich 2012
RI 2012 East Greenwich 2013
RI 2013 East Greenwich 2014
RI 2014
Mental Health Admissions by Primary Diagnosis, Fiscal Years 2012‐2014
Anxiety Major Depression Other Mood Disorder Schizophrenia Other
NOTE: Mental Health admissions may be for mental health treatment or co‐morbid mental health and substance abuse treatment. Admissions may not be unique individuals; patients could have presented for treatment multiple times.
NOTE: Mental Health admissions may be for mental health treatment or co‐morbid mental health and substance abuse treatment. Admissions may not be unique individuals; patients could have presented for treatment multiple times. Admissions with unknown race/ethnicity were excluded.
NOTE: Mental Health admissions may be for mental health treatment or co‐morbid mental health and substance abuse treatment. Admissions may not be unique individuals; patients could have presented for treatment multiple times. Anxiety (ICD‐9‐CM: 300.00‐02, 300.21‐23, 300.29‐30, 308.30, 309.21, 309.81) Major Depression (ICD‐9‐CM: 296.2‐296.3) Other Mood Disorder (ICD‐9‐CM: 296.0, 296.4‐296.89, 296.9, 300.4, 301.13, 311) Schizophrenia (ICD‐9‐CM: 295) Other (Adjustment Disorder 309.00, 309.24, 309.28, 309.30, 309.40; Attention Deficit Disorder 314; Conduct Disorder 312.80, 312.90, 313.81; Dementia 290, 293‐294; Autism 299, 315; Other Psychotic Disorder 297‐298; Personality Disorder 312.30‐39; No diagnosis or Unknown)
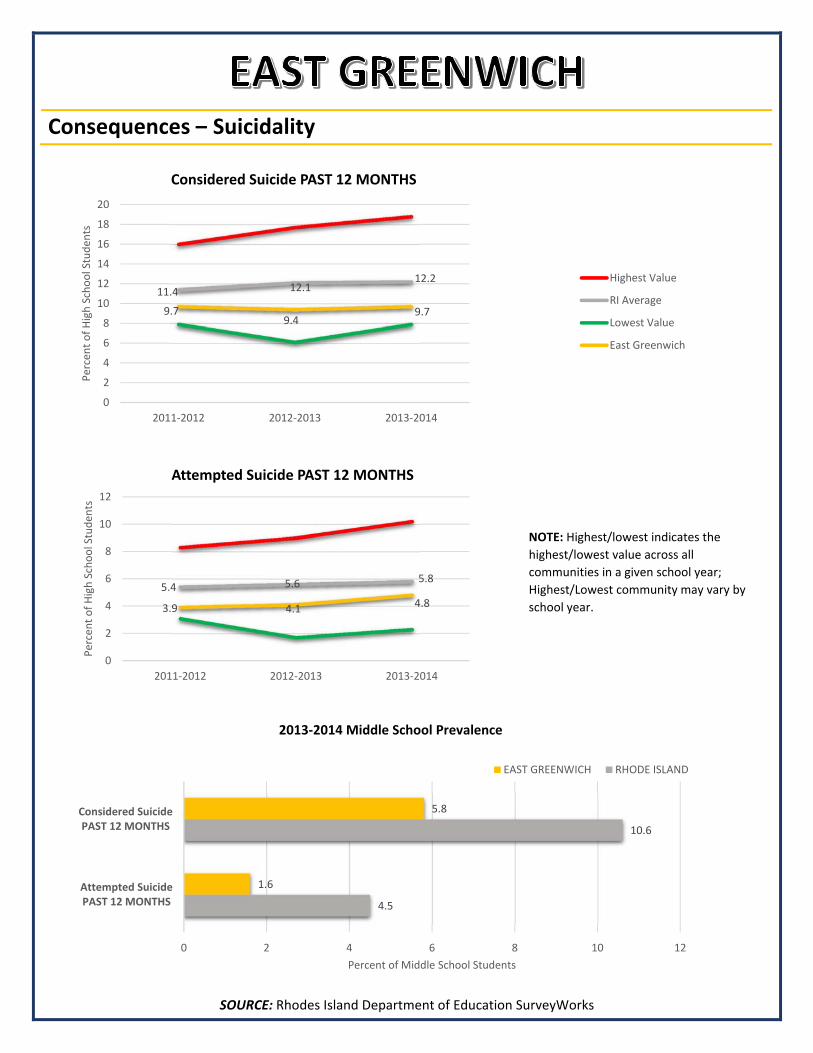
SOURCE: Rhodes Island Department of Education SurveyWorks
Consequences – Suicidality
NOTE: Highest/lowest indicates the highest/lowest value across all communities in a given school year; Highest/Lowest community may vary by school year.
11.4 12.112.2
9.79.4
9.7
0
2
4
6
8
10
12
14
16
18
20
2011‐2012 2012‐2013 2013‐2014
Percen
t of H
igh Scho
ol Stude
nts
Considered Suicide PAST 12 MONTHS
Highest Value
RI Average
Lowest Value
East Greenwich
4.5
10.6
1.6
5.8
0 2 4 6 8 10 12
Attempted SuicidePAST 12 MONTHS
Considered SuicidePAST 12 MONTHS
Percent of Middle School Students
2013‐2014 Middle School Prevalence
EAST GREENWICH RHODE ISLAND
5.4 5.6 5.8
3.9 4.1 4.8
0
2
4
6
8
10
12
2011‐2012 2012‐2013 2013‐2014
Percen
t of H
igh Scho
ol Stude
nts
Attempted Suicide PAST 12 MONTHS