Embed Size (px)
Citation preview
Real-time photoacoustic imagingsystem for burn diagnosis
Taiichiro IdaYasushi KawaguchiSatoko KawauchiKeiichi IwayaHitoshi TsudaDaizoh SaitohShunichi SatoToshiaki Iwai
Downloaded From: https://www.spiedigitallibrary.org/journals/Journal-of-Biomedical-Optics on 5/30/2018 Terms of Use: https://www.spiedigitallibrary.org/terms-of-use
Real-time photoacoustic imaging system for burndiagnosis
Taiichiro Ida,a,* Yasushi Kawaguchi,a Satoko Kawauchi,b Keiichi Iwaya,c Hitoshi Tsuda,c Daizoh Saitoh,dShunichi Sato,b and Toshiaki IwaieaNew Concept Product Initiative, Advantest Corporation, 1-5, Shin-tone, Kazo-shi, Saitama 349-1158, JapanbNational Defense Medical College Research Institute, Division of Biomedical Information Sciences, 3-2, Namiki,Tokorozawa-shi, Saitama 359-8513, JapancNational Defense Medical College Research Institute, Department of Basic Pathology, 3-2, Namiki, Tokorozawa-shi, Saitama 359-8513, JapandNational Defense Medical College Research Institute, Division of Basic Traumatology, 3-2, Namiki, Tokorozawa-shi, Saitama 359-8513, JapaneTokyo University of Agriculture and Technology, Graduate School of Bio-Applications and Systems Engineering, 2-24-6, Naka-cho,Koganei-shi, Tokyo 184-8588, Japan
Abstract. We have developed a real-time (8 to 30 fps) photoacoustic (PA) imaging system with a linear-arraytransducer for burn depth assessment. In this system, PA signals originating from blood in the noninjured tissuelayer located under the injured tissue layer are detected and imaged. A compact home-made high-repetition-rate(500 Hz) 532-nm fiber laser was incorporated as a light source. We used an alternating arrangement for thefibers and sensor elements in the probe, which improved the signal-to-noise ratio, reducing the requiredlaser energy power for PA excitation. This arrangement also enabled a hand-held light-weight probe design.A phantom study showed that thin light absorbers embedded in the tissue-mimicking scattering medium atdepths >3 mm can be imaged with high contrast. The maximum error for depth measurement was 140 μm.Diagnostic experiments were performed for rat burn models, including superficial dermal burn, deep dermalburn, and deep burn models. Injury depths (zones of stasis) indicated by PA imaging were compared withthose estimated by histological analysis, showing discrepancies <200 μm. The system was also used to monitorthe healing process of a deep dermal burn. The results demonstrate the potential usefulness of the presentsystem for clinical burn diagnosis. © The Authors. Published by SPIE under a Creative Commons Attribution 3.0 Unported License.
Distribution or reproduction of this work in whole or in part requires full attribution of the original publication, including its DOI. [DOI: 10.1117/1
.JBO.19.8.086013]
Keywords: photoacoustic imaging; real time; burn depth assessment; zone of stasis; phantom; rat burn model.
Paper 140168PR received Mar. 13, 2014; revised manuscript received Jun. 18, 2014; accepted for publication Jul. 23, 2014; pub-lished online Aug. 15, 2014.
1 IntroductionFor severe burn patients, the depth and area of injury are twocrucial factors determining long-term function and mortality.In terms of injury depth, burns are classified into epidermalburn, superficial dermal burn (SDB), deep dermal burn(DDB), and deep burn (DB). The treatment plan and strategydiffer depending on the injury depth. In cases of DDB, inwhich injury reaches the deep dermis, the injury is often exac-erbated by infection, and antibiotic treatment is important. Incases of DB (full thickness burn), spontaneous tissue regener-ation does not occur and skin grafting is required. Thus, differ-entiation between SDB and DDB and differentiation betweenDDB and DB are crucially important in a clinical situation.Currently, however, diagnosis of burn depths mainly relies onvisual observation, which is often difficult and inaccurate.Thus, many efforts have been made to develop a valid systemfor clinical burn diagnosis. Various systems, including a laserDoppler blood flow imager,1 polarization-sensitive opticalcoherence tomography,2 and a video microscope,3 have beendeveloped and tested, but their measurement depths are limitedto ∼1 mm or less, which is not sufficient for human skin diag-nosis, or the measurement is not quantitative in principle.
Photoacoustic (PA) burn diagnosis was first reported by Satoet al.4 In this method, PA signals originating from blood in thenoninjured tissue layer, which is located under the injured tissuelayer with blood occlusion (zone of stasis), are detected. Sincehyperemia occurs just under the zone of stasis, we can obtainhigh-contrast PA signals indicating the depth of injury.Experiments using rat burn models showed the validity ofthis method. In those experiments, however, the measurementdepth was limited to ∼2 mm and a single-element transducerwas used, with which real-time imaging was not possible. Inthis study, we developed a real-time PA imaging system witha measurement depth >3 mm as a prototype for clinical burndiagnosis.
We intended to make a movable whole-in-one type systemwith a handheld probe that resembles conventional ultrasoundimaging probes for ease of handling by clinicians. Varioustypes of PA imaging systems have been developed and exam-ined for burn depth assessment, including an acoustic-resolutionPA microscopy system5 and a system based on a 128-elementlinear sensor array.6 To the authors’ knowledge, however, amovable whole-in-one PA burn diagnostic system with a hand-held probe has not yet been reported. In this paper, the designand structure of the system and the results of experiments usingoriginally made skin tissue phantoms and rat burn models aredescribed. The system was also used to monitor the healingprocess of a burn in a rat, providing some new insights.
*Address all correspondence to: Taiichiro Ida, E-mail: [email protected]
Journal of Biomedical Optics 086013-1 August 2014 • Vol. 19(8)
Journal of Biomedical Optics 19(8), 086013 (August 2014)
Downloaded From: https://www.spiedigitallibrary.org/journals/Journal-of-Biomedical-Optics on 5/30/2018 Terms of Use: https://www.spiedigitallibrary.org/terms-of-use
2 Materials and Methods
2.1 System Specifications
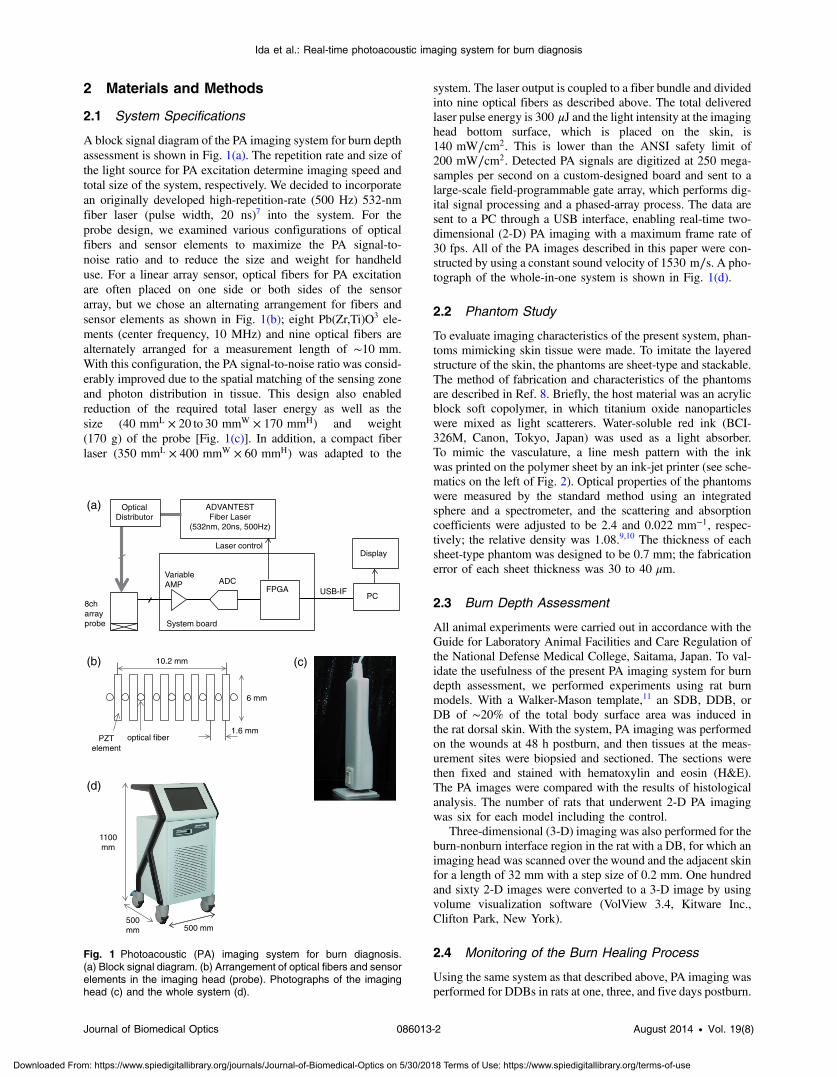
A block signal diagram of the PA imaging system for burn depthassessment is shown in Fig. 1(a). The repetition rate and size ofthe light source for PA excitation determine imaging speed andtotal size of the system, respectively. We decided to incorporatean originally developed high-repetition-rate (500 Hz) 532-nmfiber laser (pulse width, 20 ns)7 into the system. For theprobe design, we examined various configurations of opticalfibers and sensor elements to maximize the PA signal-to-noise ratio and to reduce the size and weight for handhelduse. For a linear array sensor, optical fibers for PA excitationare often placed on one side or both sides of the sensorarray, but we chose an alternating arrangement for fibers andsensor elements as shown in Fig. 1(b); eight Pb(Zr,Ti)O3 ele-ments (center frequency, 10 MHz) and nine optical fibers arealternately arranged for a measurement length of ∼10 mm.With this configuration, the PA signal-to-noise ratio was consid-erably improved due to the spatial matching of the sensing zoneand photon distribution in tissue. This design also enabledreduction of the required total laser energy as well as thesize (40 mmL × 20 to 30 mmW × 170 mmH) and weight(170 g) of the probe [Fig. 1(c)]. In addition, a compact fiberlaser (350 mmL × 400 mmW × 60 mmH) was adapted to the
system. The laser output is coupled to a fiber bundle and dividedinto nine optical fibers as described above. The total deliveredlaser pulse energy is 300 μJ and the light intensity at the imaginghead bottom surface, which is placed on the skin, is140 mW∕cm2. This is lower than the ANSI safety limit of200 mW∕cm2. Detected PA signals are digitized at 250 mega-samples per second on a custom-designed board and sent to alarge-scale field-programmable gate array, which performs dig-ital signal processing and a phased-array process. The data aresent to a PC through a USB interface, enabling real-time two-dimensional (2-D) PA imaging with a maximum frame rate of30 fps. All of the PA images described in this paper were con-structed by using a constant sound velocity of 1530 m∕s. A pho-tograph of the whole-in-one system is shown in Fig. 1(d).
2.2 Phantom Study
To evaluate imaging characteristics of the present system, phan-toms mimicking skin tissue were made. To imitate the layeredstructure of the skin, the phantoms are sheet-type and stackable.The method of fabrication and characteristics of the phantomsare described in Ref. 8. Briefly, the host material was an acrylicblock soft copolymer, in which titanium oxide nanoparticleswere mixed as light scatterers. Water-soluble red ink (BCI-326M, Canon, Tokyo, Japan) was used as a light absorber.To mimic the vasculature, a line mesh pattern with the inkwas printed on the polymer sheet by an ink-jet printer (see sche-matics on the left of Fig. 2). Optical properties of the phantomswere measured by the standard method using an integratedsphere and a spectrometer, and the scattering and absorptioncoefficients were adjusted to be 2.4 and 0.022 mm−1, respec-tively; the relative density was 1.08.9,10 The thickness of eachsheet-type phantom was designed to be 0.7 mm; the fabricationerror of each sheet thickness was 30 to 40 μm.
2.3 Burn Depth Assessment
All animal experiments were carried out in accordance with theGuide for Laboratory Animal Facilities and Care Regulation ofthe National Defense Medical College, Saitama, Japan. To val-idate the usefulness of the present PA imaging system for burndepth assessment, we performed experiments using rat burnmodels. With a Walker-Mason template,11 an SDB, DDB, orDB of ∼20% of the total body surface area was induced inthe rat dorsal skin. With the system, PA imaging was performedon the wounds at 48 h postburn, and then tissues at the meas-urement sites were biopsied and sectioned. The sections werethen fixed and stained with hematoxylin and eosin (H&E).The PA images were compared with the results of histologicalanalysis. The number of rats that underwent 2-D PA imagingwas six for each model including the control.
Three-dimensional (3-D) imaging was also performed for theburn-nonburn interface region in the rat with a DB, for which animaging head was scanned over the wound and the adjacent skinfor a length of 32 mm with a step size of 0.2 mm. One hundredand sixty 2-D images were converted to a 3-D image by usingvolume visualization software (VolView 3.4, Kitware Inc.,Clifton Park, New York).
2.4 Monitoring of the Burn Healing Process
Using the same system as that described above, PA imaging wasperformed for DDBs in rats at one, three, and five days postburn.
1100mm
500mm 500 mm
(a)
(d)
ADVANTESTFiber Laser
(532nm, 20ns, 500Hz)
8ch array probe
Variable AMP ADC
FPGA
Laser control
USB-IF PC
System board
Display
OpticalDistributor
(c) (b)
6 mm
1.6 mm
10.2 mm
PZTelement
optical fiber
Fig. 1 Photoacoustic (PA) imaging system for burn diagnosis.(a) Block signal diagram. (b) Arrangement of optical fibers and sensorelements in the imaging head (probe). Photographs of the imaginghead (c) and the whole system (d).
Journal of Biomedical Optics 086013-2 August 2014 • Vol. 19(8)
Ida et al.: Real-time photoacoustic imaging system for burn diagnosis
Downloaded From: https://www.spiedigitallibrary.org/journals/Journal-of-Biomedical-Optics on 5/30/2018 Terms of Use: https://www.spiedigitallibrary.org/terms-of-use
These time points were chosen on the basis of the results of ourprevious study using a single-element PA sensor, which showedangiogenesis in the wound within five days postburn by histo-logical analysis, while PA signals originating from neovascular-ities were not clearly detected due to limited resolution.12 In thisstudy, the tissue was biopsied after each PA imaging and asample with H&E staining was made. The PA images werecompared with the results of histological analysis. The numberof rats that underwent PA imaging for monitoring the healingprocess was four at each time point; two of them underwentbiopsy.
3 Results and Discussion
3.1 Phantom Study
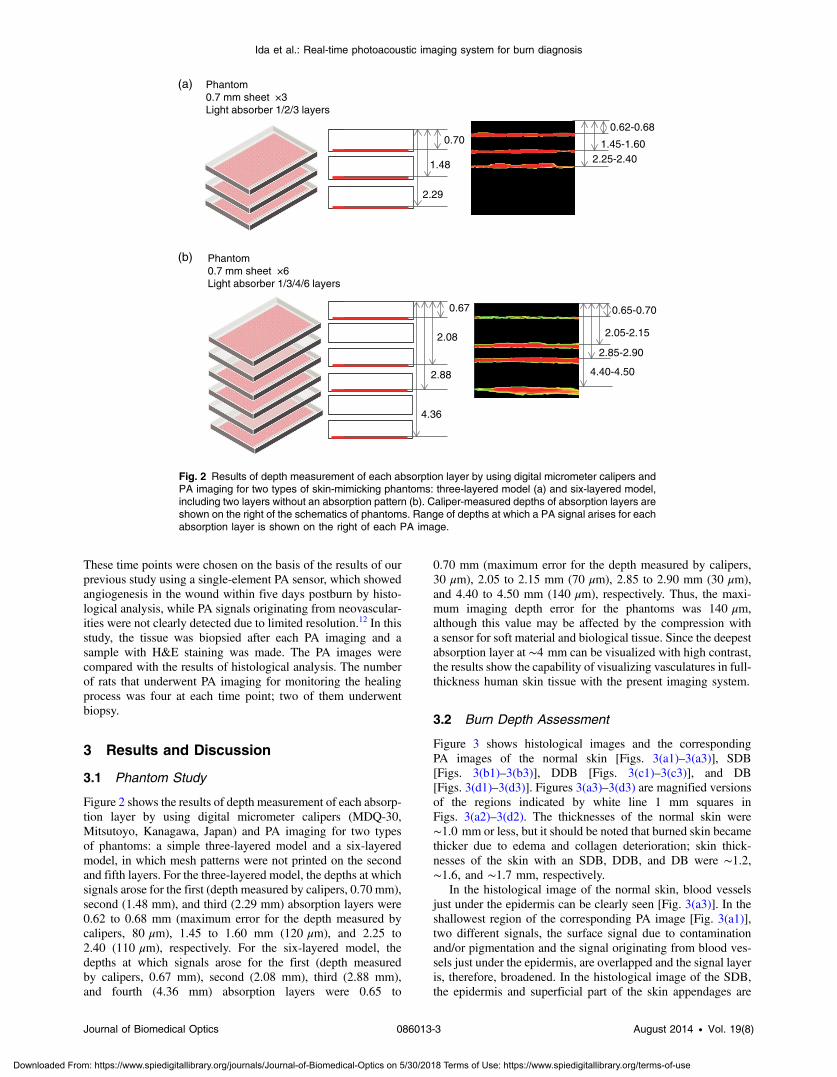
Figure 2 shows the results of depth measurement of each absorp-tion layer by using digital micrometer calipers (MDQ-30,Mitsutoyo, Kanagawa, Japan) and PA imaging for two typesof phantoms: a simple three-layered model and a six-layeredmodel, in which mesh patterns were not printed on the secondand fifth layers. For the three-layered model, the depths at whichsignals arose for the first (depth measured by calipers, 0.70 mm),second (1.48 mm), and third (2.29 mm) absorption layers were0.62 to 0.68 mm (maximum error for the depth measured bycalipers, 80 μm), 1.45 to 1.60 mm (120 μm), and 2.25 to2.40 (110 μm), respectively. For the six-layered model, thedepths at which signals arose for the first (depth measuredby calipers, 0.67 mm), second (2.08 mm), third (2.88 mm),and fourth (4.36 mm) absorption layers were 0.65 to
0.70 mm (maximum error for the depth measured by calipers,30 μm), 2.05 to 2.15 mm (70 μm), 2.85 to 2.90 mm (30 μm),and 4.40 to 4.50 mm (140 μm), respectively. Thus, the maxi-mum imaging depth error for the phantoms was 140 μm,although this value may be affected by the compression witha sensor for soft material and biological tissue. Since the deepestabsorption layer at ∼4 mm can be visualized with high contrast,the results show the capability of visualizing vasculatures in full-thickness human skin tissue with the present imaging system.
3.2 Burn Depth Assessment
Figure 3 shows histological images and the correspondingPA images of the normal skin [Figs. 3(a1)–3(a3)], SDB[Figs. 3(b1)–3(b3)], DDB [Figs. 3(c1)–3(c3)], and DB[Figs. 3(d1)–3(d3)]. Figures 3(a3)–3(d3) are magnified versionsof the regions indicated by white line 1 mm squares inFigs. 3(a2)–3(d2). The thicknesses of the normal skin were∼1.0 mm or less, but it should be noted that burned skin becamethicker due to edema and collagen deterioration; skin thick-nesses of the skin with an SDB, DDB, and DB were ∼1.2,∼1.6, and ∼1.7 mm, respectively.
In the histological image of the normal skin, blood vesselsjust under the epidermis can be clearly seen [Fig. 3(a3)]. In theshallowest region of the corresponding PA image [Fig. 3(a1)],two different signals, the surface signal due to contaminationand/or pigmentation and the signal originating from blood ves-sels just under the epidermis, are overlapped and the signal layeris, therefore, broadened. In the histological image of the SDB,the epidermis and superficial part of the skin appendages are
0.700.62-0.68
2.25-2.40
Phantom(a)
(b)
0.7 mm sheet ×3Light absorber 1/2/3 layers
1.48
2.29
1.45-1.60
Phantom0.7 mm sheet ×6Light absorber 1/3/4/6 layers
0.67
2.08
2.88
4.36
0.65-0.70
2.05-2.15
2.85-2.90
4.40-4.50
Fig. 2 Results of depth measurement of each absorption layer by using digital micrometer calipers andPA imaging for two types of skin-mimicking phantoms: three-layered model (a) and six-layered model,including two layers without an absorption pattern (b). Caliper-measured depths of absorption layers areshown on the right of the schematics of phantoms. Range of depths at which a PA signal arises for eachabsorption layer is shown on the right of each PA image.
Journal of Biomedical Optics 086013-3 August 2014 • Vol. 19(8)
Ida et al.: Real-time photoacoustic imaging system for burn diagnosis
Downloaded From: https://www.spiedigitallibrary.org/journals/Journal-of-Biomedical-Optics on 5/30/2018 Terms of Use: https://www.spiedigitallibrary.org/terms-of-use
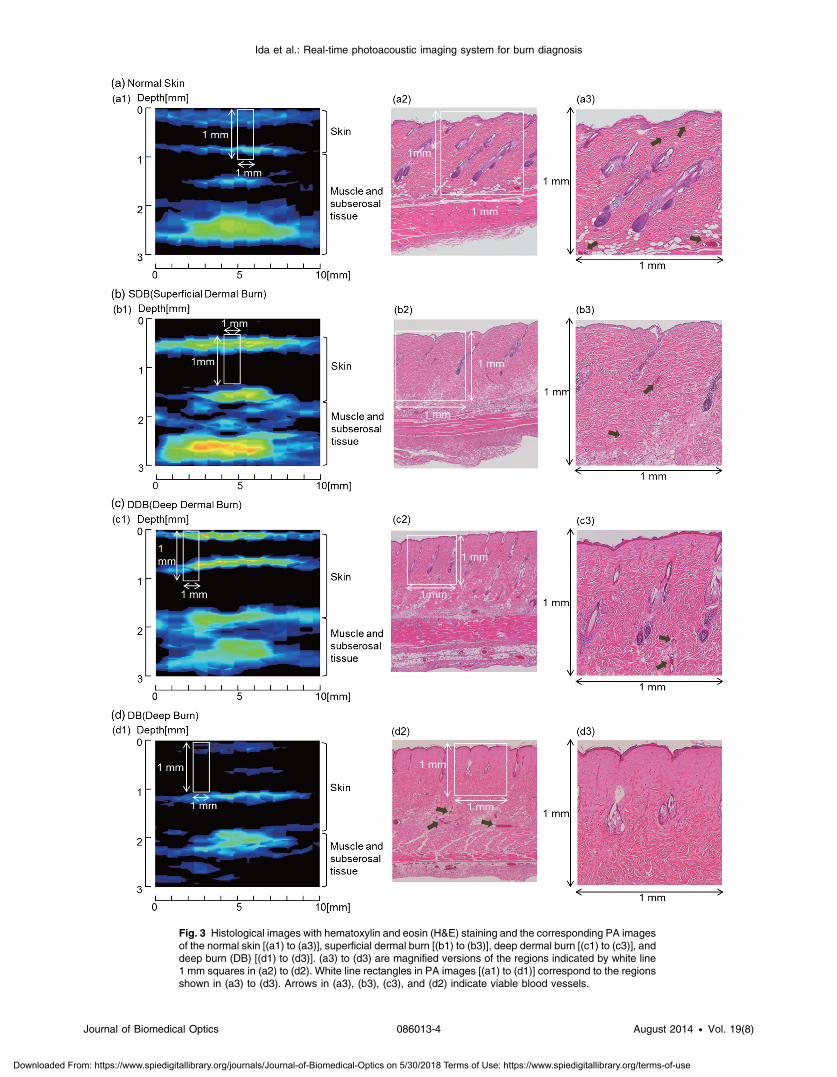
Fig. 3 Histological images with hematoxylin and eosin (H&E) staining and the corresponding PA imagesof the normal skin [(a1) to (a3)], superficial dermal burn [(b1) to (b3)], deep dermal burn [(c1) to (c3)], anddeep burn (DB) [(d1) to (d3)]. (a3) to (d3) are magnified versions of the regions indicated by white line1 mm squares in (a2) to (d2). White line rectangles in PA images [(a1) to (d1)] correspond to the regionsshown in (a3) to (d3). Arrows in (a3), (b3), (c3), and (d2) indicate viable blood vessels.
Journal of Biomedical Optics 086013-4 August 2014 • Vol. 19(8)
Ida et al.: Real-time photoacoustic imaging system for burn diagnosis
Downloaded From: https://www.spiedigitallibrary.org/journals/Journal-of-Biomedical-Optics on 5/30/2018 Terms of Use: https://www.spiedigitallibrary.org/terms-of-use
injured, where blood vessels indicated by arrows seem to be via-ble but with infiltration of a few neutrophils [Figs. 3(b2) and3(b3)]. In the corresponding PA image [Fig. 3(b1)], the surfacesignal and the signal originating from blood vessels under theepidermis are also overlapped, but the signal is much stronger,which is attributable to hyperemia. In the histological image ofDDB, the epidermis and upper two thirds of the dermis are dam-aged, where blood vessels are not observed clearly, while bloodvessels with erythrocytes remain at depths of ∼1 mm [Figs. 3(c2)and 3(c3)]. In the corresponding PA image [Fig. 3(c1)], the shal-lowest signal layer is thin due to the occlusion of blood vesselsjust under the epidermis, and a zone of stasis as deep as ∼0.8 mmcan be clearly seen. In the histological image of DB, collagenfibers in a large part of the dermis are fused and no blood vesselsare seen at depths up to ∼1.0 mm; there are some dilated bloodvessels at depths of∼1.2 mm [Figs. 3(d2) and 3(d3)]. The zone ofstasis as deep as ∼1.0 mm is shown in the corresponding PAimage [Fig. 3(d1)]. The depths of damaged tissues (zones of sta-sis) estimated by histological analysis and those estimated by PAimaging are summarized in Table 1. Discrepancies between the
results of histological analysis and those obtained by PA imagingwere in the range of 100 to 200 μm. Due to the artifact in thepreparation of tissue samples for histological analysis, it is diffi-cult to evaluate measurement errors in an in vivo study. In addi-tion, change in the sound velocity of coagulated tissue may affectthe results of PA imaging. Thus, further study is needed to accu-rately estimate errors in in vivo diagnosis of burn depth by the PAimaging. On the basis of the errors shown by the phantom study,however, the present system seems to have a potential to be usedfor clinical burn diagnosis.
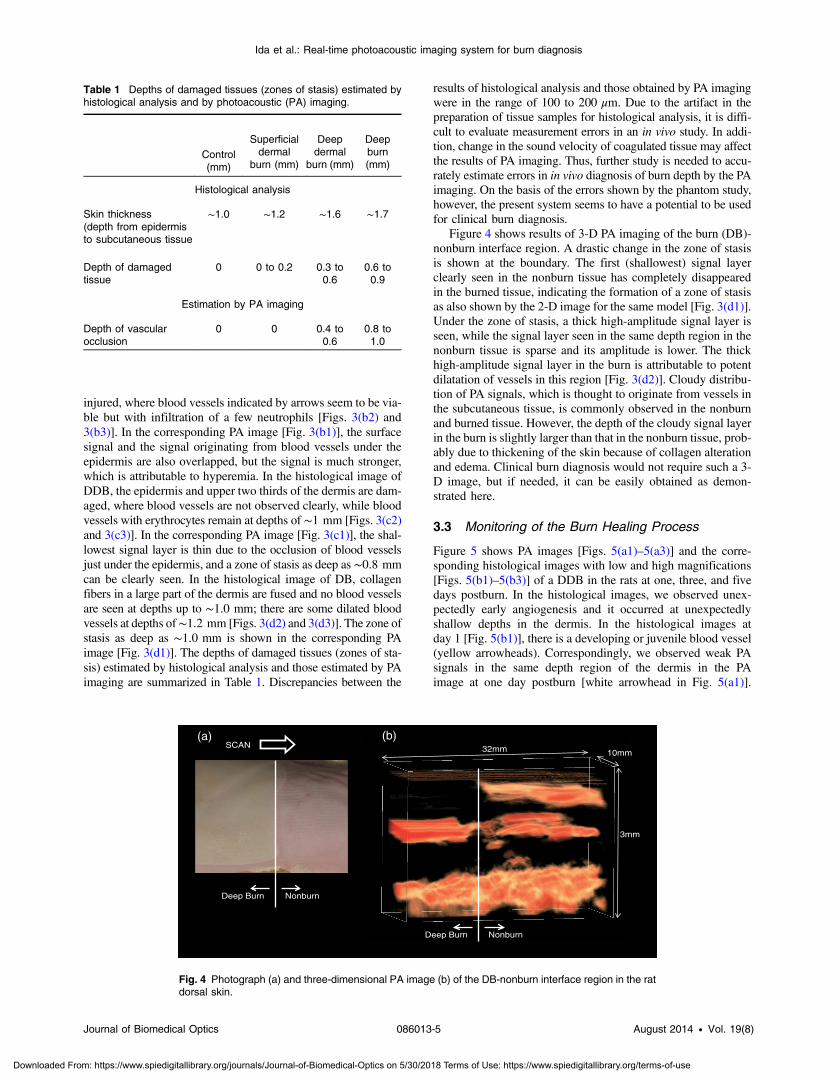
Figure 4 shows results of 3-D PA imaging of the burn (DB)-nonburn interface region. A drastic change in the zone of stasisis shown at the boundary. The first (shallowest) signal layerclearly seen in the nonburn tissue has completely disappearedin the burned tissue, indicating the formation of a zone of stasisas also shown by the 2-D image for the same model [Fig. 3(d1)].Under the zone of stasis, a thick high-amplitude signal layer isseen, while the signal layer seen in the same depth region in thenonburn tissue is sparse and its amplitude is lower. The thickhigh-amplitude signal layer in the burn is attributable to potentdilatation of vessels in this region [Fig. 3(d2)]. Cloudy distribu-tion of PA signals, which is thought to originate from vessels inthe subcutaneous tissue, is commonly observed in the nonburnand burned tissue. However, the depth of the cloudy signal layerin the burn is slightly larger than that in the nonburn tissue, prob-ably due to thickening of the skin because of collagen alterationand edema. Clinical burn diagnosis would not require such a 3-D image, but if needed, it can be easily obtained as demon-strated here.
3.3 Monitoring of the Burn Healing Process
Figure 5 shows PA images [Figs. 5(a1)–5(a3)] and the corre-sponding histological images with low and high magnifications[Figs. 5(b1)–5(b3)] of a DDB in the rats at one, three, and fivedays postburn. In the histological images, we observed unex-pectedly early angiogenesis and it occurred at unexpectedlyshallow depths in the dermis. In the histological images atday 1 [Fig. 5(b1)], there is a developing or juvenile blood vessel(yellow arrowheads). Correspondingly, we observed weak PAsignals in the same depth region of the dermis in the PAimage at one day postburn [white arrowhead in Fig. 5(a1)].
Table 1 Depths of damaged tissues (zones of stasis) estimated byhistological analysis and by photoacoustic (PA) imaging.
Control(mm)
Superficialdermal
burn (mm)
Deepdermal
burn (mm)
Deepburn(mm)
Histological analysis
Skin thickness(depth from epidermisto subcutaneous tissue
∼1.0 ∼1.2 ∼1.6 ∼1.7
Depth of damagedtissue
0 0 to 0.2 0.3 to0.6
0.6 to0.9
Estimation by PA imaging
Depth of vascularocclusion
0 0 0.4 to0.6
0.8 to1.0
10mm
3mm
32mmSCAN(a) (b)
NonburnDeep Burn
NonburnDeep Burn
Fig. 4 Photograph (a) and three-dimensional PA image (b) of the DB-nonburn interface region in the ratdorsal skin.
Journal of Biomedical Optics 086013-5 August 2014 • Vol. 19(8)
Ida et al.: Real-time photoacoustic imaging system for burn diagnosis
Downloaded From: https://www.spiedigitallibrary.org/journals/Journal-of-Biomedical-Optics on 5/30/2018 Terms of Use: https://www.spiedigitallibrary.org/terms-of-use
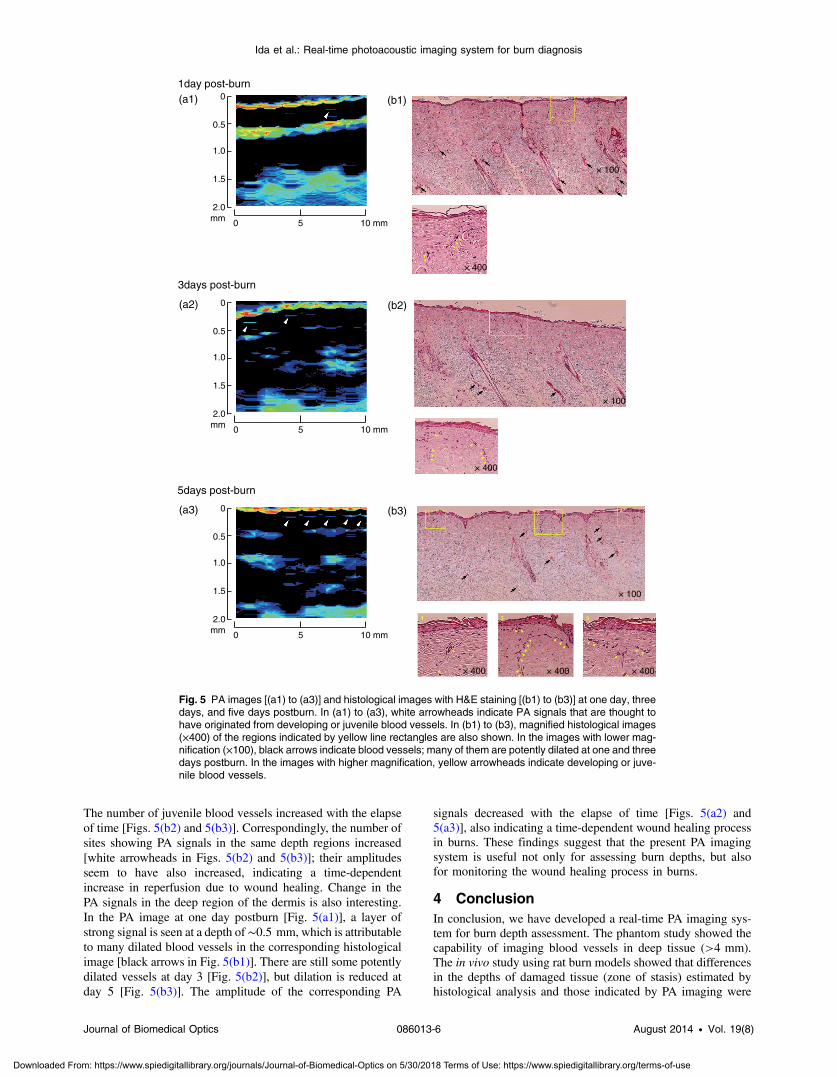
The number of juvenile blood vessels increased with the elapseof time [Figs. 5(b2) and 5(b3)]. Correspondingly, the number ofsites showing PA signals in the same depth regions increased[white arrowheads in Figs. 5(b2) and 5(b3)]; their amplitudesseem to have also increased, indicating a time-dependentincrease in reperfusion due to wound healing. Change in thePA signals in the deep region of the dermis is also interesting.In the PA image at one day postburn [Fig. 5(a1)], a layer ofstrong signal is seen at a depth of∼0.5 mm, which is attributableto many dilated blood vessels in the corresponding histologicalimage [black arrows in Fig. 5(b1)]. There are still some potentlydilated vessels at day 3 [Fig. 5(b2)], but dilation is reduced atday 5 [Fig. 5(b3)]. The amplitude of the corresponding PA
signals decreased with the elapse of time [Figs. 5(a2) and5(a3)], also indicating a time-dependent wound healing processin burns. These findings suggest that the present PA imagingsystem is useful not only for assessing burn depths, but alsofor monitoring the wound healing process in burns.
4 ConclusionIn conclusion, we have developed a real-time PA imaging sys-tem for burn depth assessment. The phantom study showed thecapability of imaging blood vessels in deep tissue (>4 mm).The in vivo study using rat burn models showed that differencesin the depths of damaged tissue (zone of stasis) estimated byhistological analysis and those indicated by PA imaging were
(a1)
0 5 10 mm
0
0.5
1.0
1.5
2.0mm
(b1)
× 100
× 400
1day post-burn
3days post-burn
(a2) (b2)
0 5 10 mm
0
0.5
1.0
1.5
2.0mm
5days post-burn
(a3) (b3)
0 5 10 mm
0
0.5
1.0
1.5
2.0mm
× 100
× 100
× 400
× 400 × 400 × 400
Fig. 5 PA images [(a1) to (a3)] and histological images with H&E staining [(b1) to (b3)] at one day, threedays, and five days postburn. In (a1) to (a3), white arrowheads indicate PA signals that are thought tohave originated from developing or juvenile blood vessels. In (b1) to (b3), magnified histological images(×400) of the regions indicated by yellow line rectangles are also shown. In the images with lower mag-nification (×100), black arrows indicate blood vessels; many of them are potently dilated at one and threedays postburn. In the images with higher magnification, yellow arrowheads indicate developing or juve-nile blood vessels.
Journal of Biomedical Optics 086013-6 August 2014 • Vol. 19(8)
Ida et al.: Real-time photoacoustic imaging system for burn diagnosis
Downloaded From: https://www.spiedigitallibrary.org/journals/Journal-of-Biomedical-Optics on 5/30/2018 Terms of Use: https://www.spiedigitallibrary.org/terms-of-use

within 200 μm. The usefulness of the system for monitoring theburn healing process was also shown. On the basis of the resultsobtained in this study, we plan to conduct clinical studies onburn diagnosis in the near future.
AcknowledgmentsThe authors thank Naoya Tsukahara, Takao Sakurai, and ShinMasuda for development and installation of the fiber laser andMs. Tsuyako Ohkura for skillful experimental assistance.
References1. S. A. Pape, C. A. Skouras, and P. O. Byrne, “An audit of the use of laser
Doppler imaging (LDI) in assessment of burns of intermediate depth,”Burns 27, 233–239 (2001).
2. S. Jiao, W. Yu, and L. V. Wang, “Contrast mechanisms in polarization-sensitive Muller-matrix optical coherence tomography and applicationin burn imaging,” Appl. Opt. 42(25), 5191–5197 (2003).
3. N. Isono et al., “Early assessment of second degree burn depth by meansof video microscope,” Jpn. J. Burn Inj. 24(1), 11–18 (1998).
4. S. Sato et al., “Photoacoustic diagnosis of burns in rats,” J. Trauma59, 1450–1456 (2005).
5. H. F. Zhang et al., “Imaging acute thermal burns by photoacousticmicroscopy,” J. Biomed. Opt. 11(5), 054033 (2006).
6. L. Vionnet et al., “24-MHz scanner for optoacoustic imaging of skin andburn,” IEEE Trans. Med. Imaging 33(2), 535–545 (2014).
7. S. Masuda, S. Niki, and M. Nakazawa, “Environmentally stable, simplepassively mode-locked fiber ring laser using a four-port circulator,”Opt. Express 17(8), 6613–6622 (2009).
8. Y. Kawaguchi et al., “New polymer-based phantom for photoacousticimaging,” Proc. SPIE 8945, 89450A (2014).
9. T. Vo-Dinh, Biomedical Photonics Handbook, CRC Press, Boca Raton(2003).
10. V. A. Shutilov, Fundamental Physics of Ultrasound, Gordon andBreach, New York (1988).
11. H. L. Walker and A. D. Mason Jr., “A standard animal burn,” J. Trauma8(6), 1049–1051 (1968).
12. K. Aizawa et al., “Photoacoustic monitoring of burn healing process inrats,” J. Biomed. Opt. 13(6), 064020 (2008).
Biographies of the authors are not available.
Journal of Biomedical Optics 086013-7 August 2014 • Vol. 19(8)
Ida et al.: Real-time photoacoustic imaging system for burn diagnosis
Downloaded From: https://www.spiedigitallibrary.org/journals/Journal-of-Biomedical-Optics on 5/30/2018 Terms of Use: https://www.spiedigitallibrary.org/terms-of-use