Embed Size (px)
Citation preview
1
Return to USA: Impact of Reshoring Announcements and Reshoring Risks on Market
Valuation
Miyuki P. S. Chenga
Christopher Tangb
Chris K. Y. Loa
Andy C. L. Yeunga
Hugo Lamc
a The Hong Kong Polytechnic University
b UCLA Anderson School of Management
c Management School, University of Liverpool
2
Return to USA: Impact of Reshoring Announcements and Reshoring Risks on Market
Valuation
Abstract
Due to soaring labor and logistics costs in developing countries, various Western firms are “reshoring”
some of their offshore operations (performed in-house or outsourced) from foreign countries to their
corresponding home countries. Moreover, the acute shortages of respirators and face masks amid the
COVID-19 pandemic have triggered more firms to reshore their production to create more jobs and
avoid severe shortages of medical supplies. However, the impact of various reshoring announcements
on the market response is not well understood.
In this paper, we conduct event studies of 272 reshoring announcements (between 2006 and 2018) made
by 85 publicly traded United States (U.S.) firms. We find no significant impact of these reshoring
announcements on the stock price of the involved firms. However, after incorporating four types of
reshoring risks, namely currency risk, development risk, management risk, and geopolitical risk, we
find that the market reacts more positively toward reshoring decisions that involve lower management
risk, currency risk, and geopolitical risk. We also find that the market reacts more negatively toward
reshoring decisions associated with U.S. firms with strong development capabilities (measured in terms
of research and development [R&D] investment), probably because reshoring might not be able to
create high-paying jobs for local manufacturing workers. We find that the market reacts negatively
toward reshoring an operation from China back to the United States, possibly because the market
anticipates that reshoring operations back from China would make the firm less competitive due to
potential cost increases.
Keywords: Reshoring, Event Study, Supply Chain Risks
1. Introduction
Over the last three decades, many Western firms have gained benefits from offshoring and outsourcing,
including lower costs (labor) and expanding their presence in developing countries. However, over the
last decade, some firms have discovered various hidden costs of offshoring and outsourcing caused by
increased supply chain complexity and opacity (Ellram et al. 2013b, Tate 2014). Moreover, other firms
have experienced collateral damage when their offshore (in-house or outsourced) operations
3
encountered problems ranging from violations of labor laws1 to issues related to worker safety,2 product
adulteration,3 and environmental violations.4 The reader is referred to the book by Sodhi and Tang
(2012), which provides a comprehensive discussion of the risks of offshoring and outsourcing. In
addition to these supply chain management risks, currency volatility,5 surging labor costs6 and logistics
costs in developing countries, and the rise of protectionism and nationalism7 are all reasons why various
Western firms are “reshoring” some of their (in-house or outsourced) operations from “offshore”
foreign countries to their “onshore” home countries (Ellram et al. 2013a, Gray et al. 2013, Fratocchi et
al. 2014, Tate 2014).
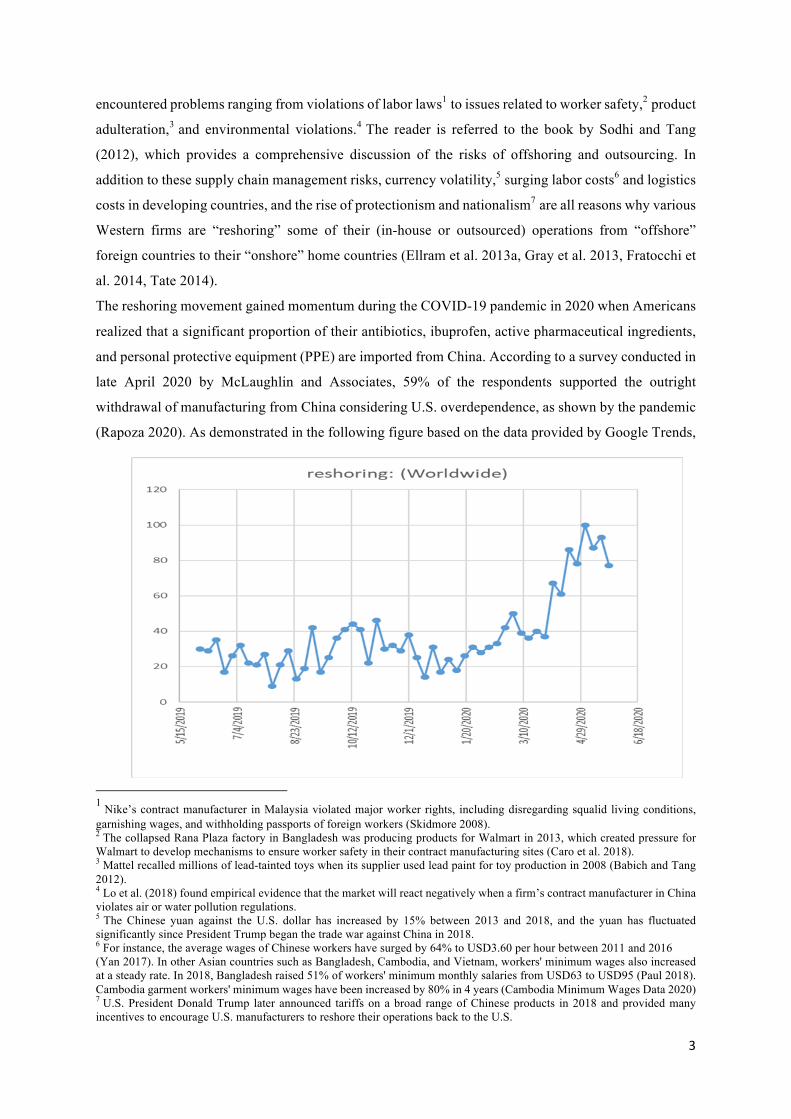
The reshoring movement gained momentum during the COVID-19 pandemic in 2020 when Americans
realized that a significant proportion of their antibiotics, ibuprofen, active pharmaceutical ingredients,
and personal protective equipment (PPE) are imported from China. According to a survey conducted in
late April 2020 by McLaughlin and Associates, 59% of the respondents supported the outright
withdrawal of manufacturing from China considering U.S. overdependence, as shown by the pandemic
(Rapoza 2020). As demonstrated in the following figure based on the data provided by Google Trends,
1 Nike’s contract manufacturer in Malaysia violated major worker rights, including disregarding squalid living conditions, garnishing wages, and withholding passports of foreign workers (Skidmore 2008).2 The collapsed Rana Plaza factory in Bangladesh was producing products for Walmart in 2013, which created pressure for Walmart to develop mechanisms to ensure worker safety in their contract manufacturing sites (Caro et al. 2018). 3 Mattel recalled millions of lead-tainted toys when its supplier used lead paint for toy production in 2008 (Babich and Tang 2012).4 Lo et al. (2018) found empirical evidence that the market will react negatively when a firm’s contract manufacturer in China violates air or water pollution regulations. 5 The Chinese yuan against the U.S. dollar has increased by 15% between 2013 and 2018, and the yuan has fluctuated significantly since President Trump began the trade war against China in 2018.6 For instance, the average wages of Chinese workers have surged by 64% to USD3.60 per hour between 2011 and 2016 (Yan 2017). In other Asian countries such as Bangladesh, Cambodia, and Vietnam, workers' minimum wages also increased at a steady rate. In 2018, Bangladesh raised 51% of workers' minimum monthly salaries from USD63 to USD95 (Paul 2018). Cambodia garment workers' minimum wages have been increased by 80% in 4 years (Cambodia Minimum Wages Data 2020)7 U.S. President Donald Trump later announced tariffs on a broad range of Chinese products in 2018 and provided many incentives to encourage U.S. manufacturers to reshore their operations back to the U.S.
4
a growing number of Google searches (worldwide) were performed for the keyword “reshoring”
between June 2019 and May 2020, which suggests an increased interest in this topic.
Political pressures have also set reshoring in motion under the Trump administration since 2016
as a way to create more jobs for Americans. Moreover, U.S. firms are under economic pressure to
consider reshoring some of their operations to the United Sates.8 The Trump administration further
provided a business-friendly environment by reducing the corporate tax rate from 35% to 21% in 2018,
which is below that in many foreign countries such as India, Brazil, China, Bangladesh, Indonesia,
Myanmar, and Russia. With this tax reduction, the Trump administration intends to entice U.S. firms to
invest more in the United States by creating more jobs (Amadeo 2020).9 Linking these challenges to
the global nature of supply chains, the U.S. Presidential Candidate and former Vice President Joseph
Biden proposed a plan in early July 2020 to “implement fundamental reforms… moving a range of
critical products back to U.S. soil, creating new jobs, and protecting U.S. supply chain against national
security threats.”10
Although reshoring is commonly discussed in the boardrooms and government offices in the
United States, the related literature is in the nascent stage. The majority of the reshoring literature
focuses on various risk drivers (country risks, regulation risks, and reputational risks) for justifying
reshoring (Ellram et al. 2013a, Fratocchi et al. 2014, Tate 2014, Foerstl et al. 2016). Instead of
examining key drivers for reshoring, Brandon-Jones et al. (2017) find that the market reacts positively
to reshoring in general. However, their study was based on a small sample set (37 announcements) and
did not examine how the market reacts to four types of reshoring strategies that depend on whether the
offshore operations are initially outsourced or in-house, and whether the reshored operations are
destined to be outsourced or in-house.11
Reshoring is a strategy for managing supply chain risks (Ciabuschi et al. 2019). In addition to
various external offshoring and outsourcing risks (technology transfer, exchange rate fluctuation,
intellectual property theft, and political instability) examined in the literature (Holweg et al. 2011, Sodhi
and Tang 2012, Stanczyk et al. 2017), other risks are associated with the reshoring process (Ciabuschi
et al. 2019) that can affect a firm’s performance. By classifying reshoring strategies into four types,
depending on whether the existing operation is performed in-house or outsourced and whether the
reshoring operations will be performed in-house or outsourced, we can relate these four types of
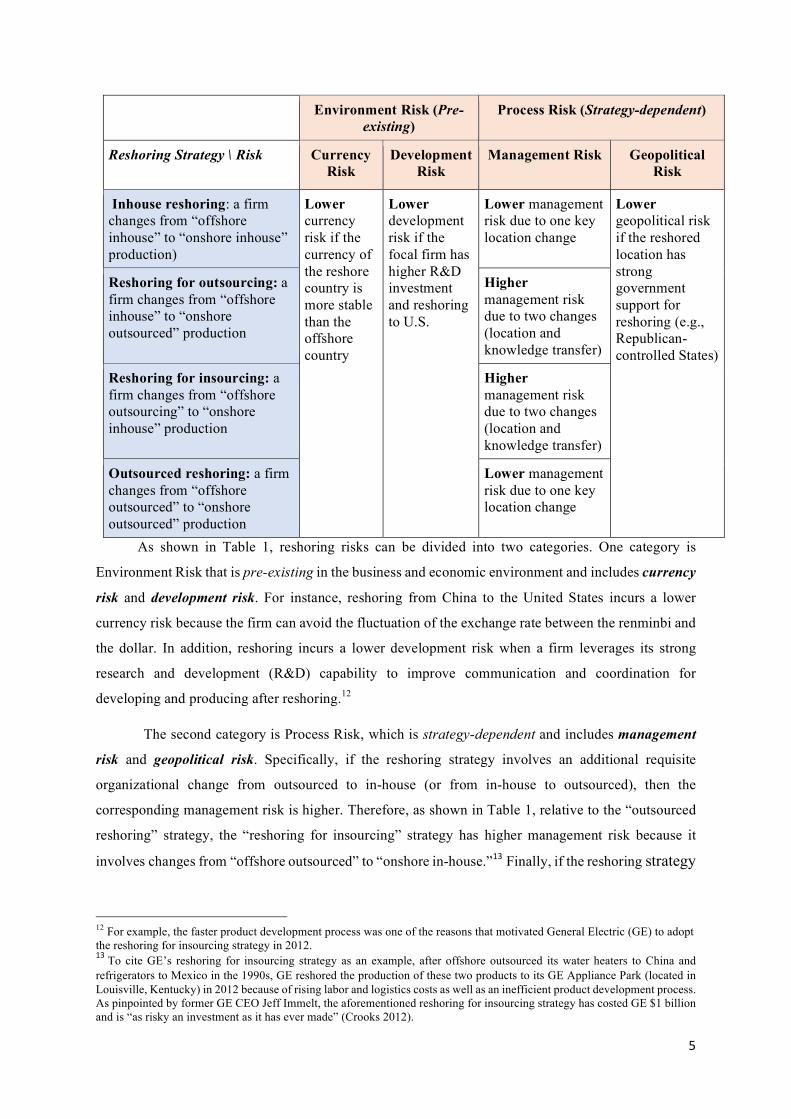
reshoring strategies to four types of risks in Table 1, as follows.
Table 1. Four Types of Reshoring Strategies and Four Types of Reshoring Risks
8 By comparing the total costs (labor and logistics costs), Boston Consulting Group argued that reshoring could be a viable strategy for U.S. companies to reshore certain products back to the United States (Sirkin et al. 2011).9 For example, Bank of America Corporation advised that extra savings generated by the tax relief could help the bank open more branches and expand into states like Ohio (Keller 2018).10 https://joebiden.com/supplychains/ 11 This classification scheme is adopted from the framework developed by Gray et al. (2013).
5
Environment Risk (Pre-existing)
Process Risk (Strategy-dependent)
Reshoring Strategy \ Risk Currency Risk
Development Risk
Management Risk Geopolitical Risk
Inhouse reshoring: a firm changes from “offshore inhouse” to “onshore inhouse” production)
Lower currency risk if the currency of the reshore country is more stable than the offshore country
Lower development risk if the focal firm has higher R&D investment and reshoring to U.S.
Lower management risk due to one key location change
Lower geopolitical risk if the reshored location has strong government support for reshoring (e.g., Republican-controlled States)
Reshoring for outsourcing: a firm changes from “offshore inhouse” to “onshore outsourced” production
Higher management risk due to two changes (location and knowledge transfer)
Reshoring for insourcing: a firm changes from “offshore outsourcing” to “onshore inhouse” production
Higher management risk due to two changes (location and knowledge transfer)
Outsourced reshoring: a firm changes from “offshore outsourced” to “onshore outsourced” production
Lower management risk due to one key location change
As shown in Table 1, reshoring risks can be divided into two categories. One category is
Environment Risk that is pre-existing in the business and economic environment and includes currency
risk and development risk. For instance, reshoring from China to the United States incurs a lower
currency risk because the firm can avoid the fluctuation of the exchange rate between the renminbi and
the dollar. In addition, reshoring incurs a lower development risk when a firm leverages its strong
research and development (R&D) capability to improve communication and coordination for
developing and producing after reshoring.12
The second category is Process Risk, which is strategy-dependent and includes management
risk and geopolitical risk. Specifically, if the reshoring strategy involves an additional requisite
organizational change from outsourced to in-house (or from in-house to outsourced), then the
corresponding management risk is higher. Therefore, as shown in Table 1, relative to the “outsourced
reshoring” strategy, the “reshoring for insourcing” strategy has higher management risk because it
involves changes from “offshore outsourced” to “onshore in-house.”13 Finally, if the reshoring strategy
12 For example, the faster product development process was one of the reasons that motivated General Electric (GE) to adopt the reshoring for insourcing strategy in 2012. 13To cite GE’s reshoring for insourcing strategy as an example, after offshore outsourced its water heaters to China and refrigerators to Mexico in the 1990s, GE reshored the production of these two products to its GE Appliance Park (located in Louisville, Kentucky) in 2012 because of rising labor and logistics costs as well as an inefficient product development process. As pinpointed by former GE CEO Jeff Immelt, the aforementioned reshoring for insourcing strategy has costed GE $1 billion and is “as risky an investment as it has ever made” (Crooks 2012).
6
involves certain states with strong state-level support and a friendly business environment (e.g.,
tax, infrastructure, and education subsidies), then the corresponding geopolitical risk is lower.14
In this paper, we examine how the market reacts to different types of reshoring strategies, as
stated in Table 1. Our results inform on which type of reshoring strategy would receive a more positive
(or negative) market reaction, especially when we incorporate pre-existing development risk and
currency risk as well as strategy-dependent management risk and geopolitical risk. Our event studies
are based on 272 reshoring strategy announcements made by 85 publicly traded U.S. firms between
2006 and 2018. We intend to examine the following two research questions:
1. Do stock markets react positively to a firm’s reshoring strategy announcement?
2. Does a reshoring strategy associated with (a) lower currency risk, (b) lower development risk, (c)
lower management risk, or (d) lower geopolitical risk amplify the positive market reaction to a firm’s
reshoring announcement?
Our empirical analysis generates the following results. First, without considering these pre-
existing and strategy-dependent reshoring risks, we find no significant impact of reshoring
announcements on a firm's stock performance in the United States.
Second, we find that when firms move from a high currency volatility foreign country with
lower management risk and geopolitical risk during the reshoring process, they receive a more favorable
market reaction. However, firms with high R&D investments cannot receive positive market reactions
when they reshore to the United States. We discuss the potential alternative explanations in Section
4.4.1.
Third, regarding the impact of the reshoring announcements between 2006 and 2018 on the
market, we find that the market reacts negatively toward reshoring an operation from China back to the
United States. This result could be due to the potential cost increases; the market anticipates that the
firm will become less competitive. However, this dynamic may be different for reshoring of PPE
manufacturing back to the United States amid the COVID-19 pandemic in 2020. Overall, our findings
provide suggestions to both firms and policymakers. When multinational enterprises (MNEs) reshore,
they must not underestimate the management and geopolitical risks. Our result challenges the common
belief that high-tech firms with heavy R&D investments can benefit more when they reshore.
14 For example, since 2011, the House and the Senate of Wisconsin have been controlled by the Republican Party, which supports reshoring. With the intention of creating 13,000 new jobs in the United States, the state of Wisconsin offered a subsidy of $4.8 billion to Foxconn (a Taiwan contract manufacturer) to build a giant factory for producing electronic products in the U.S. (Rushe 2018).
7
For policymakers, our regression analysis provides evidence that both federal and state
governments in the United States play an essential role in facilitating reshoring. Republican-led states
that provide a better business environment cause more reshoring activities and receive a more favorable
market reaction. This finding suggests that foreign countries may provide extra incentives or impose
higher exit costs to entice firms or discourage them from leaving.
This paper is organized as follows. Section 2 presents our hypotheses based on the market
reaction to reshoring strategy announcements, different types of reshoring strategies, and different types
of reshoring risks. In Section 3, we describe our data collection process, and in Section 4, we discuss
our empirical results based on different regression models. In Section 5, we discuss the implications of
our findings and the conclusion.
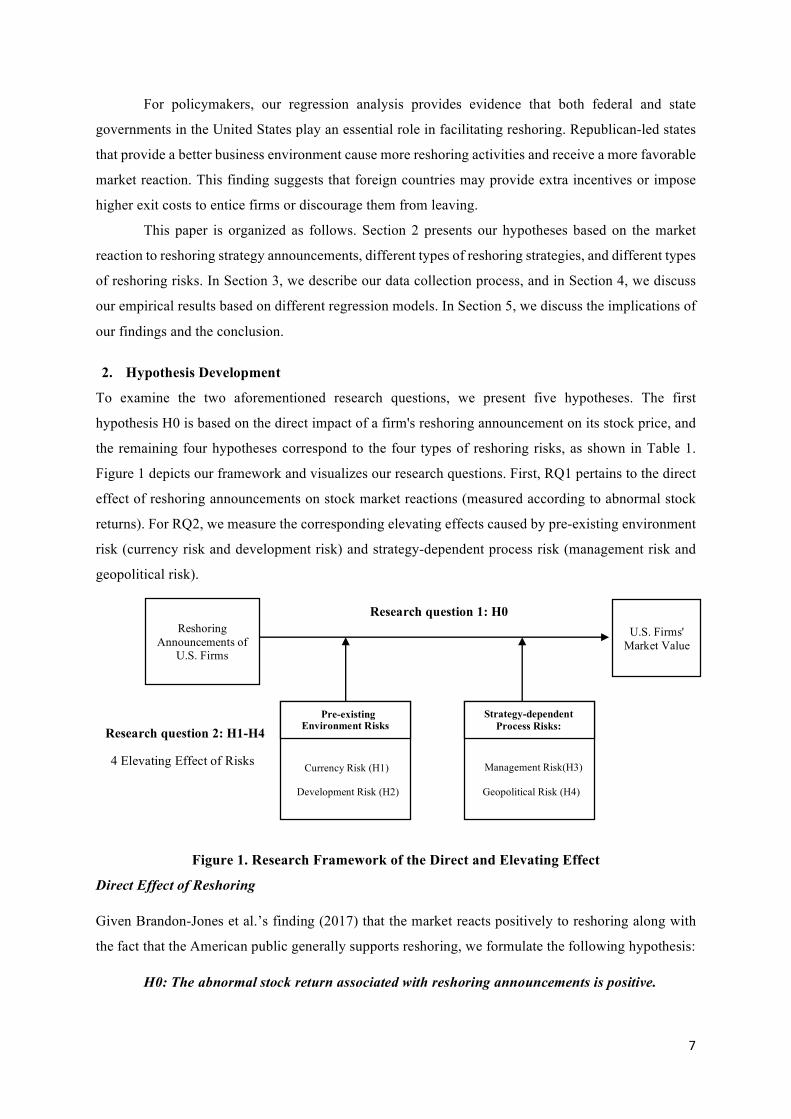
2. Hypothesis Development
To examine the two aforementioned research questions, we present five hypotheses. The first
hypothesis H0 is based on the direct impact of a firm's reshoring announcement on its stock price, and
the remaining four hypotheses correspond to the four types of reshoring risks, as shown in Table 1.
Figure 1 depicts our framework and visualizes our research questions. First, RQ1 pertains to the direct
effect of reshoring announcements on stock market reactions (measured according to abnormal stock
returns). For RQ2, we measure the corresponding elevating effects caused by pre-existing environment
risk (currency risk and development risk) and strategy-dependent process risk (management risk and
geopolitical risk).
Figure 1. Research Framework of the Direct and Elevating Effect Direct Effect of Reshoring
Given Brandon-Jones et al.’s finding (2017) that the market reacts positively to reshoring along with
the fact that the American public generally supports reshoring, we formulate the following hypothesis:
H0: The abnormal stock return associated with reshoring announcements is positive.
Pre-existing Environment Risks
Reshoring Announcements of
U.S. Firms U.S. Firms'
Market Value
Research question 1: H0
Currency Risk (H1)
Development Risk (H2)
Strategy-dependent Process Risks:
Geopolitical Risk (H4)
Management Risk(H3)
Research question 2: H1-H4
4 Elevating Effect of Risks
8
Hypothesis H0 re-examines the Brandon-Jones et al.’s finding (2017) that was based on 37
announcements from 2006 to 2015 by studying the market reaction to 272 reshoring announcements
(between 2006 and 2018) made by 85 publicly traded U.S. firms. Moreover, we examine whether the
market reacts differently to those four aforementioned types of reshoring risks as follows.
Elevating Effect Associated with Currency Risk
In the outsourcing literature, currency exchange risk has always been an essential factor for a firm to
decide whether to offshore (Tang and Nurmaya Musa 2011, Lijian Chen et al. 2014). Antithetically
speaking, currency risk should be a critical factor for a firm to decide whether to reshore its operations
from a foreign country to its home country (i.e., the United States in our context). In both offshoring
and reshoring contexts, currency fluctuations have direct economic implications (Viaene and De Vries
1992, Lijian Chen et al. 2014, Hu and Motwani 2014). For instance, when the U.S. dollar is strong
against other currencies, it is more attractive for U.S. firms to offshore (Katada and Henning 2014), and
when the dollar is weak, reshoring is more attractive. Moreover, foreign currency fluctuations create
uncertainty for a firm's offshore profit and thus affect the firm's overall financial performance (Viaene
and De Vries 1992, Lijian Chen et al. 2014, Hu and Motwani 2014). The currency risk is based on the
firm's current offshore locations and the percentage of sourcing from those locations. When the firm
faces high currency risk in a foreign country, the firm would seek to reduce the risk and reshore to the
home country.
Several factors affect currency volatility, including the geopolitical stability and monetary
policy of foreign countries. When the Chinese government allowed the Renminbi to appreciate from 8
in 2005 to over 6.8 in 2020, the corresponding fluctuation of the U.S. dollar against the Renminbi
between 2013 and 2017 jeopardized U.S. MNEs’ earnings. Therefore, some companies changed their
sourcing decision and reshored.
In addition to China, many developing countries, including Vietnam, Brazil, Bangladesh,
Mexico, and Turkey, face currency volatility risk. Bayerische Motoren Werke AG (BMW) applies a
simple natural hedge strategy to protect their benefits from different markets. To work out this natural
hedge, BMW shifts some of their sourcing and buying to the geographic locations where they sell their
products. This strategy can reduce the exchange rate risk by producing and selling using the local
currency (Weber and Fadel 2006). For instance, BMW expanded its Spartanburg plant in South Carolina
in 2008 with over $750 million and created more than 5,000 jobs in the United States. This natural
hedge can help to diversify the currency fluctuation risk in the long term. Hence, when the foreign
currency of the offshore operation is more volatile than the U.S. dollar, reshoring the production back
to the United States will reduce the underlying currency risk (Baldassarre and Campo 2015). This
observation motivates us to establish the following hypothesis:
9
H1: The stock market reacts more positively to reshoring strategies associated with lower
currency risk (which occurs when the foreign currency is more volatile against the U.S.
dollar).
Elevating Effect Associated with Development Risk
To lower labor costs, many U.S. firms relocate their R&D centers to offshore locations to capture both
costing and intellectual capital advantages from foreign countries (Hemphill 2005, Motohashi 2010,
Nieto and Rodríguez 2011, Liu and Chen 2012). Thus, U.S. firms can gain access to highly skilled
engineers and scientists when they locate their R&D centers at their foreign (in-house or outsourced)
production facilities in China and India (Fifarek et al. 2008, Lewin et al. 2009, Nieto and Rodríguez
2011).
However, these companies face the risk of intellectual property (IP) theft when they produce in
foreign countries, especially for high-tech firms. IP thefts are the results of weak patent enforcement in
some countries with weak public regulatory systems (Locke et al. 2013). The suppliers may eventually
become competitors if they gain tacit knowledge of product innovation and advanced production
techniques. To lower the development risk, these high-R&D firms in the foreign country would reshore
to protect themselves from IP theft. For instance, in 2013, General Electric (GE) shifted production to
the United States due to IP rights disputes and ease of design collaboration (Reshoring Initiative 2017).
In short, the shortfall of IP protection contributes to product development risk in offshore operations.
IP protection is also the core dispute in the trade war between the United States and China. Therefore,
when high-tech MNEs centralize the R&D in their home countries, they enjoy the economies of scale
and quick responses, especially for those industries with a short supply chain. As such, more companies
are considering moving their R&D centers and production to their home countries to improve
production lead time.
H2: The stock market reacts more positively to reshoring announcements made by firms
with higher internal R&D capability.
Elevating Effect Associated with Management Risk
In Table 1,both “in-house reshoring” and “outsourced reshoring” strategies involve only one
type of change: There is a location change from a foreign country to the home country (i.e., the United
States), but there is no change in the management structure associated with the underlying sourcing
strategy. The production remains in-house in the former case, while the production remains outsourced
in the latter case. Therefore, without changing the underlying sourcing strategy, the firm can retain its
tacit production knowledge: The firm can leverage its offshore in-house production experience to
10
implement its onshore in-house production in the former case15 or its offshore outsourced supplier
management skills to implement its onshore outsourced production in the latter case (Dunning 2000).
By contrast, “reshoring for outsourcing” and “reshoring for insourcing” strategies not only
involve location change but also require a significant change in the management or organization
structure due to a shift in the sourcing strategy. In addition to the challenge associated with location
change, reshoring for outsourcing and reshoring for insourcing strategies involve a shift from in-house
to outsourced production and outsourced to in-house production, respectively. This shift requires
restructuring (e.g., a new factory or new sourcing division) that may take a few years to implement the
change (Moses and Åhlström 2008, Faes and Matthyssens 2009) and may create management risk
(Brindley 2017). This management risk can be high especially when the firm has no prior experience
in managing outsourced production under the reshoring for outsourcing strategy or when the firm has
no in-house production management experience under the reshoring for insourcing strategy (Van den
Bossche et al. 2014).16 As stated, this reshoring process decision brings higher management risk to the
firm.
Based on the above observations, it becomes clear that both in-house reshoring and outsourced
reshoring strategies incur lower management risk than both reshoring for outsourcing and reshoring for
insourcing strategies. This observation motivates us to formulate the following hypothesis:
H3: The abnormal stock return associated with less risky reshoring strategies (i.e., in-house
reshoring and outsourced reshoring strategies) is more positive.
Elevating Effect Associated with Geopolitical Risk
Government subsidies and tax benefits influence a firm’s reshoring decision (Tan and Chintakananda
2016). In the United States, Republican and Democratic parties have different beliefs about social
welfare, corporate taxes, environmental policy and regulations, and the role of the government.17 The
rates of income taxes, corporate taxes, and property taxes vary across states. For example, Tennessee’s
Hall tax18 was reduced from 2% to 1% in 2020 (Due Date and Tax Rates 2020), and Tennessee is one
of the states without individual income tax, similar to other Republican-led states, including Alaska,
South Dakota, and Texas. Predominantly Democratic states, for instance, New Jersey and New York,
were the lowest ranked from 2014 to 2020 on the State Business Tax Climate Index (Walczak 2019),
with unfavorable corporate and property tax. The 2020 State Business Tax Climate Index Ranks and
15 For example, a firm can close its foreign factory and establish a factory in the United States by transferring its offshore management team back to the U.S.16 Previous studies show that additional costs from the disruption of previous routines outweigh the benefits of restructuring (Karim and Mitchell 2004, Girod and Whittington 2017).17 For example, the Democratic Party supports a significant rise in minimum wages and believes that firms should share their profits with their employees. On the other hand, the Republican Party believes in the free market and opposes raising minimum wages because it hurts small businesses.18The Hall tax is a Tennessee state tax on interest and dividend income from investments.
11
Component Tax Ranks including corporate tax, individual income tax, sales tax, property tax, and
unemployment insurance tax rank. Delaware and Connecticut, two other predominantly Democratic
states, are the lowest-ranked states on the index for corporate and property tax in 2020, separately. Due
to the high taxes and unfavorable business environment, firms might not consider these Democratic
states when they return to the United States.
ABB Group, a multinational electronics manufacturer, receives support from the Mississippi
Development Authority and the Tate County Economic Development Foundation; this includes support
for the workforce and a favorable business environment (Vickers 2016). Moreover, Mississippi
Development Authority has helped vehicle parts supplier Grammer move from Germany to the United
States, and Tennessee Valley Authority has subsidized Hago Automotive with respect to its relocation
and equipment costs. The car tire brand Giti and home textile firm Louis Hornick moved facilities to
South Carolina because of the state’s business-friendly environment and support for skilled labor,
together with its extensive infrastructure network (Souza 2017). Technology services company Eagle
Creek reshored because of the business-friendly environment (without corporate or income tax) in
South Dakota. The state university partners with them to provide skilled laborers (Lammers 2013).
These Republican-led states offer a better environment for the reshored company, with comprehensive
facilities and skilled labor, which provides the guidelines for other companies when they consider their
reshore location in the future. Depending on the political party that controls the state legislature, the
incentives (taxes and subsidies) for reshoring vary across different states in the United States. These
observations motivate us to formulate the following hypothesis:
H4: The stock market reacts more positively to reshoring announcements made by firms that
entail reshoring the production to a state controlled by the Republican Party.
3. Data Sources and Variables
In the last section, we formulate five hypotheses (H0–H4) directly linked to our two research questions.
In this section, to operationalize our hypothesis testing, we describe how we collected the data
associated with different reshoring announcements and discuss how we measured each of those four
reshoring risks as well as other control variables.
3.1. Reshoring Announcements
We focused on all reshoring public announcements made by publicly traded firms listed in the U.S. The
data associated with these reshoring public announcements were primarily compiled through the
reshoring library from the Reshoring Initiative (http://www.reshorenow.org/).19 From the Reshoring
Initiative database, we identified 1,095 reshoring announcements made by 181 publicly listed firms that
19 The Reshoring Initiative was founded in 2010. It provides a database of 5,531 reshoring announcements made by firms that have major operation in the U.S. from 2003 to 2018.
12
have major operations in the U.S. between 2006 and 2018 (a total of 4,397 listed companies in the U.S.
were found in 2018).20 To ensure that these records were accurate (in terms of the announcement date
and the reshore locations in the United States), we fact checked each announcement with other
information sources, including Google News and Factiva. For each reshoring announcement, we
marked the date of the announcement as “Day 0.” Of those 1,095 announcements, we removed 732
announcements due to duplication (i.e., same news reported by several sources) or insufficient
information (e.g., lacking the specific date of reshoring or location), resulting in a sample of 363
reshoring announcements.
3.2. Confounding Events
To ensure the accuracy of the abnormal returns, it is vital to remove confounding events to eliminate
potential bias (Ramasubbu et al. 2019). Specifically, we eliminated a reshoring announcement if
confounding events occurred from Day −10 to Day 10. We used Factiva to search for various
confounding events such as the announcements of lawsuits, mergers, declarations of dividends, changes
in key executives, unexpected earnings, product recalls, and acquisitions (McWilliams and Siegel
1997). Of those 363 announcements in our sample, we removed 88 announcements that involved
confounding events. and, resulting 275 sample to proceed for event study. Finally, we removed 3 are
outliers21 from the samples, resulting 272 reshoring announcements associated with 85 listing firms
between 2006 and 2018 (Appendix Figure A.1). The total numbers of announcements per year is shown
in Appendix Table A.1.
3.3. Classification of Reshoring Announcements
By examining the content of each of the 272 announcements in our sample, we classified each reshoring
announcement according to its underlying reshoring strategy: (1) in-house reshoring, (2) reshoring for
outsourcing, (3) outsourced reshoring, or (4) reshoring for insourcing. Among all 272 reshoring
announcements, 211 announcements were associated with the in-house reshoring strategy. An example
of an in-house reshoring announcement is “Acco Brands Moving 34 Jobs from the Philippines to
Booneville” published on 12 January 2016, Bizbuzz. Acco (ticker: ACCO) announced reshoring 34
front office positions from Manila, the Philippines, to Booneville, Mississippi.
Similarly, we found 26 announcements associated with the outsourced reshoring strategy. An
example of this type is “New Arkansas Jobs Coming Soon from Wal-Mart Onshoring” published on 10
September 2013, City Wire. Walmart (ticker: WMT) provided a long-term contract to two suppliers to
move back to Arkansas in 2013.
20 According to The World Bank, there were 4,397 companies listed on the U.S. stock exchange in 2018.21Based on the explore analysis in SPSS on event day 0 to day 1 abnormal changes of the three-factor model.
13
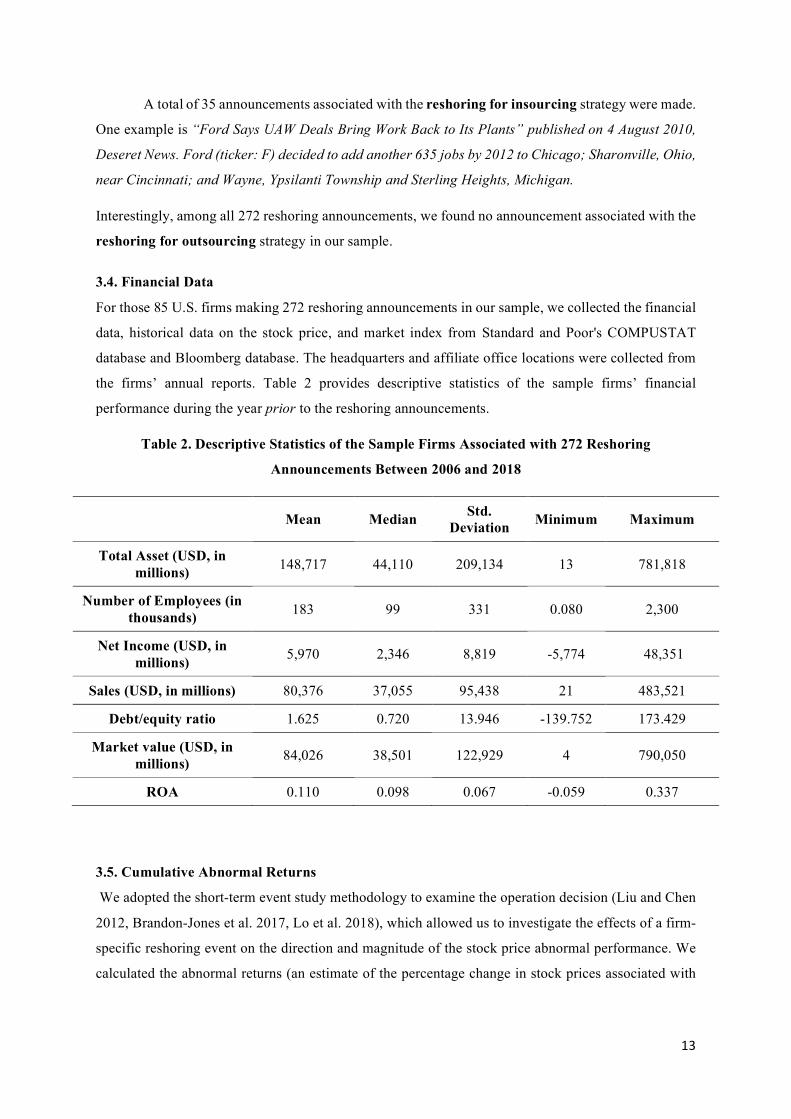
A total of 35 announcements associated with the reshoring for insourcing strategy were made.
One example is “Ford Says UAW Deals Bring Work Back to Its Plants” published on 4 August 2010,
Deseret News. Ford (ticker: F) decided to add another 635 jobs by 2012 to Chicago; Sharonville, Ohio,
near Cincinnati; and Wayne, Ypsilanti Township and Sterling Heights, Michigan.
Interestingly, among all 272 reshoring announcements, we found no announcement associated with the
reshoring for outsourcing strategy in our sample.
3.4. Financial DataFor those 85 U.S. firms making 272 reshoring announcements in our sample, we collected the financial
data, historical data on the stock price, and market index from Standard and Poor's COMPUSTAT
database and Bloomberg database. The headquarters and affiliate office locations were collected from
the firms’ annual reports. Table 2 provides descriptive statistics of the sample firms’ financial
performance during the year prior to the reshoring announcements.
Table 2. Descriptive Statistics of the Sample Firms Associated with 272 Reshoring
Announcements Between 2006 and 2018
Mean Median Std. Deviation Minimum Maximum
Total Asset (USD, in millions) 148,717 44,110 209,134 13 781,818
Number of Employees (in thousands) 183 99 331 0.080 2,300
Net Income (USD, in millions) 5,970 2,346 8,819 -5,774 48,351
Sales (USD, in millions) 80,376 37,055 95,438 21 483,521
Debt/equity ratio 1.625 0.720 13.946 -139.752 173.429
Market value (USD, in millions) 84,026 38,501 122,929 4 790,050
ROA 0.110 0.098 0.067 -0.059 0.337
3.5. Cumulative Abnormal Returns
We adopted the short-term event study methodology to examine the operation decision (Liu and Chen
2012, Brandon-Jones et al. 2017, Lo et al. 2018), which allowed us to investigate the effects of a firm-
specific reshoring event on the direction and magnitude of the stock price abnormal performance. We
calculated the abnormal returns (an estimate of the percentage change in stock prices associated with

14
an event on stock prices by adjusting them with market-wide movements). We applied the daily stock
data to calculate the abnormal returns (Sorescu et al. 2017).
Following the general practice of short-term event study (Jacobs et al. 2010), we used the
calendar days as event days and Day 0 as the reshoring news announcement date and time (i.e., before
market closing time). Then, we applied a 5-day event period and examined the effects of the three
reshoring type announcements on abnormal returns from Day −2 to Day 2. The abnormal stock price
changes of the sample firms during a short period (i.e., Days −2, −1, 0, and 1, 2) were evaluated before
the announcement was published (Jacobs et al. 2010). As the measurement window was more than 1
day, we added the daily abnormal returns in the window to obtain a cumulative abnormal return (CAR).
We further worked with cross-sectional analysis using the CAR, as presented in the next section.
Three-Factor Model
We used the Fama and French’s three-factor model to estimate abnormal returns.22 Fama and
French (1993) developed the Fama–French three-factor model by considering three factors, including
market risk, market capitalization, and book-to-market ratio, assuming the linear relationship between
the return of any stock and these three factors over time. A 200-day estimation period (from Day −210 to Day 11) was applied to compute the expected
return for each firm (210 trading days from Day −11 before the reshoring news). We eliminated the
firm with less than 40 days of stock price data to ensure accuracy (Jacobs et al. 2010). To protect the
estimate against the effects of the announcement and ensure nonstationarity, we ended the estimation
period 10 trading days before the event day (Jacobs et al. 2010). The difference between the expected
and actual return is the abnormal return for firm i on day t. The following formula shows how it is
estimated using the Fama–French three-factor model:
!"#$ = "#$ − ((# + "*$ + +#,-".$ − "*$/ + +#0123$ + +#4526$ + 7#$) (1)
Where "9: is the actual rate of return for firm i on day t; the formula within the parenthesis is the
expected returns based on the three-factor model; ";: and "2: is the risk-free rate and market return
on day t. SMB stands for small minus big (market capitalization), and HML stands for high minus low
(book-to-market ratio) return on day t; + is the factor’s coefficient; 79:is the error term.
To test the presence of abnormal returns, both parametric (t-test) and nonparametric tests will
be conducted. Non-parametric tests, such as Wilcoxon signed rank (WSR) test and binomial sign test
22 For robustness checks, we also consider the market model and the four-factor model. The market model is built on the actual returns of a reference market and the correlation of the firm's stock with the reference market. Similar to the three-factor model, the market model assumes a linear relationship between any stock return and that of the market index over a period (Scholes and Williams 1977). The four-factor model is the extension of the three-factor model by adding monthly momentum into the regression (Carhart 1997). The calculation for the mean abnormal return and cumulative abnormal return over a period is the same as Equations (3) and (4). The details are provided in Appendix Table A.5 and A.6.
15
were used to compare the abnormal median return and determine whether positive or negative abnormal
returns occurred during the event periods.
The mean abnormal returns !"¯$ for day t is are as follows:
!"¯$ = ∑ >?@A
BB#C, (2)
!"#$ is the abnormal return for firm i on day t obtained from Equation (2); N is the sample size,
representing 272 reshoring announcements.
Finally, we compute the CAR, (D!"#($,,$0)), which is the sum of the daily mean abnormal stock return
(!"¯$ ) over the measurement window (t1, t2):
D!"#($,,$0) = ∑ !"#$$F$C$G (3)
3.6. Elevating Risk Factors
To estimate the impact of the elevating risk factors, we conducted a cross-sectional regression with the
CAR as the dependent variable. We measured the four types of reshoring risks—(1) currency risk, (2)
development risk, (3) management risk, and (4) geopolitical risk—as follows:
3.6.1. Currency Risk
To measure the currency risk associated with a reshoring announcement that involves a change in
location from a foreign country to the United States, we used the Bloomberg Dollar Spot Index
(BBDXY) to measure the volatility of a foreign currency against the U.S. dollar. Unlike the U.S. Dollar
Index (DXY) that focuses on leading global currencies, BBDXY provides both developed and
“emerging 10” trading market currencies (such as the Indian rupee, Mexican peso, and Chinese
renminbi). These emerging markets are involved in our reshoring announcement event study. For this
reason, we used BBDXY to calculate the monthly volatility (coefficient of variation) using the standard
deviation of currency price by monthly and mean monthly currency value in a year (De Santis and
Gérard 1998). We defined currency risk based on the volatility of the currency of a foreign country the
month before the reshore announcement.
3.6.2. Development Risk
R&D intensity has been widely used as a measure of firm investment in knowledge assets (Berry 2015),
and it is a strong predictor of a firm’s outsourcing process (Mol 2005). High-tech firms, those with
higher R&D intensity, usually solidify their efforts to create knowledge for new product development
and process and technology improvement. These high-tech firms would lower the development risk by
reshoring to the home country to protect their IP and the know-how of new technologies. Therefore, we
16
defined a variable development risk based on the focal firm’s R&D intensity. The higher the value of
R&D intensity, the higher the firm’s development risk on reshoring. Using the financial data collected
from Standard and Poor’s COMPUSTAT database, we measured the firm’s “R&D intensity” according
to the R&D expense over sales during the fiscal year before the announcement date.
3.6.3. Management Risk
After classifying those 272 reshoring announcements into four types as discussed in Section 3.1.2, we
captured the notion that the reshoring for outsourcing and the reshoring for insourcing strategies have
higher management risk because both strategies involve management restructuring, as discussed in
Section 2. For this, we created a dummy variable called management risk. This dummy variable equals
1 if the corresponding announcement is based on a safer reshoring strategy (i.e., either the in-house
reshoring or the outsourced reshoring strategy). If the announcement is based on a riskier reshoring
strategy that involves changes from in-house to outsourced or from outsourced to in-house (i.e., either
the reshoring for outsourcing or the reshoring for insourcing strategy), the dummy variable equals 0.
3.6.4. Geopolitical Risk
We measured the geopolitical risk associated with reshoring announcements based on the controlling
party of the reshore location (State). Among 272 announcements, a total of 37 states were involved in
the reshoring activities. Of these 37 states, 15 states changed their political party control within our
study period (2006–2018) (Appendix Table A.2). Specifically, we created a dummy variable
geopolitical risk that takes on the value of 1 if the Republicans control the state legislature of the reshore
location during the year of the reshoring announcement; value 0 denotes the Democrats control the
state. The controlling party of each state during each year is available at Ballotpedia (Ballotpedia 2020).
3.7. Control Factors
To control other factors influencing abnormal stock returns associated with a firm’s reshoring
announcement, we incorporated the following control factors that were obtained from Standard and
Poor's COMPUSTAT database, Bloomberg, and company annual reports. The control factors Firm size
and leverage were computed based on the fiscal year ending prior to the announcement date.
Firm size: We measured the firm size according to the employee number. Larger firms would
have more resources and a stronger financial capability to return to the United States than would smaller
firms. We used the number of employees instead of total assets to represent firm size because it is more
relevant to firms’ operations. This variable was determined based on COMPUSTAT’s data, and the
measurement for each firm was based on the information one year prior to the announcement.
Leverage: We measured a firm’s leverage by dividing the company's total debt with total
shareholder equity, which indicates the company's operation risk (Johnson et al. 2017). High leverage
17
indicates a significant percentage of firm assets are in the form of debt.23 This variable was based on
the information one year prior the reshoring announcement.
Fiscal year of reshoring: We created the variable fiscal year and controlled it for the year of
the announcement (year dummy) for the general economic conditions. First reshoring: We controlled the first reshoring event for the company within the year by
using the dummy variable first reshoring. This variable equals 1 if the corresponding reshoring
announcement is for the first time during the year; it equals 0, otherwise.24 This variable controlled for
the effect of multiple reshoring announcements in the same year because it might have a stronger (or
weaker) impact on shareholder reactions. Industry type: Both manufacturing and service industry sectors are likely to reshore as these
two sectors outsource a large number of jobs offshore.25 Therefore, we created two dummy variables.
Manufacturing industry (industry type: manufacturing) is the first dummy variable, where the value
is 1 when the firm is from the manufacturing industry (SIC code = 20 to 39), and the value of 0 denotes
that the form is from the nonmanufacturing industry. The second dummy variable is for the service
sector (industry type: service), and it takes the value of 1 if the corresponding firm belongs to the
service industry (SIC code = 70 to 89) and value 0 otherwise.
Offshore locations: We controlled for each firm’s (original) offshore country location before
applying reshoring as a dummy variable. Explicitly, given the concern of overly relying on China as an
offshore location, we define the variable offshore China, which takes on the value of 1 if the offshore
location is in China and value 0 otherwise.
Reshoring location dummy: We controlled for the region that hosts the reshoring operation
for each announcement. The region/state would affect the reshoring decision, as different states provide
different incentives (e.g., corporate tax) to the firms. At the same time, as changes occurred in political
party control in some states during our study period, it may not fully reflect the effect of the locations.
Therefore, we controlled the state location based on the U.S. Census Bureau’s four statistical regions
of the 50 states, which are Northeast, Midwest, South, and West (Appendix Table A.3).
We also created the dummy variable Top 10 States for Business provided by CNBC. This
ranking scores all 50 states on 64 metrics on 10 economic factors of competitiveness, including the cost
of living, access to capital, friendliness, business, technology and innovation, education, economy,
infrastructure, quality of life, workforce, and cost of doing business since 2007.26 The companies have
to consider these factors when they select the reshoring location. Therefore, we controlled if the
23High-leverage firms need to maintain a healthy cash inflow to meet the liabilities. Therefore, leverage is a proper indicator of whether the reshoring firm is taking the risk to set up a new factory. High-leverage firms may find it hard to obtain further financing to reshore. 24 This includes subsequent reshoring announcements during the year. 25 For example, U.S. manufacturing jobs reduced from 17 million in 2001 to less than 13 million in 2018. More than 5 million jobs were lost due to offshore production. See: https://www.dol.gov/general/topic/statistics 26 https://www.cnbc.com/2019/06/08/how-cnbc-chose-americas-top-states-for-business-in-2019.html
18
reshoring state is one of the top 10 states for business in the reshoring year. The dummy variable has
the value of 1 if the reshoring states are among the top 10 states for business; otherwise, it has the value
of 0.
Corporate social responsibility (CSR): Social responsibility is one of the critical reshoring
reasons (Lewin et al. 2009, Ellram et al. 2013b).27 We created the dummy variable Top 100 CSR based
on the "100 Best Corporate Citizens" list provided by Corporate Responsibility Magazine since 2007.
The list is based on 134 factors in seven categories: stakeholders, society, human rights, governance,
finance, environment, employee relations, and climate change from public resources.28 The dummy
variable has the value of 1 if the reshoring company is in the top 100 corporate responsibility companies,
and it has the value of value 0 otherwise.
By considering those reshoring risk factors as described in Section 3.6 and those control factors
in Section 3.7 (that are measured prior to the reshoring announcements), we can use the CARi as defined
in Equation (3) to develop our full model as stated below.
Full model: CARi = β0 + β1 firm size + β2 leverage + β3 fiscal year + β4 first reshoring + β5 industry
type: manufacturing + β6 industry type: service + β7 Top 10 States for Business + β8 Top 100 CSR +
β9 Offshore China +β10 reshoring location dummies + β11 currency volatility (currency risk) + β12
R&D intensity (development risk) + β13 reshoring type (management risk) + β14 reshoring location
party control (geopolitical risk) + residuali (4)
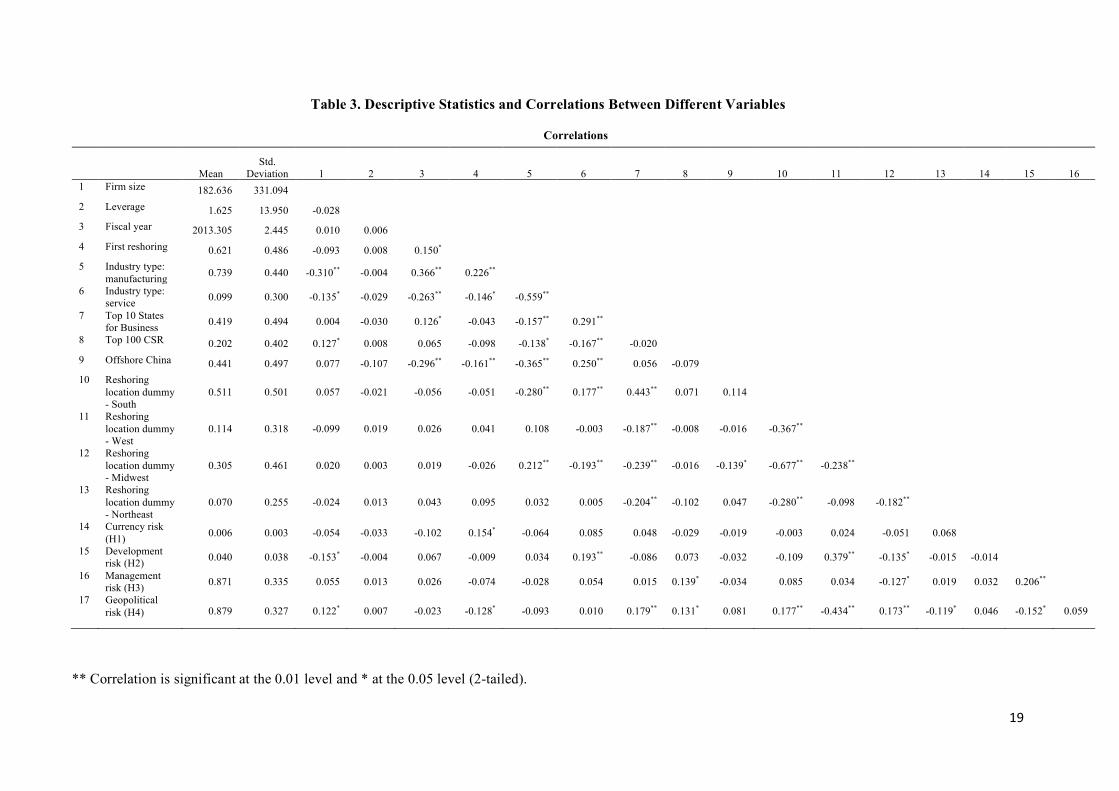
Table 3 presents the descriptive statistics and correlation of the variables. The results show that the
correlations between variables are reasonable.
27The companies aim at reducing carbon footprint by producing locally, creating more jobs, and improving environmental and social responsibility when they reshore back to the U.S. Therefore, we controlled whether the best 100 corporate citizens companies would have a positive impact on a shareholder's perception as they are already recognized for their outstanding environmental, social, and governance transparency and performance amongst the 1,000 largest U.S. public companies. 28 The 100 best corporate citizen list is a subset of Russell 1000 index, the details of the ranking can be found from here. https://www.3blassociation.com/insights/how-we-rank-the-100-best-corporate-citizens
19
Table 3. Descriptive Statistics and Correlations Between Different Variables
Correlations
Mean Std.
Deviation 1 2 3 4 5 6 7 8 9 10 11 12 13 14 15 16 1 Firm size 182.636 331.094 2 Leverage 1.625 13.950 -0.028 3 Fiscal year 2013.305 2.445 0.010 0.006 4 First reshoring 0.621 0.486 -0.093 0.008 0.150* 5 Industry type:
manufacturing 0.739 0.440 -0.310** -0.004 0.366** 0.226**
6 Industry type: service 0.099 0.300 -0.135* -0.029 -0.263** -0.146* -0.559**
7 Top 10 States for Business 0.419 0.494 0.004 -0.030 0.126* -0.043 -0.157** 0.291**
8 Top 100 CSR 0.202 0.402 0.127* 0.008 0.065 -0.098 -0.138* -0.167** -0.020 9 Offshore China 0.441 0.497 0.077 -0.107 -0.296** -0.161** -0.365** 0.250** 0.056 -0.079 10 Reshoring
location dummy - South
0.511 0.501 0.057 -0.021 -0.056 -0.051 -0.280** 0.177** 0.443** 0.071 0.114
11 Reshoring location dummy - West
0.114 0.318 -0.099 0.019 0.026 0.041 0.108 -0.003 -0.187** -0.008 -0.016 -0.367**
12 Reshoring location dummy - Midwest
0.305 0.461 0.020 0.003 0.019 -0.026 0.212** -0.193** -0.239** -0.016 -0.139* -0.677** -0.238**
13 Reshoring location dummy - Northeast
0.070 0.255 -0.024 0.013 0.043 0.095 0.032 0.005 -0.204** -0.102 0.047 -0.280** -0.098 -0.182**
14 Currency risk (H1) 0.006 0.003 -0.054 -0.033 -0.102 0.154* -0.064 0.085 0.048 -0.029 -0.019 -0.003 0.024 -0.051 0.068
15 Development risk (H2) 0.040 0.038 -0.153* -0.004 0.067 -0.009 0.034 0.193** -0.086 0.073 -0.032 -0.109 0.379** -0.135* -0.015 -0.014
16 Management risk (H3) 0.871 0.335 0.055 0.013 0.026 -0.074 -0.028 0.054 0.015 0.139* -0.034 0.085 0.034 -0.127* 0.019 0.032 0.206**
17 Geopolitical risk (H4) 0.879 0.327 0.122* 0.007 -0.023 -0.128* -0.093 0.010 0.179** 0.131* 0.081 0.177** -0.434** 0.173** -0.119* 0.046 -0.152* 0.059
** Correlation is significant at the 0.01 level and * at the 0.05 level (2-tailed).
20
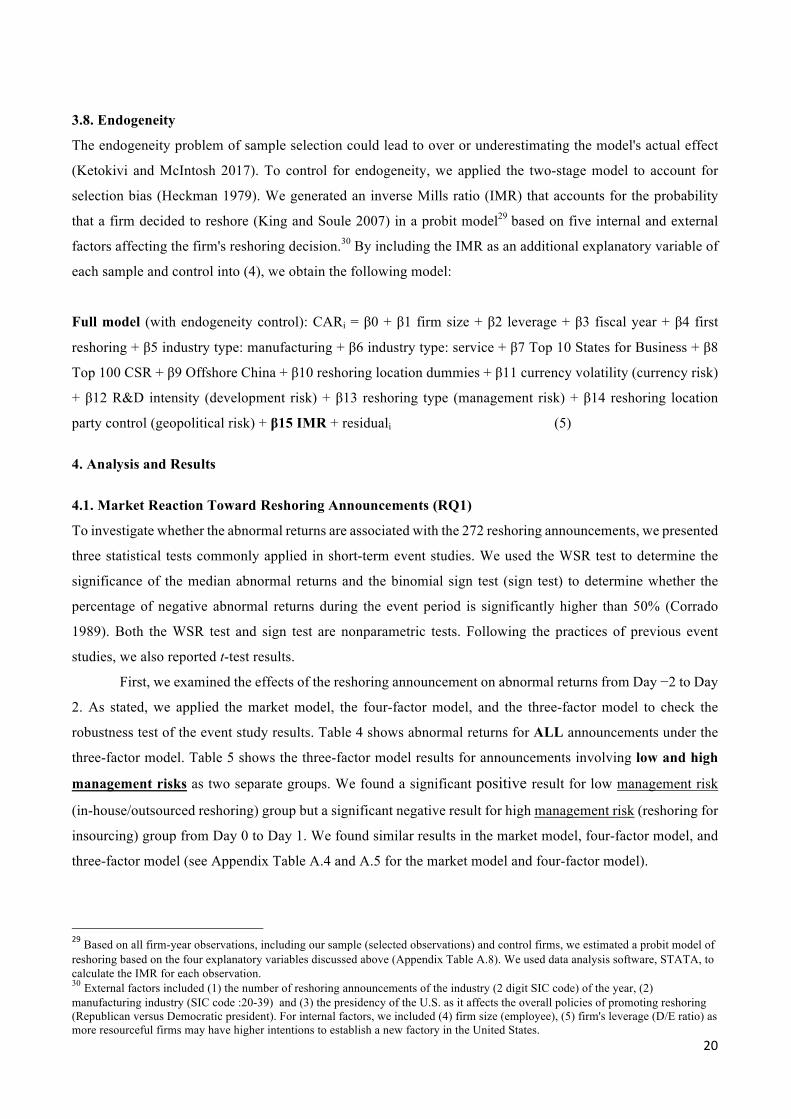
3.8. Endogeneity
The endogeneity problem of sample selection could lead to over or underestimating the model's actual effect
(Ketokivi and McIntosh 2017). To control for endogeneity, we applied the two-stage model to account for
selection bias (Heckman 1979). We generated an inverse Mills ratio (IMR) that accounts for the probability
that a firm decided to reshore (King and Soule 2007) in a probit model29 based on five internal and external
factors affecting the firm's reshoring decision.30 By including the IMR as an additional explanatory variable of
each sample and control into (4), we obtain the following model:
Full model (with endogeneity control): CARi = β0 + β1 firm size + β2 leverage + β3 fiscal year + β4 first
reshoring + β5 industry type: manufacturing + β6 industry type: service + β7 Top 10 States for Business + β8
Top 100 CSR + β9 Offshore China + β10 reshoring location dummies + β11 currency volatility (currency risk)
+ β12 R&D intensity (development risk) + β13 reshoring type (management risk) + β14 reshoring location
party control (geopolitical risk) + β15 IMR + residuali (5)
4. Analysis and Results
4.1. Market Reaction Toward Reshoring Announcements (RQ1)
To investigate whether the abnormal returns are associated with the 272 reshoring announcements, we presented
three statistical tests commonly applied in short-term event studies. We used the WSR test to determine the
significance of the median abnormal returns and the binomial sign test (sign test) to determine whether the
percentage of negative abnormal returns during the event period is significantly higher than 50% (Corrado
1989). Both the WSR test and sign test are nonparametric tests. Following the practices of previous event
studies, we also reported t-test results.
First, we examined the effects of the reshoring announcement on abnormal returns from Day −2 to Day
2. As stated, we applied the market model, the four-factor model, and the three-factor model to check the
robustness test of the event study results. Table 4 shows abnormal returns for ALL announcements under the
three-factor model. Table 5 shows the three-factor model results for announcements involving low and high
management risks as two separate groups. We found a significant positive result for low management risk
(in-house/outsourced reshoring) group but a significant negative result for high management risk (reshoring for
insourcing) group from Day 0 to Day 1. We found similar results in the market model, four-factor model, and
three-factor model (see Appendix Table A.4 and A.5 for the market model and four-factor model).
29Based on all firm-year observations, including our sample (selected observations) and control firms, we estimated a probit model of reshoring based on the four explanatory variables discussed above (Appendix Table A.8). We used data analysis software, STATA, to calculate the IMR for each observation. 30 External factors included (1) the number of reshoring announcements of the industry (2 digit SIC code) of the year, (2) manufacturing industry (SIC code :20-39) and (3) the presidency of the U.S. as it affects the overall policies of promoting reshoring (Republican versus Democratic president). For internal factors, we included (4) firm size (employee), (5) firm's leverage (D/E ratio) as more resourceful firms may have higher intentions to establish a new factory in the United States.
21
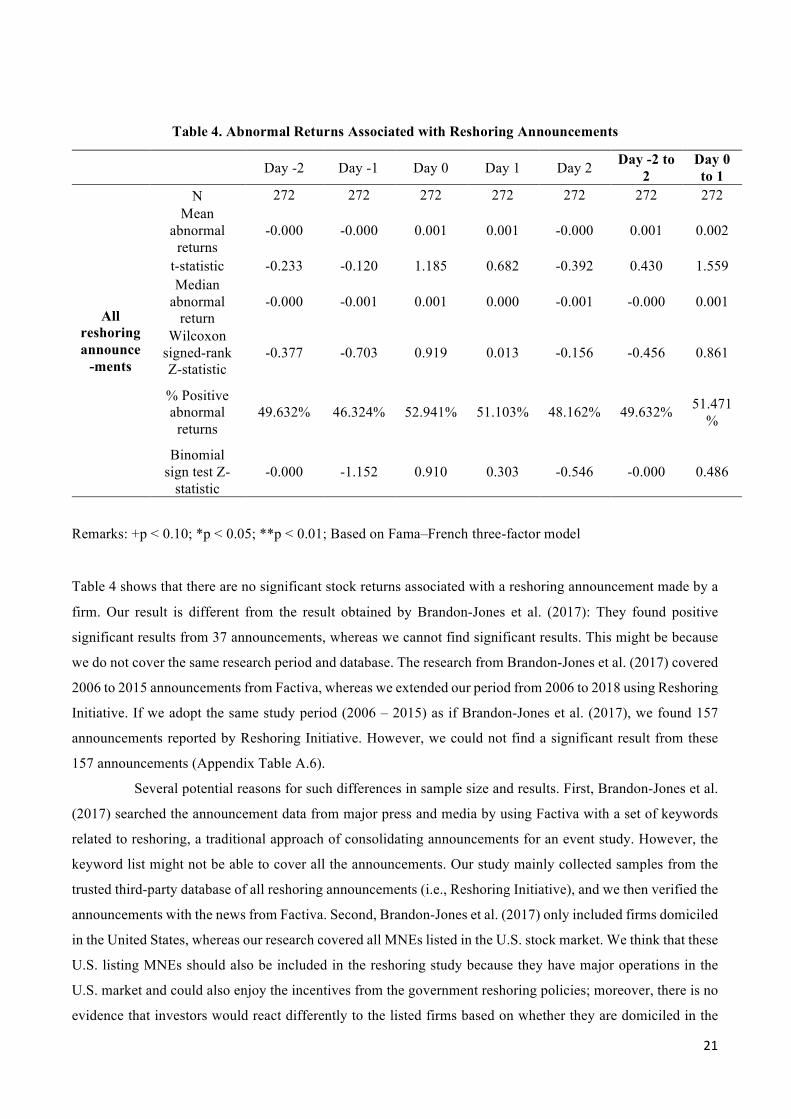
Table 4. Abnormal Returns Associated with Reshoring Announcements
Day -2 Day -1 Day 0 Day 1 Day 2 Day -2 to 2
Day 0 to 1
All reshoring announce
-ments
N 272 272 272 272 272 272 272 Mean
abnormal returns
-0.000 -0.000 0.001 0.001 -0.000 0.001 0.002
t-statistic -0.233 -0.120 1.185 0.682 -0.392 0.430 1.559 Median
abnormal return
-0.000 -0.001 0.001 0.000 -0.001 -0.000 0.001
Wilcoxon signed-rank Z-statistic
-0.377 -0.703 0.919 0.013 -0.156 -0.456 0.861
% Positive abnormal
returns 49.632%
46.324%
52.941%
51.103% 48.162% 49.632%
51.471
%
Binomial sign test Z-
statistic -0.000 -1.152 0.910 0.303 -0.546 -0.000 0.486
Remarks: +p < 0.10; *p < 0.05; **p < 0.01; Based on Fama–French three-factor model
Table 4 shows that there are no significant stock returns associated with a reshoring announcement made by a
firm. Our result is different from the result obtained by Brandon-Jones et al. (2017): They found positive
significant results from 37 announcements, whereas we cannot find significant results. This might be because
we do not cover the same research period and database. The research from Brandon-Jones et al. (2017) covered
2006 to 2015 announcements from Factiva, whereas we extended our period from 2006 to 2018 using Reshoring
Initiative. If we adopt the same study period (2006 – 2015) as if Brandon-Jones et al. (2017), we found 157
announcements reported by Reshoring Initiative. However, we could not find a significant result from these
157 announcements (Appendix Table A.6).
Several potential reasons for such differences in sample size and results. First, Brandon-Jones et al.
(2017) searched the announcement data from major press and media by using Factiva with a set of keywords
related to reshoring, a traditional approach of consolidating announcements for an event study. However, the
keyword list might not be able to cover all the announcements. Our study mainly collected samples from the
trusted third-party database of all reshoring announcements (i.e., Reshoring Initiative), and we then verified the
announcements with the news from Factiva. Second, Brandon-Jones et al. (2017) only included firms domiciled
in the United States, whereas our research covered all MNEs listed in the U.S. stock market. We think that these
U.S. listing MNEs should also be included in the reshoring study because they have major operations in the
U.S. market and could also enjoy the incentives from the government reshoring policies; moreover, there is no
evidence that investors would react differently to the listed firms based on whether they are domiciled in the
22
United States or not. Third, it may be because Brandon-Jones et al. (2017) only included reshoring
announcements with low management risk; thus, their finding has a similarly positive result as our result for
low management risk, which we present next.
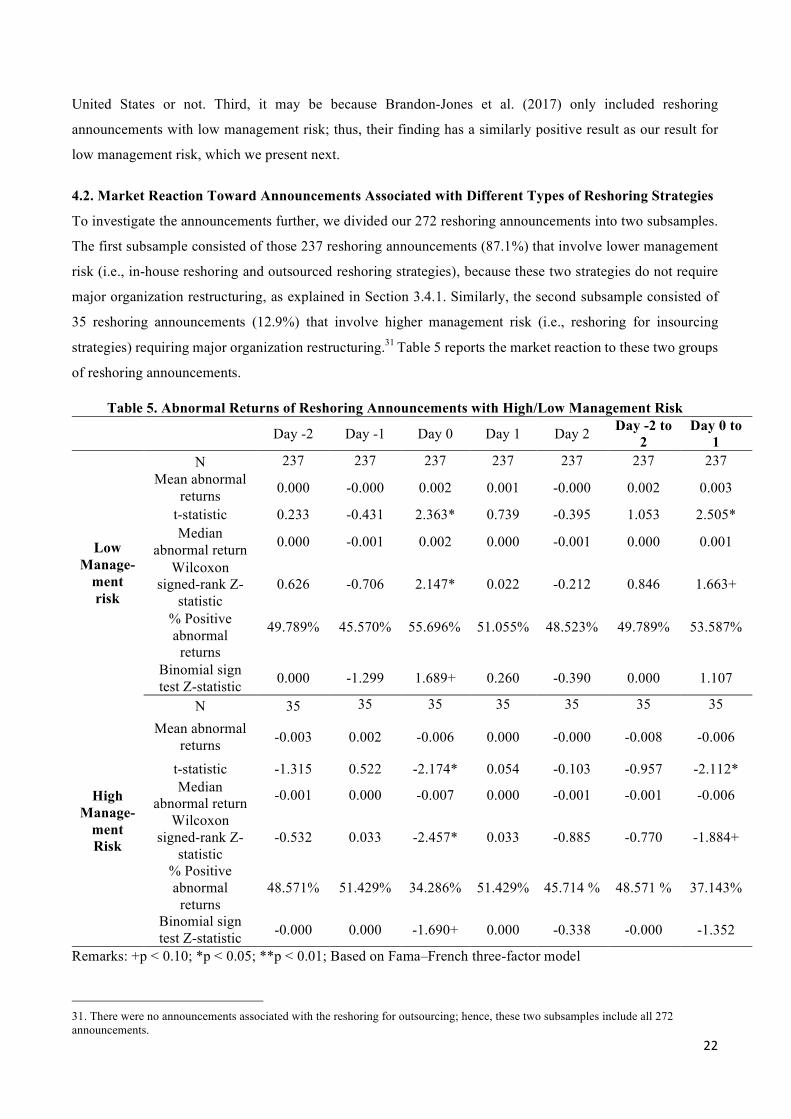
4.2. Market Reaction Toward Announcements Associated with Different Types of Reshoring Strategies
To investigate the announcements further, we divided our 272 reshoring announcements into two subsamples.
The first subsample consisted of those 237 reshoring announcements (87.1%) that involve lower management
risk (i.e., in-house reshoring and outsourced reshoring strategies), because these two strategies do not require
major organization restructuring, as explained in Section 3.4.1. Similarly, the second subsample consisted of
35 reshoring announcements (12.9%) that involve higher management risk (i.e., reshoring for insourcing
strategies) requiring major organization restructuring.31 Table 5 reports the market reaction to these two groups
of reshoring announcements.
Table 5. Abnormal Returns of Reshoring Announcements with High/Low Management Risk
Day -2 Day -1 Day 0 Day 1 Day 2 Day -2 to 2
Day 0 to 1
Low Manage-
ment risk
N 237 237 237 237 237 237 237 Mean abnormal
returns 0.000 -0.000 0.002 0.001 -0.000 0.002 0.003
t-statistic 0.233 -0.431 2.363* 0.739 -0.395 1.053 2.505* Median
abnormal return 0.000 -0.001 0.002 0.000 -0.001 0.000 0.001
Wilcoxon signed-rank Z-
statistic 0.626 -0.706 2.147* 0.022 -0.212 0.846 1.663+
% Positive abnormal
returns
49.789%
45.570%
55.696%
51.055%
48.523%
49.789%
53.587%
Binomial sign test Z-statistic 0.000 -1.299 1.689+ 0.260 -0.390 0.000 1.107
High Manage-
ment Risk
N 35 35 35 35 35 35 35
Mean abnormal returns -0.003 0.002 -0.006 0.000 -0.000 -0.008 -0.006
t-statistic -1.315 0.522 -2.174* 0.054 -0.103 -0.957 -2.112* Median
abnormal return -0.001 0.000 -0.007 0.000 -0.001 -0.001 -0.006
Wilcoxon signed-rank Z-
statistic -0.532 0.033 -2.457* 0.033 -0.885 -0.770 -1.884+
% Positive abnormal
returns 48.571% 51.429% 34.286% 51.429% 45.714 % 48.571 % 37.143%
Binomial sign test Z-statistic -0.000 0.000 -1.690+ 0.000 -0.338 -0.000 -1.352
Remarks: +p < 0.10; *p < 0.05; **p < 0.01; Based on Fama–French three-factor model
31. There were no announcements associated with the reshoring for outsourcing; hence, these two subsamples include all 272 announcements.
23
From Table 5, we find that announcements based on in-house/outsourced reshoring strategies with
lower management risk, as explained in Table 1 in Section 1, tend to show a positive market reaction on Day 0
and from Day 0 to Day 1. The mean (median) abnormal return for Day 0 to Day 1 is 0.3% (0.1%) and positively
significant less than zero (p < 0.05 for mean and p < 0.1 for median). Moreover, announcements associated
with high management risk (i.e., reshoring for insourcing strategy)32 exhibit negative market reaction from Day
0 to Day 1. The mean (median) abnormal return is −0.6% (−0.6%) and negatively significant less than zero (p
< 0.05 for the mean and p < 0.1 for median). In summary, we find that the market reacts positively to reshoring announcements associated with less
risky reshoring strategies (in-house reshoring and outsourced reshoring). However, the market reacts
significantly negative toward high management risk (reshoring for insourcing). Given these refinements, we
can conclude that H0 is partially supported for reshoring announcements associated with less risky reshoring
strategies (in-house reshoring and outsourced reshoring). Hence, our result partly corroborates those of
Brandon-Jones et al. (2017) when we examine market reaction toward reshoring announcements with a much
larger sample size covering a more recent period.
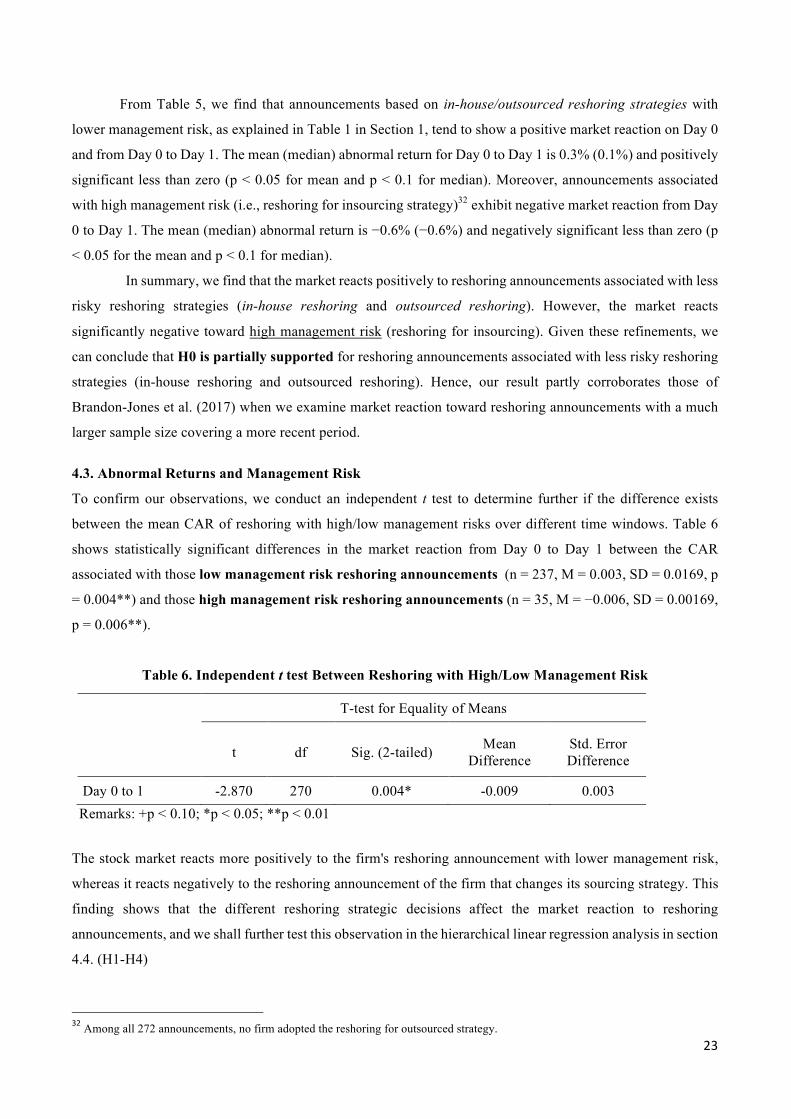
4.3. Abnormal Returns and Management Risk
To confirm our observations, we conduct an independent t test to determine further if the difference exists
between the mean CAR of reshoring with high/low management risks over different time windows. Table 6
shows statistically significant differences in the market reaction from Day 0 to Day 1 between the CAR
associated with those low management risk reshoring announcements (n = 237, M = 0.003, SD = 0.0169, p
= 0.004**) and those high management risk reshoring announcements (n = 35, M = −0.006, SD = 0.00169,
p = 0.006**).
Table 6. Independent t test Between Reshoring with High/Low Management Risk
T-test for Equality of Means
t df Sig. (2-tailed) Mean Difference
Std. Error Difference
Day 0 to 1 -2.870 270 0.004* -0.009 0.003 Remarks: +p < 0.10; *p < 0.05; **p < 0.01
The stock market reacts more positively to the firm's reshoring announcement with lower management risk,
whereas it reacts negatively to the reshoring announcement of the firm that changes its sourcing strategy. This
finding shows that the different reshoring strategic decisions affect the market reaction to reshoring
announcements, and we shall further test this observation in the hierarchical linear regression analysis in section
4.4. (H1-H4)
32Among all 272 announcements, no firm adopted the reshoring for outsourced strategy.
24
4.3.1. Placebo Test
To test if the abnormal stock return is only due to the low management reshoring announcement and
not due to other factors such as general economic conditions, we conduct a placebo test. We randomly select
firms without reshoring announcements from the same industry as those sample firms. Appendix Table A.7
reports the results when 237 non-reshoring firms are treated as a new placebo group; we found no significant
abnormal changes in all periods. The nonsignificant results further confirm that abnormal returns are purely due
to reshoring announcements with low management risk.
4.4. Hierarchical Linear Regression Analysis (RQ2)
4.4.1. Analysis of the Three Moderating Factors
We conduct a hierarchical linear regression analysis to test hypotheses H1–H4 to examine the impact of
different types of reshoring risks on market reaction associated with a firm’s reshoring announcements. We
develop a model to examine whether a positive stock market reaction toward reshoring is moderated by four
moderating factors (currency, development, management, and geopolitical risks). We consider both the control
model and the full model (that incorporates all four variables associated with different types of reshoring risks
as explained in Section 3.4 and 3.5). In the control model, the CARi from Day −2 to Day 2 is regressed against
all control variables and residuali. (as a dependent variable). The full model includes both control variables and
moderating factors, which can be represented by the formulas (4 and 5) stated in Section 3.
25
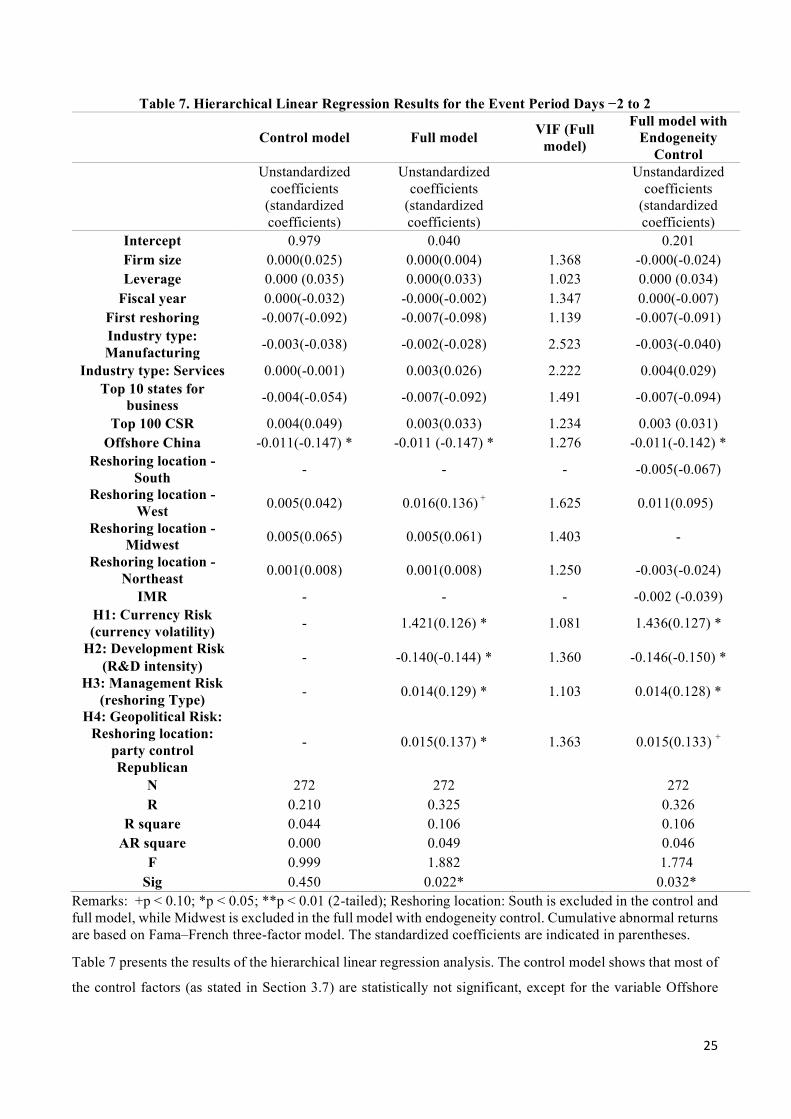
Table 7. Hierarchical Linear Regression Results for the Event Period Days −2 to 2
Control model Full model VIF (Full model)
Full model with Endogeneity
Control
Unstandardized coefficients
(standardized coefficients)
Unstandardized coefficients
(standardized coefficients)
Unstandardized coefficients
(standardized coefficients)
Intercept 0.979 0.040 0.201 Firm size 0.000(0.025) 0.000(0.004) 1.368 -0.000(-0.024) Leverage 0.000 (0.035) 0.000(0.033) 1.023 0.000 (0.034)
Fiscal year 0.000(-0.032) -0.000(-0.002) 1.347 0.000(-0.007) First reshoring -0.007(-0.092) -0.007(-0.098) 1.139 -0.007(-0.091) Industry type: Manufacturing -0.003(-0.038) -0.002(-0.028) 2.523 -0.003(-0.040)
Industry type: Services 0.000(-0.001) 0.003(0.026) 2.222 0.004(0.029) Top 10 states for
business -0.004(-0.054) -0.007(-0.092) 1.491 -0.007(-0.094)
Top 100 CSR 0.004(0.049) 0.003(0.033) 1.234 0.003 (0.031) Offshore China -0.011(-0.147) * -0.011 (-0.147) * 1.276 -0.011(-0.142) *
Reshoring location -South - - - -0.005(-0.067)
Reshoring location -West 0.005(0.042) 0.016(0.136) + 1.625 0.011(0.095)
Reshoring location -Midwest 0.005(0.065) 0.005(0.061) 1.403 -
Reshoring location -Northeast 0.001(0.008) 0.001(0.008) 1.250 -0.003(-0.024)
IMR - - - -0.002 (-0.039) H1: Currency Risk (currency volatility) - 1.421(0.126) * 1.081 1.436(0.127) *
H2: Development Risk (R&D intensity) - -0.140(-0.144) * 1.360 -0.146(-0.150) *
H3: Management Risk (reshoring Type) - 0.014(0.129) * 1.103 0.014(0.128) *
H4: Geopolitical Risk: Reshoring location:
party control Republican
- 0.015(0.137) * 1.363 0.015(0.133) +
N 272 272 272 R 0.210 0.325 0.326
R square 0.044 0.106 0.106 AR square 0.000 0.049 0.046
F 0.999 1.882 1.774 Sig 0.450 0.022* 0.032*
Remarks: +p < 0.10; *p < 0.05; **p < 0.01 (2-tailed); Reshoring location: South is excluded in the control and full model, while Midwest is excluded in the full model with endogeneity control. Cumulative abnormal returns are based on Fama–French three-factor model. The standardized coefficients are indicated in parentheses.
Table 7 presents the results of the hierarchical linear regression analysis. The control model shows that most of
the control factors (as stated in Section 3.7) are statistically not significant, except for the variable Offshore
26
China. Notably, the moving of factories away from China has a negative impact on reshoring, which we shall
discuss further.
Based on our analysis of the full model (with endogeneity control) as defined in (5),33 we find consistent
results in Table 7. Moreover, we find a significant positive market reaction for firms that are reshoring from a
foreign country with higher currency volatility (p < 0.05). Hence, we can conclude that pre-existing currency
risk has a significant impact on CAR; thus, H1 is supported. Next, from Table 7, we find that reshoring
strategy-dependent management risk is significantly positive (p < 0.05) in terms of its impact on CAR. This
finding further confirms that H3 is supported. From Table 7, the reshoring strategy-dependent geopolitical risk
has a positive significant effect (p < 0.05) on CAR. This result implies that when a company reshores to a
Republican-led state, a significant positive stock market reaction occurs (p < 0.05). Hence, H4 is supported.
However, with respect to pre-existing development risk, a moderate negative significance occurs on the stock
price (p < 0.05), implying that when a high R&D intensity company is reshoring back to the United States, the
market reaction is significantly negative (p < 0.05). Hence, H2 is not supported.
Our result that the market reacts negatively toward reshoring announcements associated with firms that
invest heavily in R&D challenges the common belief (as we hypothesized in H2) that high-tech firms with high
R&D investments would obtain more benefit when they reshore to the United States, as more reliable IP
protection is present (Locke et al. 2013). There is indeed a trend that firms are reshoring more high-tech jobs
than low-tech jobs (Backer et al. 2016), and the high-tech industries tend to bring more investment and R&D
back to the United States compared with the low-tech industries. However, the high-tech industries might find
that the readily available local blue-collar workers may not possess the skill sets needed for today’s high-tech
manufacturing. The high-tech industries are also relying on highly automated machinery and robots for
production (Backer et al. 2016). These highly automated establishments might have created more high-tech
engineering jobs. The government may eventually issue more working visas for skillful and knowledgeable
engineers from overseas. This might be contradictory to the original goal of creating jobs for local blue-collar
workers. For example, Apple’s supplier Foxconn relocated its plant to Wisconsin in 2017 and planned to create
13,000 jobs. However, Foxconn could not fulfill the job creation and investment targets to earn tax incentives
in 2018.34 As of writing this paper, there is concern over Foxconn’s commitment. Therefore, the market reaction
to the high-tech firm reshoring is not as positive as expected.
33Our regression model is significant, with an F-value of 1.882 for the full model. The R square and adjusted R square are 0.106 and 0.049, and the level is acceptable, as our regression is based on cross-sectional data with a small sample size (Klassen and McLaughlin 1996). The variance inflation factor (VIF) for the independence of all variables is under 5 (from 1.023 to 2.523) (Weigelt and Sarkar 2012, Cohen et al. 2018). The results suggest our model has low multicollinearity. In the “full model with endogeneity control,” we added IMR as a stage two regression. We found that IMR is not statistically significant. The endogeneity control model with IMR has a smaller adjusted r-square compared to the regression full model, we thus conclude our research model is unbiased and has no endogeneity issue in the first place. 34 https://www.chicagotribune.com/business/ct-biz-foxconn-wisconsin-changing-plans-20200228-hn6wzt4fyzenpdeznicyw642qu-story.html
27
Another interesting result is that the market reaction of reshoring from China back to the United States
is negatively significant (p < 0.05). Even as the pressure from the Trump administration on MNEs intensifies,
according to a survey from the United States–China Business Council in 2019, 87% of firms have no plan to
relocate the operations from China in view of their profitability.35 In addition, compared with other emerging
countries, China has abundant laborers with diversified skill sets, weak unions, and comprehensive logistics
outweigh the tariff uncertainty and the trade conflict. Tesla CEO Elon Musk recognized that “China is the
future” when he opened Tesla’s China production plant in 2019.36 However, the situation may change after the
COVID-19 pandemic. Political tensions between the United States and China along with the pandemic
lockdown in China have disrupted global supply chains, from medical supplies to vehicles, and have forced
firms to reconsider the role of China as the world’s production hub.
5. Implications and Conclusion
5.1. Implications for MNEs
Our findings for the sample of 272 reshoring announcements between 2006 and 2018 suggest that the
management risk associated with a reshoring strategy can affect the market reaction. The results indicate that
when firms maintain the same management structure during reshoring, the market reacts positively, whereas
risker reshoring brings adverse market reactions. This result indicates that investors believe that management
risks are costly, even if the firms receive tax and financial incentives from the federal and state governments. If
a firm reshores with a lower management risk strategy (e.g., in-house reshoring), it is more favorable to the
firm regardless of setting up a new factory or not. Therefore, the firms should reduce negative market reactions
by selecting a reshoring strategy that is associated with low management risk (e.g., in-house reshoring) and
with low geopolitical risk (e.g., reshoring to Republican-led states) to decrease reshoring process risk.
Despite the extra tariff for importing goods from China and the incentives from the U.S. government
that are intended to encourage more firms to reshore, each firm must evaluate all hidden costs. The additional
costs associated with an ineffective reshoring strategy could overshadow the potential benefits. Our findings
provide some explanations for the findings of some prior studies about the potential pitfalls of reshoring. For
example, Li Chen and Hu (2017) found that reshoring may not generate higher profits than offshoring. Stentoft
et al. (2018) found that the reshoring process cannot improve the quality and the lead time for the firms.
Therefore, gradually reshoring and coexisting offshore and reshoring productions are alternative options and
sourcing decisions for the managers in the future (Radi et al. 2019).
5.3. Implications for Policymakers
Ellram et al. (2013b) used exploratory factor analysis to identify potential reshoring risk factors. They also
included currency volatility and reshoring location party control (government trade policies and business-
35 https://www.uschina.org/sites/default/files/member_survey_2019_-_en_0.pdf36https://www.wraltechwire.com/2019/09/02/teslas-elon-musk-i-really-think-china-is-the-future/
28
friendly environment) in their model. Our results provide empirical evidence to support their suggestions. We
also add a new understanding of the management risk perspective. Our regression analysis suggests that the
federal and state governments play a prominent role in stimulating the reshoring strategies; the firms should
closely monitor the currency policies in their home country. Policymakers could set appropriate incentives to
guide reshoring firms to take a less risky route to achieve the intended goal: create jobs and sustain success. On
the other hand, foreign countries' policymakers can also increase the tax incentives and exit costs and reduce
currency volatility to encourage MNEs to remain overseas instead of reshoring.
5.4. Limitations and Future Opportunities
We identify a few limitations, which provide some insights for future research. First, we collected the
announcements from the Reshoring Initiative and relied on this database to identify the reshoring news.
Although this platform provides a comprehensive database for U.S. reshoring news, some reshoring
announcements might be missing. Moreover, because we cannot identify any reshoring for outsourcing
announcements based on the data provided by the Reshoring Initiative, we cannot conclude whether reshoring
for outsourcing elicits a negative or positive market reaction. Therefore, increasing the sample size in a future
study might help resolve this issue.
Our study mainly focused on publicly traded MNEs, and further research can expand this to small and
medium-sized manufacturers and private companies. This may enhance the generalizability of the findings.
Furthermore, some factors, including country risks from the foreigncountries and the capability of the senior
management team (e.g., CEO or board members with reshoring experience) to make reshoring decisions, have
not been explored in this study. We shall evaluate the economic factors of reshoring and their impacts on the
communities (e.g., employment rate and living standard). These factors can be critical in reshoring
implementation and can provide valuable information for policymakers and future research.
Finally, the COVID-19 pandemic lockdown might have caused more reshoring decisions, such as
reshoring factories from China or sourcing more from U.S. suppliers. Our data extend through 2018, so the
finding regarding the adverse market reaction to the reshoring back from China might not be fully applicable
to today’s situation. According to a 2020 survey from the Pew Research Center, 73% of U.S adults have
unfavorable views of China and seek a tougher stance toward China on trade—a sentiment that is reaching new
highs (Silver et al. 2020). A future study of the impact of COVID-19 on the global supply chain might help
address this point, but such a study could only be conducted after the pandemic.
This study explored how different reshoring risks can potentially elevate the positive (or negative)
market reaction to reshoring announcements. Overall, our findings provide insights for senior management to
consider when evaluating different reshoring options.
References:
29
Amadeo K. (2020) Trump's Tax Plan and How It Affects You. The Balance, https://www.thebalance.com/trump-s-tax-plan-how-it-affects-you-4113968. Babich V, Tang CS (2012) Managing opportunistic supplier product adulteration: Deferred payments, inspection, and combined mechanisms. Manufacturing & Service Operations Management 14(2):301-314. Backer KD, Menon C, Desnoyers-James I, Moussiegt L (2016) Reshoring: Myth or Reality? Baldassarre F, Campo R (2015) Assessing the Global Dimension of Sourcing: An Exploratory Study on Italian Companies. International Journal of Supply Chain Management 4(3):15-24. Ballotpedia. (2020). United States., Accessed Aug 19 2018, http://ballotpedia.org/. Berry H (2015) Knowledge inheritance in global industries: the impact of parent firm knowledge on the performance of foreign subsidiaries.(Report). 58(5):1438. Brandon-Jones E, Dutordoir M, Frota Neto JQ, Squire B (2017) The impact of reshoring decisions on shareholder wealth. Journal of Operations Management 49-51(1):31-36. Brindley C (2017) Supply Chain Risk (Taylor & Francis). Cambodia Minimum Wages Data. (2020). Ministry of Labor, Accessed Jul 10 2019, https://tradingeconomics.com/cambodia/minimum-wages. Carhart MM (1997) On Persistence in Mutual Fund Performance. The Journal of Finance (New York) 52(1):57-82. Caro F, Chintapalli P, Rajaram K, Tang CS (2018) Improving supplier compliance through joint and shared audits with collective penalty. Manufacturing & Service Operations Management 20(2):363-380. Chen L, Hu B (2017) Is Reshoring Better Than Offshoring? The Effect of Offshore Supply Dependence. Manufacturing & Service Operations Management 19(2):166-184. Chen L, Li S, Wang L (2014) Capacity Planning with Financial and Operational Hedging in Low- Cost Countries. Production and Operations Management 23(9):1495-1510. Ciabuschi F, Lindahl O, Barbieri P, Fratocchi L (2019) Manufacturing reshoring: A strategy to manage risk and commitment in the logic of the internationalization process model. European Business Review 31(1):139-159. Cohen MA, Cui S, Ernst R, Huchzermeier A, Kouvelis P, Lee HL, Matsuo H, Steuber M, Tsay AA (2018) Benchmarking Global Production Sourcing Decisions: Where and Why Firms Offshore and Reshore. Manufacturing & Service Operations Management 20(3):389. Corrado CJ (1989) A nonparametric test for abnormal security-price performance in event studies. Journal of Financial Economics 23(2):385-395. Crooks E. (2012) GE takes $1bn risk in bringing jobs home. Financial Times, Accessed Jul 10, 2019, https://www.ft.com/content/21a46546-78f1-11e1-88c5-00144feab49a. De Santis G, Gérard B (1998) How big is the premium for currency risk? Journal of Financial Economics 49(3):375-412. Due Date and Tax Rates. (2020). Department of Revenue, Accessed July 10, 2020, https://www.tn.gov/revenue/taxes/hall-income-tax/due-date-and-tax-rates.html. Dunning JH (2000) The eclectic paradigm as an envelope for economic and business theories of MNE activity. International Business Review 9(2):163-190. Ellram LM, Tate WL, Feitzinger EG (2013a) Factor- Market Rivalry and Competition for Supply Chain Resources. Journal of Supply Chain Management 49(1):29-46. Ellram LM, Tate WL, Petersen KJ (2013b) Offshoring and Reshoring: An Update on the Manufacturing Location Decision. Journal of Supply Chain Management 49(2):14-22. Faes W, Matthyssens P (2009) Insights into the process of changing sourcing strategies. Journal of Business & Industrial Marketing 24(3/4):245-255. Fama EF, French KR (1993) Common risk factors in the returns on stocks and bonds. Journal of Financial Economics 33(1):3-56. Fifarek BJ, Veloso FM, Davidson CI (2008) Offshoring technology innovation: A case study of rare-earth technology. Journal of Operations Management 26(2):222-238. Foerstl K, Kirchoff JF, Bals L (2016) Reshoring and insourcing: drivers and future research directions. International Journal of Physical Distribution & Logistics Management 46(5):492-515. Fratocchi L, Di Mauro C, Barbieri P, Nassimbeni G, Zanoni A (2014) When manufacturing moves back: Concepts and questions. Journal of Purchasing and Supply Management 20(1):54-59. Girod SJG, Whittington R (2017) Reconfiguration, restructuring and firm performance: Dynamic capabilities and environmental dynamism. Strategic Management Journal 38(5):1121-1133.
30
Gray JV, Skowronski K, Esenduran G, Johnny Rungtusanatham M (2013) The Reshoring Phenomenon: What Supply Chain Academics Ought to know and Should Do. Journal of Supply Chain Management 49(2):27-33. Heckman JJ (1979) Sample selection bias as a specification error. Econometrica: Journal of the Econometric Society:153-161. Hemphill TA (2005) US offshore outsourcing of R&D: Accommodating firm and national competitiveness perspectives. Innovation 7(4):351-356. Holweg M, Reichhart A, Hong E (2011) On risk and cost in global sourcing. International Journal of Production Economics 131(1):333-341. Hu X, Motwani JG (2014) Minimizing downside risks for global sourcing under price-sensitive stochastic demand, exchange rate uncertainties, and supplier capacity constraints. International Journal of Production Economics 147:398-409. Jacobs BW, Singhal VR, Subramanian R (2010) An empirical investigation of environmental performance and the market value of the firm. Journal of Operations Management 28(5):430-441. Johnson GG, Wu Z, Varnon A (2017) Investment decision risk analysis: preliminary evidence of the impact of accounting rules's convergence International Journal of Business, Accounting, and Finance 11(2):85. Karim S, Mitchell W (2004) Innovating through acquisition and internal development: a quarter-century of boundary evolution at Johnson & Johnson. Long Range Planning 37(6):525. Katada SN, Henning CR (2014) Currency and Exchange Rate Regimes in Asia. The Oxford Handbook of the International Relations of Asia:306. Keller LJ. (2018) Bank of America to Open 500 U.S. Branches, Expand Into Ohio. Bloomberg, Accessed Jul 10, 2019, https://www.bloomberg.com/news/articles/2018-02-26/bank-of-america-to-open-500-u-s-branches-push-into-ohio-retail. Ketokivi M, McIntosh CN (2017) Addressing the endogeneity dilemma in operations management research: Theoretical, empirical, and pragmatic considerations. Journal of Operations Management 52:1-14. King BG, Soule SA (2007) Social movements as extra-institutional entrepreneurs: The effect of protests on stock price returns. Administrative Science Quarterly 52(3):413-442. Klassen RD, McLaughlin CP (1996) The impact of environmental management on firm performance. Management Science 42(8):1199-1214. Lammers D. (2013) Company to add 1,000 tech jobs in South Dakota. Associated Press, Accessed Aug 19, 2019, https://news.yahoo.com/company-add-1-000-tech-212026399.html. Lewin AY, Massini S, Peeters C (2009) Why are companies offshoring innovation? The emerging global race for talent. Journal of International Business Studies 40(6):901-925. Liu M-c, Chen S-H (2012) MNCs’ offshore R&D networks in host country's regional innovation system: The case of Taiwan-based firms in China. Research Policy 41(6):1107-1120. Lo CKY, Tang CS, Zhou Y, Yeung ACL, Fan D (2018) Environmental Incidents and the Market Value of Firms: An Empirical Investigation in the Chinese Context. Manufacturing & Service Operations Management 20(3):422-439. Locke RM, Rissing BA, Pal T (2013) Complements or Substitutes? Private Codes, State Regulation and the Enforcement of Labour Standards in Global Supply Chains: Complements or Substitutes? British Journal of Iindustrial Relations 51(3):519-552. McWilliams A, Siegel D (1997) Event Studies in Management Research: Theoretical and Empirical Issues. The Academy of Management Journal 40(3):626-657. Mol MJ (2005) Does being R&D intensive still discourage outsourcing? Research Policy 34(4):571-582. Moses A, Åhlström P (2008) Problems in cross-functional sourcing decision processes. Journal of Purchasing and Supply Management 14(2):87-99. Motohashi K (2010) R&D Activities of Manufacturing Multinationals in China: Structure, Motivations and Regional Differences. China & World Economy 18(6):56-72. Nieto MJ, Rodríguez A (2011) Offshoring of R&D: Looking abroad to improve innovation performance. Journal of International Business Studies 42(3):345-361. Paul R. (2018) Bangladesh raises wages for garment workers. Reuters, Accessed Jul 13, 2019, https://www.reuters.com/article/us-bangladesh-garments/bangladesh-raises-wages-for-garment-workers-idUSKCN1LT2UR. Radi D, Lamantia F, Italo Bischi G (2019) Offshoring , Reshoring , Unemployment and Wage Dynamics in a Two-Country Evolutionary Model Macroeconomic Dynamics:1-28.
31
Ramasubbu N, Shang J, May JH, Tjader Y, Vargas L (2019) Task Interdependence and Firm Performance in Outsourced Service Operations. Manufacturing & Service Operations Management 21(3):658-673. Rapoza K. (2020) New Data Shows U.S. Companies Are Definitely Leaving China. Forbes, Accessed Aug 10 2020, https://www.forbes.com/sites/kenrapoza/2020/04/07/new-data-shows-us-companies-are-definitely-leaving-china/#23e81eeb40fe. Reshoring Initiative. (2017), Accessed March 5, 2017, https://www.reshorenow.org/. Rushe D. (2018) 'It's a huge subsidy': the $4.8bn gamble to lure Foxconn to America. The Guardian, Accessed July 2, 2018, https://www.theguardian.com/cities/2018/jul/02/its-a-huge-subsidy-the-48bn-gamble-to-lure-foxconn-to-america. Scholes M, Williams J (1977) Estimating betas from nonsynchronous data. Journal of Financial Economics 5(3):309-327. Silver L, Devlin K, & Huang C (2020) Americans Fault China for Its Role in the Spread of COVID-19 Pew Research Center https://www.pewresearch.org/global/2020/07/30/americans-fault-china-for-its-role-in-the-spread-of-covid-19/. Sirkin HL, Zinser M, Hohner D (2011) Made In America, again. Why manufacturing will return to the U.S. Skidmore S. (2008) Nike finds major labor violations at Malaysian factory. ABCNews, Accessed May 10, 2020, https://abcnews.go.com/Business/story?id=5503956&page=1. Sodhi MS, Tang CS (2012) Managing Supply Chain Risk (Springer Science & Business Media). Sorescu A, Warren NL, Ertekin L (2017) Event study methodology in the marketing literature: an overview. Journal of the Academy of Marketing Science 45(2):186-207. Souza K. (2017) Wal-Mart supplier Giti Tire to create 1,700 new jobs at U.S. tire factory. Talk Business & Politics, Accessed Jul 10 2020, 2020, https://talkbusiness.net/2017/10/wal-mart-supplier-giti-tire-to-create-1700-new-jobs-at-u-s-tire-factory/. Stanczyk A, Cataldo Z, Blome C, Busse C (2017) The dark side of global sourcing: a systematic literature review and research agenda. International Journal of Physical Distribution & Logistics Management 47(1):41-67. Stentoft J, Mikkelsen OS, Jensen JK, Rajkumar C (2018) Performance outcomes of offshoring, backshoring and staying at home manufacturing. International Journal of Production Economics 199:199-208. Tan BR, Chintakananda A (2016) The Effects of Home Country Political and Legal Institutions on Firms' Geographic Diversification Performance. Global Strategy Journal 6(2):105-123. Tang O, Nurmaya Musa S (2011) Identifying risk issues and research advancements in supply chain risk management. International Journal of Production Economics 133(1):25-34. Tate WL (2014) Offshoring and reshoring: U.S. insights and research challenges. Journal of Purchasing and Supply Management 20(1):66-68. Van den Bossche P, Gupta P, Gutierrez H, Gupta A (2014) Solving the reshoring dilemma. Supply chain management review 18(1):26-33. Viaene J-M, De Vries CG (1992) International trade and exchange rate volatility. European Economic Review 36(6):1311-1321. Vickers J. (2016) Keeping Up With Advanced Manufacturing. Business Facilities, Accessed Aug 10, 2019, https://businessfacilities.com/2016/10/keeping-up-with-advanced-manufacturing/. Walczak J. (2019) 2020 State Business Tax Climate Index. Tax Foundation, Accessed July 2, 2020, https://taxfoundation.org/publications/state-business-tax-climate-index/. Weber J, Fadel G (2006) Opportunities and Hindrances to collaborative automotive development. SAE Transactions:911-920. Weigelt C, Sarkar MB (2012) Performance implications of outsourcing for technological innovations: managing the efficiency and adaptability trade-off. Strategic Management Journal 33(2):189-216. Yan S. (2017) ‘Made in China’ isn’t so cheap anymore, and that could spell headache for Beijing CNBC, Accessed Aug 10, 2019, https://finance.yahoo.com/news/made-china-isnt-cheap-anymore-052443801.html.
32
Appendix:
Figure A.1. Number of Reshoring Announcements
Table A.1. Number of Reshoring Announcements Per Year
YearNumber of Reshoring
Announcements
2007 1
2008 0
2009 4
2010 14
2011 12
2012 32
2013 55
2014 27
2015 33
2016 17
2017 52
2018 25
1095 reshoring announcements (181 listed company) Source: Reshoring Initiative
Removed 732 announcements (duplication, missing information)
363 reshoring announcements
211 reshoring announcements (Inhouse reshoring)
Removed 88 announcements for confounding events +10/-10 days
Further remove 3 outliers for event study
272 reshoring announcements (85 listed companies)
26 reshoring announcements (Outsourced reshoring)
35 reshoring announcements (Reshoring for insourcing)
33
Table A.2. Political Party Control Status Within 2006–2018 Political party changed within 2006-2018 Political party unchanged within 2006- 2018
Alabama, Arkansas, Iowa, Indiana, Kentucky, Michigan, Minnesota, Mississippi, North Carolina, New Hampshire, Nevada, New York, Utah, Virginia, Wisconsin
Arizona, California, Connecticut, Delaware, Florida, Georgia, Idaho, Illinois, Kansas, Massachusetts, Maryland, Missouri, Montana, Nebraska, New Jersey, Ohio, Oregon, Pennsylvania, South Carolina, Tennessee, Texas, Washington
Total: 15 (41%) 22(59%)
Table A.3. Census Regions and Divisions of the United States Region I: Northeast (9 States)
Connecticut Maine Massachusetts Pennsylvania New Jersey
New Hampshire Rhode Island Vermont New York
Region 2: Midwest (12 States)
Indiana Illinois Michigan Missouri Minnesota
Ohio Wisconsin Iowa South Dakota North Dakota
Nebraska Kansas
Region 3: South (16 States)
Delaware Tennessee Florida Georgia Alabama
Maryland North Carolina South Carolina Virginia Oklahoma
West Virginia Arkansas Louisiana Kentucky Mississippi
Texas
Region 4: West (13 States)
Alaska Hawaii California Washington Montana
Oregon Utah Nevada Wyoming New Mexico
Arizona Colorado Idaho
** Puerto Rico and District of Columbia are not part of any census region or census division.
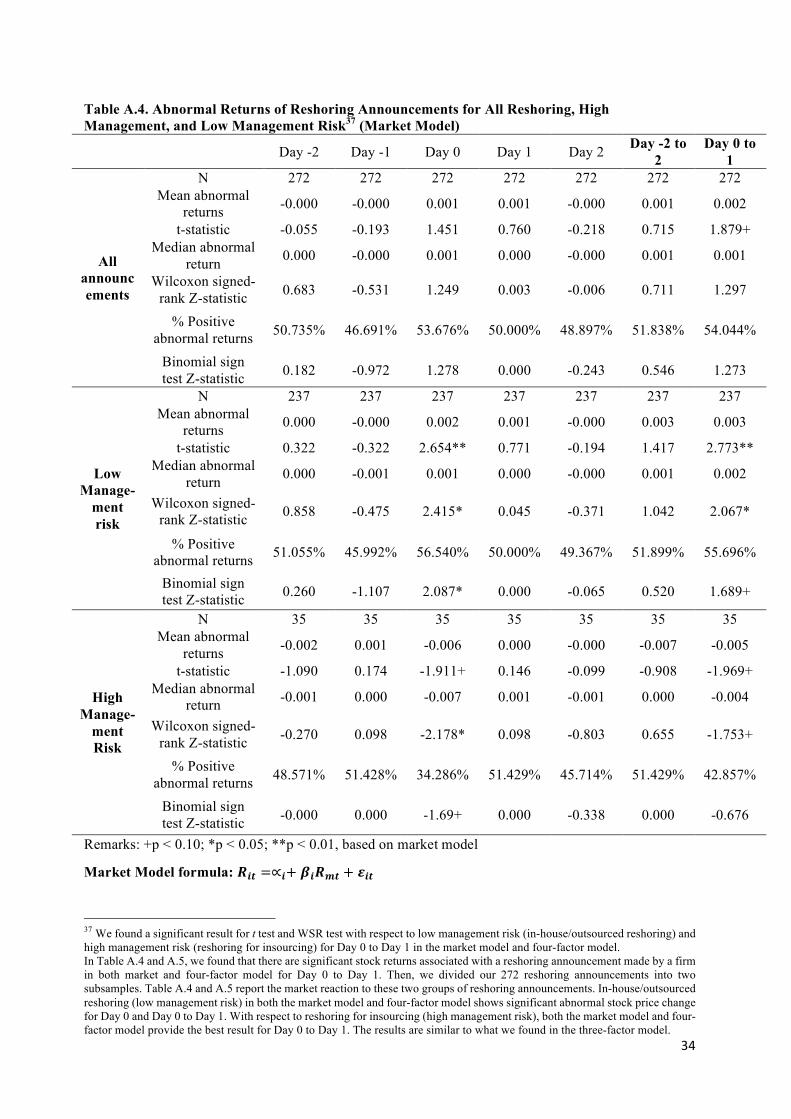
34
Table A.4. Abnormal Returns of Reshoring Announcements for All Reshoring, High Management, and Low Management Risk37 (Market Model)
Day -2 Day -1 Day 0 Day 1 Day 2 Day -2 to 2
Day 0 to 1
All announcements
N 272 272 272 272 272 272 272 Mean abnormal
returns -0.000 -0.000 0.001 0.001 -0.000 0.001 0.002
t-statistic -0.055 -0.193 1.451 0.760 -0.218 0.715 1.879+ Median abnormal
return 0.000 -0.000 0.001 0.000 -0.000 0.001 0.001
Wilcoxon signed-rank Z-statistic 0.683 -0.531 1.249 0.003 -0.006 0.711 1.297
% Positive abnormal returns 50.735% 46.691% 53.676% 50.000% 48.897% 51.838% 54.044%
Binomial sign test Z-statistic 0.182 -0.972 1.278 0.000 -0.243 0.546 1.273
Low Manage-
ment risk
N 237 237 237 237 237 237 237 Mean abnormal
returns 0.000 -0.000 0.002 0.001 -0.000 0.003 0.003
t-statistic 0.322 -0.322 2.654** 0.771 -0.194 1.417 2.773** Median abnormal
return 0.000 -0.001 0.001 0.000 -0.000 0.001 0.002
Wilcoxon signed-rank Z-statistic 0.858 -0.475 2.415* 0.045 -0.371 1.042 2.067*
% Positive abnormal returns 51.055% 45.992% 56.540% 50.000% 49.367% 51.899% 55.696%
Binomial sign test Z-statistic 0.260 -1.107 2.087* 0.000 -0.065 0.520 1.689+
High Manage-
ment Risk
N 35 35 35 35 35 35 35 Mean abnormal
returns -0.002 0.001 -0.006 0.000 -0.000 -0.007 -0.005
t-statistic -1.090 0.174 -1.911+ 0.146 -0.099 -0.908 -1.969+ Median abnormal
return -0.001 0.000 -0.007 0.001 -0.001 0.000 -0.004
Wilcoxon signed-rank Z-statistic -0.270 0.098 -2.178* 0.098 -0.803 0.655 -1.753+
% Positive abnormal returns 48.571% 51.428% 34.286% 51.429% 45.714% 51.429% 42.857%
Binomial sign test Z-statistic -0.000 0.000 -1.69+ 0.000 -0.338 0.000 -0.676
Remarks: +p < 0.10; *p < 0.05; **p < 0.01, based on market model
Market Model formula: !"# =∝"+ '"!(# + )"#
37 We found a significant result for t test and WSR test with respect to low management risk (in-house/outsourced reshoring) and high management risk (reshoring for insourcing) for Day 0 to Day 1 in the market model and four-factor model. In Table A.4 and A.5, we found that there are significant stock returns associated with a reshoring announcement made by a firm in both market and four-factor model for Day 0 to Day 1. Then, we divided our 272 reshoring announcements into two subsamples. Table A.4 and A.5 report the market reaction to these two groups of reshoring announcements. In-house/outsourced reshoring (low management risk) in both the market model and four-factor model shows significant abnormal stock price change for Day 0 and Day 0 to Day 1. With respect to reshoring for insourcing (high management risk), both the market model and four-factor model provide the best result for Day 0 to Day 1. The results are similar to what we found in the three-factor model.
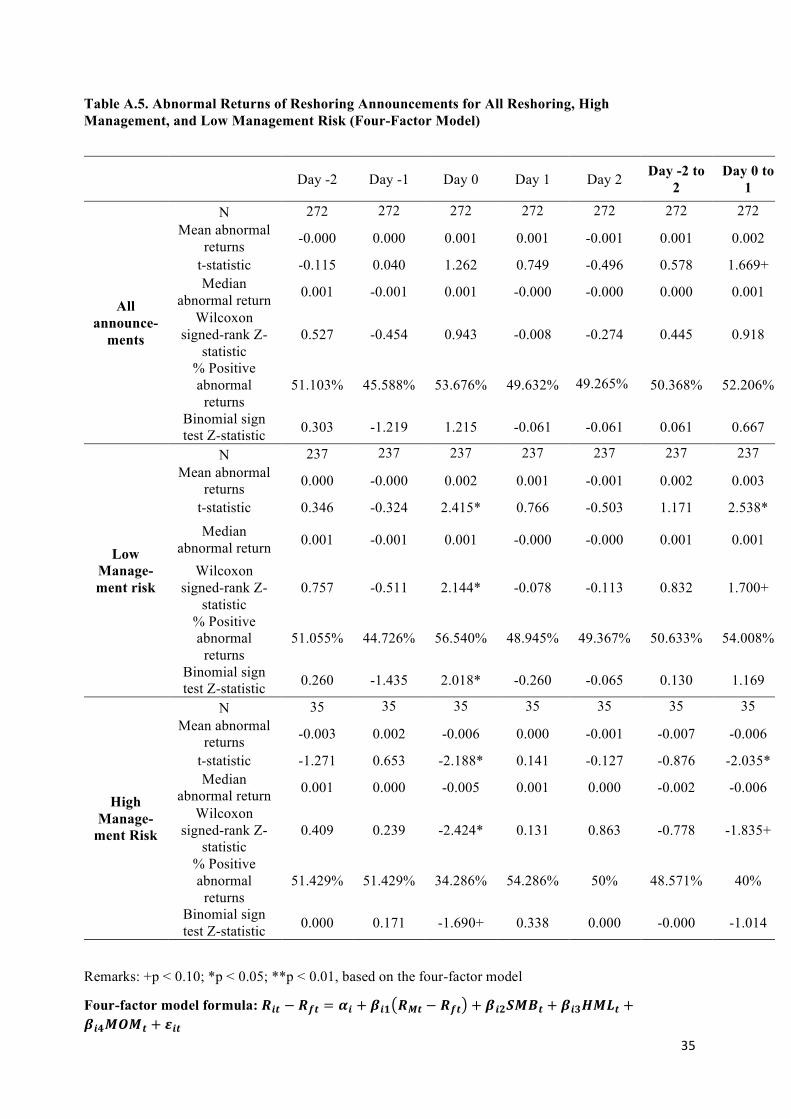
35
Table A.5. Abnormal Returns of Reshoring Announcements for All Reshoring, High Management, and Low Management Risk (Four-Factor Model)
Day -2 Day -1 Day 0 Day 1 Day 2 Day -2 to
2 Day 0 to
1
All announce-
ments
N 272 272 272 272 272 272 272 Mean abnormal
returns -0.000 0.000 0.001 0.001 -0.001 0.001 0.002
t-statistic -0.115 0.040 1.262 0.749 -0.496 0.578 1.669+ Median
abnormal return 0.001 -0.001 0.001 -0.000 -0.000 0.000 0.001
Wilcoxon signed-rank Z-
statistic 0.527 -0.454 0.943 -0.008 -0.274 0.445 0.918
% Positive abnormal
returns 51.103%
45.588%
53.676%
49.632% 49.265% 50.368% 52.206%
Binomial sign test Z-statistic 0.303 -1.219 1.215 -0.061 -0.061 0.061 0.667
Low Manage- ment risk
N 237 237 237 237 237 237 237 Mean abnormal
returns 0.000 -0.000 0.002 0.001 -0.001 0.002 0.003
t-statistic 0.346 -0.324 2.415* 0.766 -0.503 1.171 2.538*
Median abnormal return 0.001 -0.001 0.001 -0.000 -0.000 0.001 0.001
Wilcoxon signed-rank Z-
statistic 0.757 -0.511 2.144* -0.078 -0.113 0.832 1.700+
% Positive abnormal
returns 51.055% 44.726% 56.540% 48.945%
49.367%
50.633% 54.008%
Binomial sign test Z-statistic 0.260 -1.435 2.018* -0.260 -0.065 0.130 1.169
High Manage-
ment Risk
N 35 35 35 35 35 35 35 Mean abnormal
returns -0.003 0.002 -0.006 0.000 -0.001 -0.007 -0.006
t-statistic -1.271 0.653 -2.188* 0.141 -0.127 -0.876 -2.035* Median
abnormal return 0.001 0.000 -0.005 0.001 0.000 -0.002 -0.006
Wilcoxon signed-rank Z-
statistic 0.409 0.239 -2.424* 0.131 0.863 -0.778 -1.835+
% Positive abnormal
returns 51.429% 51.429% 34.286% 54.286% 50% 48.571% 40%
Binomial sign test Z-statistic 0.000 0.171 -1.690+ 0.338 0.000 -0.000 -1.014
Remarks: +p < 0.10; *p < 0.05; **p < 0.01, based on the four-factor model
Four-factor model formula: !"# − !+# = ," + '"-.!/# − !+#0 + '"12/3# + '"45/6# +'"7/8/# + )"#

36
Table A.6. Abnormal Returns of Different Reshoring Announcements (Time Period: Jan. 1, 2006 to June 30, 2015) Using Three-Factor Model
Day
Reshoring strategies
N
Mean abnormal returns
t-statistic
Median abnormal
return
Wilcoxon signed-rank Z-statistic
% Positive
abnormal returns
Binomial sign test
Z-statistic
Day 0 to 1 All announcements 157 0.001 1.223 0.002 0.831 52.866 0.638
Day 0 to 1 Low management risk 138 0.002 1.775+ 0.002 1.360 54.348 0.936
Day 0 to 1 High management risk 19 -0.004 -1.231 -0.006 -1.248 42.105 -0.648
Table A.7. Placebo Test Results Based on 238 Announcements of Non-Reshoring Firms Experience Group
Day -2
to 2 Day -2
to 1 Day -2
to 0 Day -2 to -1
Day -1 to +2
Day -1 to +1
Day -1 to 0
Day 0 to 1
Day 0 to 2
Day 1 to 2
N 237 237 237 237 237 237 237 237 237 237 Mean
abnormal returns
0.002 0.003 0.002 0.002 0.001 0.002 0.001 0.001 0.000 0.000
t-statistic 0.883 1.413 0.908 0.977 0.780 1.423 0.792 0.916 0.244 0.253 Median
abnormal return
-0.001 0.001 0.001 0.001 -0.000 -0.000 -0.001 0.000 0.000 -0.001
Wilcoxon signed-rank Z-statistic
-0.268 0.842 0.532 0.867 -0.074 -0.423 -0.061 0.467 0.377 -0.468
% Positive
abnormal returns
49.789%
51.899%
51.477%
54.852%
48.523%
48.945%
48.101%
50.633%
49.367%
46.414%
Binomial sign test
Z-statistic
-0.000 0.520 0.390 1.497 -0.325 -0.260 -0.456 0.261 0.000 -1.039
Remarks: +p < 0.10; *p < 0.05; **p < 0.01, based on the three-factor model

37
Table A.8. Probit Estimates for First-Stage Model with Standard Errors38
Coef. Standard Err.
Industry number per year 0.089 0.006
Republican President Period -0.195 0.078
Firm size 0.002 0.000
Leverage -0.000 0.000
Manufacturing industry 0.474 0.072
Number of Observations 65,119
Log-likelihood -915.342
LR chi2(5) = 566.87
Prob > chi2 = 0.0000
38 The output shows that there are 65,119 observations in our dataset. The likelihood ratio chi-square of 915.342 with a p value of 0.00001 suggests that this model is statistically significant than a model with no predictors.