Embed Size (px)
Citation preview
Spontaneous high-concentration dispersionsand liquid crystals of grapheneNatnael Behabtu1,3‡, Jay R. Lomeda2,3‡, Micah J. Green1,3†, Amanda L. Higginbotham2,3,
Alexander Sinitskii2,3, Dmitry V. Kosynkin2,3, Dmitri Tsentalovich1,3, A. Nicholas G. Parra-Vasquez1,3,
Judith Schmidt4, Ellina Kesselman4, Yachin Cohen4, Yeshayahu Talmon4, James M. Tour2,3,5* and
Matteo Pasquali1,2,3*
Graphene combines unique electronic properties and surprisingquantum effects with outstanding thermal and mechanicalproperties1–4. Many potential applications, including elec-tronics and nanocomposites, require that graphene be dis-persed and processed in a fluid phase5. Here, we show thatgraphite spontaneously exfoliates into single-layer graphenein chlorosulphonic acid, and dissolves at isotropic concen-trations as high as ∼2 mg ml21, which is an order of magnitudehigher than previously reported values. This occurs without theneed for covalent functionalization, surfactant stabilization, orsonication, which can compromise the properties of graphene6
or reduce flake size. We also report spontaneous formation ofliquid-crystalline phases at high concentrations (∼20–30 mg ml21). Transparent, conducting films are producedfrom these dispersions at 1,000VA
21 and ∼80% transparency.High-concentration solutions, both isotropic and liquid crystal-line, could be particularly useful for making flexible electronicsas well as multifunctional fibres.
Many promising macroscopic applications of graphene requirethe development of new routes for effective graphite exfoliationand processing1,7. Micromechanical cleavage8, the first reportedmethod to isolate graphene from graphite, has extremely low yieldand cannot be used in bulk applications. Large amounts of graphenesheets can be obtained by oxidizing graphite layers through variousprocesses to yield water-soluble graphene oxide9,10. Further chemi-cal reduction and derivatization yield functionalized graphene thatis soluble in common organic solvents5. Although functionalgroups aid dissolution, they also compromise many of graphene’sdesirable electrical and thermal properties6. Reduction of graphiteoxide only partially restores these properties11. Liquid phase dis-persion in organic solvents—for example, N-methyl pyrrolidone(NMP)—can be attained without chemical modification by soni-cation12 or by potassium intercalation without sonication13.Graphene has also been dispersed in water by sonication and stabil-ization using surfactants14. However, liquid-phase dispersions yieldlow concentrations (0.01 mg ml21, ref. 12; 0.15 mg ml21, ref. 13),and sonication limits the size of graphene flakes achievable.
Superacids have been successfully used to dissolve single-walledcarbon nanotubes (SWNTs) and show great promise for the bulkprocessing of SWNT-based materials15. Chlorosulphonic acid, themost promising SWNT solvent, was first produced in 1854 andtoday is a commodity chemical with a production of more than
300,000 tons per year. It is used chiefly as a sulphonating chemicalin detergent and dye production16. Although the intercalation ofgraphite by strong acids, including chlorosulphonic acid, has beenstudied for decades17, there are no reports indicating that graphiteis soluble in strong acids.
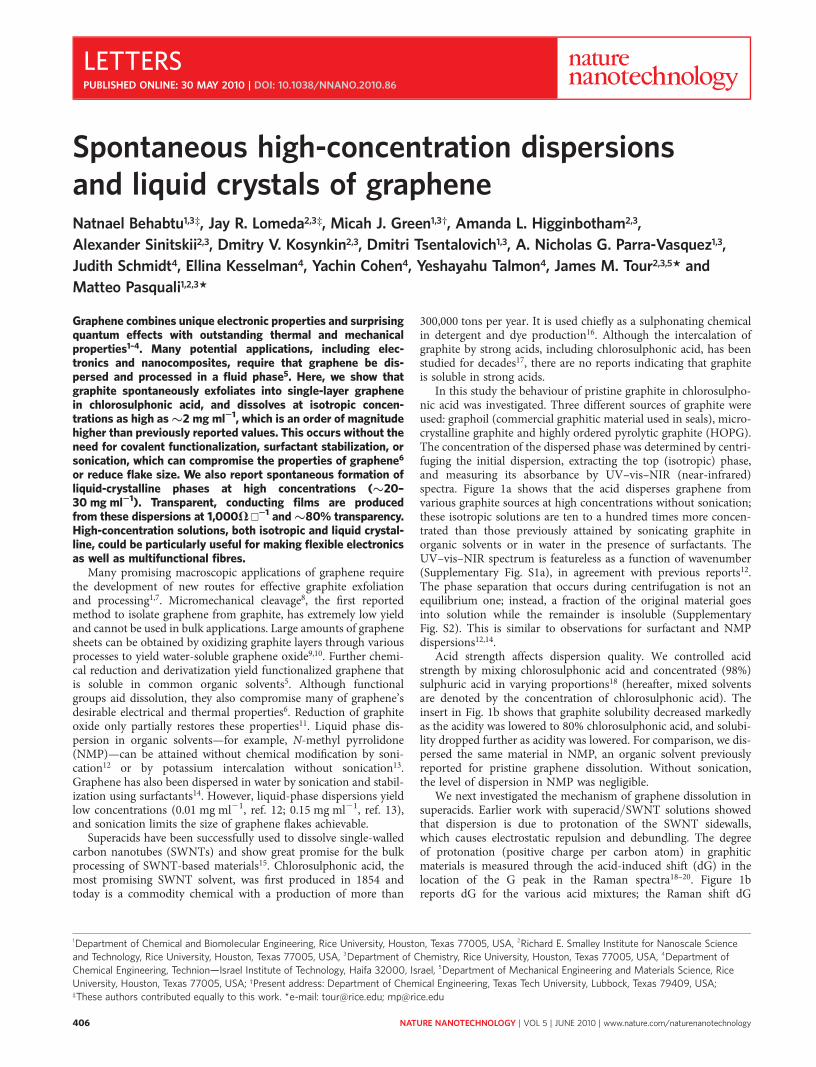
In this study the behaviour of pristine graphite in chlorosulpho-nic acid was investigated. Three different sources of graphite wereused: graphoil (commercial graphitic material used in seals), micro-crystalline graphite and highly ordered pyrolytic graphite (HOPG).The concentration of the dispersed phase was determined by centri-fuging the initial dispersion, extracting the top (isotropic) phase,and measuring its absorbance by UV–vis–NIR (near-infrared)spectra. Figure 1a shows that the acid disperses graphene fromvarious graphite sources at high concentrations without sonication;these isotropic solutions are ten to a hundred times more concen-trated than those previously attained by sonicating graphite inorganic solvents or in water in the presence of surfactants. TheUV–vis–NIR spectrum is featureless as a function of wavenumber(Supplementary Fig. S1a), in agreement with previous reports12.The phase separation that occurs during centrifugation is not anequilibrium one; instead, a fraction of the original material goesinto solution while the remainder is insoluble (SupplementaryFig. S2). This is similar to observations for surfactant and NMPdispersions12,14.
Acid strength affects dispersion quality. We controlled acidstrength by mixing chlorosulphonic acid and concentrated (98%)sulphuric acid in varying proportions18 (hereafter, mixed solventsare denoted by the concentration of chlorosulphonic acid). Theinsert in Fig. 1b shows that graphite solubility decreased markedlyas the acidity was lowered to 80% chlorosulphonic acid, and solubi-lity dropped further as acidity was lowered. For comparison, we dis-persed the same material in NMP, an organic solvent previouslyreported for pristine graphene dissolution. Without sonication,the level of dispersion in NMP was negligible.
We next investigated the mechanism of graphene dissolution insuperacids. Earlier work with superacid/SWNT solutions showedthat dispersion is due to protonation of the SWNT sidewalls,which causes electrostatic repulsion and debundling. The degreeof protonation (positive charge per carbon atom) in graphiticmaterials is measured through the acid-induced shift (dG) in thelocation of the G peak in the Raman spectra18–20. Figure 1breports dG for the various acid mixtures; the Raman shift dG
1Department of Chemical and Biomolecular Engineering, Rice University, Houston, Texas 77005, USA, 2Richard E. Smalley Institute for Nanoscale Scienceand Technology, Rice University, Houston, Texas 77005, USA, 3Department of Chemistry, Rice University, Houston, Texas 77005, USA, 4Department ofChemical Engineering, Technion—Israel Institute of Technology, Haifa 32000, Israel, 5Department of Mechanical Engineering and Materials Science, RiceUniversity, Houston, Texas 77005, USA; †Present address: Department of Chemical Engineering, Texas Tech University, Lubbock, Texas 79409, USA;‡These authors contributed equally to this work. *e-mail: [email protected]; [email protected]
LETTERSPUBLISHED ONLINE: 30 MAY 2010 | DOI: 10.1038/NNANO.2010.86
NATURE NANOTECHNOLOGY | VOL 5 | JUNE 2010 | www.nature.com/naturenanotechnology406
drops with decreasing acidity, mirroring the decrease in solubility.Figure 1c shows the Raman spectra of a sample of graphitepowder before and after acid dissolution, quenching in water anddrying. The spectrum is essentially unchanged (in particular, theD-band, characteristic of sp3 carbon content, remains low, see alsoSupplementary Fig. S14), so acid dissolution does not introducedefects in the starting material. This indicates no damage or functio-nalization by the acid, the same behaviour as seen in SWNTs15.X-ray photoelectron spectroscopy (XPS) further supports thisconclusion (Supplementary Figs S4,S13). Compared to SWNTs,graphene is less soluble in the same acid; SWNTs are soluble inweaker superacids, such as 102% sulphuric acid.
Graphoil
Top
Bottom
a
b
c
HOPG Microcrystallinegraphite
50 60 70 80 90 10025
26
Raman shift (cm−1)
Ram
an s
hift
(cm
−1)
Inte
nsity
(a.u
.)
Acid strength (vol% of chlorosulphonic acid)
27
28
29
30
31
32
33
500 1,000 1,500 2,000 2,500 3,0000
0.1
0.2
0.3
0.4
0.5
0.6
0.7
0.8
0.9
1DryQuenched
99%65%50%NMP 80%
Figure 1 | Solubility and solvent quality of graphite dispersions.
a, Comparison of chlorosulphonic acid dispersion of graphite (25 mg ml21
initial concentration) obtained from different sources as indicated below the
vials. A dark upper portion (top) is obtained for all the sources after 12 h of
centrifugation (5,000 r.p.m.), with a grey-coloured lower portion (bottom).
The yellow line on the vials indicate the interface between the top and
bottom phases in the three vials. The soluble portion was removed and
isolated for solubility determinations. b, Comparison of acid-induced shifts in
the liquid-phase Raman G-peak for graphite dispersed in the same mixtures
of chlorosulphonic acid in sulphuric acid. The G-peak shift, denoted as dG, is
a quantitative measure of the degree of protonation. The image in the insert
shows a qualitative comparison between graphite dissolution into different
solvents, showing graphite in the vials with a Teflon-coated stir bar to
promote dissolution. Starting from the left, graphite is dissolved in NMP, 50,
65 and 80 vol% chlorosulphonic acid (HSO3Cl) in sulphuric acid (H2SO4)
and pure chlorosulphonic acid. The dispersions were prepared at 10 mg ml21.
The acid dispersions were then centrifuged at 5,000 r.p.m. for 12 h and the
NMP dispersion was centrifuged for 3 h. The amount of centrifugation time
is different for the two cases because the settling time is linearly dependent
on the density differential between the particles and solvent. Thus, the
centrifugation time is scaled by this density difference. c, Solid-state Raman
spectra of the initial graphite dry powder and the graphite quenched from
the acid dispersion. The two spectra are virtually identical, indicating that
protonation is reversible. Both the liquid- and solid-phase Raman spectra
were taken with excitation wavelengths of 514 nm and long working
distances on a ×50 lens.
0
0.2
0.4
0.6
0.8
1
Inte
nsity
(a.u
.)
2,600 2,650 2,700 2,750 2,8000
0.2
0.4
0.6
0.8
1
Raman shift (cm−1)
2,600 2,650 2,700 2,750 2,800
Raman shift (cm−1)
2,600 2,650 2,700 2,750 2,800
Raman shift (cm−1)
Inte
nsity
(a.u
.)
Top phasea
b
c
Bottom phase
Initial powder
G3DA
G3DB
G2D
0
0.2
0.4
0.6
0.8
1
Inte
nsity
(a.u
.)
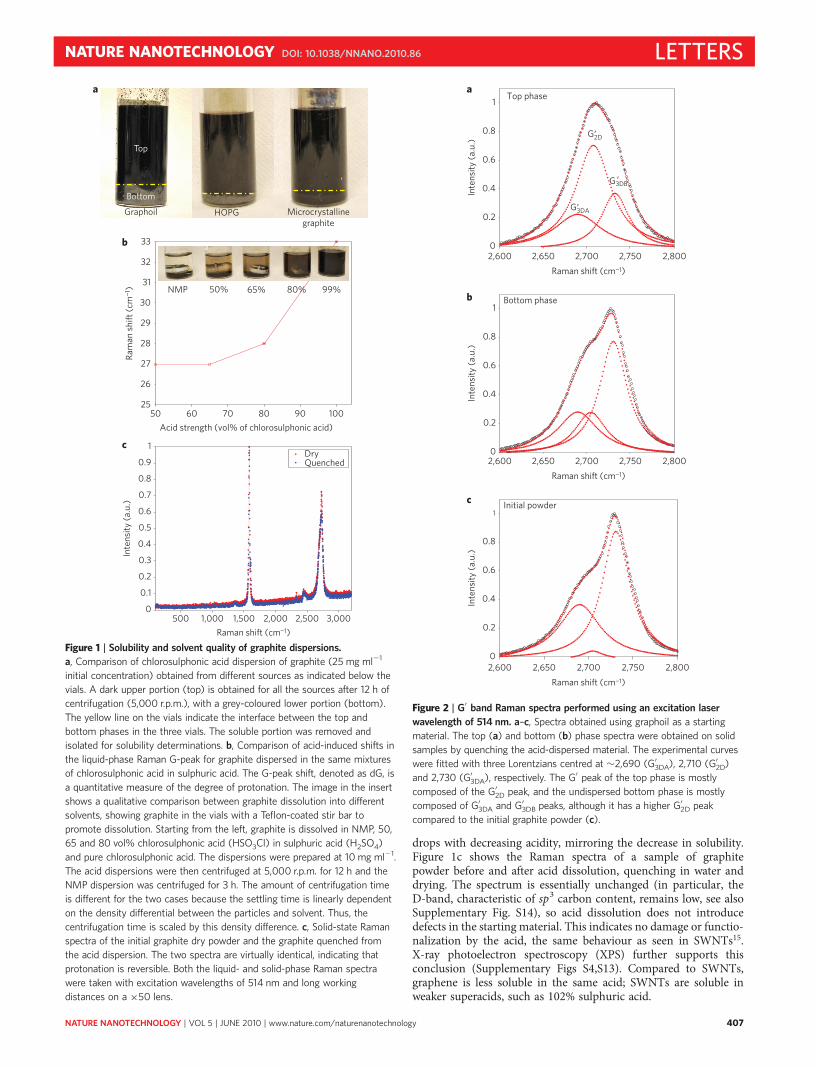
Figure 2 | G′ band Raman spectra performed using an excitation laser
wavelength of 514 nm. a–c, Spectra obtained using graphoil as a starting
material. The top (a) and bottom (b) phase spectra were obtained on solid
samples by quenching the acid-dispersed material. The experimental curves
were fitted with three Lorentzians centred at �2,690 (G′3DA), 2,710 (G′
2D)
and 2,730 (G′3DA), respectively. The G′ peak of the top phase is mostly
composed of the G′2D peak, and the undispersed bottom phase is mostly
composed of G′3DA and G′
3DB peaks, although it has a higher G′2D peak
compared to the initial graphite powder (c).
NATURE NANOTECHNOLOGY DOI: 10.1038/NNANO.2010.86 LETTERS
NATURE NANOTECHNOLOGY | VOL 5 | JUNE 2010 | www.nature.com/naturenanotechnology 407
We further characterized the top and bottom phases to betterunderstand the dispersion mechanism. Raman spectroscopy(Supplementary Fig. S3) shows a higher D-peak in the top than inthe bottom phase; this D-peak grows with longer centrifugationtime. However, XPS (Supplementary Fig. S4) does not reveal anyoxygen or sulphur in the quenched top phase. Therefore, we con-clude that the graphite flakes in the top phase are smaller, that is,they have a larger perimeter-to-surface ratio.
We measured the Raman G′ peak, a measure of graphite stacking21,of the quenched top and bottom portions of the centrifuged sample(Fig. 2). The data show that the quenched top phase loses thetypical Bernal stacking of the initial powder and attains the turbostraticstacking typical of disordered graphite, whereas the bottom phaseretains most of the Bernal signature of the initial powder.
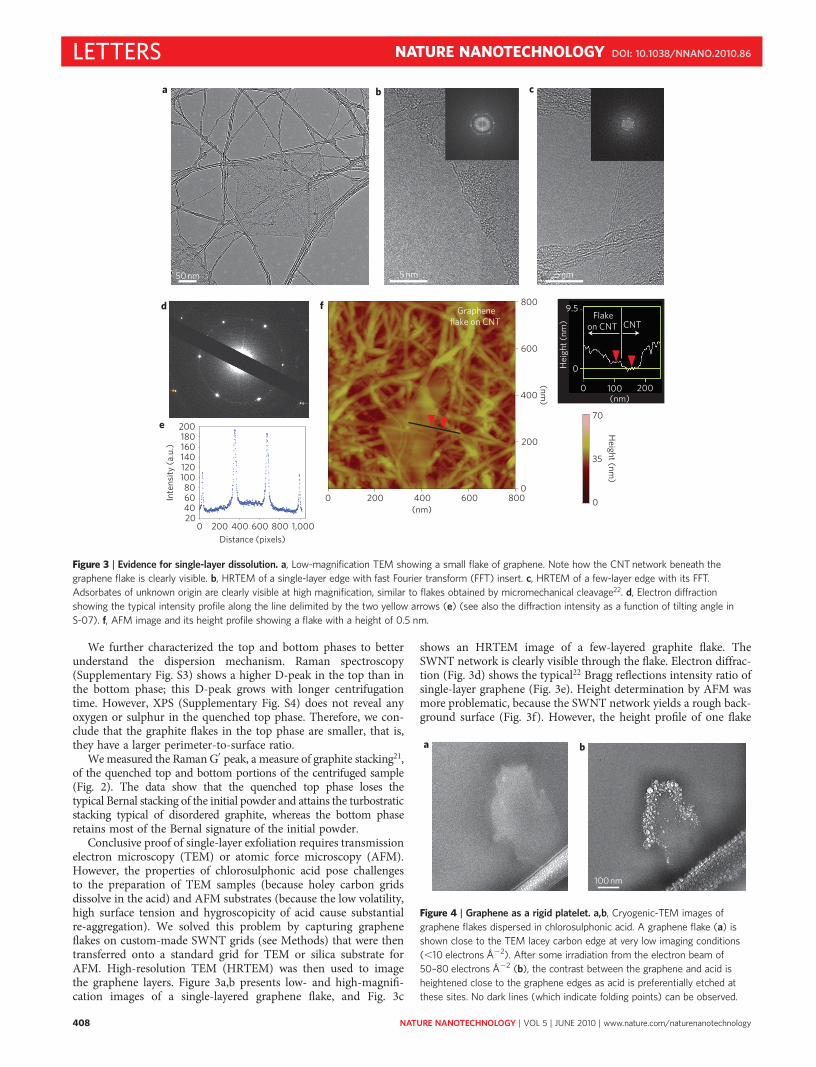
Conclusive proof of single-layer exfoliation requires transmissionelectron microscopy (TEM) or atomic force microscopy (AFM).However, the properties of chlorosulphonic acid pose challengesto the preparation of TEM samples (because holey carbon gridsdissolve in the acid) and AFM substrates (because the low volatility,high surface tension and hygroscopicity of acid cause substantialre-aggregation). We solved this problem by capturing grapheneflakes on custom-made SWNT grids (see Methods) that were thentransferred onto a standard grid for TEM or silica substrate forAFM. High-resolution TEM (HRTEM) was then used to imagethe graphene layers. Figure 3a,b presents low- and high-magnifi-cation images of a single-layered graphene flake, and Fig. 3c
shows an HRTEM image of a few-layered graphite flake. TheSWNT network is clearly visible through the flake. Electron diffrac-tion (Fig. 3d) shows the typical22 Bragg reflections intensity ratio ofsingle-layer graphene (Fig. 3e). Height determination by AFM wasmore problematic, because the SWNT network yields a rough back-ground surface (Fig. 3f). However, the height profile of one flake
0 200 400 600 800Distance (pixels)
1,000
0 200 400 600 800
Height (nm
)
(nm)
800
600
400
200
70
35
00
20406080
100120
Inte
nsity
(a.u
.)
140160180200
(nm)0
0
9.5Flake
on CNT
Grapheneflake on CNT CNT
100 200
Hei
ght (
nm)
50 nm 5 nm(nm
)5 nm
a
d f
e
b c
Figure 3 | Evidence for single-layer dissolution. a, Low-magnification TEM showing a small flake of graphene. Note how the CNT network beneath the
graphene flake is clearly visible. b, HRTEM of a single-layer edge with fast Fourier transform (FFT) insert. c, HRTEM of a few-layer edge with its FFT.
Adsorbates of unknown origin are clearly visible at high magnification, similar to flakes obtained by micromechanical cleavage22. d, Electron diffraction
showing the typical intensity profile along the line delimited by the two yellow arrows (e) (see also the diffraction intensity as a function of tilting angle in
S-07). f, AFM image and its height profile showing a flake with a height of 0.5 nm.
100 nm
a b
Figure 4 | Graphene as a rigid platelet. a,b, Cryogenic-TEM images of
graphene flakes dispersed in chlorosulphonic acid. A graphene flake (a) is
shown close to the TEM lacey carbon edge at very low imaging conditions
(,10 electrons Å22). After some irradiation from the electron beam of
50–80 electrons Å22 (b), the contrast between the graphene and acid is
heightened close to the graphene edges as acid is preferentially etched at
these sites. No dark lines (which indicate folding points) can be observed.
LETTERS NATURE NANOTECHNOLOGY DOI: 10.1038/NNANO.2010.86
NATURE NANOTECHNOLOGY | VOL 5 | JUNE 2010 | www.nature.com/naturenanotechnology408
shows a step height of 0.5 nm, consistent with single-layer graphene.HRTEM and electron diffraction were also used to analyse over 30flakes and quantify the degree of exfoliation. It was found that 70%of the dispersed graphene flakes were single layer. A combination ofscanning electron microscopy (SEM) and scanning transmissionelectron microscopy (STEM) was used to assess size distribution.We found that the average size depends on graphite source.Microcrystalline graphite and graphoil have an average flake sizeof 300 and 900 nm, respectively (Supplementary Fig. S9).
Graphene flakes should act roughly as rigid platelets (on the scaleof thermal forces) and therefore should be approximately flat ingood solvents (S-03). However, intramolecular self attraction orrepulsion could alter graphene conformation in solution. The pro-tonation induced by chlorosulphonic acid should induce self repul-sion and decrease the likelihood of folding. We imaged grapheneflakes under cryo-TEM (Fig. 4a,b) to determine their conformationin solution and found that the flakes are extended. SEM and STEMof graphene flakes captured on SWNT grids from acid solutionsfurther support this conclusion (Supplementary Fig. S6). Rigidanisotropic molecules undergo an isotropic/liquid-crystallinetransition as their concentration is raised23. Lekkerkerker, Frenkeland colleagues experimentally observed this transition with clayparticles and used Onsager-like theories to determine the phasediagram24,25. The transition concentration scales inversely with theaspect ratio (diameter/thickness). As in rigid rods26,27, polydisper-sity broadens the biphasic region, and both the maximum isotropicconcentration of the platelets and the ability to form liquid crystalsdepends on solvent quality28.
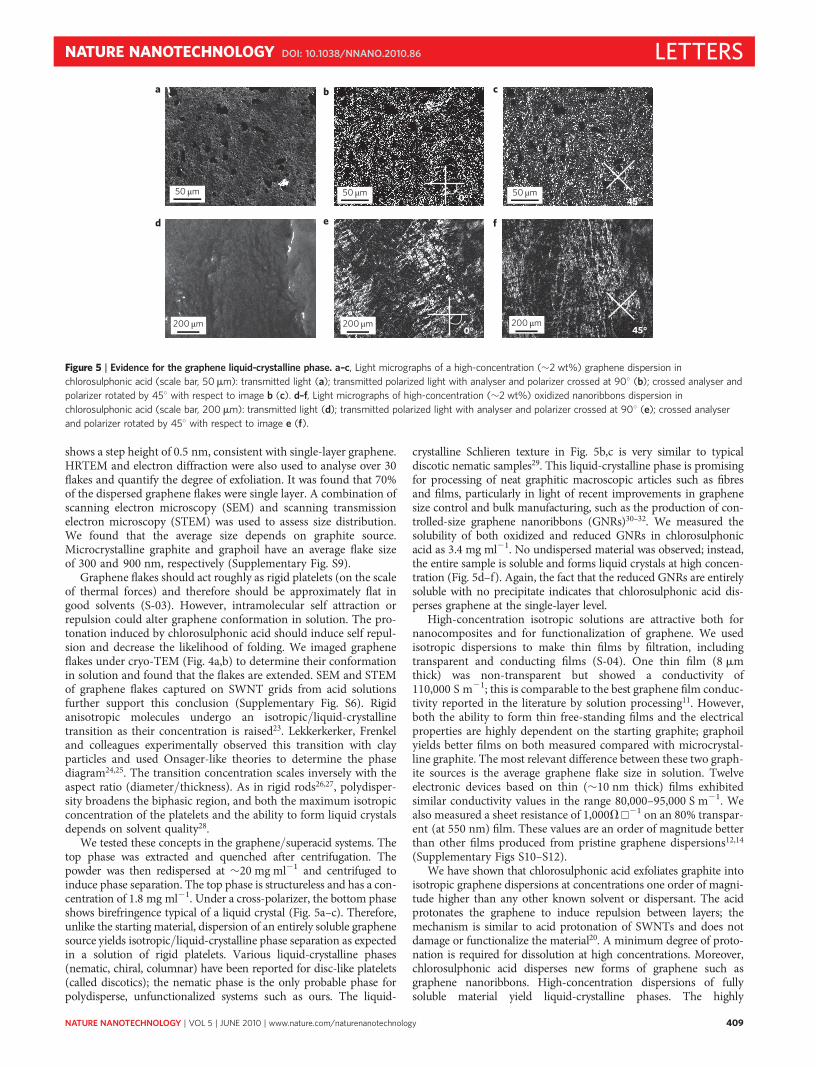
We tested these concepts in the graphene/superacid systems. Thetop phase was extracted and quenched after centrifugation. Thepowder was then redispersed at �20 mg ml21 and centrifuged toinduce phase separation. The top phase is structureless and has a con-centration of 1.8 mg ml21. Under a cross-polarizer, the bottom phaseshows birefringence typical of a liquid crystal (Fig. 5a–c). Therefore,unlike the starting material, dispersion of an entirely soluble graphenesource yields isotropic/liquid-crystalline phase separation as expectedin a solution of rigid platelets. Various liquid-crystalline phases(nematic, chiral, columnar) have been reported for disc-like platelets(called discotics); the nematic phase is the only probable phase forpolydisperse, unfunctionalized systems such as ours. The liquid-
crystalline Schlieren texture in Fig. 5b,c is very similar to typicaldiscotic nematic samples29. This liquid-crystalline phase is promisingfor processing of neat graphitic macroscopic articles such as fibresand films, particularly in light of recent improvements in graphenesize control and bulk manufacturing, such as the production of con-trolled-size graphene nanoribbons (GNRs)30–32. We measured thesolubility of both oxidized and reduced GNRs in chlorosulphonicacid as 3.4 mg ml21. No undispersed material was observed; instead,the entire sample is soluble and forms liquid crystals at high concen-tration (Fig. 5d–f). Again, the fact that the reduced GNRs are entirelysoluble with no precipitate indicates that chlorosulphonic acid dis-perses graphene at the single-layer level.
High-concentration isotropic solutions are attractive both fornanocomposites and for functionalization of graphene. We usedisotropic dispersions to make thin films by filtration, includingtransparent and conducting films (S-04). One thin film (8 mmthick) was non-transparent but showed a conductivity of110,000 S m21; this is comparable to the best graphene film conduc-tivity reported in the literature by solution processing11. However,both the ability to form thin free-standing films and the electricalproperties are highly dependent on the starting graphite; graphoilyields better films on both measured compared with microcrystal-line graphite. The most relevant difference between these two graph-ite sources is the average graphene flake size in solution. Twelveelectronic devices based on thin (�10 nm thick) films exhibitedsimilar conductivity values in the range 80,000–95,000 S m21. Wealso measured a sheet resistance of 1,000VA
21 on an 80% transpar-ent (at 550 nm) film. These values are an order of magnitude betterthan other films produced from pristine graphene dispersions12,14
(Supplementary Figs S10–S12).We have shown that chlorosulphonic acid exfoliates graphite into
isotropic graphene dispersions at concentrations one order of magni-tude higher than any other known solvent or dispersant. The acidprotonates the graphene to induce repulsion between layers; themechanism is similar to acid protonation of SWNTs and does notdamage or functionalize the material20. A minimum degree of proto-nation is required for dissolution at high concentrations. Moreover,chlorosulphonic acid disperses new forms of graphene such asgraphene nanoribbons. High-concentration dispersions of fullysoluble material yield liquid-crystalline phases. The highly
45°0°
0° 45°
a b c
d e f
50 m 50 m 50 m
200 m 200 m 200 m
Figure 5 | Evidence for the graphene liquid-crystalline phase. a–c, Light micrographs of a high-concentration (�2 wt%) graphene dispersion in
chlorosulphonic acid (scale bar, 50mm): transmitted light (a); transmitted polarized light with analyser and polarizer crossed at 908 (b); crossed analyser and
polarizer rotated by 458 with respect to image b (c). d–f, Light micrographs of high-concentration (�2 wt%) oxidized nanoribbons dispersion in
chlorosulphonic acid (scale bar, 200 mm): transmitted light (d); transmitted polarized light with analyser and polarizer crossed at 908 (e); crossed analyser
and polarizer rotated by 458 with respect to image e (f).
NATURE NANOTECHNOLOGY DOI: 10.1038/NNANO.2010.86 LETTERS
NATURE NANOTECHNOLOGY | VOL 5 | JUNE 2010 | www.nature.com/naturenanotechnology 409
concentrated isotropic and liquid-crystalline phases are promising forfunctionalization, and for scalable manufacturing of nanocomposites,films, coatings and high-performance fibres. In particular, we envi-sion graphene liquid crystals as a replacement for traditional discoticpitch-based liquid crystals used as precursors for carbon fibres, filmsand weaves.
Materials and MethodsWe analysed and characterized three different sources of graphite in this study: (i)graphoil (expanded graphite; EGS Enterprises), (ii) microcrystalline graphite (SigmaAldrich, batch no. 08017EH), and (iii) highly ordered pyrolytic graphite (HOPG)(SPI Supplies, lot no. 1091028). Chlorosulphonic acid (Sigma Aldrich, 99%, batchno. 16096EJ) and sulphuric acid (Fisher Chemical, certified ACS plus, lot no.083290) were used as solvents.
Raman spectroscopy was performed on a Renishaw Raman microscope using a514 nm He2Ne laser. Raman spectra of solid samples were taken by depositing thegraphite on a glass slide with the aid of double tape. To measure the solid-stateRaman spectra of the top and bottom phase of a centrifuged sample, the sample wasquenched by the addition of excess water. (Note that extreme care has to be takenduring this operation due to the highly exothermic reaction of chlorosulphonic acidwith water; dropwise addition of water into the acid is advised. The researcher alsoneeds the appropriate protective equipment.) Once the graphite precipitated, themixture was filtered to yield a solid sample. To measure the Raman shift in the fluid,samples were prepared in a glovebox (dew point 250 8C, to avoid contact withmoisture), deposited on glass slides, covered with cover slips and sealed with wax ortape to prevent moisture ingress during the measurement outside the glovebox. Thesame procedure was followed for the preparation of microscopy slides.
TEM and HRTEM imaging and electron diffraction were performed using aJEOL 2010 operated at 100 kV and a FEI Titan 80-300 S/TEM operated at 300 kVwith a point-to-point resolution below 1 Å.
The cryo-TEM techniques followed those of Davis and colleagues15. Thestandard cryo-TEM procedure33 was modified to account for unique difficultiesassociated with working with superacids. Soluble graphene was acquired bydispersing 250 mg graphoil in 10 ml chlorosulphonic acid, centrifuging at5,000 r.p.m. for 12 h, removing the top phase through a glass syringe, and quenchingthe top phase by slowly adding it to excess water. The quenching process producessolid graphene that could be entirely redispersed in chlorosulphonic acid with noinsoluble portion. Using this source, soluble graphene was dispersed inchlorosulphonic acid at concentrations of 0.042 mg ml21 (50 ppm by mass).Dispersions were prepared and mixed for 1 day in a glovebox (dew point 250 8C) ina nitrogen gas atmosphere to prevent contact with water and consequent evolutionof gaseous hydrochloric acid. Samples (2 ml) of either dispersion were transferredinto a vial and placed in the vitrification apparatus with a glass filter paper and glasspipette. The entire set-up was placed in a glove bag and purged with ultra-purenitrogen (99.9995%) for 30 min. A drop of the graphene dispersion was then placedon 200 copper mesh, lacey carbon grid (Ted Pella). The glass filter paper (notreactive with chlorosulphonic acid) was then used to blot the sample, leaving a thinfilm of liquid. The grid was then quickly vitrified by dipping into liquid nitrogen(77 K) and was placed in a cryo-specimen holder for transfer into the TEM.Cryo-TEM imaging was carried out on an FEI T12 transmission electronmicroscope operated at 120 kV, using an Oxford CT3500 cooling holder,operated at about 2180 8C.
XPS was performed on a PHI Quantera SXM scanning X-ray microprobe with apass energy of 26.00 eV, 458 takeoff angle and a beam size of 100 mm.
Polarized light microscopy was performed on a Zeiss Axioplan microscope intransmission mode. The samples were sensitive to humidity and had to be sufficientlythin for light to be transmitted. Slide preparation was critical for preventing watercontamination and for ensuring consistent sample thickness. Excessively thicksamples appeared homogeneously dark simply due to the near-complete blockage oflight. Glass slides and cover slips for microscopy were cleaned with diethyl ether anddried (100 8C, 225 mmHg, relative to atmospheric) overnight under vacuum andcovered with aluminium foil. Slides were prepared in the glovebox, and the cover slipswere sealed with aluminium tape. High-concentration samples were thinned byslowly hand-pressing on the cover slip to create a sufficiently thin region throughwhich light was partially transmitted.
AFM images were obtained with a Digital Instruments Nanoscope IIIa,operating in tapping mode, using silicon tips n-doped with 1–10 V cm phosphorus(Veeco, MPP-11100-140) at a scan rate of 0.5 Hz and a resolution of 512 × 512.
AFM samples were prepared by transferring free-floating thin films on asilicon substrate.
Received 7 January 2010; accepted 6 April 2010;published online 30 May 2010
References1. Segal, M. Selling graphene by the ton. Nature Nanotech. 4, 612–614 (2009).2. Novoselov, K. S. et al. Electric field effect transistor in atomically thin carbon
film. Science 306, 666–669 (2004).
3. Lee, C., Wei, X. D., Kysar, J. W. & Hone, J. Measurement of the elastic propertiesand intrinsic strength of monolayer graphene. Science 321, 385–388 (2008).
4. Balandin, A. A. et al. Superior thermal conductivity of single-layer graphene.Nano Lett. 8, 902–907 (2008).
5. Stankovich, S. et al. Graphene-based composite materials. Nature 442,282–286 (2006).
6. Schwamb, T., Burg, B. R., Schirmer, N. C. & Poulikakos, D. An electrical methodfor the measurement of the thermal and electrical conductivity of reducedgraphene oxide nanostructures. Nanotechnology 20, 405704 (2009).
7. Ruoff, R. Graphene: calling all chemists. Nature Nanotech. 3, 10–11 (2008).8. Novoselov, K. S. et al. Two-dimensional atomic crystals. Proc. Natl Acad. Sci.
USA 102, 10451–10453 (2005).9. Hummers, W. S. & Offeman, R. E. Preparation of graphitic oxide. J. Am.
Chem. Soc. 80, 1339 (1958).10. Stankovich, S. et al. Synthesis of graphene-based nanosheets via chemical
reduction of exfoliated graphite oxide. Carbon 45, 1558–1565 (2007).11. Becerril, H. A. et al. Evaluation of solution-processed reduced graphene oxide
films as transparent conductors. ACS Nano 2, 463–470 (2008).12. Hernandez, Y. et al. High-yield production of graphene by liquid-phase
exfoliation of graphite. Nature Nanotech. 3, 563–568 (2008).13. Valles, C. et al. Solutions of negatively charged graphene sheets and ribbons.
J. Am. Chem. Soc. 130, 15802–15804 (2008).14. Lotya, M. et al. Liquid phase production of graphene by exfoliation of graphite in
surfactant/water solutions. J. Am. Chem. Soc. 131, 3611–3620 (2009).15. Davis, V. A. et al. True solutions of single-walled carbon nanotubes for assembly
into macroscopic materials. Nature Nanotech. 4, 830–834 (2009).16. Cremlyn, R. J. Chlorosulfonic Acid: A Versatile Reagent (The Royal Society of
Chemistry, 2002).17. Melin, J., Furdin, G., Fuzellier, H., Vasse, R. & Herold, A. Action sur le graphite
des solutions de chlorures dans l’acide chlorosulfonique. Mater. Sci. Eng. 31,61–65 (1977).
18. Rai, P. K. et al. Isotropic-nematic phase transition of single-walled carbonnanotubes in strong acids. J. Am. Chem. Soc. 128, 591–595 (2006).
19. Ramesh, S. et al. Dissolution of pristine single walled carbon nanotubes insuperacids by direct protonation. J. Phys. Chem. B 108, 8794–8798 (2004).
20. Sumanasekera, G. U. et al. Electrochemical oxidation of single wallcarbon nanotube bundles in sulfuric acid. J. Phys. Chem. B 103,4292–4297 (1999).
21. Cancado, L. G. et al. Measuring the degree of stacking order in graphite byRaman spetroscopy. Carbon 46, 272–275 (2008).
22. Meyer, J. C. et al. On the roughness of single- and bi-layer graphene membranes.Solid State Commun. 143, 101–109 (2007).
23. Onsager, L. The effects of shape on the interaction of colloidal particles Ann. NYAcad. Sci. 51, 627–659 (1949).
24. Bates, M. A. & Frenkel, D. Nematic-isotropic transition in polydisperse systemsof infinitely thin hard platelets. J. Chem. Phys. 110, 6553–6559 (1999).
25. van der Kooij, F. M., Kassapidou, K. & Lekkerkerker, H. N. W. Liquid crystalphase transitions in suspensions of polydisperse plate-like particles. Nature 406,868–871 (2000).
26. Wensink, H. H. & Vroege, G. J. Isotropic-nematic phase behavior of length-polydisperse hard rods. J. Chem. Phys. 119, 6868–6882 (2003).
27. Green, M. J., Parra-Vasquez, A. N. G., Behabtu, N. & Pasquali, M. Modeling thephase behavior of polydisperse rigid rods with attractive interactions withapplications to single-walled carbon nanotubes in superacids. J. Chem. Phys.131, 084901 (2009).
28. van der Beek, D. & Lekkerkerker, H. N. W. Liquid crystal phases of chargedcolloidal platelets. Langmuir 20, 8582–8586 (2004).
29. Chandrasekhar, S. Liquid Crystals 2nd edn (Cambridge Univ. Press, 1992).30. Campos-Delgado, J. et al. Bulk production of a new form of sp(2) carbon:
crystalline graphene nanoribbons. Nano Lett. 8, 2773–2778 (2008).31. Jiao, L. Y., Zhang, L., Wang, X. R., Diankov, G. & Dai, H. J. Narrow graphene
nanoribbons from carbon nanotubes. Nature 458, 877–880 (2009).32. Kosynkin, D. V. et al. Longitudinal unzipping of carbon nanotubes to form
graphene nanoribbons. Nature 458, 872–875 (2009).33. Talmon, Y. Transmission electron microscopy of complex fluids: the state of the
art. Ber. Bunsen Phys. Chem. 100, 364–372 (1996).
AcknowledgementsThe authors acknowledge the helpful input of Y. Kauffmann, H. Schmidt, C. Young,M. Majumder, A. Mela, W. Adams and B. Chen. Funding was provided by Air Force Officeof Scientific Research (AFOSR) grants FA9550-06-1-0207 and FA9550-09-1-0590,Department of Energy (DOE) (DE-FC-36-05GO15073), Air Force Research Laboratories(AFRL) agreements FA8650-07-2-5061 and 07-S568-0042-01-C1, the Robert A. WelchFoundation (C-1668), US Army Corps of Engineers Environmental Quality andInstallation Program under grant W912HZ-08-C-0054, the USA–Israel Binational ScienceFoundation and the Evans–Attwell Welch Postdoctoral Fellowship. Mitsui & Co.generously donated the MWCNTs used for preparing the nanoribbons. Cryo-TEM wasperformed at the Electron Microscopy of Soft Matter Laboratory, supported by theTechnion Russell Berrie Nanotechnology Institute (RBNI). The HRTEM work was
LETTERS NATURE NANOTECHNOLOGY DOI: 10.1038/NNANO.2010.86
NATURE NANOTECHNOLOGY | VOL 5 | JUNE 2010 | www.nature.com/naturenanotechnology410
carried out at the Electron Microscopy Center at the Department of Materials Engineering,the Technion.
Author contributionsJ.L. and N.B. conceived, designed and performed the experiments including dispersionand film fabrication. J.L. and A.S. performed AFM. N.B. and D.T. performed andinterpreted the Raman measurements. N.B. characterized the liquid crystallinity. N.B. andA.N.G.P.V. designed the HRTEM experiments. A.S. fabricated the electronic devices. N.B.,J.L. and A.S. performed electrical measurements. N.B. and A.S. performed SEM. N.B.performed STEM and electron diffraction. N.B. and A.L.H. prepared HRTEM samples,
performed HRTEM experiments and interpreted the images. D.K. provided nanoribbonsand graphite oxides. Y.T., Y.C., J.S., M.J.G. and E.K. performed HRTEM and cryo-TEMexperiments and interpreted the images. N.B., M.J.G., A.L.H., A.S., J.L., Y.T., J.M.T. andM.P. co-wrote the paper. M.P., Y.T., Y.C. and J.M.T. supervised the project.
Additional informationThe authors declare no competing financial interests. Supplementary informationaccompanies this paper at www.nature.com/naturenanotechnology. Reprints andpermission information is available online at http://npg.nature.com/reprintsandpermissions/.Correspondence and requests for materials should be addressed to J.M.T. and M.P.
NATURE NANOTECHNOLOGY DOI: 10.1038/NNANO.2010.86 LETTERS
NATURE NANOTECHNOLOGY | VOL 5 | JUNE 2010 | www.nature.com/naturenanotechnology 411


![Factors Controlling the Intracellular Concentration of ... · Intracellular Calcium Concentration Control 165 LLLL _J t, min 100 45 30-15 10 t 2.5 10 15 [Ca]0,mmol/l Fig. 1. Spontaneous](https://img.pdfslide.net/doc/110x75/5cf80a2188c9933f408c9599/factors-controlling-the-intracellular-concentration-of-intracellular-calcium.jpg)