Embed Size (px)
Citation preview
SRI LANKA
ANNUAL SURVEY OF CONSTRUCTION
INDUSTRIES
2009
(Registered with ICTAD - Western Province)
Department of Census & Statistics
ANNUAL SURVEY OF CONSTRUCTION
INDUSTRIES
2009
(Registered with ICTAD - Western Province)
Department of Census & Statistics
ISBN 978-955-577-715-5
Published in 2010.
PREFACE The first Survey of Construction Industry was conducted in 1993 with the assistance of Institute for Construction Training and Development (ICTAD). Thereafter this Department continues to conduct the survey annually to cater to the needs of National Planners and other data users. This publication provides the Survey results for the year 2009 in which the reference period was 2008. The frame for this survey was the list of contractors registered with ICTAD under western province. Any suggestions to improve this survey are most welcome.
H.R.Gunasekera, Acting Director General of Census & Statistics.
Department of Census & Statistics, No. 15/12, Maitland Crescent, P.O. Box 563, Colombo. December 2010. i
AACCKKNNOOWWLLEEDDGGEEMMEENNTT The planning, collection and processing of data were done by the staff of the Industry and Construction Division under the guidance of Mrs. H. D. E. Somarathne, Director and under the direction of Mr. U.S. Wanapushpa, Senior Statistician. The Computer assisted data processing using the software package Visual Basic & Statistical Tables using the SPSS/PC+ were done by Mr. R.D.N. Premawansa, Statistician & Ms. W.S.D. Jayasundara, Statistical Officer under the supervision of Mr. U.S. Wanapushpa, Senior Statistician. Data collection at the follow up stage was done by the Statistical Officers / Statistical Assistants under the supervision of Senior Statisticians / Statisticians who attached to the Division of Industry, Construction, Trade & Services Division of the Department. The co-operation given by the respondents is also much appreciated. iii
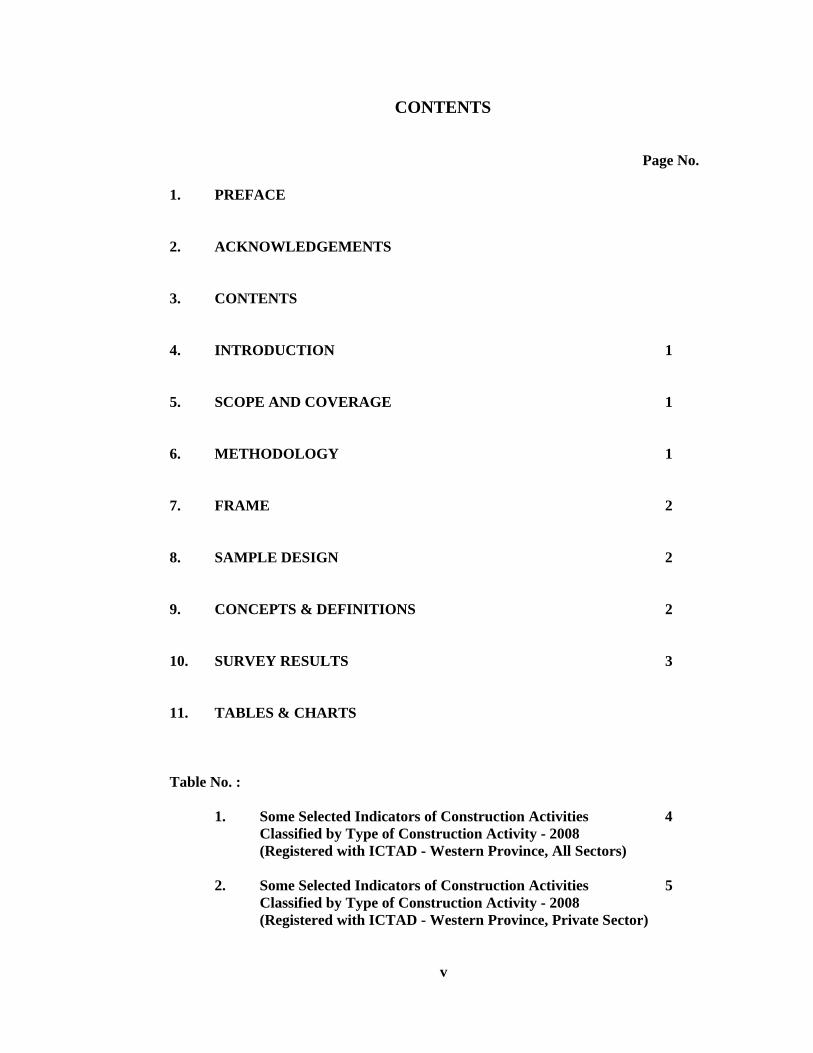
CONTENTS
Page No. 1. PREFACE 2. ACKNOWLEDGEMENTS 3. CONTENTS 4. INTRODUCTION 1 5. SCOPE AND COVERAGE 1 6. METHODOLOGY 1 7. FRAME 2 8. SAMPLE DESIGN 2 9. CONCEPTS & DEFINITIONS 2 10. SURVEY RESULTS 3 11. TABLES & CHARTS Table No. :
1. Some Selected Indicators of Construction Activities 4 Classified by Type of Construction Activity - 2008 (Registered with ICTAD - Western Province, All Sectors)
2. Some Selected Indicators of Construction Activities 5 Classified by Type of Construction Activity - 2008
(Registered with ICTAD - Western Province, Private Sector) v
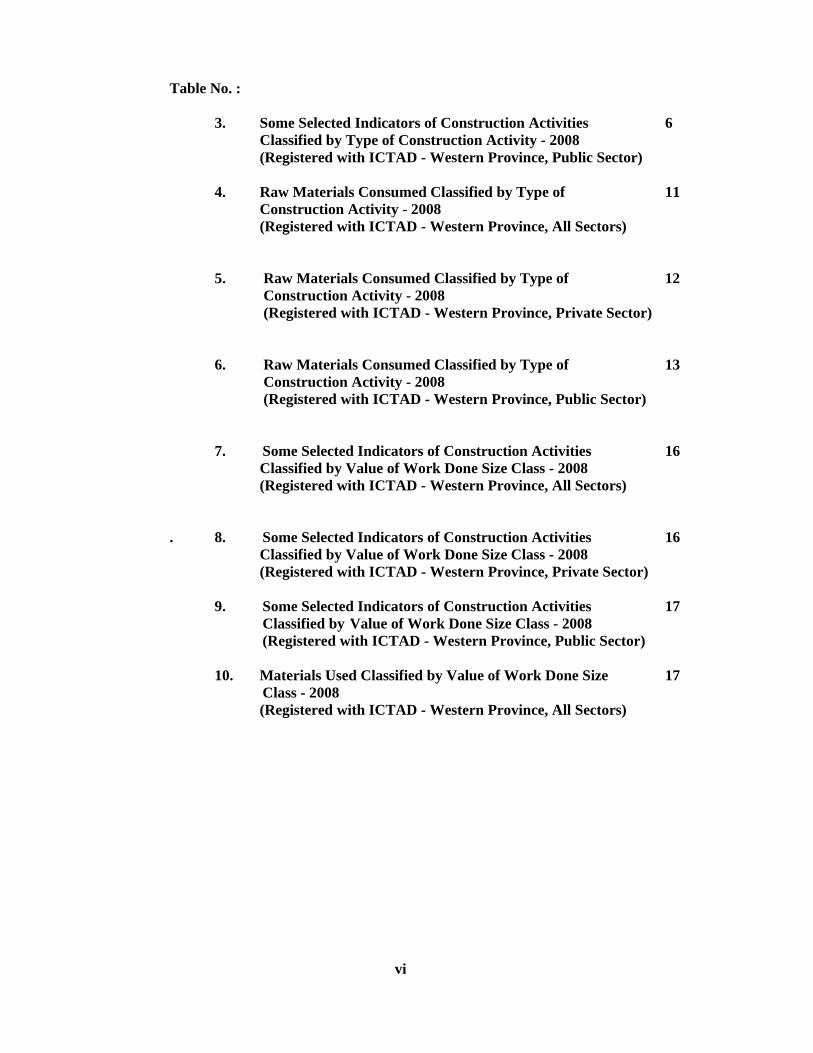
Table No. : 3. Some Selected Indicators of Construction Activities 6
Classified by Type of Construction Activity - 2008 (Registered with ICTAD - Western Province, Public Sector)
4. Raw Materials Consumed Classified by Type of 11
Construction Activity - 2008 (Registered with ICTAD - Western Province, All Sectors)
5. Raw Materials Consumed Classified by Type of 12 Construction Activity - 2008 (Registered with ICTAD - Western Province, Private Sector)
6. Raw Materials Consumed Classified by Type of 13 Construction Activity - 2008 (Registered with ICTAD - Western Province, Public Sector)
7. Some Selected Indicators of Construction Activities 16
Classified by Value of Work Done Size Class - 2008 (Registered with ICTAD - Western Province, All Sectors)
. 8. Some Selected Indicators of Construction Activities 16
Classified by Value of Work Done Size Class - 2008 (Registered with ICTAD - Western Province, Private Sector) 9. Some Selected Indicators of Construction Activities 17 Classified by Value of Work Done Size Class - 2008 (Registered with ICTAD - Western Province, Public Sector) 10. Materials Used Classified by Value of Work Done Size 17 Class - 2008
(Registered with ICTAD - Western Province, All Sectors)
vi
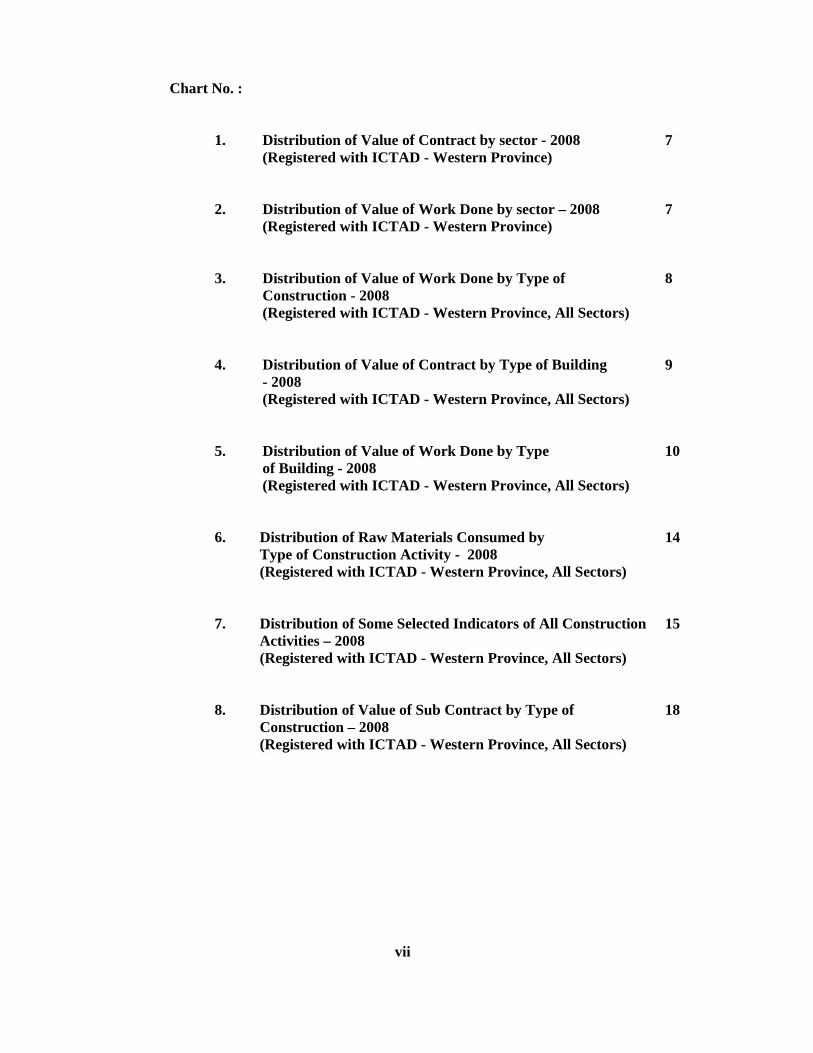
Chart No. : 1. Distribution of Value of Contract by sector - 2008 7 (Registered with ICTAD - Western Province) 2. Distribution of Value of Work Done by sector – 2008 7 (Registered with ICTAD - Western Province) 3. Distribution of Value of Work Done by Type of 8 Construction - 2008 (Registered with ICTAD - Western Province, All Sectors) 4. Distribution of Value of Contract by Type of Building 9 - 2008 (Registered with ICTAD - Western Province, All Sectors) 5. Distribution of Value of Work Done by Type 10 of Building - 2008 (Registered with ICTAD - Western Province, All Sectors)
6. Distribution of Raw Materials Consumed by 14 Type of Construction Activity - 2008 (Registered with ICTAD - Western Province, All Sectors) 7. Distribution of Some Selected Indicators of All Construction 15 Activities – 2008 (Registered with ICTAD - Western Province, All Sectors) 8. Distribution of Value of Sub Contract by Type of 18
Construction – 2008 (Registered with ICTAD - Western Province, All Sectors)
vii
SSuurrvveeyy ooff CCoonnssttrruuccttiioonn IInndduussttrriieess -- SSrrii LLaannkkaa 22000099 ( Registered with ICTAD under Western Province )
1. Introduction Survey of Construction Industry was conducted in 1993 for the first time in Sri Lanka mainly to furnish data regarding input, output and their trends to the Institute for Construction Training and Development (ICTAD). The Department of Census and Statistics continues to conduct the survey annually to cater to the requirements of the data users along with the rapid development of the construction industry in Sri Lanka. 2. Scope and Coverage In this survey, all construction activities undertaken by the private contractors registered with ICTAD under western province and government and semi-government agencies were covered. Therefore, construction activities undertaken by the international organizations and the informal sector were not represented in this survey. Information is collected relating to the following sectors of the construction industry.
i. Building construction ii. Highway construction iii. Bridge construction iv. Water supply & drainage v. Irrigation & land drainage vi. Dredging & Reclamation vii. Other constructions
All construction activities, except building construction, mentioned above are categorized under Civil Engineering activities. 3. Methodology The Survey of Construction Industries was aimed to cover 309 sample units under western province for the reference year 2008. The department introduced a very simple questionnaire, in order to collect information such as value of contract, value of workdone, value of raw materials used, salaries, value of subcontract and other services for the survey from the year 2000 considering the difficulties in collecting data in the field of construction activities. Field officers of the department were sent to establishments directly to collect the information from contractors. For the non responding contractors, field officers had to visit quite a number of times to get the questionnaire completed. The collection of accurate data from contractors is very tedious and time consuming.
1

4. Frame
List of contractors registered with the ICTAD under western province in the year 2008 have been used as the frame for this survey. 5. Sample Design
Stratified Systematic Sampling method was used for the survey and the list of contractors registered with the ICTAD under western province was divided into 2 strata according to the grading system which the ICTAD has devised based on the financial terms. Contractors of all type of construction activities categorized under grade 1 to grade 5 and Contractors of all type of construction activities except building, categorized under grade 6 to grade 10 were canvassed 100% and a probability sample was selected from other grades 6 to grade 10 in building construction as shown below. Sample Frame Strata Sample Sample Fraction size List of contractors registered grade 1-5 100% 193 with ICTAD grade 6-10 (except building) 100% 17 grade 6-10 (building) 19% 99
Total 309
6. Concepts & Definitions (a) Reference Period
Data relating to construction activities carried out during the calendar year 2008 or financial year 2008 April to 2009 March.
(b) Employment
This refers to the average number of persons engaged in construction activity during the reference period, including skilled labourers, unskilled labourers, technical, professional and other paid workers.
(c) Salaries & Wages
Amount paid as salaries, wages or subcontract on work done during the period.
(d) Output
Value of work done during the year 2008.
2
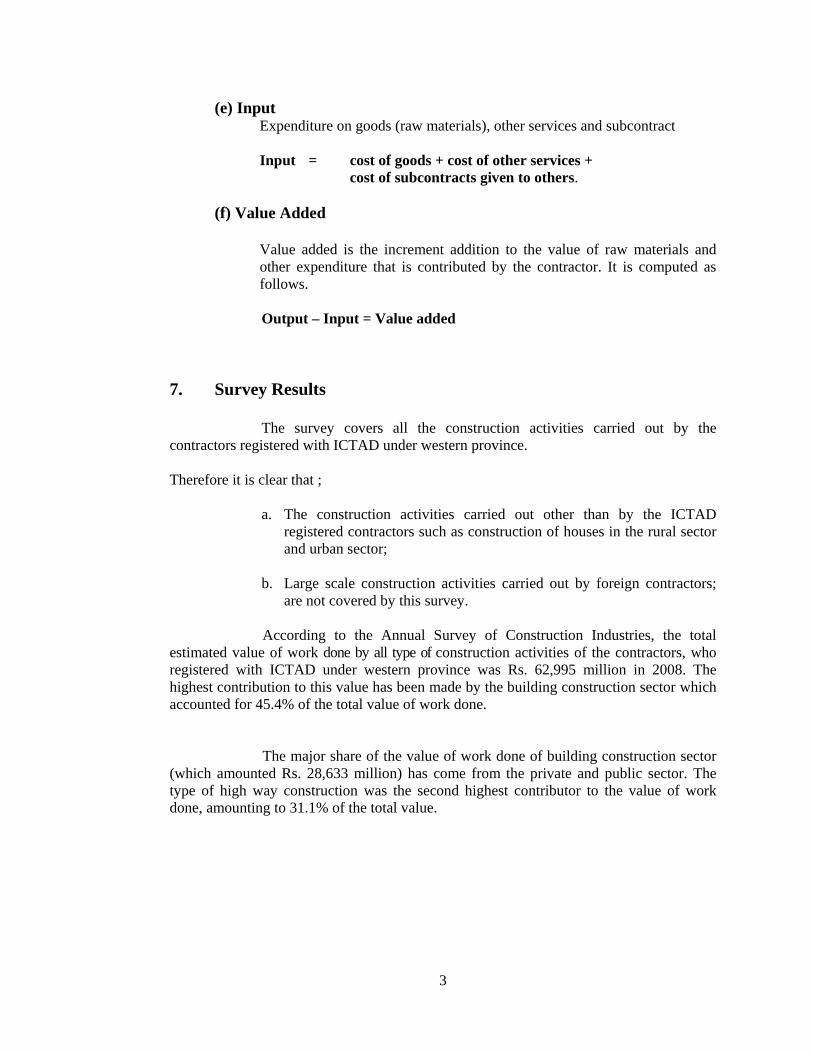
(e) Input
Expenditure on goods (raw materials), other services and subcontract Input = cost of goods + cost of other services + cost of subcontracts given to others.
(f) Value Added
Value added is the increment addition to the value of raw materials and other expenditure that is contributed by the contractor. It is computed as follows.
Output – Input = Value added 7. Survey Results The survey covers all the construction activities carried out by the contractors registered with ICTAD under western province. Therefore it is clear that ;
a. The construction activities carried out other than by the ICTAD registered contractors such as construction of houses in the rural sector and urban sector;
b. Large scale construction activities carried out by foreign contractors;
are not covered by this survey. According to the Annual Survey of Construction Industries, the total estimated value of work done by all type of construction activities of the contractors, who registered with ICTAD under western province was Rs. 62,995 million in 2008. The highest contribution to this value has been made by the building construction sector which accounted for 45.4% of the total value of work done. The major share of the value of work done of building construction sector (which amounted Rs. 28,633 million) has come from the private and public sector. The type of high way construction was the second highest contributor to the value of work done, amounting to 31.1% of the total value.
3
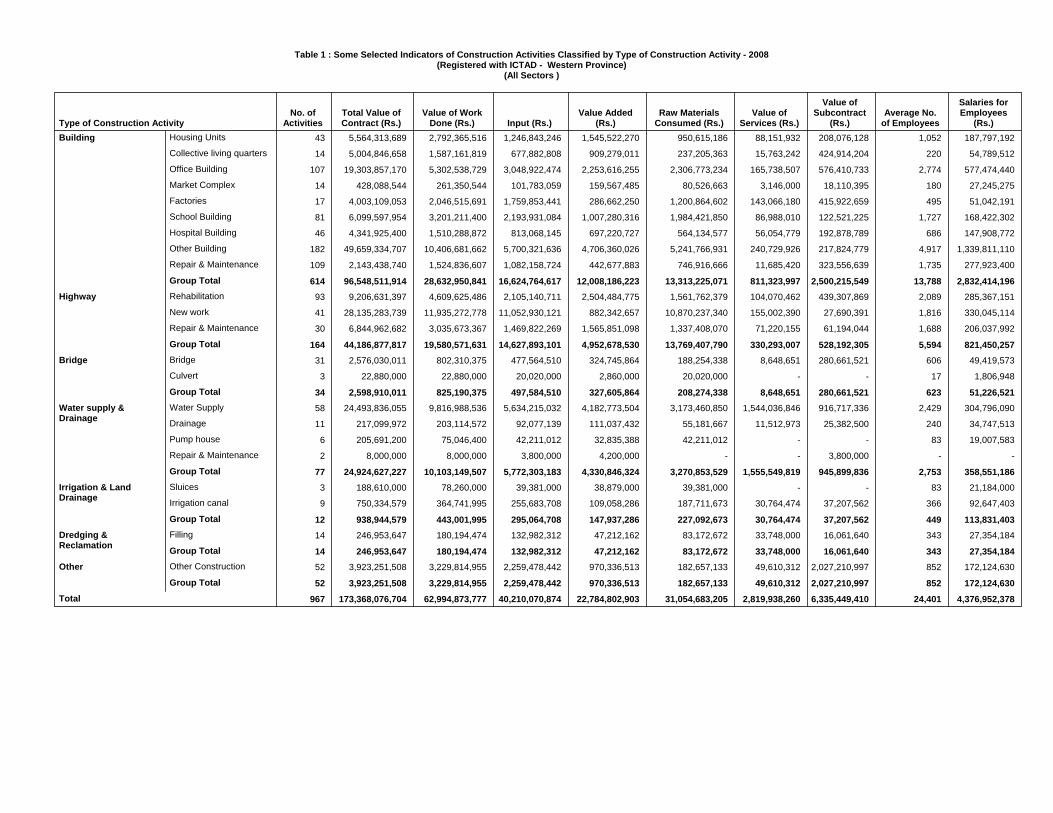
Table 1 : Some Selected Indicators of Construction Activities Classified by Type of Construction Activity - 2008(Registered with ICTAD - Western Province)
(All Sectors )
43 5,564,313,689 2,792,365,516 1,246,843,246 1,545,522,270 950,615,186 88,151,932 208,076,128 1,052 187,797,192
14 5,004,846,658 1,587,161,819 677,882,808 909,279,011 237,205,363 15,763,242 424,914,204 220 54,789,512
107 19,303,857,170 5,302,538,729 3,048,922,474 2,253,616,255 2,306,773,234 165,738,507 576,410,733 2,774 577,474,440
14 428,088,544 261,350,544 101,783,059 159,567,485 80,526,663 3,146,000 18,110,395 180 27,245,275
17 4,003,109,053 2,046,515,691 1,759,853,441 286,662,250 1,200,864,602 143,066,180 415,922,659 495 51,042,191
81 6,099,597,954 3,201,211,400 2,193,931,084 1,007,280,316 1,984,421,850 86,988,010 122,521,225 1,727 168,422,302
46 4,341,925,400 1,510,288,872 813,068,145 697,220,727 564,134,577 56,054,779 192,878,789 686 147,908,772
182 49,659,334,707 10,406,681,662 5,700,321,636 4,706,360,026 5,241,766,931 240,729,926 217,824,779 4,917 1,339,811,110
109 2,143,438,740 1,524,836,607 1,082,158,724 442,677,883 746,916,666 11,685,420 323,556,639 1,735 277,923,400
614 96,548,511,914 28,632,950,841 16,624,764,617 12,008,186,223 13,313,225,071 811,323,997 2,500,215,549 13,788 2,832,414,19693 9,206,631,397 4,609,625,486 2,105,140,711 2,504,484,775 1,561,762,379 104,070,462 439,307,869 2,089 285,367,151
41 28,135,283,739 11,935,272,778 11,052,930,121 882,342,657 10,870,237,340 155,002,390 27,690,391 1,816 330,045,114
30 6,844,962,682 3,035,673,367 1,469,822,269 1,565,851,098 1,337,408,070 71,220,155 61,194,044 1,688 206,037,992
164 44,186,877,817 19,580,571,631 14,627,893,101 4,952,678,530 13,769,407,790 330,293,007 528,192,305 5,594 821,450,25731 2,576,030,011 802,310,375 477,564,510 324,745,864 188,254,338 8,648,651 280,661,521 606 49,419,573
3 22,880,000 22,880,000 20,020,000 2,860,000 20,020,000 - - 17 1,806,948
34 2,598,910,011 825,190,375 497,584,510 327,605,864 208,274,338 8,648,651 280,661,521 623 51,226,52158 24,493,836,055 9,816,988,536 5,634,215,032 4,182,773,504 3,173,460,850 1,544,036,846 916,717,336 2,429 304,796,090
11 217,099,972 203,114,572 92,077,139 111,037,432 55,181,667 11,512,973 25,382,500 240 34,747,513
6 205,691,200 75,046,400 42,211,012 32,835,388 42,211,012 - - 83 19,007,583
2 8,000,000 8,000,000 3,800,000 4,200,000 - - 3,800,000 - -
77 24,924,627,227 10,103,149,507 5,772,303,183 4,330,846,324 3,270,853,529 1,555,549,819 945,899,836 2,753 358,551,1863 188,610,000 78,260,000 39,381,000 38,879,000 39,381,000 - - 83 21,184,000
9 750,334,579 364,741,995 255,683,708 109,058,286 187,711,673 30,764,474 37,207,562 366 92,647,403
12 938,944,579 443,001,995 295,064,708 147,937,286 227,092,673 30,764,474 37,207,562 449 113,831,40314 246,953,647 180,194,474 132,982,312 47,212,162 83,172,672 33,748,000 16,061,640 343 27,354,184
14 246,953,647 180,194,474 132,982,312 47,212,162 83,172,672 33,748,000 16,061,640 343 27,354,18452 3,923,251,508 3,229,814,955 2,259,478,442 970,336,513 182,657,133 49,610,312 2,027,210,997 852 172,124,630
52 3,923,251,508 3,229,814,955 2,259,478,442 970,336,513 182,657,133 49,610,312 2,027,210,997 852 172,124,630
967 173,368,076,704 62,994,873,777 40,210,070,874 22,784,802,903 31,054,683,205 2,819,938,260 6,335,449,410 24,401 4,376,952,378
Housing Units
Collective living quarters
Office Building
Market Complex
Factories
School Building
Hospital Building
Other Building
Repair & Maintenance
Group Total
Building
Rehabilitation
New work
Repair & Maintenance
Group Total
Highway
Bridge
Culvert
Group Total
Bridge
Water Supply
Drainage
Pump house
Repair & Maintenance
Group Total
Water supply &Drainage
Sluices
Irrigation canal
Group Total
Irrigation & LandDrainage
Filling
Group Total
Dredging &Reclamation
Other Construction
Group Total
Other
Total
Type of Construction ActivityNo. of
ActivitiesTotal Value ofContract (Rs.)
Value of WorkDone (Rs.) Input (Rs.)
Value Added(Rs.)
Raw MaterialsConsumed (Rs.)
Value ofServices (Rs.)
Value ofSubcontract
(Rs.)Average No.
of Employees
Salaries forEmployees
(Rs.)
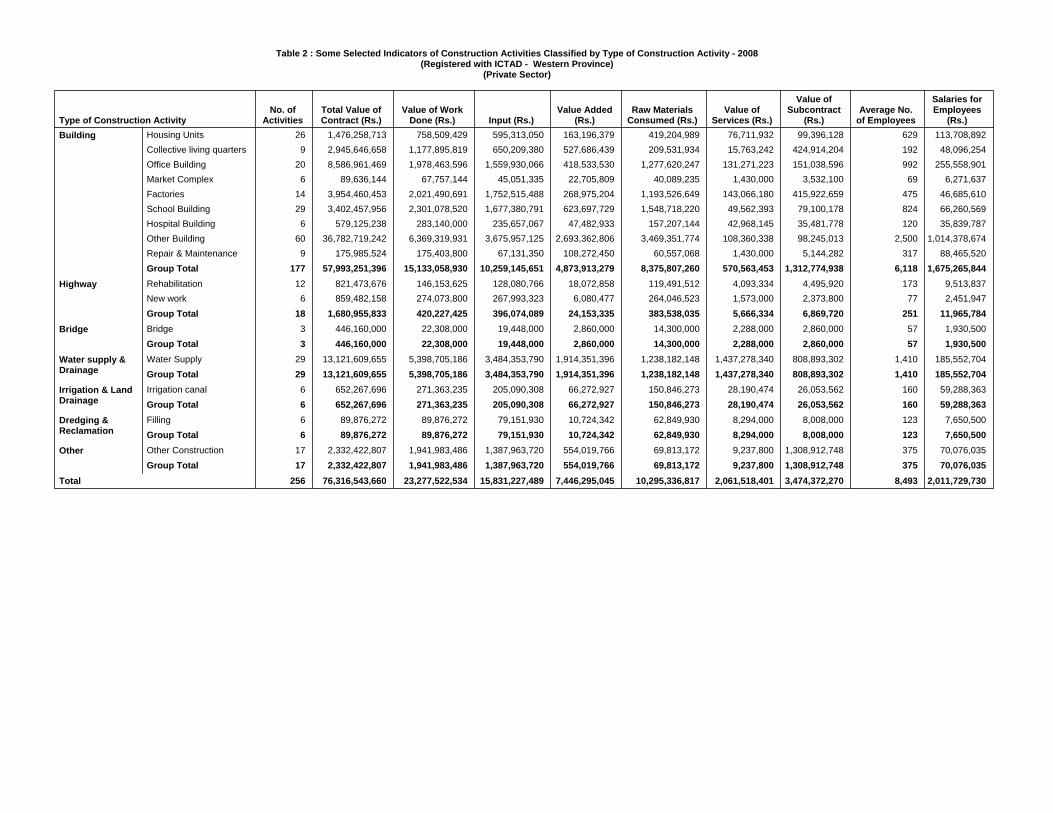
Table 2 : Some Selected Indicators of Construction Activities Classified by Type of Construction Activity - 2008(Registered with ICTAD - Western Province)
(Private Sector)
26 1,476,258,713 758,509,429 595,313,050 163,196,379 419,204,989 76,711,932 99,396,128 629 113,708,8929 2,945,646,658 1,177,895,819 650,209,380 527,686,439 209,531,934 15,763,242 424,914,204 192 48,096,254
20 8,586,961,469 1,978,463,596 1,559,930,066 418,533,530 1,277,620,247 131,271,223 151,038,596 992 255,558,9016 89,636,144 67,757,144 45,051,335 22,705,809 40,089,235 1,430,000 3,532,100 69 6,271,637
14 3,954,460,453 2,021,490,691 1,752,515,488 268,975,204 1,193,526,649 143,066,180 415,922,659 475 46,685,61029 3,402,457,956 2,301,078,520 1,677,380,791 623,697,729 1,548,718,220 49,562,393 79,100,178 824 66,260,569
6 579,125,238 283,140,000 235,657,067 47,482,933 157,207,144 42,968,145 35,481,778 120 35,839,78760 36,782,719,242 6,369,319,931 3,675,957,125 2,693,362,806 3,469,351,774 108,360,338 98,245,013 2,500 1,014,378,674
9 175,985,524 175,403,800 67,131,350 108,272,450 60,557,068 1,430,000 5,144,282 317 88,465,520177 57,993,251,396 15,133,058,930 10,259,145,651 4,873,913,279 8,375,807,260 570,563,453 1,312,774,938 6,118 1,675,265,844
12 821,473,676 146,153,625 128,080,766 18,072,858 119,491,512 4,093,334 4,495,920 173 9,513,8376 859,482,158 274,073,800 267,993,323 6,080,477 264,046,523 1,573,000 2,373,800 77 2,451,947
18 1,680,955,833 420,227,425 396,074,089 24,153,335 383,538,035 5,666,334 6,869,720 251 11,965,7843 446,160,000 22,308,000 19,448,000 2,860,000 14,300,000 2,288,000 2,860,000 57 1,930,5003 446,160,000 22,308,000 19,448,000 2,860,000 14,300,000 2,288,000 2,860,000 57 1,930,500
29 13,121,609,655 5,398,705,186 3,484,353,790 1,914,351,396 1,238,182,148 1,437,278,340 808,893,302 1,410 185,552,70429 13,121,609,655 5,398,705,186 3,484,353,790 1,914,351,396 1,238,182,148 1,437,278,340 808,893,302 1,410 185,552,704
6 652,267,696 271,363,235 205,090,308 66,272,927 150,846,273 28,190,474 26,053,562 160 59,288,3636 652,267,696 271,363,235 205,090,308 66,272,927 150,846,273 28,190,474 26,053,562 160 59,288,3636 89,876,272 89,876,272 79,151,930 10,724,342 62,849,930 8,294,000 8,008,000 123 7,650,5006 89,876,272 89,876,272 79,151,930 10,724,342 62,849,930 8,294,000 8,008,000 123 7,650,500
17 2,332,422,807 1,941,983,486 1,387,963,720 554,019,766 69,813,172 9,237,800 1,308,912,748 375 70,076,03517 2,332,422,807 1,941,983,486 1,387,963,720 554,019,766 69,813,172 9,237,800 1,308,912,748 375 70,076,035
256 76,316,543,660 23,277,522,534 15,831,227,489 7,446,295,045 10,295,336,817 2,061,518,401 3,474,372,270 8,493 2,011,729,730
Housing UnitsCollective living quartersOffice BuildingMarket ComplexFactoriesSchool BuildingHospital BuildingOther BuildingRepair & MaintenanceGroup Total
Building
RehabilitationNew workGroup Total
Highway
BridgeGroup Total
Bridge
Water SupplyGroup Total
Water supply &Drainage
Irrigation canalGroup Total
Irrigation & LandDrainage
FillingGroup Total
Dredging &Reclamation
Other ConstructionGroup Total
Other
Total
Type of Construction ActivityNo. of
ActivitiesTotal Value ofContract (Rs.)
Value of WorkDone (Rs.) Input (Rs.)
Value Added(Rs.)
Raw MaterialsConsumed (Rs.)
Value ofServices (Rs.)
Value ofSubcontract
(Rs.)Average No.
of Employees
Salaries forEmployees
(Rs.)
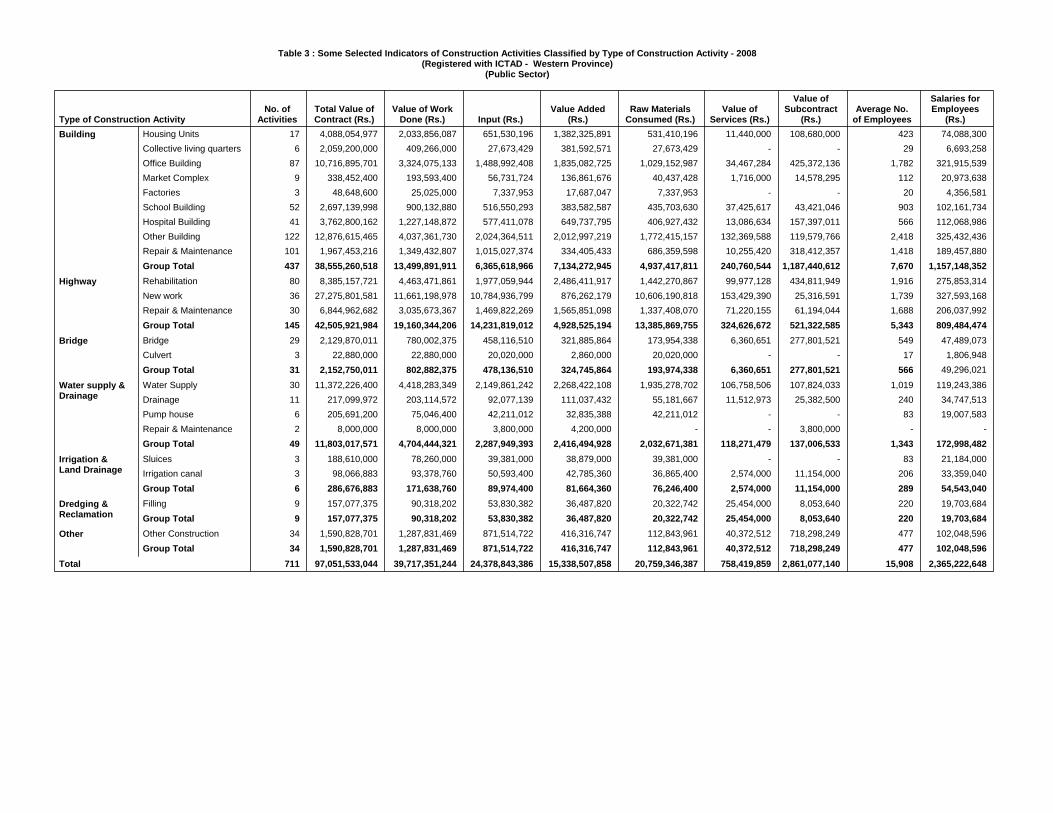
Table 3 : Some Selected Indicators of Construction Activities Classified by Type of Construction Activity - 2008(Registered with ICTAD - Western Province)
(Public Sector)
17 4,088,054,977 2,033,856,087 651,530,196 1,382,325,891 531,410,196 11,440,000 108,680,000 423 74,088,3006 2,059,200,000 409,266,000 27,673,429 381,592,571 27,673,429 - - 29 6,693,258
87 10,716,895,701 3,324,075,133 1,488,992,408 1,835,082,725 1,029,152,987 34,467,284 425,372,136 1,782 321,915,5399 338,452,400 193,593,400 56,731,724 136,861,676 40,437,428 1,716,000 14,578,295 112 20,973,6383 48,648,600 25,025,000 7,337,953 17,687,047 7,337,953 - - 20 4,356,581
52 2,697,139,998 900,132,880 516,550,293 383,582,587 435,703,630 37,425,617 43,421,046 903 102,161,73441 3,762,800,162 1,227,148,872 577,411,078 649,737,795 406,927,432 13,086,634 157,397,011 566 112,068,986
122 12,876,615,465 4,037,361,730 2,024,364,511 2,012,997,219 1,772,415,157 132,369,588 119,579,766 2,418 325,432,436101 1,967,453,216 1,349,432,807 1,015,027,374 334,405,433 686,359,598 10,255,420 318,412,357 1,418 189,457,880437 38,555,260,518 13,499,891,911 6,365,618,966 7,134,272,945 4,937,417,811 240,760,544 1,187,440,612 7,670 1,157,148,35280 8,385,157,721 4,463,471,861 1,977,059,944 2,486,411,917 1,442,270,867 99,977,128 434,811,949 1,916 275,853,31436 27,275,801,581 11,661,198,978 10,784,936,799 876,262,179 10,606,190,818 153,429,390 25,316,591 1,739 327,593,16830 6,844,962,682 3,035,673,367 1,469,822,269 1,565,851,098 1,337,408,070 71,220,155 61,194,044 1,688 206,037,992
145 42,505,921,984 19,160,344,206 14,231,819,012 4,928,525,194 13,385,869,755 324,626,672 521,322,585 5,343 809,484,47429 2,129,870,011 780,002,375 458,116,510 321,885,864 173,954,338 6,360,651 277,801,521 549 47,489,0733 22,880,000 22,880,000 20,020,000 2,860,000 20,020,000 - - 17 1,806,948
31 2,152,750,011 802,882,375 478,136,510 324,745,864 193,974,338 6,360,651 277,801,521 566 49,296,021
30 11,372,226,400 4,418,283,349 2,149,861,242 2,268,422,108 1,935,278,702 106,758,506 107,824,033 1,019 119,243,38611 217,099,972 203,114,572 92,077,139 111,037,432 55,181,667 11,512,973 25,382,500 240 34,747,5136 205,691,200 75,046,400 42,211,012 32,835,388 42,211,012 - - 83 19,007,5832 8,000,000 8,000,000 3,800,000 4,200,000 - - 3,800,000 - -
49 11,803,017,571 4,704,444,321 2,287,949,393 2,416,494,928 2,032,671,381 118,271,479 137,006,533 1,343 172,998,4823 188,610,000 78,260,000 39,381,000 38,879,000 39,381,000 - - 83 21,184,0003 98,066,883 93,378,760 50,593,400 42,785,360 36,865,400 2,574,000 11,154,000 206 33,359,0406 286,676,883 171,638,760 89,974,400 81,664,360 76,246,400 2,574,000 11,154,000 289 54,543,0409 157,077,375 90,318,202 53,830,382 36,487,820 20,322,742 25,454,000 8,053,640 220 19,703,6849 157,077,375 90,318,202 53,830,382 36,487,820 20,322,742 25,454,000 8,053,640 220 19,703,684
34 1,590,828,701 1,287,831,469 871,514,722 416,316,747 112,843,961 40,372,512 718,298,249 477 102,048,59634 1,590,828,701 1,287,831,469 871,514,722 416,316,747 112,843,961 40,372,512 718,298,249 477 102,048,596
711 97,051,533,044 39,717,351,244 24,378,843,386 15,338,507,858 20,759,346,387 758,419,859 2,861,077,140 15,908 2,365,222,648
Housing UnitsCollective living quartersOffice BuildingMarket ComplexFactoriesSchool BuildingHospital BuildingOther BuildingRepair & MaintenanceGroup Total
Building
RehabilitationNew workRepair & MaintenanceGroup Total
Highway
BridgeCulvertGroup Total
Bridge
Water SupplyDrainagePump houseRepair & MaintenanceGroup Total
Water supply &Drainage
SluicesIrrigation canalGroup Total
Irrigation &Land Drainage
FillingGroup Total
Dredging &Reclamation
Other ConstructionGroup Total
Other
Total
Type of Construction ActivityNo. of
ActivitiesTotal Value ofContract (Rs.)
Value of WorkDone (Rs.) Input (Rs.)
Value Added(Rs.)
Raw MaterialsConsumed (Rs.)
Value ofServices (Rs.)
Value ofSubcontract
(Rs.)Average No.
of Employees
Salaries forEmployees
(Rs.)

Chart 1 : Distribution of Value of Contract by Sector -2008 (Registered with ICTAD - Western Province)
Private44%
Public56%
Chart 2 : Distribution of Value of Work Done by Sector -2008 (Registered with ICTAD - Western Province)
Private37%
Public63%
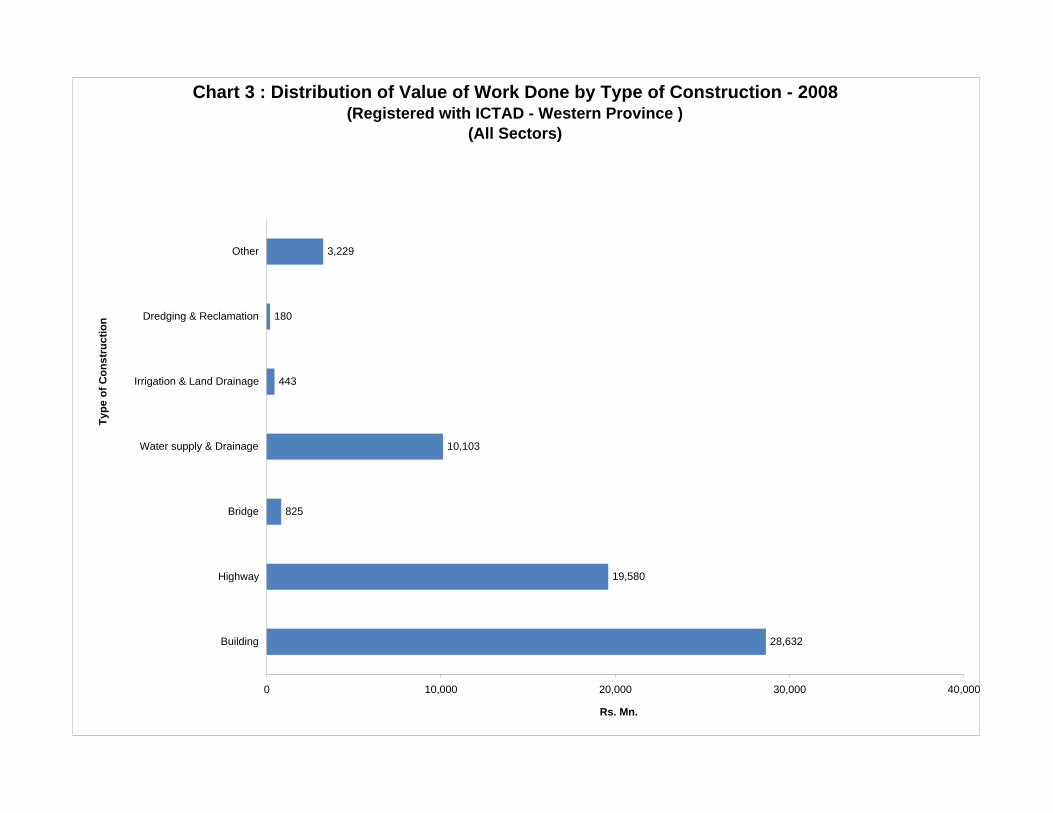
Chart 3 : Distribution of Value of Work Done by Type of Construction - 2008 (Registered with ICTAD - Western Province )
(All Sectors)
3,229
180
443
10,103
825
19,580
28,632
0 10,000 20,000 30,000 40,000
Building
Highway
Bridge
Water supply & Drainage
Irrigation & Land Drainage
Dredging & Reclamation
Other
Rs. Mn.
Type
of C
onst
ruct
ion

Chart 4 : Distribution of Value of Contract by Type of Building - 2008 (Registered with ICTAD - Western Province )
(All Sectors)
Repair & Maintenance2%
*Other Building51%
Hospital Building5%
School Building6%
Factories4%
Market Complex1%
Office Building20%
Collective living quarters5%
Housing Units6%
*Not separately classified

Chart 5: Distribution of Value of Workdone by Type of Building -2008 (Registered with ICTAD - Western Province)
(All Sectors)
Housing Units10%
Collective living quarters6%
Office Building19%
Market Complex1%
Factories7%
School Building11%
Hospital Building5%
*Other Building36%
Repair & Maintenance5%
*Not separately classified
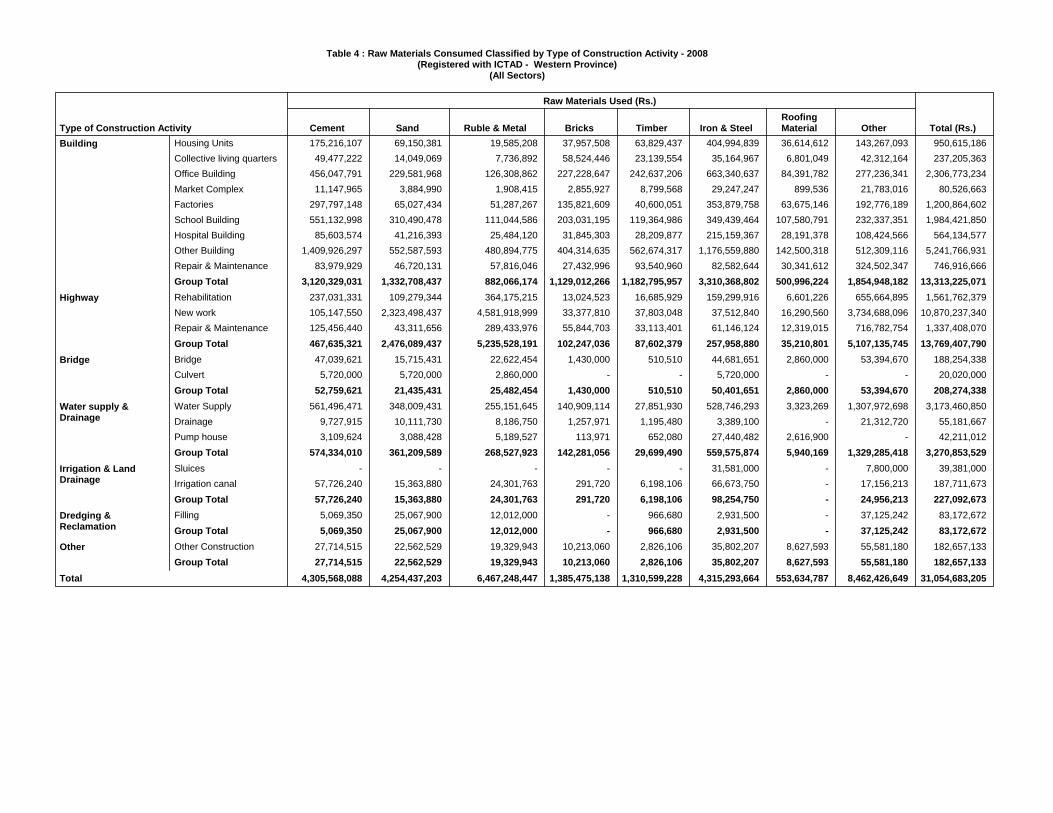
Table 4 : Raw Materials Consumed Classified by Type of Construction Activity - 2008(Registered with ICTAD - Western Province)
(All Sectors)
175,216,107 69,150,381 19,585,208 37,957,508 63,829,437 404,994,839 36,614,612 143,267,093 950,615,18649,477,222 14,049,069 7,736,892 58,524,446 23,139,554 35,164,967 6,801,049 42,312,164 237,205,363
456,047,791 229,581,968 126,308,862 227,228,647 242,637,206 663,340,637 84,391,782 277,236,341 2,306,773,23411,147,965 3,884,990 1,908,415 2,855,927 8,799,568 29,247,247 899,536 21,783,016 80,526,663
297,797,148 65,027,434 51,287,267 135,821,609 40,600,051 353,879,758 63,675,146 192,776,189 1,200,864,602551,132,998 310,490,478 111,044,586 203,031,195 119,364,986 349,439,464 107,580,791 232,337,351 1,984,421,85085,603,574 41,216,393 25,484,120 31,845,303 28,209,877 215,159,367 28,191,378 108,424,566 564,134,577
1,409,926,297 552,587,593 480,894,775 404,314,635 562,674,317 1,176,559,880 142,500,318 512,309,116 5,241,766,93183,979,929 46,720,131 57,816,046 27,432,996 93,540,960 82,582,644 30,341,612 324,502,347 746,916,666
3,120,329,031 1,332,708,437 882,066,174 1,129,012,266 1,182,795,957 3,310,368,802 500,996,224 1,854,948,182 13,313,225,071237,031,331 109,279,344 364,175,215 13,024,523 16,685,929 159,299,916 6,601,226 655,664,895 1,561,762,379105,147,550 2,323,498,437 4,581,918,999 33,377,810 37,803,048 37,512,840 16,290,560 3,734,688,096 10,870,237,340125,456,440 43,311,656 289,433,976 55,844,703 33,113,401 61,146,124 12,319,015 716,782,754 1,337,408,070467,635,321 2,476,089,437 5,235,528,191 102,247,036 87,602,379 257,958,880 35,210,801 5,107,135,745 13,769,407,79047,039,621 15,715,431 22,622,454 1,430,000 510,510 44,681,651 2,860,000 53,394,670 188,254,3385,720,000 5,720,000 2,860,000 - - 5,720,000 - - 20,020,000
52,759,621 21,435,431 25,482,454 1,430,000 510,510 50,401,651 2,860,000 53,394,670 208,274,338561,496,471 348,009,431 255,151,645 140,909,114 27,851,930 528,746,293 3,323,269 1,307,972,698 3,173,460,850
9,727,915 10,111,730 8,186,750 1,257,971 1,195,480 3,389,100 - 21,312,720 55,181,6673,109,624 3,088,428 5,189,527 113,971 652,080 27,440,482 2,616,900 - 42,211,012
574,334,010 361,209,589 268,527,923 142,281,056 29,699,490 559,575,874 5,940,169 1,329,285,418 3,270,853,529- - - - - 31,581,000 - 7,800,000 39,381,000
57,726,240 15,363,880 24,301,763 291,720 6,198,106 66,673,750 - 17,156,213 187,711,67357,726,240 15,363,880 24,301,763 291,720 6,198,106 98,254,750 - 24,956,213 227,092,6735,069,350 25,067,900 12,012,000 - 966,680 2,931,500 - 37,125,242 83,172,6725,069,350 25,067,900 12,012,000 - 966,680 2,931,500 - 37,125,242 83,172,672
27,714,515 22,562,529 19,329,943 10,213,060 2,826,106 35,802,207 8,627,593 55,581,180 182,657,13327,714,515 22,562,529 19,329,943 10,213,060 2,826,106 35,802,207 8,627,593 55,581,180 182,657,133
4,305,568,088 4,254,437,203 6,467,248,447 1,385,475,138 1,310,599,228 4,315,293,664 553,634,787 8,462,426,649 31,054,683,205
Housing UnitsCollective living quartersOffice BuildingMarket ComplexFactoriesSchool BuildingHospital BuildingOther BuildingRepair & MaintenanceGroup Total
Building
RehabilitationNew workRepair & MaintenanceGroup Total
Highway
BridgeCulvertGroup Total
Bridge
Water SupplyDrainagePump houseGroup Total
Water supply &Drainage
SluicesIrrigation canalGroup Total
Irrigation & LandDrainage
FillingGroup Total
Dredging &Reclamation
Other ConstructionGroup Total
Other
Total
Type of Construction Activity Cement Sand Ruble & Metal Bricks Timber Iron & SteelRoofingMaterial Other
Raw Materials Used (Rs.)
Total (Rs.)

Table 5 : Raw Materials Consumed Classified by Type of Construction Activity - 2008(Registered with ICTAD - Western Province)
(Private Sector)
95,370,481 49,809,654 9,085,617 21,245,032 35,831,387 56,943,987 13,371,738 137,547,093 419,204,98932,296,707 12,067,284 7,605,904 58,524,446 23,139,554 26,784,827 6,801,049 42,312,164 209,531,934
262,594,644 123,527,667 24,360,925 158,507,300 161,643,679 377,150,571 30,468,175 139,367,285 1,277,620,2472,209,350 1,198,340 - 429,000 4,791,687 23,166,000 715,858 7,579,000 40,089,235
297,265,437 64,368,976 51,003,341 135,821,609 40,404,999 348,462,632 63,423,466 192,776,189 1,193,526,649478,855,872 274,682,459 96,599,103 159,634,672 86,984,395 154,665,748 103,603,194 193,692,776 1,548,718,220
7,045,138 4,074,565 2,564,428 1,585,012 1,655,096 78,419,744 - 61,863,161 157,207,144883,055,559 418,259,416 366,009,959 233,243,187 375,384,278 843,390,356 52,591,713 297,417,306 3,469,351,774
7,587,580 3,138,850 3,833,258 2,016,300 21,744,580 11,440,000 4,290,000 6,506,500 60,557,0682,066,280,768 951,127,211 561,062,533 771,006,559 751,579,655 1,920,423,865 275,265,193 1,079,061,475 8,375,807,260
7,007,000 14,492,335 30,589,416 - 2,822,908 4,716,069 1,716,000 58,147,785 119,491,5122,869,552 2,482,194 429,000 - 2,574,000 1,430,000 2,431,000 251,830,776 264,046,5239,876,552 16,974,529 31,018,416 - 5,396,908 6,146,069 4,147,000 309,978,561 383,538,0352,288,000 1,430,000 - 1,430,000 - 3,432,000 2,860,000 2,860,000 14,300,0002,288,000 1,430,000 - 1,430,000 - 3,432,000 2,860,000 2,860,000 14,300,000
202,021,257 103,627,824 80,181,084 76,555,162 21,395,546 269,561,115 3,323,269 481,516,893 1,238,182,148202,021,257 103,627,824 80,181,084 76,555,162 21,395,546 269,561,115 3,323,269 481,516,893 1,238,182,148
39,136,240 10,530,480 16,150,763 291,720 4,911,106 64,957,750 - 14,868,213 150,846,27339,136,240 10,530,480 16,150,763 291,720 4,911,106 64,957,750 - 14,868,213 150,846,273
3,067,350 24,209,900 10,868,000 - 966,680 2,931,500 - 20,806,500 62,849,9303,067,350 24,209,900 10,868,000 - 966,680 2,931,500 - 20,806,500 62,849,9309,044,464 7,466,602 10,445,864 10,093,512 207,350 17,195,178 8,351,200 7,009,002 69,813,1729,044,464 7,466,602 10,445,864 10,093,512 207,350 17,195,178 8,351,200 7,009,002 69,813,172
2,331,714,631 1,115,366,547 709,726,661 859,376,953 784,457,244 2,284,647,477 293,946,662 1,916,100,644 10,295,336,817
Housing UnitsCollective living quartersOffice BuildingMarket ComplexFactoriesSchool BuildingHospital BuildingOther BuildingRepair & MaintenanceGroup Total
Building
RehabilitationNew workGroup Total
Highway
BridgeGroup Total
Bridge
Water SupplyGroup Total
Water supply &Drainage
Irrigation canalGroup Total
Irrigation & LandDrainage
FillingGroup Total
Dredging &Reclamation
Other ConstructionGroup Total
Other
Total
Type of Construction Activity Cement SandRuble &
Metal Bricks Timber Iron & SteelRoofingMaterial Other
Raw Materials Used (Rs.)
Total (Rs.)

Table 6 : Raw Materials Consumed Classified by Type of Construction Activity - 2008(Registered with ICTAD - Western Province)
(Public Sector)
79,845,626 19,340,727 10,499,592 16,712,476 27,998,050 348,050,852 23,242,874 5,720,000 531,410,19617,180,515 1,981,786 130,988 - - 8,380,140 - - 27,673,429
193,453,147 106,054,301 101,947,937 68,721,346 80,993,527 286,190,066 53,923,607 137,869,056 1,029,152,9878,938,615 2,686,650 1,908,415 2,426,927 4,007,881 6,081,247 183,678 14,204,016 40,437,428
531,711 658,458 283,927 - 195,052 5,417,126 251,680 - 7,337,95372,277,126 35,808,018 14,445,484 43,396,523 32,380,592 194,773,716 3,977,597 38,644,574 435,703,63078,558,435 37,141,828 22,919,693 30,260,291 26,554,781 136,739,622 28,191,378 46,561,404 406,927,432
526,870,738 134,328,177 114,884,817 171,071,448 187,290,040 333,169,524 89,908,604 214,891,810 1,772,415,15776,392,349 43,581,281 53,982,788 25,416,696 71,796,380 71,142,644 26,051,612 317,995,847 686,359,598
1,054,048,263 381,581,225 321,003,640 358,005,707 431,216,303 1,389,944,936 225,731,031 775,886,707 4,937,417,811230,024,331 94,787,009 333,585,799 13,024,523 13,863,021 154,583,848 4,885,226 597,517,110 1,442,270,867102,277,997 2,321,016,243 4,581,489,999 33,377,810 35,229,048 36,082,840 13,859,560 3,482,857,320 10,606,190,818125,456,440 43,311,656 289,433,976 55,844,703 33,113,401 61,146,124 12,319,015 716,782,754 1,337,408,070457,758,769 2,459,114,908 5,204,509,775 102,247,036 82,205,471 251,812,812 31,063,801 4,797,157,184 13,385,869,75544,751,621 14,285,431 22,622,454 - 510,510 41,249,651 - 50,534,670 173,954,3385,720,000 5,720,000 2,860,000 - - 5,720,000 - - 20,020,000
50,471,621 20,005,431 25,482,454 - 510,510 46,969,651 - 50,534,670 193,974,338359,475,215 244,381,607 174,970,562 64,353,953 6,456,384 259,185,178 - 826,455,805 1,935,278,702
9,727,915 10,111,730 8,186,750 1,257,971 1,195,480 3,389,100 - 21,312,720 55,181,6673,109,624 3,088,428 5,189,527 113,971 652,080 27,440,482 2,616,900 - 42,211,012
372,312,754 257,581,765 188,346,839 65,725,895 8,303,944 290,014,759 2,616,900 847,768,525 2,032,671,381- - - - - 31,581,000 - 7,800,000 39,381,000
18,590,000 4,833,400 8,151,000 - 1,287,000 1,716,000 - 2,288,000 36,865,40018,590,000 4,833,400 8,151,000 - 1,287,000 33,297,000 - 10,088,000 76,246,4002,002,000 858,000 1,144,000 - - - - 16,318,742 20,322,7422,002,000 858,000 1,144,000 - - - - 16,318,742 20,322,742
18,670,051 15,095,927 8,884,079 119,548 2,618,756 18,607,029 276,393 48,572,178 112,843,96118,670,051 15,095,927 8,884,079 119,548 2,618,756 18,607,029 276,393 48,572,178 112,843,961
1,973,853,457 3,139,070,656 5,757,521,787 526,098,186 526,141,984 2,030,646,188 259,688,125 6,546,326,005 20,759,346,387
Housing UnitsCollective living quartersOffice BuildingMarket ComplexFactoriesSchool BuildingHospital BuildingOther BuildingRepair & MaintenanceGroup Total
Building
RehabilitationNew workRepair & MaintenanceGroup Total
Highway
BridgeCulvertGroup Total
Bridge
Water SupplyDrainagePump houseGroup Total
Water supply &Drainage
SluicesIrrigation canalGroup Total
Irrigation & LandDrainage
FillingGroup Total
Dredging &Reclamation
Other ConstructionGroup Total
Other
Total
Type of Construction Activity Cement Sand Ruble & Metal Bricks Timber Iron & SteelRoofingMaterial Other
Raw Materials Used (Rs.)
Total (Rs.)

Chart 6 : Distribution of Raw Materials Consumed by Type of Construction Activity -2008 (Registered with ICTAD - Western Province)
(All Sectors)
Building43%
Highway44%
Bridge1%
Water supply & Drainage10%
Irrigation & Land Drainage1% Dredging & Reclamation
0%Other1%
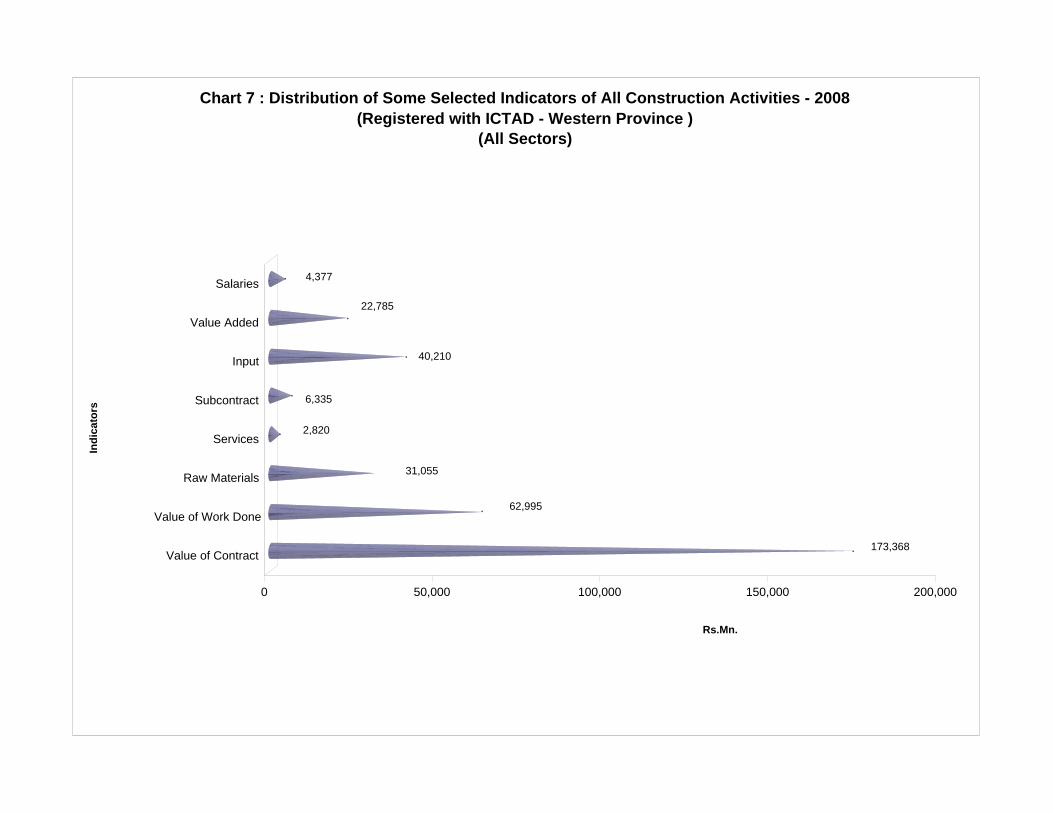
173,368
62,995
31,055
2,820
6,335
40,210
22,785
4,377
0 50,000 100,000 150,000 200,000
Rs.Mn.
Value of Contract
Value of Work Done
Raw Materials
Services
Subcontract
Input
Value Added
Salaries
Indi
cato
rsChart 7 : Distribution of Some Selected Indicators of All Construction Activities - 2008
(Registered with ICTAD - Western Province )(All Sectors)
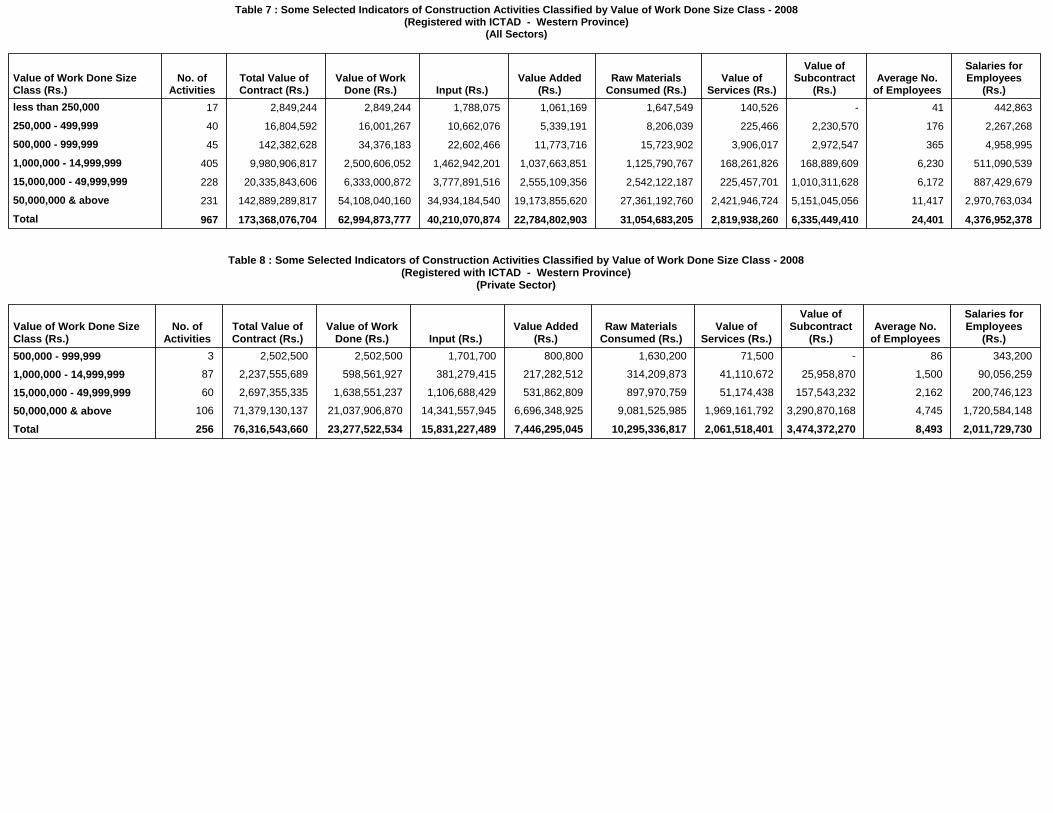
Table 7 : Some Selected Indicators of Construction Activities Classified by Value of Work Done Size Class - 2008(Registered with ICTAD - Western Province)
(All Sectors)
17 2,849,244 2,849,244 1,788,075 1,061,169 1,647,549 140,526 - 41 442,863
40 16,804,592 16,001,267 10,662,076 5,339,191 8,206,039 225,466 2,230,570 176 2,267,268
45 142,382,628 34,376,183 22,602,466 11,773,716 15,723,902 3,906,017 2,972,547 365 4,958,995
405 9,980,906,817 2,500,606,052 1,462,942,201 1,037,663,851 1,125,790,767 168,261,826 168,889,609 6,230 511,090,539
228 20,335,843,606 6,333,000,872 3,777,891,516 2,555,109,356 2,542,122,187 225,457,701 1,010,311,628 6,172 887,429,679
231 142,889,289,817 54,108,040,160 34,934,184,540 19,173,855,620 27,361,192,760 2,421,946,724 5,151,045,056 11,417 2,970,763,034
967 173,368,076,704 62,994,873,777 40,210,070,874 22,784,802,903 31,054,683,205 2,819,938,260 6,335,449,410 24,401 4,376,952,378
less than 250,000
250,000 - 499,999
500,000 - 999,999
1,000,000 - 14,999,999
15,000,000 - 49,999,999
50,000,000 & above
Total
Value of Work Done SizeClass (Rs.)
No. ofActivities
Total Value ofContract (Rs.)
Value of WorkDone (Rs.) Input (Rs.)
Value Added(Rs.)
Raw MaterialsConsumed (Rs.)
Value ofServices (Rs.)
Value ofSubcontract
(Rs.)Average No.
of Employees
Salaries forEmployees
(Rs.)
Table 8 : Some Selected Indicators of Construction Activities Classified by Value of Work Done Size Class - 2008(Registered with ICTAD - Western Province)
(Private Sector)
3 2,502,500 2,502,500 1,701,700 800,800 1,630,200 71,500 - 86 343,200
87 2,237,555,689 598,561,927 381,279,415 217,282,512 314,209,873 41,110,672 25,958,870 1,500 90,056,259
60 2,697,355,335 1,638,551,237 1,106,688,429 531,862,809 897,970,759 51,174,438 157,543,232 2,162 200,746,123
106 71,379,130,137 21,037,906,870 14,341,557,945 6,696,348,925 9,081,525,985 1,969,161,792 3,290,870,168 4,745 1,720,584,148
256 76,316,543,660 23,277,522,534 15,831,227,489 7,446,295,045 10,295,336,817 2,061,518,401 3,474,372,270 8,493 2,011,729,730
500,000 - 999,9991,000,000 - 14,999,99915,000,000 - 49,999,99950,000,000 & aboveTotal
Value of Work Done SizeClass (Rs.)
No. ofActivities
Total Value ofContract (Rs.)
Value of WorkDone (Rs.) Input (Rs.)
Value Added(Rs.)
Raw MaterialsConsumed (Rs.)
Value ofServices (Rs.)
Value ofSubcontract
(Rs.)Average No.
of Employees
Salaries forEmployees
(Rs.)
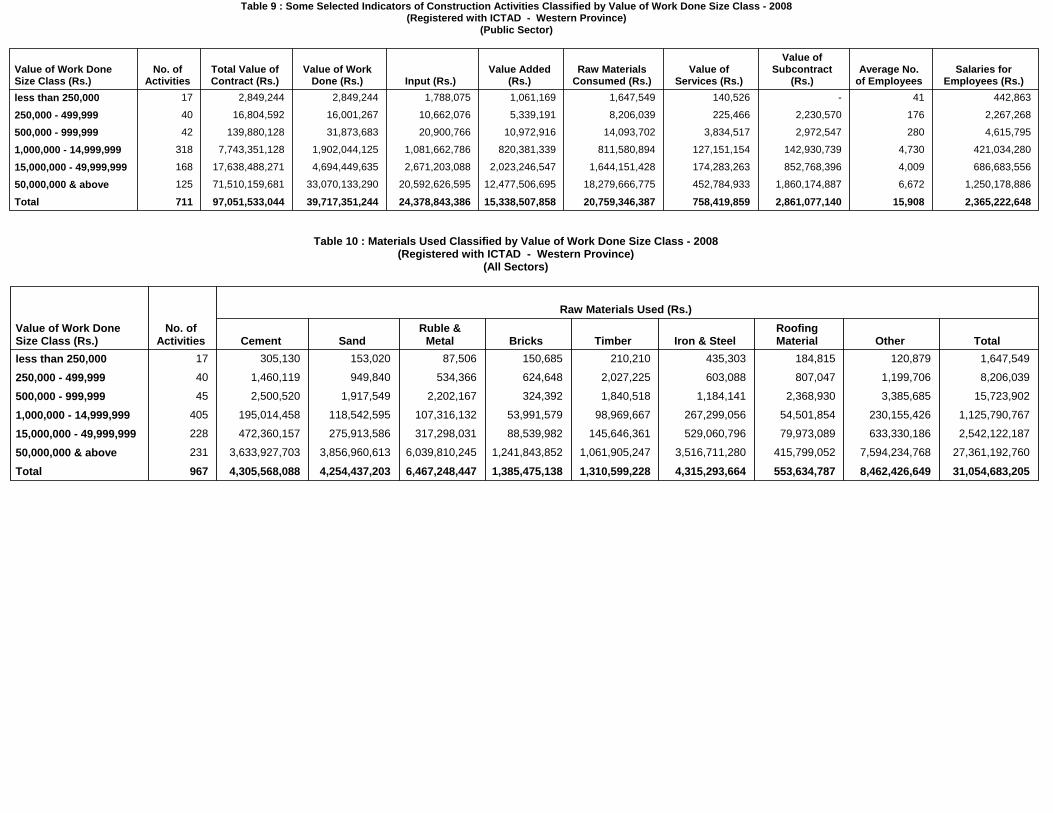
Table 9 : Some Selected Indicators of Construction Activities Classified by Value of Work Done Size Class - 2008(Registered with ICTAD - Western Province)
(Public Sector)
17 2,849,244 2,849,244 1,788,075 1,061,169 1,647,549 140,526 - 41 442,863
40 16,804,592 16,001,267 10,662,076 5,339,191 8,206,039 225,466 2,230,570 176 2,267,268
42 139,880,128 31,873,683 20,900,766 10,972,916 14,093,702 3,834,517 2,972,547 280 4,615,795
318 7,743,351,128 1,902,044,125 1,081,662,786 820,381,339 811,580,894 127,151,154 142,930,739 4,730 421,034,280
168 17,638,488,271 4,694,449,635 2,671,203,088 2,023,246,547 1,644,151,428 174,283,263 852,768,396 4,009 686,683,556
125 71,510,159,681 33,070,133,290 20,592,626,595 12,477,506,695 18,279,666,775 452,784,933 1,860,174,887 6,672 1,250,178,886
711 97,051,533,044 39,717,351,244 24,378,843,386 15,338,507,858 20,759,346,387 758,419,859 2,861,077,140 15,908 2,365,222,648
less than 250,000250,000 - 499,999500,000 - 999,9991,000,000 - 14,999,99915,000,000 - 49,999,99950,000,000 & aboveTotal
Value of Work DoneSize Class (Rs.)
No. ofActivities
Total Value ofContract (Rs.)
Value of WorkDone (Rs.) Input (Rs.)
Value Added(Rs.)
Raw MaterialsConsumed (Rs.)
Value ofServices (Rs.)
Value ofSubcontract
(Rs.)Average No.
of EmployeesSalaries for
Employees (Rs.)
Table 10 : Materials Used Classified by Value of Work Done Size Class - 2008(Registered with ICTAD - Western Province)
(All Sectors)
17 305,130 153,020 87,506 150,685 210,210 435,303 184,815 120,879 1,647,549
40 1,460,119 949,840 534,366 624,648 2,027,225 603,088 807,047 1,199,706 8,206,039
45 2,500,520 1,917,549 2,202,167 324,392 1,840,518 1,184,141 2,368,930 3,385,685 15,723,902
405 195,014,458 118,542,595 107,316,132 53,991,579 98,969,667 267,299,056 54,501,854 230,155,426 1,125,790,767
228 472,360,157 275,913,586 317,298,031 88,539,982 145,646,361 529,060,796 79,973,089 633,330,186 2,542,122,187
231 3,633,927,703 3,856,960,613 6,039,810,245 1,241,843,852 1,061,905,247 3,516,711,280 415,799,052 7,594,234,768 27,361,192,760
967 4,305,568,088 4,254,437,203 6,467,248,447 1,385,475,138 1,310,599,228 4,315,293,664 553,634,787 8,462,426,649 31,054,683,205
less than 250,000250,000 - 499,999500,000 - 999,9991,000,000 - 14,999,99915,000,000 - 49,999,99950,000,000 & aboveTotal
Value of Work DoneSize Class (Rs.)
No. ofActivities Cement Sand
Ruble &Metal Bricks Timber Iron & Steel
RoofingMaterial Other Total
Raw Materials Used (Rs.)
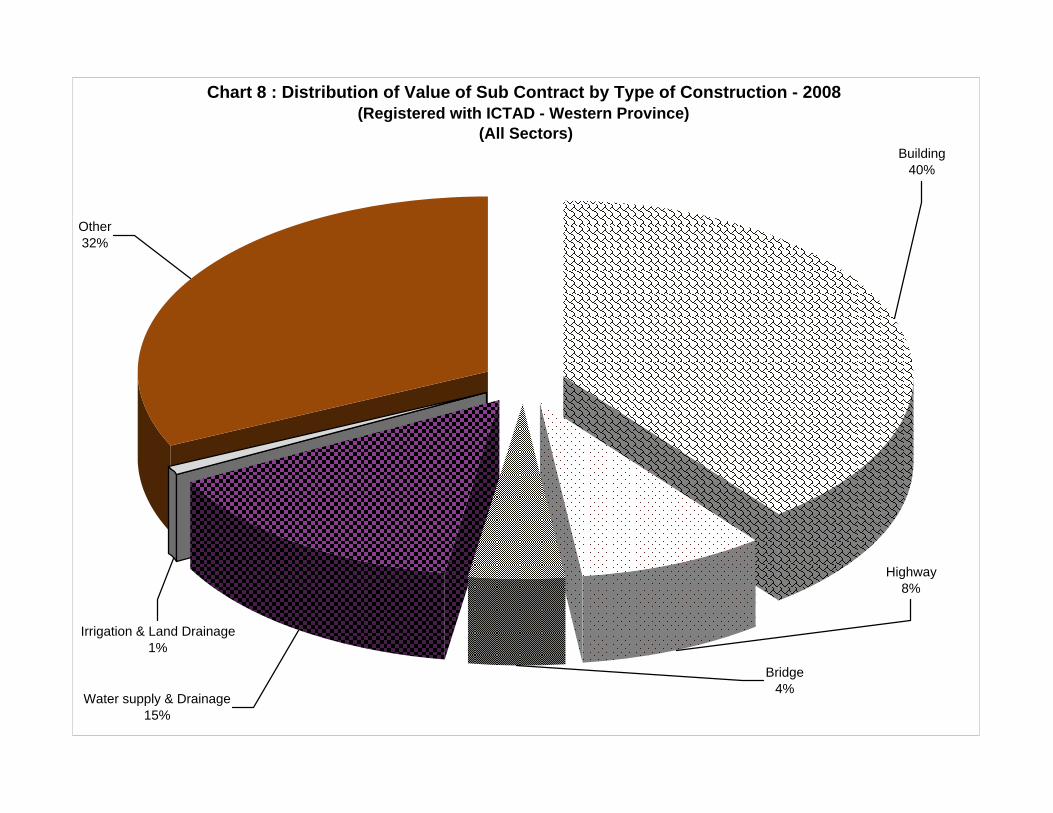
Chart 8 : Distribution of Value of Sub Contract by Type of Construction - 2008 (Registered with ICTAD - Western Province)
(All Sectors) Building
40%
Highway8%
Bridge4%
Water supply & Drainage15%
Irrigation & Land Drainage1%
Other32%