Embed Size (px)
Citation preview
THE SOUTH AFRICA I KNOW, THE HOME I UNDERSTAND
TOURISM
2016
13 July 2017
12:00
Statistics South Africa Pali Lehohla Report No. 03-51-02 (2016) Statistician-General
Statistics South Africa
Tourism, Report No. 03-51-02 (2016)
ii
Tourism, 2016 / Statistics South Africa Published by Statistics South Africa, Private Bag X44, Pretoria 0001 © Statistics South Africa, 2016 Users may apply or process this data, provided Statistics South Africa (Stats SA) is acknowledged as the original source of the data; that it is specified that the application and/or analysis is the result of the user's independent processing of the data; and that neither the basic data nor any reprocessed version or application thereof may be sold or offered for sale in any form whatsoever without prior permission from Stats SA. Stats SA Library Cataloguing-in-Publication (CIP) Data Tourism, 2016 / Statistics South Africa. Pretoria: Statistics South Africa, 2016 [Report No. 03-51-02 (2016)] 68pp ISBN: 978-0-621-45619-6 A complete set of Stats SA publications is available at Stats SA Library and the following libraries:
National Library of South Africa, Pretoria Division National Library of South Africa, Cape Town Division Library of Parliament, Cape Town Bloemfontein Public Library Natal Society Library, Pietermaritzburg Johannesburg Public Library Eastern Cape Library Services, King William’s Town Central Regional Library, Polokwane Central Reference Library, Mbombela Central Reference Collection, Kimberley Central Reference Library, Mmabatho
This report is available on the Stats SA website: www.statssa.gov.za Copies are obtainable from: Printing and Distribution, Statistics South Africa Tel: (012) 310 8093 / 8251 / 8358 / 8161 Fax: (012) 321 7381 Email: [email protected]
[email protected] Technical enquiries: Tel: (012) 406 3301 Email: [email protected]
Statistics South Africa
Tourism, Report No. 03-51-02 (2016)
iii
Preface The report provides information on South African residents and foreign travellers who passed through all South African air, land and sea ports of entry/exit in 2016. It summarises data published in the monthly statistical releases on Tourism and Migration (Statistical release P0351) in 2016, highlighting annual numbers of travellers and tourists. Details on mode of travel, seasonal travel patterns; purpose of visit; length of stay of visit; and demographic characteristics of tourists who visited South Africa in 2016 are provided.
PJ Lehohla Statistician-General
Statistics South Africa
Tourism, Report No. 03-51-02 (2016)
iv
Contents
List of tables .................................................................................................................................................................. v
List of figures................................................................................................................................................................ vi
1. Introduction .......................................................................................................................................................... 1
1.1.Background .................................................................................................................................................. 1
1.2.Objectives of this report ................................................................................................................................ 2
1.3.Scope of this report ...................................................................................................................................... 2
2. Data and methods ................................................................................................................................................ 2
2.1 Data source ................................................................................................................................................... 2
2.2 Data processing and analysis ....................................................................................................................... 2
2.3 Limitations of data ........................................................................................................................................ 3
3. All travellers .......................................................................................................................................................... 3
3.1 Number of travellers ..................................................................................................................................... 3
3.1.1 South African residents ................................................................................................................... 4
3.1.2 Foreign travellers............................................................................................................................. 6
4. Tourists............................................................................................................................................................... 11
4.1 Region of residence .................................................................................................................................... 12
4.2 Ten leading countries ................................................................................................................................. 13
4.3 Mode of travel ............................................................................................................................................. 15
4.4 Purpose of visit ........................................................................................................................................... 17
4.5 Duration of stay .......................................................................................................................................... 18
4.6 Sex and age distribution ............................................................................................................................. 21
5. Summary ............................................................................................................................................................ 22
6. Appendices ........................................................................................................................................................ 23
7. Definition of terms .............................................................................................................................................. 61
8. Other Stats SA reports ....................................................................................................................................... 62
Statistics South Africa
Tourism, Report No. 03-51-02 (2016)
v
List of tables
Table 3.1: Number of arrivals, departures and travellers in transits of South African residents by mode of
travel, 2016 ....................................................................................................................................... 5
Table 3.2: Percentage distribution of South African residents by mode of travel and place of arrival or
departure, 2016 ................................................................................................................................ 5
Table 3.3: Number of arrivals, departures and transits of foreign travellers by mode of travel and place of
arrival or departure, 2016 ................................................................................................................. 7
Table 3.4: Percentage distribution of foreign arrivals, departures and transits by mode of travel and place
of arrival or departure, 2016 ............................................................................................................. 8
Table 4.1: Distribution of tourists by mode of travel and place of arrival, 2016 .............................................. 16
Statistics South Africa
Tourism, Report No. 03-51-02 (2016)
vi
List of figures
Figure 3.1: Number of arrivals and departures of travellers by year of travel, 2002–2016 ................................ 3
Figure 3.2: Number of arrivals and departures of South African residents by year of travel, 2002–2016 ......... 4
Figure 3.3: Percentage distribution of arrivals and departures of South African residents by month of
travel, 2016 ....................................................................................................................................... 6
Figure 3.4: Number of arrivals and departures of foreign travellers by year of travel, 2002–2016 .................... 7
Figure 3.5: Percentage distribution of foreign arrivals and departures by month of travel, 2016 ...................... 9
Figure 3.6: Percentage distribution of foreign arrivals by purpose of visit, 2016 ............................................... 9
Figure 3.7: Distribution of foreign arrivals by type of visitor, 2016 ................................................................... 10
Figure 4.1: Number of tourists by month and year of travel, 2015 and 2016 ..................................................... 11
Figure 4.2: percentage distribution of tourists by region of residence, 2016 ...................................................... 12
Figure 4.3: Percentage distribution of tourists by region of residence and month of arrival, 2016..................... 12
Figure 4.4: Number of tourists from ten leading overseas countries in 2016 compared to 2015 ....................... 13
Figure 4.5: Number of tourists from ten leading SADC countries in 2016 compared to 2015 ............................ 14
Figure 4.6: Number of tourists from ten leading ‘other’ African countries in 2016 compared to 2015................ 15
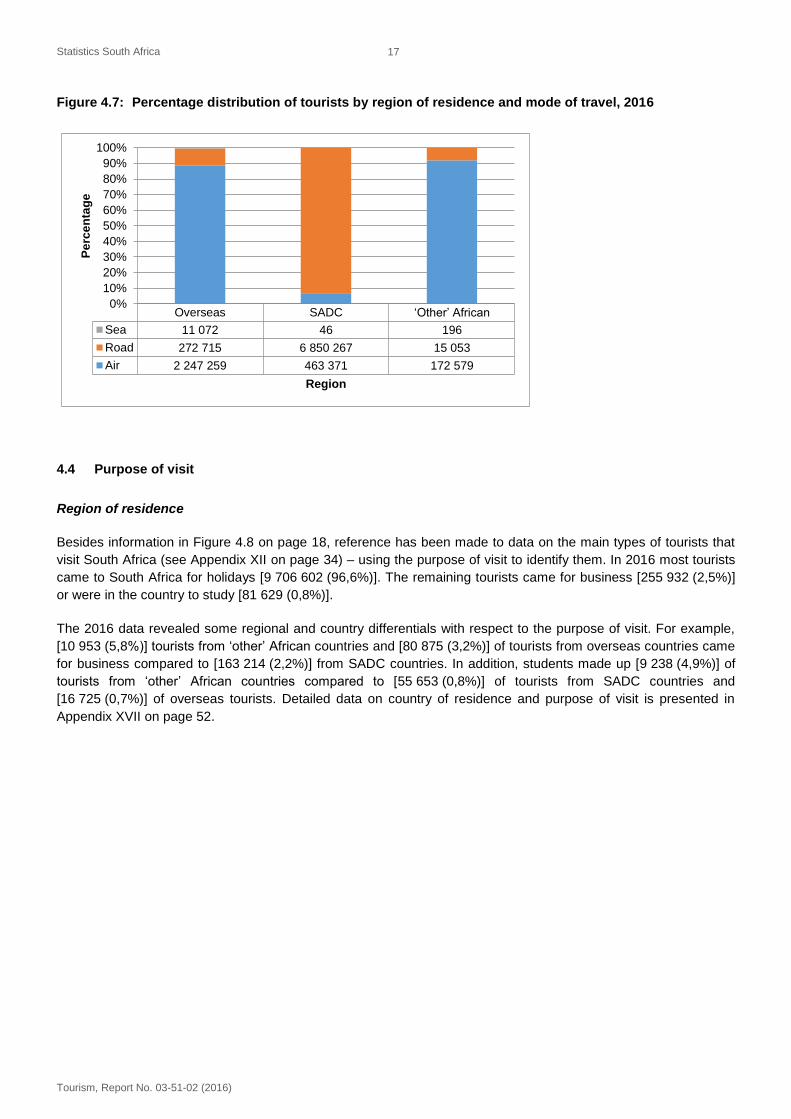
Figure 4.7: Percentage distribution of tourists by region of residence and mode of travel, 2016 ....................... 17
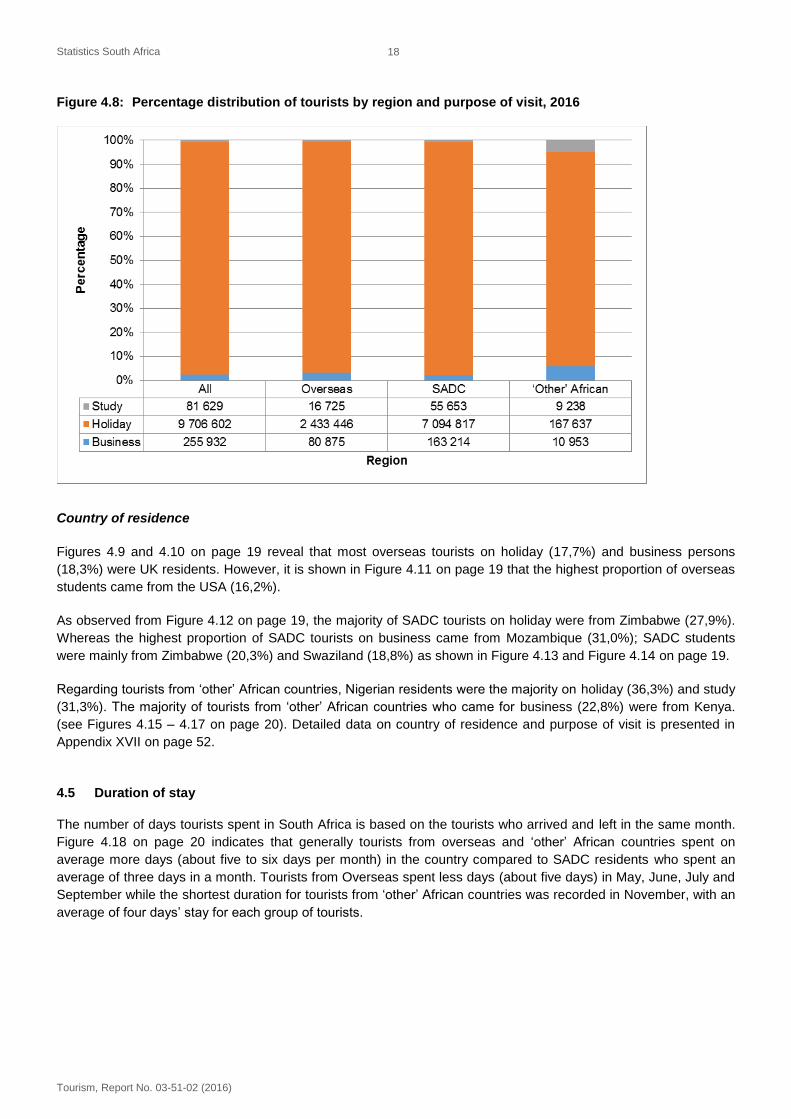
Figure 4.8: Percentage distribution of tourists by region and purpose of visit, 2016 .......................................... 18
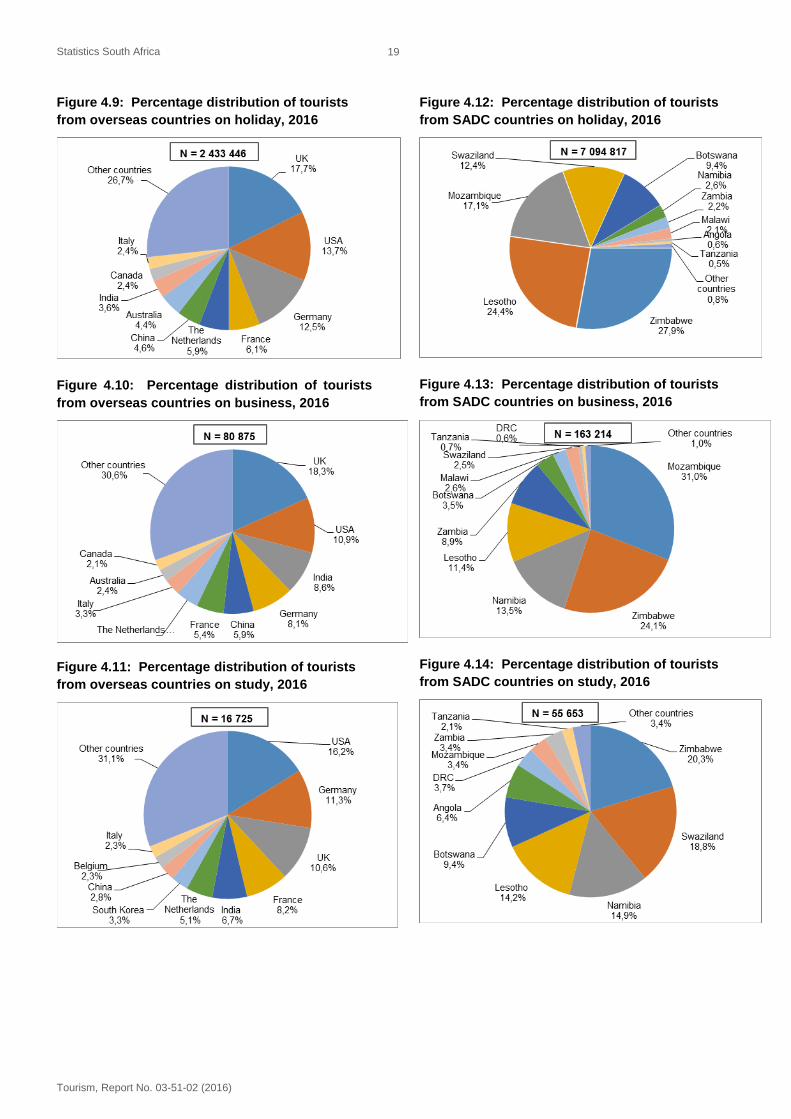
Figure 4.9 Percentage distribution of tourists from overseas countries on holiday, 2016 ................................. 19
Figure 4.10: Percentage distribution of tourists from overseas countries on business, 2016 ........................... 19
Figure 4.11: Percentage distribution of tourists from overseas countries on study, 2016................................. 19
Figure 4.12: Percentage distribution of tourists from SADC countries on holiday, 2016 .................................. 19
Figure 4.13: Percentage distribution of tourists from SADC countries on business, 2016................................ 19
Figure 4.14: Percentage distribution of tourists from SADC countries on study, 2016 ..................................... 19
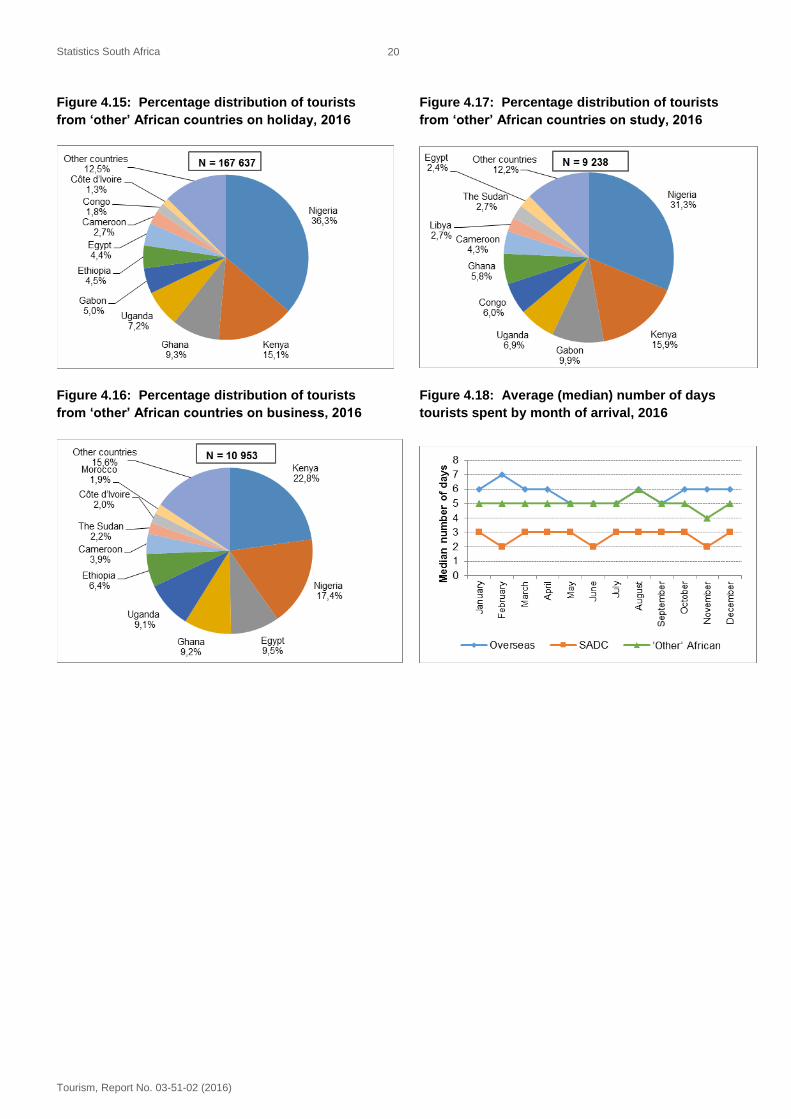
Figure 4.15: Percentage distribution of tourists from ‘other’ African countries on holiday, 2016 ...................... 20
Figure 4.16: Percentage distribution of tourists from ‘other’ African countries on business, 2016 ................... 20
Figure 4.17: Percentage distribution of tourists from ‘other’ African countries on study, 2016 ......................... 20
Figure 4.18: Average (median) number of days tourists spent by month of arrival, 2016 ................................ 20
Figure 4.19: Percentage distribution of tourists by region of residence and sex, 2016 ..................................... 21
Figure 4.20: Percentage distribution of tourists by region of residence and age, 2016 ..................................... 22
Statistics South Africa
Tourism, Report No. 03-51-02 (2016)
1
1. Introduction
1.1. Background
Administrative records regulating the flow of people across boundaries, specifically border statistics, are an
important source of statistical data on temporary population movements in many countries. Generally, countries
routinely collect data from both residents and non-residents who pass through the demarcated air, land and sea
ports on arrival in and departing from the country. The method, the kind of collected data, the quality of data and
the dissemination and availability of processed data differ widely among countries since there is no international
standardised template for the recording of information on travellers. Besides the impact of the level of infrastructure
development, the national differences are largely shaped by the immigration policies and regulations of individual
countries.
Data collection methods may be electronic, manual or both. Travel documents could be scanned and/or travellers
are expected to complete an arrival and departure form/card. The amount of documentation and the information
collected from travellers are often influenced by the citizenship / nationality of the travel document and the purpose
of entry.
Data obtained from foreigners or non-residents can be used to categorise them into visitors and non-visitors.
Usually, the data given on the form/card regarding the purpose of visit and/or length of stay is further used to
categorise travellers into visitors and migrants. In countries that do not use cards/forms, data on type of visa/permit
can also be used for the categorisation. In addition, there are countries that issue special cards for registered
immigrants that they could use to cross into and out of the country of residence. Thus the information from the visa,
permit and the card/form are used to classify non-visitors into migratory categories such as short-term and long-
term migrants; temporary migrants; permanent migrants; labour migrants, asylum seekers, students, etc. according
to a country’s specifications.
Because border statistics are derived from arrival data, they could be the most suitable data source for the direct
measurement of the flow of immigrants (UN, 2011). The data are routinely collected as travellers pass through the
immigration check points at the port of entry so data are available at any given time. It is crucial to note that unlike
data from census or sample surveys that count individual persons, border statistics by their nature, measure events
i.e. movements of persons rather than the physical persons. The reason is that the same person can cross the
border a number of times during a specified time and his or her information is recorded every time he or she
passes through the border.
The management of population movements across South African borders and immigration into South Africa fall
under the jurisdiction of the Department of Home Affairs (DHA). The jurisdiction of this responsibility is enshrined in
the various immigration acts, amendments, laws and regulations. Currently, with respect to the collection of data on
population movements in and out of South Africa, the DHA operates under the Immigration Act 2002 (Act No. 13 of
2002), its amendments and associated regulations. The latest Immigration Regulations came into operation on 26
May 2014. Any changes and amendments in the legislation and regulations affect both the flow of travellers as well
as the methods of collecting data and the kind of information collected on travellers.
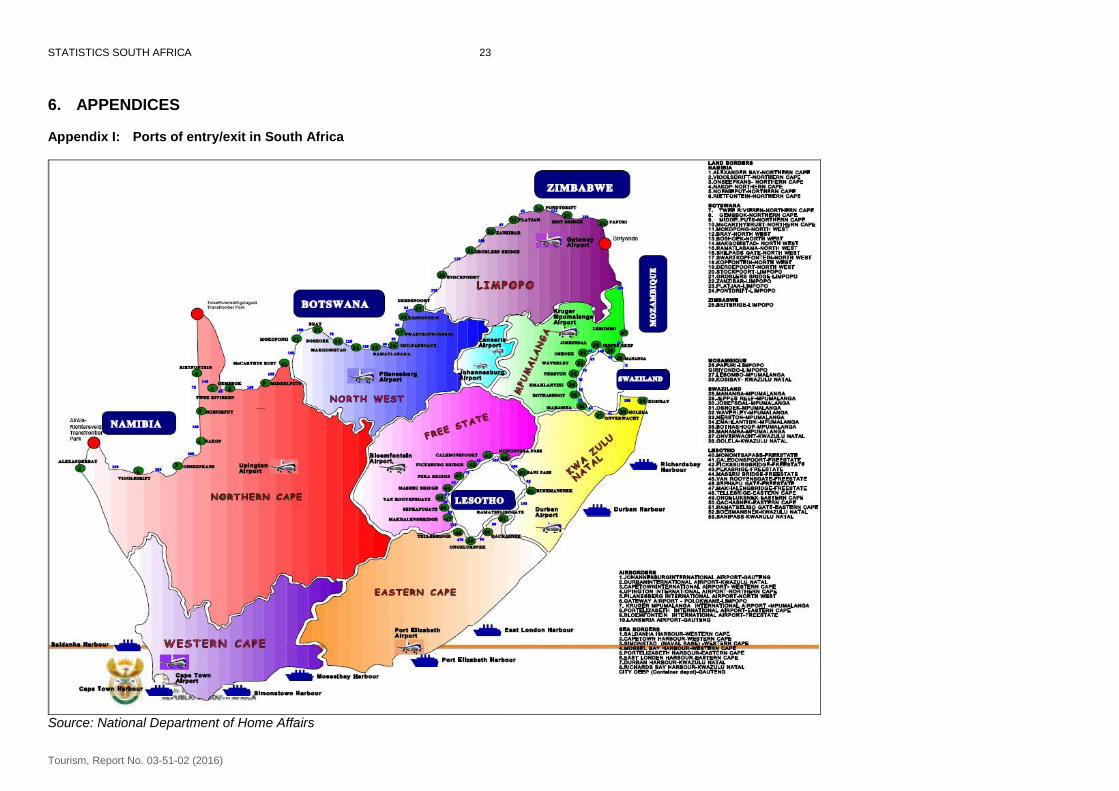
At the ports of entry/exit (see Appendix I on page 23 for the distribution of all South African ports), the immigration
officers of the DHA collect information on South African residents and foreign travellers arriving into or departing
from South Africa. This information is used to produce statistical releases on all travellers, with emphasis on
tourists and an annual report aggregating the results of one calendar year.
Statistics South Africa
Tourism, Report No. 03-51-02 (2016)
2
1.2. Objectives of this report
The report forms part of a regular annual series of publications on tourism. The main aim of the report is to present
information on population movements into and out of South Africa in 2016. Specifically, the report provides:
Information on arrivals, departures and transits of South African residents and foreign travellers.
A detailed analysis of the movements of tourists and their demographic characteristics over the twelve-
month period.
1.3. Scope of this report
This report is based on information on population movements across South Africa’s ports of entry/exit covering the
period 1 January 2016 to 31 December 2016. It covers data on arrivals and departures of South African residents
and foreign travellers. A detailed analysis of the data on foreign tourists with respect to: mode of travel, purpose of
visit, sex and age distribution is covered. The report also describes trends in the overall number of travellers and
tourists from 2002 to 2016.
2. Data and methods
2.1 Data source
Data routinely collected by immigration officers at all land, air and sea ports of entry/exit (see Appendix I on page
23) on all travellers (South African residents and foreign travellers) arriving into or departing from South Africa are
captured into the Department of Home Affair’s (DHA) population Movement Control System (MCS). The data
provide the best national coverage (in terms of both space and time) on the population movements of South African
residents and foreign travellers. Among other uses, the data:
can be used to estimate, monitor and understand salient characteristics of South African residents and
foreign travellers travelling into and out of South Africa;
provide information that can be used to assess the extent of government’s progress in strengthening bilateral
and multilateral political and economic relations with other countries;
can be used to estimate the number and some characteristics of same–day visitors and tourists that visit
South Africa;
provide information for marketing tourism by identifying niche, emerging and declining markets (both at
country and regional levels); and
provide information that can be used for monitoring the effects of major international and national events
(positive or negative) on the arrival of visitors into the country.
Generally, the data are collected directly from travel documents either by scanning them or by capturing
information from the travel documents onto the port’s electronic database. Individual ports regularly transmit the
data to the national database i.e. the MCS at the head office of the DHA.
2.2 Data processing and analysis
Statistics South Africa (Stats SA) downloads the data covering a particular calendar month from DHA. The
Statistical Analysis System (SAS) is used for data processing and analysis. Descriptive analyses (frequencies,
cross-tabulations, percentage distributions and median ages) are used to summarise the data. The results are
presented in table and graph formats. These are undertaken on a monthly basis to publish information on tourism
in the monthly Tourism and Migration (P0351) statistical release in order to meet users’ immediate needs. The
cumulative data for twelve months are published in the Tourism report on an annual basis.
Statistics South Africa
Tourism, Report No. 03-51-02 (2016)
3
2.3 Limitations of data
The information on the total number of arrivals, departures and travellers in transit for South African residents is
collected from the scanning of passports. However, data are not collected from passengers on country visited;
country of final destination; the duration of stay; intended duration of stay and purpose of visit. With this limitation, it
is impossible to identify the number of tourists from the data on South African residents.
3. All travellers
3.1 Number of travellers
The results present detailed information derived from the data published in the January to December 2016 Tourism
and Migration monthly statistical releases (P0351). In addition to the 2016 data, data from 2015 and earlier are
presented to provide some comparison in observed trends and patterns (see Appendix II on page 24).
Travellers are composed of passengers in transit, arrivals into and departures from South Africa regardless of
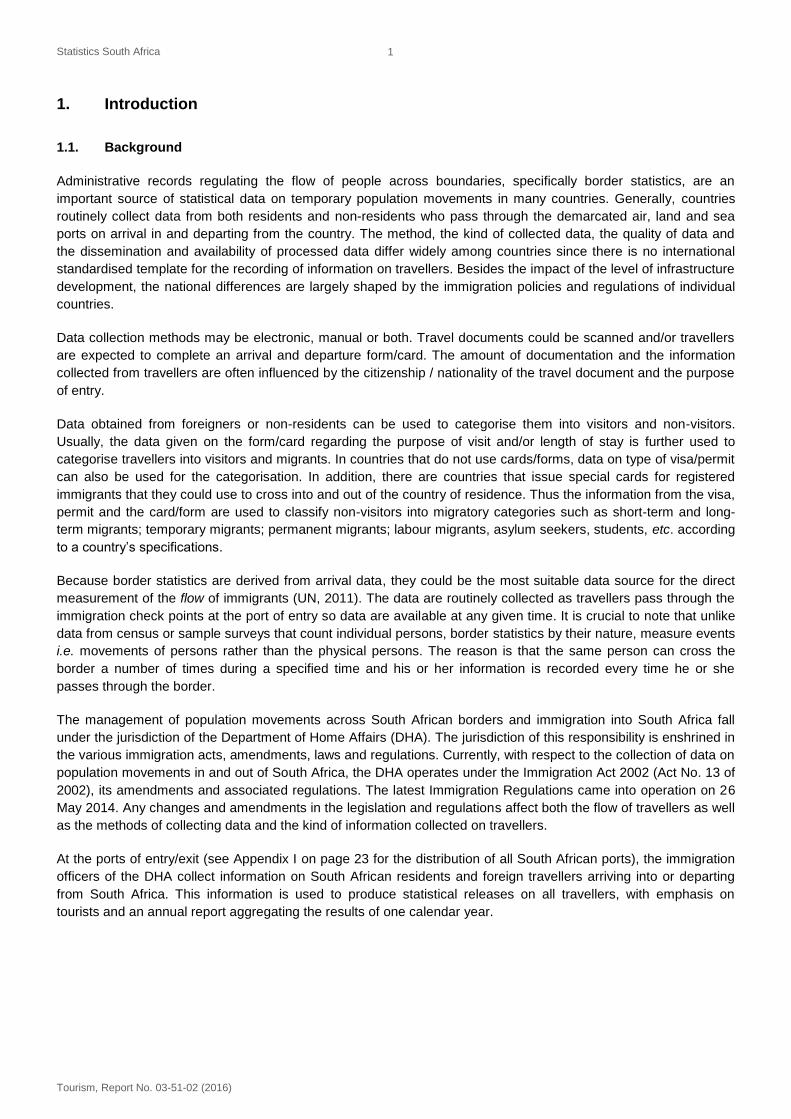
residency status. According to data presented in Figure 3.1 below, approximately 41 818 thousand travellers
(arrivals plus departures) were recorded in 2016 compared to 20 016 thousand recorded in 2002, indicating that
the overall number of travellers doubled over this 15-year period. Similarly, there were 21 636 thousand arrivals
and 20 182 thousand departures in 2016 compared to 10 400 thousand arrivals and 9 616 thousand departures in
2002.
Recent trends show that the overall number of travellers (arrivals and departures) increased by 5,7% between
2015 and 2016. Arrivals increased by 5,8% while departures increased by 5,6% during the same period.
Figure 3.1: Number of arrivals and departures of travellers by year of travel, 2002 – 2016
2002 2003 2004 2005 2006 2007 2008 2009 2010 2011 2012 2013 2014* 2015* 2016*
Arrivals 10 400 7 894 7 250 9 631 12 826 13 657 14 147 14 586 16 700 17 925 18 767 20 245 20 404 20 454 21 636
Departures 9 616 7 119 6 512 8 920 11 841 12 456 12 904 13 104 15 073 16 180 16 525 18 366 19 126 19 119 20 182
Total 20 016 15 013 13 762 18 551 24 667 26 113 27 051 27 690 31 773 34 105 35 292 38 611 39 530 39 573 41 818
0
5 000
10 000
15 000
20 000
25 000
30 000
35 000
40 000
45 000
Nu
mb
er
of
tra
ve
lle
rs in
'0
00
Year
*2014-2016 data excludes travellers in transit
Statistics South Africa
Tourism, Report No. 03-51-02 (2016)
4
3.1.1 South African residents
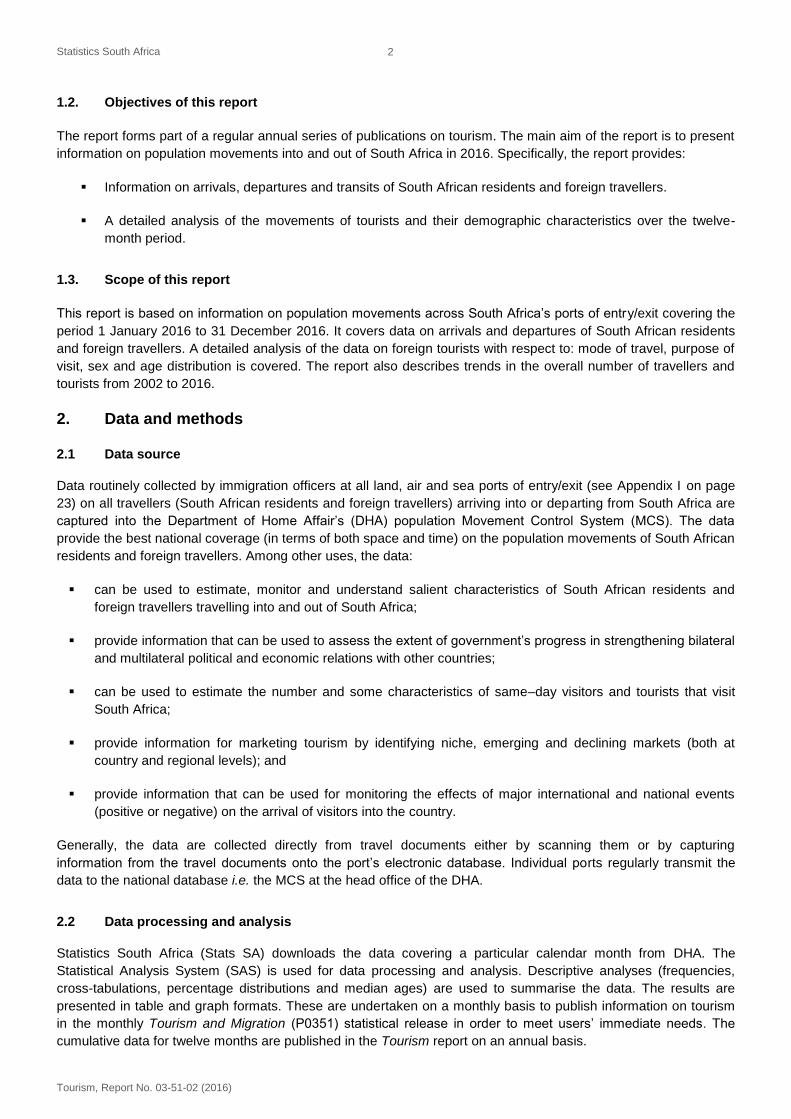
In 2016, 11 038 366 South African resident travellers were recorded compared to the 2015 volume of 10 825 818.
As shown in Appendix II on page 24, the 2016 volume was made up of 5 477 607 arrivals, 5 550 904 departures
and 9 855 travellers in transit.
The data in Figure 3.2 below indicate that the annual volumes of arrivals and departures for South African residents
had sharp declines in 2003 and 2004 then generally increased throughout the period from 2005 to 2016. These
declines in the volume of South African travellers between 2003 and 2004 were mainly due to the changes in the
Immigration Act, 2002 (Act No.13 of 2002) regarding the recording of information on international movements of
South African residents. The amendments to the Act resulted in information on arrival and departure of South
African residents not being consistently collected (i.e. misinterpretation of the Act led to some immigration officers
collecting while others were not collecting information on South African residents). Collection resumed after the
implementation of the Immigration Amendment Act, 2004 (Act No.19 of 2004). The figure further shows that there
were nearly as many departures as arrivals over the years.
Figure 3.2: Number of arrivals and departures of South African residents by year of travel, 2002–2016
2002 2003 2004 2005 2006 2007 2008 2009 2010 2011 2012 2013 2014* 2015* 2016*
Arrivals 3 850 1 254 434 2 112 4 317 4 449 4 418 4 487 5 125 5 429 4 971 5 060 5 312 5 402 5 478
Departures 3 794 1 164 419 2 192 4 339 4 433 4 429 4 424 5 165 5 455 5 031 5 168 5 382 5 414 5 551
Tota l 7 644 2 418 853 4 304 8 656 8 882 8 847 8 911 10 290 10 884 10 002 10 228 10 694 10 816 11 029
0
2 000
4 000
6 000
8 000
10 000
12 000
Nu
mb
er
of
So
uth
Afr
ica
n r
es
ide
nts
in
'0
00
Year
*2014-2016 data excludes travellers in transit
Mode of travel
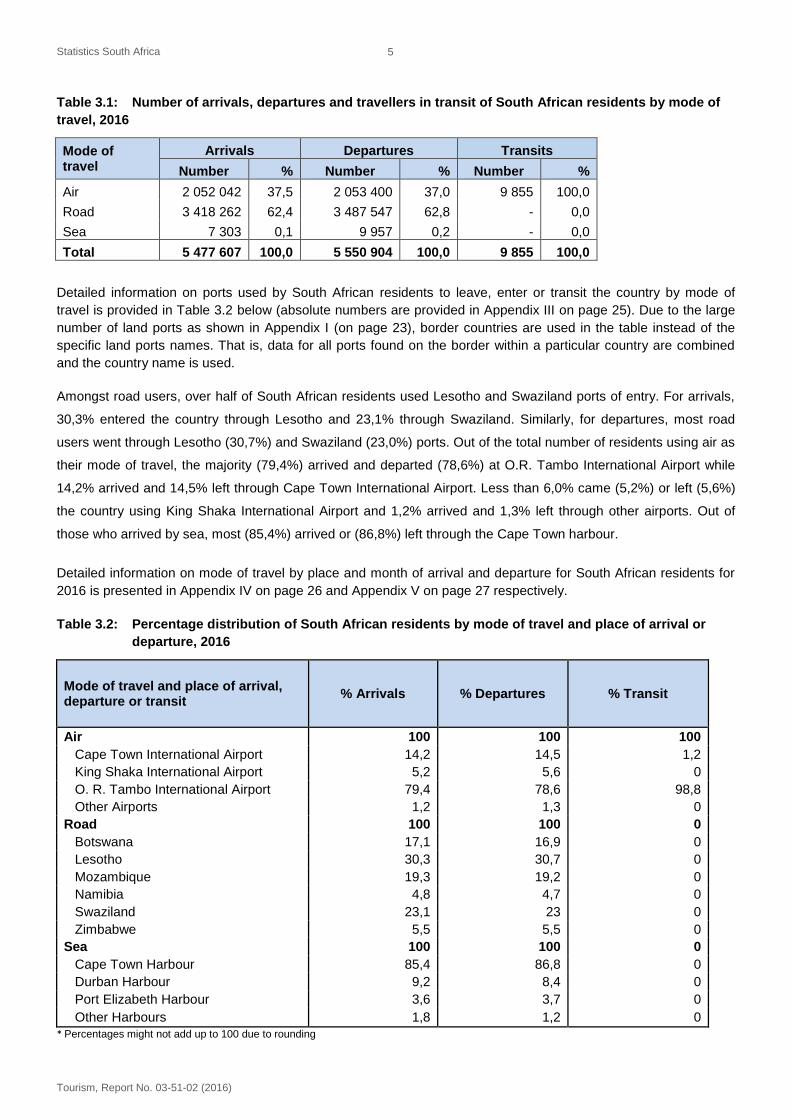
Table 3.1 on page 5 shows that the mode of travel for South African residents entering and leaving the country in
2016 was largely the same. Most South African residents (62,4%) arrived in the country with road transport and
62,8% departed the country with road transport. Air transport was the second most popular mode of travel used by
37,5% arrivals and 37,0% departures. All passengers in transit used air transport (9 855). Less than 1,0% arrived
or left by sea.
Statistics South Africa
Tourism, Report No. 03-51-02 (2016)
5
Table 3.1: Number of arrivals, departures and travellers in transit of South African residents by mode of
travel, 2016
Mode of travel
Arrivals Departures Transits
Number % Number % Number %
Air 2 052 042 37,5 2 053 400 37,0 9 855 100,0
Road 3 418 262 62,4 3 487 547 62,8 - 0,0
Sea 7 303 0,1 9 957 0,2 - 0,0
Total 5 477 607 100,0 5 550 904 100,0 9 855 100,0
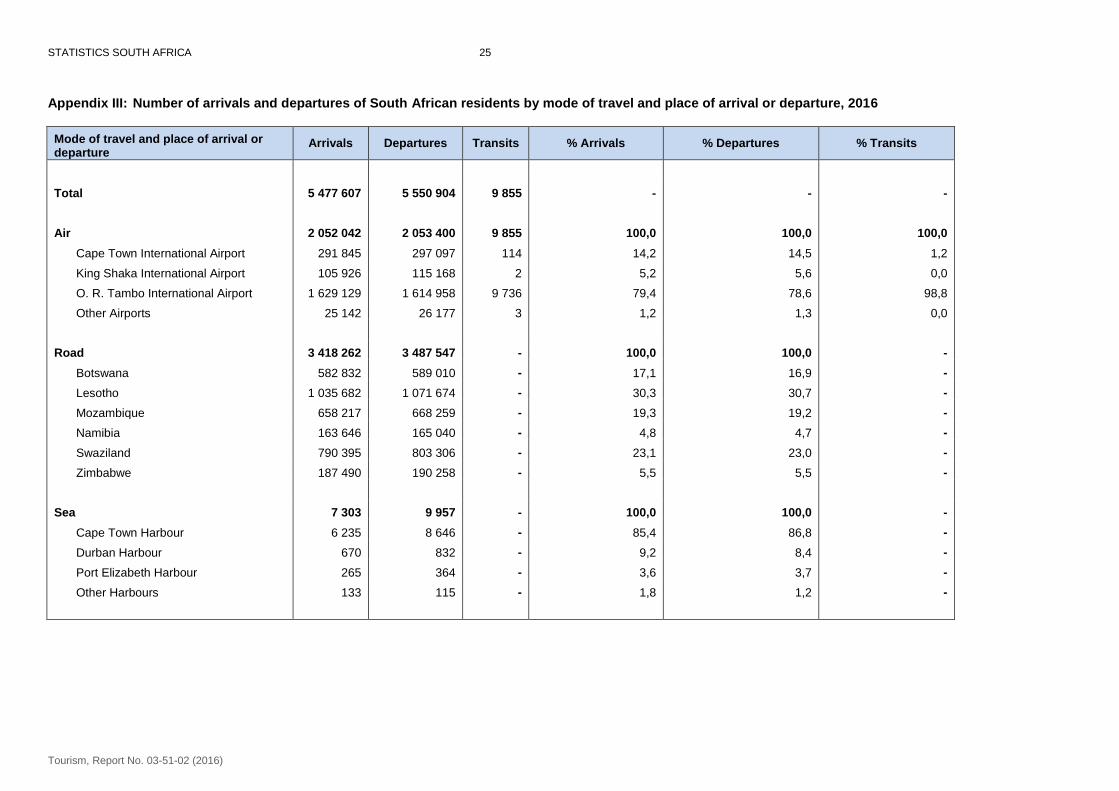
Detailed information on ports used by South African residents to leave, enter or transit the country by mode of
travel is provided in Table 3.2 below (absolute numbers are provided in Appendix III on page 25). Due to the large
number of land ports as shown in Appendix I (on page 23), border countries are used in the table instead of the
specific land ports names. That is, data for all ports found on the border within a particular country are combined
and the country name is used.
Amongst road users, over half of South African residents used Lesotho and Swaziland ports of entry. For arrivals,
30,3% entered the country through Lesotho and 23,1% through Swaziland. Similarly, for departures, most road
users went through Lesotho (30,7%) and Swaziland (23,0%) ports. Out of the total number of residents using air as
their mode of travel, the majority (79,4%) arrived and departed (78,6%) at O.R. Tambo International Airport while
14,2% arrived and 14,5% left through Cape Town International Airport. Less than 6,0% came (5,2%) or left (5,6%)
the country using King Shaka International Airport and 1,2% arrived and 1,3% left through other airports. Out of
those who arrived by sea, most (85,4%) arrived or (86,8%) left through the Cape Town harbour.
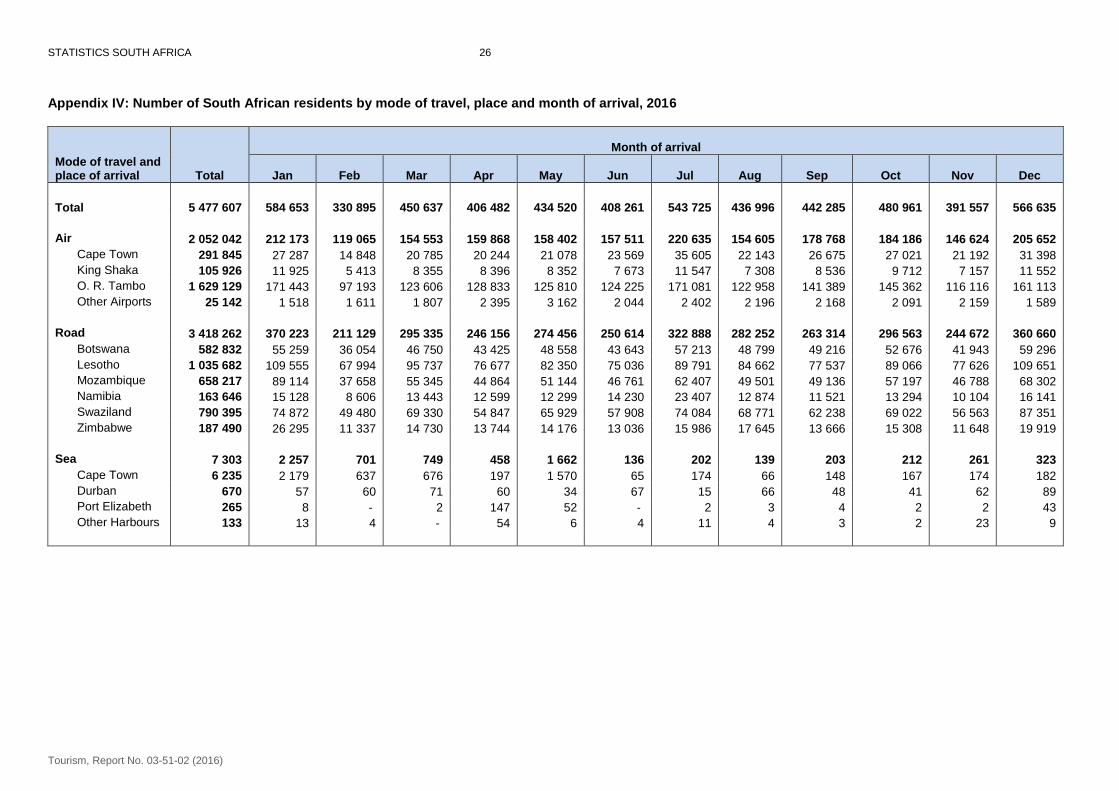
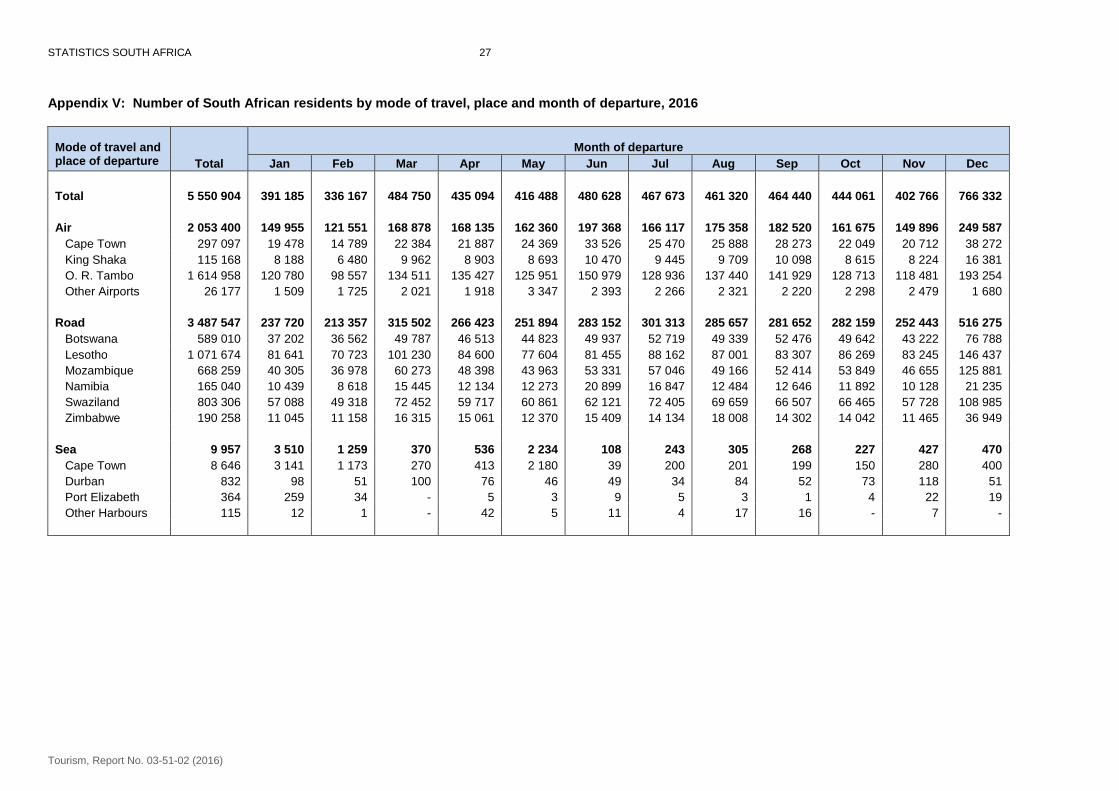
Detailed information on mode of travel by place and month of arrival and departure for South African residents for
2016 is presented in Appendix IV on page 26 and Appendix V on page 27 respectively.
Table 3.2: Percentage distribution of South African residents by mode of travel and place of arrival or
departure, 2016
Mode of travel and place of arrival, departure or transit
% Arrivals % Departures % Transit
Air 100 100 100
Cape Town International Airport 14,2 14,5 1,2
King Shaka International Airport 5,2 5,6 0
O. R. Tambo International Airport 79,4 78,6 98,8
Other Airports 1,2 1,3 0
Road 100 100 0
Botswana 17,1 16,9 0
Lesotho 30,3 30,7 0
Mozambique 19,3 19,2 0
Namibia 4,8 4,7 0
Swaziland 23,1 23 0
Zimbabwe 5,5 5,5 0
Sea 100 100 0
Cape Town Harbour 85,4 86,8 0
Durban Harbour 9,2 8,4 0
Port Elizabeth Harbour 3,6 3,7 0
Other Harbours 1,8 1,2 0
* Percentages might not add up to 100 due to rounding
Statistics South Africa
Tourism, Report No. 03-51-02 (2016)
6
Month of travel
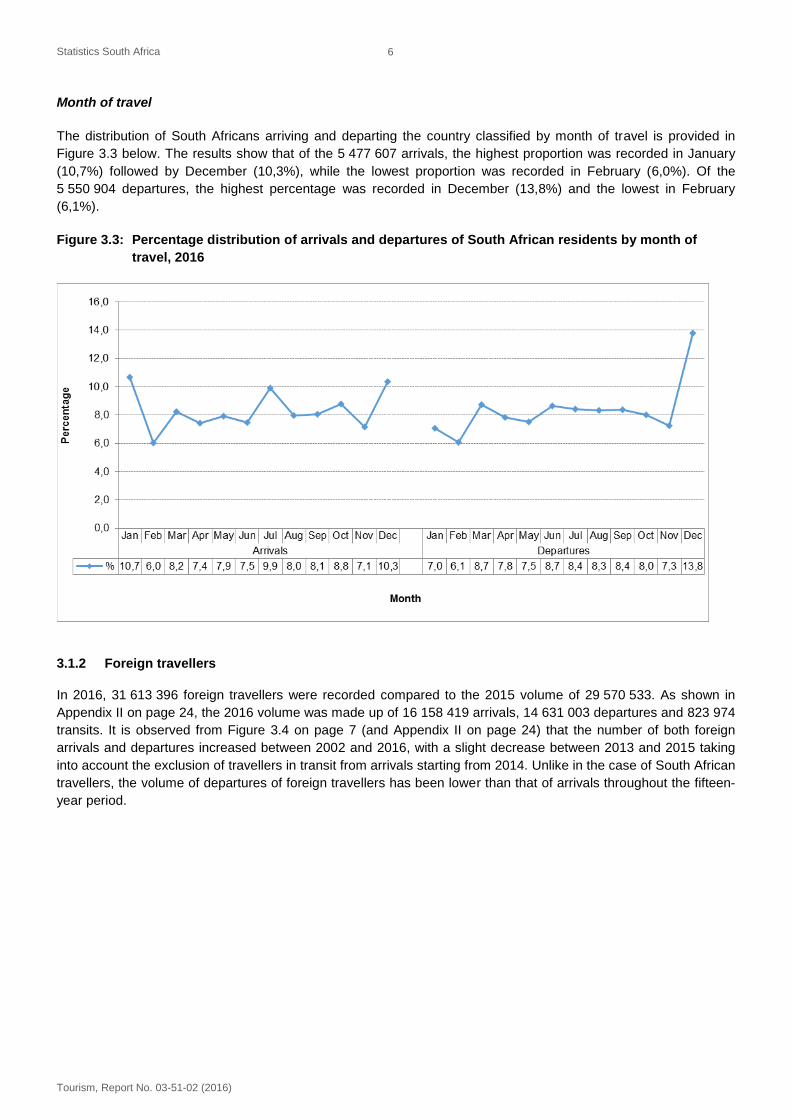
The distribution of South Africans arriving and departing the country classified by month of travel is provided in
Figure 3.3 below. The results show that of the 5 477 607 arrivals, the highest proportion was recorded in January
(10,7%) followed by December (10,3%), while the lowest proportion was recorded in February (6,0%). Of the
5 550 904 departures, the highest percentage was recorded in December (13,8%) and the lowest in February
(6,1%).
Figure 3.3: Percentage distribution of arrivals and departures of South African residents by month of
travel, 2016
3.1.2 Foreign travellers
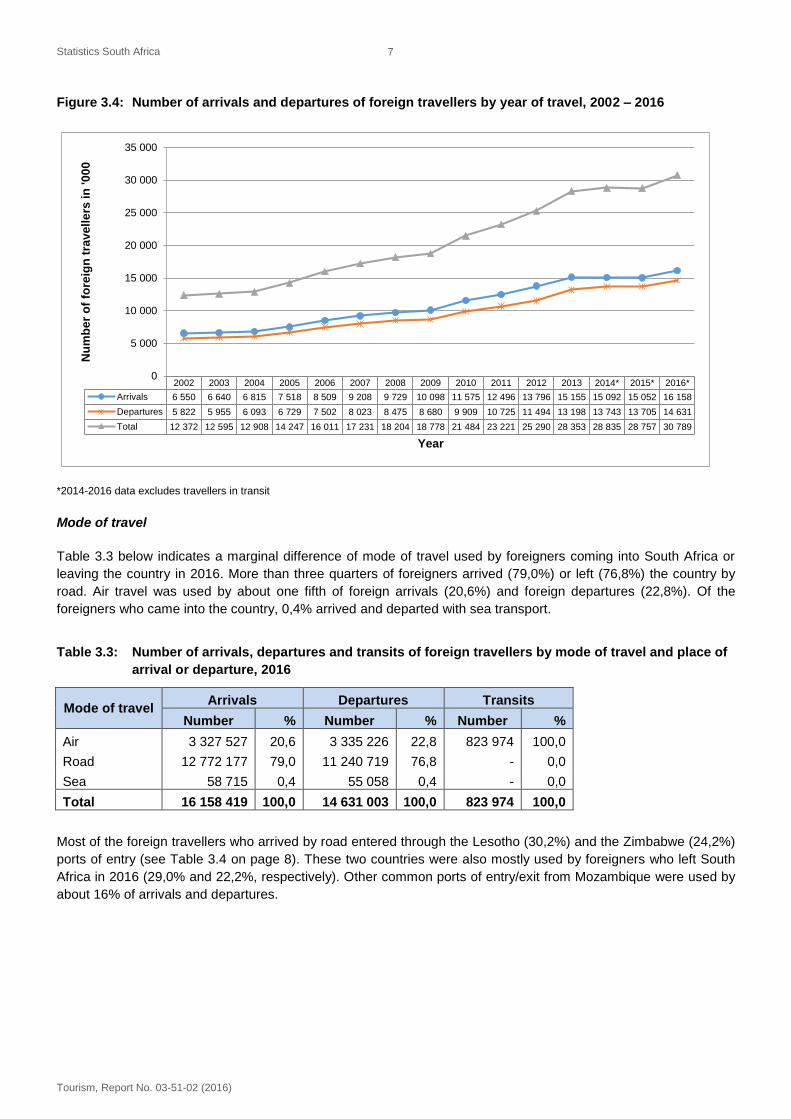
In 2016, 31 613 396 foreign travellers were recorded compared to the 2015 volume of 29 570 533. As shown in
Appendix II on page 24, the 2016 volume was made up of 16 158 419 arrivals, 14 631 003 departures and 823 974
transits. It is observed from Figure 3.4 on page 7 (and Appendix II on page 24) that the number of both foreign
arrivals and departures increased between 2002 and 2016, with a slight decrease between 2013 and 2015 taking
into account the exclusion of travellers in transit from arrivals starting from 2014. Unlike in the case of South African
travellers, the volume of departures of foreign travellers has been lower than that of arrivals throughout the fifteen-
year period.
Statistics South Africa
Tourism, Report No. 03-51-02 (2016)
7
Figure 3.4: Number of arrivals and departures of foreign travellers by year of travel, 2002 – 2016
2002 2003 2004 2005 2006 2007 2008 2009 2010 2011 2012 2013 2014* 2015* 2016*
Arrivals 6 550 6 640 6 815 7 518 8 509 9 208 9 729 10 098 11 575 12 496 13 796 15 155 15 092 15 052 16 158
Departures 5 822 5 955 6 093 6 729 7 502 8 023 8 475 8 680 9 909 10 725 11 494 13 198 13 743 13 705 14 631
Total 12 372 12 595 12 908 14 247 16 011 17 231 18 204 18 778 21 484 23 221 25 290 28 353 28 835 28 757 30 789
0
5 000
10 000
15 000
20 000
25 000
30 000
35 000
Nu
mb
er
of
fore
ign
tra
ve
lle
rs in
'0
00
Year
*2014-2016 data excludes travellers in transit
Mode of travel
Table 3.3 below indicates a marginal difference of mode of travel used by foreigners coming into South Africa or
leaving the country in 2016. More than three quarters of foreigners arrived (79,0%) or left (76,8%) the country by
road. Air travel was used by about one fifth of foreign arrivals (20,6%) and foreign departures (22,8%). Of the
foreigners who came into the country, 0,4% arrived and departed with sea transport.
Table 3.3: Number of arrivals, departures and transits of foreign travellers by mode of travel and place of
arrival or departure, 2016
Mode of travel Arrivals Departures Transits
Number % Number % Number %
Air 3 327 527 20,6 3 335 226 22,8 823 974 100,0
Road 12 772 177 79,0 11 240 719 76,8 - 0,0
Sea 58 715 0,4 55 058 0,4 - 0,0
Total 16 158 419 100,0 14 631 003 100,0 823 974 100,0
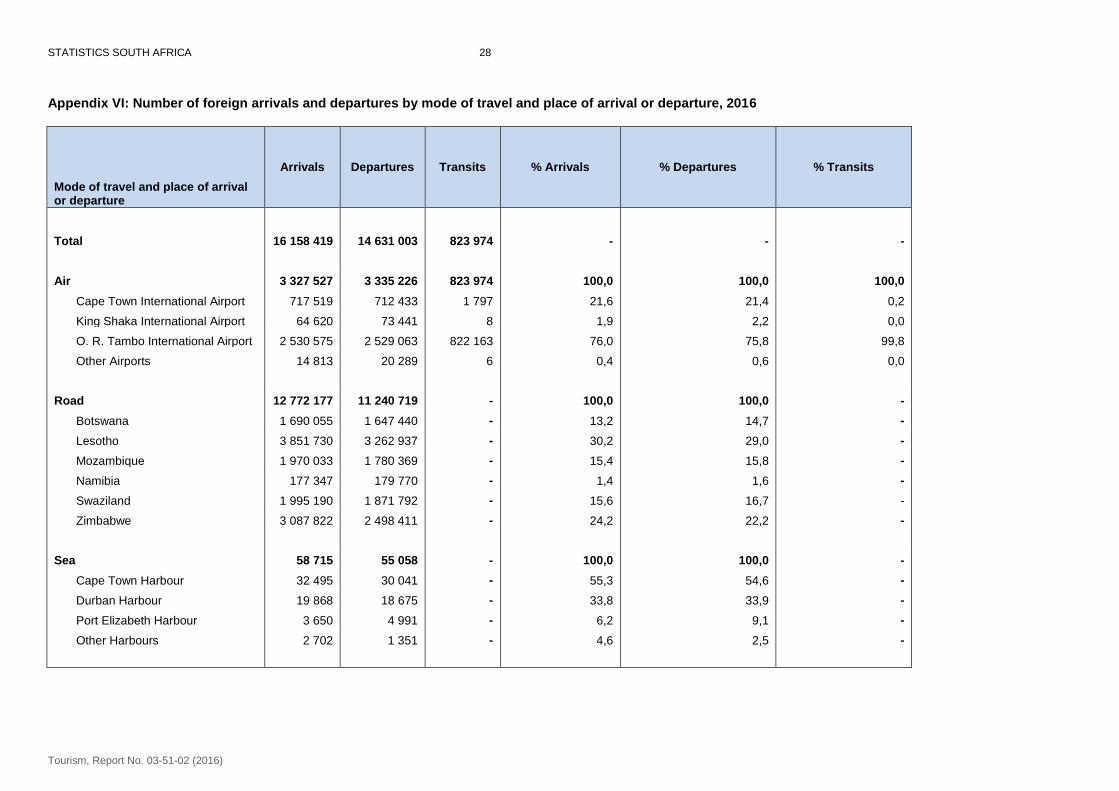
Most of the foreign travellers who arrived by road entered through the Lesotho (30,2%) and the Zimbabwe (24,2%)
ports of entry (see Table 3.4 on page 8). These two countries were also mostly used by foreigners who left South
Africa in 2016 (29,0% and 22,2%, respectively). Other common ports of entry/exit from Mozambique were used by
about 16% of arrivals and departures.
Statistics South Africa
Tourism, Report No. 03-51-02 (2016)
8
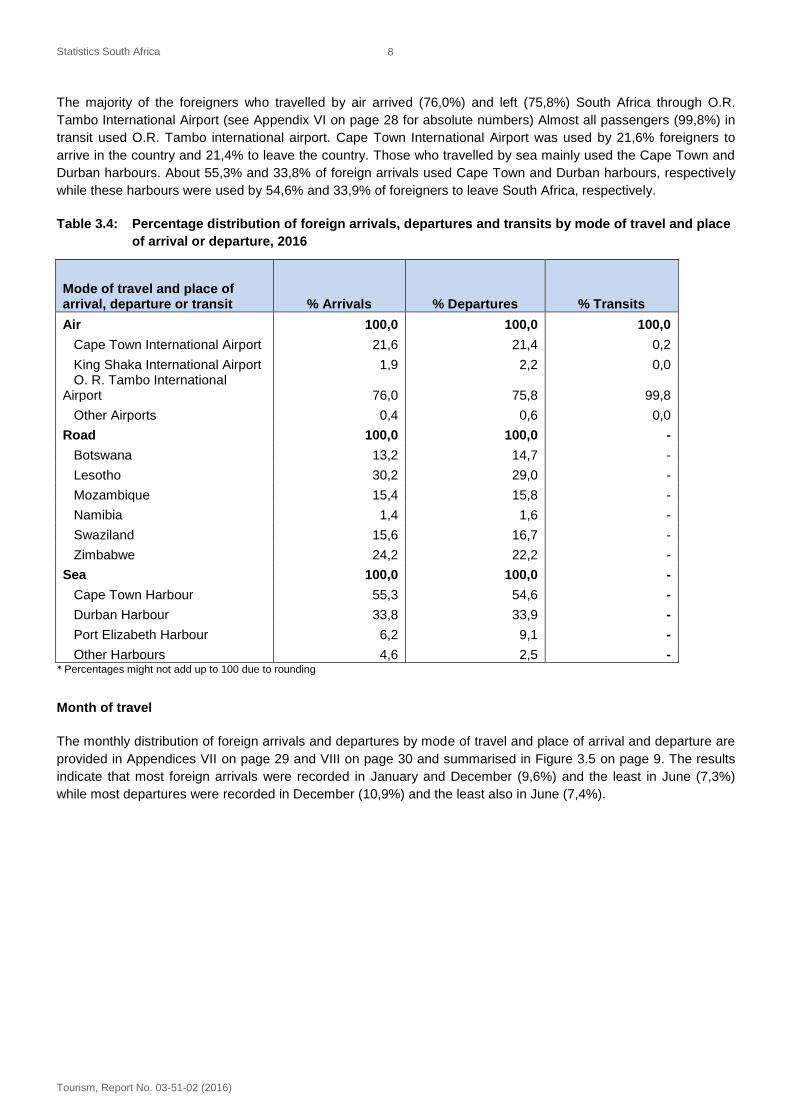
The majority of the foreigners who travelled by air arrived (76,0%) and left (75,8%) South Africa through O.R.
Tambo International Airport (see Appendix VI on page 28 for absolute numbers) Almost all passengers (99,8%) in
transit used O.R. Tambo international airport. Cape Town International Airport was used by 21,6% foreigners to
arrive in the country and 21,4% to leave the country. Those who travelled by sea mainly used the Cape Town and
Durban harbours. About 55,3% and 33,8% of foreign arrivals used Cape Town and Durban harbours, respectively
while these harbours were used by 54,6% and 33,9% of foreigners to leave South Africa, respectively.
Table 3.4: Percentage distribution of foreign arrivals, departures and transits by mode of travel and place
of arrival or departure, 2016
Mode of travel and place of arrival, departure or transit % Arrivals % Departures % Transits
Air 100,0 100,0 100,0
Cape Town International Airport 21,6 21,4 0,2
King Shaka International Airport 1,9 2,2 0,0 O. R. Tambo International Airport 76,0 75,8 99,8
Other Airports 0,4 0,6 0,0
Road 100,0 100,0 -
Botswana 13,2 14,7 -
Lesotho 30,2 29,0 -
Mozambique 15,4 15,8 -
Namibia 1,4 1,6 -
Swaziland 15,6 16,7 -
Zimbabwe 24,2 22,2 -
Sea 100,0 100,0 -
Cape Town Harbour 55,3 54,6 -
Durban Harbour 33,8 33,9 -
Port Elizabeth Harbour 6,2 9,1 -
Other Harbours 4,6 2,5 - * Percentages might not add up to 100 due to rounding
Month of travel
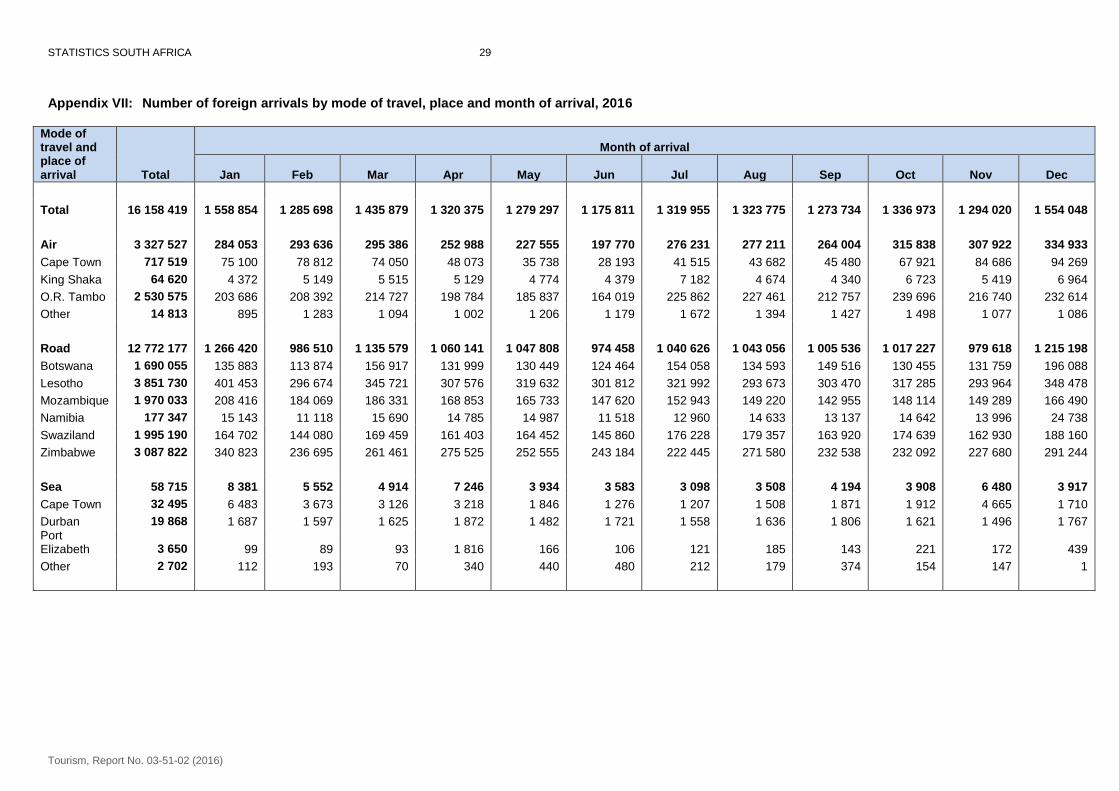
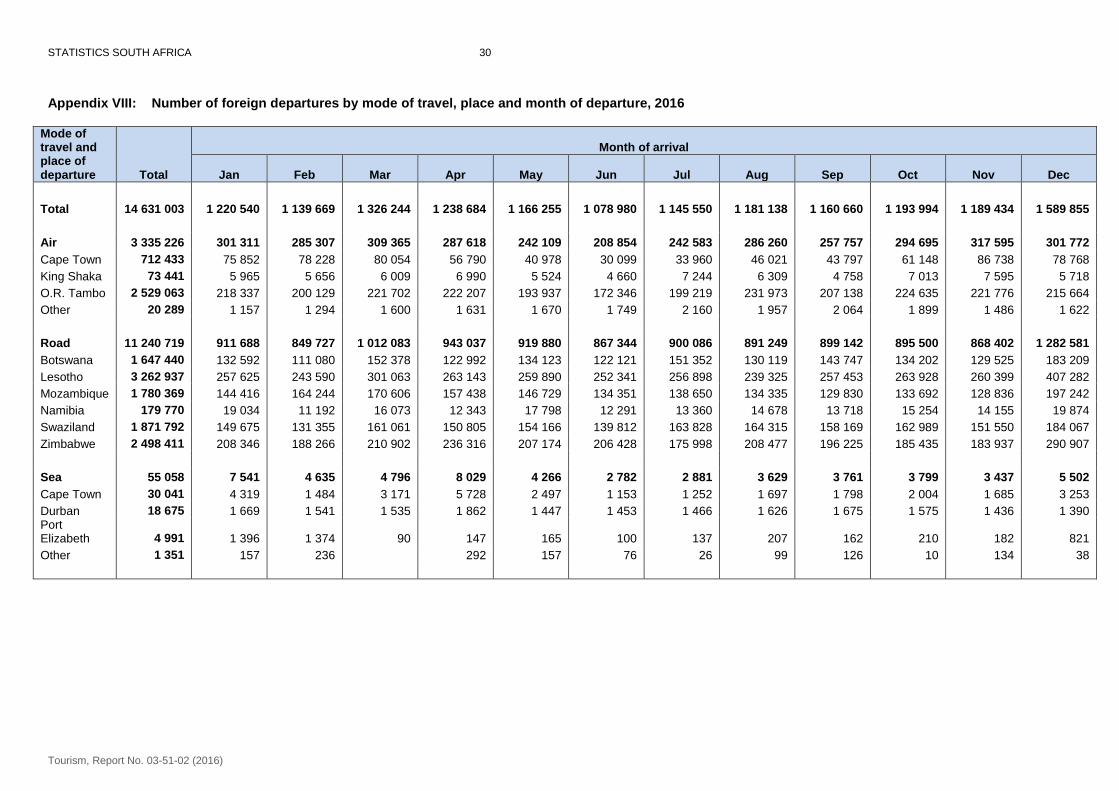
The monthly distribution of foreign arrivals and departures by mode of travel and place of arrival and departure are
provided in Appendices VII on page 29 and VIII on page 30 and summarised in Figure 3.5 on page 9. The results
indicate that most foreign arrivals were recorded in January and December (9,6%) and the least in June (7,3%)
while most departures were recorded in December (10,9%) and the least also in June (7,4%).
Statistics South Africa
Tourism, Report No. 03-51-02 (2016)
9
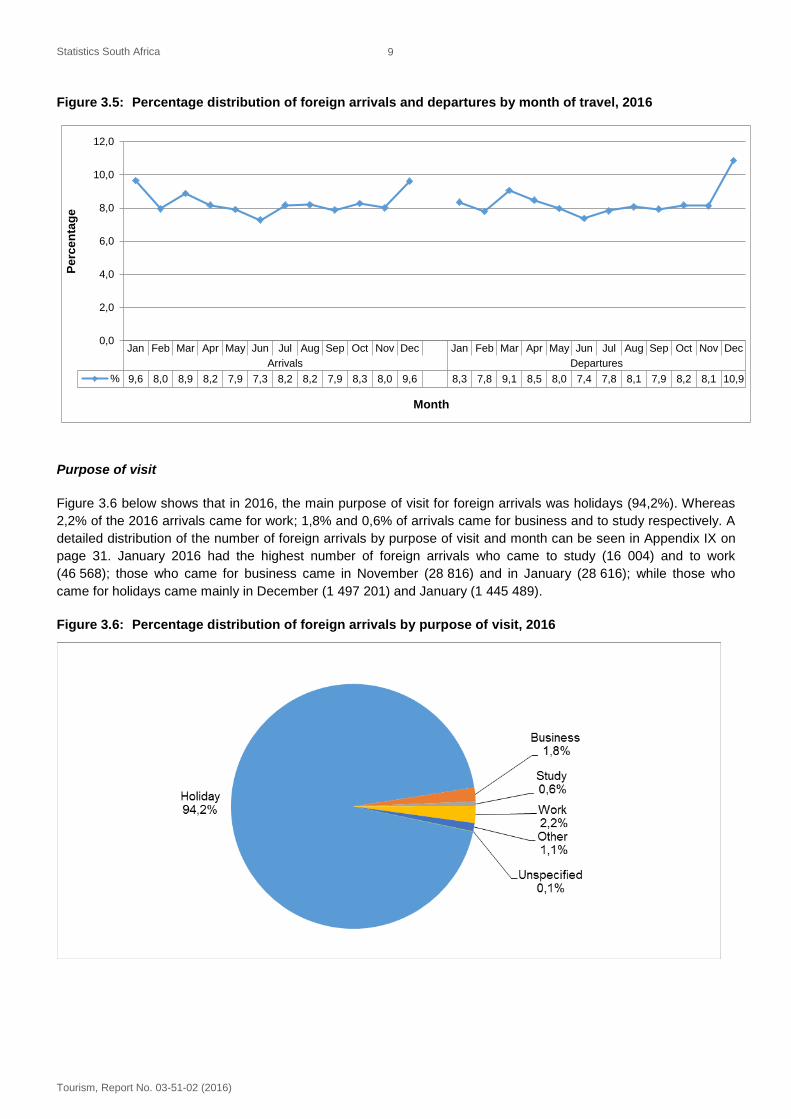
Figure 3.5: Percentage distribution of foreign arrivals and departures by month of travel, 2016
Jan Feb Mar Apr May Jun Jul Aug Sep Oct Nov Dec Jan Feb Mar Apr May Jun Jul Aug Sep Oct Nov Dec
Arrivals Departures
% 9,6 8,0 8,9 8,2 7,9 7,3 8,2 8,2 7,9 8,3 8,0 9,6 8,3 7,8 9,1 8,5 8,0 7,4 7,8 8,1 7,9 8,2 8,1 10,9
0,0
2,0
4,0
6,0
8,0
10,0
12,0
Pe
rce
nta
ge
Month
Purpose of visit
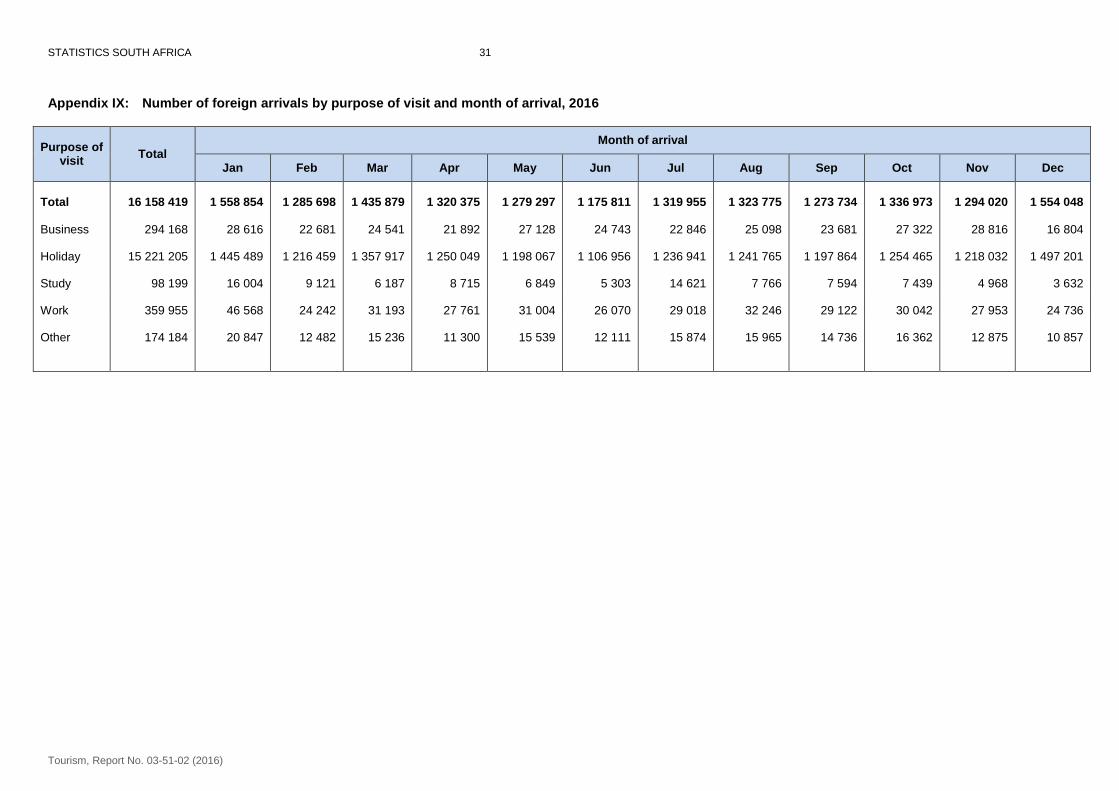
Figure 3.6 below shows that in 2016, the main purpose of visit for foreign arrivals was holidays (94,2%). Whereas
2,2% of the 2016 arrivals came for work; 1,8% and 0,6% of arrivals came for business and to study respectively. A
detailed distribution of the number of foreign arrivals by purpose of visit and month can be seen in Appendix IX on
page 31. January 2016 had the highest number of foreign arrivals who came to study (16 004) and to work
(46 568); those who came for business came in November (28 816) and in January (28 616); while those who
came for holidays came mainly in December (1 497 201) and January (1 445 489).
Figure 3.6: Percentage distribution of foreign arrivals by purpose of visit, 2016
Statistics South Africa
Tourism, Report No. 03-51-02 (2016)
10
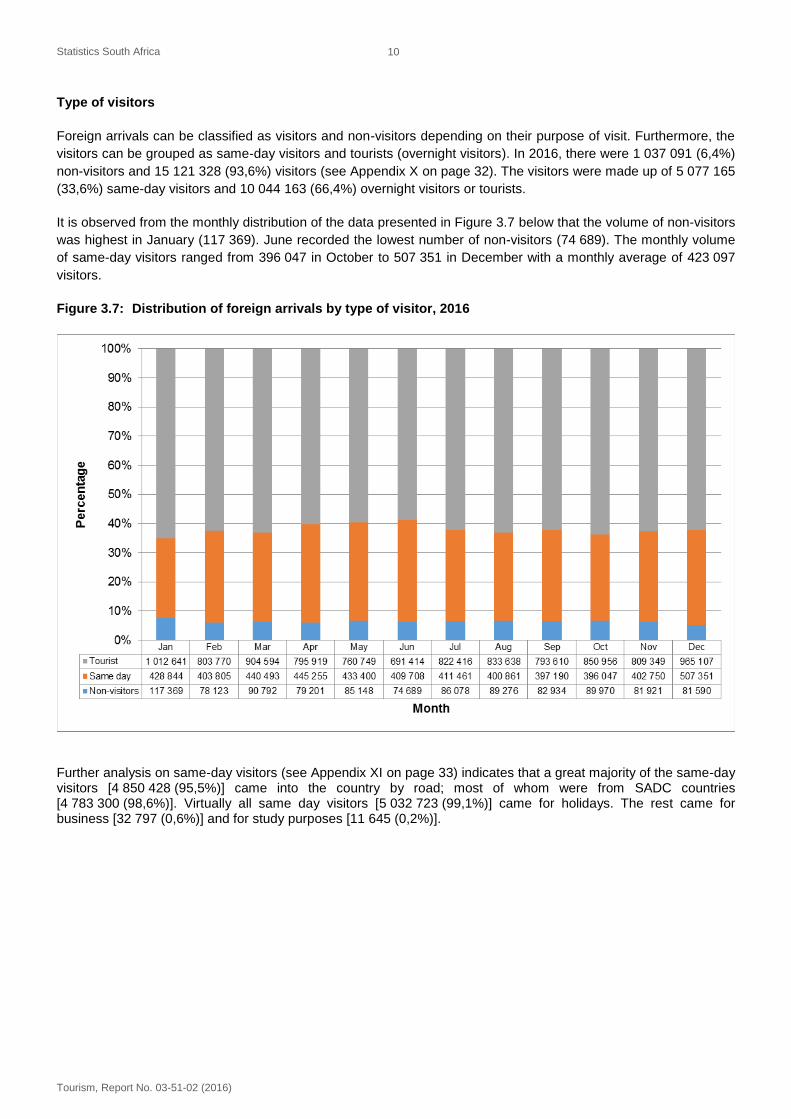
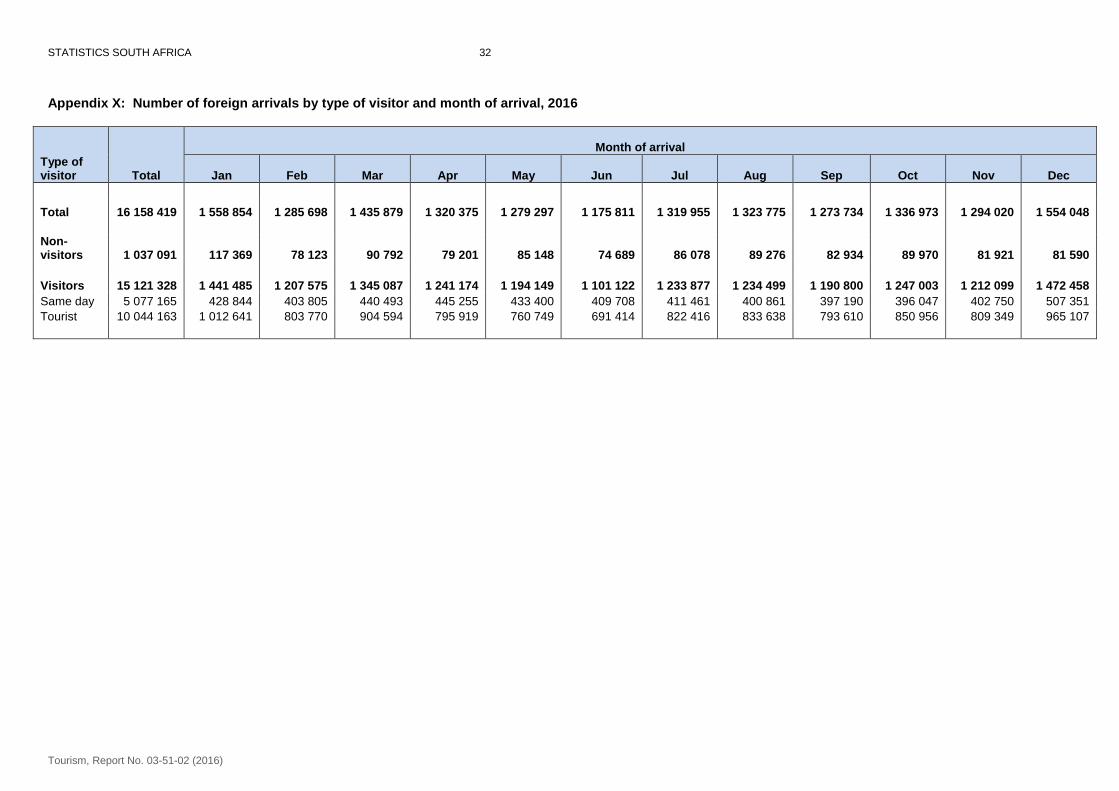
Type of visitors
Foreign arrivals can be classified as visitors and non-visitors depending on their purpose of visit. Furthermore, the
visitors can be grouped as same-day visitors and tourists (overnight visitors). In 2016, there were 1 037 091 (6,4%)
non-visitors and 15 121 328 (93,6%) visitors (see Appendix X on page 32). The visitors were made up of 5 077 165
(33,6%) same-day visitors and 10 044 163 (66,4%) overnight visitors or tourists.
It is observed from the monthly distribution of the data presented in Figure 3.7 below that the volume of non-visitors
was highest in January (117 369). June recorded the lowest number of non-visitors (74 689). The monthly volume
of same-day visitors ranged from 396 047 in October to 507 351 in December with a monthly average of 423 097
visitors.
Figure 3.7: Distribution of foreign arrivals by type of visitor, 2016
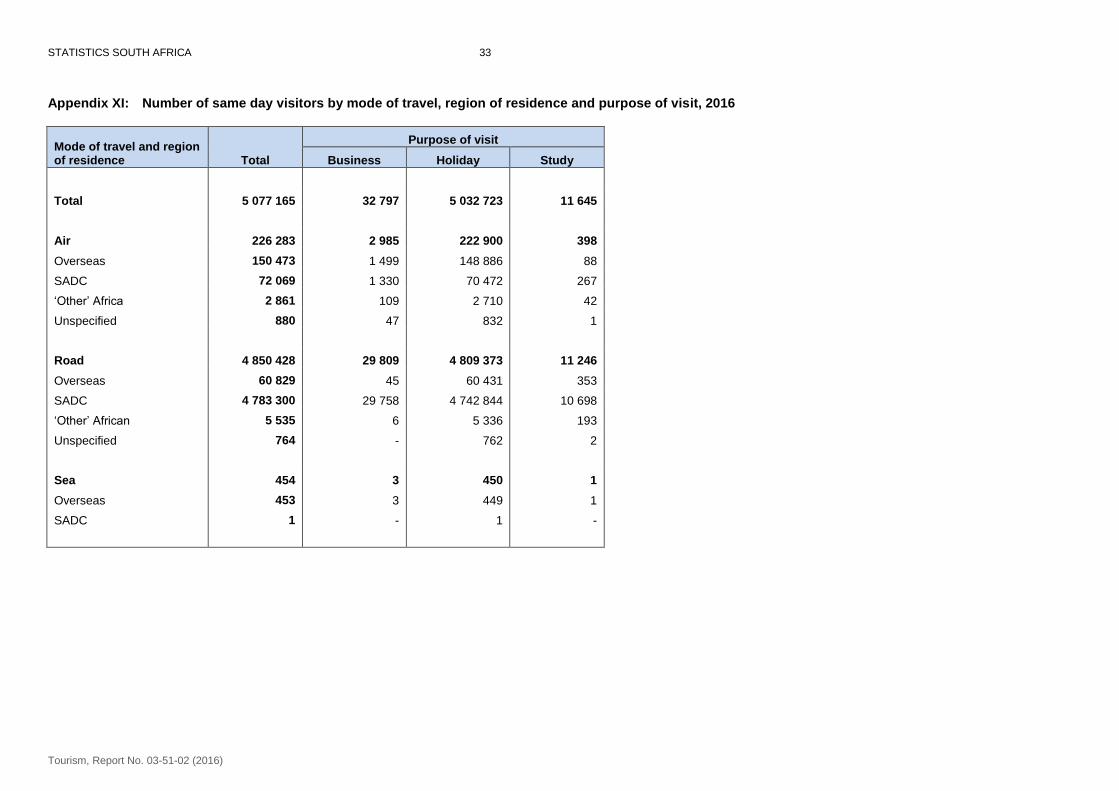
Further analysis on same-day visitors (see Appendix XI on page 33) indicates that a great majority of the same-day visitors [4 850 428 (95,5%)] came into the country by road; most of whom were from SADC countries [4 783 300 (98,6%)]. Virtually all same day visitors [5 032 723 (99,1%)] came for holidays. The rest came for business [32 797 (0,6%)] and for study purposes [11 645 (0,2%)].
Statistics South Africa
Tourism, Report No. 03-51-02 (2016)
11
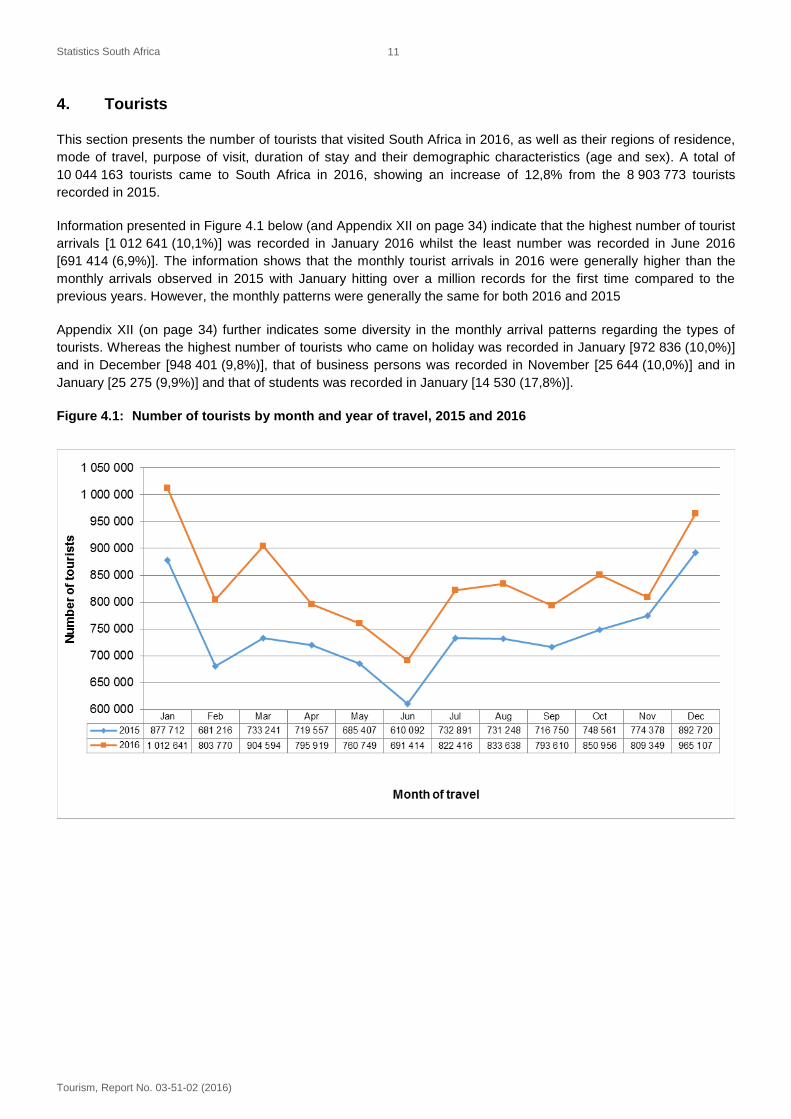
4. Tourists
This section presents the number of tourists that visited South Africa in 2016, as well as their regions of residence,
mode of travel, purpose of visit, duration of stay and their demographic characteristics (age and sex). A total of
10 044 163 tourists came to South Africa in 2016, showing an increase of 12,8% from the 8 903 773 tourists
recorded in 2015.
Information presented in Figure 4.1 below (and Appendix XII on page 34) indicate that the highest number of tourist
arrivals [1 012 641 (10,1%)] was recorded in January 2016 whilst the least number was recorded in June 2016
[691 414 (6,9%)]. The information shows that the monthly tourist arrivals in 2016 were generally higher than the
monthly arrivals observed in 2015 with January hitting over a million records for the first time compared to the
previous years. However, the monthly patterns were generally the same for both 2016 and 2015
Appendix XII (on page 34) further indicates some diversity in the monthly arrival patterns regarding the types of
tourists. Whereas the highest number of tourists who came on holiday was recorded in January [972 836 (10,0%)]
and in December [948 401 (9,8%)], that of business persons was recorded in November [25 644 (10,0%)] and in
January [25 275 (9,9%)] and that of students was recorded in January [14 530 (17,8%)].
Figure 4.1: Number of tourists by month and year of travel, 2015 and 2016
Statistics South Africa
Tourism, Report No. 03-51-02 (2016)
12
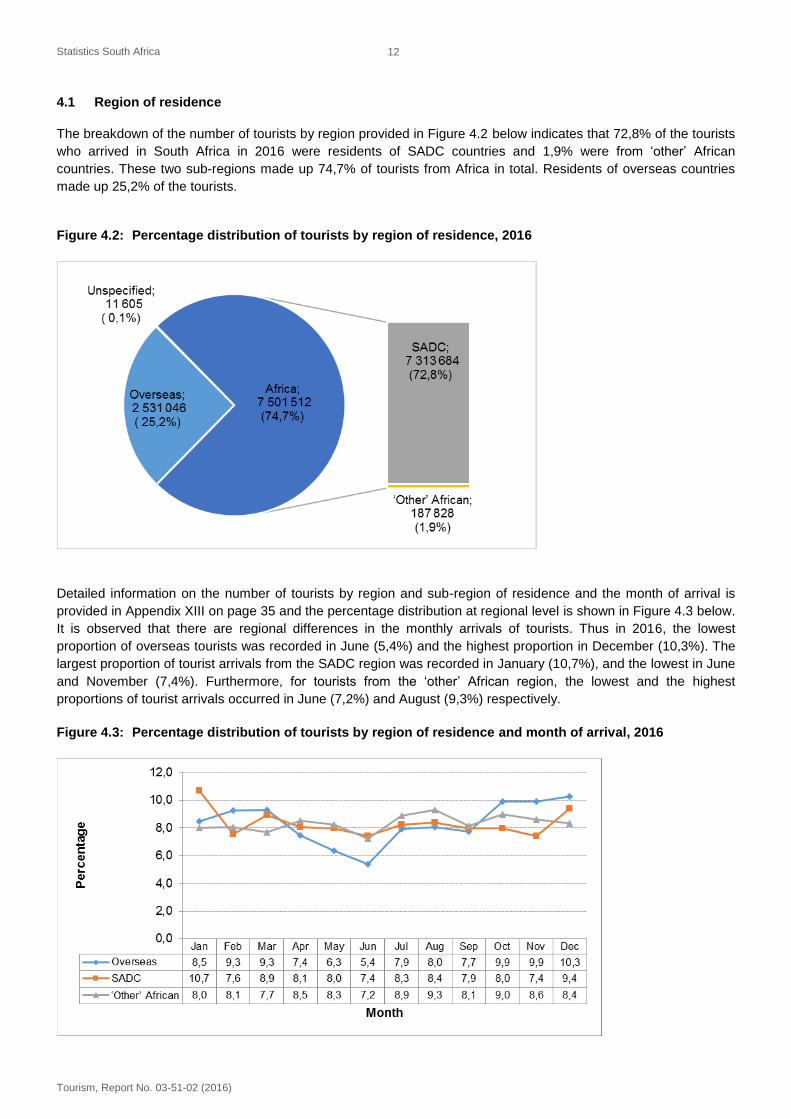
4.1 Region of residence
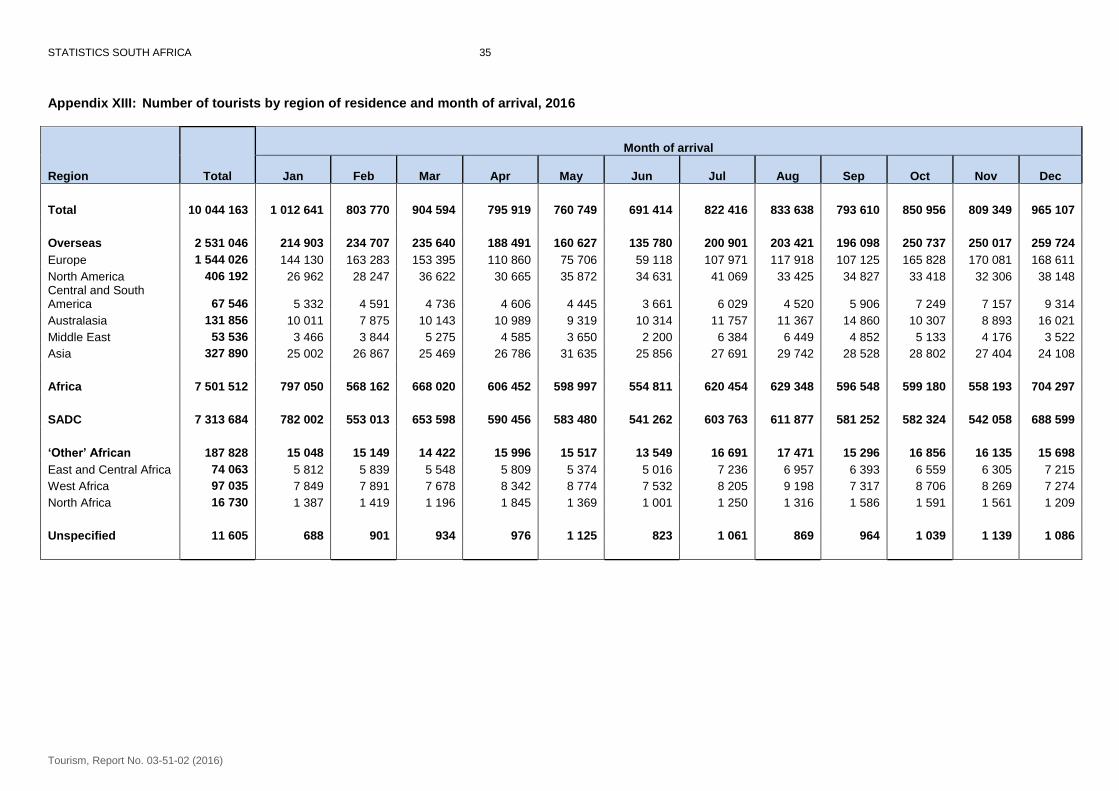
The breakdown of the number of tourists by region provided in Figure 4.2 below indicates that 72,8% of the tourists
who arrived in South Africa in 2016 were residents of SADC countries and 1,9% were from ‘other’ African
countries. These two sub-regions made up 74,7% of tourists from Africa in total. Residents of overseas countries
made up 25,2% of the tourists.
Figure 4.2: Percentage distribution of tourists by region of residence, 2016
Detailed information on the number of tourists by region and sub-region of residence and the month of arrival is
provided in Appendix XIII on page 35 and the percentage distribution at regional level is shown in Figure 4.3 below.
It is observed that there are regional differences in the monthly arrivals of tourists. Thus in 2016, the lowest
proportion of overseas tourists was recorded in June (5,4%) and the highest proportion in December (10,3%). The
largest proportion of tourist arrivals from the SADC region was recorded in January (10,7%), and the lowest in June
and November (7,4%). Furthermore, for tourists from the ‘other’ African region, the lowest and the highest
proportions of tourist arrivals occurred in June (7,2%) and August (9,3%) respectively.
Figure 4.3: Percentage distribution of tourists by region of residence and month of arrival, 2016
Statistics South Africa
Tourism, Report No. 03-51-02 (2016)
13
4.2 Ten leading countries
Overseas
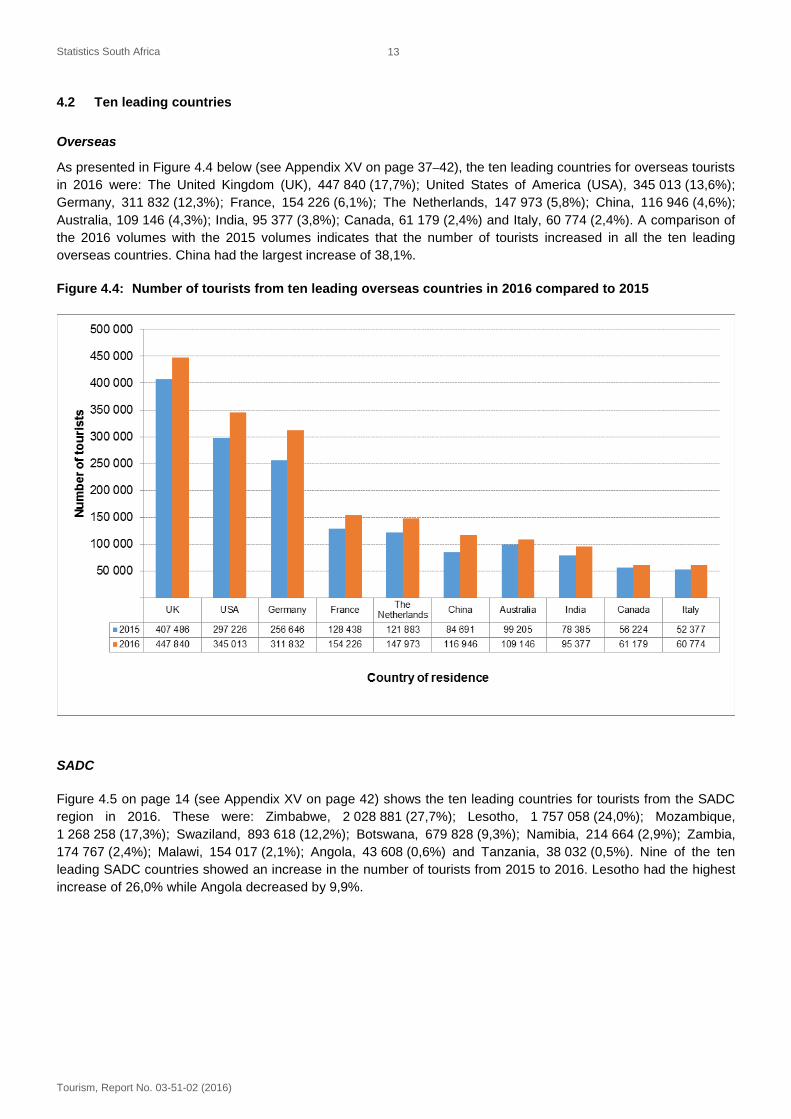
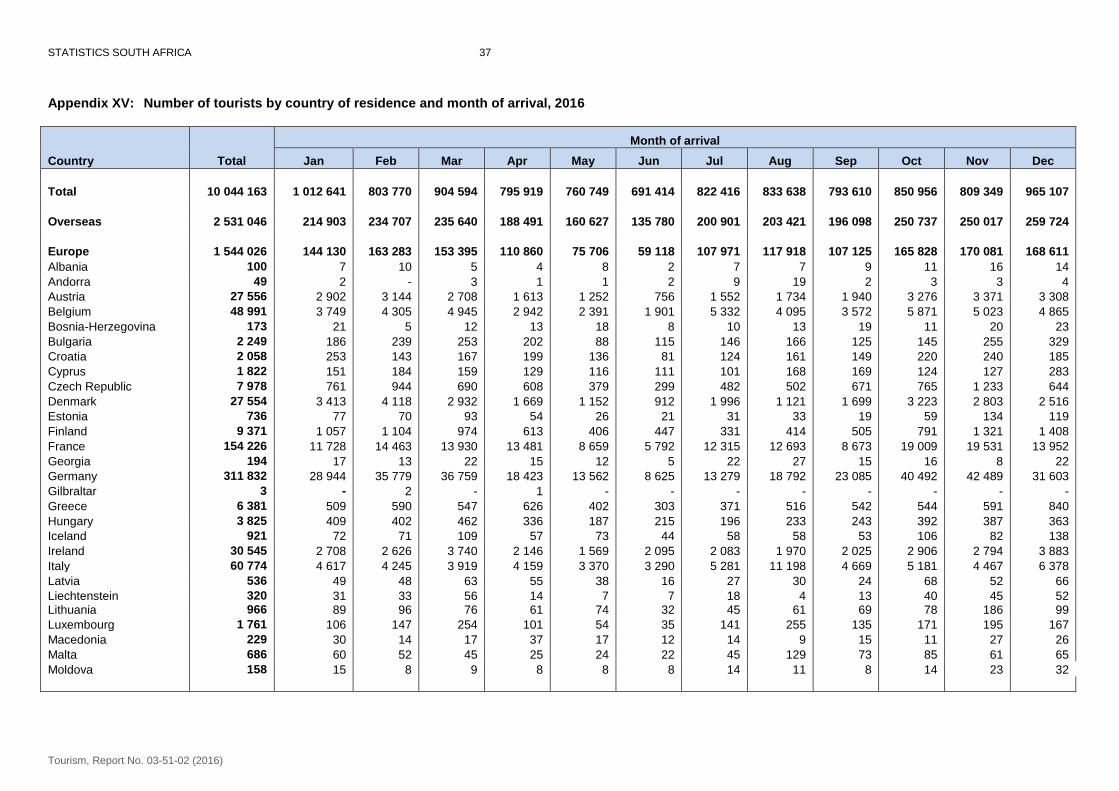
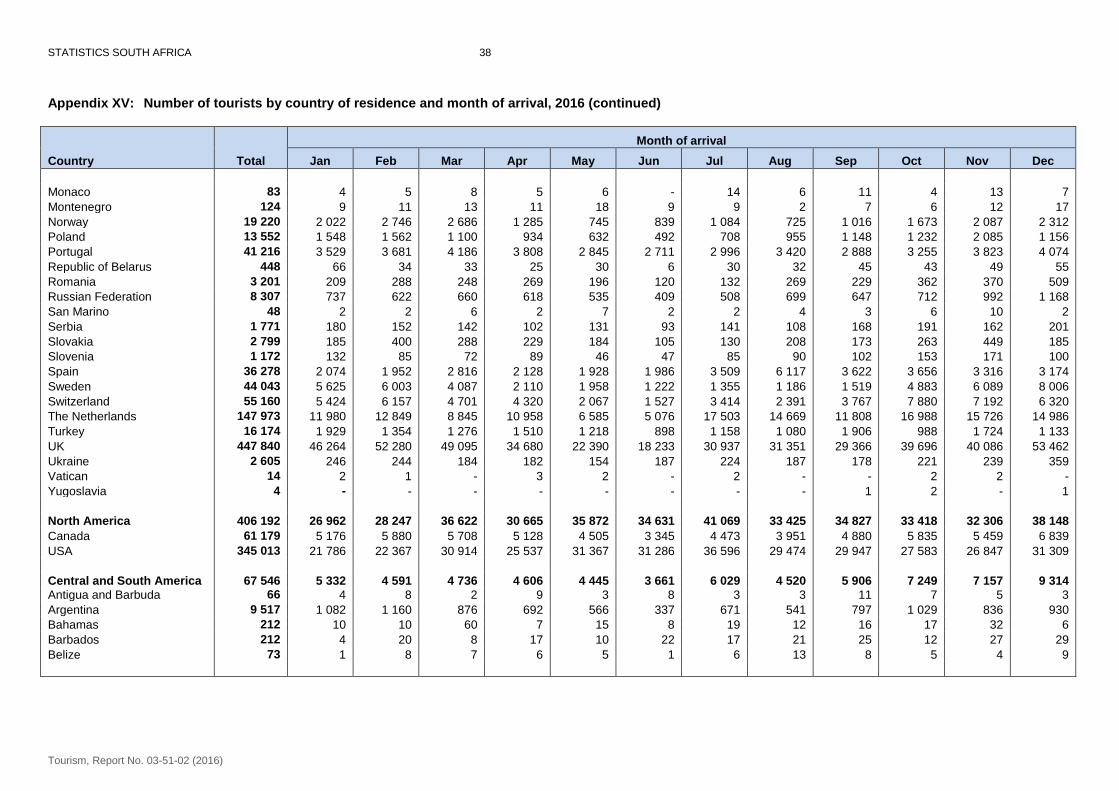
As presented in Figure 4.4 below (see Appendix XV on page 37–42), the ten leading countries for overseas tourists
in 2016 were: The United Kingdom (UK), 447 840 (17,7%); United States of America (USA), 345 013 (13,6%);
Germany, 311 832 (12,3%); France, 154 226 (6,1%); The Netherlands, 147 973 (5,8%); China, 116 946 (4,6%);
Australia, 109 146 (4,3%); India, 95 377 (3,8%); Canada, 61 179 (2,4%) and Italy, 60 774 (2,4%). A comparison of
the 2016 volumes with the 2015 volumes indicates that the number of tourists increased in all the ten leading
overseas countries. China had the largest increase of 38,1%.
Figure 4.4: Number of tourists from ten leading overseas countries in 2016 compared to 2015
SADC
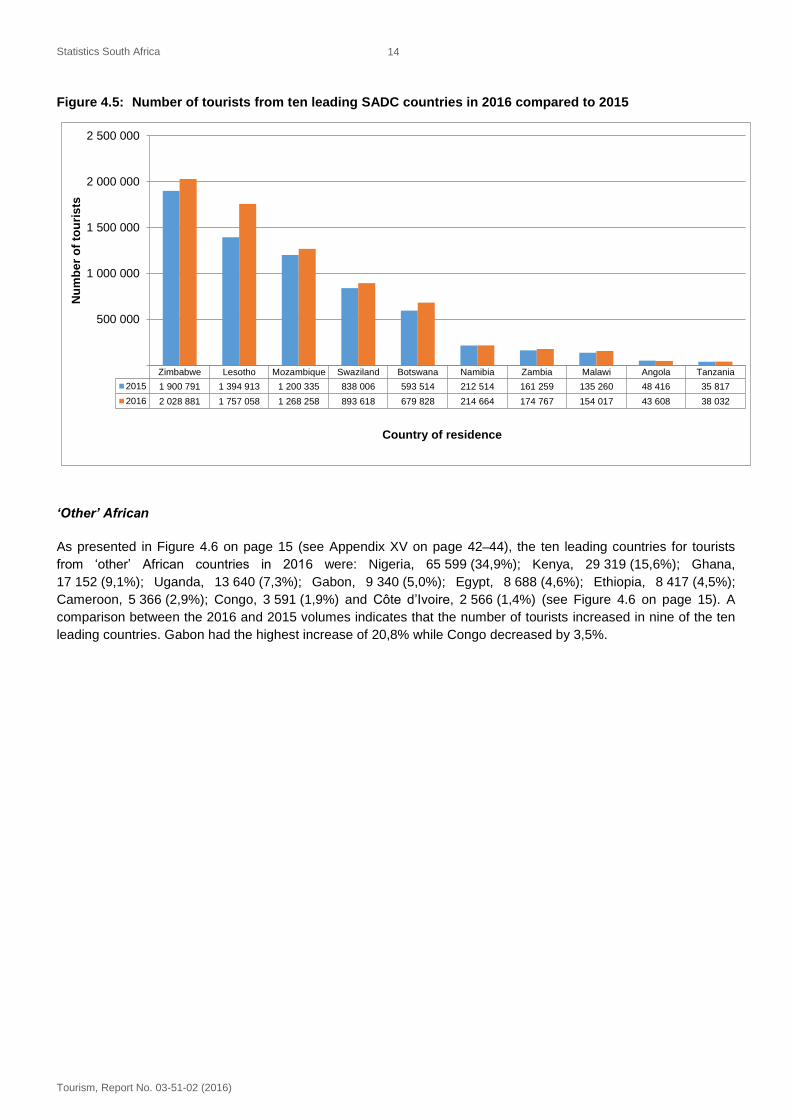
Figure 4.5 on page 14 (see Appendix XV on page 42) shows the ten leading countries for tourists from the SADC
region in 2016. These were: Zimbabwe, 2 028 881 (27,7%); Lesotho, 1 757 058 (24,0%); Mozambique,
1 268 258 (17,3%); Swaziland, 893 618 (12,2%); Botswana, 679 828 (9,3%); Namibia, 214 664 (2,9%); Zambia,
174 767 (2,4%); Malawi, 154 017 (2,1%); Angola, 43 608 (0,6%) and Tanzania, 38 032 (0,5%). Nine of the ten
leading SADC countries showed an increase in the number of tourists from 2015 to 2016. Lesotho had the highest
increase of 26,0% while Angola decreased by 9,9%.
Statistics South Africa
Tourism, Report No. 03-51-02 (2016)
14
Figure 4.5: Number of tourists from ten leading SADC countries in 2016 compared to 2015
Zimbabwe Lesotho Mozambique Swaziland Botswana Namibia Zambia Malawi Angola Tanzania
2015 1 900 791 1 394 913 1 200 335 838 006 593 514 212 514 161 259 135 260 48 416 35 817
2016 2 028 881 1 757 058 1 268 258 893 618 679 828 214 664 174 767 154 017 43 608 38 032
500 000
1 000 000
1 500 000
2 000 000
2 500 000
Nu
mb
er
of
tou
ris
ts
Country of residence
‘Other’ African
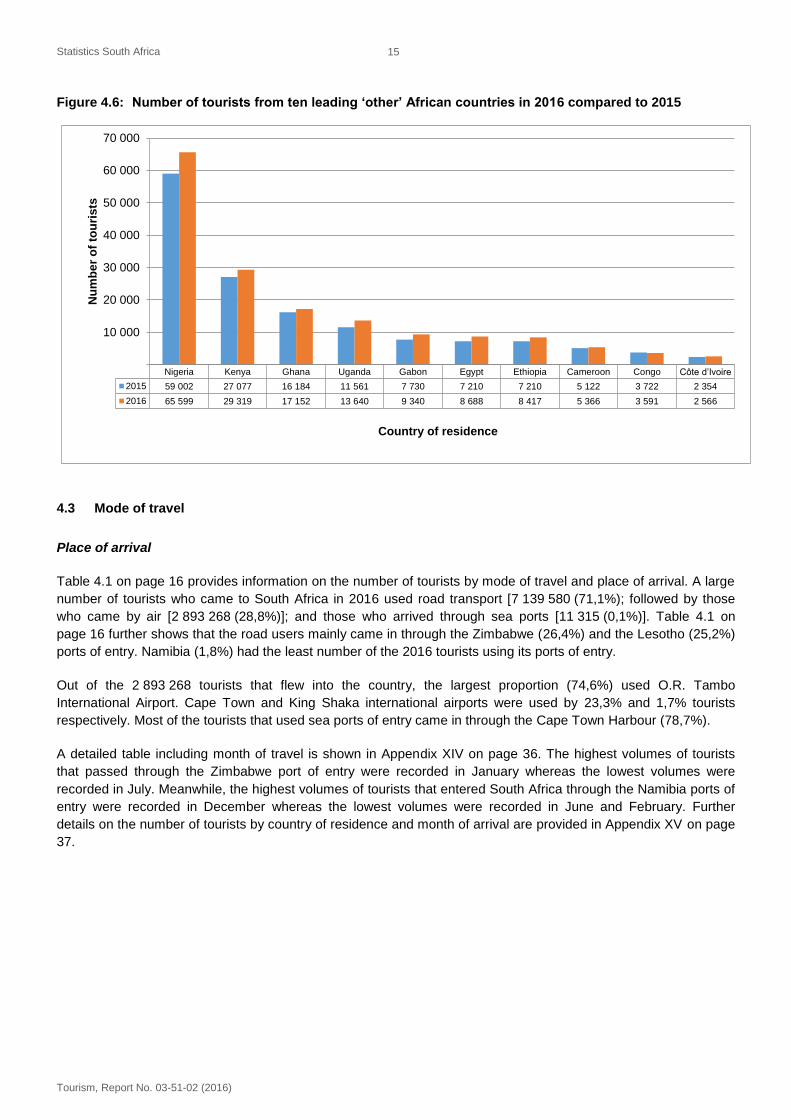
As presented in Figure 4.6 on page 15 (see Appendix XV on page 42–44), the ten leading countries for tourists
from ‘other’ African countries in 2016 were: Nigeria, 65 599 (34,9%); Kenya, 29 319 (15,6%); Ghana,
17 152 (9,1%); Uganda, 13 640 (7,3%); Gabon, 9 340 (5,0%); Egypt, 8 688 (4,6%); Ethiopia, 8 417 (4,5%);
Cameroon, 5 366 (2,9%); Congo, 3 591 (1,9%) and Côte d’Ivoire, 2 566 (1,4%) (see Figure 4.6 on page 15). A
comparison between the 2016 and 2015 volumes indicates that the number of tourists increased in nine of the ten
leading countries. Gabon had the highest increase of 20,8% while Congo decreased by 3,5%.
Statistics South Africa
Tourism, Report No. 03-51-02 (2016)
15
Figure 4.6: Number of tourists from ten leading ‘other’ African countries in 2016 compared to 2015
Nigeria Kenya Ghana Uganda Gabon Egypt Ethiopia Cameroon Congo Côte d’Ivoire
2015 59 002 27 077 16 184 11 561 7 730 7 210 7 210 5 122 3 722 2 354
2016 65 599 29 319 17 152 13 640 9 340 8 688 8 417 5 366 3 591 2 566
10 000
20 000
30 000
40 000
50 000
60 000
70 000
Nu
mb
er
of
tou
ris
ts
Country of residence
4.3 Mode of travel
Place of arrival
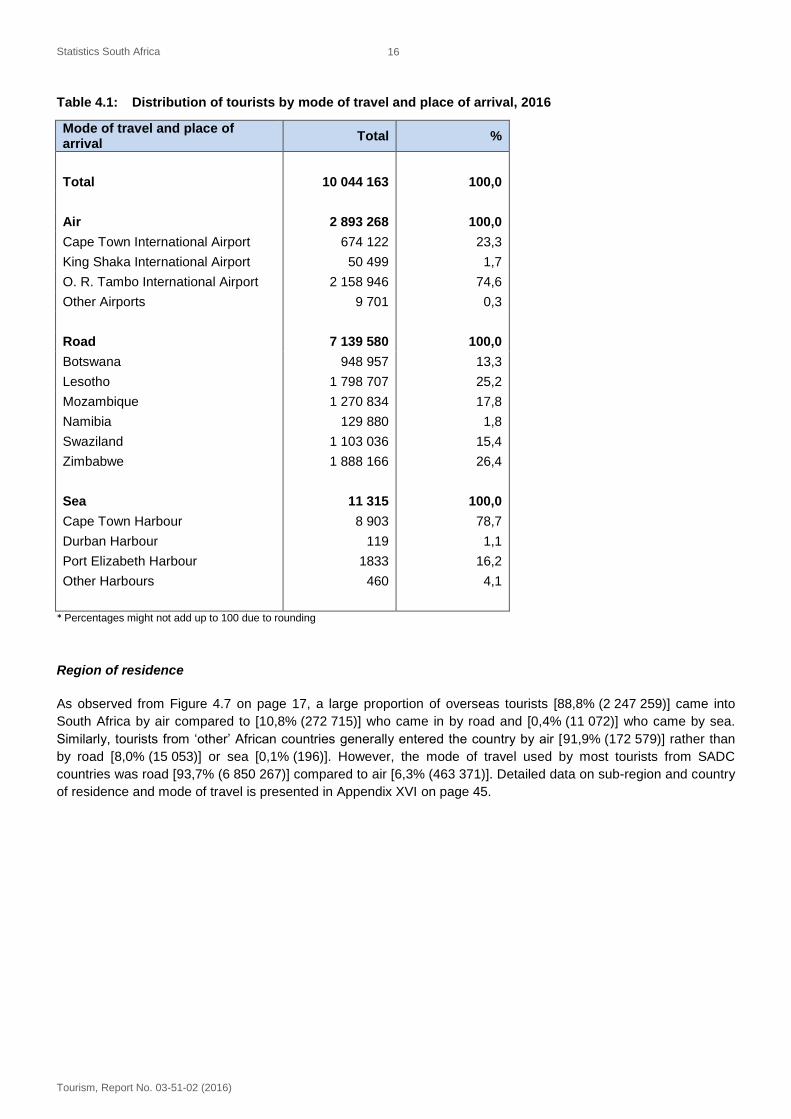
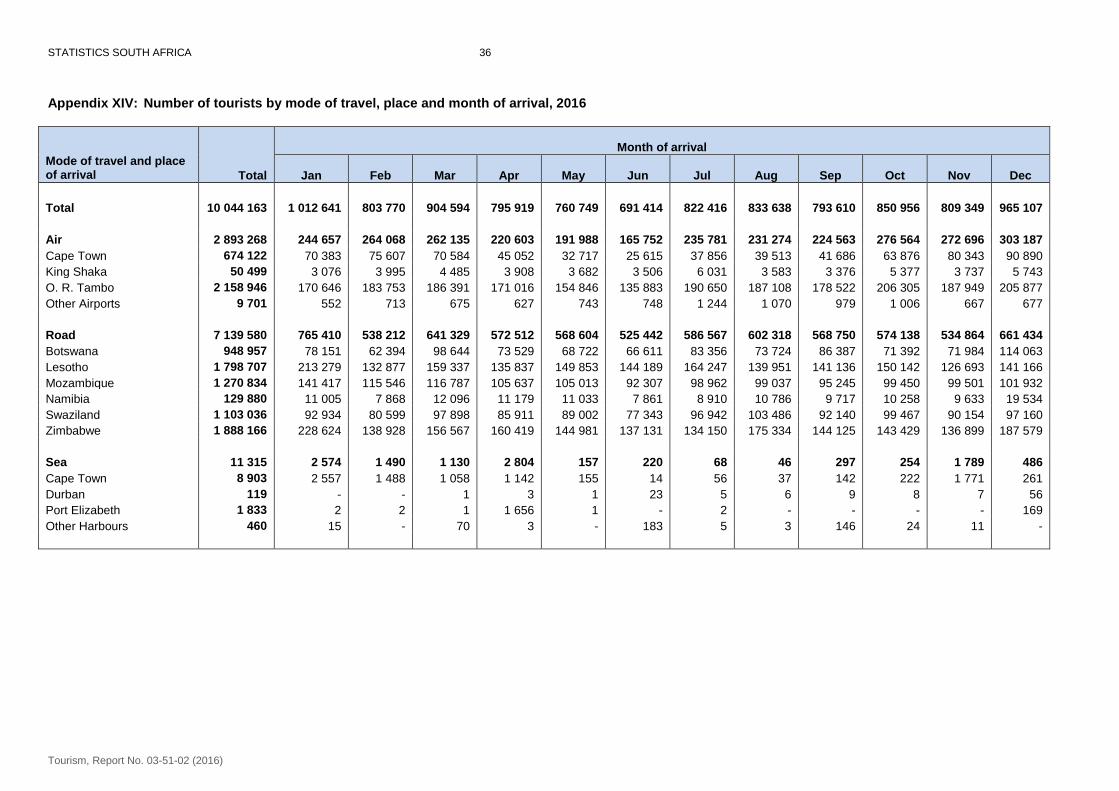
Table 4.1 on page 16 provides information on the number of tourists by mode of travel and place of arrival. A large
number of tourists who came to South Africa in 2016 used road transport [7 139 580 (71,1%); followed by those
who came by air [2 893 268 (28,8%)]; and those who arrived through sea ports [11 315 (0,1%)]. Table 4.1 on
page 16 further shows that the road users mainly came in through the Zimbabwe (26,4%) and the Lesotho (25,2%)
ports of entry. Namibia (1,8%) had the least number of the 2016 tourists using its ports of entry.
Out of the 2 893 268 tourists that flew into the country, the largest proportion (74,6%) used O.R. Tambo
International Airport. Cape Town and King Shaka international airports were used by 23,3% and 1,7% tourists
respectively. Most of the tourists that used sea ports of entry came in through the Cape Town Harbour (78,7%).
A detailed table including month of travel is shown in Appendix XIV on page 36. The highest volumes of tourists
that passed through the Zimbabwe port of entry were recorded in January whereas the lowest volumes were
recorded in July. Meanwhile, the highest volumes of tourists that entered South Africa through the Namibia ports of
entry were recorded in December whereas the lowest volumes were recorded in June and February. Further
details on the number of tourists by country of residence and month of arrival are provided in Appendix XV on page
37.
Statistics South Africa
Tourism, Report No. 03-51-02 (2016)
16
Table 4.1: Distribution of tourists by mode of travel and place of arrival, 2016
Mode of travel and place of arrival
Total %
Total 10 044 163 100,0
Air 2 893 268 100,0
Cape Town International Airport 674 122 23,3
King Shaka International Airport 50 499 1,7
O. R. Tambo International Airport 2 158 946 74,6
Other Airports 9 701 0,3
Road 7 139 580 100,0
Botswana 948 957 13,3
Lesotho 1 798 707 25,2
Mozambique 1 270 834 17,8
Namibia 129 880 1,8
Swaziland 1 103 036 15,4
Zimbabwe 1 888 166 26,4
Sea 11 315 100,0
Cape Town Harbour 8 903 78,7
Durban Harbour 119 1,1
Port Elizabeth Harbour 1833 16,2
Other Harbours 460 4,1
* Percentages might not add up to 100 due to rounding
Region of residence
As observed from Figure 4.7 on page 17, a large proportion of overseas tourists [88,8% (2 247 259)] came into
South Africa by air compared to [10,8% (272 715)] who came in by road and [0,4% (11 072)] who came by sea.
Similarly, tourists from ‘other’ African countries generally entered the country by air [91,9% (172 579)] rather than
by road [8,0% (15 053)] or sea [0,1% (196)]. However, the mode of travel used by most tourists from SADC
countries was road [93,7% (6 850 267)] compared to air [6,3% (463 371)]. Detailed data on sub-region and country
of residence and mode of travel is presented in Appendix XVI on page 45.
Statistics South Africa
Tourism, Report No. 03-51-02 (2016)
17
Figure 4.7: Percentage distribution of tourists by region of residence and mode of travel, 2016
Overseas SADC ‘Other’ African
Sea 11 072 46 196
Road 272 715 6 850 267 15 053
Air 2 247 259 463 371 172 579
0%
10%
20%
30%
40%
50%
60%
70%
80%
90%
100%
Pe
rce
nta
ge
Region
4.4 Purpose of visit
Region of residence
Besides information in Figure 4.8 on page 18, reference has been made to data on the main types of tourists that
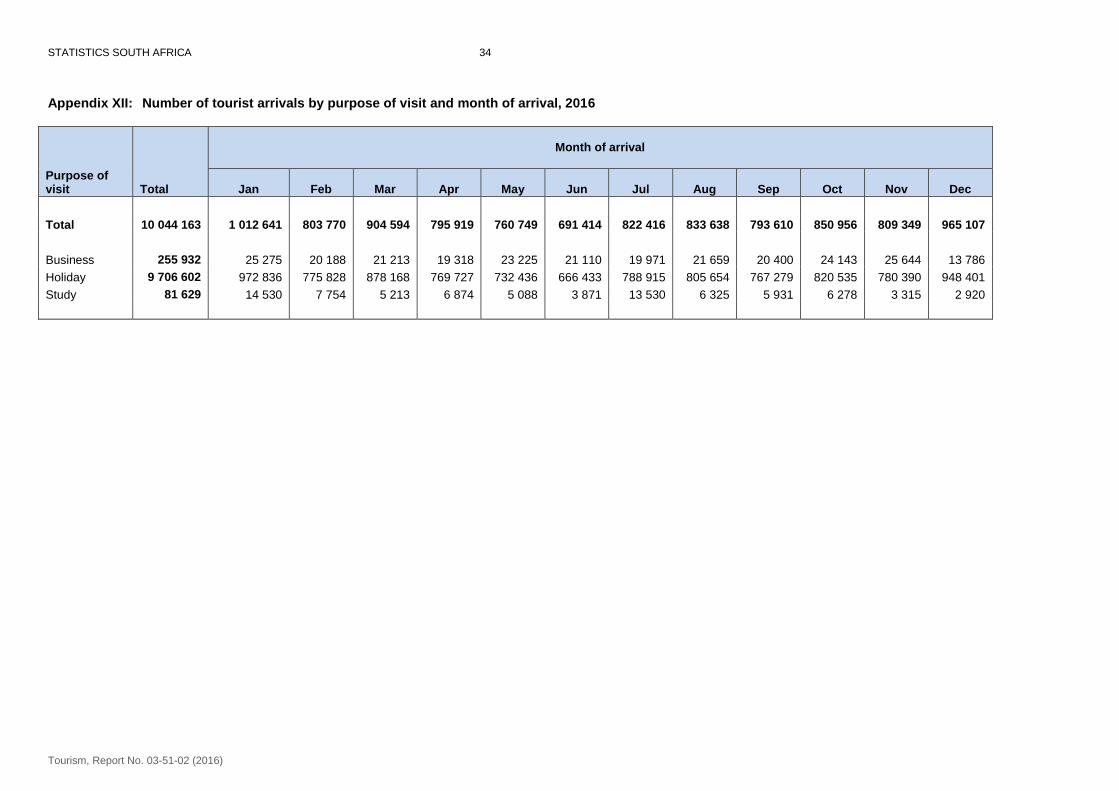
visit South Africa (see Appendix XII on page 34) – using the purpose of visit to identify them. In 2016 most tourists
came to South Africa for holidays [9 706 602 (96,6%)]. The remaining tourists came for business [255 932 (2,5%)]
or were in the country to study [81 629 (0,8%)].
The 2016 data revealed some regional and country differentials with respect to the purpose of visit. For example,
[10 953 (5,8%)] tourists from ‘other’ African countries and [80 875 (3,2%)] of tourists from overseas countries came
for business compared to [163 214 (2,2%)] from SADC countries. In addition, students made up [9 238 (4,9%)] of
tourists from ‘other’ African countries compared to [55 653 (0,8%)] of tourists from SADC countries and
[16 725 (0,7%)] of overseas tourists. Detailed data on country of residence and purpose of visit is presented in
Appendix XVII on page 52.
Statistics South Africa
Tourism, Report No. 03-51-02 (2016)
18
Figure 4.8: Percentage distribution of tourists by region and purpose of visit, 2016
Country of residence
Figures 4.9 and 4.10 on page 19 reveal that most overseas tourists on holiday (17,7%) and business persons
(18,3%) were UK residents. However, it is shown in Figure 4.11 on page 19 that the highest proportion of overseas
students came from the USA (16,2%).
As observed from Figure 4.12 on page 19, the majority of SADC tourists on holiday were from Zimbabwe (27,9%).
Whereas the highest proportion of SADC tourists on business came from Mozambique (31,0%); SADC students
were mainly from Zimbabwe (20,3%) and Swaziland (18,8%) as shown in Figure 4.13 and Figure 4.14 on page 19.
Regarding tourists from ‘other’ African countries, Nigerian residents were the majority on holiday (36,3%) and study
(31,3%). The majority of tourists from ‘other’ African countries who came for business (22,8%) were from Kenya.
(see Figures 4.15 – 4.17 on page 20). Detailed data on country of residence and purpose of visit is presented in
Appendix XVII on page 52.
4.5 Duration of stay
The number of days tourists spent in South Africa is based on the tourists who arrived and left in the same month.
Figure 4.18 on page 20 indicates that generally tourists from overseas and ‘other’ African countries spent on
average more days (about five to six days per month) in the country compared to SADC residents who spent an
average of three days in a month. Tourists from Overseas spent less days (about five days) in May, June, July and
September while the shortest duration for tourists from ‘other’ African countries was recorded in November, with an
average of four days’ stay for each group of tourists.
Statistics South Africa
Tourism, Report No. 03-51-02 (2016)
19
Figure 4.9: Percentage distribution of tourists
from overseas countries on holiday, 2016
Figure 4.10: Percentage distribution of tourists
from overseas countries on business, 2016
Figure 4.11: Percentage distribution of tourists
from overseas countries on study, 2016
Figure 4.12: Percentage distribution of tourists
from SADC countries on holiday, 2016
Figure 4.13: Percentage distribution of tourists
from SADC countries on business, 2016
Figure 4.14: Percentage distribution of tourists
from SADC countries on study, 2016
Statistics South Africa
Tourism, Report No. 03-51-02 (2016)
20
Figure 4.15: Percentage distribution of tourists
from ‘other’ African countries on holiday, 2016
Figure 4.17: Percentage distribution of tourists
from ‘other’ African countries on study, 2016
Figure 4.16: Percentage distribution of tourists
from ‘other’ African countries on business, 2016
Figure 4.18: Average (median) number of days
tourists spent by month of arrival, 2016
Statistics South Africa
Tourism, Report No. 03-51-02 (2016)
21
4.6 Sex and age distribution
Sex
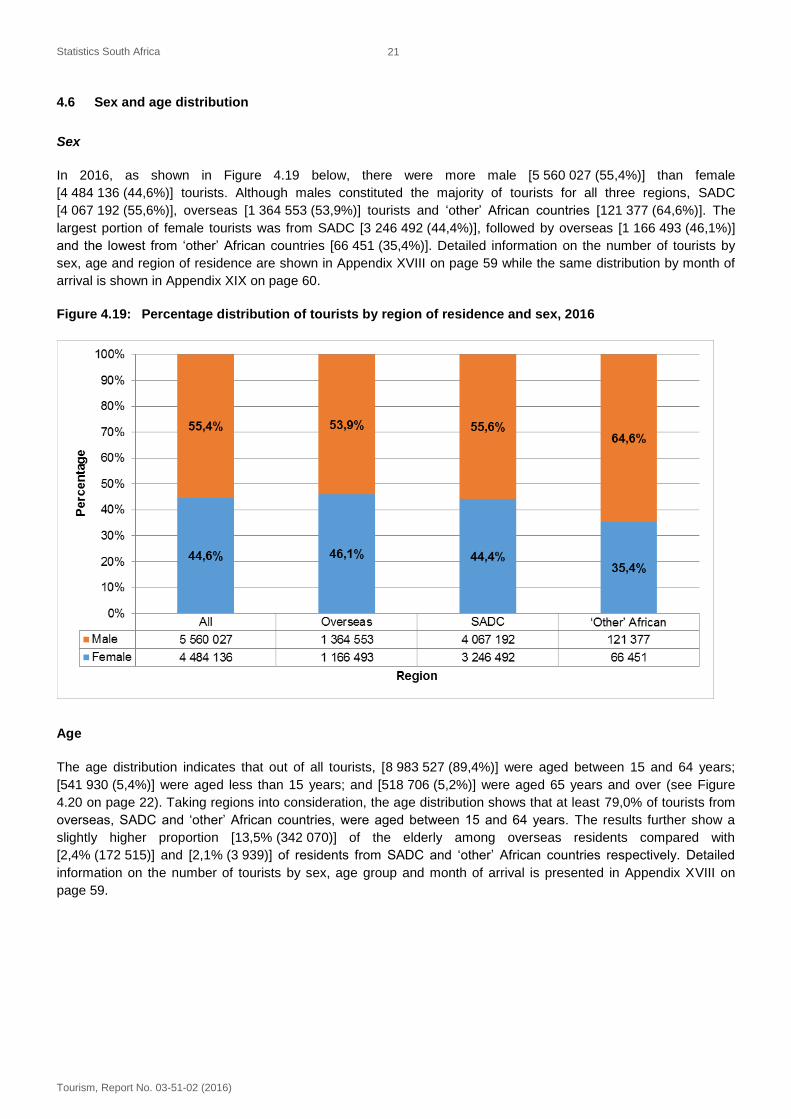
In 2016, as shown in Figure 4.19 below, there were more male [5 560 027 (55,4%)] than female
[4 484 136 (44,6%)] tourists. Although males constituted the majority of tourists for all three regions, SADC
[4 067 192 (55,6%)], overseas [1 364 553 (53,9%)] tourists and ‘other’ African countries [121 377 (64,6%)]. The
largest portion of female tourists was from SADC [3 246 492 (44,4%)], followed by overseas [1 166 493 (46,1%)]
and the lowest from ‘other’ African countries [66 451 (35,4%)]. Detailed information on the number of tourists by
sex, age and region of residence are shown in Appendix XVIII on page 59 while the same distribution by month of
arrival is shown in Appendix XIX on page 60.
Figure 4.19: Percentage distribution of tourists by region of residence and sex, 2016
Age
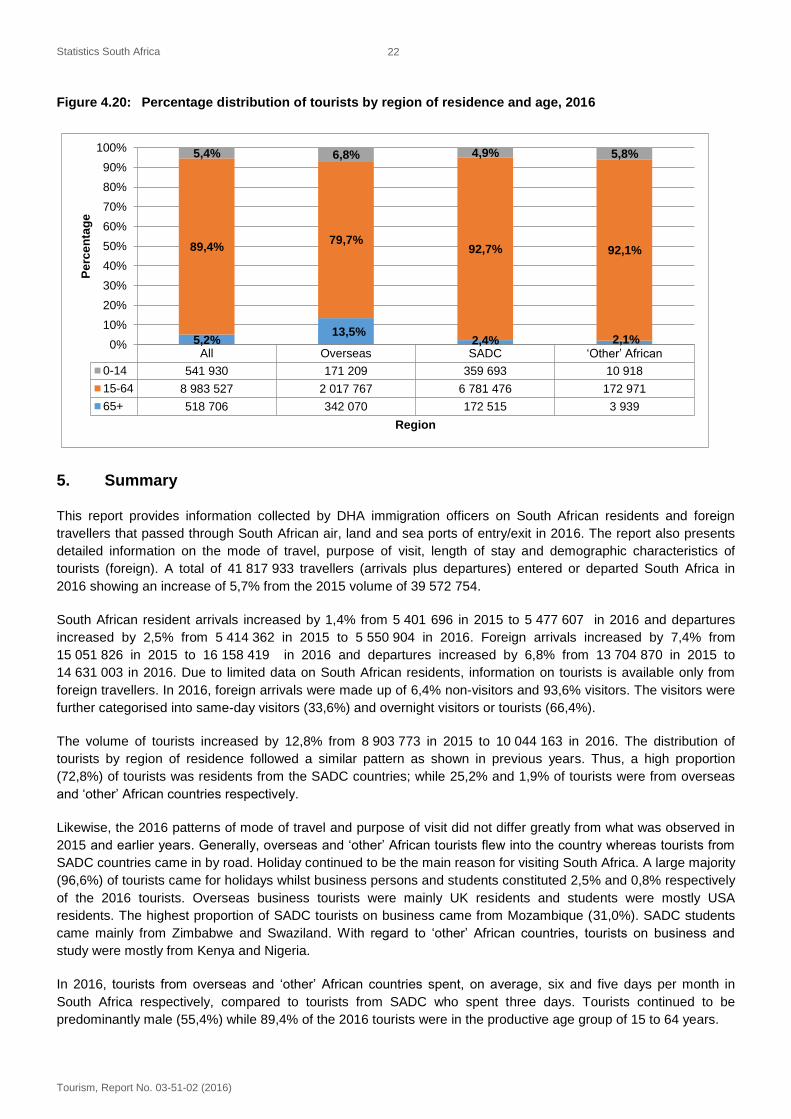
The age distribution indicates that out of all tourists, [8 983 527 (89,4%)] were aged between 15 and 64 years;
[541 930 (5,4%)] were aged less than 15 years; and [518 706 (5,2%)] were aged 65 years and over (see Figure
4.20 on page 22). Taking regions into consideration, the age distribution shows that at least 79,0% of tourists from
overseas, SADC and ‘other’ African countries, were aged between 15 and 64 years. The results further show a
slightly higher proportion [13,5% (342 070)] of the elderly among overseas residents compared with
[2,4% (172 515)] and [2,1% (3 939)] of residents from SADC and ‘other’ African countries respectively. Detailed
information on the number of tourists by sex, age group and month of arrival is presented in Appendix XVIII on
page 59.
Statistics South Africa
Tourism, Report No. 03-51-02 (2016)
22
Figure 4.20: Percentage distribution of tourists by region of residence and age, 2016
All Overseas SADC ‘Other’ African
0-14 541 930 171 209 359 693 10 918
15-64 8 983 527 2 017 767 6 781 476 172 971
65+ 518 706 342 070 172 515 3 939
5,2%13,5%
2,4% 2,1%
89,4%79,7%
92,7% 92,1%
5,4% 6,8% 4,9% 5,8%
0%
10%
20%
30%
40%
50%
60%
70%
80%
90%
100%
Pe
rce
nta
ge
Region
5. Summary
This report provides information collected by DHA immigration officers on South African residents and foreign
travellers that passed through South African air, land and sea ports of entry/exit in 2016. The report also presents
detailed information on the mode of travel, purpose of visit, length of stay and demographic characteristics of
tourists (foreign). A total of 41 817 933 travellers (arrivals plus departures) entered or departed South Africa in
2016 showing an increase of 5,7% from the 2015 volume of 39 572 754.
South African resident arrivals increased by 1,4% from 5 401 696 in 2015 to 5 477 607 in 2016 and departures
increased by 2,5% from 5 414 362 in 2015 to 5 550 904 in 2016. Foreign arrivals increased by 7,4% from
15 051 826 in 2015 to 16 158 419 in 2016 and departures increased by 6,8% from 13 704 870 in 2015 to
14 631 003 in 2016. Due to limited data on South African residents, information on tourists is available only from
foreign travellers. In 2016, foreign arrivals were made up of 6,4% non-visitors and 93,6% visitors. The visitors were
further categorised into same-day visitors (33,6%) and overnight visitors or tourists (66,4%).
The volume of tourists increased by 12,8% from 8 903 773 in 2015 to 10 044 163 in 2016. The distribution of
tourists by region of residence followed a similar pattern as shown in previous years. Thus, a high proportion
(72,8%) of tourists was residents from the SADC countries; while 25,2% and 1,9% of tourists were from overseas
and ‘other’ African countries respectively.
Likewise, the 2016 patterns of mode of travel and purpose of visit did not differ greatly from what was observed in
2015 and earlier years. Generally, overseas and ‘other’ African tourists flew into the country whereas tourists from
SADC countries came in by road. Holiday continued to be the main reason for visiting South Africa. A large majority
(96,6%) of tourists came for holidays whilst business persons and students constituted 2,5% and 0,8% respectively
of the 2016 tourists. Overseas business tourists were mainly UK residents and students were mostly USA
residents. The highest proportion of SADC tourists on business came from Mozambique (31,0%). SADC students
came mainly from Zimbabwe and Swaziland. With regard to ‘other’ African countries, tourists on business and
study were mostly from Kenya and Nigeria.
In 2016, tourists from overseas and ‘other’ African countries spent, on average, six and five days per month in
South Africa respectively, compared to tourists from SADC who spent three days. Tourists continued to be
predominantly male (55,4%) while 89,4% of the 2016 tourists were in the productive age group of 15 to 64 years.
STATISTICS SOUTH AFRICA 23
Tourism, Report No. 03-51-02 (2016)
6. APPENDICES Appendix I: Ports of entry/exit in South Africa
Source: National Department of Home Affairs
STATISTICS SOUTH AFRICA 24
Tourism, Report No. 03-51-02 (2016)
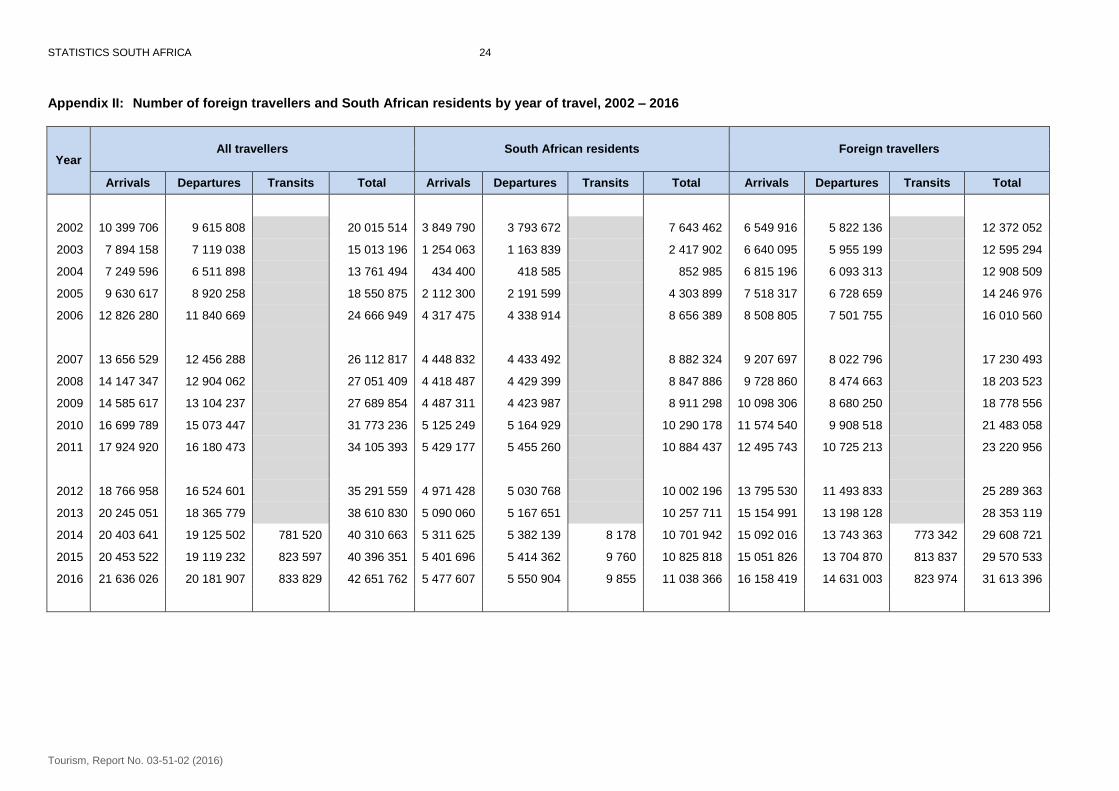
Appendix II: Number of foreign travellers and South African residents by year of travel, 2002 – 2016
Year All travellers South African residents Foreign travellers
Arrivals Departures Transits Total Arrivals Departures Transits Total Arrivals Departures Transits Total
2002 10 399 706 9 615 808 20 015 514 3 849 790 3 793 672 7 643 462 6 549 916 5 822 136 12 372 052
2003 7 894 158 7 119 038 15 013 196 1 254 063 1 163 839 2 417 902 6 640 095 5 955 199 12 595 294
2004 7 249 596 6 511 898 13 761 494 434 400 418 585 852 985 6 815 196 6 093 313 12 908 509
2005 9 630 617 8 920 258 18 550 875 2 112 300 2 191 599 4 303 899 7 518 317 6 728 659 14 246 976
2006 12 826 280 11 840 669 24 666 949 4 317 475 4 338 914 8 656 389 8 508 805 7 501 755 16 010 560
2007 13 656 529 12 456 288 26 112 817 4 448 832 4 433 492 8 882 324 9 207 697 8 022 796 17 230 493
2008 14 147 347 12 904 062 27 051 409 4 418 487 4 429 399 8 847 886 9 728 860 8 474 663 18 203 523
2009 14 585 617 13 104 237 27 689 854 4 487 311 4 423 987 8 911 298 10 098 306 8 680 250 18 778 556
2010 16 699 789 15 073 447 31 773 236 5 125 249 5 164 929 10 290 178 11 574 540 9 908 518 21 483 058
2011 17 924 920 16 180 473 34 105 393 5 429 177 5 455 260 10 884 437 12 495 743 10 725 213 23 220 956
2012 18 766 958 16 524 601 35 291 559 4 971 428 5 030 768 10 002 196 13 795 530 11 493 833 25 289 363
2013 20 245 051 18 365 779 38 610 830 5 090 060 5 167 651 10 257 711 15 154 991 13 198 128 28 353 119
2014 20 403 641 19 125 502 781 520 40 310 663 5 311 625 5 382 139 8 178 10 701 942 15 092 016 13 743 363 773 342 29 608 721
2015 20 453 522 19 119 232 823 597 40 396 351 5 401 696 5 414 362 9 760 10 825 818 15 051 826 13 704 870 813 837 29 570 533
2016 21 636 026 20 181 907 833 829 42 651 762 5 477 607 5 550 904 9 855 11 038 366 16 158 419 14 631 003 823 974 31 613 396
STATISTICS SOUTH AFRICA 25
Tourism, Report No. 03-51-02 (2016)
Appendix III: Number of arrivals and departures of South African residents by mode of travel and place of arrival or departure, 2016
Mode of travel and place of arrival or departure
Arrivals Departures Transits % Arrivals % Departures % Transits
Total 5 477 607 5 550 904 9 855 - - -
Air 2 052 042 2 053 400 9 855 100,0 100,0 100,0
Cape Town International Airport 291 845 297 097 114 14,2 14,5 1,2
King Shaka International Airport 105 926 115 168 2 5,2 5,6 0,0
O. R. Tambo International Airport 1 629 129 1 614 958 9 736 79,4 78,6 98,8
Other Airports 25 142 26 177 3 1,2 1,3 0,0
Road 3 418 262 3 487 547 - 100,0 100,0 -
Botswana 582 832 589 010 - 17,1 16,9 -
Lesotho 1 035 682 1 071 674 - 30,3 30,7 -
Mozambique 658 217 668 259 - 19,3 19,2 -
Namibia 163 646 165 040 - 4,8 4,7 -
Swaziland 790 395 803 306 - 23,1 23,0 -
Zimbabwe 187 490 190 258 - 5,5 5,5 -
Sea 7 303 9 957 - 100,0 100,0 -
Cape Town Harbour 6 235 8 646 - 85,4 86,8 -
Durban Harbour 670 832 - 9,2 8,4 -
Port Elizabeth Harbour 265 364 - 3,6 3,7 -
Other Harbours 133 115 - 1,8 1,2 -
STATISTICS SOUTH AFRICA 26
Tourism, Report No. 03-51-02 (2016)
Appendix IV: Number of South African residents by mode of travel, place and month of arrival, 2016
Mode of travel and place of arrival
Total
Month of arrival
Jan Feb Mar Apr May Jun Jul Aug Sep Oct Nov Dec
Total 5 477 607 584 653 330 895 450 637 406 482 434 520 408 261 543 725 436 996 442 285 480 961 391 557 566 635
Air 2 052 042 212 173 119 065 154 553 159 868 158 402 157 511 220 635 154 605 178 768 184 186 146 624 205 652
Cape Town 291 845 27 287 14 848 20 785 20 244 21 078 23 569 35 605 22 143 26 675 27 021 21 192 31 398
King Shaka 105 926 11 925 5 413 8 355 8 396 8 352 7 673 11 547 7 308 8 536 9 712 7 157 11 552
O. R. Tambo 1 629 129 171 443 97 193 123 606 128 833 125 810 124 225 171 081 122 958 141 389 145 362 116 116 161 113
Other Airports 25 142 1 518 1 611 1 807 2 395 3 162 2 044 2 402 2 196 2 168 2 091 2 159 1 589
Road 3 418 262 370 223 211 129 295 335 246 156 274 456 250 614 322 888 282 252 263 314 296 563 244 672 360 660
Botswana 582 832 55 259 36 054 46 750 43 425 48 558 43 643 57 213 48 799 49 216 52 676 41 943 59 296
Lesotho 1 035 682 109 555 67 994 95 737 76 677 82 350 75 036 89 791 84 662 77 537 89 066 77 626 109 651
Mozambique 658 217 89 114 37 658 55 345 44 864 51 144 46 761 62 407 49 501 49 136 57 197 46 788 68 302
Namibia 163 646 15 128 8 606 13 443 12 599 12 299 14 230 23 407 12 874 11 521 13 294 10 104 16 141
Swaziland 790 395 74 872 49 480 69 330 54 847 65 929 57 908 74 084 68 771 62 238 69 022 56 563 87 351
Zimbabwe 187 490 26 295 11 337 14 730 13 744 14 176 13 036 15 986 17 645 13 666 15 308 11 648 19 919
Sea 7 303 2 257 701 749 458 1 662 136 202 139 203 212 261 323
Cape Town 6 235 2 179 637 676 197 1 570 65 174 66 148 167 174 182
Durban 670 57 60 71 60 34 67 15 66 48 41 62 89
Port Elizabeth 265 8 - 2 147 52 - 2 3 4 2 2 43
Other Harbours 133 13 4 - 54 6 4 11 4 3 2 23 9
STATISTICS SOUTH AFRICA 27
Tourism, Report No. 03-51-02 (2016)
Appendix V: Number of South African residents by mode of travel, place and month of departure, 2016
Mode of travel and place of departure
Total
Month of departure
Jan Feb Mar Apr May Jun Jul Aug Sep Oct Nov Dec
Total 5 550 904 391 185 336 167 484 750 435 094 416 488 480 628 467 673 461 320 464 440 444 061 402 766 766 332
Air 2 053 400 149 955 121 551 168 878 168 135 162 360 197 368 166 117 175 358 182 520 161 675 149 896 249 587
Cape Town 297 097 19 478 14 789 22 384 21 887 24 369 33 526 25 470 25 888 28 273 22 049 20 712 38 272
King Shaka 115 168 8 188 6 480 9 962 8 903 8 693 10 470 9 445 9 709 10 098 8 615 8 224 16 381
O. R. Tambo 1 614 958 120 780 98 557 134 511 135 427 125 951 150 979 128 936 137 440 141 929 128 713 118 481 193 254
Other Airports 26 177 1 509 1 725 2 021 1 918 3 347 2 393 2 266 2 321 2 220 2 298 2 479 1 680
Road 3 487 547 237 720 213 357 315 502 266 423 251 894 283 152 301 313 285 657 281 652 282 159 252 443 516 275
Botswana 589 010 37 202 36 562 49 787 46 513 44 823 49 937 52 719 49 339 52 476 49 642 43 222 76 788
Lesotho 1 071 674 81 641 70 723 101 230 84 600 77 604 81 455 88 162 87 001 83 307 86 269 83 245 146 437
Mozambique 668 259 40 305 36 978 60 273 48 398 43 963 53 331 57 046 49 166 52 414 53 849 46 655 125 881
Namibia 165 040 10 439 8 618 15 445 12 134 12 273 20 899 16 847 12 484 12 646 11 892 10 128 21 235
Swaziland 803 306 57 088 49 318 72 452 59 717 60 861 62 121 72 405 69 659 66 507 66 465 57 728 108 985
Zimbabwe 190 258 11 045 11 158 16 315 15 061 12 370 15 409 14 134 18 008 14 302 14 042 11 465 36 949
Sea 9 957 3 510 1 259 370 536 2 234 108 243 305 268 227 427 470
Cape Town 8 646 3 141 1 173 270 413 2 180 39 200 201 199 150 280 400
Durban 832 98 51 100 76 46 49 34 84 52 73 118 51
Port Elizabeth 364 259 34 - 5 3 9 5 3 1 4 22 19
Other Harbours 115 12 1 - 42 5 11 4 17 16 - 7 -
STATISTICS SOUTH AFRICA 28
Tourism, Report No. 03-51-02 (2016)
Appendix VI: Number of foreign arrivals and departures by mode of travel and place of arrival or departure, 2016
Mode of travel and place of arrival or departure
Arrivals Departures Transits % Arrivals % Departures % Transits
Total 16 158 419 14 631 003 823 974 - - -
Air 3 327 527 3 335 226 823 974 100,0 100,0 100,0
Cape Town International Airport 717 519 712 433 1 797 21,6 21,4 0,2
King Shaka International Airport 64 620 73 441 8 1,9 2,2 0,0
O. R. Tambo International Airport 2 530 575 2 529 063 822 163 76,0 75,8 99,8
Other Airports 14 813 20 289 6 0,4 0,6 0,0
Road 12 772 177 11 240 719 - 100,0 100,0 -
Botswana 1 690 055 1 647 440 - 13,2 14,7 -
Lesotho 3 851 730 3 262 937 - 30,2 29,0 -
Mozambique 1 970 033 1 780 369 - 15,4 15,8 -
Namibia 177 347 179 770 - 1,4 1,6 -
Swaziland 1 995 190 1 871 792 - 15,6 16,7 -
Zimbabwe 3 087 822 2 498 411 - 24,2 22,2 -
Sea 58 715 55 058 - 100,0 100,0 -
Cape Town Harbour 32 495 30 041 - 55,3 54,6 -
Durban Harbour 19 868 18 675 - 33,8 33,9 -
Port Elizabeth Harbour 3 650 4 991 - 6,2 9,1 -
Other Harbours 2 702 1 351 - 4,6 2,5 -
STATISTICS SOUTH AFRICA 29
Tourism, Report No. 03-51-02 (2016)
Appendix VII: Number of foreign arrivals by mode of travel, place and month of arrival, 2016
Mode of travel and place of arrival
Total
Month of arrival
Jan Feb Mar Apr May Jun Jul Aug Sep Oct Nov Dec
Total 16 158 419 1 558 854 1 285 698 1 435 879 1 320 375 1 279 297 1 175 811 1 319 955 1 323 775 1 273 734 1 336 973 1 294 020 1 554 048
Air 3 327 527 284 053 293 636 295 386 252 988 227 555 197 770 276 231 277 211 264 004 315 838 307 922 334 933
Cape Town 717 519 75 100 78 812 74 050 48 073 35 738 28 193 41 515 43 682 45 480 67 921 84 686 94 269
King Shaka 64 620 4 372 5 149 5 515 5 129 4 774 4 379 7 182 4 674 4 340 6 723 5 419 6 964
O.R. Tambo 2 530 575 203 686 208 392 214 727 198 784 185 837 164 019 225 862 227 461 212 757 239 696 216 740 232 614
Other 14 813 895 1 283 1 094 1 002 1 206 1 179 1 672 1 394 1 427 1 498 1 077 1 086
Road 12 772 177 1 266 420 986 510 1 135 579 1 060 141 1 047 808 974 458 1 040 626 1 043 056 1 005 536 1 017 227 979 618 1 215 198
Botswana 1 690 055 135 883 113 874 156 917 131 999 130 449 124 464 154 058 134 593 149 516 130 455 131 759 196 088
Lesotho 3 851 730 401 453 296 674 345 721 307 576 319 632 301 812 321 992 293 673 303 470 317 285 293 964 348 478
Mozambique 1 970 033 208 416 184 069 186 331 168 853 165 733 147 620 152 943 149 220 142 955 148 114 149 289 166 490
Namibia 177 347 15 143 11 118 15 690 14 785 14 987 11 518 12 960 14 633 13 137 14 642 13 996 24 738
Swaziland 1 995 190 164 702 144 080 169 459 161 403 164 452 145 860 176 228 179 357 163 920 174 639 162 930 188 160
Zimbabwe 3 087 822 340 823 236 695 261 461 275 525 252 555 243 184 222 445 271 580 232 538 232 092 227 680 291 244
Sea 58 715 8 381 5 552 4 914 7 246 3 934 3 583 3 098 3 508 4 194 3 908 6 480 3 917
Cape Town 32 495 6 483 3 673 3 126 3 218 1 846 1 276 1 207 1 508 1 871 1 912 4 665 1 710
Durban 19 868 1 687 1 597 1 625 1 872 1 482 1 721 1 558 1 636 1 806 1 621 1 496 1 767 Port Elizabeth 3 650 99 89 93 1 816 166 106 121 185 143 221 172 439
Other 2 702 112 193 70 340 440 480 212 179 374 154 147 1
STATISTICS SOUTH AFRICA 30
Tourism, Report No. 03-51-02 (2016)
Appendix VIII: Number of foreign departures by mode of travel, place and month of departure, 2016
Mode of travel and place of departure
Total
Month of arrival
Jan Feb Mar Apr May Jun Jul Aug Sep Oct Nov Dec
Total 14 631 003 1 220 540 1 139 669 1 326 244 1 238 684 1 166 255 1 078 980 1 145 550 1 181 138 1 160 660 1 193 994 1 189 434 1 589 855
Air 3 335 226 301 311 285 307 309 365 287 618 242 109 208 854 242 583 286 260 257 757 294 695 317 595 301 772
Cape Town 712 433 75 852 78 228 80 054 56 790 40 978 30 099 33 960 46 021 43 797 61 148 86 738 78 768
King Shaka 73 441 5 965 5 656 6 009 6 990 5 524 4 660 7 244 6 309 4 758 7 013 7 595 5 718
O.R. Tambo 2 529 063 218 337 200 129 221 702 222 207 193 937 172 346 199 219 231 973 207 138 224 635 221 776 215 664
Other 20 289 1 157 1 294 1 600 1 631 1 670 1 749 2 160 1 957 2 064 1 899 1 486 1 622
Road 11 240 719 911 688 849 727 1 012 083 943 037 919 880 867 344 900 086 891 249 899 142 895 500 868 402 1 282 581
Botswana 1 647 440 132 592 111 080 152 378 122 992 134 123 122 121 151 352 130 119 143 747 134 202 129 525 183 209
Lesotho 3 262 937 257 625 243 590 301 063 263 143 259 890 252 341 256 898 239 325 257 453 263 928 260 399 407 282
Mozambique 1 780 369 144 416 164 244 170 606 157 438 146 729 134 351 138 650 134 335 129 830 133 692 128 836 197 242
Namibia 179 770 19 034 11 192 16 073 12 343 17 798 12 291 13 360 14 678 13 718 15 254 14 155 19 874
Swaziland 1 871 792 149 675 131 355 161 061 150 805 154 166 139 812 163 828 164 315 158 169 162 989 151 550 184 067
Zimbabwe 2 498 411 208 346 188 266 210 902 236 316 207 174 206 428 175 998 208 477 196 225 185 435 183 937 290 907
Sea 55 058 7 541 4 635 4 796 8 029 4 266 2 782 2 881 3 629 3 761 3 799 3 437 5 502
Cape Town 30 041 4 319 1 484 3 171 5 728 2 497 1 153 1 252 1 697 1 798 2 004 1 685 3 253
Durban 18 675 1 669 1 541 1 535 1 862 1 447 1 453 1 466 1 626 1 675 1 575 1 436 1 390 Port Elizabeth 4 991 1 396 1 374 90 147 165 100 137 207 162 210 182 821
Other 1 351 157 236 292 157 76 26 99 126 10 134 38
STATISTICS SOUTH AFRICA 31
Tourism, Report No. 03-51-02 (2016)
Appendix IX: Number of foreign arrivals by purpose of visit and month of arrival, 2016
Purpose of visit
Total Month of arrival
Jan Feb Mar Apr May Jun Jul Aug Sep Oct Nov Dec
Total 16 158 419 1 558 854 1 285 698 1 435 879 1 320 375 1 279 297 1 175 811 1 319 955 1 323 775 1 273 734 1 336 973 1 294 020 1 554 048
Business 294 168 28 616 22 681 24 541 21 892 27 128 24 743 22 846 25 098 23 681 27 322 28 816 16 804
Holiday 15 221 205 1 445 489 1 216 459 1 357 917 1 250 049 1 198 067 1 106 956 1 236 941 1 241 765 1 197 864 1 254 465 1 218 032 1 497 201
Study 98 199 16 004 9 121 6 187 8 715 6 849 5 303 14 621 7 766 7 594 7 439 4 968 3 632
Work 359 955 46 568 24 242 31 193 27 761 31 004 26 070 29 018 32 246 29 122 30 042 27 953 24 736
Other 174 184 20 847 12 482 15 236 11 300 15 539 12 111 15 874 15 965 14 736 16 362 12 875 10 857
STATISTICS SOUTH AFRICA 32
Tourism, Report No. 03-51-02 (2016)
Appendix X: Number of foreign arrivals by type of visitor and month of arrival, 2016
Type of visitor
Total
Month of arrival
Jan
Feb
Mar
Apr
May
Jun
Jul
Aug
Sep
Oct
Nov
Dec
Total 16 158 419 1 558 854 1 285 698 1 435 879 1 320 375 1 279 297 1 175 811 1 319 955 1 323 775 1 273 734 1 336 973 1 294 020 1 554 048
Non-visitors 1 037 091 117 369 78 123 90 792 79 201 85 148 74 689 86 078 89 276 82 934 89 970 81 921 81 590
Visitors 15 121 328 1 441 485 1 207 575 1 345 087 1 241 174 1 194 149 1 101 122 1 233 877 1 234 499 1 190 800 1 247 003 1 212 099 1 472 458
Same day 5 077 165 428 844 403 805 440 493 445 255 433 400 409 708 411 461 400 861 397 190 396 047 402 750 507 351
Tourist 10 044 163 1 012 641 803 770 904 594 795 919 760 749 691 414 822 416 833 638 793 610 850 956 809 349 965 107
STATISTICS SOUTH AFRICA 33
Tourism, Report No. 03-51-02 (2016)
Appendix XI: Number of same day visitors by mode of travel, region of residence and purpose of visit, 2016
Mode of travel and region of residence Total
Purpose of visit
Business Holiday Study
Total 5 077 165 32 797 5 032 723 11 645
Air 226 283 2 985 222 900 398
Overseas 150 473 1 499 148 886 88
SADC 72 069 1 330 70 472 267
‘Other’ Africa 2 861 109 2 710 42
Unspecified 880 47 832 1
Road 4 850 428 29 809 4 809 373 11 246
Overseas 60 829 45 60 431 353
SADC 4 783 300 29 758 4 742 844 10 698
‘Other’ African 5 535 6 5 336 193
Unspecified 764 - 762 2
Sea 454 3 450 1
Overseas 453 3 449 1
SADC 1 - 1 -
STATISTICS SOUTH AFRICA 34
Tourism, Report No. 03-51-02 (2016)
Appendix XII: Number of tourist arrivals by purpose of visit and month of arrival, 2016
Purpose of visit Total
Month of arrival
Jan Feb Mar Apr May Jun Jul Aug Sep Oct Nov Dec
Total 10 044 163 1 012 641 803 770 904 594 795 919 760 749 691 414 822 416 833 638 793 610 850 956 809 349 965 107
Business 255 932 25 275 20 188 21 213 19 318 23 225 21 110 19 971 21 659 20 400 24 143 25 644 13 786
Holiday 9 706 602 972 836 775 828 878 168 769 727 732 436 666 433 788 915 805 654 767 279 820 535 780 390 948 401
Study 81 629 14 530 7 754 5 213 6 874 5 088 3 871 13 530 6 325 5 931 6 278 3 315 2 920
STATISTICS SOUTH AFRICA 35
Tourism, Report No. 03-51-02 (2016)
Appendix XIII: Number of tourists by region of residence and month of arrival, 2016
Region Total
Month of arrival
Jan
Feb
Mar
Apr
May
Jun
Jul
Aug
Sep
Oct
Nov
Dec
Total 10 044 163 1 012 641 803 770 904 594 795 919 760 749 691 414 822 416 833 638 793 610 850 956 809 349 965 107
Overseas 2 531 046 214 903 234 707 235 640 188 491 160 627 135 780 200 901 203 421 196 098 250 737 250 017 259 724
Europe 1 544 026 144 130 163 283 153 395 110 860 75 706 59 118 107 971 117 918 107 125 165 828 170 081 168 611
North America 406 192 26 962 28 247 36 622 30 665 35 872 34 631 41 069 33 425 34 827 33 418 32 306 38 148 Central and South America 67 546 5 332 4 591 4 736 4 606 4 445 3 661 6 029 4 520 5 906 7 249 7 157 9 314
Australasia 131 856 10 011 7 875 10 143 10 989 9 319 10 314 11 757 11 367 14 860 10 307 8 893 16 021
Middle East 53 536 3 466 3 844 5 275 4 585 3 650 2 200 6 384 6 449 4 852 5 133 4 176 3 522
Asia 327 890 25 002 26 867 25 469 26 786 31 635 25 856 27 691 29 742 28 528 28 802 27 404 24 108
Africa 7 501 512 797 050 568 162 668 020 606 452 598 997 554 811 620 454 629 348 596 548 599 180 558 193 704 297
SADC 7 313 684 782 002 553 013 653 598 590 456 583 480 541 262 603 763 611 877 581 252 582 324 542 058 688 599
‘Other’ African 187 828 15 048 15 149 14 422 15 996 15 517 13 549 16 691 17 471 15 296 16 856 16 135 15 698
East and Central Africa 74 063 5 812 5 839 5 548 5 809 5 374 5 016 7 236 6 957 6 393 6 559 6 305 7 215
West Africa 97 035 7 849 7 891 7 678 8 342 8 774 7 532 8 205 9 198 7 317 8 706 8 269 7 274
North Africa 16 730 1 387 1 419 1 196 1 845 1 369 1 001 1 250 1 316 1 586 1 591 1 561 1 209
Unspecified 11 605 688 901 934 976 1 125 823 1 061 869 964 1 039 1 139 1 086
STATISTICS SOUTH AFRICA 36
Tourism, Report No. 03-51-02 (2016)
Appendix XIV: Number of tourists by mode of travel, place and month of arrival, 2016 Mode of travel and place of arrival
Total
Month of arrival
Jan Feb Mar Apr May Jun Jul Aug Sep Oct Nov Dec
Total 10 044 163 1 012 641 803 770 904 594 795 919 760 749 691 414 822 416 833 638 793 610 850 956 809 349 965 107
Air 2 893 268 244 657 264 068 262 135 220 603 191 988 165 752 235 781 231 274 224 563 276 564 272 696 303 187
Cape Town 674 122 70 383 75 607 70 584 45 052 32 717 25 615 37 856 39 513 41 686 63 876 80 343 90 890
King Shaka 50 499 3 076 3 995 4 485 3 908 3 682 3 506 6 031 3 583 3 376 5 377 3 737 5 743
O. R. Tambo 2 158 946 170 646 183 753 186 391 171 016 154 846 135 883 190 650 187 108 178 522 206 305 187 949 205 877
Other Airports 9 701 552 713 675 627 743 748 1 244 1 070 979 1 006 667 677
Road 7 139 580 765 410 538 212 641 329 572 512 568 604 525 442 586 567 602 318 568 750 574 138 534 864 661 434
Botswana 948 957 78 151 62 394 98 644 73 529 68 722 66 611 83 356 73 724 86 387 71 392 71 984 114 063
Lesotho 1 798 707 213 279 132 877 159 337 135 837 149 853 144 189 164 247 139 951 141 136 150 142 126 693 141 166
Mozambique 1 270 834 141 417 115 546 116 787 105 637 105 013 92 307 98 962 99 037 95 245 99 450 99 501 101 932
Namibia 129 880 11 005 7 868 12 096 11 179 11 033 7 861 8 910 10 786 9 717 10 258 9 633 19 534
Swaziland 1 103 036 92 934 80 599 97 898 85 911 89 002 77 343 96 942 103 486 92 140 99 467 90 154 97 160
Zimbabwe 1 888 166 228 624 138 928 156 567 160 419 144 981 137 131 134 150 175 334 144 125 143 429 136 899 187 579
Sea 11 315 2 574 1 490 1 130 2 804 157 220 68 46 297 254 1 789 486
Cape Town 8 903 2 557 1 488 1 058 1 142 155 14 56 37 142 222 1 771 261
Durban 119 - - 1 3 1 23 5 6 9 8 7 56
Port Elizabeth 1 833 2 2 1 1 656 1 - 2 - - - - 169
Other Harbours 460 15 - 70 3 - 183 5 3 146 24 11 -
STATISTICS SOUTH AFRICA 37
Tourism, Report No. 03-51-02 (2016)
Appendix XV: Number of tourists by country of residence and month of arrival, 2016
Country
Total
Month of arrival
Jan Feb Mar Apr May Jun Jul Aug Sep Oct Nov Dec
Total 10 044 163 1 012 641 803 770 904 594 795 919 760 749 691 414 822 416 833 638 793 610 850 956 809 349 965 107
Overseas 2 531 046 214 903 234 707 235 640 188 491 160 627 135 780 200 901 203 421 196 098 250 737 250 017 259 724
Europe 1 544 026 144 130 163 283 153 395 110 860 75 706 59 118 107 971 117 918 107 125 165 828 170 081 168 611
Albania 100 7 10 5 4 8 2 7 7 9 11 16 14
Andorra 49 2 - 3 1 1 2 9 19 2 3 3 4
Austria 27 556 2 902 3 144 2 708 1 613 1 252 756 1 552 1 734 1 940 3 276 3 371 3 308
Belgium 48 991 3 749 4 305 4 945 2 942 2 391 1 901 5 332 4 095 3 572 5 871 5 023 4 865
Bosnia-Herzegovina 173 21 5 12 13 18 8 10 13 19 11 20 23
Bulgaria 2 249 186 239 253 202 88 115 146 166 125 145 255 329
Croatia 2 058 253 143 167 199 136 81 124 161 149 220 240 185
Cyprus 1 822 151 184 159 129 116 111 101 168 169 124 127 283
Czech Republic 7 978 761 944 690 608 379 299 482 502 671 765 1 233 644
Denmark 27 554 3 413 4 118 2 932 1 669 1 152 912 1 996 1 121 1 699 3 223 2 803 2 516
Estonia 736 77 70 93 54 26 21 31 33 19 59 134 119
Finland 9 371 1 057 1 104 974 613 406 447 331 414 505 791 1 321 1 408
France 154 226 11 728 14 463 13 930 13 481 8 659 5 792 12 315 12 693 8 673 19 009 19 531 13 952
Georgia 194 17 13 22 15 12 5 22 27 15 16 8 22
Germany 311 832 28 944 35 779 36 759 18 423 13 562 8 625 13 279 18 792 23 085 40 492 42 489 31 603
Gilbraltar 3 - 2 - 1 - - - - - - - -
Greece 6 381 509 590 547 626 402 303 371 516 542 544 591 840
Hungary 3 825 409 402 462 336 187 215 196 233 243 392 387 363
Iceland 921 72 71 109 57 73 44 58 58 53 106 82 138
Ireland 30 545 2 708 2 626 3 740 2 146 1 569 2 095 2 083 1 970 2 025 2 906 2 794 3 883
Italy 60 774 4 617 4 245 3 919 4 159 3 370 3 290 5 281 11 198 4 669 5 181 4 467 6 378
Latvia 536 49 48 63 55 38 16 27 30 24 68 52 66
Liechtenstein 320 31 33 56 14 7 7 18 4 13 40 45 52 Lithuania 966 89 96 76 61 74 32 45 61 69 78 186 99
Luxembourg 1 761 106 147 254 101 54 35 141 255 135 171 195 167
Macedonia 229 30 14 17 37 17 12 14 9 15 11 27 26
Malta 686 60 52 45 25 24 22 45 129 73 85 61 65
Moldova 158 15 8 9 8 8 8 14 11 8 14 23 32
STATISTICS SOUTH AFRICA 38
Tourism, Report No. 03-51-02 (2016)
Appendix XV: Number of tourists by country of residence and month of arrival, 2016 (continued)
Country
Total
Month of arrival
Jan Feb Mar Apr May Jun Jul Aug Sep Oct Nov Dec
Monaco 83 4 5 8 5 6 - 14 6 11 4 13 7
Montenegro 124 9 11 13 11 18 9 9 2 7 6 12 17
Norway 19 220 2 022 2 746 2 686 1 285 745 839 1 084 725 1 016 1 673 2 087 2 312
Poland 13 552 1 548 1 562 1 100 934 632 492 708 955 1 148 1 232 2 085 1 156
Portugal 41 216 3 529 3 681 4 186 3 808 2 845 2 711 2 996 3 420 2 888 3 255 3 823 4 074
Republic of Belarus 448 66 34 33 25 30 6 30 32 45 43 49 55
Romania 3 201 209 288 248 269 196 120 132 269 229 362 370 509
Russian Federation 8 307 737 622 660 618 535 409 508 699 647 712 992 1 168
San Marino 48 2 2 6 2 7 2 2 4 3 6 10 2
Serbia 1 771 180 152 142 102 131 93 141 108 168 191 162 201
Slovakia 2 799 185 400 288 229 184 105 130 208 173 263 449 185
Slovenia 1 172 132 85 72 89 46 47 85 90 102 153 171 100
Spain 36 278 2 074 1 952 2 816 2 128 1 928 1 986 3 509 6 117 3 622 3 656 3 316 3 174
Sweden 44 043 5 625 6 003 4 087 2 110 1 958 1 222 1 355 1 186 1 519 4 883 6 089 8 006
Switzerland 55 160 5 424 6 157 4 701 4 320 2 067 1 527 3 414 2 391 3 767 7 880 7 192 6 320
The Netherlands 147 973 11 980 12 849 8 845 10 958 6 585 5 076 17 503 14 669 11 808 16 988 15 726 14 986
Turkey 16 174 1 929 1 354 1 276 1 510 1 218 898 1 158 1 080 1 906 988 1 724 1 133
UK 447 840 46 264 52 280 49 095 34 680 22 390 18 233 30 937 31 351 29 366 39 696 40 086 53 462
Ukraine 2 605 246 244 184 182 154 187 224 187 178 221 239 359
Vatican 14 2 1 - 3 2 - 2 - - 2 2 -
Yugoslavia 4 - - - - - - - - 1 2 - 1
North America 406 192 26 962 28 247 36 622 30 665 35 872 34 631 41 069 33 425 34 827 33 418 32 306 38 148
Canada 61 179 5 176 5 880 5 708 5 128 4 505 3 345 4 473 3 951 4 880 5 835 5 459 6 839
USA 345 013 21 786 22 367 30 914 25 537 31 367 31 286 36 596 29 474 29 947 27 583 26 847 31 309
Central and South America 67 546 5 332 4 591 4 736 4 606 4 445 3 661 6 029 4 520 5 906 7 249 7 157 9 314
Antigua and Barbuda 66 4 8 2 9 3 8 3 3 11 7 5 3
Argentina 9 517 1 082 1 160 876 692 566 337 671 541 797 1 029 836 930
Bahamas 212 10 10 60 7 15 8 19 12 16 17 32 6
Barbados 212 4 20 8 17 10 22 17 21 25 12 27 29
Belize 73 1 8 7 6 5 1 6 13 8 5 4 9
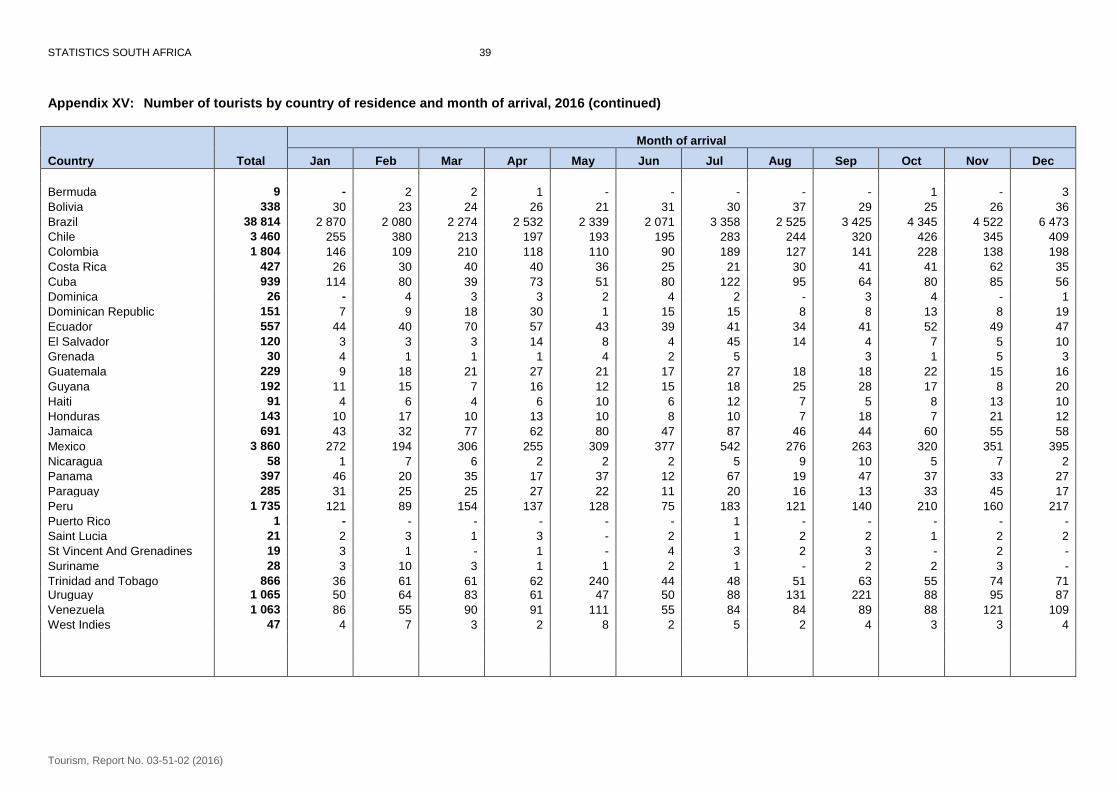
STATISTICS SOUTH AFRICA 39
Tourism, Report No. 03-51-02 (2016)
Appendix XV: Number of tourists by country of residence and month of arrival, 2016 (continued)
Country
Total
Month of arrival
Jan Feb Mar Apr May Jun Jul Aug Sep Oct Nov Dec
Bermuda 9 - 2 2 1 - - - - - 1 - 3
Bolivia 338 30 23 24 26 21 31 30 37 29 25 26 36
Brazil 38 814 2 870 2 080 2 274 2 532 2 339 2 071 3 358 2 525 3 425 4 345 4 522 6 473
Chile 3 460 255 380 213 197 193 195 283 244 320 426 345 409
Colombia 1 804 146 109 210 118 110 90 189 127 141 228 138 198
Costa Rica 427 26 30 40 40 36 25 21 30 41 41 62 35
Cuba 939 114 80 39 73 51 80 122 95 64 80 85 56
Dominica 26 - 4 3 3 2 4 2 - 3 4 - 1
Dominican Republic 151 7 9 18 30 1 15 15 8 8 13 8 19
Ecuador 557 44 40 70 57 43 39 41 34 41 52 49 47
El Salvador 120 3 3 3 14 8 4 45 14 4 7 5 10
Grenada 30 4 1 1 1 4 2 5 3 1 5 3
Guatemala 229 9 18 21 27 21 17 27 18 18 22 15 16
Guyana 192 11 15 7 16 12 15 18 25 28 17 8 20
Haiti 91 4 6 4 6 10 6 12 7 5 8 13 10
Honduras 143 10 17 10 13 10 8 10 7 18 7 21 12
Jamaica 691 43 32 77 62 80 47 87 46 44 60 55 58
Mexico 3 860 272 194 306 255 309 377 542 276 263 320 351 395
Nicaragua 58 1 7 6 2 2 2 5 9 10 5 7 2
Panama 397 46 20 35 17 37 12 67 19 47 37 33 27
Paraguay 285 31 25 25 27 22 11 20 16 13 33 45 17
Peru 1 735 121 89 154 137 128 75 183 121 140 210 160 217
Puerto Rico 1 - - - - - - 1 - - - - -
Saint Lucia 21 2 3 1 3 - 2 1 2 2 1 2 2
St Vincent And Grenadines 19 3 1 - 1 - 4 3 2 3 - 2 -
Suriname 28 3 10 3 1 1 2 1 - 2 2 3 -
Trinidad and Tobago 866 36 61 61 62 240 44 48 51 63 55 74 71 Uruguay 1 065 50 64 83 61 47 50 88 131 221 88 95 87
Venezuela 1 063 86 55 90 91 111 55 84 84 89 88 121 109
West Indies 47 4 7 3 2 8 2 5 2 4 3 3 4
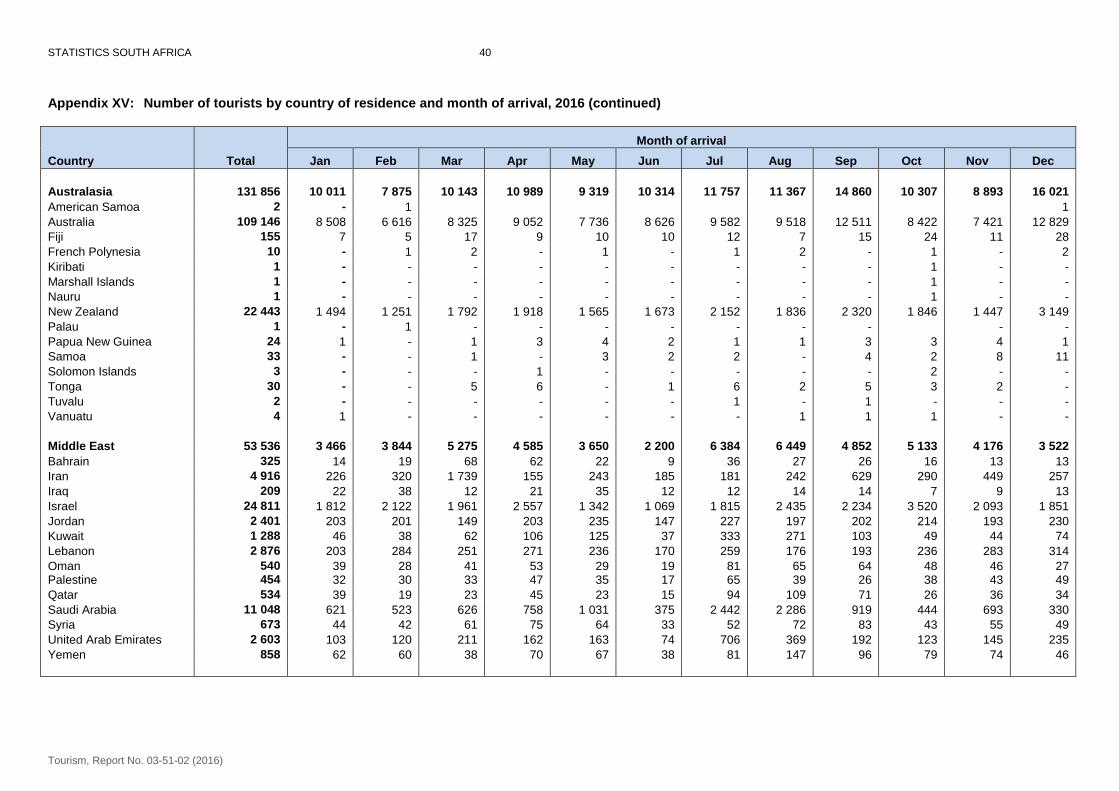
STATISTICS SOUTH AFRICA 40
Tourism, Report No. 03-51-02 (2016)
Appendix XV: Number of tourists by country of residence and month of arrival, 2016 (continued)
Country
Total
Month of arrival
Jan Feb Mar Apr May Jun Jul Aug Sep Oct Nov Dec
Australasia 131 856 10 011 7 875 10 143 10 989 9 319 10 314 11 757 11 367 14 860 10 307 8 893 16 021
American Samoa 2 - 1 1
Australia 109 146 8 508 6 616 8 325 9 052 7 736 8 626 9 582 9 518 12 511 8 422 7 421 12 829
Fiji 155 7 5 17 9 10 10 12 7 15 24 11 28
French Polynesia 10 - 1 2 - 1 - 1 2 - 1 - 2
Kiribati 1 - - - - - - - - - 1 - -
Marshall Islands 1 - - - - - - - - - 1 - -
Nauru 1 - - - - - - - - - 1 - -
New Zealand 22 443 1 494 1 251 1 792 1 918 1 565 1 673 2 152 1 836 2 320 1 846 1 447 3 149
Palau 1 - 1 - - - - - - - - -
Papua New Guinea 24 1 - 1 3 4 2 1 1 3 3 4 1
Samoa 33 - - 1 - 3 2 2 - 4 2 8 11
Solomon Islands 3 - - - 1 - - - - - 2 - -
Tonga 30 - - 5 6 - 1 6 2 5 3 2 -
Tuvalu 2 - - - - - - 1 - 1 - - -
Vanuatu 4 1 - - - - - - 1 1 1 - -
Middle East 53 536 3 466 3 844 5 275 4 585 3 650 2 200 6 384 6 449 4 852 5 133 4 176 3 522
Bahrain 325 14 19 68 62 22 9 36 27 26 16 13 13
Iran 4 916 226 320 1 739 155 243 185 181 242 629 290 449 257
Iraq 209 22 38 12 21 35 12 12 14 14 7 9 13
Israel 24 811 1 812 2 122 1 961 2 557 1 342 1 069 1 815 2 435 2 234 3 520 2 093 1 851
Jordan 2 401 203 201 149 203 235 147 227 197 202 214 193 230
Kuwait 1 288 46 38 62 106 125 37 333 271 103 49 44 74
Lebanon 2 876 203 284 251 271 236 170 259 176 193 236 283 314
Oman 540 39 28 41 53 29 19 81 65 64 48 46 27 Palestine 454 32 30 33 47 35 17 65 39 26 38 43 49
Qatar 534 39 19 23 45 23 15 94 109 71 26 36 34
Saudi Arabia 11 048 621 523 626 758 1 031 375 2 442 2 286 919 444 693 330
Syria 673 44 42 61 75 64 33 52 72 83 43 55 49
United Arab Emirates 2 603 103 120 211 162 163 74 706 369 192 123 145 235
Yemen 858 62 60 38 70 67 38 81 147 96 79 74 46
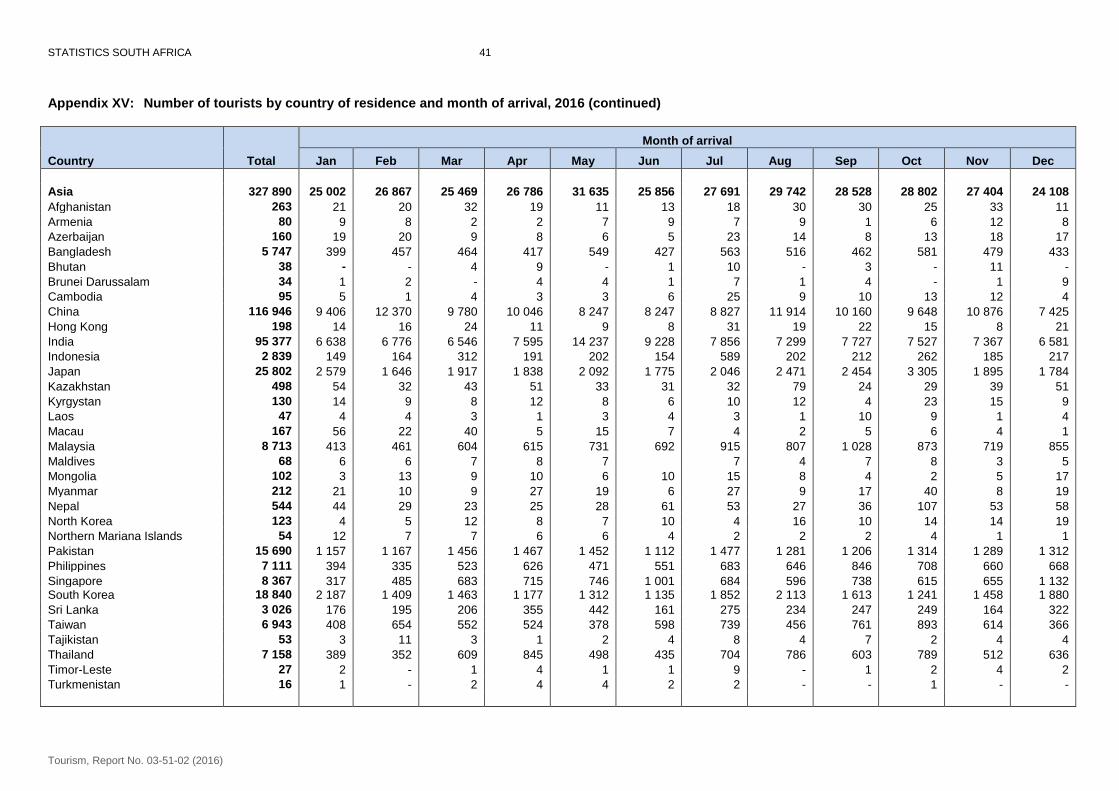
STATISTICS SOUTH AFRICA 41
Tourism, Report No. 03-51-02 (2016)
Appendix XV: Number of tourists by country of residence and month of arrival, 2016 (continued)
Country
Total
Month of arrival
Jan Feb Mar Apr May Jun Jul Aug Sep Oct Nov Dec
Asia 327 890 25 002 26 867 25 469 26 786 31 635 25 856 27 691 29 742 28 528 28 802 27 404 24 108
Afghanistan 263 21 20 32 19 11 13 18 30 30 25 33 11
Armenia 80 9 8 2 2 7 9 7 9 1 6 12 8
Azerbaijan 160 19 20 9 8 6 5 23 14 8 13 18 17
Bangladesh 5 747 399 457 464 417 549 427 563 516 462 581 479 433
Bhutan 38 - - 4 9 - 1 10 - 3 - 11 -
Brunei Darussalam 34 1 2 - 4 4 1 7 1 4 - 1 9
Cambodia 95 5 1 4 3 3 6 25 9 10 13 12 4
China 116 946 9 406 12 370 9 780 10 046 8 247 8 247 8 827 11 914 10 160 9 648 10 876 7 425
Hong Kong 198 14 16 24 11 9 8 31 19 22 15 8 21
India 95 377 6 638 6 776 6 546 7 595 14 237 9 228 7 856 7 299 7 727 7 527 7 367 6 581
Indonesia 2 839 149 164 312 191 202 154 589 202 212 262 185 217
Japan 25 802 2 579 1 646 1 917 1 838 2 092 1 775 2 046 2 471 2 454 3 305 1 895 1 784
Kazakhstan 498 54 32 43 51 33 31 32 79 24 29 39 51
Kyrgystan 130 14 9 8 12 8 6 10 12 4 23 15 9
Laos 47 4 4 3 1 3 4 3 1 10 9 1 4
Macau 167 56 22 40 5 15 7 4 2 5 6 4 1
Malaysia 8 713 413 461 604 615 731 692 915 807 1 028 873 719 855
Maldives 68 6 6 7 8 7 7 4 7 8 3 5
Mongolia 102 3 13 9 10 6 10 15 8 4 2 5 17
Myanmar 212 21 10 9 27 19 6 27 9 17 40 8 19
Nepal 544 44 29 23 25 28 61 53 27 36 107 53 58
North Korea 123 4 5 12 8 7 10 4 16 10 14 14 19
Northern Mariana Islands 54 12 7 7 6 6 4 2 2 2 4 1 1
Pakistan 15 690 1 157 1 167 1 456 1 467 1 452 1 112 1 477 1 281 1 206 1 314 1 289 1 312
Philippines 7 111 394 335 523 626 471 551 683 646 846 708 660 668
Singapore 8 367 317 485 683 715 746 1 001 684 596 738 615 655 1 132 South Korea 18 840 2 187 1 409 1 463 1 177 1 312 1 135 1 852 2 113 1 613 1 241 1 458 1 880
Sri Lanka 3 026 176 195 206 355 442 161 275 234 247 249 164 322
Taiwan 6 943 408 654 552 524 378 598 739 456 761 893 614 366
Tajikistan 53 3 11 3 1 2 4 8 4 7 2 4 4
Thailand 7 158 389 352 609 845 498 435 704 786 603 789 512 636
Timor-Leste 27 2 - 1 4 1 1 9 - 1 2 4 2
Turkmenistan 16 1 - 2 4 4 2 2 - - 1 - -
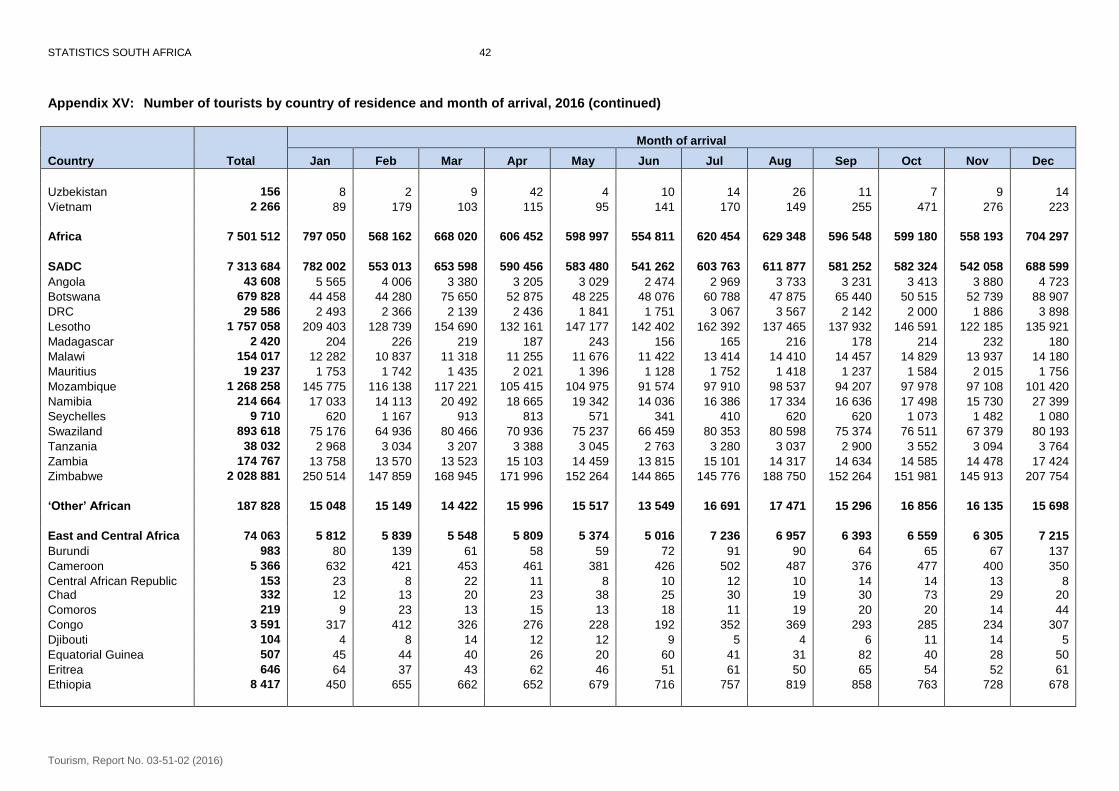
STATISTICS SOUTH AFRICA 42
Tourism, Report No. 03-51-02 (2016)
Appendix XV: Number of tourists by country of residence and month of arrival, 2016 (continued)
Country
Total
Month of arrival
Jan Feb Mar Apr May Jun Jul Aug Sep Oct Nov Dec
Uzbekistan 156 8 2 9 42 4 10 14 26 11 7 9 14
Vietnam 2 266 89 179 103 115 95 141 170 149 255 471 276 223
Africa 7 501 512 797 050 568 162 668 020 606 452 598 997 554 811 620 454 629 348 596 548 599 180 558 193 704 297
SADC 7 313 684 782 002 553 013 653 598 590 456 583 480 541 262 603 763 611 877 581 252 582 324 542 058 688 599
Angola 43 608 5 565 4 006 3 380 3 205 3 029 2 474 2 969 3 733 3 231 3 413 3 880 4 723
Botswana 679 828 44 458 44 280 75 650 52 875 48 225 48 076 60 788 47 875 65 440 50 515 52 739 88 907
DRC 29 586 2 493 2 366 2 139 2 436 1 841 1 751 3 067 3 567 2 142 2 000 1 886 3 898
Lesotho 1 757 058 209 403 128 739 154 690 132 161 147 177 142 402 162 392 137 465 137 932 146 591 122 185 135 921
Madagascar 2 420 204 226 219 187 243 156 165 216 178 214 232 180
Malawi 154 017 12 282 10 837 11 318 11 255 11 676 11 422 13 414 14 410 14 457 14 829 13 937 14 180
Mauritius 19 237 1 753 1 742 1 435 2 021 1 396 1 128 1 752 1 418 1 237 1 584 2 015 1 756
Mozambique 1 268 258 145 775 116 138 117 221 105 415 104 975 91 574 97 910 98 537 94 207 97 978 97 108 101 420
Namibia 214 664 17 033 14 113 20 492 18 665 19 342 14 036 16 386 17 334 16 636 17 498 15 730 27 399
Seychelles 9 710 620 1 167 913 813 571 341 410 620 620 1 073 1 482 1 080
Swaziland 893 618 75 176 64 936 80 466 70 936 75 237 66 459 80 353 80 598 75 374 76 511 67 379 80 193
Tanzania 38 032 2 968 3 034 3 207 3 388 3 045 2 763 3 280 3 037 2 900 3 552 3 094 3 764
Zambia 174 767 13 758 13 570 13 523 15 103 14 459 13 815 15 101 14 317 14 634 14 585 14 478 17 424
Zimbabwe 2 028 881 250 514 147 859 168 945 171 996 152 264 144 865 145 776 188 750 152 264 151 981 145 913 207 754
‘Other’ African 187 828 15 048 15 149 14 422 15 996 15 517 13 549 16 691 17 471 15 296 16 856 16 135 15 698
East and Central Africa 74 063 5 812 5 839 5 548 5 809 5 374 5 016 7 236 6 957 6 393 6 559 6 305 7 215
Burundi 983 80 139 61 58 59 72 91 90 64 65 67 137
Cameroon 5 366 632 421 453 461 381 426 502 487 376 477 400 350
Central African Republic 153 23 8 22 11 8 10 12 10 14 14 13 8 Chad 332 12 13 20 23 38 25 30 19 30 73 29 20
Comoros 219 9 23 13 15 13 18 11 19 20 20 14 44
Congo 3 591 317 412 326 276 228 192 352 369 293 285 234 307
Djibouti 104 4 8 14 12 12 9 5 4 6 11 14 5
Equatorial Guinea 507 45 44 40 26 20 60 41 31 82 40 28 50
Eritrea 646 64 37 43 62 46 51 61 50 65 54 52 61
Ethiopia 8 417 450 655 662 652 679 716 757 819 858 763 728 678
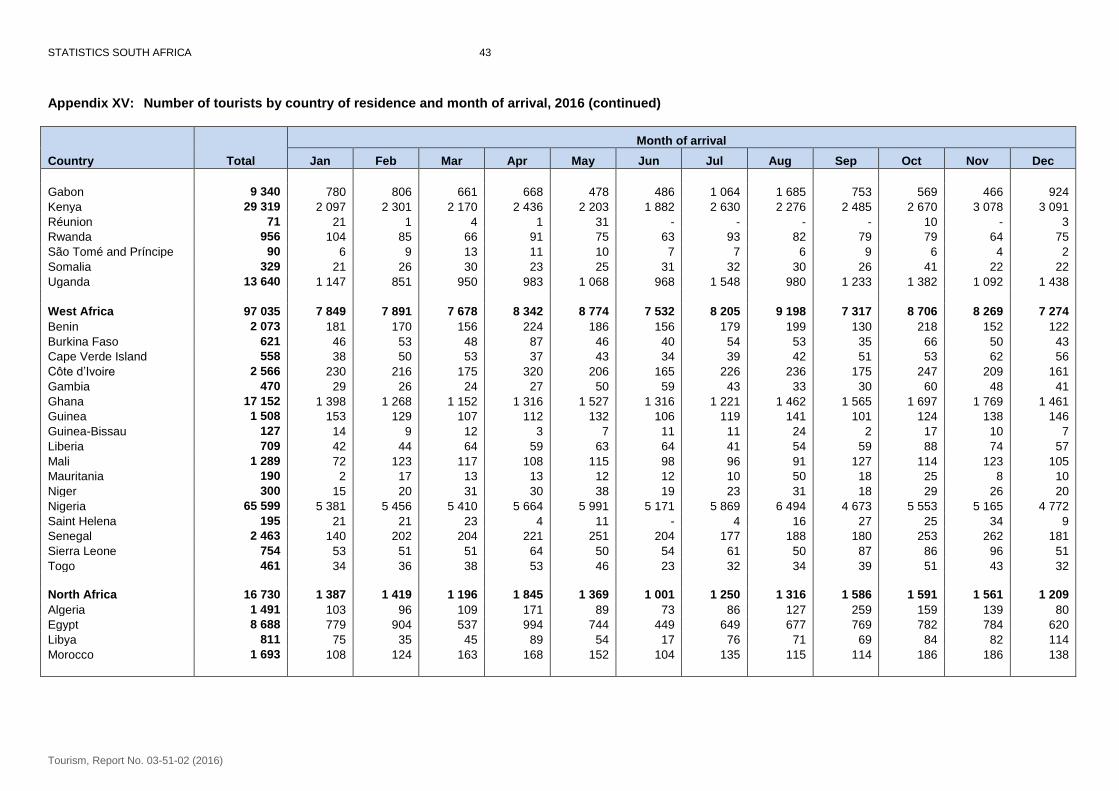
STATISTICS SOUTH AFRICA 43
Tourism, Report No. 03-51-02 (2016)
Appendix XV: Number of tourists by country of residence and month of arrival, 2016 (continued)
Country
Total
Month of arrival
Jan Feb Mar Apr May Jun Jul Aug Sep Oct Nov Dec
Gabon 9 340 780 806 661 668 478 486 1 064 1 685 753 569 466 924
Kenya 29 319 2 097 2 301 2 170 2 436 2 203 1 882 2 630 2 276 2 485 2 670 3 078 3 091
Réunion 71 21 1 4 1 31 - - - - 10 - 3
Rwanda 956 104 85 66 91 75 63 93 82 79 79 64 75
São Tomé and Príncipe 90 6 9 13 11 10 7 7 6 9 6 4 2
Somalia 329 21 26 30 23 25 31 32 30 26 41 22 22
Uganda 13 640 1 147 851 950 983 1 068 968 1 548 980 1 233 1 382 1 092 1 438
West Africa 97 035 7 849 7 891 7 678 8 342 8 774 7 532 8 205 9 198 7 317 8 706 8 269 7 274
Benin 2 073 181 170 156 224 186 156 179 199 130 218 152 122
Burkina Faso 621 46 53 48 87 46 40 54 53 35 66 50 43
Cape Verde Island 558 38 50 53 37 43 34 39 42 51 53 62 56
Côte d’Ivoire 2 566 230 216 175 320 206 165 226 236 175 247 209 161
Gambia 470 29 26 24 27 50 59 43 33 30 60 48 41
Ghana 17 152 1 398 1 268 1 152 1 316 1 527 1 316 1 221 1 462 1 565 1 697 1 769 1 461
Guinea 1 508 153 129 107 112 132 106 119 141 101 124 138 146
Guinea-Bissau 127 14 9 12 3 7 11 11 24 2 17 10 7
Liberia 709 42 44 64 59 63 64 41 54 59 88 74 57
Mali 1 289 72 123 117 108 115 98 96 91 127 114 123 105
Mauritania 190 2 17 13 13 12 12 10 50 18 25 8 10
Niger 300 15 20 31 30 38 19 23 31 18 29 26 20
Nigeria 65 599 5 381 5 456 5 410 5 664 5 991 5 171 5 869 6 494 4 673 5 553 5 165 4 772
Saint Helena 195 21 21 23 4 11 - 4 16 27 25 34 9
Senegal 2 463 140 202 204 221 251 204 177 188 180 253 262 181
Sierra Leone 754 53 51 51 64 50 54 61 50 87 86 96 51
Togo 461 34 36 38 53 46 23 32 34 39 51 43 32
North Africa 16 730 1 387 1 419 1 196 1 845 1 369 1 001 1 250 1 316 1 586 1 591 1 561 1 209
Algeria 1 491 103 96 109 171 89 73 86 127 259 159 139 80
Egypt 8 688 779 904 537 994 744 449 649 677 769 782 784 620
Libya 811 75 35 45 89 54 17 76 71 69 84 82 114
Morocco 1 693 108 124 163 168 152 104 135 115 114 186 186 138
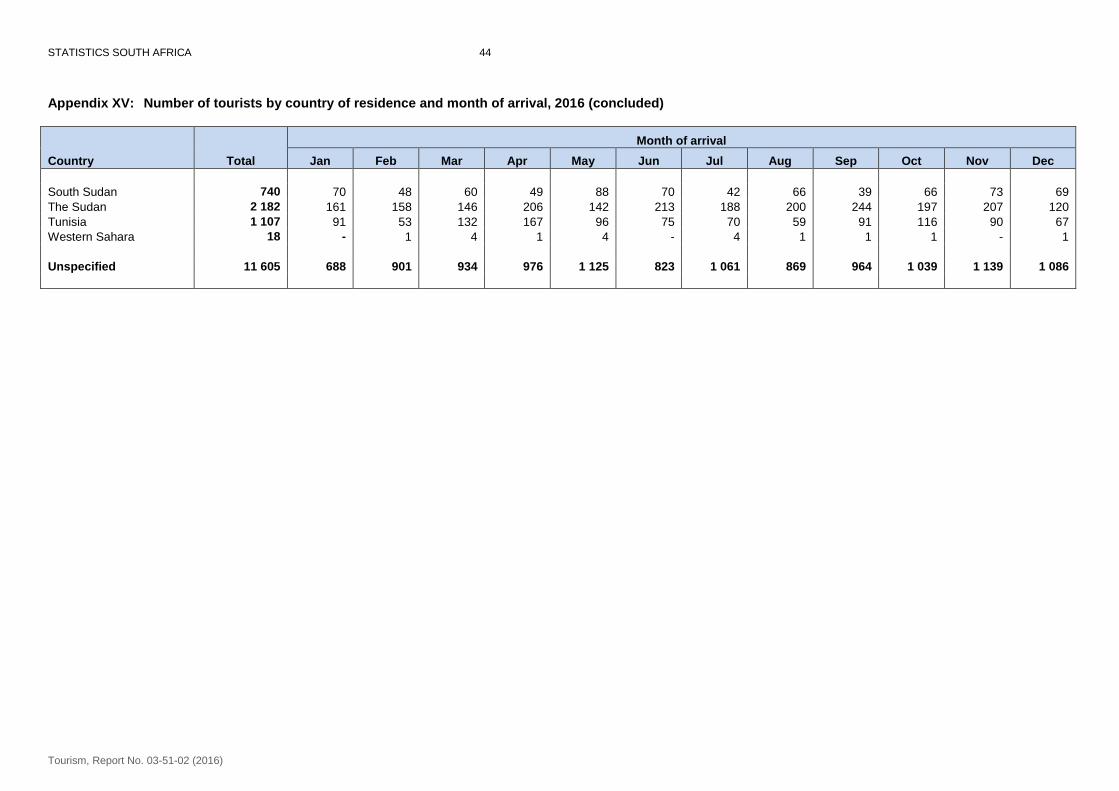
STATISTICS SOUTH AFRICA 44
Tourism, Report No. 03-51-02 (2016)
Appendix XV: Number of tourists by country of residence and month of arrival, 2016 (concluded)
Country
Total
Month of arrival
Jan Feb Mar Apr May Jun Jul Aug Sep Oct Nov Dec
South Sudan 740 70 48 60 49 88 70 42 66 39 66 73 69
The Sudan 2 182 161 158 146 206 142 213 188 200 244 197 207 120
Tunisia 1 107 91 53 132 167 96 75 70 59 91 116 90 67
Western Sahara 18 - 1 4 1 4 - 4 1 1 1 - 1
Unspecified 11 605 688 901 934 976 1 125 823 1 061 869 964 1 039 1 139 1 086
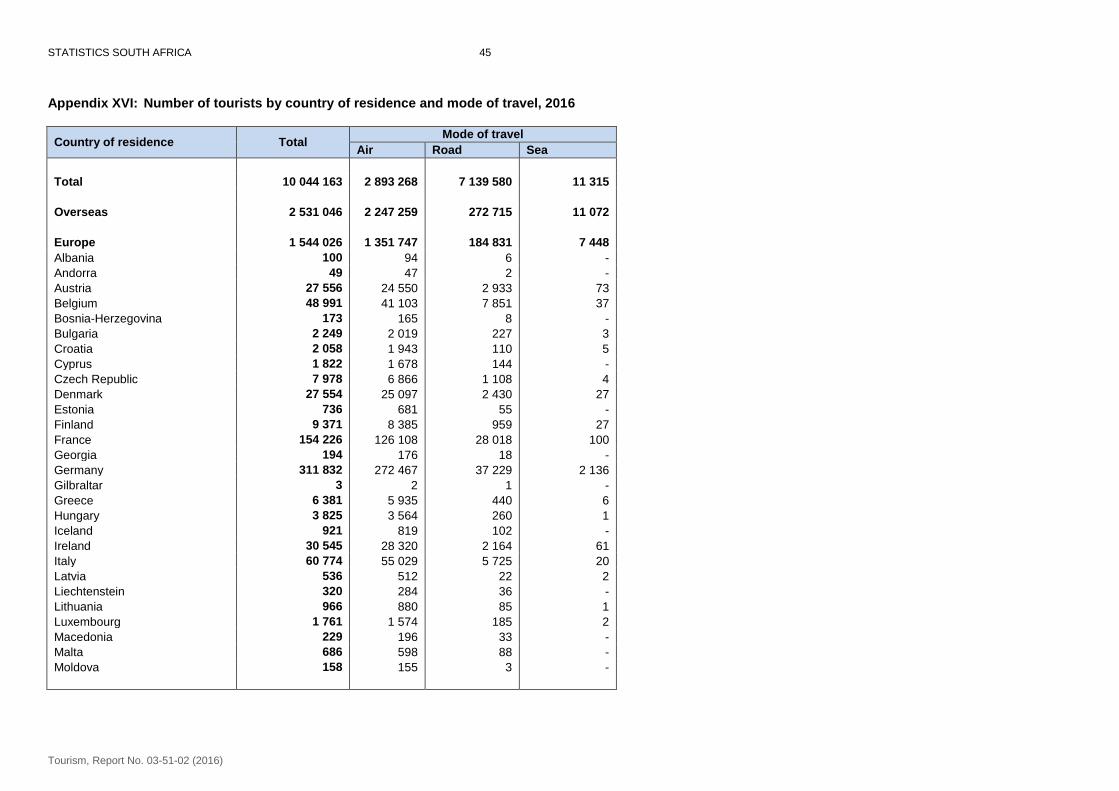
STATISTICS SOUTH AFRICA 45
Tourism, Report No. 03-51-02 (2016)
Appendix XVI: Number of tourists by country of residence and mode of travel, 2016
Country of residence Total Mode of travel
Air Road Sea
Total 10 044 163 2 893 268 7 139 580 11 315
Overseas 2 531 046 2 247 259 272 715 11 072
Europe 1 544 026 1 351 747 184 831 7 448
Albania 100 94 6 -
Andorra 49 47 2 -
Austria 27 556 24 550 2 933 73
Belgium 48 991 41 103 7 851 37
Bosnia-Herzegovina 173 165 8 -
Bulgaria 2 249 2 019 227 3
Croatia 2 058 1 943 110 5
Cyprus 1 822 1 678 144 -
Czech Republic 7 978 6 866 1 108 4
Denmark 27 554 25 097 2 430 27
Estonia 736 681 55 -
Finland 9 371 8 385 959 27
France 154 226 126 108 28 018 100
Georgia 194 176 18 -
Germany 311 832 272 467 37 229 2 136
Gilbraltar 3 2 1 -
Greece 6 381 5 935 440 6
Hungary 3 825 3 564 260 1
Iceland 921 819 102 -
Ireland 30 545 28 320 2 164 61
Italy 60 774 55 029 5 725 20
Latvia 536 512 22 2
Liechtenstein 320 284 36 -
Lithuania 966 880 85 1
Luxembourg 1 761 1 574 185 2
Macedonia 229 196 33 -
Malta 686 598 88 -
Moldova 158 155 3 -
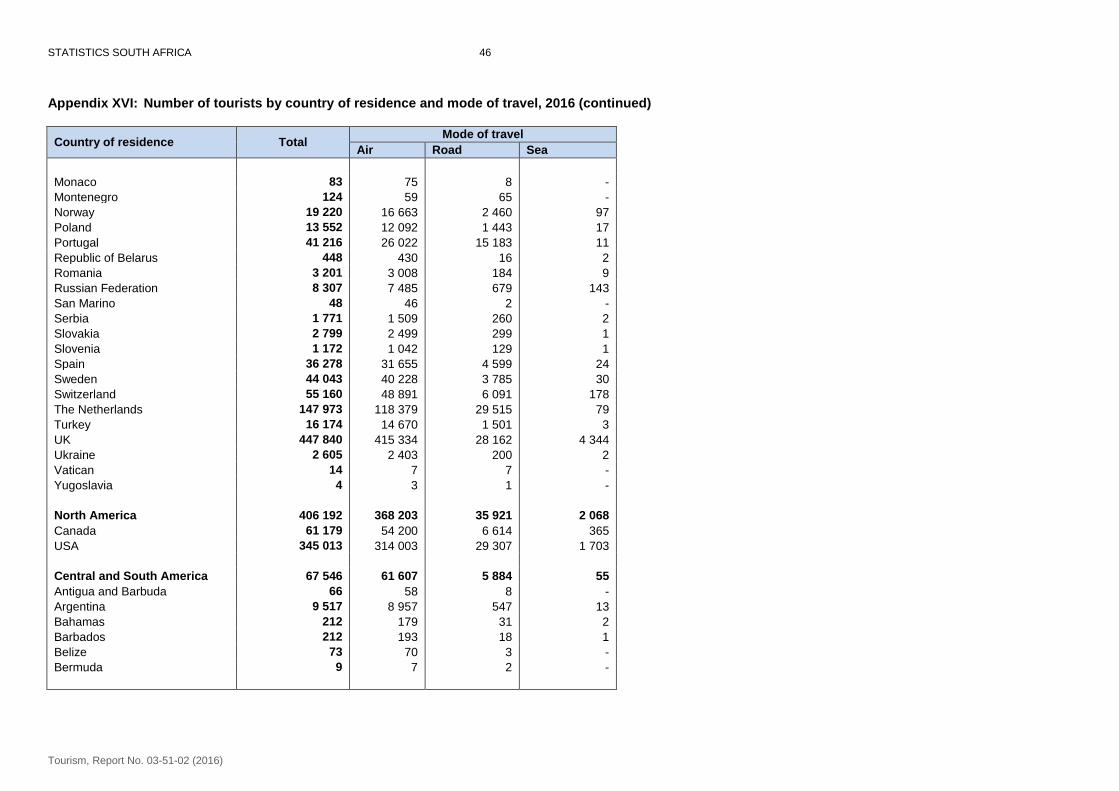
STATISTICS SOUTH AFRICA 46
Tourism, Report No. 03-51-02 (2016)
Appendix XVI: Number of tourists by country of residence and mode of travel, 2016 (continued)
Country of residence Total Mode of travel
Air Road Sea
Monaco 83 75 8 -
Montenegro 124 59 65 -
Norway 19 220 16 663 2 460 97
Poland 13 552 12 092 1 443 17
Portugal 41 216 26 022 15 183 11
Republic of Belarus 448 430 16 2
Romania 3 201 3 008 184 9
Russian Federation 8 307 7 485 679 143
San Marino 48 46 2 -
Serbia 1 771 1 509 260 2
Slovakia 2 799 2 499 299 1
Slovenia 1 172 1 042 129 1
Spain 36 278 31 655 4 599 24
Sweden 44 043 40 228 3 785 30
Switzerland 55 160 48 891 6 091 178
The Netherlands 147 973 118 379 29 515 79
Turkey 16 174 14 670 1 501 3
UK 447 840 415 334 28 162 4 344
Ukraine 2 605 2 403 200 2
Vatican 14 7 7 -
Yugoslavia 4 3 1 -
North America 406 192 368 203 35 921 2 068
Canada 61 179 54 200 6 614 365
USA 345 013 314 003 29 307 1 703
Central and South America 67 546 61 607 5 884 55
Antigua and Barbuda 66 58 8 -
Argentina 9 517 8 957 547 13
Bahamas 212 179 31 2
Barbados 212 193 18 1
Belize 73 70 3 -
Bermuda 9 7 2 -
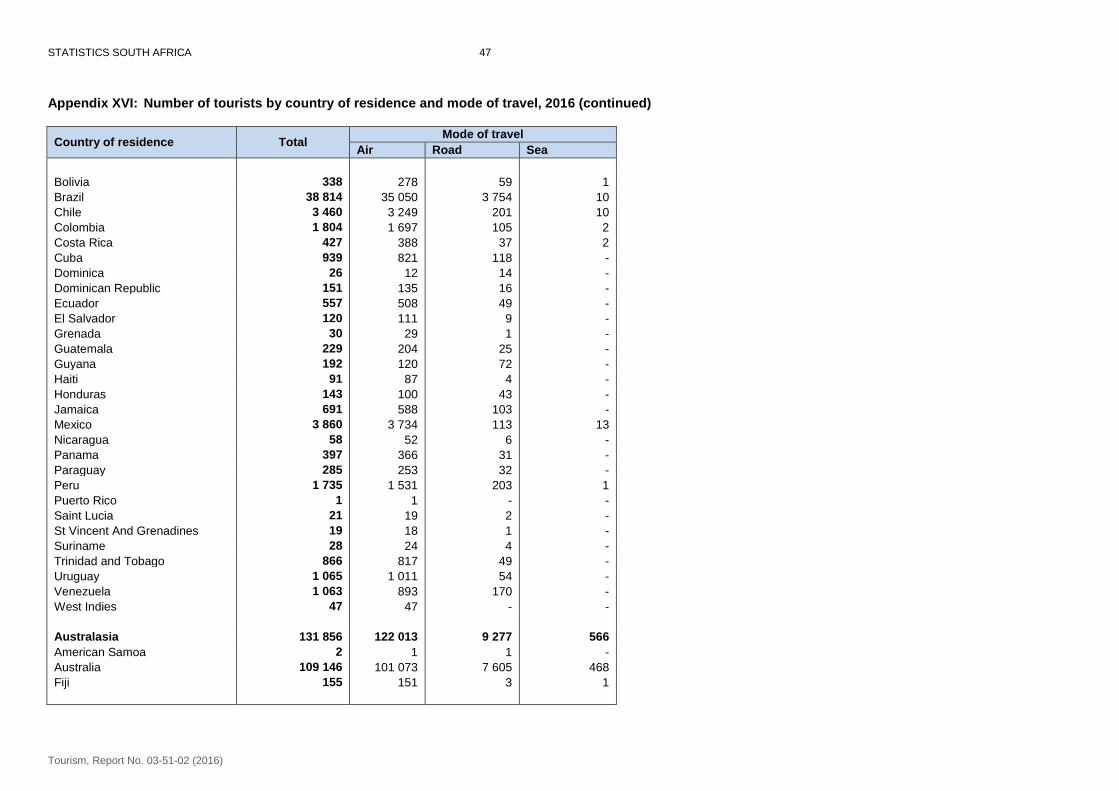
STATISTICS SOUTH AFRICA 47
Tourism, Report No. 03-51-02 (2016)
Appendix XVI: Number of tourists by country of residence and mode of travel, 2016 (continued)
Country of residence Total Mode of travel
Air Road Sea
Bolivia 338 278 59 1
Brazil 38 814 35 050 3 754 10
Chile 3 460 3 249 201 10
Colombia 1 804 1 697 105 2
Costa Rica 427 388 37 2
Cuba 939 821 118 -
Dominica 26 12 14 -
Dominican Republic 151 135 16 -
Ecuador 557 508 49 -
El Salvador 120 111 9 -
Grenada 30 29 1 -
Guatemala 229 204 25 -
Guyana 192 120 72 -
Haiti 91 87 4 -
Honduras 143 100 43 -
Jamaica 691 588 103 -
Mexico 3 860 3 734 113 13
Nicaragua 58 52 6 -
Panama 397 366 31 -
Paraguay 285 253 32 -
Peru 1 735 1 531 203 1
Puerto Rico 1 1 - -
Saint Lucia 21 19 2 -
St Vincent And Grenadines 19 18 1 -
Suriname 28 24 4 -
Trinidad and Tobago 866 817 49 -
Uruguay 1 065 1 011 54 -
Venezuela 1 063 893 170 -
West Indies 47 47 - -
Australasia 131 856 122 013 9 277 566
American Samoa 2 1 1 -
Australia 109 146 101 073 7 605 468
Fiji 155 151 3 1
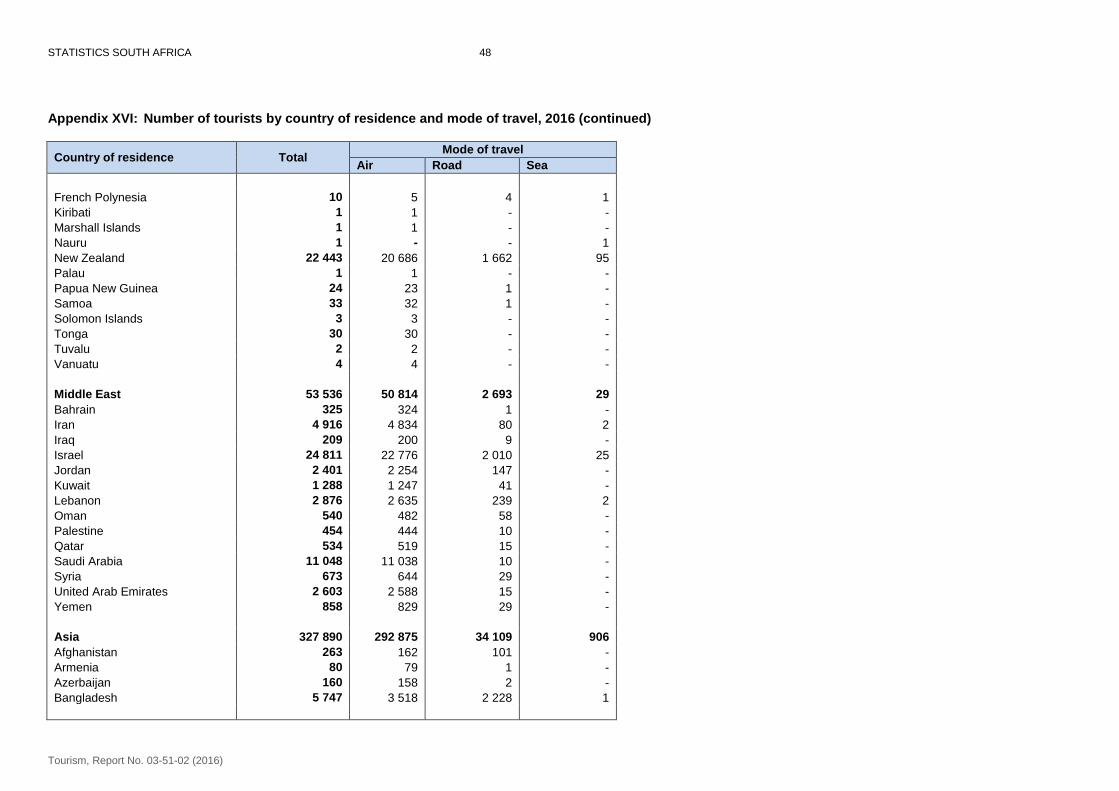
STATISTICS SOUTH AFRICA 48
Tourism, Report No. 03-51-02 (2016)
Appendix XVI: Number of tourists by country of residence and mode of travel, 2016 (continued)
Country of residence Total Mode of travel
Air Road Sea
French Polynesia 10 5 4 1
Kiribati 1 1 - -
Marshall Islands 1 1 - -
Nauru 1 - - 1
New Zealand 22 443 20 686 1 662 95
Palau 1 1 - -
Papua New Guinea 24 23 1 -
Samoa 33 32 1 -
Solomon Islands 3 3 - -
Tonga 30 30 - -
Tuvalu 2 2 - -
Vanuatu 4 4 - -
Middle East 53 536 50 814 2 693 29
Bahrain 325 324 1 -
Iran 4 916 4 834 80 2
Iraq 209 200 9 -
Israel 24 811 22 776 2 010 25
Jordan 2 401 2 254 147 -
Kuwait 1 288 1 247 41 -
Lebanon 2 876 2 635 239 2
Oman 540 482 58 -
Palestine 454 444 10 -
Qatar 534 519 15 -
Saudi Arabia 11 048 11 038 10 -
Syria 673 644 29 -
United Arab Emirates 2 603 2 588 15 -
Yemen 858 829 29 -
Asia 327 890 292 875 34 109 906
Afghanistan 263 162 101 -
Armenia 80 79 1 -
Azerbaijan 160 158 2 -
Bangladesh 5 747 3 518 2 228 1
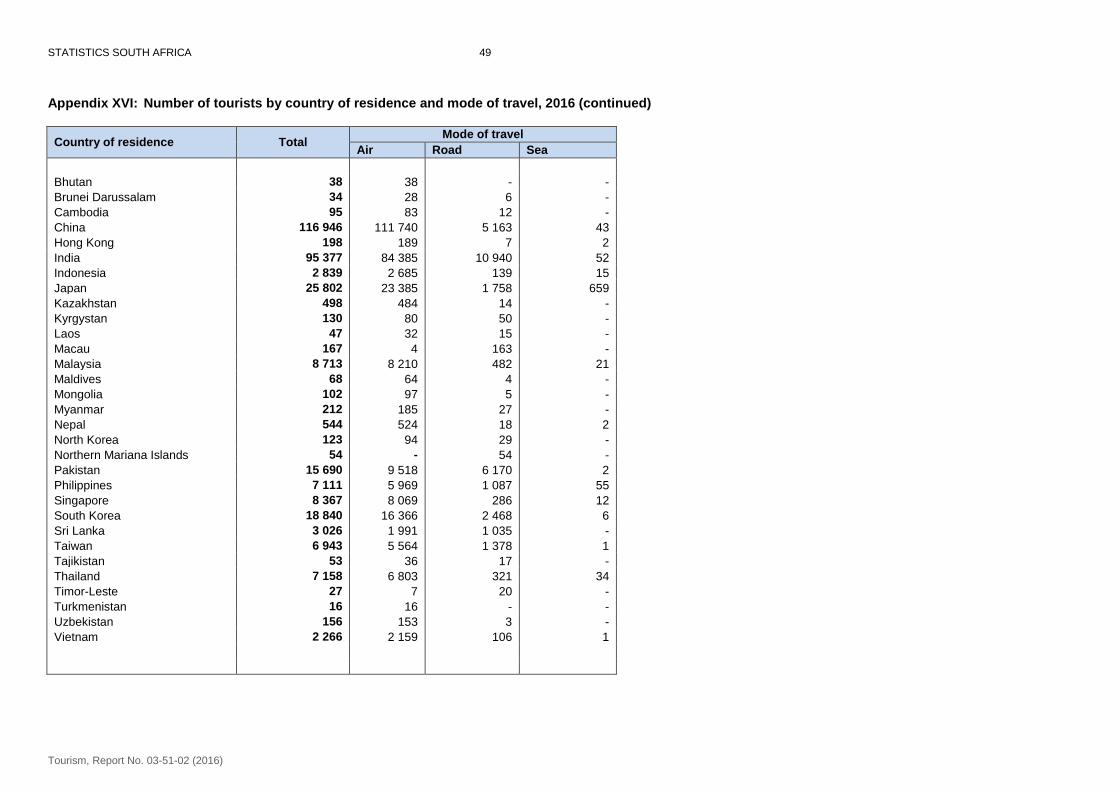
STATISTICS SOUTH AFRICA 49
Tourism, Report No. 03-51-02 (2016)
Appendix XVI: Number of tourists by country of residence and mode of travel, 2016 (continued)
Country of residence Total Mode of travel
Air Road Sea
Bhutan 38 38 - -
Brunei Darussalam 34 28 6 -
Cambodia 95 83 12 -
China 116 946 111 740 5 163 43
Hong Kong 198 189 7 2
India 95 377 84 385 10 940 52
Indonesia 2 839 2 685 139 15
Japan 25 802 23 385 1 758 659
Kazakhstan 498 484 14 -
Kyrgystan 130 80 50 -
Laos 47 32 15 -
Macau 167 4 163 -
Malaysia 8 713 8 210 482 21
Maldives 68 64 4 -
Mongolia 102 97 5 -
Myanmar 212 185 27 -
Nepal 544 524 18 2
North Korea 123 94 29 -
Northern Mariana Islands 54 - 54 -
Pakistan 15 690 9 518 6 170 2
Philippines 7 111 5 969 1 087 55
Singapore 8 367 8 069 286 12
South Korea 18 840 16 366 2 468 6
Sri Lanka 3 026 1 991 1 035 -
Taiwan 6 943 5 564 1 378 1
Tajikistan 53 36 17 -
Thailand 7 158 6 803 321 34
Timor-Leste 27 7 20 -
Turkmenistan 16 16 - -
Uzbekistan 156 153 3 -
Vietnam 2 266 2 159 106 1
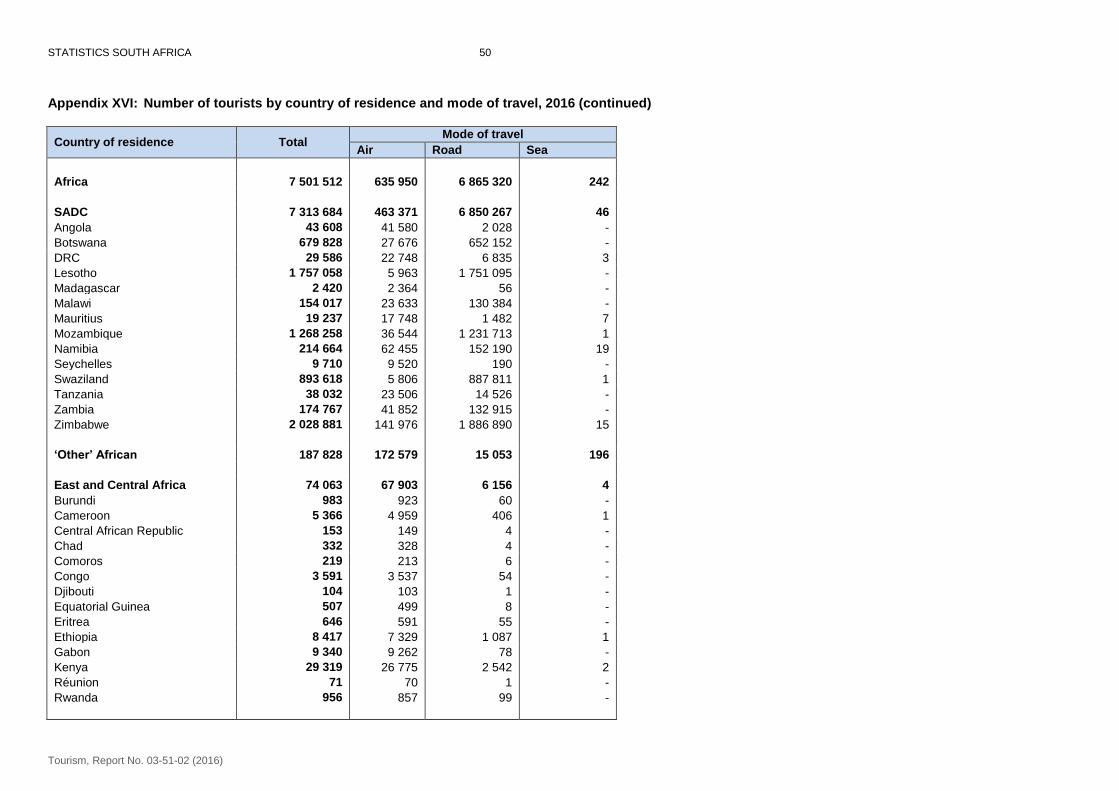
STATISTICS SOUTH AFRICA 50
Tourism, Report No. 03-51-02 (2016)
Appendix XVI: Number of tourists by country of residence and mode of travel, 2016 (continued)
Country of residence Total Mode of travel
Air Road Sea
Africa 7 501 512 635 950 6 865 320 242
SADC 7 313 684 463 371 6 850 267 46
Angola 43 608 41 580 2 028 -
Botswana 679 828 27 676 652 152 -
DRC 29 586 22 748 6 835 3
Lesotho 1 757 058 5 963 1 751 095 -
Madagascar 2 420 2 364 56 -
Malawi 154 017 23 633 130 384 -
Mauritius 19 237 17 748 1 482 7
Mozambique 1 268 258 36 544 1 231 713 1
Namibia 214 664 62 455 152 190 19
Seychelles 9 710 9 520 190 -
Swaziland 893 618 5 806 887 811 1
Tanzania 38 032 23 506 14 526 -
Zambia 174 767 41 852 132 915 -
Zimbabwe 2 028 881 141 976 1 886 890 15
‘Other’ African 187 828 172 579 15 053 196
East and Central Africa 74 063 67 903 6 156 4
Burundi 983 923 60 -
Cameroon 5 366 4 959 406 1
Central African Republic 153 149 4 -
Chad 332 328 4 -
Comoros 219 213 6 -
Congo 3 591 3 537 54 -
Djibouti 104 103 1 -
Equatorial Guinea 507 499 8 -
Eritrea 646 591 55 -
Ethiopia 8 417 7 329 1 087 1
Gabon 9 340 9 262 78 -
Kenya 29 319 26 775 2 542 2
Réunion 71 70 1 -
Rwanda 956 857 99 -
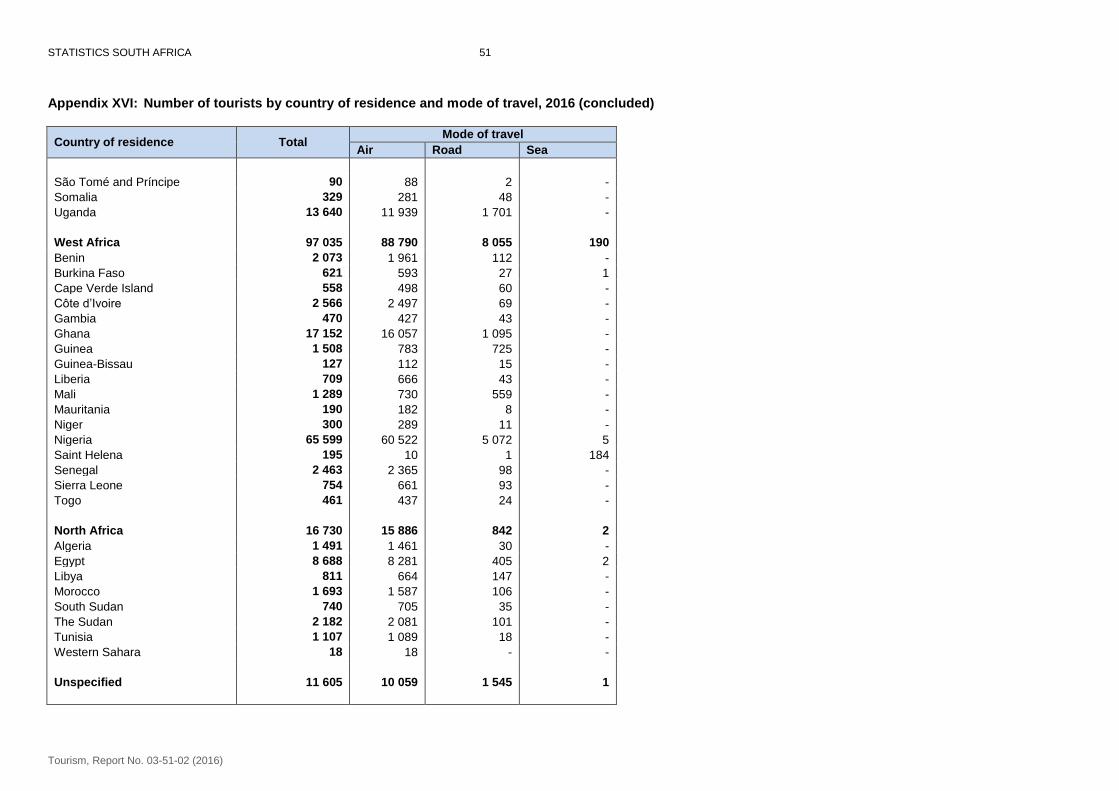
STATISTICS SOUTH AFRICA 51
Tourism, Report No. 03-51-02 (2016)
Appendix XVI: Number of tourists by country of residence and mode of travel, 2016 (concluded)
Country of residence Total Mode of travel
Air Road Sea
São Tomé and Príncipe 90 88 2 -
Somalia 329 281 48 -
Uganda 13 640 11 939 1 701 -
West Africa 97 035 88 790 8 055 190
Benin 2 073 1 961 112 -
Burkina Faso 621 593 27 1
Cape Verde Island 558 498 60 -
Côte d’Ivoire 2 566 2 497 69 -
Gambia 470 427 43 -
Ghana 17 152 16 057 1 095 -
Guinea 1 508 783 725 -
Guinea-Bissau 127 112 15 -
Liberia 709 666 43 -
Mali 1 289 730 559 -
Mauritania 190 182 8 -
Niger 300 289 11 -
Nigeria 65 599 60 522 5 072 5
Saint Helena 195 10 1 184
Senegal 2 463 2 365 98 -
Sierra Leone 754 661 93 -
Togo 461 437 24 -
North Africa 16 730 15 886 842 2
Algeria 1 491 1 461 30 -
Egypt 8 688 8 281 405 2
Libya 811 664 147 -
Morocco 1 693 1 587 106 -
South Sudan 740 705 35 -
The Sudan 2 182 2 081 101 -
Tunisia 1 107 1 089 18 -
Western Sahara 18 18 - -
Unspecified 11 605 10 059 1 545 1
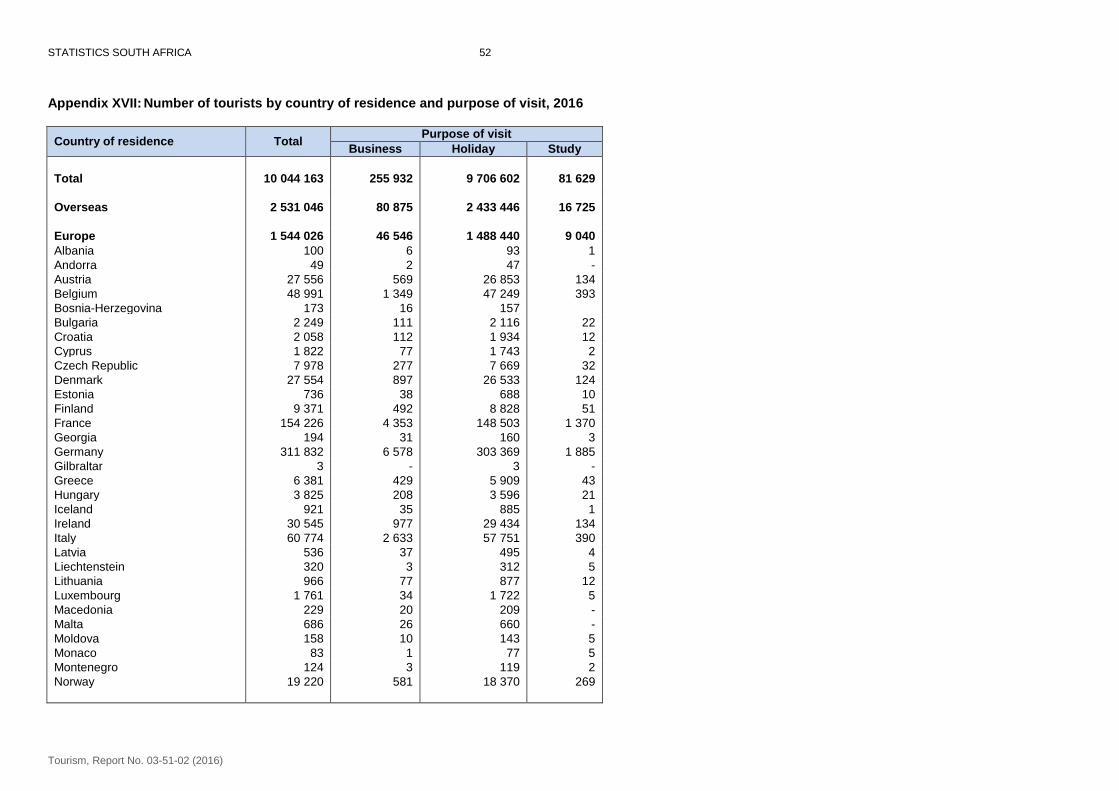
STATISTICS SOUTH AFRICA 52
Tourism, Report No. 03-51-02 (2016)
Appendix XVII: Number of tourists by country of residence and purpose of visit, 2016
Country of residence Total Purpose of visit
Business Holiday Study
Total 10 044 163 255 932 9 706 602 81 629
Overseas 2 531 046 80 875 2 433 446 16 725
Europe 1 544 026 46 546 1 488 440 9 040
Albania 100 6 93 1
Andorra 49 2 47 -
Austria 27 556 569 26 853 134
Belgium 48 991 1 349 47 249 393
Bosnia-Herzegovina 173 16 157 Bulgaria 2 249 111 2 116 22
Croatia 2 058 112 1 934 12
Cyprus 1 822 77 1 743 2
Czech Republic 7 978 277 7 669 32
Denmark 27 554 897 26 533 124
Estonia 736 38 688 10
Finland 9 371 492 8 828 51
France 154 226 4 353 148 503 1 370
Georgia 194 31 160 3
Germany 311 832 6 578 303 369 1 885
Gilbraltar 3 - 3 -
Greece 6 381 429 5 909 43
Hungary 3 825 208 3 596 21
Iceland 921 35 885 1
Ireland 30 545 977 29 434 134
Italy 60 774 2 633 57 751 390
Latvia 536 37 495 4
Liechtenstein 320 3 312 5
Lithuania 966 77 877 12
Luxembourg 1 761 34 1 722 5
Macedonia 229 20 209 -
Malta 686 26 660 -
Moldova 158 10 143 5
Monaco 83 1 77 5
Montenegro 124 3 119 2
Norway 19 220 581 18 370 269
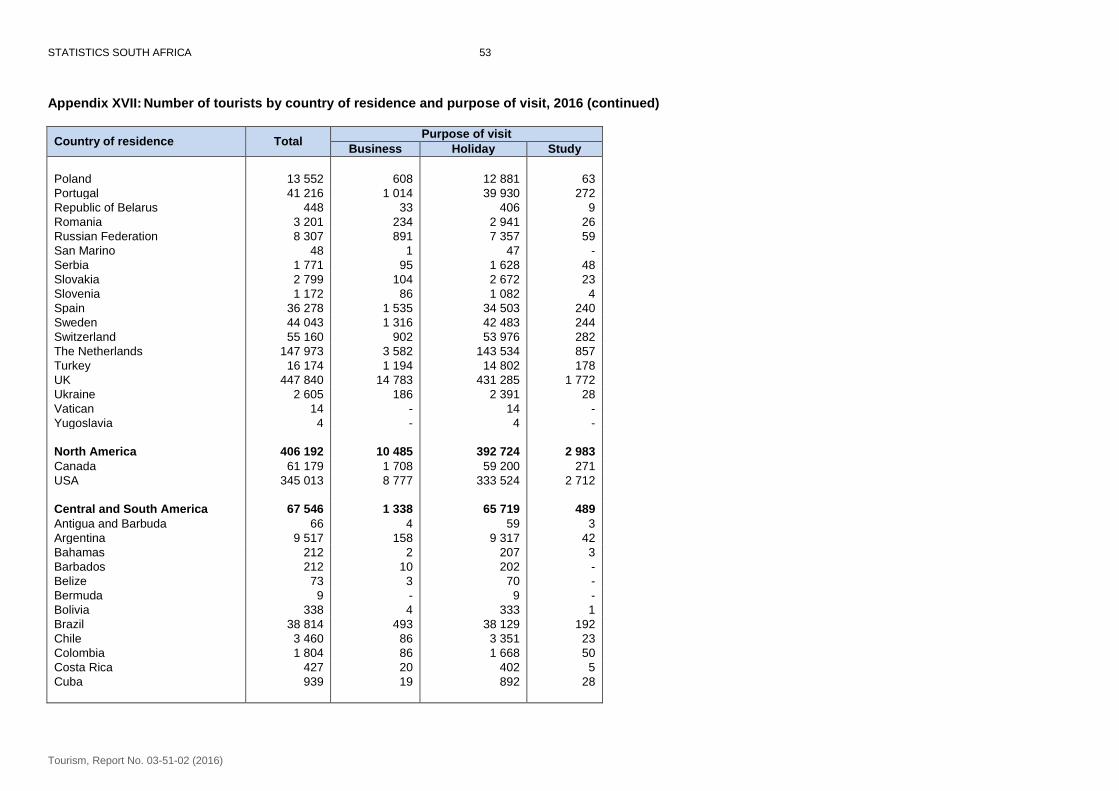
STATISTICS SOUTH AFRICA 53
Tourism, Report No. 03-51-02 (2016)
Appendix XVII: Number of tourists by country of residence and purpose of visit, 2016 (continued)
Country of residence Total Purpose of visit
Business Holiday Study
Poland 13 552 608 12 881 63
Portugal 41 216 1 014 39 930 272
Republic of Belarus 448 33 406 9
Romania 3 201 234 2 941 26
Russian Federation 8 307 891 7 357 59
San Marino 48 1 47 -
Serbia 1 771 95 1 628 48
Slovakia 2 799 104 2 672 23
Slovenia 1 172 86 1 082 4
Spain 36 278 1 535 34 503 240
Sweden 44 043 1 316 42 483 244
Switzerland 55 160 902 53 976 282
The Netherlands 147 973 3 582 143 534 857
Turkey 16 174 1 194 14 802 178
UK 447 840 14 783 431 285 1 772
Ukraine 2 605 186 2 391 28
Vatican 14 - 14 -
Yugoslavia 4 - 4 -
North America 406 192 10 485 392 724 2 983
Canada 61 179 1 708 59 200 271
USA 345 013 8 777 333 524 2 712
Central and South America 67 546 1 338 65 719 489
Antigua and Barbuda 66 4 59 3
Argentina 9 517 158 9 317 42
Bahamas 212 2 207 3
Barbados 212 10 202 -
Belize 73 3 70 -
Bermuda 9 - 9 -
Bolivia 338 4 333 1
Brazil 38 814 493 38 129 192
Chile 3 460 86 3 351 23
Colombia 1 804 86 1 668 50
Costa Rica 427 20 402 5
Cuba 939 19 892 28
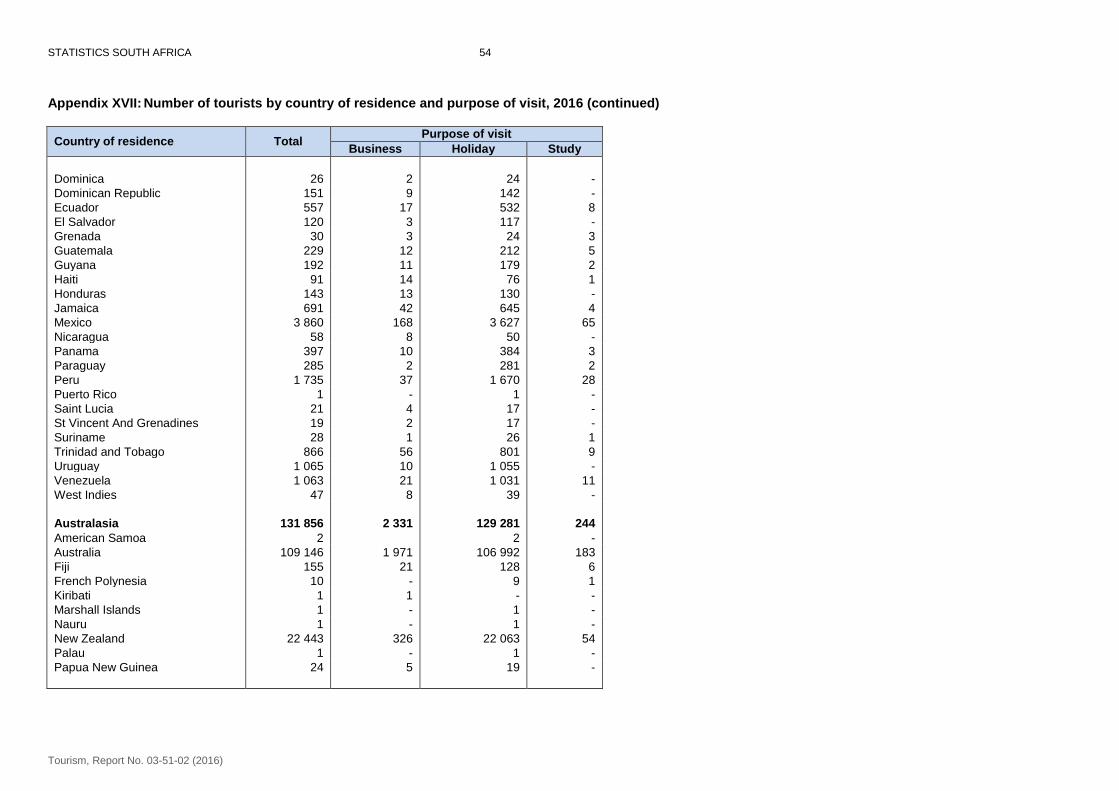
STATISTICS SOUTH AFRICA 54
Tourism, Report No. 03-51-02 (2016)
Appendix XVII: Number of tourists by country of residence and purpose of visit, 2016 (continued)
Country of residence Total Purpose of visit
Business Holiday Study
Dominica 26 2 24 -
Dominican Republic 151 9 142 -
Ecuador 557 17 532 8
El Salvador 120 3 117 -
Grenada 30 3 24 3
Guatemala 229 12 212 5
Guyana 192 11 179 2
Haiti 91 14 76 1
Honduras 143 13 130 -
Jamaica 691 42 645 4
Mexico 3 860 168 3 627 65
Nicaragua 58 8 50 -
Panama 397 10 384 3
Paraguay 285 2 281 2
Peru 1 735 37 1 670 28
Puerto Rico 1 - 1 -
Saint Lucia 21 4 17 -
St Vincent And Grenadines 19 2 17 -
Suriname 28 1 26 1
Trinidad and Tobago 866 56 801 9
Uruguay 1 065 10 1 055 -
Venezuela 1 063 21 1 031 11
West Indies 47 8 39 -
Australasia 131 856 2 331 129 281 244
American Samoa 2
2 -
Australia 109 146 1 971 106 992 183
Fiji 155 21 128 6
French Polynesia 10 - 9 1
Kiribati 1 1 - -
Marshall Islands 1 - 1 -
Nauru 1 - 1 -
New Zealand 22 443 326 22 063 54
Palau 1 - 1 -
Papua New Guinea 24 5 19 -
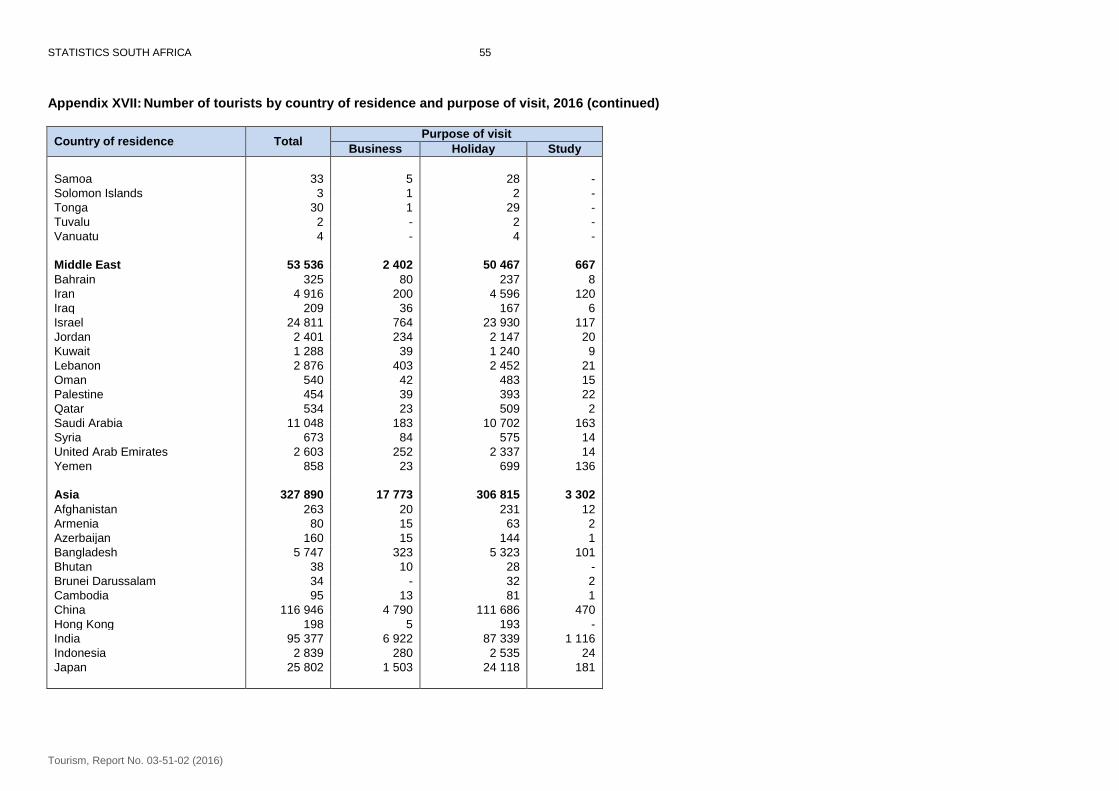
STATISTICS SOUTH AFRICA 55
Tourism, Report No. 03-51-02 (2016)
Appendix XVII: Number of tourists by country of residence and purpose of visit, 2016 (continued)
Country of residence Total Purpose of visit
Business Holiday Study
Samoa 33 5 28 -
Solomon Islands 3 1 2 -
Tonga 30 1 29 -
Tuvalu 2 - 2 -
Vanuatu 4 - 4 -
Middle East 53 536 2 402 50 467 667
Bahrain 325 80 237 8
Iran 4 916 200 4 596 120
Iraq 209 36 167 6
Israel 24 811 764 23 930 117
Jordan 2 401 234 2 147 20
Kuwait 1 288 39 1 240 9
Lebanon 2 876 403 2 452 21
Oman 540 42 483 15
Palestine 454 39 393 22
Qatar 534 23 509 2
Saudi Arabia 11 048 183 10 702 163
Syria 673 84 575 14
United Arab Emirates 2 603 252 2 337 14
Yemen 858 23 699 136
Asia 327 890 17 773 306 815 3 302
Afghanistan 263 20 231 12
Armenia 80 15 63 2
Azerbaijan 160 15 144 1
Bangladesh 5 747 323 5 323 101
Bhutan 38 10 28 -
Brunei Darussalam 34 - 32 2
Cambodia 95 13 81 1
China 116 946 4 790 111 686 470
Hong Kong 198 5 193 -
India 95 377 6 922 87 339 1 116
Indonesia 2 839 280 2 535 24
Japan 25 802 1 503 24 118 181
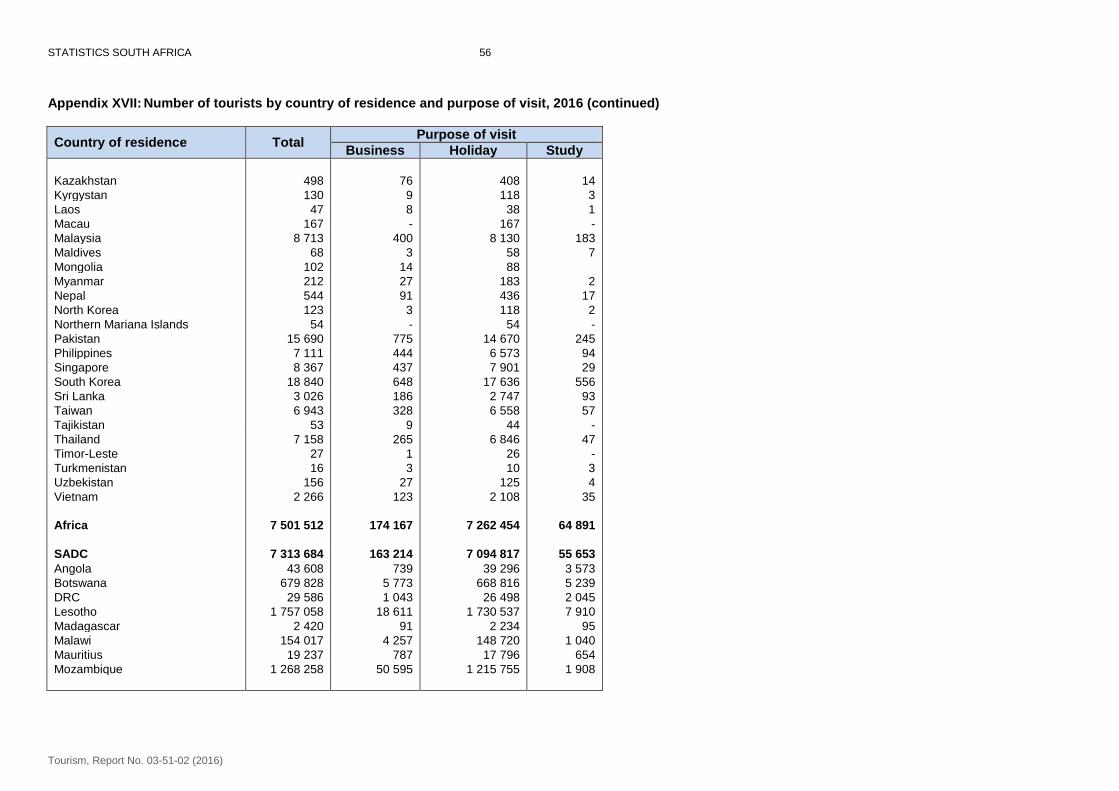
STATISTICS SOUTH AFRICA 56
Tourism, Report No. 03-51-02 (2016)
Appendix XVII: Number of tourists by country of residence and purpose of visit, 2016 (continued)
Country of residence Total Purpose of visit
Business Holiday Study
Kazakhstan 498 76 408 14
Kyrgystan 130 9 118 3
Laos 47 8 38 1
Macau 167 - 167 -
Malaysia 8 713 400 8 130 183
Maldives 68 3 58 7
Mongolia 102 14 88 Myanmar 212 27 183 2
Nepal 544 91 436 17
North Korea 123 3 118 2
Northern Mariana Islands 54 - 54 -
Pakistan 15 690 775 14 670 245
Philippines 7 111 444 6 573 94
Singapore 8 367 437 7 901 29
South Korea 18 840 648 17 636 556
Sri Lanka 3 026 186 2 747 93
Taiwan 6 943 328 6 558 57
Tajikistan 53 9 44 -
Thailand 7 158 265 6 846 47
Timor-Leste 27 1 26 -
Turkmenistan 16 3 10 3
Uzbekistan 156 27 125 4
Vietnam 2 266 123 2 108 35
Africa 7 501 512 174 167 7 262 454 64 891
SADC 7 313 684 163 214 7 094 817 55 653
Angola 43 608 739 39 296 3 573
Botswana 679 828 5 773 668 816 5 239
DRC 29 586 1 043 26 498 2 045
Lesotho 1 757 058 18 611 1 730 537 7 910
Madagascar 2 420 91 2 234 95
Malawi 154 017 4 257 148 720 1 040
Mauritius 19 237 787 17 796 654
Mozambique 1 268 258 50 595 1 215 755 1 908
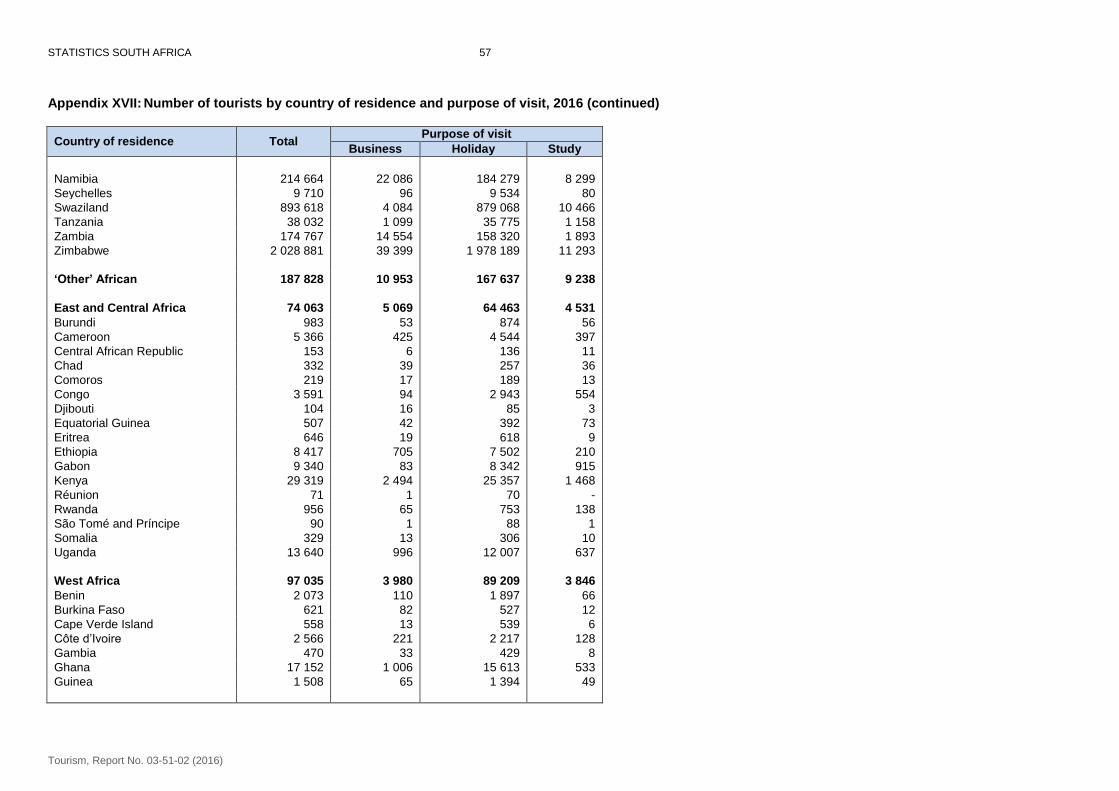
STATISTICS SOUTH AFRICA 57
Tourism, Report No. 03-51-02 (2016)
Appendix XVII: Number of tourists by country of residence and purpose of visit, 2016 (continued)
Country of residence Total Purpose of visit
Business Holiday Study
Namibia 214 664 22 086 184 279 8 299
Seychelles 9 710 96 9 534 80
Swaziland 893 618 4 084 879 068 10 466
Tanzania 38 032 1 099 35 775 1 158
Zambia 174 767 14 554 158 320 1 893
Zimbabwe 2 028 881 39 399 1 978 189 11 293
‘Other’ African 187 828 10 953 167 637 9 238
East and Central Africa 74 063 5 069 64 463 4 531
Burundi 983 53 874 56
Cameroon 5 366 425 4 544 397
Central African Republic 153 6 136 11
Chad 332 39 257 36
Comoros 219 17 189 13
Congo 3 591 94 2 943 554
Djibouti 104 16 85 3
Equatorial Guinea 507 42 392 73
Eritrea 646 19 618 9
Ethiopia 8 417 705 7 502 210
Gabon 9 340 83 8 342 915
Kenya 29 319 2 494 25 357 1 468
Réunion 71 1 70 -
Rwanda 956 65 753 138
São Tomé and Príncipe 90 1 88 1
Somalia 329 13 306 10
Uganda 13 640 996 12 007 637
West Africa 97 035 3 980 89 209 3 846
Benin 2 073 110 1 897 66
Burkina Faso 621 82 527 12
Cape Verde Island 558 13 539 6
Côte d’Ivoire 2 566 221 2 217 128
Gambia 470 33 429 8
Ghana 17 152 1 006 15 613 533
Guinea 1 508 65 1 394 49
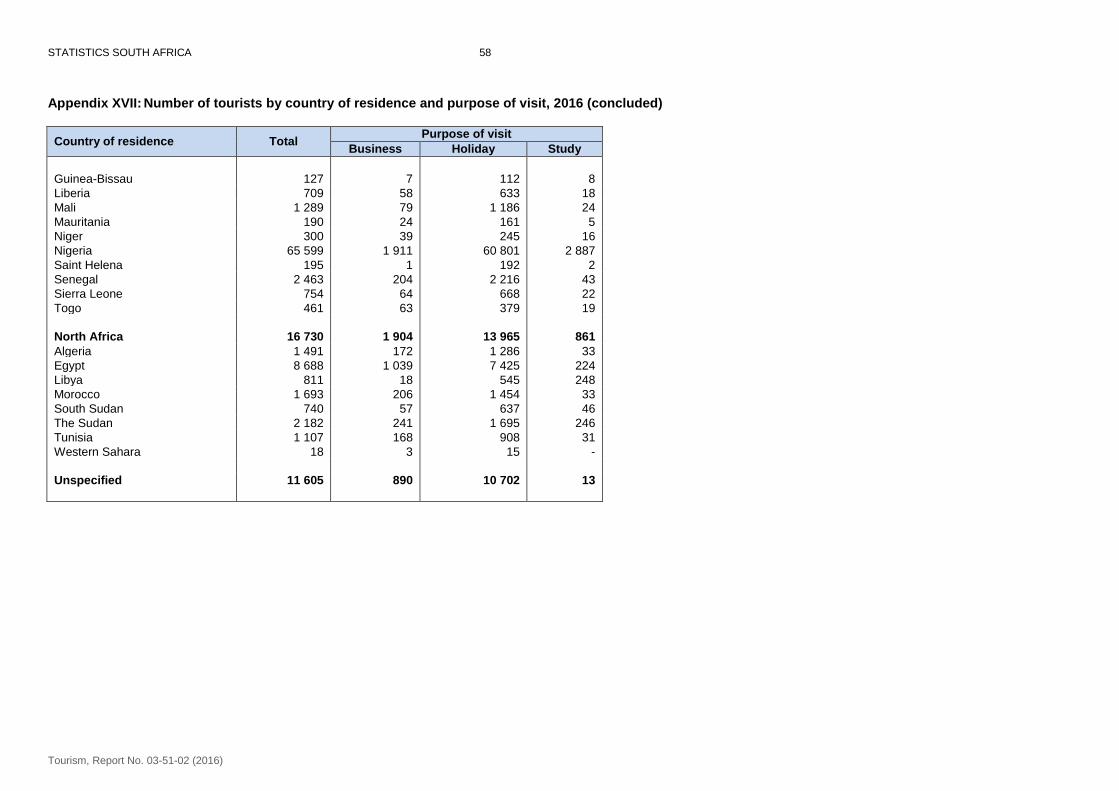
STATISTICS SOUTH AFRICA 58
Tourism, Report No. 03-51-02 (2016)
Appendix XVII: Number of tourists by country of residence and purpose of visit, 2016 (concluded)
Country of residence Total Purpose of visit
Business Holiday Study
Guinea-Bissau 127 7 112 8
Liberia 709 58 633 18
Mali 1 289 79 1 186 24
Mauritania 190 24 161 5
Niger 300 39 245 16
Nigeria 65 599 1 911 60 801 2 887
Saint Helena 195 1 192 2
Senegal 2 463 204 2 216 43
Sierra Leone 754 64 668 22
Togo 461 63 379 19
North Africa 16 730 1 904 13 965 861
Algeria 1 491 172 1 286 33
Egypt 8 688 1 039 7 425 224
Libya 811 18 545 248
Morocco 1 693 206 1 454 33
South Sudan 740 57 637 46
The Sudan 2 182 241 1 695 246
Tunisia 1 107 168 908 31
Western Sahara 18 3 15 -
Unspecified 11 605 890 10 702 13
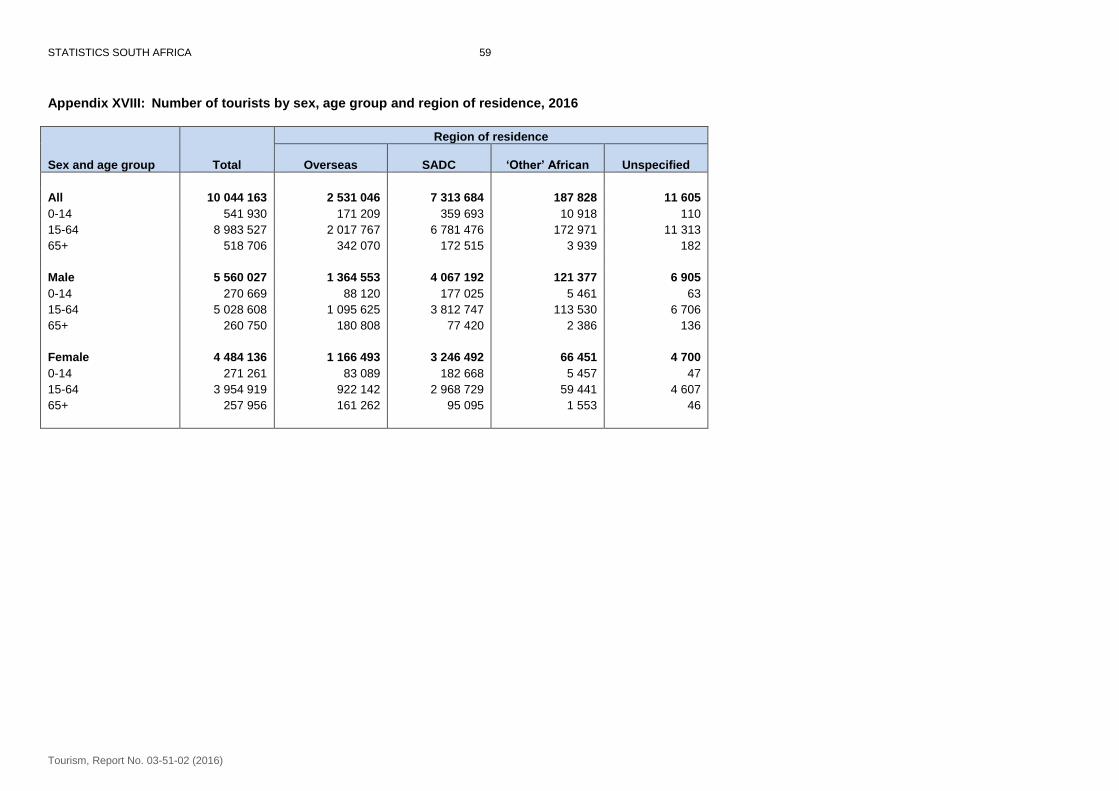
STATISTICS SOUTH AFRICA 59
Tourism, Report No. 03-51-02 (2016)
Appendix XVIII: Number of tourists by sex, age group and region of residence, 2016
Sex and age group
Total
Region of residence
Overseas
SADC
‘Other’ African
Unspecified
All 10 044 163 2 531 046 7 313 684 187 828 11 605
0-14 541 930 171 209 359 693 10 918 110
15-64 8 983 527 2 017 767 6 781 476 172 971 11 313
65+ 518 706 342 070 172 515 3 939 182
Male 5 560 027 1 364 553 4 067 192 121 377 6 905
0-14 270 669 88 120 177 025 5 461 63
15-64 5 028 608 1 095 625 3 812 747 113 530 6 706
65+ 260 750 180 808 77 420 2 386 136
Female 4 484 136 1 166 493 3 246 492 66 451 4 700
0-14 271 261 83 089 182 668 5 457 47
15-64 3 954 919 922 142 2 968 729 59 441 4 607
65+ 257 956 161 262 95 095 1 553 46
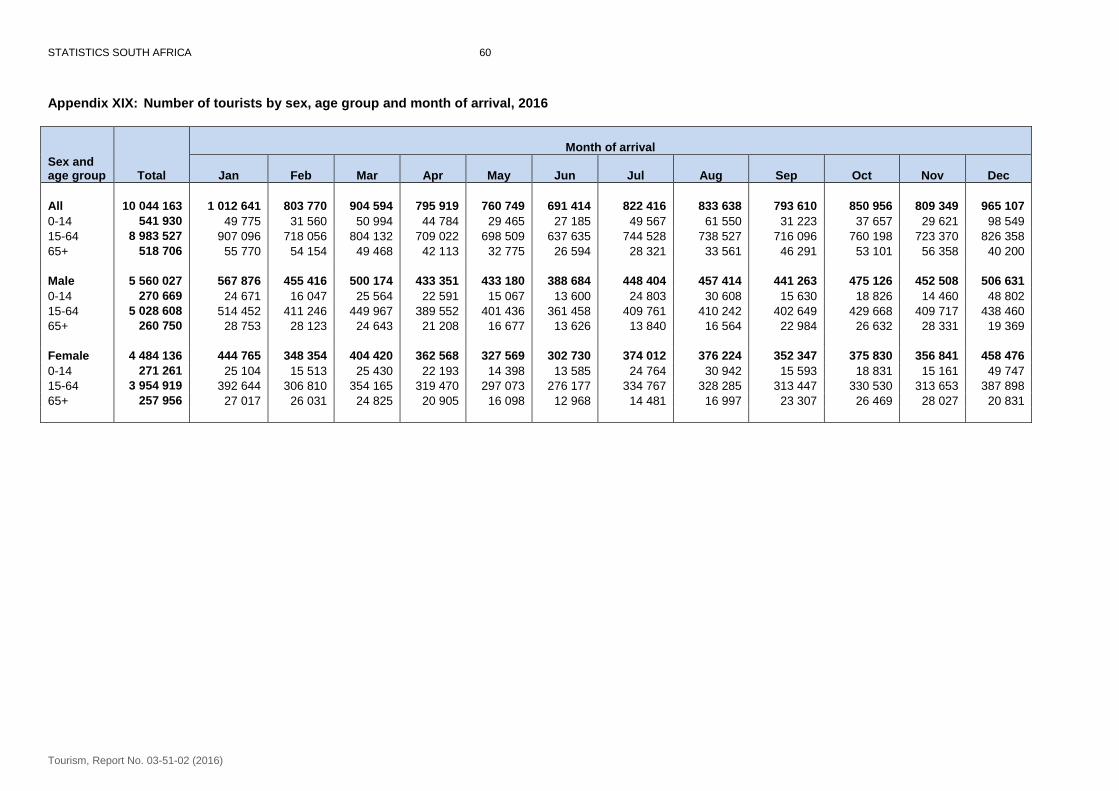
STATISTICS SOUTH AFRICA 60
Tourism, Report No. 03-51-02 (2016)
Appendix XIX: Number of tourists by sex, age group and month of arrival, 2016
Sex and age group Total
Month of arrival
Jan Feb Mar Apr May Jun Jul Aug Sep Oct Nov Dec
All 10 044 163 1 012 641 803 770 904 594 795 919 760 749 691 414 822 416 833 638 793 610 850 956 809 349 965 107
0-14 541 930 49 775 31 560 50 994 44 784 29 465 27 185 49 567 61 550 31 223 37 657 29 621 98 549
15-64 8 983 527 907 096 718 056 804 132 709 022 698 509 637 635 744 528 738 527 716 096 760 198 723 370 826 358
65+ 518 706 55 770 54 154 49 468 42 113 32 775 26 594 28 321 33 561 46 291 53 101 56 358 40 200
Male 5 560 027 567 876 455 416 500 174 433 351 433 180 388 684 448 404 457 414 441 263 475 126 452 508 506 631
0-14 270 669 24 671 16 047 25 564 22 591 15 067 13 600 24 803 30 608 15 630 18 826 14 460 48 802
15-64 5 028 608 514 452 411 246 449 967 389 552 401 436 361 458 409 761 410 242 402 649 429 668 409 717 438 460
65+ 260 750 28 753 28 123 24 643 21 208 16 677 13 626 13 840 16 564 22 984 26 632 28 331 19 369
Female 4 484 136 444 765 348 354 404 420 362 568 327 569 302 730 374 012 376 224 352 347 375 830 356 841 458 476
0-14 271 261 25 104 15 513 25 430 22 193 14 398 13 585 24 764 30 942 15 593 18 831 15 161 49 747
15-64 3 954 919 392 644 306 810 354 165 319 470 297 073 276 177 334 767 328 285 313 447 330 530 313 653 387 898
65+ 257 956 27 017 26 031 24 825 20 905 16 098 12 968 14 481 16 997 23 307 26 469 28 027 20 831
Statistics South Africa
Tourism, Report No. 03-51-02 (2013) Tourism, Report No. 03-51-02 (2016)
61
7. DEFINITION OF TERMS
Definitions used by the United Nations World Tourism Organisation (UNWTO)
Traveller is someone who moves between different geographical locations for any purpose and any duration. Note: in this publication, the geographical locations are countries. Hence in this report, the term traveller refers to an international traveller.
Visitor refers to any person travelling to a place other than that of his/her usual environment for less than 12
months and whose main purpose of the trip is other than the exercise of an activity remunerated from within the place visited.
Same-day visitor is a visitor who visits a place for less than one night.
Tourist (overnight visitor) is a visitor who stays at least one night in collective or private accommodation in
the place visited for less than twelve months.
Tourism comprises the activities of persons travelling to, and staying in places outside their usual environment, for not more than one uninterrupted year, for leisure, business and other purposes. The usual environment of a person consists of a certain area around his/her place of residence, plus all other places he/she frequently visits.
Definitions used specifically in this report
South African resident refers to either a South African citizen or a non-South African citizen with a South African permanent residence permit.
Foreign traveller refers to a traveller who is not a South African citizen or permanent resident.
Country refers to individual countries within a region. (Note: The country of residence is used here and not
the country from which the visitor travelled).
Region refers to the following country classification: Overseas, SADC and ‘Other’ African. Overseas consists of Europe, North America, Central and South America, Australasia, the Middle East and Asia.
Overseas: refers to all countries outside Africa
Africa refers to all the countries in Africa (both mainland and island countries).
SADC refers to the fourteen countries, excluding South Africa, that belong to the Southern African
Development Community
‘Other’ African refers to all countries in Africa that are not members of the SADC. They are grouped as: East and Central Africa, West Africa and North Africa.
Symbol used - = Nil
Statistics South Africa
Tourism, Report No. 03-51-02 (2013) Tourism, Report No. 03-51-02 (2016)
62
Limitations Stats SA is unable to provide tourism information on South African residents. This is because the DHA does not collect data on purpose of travel and the number of days South African residents intends to spend or spent abroad. Related publications Tourism statistics are also published in the monthly Statistical Release P0351: Tourism and Migration and in the quarterly Bulletin of Statistics, South African Statistics and Stats in brief.
8. OTHER STATS SA REPORTS
No. 03-51-02 (2000) - Tourism No. 03-51-02 (2001) - Tourism No. 03-51-02 (2002) -Tourism No. 03-51-02 (2003) -Tourism No. 03-51-02 (2004, 2005 and 2006) -Tourism No. 03-51-02 (2007) -Tourism No. 03-51-02 (2008) -Tourism No. 03-51-02 (2009) - Tourism No. 03-51-02 (2011) -Tourism No. 03-51-02 (2012) -Tourism No. 03-51-02 (2013) -Tourism No. 03-51-02 (2014) -Tourism No. 03-51-02 (2015) -Tourism