Embed Size (px)
Citation preview

University of Nebraska - LincolnDigitalCommons@University of Nebraska - Lincoln
Sociology Department, Faculty Publications Sociology, Department of
2007
Visual Design, Order Effects, and RespondentCharacteristics in a Self-Administered SurveyMichael J. SternOklahoma State University, [email protected]
Don A. DillmanWashington State University, [email protected]
Jolene D. SmythUniversity of Nebraska-Lincoln, [email protected]
Follow this and additional works at: https://digitalcommons.unl.edu/sociologyfacpubPart of the Family, Life Course, and Society Commons, and the Social Psychology and
Interaction Commons
This Article is brought to you for free and open access by the Sociology, Department of at DigitalCommons@University of Nebraska - Lincoln. It hasbeen accepted for inclusion in Sociology Department, Faculty Publications by an authorized administrator of DigitalCommons@University ofNebraska - Lincoln.
Stern, Michael J.; Dillman, Don A.; and Smyth, Jolene D., "Visual Design, Order Effects, and Respondent Characteristics in a Self-Administered Survey" (2007). Sociology Department, Faculty Publications. 671.https://digitalcommons.unl.edu/sociologyfacpub/671
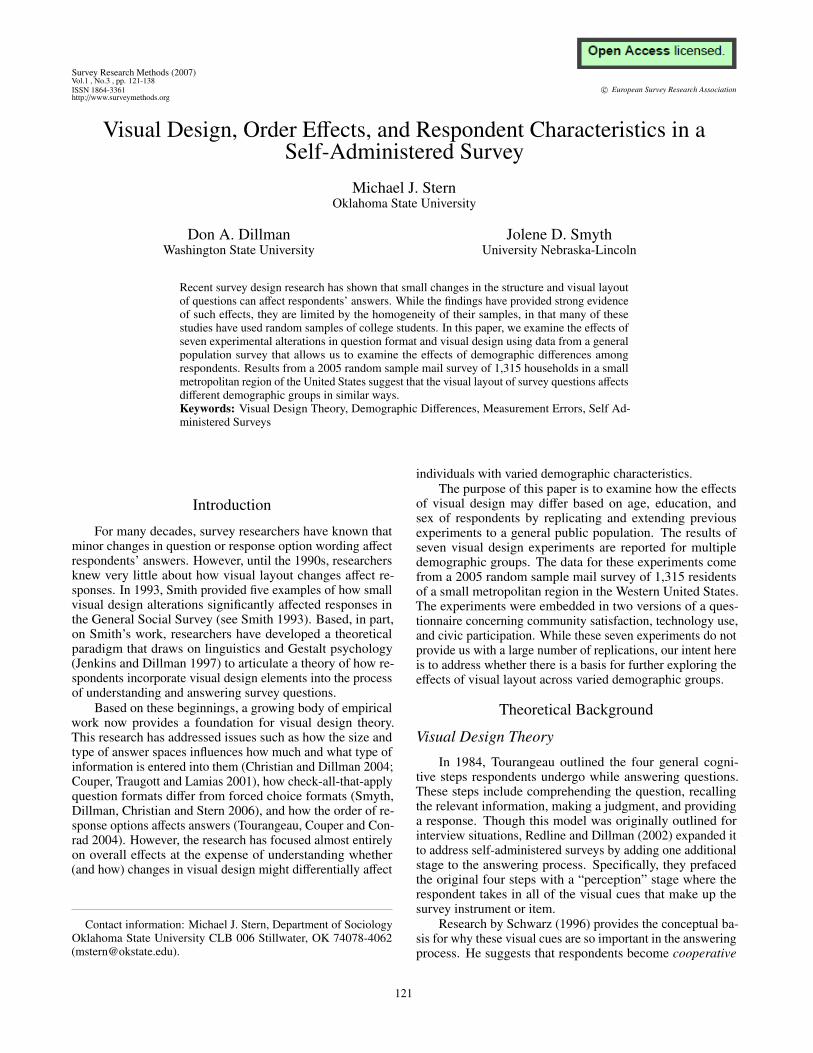
Survey Research Methods (2007)Vol.1 , No.3 , pp. 121-138ISSN 1864-3361http://www.surveymethods.org
c© European Survey Research Association
Visual Design, Order Effects, and Respondent Characteristics in aSelf-Administered Survey
Michael J. SternOklahoma State University
Don A. DillmanWashington State University
Jolene D. SmythUniversity Nebraska-Lincoln
Recent survey design research has shown that small changes in the structure and visual layoutof questions can affect respondents’ answers. While the findings have provided strong evidenceof such effects, they are limited by the homogeneity of their samples, in that many of thesestudies have used random samples of college students. In this paper, we examine the effects ofseven experimental alterations in question format and visual design using data from a generalpopulation survey that allows us to examine the effects of demographic differences amongrespondents. Results from a 2005 random sample mail survey of 1,315 households in a smallmetropolitan region of the United States suggest that the visual layout of survey questions affectsdifferent demographic groups in similar ways.Keywords: Visual Design Theory, Demographic Differences, Measurement Errors, Self Ad-ministered Surveys
Introduction
For many decades, survey researchers have known thatminor changes in question or response option wording affectrespondents’ answers. However, until the 1990s, researchersknew very little about how visual layout changes affect re-sponses. In 1993, Smith provided five examples of how smallvisual design alterations significantly affected responses inthe General Social Survey (see Smith 1993). Based, in part,on Smith’s work, researchers have developed a theoreticalparadigm that draws on linguistics and Gestalt psychology(Jenkins and Dillman 1997) to articulate a theory of how re-spondents incorporate visual design elements into the processof understanding and answering survey questions.
Based on these beginnings, a growing body of empiricalwork now provides a foundation for visual design theory.This research has addressed issues such as how the size andtype of answer spaces influences how much and what type ofinformation is entered into them (Christian and Dillman 2004;Couper, Traugott and Lamias 2001), how check-all-that-applyquestion formats differ from forced choice formats (Smyth,Dillman, Christian and Stern 2006), and how the order of re-sponse options affects answers (Tourangeau, Couper and Con-rad 2004). However, the research has focused almost entirelyon overall effects at the expense of understanding whether(and how) changes in visual design might differentially affect
Contact information: Michael J. Stern, Department of SociologyOklahoma State University CLB 006 Stillwater, OK 74078-4062([email protected]).
individuals with varied demographic characteristics.The purpose of this paper is to examine how the effects
of visual design may differ based on age, education, andsex of respondents by replicating and extending previousexperiments to a general public population. The results ofseven visual design experiments are reported for multipledemographic groups. The data for these experiments comefrom a 2005 random sample mail survey of 1,315 residentsof a small metropolitan region in the Western United States.The experiments were embedded in two versions of a ques-tionnaire concerning community satisfaction, technology use,and civic participation. While these seven experiments do notprovide us with a large number of replications, our intent hereis to address whether there is a basis for further exploring theeffects of visual layout across varied demographic groups.
Theoretical Background
Visual Design Theory
In 1984, Tourangeau outlined the four general cogni-tive steps respondents undergo while answering questions.These steps include comprehending the question, recallingthe relevant information, making a judgment, and providinga response. Though this model was originally outlined forinterview situations, Redline and Dillman (2002) expanded itto address self-administered surveys by adding one additionalstage to the answering process. Specifically, they prefacedthe original four steps with a “perception” stage where therespondent takes in all of the visual cues that make up thesurvey instrument or item.
Research by Schwarz (1996) provides the conceptual ba-sis for why these visual cues are so important in the answeringprocess. He suggests that respondents become cooperative
121
I Open Access licensed. I
122 MICHAEL J. STERN, DON. A. DILLMAN AND JOLENE D. SMYTH
communicators when engaging in the act of completing asurvey. That is, conversational norms govern the way thatrespondents interact with the survey instrument. Schwarz(1996) articulates four underlying maxims involved in theconversational norm, including that the information be clearlyexpressed and understandable to the intended audience, con-tributions to the conversation be relevant, contributions tothe conversation be informative, and contributions be truthful.The survey instrument serves as the researcher’s side of theconversation and should conform to the maxims. Because theresearcher is not present during the conversation, the respon-dent uses all of the visual cues and the layout to guide themin the conversation (Christian and Dillman 2004).
Christian and Dillman (2004) have demonstrated empir-ically that in addition to verbal language effects, the visualfeatures of questionnaires influence people’s answers to sur-vey questions. These additional features include numericlanguage (numbers in the queries and answer categories),graphical language (size, spacing, and location of informa-tion on the page), and symbolic language (e.g. arrows andanswer boxes). Survey researchers use these languages bothindependently and in concert to communicate information torespondents completing self-administered questionnaires.
Tourangeau, Couper, and Conrad (2004) argue that thereare five specifically visual interpretive heuristics that respon-dents follow when evaluating the visual layout of survey ques-tions and the violation of these heuristics can affect the an-swering process. The five heuristics include: 1) middle meanstypical; 2) left and top means first; 3) near means related;4) up means good; and 5) items that are close to each otherare similar. As the authors explain, “each heuristic assigns ameaning to a spatial or visual cue” (Tourangeau, Couper andConrad 2004:370; see also Tourangeau, Couper and Conrad2007). They also provide evidence to support the underlyingprinciple that when the visual presentation of the questiondoes not conform to the expectation of the respondent, properinterpretation of the meaning of the question can be lost.
A number of Gestalt psychology grouping principles canalso help us understand how the presentation of informationmight affect its interpretation. These principles can be sum-marized as the Law of Similarity (objects of the same size,brightness, color, or shape are more easily seen together), theLaw of Proximity (objects close to each other are groupedtogether), and the Law of Pragnanz (figures with simplicity,regularity, and symmetry are easier to follow) (Dillman 2007).Jenkins and Dillman (1997) have addressed how these visualand spatial cues affect how respondents interpret information.
One of the lessons we have learned through the researchused to develop these perspectives is that respondents oftenanswer questions in ways that were unanticipated by the re-searcher for reasons having to do with visual layout, ratherthan their opinion or position on a particular question or issue(Dillman 2007). One of the most well-documented theoriesconcerning these response errors is that of “satisficing” (Kros-nick and Alwin 1987). Satisficing occurs when respondentsfail to expend the necessary energy needed to answer a ques-tion and thus fail to provide an optimal response. While thereare reasons why a respondent may satisfice that are outside
of the researcher’s control, one area that can be controlledby the researcher is the visual design of the question. Themore respondents are cognitively taxed by the visual design ofquestions – including the violation of the interpretive heuris-tics – the more likely they are to satisfice, thus increasingmeasurement error (Israel 2006).
Krosnick (1991; 1999) provides evidence for satisficingby showing that respondents tend to choose earlier items in alist because they find the first position that they can reason-ably agree with and consider it a satisfactory answer, ratherthan reading and considering each response option separately.When this occurs in self-administered survey questions, apattern of primacy is expected.1 These effects are not onlyseen in scalar questions, but also, for example, in mark-all-that-apply questions where the respondent is asked to selecteach option that pertains to them from a list (Smyth et al.2006).
Respondent Characteristics
Despite growing empirical support for visual design the-ory (Dillman 2007), the theory itself and the empirical re-search may be overstated because it has yet to consider demo-graphic variation. In fact, the theory concerning visual layoutand design in self-administered surveys is virtually devoidof any reference to respondent characteristics. As a result,the empirical tests to date have not taken into account howvarious question formats may affect respondents differentlybased on their demographic characteristics (e.g. education,age, and sex). Furthermore, the research that has examined de-mographic differences in respondent behavior was developedindependently of theories of visual design.
The most common reasoning provided for expecting re-sponse effects among individuals of lower education has beentheir level of cognitive sophistication. Krosnick (1992) arguesthat respondents with lower levels of education are less likelyto do the necessary cognitive work needed for evaluating re-sponse categories or fully comprehending the question stem;thus, they are likely to satisfice as evidenced by primacy.However, the research attempting to test this proposition hasproduced mixed results. For example, Ayidiya and McClen-don (1990:244) found that in self-administered mail surveysthere were response order effects; however, there was no “re-liable evidence” for systematic differences among individualsof lower education. In contrast, Knauper (1999), Knauper,Belli, Hill and Herzog (1998), and Krosnick, Narayan andSmith (1996) have all reported that response order effects aremore prevalent among people with lower levels of education.
Knauper (1999) and Knauper et al. (1998) argue thatlimits in cognitive ability are present among individuals ofolder age (60 and older). Using cognitive psychology asthe basis of their argument, they suggest that as individualsage, their diminished ability to comprehend questions (which
1 It should be noted that while patterns of primacy are often foundin self-administered surveys, patterns of recency, where the lastoptions in a list are more likely to be selected, are frequently foundin interview situations (e.g., telephone surveys).
VISUAL DESIGN, ORDER EFFECTS, AND RESPONDENT CHARACTERISTICS IN A SELF-ADMINISTERED SURVEY 123
could be largely affected by visual design) and recall mem-ories (perhaps not as affected by visual design) makes themmore susceptible to response order effects and other questionproblems. This research further suggests that age is a morepowerful predictor of response order effects than educationalattainment. However, Knauper (1999) concedes that futuretheoretical work is needed concerning response effects inolder respondents.
Fewer studies have examined response effects by the sexof the respondent. However, studies do suggest that such re-search is needed. For example, research on the use of a “don’tknow” category has consistently shown that women are morelikely to provide this response than their male counterpartsin both adult and adolescent samples (see Rapoport 1982 fora review). Rapoport (1982) suggests that this effect couldbe the enduring result of differential socialization in that theeffect is still persistent after controlling for issues such asquestion subject knowledge. That is, women are socialized tohave lower levels of opinionation than men. This perspectivehas been supported in research that examines the numberof affirmative answers provided in forced choice questions(Glenn 1969).2 The implications for response effects could bevery important. If women and men differ in their level of en-gagement in survey items, then theories of visual design mustaddress this issue. One way to do this is by testing whether theeffects of visual design are equally recognizable across menand women. Notably, the research summarized here precedesthe development of the cooperative communicator model ofSchwarz (1996) and is in need of further explication.
Research and theory concerning the visual design of self-administered survey questions suggests that respondents ac-tively utilize visual cues (verbal, symbolic, numeric, andgraphical) embedded in the design of these questions to guidethem in the response process. However, research has not yetaddressed in detail how respondents who differ by age, educa-tion, and sex may be differentially affected by visual design.Further, the research concerning demographic differences inrespondent behavior has not been guided by any unifying the-ory that seeks to explain the effects reported (Knauper 1999)and has not yet taken into consideration potential relation-ships between respondent characteristics and visual design.The experiments described in the following sections seek toprovide a basis for unifying these literatures by testing for theeffects of visual design in a self-administered mail survey andanalyzing whether those effects vary by respondent education,age, and sex. We designed each of the experiments used inthis paper to either specifically replicate an earlier study orto test a theoretical postulate relevant to the visual design ofself-administered surveys.
Procedures
The experimental comparisons were embedded in twoversions of a self-administered mail survey designed to askresidents about their community satisfaction, technology use,and civic participation. Respondents were randomly assignedto one of the two versions. The overall design of the surveyswas very similar with only a slight color difference (white
and off-white) between the two versions. The 10-page ques-tionnaire with 75 queries for the average respondent wasconducted in the winter of 2005. A random sample of 2,000households was drawn with 1,315 of the households complet-ing and returning the survey, culminating in a response rateof 65.75% (AAPOR [2006] RR1).
The implementation design used three mail contacts (Dill-man 2007). The first contact contained a personally signedcover letter explaining the survey’s goals and content, a self-addressed stamped envelope, a two-dollar token incentive, andthe questionnaire. Two weeks later a follow-up post card wassent to all respondents that thanked those who had respondedand encouraged those who had not to please do so. Finally,about two weeks after the post card was sent, a replacementquestionnaire was sent to individuals who had not yet re-sponded along with a personally signed letter encouragingthem to fill out the questionnaire.
Based on previous research concerning demographic dif-ferences in respondent behavior and survey response effects(Knauper 1999; Krosnick, Narayan and Smith 1996; Rapoport1982), individuals were partitioned into demographic groups.To examine age, respondents were classified as 60 years oldand older or under the age of 60. For education, in keepingwith previous studies (Krosnick, Narayan and Smith 1996),individuals were divided into two groups based on presenceor absence of a college degree. Sex was partitioned as womenor men.
Experiments and Results
Experiment 1: Use of the Number Box versus PolarPoint Scale
Design. We begin our analysis by replicating and extend-ing a combined graphical and symbolic language manipula-tion test. In the original test, Christian and Dillman (2004)examined the effects of two types of non-verbal language(graphical and symbolic) on responses to scalar questions.Respondents provided dramatically different responses basedon the version of the question they received. Specifically, re-spondents provided much higher values (5 = very dissatisfied)in the number box question (where the respondent writes inthe number corresponding to their answer) when compared tothe polar point (labeled endpoints) versions. It appeared thatthe removal of the non-verbal languages might have causedrespondents to become confused about the direction of thescale in the number box version. That is, the need to carry theinformation from the question stem to the answer box proveddifficult. We sought to examine whether the findings wouldbe 1) replicated and 2) if the results would be reliable acrossdemographic groups.
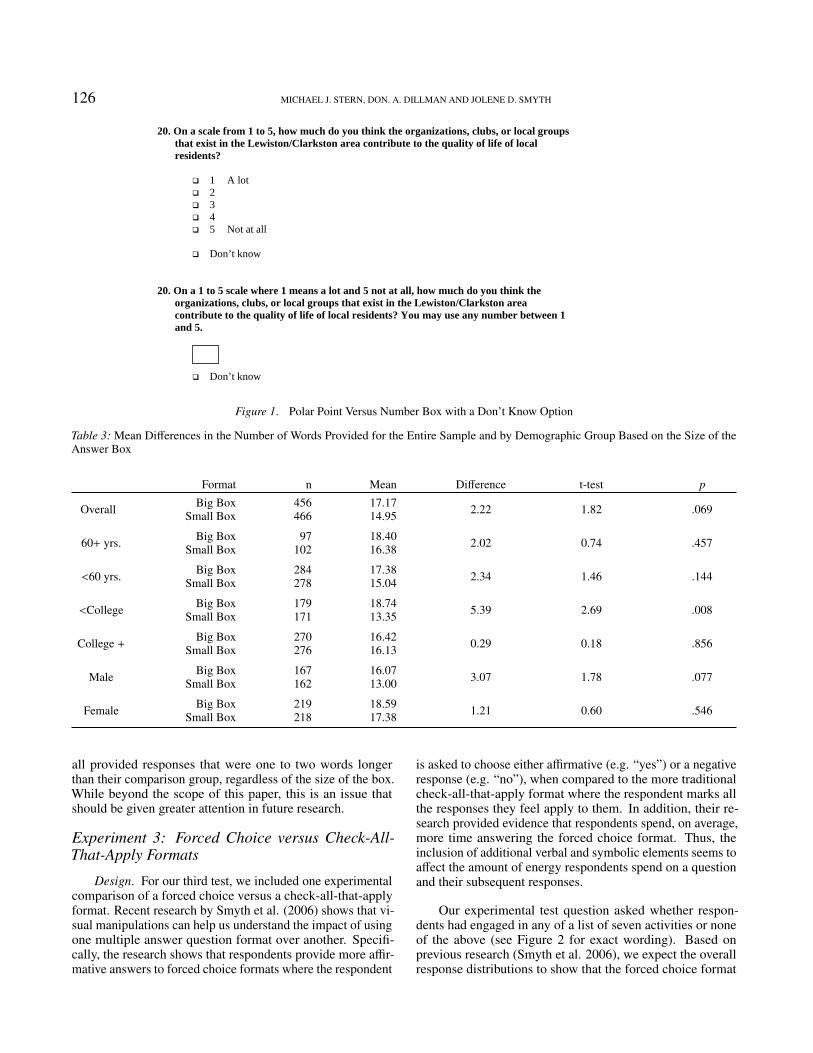
Similar to Christian and Dillman (2004), we compareda scalar question with a polar point scale and a number box.In addition to the original test, we incorporated a modestextension by including a “don’t know” response (Figure 1).The question asked, “On a scale from 1 to 5, how much do
2 Glenn (1969) does not explicitly discuss this point in his paper,but his data do show this trend.
124 MICHAEL J. STERN, DON. A. DILLMAN AND JOLENE D. SMYTH
you think the organizations, clubs, or local groups that existin the Lewiston/Clarkston area contribute to the quality of lifeof local residents?” One polar point was represented by “alot” and the other by “not at all.”
We first hypothesize that our findings will replicate thoseof Christian and Dillman (2004) in that the polar point andnumber box formats will elicit different responses for thesame question and that the direction of this relationship willbe the same (e.g. more negative responses for the number boxquestion). In addition, we predict that more respondents willchoose the “don’t know” option when given the number boxversion because there is more respondent burden associatedwith using the number box. Because of this cognitive difficultyand based upon the work of Knauper (1999) and Krosnick,Narayan and Smith (1996), we expect individuals aged 60and older or with less than a college degree to be the mostaffected by the difference in response formats. In addition,we expect these groups to be more likely to choose the “don’tknow” option.
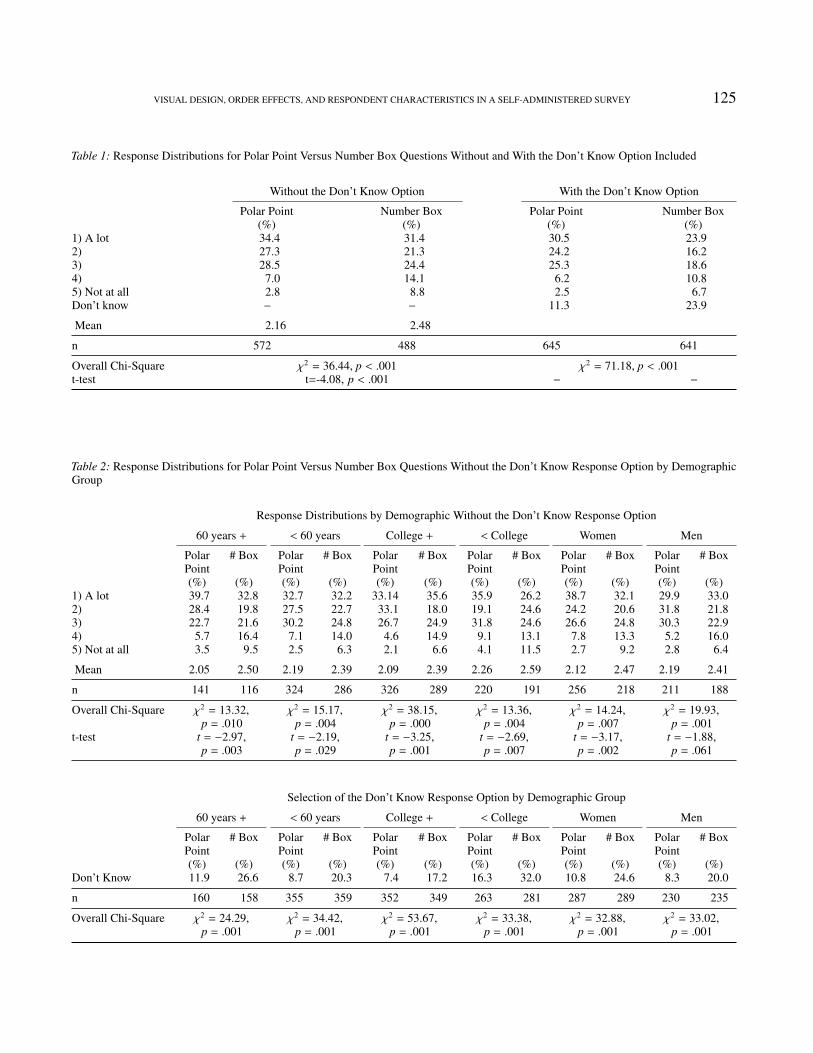
Findings. Table 1 reports the results comparing the num-ber box to the polar point version of the question, both withand without the “don’t know” option. As predicted, therewere significant differences in the response distributions be-tween the formats (χ2= 36.44; p <.001). The direction of therelationship shows that respondents were significantly morelikely to provide negative responses (e.g. higher numbers)for the number box as compared to the polar point versionof the question (the means were 2.48 and 2.16, respectively).In addition, respondents who received the number box ver-sion were significantly more likely to provide a “don’t know”response compared to respondents who received the polarpoint version of the question (23.9% and 11.3%, respectively;χ2 = 71.18; p < .001).
As shown in Table 2, across all demographic groups therewere statistically significant differences in responses basedon the version of the question respondents received. In ad-dition, for each demographic group more negative responseswere provided for the number box version of the question,meaning that respondents provided larger numbers. The meandifferences were significant for all but one of the demographicgroups (men), where the mean difference approached signifi-cance (p=.06). Furthermore, the likelihood of selecting the“don’t know” response was significantly higher for each de-mographic group when they received the number box version(all differences were statistically significant).
Conclusions. In terms of the demographic hypothesis,there was mixed support. First, the data show that respondentsover 60 years of age or possessing less than a college degreeappeared to be no more likely than other groups to be influ-enced by the visual layout of the question. However, whengiven the number box version, both of these demographicwere more likely to provide a “don’t know” response thanthe other demographic groups. Thus, part of the explanationfor not seeing a greater overall difference for these groups inthe response distributions may have to do with the fact thatso many of these individuals chose a “don’t know” response.
Nonetheless, these findings seem to lend considerable supportto the findings of Christian and Dillman (2004), which suggestthat responses that are more negative are provided for numberbox formats, inasmuch as our results show this pattern acrossdemographic groups.
Experiment 2: Manipulating the Size of the AnswerSpace in Open-Ended Questions
Design. In our second experiment, we examined whetherthe size of answer spaces in open-ended questions affected allrespondents in similar ways. Several previous studies haveexamined the effects of manipulating the size of the answerspace in open-ended questions. For example, Israel (2006)and Christian and Dillman (2004) conducted graphical ex-periments using various sized answer spaces for open-endedquestions. The larger spaces elicited longer responses thanthe smaller boxes for all items in both experiments. Thus,they concluded that the large box suggests to the respondentthat the surveyor wants more information than when smallboxes are used.
In this experiment, two different sized boxes were used.The experiment was part of a branching question that asked re-spondents first whether or not there was any particular changethat they believed would make the community a better placeto live. If they responded “yes,” they were asked to elaborateabout what they would change. In one version of the ques-tionnaire the box was 2 inches high and 6.5 inches wide. Inthe alternate version, the box was 1 inch high and 6.5 incheswide.
Consistent with previous research, we expect the biggerbox to yield longer responses for all demographic groups. Toclarify, this is a hypothesis about direction of effect; we do notexpect all demographic groups to provide answers of the samelength. Rather, we are predicting that each demographic groupwill provide more words when a bigger space is provided thanthey provide when a smaller space is provided.
Findings. Table 3 shows the mean number of words pro-vided for each size of the box. Overall, the results are con-sistent with previous research and the hypothesis by showingthat the larger box yielded longer responses (17.17 words)than the smaller box (14.95 words). However, the differencefailed to reach statistical significance. Turning to the respon-dent characteristics, as hypothesized, each group providedlonger responses in the larger space. However, only amongrespondents with less than a college degree (p=.008) andmen (p=.07) did we find differences that were significant orapproached significance.
Conclusions. Regarding the size of the answer space,each demographic group wrote more in the larger space; thus,the graphical language affected all respondents in a similarway. These findings support previous research by showingthat the size of the box influences the amount that respondentscontribute across demographic groups. However, it should benoted that some groups were more likely to provide longerand more detailed responses. For example, respondents over60 years of age, with less than a college degree, and women
VISUAL DESIGN, ORDER EFFECTS, AND RESPONDENT CHARACTERISTICS IN A SELF-ADMINISTERED SURVEY 125
Table 1: Response Distributions for Polar Point Versus Number Box Questions Without and With the Don’t Know Option Included
Without the Don’t Know Option With the Don’t Know Option
Polar Point Number Box Polar Point Number Box(%) (%) (%) (%)
1) A lot 34.4 31.4 30.5 23.92) 27.3 21.3 24.2 16.23) 28.5 24.4 25.3 18.64) 7.0 14.1 6.2 10.85) Not at all 2.8 8.8 2.5 6.7Don’t know − − 11.3 23.9
Mean 2.16 2.48
n 572 488 645 641
Overall Chi-Square χ2 = 36.44, p < .001 χ2 = 71.18, p < .001t-test t=-4.08, p < .001 − −
Table 2: Response Distributions for Polar Point Versus Number Box Questions Without the Don’t Know Response Option by DemographicGroup
Response Distributions by Demographic Without the Don’t Know Response Option
60 years + < 60 years College + < College Women Men
Polar # Box Polar # Box Polar # Box Polar # Box Polar # Box Polar # BoxPoint Point Point Point Point Point(%) (%) (%) (%) (%) (%) (%) (%) (%) (%) (%) (%)
1) A lot 39.7 32.8 32.7 32.2 33.14 35.6 35.9 26.2 38.7 32.1 29.9 33.02) 28.4 19.8 27.5 22.7 33.1 18.0 19.1 24.6 24.2 20.6 31.8 21.83) 22.7 21.6 30.2 24.8 26.7 24.9 31.8 24.6 26.6 24.8 30.3 22.94) 5.7 16.4 7.1 14.0 4.6 14.9 9.1 13.1 7.8 13.3 5.2 16.05) Not at all 3.5 9.5 2.5 6.3 2.1 6.6 4.1 11.5 2.7 9.2 2.8 6.4
Mean 2.05 2.50 2.19 2.39 2.09 2.39 2.26 2.59 2.12 2.47 2.19 2.41
n 141 116 324 286 326 289 220 191 256 218 211 188
Overall Chi-Square χ2 = 13.32, χ2 = 15.17, χ2 = 38.15, χ2 = 13.36, χ2 = 14.24, χ2 = 19.93,p = .010 p = .004 p = .000 p = .004 p = .007 p = .001
t-test t = −2.97, t = −2.19, t = −3.25, t = −2.69, t = −3.17, t = −1.88,p = .003 p = .029 p = .001 p = .007 p = .002 p = .061
Selection of the Don’t Know Response Option by Demographic Group
60 years + < 60 years College + < College Women Men
Polar # Box Polar # Box Polar # Box Polar # Box Polar # Box Polar # BoxPoint Point Point Point Point Point(%) (%) (%) (%) (%) (%) (%) (%) (%) (%) (%) (%)
Don’t Know 11.9 26.6 8.7 20.3 7.4 17.2 16.3 32.0 10.8 24.6 8.3 20.0
n 160 158 355 359 352 349 263 281 287 289 230 235
Overall Chi-Square χ2 = 24.29, χ2 = 34.42, χ2 = 53.67, χ2 = 33.38, χ2 = 32.88, χ2 = 33.02,p = .001 p = .001 p = .001 p = .001 p = .001 p = .001
126 MICHAEL J. STERN, DON. A. DILLMAN AND JOLENE D. SMYTH
20. On a scale from 1 to 5, how much do you think the organizations, clubs, or local groups that exist in the Lewiston/Clarkston area contribute to the quality of life of local residents?
1 A lot 2 3 4 5 Not at all
Don’t know
20. On a 1 to 5 scale where 1 means a lot and 5 not at all, how much do you think the
organizations, clubs, or local groups that exist in the Lewiston/Clarkston area contribute to the quality of life of local residents? You may use any number between 1 and 5.
Don’t know
Figure 1. Polar Point Versus Number Box with a Don’t Know Option
Table 3: Mean Differences in the Number of Words Provided for the Entire Sample and by Demographic Group Based on the Size of theAnswer Box
Format n Mean Difference t-test p
Overall Big Box 456 17.17 2.22 1.82 .069Small Box 466 14.95
60+ yrs. Big Box 97 18.40 2.02 0.74 .457Small Box 102 16.38
<60 yrs. Big Box 284 17.38 2.34 1.46 .144Small Box 278 15.04
<College Big Box 179 18.74 5.39 2.69 .008Small Box 171 13.35
College + Big Box 270 16.42 0.29 0.18 .856Small Box 276 16.13
Male Big Box 167 16.07 3.07 1.78 .077Small Box 162 13.00
Female Big Box 219 18.59 1.21 0.60 .546Small Box 218 17.38
all provided responses that were one to two words longerthan their comparison group, regardless of the size of the box.While beyond the scope of this paper, this is an issue thatshould be given greater attention in future research.
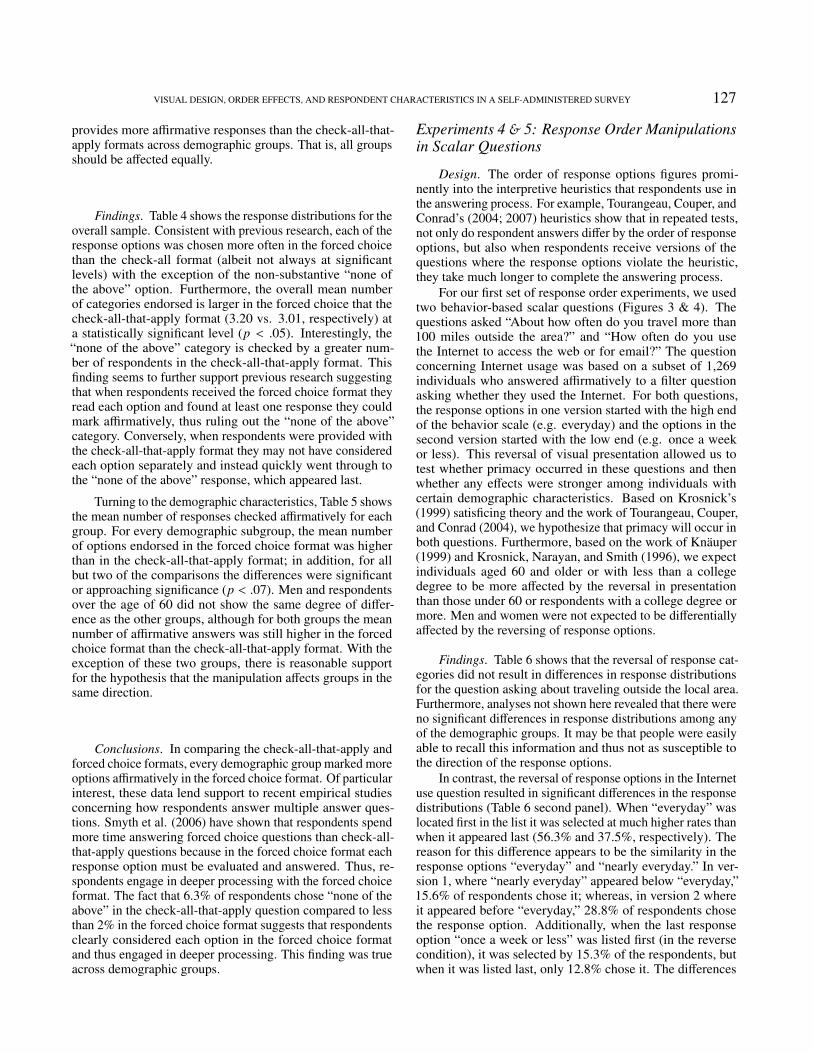
Experiment 3: Forced Choice versus Check-All-That-Apply Formats
Design. For our third test, we included one experimentalcomparison of a forced choice versus a check-all-that-applyformat. Recent research by Smyth et al. (2006) shows that vi-sual manipulations can help us understand the impact of usingone multiple answer question format over another. Specifi-cally, the research shows that respondents provide more affir-mative answers to forced choice formats where the respondent
is asked to choose either affirmative (e.g. “yes”) or a negativeresponse (e.g. “no”), when compared to the more traditionalcheck-all-that-apply format where the respondent marks allthe responses they feel apply to them. In addition, their re-search provided evidence that respondents spend, on average,more time answering the forced choice format. Thus, theinclusion of additional verbal and symbolic elements seems toaffect the amount of energy respondents spend on a questionand their subsequent responses.
Our experimental test question asked whether respon-dents had engaged in any of a list of seven activities or noneof the above (see Figure 2 for exact wording). Based onprevious research (Smyth et al. 2006), we expect the overallresponse distributions to show that the forced choice format
D
VISUAL DESIGN, ORDER EFFECTS, AND RESPONDENT CHARACTERISTICS IN A SELF-ADMINISTERED SURVEY 127
provides more affirmative responses than the check-all-that-apply formats across demographic groups. That is, all groupsshould be affected equally.
Findings. Table 4 shows the response distributions for theoverall sample. Consistent with previous research, each of theresponse options was chosen more often in the forced choicethan the check-all format (albeit not always at significantlevels) with the exception of the non-substantive “none ofthe above” option. Furthermore, the overall mean numberof categories endorsed is larger in the forced choice that thecheck-all-that-apply format (3.20 vs. 3.01, respectively) ata statistically significant level (p < .05). Interestingly, the“none of the above” category is checked by a greater num-ber of respondents in the check-all-that-apply format. Thisfinding seems to further support previous research suggestingthat when respondents received the forced choice format theyread each option and found at least one response they couldmark affirmatively, thus ruling out the “none of the above”category. Conversely, when respondents were provided withthe check-all-that-apply format they may not have consideredeach option separately and instead quickly went through tothe “none of the above” response, which appeared last.
Turning to the demographic characteristics, Table 5 showsthe mean number of responses checked affirmatively for eachgroup. For every demographic subgroup, the mean numberof options endorsed in the forced choice format was higherthan in the check-all-that-apply format; in addition, for allbut two of the comparisons the differences were significantor approaching significance (p < .07). Men and respondentsover the age of 60 did not show the same degree of differ-ence as the other groups, although for both groups the meannumber of affirmative answers was still higher in the forcedchoice format than the check-all-that-apply format. With theexception of these two groups, there is reasonable supportfor the hypothesis that the manipulation affects groups in thesame direction.
Conclusions. In comparing the check-all-that-apply andforced choice formats, every demographic group marked moreoptions affirmatively in the forced choice format. Of particularinterest, these data lend support to recent empirical studiesconcerning how respondents answer multiple answer ques-tions. Smyth et al. (2006) have shown that respondents spendmore time answering forced choice questions than check-all-that-apply questions because in the forced choice format eachresponse option must be evaluated and answered. Thus, re-spondents engage in deeper processing with the forced choiceformat. The fact that 6.3% of respondents chose “none of theabove” in the check-all-that-apply question compared to lessthan 2% in the forced choice format suggests that respondentsclearly considered each option in the forced choice formatand thus engaged in deeper processing. This finding was trueacross demographic groups.
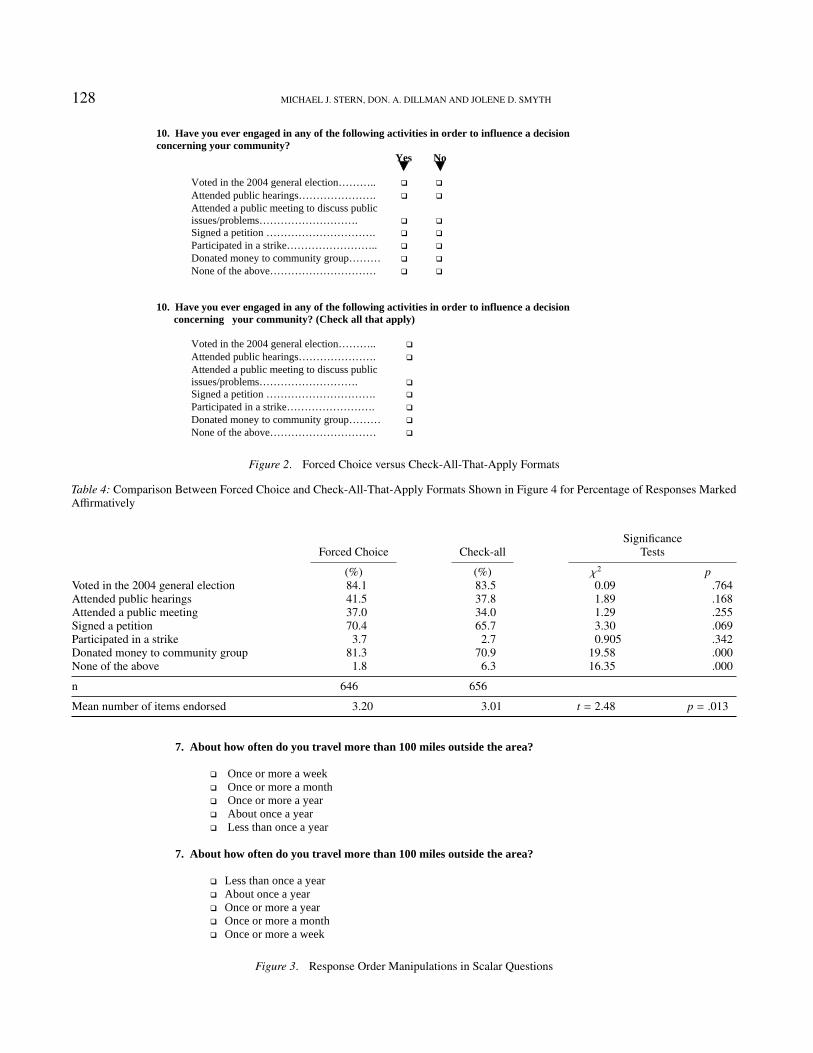
Experiments 4 & 5: Response Order Manipulationsin Scalar Questions
Design. The order of response options figures promi-nently into the interpretive heuristics that respondents use inthe answering process. For example, Tourangeau, Couper, andConrad’s (2004; 2007) heuristics show that in repeated tests,not only do respondent answers differ by the order of responseoptions, but also when respondents receive versions of thequestions where the response options violate the heuristic,they take much longer to complete the answering process.
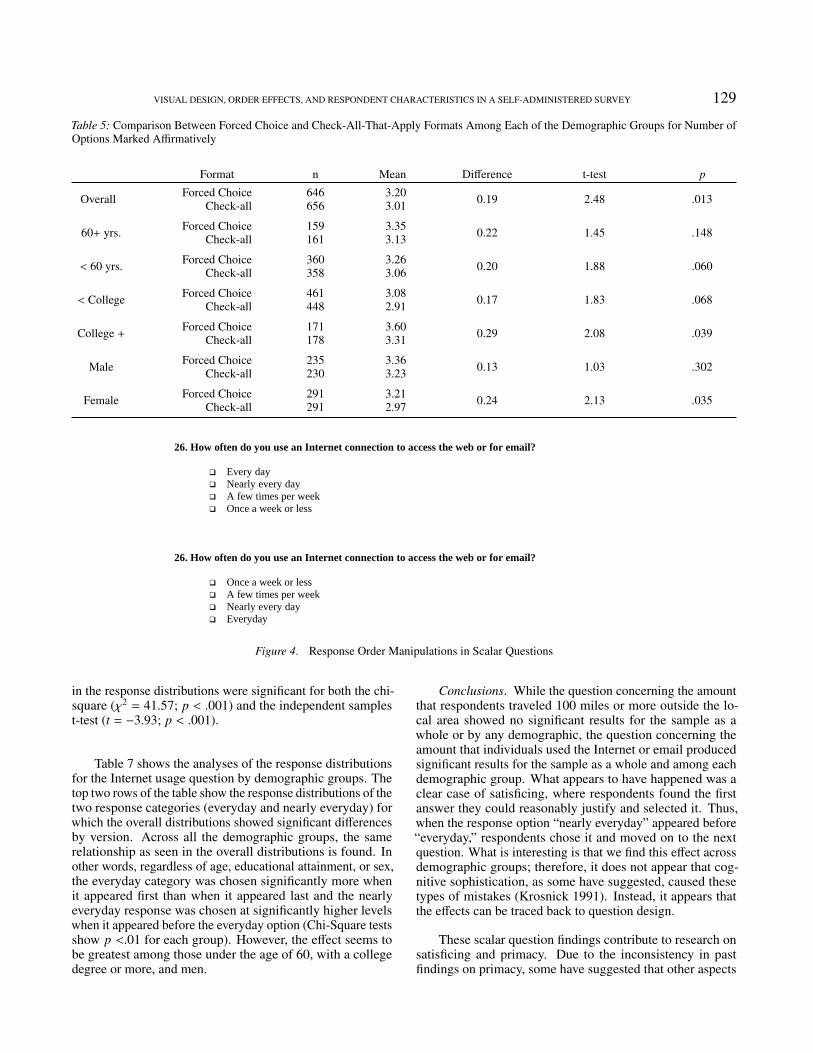
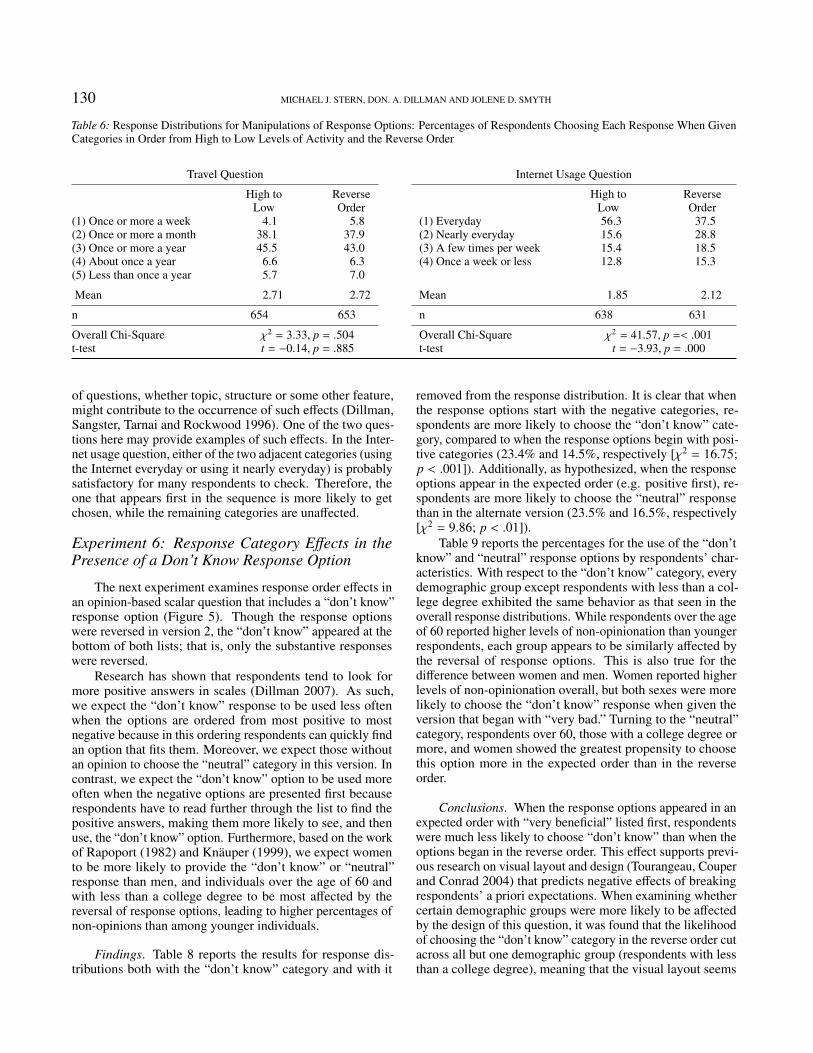
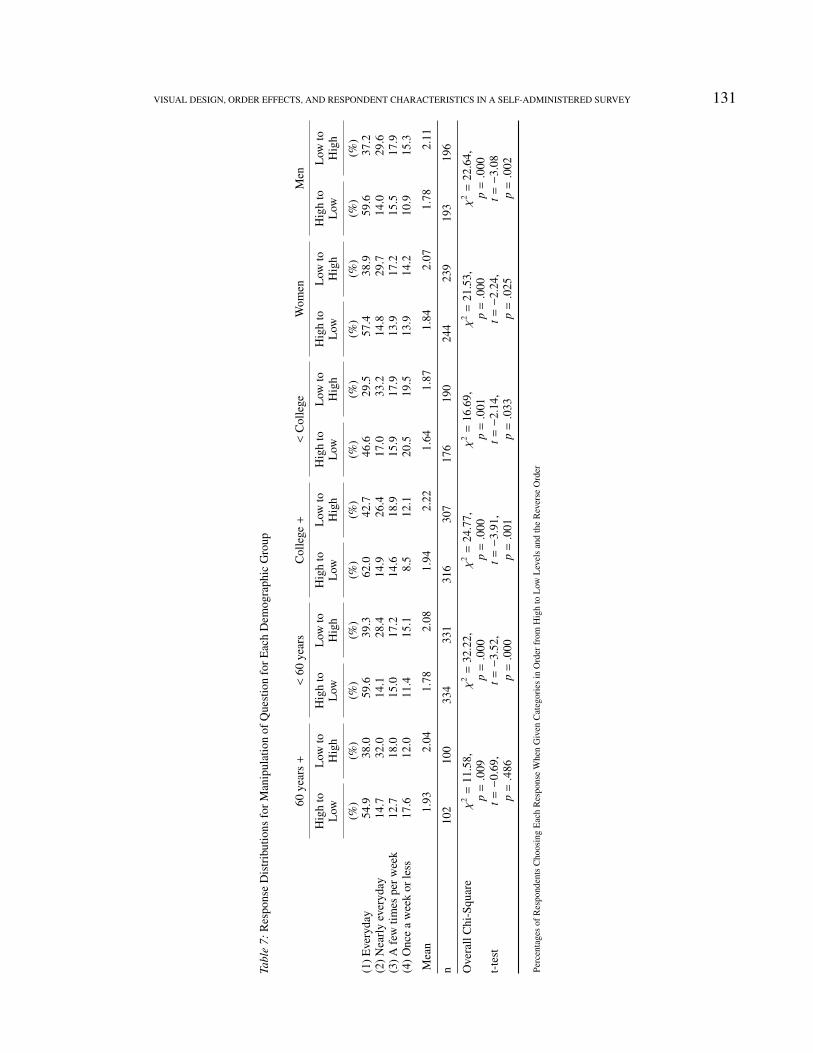
For our first set of response order experiments, we usedtwo behavior-based scalar questions (Figures 3 & 4). Thequestions asked “About how often do you travel more than100 miles outside the area?” and “How often do you usethe Internet to access the web or for email?” The questionconcerning Internet usage was based on a subset of 1,269individuals who answered affirmatively to a filter questionasking whether they used the Internet. For both questions,the response options in one version started with the high endof the behavior scale (e.g. everyday) and the options in thesecond version started with the low end (e.g. once a weekor less). This reversal of visual presentation allowed us totest whether primacy occurred in these questions and thenwhether any effects were stronger among individuals withcertain demographic characteristics. Based on Krosnick’s(1999) satisficing theory and the work of Tourangeau, Couper,and Conrad (2004), we hypothesize that primacy will occur inboth questions. Furthermore, based on the work of Knauper(1999) and Krosnick, Narayan, and Smith (1996), we expectindividuals aged 60 and older or with less than a collegedegree to be more affected by the reversal in presentationthan those under 60 or respondents with a college degree ormore. Men and women were not expected to be differentiallyaffected by the reversing of response options.
Findings. Table 6 shows that the reversal of response cat-egories did not result in differences in response distributionsfor the question asking about traveling outside the local area.Furthermore, analyses not shown here revealed that there wereno significant differences in response distributions among anyof the demographic groups. It may be that people were easilyable to recall this information and thus not as susceptible tothe direction of the response options.
In contrast, the reversal of response options in the Internetuse question resulted in significant differences in the responsedistributions (Table 6 second panel). When “everyday” waslocated first in the list it was selected at much higher rates thanwhen it appeared last (56.3% and 37.5%, respectively). Thereason for this difference appears to be the similarity in theresponse options “everyday” and “nearly everyday.” In ver-sion 1, where “nearly everyday” appeared below “everyday,”15.6% of respondents chose it; whereas, in version 2 whereit appeared before “everyday,” 28.8% of respondents chosethe response option. Additionally, when the last responseoption “once a week or less” was listed first (in the reversecondition), it was selected by 15.3% of the respondents, butwhen it was listed last, only 12.8% chose it. The differences
128 MICHAEL J. STERN, DON. A. DILLMAN AND JOLENE D. SMYTH
10. Have you ever engaged in any of the following activities in order to influence a decision concerning your community? Yes No
Voted in the 2004 general election……….. Attended public hearings…………………. Attended a public meeting to discuss public issues/problems……………………….
Signed a petition …………………………. Participated in a strike…………………….. Donated money to community group……… None of the above…………………………
10. Have you ever engaged in any of the following activities in order to influence a decision
concerning your community? (Check all that apply)
Voted in the 2004 general election……….. Attended public hearings…………………. Attended a public meeting to discuss public issues/problems……………………….
Signed a petition …………………………. Participated in a strike……………………. Donated money to community group……… None of the above…………………………
Figure 2. Forced Choice versus Check-All-That-Apply Formats
Table 4: Comparison Between Forced Choice and Check-All-That-Apply Formats Shown in Figure 4 for Percentage of Responses MarkedAffirmatively
SignificanceForced Choice Check-all Tests
(%) (%) χ2 pVoted in the 2004 general election 84.1 83.5 0.09 .764Attended public hearings 41.5 37.8 1.89 .168Attended a public meeting 37.0 34.0 1.29 .255Signed a petition 70.4 65.7 3.30 .069Participated in a strike 3.7 2.7 0.905 .342Donated money to community group 81.3 70.9 19.58 .000None of the above 1.8 6.3 16.35 .000
n 646 656
Mean number of items endorsed 3.20 3.01 t = 2.48 p = .013
7. About how often do you travel more than 100 miles outside the area?
Once or more a week Once or more a month Once or more a year About once a year Less than once a year
7. About how often do you travel more than 100 miles outside the area?
Less than once a year About once a year Once or more a year Once or more a month Once or more a week
Figure 3. Response Order Manipulations in Scalar Questions
VISUAL DESIGN, ORDER EFFECTS, AND RESPONDENT CHARACTERISTICS IN A SELF-ADMINISTERED SURVEY 129
Table 5: Comparison Between Forced Choice and Check-All-That-Apply Formats Among Each of the Demographic Groups for Number ofOptions Marked Affirmatively
Format n Mean Difference t-test p
Overall Forced Choice 646 3.20 0.19 2.48 .013Check-all 656 3.01
60+ yrs. Forced Choice 159 3.35 0.22 1.45 .148Check-all 161 3.13
< 60 yrs. Forced Choice 360 3.26 0.20 1.88 .060Check-all 358 3.06
< College Forced Choice 461 3.08 0.17 1.83 .068Check-all 448 2.91
College + Forced Choice 171 3.60 0.29 2.08 .039Check-all 178 3.31
Male Forced Choice 235 3.36 0.13 1.03 .302Check-all 230 3.23
Female Forced Choice 291 3.21 0.24 2.13 .035Check-all 291 2.97
26. How often do you use an Internet connection to access the web or for email?
Every day Nearly every day A few times per week Once a week or less
26. How often do you use an Internet connection to access the web or for email?
Once a week or less A few times per week Nearly every day Everyday
Figure 4. Response Order Manipulations in Scalar Questions
in the response distributions were significant for both the chi-square (χ2 = 41.57; p < .001) and the independent samplest-test (t = −3.93; p < .001).
Table 7 shows the analyses of the response distributionsfor the Internet usage question by demographic groups. Thetop two rows of the table show the response distributions of thetwo response categories (everyday and nearly everyday) forwhich the overall distributions showed significant differencesby version. Across all the demographic groups, the samerelationship as seen in the overall distributions is found. Inother words, regardless of age, educational attainment, or sex,the everyday category was chosen significantly more whenit appeared first than when it appeared last and the nearlyeveryday response was chosen at significantly higher levelswhen it appeared before the everyday option (Chi-Square testsshow p <.01 for each group). However, the effect seems tobe greatest among those under the age of 60, with a collegedegree or more, and men.
Conclusions. While the question concerning the amountthat respondents traveled 100 miles or more outside the lo-cal area showed no significant results for the sample as awhole or by any demographic, the question concerning theamount that individuals used the Internet or email producedsignificant results for the sample as a whole and among eachdemographic group. What appears to have happened was aclear case of satisficing, where respondents found the firstanswer they could reasonably justify and selected it. Thus,when the response option “nearly everyday” appeared before“everyday,” respondents chose it and moved on to the nextquestion. What is interesting is that we find this effect acrossdemographic groups; therefore, it does not appear that cog-nitive sophistication, as some have suggested, caused thesetypes of mistakes (Krosnick 1991). Instead, it appears thatthe effects can be traced back to question design.
These scalar question findings contribute to research onsatisficing and primacy. Due to the inconsistency in pastfindings on primacy, some have suggested that other aspects
130 MICHAEL J. STERN, DON. A. DILLMAN AND JOLENE D. SMYTH
Table 6: Response Distributions for Manipulations of Response Options: Percentages of Respondents Choosing Each Response When GivenCategories in Order from High to Low Levels of Activity and the Reverse Order
Travel Question Internet Usage Question
High to Reverse High to ReverseLow Order Low Order
(1) Once or more a week 4.1 5.8 (1) Everyday 56.3 37.5(2) Once or more a month 38.1 37.9 (2) Nearly everyday 15.6 28.8(3) Once or more a year 45.5 43.0 (3) A few times per week 15.4 18.5(4) About once a year 6.6 6.3 (4) Once a week or less 12.8 15.3(5) Less than once a year 5.7 7.0
Mean 2.71 2.72 Mean 1.85 2.12
n 654 653 n 638 631
Overall Chi-Square χ2 = 3.33, p = .504 Overall Chi-Square χ2 = 41.57, p =< .001t-test t = −0.14, p = .885 t-test t = −3.93, p = .000
of questions, whether topic, structure or some other feature,might contribute to the occurrence of such effects (Dillman,Sangster, Tarnai and Rockwood 1996). One of the two ques-tions here may provide examples of such effects. In the Inter-net usage question, either of the two adjacent categories (usingthe Internet everyday or using it nearly everyday) is probablysatisfactory for many respondents to check. Therefore, theone that appears first in the sequence is more likely to getchosen, while the remaining categories are unaffected.
Experiment 6: Response Category Effects in thePresence of a Don’t Know Response Option
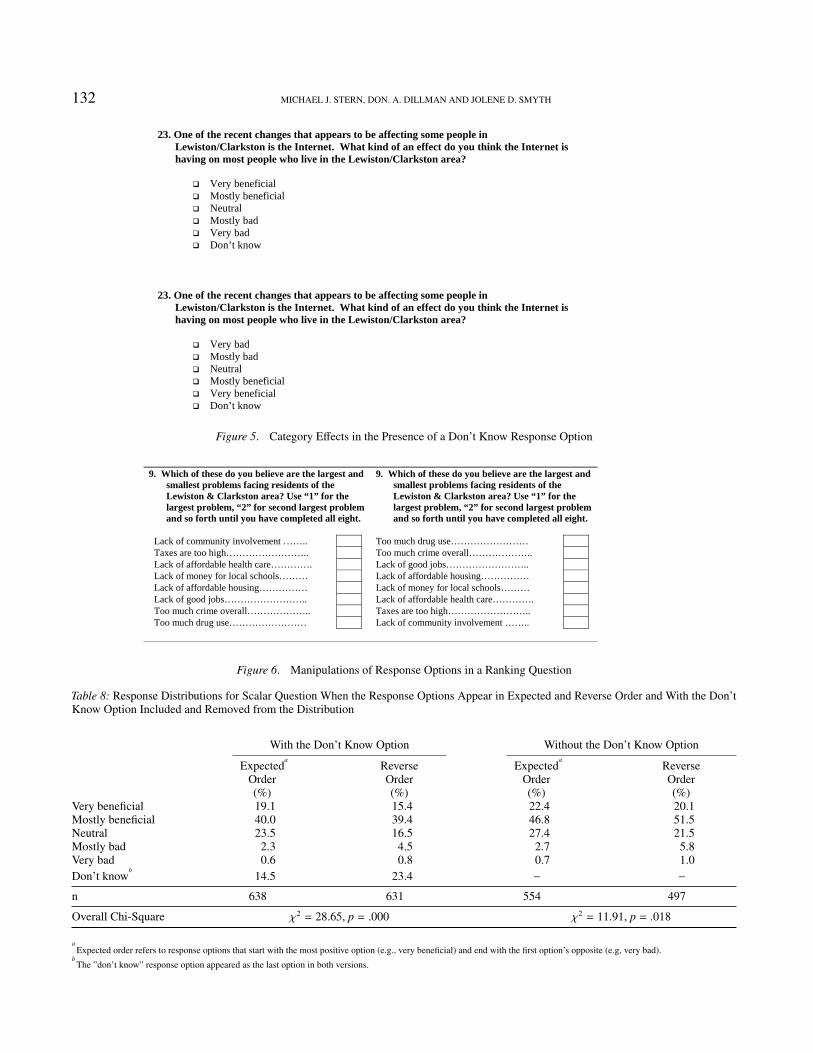
The next experiment examines response order effects inan opinion-based scalar question that includes a “don’t know”response option (Figure 5). Though the response optionswere reversed in version 2, the “don’t know” appeared at thebottom of both lists; that is, only the substantive responseswere reversed.
Research has shown that respondents tend to look formore positive answers in scales (Dillman 2007). As such,we expect the “don’t know” response to be used less oftenwhen the options are ordered from most positive to mostnegative because in this ordering respondents can quickly findan option that fits them. Moreover, we expect those withoutan opinion to choose the “neutral” category in this version. Incontrast, we expect the “don’t know” option to be used moreoften when the negative options are presented first becauserespondents have to read further through the list to find thepositive answers, making them more likely to see, and thenuse, the “don’t know” option. Furthermore, based on the workof Rapoport (1982) and Knauper (1999), we expect womento be more likely to provide the “don’t know” or “neutral”response than men, and individuals over the age of 60 andwith less than a college degree to be most affected by thereversal of response options, leading to higher percentages ofnon-opinions than among younger individuals.
Findings. Table 8 reports the results for response dis-tributions both with the “don’t know” category and with it
removed from the response distribution. It is clear that whenthe response options start with the negative categories, re-spondents are more likely to choose the “don’t know” cate-gory, compared to when the response options begin with posi-tive categories (23.4% and 14.5%, respectively [χ2 = 16.75;p < .001]). Additionally, as hypothesized, when the responseoptions appear in the expected order (e.g. positive first), re-spondents are more likely to choose the “neutral” responsethan in the alternate version (23.5% and 16.5%, respectively[χ2 = 9.86; p < .01]).
Table 9 reports the percentages for the use of the “don’tknow” and “neutral” response options by respondents’ char-acteristics. With respect to the “don’t know” category, everydemographic group except respondents with less than a col-lege degree exhibited the same behavior as that seen in theoverall response distributions. While respondents over the ageof 60 reported higher levels of non-opinionation than youngerrespondents, each group appears to be similarly affected bythe reversal of response options. This is also true for thedifference between women and men. Women reported higherlevels of non-opinionation overall, but both sexes were morelikely to choose the “don’t know” response when given theversion that began with “very bad.” Turning to the “neutral”category, respondents over 60, those with a college degree ormore, and women showed the greatest propensity to choosethis option more in the expected order than in the reverseorder.
Conclusions. When the response options appeared in anexpected order with “very beneficial” listed first, respondentswere much less likely to choose “don’t know” than when theoptions began in the reverse order. This effect supports previ-ous research on visual layout and design (Tourangeau, Couperand Conrad 2004) that predicts negative effects of breakingrespondents’ a priori expectations. When examining whethercertain demographic groups were more likely to be affectedby the design of this question, it was found that the likelihoodof choosing the “don’t know” category in the reverse order cutacross all but one demographic group (respondents with lessthan a college degree), meaning that the visual layout seems
VISUAL DESIGN, ORDER EFFECTS, AND RESPONDENT CHARACTERISTICS IN A SELF-ADMINISTERED SURVEY 131
Tabl
e7:
Res
pons
eD
istr
ibut
ions
forM
anip
ulat
ion
ofQ
uest
ion
forE
ach
Dem
ogra
phic
Gro
up
60ye
ars+
<60
year
sC
olle
ge+
<C
olle
geW
omen
Men
Hig
hto
Low
toH
igh
toL
owto
Hig
hto
Low
toH
igh
toL
owto
Hig
hto
Low
toH
igh
toL
owto
Low
Hig
hL
owH
igh
Low
Hig
hL
owH
igh
Low
Hig
hL
owH
igh
(%)
(%)
(%)
(%)
(%)
(%)
(%)
(%)
(%)
(%)
(%)
(%)
(1)E
very
day
54.9
38.0
59.6
39.3
62.0
42.7
46.6
29.5
57.4
38.9
59.6
37.2
(2)N
earl
yev
eryd
ay14.7
32.0
14.1
28.4
14.9
26.4
17.0
33.2
14.8
29.7
14.0
29.6
(3)A
few
times
perw
eek
12.7
18.0
15.0
17.2
14.6
18.9
15.9
17.9
13.9
17.2
15.5
17.9
(4)O
nce
aw
eek
orle
ss17.6
12.0
11.4
15.1
8.5
12.1
20.5
19.5
13.9
14.2
10.9
15.3
Mea
n1.
932.
041.
782.
081.
942.
221.
641.
871.
842.
071.
782.
11
n10
210
033
433
131
630
717
619
024
423
919
319
6
Ove
rall
Chi
-Squ
are
χ2=
11.5
8,χ
2=
32.2
2,χ
2=
24.7
7,χ
2=
16.6
9,χ
2=
21.5
3,χ
2=
22.6
4,p=.0
09p=.0
00p=.0
00p=.0
01p=.0
00p=.0
00t-
test
t=−
0.69
,t=−
3.52
,t=−
3.91
,t=−
2.14
,t=−
2.24
,t=−
3.08
p=.4
86p=.0
00p=.0
01p=.0
33p=.0
25p=.0
02
Perc
enta
ges
ofR
espo
nden
tsC
hoos
ing
Eac
hR
espo
nse
Whe
nG
iven
Cat
egor
ies
inO
rder
from
Hig
hto
Low
Lev
els
and
the
Rev
erse
Ord
er
132 MICHAEL J. STERN, DON. A. DILLMAN AND JOLENE D. SMYTH
23. One of the recent changes that appears to be affecting some people in Lewiston/Clarkston is the Internet. What kind of an effect do you think the Internet is having on most people who live in the Lewiston/Clarkston area?
Very beneficial Mostly beneficial Neutral Mostly bad Very bad Don’t know
23. One of the recent changes that appears to be affecting some people in
Lewiston/Clarkston is the Internet. What kind of an effect do you think the Internet is having on most people who live in the Lewiston/Clarkston area?
Very bad Mostly bad Neutral Mostly beneficial Very beneficial Don’t know
Figure 5. Category Effects in the Presence of a Don’t Know Response Option
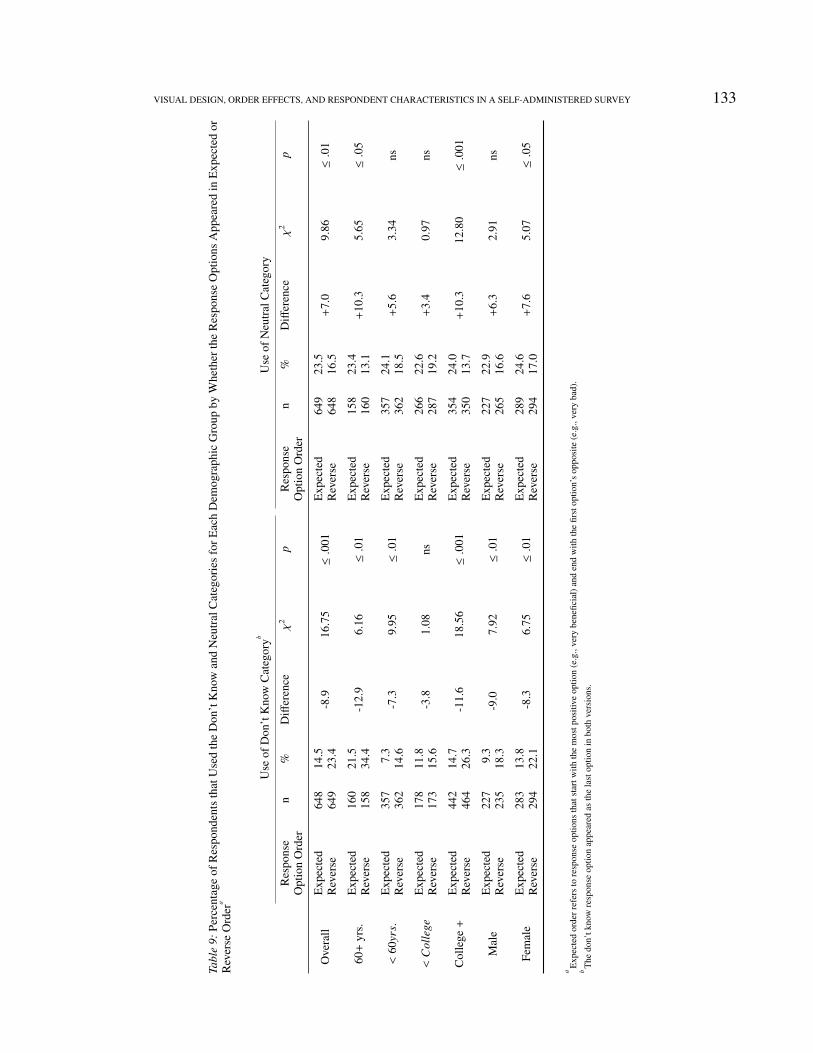
9. Which of these do you believe are the largest and smallest problems facing residents of the Lewiston & Clarkston area? Use “1” for the largest problem, “2” for second largest problem and so forth until you have completed all eight.
Lack of community involvement …….. Taxes are too high…………………….. Lack of affordable health care…………. Lack of money for local schools……… Lack of affordable housing…………… Lack of good jobs…………………….. Too much crime overall……………….. Too much drug use……………………
9. Which of these do you believe are the largest and smallest problems facing residents of the Lewiston & Clarkston area? Use “1” for the largest problem, “2” for second largest problem and so forth until you have completed all eight.
Too much drug use…………………… Too much crime overall……………….. Lack of good jobs…………………….. Lack of affordable housing…………… Lack of money for local schools……… Lack of affordable health care…………. Taxes are too high…………………….. Lack of community involvement ……..
Figure 6. Manipulations of Response Options in a Ranking Question
Table 8: Response Distributions for Scalar Question When the Response Options Appear in Expected and Reverse Order and With the Don’tKnow Option Included and Removed from the Distribution
With the Don’t Know Option Without the Don’t Know Option
Expecteda
Reverse Expecteda
ReverseOrder Order Order Order(%) (%) (%) (%)
Very beneficial 19.1 15.4 22.4 20.1Mostly beneficial 40.0 39.4 46.8 51.5Neutral 23.5 16.5 27.4 21.5Mostly bad 2.3 4.5 2.7 5.8Very bad 0.6 0.8 0.7 1.0Don’t know
b14.5 23.4 − −
n 638 631 554 497
Overall Chi-Square χ2 = 28.65, p = .000 χ2 = 11.91, p = .018
aExpected order refers to response options that start with the most positive option (e.g., very beneficial) and end with the first option’s opposite (e.g, very bad).
bThe ”don’t know” response option appeared as the last option in both versions.
VISUAL DESIGN, ORDER EFFECTS, AND RESPONDENT CHARACTERISTICS IN A SELF-ADMINISTERED SURVEY 133
Tabl
e9:
Perc
enta
geof
Res
pond
ents
that
Use
dth
eD
on’t
Kno
wan
dN
eutr
alC
ateg
orie
sfo
rEac
hD
emog
raph
icG
roup
byW
heth
erth
eR
espo
nse
Opt
ions
App
eare
din
Exp
ecte
dor
Rev
erse
Ord
era
Use
ofD
on’t
Kno
wC
ateg
oryb
Use
ofN
eutr
alC
ateg
ory
Res
pons
en
%D
iffer
ence
χ2
pR
espo
nse
n%
Diff
eren
ceχ
2p
Opt
ion
Ord
erO
ptio
nO
rder
Ove
rall
Exp
ecte
d64
814
.5-8
.916
.75
≤.0
01E
xpec
ted
649
23.5
+7.
09.
86≤.0
1R
ever
se64
923
.4R
ever
se64
816
.5
60+
yrs.
Exp
ecte
d16
021
.5-1
2.9
6.16
≤.0
1E
xpec
ted
158
23.4
+10
.35.
65≤.0
5R
ever
se15
834
.4R
ever
se16
013
.1
<60
yrs.
Exp
ecte
d35
77.
3-7
.39.
95≤.0
1E
xpec
ted
357
24.1
+5.
63.
34ns
Rev
erse
362
14.6
Rev
erse
362
18.5
<C
olle
geE
xpec
ted
178
11.8
-3.8
1.08
nsE
xpec
ted
266
22.6
+3.
40.
97ns
Rev
erse
173
15.6
Rev
erse
287
19.2
Col
lege+
Exp
ecte
d44
214
.7-1
1.6
18.5
6≤.0
01E
xpec
ted
354
24.0
+10
.312
.80
≤.0
01R
ever
se46
426
.3R
ever
se35
013
.7
Mal
eE
xpec
ted
227
9.3
-9.0
7.92
≤.0
1E
xpec
ted
227
22.9
+6.
32.
91ns
Rev
erse
235
18.3
Rev
erse
265
16.6
Fem
ale
Exp
ecte
d28
313
.8-8
.36.
75≤.0
1E
xpec
ted
289
24.6
+7.
65.
07≤.0
5R
ever
se29
422
.1R
ever
se29
417
.0
aE
xpec
ted
orde
rref
ers
tore
spon
seop
tions
that
star
twith
the
mos
tpos
itive
optio
n(e
.g.,
very
bene
ficia
l)an
den
dw
ithth
efir
stop
tion’
sop
posi
te(e
.g.,
very
bad)
.bT
hedo
n’tk
now
resp
onse
optio
nap
pear
edas
the
last
optio
nin
both
vers
ions
.
134 MICHAEL J. STERN, DON. A. DILLMAN AND JOLENE D. SMYTH
to have affected most respondents in the same way, regardlessof demographic characteristics.
With the “don’t know” category, we see that this optionis much more likely to get checked when the most used cat-egories (very beneficial and mostly beneficial) appear at theend of the response options. As suggested in our hypotheses,in this situation the “don’t know” response option is visuallymore accessible to respondents. While in the other version,the respondents may check the beneficial categories at thetop of the list and never see the “don’t know” category, thusrendering the “don’t know” category visually inaccessible.Previous research has also shown that when an undecided cat-egory is placed in the middle of scalar responses, respondentsthat are neutral as well as undecided use it (Willits and Janota1996).
Experiment 7: Response Order Manipulations in aRanking Question
Design. Although response order effects are widely doc-umented in scalar questions (Dillman 2007; Krosnick 1999;Schuman and Presser 1981) as well as in mark-all-that-applyquestions (Smyth et al. 2006), very little research has ad-dressed whether they are present in ranking questions. How-ever, survey researchers often ask respondents to rank a seriesof items. In these ranking questions, respondents are generallygiven a list of response options and asked to rank them basedon a given criterion that is generally specified in the query(e.g. What is the biggest problem?). These questions may bevery difficult for respondents to answer for two reasons. First,respondents must carry the information from the query to thelist of response options. For example, the query might askthe respondent to rank the options from best to worst or viceversa. However, the respondent must recall when answeringthe question what the highest and lowest numbers are meant torepresent. Second, respondents must evaluate each responseoption relative to the others in order to provide a ranking; thus,the more options there are, the more difficult the task.
In the only test of reversing response options in a rankingquestion that we could locate, Ali (2003) found that the re-versal affected how respondents ranked the options on a scalefrom 1 to 10 where 1 represented the biggest problem in thecommunity and 10 represented the smallest problem. Specif-ically, the data showed that options at the top and bottomof the list showed significant differences, with options listedfirst receiving a higher ranking (i.e. were listed as “biggerproblems”). Nonetheless, some researchers have suggestedthat ranking questions actually produce better data than thetraditionally used rating questions because respondents tendto answer rating questions very quickly (see Krosnick 1999for review). However, Krosnick’s (1999) work on satisficingwould suggest that one should expect response order effects inranking questions due to the cognitive difficulty of answeringthem. As a result of this work, we expect to see an indicationof respondents satisficing, as evidenced through primacy byranking options as larger problems (i.e., giving them lowernumbers where 1 means the largest problem) when they ap-pear early in the list than when they appear later in the list,
because of the cognitive difficulty of ranking questions. Thus,the major difference is expected to appear in the first and lastfew response options; the middle categories are not expectedto exhibit the same magnitude of differences. Based on previ-ous research, we also expect older respondents and those withless than a college degree to be most affected by the reversalof the response options. Furthermore, one might expect theneed to carry information from the query and evaluate eachoption in relation to others to be more cognitively taxingfor older individuals as well as those with lower levels ofeducation (Knauper 1999), resulting in more response ordereffects among these groups.
To examine these expectations the final experiment exam-ines two versions of a question that asked respondents to rankeight problems facing the area from the largest to the smallest.Exact question wording as well as the original and reverseorder presentations of the response options can be seen inFigure 6. In the analyses below, 303 cases were removed(reducing the sample size from 1,315 to 1,012) because theyeither provided the same ranking to different items or did notprovide a ranking for all eight items.
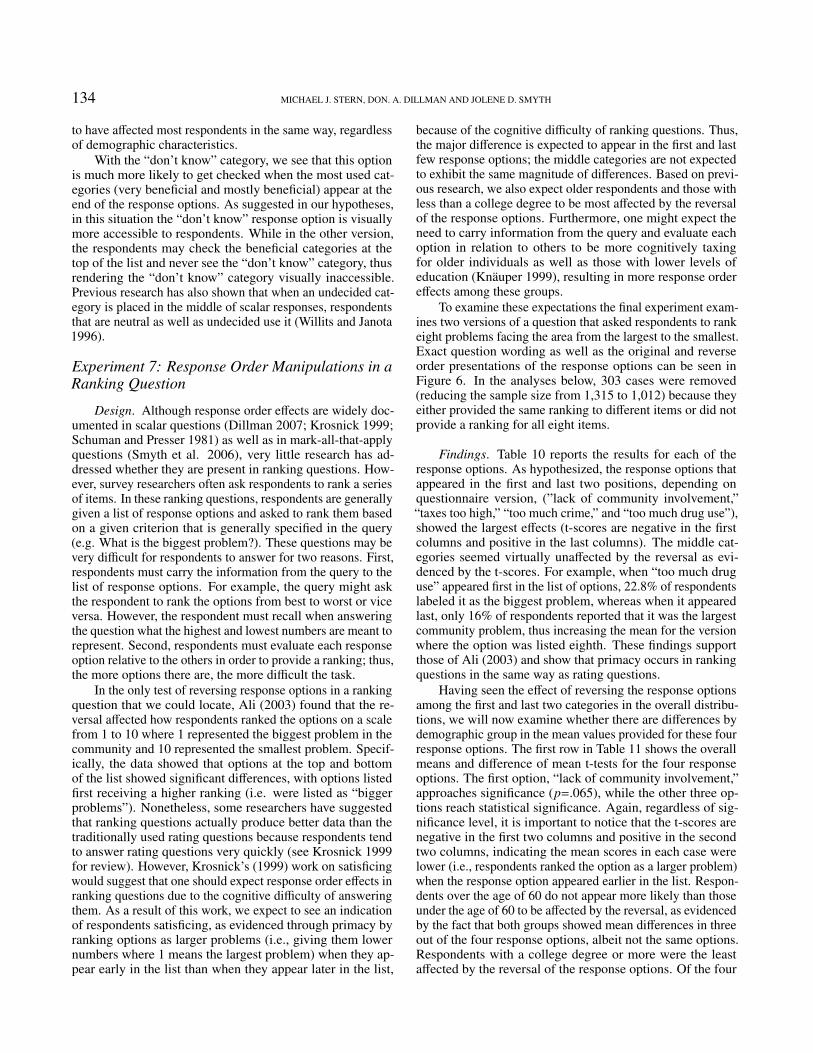
Findings. Table 10 reports the results for each of theresponse options. As hypothesized, the response options thatappeared in the first and last two positions, depending onquestionnaire version, (”lack of community involvement,”“taxes too high,” “too much crime,” and “too much drug use”),showed the largest effects (t-scores are negative in the firstcolumns and positive in the last columns). The middle cat-egories seemed virtually unaffected by the reversal as evi-denced by the t-scores. For example, when “too much druguse” appeared first in the list of options, 22.8% of respondentslabeled it as the biggest problem, whereas when it appearedlast, only 16% of respondents reported that it was the largestcommunity problem, thus increasing the mean for the versionwhere the option was listed eighth. These findings supportthose of Ali (2003) and show that primacy occurs in rankingquestions in the same way as rating questions.
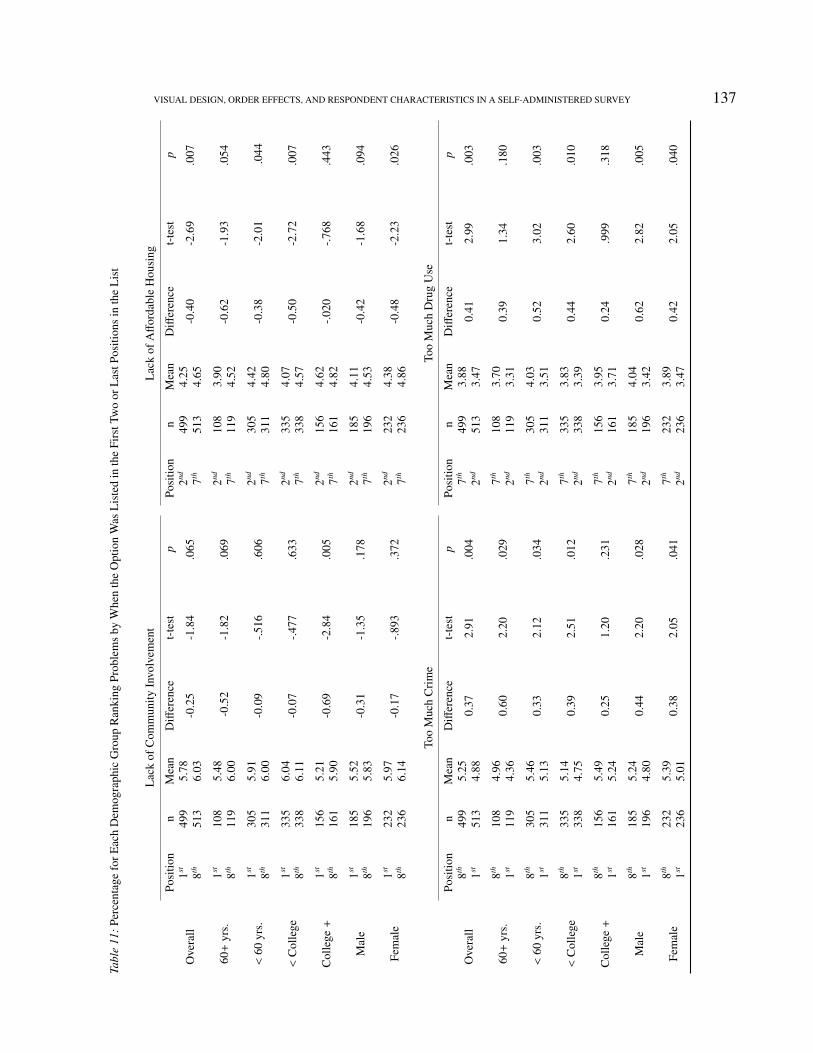
Having seen the effect of reversing the response optionsamong the first and last two categories in the overall distribu-tions, we will now examine whether there are differences bydemographic group in the mean values provided for these fourresponse options. The first row in Table 11 shows the overallmeans and difference of mean t-tests for the four responseoptions. The first option, “lack of community involvement,”approaches significance (p=.065), while the other three op-tions reach statistical significance. Again, regardless of sig-nificance level, it is important to notice that the t-scores arenegative in the first two columns and positive in the secondtwo columns, indicating the mean scores in each case werelower (i.e., respondents ranked the option as a larger problem)when the response option appeared earlier in the list. Respon-dents over the age of 60 do not appear more likely than thoseunder the age of 60 to be affected by the reversal, as evidencedby the fact that both groups showed mean differences in threeout of the four response options, albeit not the same options.Respondents with a college degree or more were the leastaffected by the reversal of the response options. Of the four
VISUAL DESIGN, ORDER EFFECTS, AND RESPONDENT CHARACTERISTICS IN A SELF-ADMINISTERED SURVEY 135
Tabl
e10
:Per
cent
age
ofR
espo
nden
tsR
anki
ngPr
oble
ms
inth
eC
omm
unity
byPo
sitio
nth
eO
ptio
nW
asL
iste
din
the
Res
pons
eC
ateg
orie
s.
Lac
kof
Lac
kof
Lac
kof
Lac
kof
com
mun
ityTa
xes
too
affor
dabl
em
oney
for
affor
dabl
eL
ack
ofTo
om
uch
Too
muc
hin
volv
emen
thi
ghhe
alth
care
loca
lsch
ools
hous
ing
good
jobs
crim
edr
ugus
e
1st8th
2nd7th
3rd6th
4th5th
5th4th
6th3rd
7th2nd
8th1st
Posi
tion
(%)
(%)
(%)
(%)
(%)
(%)
(%)
(%)
(%)
(%)
(%)
(%)
(%)
(%)
(%)
(%)
Lar
gest
Prob
lem
s1
3.0
3.5
15.0
11.5
5.8
6.6
4.8
6.6
3.4
1.2
49.9
46.0
2.2
4.1
16.0
22.8
25.
65.
517
.413
.814
.014
.612
.813
.19.
612
.613
.816
.68.
611
.722
.417
.53
8.4
7.4
10.4
11.9
16.0
16.4
15.6
12.9
8.2
12.5
16.6
13.8
12.8
10.1
13.6
15.2
413
.09.
412
.210
.516
.815
.015
.014
.014
.612
.37.
010
.913
.415
.68.
811
.75
11.4
9.2
10.0
11.3
17.2
13.6
14.4
14.8
18.2
15.0
5.6
6.4
11.8
16.4
10.4
12.5
612
.211
.910
.29.
911
.812
.316
.213
.617
.818
.72.
83.
517
.418
.38.
49.
6Sm
alle
stPr
oble
ms
713
.413
.313
.615
.811
.214
.09.
414
.414
.417
.02.
41.
819
.613
.613
.28.
48
32.9
40.0
11.0
15.2
7.0
7.4
11.6
10.5
13.6
11.3
0.9
0.5
14.0
10.1
7.0
2.3
Mea
n5.
796.
044.
254.
654.
414.
444.
274.
345.
145.
082.
312.
385.
254.
893.
883.
47
n49
951
349
951
349
951
349
951
349
951
349
951
349
951
349
951
3
Ove
rall
Chi
-Squ
are
χ2=
8.36
,χ
2=
10.1
9,χ
2=
4.60
,χ
2=
9.34
,χ
2=
16.2
7,χ
2=
10.0
8,χ
2=
20.9
6,χ
2=
30.1
9,p=.3
02p=.1
78p=.7
00p=.2
04p=.0
23p=.1
84p=.0
05p=.0
00t-
test
t=−
1.85
,t=−
2.69
,t=−.2
66,
t=−.2
05,
t=.4
60,
t=−.5
53,
t=2.
92,
t=2.
99,
p=.0
65p=.0
07p=.7
90p=.8
37p=.6
46p=.5
81p=.0
04p=.0
03
136 MICHAEL J. STERN, DON. A. DILLMAN AND JOLENE D. SMYTH
response options, individuals with a college degree or moreonly showed a primacy effect for “lack of community involve-ment” (listed first in one version and last in the other). Forrespondents with less than a college degree, a primacy patternwas present in three of the four options. In terms of sex, bothmen and women were affected by the reversal in similar ways.
Conclusions. Overall, the position of the response optionclearly affects how it was ranked. However, as seen above,there are some mixed results concerning how powerfully theresponse option’s position affected respondents across the de-mographic groups. For example, there is little support for thehypothesis that age would affect the propensity for satisficingin this experiment. However, there is evidence that educationaffected the likelihood of satisficing. As a result, in keepingwith previous research (Krosnick, Narayan and Smith 1996),it appears that respondents with less than a college degreewere more affected by the reversal than those with a collegedegree or more. Nonetheless, most of the demographic groupsshowed a propensity to provide low rankings when the itemappeared high in the list, suggesting that the question designoutweighed individual demographic differences.
Discussion & OverallConclusions
This paper has attempted to contribute to our understand-ing of how to reduce measurement error in self-administeredsurveys by unifying two literatures. On the one hand, theemerging literature concerning visual layout and design the-ory has not addressed how respondents with varied demo-graphic characteristics may be differentially affected by thequestionnaire design. Indeed, a major shortcoming of thisresearch has been the homogeneity of the samples used totest these theories, in particular, the use of college studentsamples. On the other hand, the research concerning demo-graphic differences in respondent behavior has not addressedthe recent contributions of visual design theory.
The results from our seven experiments embedded in ageneral population survey provide substantial evidence thatthe visual design of questions (graphical and verbal manip-ulations) in self-administered surveys affects respondents’behavior regardless of age, educational attainment, and sex.Thus, the results of this paper lend considerable support toprevious work that has served to explicate and/or test visualdesign theory. For example, the replications of Christianand Dillman’s (2004) number box versus polar point scalarquestions and use of different sized open-ended answer spacesresulted in findings that suggest that it is the visual design thatwas influential across demographic sub-groups. In addition,we were able to replicate the findings from Smyth et al.’s(2006) check-all-that-apply versus forced choice formats forall but two of demographic groups (men and respondents over60).
A very interesting result is that the use of the don’t knowcategory was so dramatically affected by the reversal of re-sponse options. These findings seem to support the sugges-tion of Tourangeau, Couper and Conrad (2004) that whenthe response options do not meet the respondent’s a priori
expectations, the way they answer the question is affected.In our test, the neutral category was used more often whenthe beneficial categories were placed first. This use seemsconsistent with respondents reading down a list that starts withpositive responses, but when noting that they were movinginto negative responses (which few wanted to pick) they optedfor what seemed a reasonable category (i.e. neutral). It isimpossible to know whether this finding is the product ofhigher levels of non-opinionation, as suggested by Rapoport(1982), or the effects of the “up means good” and “middlemeans typical” heuristics. In all likelihood, it is a combination.However, it is clear that the reversal of response options didnot equally affect all demographic groups in terms of theirpropensity to choose the conceptual middle category (”neu-tral”). These findings suggest that it is not only category orderthat may influence people’s answers, but characteristics ofthose categories and their layout, as well as the visibility ofresponse options. This explanation may also address whythere were not consistent results across demographic groupsin the ranking question. This is an issue that clearly needs fur-ther research, which may help explain the highly inconsistentresults observed in previous primacy experiments.
In short, while the majority of these seven experimentshave shown that the effects of visual design affect peopleof different ages, educational attainment, and sex in similarways, what remains unresolved is why different demographicgroups show effects to be of the same kind and yet differentin degree and/or magnitude. For example, while all demo-graphic groups provided more answers in the larger space inthe open-ended experiment, there was quite a bit of variationbetween the groups, particularly, in terms of the number ofwords used regardless of box size. Several of these issuesmay benefit from the use of cognitive interviews where morein-depth qualitative data can be collected and analyzed. Thus,while this research bolsters previous studies on the importanceof visual design theory, more studies are needed to test thevarying effects on demographic groups.
Acknowledgements
Support for conducting this research was provided by the De-partment of Community and Rural Sociology and the Socialand Economic Sciences Research Center at Washington StateUniversity, Pullman, WA. Additional support was providedby the USDA-National Agricultural Statistics Service and theNational Science Foundation Division of Science ResourceStatistics under Cooperative Agreement #43-3AEU-1-80055with the Washington State University Social and EconomicSciences Research Center, Don A. Dillman, Principal Investi-gator.We wish to acknowledge with thanks thoughtful commentson earlier versions of this paper provided by Kendra W. Stern,Thomas Rotolo, and Scott Myers.
ReferencesAli, Y. (2003). Local and global environmental issues and atti-
tudes: The case of the snake and clearwater rivers. (UnpublishedDoctoral Dissertation. Washington State University)
VISUAL DESIGN, ORDER EFFECTS, AND RESPONDENT CHARACTERISTICS IN A SELF-ADMINISTERED SURVEY 137Ta
ble
11:P
erce
ntag
efo
rEac
hD
emog
raph
icG
roup
Ran
king
Prob
lem
sby
Whe
nth
eO
ptio
nW
asL
iste
din
the
Firs
tTw
oor
Las
tPos
ition
sin
the
Lis
t
Lac
kof
Com
mun
ityIn
volv
emen
tL
ack
ofAff
orda
ble
Hou
sing
Posi
tion
nM
ean
Diff
eren
cet-
test
pPo
sitio
nn
Mea
nD
iffer
ence
t-te
stp
Ove
rall
1st49
95.
78-0
.25
-1.8
4.0
652nd
499
4.25
-0.4
0-2
.69
.007
8th51
36.
037th
513
4.65
60+
yrs.
1st10
85.
48-0
.52
-1.8
2.0
692nd
108
3.90
-0.6
2-1
.93
.054
8th11
96.
007th
119
4.52
<60
yrs.
1st30
55.
91-0
.09
-.516
.606
2nd30
54.
42-0
.38
-2.0
1.0
448th
311
6.00
7th31
14.
80
<C
olle
ge1st
335
6.04
-0.0
7-.4
77.6
332nd
335
4.07
-0.5
0-2
.72
.007
8th33
86.
117th
338
4.57
Col
lege+
1st15
65.
21-0
.69
-2.8
4.0
052nd
156
4.62
-.020
-.768
.443
8th16
15.
907th
161
4.82
Mal
e1st
185
5.52
-0.3
1-1
.35
.178
2nd18
54.
11-0
.42
-1.6
8.0
948th
196
5.83
7th19
64.
53
Fem
ale
1st23
25.
97-0
.17
-.893
.372
2nd23
24.
38-0
.48
-2.2
3.0
268th
236
6.14
7th23
64.
86
Too
Muc
hC
rim
eTo
oM
uch
Dru
gU
se
Posi
tion
nM
ean
Diff
eren
cet-
test
pPo
sitio
nn
Mea
nD
iffer
ence
t-te
stp
Ove
rall
8th49
95.
250.
372.
91.0
047th
499
3.88
0.41
2.99
.003
1st51
34.
882nd
513
3.47
60+
yrs.
8th10
84.
960.
602.
20.0
297th
108
3.70
0.39
1.34
.180
1st11
94.
362nd
119
3.31
<60
yrs.
8th30
55.
460.
332.
12.0
347th
305
4.03
0.52
3.02
.003
1st31
15.
132nd
311
3.51
<C
olle
ge8th
335
5.14
0.39
2.51
.012
7th33
53.
830.
442.
60.0
101st
338
4.75
2nd33
83.
39
Col
lege+
8th15
65.
490.
251.
20.2
317th
156
3.95
0.24
.999
.318
1st16
15.
242nd
161
3.71
Mal
e8th
185
5.24
0.44
2.20
.028
7th18
54.
040.
622.
82.0
051st
196
4.80
2nd19
63.
42
Fem
ale
8th23
25.
390.
382.
05.0
417th
232
3.89
0.42
2.05
.040
1st23
65.
012nd
236
3.47
138 MICHAEL J. STERN, DON. A. DILLMAN AND JOLENE D. SMYTH
Ayidiya, S., & McClendon, M. (1990). Response effects in mailsurveys. Public Opinion Quarterly, 54(2), 229-247.
Christian, L., & Dillman, D. (2004). The influence of graphi-cal and symbolic language manipulations on responses to self-administered questions. Public Opinion Quarterly, 68, 58-81.
Couper, M., Traugott, M., & Lamias, M. (2001). Web survey designand administration. Public Opinion Quarterly, 65, 230-253.
Dillman, D. (2007). Mail and internet surveys: The tailored designmethod. New York: Wiley.
Dillman, D., Sangster, R., Tarnai, J., & Rockwood, T. (1996). Under-standing differences in people’s answers to telephone and mailsurveys. New Directions for Evaluation, 70, 45-61.
Glenn, N. (1969). Aging, disengagement and opinionation. PublicOpinion Quarterly, 33(1), 17-33.
Israel, G. (2006, February). Visual cues and response format effectsin mail surveys. (Paper presented at the annual meeting of theSouthern Rural Sociological Association. Orlando Florida)
Jenkins, C., & Dillman, D. (1997). Towards a theory of self-administered questionnaire design. In L. E. Lyberg et al. (Eds.),Survey measurement and process quality. New York: John Wiley& Sons.
Knauper, B. (1999). The impact of age and education on responseorder effects in attitude measurement. Public Opinion Quarterly,63(3), 347-370.
Knauper, B., Belli, R., Hill, D., & Herzog, A. (1998). Questiondifficulty and respondents’ characteristics: Effects on data quality.Journal of Official Statistics, 13, 181-199.
Krosnick, J. (1991). Response strategies for coping with the cogni-tive demands of attitude measures in surveys. Applied CognitivePsychology, 5, 213-236.
Krosnick, J. (1992). The impact of cognitive sophistication andattitude importance on response-order and question-order effects.In N. Schwarz & S. Sudman (Eds.), Context effects in social andpsychological research. New York: Springer.
Krosnick, J. (1999). Survey research. Annual Review of Psychology,50, 537-567.
Krosnick, J., & Alwin, D. (1987). An evaluation of a cognitivetheory of response-order effects in survey measurement. PublicOpinion Quarterly, 51, 201-219.
Krosnick, J., Narayan, J., & Smith, W. (1996). Satisficing in surveys:Initial evidence. New Directions for Evaluation, 70, 29-44.
Rapoport, R. (1982). Sex differences in attitude expression: Agenerational explanation. Public Opinion Quarterly, 46(1), 86-96.
Redline, C., & Dillman, D. (2002). The influence of alternativevisual designs on respondents’ performance with branching in-structions in self-administered questionnaires. In R. M. Groves,D. Dillman, J. Eltinge, & R. Little (Eds.), Survey nonresponse.New York: Wiley.
Schuman, H., & Presser, S. (1981). Questions and answers inattitude surveys experiments on question form, wording, andcontext. New York: Academic Press.
Schwarz, N. (1996). Cognition and communication: Judgmentalbiases, research methods, and the logic of conversation. Mahwah,New Jersey: Lawrence Erlbaum.
Smith, T. (1993). Little things matter: A sampler of how differencesin questionnaire format can affect survey response. NationalOpinion Research Center, Methodological Report #78. (Univer-sity of Chicago General Society Survey)
Smyth, J., Dillman, D., Christian, L., & Stern, M. (2006). Compar-ing check-all and forced-choice question formats in web surveys.Public Opinion Quarterly, 70(1), 66-77.
Tourangeau, R., Couper, M., & Conrad, F. (2004). Spacing, position,and order: Interpretive heuristics for visual features of surveyquestions. Public Opinion Quarterly, 68, 368-393.
Tourangeau, R., Couper, M., & Conrad, F. (2007). Color, labels,and interpretive heuristics for response scales. Public OpinionQuarterly, 71, 91-112.