Embed Size (px)
Citation preview
A PUZZLE OF A DIFFERENT SORTEach month we host a membership group session called “Performance Measurement Think Tank.” It lasts about an hour, though sometimes a bit longer. Members submit performance and risk questions, and we answer them. For the most part, they’ve been chaired by John D. Simpson, CIPM or me.
I had the pleasure to do the February session on February 26th. And one member submitted a question relating to cash flows. Actually, it was three questions relating to a scenario they encountered.
I will present the entire scenario here, as I find it quite intriguing.
We begin with the base case, which apparently spurred the individual to seek guidance.
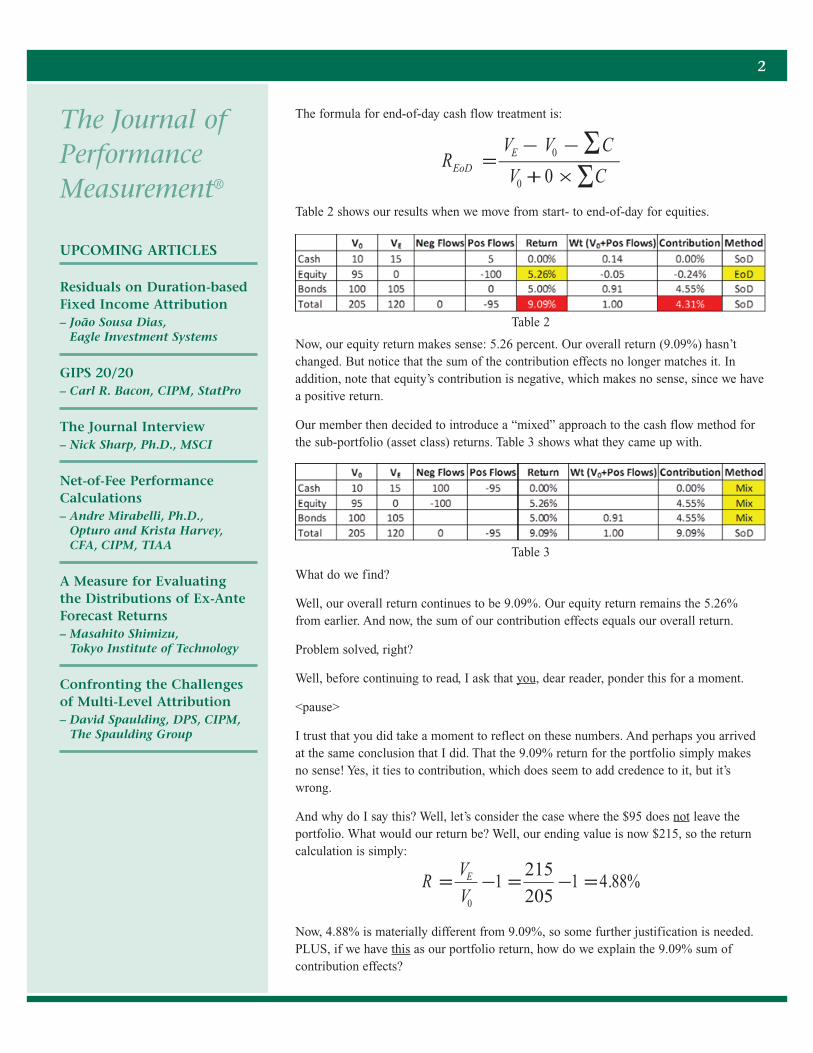
We have a portfolio that has a complete liquidation of equities, which results in $100, which. We can see that part of the cash ($5) goes into cash, and the balance ($95) leaves the portfolio.
The table not only shows our returns, but also the contribution effects.
You’ll recall that the sum of contribution effects should equal our overall return, and we see that this has, in fact, occurred: both equal 9.09 percent.
Note that the cash flow method is start-of-day. Returns are calculated daily, so our formula is:
I show the sum of the flows being multiplied by a one in the denominator, simply to indicate that the “weighting factor” for start-of-day cash flow treatment equals one, meaning the entire flow is included.
We’ve highlighted the return for equities because, well, it should be obvious that it is wrong. A −100% means we lost all of our money, but we didn’t. In fact, equities went from $95 to $100 before we did the transfer.
And so, we have a problem. What do we do?
Well, our member decided to switch the cash flow method for equities from start- to end-of-day. This isn’t unusual. Many (perhaps even “most”) firms will override their method (be it start- or end-of-day) when they get a clearly incorrect result.
Since 1990, The Spaulding Group has had an increasing presence in the money management industry. Unlike most consult-ing firms that support a variety of industries, our focus is on the money management industry.
Our involvement with the industry isn’t limited to consulting. We’re actively involved as members of the CFA Institute (formerly AIMR), the New York Society of Security Analysts (NYSSA), and other industry groups. Our president and founder regularly speaks at and/or chairs industry conferences and is a frequent author and source of information to various industry publications.
Our clients appreciate our industry focus. We understand their business, their needs, and the opportunities to make them more efficient and competitive.
For additional information about The Spaulding Group and our services, please visit our web site or contact Patrick Fowler at
http://www.SpauldingGrp.com
VOLUME 15 – ISSUE 6 MARCH 2018
Table 1
2
The Journal of Performance Measurement®
UPCOMING ARTICLES
Residuals on Duration-based Fixed Income Attribution – João Sousa Dias,
Eagle Investment Systems
GIPS 20/20– Carl R. Bacon, CIPM, StatPro
The Journal Interview– Nick Sharp, Ph.D., MSCI
Net-of-Fee Performance Calculations– Andre Mirabelli, Ph.D.,
Opturo and Krista Harvey, CFA, CIPM, TIAA
A Measure for Evaluating the Distributions of Ex-Ante Forecast Returns– Masahito Shimizu,
Tokyo Institute of Technology
Confronting the Challenges of Multi-Level Attribution– David Spaulding, DPS, CIPM,
The Spaulding Group
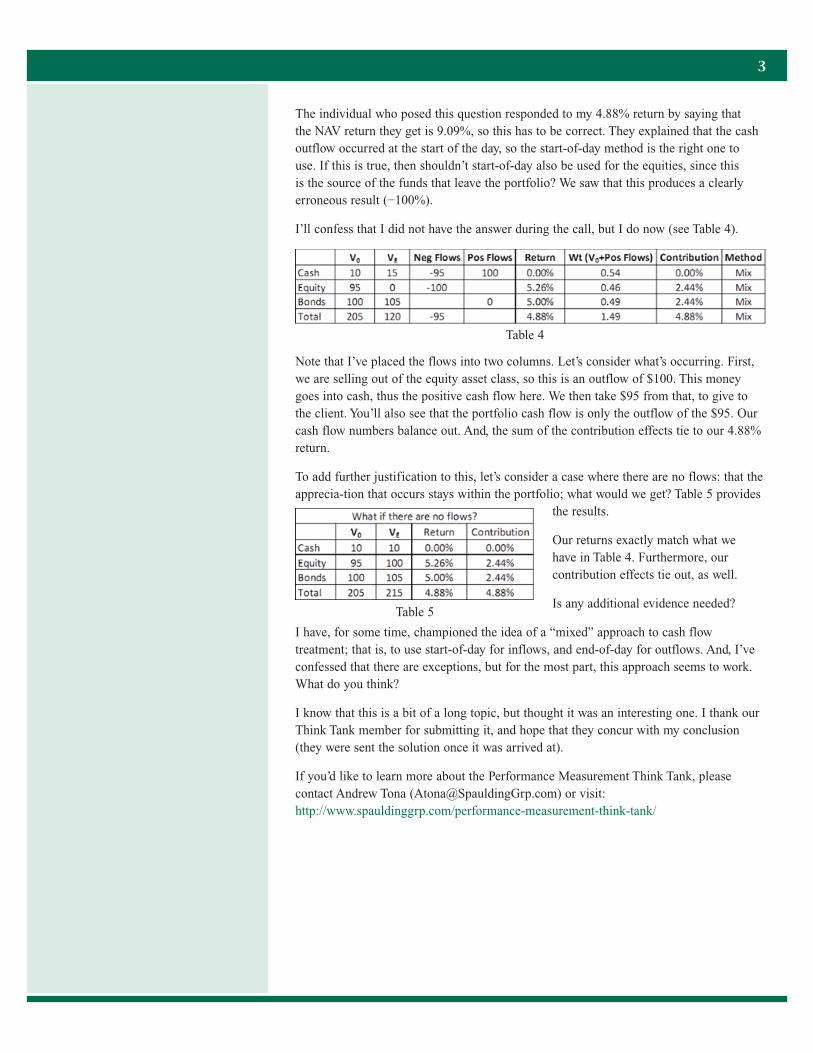
The formula for end-of-day cash flow treatment is:
Table 2 shows our results when we move from start- to end-of-day for equities.
Now, our equity return makes sense: 5.26 percent. Our overall return (9.09%) hasn’t changed. But notice that the sum of the contribution effects no longer matches it. In addition, note that equity’s contribution is negative, which makes no sense, since we have a positive return.
Our member then decided to introduce a “mixed” approach to the cash flow method for the sub-portfolio (asset class) returns. Table 3 shows what they came up with.
What do we find?
Well, our overall return continues to be 9.09%. Our equity return remains the 5.26% from earlier. And now, the sum of our contribution effects equals our overall return.
Problem solved, right?
Well, before continuing to read, I ask that you, dear reader, ponder this for a moment.
<pause>
I trust that you did take a moment to reflect on these numbers. And perhaps you arrived at the same conclusion that I did. That the 9.09% return for the portfolio simply makes no sense! Yes, it ties to contribution, which does seem to add credence to it, but it’s wrong.
And why do I say this? Well, let’s consider the case where the $95 does not leave the portfolio. What would our return be? Well, our ending value is now $215, so the return calculation is simply:
Now, 4.88% is materially different from 9.09%, so some further justification is needed. PLUS, if we have this as our portfolio return, how do we explain the 9.09% sum of contribution effects?
Table 2
Table 3
The individual who posed this question responded to my 4.88% return by saying that the NAV return they get is 9.09%, so this has to be correct. They explained that the cash outflow occurred at the start of the day, so the start-of-day method is the right one to use. If this is true, then shouldn’t start-of-day also be used for the equities, since this is the source of the funds that leave the portfolio? We saw that this produces a clearly erroneous result (−100%).
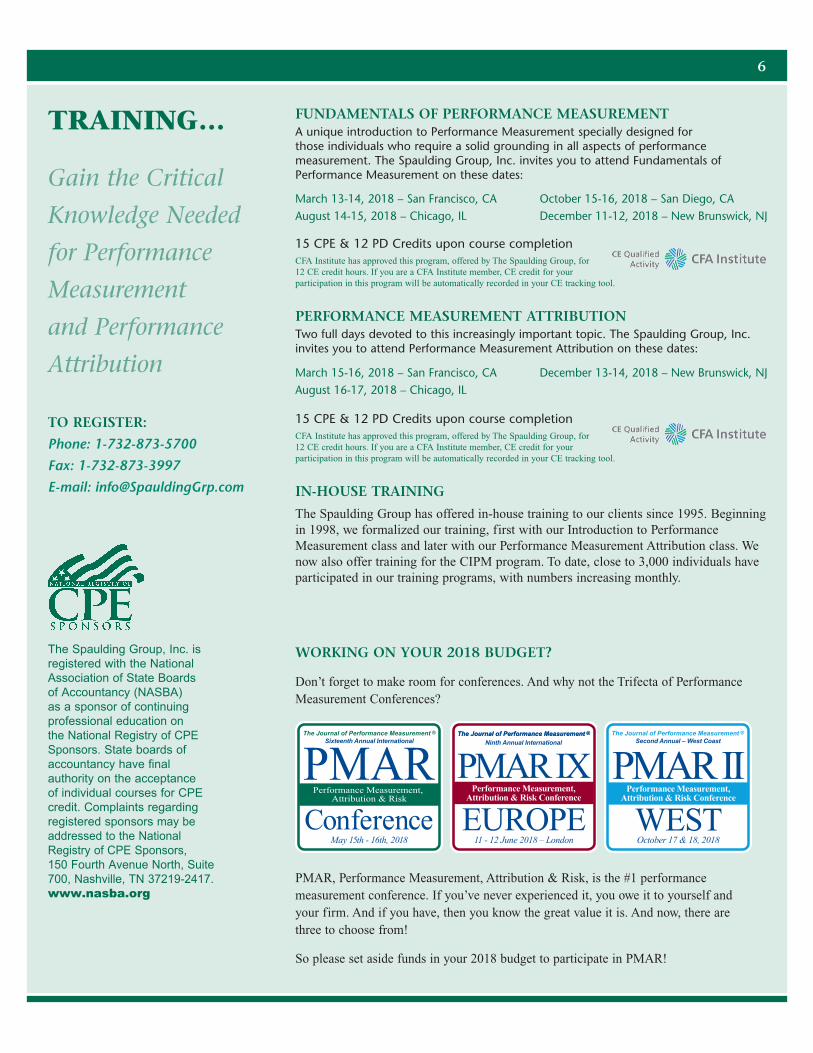
I’ll confess that I did not have the answer during the call, but I do now (see Table 4).
Note that I’ve placed the flows into two columns. Let’s consider what’s occurring. First, we are selling out of the equity asset class, so this is an outflow of $100. This money goes into cash, thus the positive cash flow here. We then take $95 from that, to give to the client. You’ll also see that the portfolio cash flow is only the outflow of the $95. Our cash flow numbers balance out. And, the sum of the contribution effects tie to our 4.88% return.
To add further justification to this, let’s consider a case where there are no flows: that the apprecia-tion that occurs stays within the portfolio; what would we get? Table 5 provides
the results.
Our returns exactly match what we have in Table 4. Furthermore, our contribution effects tie out, as well.
Is any additional evidence needed?
I have, for some time, championed the idea of a “mixed” approach to cash flow treatment; that is, to use start-of-day for inflows, and end-of-day for outflows. And, I’ve confessed that there are exceptions, but for the most part, this approach seems to work. What do you think?
I know that this is a bit of a long topic, but thought it was an interesting one. I thank our Think Tank member for submitting it, and hope that they concur with my conclusion (they were sent the solution once it was arrived at).
If you’d like to learn more about the Performance Measurement Think Tank, please contact Andrew Tona ([email protected]) or visit: http://www.spauldinggrp.com/performance-measurement-think-tank/
3
Table 4
Table 5

KEEP THOSE CARDS & LETTERS COMING
We appreciate the emails we receive regarding our newsletter. Mostly, we hear positive feedback while at other times, we hear opposition to what we suggest. That’s fine. We can take it. And more important, we encourage the dialogue. We see this newsletter as one way to communicate ideas and want to hear your thoughts.
4
Reminder! The Journal of Performance Measurement has established a new annual award, to be given to outstanding women in performance and risk measurement. We are currently seeking nominations, but you have to get the name(s) in by March 15th! Please email them to the journal’s editor, Douglas Spaulding: [email protected]. Don’t be shy: if you feel that you’re qualified, send your name in!.
PUZZLE TIME!
February Puzzle
February’s issue was delayed, and this one is a bit early, so we haven’t given our readers time to respond to the last puzzle: we will therefore provide answers to both the February and March puzzles in the April issue.
March Puzzle
The difference between two numbers is 66; the sum of these two numbers is 88. Find the greater number.
www.spauldinggrp.com/bacon-vs-spaulding

5
THE SPAULDING GROUP’S 2018 INVESTMENT PERFORMANCE MEASUREMENT CALENDAR OF EVENTS
DATE EVENT LOCATION
March 13-14, 2018 Fundamentals of Performance Measurement San Francisco, CA
March 15-16, 2018 Performance Measurement Attribution San Francisco, CA
April 25, 2018 Asset Owner Roundtable Denver, CO
April 26-27, 2018 Performance Measurement Forum Denver, CO
May 15-16, 2018 PMAR North America Philadelphia, PA
May 17, 2018 Bacon vs. Spaulding Philadelphia, PA
June 11-12, 2018 PMAR Europe London, England
June 13, 2018 Spaulding vs. Bacon London, England
June 14-15, 2018 Performance Measurement Forum Dublin, Ireland
July 16-20, 2018 Performance Measurement Boot Camp New Brunswick, NJ
August 14-15, 2018 Fundamentals of Performance Measurement Chicago, IL
August 16-17, 2018 Performance Measurement Attribution Chicago, IL
October 15-16, 2018 Fundamentals of Performance Measurement San Diego, CA
October 17-18, 2018 PMAR West Coast San Diego, CA
November 15-16, 2018 Performance Measurement Forum Luxembourg
November 28, 2018 Asset Owner Roundtable Orlando, FL
November 29-30, 2018 Performance Measurement Forum Orlando, FL
December 5-6, 2018 Fundamentals of Performance Measurement Mumbai, India
December 11-12, 2018 Fundamentals of Performance Measurement New Brunswick, NJ
December 13-14, 2018 Performance Measurement Attribution New Brunswick, NJ
For additional information on any of our 2018 events, please contact Patrick Fowler at 732-873-5700
TRAINING…
Gain the Critical
Knowledge Needed
for Performance
Measurement
and Performance
Attribution
TO REGISTER:
Phone: 1-732-873-5700
Fax: 1-732-873-3997
E-mail: [email protected]
The Spaulding Group, Inc. is registered with the National Association of State Boards of Accountancy (NASBA) as a sponsor of continuing professional education on the National Registry of CPE Sponsors. State boards of accountancy have final authority on the acceptance of individual courses for CPE credit. Complaints regarding registered sponsors may be addressed to the National Registry of CPE Sponsors, 150 Fourth Avenue North, Suite 700, Nashville, TN 37219-2417. www.nasba.org
FUNDAMENTALS OF PERFORMANCE MEASUREMENT A unique introduction to Performance Measurement specially designed for those individuals who require a solid grounding in all aspects of performance measurement. The Spaulding Group, Inc. invites you to attend Fundamentals of Performance Measurement on these dates:
15 CPE & 12 PD Credits upon course completionCFA Institute has approved this program, offered by The Spaulding Group, for 12 CE credit hours. If you are a CFA Institute member, CE credit for your participation in this program will be automatically recorded in your CE tracking tool.
PERFORMANCE MEASUREMENT ATTRIBUTIONTwo full days devoted to this increasingly important topic. The Spaulding Group, Inc. invites you to attend Performance Measurement Attribution on these dates:
15 CPE & 12 PD Credits upon course completionCFA Institute has approved this program, offered by The Spaulding Group, for 12 CE credit hours. If you are a CFA Institute member, CE credit for your participation in this program will be automatically recorded in your CE tracking tool.
IN-HOUSE TRAINING
The Spaulding Group has offered in-house training to our clients since 1995. Beginning in 1998, we formalized our training, first with our Introduction to Performance Measurement class and later with our Performance Measurement Attribution class. We now also offer training for the CIPM program. To date, close to 3,000 individuals have participated in our training programs, with numbers increasing monthly.
6
March 13-14, 2018 – San Francisco, CAAugust 14-15, 2018 – Chicago, IL
October 15-16, 2018 – San Diego, CADecember 11-12, 2018 – New Brunswick, NJ
March 15-16, 2018 – San Francisco, CAAugust 16-17, 2018 – Chicago, IL
December 13-14, 2018 – New Brunswick, NJ
WORKING ON YOUR 2018 BUDGET?
Don’t forget to make room for conferences. And why not the Trifecta of Performance Measurement Conferences?
PMAR, Performance Measurement, Attribution & Risk, is the #1 performance measurement conference. If you’ve never experienced it, you owe it to yourself and your firm. And if you have, then you know the great value it is. And now, there are three to choose from!
So please set aside funds in your 2018 budget to participate in PMAR!