Embed Size (px)
Citation preview
European Journal of Social Sciences
ISSN 1450-2267 Vol. 52 No 1 May, 2016, pp.5-13
http://www.europeanjournalofsocialsciences.com/
5
Structure and Economic Development Pattern in Jayapura
through other Cities and Towns in Papua
Suwandi
Urban and Regional Planning, University of Cenderawasih
Abepura Street Jayapura Papua
E-mail: [email protected]
Tel: 6281344554456
Abstract
This research aims to: (1) determine the economic performance of Jayapura City or Cities
and Towns in Papua viewed from economic growth aspect and the contribution of the local
economy, (2) identify the potential sectors of economy in Jayapura City, (3 ) analyze the
dominant sector in terms of the economy in Jayapura City. The data obtained from
interviews staffs of Centre Bureau of Statistics (BPS) based on the Gross Domestic
Product (GDP), and the related documents. The analytical tool used was Typology Analysis
of Klassen, Location Quotient (LQ) and Shift Share. The results of this study: the
construction sector is included in the prime sector qualification in which this is caused by
the growth rate of the construction sector Jayapura City larger than the building sector at
provincial level in Papua. The potential sector qualificatios are: transportation and
communication, agriculture, services, electricity, water and financial. The mining and
quarrying sectors, trade and industry are the growing sector qualifications. The superior
category are: agriculture, manufacturing, electricity and water supply, construction, trade,
and transport and communications.
Keywords: Gross Domestic Product (GDP), Klassen Typology, Location Quotient (LQ)
1. Introduction Regional autonomy is an autonomous regional authority to regulate and manage the interests of local
people’s own initiative based on the aspirations of the community in accordance with the legislation,
unless the aspects of the authority in the field of foreign policy, defense and security, justice, monetary,
and fiscal, religion and other areas of authority will be determined by government regulation. As a
consequence, the provision of the right and authority to the regions in the form of duties and
obligations to be borne by the region in achieving autonomy, in the form of improved services and
better public welfare, development of democracy, justice and equity, the maintenance of harmonious
relations between the central government and regions and between regions in order to maintain the
integrity of the Unitary Republic of Indonesia. In other words, local governments are required (1) able
to accommodate the aspirations of the people in every political decision-making and development, (2)
clean and authoritative bureaucracy (clean and good government).
Autonomous regions are hereinafter referred to local public entity that has the legal authority to
set the limits of a particular area and take care of the interests of the local community, is a habitat for
the resident activities that includes economic activities. Therefore, if it is judged from the goal of
regional development, it can be said that it is a development that involves the community, both in the
European Journal of Social Sciences – Volume 52, Issue 1 May (2016)
6
process of economic activities and in enjoying the results, so that community empowerment can
improve the welfare of the local community significantly.
In the area of development effort will be utilized aspects of economic potential to be developed.
Literally, the economic potential within the framework of regional development can be defined as the
ability, strength, and ability in the field of economics which an area to build the area. The economic
potential can be either natural resources, human resources, geographical areas close to infrastructure
and other support.
One of the functions of local government is to allocate economic resources in the form of goods
and services needed by local communities. Local economic development is a process by which local
governments and community groups to manage existing resources and establish a partnership between
local government and the private sector to create a new jobs and stimulating the development of
economic activities in the region. Key issues in the economic development area is located in its
emphasis on development policies based on the uniqueness of the area in question (endegenous
development) by using the potential of human resources, institutional and physical resources in the
local / regional (Arsyad, 1999). As an indicator of the success of economic development and
community service can be understood in the viewable area of regional economic growth and the
decrease of unequal distribution of incomes.
Basically the theory of regional economic development discusses two things; a) Discussion on
method on analyzing the development of a region. B) theory that deals with the factors that determine
the economic growth of a region. Arsyad (1996: 7) formulates the study of regional development as
follows: regional development = (natural resources, labor, investment, entrepreneurship,
communication, industry composition, technology, area, export markets, the international economic
situation, the capacity of local government, spending central government and aid development) the
development that is undertaken should be able to explore all the potential in each region to be
processed so that will be very useful in real terms.
Potentials that exist in each region is comprised of the natural resources, human resources, the
potential of cultural and other potentials should be pursued and empowered optimally. Excavation of
all existing potential is very important in order to further develop the independence of each region, so
that the dependency on central or local government, or any other State Cosmos can be reduced or even
eliminated (Stewart, 1988)..
Regional economic growth is closely related to an increase in the production of goods and
services, as measured by the amount of the Gross Domestic Product (GDP). Economic growth itself is
a process of increasing the per capita income of the region in the long term. The goal of national
economic development and regional / area is (1) create jobs for the community, (2) achieving national
economic stability / region, and (3) build the economic base and diverse opportunities (Rappaport,
1999).
The economic potential of the region is crucial in the effort to improve the financial capability
of the regions in the household. In general, sources of revenue (PAD) which is the dominant source of
local tax revenue and levies. The result looks very large disparity between the share of local taxes and
levies with a share of revenue other components. This shows that the local government has not been
doing excavation potential revenue sources optimally. Local revenues in its execution greatly
influenced the region's economic conditions. One of the indicators used to assess the economic
conditions of a region in a given period indicated by the Gross Regional Domestic Product (GRDP).
GDP is defined as the total value added generated by all business units within a region, or the entire
amount of the value of final goods and services produced by all economic units in a region.
The relevance of the description of the regional development in Papua, especially the city of
Jayapura is that it should conduct a study to identify the potential of its economy. In this research study
will focus on the analysis of regional development in Papua, especially Jayapura. Issues of interest that
should be analyzed is the growth of the economy as well as the city of Jayapura. The Papua Province
during the period 2009-201 shows a negative trend or decrease from year to year.
European Journal of Social Sciences – Volume 52, Issue 1 May (2016)
7
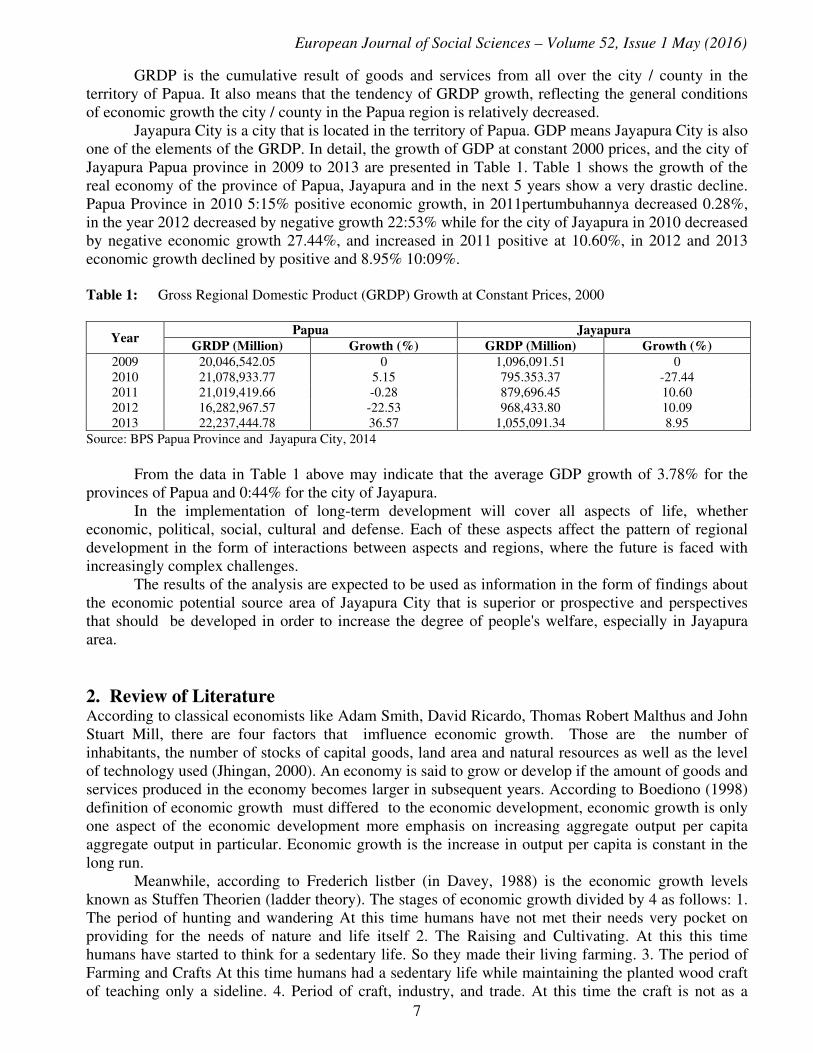
GRDP is the cumulative result of goods and services from all over the city / county in the
territory of Papua. It also means that the tendency of GRDP growth, reflecting the general conditions
of economic growth the city / county in the Papua region is relatively decreased.
Jayapura City is a city that is located in the territory of Papua. GDP means Jayapura City is also
one of the elements of the GRDP. In detail, the growth of GDP at constant 2000 prices, and the city of
Jayapura Papua province in 2009 to 2013 are presented in Table 1. Table 1 shows the growth of the
real economy of the province of Papua, Jayapura and in the next 5 years show a very drastic decline.
Papua Province in 2010 5:15% positive economic growth, in 2011pertumbuhannya decreased 0.28%,
in the year 2012 decreased by negative growth 22:53% while for the city of Jayapura in 2010 decreased
by negative economic growth 27.44%, and increased in 2011 positive at 10.60%, in 2012 and 2013
economic growth declined by positive and 8.95% 10:09%.
Table 1: Gross Regional Domestic Product (GRDP) Growth at Constant Prices, 2000
Year Papua Jayapura
GRDP (Million) Growth (%) GRDP (Million) Growth (%)
2009 20,046,542.05 0 1,096,091.51 0
2010 21,078,933.77 5.15 795.353.37 -27.44
2011 21,019,419.66 -0.28 879,696.45 10.60
2012 16,282,967.57 -22.53 968,433.80 10.09
2013 22,237,444.78 36.57 1,055,091.34 8.95
Source: BPS Papua Province and Jayapura City, 2014
From the data in Table 1 above may indicate that the average GDP growth of 3.78% for the
provinces of Papua and 0:44% for the city of Jayapura.
In the implementation of long-term development will cover all aspects of life, whether
economic, political, social, cultural and defense. Each of these aspects affect the pattern of regional
development in the form of interactions between aspects and regions, where the future is faced with
increasingly complex challenges.
The results of the analysis are expected to be used as information in the form of findings about
the economic potential source area of Jayapura City that is superior or prospective and perspectives
that should be developed in order to increase the degree of people's welfare, especially in Jayapura
area.
2. Review of Literature According to classical economists like Adam Smith, David Ricardo, Thomas Robert Malthus and John
Stuart Mill, there are four factors that imfluence economic growth. Those are the number of
inhabitants, the number of stocks of capital goods, land area and natural resources as well as the level
of technology used (Jhingan, 2000). An economy is said to grow or develop if the amount of goods and
services produced in the economy becomes larger in subsequent years. According to Boediono (1998)
definition of economic growth must differed to the economic development, economic growth is only
one aspect of the economic development more emphasis on increasing aggregate output per capita
aggregate output in particular. Economic growth is the increase in output per capita is constant in the
long run.
Meanwhile, according to Frederich listber (in Davey, 1988) is the economic growth levels
known as Stuffen Theorien (ladder theory). The stages of economic growth divided by 4 as follows: 1.
The period of hunting and wandering At this time humans have not met their needs very pocket on
providing for the needs of nature and life itself 2. The Raising and Cultivating. At this this time
humans have started to think for a sedentary life. So they made their living farming. 3. The period of
Farming and Crafts At this time humans had a sedentary life while maintaining the planted wood craft
of teaching only a sideline. 4. Period of craft, industry, and trade. At this time the craft is not as a
European Journal of Social Sciences – Volume 52, Issue 1 May (2016)
8
sideline but as the need to sell to the market, so that the growing industry of handicraft industry into a
major industry.
Robert Sollow (in Jhingan, 2000) emphasized attention on output growth that will occur over
the work of the two main input factors. Namely capital and labor. Meanwhile Harrod Domar said that
economic growth will occur when there is an increase in the productivity of capital (MEC) and labor
productivity. Schumpeter (1961) argues that economic growth can occur via two (2) ways: first by
increasing the capital investment and the efficiency of its resources. Dickson and Vaughan (2000)
suggested that the amount of backwash effect greater than the spread effect will cause inequality
between regions. Backwash effect caused by the migration of labor and capital from poor areas to rich
areas.
While the spread effect is caused by increased market share of agricultural products and will
stimulate progress toward engineering. Opinion supported by Hirchman Myrdal (1968) that the trickle
down effect of the core region to region peryphery smaller than the polarization effect will cause each
areas increasing income inequality. Research on inequality regions in Indonesia was initiated by Islam
and Khan (1986), and Manor (1999). By using the data in real GDP over the period 1968-1997 noted
that the index of income inequality between regions is increasing. Jakarta, East Kalimantan, West
Kalimantan, Central Kalimantan, Bali and Riau are provinces of the most prosperous, while the worst
affected provinces, namely: East and West Nusa Tenggara, Bengkulu and Jambi. In general, provinces
in eastern Indonesia occupies a low position. Sjafrizal Research (2008) using data from non-oil GDP
between the years 1983 to 1997 shows an index of inequality moving from 0.49 to 0.54. Indonesia
inequality index when compared with developed countries (0.49 to 0.54) and middle income (0.46)
will be above average. Takahiro Akita Research (2003) used data per-capita GDP of China and
Indonesia with a two-stage technique of nested Theil inequality decomposition. Generate the following
conclusions: One; In view of efficiency, inter-regional income inequality caused by the unequal
distribution of natural resources and the poor quality of transport in some areas. two; In China 60% of
the province shows that income inequality is high, while in Indonesia, half experienced inequality.
3. Methodology This study used quantitative methods in data collection and analysis. Besides, this study also collected
qualitative data and also used traditional research methods with depth interviews with the sources for
this research was conducted in the city of Jayapura in Papua Province. The data collected was used in
this study-source revenue (PAD), Tax-Based Profit Sharing funds, Gross Domestic.
The analysis of this research is the identification of the economic potential of this area of the
city of Jayapura which is done by processing approach to the study of literature and secondary data.
The research literature was conducted to obtain the theoretical basis that can support the writing. This
data was obtained from the literature and the results of previous studies related to the subject matter of
the study. From the secondary data required is then processed by the formulation used as a theoretical
basis. Secondary data were observed in the period 2009-2013. The time span is taken under
consideration the dynamics of economic growth in the city of Jayapura This analysis is used to
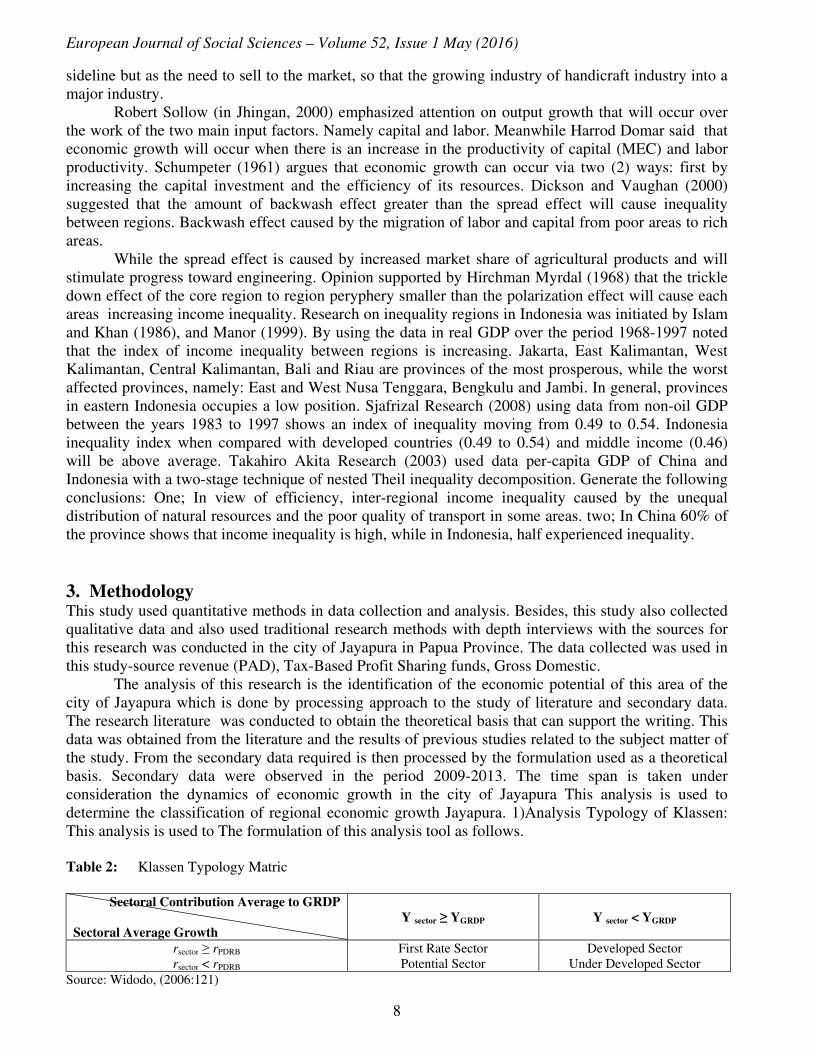
determine the classification of regional economic growth Jayapura. 1)Analysis Typology of Klassen:
This analysis is used to The formulation of this analysis tool as follows.
Table 2: Klassen Typology Matric
Sectoral Contribution Average to GRDP
Sectoral Average Growth
Y sector ≥ YGRDP Y sector < YGRDP
rsector ≥ rPDRB First Rate Sector Developed Sector
rsector < rPDRB Potential Sector Under Developed Sector
Source: Widodo, (2006:121)
European Journal of Social Sciences – Volume 52, Issue 1 May (2016)
9
With Quotien Location Analysis (LQ), it can be seen economic favorite sectors and sub-sectors
of the city of Jayapura area contribute to GDP compared with the contribution of economic sectors
and and sub-sectors the same province. Formulation of the analysis tool are:
Where: q(x) District / City = Sector’s output x sector in Jayapura
Q(x) = regional sector output x in Papua
From the results of this calculation can be seen that LQ if:
1. A sector LQ> 1 is said superior sector
2. A sector LQ <1 said unsuperior sector
3. LQ a sector level = 1 is said provincial sector
The higher the value of a sector LQ means the higher the competitive advantage of the region
concerned in developing the sector. LQ method is one simple indicator that shows the "strength" will
be large and small sectors in an area compared to the same sector in a wider area of the region
(province). Haynes and Kingsley E and Dino, M (1997) and Blakely and. Edward (1991) state
weakness LQ techniques are (a) taste or patterns of consumption and the local community there are
differences both between regions and within the same area, (b) the average consumption for the
different types of goods each region, and (c) industrial use of different materials between regions.
4. Result Research 4.1 Klassen Typology Analysis: Growth and Contributions
Quotients Klassen in this study was conducted with the approach of the total GDP of Jayapura and also
cities and districts (towns) in the province of Papua. This approach is used to determine each district's
economy and the city of Jayapura in Papua, so that the known performance of the economy in the city
of Jayapura as compared to other districts (towns) / cities within the scope of Papua. Knowledgeable
position of economic performance districts / cities can be used as a decisive step in the planning
information for the improvement of the next stage. The available data are then presented and analyzed
by Klassen Typology theory approach. This analysis shows the classification of the position of the
economy as compared to the economic Jayapura Papua or cumulative of cities and counties in Papua.
The variables analyzed were the GDP and economic growth during the observation period, namely:
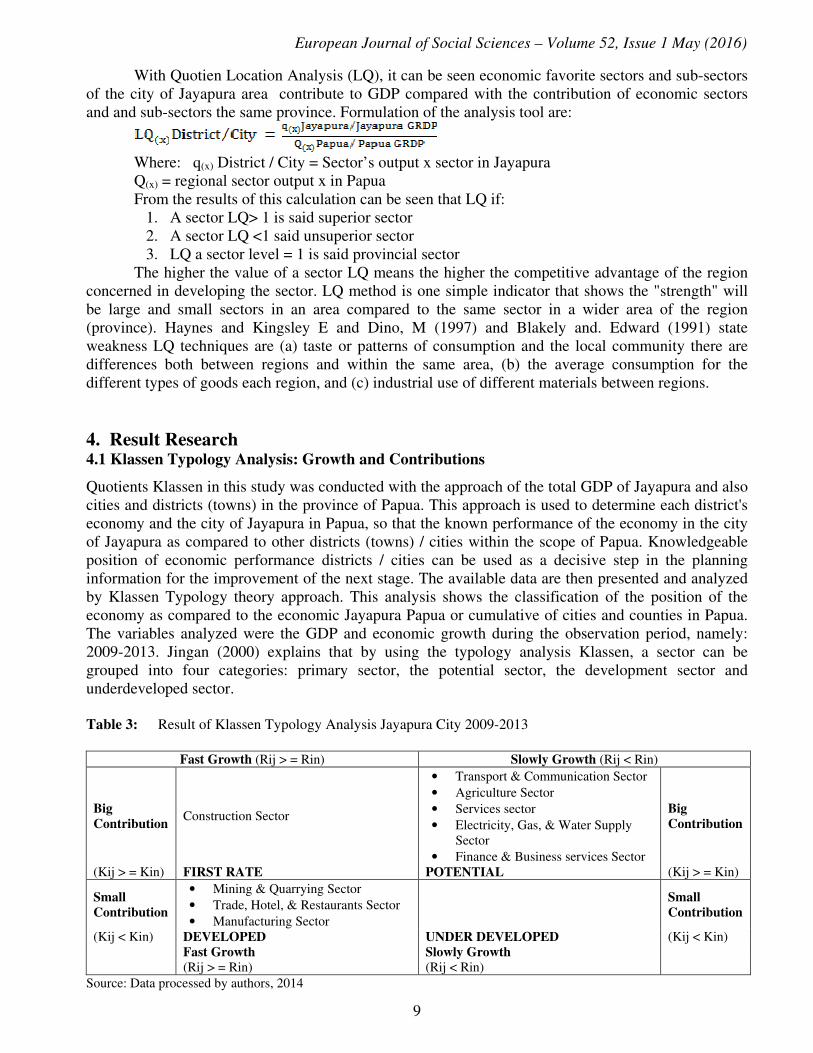
2009-2013. Jingan (2000) explains that by using the typology analysis Klassen, a sector can be
grouped into four categories: primary sector, the potential sector, the development sector and
underdeveloped sector.
Table 3: Result of Klassen Typology Analysis Jayapura City 2009-2013
Fast Growth (Rij > = Rin) Slowly Growth (Rij < Rin)
Big
Contribution Construction Sector
• Transport & Communication Sector
• Agriculture Sector
• Services sector
• Electricity, Gas, & Water Supply
Sector
• Finance & Business services Sector
Big
Contribution
(Kij > = Kin) FIRST RATE POTENTIAL (Kij > = Kin)
Small
Contribution
• Mining & Quarrying Sector
• Trade, Hotel, & Restaurants Sector
• Manufacturing Sector
Small
Contribution
(Kij < Kin) DEVELOPED UNDER DEVELOPED (Kij < Kin)
Fast Growth Slowly Growth
(Rij > = Rin) (Rij < Rin)
Source: Data processed by authors, 2014
European Journal of Social Sciences – Volume 52, Issue 1 May (2016)
10
The results of the analysis in Table 3 above shows that the construction sector is included in the
prime sector qualifications, This is caused by the growth rate of the construction sector in the city of
Jayapura in which it is larger than the building sector in the province of Papua, as well as the relatively
large contribution to the economy.
Economic sectors are grouped into potential sectors, such as transportation and
communications, agriculture, services and utilities and financial sectors, due to its slow growth but a
small contribution to the economy. The results of the analysis indicate that there is no economic sector
in the city of Jayapura and the Papuan are grouped into sectors in which can be regarded as
underdeveloped.
From the explanation above, it can be concluded that the economic performance of Jayapura
city has increased, particularly in the building sector which can be grouped into economic sectors
primed for rapid growth and contribute greatly to the local economy.
While economic performance in transportation and communications, agriculture, services,
electricity and water as well as well as financial growth is slowly but contributed greatly to the local
economy so that they can be grouped into a potential economic sectors. The economic performance of
the city of Jayapura mining and quarrying, trade, hotels and restaurants, and the industry sector is
considered quite good because it has a fast growth despite a small contribution to the local economy,
thus grouped into economic sectors develop.
It should be pointed out that of the nine sectors of the economy, no one sector were grouped
into economic sectors underdeveloped, it is shown that the performance of Jayapura City government
is considered good when it is compared to the province.
4.2 Location Quotient Analysis (LQ)
After knowing the position of the economy in the aggregate GDP classification Jayapura, then the
researcher used the classification to determine the dominant or favourite sector analysis that is the tool
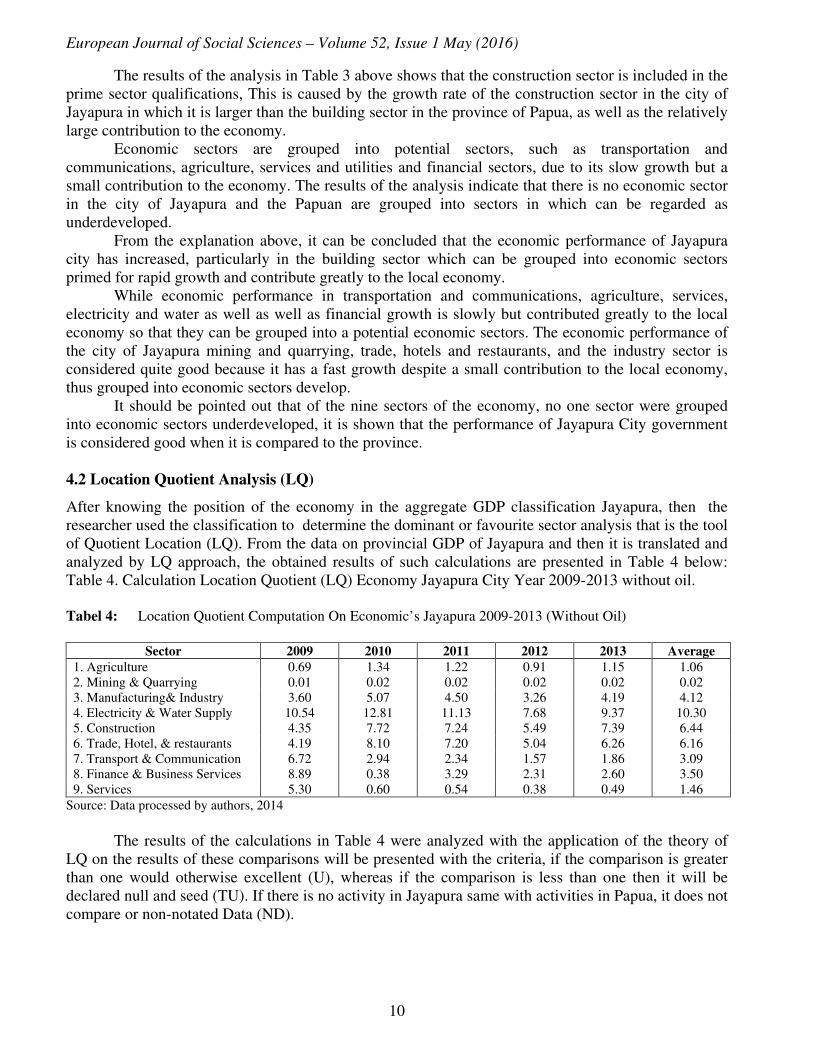
of Quotient Location (LQ). From the data on provincial GDP of Jayapura and then it is translated and
analyzed by LQ approach, the obtained results of such calculations are presented in Table 4 below:
Table 4. Calculation Location Quotient (LQ) Economy Jayapura City Year 2009-2013 without oil.
Tabel 4: Location Quotient Computation On Economic’s Jayapura 2009-2013 (Without Oil)
Sector 2009 2010 2011 2012 2013 Average
1. Agriculture 0.69 1.34 1.22 0.91 1.15 1.06
2. Mining & Quarrying 0.01 0.02 0.02 0.02 0.02 0.02
3. Manufacturing& Industry 3.60 5.07 4.50 3.26 4.19 4.12
4. Electricity & Water Supply 10.54 12.81 11.13 7.68 9.37 10.30
5. Construction 4.35 7.72 7.24 5.49 7.39 6.44
6. Trade, Hotel, & restaurants 4.19 8.10 7.20 5.04 6.26 6.16
7. Transport & Communication 6.72 2.94 2.34 1.57 1.86 3.09
8. Finance & Business Services 8.89 0.38 3.29 2.31 2.60 3.50
9. Services 5.30 0.60 0.54 0.38 0.49 1.46
Source: Data processed by authors, 2014
The results of the calculations in Table 4 were analyzed with the application of the theory of
LQ on the results of these comparisons will be presented with the criteria, if the comparison is greater
than one would otherwise excellent (U), whereas if the comparison is less than one then it will be
declared null and seed (TU). If there is no activity in Jayapura same with activities in Papua, it does not
compare or non-notated Data (ND).
European Journal of Social Sciences – Volume 52, Issue 1 May (2016)
11
Tabel 5: Classification of Economy Activities in Jayapura City Compared to The Same Economy Activities
in Jayapura Province, 2009-2013
No Sector 2009 2010 2011 2012 2013 Average
1 Agriculture Not
Dominant Dominant Dominant
Not
Dominant Dominant Dominant
2 Mining & Quarrying Not
Dominant
Not
Dominant
Not
Dominant
Not
Dominant
Not
Dominant
Not
Dominant
3 Manufacturing& Industry Dominant Dominant Dominant Dominant Dominant Dominant
4 Electricity & Water Supply Dominant Dominant Dominant Dominant Dominant Dominant
5 Construction Dominant Dominant Dominant Dominant Dominant Dominant
6 Trade, Hotel, & Restaurants Dominant Dominant Dominant Dominant Dominant Dominant
7 Transport & Communication Dominant Dominant Dominant Dominant Dominant Dominant
8 Finance & Business Services Dominant Dominant Dominant Dominant Dominant Dominant
9 Services Dominant Dominant Dominant Dominant Dominant Dominant
Source: Data processed by authors, 2014.
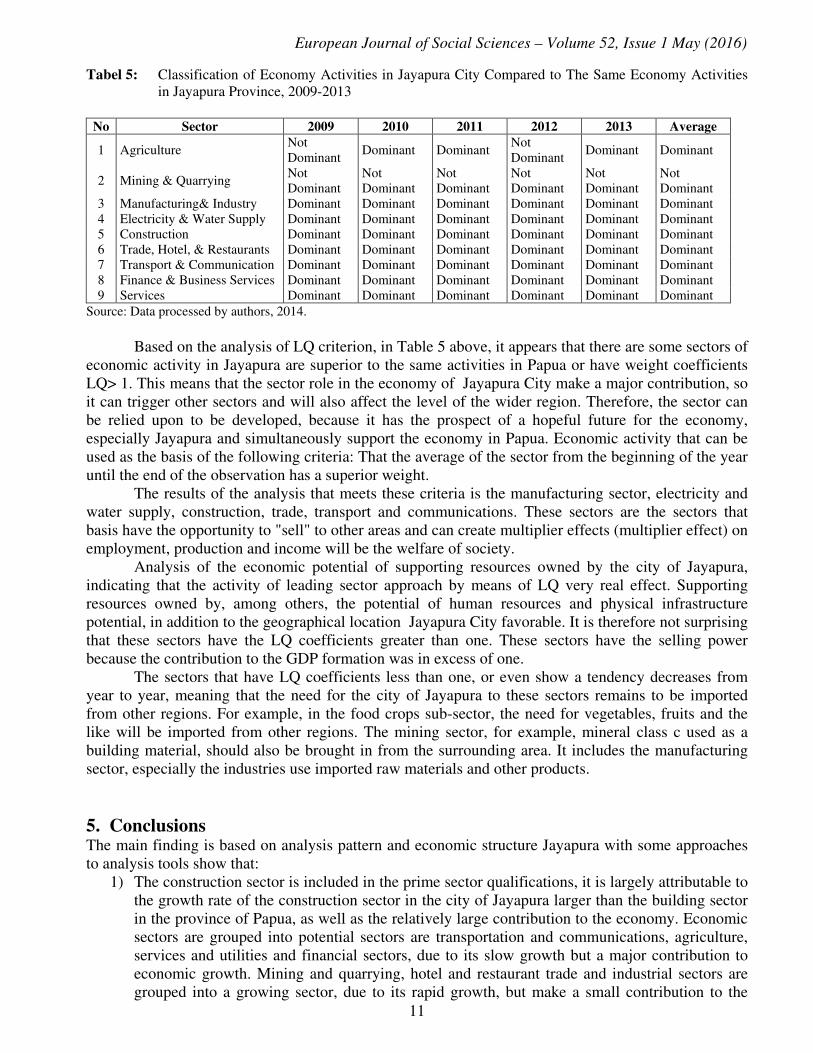
Based on the analysis of LQ criterion, in Table 5 above, it appears that there are some sectors of
economic activity in Jayapura are superior to the same activities in Papua or have weight coefficients
LQ> 1. This means that the sector role in the economy of Jayapura City make a major contribution, so
it can trigger other sectors and will also affect the level of the wider region. Therefore, the sector can
be relied upon to be developed, because it has the prospect of a hopeful future for the economy,
especially Jayapura and simultaneously support the economy in Papua. Economic activity that can be
used as the basis of the following criteria: That the average of the sector from the beginning of the year
until the end of the observation has a superior weight.
The results of the analysis that meets these criteria is the manufacturing sector, electricity and
water supply, construction, trade, transport and communications. These sectors are the sectors that
basis have the opportunity to "sell" to other areas and can create multiplier effects (multiplier effect) on
employment, production and income will be the welfare of society.
Analysis of the economic potential of supporting resources owned by the city of Jayapura,
indicating that the activity of leading sector approach by means of LQ very real effect. Supporting
resources owned by, among others, the potential of human resources and physical infrastructure
potential, in addition to the geographical location Jayapura City favorable. It is therefore not surprising
that these sectors have the LQ coefficients greater than one. These sectors have the selling power
because the contribution to the GDP formation was in excess of one.
The sectors that have LQ coefficients less than one, or even show a tendency decreases from
year to year, meaning that the need for the city of Jayapura to these sectors remains to be imported
from other regions. For example, in the food crops sub-sector, the need for vegetables, fruits and the
like will be imported from other regions. The mining sector, for example, mineral class c used as a
building material, should also be brought in from the surrounding area. It includes the manufacturing
sector, especially the industries use imported raw materials and other products.
5. Conclusions The main finding is based on analysis pattern and economic structure Jayapura with some approaches
to analysis tools show that:
1) The construction sector is included in the prime sector qualifications, it is largely attributable to
the growth rate of the construction sector in the city of Jayapura larger than the building sector
in the province of Papua, as well as the relatively large contribution to the economy. Economic
sectors are grouped into potential sectors are transportation and communications, agriculture,
services and utilities and financial sectors, due to its slow growth but a major contribution to
economic growth. Mining and quarrying, hotel and restaurant trade and industrial sectors are
grouped into a growing sector, due to its rapid growth, but make a small contribution to the
European Journal of Social Sciences – Volume 52, Issue 1 May (2016)
12
economy. The analysis results indicate that there is no single economic sector in Jayapura City
and the Papuan that can be grouped into underdeveloped sectors. From the explanation above,
it can be concluded that the economic performance of Jayapura City has increased, particularly
in the building sector which can be grouped into economic sectors primed for rapid growth and
contribute greatly to the local economy. While economic performances in transportation and
communications, agriculture, services, electricity and water as well as well as financial growth
is slowly but contributed greatly to the local economy so that they can be grouped into a
potential economic sectors. The economic performance of the city of Jayapura mining and
quarrying, trade, hotels and restaurants, and the industry sector is considered quite good
because it has a fast growth despite a small contribution to the local economy, thus grouped
into economic sectors develop. It should be pointed out that of the nine sectors of the economy,
no one single sector can be grouped into sectors of underdeveloped economy. This suggests
that the performance of the government in Jayapura can be considered as good when it is
compared to the province.
2) The analysis showed that the meet the criteria of the base sector is the manufacturing sector,
electricity and water supply, construction, trade, transport, and communications. These sectors
are the sectors that basis have the opportunity to "sell" other regions and can create multiplier
effects (multiplier effect) on employment, production and income will prosper community.
3) During the period 2009-2013, GDP Jayapura city experienced a reduction in value or decrease
of negative economic performance Rp.357,017 billion. This is caused by some sectors of the
economy may be impaired include: the transportation and communication sector, finance,
leasing and business services, services. While competitive economic sectors in the city of
Jayapura during the observation period comprise: agriculture, mining, industry, construction
and trade. From the aspect of the city of Jayapura sector economic growth compared with the
growth rate relative to the same economic sector in Papua province shows that all economic
sectors at provincial level higher. For Jayapura city level economic sectors that have a negative
value is transport & communication, finance, leasing services company and services.
References [1] Arsyad, Lincolin, (1999). Introduction of Planning Local Economic Development.
Yogyakarta: BPFE.
[2] Blakely, J. Edward. (1991). Planning Local Economic Development, Theory & Practice.
Newbury Park London New Delhi: Sage Publications.
[3] Boediono. (1998). Macro Economic, Synopsis Series, No.2. (4th ed), Yogyakarta: BPFE.
[4] Davey, K. (1988). Financing of Local Government, International Practices and the Relevance
for The Third World. Jakarta; Universitas Indonesia Publishing.
[5] Dickson, Vaughan, (2000). Revenue Structures, The Perceived Price of Government Out Put,
and Public Expenditure, Public Finance Review. January (48-66).
[6] Haynes, Kingsley E., & Dino, M., (1997). Productivity Change in Manufacturing Regions: A
Multifactors/Shift-share Approach, Growth and Change. ( 28), 102-223
[7] Islam, Kan. (1986). Making Decentralization Work: Reaping the Rewards and Managing the
Risks. UNSFIR Working Paper, Jakarta.
[8] Jhingan, M. L. (2000). Economy Development and Planning. Translated by D. Guritno. (8 th
ed). Jakarta: Raja Grafindo Persada.
[9] Manor, James. (1999). The Political Economy of Democratic Decentralisation. Washington:
World Bank, IBRD, ( 6)
[10] Myrdal, Gunnar. 1968. Asian Drama: An Inquiry into the Poverty of Nations. New York:
Pantheon.
[11] Rappaport, J. (1999). Local Growth Empirics. CID Working Paper, July (23).

European Journal of Social Sciences – Volume 52, Issue 1 May (2016)
13
[12] (Schumpeter, Joseph A. (1961). The Theory of Economic Development. New York: Oxford
University Press.
[13] Syafrizal, (2008). Regional Economic: Theory and Application, (1th ed). Padang: Baduose
Publishing.
[14] Stewart, J. (1988). Understanding the Managemet of Local Government: Its Special Purpose,
Conditions and Task. UK: Longman Group Ltd.
[15] Takahiro, Akita. (2003). Pitfalls on the Road to Fiscal Decentralization, in Ehtisham Ahmad
and Vito Tanzi (eds.), Managing Fiscal Decentralization, London and New York: Routledge
[16] Widodo, Tri. (2006). Planning Development, Yogyakarta: UPP STIM YKPN.