GAS REGIONAL INVESTMENT PLAN
2014 – 2023
GRIP
South -North Corridor
2 | South -North Corridor GRIP 2014 – 2023
Table of Content
FOREWORD 4
EXECUTIVE SUMMARY 5
1 INTRODUCTION 6
2 SUPPLY AND INFRASTRUCTURE 10
2.1. Supply Sources . . . . . . . . . . . . . . . . . . . . . . . . . . . . . . . . . . . . . . 11
2.2. Infrastructural Elements . . . . . . . . . . . . . . . . . . . . . . . . . . . . . . . 13
3 DEMAND ELEMENTS AND MARKET ANALYSIS 24
3.1 Historic Demand . . . . . . . . . . . . . . . . . . . . . . . . . . . . . . . . . . . . . 25
3.2 Forecast Demand Trends . . . . . . . . . . . . . . . . . . . . . . . . . . . . . . 28
3.3 Market Development Indicators . . . . . . . . . . . . . . . . . . . . . . . . . . 30
3.4 Price Correlation . . . . . . . . . . . . . . . . . . . . . . . . . . . . . . . . . . . . . . 34
3.5 Interconnection Points in the South-North Corridor . . . . . . . . . . . . 36
4 GAS-ELECTRICITY LINKS : CURRENT POWER GENERATION ENVIRONMENT 44
4.1 Forecast of Installed Capacity and
Gas Demand for Power Generation . . . . . . . . . . . . . . . . . . . . . . . 45
4.2 The impact of renewables on gas demand
in the countries of the South-North Corridor . . . . . . . . . . . . . . . . 47
5 THE ROLE OF THE REGION IN THE DEVELOPMENT OF EU GASINFRASTRUCTURE AND INTERNAL MARKET 54
South -North Corridor GRIP 2014 – 2023 | 3
6 SOUTH-NORTH CORRIDOR 58
6.1 Introduction . . . . . . . . . . . . . . . . . . . . . . . . . . . . . . . . . . . . . . . . 59
6.2 Project Rationales . . . . . . . . . . . . . . . . . . . . . . . . . . . . . . . . . . . . 60
6.3 Projects Description . . . . . . . . . . . . . . . . . . . . . . . . . . . . . . . . . . 62
6.4 PCI Status . . . . . . . . . . . . . . . . . . . . . . . . . . . . . . . . . . . . . . . . . 70
6.5 Odorisation . . . . . . . . . . . . . . . . . . . . . . . . . . . . . . . . . . . . . . . . . 71
7 OTHER TSO TRANSMISSION PROJECTS IN THE REGION 72
7.1 Investments in the Western area of the Region . . . . . . . . . . . . . . 74
7.2 Investments in the Northern area of the Region . . . . . . . . . . . . . . 76
7.3 Investments in the Eastern area of the Region . . . . . . . . . . . . . . . 79
7.4 Investments in the Southern area of the Region . . . . . . . . . . . . . . 82
7.5 Other Investments Relevant for the Region . . . . . . . . . . . . . . . . . 85
8 NETWORK MODELLING 88
8.1 Introduction . . . . . . . . . . . . . . . . . . . . . . . . . . . . . . . . . . . . . . . . 89
8.2 Modelled Cases . . . . . . . . . . . . . . . . . . . . . . . . . . . . . . . . . . . . . 89
8.3 South-North Corridor Capacities . . . . . . . . . . . . . . . . . . . . . . . . . 94
8.4 Assessment Results . . . . . . . . . . . . . . . . . . . . . . . . . . . . . . . . . . 95
WAY FORWARD – STAKE HOLDERS FEEDBACK FORM 99
LEGAL DISCLAIMER 100
LIST OF TABLES 101
LIST OF FIGURES 101
DEFINITIONS 104
ABBREVIATIONS 106
4 | South -North Corridor GRIP 2014 – 2023
Paolo Mosa
CEO Snam Rete Gas S.p.A.
Walter Peeraer
CEO Fluxys Belgium
Foreword
On behalf of the Transmission System Operators
( TSOs ) of the Region, we are pleased to introduce the
South-North Corridor Gas Regional Investment Plan
( GRIP SNC ) 2014 – 2023. This is the second edition,
which builds further on the previous edition of the GRIP
South-North Corridor released in June 2012, while also
complementing the Ten Year Network Development
Plan ( TYNDP ) 2013 – 2022 published by ENTSOG in
February 2013.
This GRIP is the result of close cooperation between TSOs in the fi ve countries of the European region made up of Belgium, France, Germany, Italy and Switzerland (the “Region”). The coordination of this document was facilitated by Fluxys Belgium and Snam Rete Gas (Regional co-ordinators).
This report takes into account the feedback received since the fi rst GRIP edition, in particular the ACER opinion1 ), and stakeholder views expressed during the dedicat-ed workshops presenting the fi rst GRIP edition (November 2012) and introducing this second GRIP edition (November 2013).
TSOs of the Region would like to thank the stakeholders involved in this process and welcome further comments from them aiming at improving future editions of this report.
This South-North Corridor GRIP aims at giving stakeholders a deeper understand-ing of existing infrastructure and possible future market and projects developments within the Region.
The TSOs of the Region believe that this document will provide useful information to stakeholders to support an informed discussion on assessing the ability of invest-ment projects to answer specifi c Regional and overall European market needs.
1 ) ACER Opinion of 25 March 2013 on Gas Regional Investment Plans 2011 (12) – 2020 (21) and related Annexes.
South -North Corridor GRIP 2014 – 2023 | 5
Executive Summary
This second edition of the South-North Corridor Gas
Regional Investment Plan takes advantage from an
enlargement of the Region, now spanning from Italy
to Belgium and crossing the backbone of the European
continent along Switzerland, Germany and France.
The geographical expansion has been combined with
a higher level of contents, measured as amount of in-
formation published and, more signifi cantly, in terms of
quality of the analyses presented.
The improvement of EU security of supply and market integration is linked to the expansion of infrastructure aimed at interconnecting markets, countries and gas corridors in fl exible ways, commercially effective and physically reliable. In consid-eration of its position, at the heart of the European Union and at the crossroads of the major current and future gas import routes, the Region is vital for the creation of the internal gas market, as witnessed also by the Project of Common Interests affecting this area, among them the South-North Corridor projects.
The already considerable Regional infrastructure base, together with its expected developments and modernization, is destined to increase the role of the Region in bridging priority gas corridors and building a competitive and secure European internal gas market. The existing and expected assets in the Region are thoroughly assessed in the Report. It presents an exhaustive overview of the overall planned gas infrastructure, with a special focus on the South-North Corridor projects, being at the core of the Region and playing a key-role for the future evolution of European demand and supply patterns.
The rationales and the benefi ts of the South-North Corridor projects are further explored in the document and the possibility to follow the whole route evolution has been ensured adopting an Interconnection Point approach, as already done in the fi rst edition of the Report.
Other initiatives with a Regional relevance, gathered according to the involved countries and relevant associated TSOs, have been reported following a project-based description of their main features.
Finally, a specifi c chapter has been destined in this South-North Corridor GRIP to the forward-looking perspectives for natural gas. This effort has been done on one side by highlighting the fundamental supply trends in the Region, with a particular focus to the depletion of Northern European reserves, and on the other hand by sustaining the evidences that natural gas is actually the best-placed fuel to back-up renewable energy sources, complementing their intermittent nature in the most sustainable way.
Image courtesy of FluxSwiss
Introduction
South -North Corridor GRIP 2014 – 2023 | 7
This report represents the 2nd Gas Regional Investment
Plan ( GRIP ) produced by the Transmission System
Operators ( TSOs ) currently composing the South-North
Corridor Region : Belgium, France, Germany, Italy and
Switzerland.
The document aims at providing a specifi c overview
of the infrastructure ( pipelines, storage facilities and
LNG plants ) of the Region together with an outlook of
the developments of Regional supply and demand as
fundamental elements of the European gas market.
The projects description covers in detail the initiatives constituting the South-North Corridor and complements the transmission projects Regional overview presenting other projects of Regional relevance according to their geographical distribution.
The projects belong either to Regional TSOs or Third parties sponsors and the Report has been produced ensuring the highest degree of consistency possible with the Community-wide ENTSOG TYNDP 2013 – 2022, national TSO development plans and other Regions’ GRIPs while updating the information presented where relevant. The status and all the data related to infrastructural projects in this Report refl ect the best information available to the co-authors at the moment of drafting, hence not considering possible updates effective at the date of publication.
LEGAL BASIS
This publication is a legal obligation for TSOs, based on the European Directive 2009 / 73 / EC Article 7 and further detailed by Regulation (EC) 715 / 2009 Article 12, to publish a Gas Regional Investment Plan every two years.
STRUCTURE OF THE REPORT
The report is structured according to the following sections:
y Infrastructure and Supply: a general overview of the gas sources available to the Region is provided together with a comprehensive analysis of the existing infrastructures capacities (pipelines, storages facilities, and LNG plants) and the main features of projects under development.
y Demand Elements and Market Analysis: historical and forecasted trends of the main demand features and an analysis of the last years markets developments is presented together with an overview of capacities and fl ows at the relevant Interconnection Points of the Region.
y Gas-electricity links: a section dedicated to the forecasted evolutions and main characteristics of the power generation industry in the Region, with a particular focus to renewable sources and their vital links with the gas sector.
y The role of the Region: the Regional weight with reference to the envisaged developments of European infrastructure and internal gas market is highlighted in terms of Security of Supply and Market Integration, linked in particular to supply-demand evolution in Western Europe.
y South-North Corridor Projects: according to an Interconnection Point approach, the section provides a description of the projects allowing physical reverse fl ow transmission capacity from Italy through Switzerland to France, Germany, and
8 | South -North Corridor GRIP 2014 – 2023
Image courtesy of GRTgaz
Belgium. The initiatives are framed according to their PCI status, with an evaluation of the benefi ts generated in terms of criteria identifi ed as relevant for projects of common interest by Regulation EC 347 / 2013.
y Other TSO transmission projects: further main transmission investments with Regional relevance are presented according to a project-based approach and gathered according to the involved countries and relevant associated TSOs.
y Network Modelling: developed in cooperation with ENTSOG, this new section aims at analyzing modelling results relevant in particular for the South-North Corridor. The use of the ENTSOG Network Modelling tool was combined with updated inputs compared to the Community-wide TYNDP 2013 – 2022 and an innovative set of scenarios.
ENHANCEMENTS OF THIS SECOND SNC GRIP EDITION
Special attention has been granted in this 2 nd SNC GRIP to stakeholder's feedbacks and the way to accommodate their requests. In this view, several enhancements have been introduced, and in particular:
y A more detailed analysis of supply sources and infrastructural elements, now presented not only according to a status quo situation but including also a p rospective, planning sub-section1 ).
y A deeper study of demand components, future trends, additional gas hubs information, including the increasing degree of price correlation among them, and fi nally an analysis of the relevant Interconnection Points in the Region.
y The inclusion of two completely new sections: a fi rst one regarding power generation, highlighting in particular RES can grow only in a consolidated way with natural gas, and a second section related to simulations and network modelling studies, tailored on South-North Corridor evolutions.
y Finally, the core-sections related to transmission projects have been enriched with links to their PCI status and the benefi ts brought to European market integration.
1 ) The development of this section has been possible on the basis of a data collection process organized by ENTSOG
in Q3 2013 and further integrated by co-authors on the basis of the latest available information, in particular national
development plans.
South -North Corridor GRIP 2014 – 2023 | 9
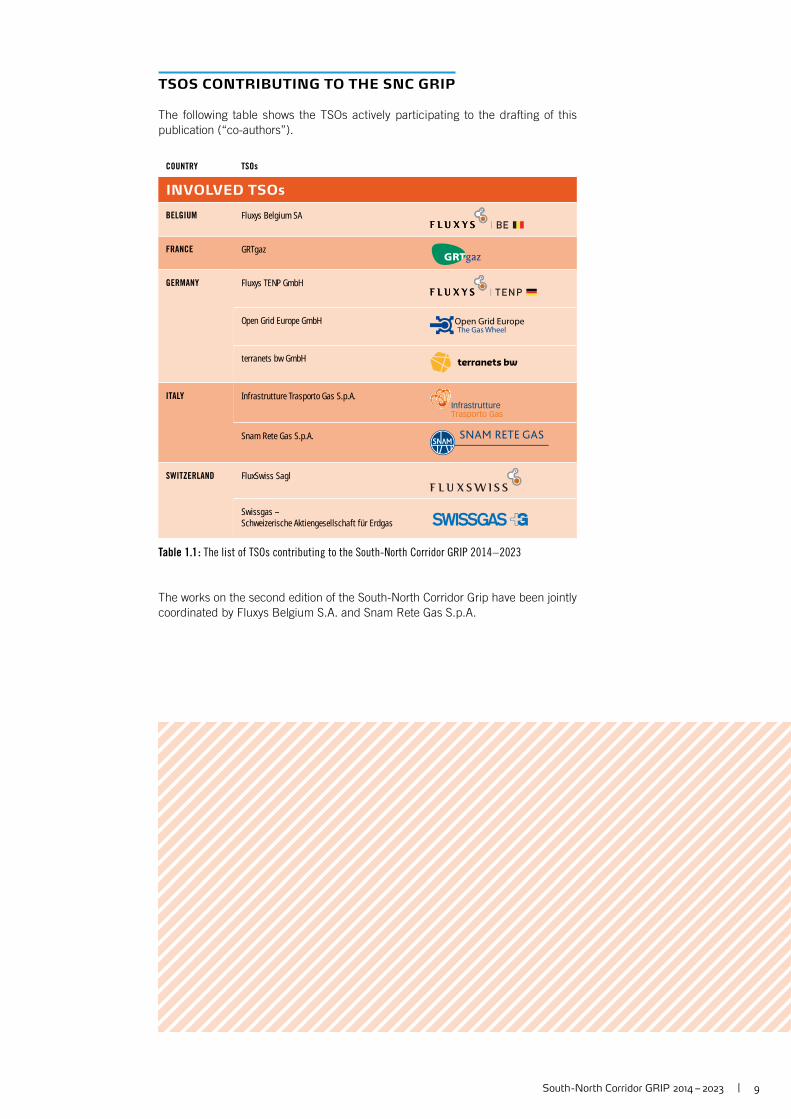
TSOS CONTRIBUTING TO THE SNC GRIP
The following table shows the TSOs actively participating to the drafting of this publication (“co-authors”).
COUNTRY TSOs
INVOLVED TSOs
BELGIUM Fluxys Belgium SA
FRANCE GRTgaz
GERMANY Fluxys TENP GmbH
Open Grid Europe GmbH
terranets bw GmbH
ITALY Infrastrutture Trasporto Gas S.p.A.
Snam Rete Gas S.p.A.
SWITZERLAND FluxSwiss Sagl
Swissgas – Schweizerische Aktiengesellschaft für Erdgas
Table 1.1 : The list of TSOs contributing to the South-North Corridor GRIP 2014 – 2023
The works on the second edition of the South-North Corridor Grip have been jointly coordinated by Fluxys Belgium S.A. and Snam Rete Gas S.p.A.
Supply and Infrastructure
Supply Sources
Infrastructural Elements
Image courtesy of Snam Rete Gas
South -North Corridor GRIP 2014 – 2023 | 11
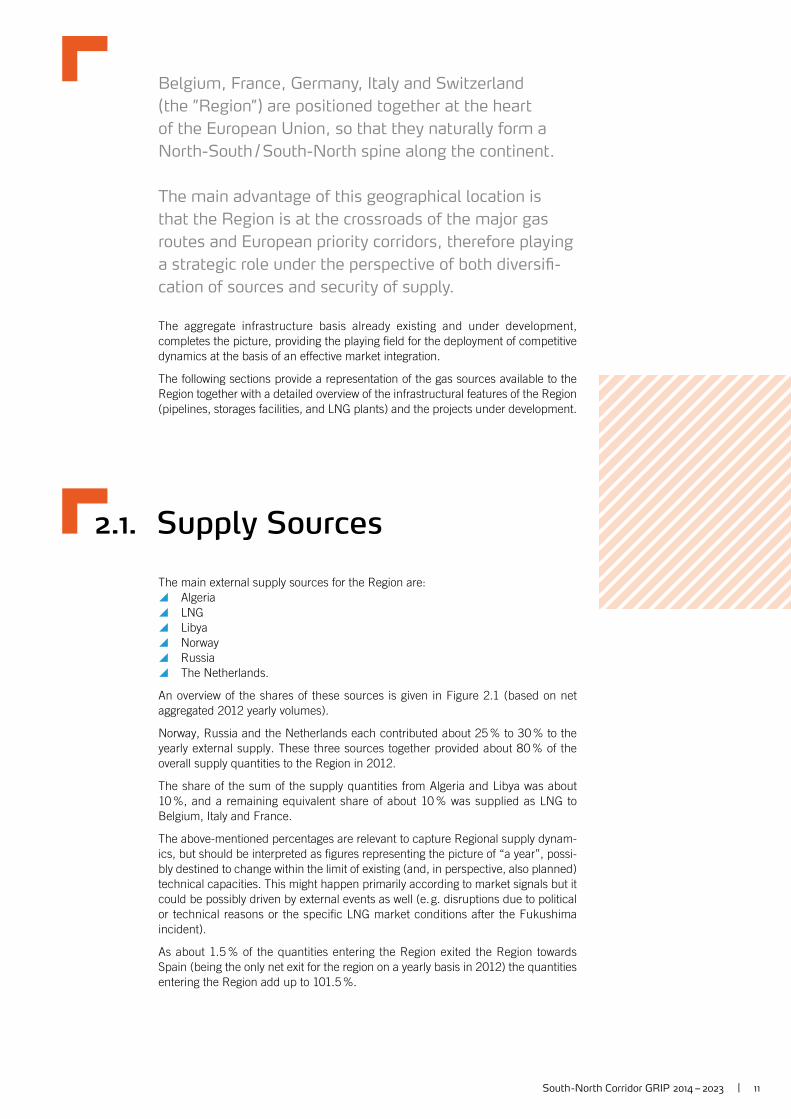
Belgium, France, Germany, Italy and Switzerland
( the ”Region” ) are positioned together at the heart
of the European Union, so that they naturally form a
North-South / South-North spine along the continent.
The main advantage of this geographical location is
that the Region is at the crossroads of the major gas
routes and European priority corridors, therefore playing
a strategic role under the perspective of both diversifi -
cation of sources and security of supply.
The aggregate infrastructure basis already existing and under development, completes the picture, providing the playing fi eld for the deployment of competitive dynamics at the basis of an effective market integration.
The following sections provide a representation of the gas sources available to the Region together with a detailed overview of the infrastructural features of the Region (pipelines, storages facilities, and LNG plants) and the projects under development.
2.1. Supply Sources
The main external supply sources for the Region are: y Algeria y LNG y Libya y Norway y Russia y The Netherlands.
An overview of the shares of these sources is given in Figure 2.1 (based on net aggregated 2012 yearly volumes).
Norway, Russia and the Netherlands each contributed about 25 % to 30 % to the yearly external supply. These three sources together provided about 80 % of the overall supply quantities to the Region in 2012.
The share of the sum of the supply quantities from Algeria and Libya was about 10 %, and a remaining equivalent share of about 10 % was supplied as LNG to Belgium, Italy and France.
The above-mentioned percentages are relevant to capture Regional supply dynam-ics, but should be interpreted as fi gures representing the picture of “a year”, possi-bly destined to change within the limit of existing (and, in perspective, also planned) technical capacities. This might happen primarily according to market signals but it could be possibly driven by external events as well (e. g. disruptions due to political or technical reasons or the specifi c LNG market conditions after the Fukushima incident).
As about 1.5 % of the quantities entering the Region exited the Region towards Spain (being the only net exit for the region on a yearly basis in 2012) the quantities entering the Region add up to 101.5 %.
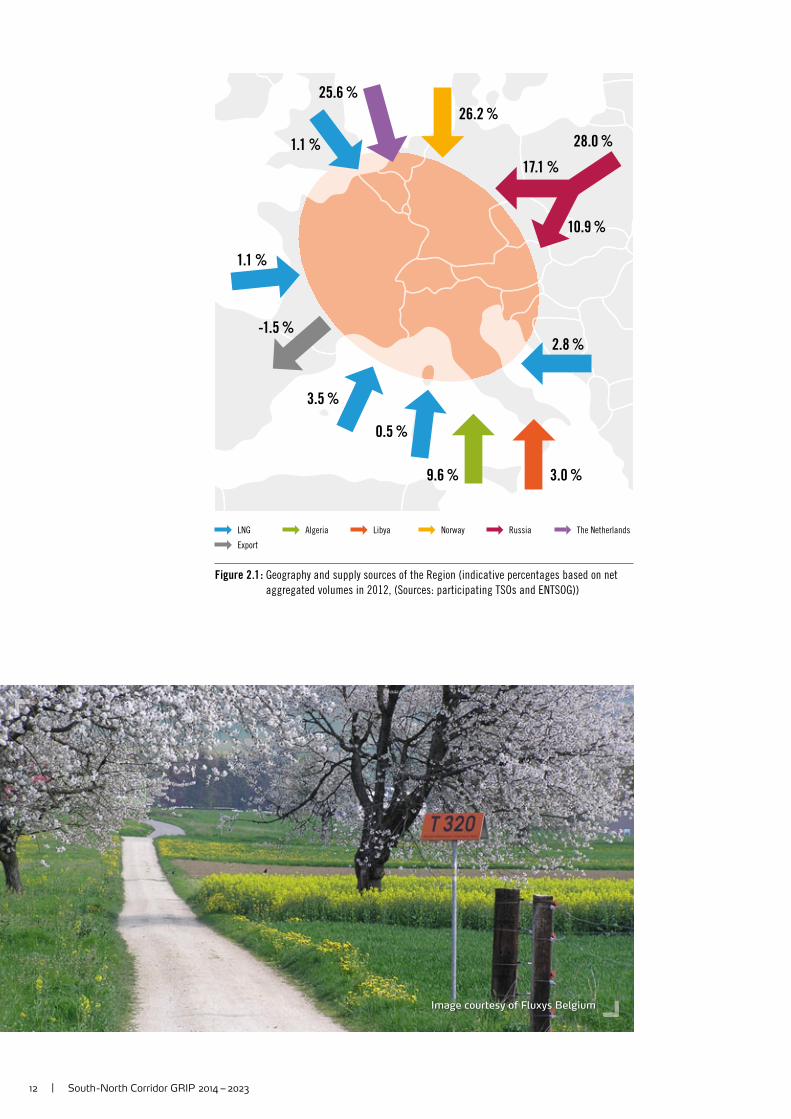
Image courtesy of Fluxys Belgium
12 | South -North Corridor GRIP 2014 – 2023
AlgeriaLNG Libya The NetherlandsNorway Russia
Export
1.1 %
1.1 %
-1.5 %
3.5 %
0.5 %
9.6 % 3.0 %
2.8 %
25.6 %
26.2 %
17.1 %
10.9 %
28.0 %
Figure 2.1 : Geography and supply sources of the Region (indicative percentages based on net
aggregated volumes in 2012, (Sources: participating TSOs and ENTSOG))
South -North Corridor GRIP 2014 – 2023 | 13
2.2. Infrastructural Elements
Infrastructures form the backbone for the development
of competitive and integrated gas markets.
The services that infrastructure operators can provide
to their users rely on the availability of adequate and
well-developed transmission networks, complemented
by the presence of equally advanced services offered by
storage facilities and LNG operators.
The existing aggregated gas equipment of the Region represents a unique infra-structure base, coupling transmission assets with the fl exibility provided by storage facilities and LNG plants and providing to users active in this area a wide range of market possibilities.
The same sound and balanced mix of infrastructure guarantees a substantial level of supply, along with diversifi cation and security of supply for all Regional and EU customers.
Also adopting a forward-looking perspective, the number of projects included in this GRIP illustrates that the Region is willing to further develop the gas infrastructures, provided that favourable investment conditions sustain project promoters’ efforts.
Taking into account the need to refurbish the existing infrastructure and the envis-aged changes in demand and supply patterns, further investments in enhancing network, storage and LNG systems are essential to support market integration, security of supply and sustainability as pillars of the European energy policy.
The infrastructure analysis is organized in the following way:
y For the existing assets: the analysis focuses on the Regional weight for the different categories of infrastructure (pipelines, storage facilities and LNG plants) compared to the EU aggregate, with a specifi c breakdown for the coun-tries composing the Region.
y For projected infrastructures: an overall evaluation has been conducted on the FID / non-FID situation for the various categories of assets. The chapter closes with a detailed list of projects, grouped in different tables according to the category of infrastructure, with the indication of the related project promoters, the FID / non-FID status and the foreseen commissioning year. More details on the respective projects can be found in annex A of ENTSOG TYNDP 2013 – 2022.
14 | ENTSOG – GRIP Central Eastern Europe 2014 – 2023
CH 1.1 %BE 1.7 %
IT 15.6 %
DE 17.7 %
FR 17.8 %
% 5446
Rest of EU-28 Region
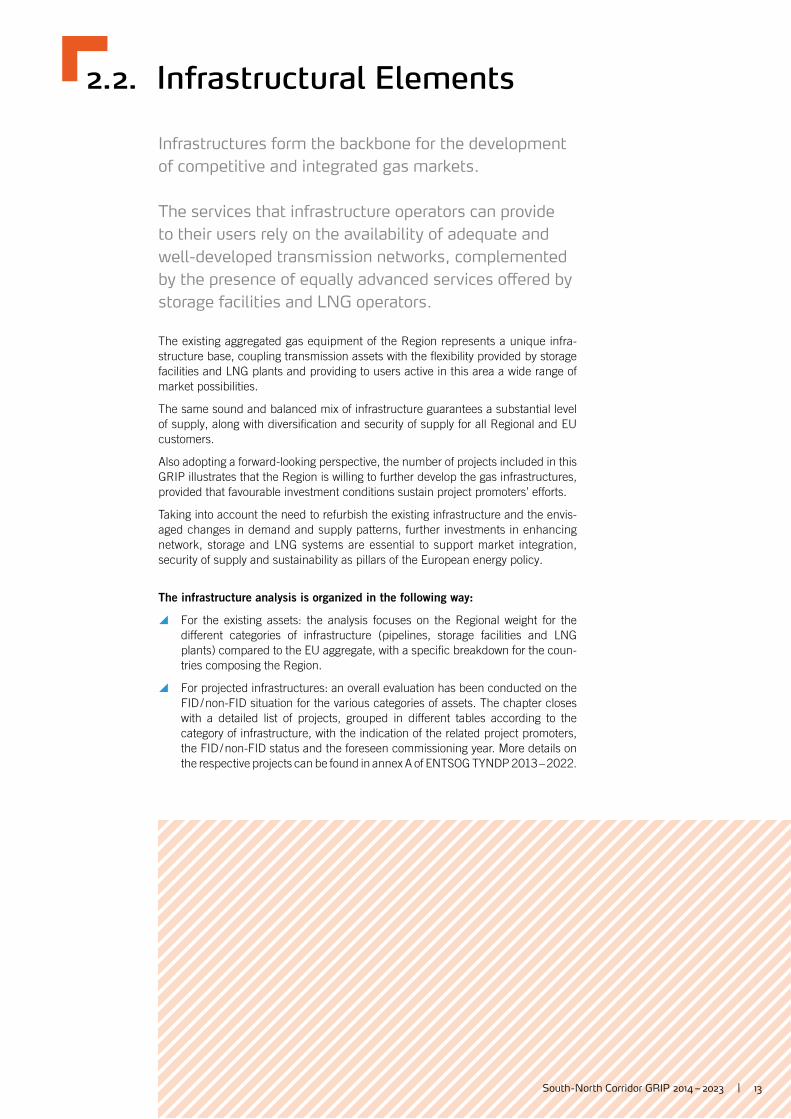
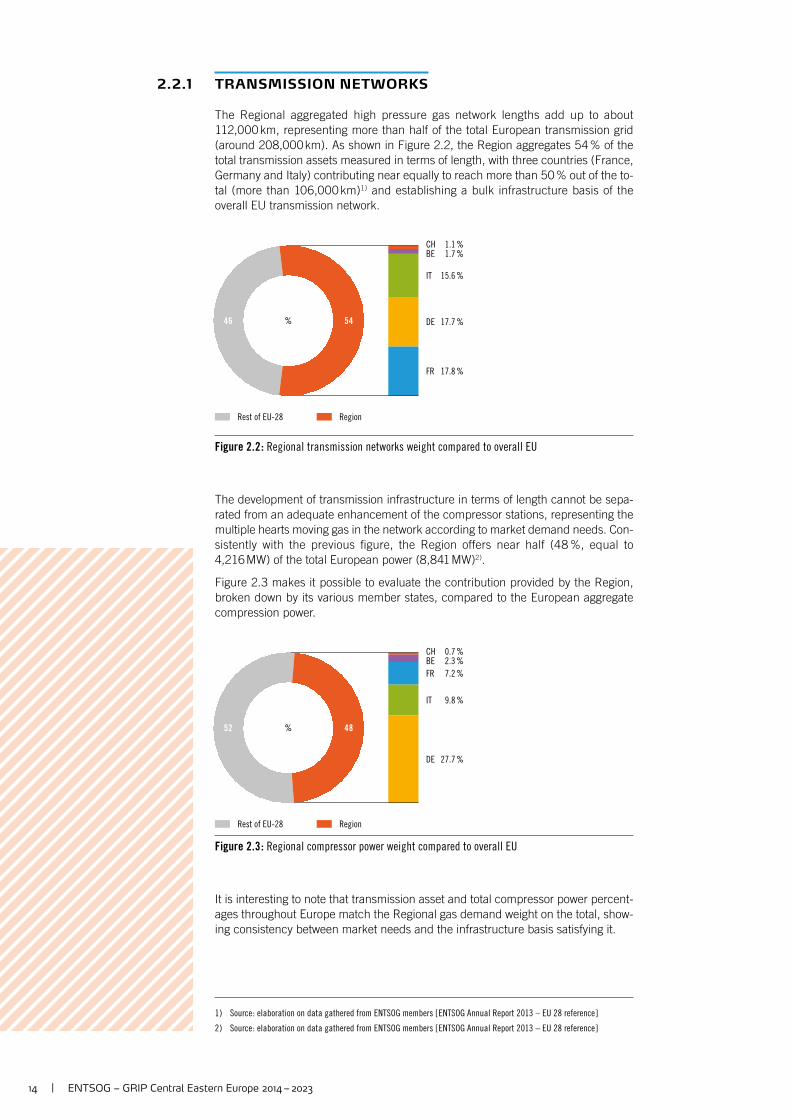
Figure 2.2 : Regional transmission networks weight compared to overall EU
CH 0.7 %BE 2.3 %
FR 7.2 %
IT 9.8 %
DE 27.7 %
% 4852
Rest of EU-28 Region
Figure 2.3 : Regional compressor power weight compared to overall EU
2.2.1 TRANSMISSION NETWORKS
The Regional aggregated high pressure gas network lengths add up to about 112,000 km, representing more than half of the total European transmission grid (around 208,000 km). As shown in Figure 2.2, the Region aggregates 54 % of the total transmission assets measured in terms of length, with three countries (France, Germany and Italy) contributing near equally to reach more than 50 % out of the to-tal (more than 106,000 km)1 ) and establishing a bulk infrastructure basis of the overall EU transmission network.
The development of transmission infrastructure in terms of length cannot be sepa-rated from an adequate enhancement of the compressor stations, representing the multiple hearts moving gas in the network according to market demand needs. Con-sistently with the previous fi gure, the Region offers near half (48 %, equal to 4,216 MW) of the total European power (8,841 MW)2 ).
Figure 2.3 makes it possible to evaluate the contribution provided by the Region, broken down by its various member states, compared to the European aggregate compression power.
It is interesting to note that transmission asset and total compressor power percent-ages throughout Europe match the Regional gas demand weight on the total, show-ing consistency between market needs and the infrastructure basis satisfying it.
1 ) Source : elaboration on data gathered from ENTSOG members [ ENTSOG Annual Report 2013 – EU 28 reference ]
2 ) Source : elaboration on data gathered from ENTSOG members [ ENTSOG Annual Report 2013 – EU 28 reference ]
South -North Corridor GRIP 2014 – 2023 | 15
BE 1 %
FR 13 %
IT 17 %
DE 23 %
% 5446
Rest of EU-28 Region
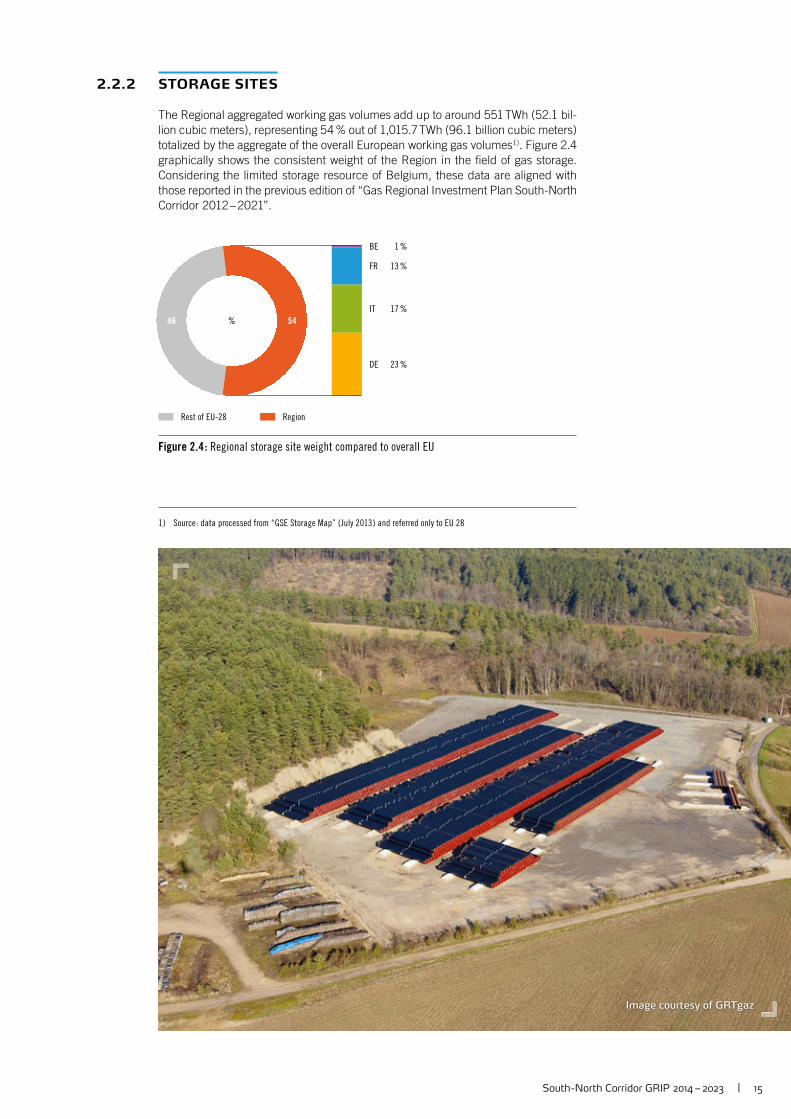
Figure 2.4 : Regional storage site weight compared to overall EU
Image courtesy of GRTgaz
2.2.2 STORAGE SITES
The Regional aggregated working gas volumes add up to around 551 TWh (52.1 bil-lion cubic meters), representing 54 % out of 1,015.7 TWh (96.1 billion cubic meters) totalized by the aggregate of the overall European working gas volumes1 ). Figure 2.4 graphically shows the consistent weight of the Region in the fi eld of gas storage. Considering the limited storage resource of Belgium, these data are aligned with those reported in the previous edition of “Gas Regional Investment Plan South-North Corridor 2012 – 2021”.
1 ) Source : data processed from “GSE Storage Map” ( July 2013 ) and referred only to EU 28
16 | South -North Corridor GRIP 2014 – 2023
BE 5 %
FR 13 %
IT 8 %
% 2674
Rest of EU-28 Region
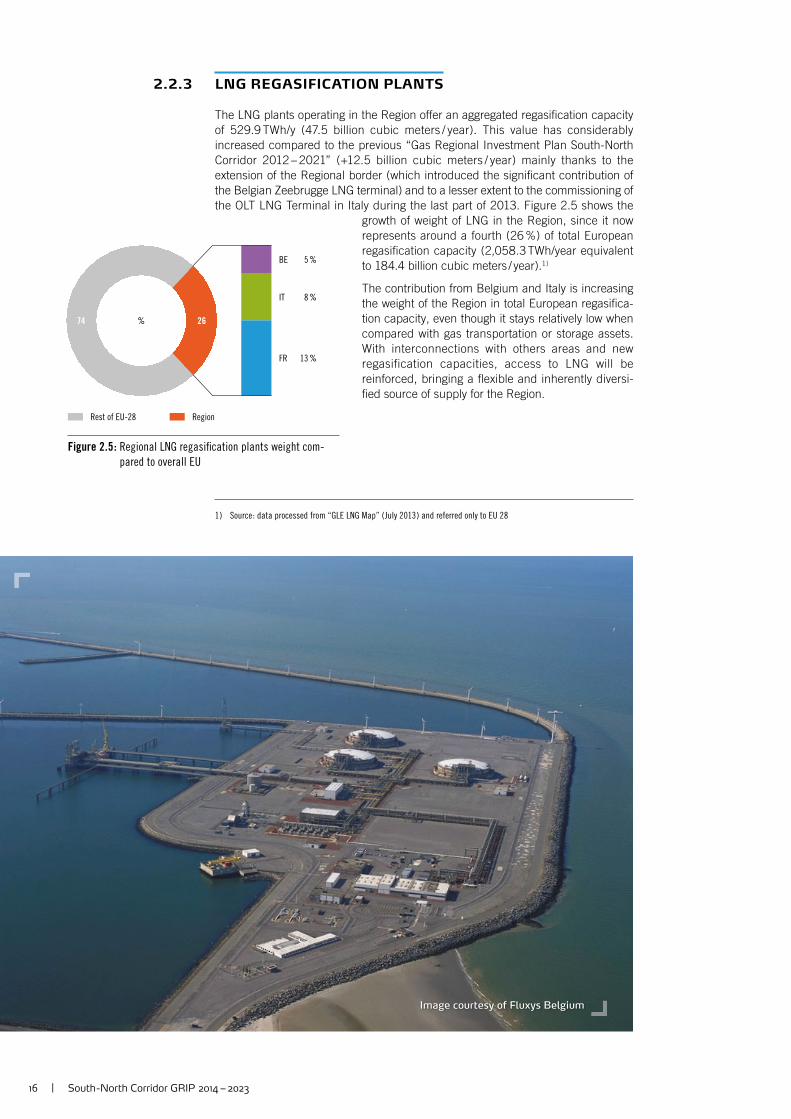
Figure 2.5 : Regional LNG regasifi cation plants weight com-
pared to overall EU
Image courtesy of Fluxys Belgium
2.2.3 LNG REGASIFICATION PLANTS
The LNG plants operating in the Region offer an ag gregated regasifi cation capacity of 529.9 TWh/y (47.5 billion cubic meters / year). This value has considerably increased compared to the previous “Gas Regional Investment Plan South-North Corridor 2012 – 2021” (+12.5 billion cubic meters / year) mainly thanks to the ex tension of the Regional border (which introduced the signifi cant contribution of the Belgian Zeebrugge LNG terminal) and to a lesser extent to the commissioning of the OLT LNG Terminal in Italy during the last part of 2013. Figure 2.5 shows the
growth of weight of LNG in the Region, since it now represents around a fourth (26 %) of total European regasifi cation capacity (2,058.3 TWh/year equivalent to 184.4 billion cubic meters / year).1 )
The contribution from Belgium and Italy is increasing the weight of the Region in total European regasifi ca-tion capacity, even though it stays relatively low when compared with gas transportation or storage assets. With interconnections with others areas and new regasification capacities, access to LNG will be reinforced, bringing a fl exible and inherently diversi-fi ed source of supply for the Region.
1 ) Source : data processed from “GLE LNG Map” ( July 2013 ) and referred only to EU 28
South -North Corridor GRIP 2014 – 2023 | 17
25
52
Total FID
Total non-FIDNumber of projects
Figure 2.6 : FID vs non-FID projects : the aggregate picture in
the South-North Corridor Region
%
3
1
43
27
26 FR
IT
DE
BE
CH
Figure 2.7 : Country distribution of projects ( FID + non-
FID) in the South-North Corridor Region
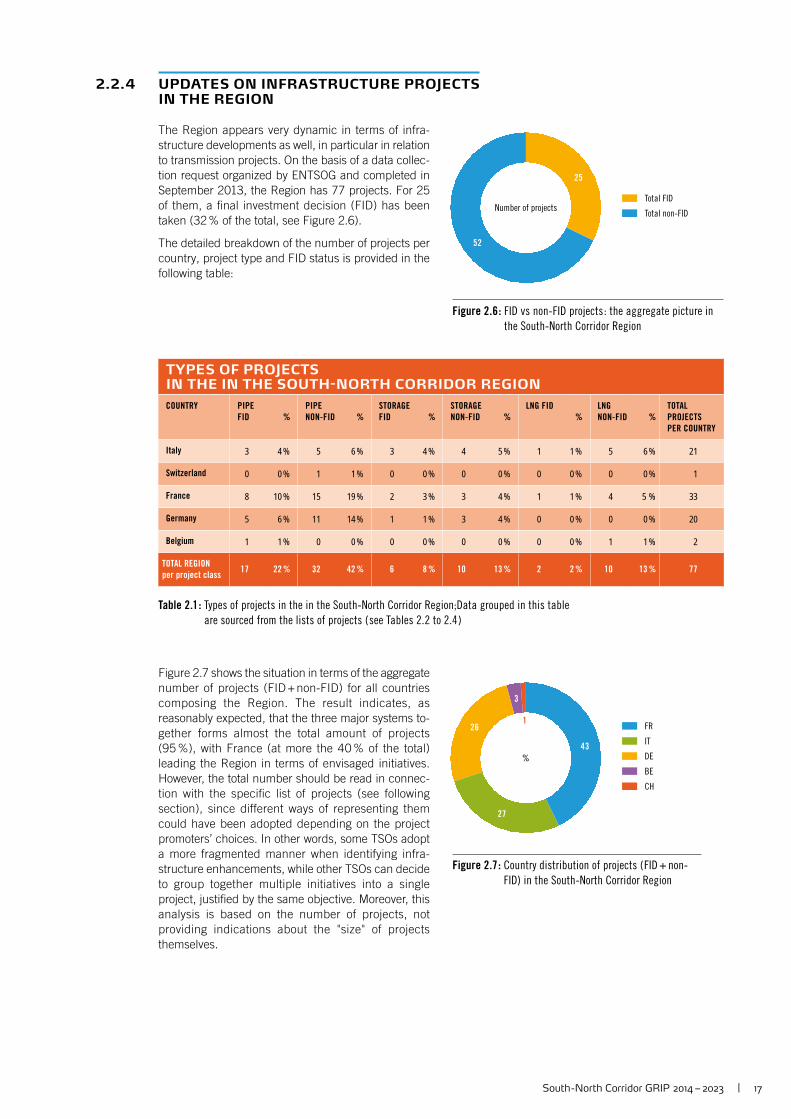
2.2.4 UPDATES ON INFRASTRUCTURE PROJECTS IN THE REGION
The Region appears very dynamic in terms of infra-structure developments as well, in particular in relation to transmission projects. On the basis of a data collec-tion request organized by ENTSOG and completed in September 2013, the Region has 77 projects. For 25 of them, a fi nal investment decision (FID) has been taken (32 % of the total, see Figure 2.6).
The detailed breakdown of the number of projects per country, project type and FID status is provided in the following table:
TYPES OF PROJECTSIN THE IN THE SOUTH-NORTH CORRIDOR REGION
COUNTRY PIPE
FID %
PIPE
NON-FID %
STORAGE
FID %
STORAGE
NON-FID %
LNG FID
%
LNG
NON-FID %
TOTAL
PROJECTS
PER COUNTRY
Italy 3 4 % 5 6 % 3 4 % 4 5 % 1 1 % 5 6 % 21
Switzerland 0 0 % 1 1 % 0 0 % 0 0 % 0 0 % 0 0 % 1
France 8 10 % 15 19 % 2 3 % 3 4 % 1 1 % 4 5 % 33
Germany 5 6 % 11 14 % 1 1 % 3 4 % 0 0 % 0 0 % 20
Belgium 1 1 % 0 0 % 0 0 % 0 0 % 0 0 % 1 1 % 2
TOTAL REGION
per project class17 22 % 32 42 % 6 8 % 10 13 % 2 2 % 10 13 % 77
Table 2.1 : Types of projects in the in the South-North Corridor Region;Data grouped in this table
are sourced from the lists of projects ( see Tables 2.2 to 2.4 )
Figure 2.7 shows the situation in terms of the aggregate number of projects (FID + non-FID) for all countries composing the Region. The result indicates, as reasonably expected, that the three major systems to-gether forms almost the total amount of projects (95 %), with France (at more the 40 % of the total) leading the Region in terms of envisaged initiatives. However, the total number should be read in connec-tion with the specifi c list of projects (see following section), since different ways of representing them could have been adopted depending on the project promoters’ choices. In other words, some TSOs adopt a more fragmented manner when identifying infra-structure enhancements, while other TSOs can decide to group together multiple initiatives into a single project, justifi ed by the same objective. Moreover, this analysis is based on the number of projects, not providing indications about the "size" of projects themselves.
18 | South -North Corridor GRIP 2014 – 2023
0
3
6
9
12
15
Number
of projects
2013
2014
2015
2017
2016
2018
2019
2020
2021
2022
2023
Pipe FID
Pipe non-FID
Storage FID
Sorage non-FID
LNG FID
LNG non-FID
Figure 2.8 : Total number of projects per type (LNG, Storage, Pipes) and status (FID, non-FID)
in the South-North Corridor Region
0
20
40
60
80
2013
2014
2015
2017
2016
2018
2019
2020
2021
2022
2023
Pipe FID
Pipe non-FID
Storage FID
Sorage non-FID
LNG FID
LNG non-FID
Number
of projects
Figure 2.9 : Cumulated distribution of Regional projects in the South-North Corridor Region
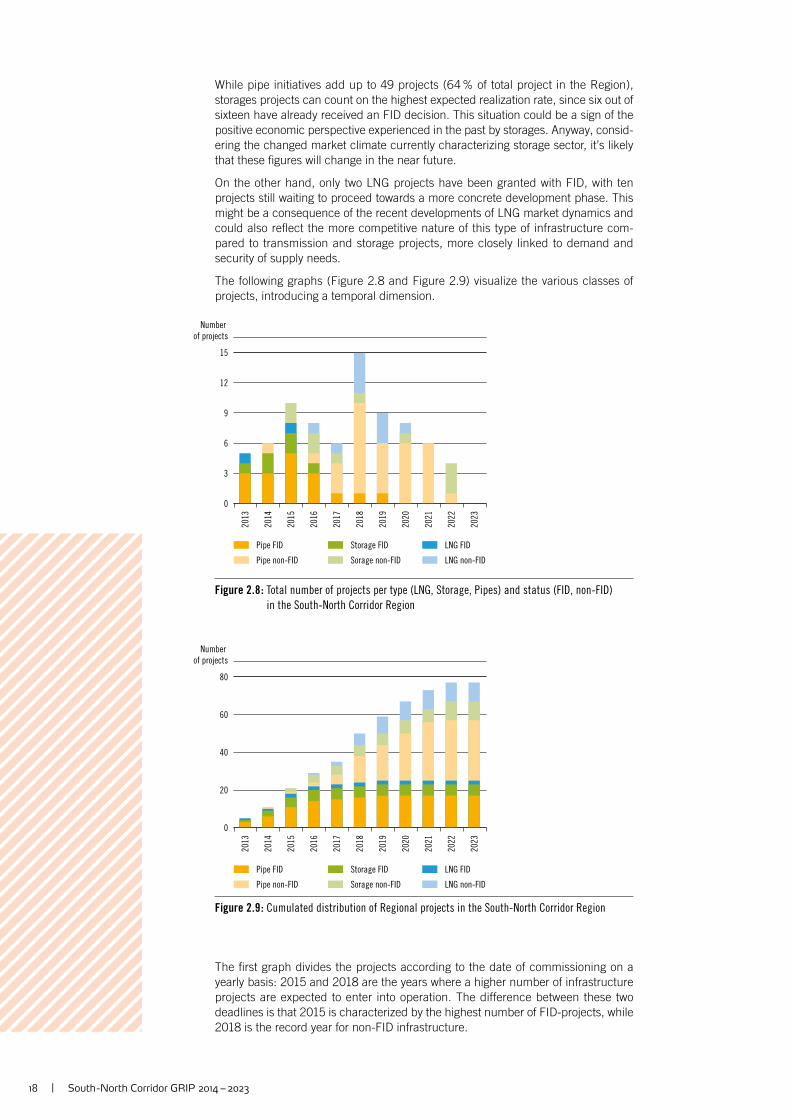
While pipe initiatives add up to 49 projects (64 % of total project in the Region), storages projects can count on the highest expected realization rate, since six out of sixteen have already received an FID decision. This situation could be a sign of the positive economic perspective experienced in the past by storages. Anyway, consid-ering the changed market climate currently characterizing storage sector, it’s likely that these fi gures will change in the near future.
On the other hand, only two LNG projects have been granted with FID, with ten projects still waiting to proceed towards a more concrete development phase. This might be a consequence of the recent developments of LNG market dynamics and could also refl ect the more competitive nature of this type of infrastructure com-pared to transmission and storage projects, more closely linked to demand and security of supply needs.
The following graphs (Figure 2.8 and Figure 2.9) visualize the various classes of projects, introducing a temporal dimension.
The fi rst graph divides the projects according to the date of commissioning on a yearly basis: 2015 and 2018 are the years where a higher number of infrastructure projects are expected to enter into operation. The difference between these two deadlines is that 2015 is characterized by the highest number of FID-projects, while 2018 is the record year for non-FID infrastructure.
South -North Corridor GRIP 2014 – 2023 | 19
%
17
6
2
32
22
8
2
42
13
13
10
10
Pipe FID
Storage FID
LNG FID
Pipe non-FID
Storage non-FID
LNG non-FID
Figure 2.10 : Relative weight of Infrastructure projects per class (LNG, storages, pipelines) and
status (FID, non-FID) in the South-North Corridor Region
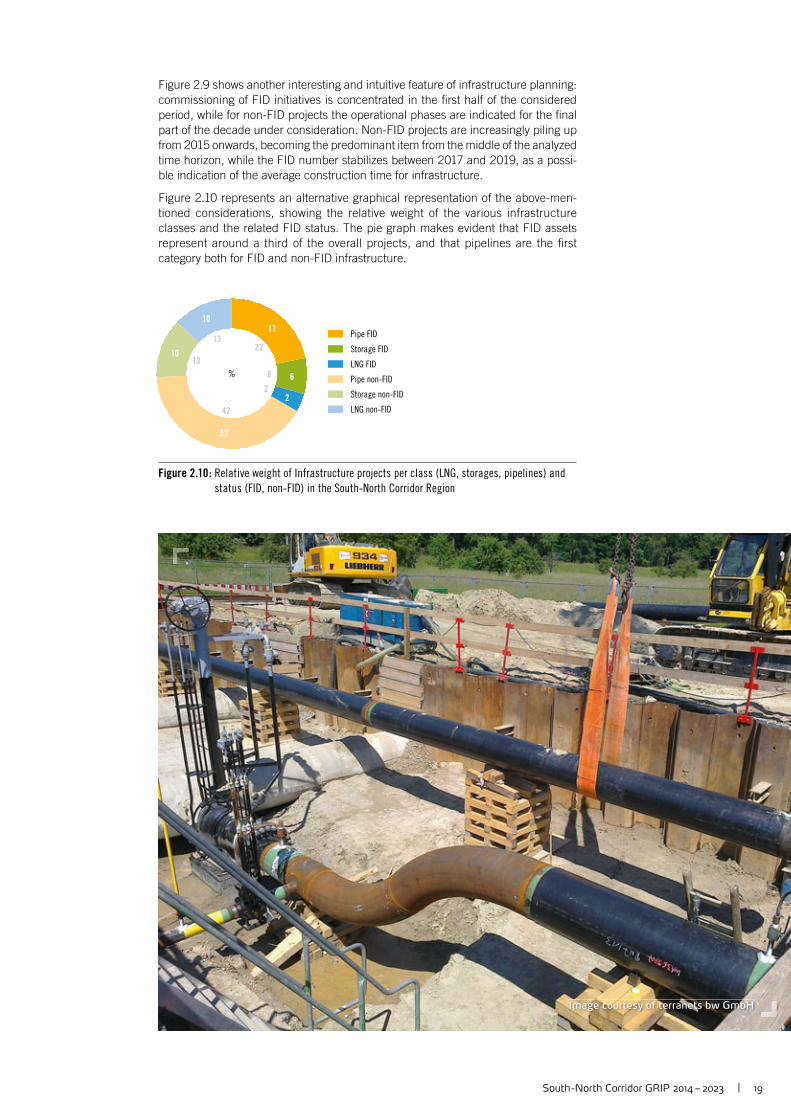
Figure 2.9 shows another interesting and intuitive feature of infrastructure planning: commissioning of FID initiatives is concentrated in the fi rst half of the considered period, while for non-FID projects the operational phases are indicated for the fi nal part of the decade under consideration. Non-FID projects are increasingly piling up from 2015 onwards, becoming the predominant item from the middle of the analyzed time horizon, while the FID number stabilizes between 2017 and 2019, as a possi-ble indication of the average construction time for infrastructure.
Figure 2.10 represents an alternative graphical representation of the above-men-tioned considerations, showing the relative weight of the various infrastructure classes and the related FID status. The pie graph makes evident that FID assets represent around a third of the overall projects, and that pipelines are the fi rst category both for FID and non-FID infrastructure.
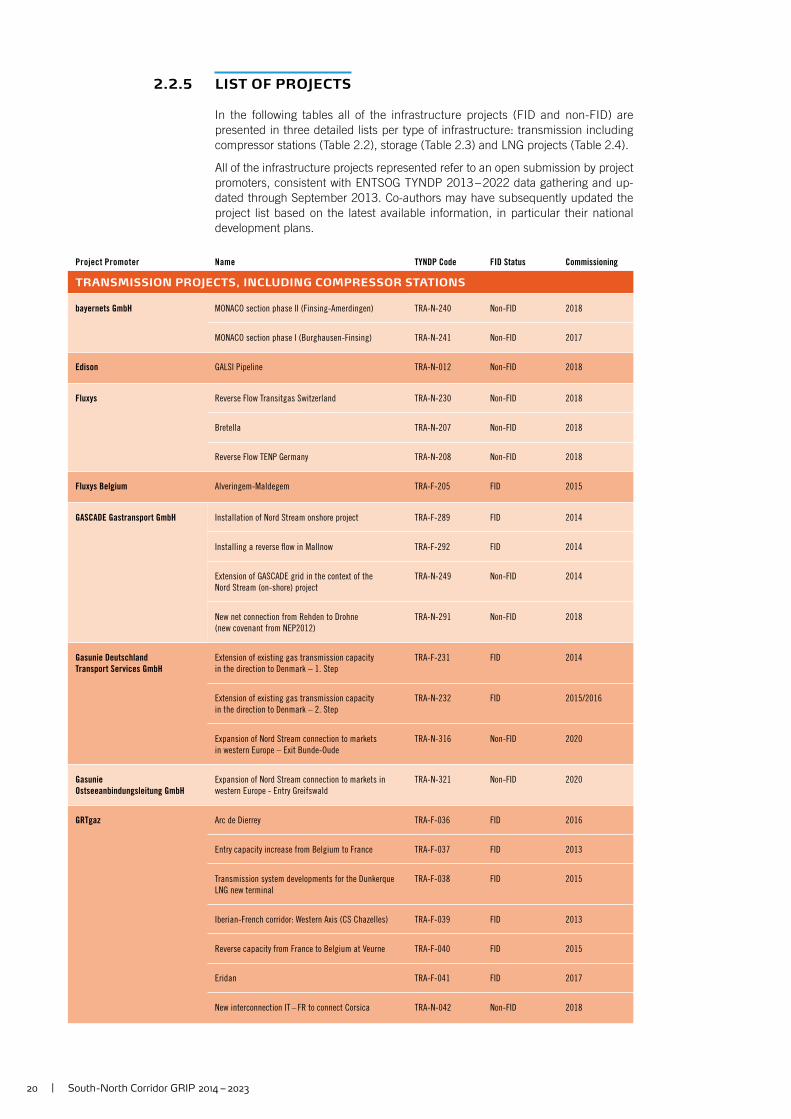
Image courtesy of terranets bw GmbH
20 | South -North Corridor GRIP 2014 – 2023
2.2.5 LIST OF PROJECTS
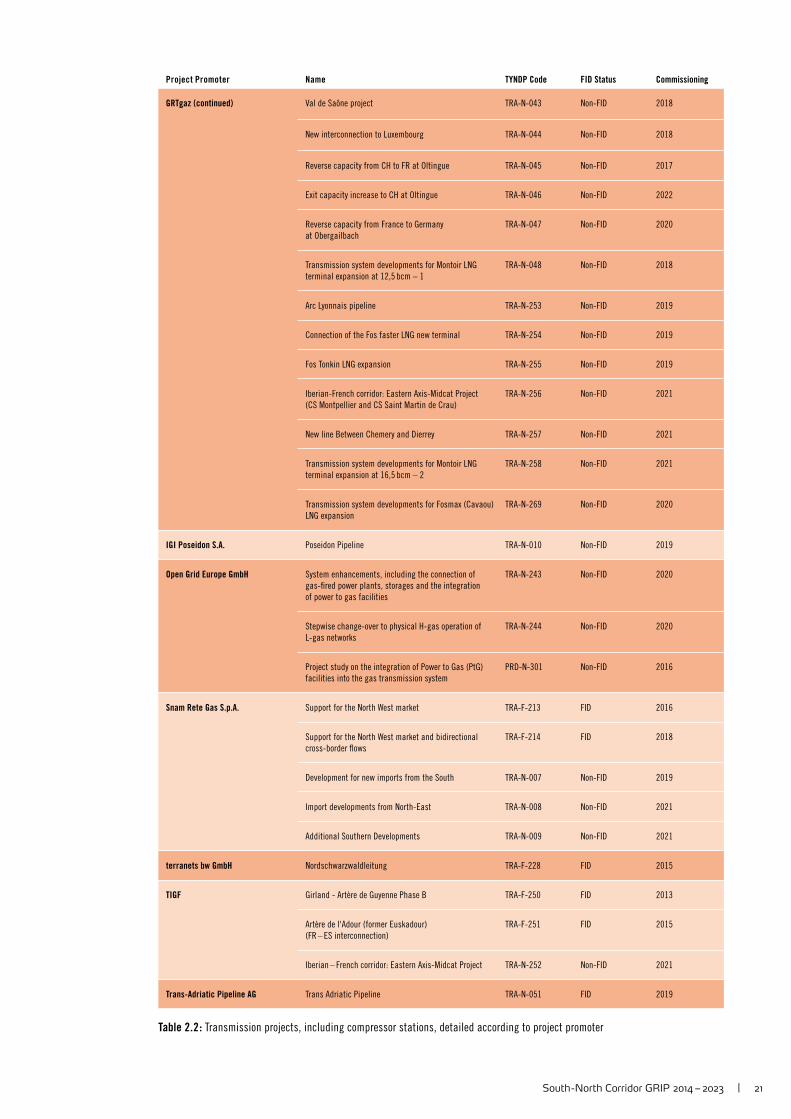
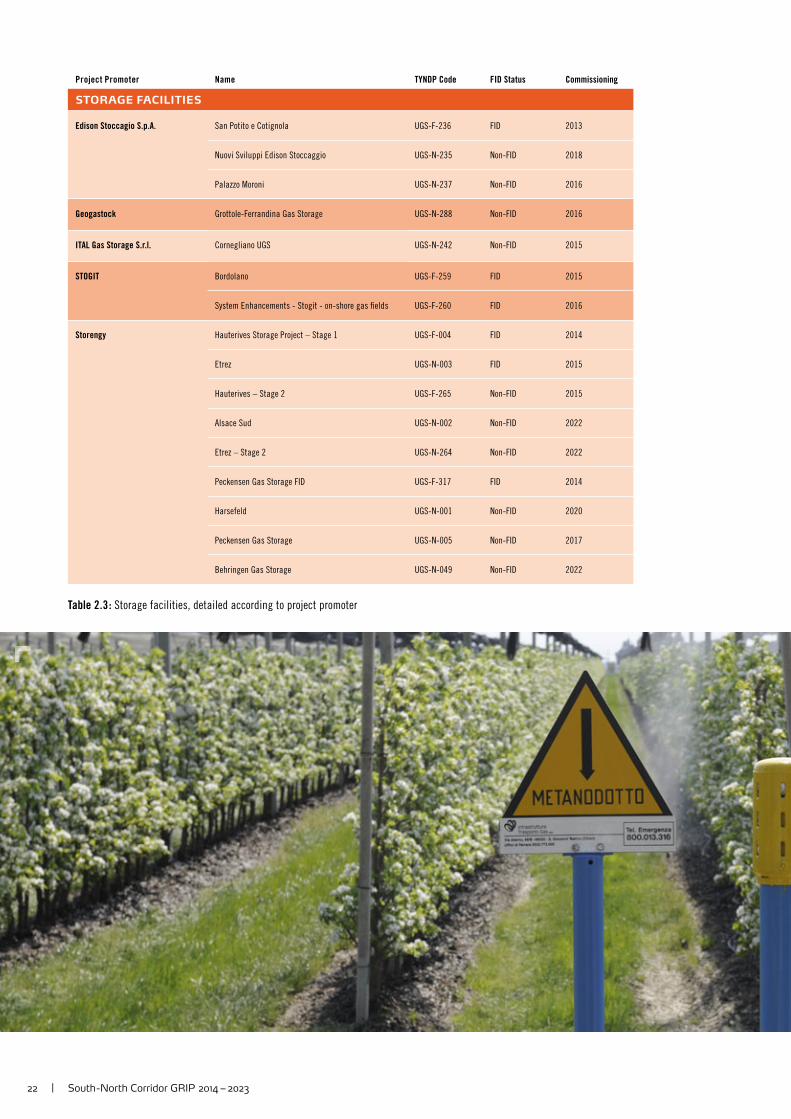
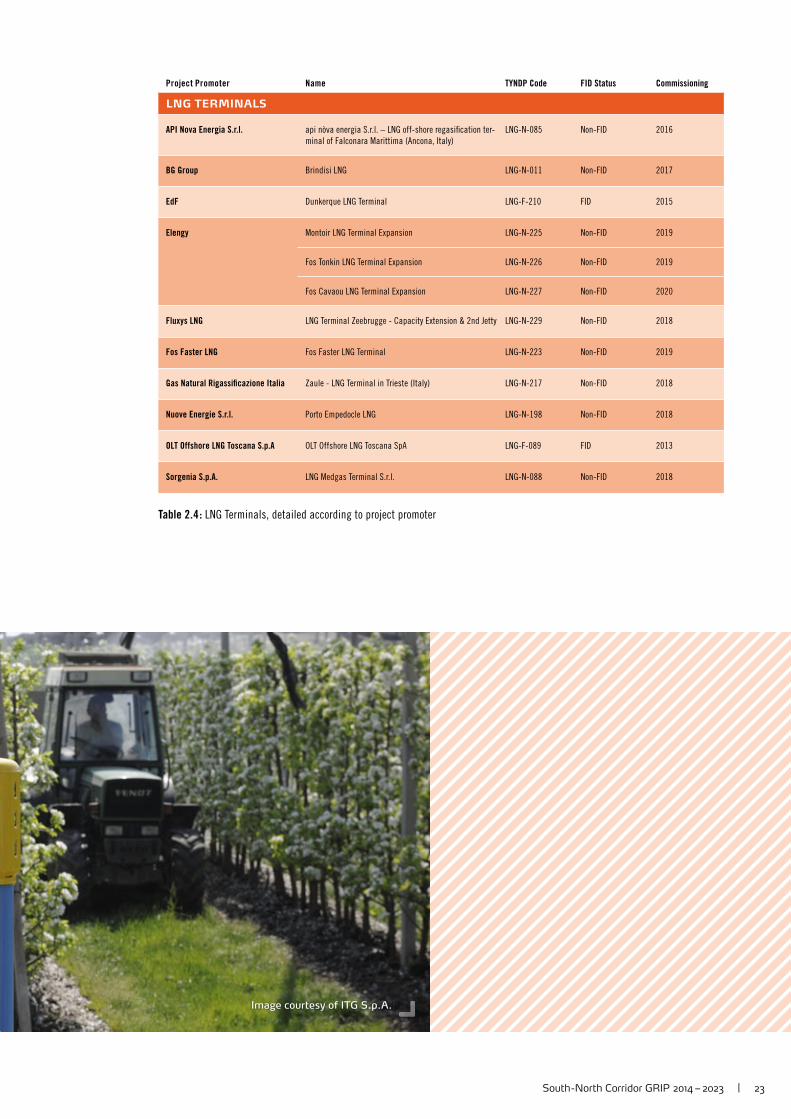
In the following tables all of the infrastructure projects (FID and non-FID) are presented in three detailed lists per type of infrastructure: transmission including compressor stations (Table 2.2), storage (Table 2.3) and LNG projects (Table 2.4).
All of the infrastructure projects represented refer to an open submission by project promoters, consistent with ENTSOG TYNDP 2013 – 2022 data gathering and up-dated through September 2013. Co-authors may have subsequently updated the project list based on the latest available information, in particular their national development plans.
Project Promoter Name TYNDP Code FID Status Commissioning
TRANSMISSION PROJECTS, INCLUDING COMPRESSOR STATIONS
bayernets GmbH MONACO section phase II (Finsing-Amerdingen) TRA-N-240 Non-FID 2018
MONACO section phase I (Burghausen-Finsing) TRA-N-241 Non-FID 2017
Edison GALSI Pipeline TRA-N-012 Non-FID 2018
Fluxys Reverse Flow Transitgas Switzerland TRA-N-230 Non-FID 2018
Bretella TRA-N-207 Non-FID 2018
Reverse Flow TENP Germany TRA-N-208 Non-FID 2018
Fluxys Belgium Alveringem-Maldegem TRA-F-205 FID 2015
GASCADE Gastransport GmbH Installation of Nord Stream onshore project TRA-F-289 FID 2014
Installing a reverse fl ow in Mallnow TRA-F-292 FID 2014
Extension of GASCADE grid in the context of the
Nord Stream (on-shore) project
TRA-N-249 Non-FID 2014
New net connection from Rehden to Drohne
(new covenant from NEP2012)
TRA-N-291 Non-FID 2018
Gasunie Deutschland
Transport Services GmbH
Extension of existing gas transmission capacity
in the direction to Denmark – 1. Step
TRA-F-231 FID 2014
Extension of existing gas transmission capacity
in the direction to Denmark – 2. Step
TRA-N-232 FID 2015/2016
Expansion of Nord Stream connection to markets
in western Europe – Exit Bunde-Oude
TRA-N-316 Non-FID 2020
Gasunie
Ostseeanbindungsleitung GmbH
Expansion of Nord Stream connection to markets in
western Europe - Entry Greifswald
TRA-N-321 Non-FID 2020
GRTgaz Arc de Dierrey TRA-F-036 FID 2016
Entry capacity increase from Belgium to France TRA-F-037 FID 2013
Transmission system developments for the Dunkerque
LNG new terminal
TRA-F-038 FID 2015
Iberian-French corridor: Western Axis (CS Chazelles) TRA-F-039 FID 2013
Reverse capacity from France to Belgium at Veurne TRA-F-040 FID 2015
Eridan TRA-F-041 FID 2017
New interconnection IT – FR to connect Corsica TRA-N-042 Non-FID 2018
South -North Corridor GRIP 2014 – 2023 | 21
Project Promoter Name TYNDP Code FID Status Commissioning
GRTgaz (continued) Val de Saône project TRA-N-043 Non-FID 2018
New interconnection to Luxembourg TRA-N-044 Non-FID 2018
Reverse capacity from CH to FR at Oltingue TRA-N-045 Non-FID 2017
Exit capacity increase to CH at Oltingue TRA-N-046 Non-FID 2022
Reverse capacity from France to Germany
at Obergailbach
TRA-N-047 Non-FID 2020
Transmission system developments for Montoir LNG
terminal expansion at 12,5 bcm – 1
TRA-N-048 Non-FID 2018
Arc Lyonnais pipeline TRA-N-253 Non-FID 2019
Connection of the Fos faster LNG new terminal TRA-N-254 Non-FID 2019
Fos Tonkin LNG expansion TRA-N-255 Non-FID 2019
Iberian-French corridor: Eastern Axis-Midcat Project
(CS Montpellier and CS Saint Martin de Crau)
TRA-N-256 Non-FID 2021
New line Between Chemery and Dierrey TRA-N-257 Non-FID 2021
Transmission system developments for Montoir LNG
terminal expansion at 16,5 bcm – 2
TRA-N-258 Non-FID 2021
Transmission system developments for Fosmax (Cavaou)
LNG expansion
TRA-N-269 Non-FID 2020
IGI Poseidon S.A. Poseidon Pipeline TRA-N-010 Non-FID 2019
Open Grid Europe GmbH System enhancements, including the connection of
gas-fi red power plants, storages and the integration
of power to gas facilities
TRA-N-243 Non-FID 2020
Stepwise change-over to physical H-gas operation of
L-gas networks
TRA-N-244 Non-FID 2020
Project study on the integration of Power to Gas (PtG)
facilities into the gas transmission system
PRD-N-301 Non-FID 2016
Snam Rete Gas S.p.A. Support for the North West market TRA-F-213 FID 2016
Support for the North West market and bidirectional
cross-border fl ows
TRA-F-214 FID 2018
Development for new imports from the South TRA-N-007 Non-FID 2019
Import developments from North-East TRA-N-008 Non-FID 2021
Additional Southern Developments TRA-N-009 Non-FID 2021
terranets bw GmbH Nordschwarzwaldleitung TRA-F-228 FID 2015
TIGF Girland - Artère de Guyenne Phase B TRA-F-250 FID 2013
Artère de l'Adour (former Euskadour)
(FR – ES interconnection)
TRA-F-251 FID 2015
Iberian – French corridor: Eastern Axis-Midcat Project TRA-N-252 Non-FID 2021
Trans-Adriatic Pipeline AG Trans Adriatic Pipeline TRA-N-051 FID 2019
Table 2.2 : Transmission projects, including compressor stations, detailed according to project promoter
22 | South -North Corridor GRIP 2014 – 2023
Project Promoter Name TYNDP Code FID Status Commissioning
STORAGE FACILITIES
Edison Stoccagio S.p.A. San Potito e Cotignola UGS-F-236 FID 2013
Nuovi Sviluppi Edison Stoccaggio UGS-N-235 Non-FID 2018
Palazzo Moroni UGS-N-237 Non-FID 2016
Geogastock Grottole-Ferrandina Gas Storage UGS-N-288 Non-FID 2016
ITAL Gas Storage S.r.l. Cornegliano UGS UGS-N-242 Non-FID 2015
STOGIT Bordolano UGS-F-259 FID 2015
System Enhancements - Stogit - on-shore gas fi elds UGS-F-260 FID 2016
Storengy Hauterives Storage Project – Stage 1 UGS-F-004 FID 2014
Etrez UGS-N-003 FID 2015
Hauterives – Stage 2 UGS-F-265 Non-FID 2015
Alsace Sud UGS-N-002 Non-FID 2022
Etrez – Stage 2 UGS-N-264 Non-FID 2022
Peckensen Gas Storage FID UGS-F-317 FID 2014
Harsefeld UGS-N-001 Non-FID 2020
Peckensen Gas Storage UGS-N-005 Non-FID 2017
Behringen Gas Storage UGS-N-049 Non-FID 2022
Table 2.3 : Storage facilities, detailed according to project promoter
South -North Corridor GRIP 2014 – 2023 | 23
Image courtesy of ITG S.p.A.
Project Promoter Name TYNDP Code FID Status Commissioning
LNG TERMINALS
API Nova Energia S.r.l. api nòva energia S.r.l. – LNG off-shore regasifi cation ter-
minal of Falconara Marittima (Ancona, Italy)
LNG-N-085 Non-FID 2016
BG Group Brindisi LNG LNG-N-011 Non-FID 2017
EdF Dunkerque LNG Terminal LNG-F-210 FID 2015
Elengy Montoir LNG Terminal Expansion LNG-N-225 Non-FID 2019
Fos Tonkin LNG Terminal Expansion LNG-N-226 Non-FID 2019
Fos Cavaou LNG Terminal Expansion LNG-N-227 Non-FID 2020
Fluxys LNG LNG Terminal Zeebrugge - Capacity Extension & 2nd Jetty LNG-N-229 Non-FID 2018
Fos Faster LNG Fos Faster LNG Terminal LNG-N-223 Non-FID 2019
Gas Natural Rigassifi cazione Italia Zaule - LNG Terminal in Trieste (Italy) LNG-N-217 Non-FID 2018
Nuove Energie S.r.l. Porto Empedocle LNG LNG-N-198 Non-FID 2018
OLT Offshore LNG Toscana S.p.A OLT Offshore LNG Toscana SpA LNG-F-089 FID 2013
Sorgenia S.p.A. LNG Medgas Terminal S.r.l. LNG-N-088 Non-FID 2018
Table 2.4 : LNG Terminals, detailed according to project promoter
image courtesy of Snam Rete Gas
Demand Elements and Market Analysis
Historic Demand | Forecast Demand Trends
Market Development Indicators | Price Correlation
Interconnection Points in the South-North Corridor
South-North Corridor GRIP 2014 – 2023 | 25
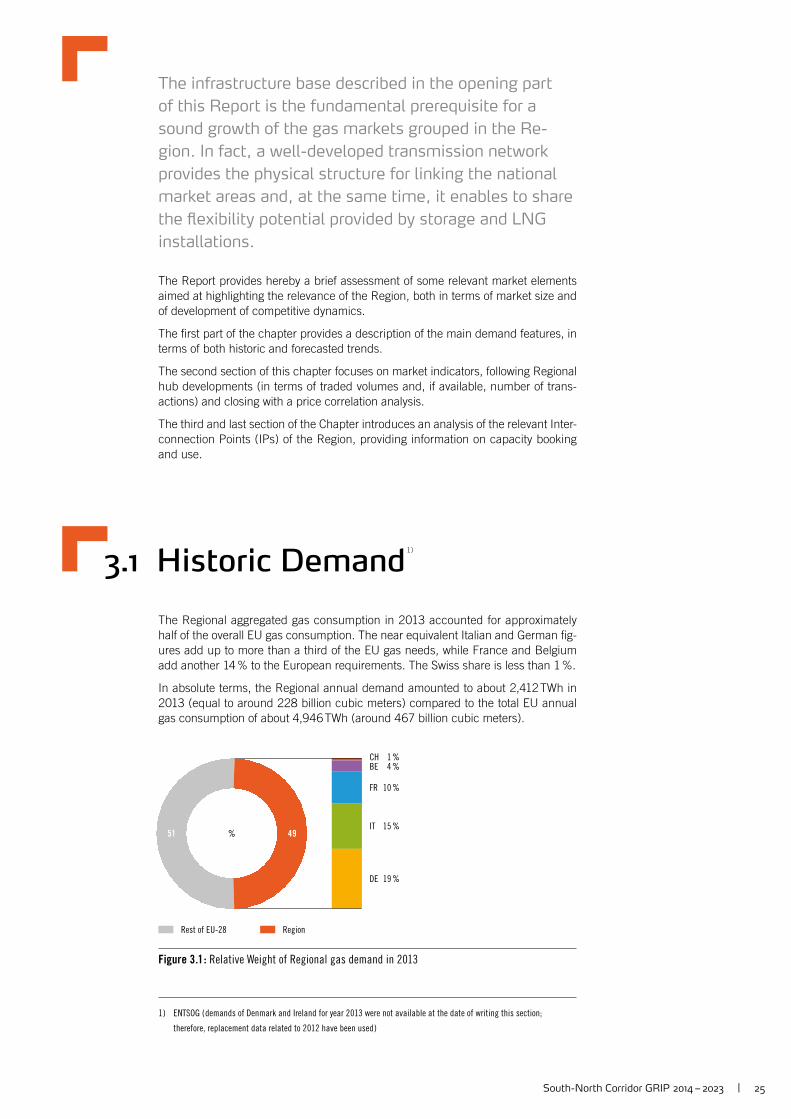
CH 1 %BE 4 %
FR 10 %
IT 15 %
DE 19 %
% 4951
Rest of EU-28 Region
Figure 3.1 : Relative Weight of Regional gas demand in 2013
The infrastructure base described in the opening part
of this Report is the fundamental prerequisite for a
sound growth of the gas markets grouped in the Re-
gion. In fact, a well-developed transmission network
provides the physical structure for linking the national
market areas and, at the same time, it enables to share
the fl exibility potential provided by storage and LNG
installations.
The Report provides hereby a brief assessment of some relevant market elements aimed at highlighting the relevance of the Region, both in terms of market size and of development of competitive dynamics.
The fi rst part of the chapter provides a description of the main demand features, in terms of both historic and forecasted trends.
The second section of this chapter focuses on market indicators, following Regional hub developments (in terms of traded volumes and, if available, number of trans-actions) and closing with a price correlation analysis.
The third and last section of the Chapter introduces an analysis of the relevant Inter-connection Points (IPs) of the Region, providing information on capacity booking and use.
3.1 Historic Demand 1 )
The Regional aggregated gas consumption in 2013 accounted for approximately half of the overall EU gas consumption. The near equivalent Italian and German fi g-ures add up to more than a third of the EU gas needs, while France and Belgium add another 14 % to the European requirements. The Swiss share is less than 1 %.
In absolute terms, the Regional annual demand amounted to about 2,412 TWh in 2013 (equal to around 228 billion cubic meters) compared to the total EU annual gas consumption of about 4,946 TWh (around 467 billion cubic meters).
1 ) ENTSOG ( demands of Denmark and Ireland for year 2013 were not available at the date of writing this section;
therefore, replacement data related to 2012 have been used )
26 | South -North Corridor GRIP 2014 – 2023
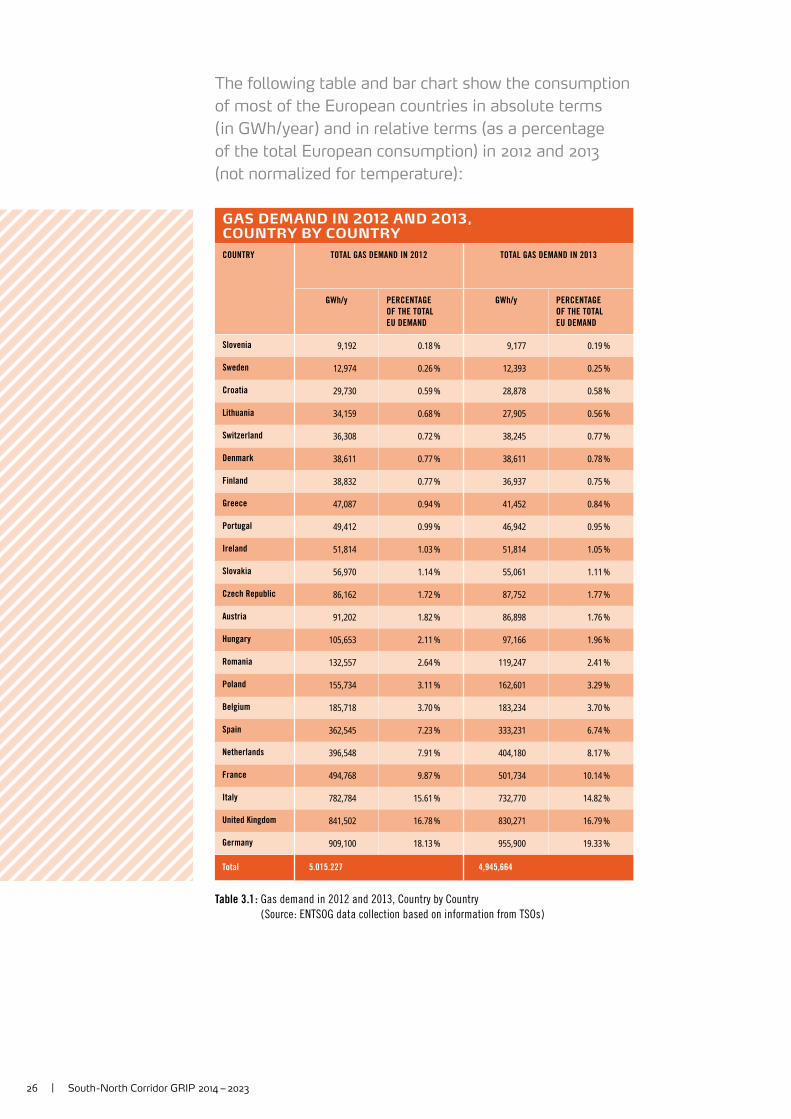
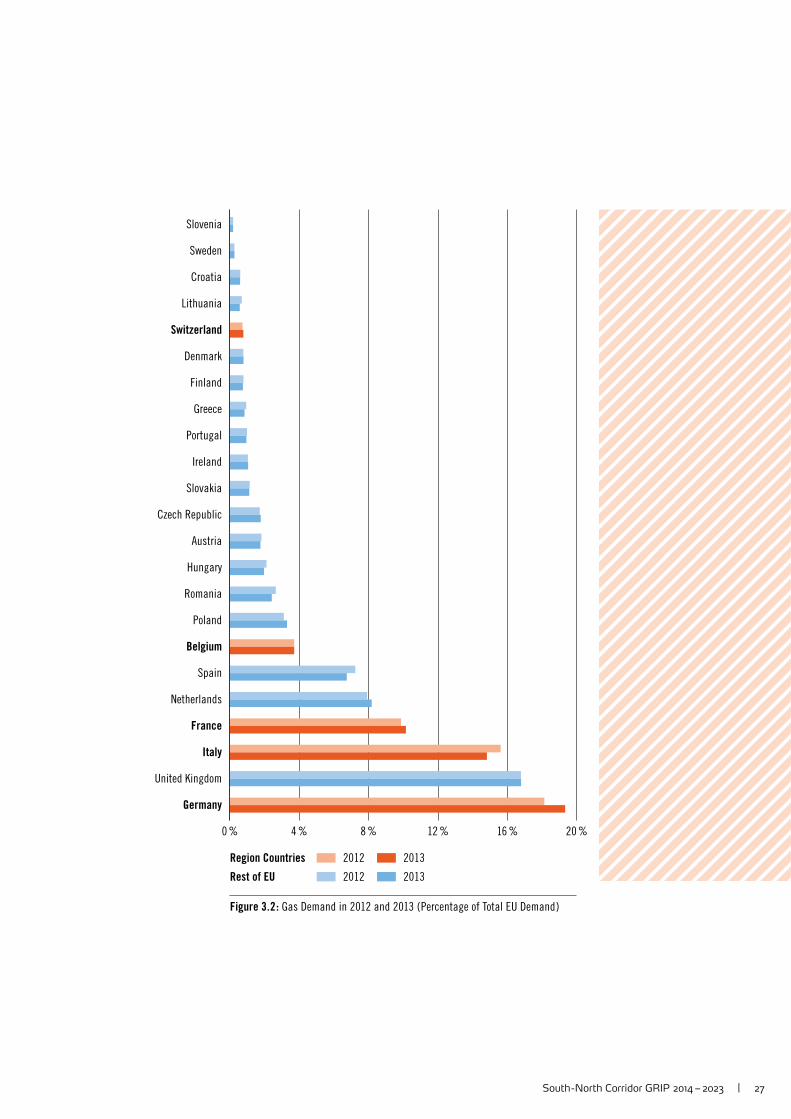
The following table and bar chart show the consumption
of most of the European countries in absolute terms
( in GWh/year ) and in relative terms (as a percentage
of the total European consumption) in 2012 and 2013
(not normalized for temperature):
GAS DEMAND IN 2012 AND 2013, COUNTRY BY COUNTRY
COUNTRY TOTAL GAS DEMAND IN 2012 TOTAL GAS DEMAND IN 2013
GWh/y PERCENTAGE
OF THE TOTAL
EU DEMAND
GWh/y PERCENTAGE
OF THE TOTAL
EU DEMAND
Slovenia 9,192 0.18 % 9,177 0.19 %
Sweden 12,974 0.26 % 12,393 0.25 %
Croatia 29,730 0.59 % 28,878 0.58 %
Lithuania 34,159 0.68 % 27,905 0.56 %
Switzerland 36,308 0.72 % 38,245 0.77 %
Denmark 38,611 0.77 % 38,611 0.78 %
Finland 38,832 0.77 % 36,937 0.75 %
Greece 47,087 0.94 % 41,452 0.84 %
Portugal 49,412 0.99 % 46,942 0.95 %
Ireland 51,814 1.03 % 51,814 1.05 %
Slovakia 56,970 1.14 % 55,061 1.11 %
Czech Republic 86,162 1.72 % 87,752 1.77 %
Austria 91,202 1.82 % 86,898 1.76 %
Hungary 105,653 2.11 % 97,166 1.96 %
Romania 132,557 2.64 % 119,247 2.41 %
Poland 155,734 3.11 % 162,601 3.29 %
Belgium 185,718 3.70 % 183,234 3.70 %
Spain 362,545 7.23 % 333,231 6.74 %
Netherlands 396,548 7.91 % 404,180 8.17 %
France 494,768 9.87 % 501,734 10.14 %
Italy 782,784 15.61 % 732,770 14.82 %
United Kingdom 841,502 16.78 % 830,271 16.79 %
Germany 909,100 18.13 % 955,900 19.33 %
Total 5.015.227 4,945,664
Table 3.1 : Gas demand in 2012 and 2013, Country by Country
( Source : ENTSOG data collection based on information from TSOs )
South -North Corridor GRIP 2014 – 2023 | 27
0 % 12 %4 % 8 % 16 % 20 %
Denmark
Netherlands
Sweden
Slovenia
Croatia
Ireland
Portugal
Greece
Finland
Belgium
Hungary
Romania
Italy
United Kingdom
Germany
France
Lithuania
Switzerland
Slovakia
Czech Republic
Austria
Poland
Spain
2012 2013
2012 2013
Region Countries
Rest of EU
Figure 3.2 : Gas Demand in 2012 and 2013 ( Percentage of Total EU Demand )
28 | South -North Corridor GRIP 2014 – 2023
0
3000
6000
9000
12000
15000
GWh/d
2014
2015
2017
2016
2018
2019
2020
2021
2022
2023
Switzerland
Belgium
France
Italy
Germany
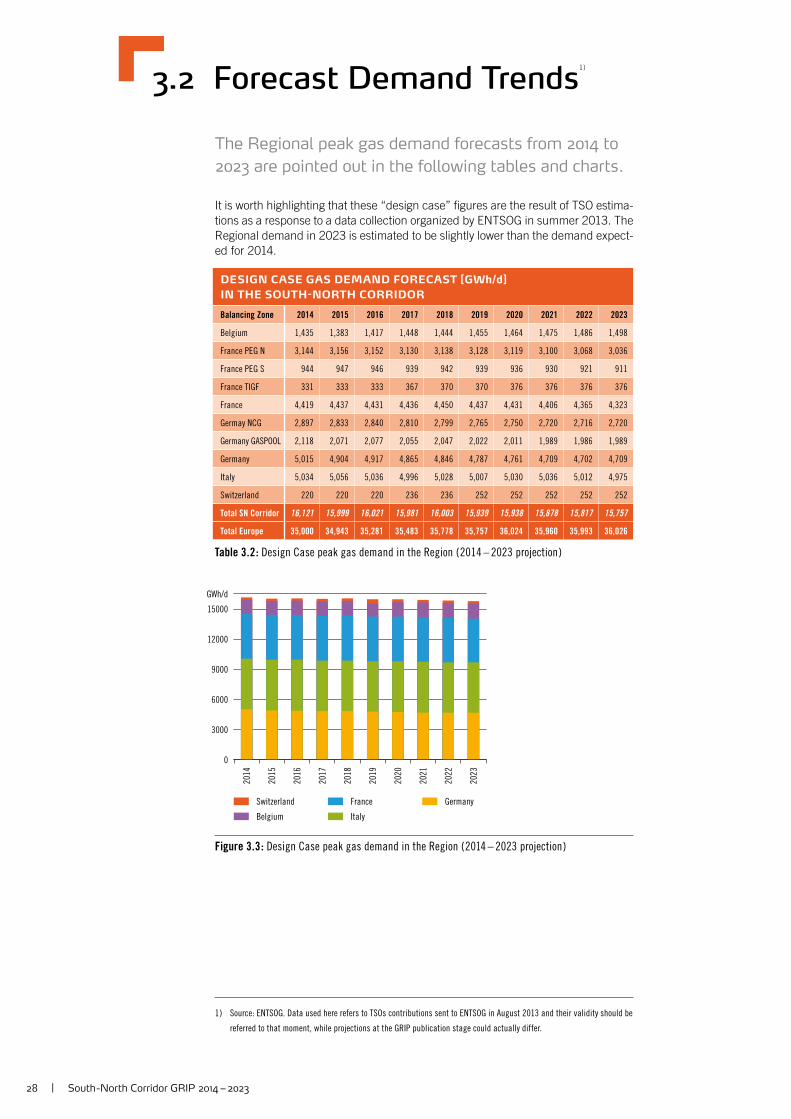
Figure 3.3 : Design Case peak gas demand in the Region ( 2014 – 2023 projection )
3.2 Forecast Demand Trends1 )
The Regional peak gas demand forecasts from 2014 to
2023 are pointed out in the following tables and charts.
It is worth highlighting that these “design case” fi gures are the result of TSO estima-tions as a response to a data collection organized by ENTSOG in summer 2013. The Regional demand in 2023 is estimated to be slightly lower than the demand expect-ed for 2014.
DESIGN CASE GAS DEMAND FORECAST [GWh/d]
IN THE SOUTH-NORTH CORRIDOR
Balancing Zone 2014 2015 2016 2017 2018 2019 2020 2021 2022 2023
Belgium 1,435 1,383 1,417 1,448 1,444 1,455 1,464 1,475 1,486 1,498
France PEG N 3,144 3,156 3,152 3,130 3,138 3,128 3,119 3,100 3,068 3,036
France PEG S 944 947 946 939 942 939 936 930 921 911
France TIGF 331 333 333 367 370 370 376 376 376 376
France 4,419 4,437 4,431 4,436 4,450 4,437 4,431 4,406 4,365 4,323
Germay NCG 2,897 2,833 2,840 2,810 2,799 2,765 2,750 2,720 2,716 2,720
Germany GASPOOL 2,118 2,071 2,077 2,055 2,047 2,022 2,011 1,989 1,986 1,989
Germany 5,015 4,904 4,917 4,865 4,846 4,787 4,761 4,709 4,702 4,709
Italy 5,034 5,056 5,036 4,996 5,028 5,007 5,030 5,036 5,012 4,975
Switzerland 220 220 220 236 236 252 252 252 252 252
Total SN Corridor 16,121 15,999 16,021 15,981 16,003 15,939 15,938 15,878 15,817 15,757
Total Europe 35,000 34,943 35,281 35,483 35,778 35,757 36,024 35,960 35,993 36,026
Table 3.2 : Design Case peak gas demand in the Region ( 2014 – 2023 projection )
1 ) Source: ENTSOG. Data used here refers to TSOs contributions sent to ENTSOG in August 2013 and their validity should be
referred to that moment, while projections at the GRIP publication stage could actually differ.
South -North Corridor GRIP 2014 – 2023 | 29
0
2500000
2000000
1500000
1000000
500000
GWh/y
2014
2015
2017
2016
2018
2019
2020
2021
2022
2023
Switzerland
Belgium
France
Italy
Germany
Figure 3.4 : Yearly gas demand in the Region ( 2014 – 2023 projection )
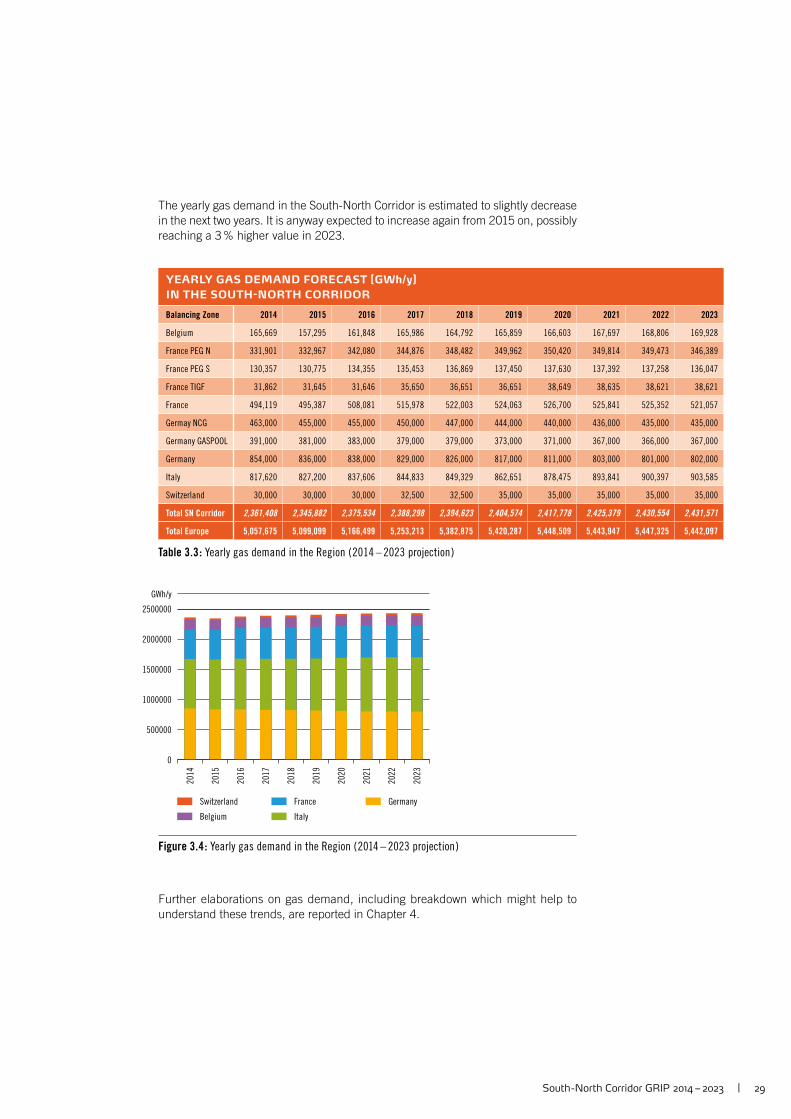
The yearly gas demand in the South-North Corridor is estimated to slightly decrease in the next two years. It is anyway expected to increase again from 2015 on, possibly reaching a 3 % higher value in 2023.
YEARLY GAS DEMAND FORECAST [GWh/y]
IN THE SOUTH-NORTH CORRIDOR
Balancing Zone 2014 2015 2016 2017 2018 2019 2020 2021 2022 2023
Belgium 165,669 157,295 161,848 165,986 164,792 165,859 166,603 167,697 168,806 169,928
France PEG N 331,901 332,967 342,080 344,876 348,482 349,962 350,420 349,814 349,473 346,389
France PEG S 130,357 130,775 134,355 135,453 136,869 137,450 137,630 137,392 137,258 136,047
France TIGF 31,862 31,645 31,646 35,650 36,651 36,651 38,649 38,635 38,621 38,621
France 494,119 495,387 508,081 515,978 522,003 524,063 526,700 525,841 525,352 521,057
Germay NCG 463,000 455,000 455,000 450,000 447,000 444,000 440,000 436,000 435,000 435,000
Germany GASPOOL 391,000 381,000 383,000 379,000 379,000 373,000 371,000 367,000 366,000 367,000
Germany 854,000 836,000 838,000 829,000 826,000 817,000 811,000 803,000 801,000 802,000
Italy 817,620 827,200 837,606 844,833 849,329 862,651 878,475 893,841 900,397 903,585
Switzerland 30,000 30,000 30,000 32,500 32,500 35,000 35,000 35,000 35,000 35,000
Total SN Corridor 2,361,408 2,345,882 2,375,534 2,388,298 2,394,623 2,404,574 2,417,778 2,425,379 2,430,554 2,431,571
Total Europe 5,057,675 5,099,099 5,166,499 5,253,213 5,382,875 5,420,287 5,448,509 5,443,947 5,447,325 5,442,097
Table 3.3 : Yearly gas demand in the Region ( 2014 – 2023 projection )
Further elaborations on gas demand, including breakdown which might help to understand these trends, are reported in Chapter 4.
30 | South -North Corridor GRIP 2014 – 2023
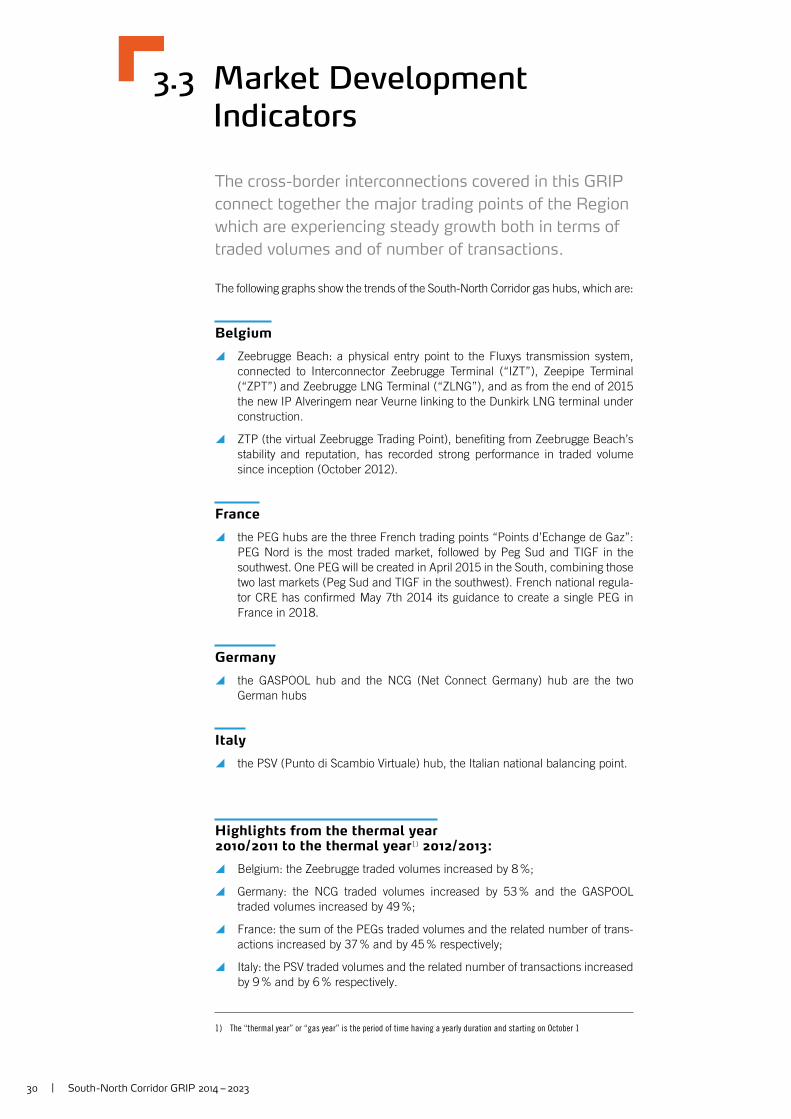
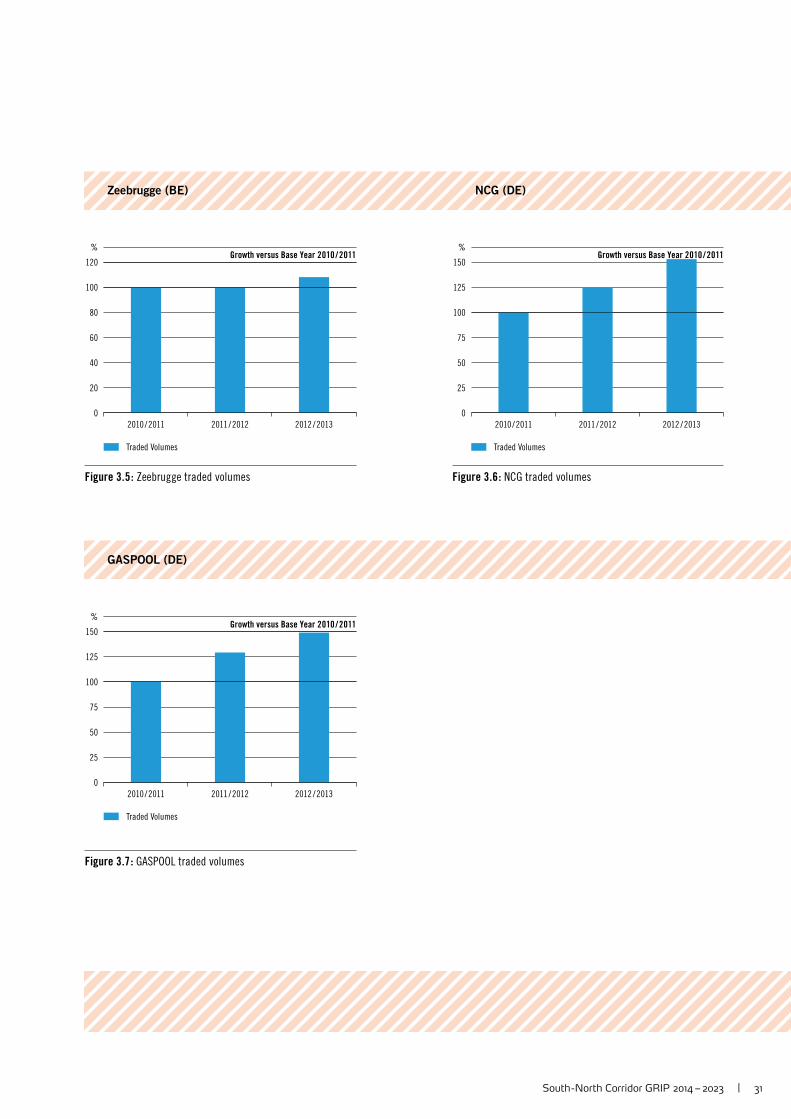
3.3 Market Development Indicators
The cross-border interconnections covered in this GRIP
connect together the major trading points of the Region
which are experiencing steady growth both in terms of
traded volumes and of number of transactions.
The following graphs show the trends of the South-North Corridor gas hubs, which are:
Belgium
y Zeebrugge Beach: a physical entry point to the Fluxys transmission system, connected to Interconnector Zeebrugge Terminal (“IZT”), Zeepipe Terminal (“ZPT”) and Zeebrugge LNG Terminal (“ZLNG”), and as from the end of 2015 the new IP Alveringem near Veurne linking to the Dunkirk LNG terminal under construction.
y ZTP (the virtual Zeebrugge Trading Point), benefi ting from Zeebrugge Beach’s stability and reputation, has recorded strong performance in traded volume since inception (October 2012).
France
y the PEG hubs are the three French trading points “Points d’Echange de Gaz”: PEG Nord is the most traded market, followed by Peg Sud and TIGF in the southwest. One PEG will be created in April 2015 in the South, combining those two last markets (Peg Sud and TIGF in the southwest). French national regula-tor CRE has confi rmed May 7th 2014 its guidance to create a single PEG in France in 2018.
Germany
y the GASPOOL hub and the NCG (Net Connect Germany) hub are the two German hubs
Italy
y the PSV (Punto di Scambio Virtuale) hub, the Italian national balancing point.
Highlights from the thermal year 2010/2011 to the thermal year1 ) 2012/2013:
y Belgium: the Zeebrugge traded volumes increased by 8 %;
y Germany: the NCG traded volumes increased by 53 % and the GASPOOL traded volumes increased by 49 %;
y France: the sum of the PEGs traded volumes and the related number of trans-actions increased by 37 % and by 45 % respectively;
y Italy: the PSV traded volumes and the related number of transactions increased by 9 % and by 6 % respectively.
1 ) The “thermal year” or “gas year” is the period of time having a yearly duration and starting on October 1
South -North Corridor GRIP 2014 – 2023 | 31
0
120
100
80
60
20
40
%
2010/2011 2011/2012 2012 /2013
Growth versus Base Year 2010 /2011
Traded Volumes
0
150
125
100
75
25
50
%
2010/2011 2011/2012 2012 /2013
Growth versus Base Year 2010 /2011
Traded Volumes
Figure 3.6 : NCG traded volumes
0
150
125
100
75
25
50
%
2010/2011 2011/2012 2012 /2013
Growth versus Base Year 2010 /2011
Traded Volumes
Figure 3.7 : GASPOOL traded volumes
Figure 3.5 : Zeebrugge traded volumes
Zeebrugge (BE) NCG (DE)
GASPOOL (DE)
32 | South -North Corridor GRIP 2014 – 2023
0
150
125
100
75
25
50
%
2010/2011 2011/2012 2012 /2013
Growth versus Base Year 2010 /2011
Traded Volumes Number of Trades
0
180
150
120
90
30
60
%
2010/2011 2011/2012 2012 /2013
Growth versus Base Year 2010 /2011
Traded Volumes Number of Trades
Figure 3.8 : PEG Nord traded volumes and transactions Figure 3.9 : PEG Sud traded volumes and transactions
0
200
150
100
50
%
2010/2011 2011/2012 2012 /2013
Growth versus Base Year 2010 /2011
Traded Volumes Number of Trades
0
120
100
80
60
20
40
%
2010/2011 2011/2012 2012 /2013
Growth versus Base Year 2010 /2011
Traded Volumes Number of Trades
Figure 3.10 : PEG TIGF traded volumes and transactions Figure 3.11 : PSV traded volumes and transactions
PEG NORD (FR) PEG SUD (FR)
PEG TIGF (FR) PSV (IT)
South -North Corridor GRIP 2014 – 2023 | 33
0
200
100
300
400
500
bcm
1999
2000
2001
2003
2002
2004
2005
2006
2007
2008
2009
2010
2011
CEGH
PSV
TTF
huberator
GRTgaz
GASPOOL
TIGF
NCG
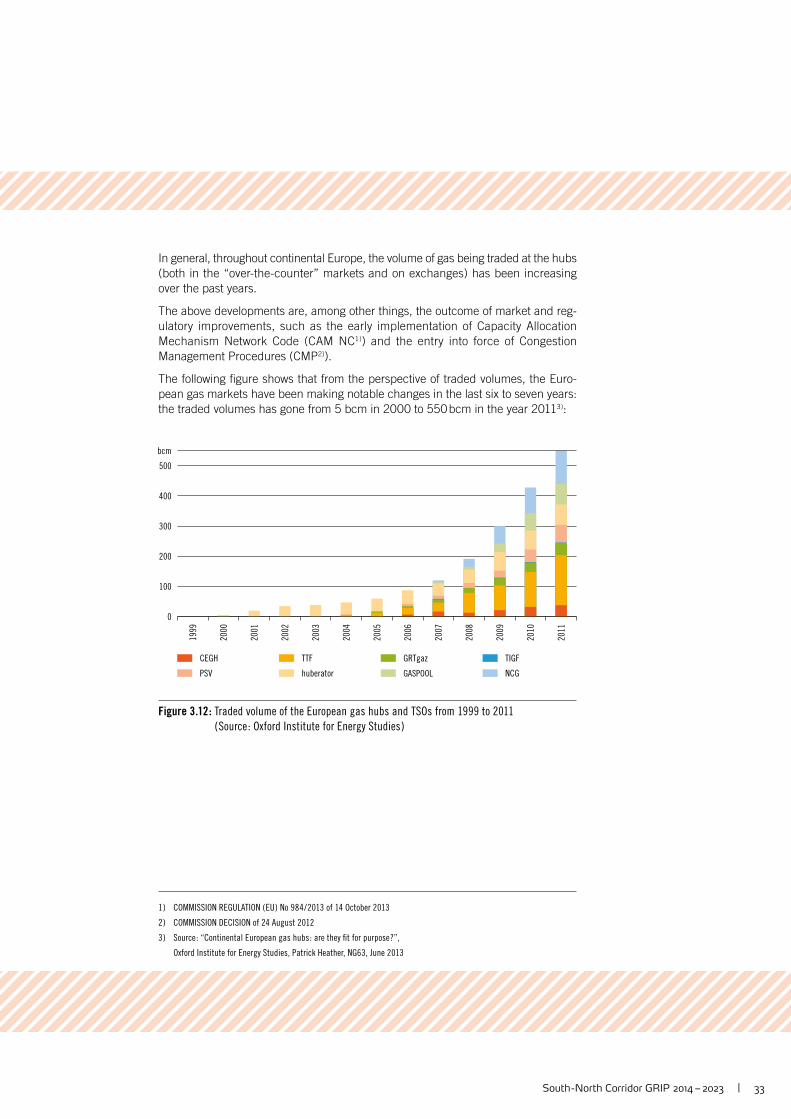
Figure 3.12 : Traded volume of the European gas hubs and TSOs from 1999 to 2011
( Source : Oxford Institute for Energy Studies )
In general, throughout continental Europe, the volume of gas being traded at the hubs (both in the “over-the-counter” markets and on exchanges) has been increasing over the past years.
The above developments are, among other things, the outcome of market and reg-ulatory improvements, such as the early implementation of Capacity Allocation Mechanism Network Code (CAM NC1 )) and the entry into force of Congestion Management Procedures (CMP2 )).
The following fi gure shows that from the perspective of traded volumes, the Euro-pean gas markets have been making notable changes in the last six to seven years: the traded volumes has gone from 5 bcm in 2000 to 550 bcm in the year 20113 ):
1 ) COMMISSION REGULATION ( EU ) No 984 / 2013 of 14 October 2013
2 ) COMMISSION DECISION of 24 August 2012
3 ) Source : “Continental European gas hubs : are they fi t for purpose ?”,
Oxford Institute for Energy Studies, Patrick Heather, NG63, June 2013

34 | South -North Corridor GRIP 2014 – 2023
Image courtesy of GRTgaz
3.4 Price Correlation
Price correlation of the European gas hubs is an impor-
tant factor because it may be an indication of the actual
integration of the related gas markets. Furthermore,
price correlation can be considered as one possible,
even if not exhaustive, indicator of competitiveness
and effi ciency of hub gas trading.
In fact, the prices of gas on the hubs are expected to tend uniformly in the absence of physical and / or regulatory barriers distortions and in the absence of other factors thwarting arbitrage and competition activities. Therefore, closely parallel price move-ments at the hubs indicate that hubs form a single well-integrated market.
Substantially, price correlation may be used as one of the factors indicating whether the hubs may be capable of giving a correct and reliable signal for setting the price of gas sold under long term contracts.
Furthermore, effi ciency and competitiveness in market pricing can take place only in the presence of hub price correlation.
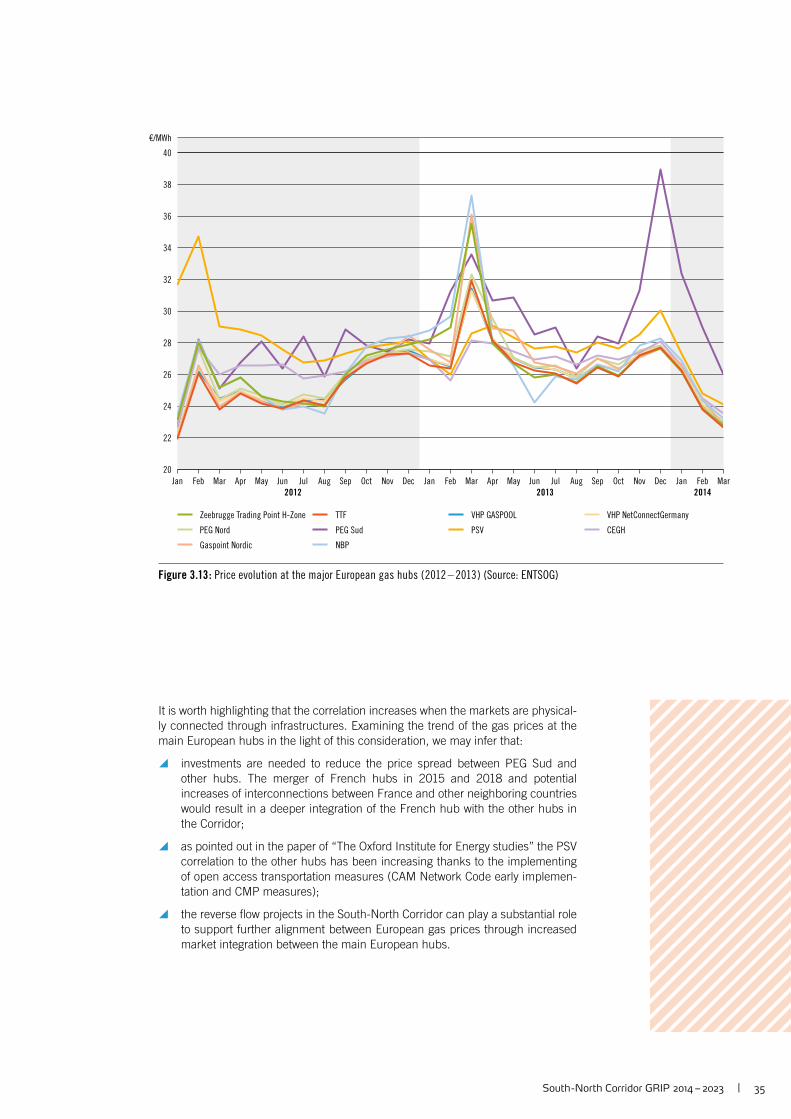
Figure 3.13 (source: ENTSOG) shows the day-ahead price average trends on the South-North Corridor hubs and some other important European hubs.
The assessment of hub price correlation leads to think that the European gas hubs form an integrated market and that the correlation among their prices may be the basis for a reliable gas price reference in Europe. This also suggests that EU gas hubs may represent a benchmark for gas pricing in Europe.
In fact, even if the EU gas hubs show different levels of liquidity, price correlation is high and, moreover, is getting higher and higher.
South -North Corridor GRIP 2014 – 2023 | 35
20
24
22
28
32
36
26
30
34
38
40
€/MWh
Jan Feb Mar Apr May Jun Jul Aug Sep Oct Nov Dec Jan Feb Mar Jan Feb MarApr May Jun Jul Aug Sep Oct Nov Dec
2012 20142013
Zeebrugge Trading Point H-Zone
PEG Nord
TTF
PEG Sud
VHP GASPOOL
PSV
VHP NetConnectGermany
CEGH
Gaspoint Nordic NBP
Figure 3.13 : Price evolution at the major European gas hubs ( 2012 – 2013 ) (Source: ENTSOG)
It is worth highlighting that the correlation increases when the markets are physical-ly connected through infrastructures. Examining the trend of the gas prices at the main European hubs in the light of this consideration, we may infer that:
y investments are needed to reduce the price spread between PEG Sud and other hubs. The merger of French hubs in 2015 and 2018 and potential increases of interconnections between France and other neighboring countries would result in a deeper integration of the French hub with the other hubs in the Corridor;
y as pointed out in the paper of “The Oxford Institute for Energy studies” the PSV correlation to the other hubs has been increasing thanks to the implementing of open access transportation measures (CAM Network Code early implemen-tation and CMP measures);
y the reverse fl ow projects in the South-North Corridor can play a substantial role to support further alignment between European gas prices through increased market integration between the main European hubs.
36 | South -North Corridor GRIP 2014 – 2023
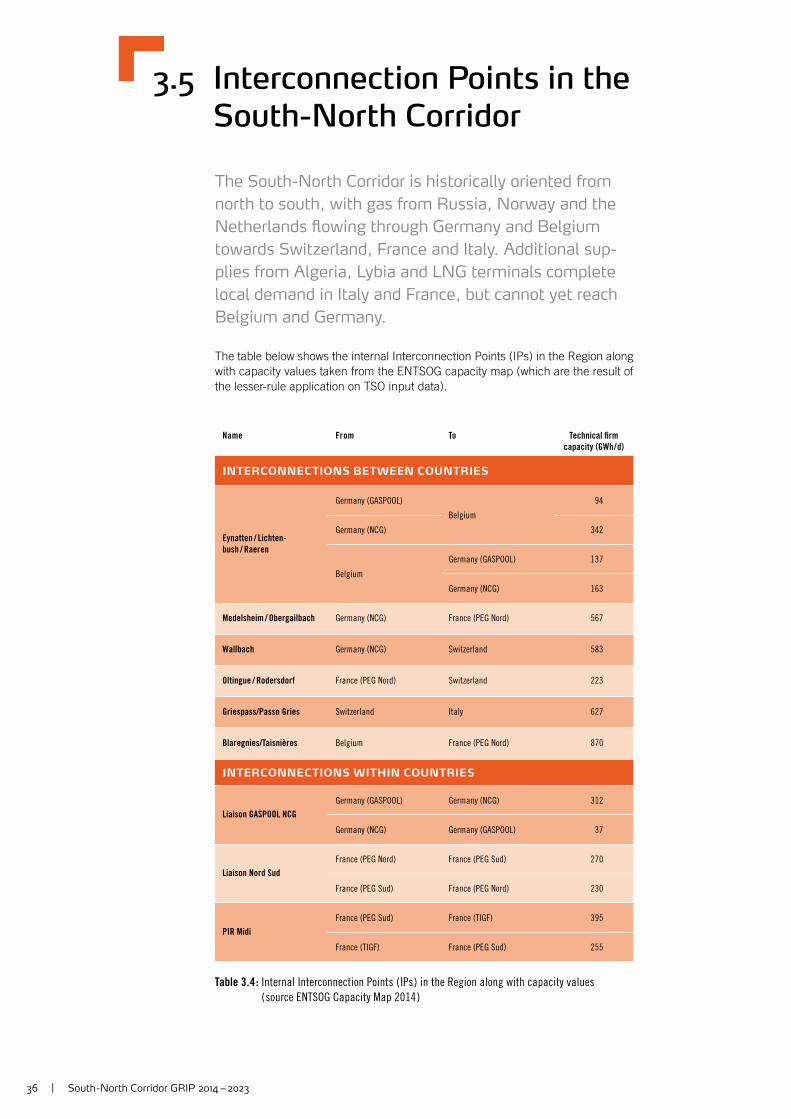
3.5 Interconnection Points in the South-North Corridor
The South-North Corridor is historically oriented from
north to south, with gas from Russia, Norway and the
Netherlands fl owing through Germany and Belgium
towards Switzerland, France and Italy. Additional sup-
plies from Algeria, Lybia and LNG terminals complete
local demand in Italy and France, but cannot yet reach
Belgium and Germany.
The table below shows the internal Interconnection Points (IPs) in the Region along with capacity values taken from the ENTSOG capacity map (which are the result of the lesser-rule application on TSO input data).
Name From To Technical fi rm
capacity (GWh / d)
INTERCONNECTIONS BETWEEN COUNTRIES
Eynatten / Lichten-
bush / Raeren
Germany (GASPOOL)
Belgium
94
Germany (NCG) 342
Belgium
Germany (GASPOOL) 137
Germany (NCG) 163
Medelsheim / Obergailbach Germany (NCG) France (PEG Nord) 567
Wallbach Germany (NCG) Switzerland 583
Oltingue / Rodersdorf France (PEG Nord) Switzerland 223
Griespass/Passo Gries Switzerland Italy 627
Blaregnies/Taisnières Belgium France (PEG Nord) 870
INTERCONNECTIONS WITHIN COUNTRIES
Liaison GASPOOL NCG
Germany (GASPOOL) Germany (NCG) 312
Germany (NCG) Germany (GASPOOL) 37
Liaison Nord Sud
France (PEG Nord) France (PEG Sud) 270
France (PEG Sud) France (PEG Nord) 230
PIR Midi
France (PEG Sud) France (TIGF) 395
France (TIGF) France (PEG Sud) 255
Table 3.4 : Internal Interconnection Points ( IPs ) in the Region along with capacity values
( source ENTSOG Capacity Map 2014 )
South -North Corridor GRIP 2014 – 2023 | 37
223
62739
2
255
230
640
270
230
312
37
94
137
342
163
567
583
H-gasL-gas
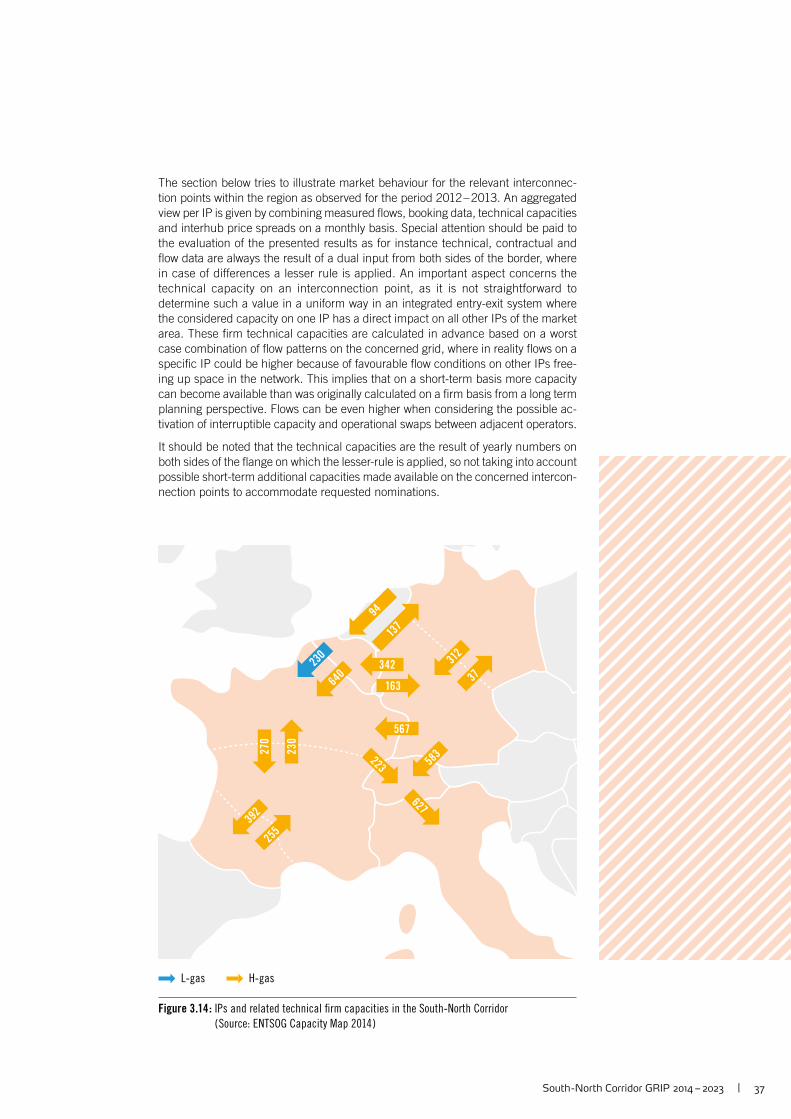
Figure 3.14 : IPs and related technical fi rm capacities in the South-North Corridor
( Source: ENTSOG Capacity Map 2014 )
The section below tries to illustrate market behaviour for the relevant interconnec-tion points within the region as observed for the period 2012 – 2013. An aggregated view per IP is given by combining measured fl ows, booking data, technical capacities and interhub price spreads on a monthly basis. Special attention should be paid to the evaluation of the presented results as for instance technical, contractual and fl ow data are always the result of a dual input from both sides of the border, where in case of differences a lesser rule is applied. An important aspect concerns the technical capacity on an interconnection point, as it is not straightforward to determine such a value in a uniform way in an integrated entry-exit system where the considered capacity on one IP has a direct impact on all other IPs of the market area. These fi rm technical capacities are calculated in advance based on a worst case combination of fl ow patterns on the concerned grid, where in reality fl ows on a specifi c IP could be higher because of favourable fl ow conditions on other IPs free-ing up space in the network. This implies that on a short-term basis more capacity can become available than was originally calculated on a fi rm basis from a long term planning perspective. Flows can be even higher when considering the possible ac-tivation of interruptible capacity and operational swaps between adjacent operators.
It should be noted that the technical capacities are the result of yearly numbers on both sides of the fl ange on which the lesser-rule is applied, so not taking into account possible short-term additional capacities made available on the concerned intercon-nection points to accommodate requested nominations.
38 | South -North Corridor GRIP 2014 – 2023
-300
-200
-100
0
100
200
300
400
GWh/d
-3
-2
-1
0
1
2
3
4
€/MWh
Jan MarFeb Apr May Jun Jul Aug Sep Oct Nov Dec Jan MarFeb Apr May Jun Jul Aug Sep Oct Nov Dec
2012 2013
-150
-75
0
150
300
375
75
225
GWh/d
-1.50
-0.75
0.75
0
1.50
3.00
2.25
3.75
€/MWh
Jan MarFeb Apr May Jun Jul Aug Sep Oct Nov Dec Jan MarFeb Apr May Jun Jul Aug Sep Oct Nov Dec
2012 2013
Daily Flow Range
Price Spread Zeebrugge – NCG (top) and Zeebrugge – GASPOOL (bottom)
Average Monthly Flow
Technical Firm Capacity
Booked Firm Capacity
Technical Firm Capacity Reverse
Booked Firm Capacity Reverse
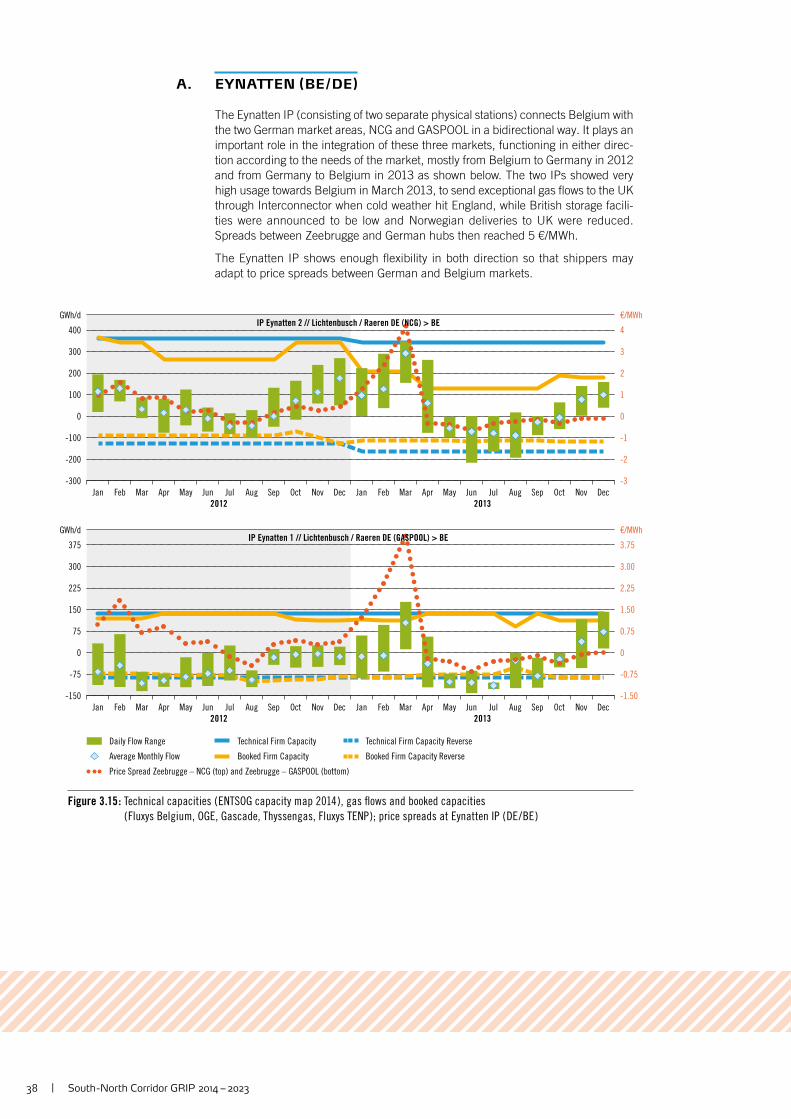
IP Eynatten 2 // Lichtenbusch / Raeren DE (NCG) > BE
IP Eynatten 1 // Lichtenbusch / Raeren DE (GASPOOL) > BE
Figure 3.15 : Technical capacities ( ENTSOG capacity map 2014 ), gas fl ows and booked capacities
( Fluxys Belgium, OGE, Gascade, Thyssengas, Fluxys TENP ); price spreads at Eynatten IP ( DE / BE )
A. EYNATTEN ( BE / DE )
The Eynatten IP (consisting of two separate physical stations) connects Belgium with the two German market areas, NCG and GASPOOL in a bidirectional way. It plays an important role in the integration of these three markets, functioning in either direc-tion according to the needs of the market, mostly from Belgium to Germany in 2012 and from Germany to Belgium in 2013 as shown below. The two IPs showed very high usage towards Belgium in March 2013, to send exceptional gas fl ows to the UK through Interconnector when cold weather hit England, while British storage facili-ties were announced to be low and Norwegian deliveries to UK were reduced. Spreads between Zeebrugge and German hubs then reached 5 €/MWh.
The Eynatten IP shows enough fl exibility in both direction so that shippers may adapt to price spreads between German and Belgium markets.
South -North Corridor GRIP 2014 – 2023 | 39
0
100
200
300
400
500
600
700
GWh/d
-4
-3
-2
-1
0
2
1
3
4
5
€/MWh
Jan MarFeb Apr May Jun Jul Aug Sep Oct Nov Dec Jan MarFeb Apr May Jun Jul Aug Sep Oct Nov Dec
2012 2013
IP Blaregnies / Taisnières (H) BE > FR
0
50
100
150
200
250
300
GWh/d
-4
-3
-2
-1
0
1
2
€/MWh
Jan MarFeb Apr May Jun Jul Aug Sep Oct Nov Dec Jan MarFeb Apr May Jun Jul Aug Sep Oct Nov Dec
2012 2013
IP Blaregnies / Taisnières (L) BE > FR
Daily Flow Range
Price Spread PEG Nord – Zeebrugge
Average Monthly Flow
Technical Firm Capacity
Booked Firm Capacity
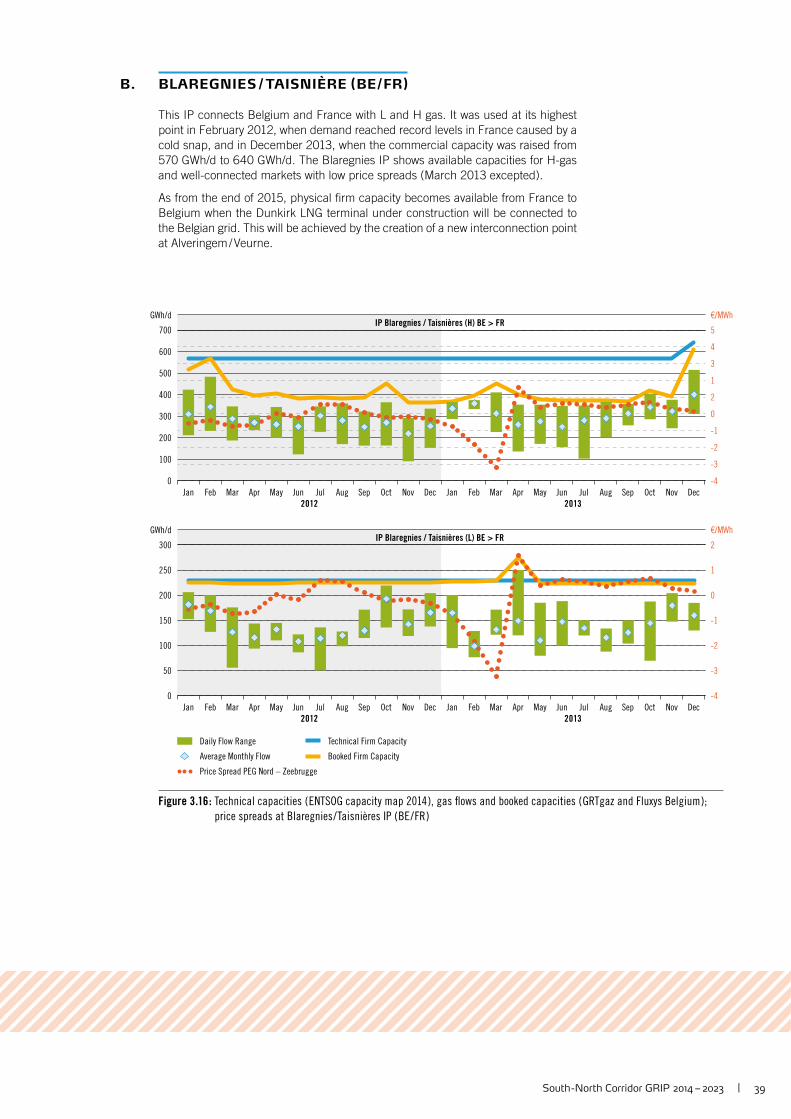
Figure 3.16 : Technical capacities ( ENTSOG capacity map 2014 ), gas fl ows and booked capacities ( GRTgaz and Fluxys Belgium );
price spreads at Blaregnies / Taisnières IP ( BE / FR )
B. BLAREGNIES / TAISNIÈRE ( BE / FR )
This IP connects Belgium and France with L and H gas. It was used at its highest point in February 2012, when demand reached record levels in France caused by a cold snap, and in December 2013, when the commercial capacity was raised from 570 GWh/d to 640 GWh/d. The Blaregnies IP shows available capacities for H-gas and well-connected markets with low price spreads (March 2013 excepted).
As from the end of 2015, physical fi rm capacity becomes available from France to Belgium when the Dunkirk LNG terminal under construction will be connected to the Belgian grid. This will be achieved by the creation of a new interconnection point at Alveringem / Veurne.
40 | South -North Corridor GRIP 2014 – 2023
0
200
400
600
800
GWh/d
-0.2
0
0.2
0.4
0.6
0.8
1.0
1.2
1.4
€/MWh
Jan MarFeb Apr May Jun Jul Aug Sep Oct Nov Dec Jan MarFeb Apr May Jun Jul Aug Sep Oct Nov Dec
2012 2013
IP Medelsheim / Obergailbach DE > FR
Daily Flow Range
Price Spread PEG Nord – NCG
Average Monthly Flow
Technical Firm Capacity
Booked Firm Capacity
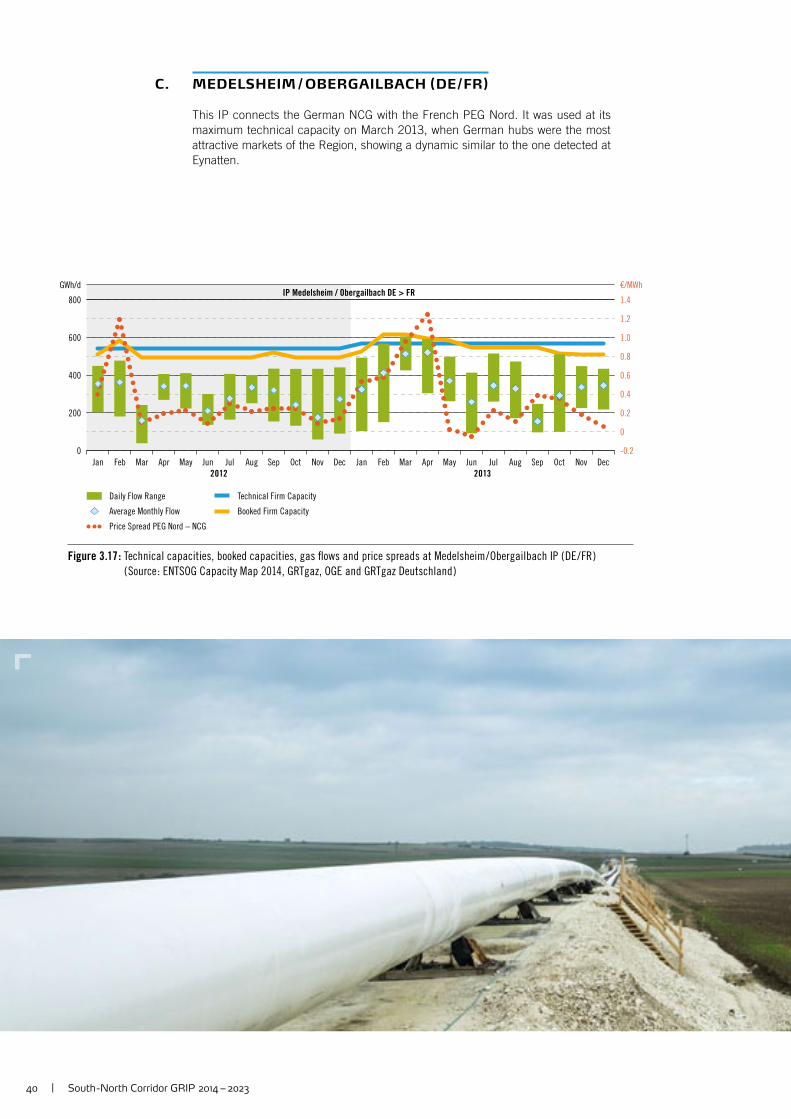
Figure 3.17 : Technical capacities, booked capacities, gas fl ows and price spreads at Medelsheim / Obergailbach IP ( DE / FR )
( Source : ENTSOG Capacity Map 2014, GRTgaz, OGE and GRTgaz Deutschland )
C. MEDELSHEIM / OBERGAILBACH ( DE / FR )
This IP connects the German NCG with the French PEG Nord. It was used at its maximum technical capacity on March 2013, when German hubs were the most attractive markets of the Region, showing a dynamic similar to the one detected at Eynatten.
South -North Corridor GRIP 2014 – 2023 | 41
0
50
100
150
200
250
300
GWh/d
-6
-2
2
6
10
€/MWh
Jan MarFeb Apr May Jun Jul Aug Sep Oct Nov Dec Jan MarFeb Apr May Jun Jul Aug Sep Oct Nov Dec
2012 2013
IP Oltingue / Rodersdorf FR > CH
Daily Flow Range
Price Spread PSV – PEG Nord
Average Monthly Flow
Technical Firm Capacity
Booked Firm Capacity
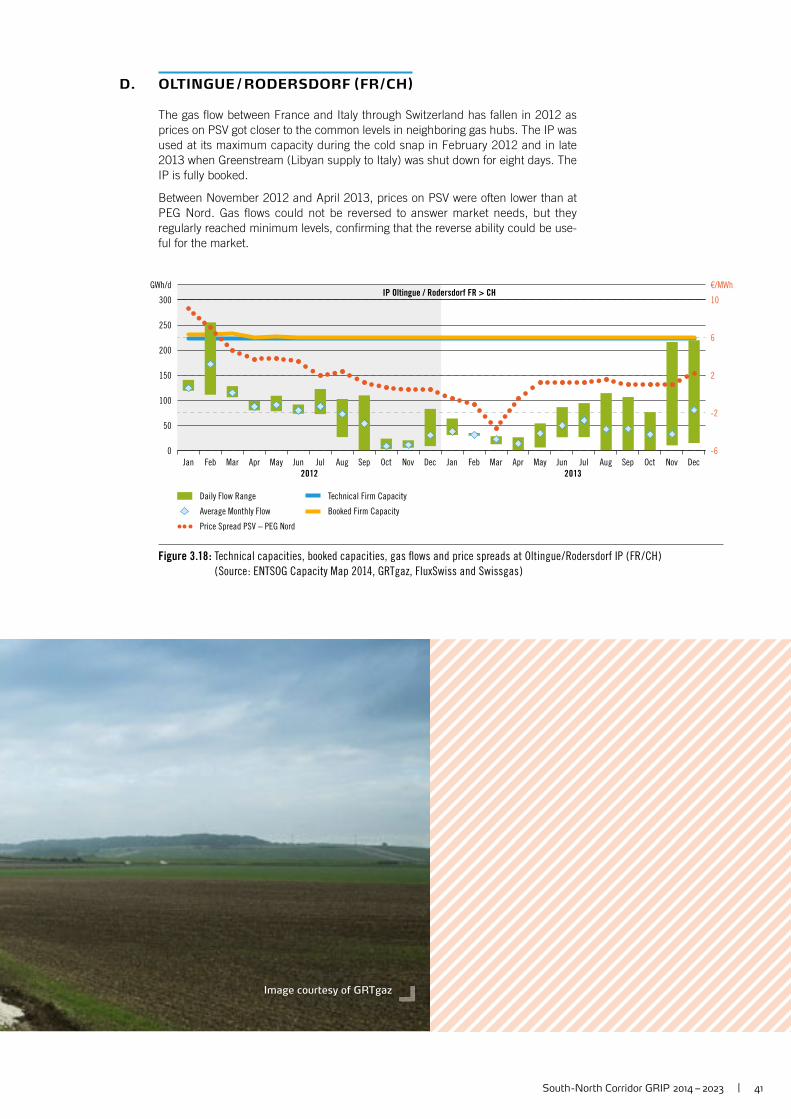
Figure 3.18 : Technical capacities, booked capacities, gas fl ows and price spreads at Oltingue / Rodersdorf IP ( FR / CH )
( Source : ENTSOG Capacity Map 2014, GRTgaz, FluxSwiss and Swissgas )
Image courtesy of GRTgaz
D. OLTINGUE / RODERSDORF ( FR / CH )
The gas fl ow between France and Italy through Switzerland has fallen in 2012 as prices on PSV got closer to the common levels in neighboring gas hubs. The IP was used at its maximum capacity during the cold snap in February 2012 and in late 2013 when Greenstream (Libyan supply to Italy) was shut down for eight days. The IP is fully booked.
Between November 2012 and April 2013, prices on PSV were often lower than at PEG Nord. Gas fl ows could not be reversed to answer market needs, but they regularly reached minimum levels, confi rming that the reverse ability could be use-ful for the market.
42 | South -North Corridor GRIP 2014 – 2023
0
100
200
300
400
500
600
700
GWh/d
-4
-2
0
2
4
6
8
10
12
€/MWh
Jan MarFeb Apr May Jun Jul Aug Sep Oct Nov Dec Jan MarFeb Apr May Jun Jul Aug Sep Oct Nov Dec
2012 2013
IP Wallbach DE > CH
Daily Flow Range
Price Spread PSV – NCG
Average Monthly Flow
Technical Firm Capacity
Booked Firm Capacity
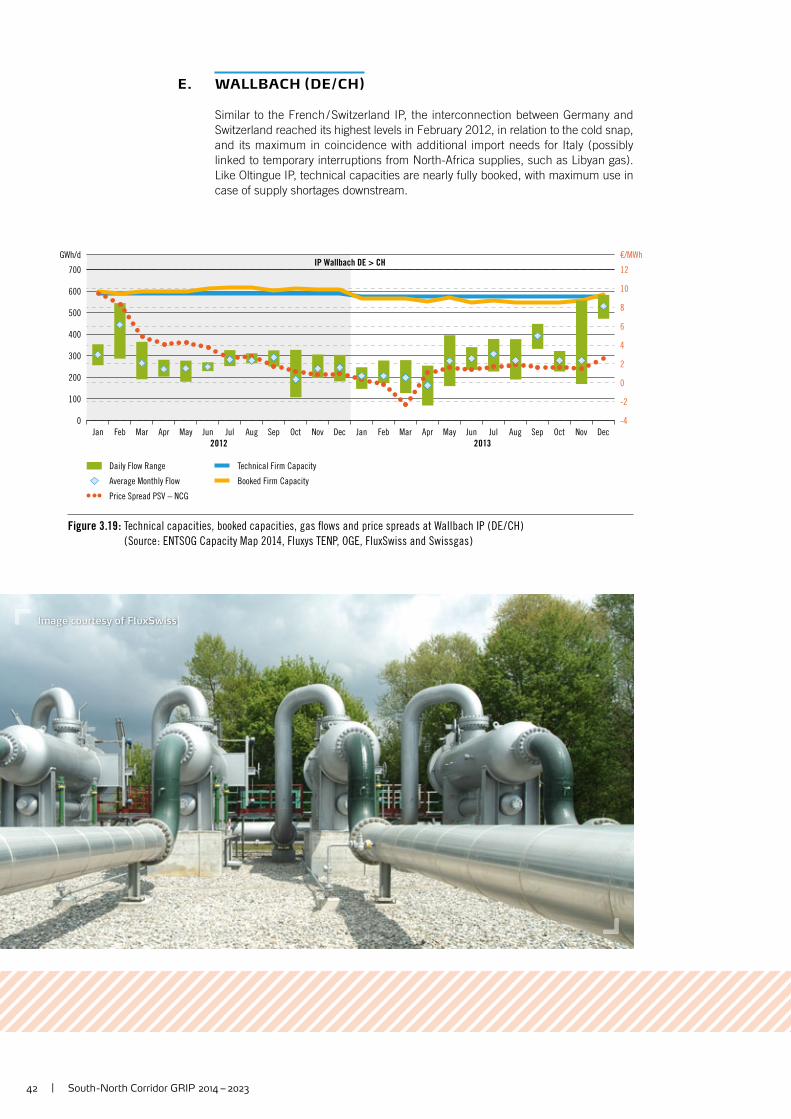
Figure 3.19 : Technical capacities, booked capacities, gas fl ows and price spreads at Wallbach IP ( DE / CH )
( Source : ENTSOG Capacity Map 2014, Fluxys TENP, OGE, FluxSwiss and Swissgas )
Image courtesy of FluxSwiss
E. WALLBACH ( DE / CH )
Similar to the French / Switzerland IP, the interconnection between Germany and Switzerland reached its highest levels in February 2012, in relation to the cold snap, and its maximum in coincidence with additional import needs for Italy (possibly linked to temporary interruptions from North-Africa supplies, such as Libyan gas). Like Oltingue IP, technical capacities are nearly fully booked, with maximum use in case of supply shortages downstream.
South -North Corridor GRIP 2014 – 2023 | 43
0
100
200
300
400
500
600
700
GWh/d
-4
-2
0
2
4
6
8
10
€/MWh
Jan MarFeb Apr May Jun Jul Aug Sep Oct Nov Dec Jan MarFeb Apr May Jun Jul Aug Sep Oct Nov Dec
2012 2013
IP Griespass / Passo Gries CH > IT
Daily Flow Range
Price Spread PSV – NCG
Average Monthly Flow
Technical Firm Capacity
Booked Firm Capacity
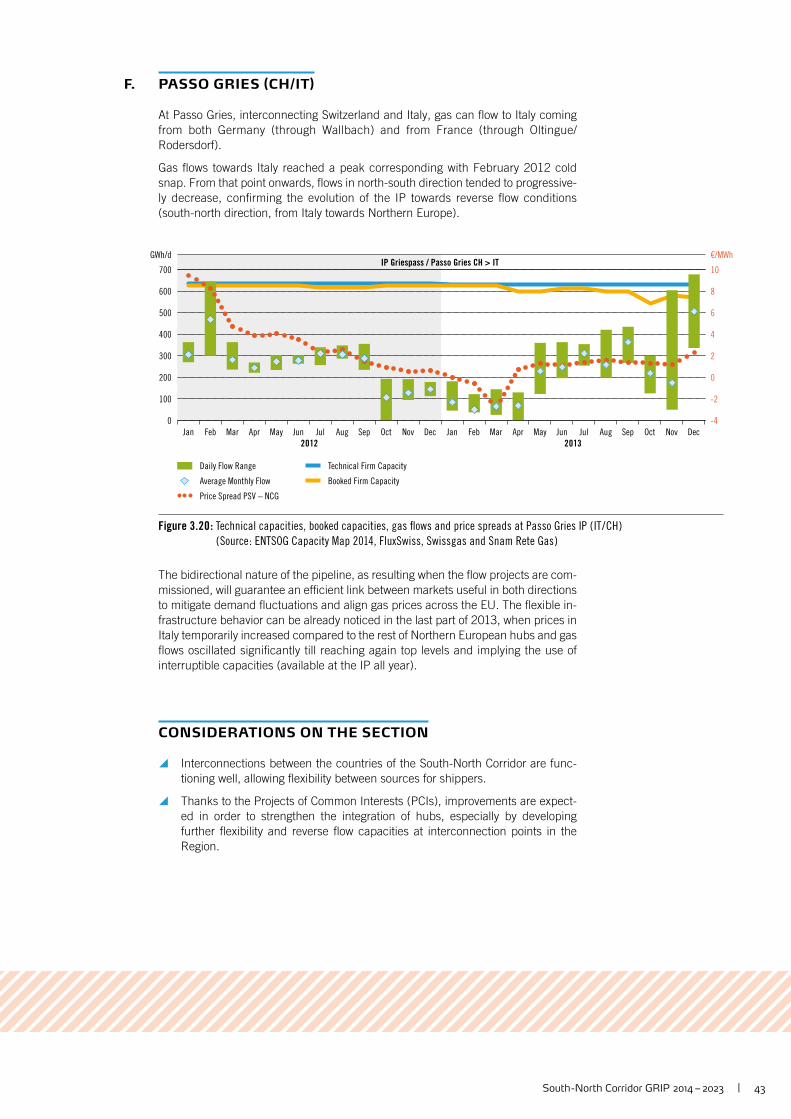
Figure 3.20 : Technical capacities, booked capacities, gas fl ows and price spreads at Passo Gries IP ( IT / CH )
( Source : ENTSOG Capacity Map 2014, FluxSwiss, Swissgas and Snam Rete Gas )
F. PASSO GRIES (CH/IT)
At Passo Gries, interconnecting Switzerland and Italy, gas can fl ow to Italy coming from both Germany (through Wallbach) and from France (through Oltingue/Rodersdorf).
Gas fl ows towards Italy reached a peak corresponding with February 2012 cold snap. From that point onwards, fl ows in north-south direction tended to progressive-ly decrease, confi rming the evolution of the IP towards reverse fl ow conditions (south-north direction, from Italy towards Northern Europe).
The bidirectional nature of the pipeline, as resulting when the fl ow projects are com-missioned, will guarantee an effi cient link between markets useful in both directions to mitigate demand fl uctuations and align gas prices across the EU. The fl exible in-frastructure behavior can be already noticed in the last part of 2013, when prices in Italy temporarily increased compared to the rest of Northern European hubs and gas fl ows oscillated signifi cantly till reaching again top levels and implying the use of interruptible capacities (available at the IP all year).
CONSIDERATIONS ON THE SECTION
y Interconnections between the countries of the South-North Corridor are func-tioning well, allowing fl exibility between sources for shippers.
y Thanks to the Projects of Common Interests (PCIs), improvements are expect-ed in order to strengthen the integration of hubs, especially by developing further fl exibility and reverse fl ow capacities at interconnection points in the Region.
Image courtesy of FluxSwiss
Gas-Electricity Links :
Current Power Generation Environment
Forecast of installed capacity and gas demand for power
generation
The Impact of Renewables on Gas Demand in the Countries
of the South-North Corridor
South -North Corridor GRIP 2014 – 2023 | 45
0
250000
200000
150000
100000
50000
MW el.
2013
2014
2016
2015
2017
2018
2019
2020
2021
2023
2022
Switzerland
Belgium
France
Italy
Germany
Other Europe
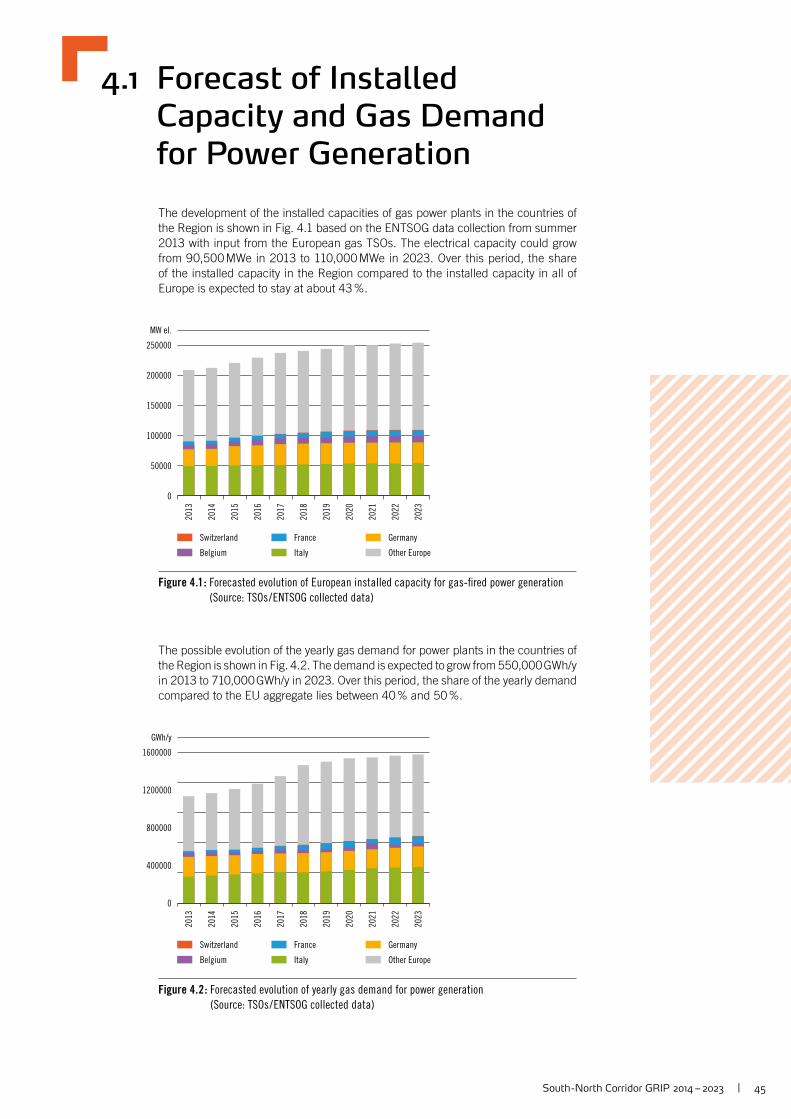
Figure 4.1 : Forecasted evolution of European installed capacity for gas-fi red power generation
(Source: TSOs / ENTSOG collected data)
0
1600000
1200000
800000
400000
GWh/y
2013
2014
2016
2015
2017
2018
2019
2020
2021
2023
2022
Switzerland
Belgium
France
Italy
Germany
Other Europe
Figure 4.2 : Forecasted evolution of yearly gas demand for power generation
(Source: TSOs / ENTSOG collected data)
4.1 Forecast of Installed Capacity and Gas Demand for Power Generation
The development of the installed capacities of gas power plants in the countries of the Region is shown in Fig. 4.1 based on the ENTSOG data collection from summer 2013 with input from the European gas TSOs. The electrical capacity could grow from 90,500 MWe in 2013 to 110,000 MWe in 2023. Over this period, the share of the installed capacity in the Region compared to the installed capacity in all of Europe is expected to stay at about 43 %.
The possible evolution of the yearly gas demand for power plants in the countries of the Region is shown in Fig. 4.2. The demand is expected to grow from 550,000 GWh/y in 2013 to 710,000 GWh/y in 2023. Over this period, the share of the yearly demand compared to the EU aggregate lies between 40 % and 50 %.

46 | South -North Corridor GRIP 2014 – 2023
Image courtesy of Snam Rete Gas
As witnessed by the comparison of power generation landscapes in the countries of the Region (following sections from 3.1.1 to 3.1.5), the current levels of gas prices compared to other sources (especially coal), combined with incentives granted to RES, make it very hard for gas power plants to stay competitive. The number of func-tioning hours has progressively reduced in the last few years and this has negatively affected the gas demand for power generation.
This negative trend, also worsened by the economic crisis effects, should be hope-fully inverted in the next years thanks to the implementation of positive elements such as:
y a more effective EU Emissions Trading Scheme, destined to correctly pricing negative coal environmental impacts;
y a rescaling of subsidies for RES technologies in accordance with their maturity, possibly complemented by the use of freed-up resources for capacity remuner-a tion measures, targeted to those gas-fi red plants needed to back up renewa-bles sources.
The above mentioned initiatives could help to explain the only apparent discrepan-cy between historically observed decreasing fi gures and the positive forecasts included in this section.
While the demand for power generation is expected to grow from 550,000 GWh/y in 2013 to 710,000 GWh/y in 2023, other types of gas demand are expected to shrink from about 1,800,000 GWh/y in 2013 to about 1,700,000 GWh/y in 2023. This leads to a growth of the share of gas used for power generation from 23 % to 30 %, showing an expected leading role for gas in this domain. The rationales be-hind this expectation are further elaborated in the following sections of this Chapter.
South -North Corridor GRIP 2014 – 2023 | 47
0
2000
1600
1200
800
400
GWh/d
2013
2014
2016
2015
2017
2018
2019
2020
2021
2023
2022
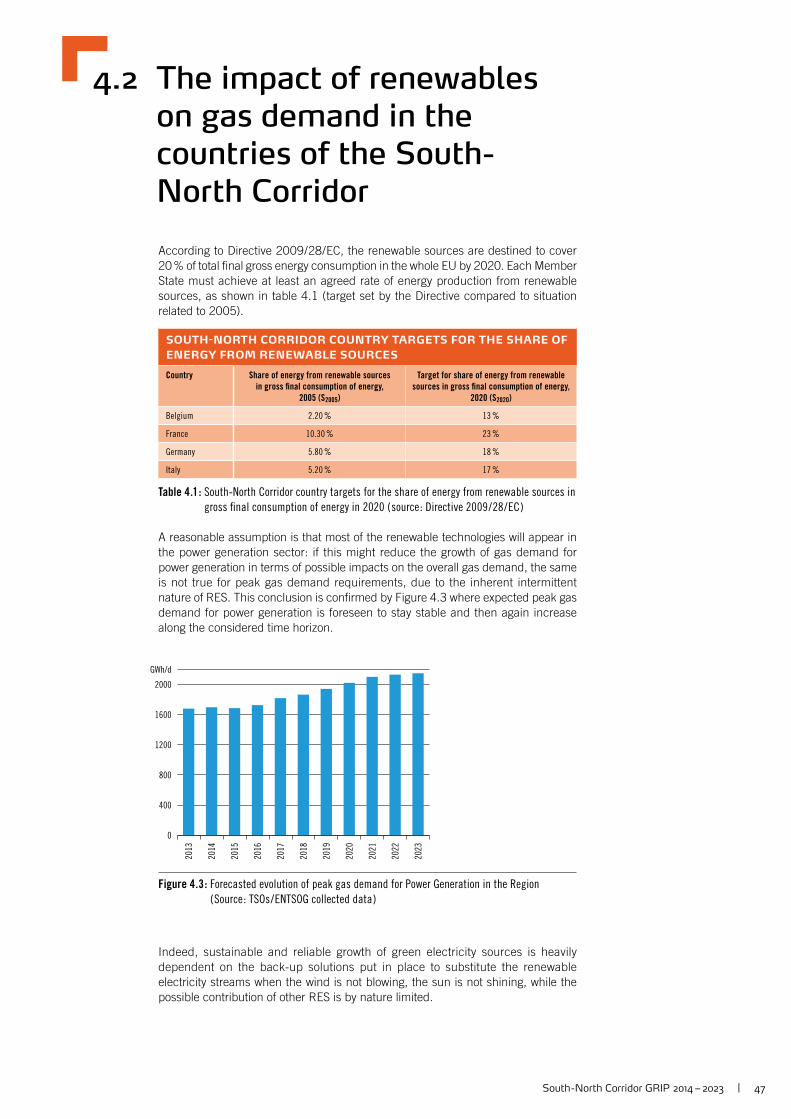
Figure 4.3 : Forecasted evolution of peak gas demand for Power Generation in the Region
( Source : TSOs / ENTSOG collected data )
4.2 The impact of renewables on gas demand in the countries of the South-North Corridor
According to Directive 2009 / 28 / EC, the renewable sources are destined to cover 20 % of total fi nal gross energy consumption in the whole EU by 2020. Each Member State must achieve at least an agreed rate of energy production from renewable sources, as shown in table 4.1 (target set by the Directive compared to situation related to 2005).
SOUTH-NORTH CORRIDOR COUNTRY TARGETS FOR THE SHARE OF
ENERGY FROM RENEWABLE SOURCES
Country Share of energy from renewable sources
in gross fi nal consumption of energy,
2005 (S2005)
Target for share of energy from renewable
sources in gross fi nal consumption of energy,
2020 (S2020)
Belgium 2.20 % 13 %
France 10.30 % 23 %
Germany 5.80 % 18 %
Italy 5.20 % 17 %
Table 4.1 : South-North Corridor country targets for the share of energy from renewable sources in
gross fi nal consumption of energy in 2020 ( source : Directive 2009 / 28 / EC )
A reasonable assumption is that most of the renewable technologies will appear in the power generation sector: if this might reduce the growth of gas demand for power generation in terms of possible impacts on the overall gas demand, the same is not true for peak gas demand requirements, due to the inherent intermittent nature of RES. This conclusion is confi rmed by Figure 4.3 where expected peak gas demand for power generation is foreseen to stay stable and then again increase along the considered time horizon.
Indeed, sustainable and reliable growth of green electricity sources is heavily dependent on the back-up solutions put in place to substitute the renewable electricity streams when the wind is not blowing, the sun is not shining, while the possible contribution of other RES is by nature limited.
48 | South -North Corridor GRIP 2014 – 2023
0
160
120
80
40
mcm/d
Oct Nov Dec Jan Feb Mar Apr May Jul Aug SepJun Oct
2012 2030
Gas demand for power generation in Germany
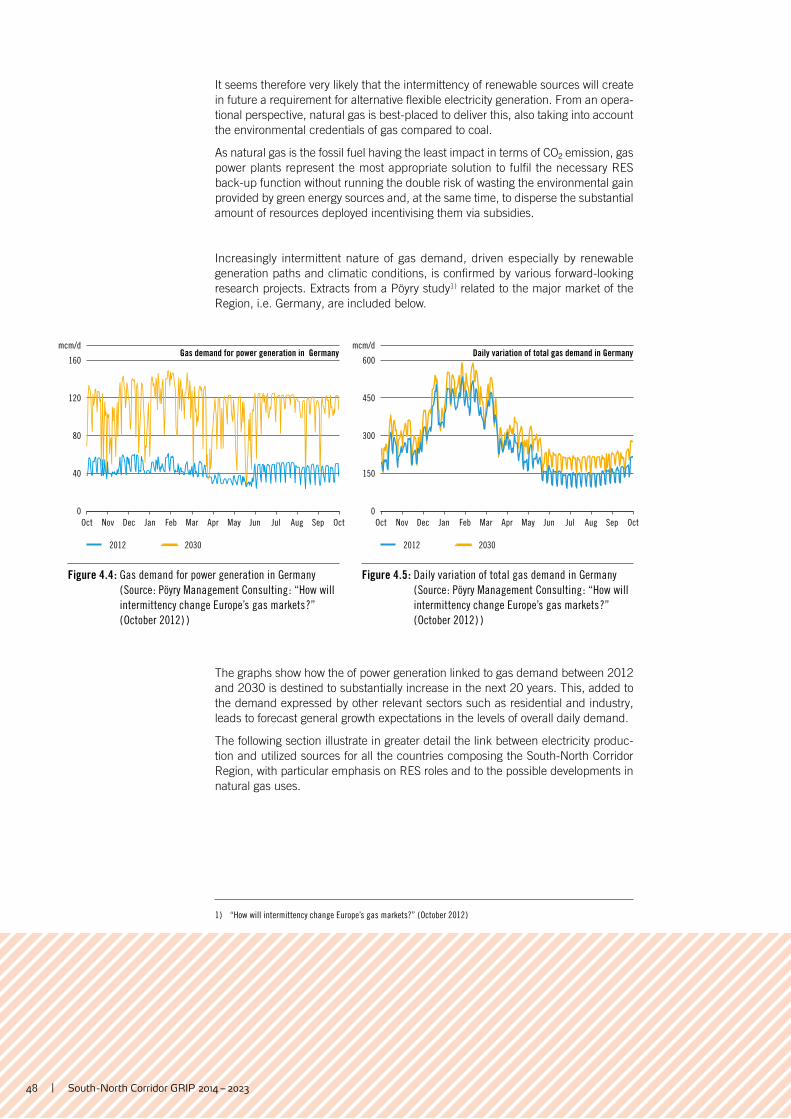
Figure 4.4 : Gas demand for power generation in Germany
( Source : Pöyry Management Consulting : “How will
intermittency change Europe’s gas markets ?”
( October 2012 ) )
0
600
450
300
150
mcm/d
Oct Nov Dec Jan Feb Mar Apr May Jul Aug SepJun Oct
2012 2030
Daily variation of total gas demand in Germany
Figure 4.5 : Daily variation of total gas demand in Germany
( Source : Pöyry Management Consulting : “How will
intermittency change Europe’s gas markets ?”
( October 2012 ) )
It seems therefore very likely that the intermittency of renewable sources will create in future a requirement for alternative fl exible electricity generation. From an opera-tional perspective, natural gas is best-placed to deliver this, also taking into account the environmental credentials of gas compared to coal.
As natural gas is the fossil fuel having the least impact in terms of CO² emission, gas power plants represent the most appropriate solution to fulfi l the necessary RES back-up function without running the double risk of wasting the environmental gain provided by green energy sources and, at the same time, to disperse the substantial amount of resources deployed incentivising them via subsidies.
Increasingly intermittent nature of gas demand, driven especially by renewable generation paths and climatic conditions, is confi rmed by various forward-looking research projects. Extracts from a Pöyry study1 ) related to the major market of the Region, i.e. Germany, are included below.
The graphs show how the of power generation linked to gas demand between 2012 and 2030 is destined to substantially increase in the next 20 years. This, added to the demand expressed by other relevant sectors such as residential and industry, leads to forecast general growth expectations in the levels of overall daily demand.
The following section illustrate in greater detail the link between electricity produc-tion and utilized sources for all the countries composing the South-North Corridor Region, with particular emphasis on RES roles and to the possible developments in natural gas uses.
1 ) “How will intermittency change Europe’s gas markets?” ( October 2012 )
South -North Corridor GRIP 2014 – 2023 | 49
0
80000
60000
40000
20000
GWh/y
2009 2010 2011 2012
Nuclear
Natural Gas
Solids
Other fossil fuels
Hydro Wind
Solar Oil
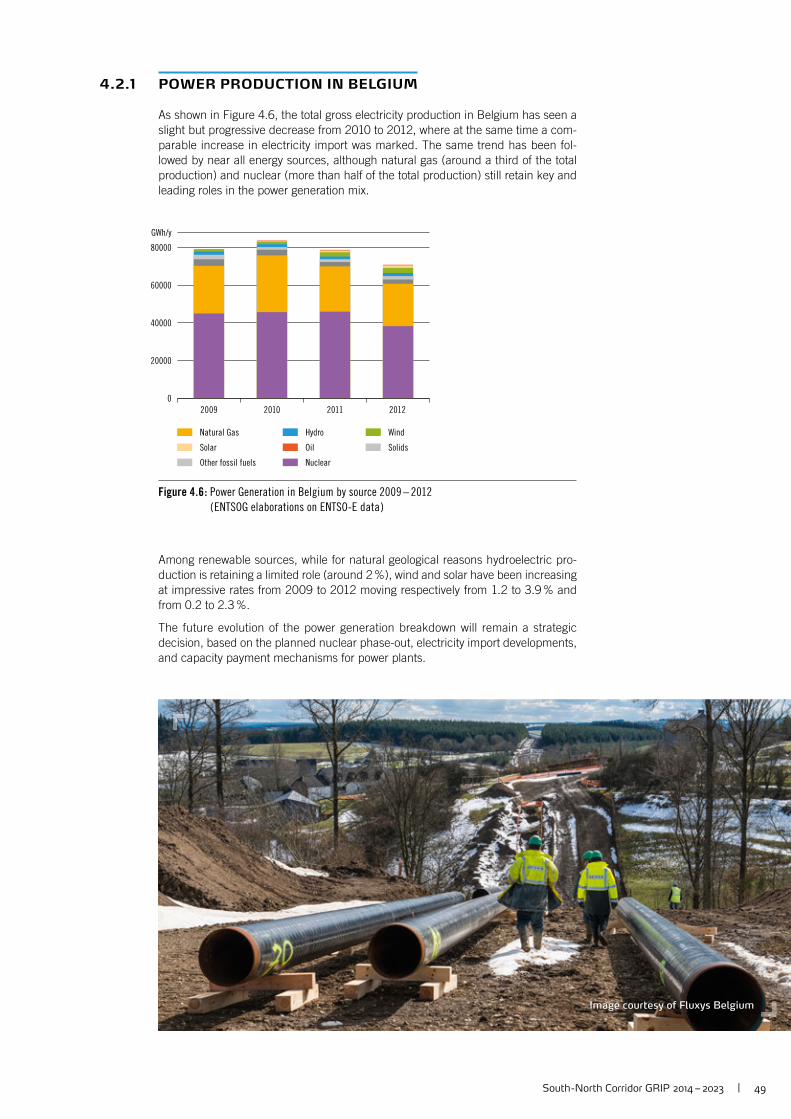
Figure 4.6 : Power Generation in Belgium by source 2009 – 2012
( ENTSOG elaborations on ENTSO-E data )
Image courtesy of Fluxys Belgium
4.2.1 POWER PRODUCTION IN BELGIUM
As shown in Figure 4.6, the total gross electricity production in Belgium has seen a slight but progressive decrease from 2010 to 2012, where at the same time a com-parable increase in electricity import was marked. The same trend has been fol-lowed by near all energy sources, although natural gas (around a third of the total production) and nuclear (more than half of the total production) still retain key and leading roles in the power generation mix.
Among renewable sources, while for natural geological reasons hydroelectric pro-duction is retaining a limited role (around 2 %), wind and solar have been in creasing at impressive rates from 2009 to 2012 moving respectively from 1.2 to 3.9 % and from 0.2 to 2.3 %.
The future evolution of the power generation breakdown will remain a strategic decision, based on the planned nuclear phase-out, electricity import developments, and capacity payment mechanisms for power plants.
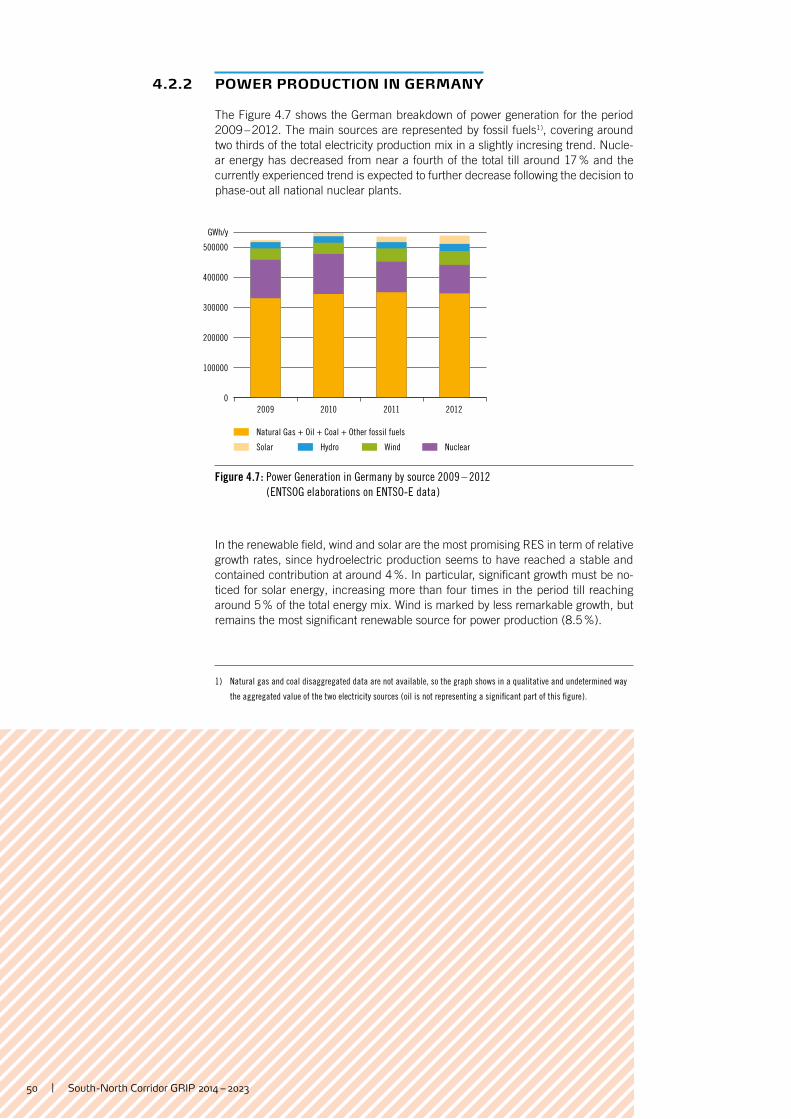
50 | South -North Corridor GRIP 2014 – 2023
0
500000
400000
300000
200000
100000
GWh/y
2009 2010 2011 2012
Nuclear
Natural Gas + Oil + Coal + Other fossil fuels
Hydro WindSolar
Figure 4.7 : Power Generation in Germany by source 2009 – 2012
( ENTSOG elaborations on ENTSO-E data )
4.2.2 POWER PRODUCTION IN GERMANY
The Figure 4.7 shows the German breakdown of power generation for the period 2009 – 2012. The main sources are represented by fossil fuels1 ), covering around two thirds of the total electricity production mix in a slightly incresing trend. Nucle-ar energy has decreased from near a fourth of the total till around 17 % and the currently experienced trend is expected to further decrease following the decision to phase-out all national nuclear plants.
In the renewable fi eld, wind and solar are the most promising RES in term of relative growth rates, since hydroelectric production seems to have reached a stable and contained contribution at around 4 %. In particular, signifi cant growth must be no-ticed for solar energy, increasing more than four times in the period till reaching around 5 % of the total energy mix. Wind is marked by less remarkable growth, but remains the most signifi cant renewable source for power production (8.5 %).
1 ) Natural gas and coal disaggregated data are not available, so the graph shows in a qualitative and undetermined way
the aggregated value of the two electricity sources ( oil is not representing a signifi cant part of this fi gure ).
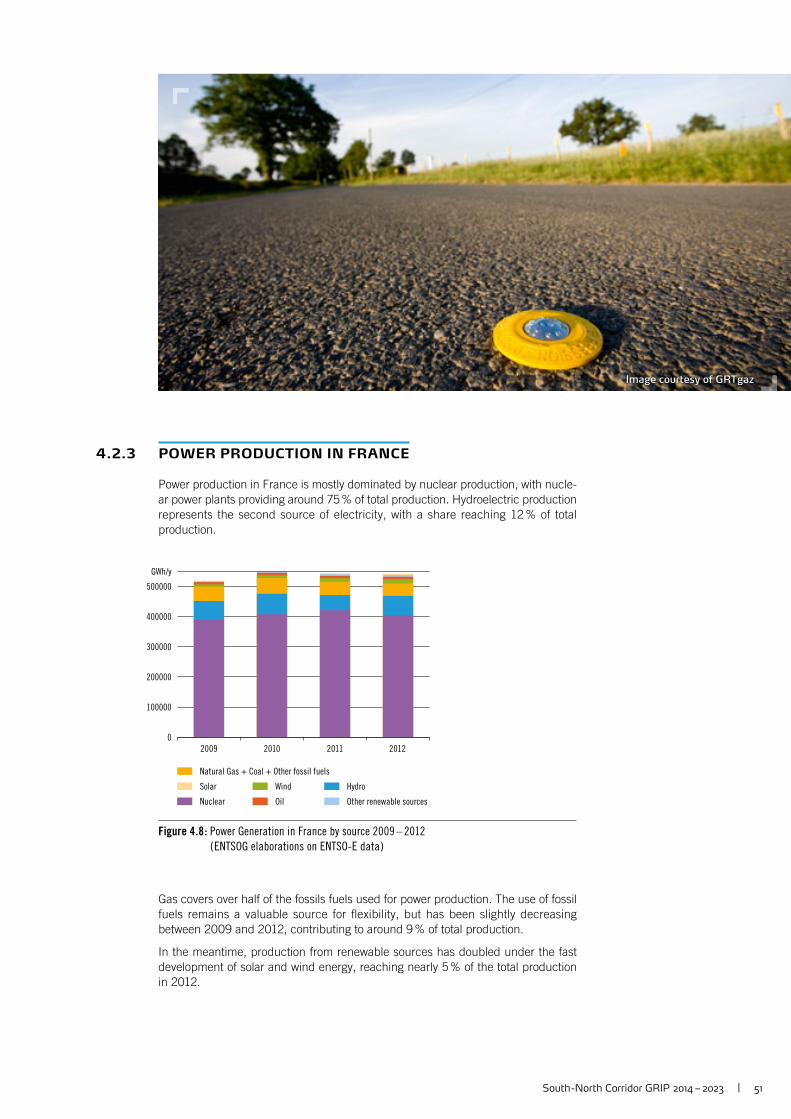
South -North Corridor GRIP 2014 – 2023 | 51
0
500000
400000
300000
200000
100000
GWh/y
2009 2010 2011 2012
Nuclear
Natural Gas + Coal + Other fossil fuels
Wind Hydro
Other renewable sources
Solar
Oil
Figure 4.8 : Power Generation in France by source 2009 – 2012
( ENTSOG elaborations on ENTSO-E data )
Image courtesy of GRTgaz
4.2.3 POWER PRODUCTION IN FRANCE
Power production in France is mostly dominated by nuclear production, with nucle-ar power plants providing around 75 % of total production. Hydroelectric production represents the second source of electricity, with a share reaching 12 % of total production.
Gas covers over half of the fossils fuels used for power production. The use of fossil fuels remains a valuable source for fl exibility, but has been slightly decreasing between 2009 and 2012, contributing to around 9 % of total production.
In the meantime, production from renewable sources has doubled under the fast development of solar and wind energy, reaching nearly 5 % of the total production in 2012.
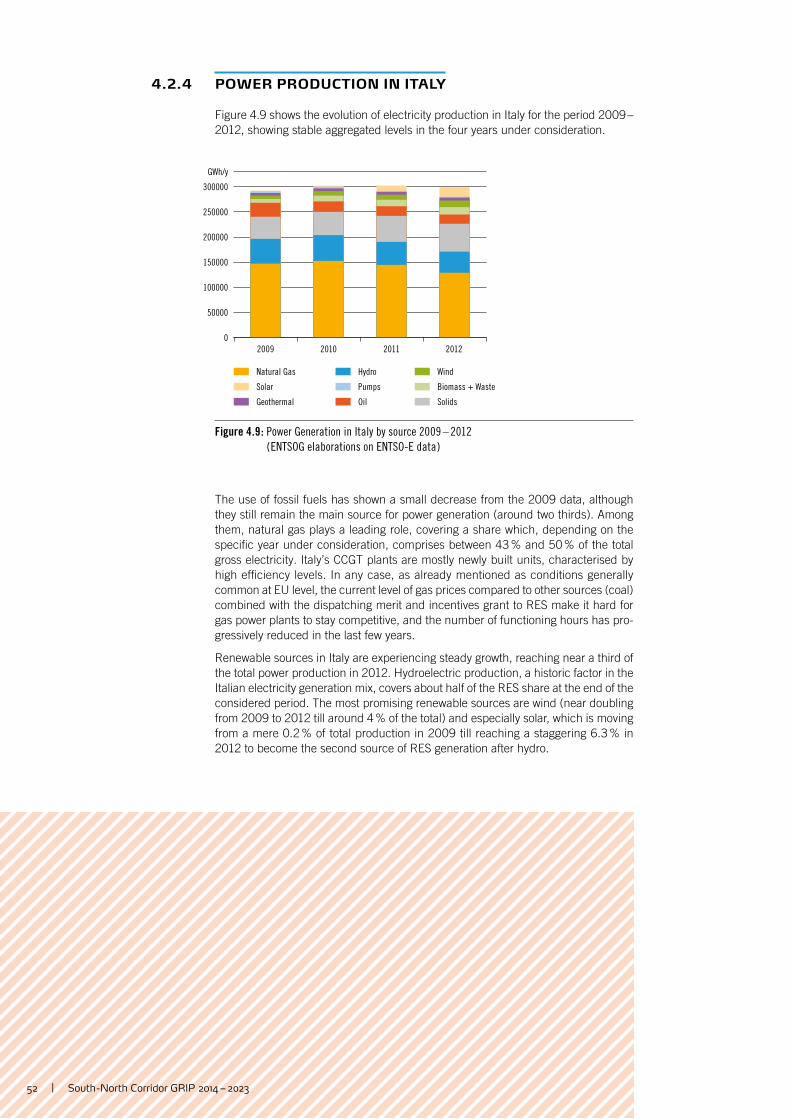
52 | South -North Corridor GRIP 2014 – 2023
0
300000
200000
250000
100000
150000
50000
GWh/y
2009 2010 2011 2012
SolidsOil
Natural Gas Hydro
Pumps
Wind
Solar
Geothermal
Biomass + Waste
Figure 4.9 : Power Generation in Italy by source 2009 – 2012
( ENTSOG elaborations on ENTSO-E data )
4.2.4 POWER PRODUCTION IN ITALY
Figure 4.9 shows the evolution of electricity production in Italy for the period 2009 – 2012, showing stable aggregated levels in the four years under consideration.
The use of fossil fuels has shown a small decrease from the 2009 data, although they still remain the main source for power generation (around two thirds). Among them, natural gas plays a leading role, covering a share which, depending on the specifi c year under consideration, comprises between 43 % and 50 % of the total gross electricity. Italy’s CCGT plants are mostly newly built units, characterised by high effi ciency levels. In any case, as already mentioned as conditions generally common at EU level, the current level of gas prices compared to other sources (coal) combined with the dispatching merit and incentives grant to RES make it hard for gas power plants to stay competitive, and the number of functioning hours has pro-gressively reduced in the last few years.
Renewable sources in Italy are experiencing steady growth, reaching near a third of the total power production in 2012. Hydroelectric production, a historic factor in the Italian electricity generation mix, covers about half of the RES share at the end of the considered period. The most promising renewable sources are wind (near doubling from 2009 to 2012 till around 4 % of the total) and especially solar, which is moving from a mere 0.2 % of total production in 2009 till reaching a staggering 6.3 % in 2012 to become the second source of RES generation after hydro.
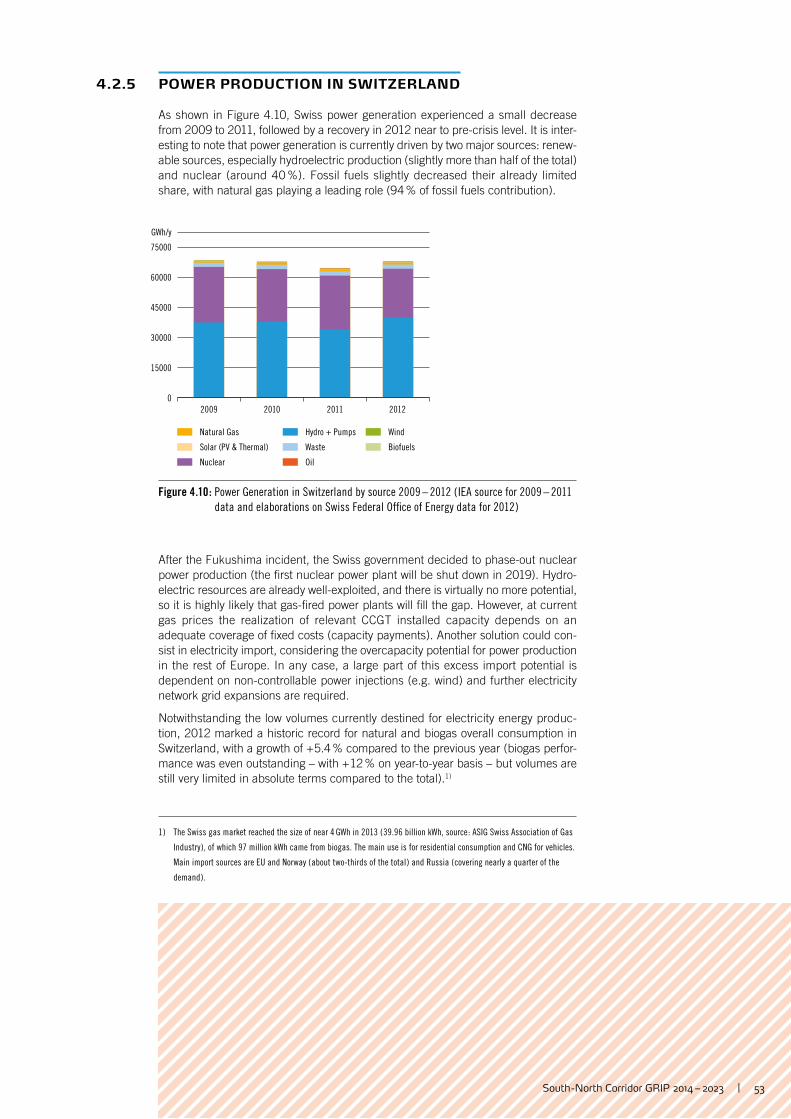
South -North Corridor GRIP 2014 – 2023 | 53
0
75000
60000
45000
30000
15000
GWh/y
2009 2010 2011 2012
Natural Gas Hydro + Pumps
Waste
Wind
BiofuelsSolar (PV & Thermal)
Nuclear Oil
Figure 4.10 : Power Generation in Switzerland by source 2009 – 2012 ( IEA source for 2009 – 2011
data and elaborations on Swiss Federal Offi ce of Energy data for 2012 )
4.2.5 POWER PRODUCTION IN SWITZERLAND
As shown in Figure 4.10, Swiss power generation experienced a small decrease from 2009 to 2011, followed by a recovery in 2012 near to pre-crisis level. It is inter-esting to note that power generation is currently driven by two major sources: renew-able sources, especially hydroelectric production (slightly more than half of the total) and nuclear (around 40 %). Fossil fuels slightly decreased their already limited share, with natural gas playing a leading role (94 % of fossil fuels contribution).
After the Fukushima incident, the Swiss government decided to phase-out nuclear power production (the fi rst nuclear power plant will be shut down in 2019). Hydro-electric resources are already well-exploited, and there is virtually no more potential, so it is highly likely that gas-fi red power plants will fi ll the gap. However, at current gas prices the realization of relevant CCGT installed capacity depends on an adequate coverage of fi xed costs (capacity payments). Another solution could con-sist in electricity import, considering the overcapacity potential for power production in the rest of Europe. In any case, a large part of this excess import potential is dependent on non-controllable power injections (e.g. wind) and further electricity network grid expansions are required.
Notwithstanding the low volumes currently destined for electricity energy produc-tion, 2012 marked a historic record for natural and biogas overall consumption in Switzerland, with a growth of + 5.4 % compared to the previous year (biogas perfor-mance was even outstanding – with + 12 % on year-to-year basis – but volumes are still very limited in absolute terms compared to the total).1 )
1 ) The Swiss gas market reached the size of near 4 GWh in 2013 ( 39.96 billion kWh, source : ASIG Swiss Association of Gas
Industry ), of which 97 million kWh came from biogas. The main use is for residential consumption and CNG for vehicles.
Main import sources are EU and Norway ( about two-thirds of the total ) and Russia ( covering nearly a quarter of the
demand ).
Image courtesy of Fluxys Belgium
The Role of the Region in the Development of EU
Gas Infrastructure and
Internal Market
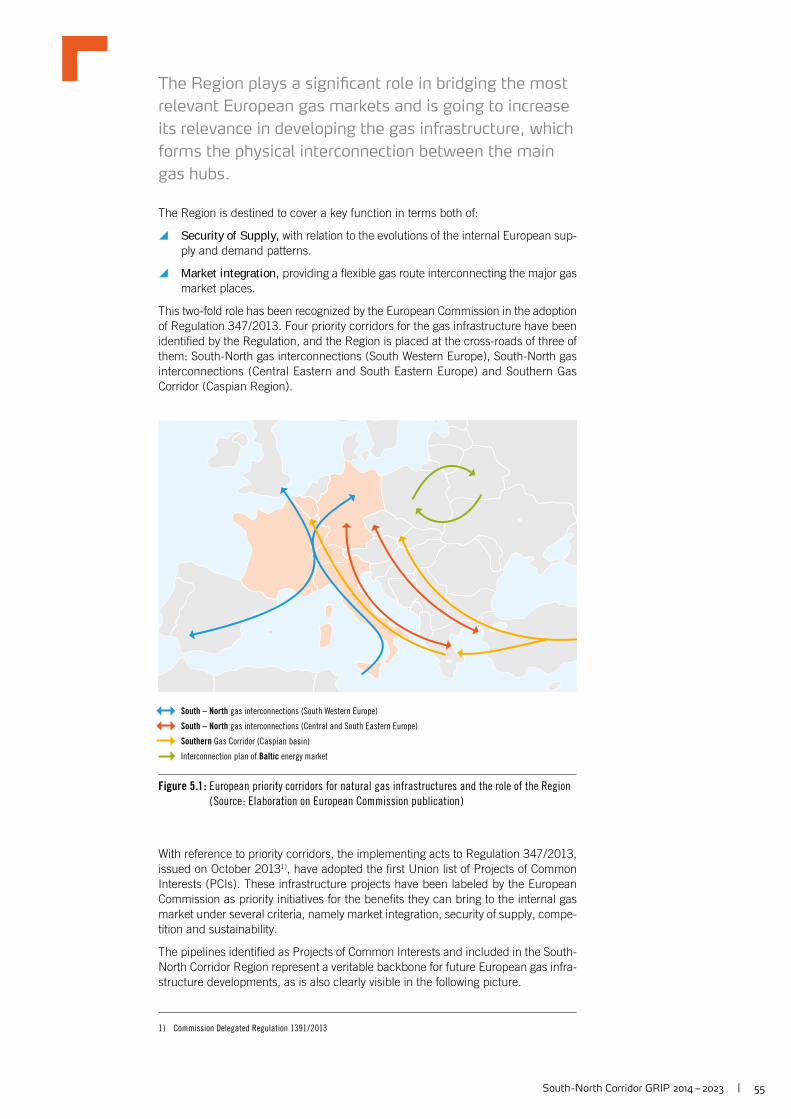
South -North Corridor GRIP 2014 – 2023 | 55
South – North gas interconnections (South Western Europe)
South – North gas interconnections (Central and South Eastern Europe)
Southern Gas Corridor (Caspian basin)
Interconnection plan of Baltic energy market
Figure 5.1 : European priority corridors for natural gas infrastructures and the role of the Region
( Source : Elaboration on European Commission publication )
The Region plays a signifi cant role in bridging the most
relevant European gas markets and is going to increase
its relevance in developing the gas infrastructure, which
forms the physical interconnection between the main
gas hubs.
The Region is destined to cover a key function in terms both of:
y Security of Supply, with relation to the evolutions of the internal European sup-ply and demand patterns.
y Market integration, providing a fl exible gas route interconnecting the major gas market places.
This two-fold role has been recognized by the European Commission in the adoption of Regulation 347 / 2013. Four priority corridors for the gas infrastructure have been identifi ed by the Regulation, and the Region is placed at the cross-roads of three of them: South-North gas interconnections (South Western Europe), South-North gas interconnections (Central Eastern and South Eastern Europe) and Southern Gas Corridor (Caspian Region).
With reference to priority corridors, the implementing acts to Regulation 347 / 2013, issued on October 20131 ), have adopted the fi rst Union list of Projects of Common Interests (PCIs). These infrastructure projects have been labeled by the European Commission as priority initiatives for the benefi ts they can bring to the internal gas market under several criteria, namely market integration, security of supply, compe-tition and sustainability.
The pipelines identifi ed as Projects of Common Interests and included in the South-North Corridor Region represent a veritable backbone for future European gas infra-structure developments, as is also clearly visible in the following picture.
1 ) Commission Delegated Regulation 1391 / 2013
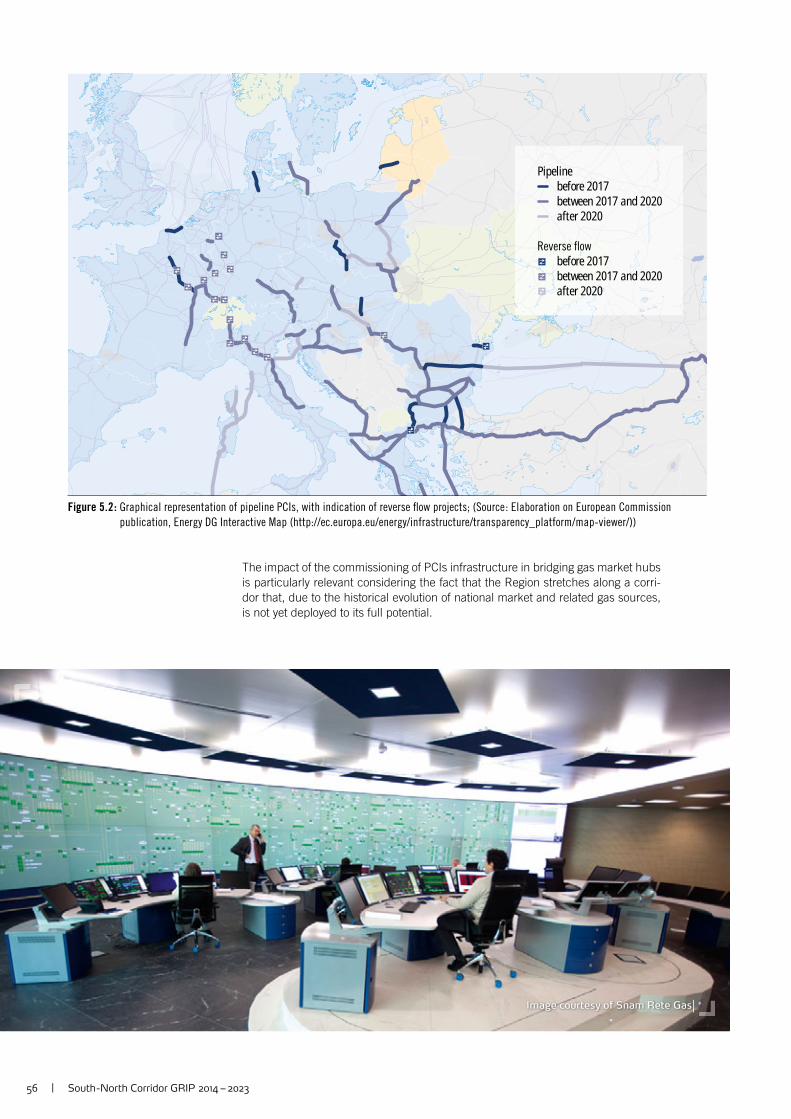
56 | South -North Corridor GRIP 2014 – 2023
Pipeline before 2017 between 2017 and 2020 after 2020
before 2017 between 2017 and 2020 after 2020
Image courtesy of Snam Rete Gas
Figure 5.2 : Graphical representation of pipeline PCIs, with indication of reverse fl ow projects; (Source : Elaboration on European Commission
publication, Energy DG Interactive Map (http://ec.europa.eu/energy/infrastructure/transparency_platform/map-viewer/))
The impact of the commissioning of PCIs infrastructure in bridging gas market hubs is particularly relevant considering the fact that the Region stretches along a corri-dor that, due to the historical evolution of national market and related gas sources, is not yet deployed to its full potential.
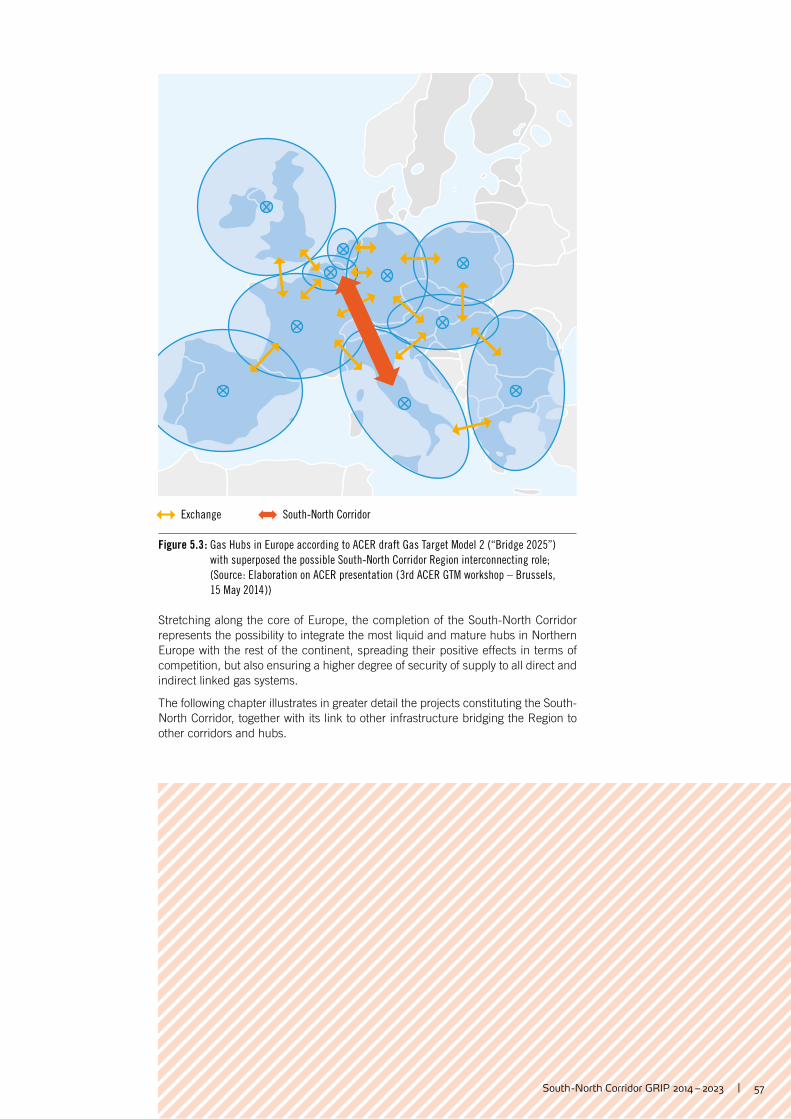
South -North Corridor GRIP 2014 – 2023 | 57
Exchange South-North Corridor
Figure 5.3 : Gas Hubs in Europe according to ACER draft Gas Target Model 2 (“Bridge 2025”)
with superposed the possible South-North Corridor Region interconnecting role;
(Source : Elaboration on ACER presentation ( 3rd ACER GTM workshop – Brussels,
15 May 2014 ))
Stretching along the core of Europe, the completion of the South-North Corridor represents the possibility to integrate the most liquid and mature hubs in Northern Europe with the rest of the continent, spreading their positive effects in terms of competition, but also ensuring a higher degree of security of supply to all direct and indirect linked gas systems.
The following chapter illustrates in greater detail the projects constituting the South-North Corridor, together with its link to other infrastructure bridging the Region to other corridors and hubs.
58 | South -North Corridor GRIP 2014 – 2023
Image courtesy of Snam Rete Gas
South-North Corridor
Introduction | Project Rationales
Projects Description | PCI Status
Odorisation
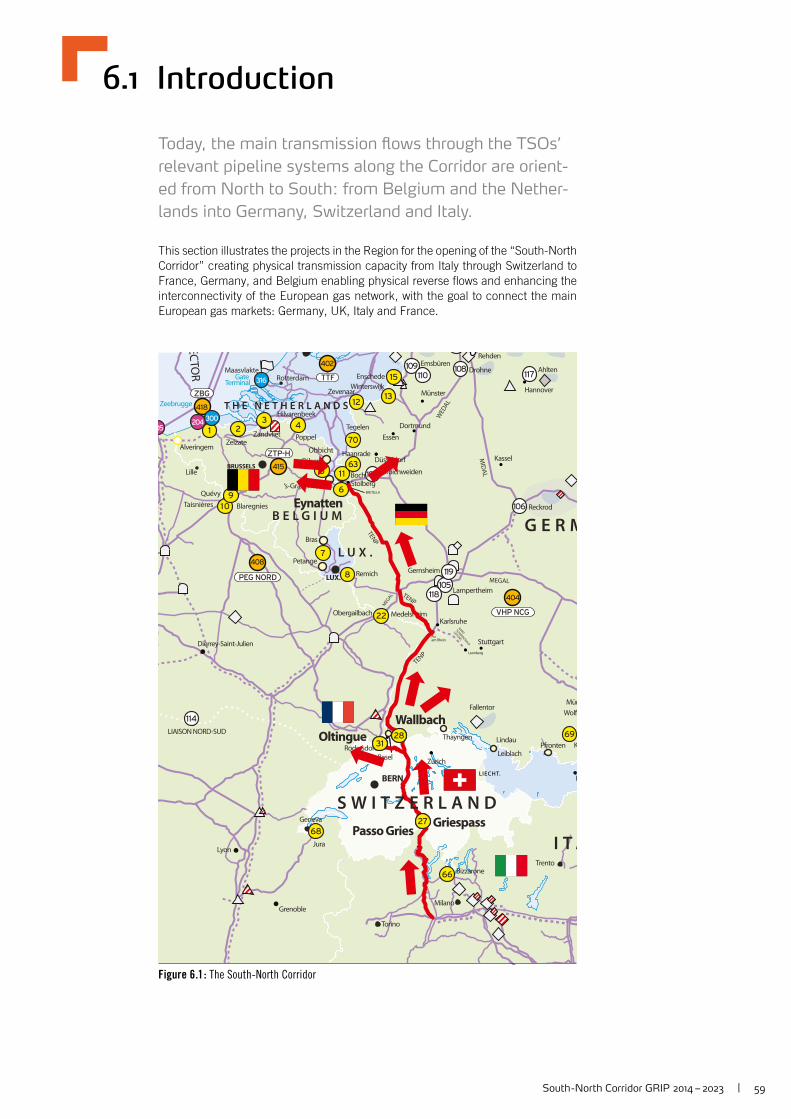
South -North Corridor GRIP 2014 – 2023 | 59
Reckrod
Alveringem
ECTO
R
M
MID
AL
WED
AL
TENP
TENP
MEG
AL
TENP
BRETELLA
NO
RD
SCHWARZW
ALD
LEITUNG
MEGAL
Torino
Milano
Trento
Grenoble
Dierrey-Saint-Julien
Lyon
Geneva
Jura
Zürich
Kassel
Essen
Tegelen
Stuttgart
Mün
Hannover
Dortmund
I
Lille
Düsseldorf
Münster
Au am Rhein
Karlsruhe
Leonberg
Rotterdam
T H E N E T H E R L A N D S
LIECHT.
BRUSSELS
BERN
LUX.
LIAISON NORD-SUD
Rodersdorf
Medelsheim
Remich
Bras
Petange
Obergailbach
‘s-Gravenvoeren
Obbicht
DilsenHaanrade
Bocholtz
ZelzateZandvliet
Quévy
BlaregniesTaisnières
Poppel
Zeebrugge
Gate Terminal
Enschede
ZevenaarWinterswijk
Hilvarenbeek
Maasvlakte AhltenEmsbüren
Broichweiden
Lampertheim
Gernsheim
Rehden
Drohne
PfrontenLindau
Leiblach
Thayngen
Basel
K
WolfFallentor
Stolberg
Bizzarone
TTF
VHP NCG
PEG NORD
ZTP-H
ZBG
402
408
404
415
418
1 23
4
5
6
1163
7
109
12
70
13
15
692831
2768
66
22
8
109110
108
114
104
105
119
118
106
117
204 300
316
05
2831
27
Wallbach
Oltingue
Eynatten
GriespassPasso Gries
S W I T Z E R L A N D
I T A
G E R MB E L G I U M
L U X .
Figure 6.1 : The South-North Corridor
6.1 Introduction
Today, the main transmission fl ows through the TSOs’
relevant pipeline systems along the Corridor are orient-
ed from North to South: from Belgium and the Nether-
lands into Germany, Switzerland and Italy.
This section illustrates the projects in the Region for the opening of the “South-North Corridor” creating physical transmission capacity from Italy through Switzerland to France, Germany, and Belgium enabling physical reverse fl ows and enhancing the interconnectivity of the European gas network, with the goal to connect the main European gas markets: Germany, UK, Italy and France.

60 | South -North Corridor GRIP 2014 – 2023
Image courtesy of OGE
6.2 Project Rationales
Traditionally there has been a substantial southward
oriented fl ow from gas producers in the North Sea and
Netherlands across Switzerland to Italy. In the medium
to long term there is now a potential to build up the
capacity for a new pattern of fl ows, from the South to
the North of Europe.
This new pattern of Northwards fl ows from Italy would clearly improve Europe’s security of supply and competition by connecting the main European gas markets.
Future European gas fl ows will not only be determined by demand but also pro-duction. With stable-to-declining Norwegian sources, UK and Dutch productions already going down at a steeper pace than projected, more gas will need to come from other sources and the related infrastructure will have to be put in place to connect these new sources of gas.
One of the most obvious and least-costly options for diversifying supply sources is to create reverse fl ows. This is a core EU goal, which enjoys widespread support by the European Commission and in legislation, as demonstrated by the recent publication of the ‘Projects of Common Interest’ list (PCIs).
With supply diversifi cation expected to be one of the main rationales for reverse fl ows, recent events in Crimea and Ukraine could push for a reduced dependency on Russian gas, further favoring such a diversifi cation policy.
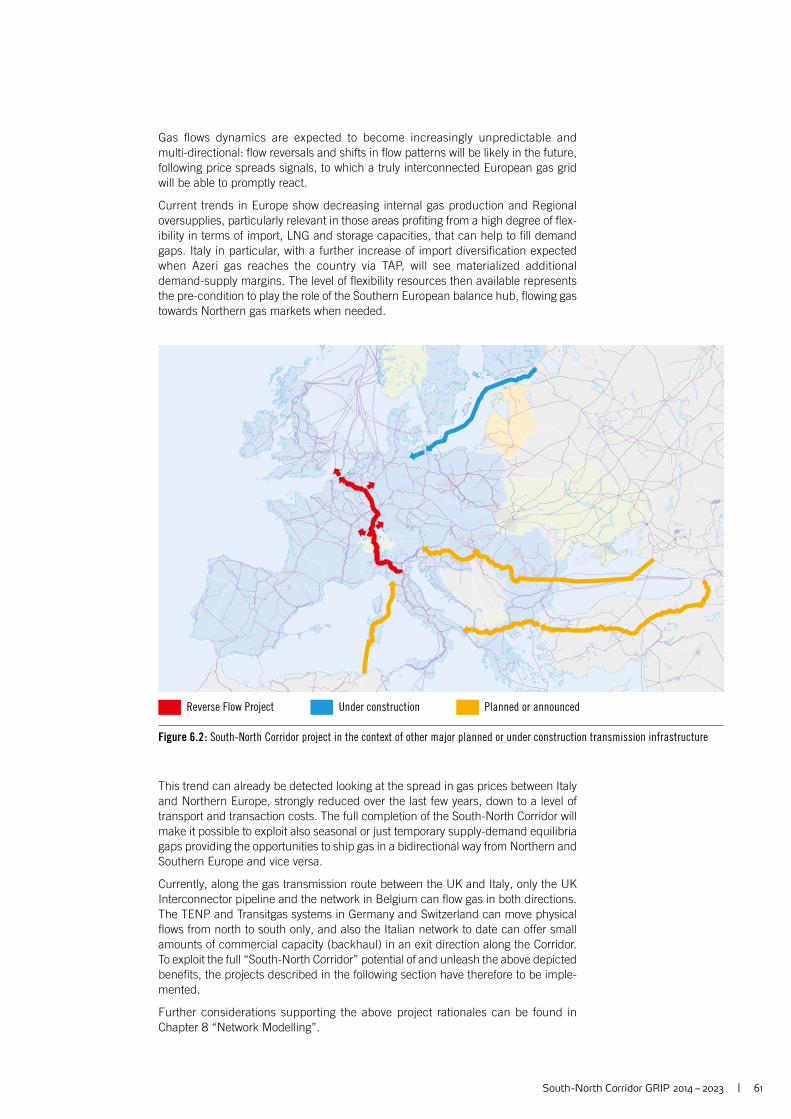
South -North Corridor GRIP 2014 – 2023 | 61
Figure 6.2 : South-North Corridor project in the context of other major planned or under construction transmission infrastructure
Gas fl ows dynamics are expected to become increasingly unpredictable and multi-directional: fl ow reversals and shifts in fl ow patterns will be likely in the future, following price spreads signals, to which a truly interconnected European gas grid will be able to promptly react.
Current trends in Europe show decreasing internal gas production and Regional oversupplies, particularly relevant in those areas profi ting from a high degree of fl ex-ibility in terms of import, LNG and storage capacities, that can help to fi ll demand gaps. Italy in particular, with a further increase of import diversifi cation expected when Azeri gas reaches the country via TAP, will see materialized additional demand-supply margins. The level of fl exibility resources then available represents the pre-condition to play the role of the Southern European balance hub, fl owing gas towards Northern gas markets when needed.
This trend can already be detected looking at the spread in gas prices between Italy and Northern Europe, strongly reduced over the last few years, down to a level of transport and transaction costs. The full completion of the South-North Corridor will make it possible to exploit also seasonal or just temporary supply-demand equilibria gaps providing the opportunities to ship gas in a bidirectional way from Northern and Southern Europe and vice versa.
Currently, along the gas transmission route between the UK and Italy, only the UK Interconnector pipeline and the network in Belgium can fl ow gas in both directions. The TENP and Transitgas systems in Germany and Switzerland can move physical fl ows from north to south only, and also the Italian network to date can offer small amounts of commercial capacity (backhaul) in an exit direction along the Corridor. To exploit the full “South-North Corridor” potential of and unleash the above depicted benefi ts, the projects described in the following section have therefore to be imple-mented.
Further considerations supporting the above project rationales can be found in Chapter 8 “Network Modelling”.
Reverse Flow Project Under construction Planned or announced
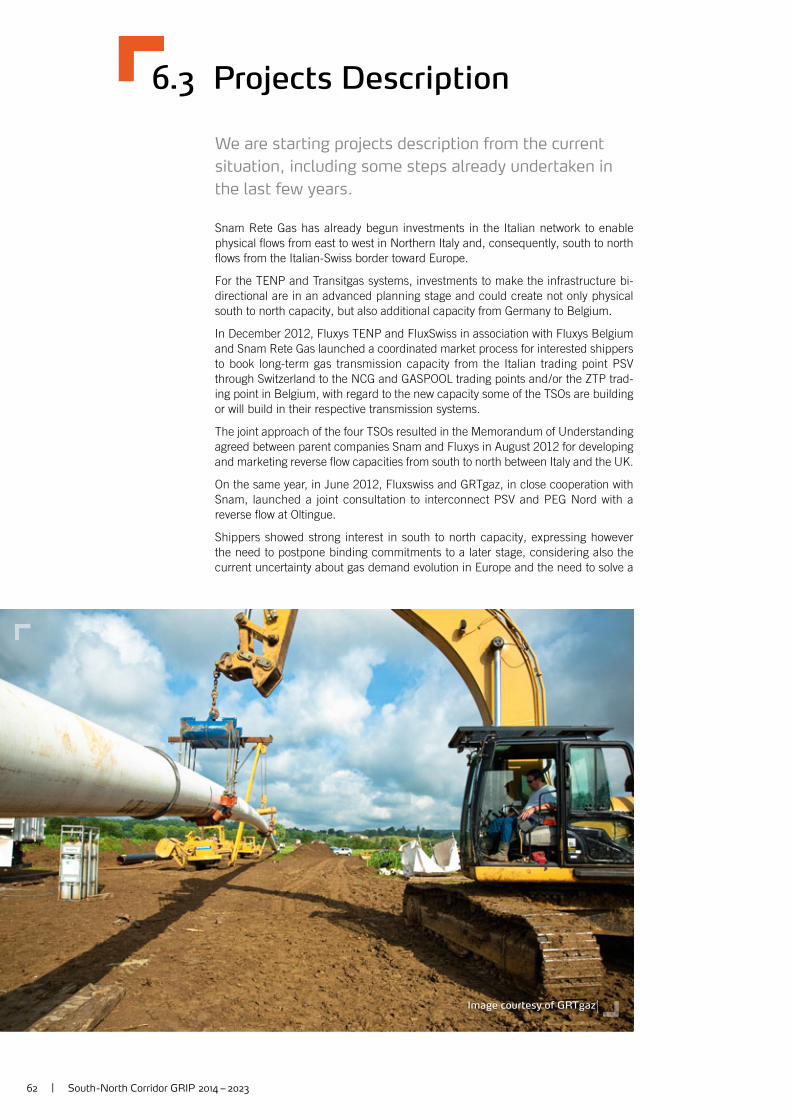
62 | South -North Corridor GRIP 2014 – 2023
Image courtesy of GRTgaz
6.3 Projects Description
We are starting projects description from the current
situation, including some steps already undertaken in
the last few years.
Snam Rete Gas has already begun investments in the Italian network to enable physical fl ows from east to west in Northern Italy and, consequently, south to north fl ows from the Italian-Swiss border toward Europe.
For the TENP and Transitgas systems, investments to make the infrastructure bi-directional are in an advanced planning stage and could create not only physical south to north capacity, but also additional capacity from Germany to Belgium.
In December 2012, Fluxys TENP and FluxSwiss in association with Fluxys Belgium and Snam Rete Gas launched a coordinated market process for interested shippers to book long-term gas transmission capacity from the Italian trading point PSV through Switzerland to the NCG and GASPOOL trading points and / or the ZTP trad-ing point in Belgium, with regard to the new capacity some of the TSOs are building or will build in their respective transmission systems.
The joint approach of the four TSOs resulted in the Memorandum of Understanding agreed between parent companies Snam and Fluxys in August 2012 for developing and marketing reverse fl ow capacities from south to north between Italy and the UK.
On the same year, in June 2012, Fluxswiss and GRTgaz, in close cooperation with Snam, launched a joint consultation to interconnect PSV and PEG Nord with a reverse fl ow at Oltingue.
Shippers showed strong interest in south to north capacity, expressing however the need to postpone binding commitments to a later stage, considering also the current uncertainty about gas demand evolution in Europe and the need to solve a
South -North Corridor GRIP 2014 – 2023 | 63
few remaining outstanding issues (e.g. odorisation). As a result, the coordinated market process was discontinued in April 2013 and postponed.
Fluxys TENP, FluxSwiss, Fluxys Belgium and Snam Rete Gas closely work together to solve any remaining open issues involved, and the marketing of reverse fl ow capacities will be relaunched as soon as possible.
GRTgaz and FluxSwiss are discussing with prospective customers and involved regulators the performance of a market test.
In the current project planning, capacity along the entire route from Italy to Belgium will be made available as from October 2018.
Snam Rete Gas, FluxSwiss and Fluxys TENP have put in place a project coordina-tion to ensure technical alignment of the execution of the projects under the respon-sibility of the respective TSOs.
As the permitting processes and the nature of the technical measures are signifi -cantly different along the route and for each concerned TSO, the projects coordina-tion will aim at achieving an aligned approach with regards to the timing of the com-missioning and hence the availability of the capacities along the routes.
The following sections provide a description of the various projects composing the South-North Corridor, building upon the appreciated Interconnection Point approach already adopted in the fi rst GRIP edition.
6.3.1 IN ITALY : SUPPORT FOR THE NORTH WEST MARKET AND BIDIRECTIONAL CROSS-BORDER FLOWS
The Snam Rete Gas project to support fl ows to the North West Italian market and to create exit fl ow towards Passo Gries Interconnection Point can be divided into two phases:
y The three-year period 2014 – 2016 is expected to see the fi nalization of the fi rst phase of the project to support to the North West market and bidirectional cross-border fl ows, which will also allow the creation of an initial availability of fl ows for export from January 2016. The completion of this phase will ensure exports of 5 MSm³/d (around 54 GWh/d) at Passo Gries IP (from Italy to Switzer-land), and up to 18 MSm³/d (around 191 GWh/d) at Tarvisio IP (from Italy to Austria).
y The second phase, continues on from the fi rst phase and integrates the expan-sions to facilitate an increase in export capacity by 2018. The capacity at the exit point of Passo Gries will increase to up to 40 MSm³/d (around 429 GWh/d), or up to 22 MSm³/d (around 238 GWh/d) with a simultaneous exit fl ow at the Tarvisio exit point of up to 18 MSm³/d (around 191 GWh/d).
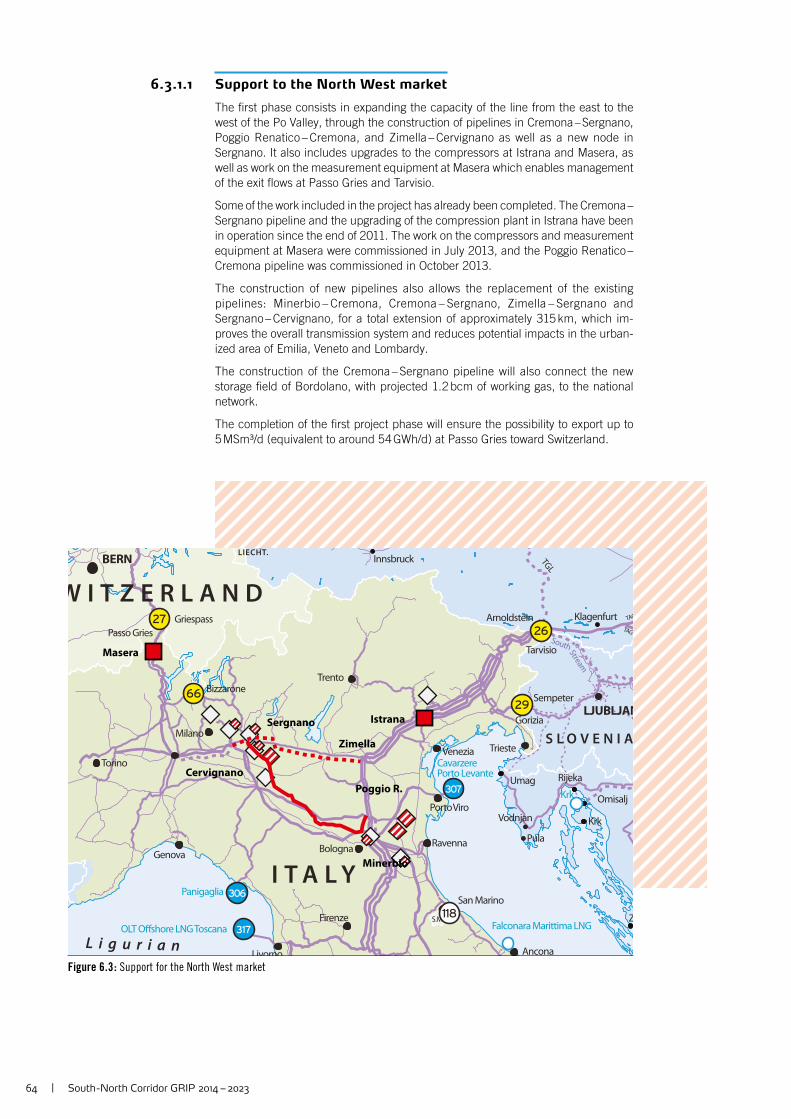
64 | South -North Corridor GRIP 2014 – 2023
SouthStream
TGL
TAG
TAG I
Krk
Falconara Marittima LNG
Ancona
Firenze
Livorno
Bologna
Torino
Milano
Trento
Porto
Ravenna
San Marino
Viro
Krk
Pula
Vodnjan
Umag Rijeka
Z
Omisalj
Innsbruck
Klagenfurt
Genova
Venezia
L i g u r i a n
W I T Z E R L A N D
I T A L Y
S L O V E N I A
LIECHT.
S.M.
LJUBLJAN
BERN
Griespass
Bizzarone
Passo Gries
Panigaglia
OLT Offshore LNG Toscana
Porto LevanteCavarzere
Arnoldstein
Tarvisio
Gorizia
Trieste
Sempeter
27
6629
26
118
306
317
307
Masera
Istrana
Zimella
Cervignano
Sergnano
Poggio R.
Minerbio
Figure 6.3 : Support for the North West market
6.3.1.1 Support to the North West market
The fi rst phase consists in expanding the capacity of the line from the east to the west of the Po Valley, through the construction of pipelines in Cremona – Sergnano, Poggio Renatico – Cremona, and Zimella – Cervignano as well as a new node in Sergnano. It also includes upgrades to the compressors at Istrana and Masera, as well as work on the measurement equipment at Masera which enables management of the exit fl ows at Passo Gries and Tarvisio.
Some of the work included in the project has already been completed. The Cremona – Sergnano pipeline and the upgrading of the compression plant in Istrana have been in operation since the end of 2011. The work on the compressors and measurement equipment at Masera were commissioned in July 2013, and the Poggio Renatico – Cremona pipeline was commissioned in October 2013.
The construction of new pipelines also allows the replacement of the existing pipelines: Minerbio – Cremona, Cremona – Sergnano, Zimella – Sergnano and Sergnano – Cervignano, for a total extension of approximately 315 km, which im-proves the overall transmission system and reduces potential impacts in the urban-ized area of Emilia, Veneto and Lombardy.
The construction of the Cremona – Sergnano pipeline will also connect the new storage fi eld of Bordolano, with projected 1.2 bcm of working gas, to the national network.
The completion of the fi rst project phase will ensure the possibility to export up to 5 MSm³/d (equivalent to around 54 GWh/d) at Passo Gries toward Switzerland.
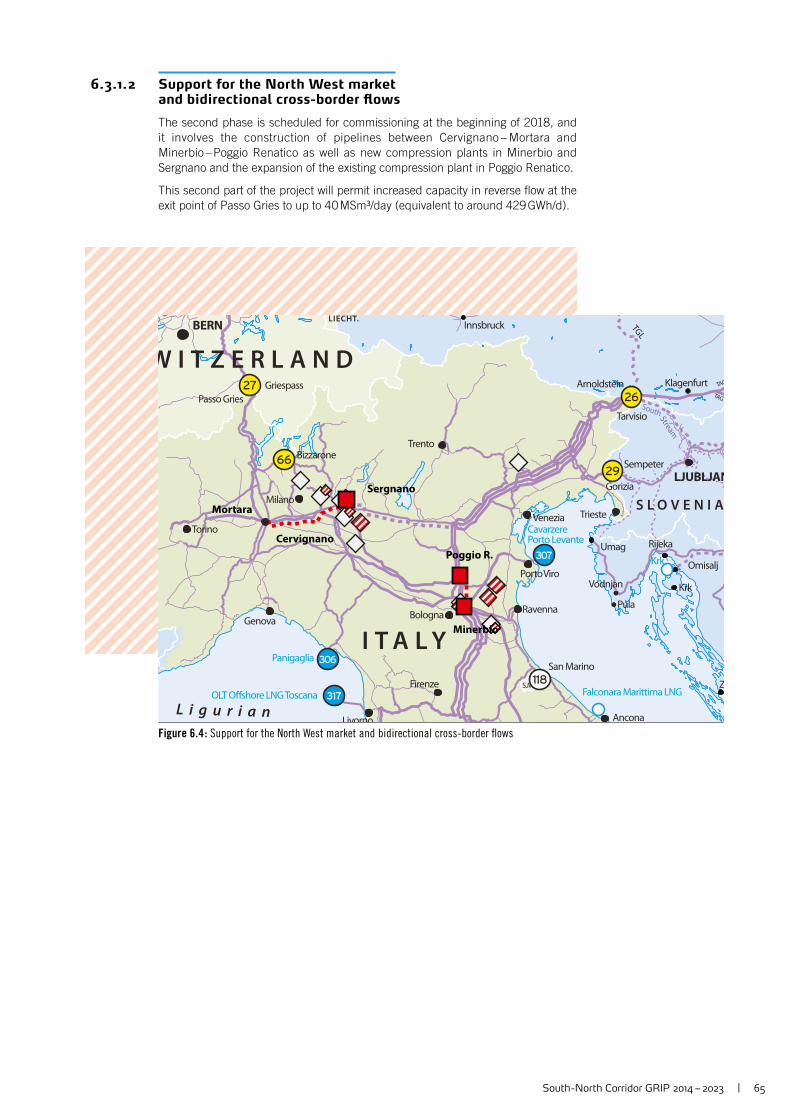
South -North Corridor GRIP 2014 – 2023 | 65
SouthStream
TGL
TAG
TAG I
Krk
Falconara Marittima LNG
Ancona
Firenze
Livorno
Bologna
Torino
Milano
Trento
Porto
Ravenna
San Marino
Viro
Krk
Pula
Vodnjan
Umag Rijeka
Z
Omisalj
Innsbruck
Klagenfurt
Genova
Venezia
L i g u r i a n
W I T Z E R L A N D
I T A L Y
S L O V E N I A
LIECHT.
S.M.
LJUBLJAN
BERN
Griespass
Bizzarone
Passo Gries
Panigaglia
OLT Offshore LNG Toscana
Porto LevanteCavarzere
Arnoldstein
Tarvisio
Gorizia
Trieste
Sempeter
27
6629
26
118
306
317
307
Mortara
Cervignano
Sergnano
Poggio R.
Minerbio
Figure 6.4 : Support for the North West market and bidirectional cross-border fl ows
6.3.1.2 Support for the North West market and bidirectional cross-border fl ows
The second phase is scheduled for commissioning at the beginning of 2018, and it involves the construction of pipelines between Cervignano – Mortara and Minerbio – Poggio Renatico as well as new compression plants in Minerbio and Sergnano and the expansion of the existing compression plant in Poggio Renatico.
This second part of the project will permit increased capacity in reverse fl ow at the exit point of Passo Gries to up to 40 MSm³/day (equivalent to around 429 GWh/d).
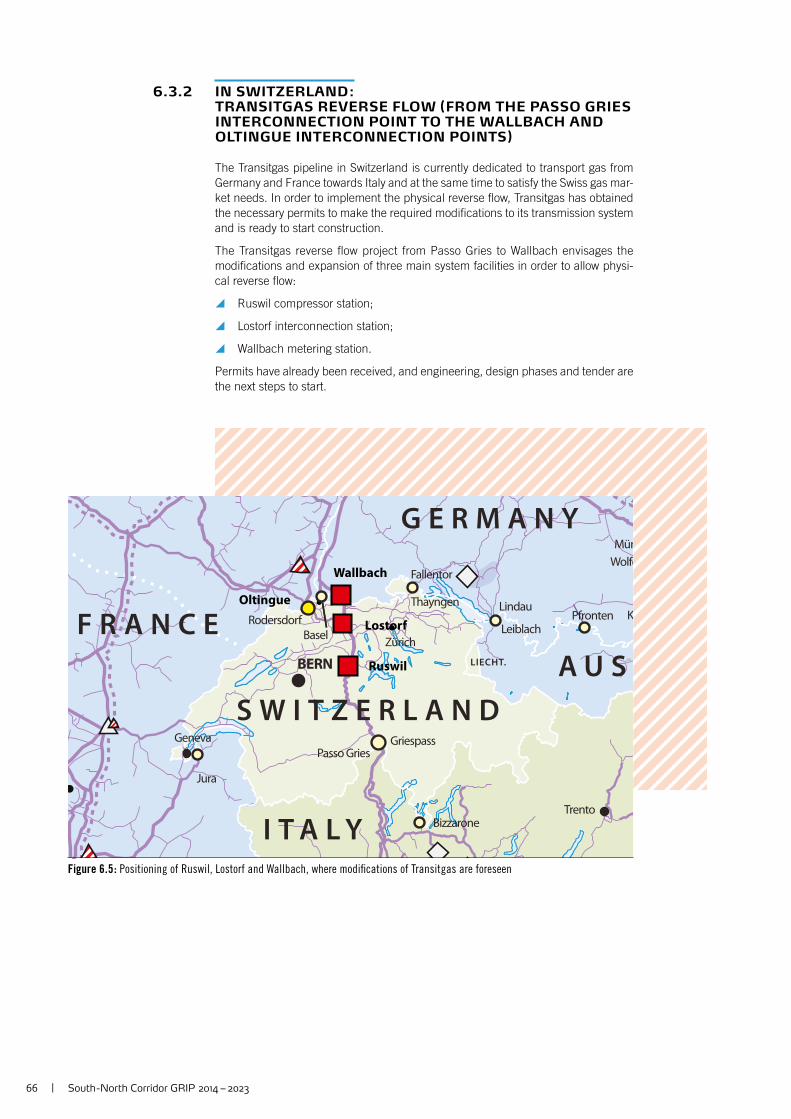
66 | South -North Corridor GRIP 2014 – 2023
M
Trento
Geneva
Jura
Zürich
Mün
S W I T Z E R L A N D
I T A L Y
G E R M A N Y
A U SF R A N C E
LIECHT.BERN
Rodersdorf PfrontenLindau
Leiblach
Thayngen
Basel
K
WolfeFallentor
Griespass
Bizzarone
Passo Gries
Oltingue
Wallbach
Lostorf
Ruswil
Figure 6.5 : Positioning of Ruswil, Lostorf and Wallbach, where modifi cations of Transitgas are foreseen
6.3.2 IN SWITZERLAND : TRANSITGAS REVERSE FLOW ( FROM THE PASSO GRIES INTERCONNECTION POINT TO THE WALLBACH AND OLTINGUE INTERCONNECTION POINTS )
The Transitgas pipeline in Switzerland is currently dedicated to transport gas from Germany and France towards Italy and at the same time to satisfy the Swiss gas mar-ket needs. In order to implement the physical reverse fl ow, Transitgas has obtained the necessary permits to make the required modifi cations to its transmission system and is ready to start construction.
The Transitgas reverse fl ow project from Passo Gries to Wallbach envisages the modifi cations and expansion of three main system facilities in order to allow physi-cal reverse fl ow:
y Ruswil compressor station;
y Lostorf interconnection station;
y Wallbach metering station.
Permits have already been received, and engineering, design phases and tender are the next steps to start.
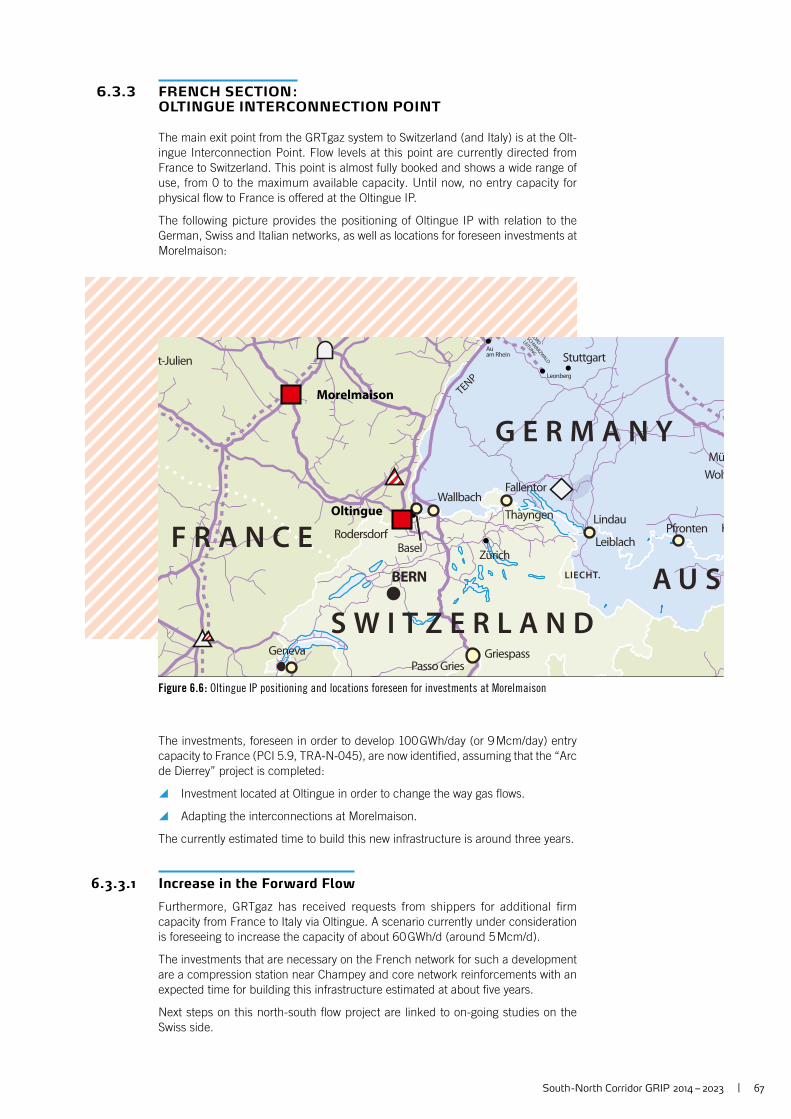
South -North Corridor GRIP 2014 – 2023 | 67
TENP
NO
RD
SCHWARZW
ALD
LEITUNG
t-Julien
Geneva
Zürich
Stuttgart
Mü
Au am Rhein
Leonberg
S W I T Z E R L A N D
G E R M A N Y
A U SF R A N C E
LIECHT.BERN
Rodersdorf PfrontenLindau
Leiblach
Thayngen
Basel
K
WolfFallentor
Wallbach
GriespassPasso Gries
Oltingue
Morelmaison
Figure 6.6 : Oltingue IP positioning and locations foreseen for investments at Morelmaison
6.3.3 FRENCH SECTION : OLTINGUE INTERCONNECTION POINT
The main exit point from the GRTgaz system to Switzerland (and Italy) is at the Olt-ingue Interconnection Point. Flow levels at this point are currently directed from France to Switzerland. This point is almost fully booked and shows a wide range of use, from 0 to the maximum available capacity. Until now, no entry capacity for physical fl ow to France is offered at the Oltingue IP.
The following picture provides the positioning of Oltingue IP with relation to the German, Swiss and Italian networks, as well as locations for foreseen investments at Morelmaison:
The investments, foreseen in order to develop 100 GWh/day (or 9 Mcm/day) entry capacity to France (PCI 5.9, TRA-N-045), are now identifi ed, assuming that the “Arc de Dierrey” project is completed:
y Investment located at Oltingue in order to change the way gas fl ows.
y Adapting the interconnections at Morelmaison.
The currently estimated time to build this new infrastructure is around three years.
6.3.3.1 Increase in the Forward Flow
Furthermore, GRTgaz has received requests from shippers for additional fi rm capacity from France to Italy via Oltingue. A scenario currently under consideration is foreseeing to increase the capacity of about 60 GWh/d (around 5 Mcm/d).
The investments that are necessary on the French network for such a development are a compression station near Champey and core network reinforcements with an expected time for building this infrastructure estimated at about fi ve years.
Next steps on this north-south fl ow project are linked to on-going studies on the Swiss side.
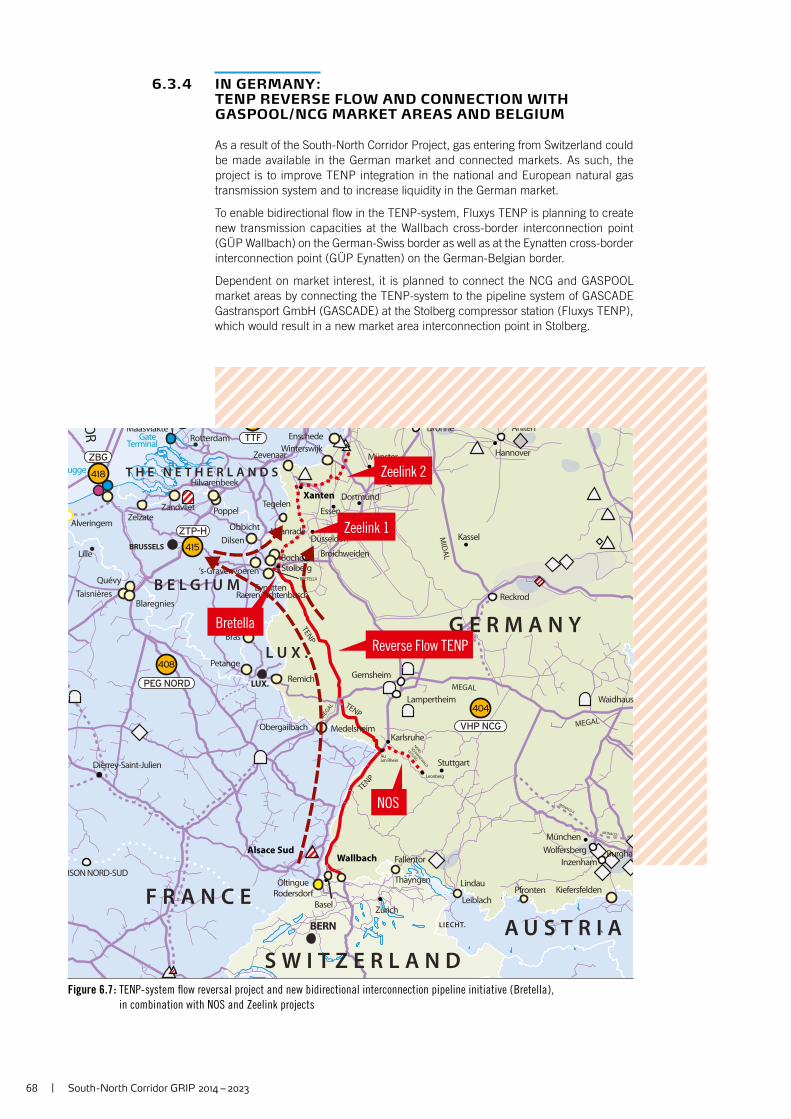
68 | South -North Corridor GRIP 2014 – 2023
Reckrod
Alveringem
OR
MONACO I
MONACO II
MID
AL
WED
AL
TENP
TENP
MEG
AL
MEGAL
TENP
BRETELLA
NO
RD
SCHW
ARZWALD
LEITUNG
MEGAL
Dierrey-Saint-Julien
G
Zürich
Kassel
EssenTegelen
Stuttgart
München
Hannover
Dortmund
Lille
Düsseldorf
Münster
Au am Rhein
Karlsruhe
Leonberg
Rotterdam
S W I T Z E R L A N D
G E R M A N Y
A U S T R I AF R A N C E
B E L G I U M
T H E N E T H E R L A N D S
L U X .
LIECHT.
BRUSSELS
BERN
LUX.
ISON NORD-SUD
RodersdorfOltingue
Medelsheim
Remich
Bras
Petange
Obergailbach
‘s-Gravenvoeren
Obbicht
DilsenHaanrade
Bocholtz
ZelzateZandvliet
EynattenRaeren/Lichtenbusch
Quévy
BlaregniesTaisnières
Poppel
ugge
Gate Terminal
Enschede
ZevenaarWinterswijk
Hilvarenbeek
Maasvlakte Ahlten
Broichweiden
Lampertheim
Gernsheim
Drohne
PfrontenLindau
Leiblach
Thayngen
Basel
Kiefersfelden
BurghauWolfersberg
InzenhamFallentor
Stolberg
Waidhaus
TTF
VHP NCG
PEG NORD
ZTP-H
ZBG
408
404
415
418
WallbachAlsace Sud
Xanten
NOS
Reverse Flow TENP
Zeelink 1
Bretella
Zeelink 2
Figure 6.7 : TENP-system fl ow reversal project and new bidirectional interconnection pipeline initiative ( Bretella ),
in combination with NOS and Zeelink projects
6.3.4 IN GERMANY : TENP REVERSE FLOW AND CONNECTION WITH GASPOOL / NCG MARKET AREAS AND BELGIUM
As a result of the South-North Corridor Project, gas entering from Switzerland could be made available in the German market and connected markets. As such, the project is to improve TENP integration in the national and European natural gas transmission system and to increase liquidity in the German market.
To enable bidirectional fl ow in the TENP-system, Fluxys TENP is planning to create new transmission capacities at the Wallbach cross-border interconnection point (GÜP Wallbach) on the German-Swiss border as well as at the Eynatten cross- border interconnection point (GÜP Eynatten) on the German-Belgian border.
Dependent on market interest, it is planned to connect the NCG and GASPOOL market areas by connecting the TENP-system to the pipeline system of GASCADE Gastransport GmbH (GASCADE) at the Stolberg compressor station (Fluxys TENP), which would result in a new market area interconnection point in Stolberg.
South -North Corridor GRIP 2014 – 2023 | 69
The investment and capacity measures envisaged by Fluxys TENP could include modifi cations at the compressor stations of Stolberg, Hügelheim and Mittelbrunn and the installation of additional compressors in Stolberg with a view to increasing the pressure up to 84 bar, allowing Fluxys TENP to offer exit services into the GASCADE system as well as into the direction of Eynatten.
Another investment under consideration consists of a new bidirectional interconnec-tion pipeline (Bretella) and a station in Nordschwaben between the compressor sta-tion in Stolberg and the cross-border interconnection point at Eynatten (Belgium), which would create additional capacities between Germany and Belgium. These additional capacities also require additional compression power in Stolberg.
Should the market demand not be high enough Fluxys TENP is also considering a reduced investment case allowing for capacities from Wallbach to NCG without additional capacities to Belgium and GASPOOL. This reduced investment case does not request the installation of the additional compressors in Stolberg.
The investments are planned to be ready as of October 2018.
The planned fl ow reversal is integrated in the German network development plan of German TSOs (details see www.netzentwicklungsplan.de and in next chapter of the report, section: “The investments in the eastern area of the Region”) and also supports investment projects of other TSOs, at this stage not being core to the Reverse Flow Project, in particular the NOS-project sponsored by terranets bw and the ZEELINK project planned by OGE and (for ZEELINK 1) Thyssengas.
The terranets bw project “Nordschwarzwaldleitung” (NOS-project) is the realization of a pipeline of ca. 70 km (DN 600 / DP 80) in the south-western area of Germany (federal state of Baden-Württemberg). The ongoing construction establishes anoth-er connection between the terranets bw network in Baden-Württemberg and the European gas transmission network.
Through this, the onward demand of transport capacities for natural gas in Baden-Württemberg will be covered and an essential contribution for the security of supply will be made. The reversion of TENP will generate additional gas capacities, which would secure the demand in south-western Germany. The construction of NOS will be fi nalized at the end of 2015.
The ZEELINK project is composed of three sub-projects. The sub-project "ZEELINK 1", planned by OGE and Thyssengas, is a new pipeline of about 112 km (DN 1000 /DP 100) from Eynatten at the German/Belgian border to St. Hubert in the federal state North-Rhine Westphalia. The sub-project "ZEELINK 2", planned by OGE, is a new pipeline of about 115 km (DN 1000 / DP 100) from St. Hubert to Legden in the German federal state North-Rhine Westphalia. The sub-project "VDS Rheinland”, planned by OGE, is the development of a new compressor station with two 25 MW units in the area of Aachen in the German federal state North-Rhine Westphalia. Implementation of the ZEELINK project is foreseen between 2020 and 2024. The main purpose of the ZEELINK project is to support the conversion of markets currently supplied by low-calorifi c gas (L-gas) to high-calorifi c gas (H-gas) (see also section 7.2.3).
6.3.5 IN BELGIUM : EYNATTEN INTERCONNECTION POINT
The Fluxys Belgium network can already accept reverse fl ow gas coming from Germany. The existing pipeline system at the Eynatten interconnection point is al-ready bidirectional and gives full access to the entire Belgian H-gas network and hence to the ZTP trading point.
Since the UK Interconnector between Belgium and the UK is already a bidirection-al pipeline, gas can fl ow directly from the Belgian system to the Great Britain market, allowing for the full completion of the South-North Corridor.
70 | South -North Corridor GRIP 2014 – 2023
6.4 PCI Status
In 2013 several projects that allow for the opening of the
South-North Corridor have attained PCI status, confi rm-
ing their importance for the cross-border security of
supply and supply diversifi cation of Europe.
The table below lists these projects on the backbone of the South-North Corridor.
SOUTH-NORTH CORRIDOR PROJECTS WITH PCI STATUS
5.9 PCI Reverse fl ow interconnection between Switzerland and France
5.10 PCI Reverse fl ow interconnection on TENP Pipeline in Germany
5.11 PCI Reverse fl ow interconnection between Italy and Switzerland at Passo Gries interconnection point
5.12 PCI Reverse fl ow interconnection on TENP Pipeline to Eynatten interconnection point (Germany)
Table 6.1 : South-North Corridor projects with PCI Status; Source : Section “Bi-directional fl ows
between Italy, Switzerland, Germany and Belgium /France” of Chapter 5 “Priority
corridor North-South gas interconnections in Western Europe ('NSI West Gas')”
Annex B of Commission Delegated Regulation 1391 / 2013
The South-North Corridor projects are particularly important for the European Internal Gas Market completion, also because they all share the key-feature of reverse fl ow infrastructure. This infrastructure bidirectionality has been recognised as bringing peculiar benefi ts according to Regulation EC 347 / 2013, so that having a reverse fl ow nature is a criterion directly fulfi lling the admissibility rule for entering in the PCI selection list.
Reverse fl ow projects provide additional benefi ts to the ones generated by mono- directional pipelines replicating their functions, with relation to the all four criteria considered essential by the Regulation to evaluate gas projects:
y Market integration and competition. Bi-directional pipelines allow for greater price convergence compared to mono-directional pipelines having the same function in connecting markets.
In fact, if the choice is between a new pipeline and the reverse fl ow of an existing infrastructure, this second solution permits to better follow spot price dynamics between hubs, permitting a deeper market integration and making possible the functioning of a competitive European internal gas market. This is highly likely unless comparatively low load factors are accepted for those mono-directional pipes replicating the reverse fl ow function.
y Interoperability and fl exibility of the system. The same operator normally manages reverse fl ow infrastructure in both directions. This situation is far less granted in case of multiple mono-directional pipes replicating reverse fl ow functions. In fact, the underlying physical and geographical separation of the pipelines not only increases their costs but also the probability that the number of subjects operating the assets will increase.
First of all, from a physical point of view, a single operator optimises dispatch-ing avoiding that gas fl ows in opposite directions (sub-optimal effect in case of meshed and evolved entry-exit systems are connected). Secondly, from a commercial perspective, having the same counterparts when marketing, using and managing capacity rights represents a clear advantage both for shippers and TSOs.
In conclusion, reverse fl ow benefi ts materialise both in physical and in commer-cial terms, increasing interoperability, fl exibility and the overall effi ciency of the system.
South -North Corridor GRIP 2014 – 2023 | 71
y Security of Supply. Regulation 994 / 2010 (SoS Regulation) clearly recognises the importance of reverse fl ow in enhancing European SoS, prescribing bidirec-tional pipelines for each cross-border interconnection between member states as a general rule. Reverse fl ow infrastructure increases the fl exibility of the Eu-ropean grid, permitting quick physical responses to cover energy needs arising from stressed or emergency situations. Additionally, reverse fl ow projects per-form this task in the most effective way because – "time-wise speaking" – they become available earlier to face possible emergency conditions, since faster permitting and usually shorter realisation phases can ensure earlier commissioning.
y Sustainability. Avoiding the laying of additional pipes is bringing several "green" positive externalities: in terms of avoided CO² emissions linked to pipeline production and laying (e. g. steel production and transportation, construction and following O & M activities etc.) as well as more general environmental impacts in terms of landing preservation benefi ts, since the track used for re-verse fl ow purposes is the same already exploited for the prevailing fl ows.
All the above mentioned benefi ts have been recognised in granting South-North Corridor projects the PCI status and demonstrate that this infrastructure is a neces-sary and cost-effective missing link for the completion of the internal gas market.
6.5 Odorisation
As a consequence of the planned bidirectionality on the
Transitgas system, new fl ow patterns can occur in the
future, additional to the ones possible today.
The conceivable combination of a fl ow from France to Switzerland at the Oltingue IP and a reversed fl ow from Switzerland to Germany at Wallbach might be one of them. This could be a problem as in France the odorisation process is centralised upon entry into the system while in Germany no odorised gas is accepted at the entries.
As there is currently no formal plan in France to avoid odorised gas fl owing from France into the Transitgas system, the installation of a de-odorisation plant would be required in order to avoid odorised gas fl owing into Germany.
Gas in Switzerland and gas entering into Italy is a mix of gas, coming from Germany (non-odorised) and coming from France (odorised), which has never created prob-lems until now in terms of interoperability of the interconnected systems (France –Switzerland and Italy).
Two solutions are under study to prevent possible THT-odorant quantities entering into Germany thereby not respecting current German specifi cations. On the one hand the construction of a de-odorisation plant by Fluxys TENP with a fi nal invest-ment decision expected in 2015. Studies are on-going to evaluate which THT remov-al technology provides the best results from a technical and economical perspective, with the next stage being pilot plant level testing.
On the other hand, on a wider time horizon, GRTgaz has launched studies to evalu-ate the impact of a change of odorisation practices on its network, from centralised to de-centralised odorisation. The fi rst exchanges with the national stakeholders showed the need for a wide-ranging consultation in order to weigh up the impacts of the harmonisation process. To this effect, GRTgaz will launch the construction of pilot facilities with the assistance of a distribution network operator.
72 | South -North Corridor GRIP 2014 – 2023
Image courtesy of Snam Rete Gas
Other TSO Transmission Projects in the Region
Investments in the Western area of the Region
Investments in the Northern area of the Region
Investments in the Eastern area of the Region
Investments in the Southern area of the Region
Other Investments Relevant for the Region
South -North Corridor GRIP 2014 – 2023 | 73
This chapter groups together other transmission
projects of importance in the Region, mainly following
a country-based approach:
y “Investments in the Western area of the Region” (section 7.1), describing the main GRTgaz system enhancements;
y “Investments in the Northern area of the Region” (section 7.2), depicting system development in Belgium;
y “Investments in the Eastern area of the Region” (section 7.3), presenting the draft National Development Plan 2014 of Germany's gas transmission system operators (TSOs);
y “Investments in the Southern area of the Region” (section 7.4), illustrating other key projects for Snam Rete Gas transmission network enhancement additional to “Support for the North West market and bidirectional cross-border fl ows” projects;
y A fi nal section dedicated to other projects possibly relevant for the Region and interesting more than one country (section 7.5).
In this section, the country maps presenting the overall TSO, SSO and LSO infra-structure projects use the same codes the projects had in the TYNDP 2013 – 2022, as reported also in the tables composing the section 2.2.5 of Chapter 2. In the same maps the infrastructural projects are indicated by the following colours:
FID projects non-FID but PCI projects non-FID and non-PCI projects
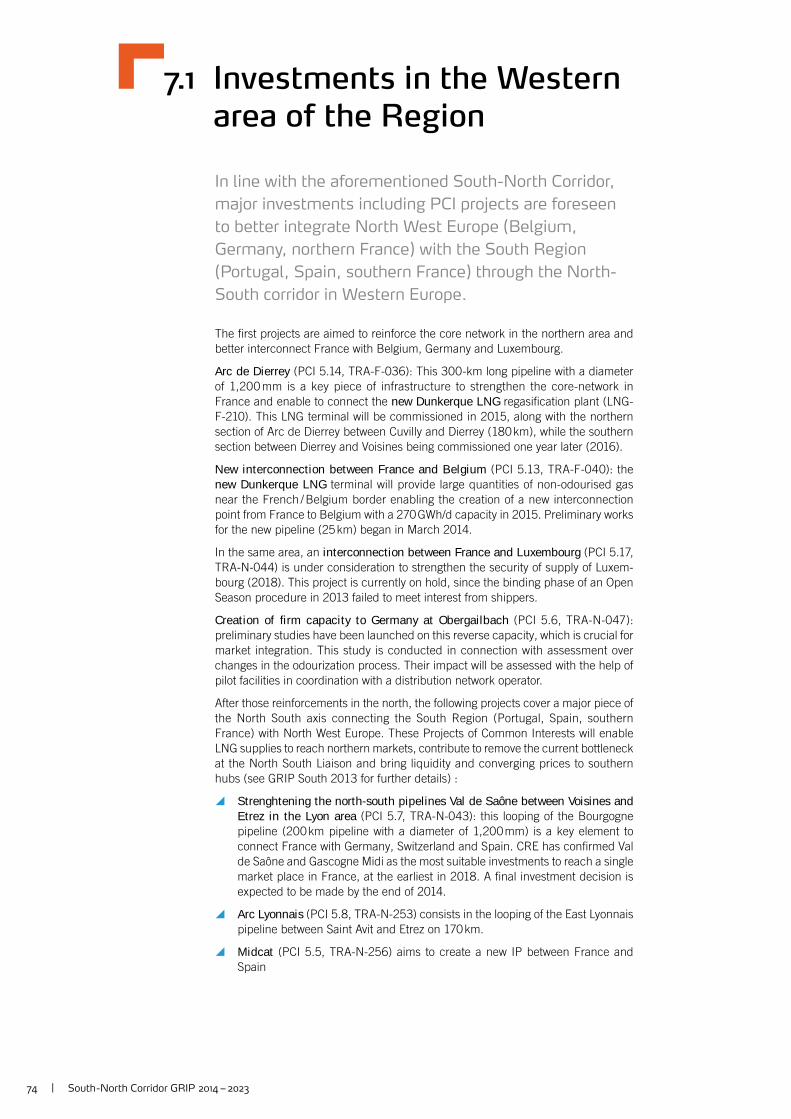
74 | South -North Corridor GRIP 2014 – 2023
7.1 Investments in the Western area of the Region
In line with the aforementioned South-North Corridor,
major investments including PCI projects are foreseen
to better integrate North West Europe ( Belgium,
Germany, northern France ) with the South Region
( Portugal, Spain, southern France ) through the North-
South corridor in Western Europe.
The fi rst projects are aimed to reinforce the core network in the northern area and better interconnect France with Belgium, Germany and Luxembourg.
Arc de Dierrey (PCI 5.14, TRA-F-036): This 300-km long pipeline with a diameter of 1,200 mm is a key piece of infrastructure to strengthen the core-network in France and enable to connect the new Dunkerque LNG regasifi cation plant (LNG-F-210). This LNG terminal will be commissioned in 2015, along with the northern section of Arc de Dierrey between Cuvilly and Dierrey (180 km), while the southern section between Dierrey and Voisines being commissioned one year later (2016).
New interconnection between France and Belgium (PCI 5.13, TRA-F-040): the new Dunkerque LNG terminal will provide large quantities of non-odourised gas near the French / Belgium border enabling the creation of a new interconnection point from France to Belgium with a 270 GWh/d capacity in 2015. Preliminary works for the new pipeline (25 km) began in March 2014.
In the same area, an interconnection between France and Luxembourg (PCI 5.17, TRA-N-044) is under consideration to strengthen the security of supply of Luxem-bourg (2018). This project is currently on hold, since the binding phase of an Open Season procedure in 2013 failed to meet interest from shippers.
Creation of fi rm capacity to Germany at Obergailbach (PCI 5.6, TRA-N-047): preliminary studies have been launched on this reverse capacity, which is crucial for market integration. This study is conducted in connection with assessment over changes in the odourization process. Their impact will be assessed with the help of pilot facilities in coordination with a distribution network operator.
After those reinforcements in the north, the following projects cover a major piece of the North South axis connecting the South Region (Portugal, Spain, southern France) with North West Europe. These Projects of Common Interests will enable LNG supplies to reach northern markets, contribute to remove the current bottleneck at the North South Liaison and bring liquidity and converging prices to southern hubs (see GRIP South 2013 for further details) :
y Strenghtening the north-south pipelines Val de Saône between Voisines and Etrez in the Lyon area (PCI 5.7, TRA-N-043): this looping of the Bourgogne pipeline (200 km pipeline with a diameter of 1,200 mm) is a key element to connect France with Germany, Switzerland and Spain. CRE has confi rmed Val de Saône and Gascogne Midi as the most suitable investments to reach a single market place in France, at the earliest in 2018. A fi nal investment decision is expected to be made by the end of 2014.
y Arc Lyonnais (PCI 5.8, TRA-N-253) consists in the looping of the East Lyonnais pipeline between Saint Avit and Etrez on 170 km.
y Midcat (PCI 5.5, TRA-N-256) aims to create a new IP between France and Spain
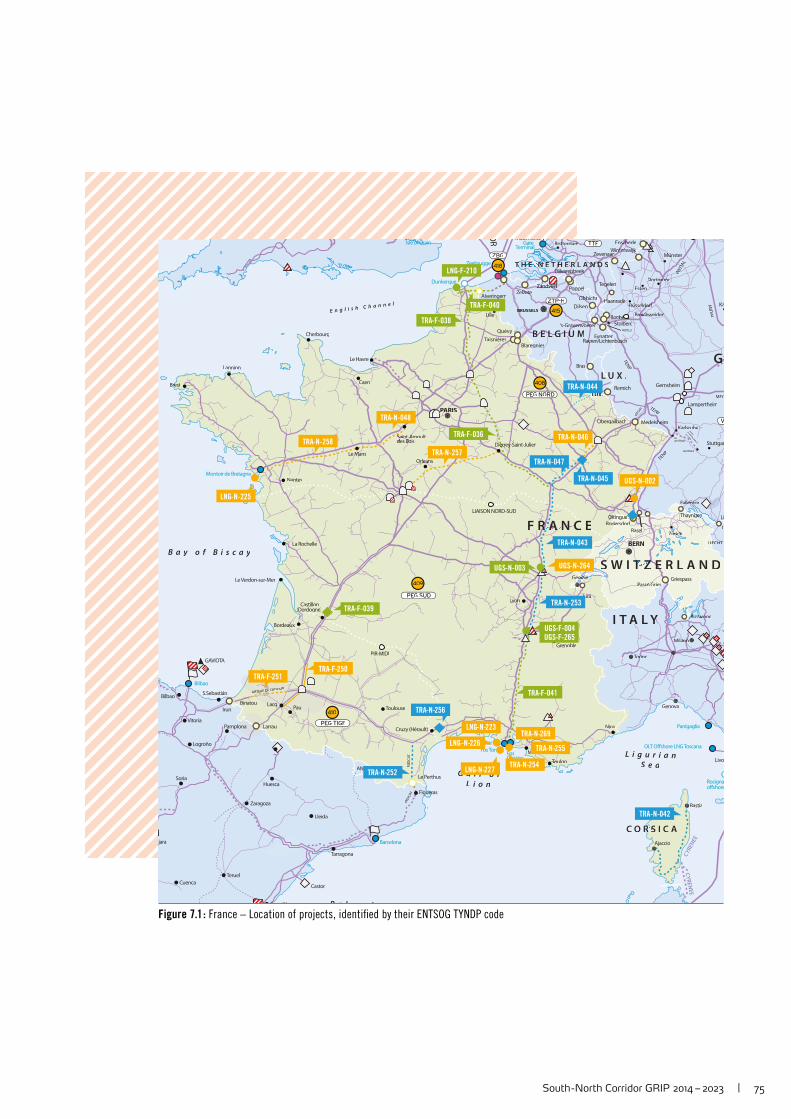
South -North Corridor GRIP 2014 – 2023 | 75
GAVIOTA
Alveringem
Le Perthus
CY
REN
EE
CY
RE
NE
E
OR
MID
CAT
MID
CA
T
ARTERE DE L’ADOURDEDE
MID
AL
WED
AL
DA
W
TENP
TENP
MEG
AL
TENP
BRETELLA
NO
RD
SCHW
ARZWALD
LEITUNG
MEG
Fos Faster
Rosignaoffshore
Dunkerque
Bastia
Ajaccio
Livo
Torinoori
Milanooan
Castillon(D(Dord(Dordogne)(Dordo(D )D
Bordeauxau
Toulouse
Cruzy (Hérault) Nice
Marseillerserar
Grenoble
Caen
Orleanslean
Saint-ArnoultSaaint ASdes Boisdes BoisBo
Dierrey-Saint-JulienyierrD er
Le MansMaLe M
Nantes
Breestree
Lannion
Cherbourg
La Rochelle
Lyononyo
ToulonTo
evaeneGennevanevanevaenene
Jura
Zürichüricüricüricch
BilbaoS.Sebastián
Castor
Pamplona
Logroño
Vitoria
Soria
jara
Zaragoza
Tarragona
C t lló
Teruel
Cuenca
Huesca
Lleida
Le Havre
Le Verdon-sur-Mer
Ka
Essens nngelenTeg nge
Stuttgar
Dortmundmu dundrtm nunDo
LilleLille
DüsseldorfdorfsDü feüssD
MünsterMü
Auam Rheini
Karlsruhe
Leonberg
terdamdRotteR tt damtttte
Genova
Figueras
LacqPau
E n g l i s h C h a n n e l
G u l f o fL i o n
L i g u r i a nS e a
B a l e i
B a y o f B i s c a y
S W I T Z E R L A N DTT ZZZZZZZZ ES
I T A L YYT A
C O R SR S I C AR SR S
GGGG
C EA N C EC EF R ARR A N CNRR AAAA
B E L G I U MUB E L G I UE
D SSH E R L A N DE R LT H E N ET H E N E T HH ET H E N E THH EEEEEEE N E SA N SA N DDDH R A N
L U X .L UL UL U
ECHTLIE T.
AND.
BRUSSELSBB
PARISARPAR
BERNBERB
UX.LUX.LUXLUX.
Bilbao
Barcelona
Fos TonkinFosCavaou
PIR-MIDI
LIAISON NORD-SUD
dersdorfRoderder ftingueOltinguetingueO
MedelsheimMeMe hei
Remich
Bras
PetangePePe ange
ObergailbachaO
Montoir de Bretagne
‘s-Gravenvoerenavenvoer
ObbichthtObb
DilsenHaanradeHaaaanradeHHaaH edee
BocholtzholtzocholtBocho tzztz
ZelzateelzateZandvlietZananndvlieeteteli
tenEynattetennbuschRaeren/Lichtennbusce h
yyQuévy
regniesrBlarere sTaisnières
Poppelpelppel
Zeebrugge
Gate Terminal
Isle of Grain Enschedeschchchsc
ZevenaaraarZ arnaWinterswijkknte wijktersarar
HilvarenbeekaHilvarenbeekH n k
Maasvlakte
Broichweidenoooichwoich enno
Lampertheim
Gernsheim
Li
L
Thayngengenayngenayngenhayngen
Basel
Fallentorntntntenllentoento
StolbergS bStolbe
Griespass
BizzaroneBizzaBizzaro
esPasso GriesesPasso G
BiriatouIrun
Larrau Panigaglia
OLT Offshore LNG Toscana
TTF
V
PEG SUD
PEG NORD
ZTP-H
ZBG
PEG TIGF
408
409
410
415
418
TRA-N-044
TRA-N-045
TRA-F-039
TRA-N-256
TRA-N-047
TRA-N-046
TRA-N-254
TRA-N-253
TRA-N-255
TRA-N-269
TRA-N-257
TRA-N-043
TRA-F-036
TRA-F-038
TRA-F-250 TRA-F-251
TRA-N-252
TRA-N-042
LNG-F-210
UGS-F-004
TRA-F-040
TRA-N-048
UGS-F-265
UGS-N-002
UGS-N-003 UGS-N-264
TRA-N-258
LNG-N-227
LNG-N-226
LNG-N-225
TRA-F-041
LNG-N-223
Figure 7.1 : France – Location of projects, identifi ed by their ENTSOG TYNDP code
76 | South -North Corridor GRIP 2014 – 2023
7.2 Investments in the Northern area of the Region
Fluxys Belgium updates annually its ten-year indicative
investment programme to factor in new market signals
for its three core activities: transmission and storage of
natural gas and terminalling of liquefi ed natural gas
( LNG ). For these updates, due account is taken of the
changing needs for natural gas supply, requests for ad-
ditional connections, new needs of grid users as identi-
fi ed through international market consultations and di-
versifi cation of sources contributing to security of supply
and effective market functioning, among other things.
As part of its indicative investment program for Belgium, Fluxys plans to lay new pipelines, including one between Alveringem and Maldegem linking the future LNG terminal at Dunkirk with the Zeebrugge area and further towards the German markets. Other main topics include the further development of the Zeebrugge LNG terminal as a gateway to Europe and to bolster the potential of natural gas as a transport fuel.
7.2.1 INTERCONNECTION FROM THE DUNKIRK LNG TERMINAL TO THE FRENCH AND BELGIAN NETWORKS : THE DUNKIRK-ZEEBRUGGE LINK
Fluxys is a 25 % partner in the LNG terminal being built at Dunkirk, alongside EDF (65 %) and Total (10 %). Fluxys also has a 49 % stake in Gaz-Opale, a joint venture which will operate the future facility. The terminal is due to be operational by end 2015 and will have a capacity of 13 billion m³ of natural gas per year, which will contribute signifi cantly to strengthening security of supply and to the effective func-tioning of the market in North-West Europe.
Alongside construction of the LNG terminal in Dunkirk, a pipeline will be laid to connect three infrastructures: the Dunkirk LNG terminal as a new gas entry point for Europe, the network of French transmission system operator GRTgaz and Fluxys’ network in Belgium. This combination will allow up to an additional 8 billion m³ of natural gas to be transmitted to Belgium and elsewhere in Europe from the Dunkirk LNG terminal, thereby strengthening security and diversity of supply. The Dunkirk-Zeebrugge pipeline project is a fi rst in Europe. To begin with, it is the result of close cooperation between the national regulators and the system operators concerned. Secondly, it will create cross-border capacity from the Dunkirk LNG terminal in France (also connected to PEG Nord) to the ZTP and Zeebrugge Beach gas trading places in Belgium.
To link up the Dunkirk and Zeebrugge areas, French transmission system operator GRTgaz will lay a pipeline between the Dunkirk LNG terminal and the French- Belgian border. Fluxys Belgium, in turn, will build a new interconnection point in Alveringem and lay a new pipeline between Alveringem and Maldegem that will run for a distance of around 74 km. Based on the current schedule, work on laying the pipeline will start early 2015, with the pipeline itself to come into operation that autumn.
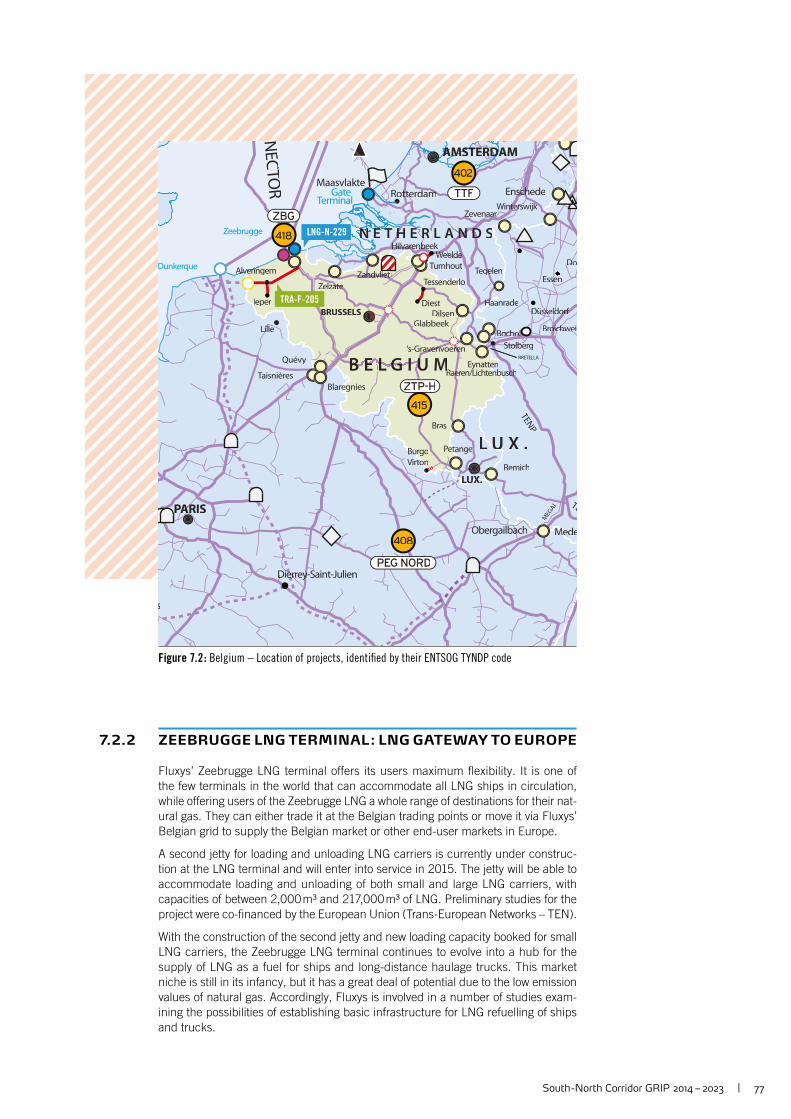
South -North Corridor GRIP 2014 – 2023 | 77
AlverinAlvveringemverinvverinAlvAlvv
NEC
TOR
TENP
TE
MEG
AL
BRETELLA
Dunkerque
s
errey-Saint-JulienyDierrierrD er
Essene
WeeldeWe eeldeeeeldeTurnhoutT
TegelengeDoDDo
LilleLille
dorforfDüsseldssDüs dsseD
terdamdRotteR tt damtttte
B E L G I U MUB E L G I UE
D SSH E R L A N DE R LT H E N ET H E N E T HH ET H E N E THH EEEEEEE N E SA N SA N DDDH R A N
L U X .L UL UL U
BRUSSELSBB
PARISARPAR
DAMDDAMDDADAERDAMSTAMSTERAAAMST RERD
UX.LUX.LUXLUX.
MedeMeMe
Remich
Bras
tangePeteta eBurgoBuBur
onVirtorton
achObergailbaaO
‘s-Gravenvoerenavenvoere
DiestDilsen
Glabbeek
HaanradeHaaaaHHaaHa
oltzltzchoholBocholtzocholtzBochol
Zelzatezate
Ieper
ZandvlietZandandvliett
enEynattenennbuschRaeren/Lichtenbenbusche
MM yQuévy
egnieseBlarereg
Taisnières
rloTessenderdesendesenderl
Zeebrugge
Gate Terminal
Enschedeschchchsc
ZevenaaraZ raaerswijkkWintersnteersw
beekbeHilvarenbHilvarenbH b
Maasvlakte
Broichweidoiichioicichweichi
StolbergStolbe
TTF
PEG NORD
ZTP-H
ZBG
4024
408
415
418 LNG-N-229
TRA-F-205
Figure 7.2 : Belgium – Location of projects, identifi ed by their ENTSOG TYNDP code
7.2.2 ZEEBRUGGE LNG TERMINAL : LNG GATEWAY TO EUROPE
Fluxys’ Zeebrugge LNG terminal offers its users maximum fl exibility. It is one of the few terminals in the world that can accommodate all LNG ships in circulation, while offering users of the Zeebrugge LNG a whole range of destinations for their nat-ural gas. They can either trade it at the Belgian trading points or move it via Fluxys’ Belgian grid to supply the Belgian market or other end-user markets in Europe.
A second jetty for loading and unloading LNG carriers is currently under construc-tion at the LNG terminal and will enter into service in 2015. The jetty will be able to accommodate loading and unloading of both small and large LNG carriers, with capacities of between 2,000 m³ and 217,000 m³ of LNG. Preliminary studies for the project were co-fi nanced by the European Union (Trans-European Networks – TEN).
With the construction of the second jetty and new loading capacity booked for small LNG carriers, the Zeebrugge LNG terminal continues to evolve into a hub for the supply of LNG as a fuel for ships and long-distance haulage trucks. This market niche is still in its infancy, but it has a great deal of potential due to the low emission values of natural gas. Accordingly, Fluxys is involved in a number of studies exam-ining the possibilities of establishing basic infrastructure for LNG refuelling of ships and trucks.
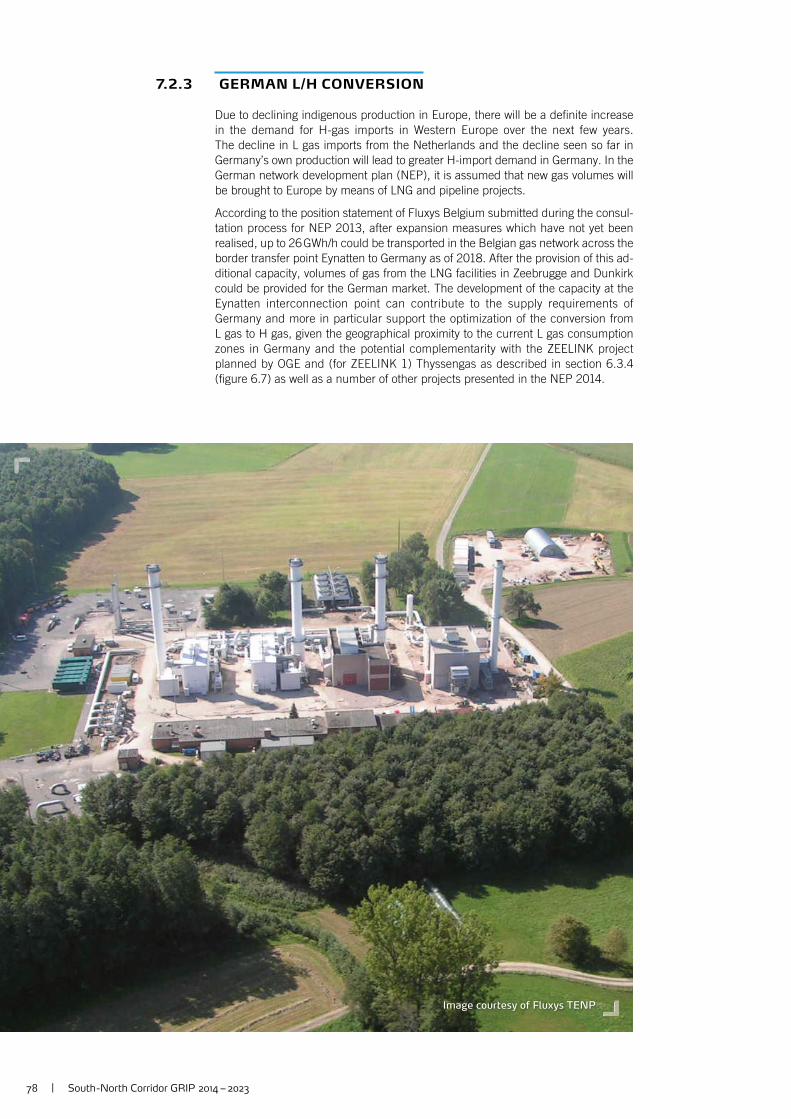
78 | South -North Corridor GRIP 2014 – 2023
Image courtesy of Fluxys TENP
7.2.3 GERMAN L/H CONVERSION
Due to declining indigenous production in Europe, there will be a defi nite increase in the demand for H-gas imports in Western Europe over the next few years. The decline in L gas imports from the Netherlands and the decline seen so far in Germany’s own production will lead to greater H-import demand in Germany. In the German network development plan (NEP), it is assumed that new gas volumes will be brought to Europe by means of LNG and pipeline projects.
According to the position statement of Fluxys Belgium submitted during the consul-tation process for NEP 2013, after expansion measures which have not yet been realised, up to 26 GWh/h could be transported in the Belgian gas network across the border transfer point Eynatten to Germany as of 2018. After the provision of this ad-ditional capacity, volumes of gas from the LNG facilities in Zeebrugge and Dunkirk could be provided for the German market. The development of the capacity at the Eynatten interconnection point can contribute to the supply requirements of Germany and more in particular support the optimization of the conversion from L gas to H gas, given the geographical proximity to the current L gas consumption zones in Germany and the potential complementarity with the ZEELINK project planned by OGE and (for ZEELINK 1) Thyssengas as described in section 6.3.4 (fi gure 6.7) as well as a number of other projects presented in the NEP 2014.
South -North Corridor GRIP 2014 – 2023 | 79
7.3 Investments in the Eastern area of the Region
On 1 April 2014 the German TSOs submitted the draft
German Network Development Plan 2014 ( Draft NDP
2014 ) to the German regulator BNetzA1 ). In this draft
NDP 2014, Germany's gas transmission system opera-
tors ( TSOs ) present the results of their latest network
modelling complete with fi ndings from public consul-
tation and a determination of long-term capacity needs,
in order to meet the requirements of the German
Energy Law ( Energiewirtschaftsgesetz, EnWG ) and
the German Network Access Code ( Gasnetzzugangs-
verordnung ).
This third issue is based on the scenario framework which after public consultation was confi rmed by the German national regulatory agency Bundesnetzagentur (BNetzA) on 16 October 2013.
As proposed by TSOs, network development will require investments of approxi-mately € 1.8 bn by 2019 and a total of € 3.1 bn by 2024.
In general, the current plan confi rms the fi ndings published in the previous NDP 2013. For the period ending 2024 the new NDP has identifi ed the need for addition-al network upgrades mainly resulting from:
y More specifi c information on L/H gas market conversion needs Under the confi rmed scenario framework these needs will much exceed the last
NDP, the changes resulting from an extension of the period under review and current fi ndings regarding detailed market conversion schedules.
y A rise in demand for H gas supplies Additional volumes of H gas to substitute L gas require further improvements of
the gas infrastructure to carry these quantities to Regions in need.
y Greater capacity required for gas storages The signifi cant increase in capacities to be considered and modifi cations to
temperatures curves have added to the need for upgrades.
Security of supply considerations in the NDP 2014 have focused on L/H gas market conversion and resulted in a detailed proposal for the gradual conversion of areas now supplied with L gas to H gas. In addition, the availability of L gas until 2030 has been investigated.
For the period ending 2024 the NDP 2014 has made allowance for the additional H gas volumes needed and allocated them to specifi c H gas supply sources as spec-ifi ed in the scenario framework. Providing an infrastructure in Germany that can take these volumes to the conversion zones is part of the proposed NDP project list.
In both the gas and power sectors, gas-fi red power stations are vital to maintaining today’s high supply security. From a macroeconomic perspective, the dynamic capacity product specially designed for these plants by German TSOs in the NDP 2013 has the potential to meet the needs of this diffi cult to predict market.
1 ) Reference : Draft of the German TSOs for the German NDP 2014 :
http://www.fnb-gas.de/fi les/nep_gas_2014_entwurf_2014-04-01.pdf
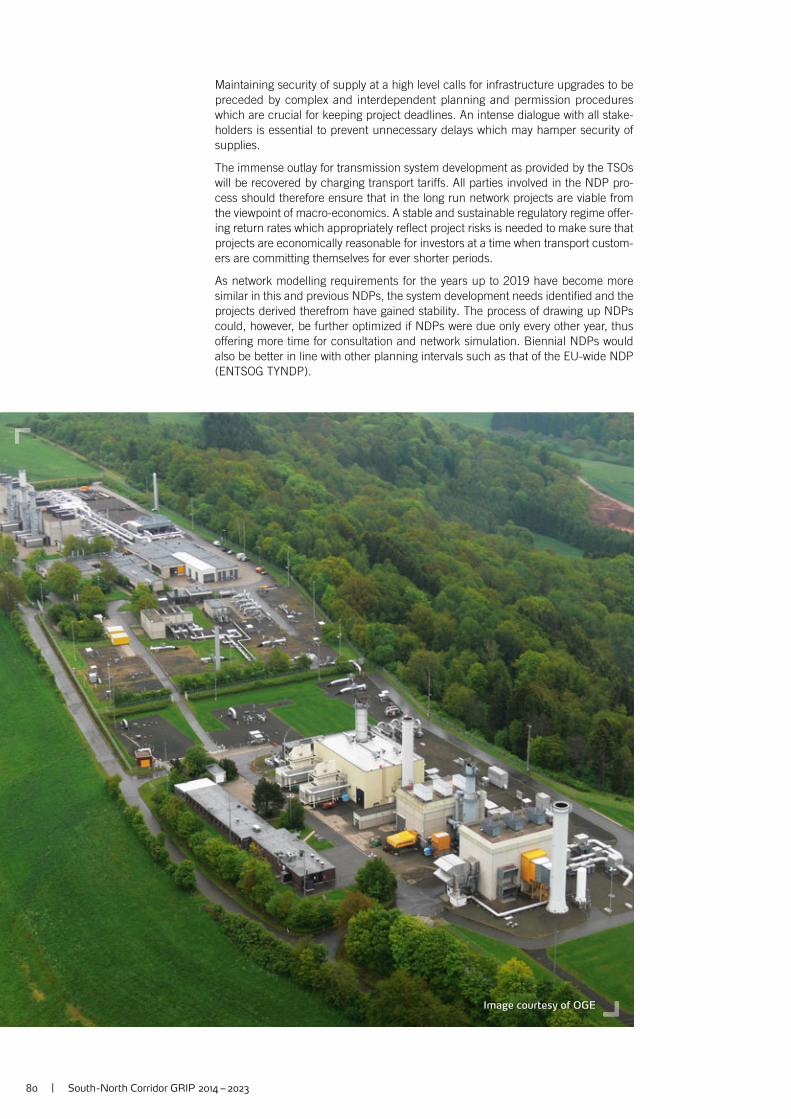
80 | South -North Corridor GRIP 2014 – 2023
Image courtesy of OGE
Maintaining security of supply at a high level calls for infrastructure upgrades to be preceded by complex and interdependent planning and permission procedures which are crucial for keeping project deadlines. An intense dialogue with all stake-holders is essential to prevent unnecessary delays which may hamper security of supplies.
The immense outlay for transmission system development as provided by the TSOs will be recovered by charging transport tariffs. All parties involved in the NDP pro-cess should therefore ensure that in the long run network projects are viable from the viewpoint of macro-economics. A stable and sustainable regulatory regime offer-ing return rates which appropriately refl ect project risks is needed to make sure that projects are economically reasonable for investors at a time when transport custom-ers are committing themselves for ever shorter periods.
As network modelling requirements for the years up to 2019 have become more similar in this and previous NDPs, the system development needs identifi ed and the projects derived therefrom have gained stability. The process of drawing up NDPs could, however, be further optimized if NDPs were due only every other year, thus offering more time for consultation and network simulation. Biennial NDPs would also be better in line with other planning intervals such as that of the EU-wide NDP (ENTSOG TYNDP).
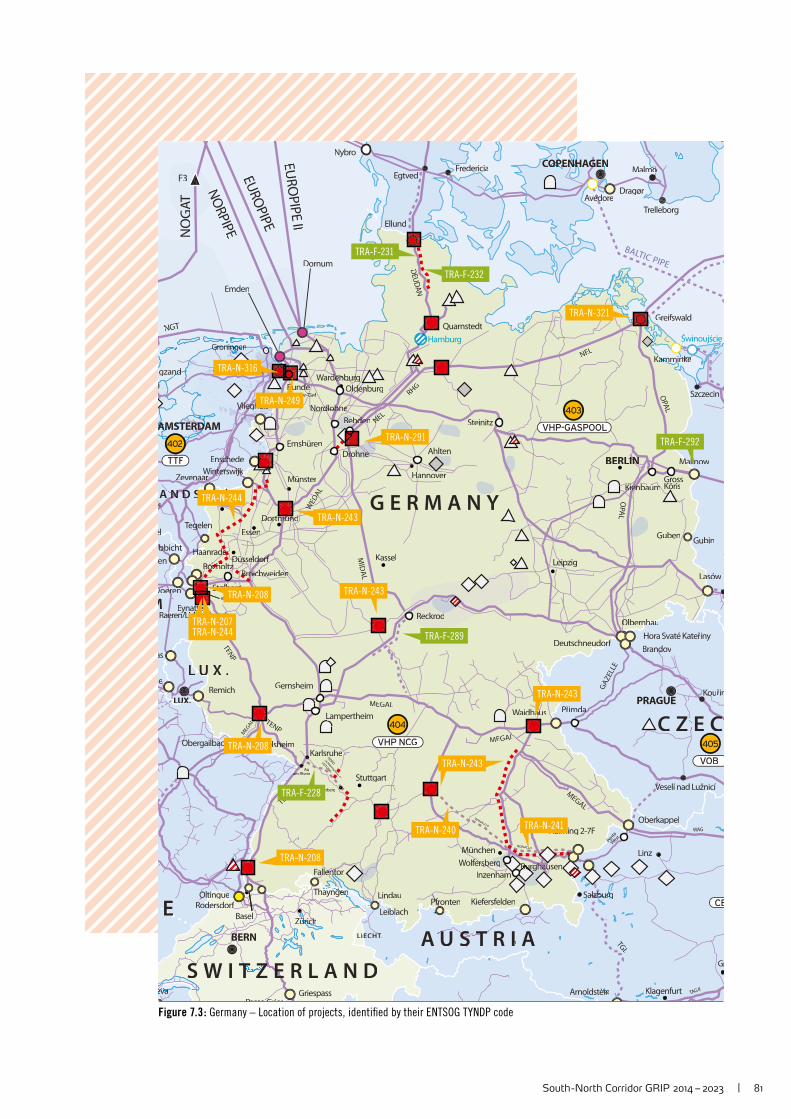
South -North Corridor GRIP 2014 – 2023 | 81
F3
Reckrodd
KamminkenkeKamKammK nkenke
BALTIC PIPE
NO
GGA
T
NO
RPIPE
N
EURO
PIPE
EUR
OP
IPE II
NGT
TGL
MONACO I
MONACO II
NELN
NEL
DEU
DA
N
OPA
L
RHG
MID
AL
WED
AL
DA
W
TENP
TENP
MEG
AL
MEGALL
MEGALTENP
OPA
L
BRETELLA
NO
RD
SCHWARZW
ALDW
LEITUNG
GA
ZEL
LE
TAG II
TA
MEGAL
S
WAG
Hamburg Świnoujście
evaevaevaevae
Zürichüricüricüricch
Kassel
Essens nngelenTeg nge
Stuttgart
MünchenM
HannoverH
rtmundmuDortmunddundrtm nunDo
Klagenfurt
Linz
eldorfdorfDüssesDü feüssD
Gr
ggngGroningenGroningenginoGGroningenG
SzczecinOldenburgenOldede
MünsterMü
MalmömömömöEgtved
Trelleborg
Leipzigeip
Auam Rheinam
Karlsruhe
Leonberg
Salzburgalzalzbzbuburgurgurgzzbbbb
Veselí nad LužnicíV
KouKo řim
Fredericia
S W I T Z E R L A N DTT ZZZZZZZZZ ESS
E CCC Z
G E R M A N YR
S T R I AIIA U S TU S TSSEEE
M
D SSN DA N SA N SA N DDDA N
L U X .L UL UL U
ECHTLIE T.
NNBERLINLIINN
NGENNNOPENHCOPENHAGOPENHCOPENH GEN
PRAGUE
DAMDDDAMDADAERDAAAMSTMSTERAAMST RERD
BERNBERB
UX.LUX.LUXLUX.
dersdorfRoderder ftingueOltinguetingueOO
MedelsheimMeMe hei
Remich
as
ee
achObergailbaaO
voerenvoer
ObbichthtObb
enHaanradeHaaaaHHaaH eedeee
BocholtzzBoc zzocho
tenEynattetennbuschRaeren/Lichtennbusce h
yy
elelel
mdenEmden
Enschedeschchchsc
arrZevenaaaZ rarnaerswijkkwijkWinternteters
arar
Oude StatenzijOudOu Se Se Stattat zijlOO jlOuOude StatenzijljOO nzeOu l
eghuisg uisVliegegVlie
kkk
ndgzandnd
Dornum
Steinitz
Ahlten
denburgdWardenbude urgdenbu g
Quarnstedt
Emsbüren
BundededeeBBunder-Tief-T-T
Broichweidenoooichwoich ennoB
Lampertheim
Gernsheim
Nordlohneohh erdlohneehnrdNo
ehdenRehdenhdede
DrohohneDro nee
PfrontenPfrLindau
blachLeiblabla
Thayngengenayngenayngenhayngen
Basel
Kiefersfelden
BurghausenurghaurghauhauauBuBur nWolfersbergergersbe
Inzenhamm
Haiming 2-7F
Fallentorntntntenllentoento
StolbergbStolb grg
GriespassPasso Griesso G
Arnoldsteineineinein
PřimdaaWaidhausau
orfDeutschneudorforforf
nhauOlbernhaunhaunhauO
Hora Svaté Kateřiny
Brandovd
Greifswald
GrossKörisKienbaumienKieKienbaumen
GubenGubin
asówLaa
MallnowMaMa
AvedoreedDragør
Nybro
Ellund
berkappelOberkappOberkappe
WestPe
nta
TTF
VHP-GASPOOL
VHP NCG
CE
VOB
4024
404
403
405
TRA-F-231
TRA-N-321
TRA-N-291
TRA-N-208
TRA-F-232
TRA-N-316
TRA-N-249
TRA-N-208
TRA-N-240
TRA-F-228
TRA-N-207TRA-N-244
TRA-N-244
TRA-N-243
TRA-N-241
TRA-N-243
TRA-N-243
TRA-F-292
TRA-N-208
TRA-F-289
TRA-N-243
Figure 7.3 : Germany – Location of projects, identifi ed by their ENTSOG TYNDP code
82 | South -North Corridor GRIP 2014 – 2023
7.4 Investments in the Southern area of the Region
This paragraph covers further infrastructure enhance-
ments in the southern area of the Region, additional to
Snam Rete Gas transmission network developments
(“Support to the North West market and bidirectional
cross-border fl ows” projects ) already described in the
previous chapter 6.
Other key projects for Snam Rete Gas transmission network enhancement addition-al to “Support for the North West market and bidirectional cross-border fl ows” pro-jects and having a Regional relevance, also in terms of potential interlinks between South-North Corridor and other Regions are the following initiatives: y Development for new imports from the South y Import developments from North-East y Additional Southern developments
These three new projects are currently planned with commissioning date between 2019 and 2021 and will involve the development of around 1,400 km of new pipe-lines and the installation of around 300 MW of new compression capacity.
y “Development for new imports from the South” (TRA-N-007; included in PCI list with code 6.18): Snam Rete Gas, in line with the fi ndings of SEN (National Energy Strategy), considers the development of new imports from the south, a strategic element to enable greater diversifi cation of energy sources, so as to increase the competitiveness of the gas market and provide greater security to the entire national transmission system.
Snam Rete Gas has therefore planned the construction of a project that will cre-ate new transmission capacity of approximately 24 MSm³/d (equivalent to around 264 GWh/d) to facilitate gas from future entry points in the south.
The project includes the construction of an approximately 430 km-long new pipeline and a compression plant of approximately 33 MW (Sulmona compres-sor station1 )), along the south-north line, known as the “Adriatic Line". The Adriatic Line is functional to transport quantities of gas from any new sourcing initiatives from Sicily and from the middle Adriatic. The Adriatic Line can be seen as a development that has the character of generality and allows the system of gas supply to new Italian imports to be set up, such as the projects of TAP and ITGI and a new LNG plant in Sicily (Porto Empedocle).
The Adriatic Line is included in the list of Projects of Common Interest and in the Snam Rete Gas ten-year plan.
The upgrade work required for the transport of new quantities of gas is currently under feasibility study and the commissioning of the entire project is scheduled for 2019.
y “Import developments from North-East” (TRA-N-008): the project involves the realization of new pipelines to increase the transmission capacity from the northeast, and the connection of a regasifi cation terminal in the northern Adri-atic Region. The construction of an LNG terminal in the northern Adriatic area is included in the PCI list, and the connection to the national network is includ-ed in the Snam Rete Gas ten-year plan.
1 ) The construction of Sulmona CS has been approved to improve the reliability and safety of the transport and also in
relation to the expected increase in withdrawal capacity planned for the Stogit storage fi eld of Fiume Treste.
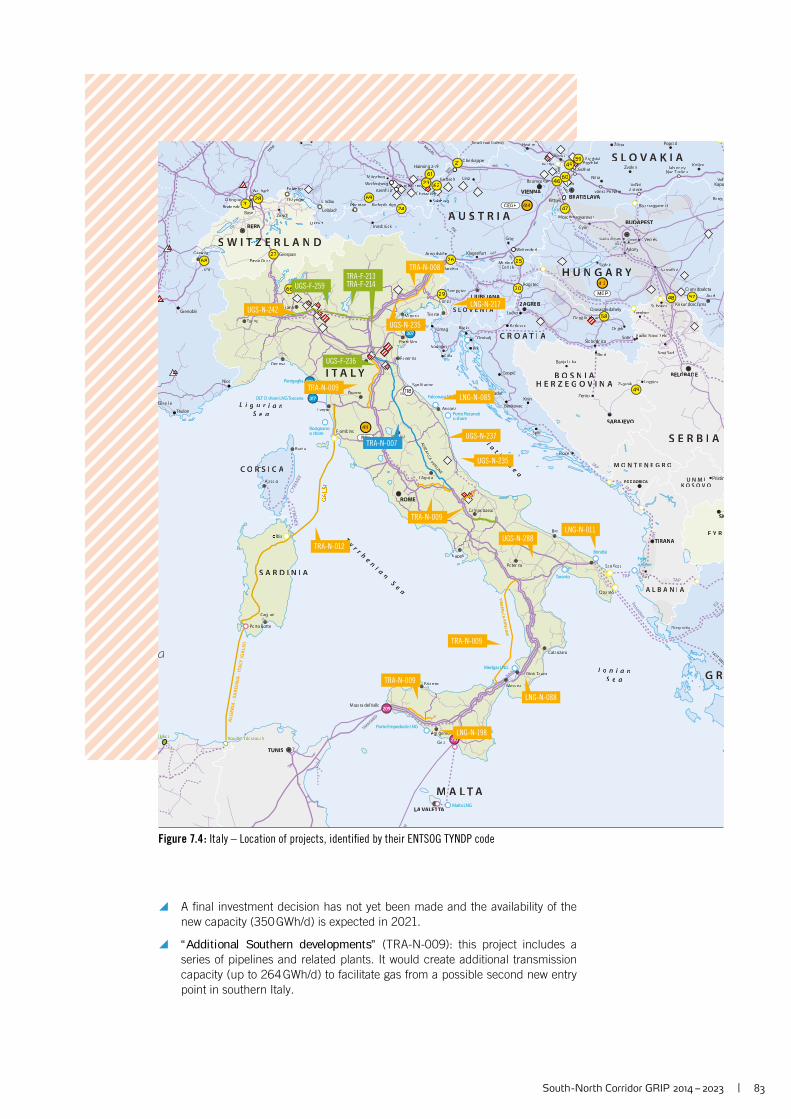
South -North Corridor GRIP 2014 – 2023 | 83
Porto BBBBotte
Subototica
Somboom rr
Ballasssaaggyay rmaatt
Reinthal
Piombino
OOtrantttoooo
San Foca
lbia
Skikda Koudieeeetttt EEEEddraouch
Poseidon
CY
REN
EE
CY
RE
NE
E
AL
GE
RIA
- S
AR
DIN
IA -
IT
ALY
(G
AL
SI)
TAP
TRANSMED
AM
T
IGI
South Stream
South Stream
SouthStream
South
TAP
IAP
IAP
IAP
EAST MED
IC
AB
TGL
Sou
th Stream
MONACO I
MONACO II
AD
RIA
TIAA
CA
PIPELINE
MEGALTENP
TAG
TAG II
TAG I
SOL
WAG
HA
G
Porto Empedocle LNG
Krk
Falconara Marittima LNG
Porto Recanatio shore
Rosignanoo shore
Medgas LNG
Brindisi
Taranto
Fiere
o shore
Malta LNG
Pristin
Arad
Zenica
Banjn a Luka
Loznica
KoKK šice
PopradŽilina
Zvolevv n
VeVV ľkľľ ékkZlievcvv e
NadTuTT rňrr ouJablonov
VecVV sés
Siófoff kVVaaVVV rosffölöffff dd
Adony
GGyyőyy r
CsepelSzázhalommbbatta
Ercsii
HosHo tim
Napoli
Bari
Potenza
Cammppoobasso
Peruugggiia
Bastia
AjA accio
Ancona
L’LLALL’LL quila
MMMMessina
GioiaTaTT uuuuro
Catanzaro
Palermo
FFiirrene ze
Livovv rnnnnoooo
Bologna
TooTT rrino
Milananoo
TrTT ento
Poooorrrttttooo
Ravenv na
San Marino
Viro
AAAAggggriigegg nto
SSlol boodddnica
Brod
Osijei k
Sotin Bačkokk No ovovv Selo
Nice
Marrrrsseeille
Grenoble
TTouoTTTT lon
G eeeeeennenneeenenevvvaaaa
Jura
Züüüürrrricicicichh
Cagliari
KKKKrrrrkkk
Puuuulla
VododododVV njajan n
Umag Rijejjjei ka Karlovac
Lučko
Gospič
Knin
Split
Ploče
Benkovac
Zadar
Omisaljl
MMünchen
Novi Sad
Innsbrück
Klagenfurt
Linz
Graz
Leonberg
Salzalzalzzzbbbbbbbbuuuuurrrrgggg
Nitra
Prii NNiittrreeIvánka
VVeVV selí nad Lužnicí
Genova
VVVVeVV nezia
BBřřeeřřř clav
FFieier
a
Ad
ri a
ti c
Se
a
Ty
r r he
ni a
nS
ea
L i g u r i a nS e a
I o n i a nS e a
H UUUUUUUUU NNN G A R YY
A L B A N I A
M A L T A
S E R B I A
B O S N I AAH E R Z E G O V I N A
M O N T E N E G R O
F Y R
SS W I T ZTT ZZZZZZZZ EE R L A N D
I T A L Y
N IS A R D I A
C O R SR S IR SR S C A
S L O V A K I A
AAAA UUU SS T R I A
G R
C R O A T I A
S LL O V E N I A
U N M IK O S O V O
LIECHE TT.
S.MS
ThTT esprotia
TUNIS
PESBUDAPEDD SA T
VIENNA
BELGGRRAADDE
ZAGREBBLJUBLBLJJANA A
SARAJEVO
PODGORICA
BERN
SK
LA VALEVV TTATT
TIT RANA
ROME
BBRATISAA LAVAA AVVWWaWW llbach
OOlt nginginguuuue
R eodedderrrsdorff PfPfrrffff ontenLindau
Leibbbblllaaach
Thhayngeegegeennnnn
Basel
Kiefeff rsfeff lden
BBBuuuurrgghhaaaahahaauuuusennWolWW fererff ssbeebb rrgg
Inzenhamm
Haiming 2-7F
Fallleeleennnnnnntttttor
Griespass
BBBizzaazazz rrono e
PPaasssoso GGrrriiieeess
Panigaglia
OLT O shore LNG Toscana
Porto LevanteCavarzere
Arnoldsteieieieinnnn
TTTaTTT rvisio
GGGGGGooorizia
TrTT ieste
Sempeter
MMMMurfffeff llldddd
RRRogatecc
Cersakv
Kiskunnndod rozzsmsma
Csanaddpa oloota
DDrravaszzeerdahelyy
Donji MMiihohohoohollaac
Kittseseeee
Mososonnmmn agggagyyyayy rovar
BaBaumu gartteennLLLááább
Brodskékk
Bereg
KapuVeVV ľ
WeWW itendoorrrfff
Zvovv rnik
Gela
Mazara delVallVV o
OObebb rkappeppel
WestPe
nta LanžhLaL ot
Brodskékk
k
S
PSV
MGP
CEGH
411
414
413
21
23
Über ccacackkkkeeeekkkk rrrrnnnnn
HHaiaiddach
g
61
62
24
6928e
rff31
2768
6629
26 25
30
47
48 57
c 58
49
4660
5945
M.118
306
317
307
209
210
LNG-N-085
LNG-N-217
LNG-N-088
LNG-N-198
UGS-N-237
UGS-N-288LNG-N-011
TRA-N-012
TRA-N-007
TRA-N-009
TRA-N-009
TRA-N-009
TRA-N-009
UGS-F-236
UGS-F-259
TRA-F-213TRA-F-214
UGS-N-242
UGS-N-235
UGS-N-235
TRA-N-008
TIR
RE
NIC
A P
IPE
LIN
E
Figure 7.4 : Italy – Location of projects, identifi ed by their ENTSOG TYNDP code
y A fi nal investment decision has not yet been made and the availability of the new capacity (350 GWh/d) is expected in 2021.
y “Additional Southern developments” (TRA-N-009): this project includes a series of pipelines and related plants. It would create additional transmission capacity (up to 264 GWh/d) to facilitate gas from a possible second new entry point in southern Italy.
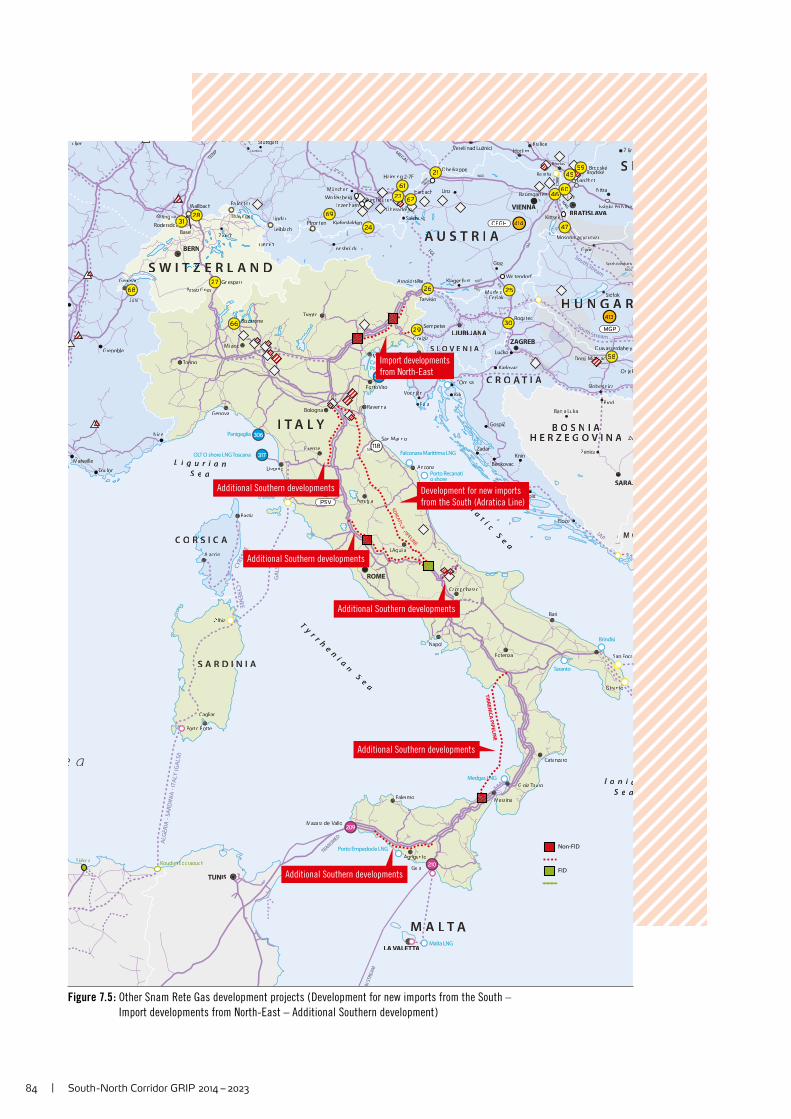
84 | South -North Corridor GRIP 2014 – 2023
Porto BBBBotte
Reinthal
Piombino
OOtrantttoooo
San Foca
lbia
SSkikda Koudieeeetttt EEEEddraouch
CY
REN
EE
CY
RE
NE
E
AL
GE
RIA
- S
AR
DIN
IA -
IT
AL
Y (
GA
LS
I)
TRANSMED
EN S
TREA
M
South Stream
South Stream
SouthStream
IAP
IC
AB
TGL
MONACO I
MONACO II
AD
RIA
TIAA
CA
PIPELINE
MEGALTENP
WA
WWLD
TAG
TAG II
TAG ISO
L
WAG
HA
G
Porto Empedocle LNG
Krk
Falconara Marittima LNG
Porto Recanatio shore
Rosignanoo shore
Medgas LNG
Brindisi
Taranto
Malta LNG
Zenica
Banjn a Luka
Žilina
Siófoff k
GGyyőyy r
Százhalommbbatta
Ercsii
KKraliceHosHo tim
Napoli
Bari
Potenza
Cammppoobasso
Peruugggiia
Bastia
AjA accio
Ancona
L’LLALL’LL quila
MMMMessina
GioiaTaTT uuuuro
Catanzaro
Palermo
FFiirrene ze
Livovv rnnnnoooo
Bologna
TooTT rrino
Milananoo
TrTT ento
Poooorrrttttooo
Ravenvv na
San Marino
Viro
AAAAggggriigegg nto
SSlol boodddnica
Brod
Osijei k
S
Nice
Marrrrsseeille
Grenoble
t-J- ulien
TTouoTTTT lon
G eeeeeennenneeenenevvvaaaa
Jura
Züüüürrrricicicichh
Cagliari
KKKKrrrrkkk
Puuuulla
VododododVV njajan n
Umag Rijejjjei ka Karlovac
Lučko
Gospič
Knin
Split
Ploče
Benkovac
Zadar
Omisaljl
Stuttgart
MMünchen
Innsbrück
Klagenfurt
Linz
Graz
am Rhein
Leonberg
Salzalzalzzzbbbbbbbbuuuuurrrrgggg
Nitra
Prii NNiittrreeIvánka
VVeVV selí nad Lužnicí
Genova
VVVVeVV nezia
BBřřeeřřř clav
e a
Ad
ri a
ti c
Se
a
Ty
r r he
ni a
nS
ea
L i g u r i a nS e a
I o n i aS e a
H UUUUUUUUU NNN G A R
M A L T A
B O S N I AAH E R Z E G O V I N A
M O
SS W I T ZTT ZZZZZZZZZ EE R L A N D
I T A L Y
N IS A R D I A
C O R SR S IR SR S C A
S L
AAAA UUU SS T R I A
C R O A T I A
S LL O V E N I A
LIECHE TT.
S.MS
TUNIS
VIENNA
ZAGREBBLJUBLBLJJANA A
SARAJ
BERN
LA VALEVV TTATT
ROME
BBRATISAA LAVAA AVV
u
WWaWW llbach
OOlt nginginguuuue
R eodedderrrsdorff PfPfrrffff ontenLindau
Leibbbblllaaach
Thhayngeegegeennnnn
Basel
Kiefeff rsfeff lden
BBBuuuurrgghhaaaahahaauuuusennWolWW fererff ssbeebb rrgg
Inzenhamm
Haiming 2-7F
Fallleeleennnnnnntttttor
Griespass
BBBizzaazazz rrono e
PPaasssoso GGrrriiieeess
Panigaglia
OLT O shore LNG Toscana
Porto LevanteCavarzere
Arnoldsteieieieinnnn
TTTaTTT rvisio
GGGGGGGooorizia
TrTT ieste
Sempeter
MMMMurfffeff llldddd
RRRogatecc
Cersakv
DDrravaszzeerdahelyy
Donji MMiihohohoohollaac
Kittseseeee
Mososonnmmn agggagyyyayy rovar
BaBaumu gartteennLLLááább
Brodskékk
WeWW itendoorrrfff
Zv
Gela
Mazara delVallVV o
OObebb rkappeppel
WestPe
nta LanžhLaL ot
Brodskékk
k
PSV
MGP
CEGH
411
414
413
21
23
Über ccacackkkkeeeekkkkkk rrrrnnnnn
HHaiaiddach
g
61
62
24
6928e
rff31
2768
6629
26 25
30
47
c 58
4660
5945
M.118
306
317
307
209
210
Development for new imports
from the South (Adratica Line)
GA
LS
I
Import developments
from North-East
TIR
RE
NIC
A P
IPE
LIN
E
Non-FID
FID
Additional Southern developments
Additional Southern developments
Additional Southern developments
Additional Southern developments
Additional Southern developments
Figure 7.5 : Other Snam Rete Gas development projects ( Development for new imports from the South –
Import developments from North-East – Additional Southern development )
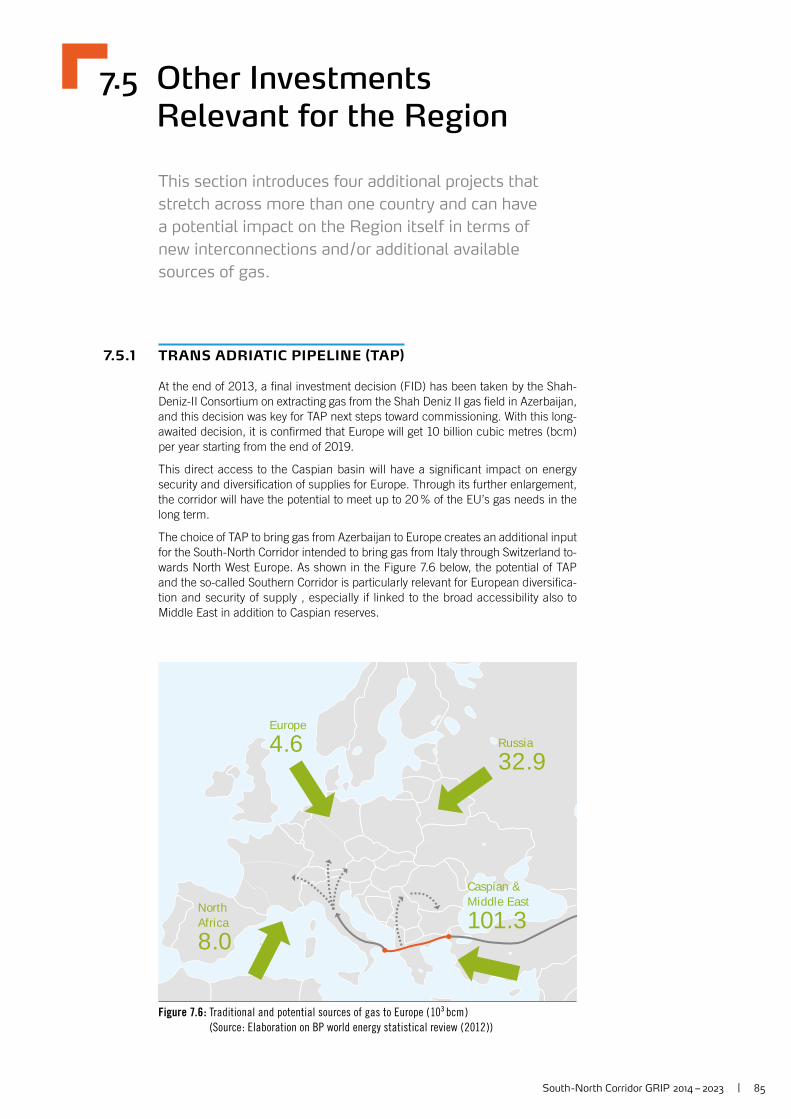
South -North Corridor GRIP 2014 – 2023 | 85
NorthAfrica
8.0
Caspian & Middle East
101.3
Europe
4.6 Russia
32.9
Figure 7.6 : Traditional and potential sources of gas to Europe ( 10³ bcm )
(Source : Elaboration on BP world energy statistical review ( 2012 ))
7.5 Other Investments Relevant for the Region
This section introduces four additional projects that
stretch across more than one country and can have
a potential impact on the Region itself in terms of
new interconnections and / or additional available
sources of gas.
7.5.1 TRANS ADRIATIC PIPELINE (TAP)
At the end of 2013, a fi nal investment decision (FID) has been taken by the Shah-Deniz-II Consortium on extracting gas from the Shah Deniz II gas fi eld in Azerbaijan, and this decision was key for TAP next steps toward commissioning. With this long-awaited decision, it is confi rmed that Europe will get 10 billion cubic metres (bcm) per year starting from the end of 2019.
This direct access to the Caspian basin will have a signifi cant impact on energy security and diversifi cation of supplies for Europe. Through its further enlargement, the corridor will have the potential to meet up to 20 % of the EU’s gas needs in the long term.
The choice of TAP to bring gas from Azerbaijan to Europe creates an additional input for the South-North Corridor intended to bring gas from Italy through Switzerland to-wards North West Europe. As shown in the Figure 7.6 below, the potential of TAP and the so-called Southern Corridor is particularly relevant for European diversifi ca-tion and security of supply , especially if linked to the broad accessibility also to Middle East in addition to Caspian reserves.
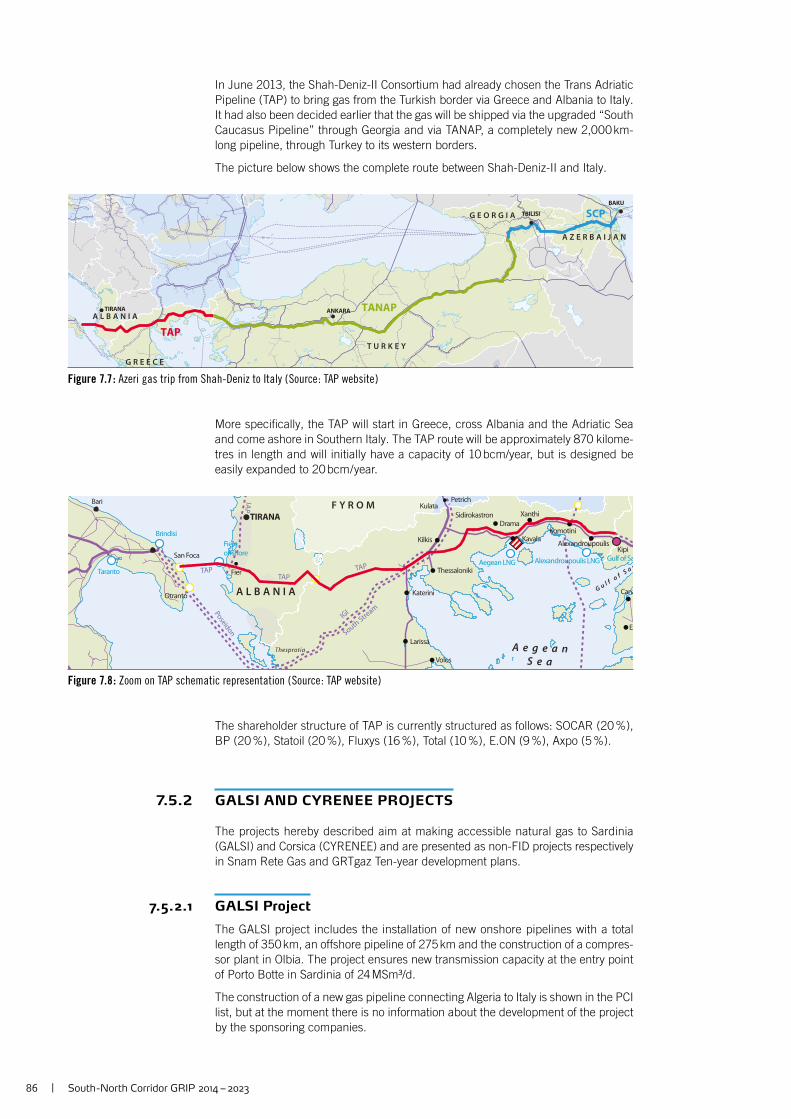
86 | South -North Corridor GRIP 2014 – 2023
SCP
TANAP
TAP
G E O R G I A
T U R K E Y
A L B A N I A
G R E E C E
A Z E R B A I J A N
TBILISI
TIRANA ANKARA
BAKU
Figure 7.7 : Azeri gas trip from Shah-Deniz to Italy ( Source : TAP website )
Otranto
San Foca
Poseidon
TAP TAP
IGI
South Stre
am
TAP
IAP
Aegean LNG Alexandroupoulis LNG Gulf of Sa
G u l f o f S a r
Brindisi
Taranto
Fiere
offshore
Cana
Ez
Volos
Larissa
Katerini
Thessaloniki
Kilkis
Drama
Kavala
Xanthi
Komotini
Alexandroupoulis
Bari
Fier
A e g e a nS e a
A L B A N I A
F Y R O M
Thesprotia
TIRANA
Kipi
SidirokastronKulata
Petrich
Figure 7.8 : Zoom on TAP schematic representation ( Source : TAP website )
In June 2013, the Shah-Deniz-II Consortium had already chosen the Trans Adriatic Pipeline (TAP) to bring gas from the Turkish border via Greece and Albania to Italy. It had also been decided earlier that the gas will be shipped via the upgraded “South Caucasus Pipeline” through Georgia and via TANAP, a completely new 2,000 km-long pipeline, through Turkey to its western borders.
The picture below shows the complete route between Shah-Deniz-II and Italy.
More specifi cally, the TAP will start in Greece, cross Albania and the Adriatic Sea and come ashore in Southern Italy. The TAP route will be approximately 870 kilome-tres in length and will initially have a capacity of 10 bcm/year, but is designed be easily expanded to 20 bcm / year.
The shareholder structure of TAP is currently structured as follows: SOCAR (20 %), BP (20 %), Statoil (20 %), Fluxys (16 %), Total (10 %), E.ON (9 %), Axpo (5 %).
7.5.2 GALSI AND CYRENEE PROJECTS
The projects hereby described aim at making accessible natural gas to Sardinia (GALSI) and Corsica (CYRENEE) and are presented as non-FID projects respectively in Snam Rete Gas and GRTgaz Ten-year development plans.
7.5.2.1 GALSI Project
The GALSI project includes the installation of new onshore pipelines with a total length of 350 km, an offshore pipeline of 275 km and the construction of a compres-sor plant in Olbia. The project ensures new transmission capacity at the entry point of Porto Botte in Sardinia of 24 MSm³/d.
The construction of a new gas pipeline connecting Algeria to Italy is shown in the PCI list, but at the moment there is no information about the development of the project by the sponsoring companies.
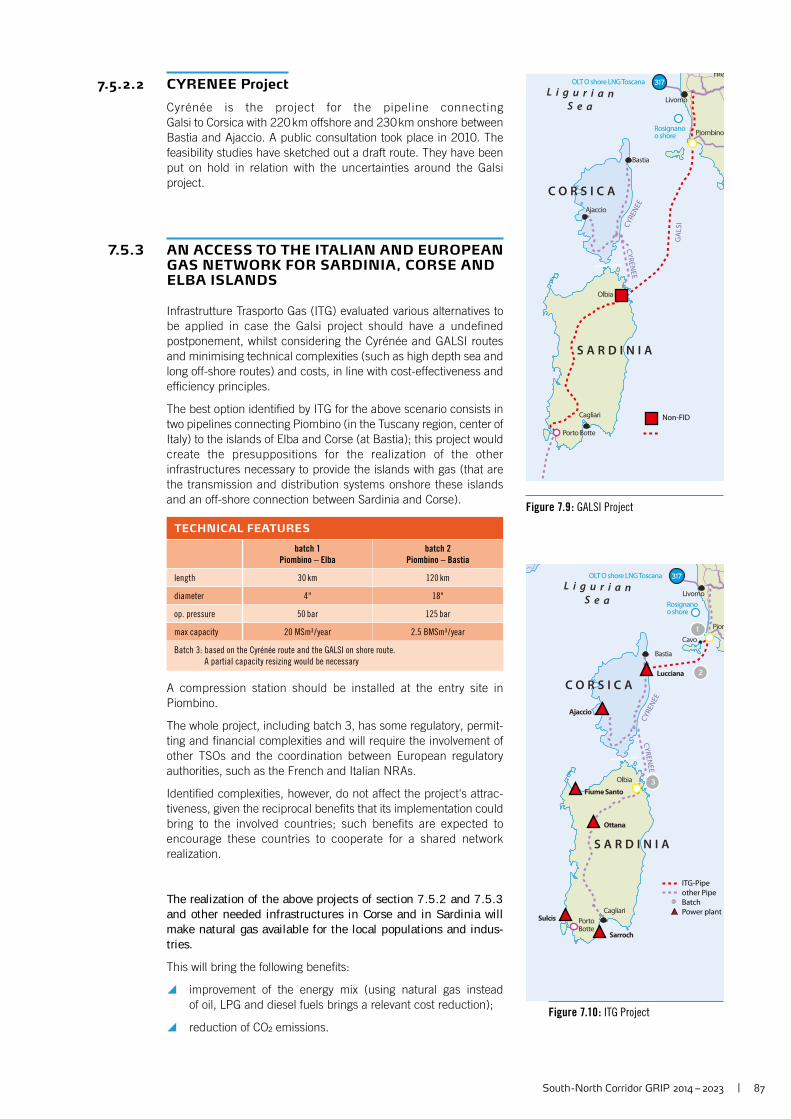
South -North Corridor GRIP 2014 – 2023 | 87
Porto Botte
Piombino
Olbia
CY
REN
EE
CY
RE
NE
E
Rosignanoo shore
Bastia
Ajaccio
Fire
Livorno
Cagliari
L i g u r i a nS e a
S A R D I N I A
C O R S I C A
OLT O shore LNG Toscana 317
GA
LS
I
Non-FID
Figure 7.9 : GALSI Project
Porto Botte
Piom
Olbia
CY
REN
EE
CY
RE
NE
E
Rosignanoo shore
Bastia
Cavo
Ajaccio
Fiume Santo
Ottana
Sarroch
Sulcis
Lucciana
Livorno
Cagliari
L i g u r i a nS e a
S A R D I N I A
C O R S I C A
OLT O shore LNG Toscana 317
ITG-Pipeother PipeBatchPower plant
1
2
3
Figure 7.10 : ITG Project
7.5.2.2 CYRENEE Project
Cyrénée is the project for the pipeline connecting Galsi to Corsica with 220 km offshore and 230 km onshore between Bastia and Ajaccio. A public consultation took place in 2010. The feasibility studies have sketched out a draft route. They have been put on hold in relation with the uncertainties around the Galsi project.
7.5.3 AN ACCESS TO THE ITALIAN AND EUROPEAN GAS NETWORK FOR SARDINIA, CORSE AND ELBA ISLANDS
Infrastrutture Trasporto Gas (ITG) evaluated various alternatives to be applied in case the Galsi project should have a undefi ned postponement, whilst considering the Cyrénée and GALSI routes and minimising technical complexities (such as high depth sea and long off-shore routes) and costs, in line with cost-effectiveness and effi ciency principles.
The best option identifi ed by ITG for the above scenario consists in two pipelines connecting Piombino (in the Tuscany region, center of Italy) to the islands of Elba and Corse (at Bastia); this project would create the presuppositions for the realization of the other infrastructures necessary to provide the islands with gas (that are the transmission and distribution systems onshore these islands and an off-shore connection between Sardinia and Corse).
TECHNICAL FEATURES
batch 1
Piombino – Elba
batch 2
Piombino – Bastia
length 30 km 120 km
diameter 4" 18"
op. pressure 50 bar 125 bar
max capacity 20 MSm³ / year 2.5 BMSm³ / year
Batch 3: based on the Cyrénée route and the GALSI on shore route.
A partial capacity resizing would be necessary
A compression station should be installed at the entry site in Piombino.
The whole project, including batch 3, has some regulatory, permit-ting and fi nancial complexities and will require the involvement of other TSOs and the coordination between European regulatory authorities, such as the French and Italian NRAs.
Identifi ed complexities, however, do not affect the project's attrac-tiveness, given the reciprocal benefi ts that its implementation could bring to the involved countries; such benefi ts are expected to encourage these countries to cooperate for a shared network realization.
The realization of the above projects of section 7.5.2 and 7.5.3 and other needed infrastructures in Corse and in Sardinia will make natural gas available for the local populations and indus-tries.
This will bring the following benefi ts:
y improvement of the energy mix (using natural gas instead of oil, LPG and diesel fuels brings a relevant cost reduction);
y reduction of CO² emissions.
Image courtesy of GRTgaz
Network Modelling
Introduction | Modelled cases
South-North Corridor capacities
Assessment results
South -North Corridor GRIP 2014 – 2023 | 89
8.1 Introduction
For this second version of the GRIP South-North Corridor
numerous cases have been simulated using the
ENTSOG Network Modelling tool ( NeMo )1 ), which tries
to satisfy demand throughout Europe with the consid-
ered supply sources taking into account technical inter-
connection capacities between different market zones.
This represents an evolution compared to the previous report of this Region where no modelling was taken into account. The cases considered represent variations on scenarios considered in TYNDP 2013 – 2022, with updated information with regard to demand and project data. It is to be noted that network assessment is always performed at a European-wide scale but for demand variations, considered project clusters, disruption scenarios and output, closer attention is given to the Corridor specifi cities.
8.2 Modelled Cases
In total, 156 cases have been processed through the NeMo tool for this specifi c GRIP. The case specifi cities are a result of variations on behalf of the considered year, demand profi les throughout Europe, infrastructure clusters, and supply situa-tions including possible disruptions.
8.2.1 YEARS
For the purpose of this GRIP, the years 2014, 2018 and 2023 were taken into account, with the latter two being the most relevant ones with regard to the foreseen commissioning date of the main projects in the Region.
8.2.2 INFRASTRUCTURE
As in TYNDP two different infrastructure clusters were considered as a combination of existing infrastructure and future projects depending on their FID status. Two specifi c additional clusters have been taken into account. One by adding all PCI projects (as a result of the fi rst PCI selection round) and another one by adding only the core projects bridging the South-North corridor to the existing infrastructure plus projects that already proceeded to FID status. This last infrastructure cluster focuses on the fl ow reversal at the interconnection points Passo Gries, Oltingue and Wallbach, in this way making possible to transport gas from Italy towards the North West European markets. Projects in Italy, Switzerland and Germany related to this cluster are taken into account as from the simulated year of 2018. The project TAP offers a new possible entry of gas for Italy and a new potential gas source for Europe as a whole in terms of supply diversifi cation and is taken into account for the 2023 simulation year.
1 ) More details on the ENTSOG simulation tool and methodology can be found in the Methodology chapter of
TYNDP 2013 – 2022.
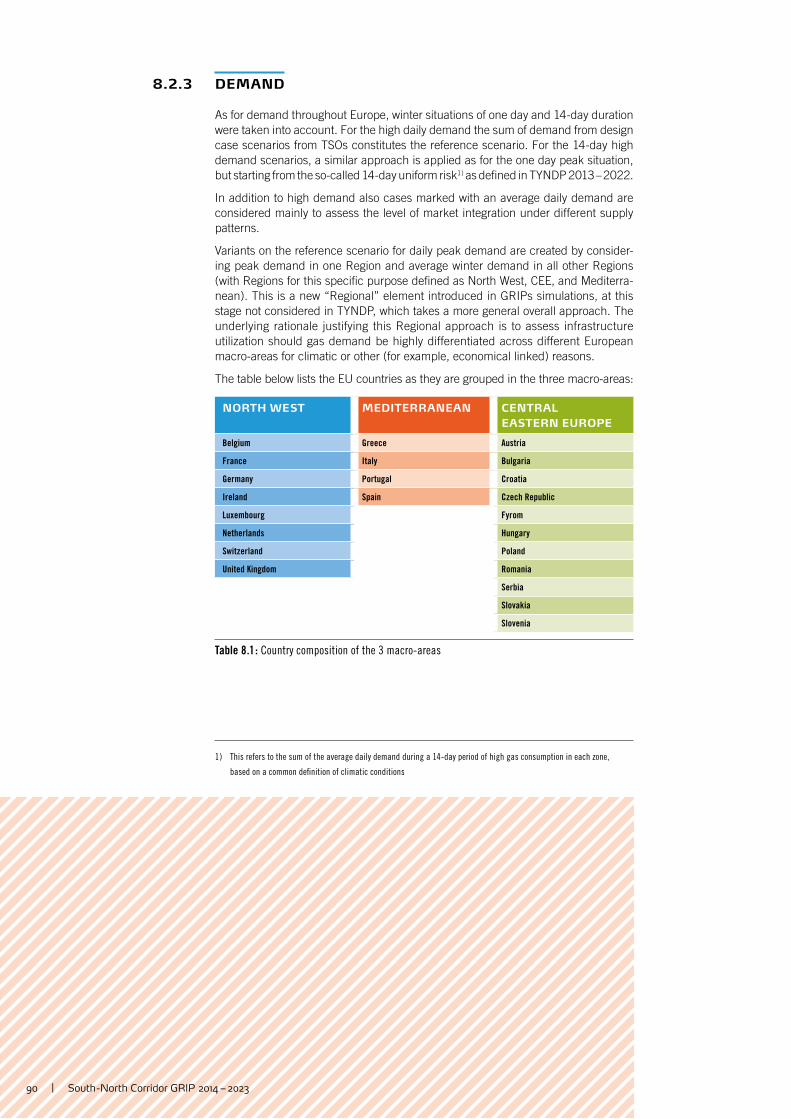
90 | South -North Corridor GRIP 2014 – 2023
8.2.3 DEMAND
As for demand throughout Europe, winter situations of one day and 14-day duration were taken into account. For the high daily demand the sum of demand from design case scenarios from TSOs constitutes the reference scenario. For the 14-day high demand scenarios, a similar approach is applied as for the one day peak situation, but starting from the so-called 14-day uniform risk1 ) as defi ned in TYNDP 2013 – 2022.
In addition to high demand also cases marked with an average daily demand are considered mainly to assess the level of market integration under different supply patterns.
Variants on the reference scenario for daily peak demand are created by consider-ing peak demand in one Region and average winter demand in all other Regions (with Regions for this specifi c purpose defi ned as North West, CEE, and Mediterra-nean). This is a new “Regional” element introduced in GRIPs simulations, at this stage not considered in TYNDP, which takes a more general overall approach. The underlying rationale justifying this Regional approach is to assess infrastructure utilization should gas demand be highly differentiated across different European macro-areas for climatic or other (for example, economical linked) reasons.
The table below lists the EU countries as they are grouped in the three macro-areas:
NORTH WEST MEDITERRANEAN CENTRAL
EASTERN EUROPE
Belgium Greece Austria
France Italy Bulgaria
Germany Portugal Croatia
Ireland Spain Czech Republic
Luxembourg Fyrom
Netherlands Hungary
Switzerland Poland
United Kingdom Romania
Serbia
Slovakia
Slovenia
Table 8.1 : Country composition of the 3 macro-areas
1 ) This refers to the sum of the average daily demand during a 14-day period of high gas consumption in each zone,
based on a common defi nition of climatic conditions
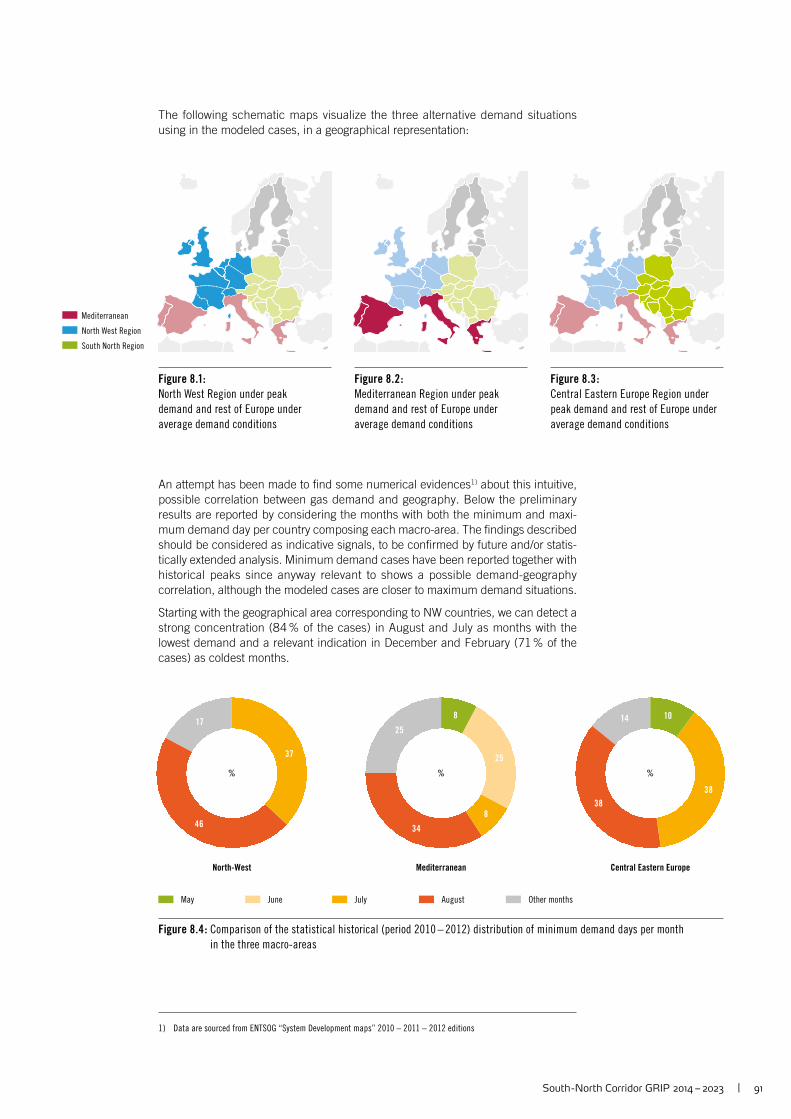
South -North Corridor GRIP 2014 – 2023 | 91
37
46
17
% %
8
25
8
34
25
%
10
38
38
14
May June July August Other months
North-West Mediterranean Central Eastern Europe
Figure 8.4 : Comparison of the statistical historical (period 2010 – 2012) distribution of minimum demand days per month
in the three macro-areas
North West Region
Mediterranean
South North Region
Figure 8.2 :
Mediterranean Region under peak
demand and rest of Europe under
average demand conditions
Figure 8.1:
North West Region under peak
demand and rest of Europe under
average demand conditions
Figure 8.3 :
Central Eastern Europe Region under
peak demand and rest of Europe under
average demand conditions
The following schematic maps visualize the three alternative demand situations using in the modeled cases, in a geographical representation:
An attempt has been made to fi nd some numerical evidences1 ) about this intuitive, possible correlation between gas demand and geography. Below the preliminary results are reported by considering the months with both the minimum and maxi-mum demand day per country composing each macro-area. The fi ndings described should be considered as indicative signals, to be confi rmed by future and/or statis-tically extended analysis. Minimum demand cases have been reported together with historical peaks since anyway relevant to shows a possible demand-geography correlation, although the modeled cases are closer to maximum demand situations.
Starting with the geographical area corresponding to NW countries, we can detect a strong concentration (84 % of the cases) in August and July as months with the lowest demand and a relevant indication in December and February (71 % of the cases) as coldest months.
1 ) Data are sourced from ENTSOG “System Development maps” 2010 – 2011 – 2012 editions
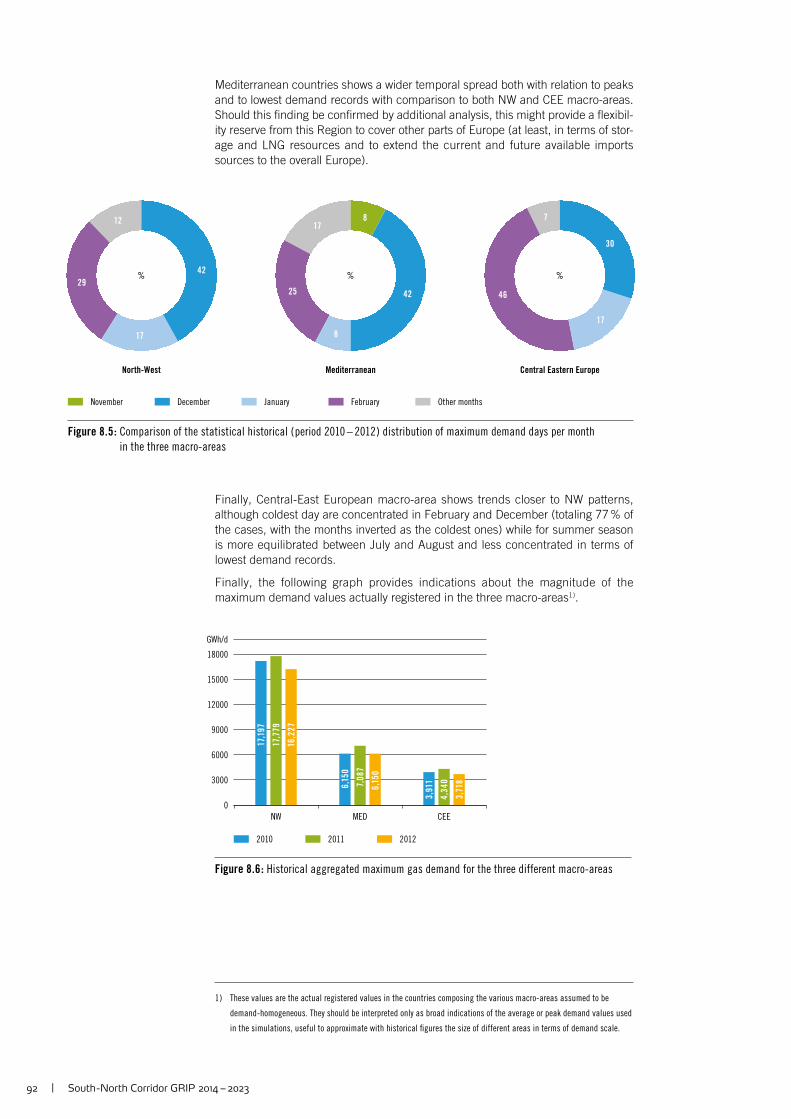
92 | South -North Corridor GRIP 2014 – 2023
42
17
29
12
% %
8
42
8
25
17
%
30
17
46
7
November December January February Other months
North-West Mediterranean Central Eastern Europe
Figure 8.5 : Comparison of the statistical historical ( period 2010 – 2012 ) distribution of maximum demand days per month
in the three macro-areas
0
18000
15000
12000
9000
3000
6000
GWh/d
NW MED CEE
2010 2011 2012
17,1
97
6,1
50
3,91
1
17,7
79
7,0
87
4,3
40
16,2
27
6,1
50
3,71
8
Figure 8.6 : Historical aggregated maximum gas demand for the three different macro-areas
Mediterranean countries shows a wider temporal spread both with relation to peaks and to lowest demand records with comparison to both NW and CEE macro-areas. Should this fi nding be confi rmed by additional analysis, this might provide a fl exibil-ity reserve from this Region to cover other parts of Europe (at least, in terms of stor-age and LNG resources and to extend the current and future available imports sources to the overall Europe).
Finally, Central-East European macro-area shows trends closer to NW patterns, although coldest day are concentrated in February and December (totaling 77 % of the cases, with the months inverted as the coldest ones) while for summer season is more equilibrated between July and August and less concentrated in terms of lowest demand records.
Finally, the following graph provides indications about the magnitude of the maximum demand values actually registered in the three macro-areas1 ).
1 ) These values are the actual registered values in the countries composing the various macro-areas assumed to be
demand-homogeneous. They should be interpreted only as broad indications of the average or peak demand values used
in the simulations, useful to approximate with historical fi gures the size of different areas in terms of demand scale.
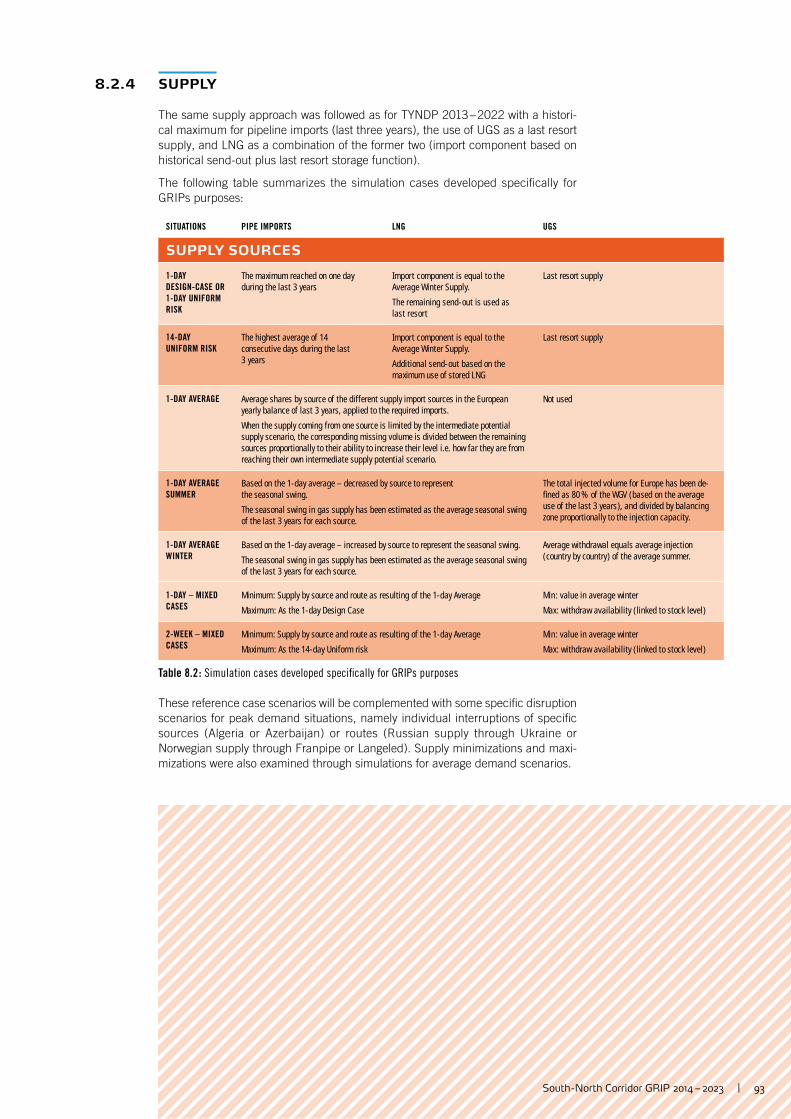
South -North Corridor GRIP 2014 – 2023 | 93
8.2.4 SUPPLY
The same supply approach was followed as for TYNDP 2013 – 2022 with a histori-cal maximum for pipeline imports (last three years), the use of UGS as a last resort supply, and LNG as a combination of the former two (import component based on historical send-out plus last resort storage function).
The following table summarizes the simulation cases developed specifi cally for GRIPs purposes:
SITUATIONS PIPE IMPORTS LNG UGS
SUPPLY SOURCES
1-DAY
DESIGN-CASE OR
1-DAY UNIFORM
RISK
The maximum reached on one day during the last 3 years
Import component is equal to the Average Winter Supply.
The remaining send-out is used as last resort
Last resort supply
14-DAY
UNIFORM RISKThe highest average of 14 consecutive days during the last 3 years
Import component is equal to the Average Winter Supply.
Additional send-out based on the maximum use of stored LNG
Last resort supply
1-DAY AVERAGE Average shares by source of the different supply import sources in the European yearly balance of last 3 years, applied to the required imports.
When the supply coming from one source is limited by the intermediate potential supply scenario, the corresponding missing volume is divided between the remaining sources proportionally to their ability to increase their level i.e. how far they are from reaching their own intermediate supply potential scenario.
Not used
1-DAY AVERAGE
SUMMERBased on the 1-day average – decreased by source to represent the seasonal swing.
The seasonal swing in gas supply has been estimated as the average seasonal swing of the last 3 years for each source.
The total injected volume for Europe has been de-fi ned as 80 % of the WGV ( based on the average use of the last 3 years ), and divided by balancing zone proportionally to the injection capacity.
1-DAY AVERAGE
WINTERBased on the 1-day average – increased by source to represent the seasonal swing.
The seasonal swing in gas supply has been estimated as the average seasonal swing of the last 3 years for each source.
Average withdrawal equals average injection ( country by country ) of the average summer.
1-DAY – MIXED
CASESMinimum : Supply by source and route as resulting of the 1-day Average
Maximum : As the 1-day Design Case
Min : value in average winter
Max : withdraw availability ( linked to stock level )
2-WEEK – MIXED
CASESMinimum : Supply by source and route as resulting of the 1-day Average
Maximum : As the 14-day Uniform risk
Min : value in average winter
Max : withdraw availability ( linked to stock level )
Table 8.2 : Simulation cases developed specifi cally for GRIPs purposes
These reference case scenarios will be complemented with some specifi c disruption scenarios for peak demand situations, namely individual interruptions of specifi c sources (Algeria or Azerbaijan) or routes (Russian supply through Ukraine or Norwegian supply through Franpipe or Langeled). Supply minimizations and maxi-mizations were also examined through simulations for average demand scenarios.
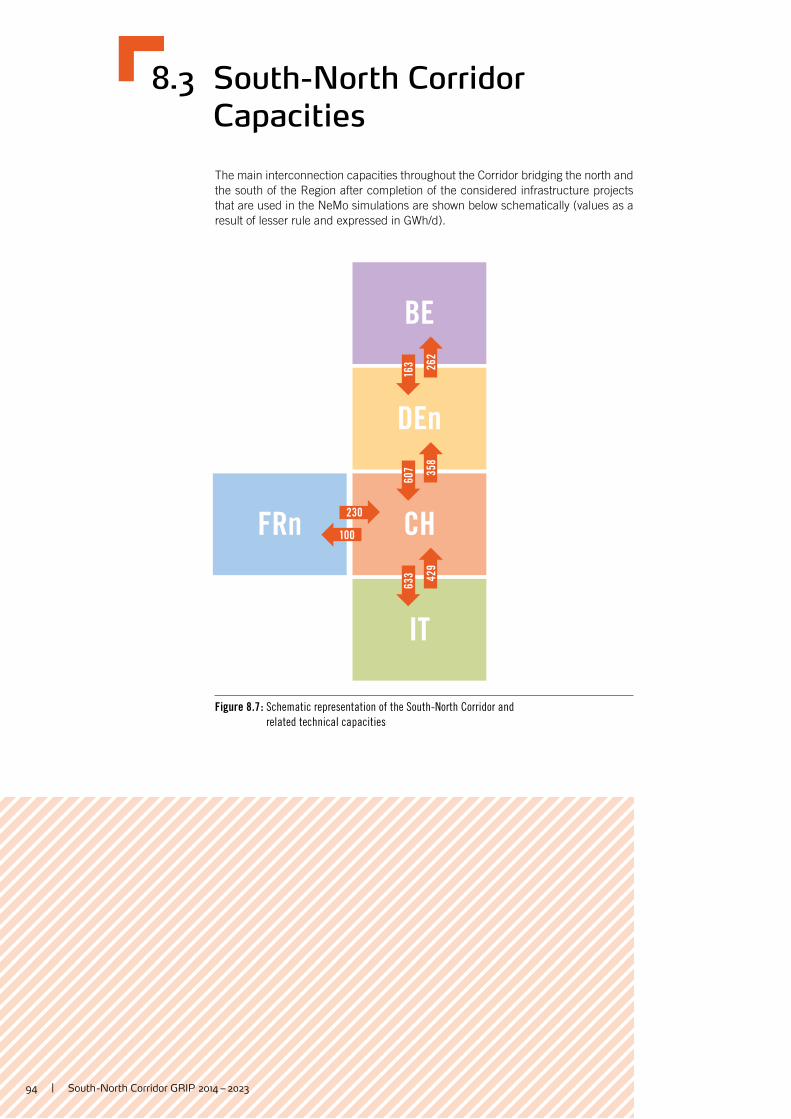
94 | South -North Corridor GRIP 2014 – 2023
BE
DEn
CHFRn
IT
607 35
8
163 26
2
633 42
9
100
230
Figure 8.7 : Schematic representation of the South-North Corridor and
related technical capacities
8.3 South-North Corridor Capacities
The main interconnection capacities throughout the Corridor bridging the north and the south of the Region after completion of the considered infrastructure projects that are used in the NeMo simulations are shown below schematically (values as a result of lesser rule and expressed in GWh/d).
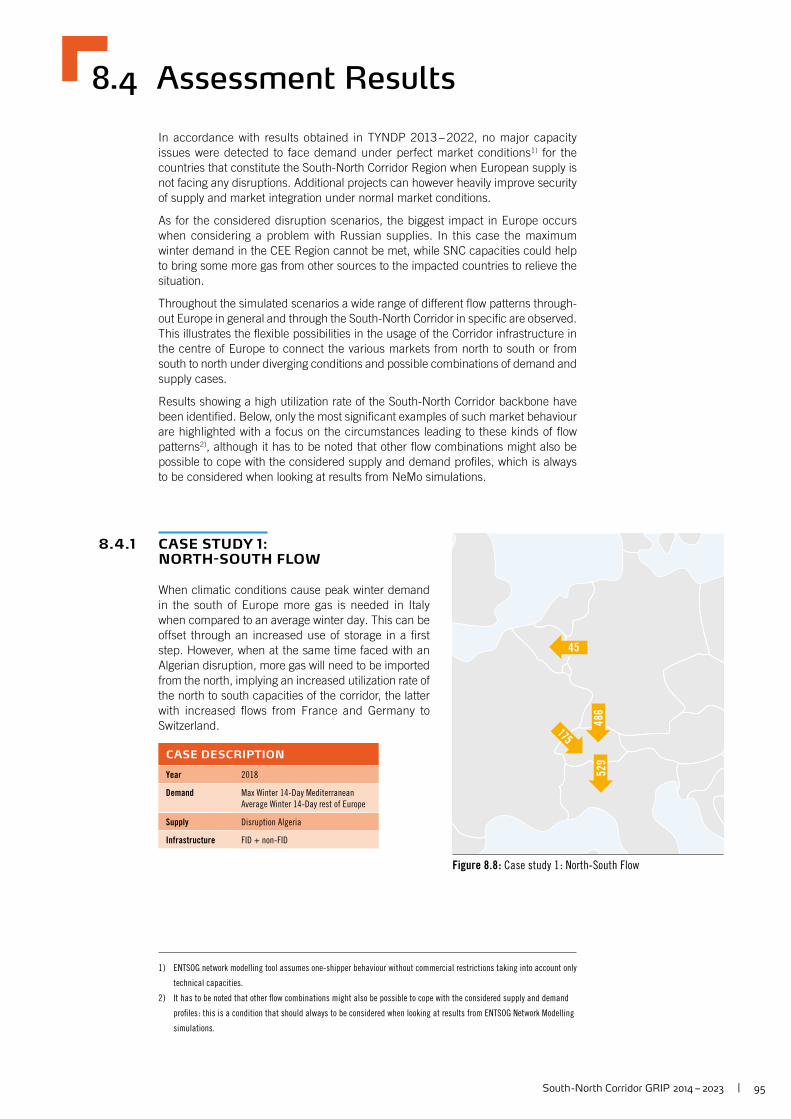
South -North Corridor GRIP 2014 – 2023 | 95
45
486
529
175
Figure 8.8 : Case study 1 : North-South Flow
8.4 Assessment Results
In accordance with results obtained in TYNDP 2013 – 2022, no major capacity issues were detected to face demand under perfect market conditions1 ) for the countries that constitute the South-North Corridor Region when European supply is not facing any disruptions. Additional projects can however heavily improve security of supply and market integration under normal market conditions.
As for the considered disruption scenarios, the biggest impact in Europe occurs when considering a problem with Russian supplies. In this case the maximum winter demand in the CEE Region cannot be met, while SNC capacities could help to bring some more gas from other sources to the impacted countries to relieve the situation.
Throughout the simulated scenarios a wide range of different fl ow patterns through-out Europe in general and through the South-North Corridor in specifi c are observed. This illustrates the fl exible possibilities in the usage of the Corridor infrastructure in the centre of Europe to connect the various markets from north to south or from south to north under diverging conditions and possible combinations of demand and supply cases.
Results showing a high utilization rate of the South-North Corridor backbone have been identifi ed. Below, only the most signifi cant examples of such market behaviour are highlighted with a focus on the circumstances leading to these kinds of fl ow patterns2 ), although it has to be noted that other fl ow combinations might also be possible to cope with the considered supply and demand profi les, which is always to be considered when looking at results from NeMo simulations.
8.4.1 CASE STUDY 1: NORTH-SOUTH FLOW
When climatic conditions cause peak winter demand in the south of Europe more gas is needed in Italy when compared to an average winter day. This can be offset through an increased use of storage in a fi rst step. However, when at the same time faced with an Algerian disruption, more gas will need to be imported from the north, implying an increased utilization rate of the north to south capacities of the corridor, the latter with increased fl ows from France and Germany to Switzerland.
CASE DESCRIPTION
Year 2018
Demand Max Winter 14-Day Mediterranean
Average Winter 14-Day rest of Europe
Supply Disruption Algeria
Infrastructure FID + non-FID
1 ) ENTSOG network modelling tool assumes one-shipper behaviour without commercial restrictions taking into account only
technical capacities.
2 ) It has to be noted that other fl ow combinations might also be possible to cope with the considered supply and demand
profi les : this is a condition that should always to be considered when looking at results from ENTSOG Network Modelling
simulations.
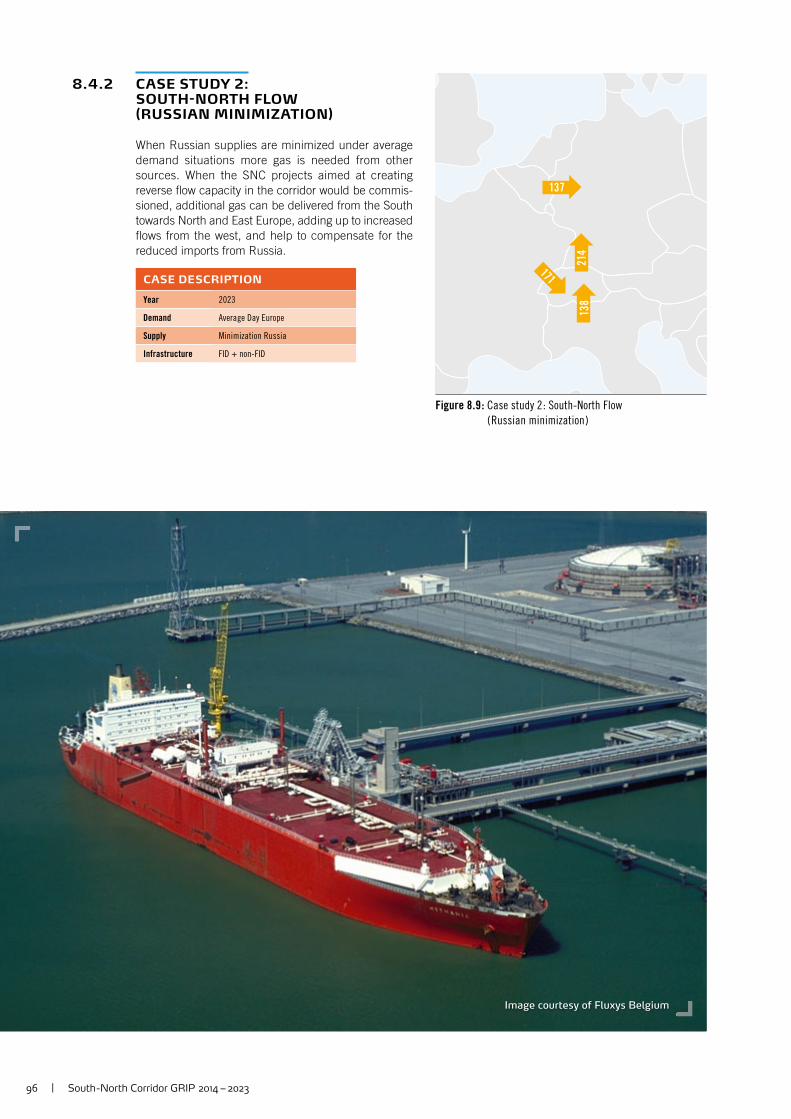
96 | South -North Corridor GRIP 2014 – 2023
Image courtesy of Fluxys Belgium
137
214
138
171
Figure 8.9 : Case study 2 : South-North Flow
( Russian minimization )
8.4.2 CASE STUDY 2: SOUTH-NORTH FLOW (RUSSIAN MINIMIZATION)
When Russian supplies are minimized under average demand situations more gas is needed from other sources. When the SNC projects aimed at creating reverse fl ow capacity in the corridor would be commis-sioned, additional gas can be delivered from the South towards North and East Europe, adding up to increased fl ows from the west, and help to compensate for the reduced imports from Russia.
CASE DESCRIPTION
Year 2023
Demand Average Day Europe
Supply Minimization Russia
Infrastructure FID + non-FID
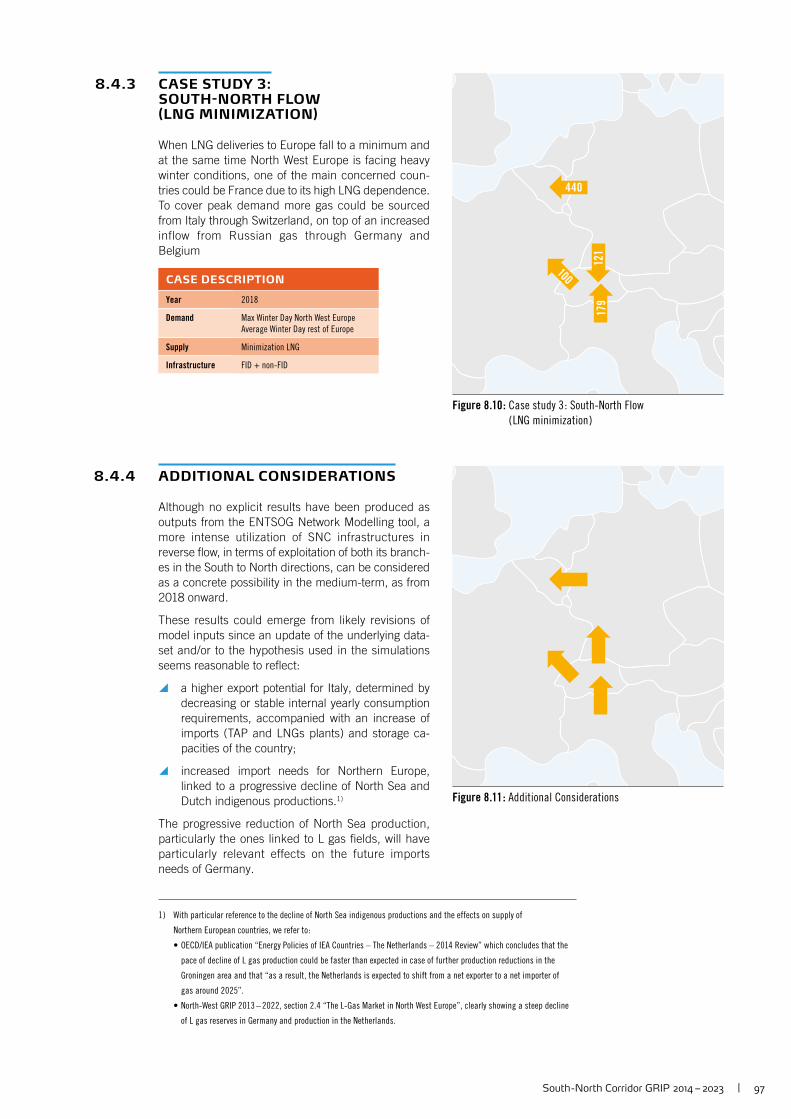
South -North Corridor GRIP 2014 – 2023 | 97
440
121
179
100
Figure 8.10 : Case study 3 : South-North Flow
( LNG minimization )
Figure 8.11 : Additional Considerations
8.4.3 CASE STUDY 3: SOUTH-NORTH FLOW (LNG MINIMIZATION)
When LNG deliveries to Europe fall to a minimum and at the same time North West Europe is facing heavy winter conditions, one of the main concerned coun-tries could be France due to its high LNG dependence. To cover peak demand more gas could be sourced from Italy through Switzerland, on top of an increased inflow from Russian gas through Germany and Belgium
CASE DESCRIPTION
Year 2018
Demand Max Winter Day North West Europe
Average Winter Day rest of Europe
Supply Minimization LNG
Infrastructure FID + non-FID
8.4.4 ADDITIONAL CONSIDERATIONS
Although no explicit results have been produced as outputs from the ENTSOG Network Modelling tool, a more intense utilization of SNC infrastructures in reverse fl ow, in terms of exploitation of both its branch-es in the South to North directions, can be considered as a concrete possibility in the medium-term, as from 2018 onward.
These results could emerge from likely revisions of model inputs since an update of the underlying data-set and/or to the hypothesis used in the simulations seems reasonable to refl ect:
y a higher export potential for Italy, determined by decreasing or stable internal yearly consumption requirements, accompanied with an increase of imports (TAP and LNGs plants) and storage ca-pacities of the country;
y increased import needs for Northern Europe, linked to a progressive decline of North Sea and Dutch indigenous productions.1 )
The progressive reduction of North Sea production, particularly the ones linked to L gas fi elds, will have particularly relevant effects on the future imports needs of Germany.
1 ) With particular reference to the decline of North Sea indigenous productions and the effects on supply of
Northern European countries, we refer to :
• OECD/IEA publication “Energy Policies of IEA Countries – The Netherlands – 2014 Review” which concludes that the
pace of decline of L gas production could be faster than expected in case of further production reductions in the
Groningen area and that “as a result, the Netherlands is expected to shift from a net exporter to a net importer of
gas around 2025”.
• North-West GRIP 2013 – 2022, section 2.4 “The L-Gas Market in North West Europe”, clearly showing a steep decline
of L gas reserves in Germany and production in the Netherlands.
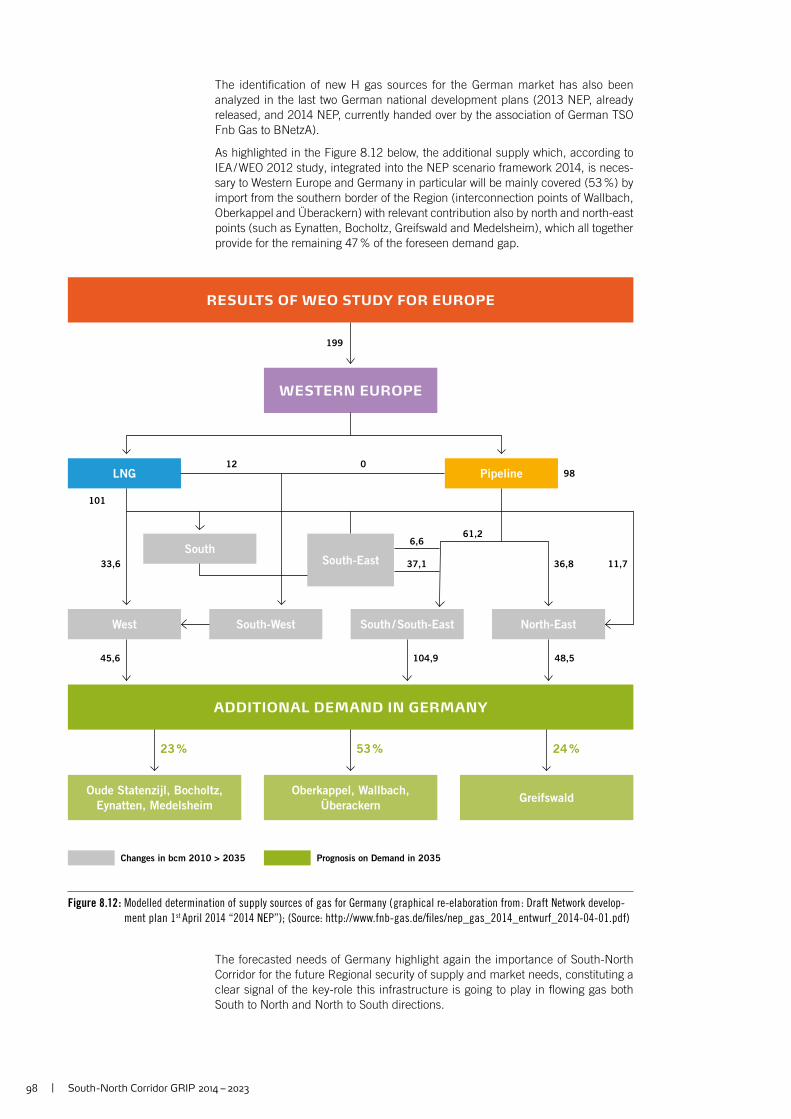
98 | South -North Corridor GRIP 2014 – 2023
RESULTS OF WEO STUDY FOR EUROPE
WESTERN EUROPE
West
LNG
SouthSouth-East
Pipeline
South-West South / South-East North-East
ADDITIONAL DEMAND IN GERMANY
Oude Statenzijl, Bocholtz,
Eynatten, Medelsheim
Oberkappel, Wallbach,
ÜberackernGreifswald
98
199
12 0
11,733,6
101
61,2
48,5104,945,6
Changes in bcm 2010 > 2035 Prognosis on Demand in 2035
23 % 53 % 24 %
6,6
37,1 36,8
Figure 8.12 : Modelled determination of supply sources of gas for Germany ( graphical re-elaboration from : Draft Network develop-
ment plan 1st April 2014 “2014 NEP”); (Source: http://www.fnb-gas.de/fi les/nep_gas_2014_entwurf_2014-04-01.pdf)
The identifi cation of new H gas sources for the German market has also been analyzed in the last two German national development plans (2013 NEP, already released, and 2014 NEP, currently handed over by the association of German TSO Fnb Gas to BNetzA).
As highlighted in the Figure 8.12 below, the additional supply which, according to IEA / WEO 2012 study, integrated into the NEP scenario framework 2014, is neces-sary to Western Europe and Germany in particular will be mainly covered (53 %) by import from the southern border of the Region (interconnection points of Wallbach, Oberkappel and Überackern) with relevant contribution also by north and north-east points (such as Eynatten, Bocholtz, Greifswald and Medelsheim), which all together provide for the remaining 47 % of the foreseen demand gap.
The forecasted needs of Germany highlight again the importance of South-North Corridor for the future Regional security of supply and market needs, constituting a clear signal of the key-role this infrastructure is going to play in fl owing gas both South to North and North to South directions.

South -North Corridor GRIP 2014 – 2023 | 99
Way Forward – Stake holders Feedback Form
Interactions with stakeholders are welcomed and TSOs of the Region, with ENTSOG support, have organized different events, allowing to any external parties to provide inputs to GRIPs structure and elaboration. In particular:
y Following its publication on June 2012, SNC GRIP fi rst edition has been pre-sented and discussed on November 2012 (6 th TYNDP Workshop at ENTSOG Offi ces);
y SNC GRIP second edition structure and main contents has been anticipated on November 2013 at the Gas Regional Investment Plan (GRIP) Workshop on Brussels;
y More recently, during 9 th TYNDP/CBA Workshop, held in Vienna on June 2014, the main subjects and fi ndings of the fi nalized version of the GRIP have been introduced by Region’s coordinators.
In order to provide continuity to stakeholders involvement, we propose to any interest subject to complete the fi elds below and send them via mail to the Region’s coordinators:
y Snam Rete Gas: Marco.Gazzola @ snam.it
y Fluxys Belgium: Geert.Smits @ fl uxys.com
We will be happy to receive reader’s feedback and we will take them into consideration for future GRIP editions.
ORGANISATION AND CONTACT DETAILS
Company / Organisation Name
Organisation type (TSO, LNG terminal operator, UGS operator, Trader, Shipper, Consultant … )
Contact person
DID YOU FIND THE CONTENTS AND ANALYSIS OF SOUTH-NORTH
CORRIDOR GRIP INTERESTING?
WHAT ADDITIONAL INFORMATION/ANALYSIS WOULD YOU LIKE TO
SEE INCLUDED IN THE FUTURE EDITION OF THE GRIP?
_
100 | South -North Corridor GRIP 2014 – 2023
Legal Disclaimer
The South-North Corridor GRIP was prepared in a pro-fessional and workmanlike manner by the TSOs of the fi ve countries forming the South-North Corridor Re-gion, on the basis of information collected and com-piled by them and from stakeholders, and on the basis of the methodology developed by ENTSOG with the support of the stakeholders via public consultation for the preparation of the TYNDP 2013 – 2022. The South-North Corridor GRIP contains TSOs’ own assumptions and analysis based upon this information.
All content is provided “as is” without any warranty of any kind as to the completeness, accuracy, fi tness for any particular purpose or any use of results based on this information and the Region’s TSOs hereby expressly disclaim all warranties and representations, whether express or implied, including without limita-tion, warranties or representations of merchantability or fi tness for a particular purpose.
In no event shall Region’s TSOs be liable to any party for any direct, indirect, incidental, exemplary, compensatory, punitive, special or consequential damages, costs, expenses, legal fees, or losses, including, without limitation, lost income or lost profi ts and opportunity costs, in connection with any use of all content.
All analyses and forecasts are mere statements of opinion as of the date they are expressed and not statements of fact or recommendations. When making decisions of any nature, any party shall rely exclusive-ly on its own information, forecast, skill, judgment and experience and not on the GRIP contents.
The reader in its capacity as professional individual or entity shall be responsible for seeking to verify the accurate and relevant information needed for its own assessment and decision and shall be responsible for use of the document or any part of it for any purpose other than that for which it is intended.
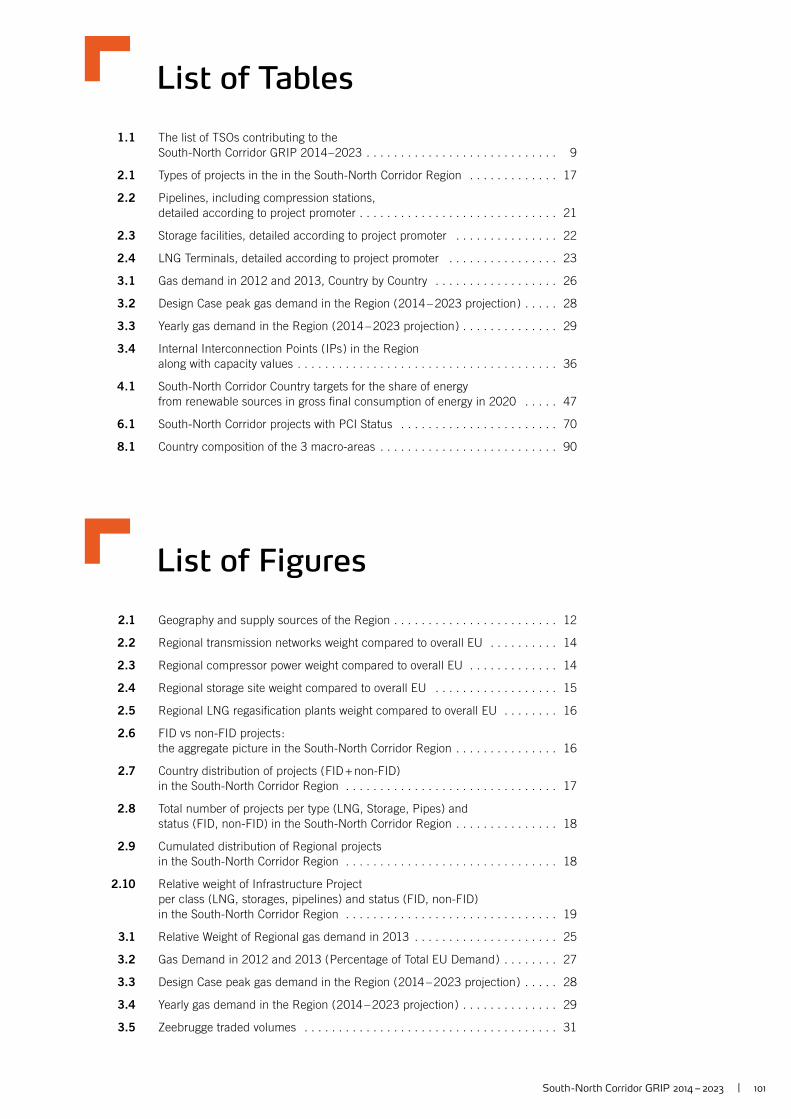
South -North Corridor GRIP 2014 – 2023 | 101
List of Tables
1.1 The list of TSOs contributing to the
South-North Corridor GRIP 2014 – 2023 . . . . . . . . . . . . . . . . . . . . . . . . . . . . 9
2.1 Types of projects in the in the South-North Corridor Region . . . . . . . . . . . . . 17
2.2 Pipelines, including compression stations,
detailed according to project promoter . . . . . . . . . . . . . . . . . . . . . . . . . . . . . 21
2.3 Storage facilities, detailed according to project promoter . . . . . . . . . . . . . . . 22
2.4 LNG Terminals, detailed according to project promoter . . . . . . . . . . . . . . . . 23
3.1 Gas demand in 2012 and 2013, Country by Country . . . . . . . . . . . . . . . . . . 26
3.2 Design Case peak gas demand in the Region ( 2014 – 2023 projection ) . . . . . 28
3.3 Yearly gas demand in the Region ( 2014 – 2023 projection ) . . . . . . . . . . . . . . 29
3.4 Internal Interconnection Points ( IPs ) in the Region
along with capacity values . . . . . . . . . . . . . . . . . . . . . . . . . . . . . . . . . . . . . . 36
4.1 South-North Corridor Country targets for the share of energy
from renewable sources in gross fi nal consumption of energy in 2020 . . . . . 47
6.1 South-North Corridor projects with PCI Status . . . . . . . . . . . . . . . . . . . . . . . 70
8.1 Country composition of the 3 macro-areas . . . . . . . . . . . . . . . . . . . . . . . . . . 90
List of Figures
2.1 Geography and supply sources of the Region . . . . . . . . . . . . . . . . . . . . . . . . 12
2.2 Regional transmission networks weight compared to overall EU . . . . . . . . . . 14
2.3 Regional compressor power weight compared to overall EU . . . . . . . . . . . . . 14
2.4 Regional storage site weight compared to overall EU . . . . . . . . . . . . . . . . . . 15
2.5 Regional LNG regasifi cation plants weight compared to overall EU . . . . . . . . 16
2.6 FID vs non-FID projects :
the aggregate picture in the South-North Corridor Region . . . . . . . . . . . . . . . 16
2.7 Country distribution of projects ( FID + non-FID)
in the South-North Corridor Region . . . . . . . . . . . . . . . . . . . . . . . . . . . . . . . 17
2.8 Total number of projects per type (LNG, Storage, Pipes) and
status (FID, non-FID) in the South-North Corridor Region . . . . . . . . . . . . . . . 18
2.9 Cumulated distribution of Regional projects
in the South-North Corridor Region . . . . . . . . . . . . . . . . . . . . . . . . . . . . . . . 18
2.10 Relative weight of Infrastructure Project
per class (LNG, storages, pipelines) and status (FID, non-FID)
in the South-North Corridor Region . . . . . . . . . . . . . . . . . . . . . . . . . . . . . . . 19
3.1 Relative Weight of Regional gas demand in 2013 . . . . . . . . . . . . . . . . . . . . . 25
3.2 Gas Demand in 2012 and 2013 ( Percentage of Total EU Demand ) . . . . . . . . 27
3.3 Design Case peak gas demand in the Region ( 2014 – 2023 projection ) . . . . . 28
3.4 Yearly gas demand in the Region ( 2014 – 2023 projection ) . . . . . . . . . . . . . . 29
3.5 Zeebrugge traded volumes . . . . . . . . . . . . . . . . . . . . . . . . . . . . . . . . . . . . . 31
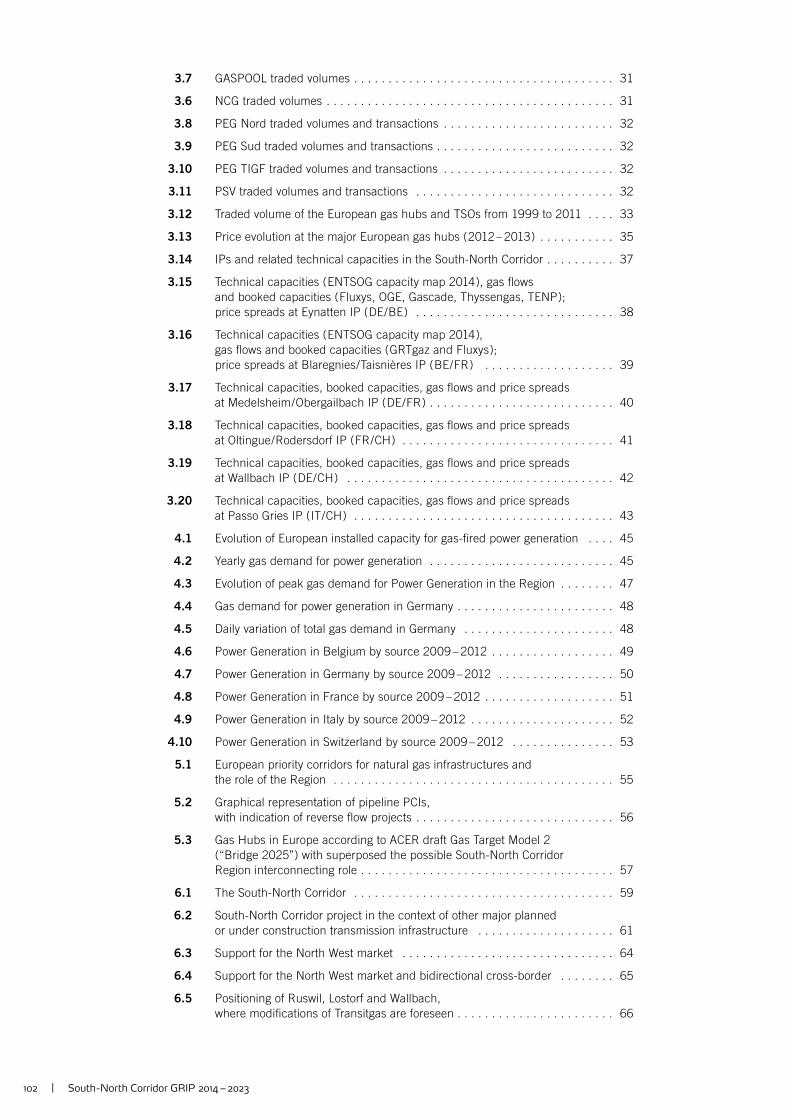
102 | South -North Corridor GRIP 2014 – 2023
3.7 GASPOOL traded volumes . . . . . . . . . . . . . . . . . . . . . . . . . . . . . . . . . . . . . . 31
3.6 NCG traded volumes . . . . . . . . . . . . . . . . . . . . . . . . . . . . . . . . . . . . . . . . . . 31
3.8 PEG Nord traded volumes and transactions . . . . . . . . . . . . . . . . . . . . . . . . . 32
3.9 PEG Sud traded volumes and transactions . . . . . . . . . . . . . . . . . . . . . . . . . . 32
3.10 PEG TIGF traded volumes and transactions . . . . . . . . . . . . . . . . . . . . . . . . . 32
3.11 PSV traded volumes and transactions . . . . . . . . . . . . . . . . . . . . . . . . . . . . . 32
3.12 Traded volume of the European gas hubs and TSOs from 1999 to 2011 . . . . 33
3.13 Price evolution at the major European gas hubs ( 2012 – 2013 ) . . . . . . . . . . . 35
3.14 IPs and related technical capacities in the South-North Corridor . . . . . . . . . . 37
3.15 Technical capacities ( ENTSOG capacity map 2014 ), gas fl ows
and booked capacities ( Fluxys, OGE, Gascade, Thyssengas, TENP );
price spreads at Eynatten IP ( DE / BE ) . . . . . . . . . . . . . . . . . . . . . . . . . . . . . 38
3.16 Technical capacities ( ENTSOG capacity map 2014 ),
gas fl ows and booked capacities ( GRTgaz and Fluxys );
price spreads at Blaregnies / Taisnières IP ( BE / FR ) . . . . . . . . . . . . . . . . . . . 39
3.17 Technical capacities, booked capacities, gas fl ows and price spreads
at Medelsheim / Obergailbach IP ( DE / FR ) . . . . . . . . . . . . . . . . . . . . . . . . . . . 40
3.18 Technical capacities, booked capacities, gas fl ows and price spreads
at Oltingue / Rodersdorf IP ( FR / CH ) . . . . . . . . . . . . . . . . . . . . . . . . . . . . . . . 41
3.19 Technical capacities, booked capacities, gas fl ows and price spreads
at Wallbach IP ( DE / CH ) . . . . . . . . . . . . . . . . . . . . . . . . . . . . . . . . . . . . . . . 42
3.20 Technical capacities, booked capacities, gas fl ows and price spreads
at Passo Gries IP ( IT / CH ) . . . . . . . . . . . . . . . . . . . . . . . . . . . . . . . . . . . . . . 43
4.1 Evolution of European installed capacity for gas-fi red power generation . . . . 45
4.2 Yearly gas demand for power generation . . . . . . . . . . . . . . . . . . . . . . . . . . . 45
4.3 Evolution of peak gas demand for Power Generation in the Region . . . . . . . . 47
4.4 Gas demand for power generation in Germany . . . . . . . . . . . . . . . . . . . . . . . 48
4.5 Daily variation of total gas demand in Germany . . . . . . . . . . . . . . . . . . . . . . 48
4.6 Power Generation in Belgium by source 2009 – 2012 . . . . . . . . . . . . . . . . . . 49
4.7 Power Generation in Germany by source 2009 – 2012 . . . . . . . . . . . . . . . . . 50
4.8 Power Generation in France by source 2009 – 2012 . . . . . . . . . . . . . . . . . . . 51
4.9 Power Generation in Italy by source 2009 – 2012 . . . . . . . . . . . . . . . . . . . . . 52
4.10 Power Generation in Switzerland by source 2009 – 2012 . . . . . . . . . . . . . . . 53
5.1 European priority corridors for natural gas infrastructures and
the role of the Region . . . . . . . . . . . . . . . . . . . . . . . . . . . . . . . . . . . . . . . . . 55
5.2 Graphical representation of pipeline PCIs,
with indication of reverse fl ow projects . . . . . . . . . . . . . . . . . . . . . . . . . . . . . 56
5.3 Gas Hubs in Europe according to ACER draft Gas Target Model 2
(“Bridge 2025”) with superposed the possible South-North Corridor
Region interconnecting role . . . . . . . . . . . . . . . . . . . . . . . . . . . . . . . . . . . . . 57
6.1 The South-North Corridor . . . . . . . . . . . . . . . . . . . . . . . . . . . . . . . . . . . . . . 59
6.2 South-North Corridor project in the context of other major planned
or under construction transmission infrastructure . . . . . . . . . . . . . . . . . . . . 61
6.3 Support for the North West market . . . . . . . . . . . . . . . . . . . . . . . . . . . . . . . 64
6.4 Support for the North West market and bidirectional cross-border . . . . . . . . 65
6.5 Positioning of Ruswil, Lostorf and Wallbach,
where modifi cations of Transitgas are foreseen . . . . . . . . . . . . . . . . . . . . . . . 66
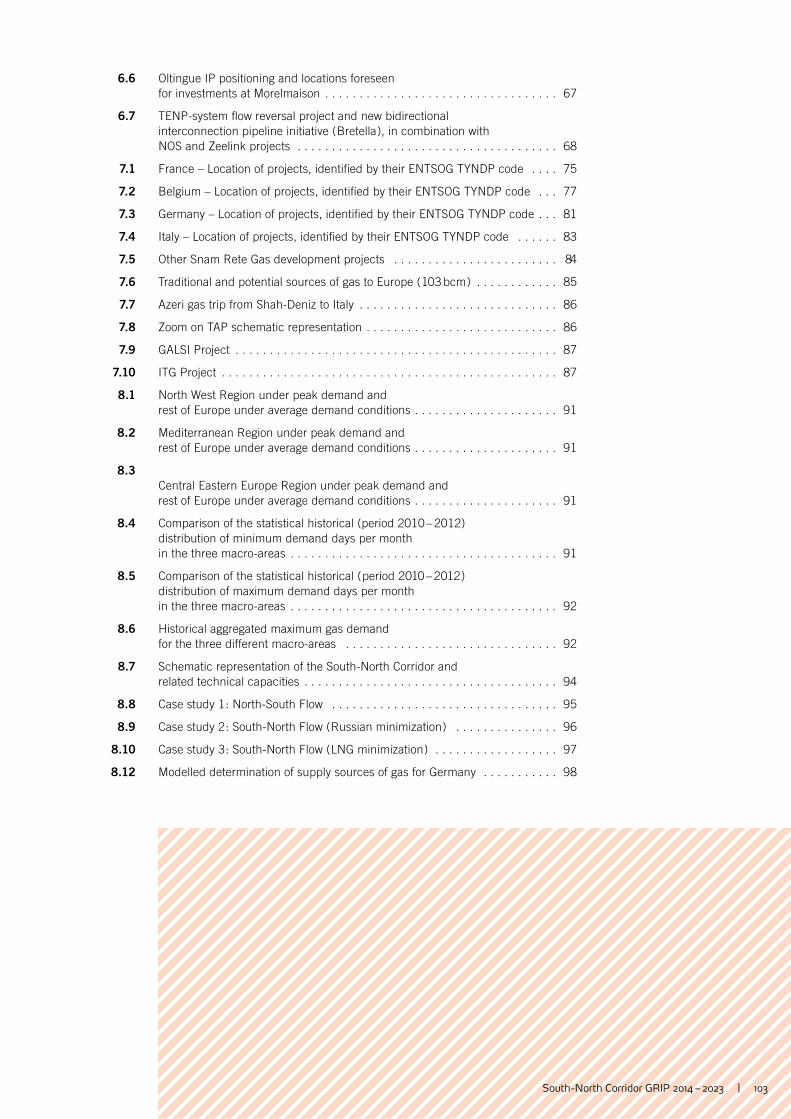
South -North Corridor GRIP 2014 – 2023 | 103
6.6 Oltingue IP positioning and locations foreseen
for investments at Morelmaison . . . . . . . . . . . . . . . . . . . . . . . . . . . . . . . . . . 67
6.7 TENP-system fl ow reversal project and new bidirectional
interconnection pipeline initiative ( Bretella ), in combination with
NOS and Zeelink projects . . . . . . . . . . . . . . . . . . . . . . . . . . . . . . . . . . . . . . 68
7.1 France – Location of projects, identifi ed by their ENTSOG TYNDP code . . . . 75
7.2 Belgium – Location of projects, identifi ed by their ENTSOG TYNDP code . . . 77
7.3 Germany – Location of projects, identifi ed by their ENTSOG TYNDP code . . . 81
7.4 Italy – Location of projects, identifi ed by their ENTSOG TYNDP code . . . . . . 83
7.5 Other Snam Rete Gas development projects . . . . . . . . . . . . . . . . . . . . . . . . 84
7.6 Traditional and potential sources of gas to Europe ( 103 bcm ) . . . . . . . . . . . . 85
7.7 Azeri gas trip from Shah-Deniz to Italy . . . . . . . . . . . . . . . . . . . . . . . . . . . . . 86
7.8 Zoom on TAP schematic representation . . . . . . . . . . . . . . . . . . . . . . . . . . . . 86
7.9 GALSI Project . . . . . . . . . . . . . . . . . . . . . . . . . . . . . . . . . . . . . . . . . . . . . . . 87
7.10 ITG Project . . . . . . . . . . . . . . . . . . . . . . . . . . . . . . . . . . . . . . . . . . . . . . . . . 87
8.1 North West Region under peak demand and
rest of Europe under average demand conditions . . . . . . . . . . . . . . . . . . . . . 91
8.2 Mediterranean Region under peak demand and
rest of Europe under average demand conditions . . . . . . . . . . . . . . . . . . . . . 91
8.3
Central Eastern Europe Region under peak demand and
rest of Europe under average demand conditions . . . . . . . . . . . . . . . . . . . . . 91
8.4 Comparison of the statistical historical (period 2010 – 2012)
distribution of minimum demand days per month
in the three macro-areas . . . . . . . . . . . . . . . . . . . . . . . . . . . . . . . . . . . . . . . 91
8.5 Comparison of the statistical historical ( period 2010 – 2012 )
distribution of maximum demand days per month
in the three macro-areas . . . . . . . . . . . . . . . . . . . . . . . . . . . . . . . . . . . . . . . 92
8.6 Historical aggregated maximum gas demand
for the three different macro-areas . . . . . . . . . . . . . . . . . . . . . . . . . . . . . . . 92
8.7 Schematic representation of the South-North Corridor and
related technical capacities . . . . . . . . . . . . . . . . . . . . . . . . . . . . . . . . . . . . . 94
8.8 Case study 1 : North-South Flow . . . . . . . . . . . . . . . . . . . . . . . . . . . . . . . . . 95
8.9 Case study 2 : South-North Flow ( Russian minimization ) . . . . . . . . . . . . . . . 96
8.10 Case study 3 : South-North Flow ( LNG minimization ) . . . . . . . . . . . . . . . . . . 97
8.12 Modelled determination of supply sources of gas for Germany . . . . . . . . . . . 98

104 | South -North Corridor GRIP 2014 – 2023
Defi nitions
Number formatting Comma ( , ) is used as a 1,000 separatorPoint ( . ) is used as decimal separator
1-day Uniform A daily demand Situation forecasted under the same risk of a Risk Demand Situation climatic occurrence close to 1-in-20 years
14-day Uniform A 14-day average daily demand Situation forecasted under the Risk Demand Situation same risk of a climatic occurrence close to 1-in-20 years
Average Day A daily average demand Situation calculated as 1 / 365 th of an Demand Situation annual demand
Case A combination of a demand and supply situation, infrastructure cluster and the respective time reference
Design-Case A high daily demand situation used by TSOs in their National Demand Situation Development Plans to determine the resilience of their system and
needs for investment
FID project A project where the respective project promoter( s ) has ( have ) taken the Final Investment Decision
Full Minimisation A modelling approach aimed at minimising supply from each source separately, in order to identify Zone Supply Source Dependence, and replacing it with the corresponding volume from the remaining sources in such a way that the maximum minimisation of the ana-lysed supply is achieved
Import The supply of gas at the entry of the European network as defi ned by this GRIP or gas delivered at the entry of a Zone
Interconnection Point A point of interconnection between two different infrastructures; an Interconnection Point may or may not be operated by different infrastructure operators
National Production The indigenous production related to each country covered in the GRIP; a Zone allocation has been carried out where relevant
Network Resilience A notion related to the capability of a network to ensure supply demand balance in High Daily Demand Situations, including also under Supply Stress
Non-FID project A project where the Final Investment Decision has not yet been taken by the respective project promoter( s )
Plan Means the referenced GRIP, including all Annexes; Plan and Report are used interchangeably
Reference Case The Case that extends the historical ( last three years ) trend of supply over the 10-year period covered by the GRIP; where new import pipe / LNG terminal projects are planned to come on stream the supply is adjusted in proportion to the last applicable supply situation
Remaining Flexibility A notion related to the assessment of Network Resilience; it refers to the ability of a Zone to offer additional room for supply arbitrage; the value of the Remaining Flexibility is benchmarked against defi ned limits to identify potential capacity gaps
Scenario A set of assumptions related to a future development which is the basis for generating concrete value sets covering demand or supply
Situation A combination of conditions and circumstances relating to a partic-ular occurrence of demand or supply, or both; such conditions and circumstances may relate to e.g. time duration, climatic conditions, or infrastructure availability.
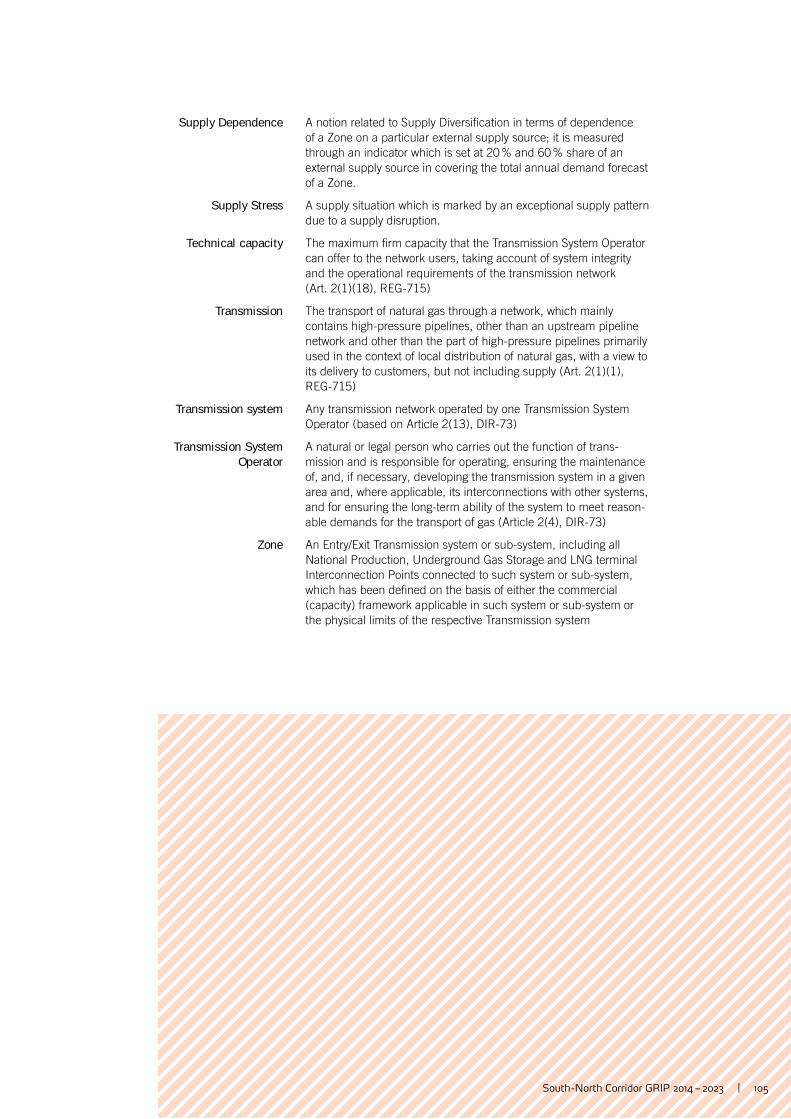
South -North Corridor GRIP 2014 – 2023 | 105
Supply Dependence A notion related to Supply Diversifi cation in terms of dependence of a Zone on a particular external supply source; it is measured through an indicator which is set at 20 % and 60 % share of an external supply source in covering the total annual demand forecast of a Zone.
Supply Stress A supply situation which is marked by an exceptional supply pattern due to a supply disruption.
Technical capacity The maximum fi rm capacity that the Transmission System Operator can offer to the network users, taking account of system integrity and the operational requirements of the transmission network (Art. 2(1)(18), REG-715)
Transmission The transport of natural gas through a network, which mainly contains high-pressure pipelines, other than an upstream pipeline network and other than the part of high-pressure pipelines primarily used in the context of local distribution of natural gas, with a view to its delivery to customers, but not including supply (Art. 2(1)(1), REG-715)
Transmission system Any transmission network operated by one Transmission System Operator (based on Article 2(13), DIR-73)
Transmission System A natural or legal person who carries out the function of trans- Operator mission and is responsible for operating, ensuring the maintenance
of, and, if necessary, developing the transmission system in a given area and, where applicable, its interconnections with other systems, and for ensuring the long-term ability of the system to meet reason-able demands for the transport of gas (Article 2(4), DIR-73)
Zone An Entry/Exit Transmission system or sub-system, including all National Production, Underground Gas Storage and LNG terminal Interconnection Points connected to such system or sub-system, which has been defi ned on the basis of either the commercial (capacity) framework applicable in such system or sub-system or the physical limits of the respective Transmission system
106 | South -North Corridor GRIP 2014 – 2023
Abbreviations
ACER Agency for the Cooperation of Energy Regulators
ASIG Associazione svizzera dell'industria del gas / Swiss Association of Gas In dustry
BCM Billion Cubic Meter
BE Belgium
BLN Billion
BNetzA Bundesnetzagentur /German National Regulatory Agency
BP British Petroleum
CAM NC Capacity Allocation Mechanisms Net-work Code
CCGT Combined Cycle Gas Turbine
CEE Central Eastern Europe
CEGH Central European Gas Hub
CH Switzerland
CMP Congestion Management Procedures
CNG Compressed Natural Gas
CO² Carbon Dioxide
Co-authors Fluxys Belgium; GRTgaz; Fluxys TENP; terranets bw; Open Grid Europe; Infrastrutture Trasporto Gas; Snam Rete Gas; Swissgas; FluxSwiss
CRE Commission De Regulation de L'Energie /French National Regulator Agency
CS Compressor Station
DE Germany
DG Directorate-General
DN Diameter Nominal
DP Dynamic pressure
EC European Commission
ENTSO-E European Network of Transmission System Operator for Electricity
ENTSOG European Network of Transmission System Operator for Gas
EU European Union
FID Final Investment Decision
Fnb Gas Vereinigung der Fernleitungsnetzbetreiber Gas e. V.
FR France
GLE Gas LNG Europe
GRIP Gas Regional Investment Plan
GSE Gas Storage Europe
GTM Gas Target Model
GUP Grenzüberschreitender Punkt / Cross-Border Interconnection Point
GWh Giga Watt hour
GWh/d Giga Watt hour / day
GWh/y Giga Watt hour / year
H-Gas High-calorifi c natural gas
ICT Information & Communications Technology
IEA International Energy Agency
IP Interconnection Point
IT Italy
IZT Interconnector Zeebrugge Terminal
Km Kilo meter
KWh Kilo Watt hour
L-Gas Low-calorifi c natural gas
LNG Liquifi ed Natural Gas
Mcm Million cubic meter
Mcm / d Million cubic meter / day
Med Mediterranean
MSm³ Mega Standard cubic meter
MSm³ / d Mega Standard cubic meter / day
MW Mega Watt
MWh Mega Watt hour
NBP National Balancing Point
NCG Net Connect Germany
NDP Network Development Plan
NEP Netzentwicklungsplan (German Network Development Plan)
NeMo Network Modelling
NOS Nordschwarzwaldleitung – Northern Black Forest Pipeline
NRA National Regulatory Authority
NSI North South Interconnection
NW North West
O & M Operation & Maintenance
OECD Organisation for Economic Co-opera-tion and Development
OLT Offshore LNG Toscana
PCI Project of Common Interest
PEG Points d'Echange de Gaz
PSV Punto di Scambio Virtuale
South -North Corridor GRIP 2014 – 2023 | 107
RES Renewable Energy Source
SCP South Caucasus Pipeline
SEN Strategia energetica nazionale / National Energy Strategy
SN South North
SNC South-North Corridor
SOCAR State Oil Company of Azerbaijan Republic
SoS Security of Supply
TANAP Trans Anatolian Pipeline
TAP Trans Adriatic Pipeline
TEN Trans-European Networks
TENP Trans Europa Naturgas Pipeline
THT Tetrahydrothiophene
TSO Transmission System Operator
TTF Title Transfer Facility
TWh Tera Watt hour
TWh/y Tera Watt hour / year
TYNDP Ten Year Network Development Plan
UGS Underground Storage
USD US Dollar
VHP Virtueller Handelspunkt / Virtual trading point
WEO World Economic Outlook of IEA
WGV Working Gas Volume
ZLNG Zeebrugge LNG Terminal
ZPT Zeepipe Terminal
ZTP Zeebrugge Trading Point
Publisher: ENTSOG aisblAvenue de Cortenbergh 1001000 Brussels, Belgium
Co-Authors: Fluxys Belgium; GRTgaz; Fluxys TENP; terranets bw; Open Grid Europe; Infrastrutture Trasporto Gas; Snam Rete Gas; Swissgas; FluxSwiss
Design & Layout: DreiDreizehn GmbH, Berlin | www.313.de

ENTSOG AISBL
Avenue de Cortenbergh 100
1000 Brussels, Belgium
Tel. +32 2 894 51 00
www.entsog.eu
Recommended