Embed Size (px)
Citation preview
Q2-14 Report July 18, 2014 Keith McLoughlin, President and CEO
Tomas Eliasson, CFO
Q2 Highlights
2
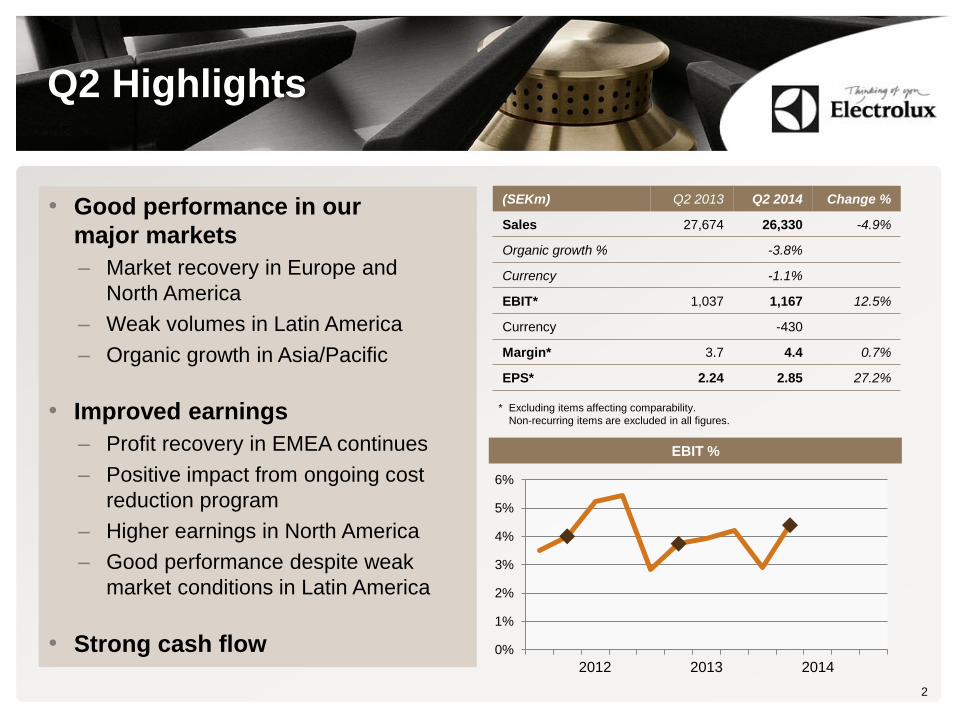
(SEKm) Q2 2013 Q2 2014 Change %
Sales 27,674 26,330 -4.9%
Organic growth % -3.8%
Currency -1.1%
EBIT* 1,037 1,167 12.5%
Currency -430
Margin* 3.7 4.4 0.7%
EPS* 2.24 2.85 27.2%
* Excluding items affecting comparability.
Non-recurring items are excluded in all figures.
0%
1%
2%
3%
4%
5%
6%
2012 2013 2014
EBIT %
• Good performance in our
major markets
– Market recovery in Europe and
North America
– Weak volumes in Latin America
– Organic growth in Asia/Pacific
• Improved earnings
– Profit recovery in EMEA continues
– Positive impact from ongoing cost
reduction program
– Higher earnings in North America
– Good performance despite weak
market conditions in Latin America
• Strong cash flow
Market Highlights
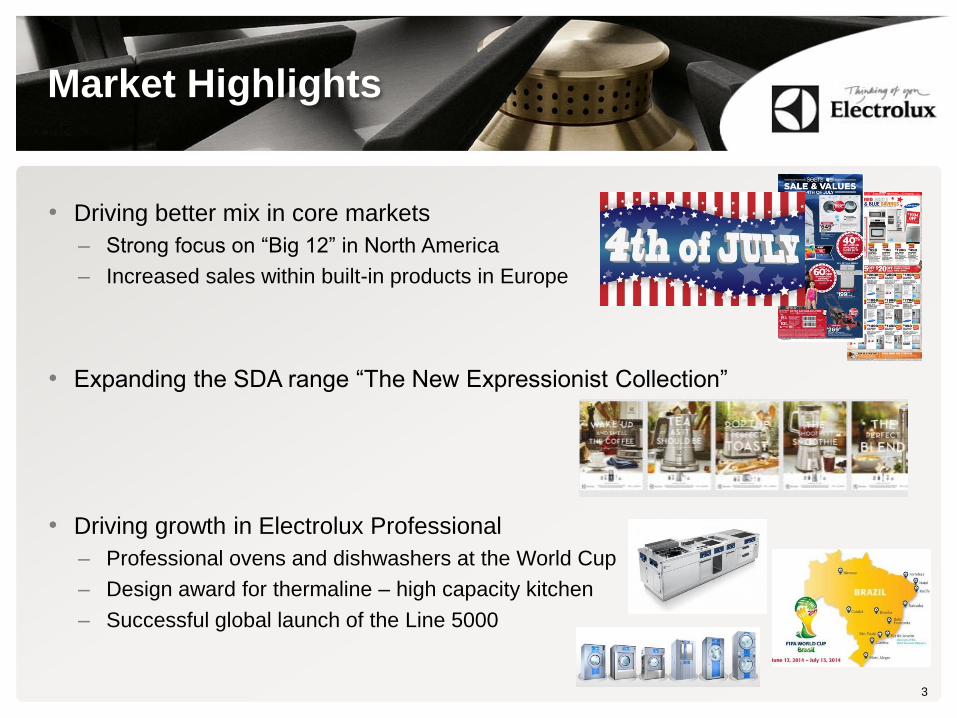
• Driving better mix in core markets
– Strong focus on “Big 12” in North America
– Increased sales within built-in products in Europe
• Expanding the SDA range “The New Expressionist Collection”
• Driving growth in Electrolux Professional
– Professional ovens and dishwashers at the World Cup
– Design award for thermaline – high capacity kitchen
– Successful global launch of the Line 5000
3

Sales in Local Currencies
4
90,000
95,000
100,000
105,000
110,000
115,000
-5%
-3%
-1%
1%
3%
5%
7%
2011 2012 2013
Sa
les
SE
Km
Gro
wth
%
Organic growth % Acquired growth % Sales in local currencies, SEKm
2014
Major Appliances EMEA – Q2
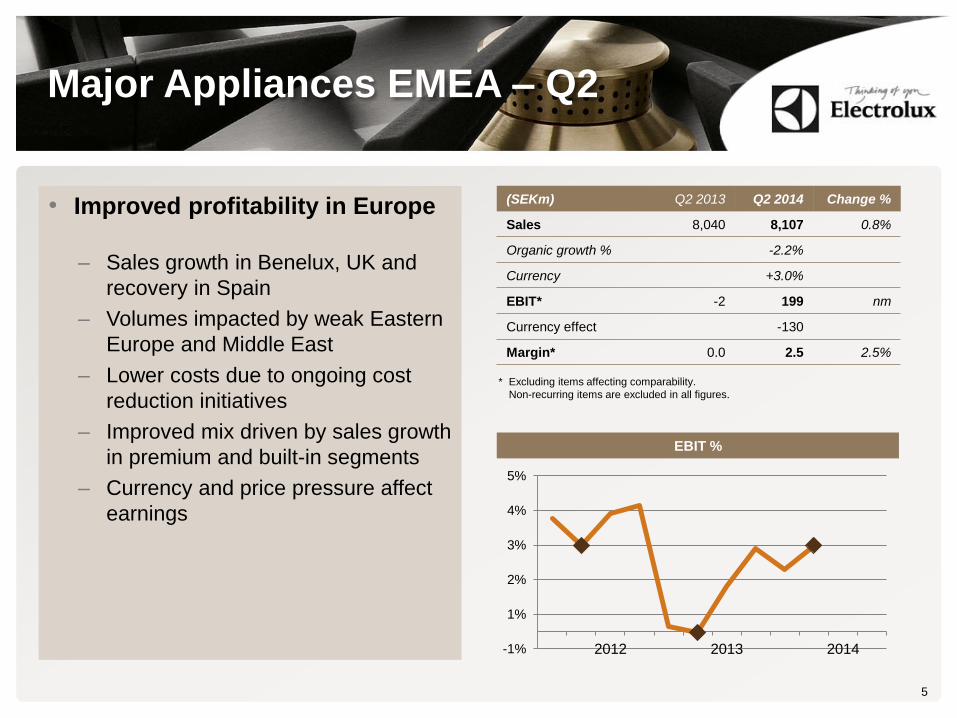
• Improved profitability in Europe
– Sales growth in Benelux, UK and
recovery in Spain
– Volumes impacted by weak Eastern
Europe and Middle East
– Lower costs due to ongoing cost
reduction initiatives
– Improved mix driven by sales growth
in premium and built-in segments
– Currency and price pressure affect
earnings
5
(SEKm) Q2 2013 Q2 2014 Change %
Sales 8,040 8,107 0.8%
Organic growth % -2.2%
Currency +3.0%
EBIT* -2 199 nm
Currency effect -130
Margin* 0.0 2.5 2.5%
* Excluding items affecting comparability.
Non-recurring items are excluded in all figures.
EBIT %
-1%
1%
2%
3%
4%
5%
2012 2013 2014
-20%
-15%
-10%
-5%
0%
5%
10%
2006 2007 2008 2009 2010 2011 2012 2013
European White Goods Market
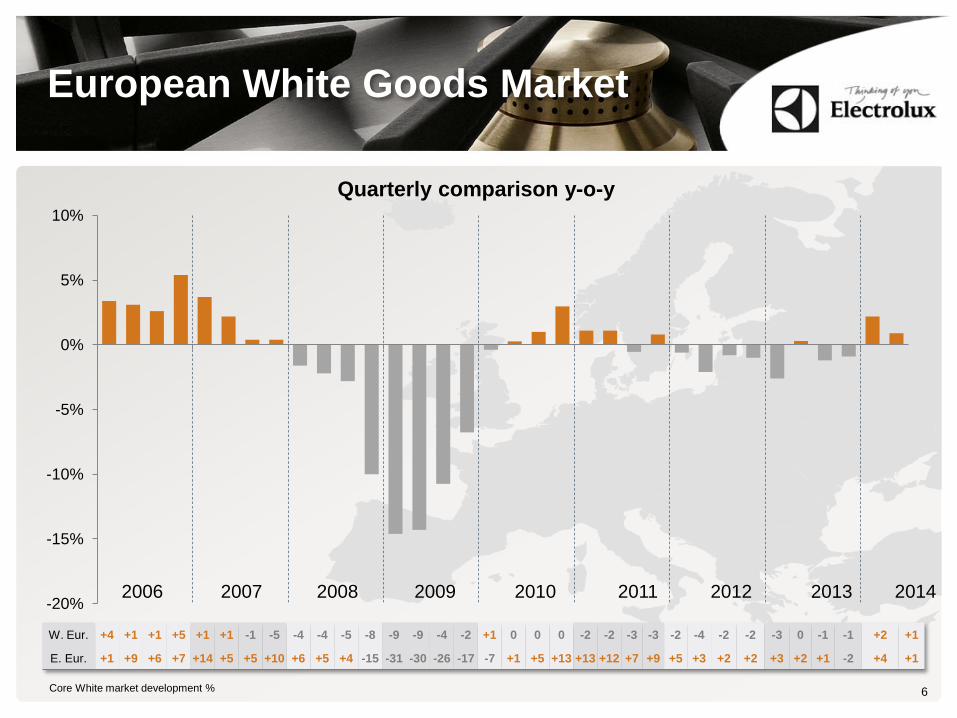
6 Core White market development %
W. Eur. +4 +1 +1 +5 +1 +1 -1 -5 -4 -4 -5 -8 -9 -9 -4 -2 +1 0 0 0 -2 -2 -3 -3 -2 -4 -2 -2 -3 0 -1 -1 +2 +1
E. Eur. +1 +9 +6 +7 +14 +5 +5 +10 +6 +5 +4 -15 -31 -30 -26 -17 -7 +1 +5 +13 +13 +12 +7 +9 +5 +3 +2 +2 +3 +2 +1 -2 +4 +1
Quarterly comparison y-o-y
2014
Major Appliances North America –
Q2
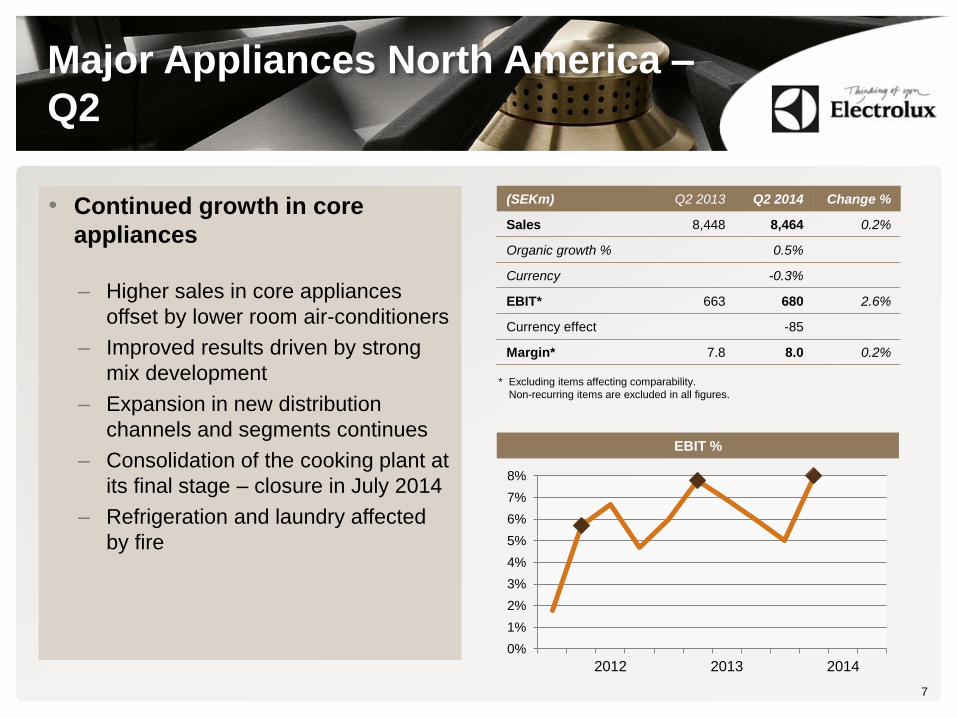
• Continued growth in core
appliances
– Higher sales in core appliances
offset by lower room air-conditioners
– Improved results driven by strong
mix development
– Expansion in new distribution
channels and segments continues
– Consolidation of the cooking plant at
its final stage – closure in July 2014
– Refrigeration and laundry affected
by fire
7
(SEKm) Q2 2013 Q2 2014 Change %
Sales 8,448 8,464 0.2%
Organic growth % 0.5%
Currency -0.3%
EBIT* 663 680 2.6%
Currency effect -85
Margin* 7.8 8.0 0.2%
* Excluding items affecting comparability.
Non-recurring items are excluded in all figures.
0%
1%
2%
3%
4%
5%
6%
7%
8%
2012 2013 2014
EBIT %

-20%
-15%
-10%
-5%
0%
5%
10%
15%
2006 2007 2008 2009 2010 2011 2012 2013
North American White Goods Market
8
Quarterly comparison y-o-y
2014
Major Appliances Latin America – Q2
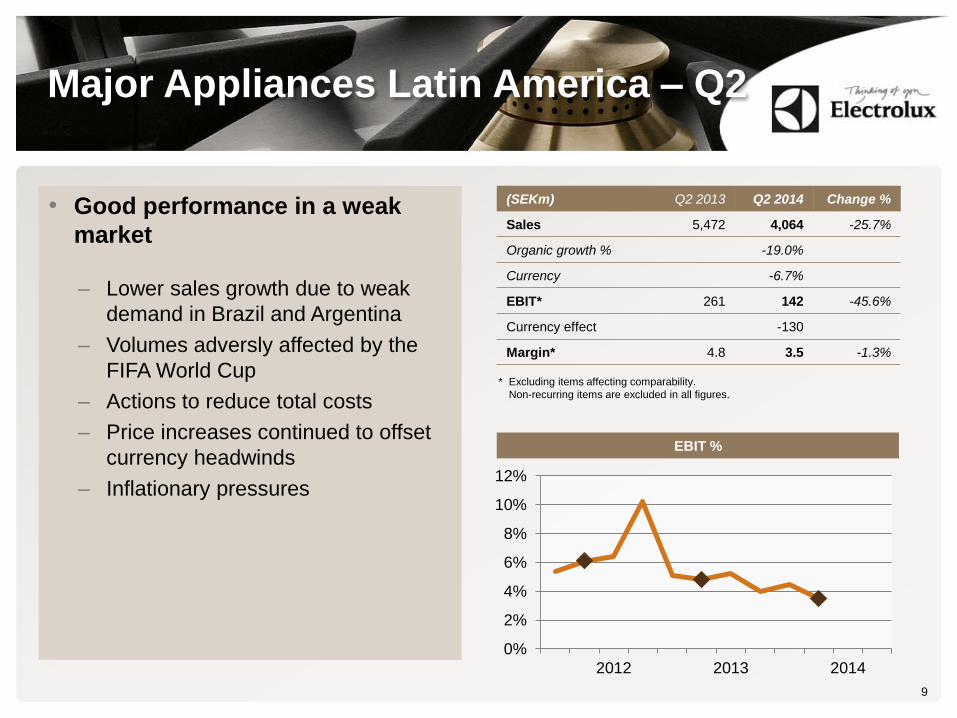
• Good performance in a weak
market
– Lower sales growth due to weak
demand in Brazil and Argentina
– Volumes adversly affected by the
FIFA World Cup
– Actions to reduce total costs
– Price increases continued to offset
currency headwinds
– Inflationary pressures
9
(SEKm) Q2 2013 Q2 2014 Change %
Sales 5,472 4,064 -25.7%
Organic growth % -19.0%
Currency -6.7%
EBIT* 261 142 -45.6%
Currency effect -130
Margin* 4.8 3.5 -1.3%
* Excluding items affecting comparability.
Non-recurring items are excluded in all figures.
0%
2%
4%
6%
8%
10%
12%
2012 2013 2014
EBIT %

Major Appliances Asia Pacific – Q2
10
(SEKm) Q2 2013 Q2 2014 Change %
Sales 2,227 2,221 -0.3%
Organic growth % 3.3%
Currency -3.6%
EBIT* 148 102 -31.1%
Currency effect -49
Margin* 6.6 4.6 -2.0%
* Excluding items affecting comparability.
Non-recurring items are excluded in all figures.
0%
2%
4%
6%
8%
10%
12%
2012 2013 2014
EBIT %
• Volume growth in Asia
– Organic growth of +3.3%
– Volume growth in China and
Southeast Asia
– Improved prices offset lower
volumes in Australia
– Launch investments in China and
plant ramp up costs in Thailand
continued to impact earnings
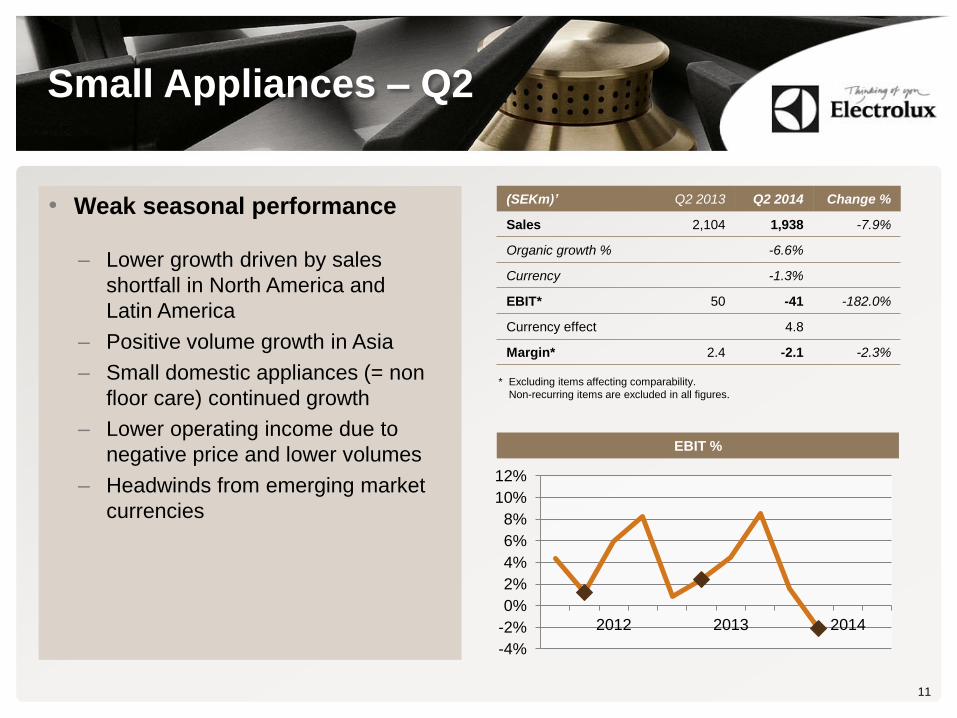
Small Appliances – Q2
11
(SEKm)’ Q2 2013 Q2 2014 Change %
Sales 2,104 1,938 -7.9%
Organic growth % -6.6%
Currency -1.3%
EBIT* 50 -41 -182.0%
Currency effect 4.8
Margin* 2.4 -2.1 -2.3%
* Excluding items affecting comparability.
Non-recurring items are excluded in all figures.
-4%
-2%
0%
2%
4%
6%
8%
10%
12%
2012 2013 2014
EBIT %
• Weak seasonal performance
– Lower growth driven by sales
shortfall in North America and
Latin America
– Positive volume growth in Asia
– Small domestic appliances (= non
floor care) continued growth
– Lower operating income due to
negative price and lower volumes
– Headwinds from emerging market
currencies
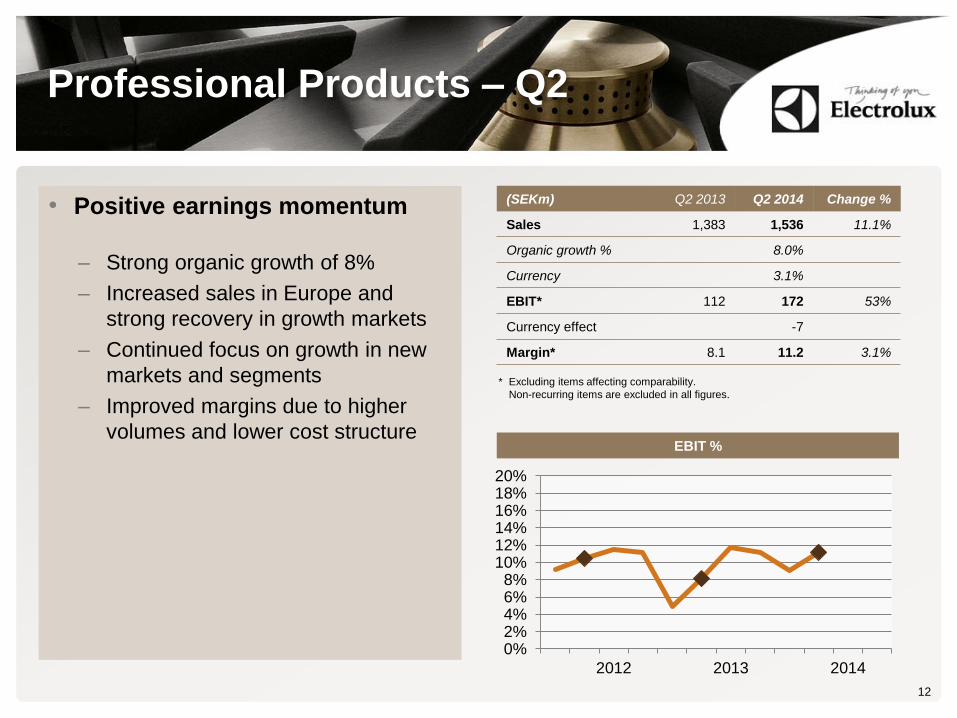
Professional Products – Q2
• Positive earnings momentum
– Strong organic growth of 8%
– Increased sales in Europe and
strong recovery in growth markets
– Continued focus on growth in new
markets and segments
– Improved margins due to higher
volumes and lower cost structure
12
(SEKm) Q2 2013 Q2 2014 Change %
Sales 1,383 1,536 11.1%
Organic growth % 8.0%
Currency 3.1%
EBIT* 112 172 53%
Currency effect -7
Margin* 8.1 11.2 3.1%
* Excluding items affecting comparability.
Non-recurring items are excluded in all figures.
0%2%4%6%8%
10%12%14%16%18%20%
2012 2013 2014
EBIT %

Financials Q2-14 Tomas Eliasson, CFO
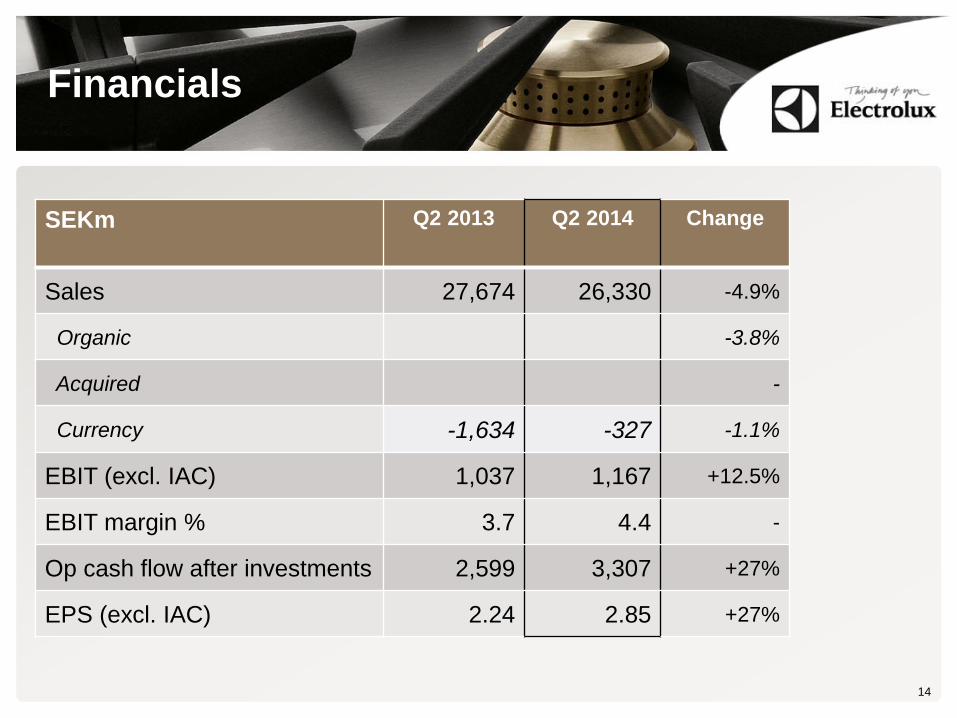
Financials
14
SEKm Q2 2013 Q2 2014 Change
Sales 27,674 26,330 -4.9%
Organic -3.8%
Acquired -
Currency -1,634 -327 -1.1%
EBIT (excl. IAC) 1,037 1,167 +12.5%
EBIT margin % 3.7 4.4 -
Op cash flow after investments 2,599 3,307 +27%
EPS (excl. IAC) 2.24 2.85 +27%
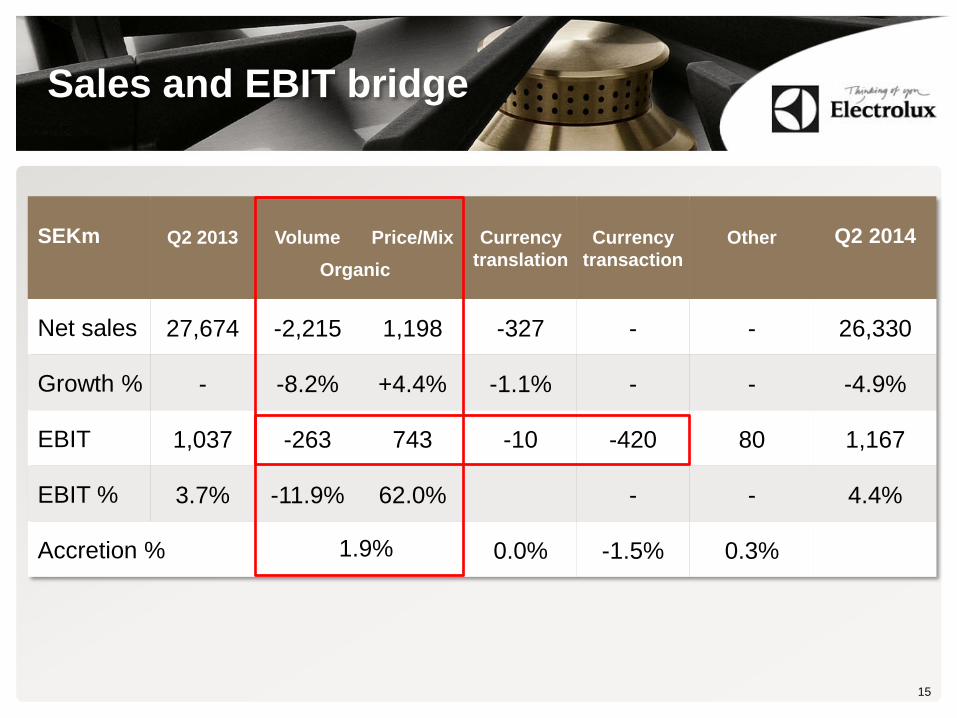
Sales and EBIT bridge
15
SEKm
Q2 2013
Volume
Price/Mix
Currency
translation
Currency
transaction
Other
Q2 2014
Net sales 27,674 -2,215 1,198 -327 - - 26,330
Growth % - -8.2% +4.4% -1.1% - - -4.9%
EBIT 1,037 -263 743 -10 -420 80 1,167
EBIT % 3.7% -11.9% 62.0% - - 4.4%
Accretion % 0.0% -1.5% 0.3%
Organic
1.9%

Currency Effects
16
Major transaction effects by, SEKm Q1 Q2 Q3 Q4
BRL -200 -80
ARS, CLP, VEF, COP -130 -50
CNY -1 -70
AUD -75 -35
RUB -15 -25
Total -565 -420
Translation effects, SEKm Q1 Q2 Q3 Q4
Total -55 -10
Total currency effects, SEKm -620 -430
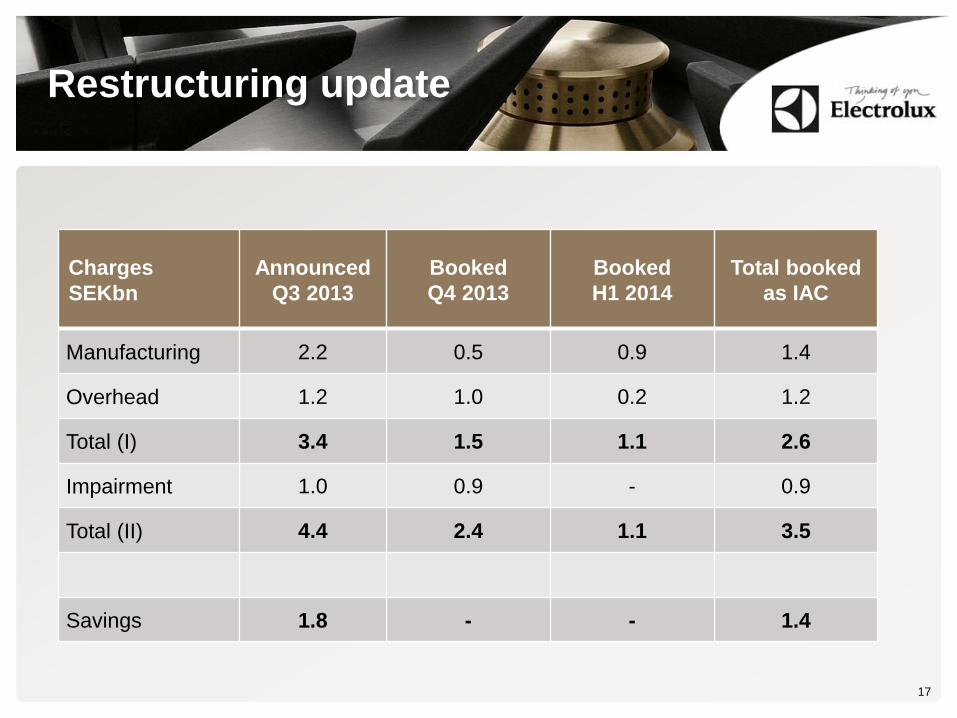
Restructuring update
17
Charges
SEKbn
Announced
Q3 2013
Booked
Q4 2013
Booked
H1 2014
Total booked
as IAC
Manufacturing 2.2 0.5 0.9 1.4
Overhead 1.2 1.0 0.2 1.2
Total (I) 3.4 1.5 1.1 2.6
Impairment 1.0 0.9 - 0.9
Total (II) 4.4 2.4 1.1 3.5
Savings 1.8 - - 1.4
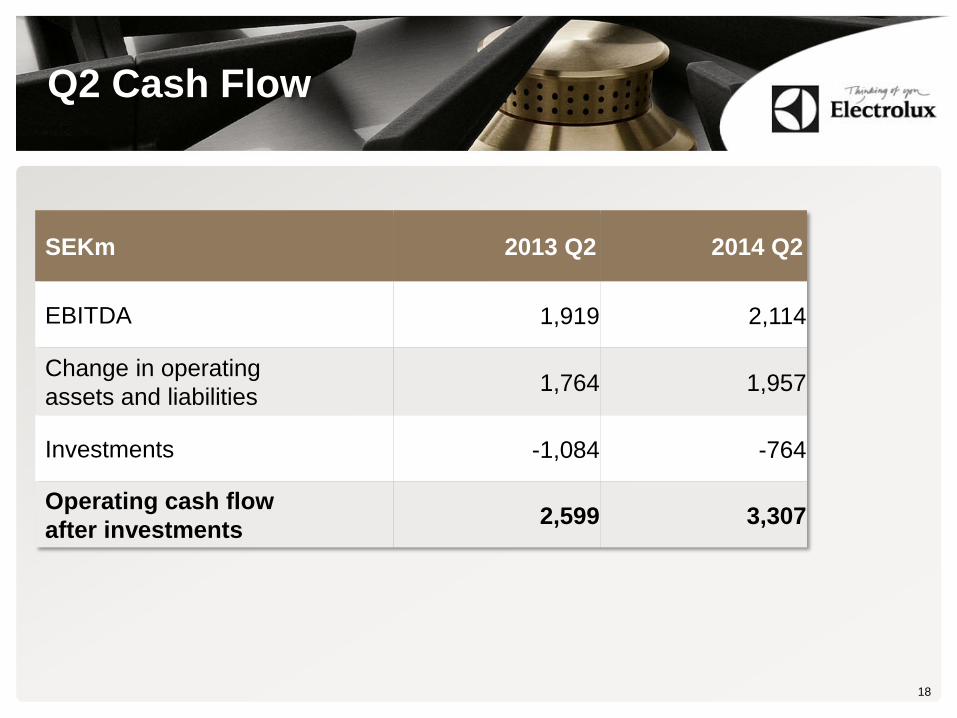
Q2 Cash Flow
18
SEKm 2013 Q2 2014 Q2
EBITDA 1,919 2,114
Change in operating
assets and liabilities 1,764 1,957
Investments -1,084 -764
Operating cash flow
after investments 2,599 3,307
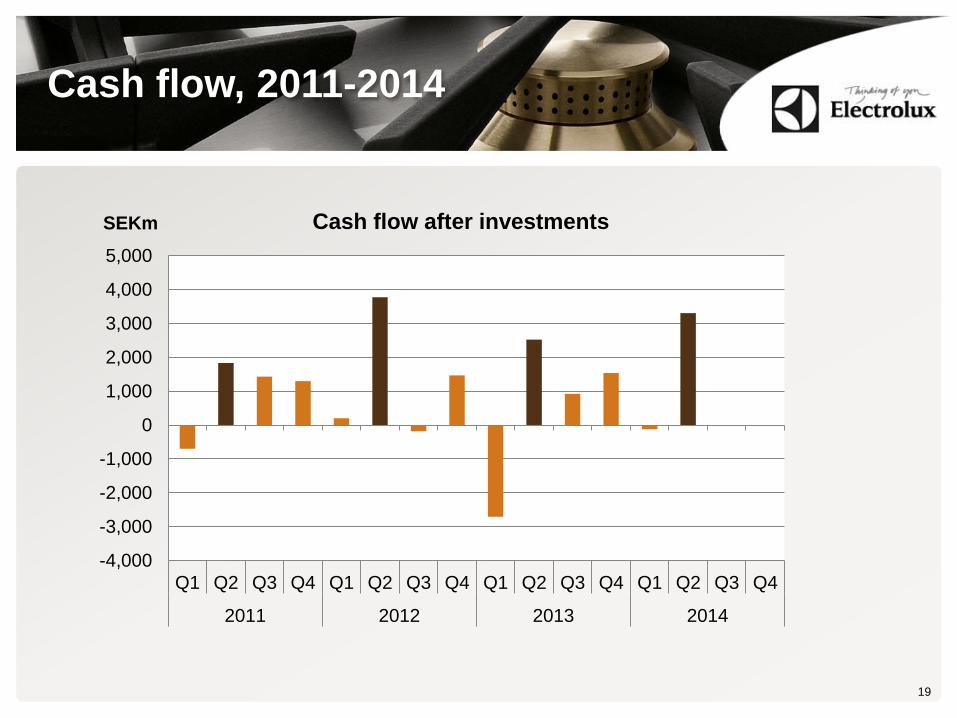
Cash flow, 2011-2014
19
-4,000
-3,000
-2,000
-1,000
0
1,000
2,000
3,000
4,000
5,000
Q1 Q2 Q3 Q4 Q1 Q2 Q3 Q4 Q1 Q2 Q3 Q4 Q1 Q2 Q3 Q4
2011 2012 2013 2014
Cash flow after investments SEKm

Outlook and summary Keith McLoughlin, President and CEO
Tomas Eliasson, CFO

Outlook
21
Q3 2014 FY 2014 Comments
Market volumes Slightly
Positive
Slightly
Positive
Growth in NA and emerging markets,
Europe recovery, Brazil deteriorating
Price/Mix Slightly
Positive
Slightly
Positive
Latin America and North America positive,
Europe: negative price, positive product mix
Asia/Pacific: negative country mix
Raw-material
costs Flat Flat Range SEK -100m/+100m
R&D and
Marketing Higher Higher
Higher marketing spend in North America
and Asia, higher global R&D
Cost savings SEK 250-
300m
SEK 1bn-
1.2bn
Includes global operations, overhead
reduction and manufacturing footprint
Summary Q2
Continued recovery in our core markets with a strong cash flow
Price and mix improvement offset lower volume growth
Profitability in EMEA is being restored
Solid performance in North America driven by strong mix
Given the weak market in Latin America performance was good
Good growth in Asia and Professional Products
22

23 23 23
24
Factors affecting forward-
looking statements
Factors affecting forward-looking statements
This presentation contains “forward-looking” statements within the meaning
of the US Private Securities Litigation Reform Act of 1995. Such statements
include, among others, the financial goals and targets of Electrolux for
future periods and future business and financial plans. These statements
are based on current expectations and are subject to risks and uncertainties
that could cause actual results to differ materially due to a variety of factors.
These factors include, but may not be limited to the following: consumer
demand and market conditions in the geographical areas and industries in
which Electrolux operates, effects of currency fluctuations, competitive
pressures to reduce prices, significant loss of business from major retailers,
the success in developing new products and marketing initiatives,
developments in product liability litigation, progress in achieving operational
and capital efficiency goals, the success in identifying growth opportunities
and acquisition candidates and the integration of these opportunities with
existing businesses, progress in achieving structural and supply-chain
reorganization goals.