Embed Size (px)
Citation preview

A
LHa
b
c
d
Te
f
a
ARRA
KGIFALP
2
0h
Veterinary Parasitology 193 (2013) 150– 162
Contents lists available at SciVerse ScienceDirect
Veterinary Parasitology
jou rn al h om epa ge: www.elsev ier .com/ locate /vetpar
nthelmintic resistance in sheep flocks in Ontario, Canada
.C. Falzona,∗, P.I. Menziesa, K.P. Shakyab, A. Jones-Bittona, J. Vanleeuwenc, J. Avulab,. Stewartd, J.T. Jansene, M.A. Taylor f,1, J. Learmount f, A.S. Peregrineb
Department of Population Medicine, Ontario Veterinary College, University of Guelph, Guelph, Ontario, CanadaDepartment of Pathobiology, Ontario Veterinary College, University of Guelph, Guelph, Ontario, CanadaCentre for Veterinary Epidemiological Research, Department of Health Management, Atlantic Veterinary College, University of Prince Edward Island, CanadaThe University of Trinidad and Tobago, Bio-sciences, Agriculture & Food Technologies, O’Meara Campus, O’Meara Industrial Park, Arima, Trinidad and
obagoVeterinary Science and Policy, Ontario Ministry of Agriculture, Food and Rural Affairs, Elora, Ontario, CanadaFood and Environment Research Agency, Sand Hutton, York YO41 1LZ, United Kingdom
r t i c l e i n f o
rticle history:eceived 10 July 2012eceived in revised form 7 November 2012ccepted 8 November 2012
eywords:astro-intestinal nematodes
vermectin drench failureecal Egg Count Reduction Testnthelmintic resistancearval Development Assaysost-treatment larval cultures
a b s t r a c t
Gastrointestinal nematodes (GIN) are a significant constraint to pasture-based sheep pro-duction worldwide. Anthelmintic resistance (AR) has been reported in most sheep-raisingareas in the world, yet little is known about the AR status in Canada. This study wasconducted to determine the frequency of AR in GIN in sheep flocks in Ontario, Canada. Forty-seven sheep flocks were enrolled in the study, and their level of parasitism was monitoredmonthly throughout a grazing season by analyzing owner-acquired fecal samples from 15grazing lambs per flock. When the mean GIN fecal egg count (FEC) reached a threshold of200 eggs per gram (epg), oral ivermectin was supplied to producers to check ivermectin effi-cacy; the reduction in mean FEC 14 days after ivermectin treatment was calculated. ‘Drenchfailure’ was defined as a reduction in mean FEC of <95%. In those flocks with apparent drenchfailure, researchers performed a Fecal Egg Count Reduction Test (FECRT), dividing sheep into4 treatment groups (n = 10–15): control (i.e. untreated), ivermectin, and, if sufficient num-bers of animals – fenbendazole and levamisole. AR was defined as a reduction in mean FEC<95% and a lower 95% confidence interval <90%. Larval cultures were performed on pooledpost-treatment FECRT samples. Larval Development Assays (LDAs) to detect the presence ofresistance to thiabendazole and levamisole were performed prior to the ivermectin drenchcheck on pooled owner-acquired fecal samples that reached the 200 epg threshold. Approx-imately 89% (42/47) of the farms reached the FEC threshold of 200 epg; 93% (39/42) of thesefarms performed an ivermectin drench check, and 88% (34/39) of these farms had drenchfailure. The FECRT was performed on 29 of the 34 farms. Resistance to ivermectin, fenben-dazole and levamisole was demonstrated on 97% (28/29), 95% (19/20) and 6% (1/17) of thefarms tested, respectively, with considerable variability in resistance levels among farms.Haemonchus sp. was the most commonly cultured parasite from post-treatment fecal sam-ples. LDA results for 21 farms were available; of these, 14% (3/21) and 62% (13/21) had low
and high levels of thiabendazole resistance, respectively, while none of the farms exhibitedresistance to levamisole.benzimidazoles was very
Haemonchus sp., is a seriomanagement need to be i
∗ Corresponding author at: Department of Population Medicine, Ontario VeterW1, Canada. Tel.: +1 519 824 4120x54595; fax: +1 519 763 8621.
E-mail address: [email protected] (L.C. Falzon).1 Present address: Vparst Ltd, Maple House, Dawson Road, Market Weighton Y
304-4017/$ – see front matter © 2012 Elsevier B.V. All rights reserved.ttp://dx.doi.org/10.1016/j.vetpar.2012.11.014
Amongst these tested farms, resistance to both ivermectin and
common. These findings strongly suggest that AR, particularly inus problem in these sheep flocks. Thus, marked changes in GINnstituted immediately to mitigate a worsening situation.© 2012 Elsevier B.V. All rights reserved.
inary College, University of Guelph, 50, Stone Road East, Guelph, ON N1G
O43 3GE, United Kingdom.
y Parasit
L.C. Falzon et al. / Veterinar1. Introduction
Parasitic gastroenteritis caused by gastrointestinalnematodes (GINs) is widely considered the most impor-tant disease of grazing sheep worldwide, causing weightloss, diarrhea and death (Sutherland and Scott, 2010). Gas-trointestinal nematode infections are typically controlledwith anthelmintic drugs, and sheep producers worldwidehave customarily relied heavily on such drugs to maintainsheep health and productivity, while improving the overallprofitability of the sheep industry (Sargison, 2008).
In North America, three broad-spectrum anthelminticdrug classes are most commonly used in sheep: macro-cyclic lactones (e.g. ivermectin and moxidectin), benzimi-dazoles (e.g. thiabendazole, fenbendazole and albendazole)and imidazothiazoles (e.g. levamisole) (Adams, 2001). InCanada, only ivermectin is licensed for use in sheep(Compendium of Veterinary Products, Canada, 2012). Thia-bendazole was the first benzimidazole to be marketed inCanada in the early 1960s (Adams, 2001), but was sub-sequently replaced with other structurally similar, butimproved drugs, such as fenbendazole and albendazole.Fenbendazole and albendazole are licensed for use inCanada in cattle (Compendium of Veterinary Products,Canada, 2012), but are often used in sheep in an extra-label manner. Levamisole has not been licensed for use insheep in Canada for the past 10 years (Health Canada – DrugProduct Database Online Query, 2012).
Anthelmintic resistance (AR) is defined as the “heritableability of the parasite to tolerate a normally effective doseof the anthelmintic” (Abbott et al., 2009), and if sufficientlyprevalent in a parasite population, results in treatment fail-ure. However, treatment failure may also be caused byother confounding factors (McKenna, 1990), such as under-dosing or incorrect administration of anthelmintic drugs(El-Abdellati et al., 2010).
Anthelmintic resistance is an escalating problem inmost sheep-rearing countries worldwide (Papadopoulos,2008), and is a threat to both agricultural income and sheepwelfare (Wolstenholme et al., 2004). It is widespread inNew Zealand (Waghorn et al., 2006), Australia (Love et al.,1992; Besier and Love, 2004), and in many South Amer-ican countries, such as Brazil and Uruguay (Waller et al.,1996; Cezar et al., 2010). In recent years, AR has also beendescribed in the United States (Kaplan and Vidyashankar,2012) and in several European countries including Greece(Gallidis et al., 2009), Italy (Cringoli et al., 2009) and theUnited Kingdom (Jackson and Coop, 2000). In 2007, thefirst case of AR in Canada was described in a sheep flockin Ontario (Glauser et al., 2007). Ontario is considered tohave a humid continental climate, with cold snowy wintersand warm to hot summers (World Maps of Köppen-GeigerClimate Classification, 2012). While recent studies haveinvestigated how this climate affects the epidemiology ofGIN infections in sheep (Mederos et al., 2010), no surveyshave been published on how widespread the problem oftreatment failure and AR is in sheep flocks in Canada and,
in particular, Ontario.The Fecal Egg Count Reduction Test (FECRT) is thestandard test for determining AR under field conditions(Coles et al., 1992), and provides an indirect measurement
ology 193 (2013) 150– 162 151
of anthelmintic efficacy by determining the reduction infecal egg counts (FECs) after treatment (McKenna, 2006).Several authors have suggested different threshold valuesfor defining the presence of AR (McKenna, 1990; Woodet al., 1995; Smart, 2009), but the most commonly acceptedthreshold is that endorsed by the World Association for theAdvancement of Veterinary Parasitology (WAAVP), whichdefines AR as a Fecal Egg Count Reduction (FECR) of <95%and a lower 95% confidence interval (CI) of <90%; if onlyone of these two factors is present, the farm is defined asbeing ‘suspected’ of having resistance (Coles et al., 1992).
Despite being the standard test for AR determination,the FECRT is laborious, expensive and time-consuming(Craven et al., 1999; El-Abdellati et al., 2010). As a result,various alternative diagnostic tests have been suggestedfor the determination of anthelmintic susceptibility (Coleset al., 2006). The Larval Development Assay (LDA) describedby Taylor (1990) is based on culturing a known number ofGIN eggs in the presence of different anthelmintics. It isreported to be relatively easy to perform, more sensitivethan the FECRT, and allows for the identification of para-site larvae to the genus level (Taylor, 1990). However, someLDAs are unable to reliably detect resistance to avermectins(Grimshaw et al., 1994), and the methodology is consideredby some to require a high level of technical expertise, thuslimiting its use outside of research laboratories (Kaplan andVidyashankar, 2012).
The objectives of this study in Ontario sheep flockswere: (i) to determine the frequency of ivermectin treat-ment failure; (ii) to determine the frequency of resistanceto ivermectin, fenbendazole and levamisole using a FECRT;and (iii) to assess the frequency of resistance to thiabenda-zole and levamisole using the LDA.
2. Materials and methods
2.1. Number and selection of sheep farms
The study was conducted in Ontario, Canada, for twoconsecutive grazing seasons (May to November 2010 andMay to November 2011). The target population was sheepfarms in Ontario, while the study population was eligibleand willing sheep producers (as defined below) that weremembers of the Ontario Sheep Marketing Agency (OSMA)– a producer-operated agency formed under the OntarioFarm Products Marketing Act that represents all producersthat raise and sell market lambs. All registered producers(n = 3600) receive the magazine ‘Ontario Sheep News’, withover 70% of these producers also receiving emails from theOSMA email list-serve (OSMA office, personal communica-tion).
Forty-seven sheep farms were recruited during thesummers of 2010 or 2011. This sample size is associatedwith a precision of 14%, using a 95% level of confidence andan estimated ivermectin drench failure prevalence of 60%(latter estimate based on an unpublished pilot study con-ducted on Ontario sheep farms in 2009, in which 8 of 13
farms tested had ivermectin drench failure).Recruitment required volunteer participation and wascarried out through talks given at various OSMA sheep pro-ducer meetings held across the province and letters posted
1 y Parasit
ilhttfielpaT((
2
scecp5pctytbtctDU
rcpicFFctawow
2
aiCwdtTt
52 L.C. Falzon et al. / Veterinar
n the ‘Ontario Sheep News’ and distributed via the emailist-serve. To be included in the study, farms had to: (i)ave a minimum of 30 animals (lambs or yearling ewes) inheir first grazing season; and (ii) keep the animals on pas-ure for at least 3 months during the grazing season. Therst criterion was set to include both lambs and yearlingwes since a number of producers in Ontario opt to keepambs indoors during the summer months to reduce risk ofredator attacks, thereby minimizing their GIN exposurend immunity development during their first year of life.his study was approved by the Animal Care CommitteeProtocol Number: 09R056) and the Research Ethics BoardProtocol Number: 09DC005) at the University of Guelph.
.2. Farm monitoring
Starting in May each year, all producers enrolled in thetudy received a kit for fecal sample collection. This kitonsisted of a Styrofoam cooler with 2 ice-packs, transpar-nt plastic sealable bags, elastic bands, disposable gloves,ellophane packing tape, a bag with 5 g of coffee beans (torovide producers with a visual estimate of approximately
g of sheep feces), a courier (Purolator Inc., Canada) ship-ing label, and a consent form. Producers were asked toollect 5 g of fresh fecal pellets from the ground or per rec-um, using the gloves provided, from each of 15 lambs orearling ewes in their first grazing season, and to packagehese fecal samples individually, using the plastic sealableags and elastic bands. The producers were then askedo place the samples in the Styrofoam cooler with thehilled ice-packs, and to courier the taped box, along withhe signed consent form, to the Parasitology Laboratory,epartment of Pathobiology, Ontario Veterinary College,niversity of Guelph.
The fecal samples were analyzed individually andesults used to determine the flock mean FEC, as an indi-ator of flock-level GIN parasitism. A mean FEC of 200 eggser gram (epg) was the threshold used for conducting the
vermectin drench check, since a previous study has indi-ated that this is a sufficient level for detecting changes inEC following treatment (Miller et al., 2006). If the meanEC on the farm was <200 epg, another kit for fecal sampleollection was sent to the producer, and they were askedo repeat the process in 3–4 weeks; kits were thus sentpproximately monthly until either the mean FEC attainedas ≥200 epg or until early September. If the mean FEC
n the farm reached ≥200 epg, an ivermectin drench checkas conducted.
.3. Ivermectin drench check
For the ivermectin drench check, a package containing sample-collection kit (see Section 2.2) and a 1 l bottle ofvermectin (0.8 mg/mL, Ivomec® Drench for Sheep, Merialanada Inc.) was couriered to the producers. The producersere asked to treat the sampled group with the ivermectin
rench as they normally would; no recommendations onhe dosage or methodology of treatment were provided.his was done to assess what producers normally do onheir farms.ology 193 (2013) 150– 162
Fourteen days after treatment, the producers wereasked to collect fecal samples from 15 of the treatedanimals, which were not necessarily the same animalssampled before treatment, and then package the samplesindividually and send for analysis as described above. Thepost-treatment fecal samples were analyzed individually,and the GIN FECR following ivermectin treatment was cal-culated for the group sampled as:
100 × mean FEC before treatment − mean FEC after treatmentmean FEC before treatment
In the published literature, drench failure is ascribedwhen the post-treatment FECs are positive (Sargison,2008); however, specific cut-points to indicate resistancewhen post-treatment FECs were positive could not befound. A review by Campbell and Benz (1984) describesivermectin efficacy in the absence of resistance as varyingbetween 95 and 100% for different stages and species ofovine GINs. As such, ivermectin drench success was definedas a mean FECR ≥95%, and ivermectin drench failure as amean GIN FECR <95% in the work described here. If a farmhad ivermectin drench success, no further sampling wasperformed on that farm. If a farm had ivermectin drenchfailure, a FECRT was initiated.
2.4. Fecal Egg Count Reduction Test
The FECRT was conducted a minimum of three weeksafter treatment with ivermectin. Each farm was visitedtwice by the research team, 14 days apart (day 0 and day14), and lambs or yearling ewes in their first grazing season(as described previously) were included.
On the first visit, eligible animals were divided into oneof a maximum of 4 treatment groups, each with 10–15 ani-mals: control (i.e. untreated), or treated with ivermectin,fenbendazole or levamisole. In the first year of the study,the animals were divided into groups sequentially (i.e. thefirst 15 animals passing through a chute were put in onegroup; the following 15 animals were put in a second group,etc.), except for 3 farms (farms 1, 3 and 7) where the animalswere divided into different pens prior to the researchers’visit, based on different age groups or breeds. In the secondyear, the animals were systematically assigned into groupsto allow for better randomization; this was carried out byrunning the animals through a chute and the first animalallocated to the first group, the second animal allocated tothe second group, etc. The age and sex of lambs was mixed,and all animals used were <2 years of age. The number ofanimals in each group was based on recommendations that10 animals per group are sufficient to detect differences inFEC between groups (Coles et al., 1992); up to 15 animalsper group were sampled to help account for any losses ornon-suppliers of fecal samples that might occur. On somefarms, less than 40 animals were eligible for inclusion inthe study; fewer treatment groups were therefore used onthese farms.
All animals involved in the FECRT were identified
using ear-tag numbers, weighed, and then either leftuntreated or treated by the researchers according to thetreatment group assigned. Treatments were as follows:0.2 mg/kg ivermectin (Ivomec Drench for Sheep, Merial
y Parasit
L.C. Falzon et al. / VeterinarCanada Inc.); 5 mg/kg fenbendazole (Safe-guardTM Suspen-sion 10%, Intervet Canada Ltd.); or 10.5 mg/kg levamisole(levamisole hydrochloride suspension, Chiron Compound-ing Pharmacy Inc., Canada). Doses were calculated based oneach animal’s individual weight. Both the ivermectin andlevamisole drenches were administered using a drench-gun that was calibrated before use, and after half of theanimals per treatment group had been treated. The fenben-dazole drench was administered using a 5 mL syringe sincesmall doses were required, and the dose was administeredorally over the back of the tongue.
Fecal samples were collected by the researchers directlyfrom the rectum of each selected animal on day 0 andday 14, and these samples were analyzed individually andused to determine the arithmetic mean FEC pre- and post-treatment for each of the treatment groups. Due to logisticconstraints related to the distant locations of the farms, ontwo farms in the first year (farms 4 and 9), the producerswere asked to collect fecal samples from the rectums ofselected animals 14 days after the first visit and to courierthe samples to the researchers for analysis.
2.5. Laboratory analysis
All fecal samples were examined at the ParasitologyLaboratory, Department of Pathobiology, Ontario Veteri-nary College, University of Guelph. During transportationto the laboratory, all fecal samples were shipped with ice-packs. Thereafter, they were kept refrigerated at 4 ◦C beforebeing tested. Time from fecal sample collection on farmto receipt by the laboratory took, on average, two busi-ness days, and most fecal samples were examined withinseven days of collection. In the first year of the study, somefecal samples were stored for up to three weeks beforebeing processed, due to a backlog of samples in the lab-oratory. All researchers processing the fecal samples wereblinded to the treatment status of individual sheep. Fecalegg counts were performed on individual fecal samplesusing a modified McMaster concentration method (Min-istry of Agriculture, Fisheries and Food [MAFF], 1986), witha lower detection limit of 50 epg.
2.6. Larval culture of post-treatment fecal samples
Larval cultures were performed on post-treatment fecalsamples (FECRT day 14), to identify the resistant GIN gen-era. In the first year, larval cultures were not carried out dueto a backlog of samples in the laboratory; in the second year,the larval cultures were performed on post-treatment fecalsamples (FECRT day 14) for all farms on which a FECRT wasconducted to identify the resistant GIN genera.
For each farm, fecal samples were pooled together using2 g of feces per animal, for the control and each treatedgroup, and the pooled feces were broken up finely usinga pestle and mortar. If the fecal mixture was too dry, justenough water was added to moisten the feces, whereas, if
the mixture was too wet, vermiculite was added to bringit to the necessary consistency (MAFF, 1986). The culturewells were then filled with the mixture, and separate cul-ture wells were used for the different groups. The wellsology 193 (2013) 150– 162 153
were incubated at 27 ◦C for 7 days, after which third-stage GIN larvae (L3s) were harvested by baermannization(Coles et al., 1992). The first 100 L3s, or all L3s when <100developed, were identified to the genus level, followingidentification keys (MAFF, 1986).
2.7. Larval Development Assay
Larval Development Assays were performed to assessthe in vitro anthelmintic susceptibility of GIN on sheepfarms. In the first year, a member of the research grouplearned the technique at the Central Science Laboratory,York, United Kingdom and then established it at the Para-sitology Laboratory, Department of Pathobiology, OntarioVeterinary College, University of Guelph. In the secondyear, LDAs were performed for all farms that reachedthe mean FEC threshold of ≥200 epg; this included farmsenrolled in the second year, and some farms from the firstyear that re-submitted fecal samples in the second year.The samples used for the LDAs were from animals that hadnot been treated with an anthelmintic for at least 28 days.
The LDA used was a modification of the method origi-nally described by Taylor (1990). In the modified method,the culture medium comprised lyophilized Escherichia coliand fecal extract, the final volume of fecal solution wasadjusted to give 300 eggs/mL, and 2 concentrations of thia-bendazole (0.1 and 0.3 �g/mL) and levamisole (1.0 and3.0 �g/mL) were tested. The anthelmintics used were in thepure form: 99% thiabendazole (Sigma Life Science, T8904-100G, batch number: 079K1429) and 99% levamisole(ACROS Organics, CAS: 16595-80-5, Lot: A0287589), andtherefore were diluted to the appropriate concentrations.All tests were run in duplicate, with a total of 10 culturewells per farm (2 control wells and 8 test wells) that wereincubated at 26 ± 3 ◦C for seven days. Recovered L3s in eachwell were counted and the first 100 L3s were identifiedmicroscopically to the genus level (MAFF, 1986).
2.8. Descriptive statistics
2.8.1. Fecal Egg Count ReductionAll data were entered manually into an Excel spread-
sheet (Microsoft Office Excel©, 2007). The FECR wascalculated in SAS® 9.3 (SAS Institute Inc., Cary, NC, USA),using the method endorsed by the WAAVP (Coles et al.,1992):
FECR = 100 × (1 − [T2/C2]), where T2 and C2 are the arith-metic means of epg, 14 days after treatment, for thetreated and control groups, respectively;The 95% CI was calculated as: 100 × (1 − [T2/C2]exp [±1.96
√Y2]), where Y2 is the variance of the reduction
percentage.
Farms were classified as resistant when the FECR was<95% and the lower 95% CI limit was <90%; if only one ofthese two criteria was met, the farm was classified as beingsuspected of resistance (Coles et al., 1992).
1 y Parasit
2
tweogFicgggFitWta<tta(w
2
ltrwclb≤hioa3obFttg
s≥pd
1lls − ms-spec
Wc
ru
54 L.C. Falzon et al. / Veterinar
.8.2. Larval cultures from FECR samples post-treatmentThe percentage reduction for specific genera for each
reatment was calculated for each farm in which the FECRTas performed using an equation described by Waghorn
t al. (2006). Briefly, the pre-treatment FEC by genera wasbtained by multiplying the proportion of larvae for eachenus in the control well with the average pre-treatmentEC; any genus failing to achieve the equivalent of >50 epgn the pre-treatment counts was excluded from furtheralculations as their number was considered too low toive a reliable result (Coles et al., 2006). The efficacy byenus, for each treatment, was calculated by dividing theenus-specific post-treatment FECs by the genus-specificECs from the pre-treatment samples, and then multiply-ng this value with the reduction in the untreated group,o control for any changes occurring in the latter group.
hen the reduction was <95%, the genus was consideredo be resistant to that anthelmintic treatment. If the over-ll FECR was ≥95% (i.e. anthelmintic was effective) and/or50 L3s were found in an individual treatment culture (cul-ure results deemed inconclusive for that anthelmintic),he genus-specific reduction was not calculated. A one-waynalysis of variance using proc GLM for unbalanced designSAS 9.3) was performed to compare genus-specific FECRsithin treatment groups.
.8.3. Larval Development AssayThe LDA was considered reliable when a mean of >100
arvae was isolated in the 2 control wells. Farms that methis criterion were defined as having a low level of drugesistance when the total number of L3s that developed inells containing anthelmintics at the discriminatory drug
oncentration of 0.1 �g/mL thiabendazole or 1.0 �g/mLevamisole (Mitchell et al., 2010) was >5% of the num-er that developed in the control wells, while there was5% of the number of larvae in the control wells in theigher concentration wells. Farms were defined as hav-
ng a high level of drug resistance when the total numberf L3s that developed in wells containing anthelminticst the higher concentration of 0.3 �g/mL thiabendazole or.0 �g/mL levamisole was >5% of the number that devel-ped in the control wells. The 5% cut-offs were selected toe consistent with the definition of resistance used for theECRT, whereby resistance is said to be present if the reduc-ion in GIN eggs following treatment is <95%, compared tohe number of GIN eggs in the control or pre-treatmentroup.
When the proportion of Haemonchus sp., Teladorsagiapp. and/or Trichostrongylus spp. in the control well was5% of the total larvae isolated in the control well, theercentage reductions were separately calculated, for bothrugs at both concentrations, for each genus as:
00 × mean number of genus-specific larvae in control wemean number of genu
hen the percentage reduction was <95%, the genus was
onsidered to be resistant.In-depth statistical analyses comparing FECRT and LDAesults have been included in a separate paper (Falzon et al.,npublished).
ology 193 (2013) 150– 162
ean number of genus-specific larvae in treatment wellsific larvae in control wells
3. Results
3.1. Study population
Forty-seven farms participated in the study from acrosssouthern and central Ontario (latitude from 42.6◦N to47.3◦N; longitude from 75.4◦W to 82.3◦W); 25 farms inYear 1, and 22 farms in Year 2. Flock sizes ranged between50 and 2000 animals (mean flock size = 300 animals).
3.2. Farm monitoring
Forty-two of 47 farms (89%) reached the fecal GINthreshold of ≥200 epg; 22 farms in Year 1 and 20 farms inYear 2. Of these 42 farms, 10 farms reached the thresholdin June, 26 farms in July, 5 farms in August, and 1 farm inSeptember. Four farms never reached the threshold, whileanother farm stopped submitting samples. On average, theproducers sent 1.7 and 1.4 sets of samples in the first andsecond year, respectively, before reaching the threshold.
3.3. Ivermectin drench check
Thirty-nine of 42 farms (93%) performed the iver-mectin drench check; 21 farms in Year 1 and 18 farmsin Year 2. The other three farms did not submit post-ivermectin treatment samples. Of the 39 farms, 5 (13%)farms had ivermectin drench success, while 34 (87%) farmshad ivermectin drench failure. All cases of drench suc-cess occurred in the first year. Of the 34 farms withivermectin drench failure, 16 cases were reported in thefirst year and 18 cases were reported in the second year.For farms that performed an ivermectin drench check,the mean and median pre-ivermectin FECs were 1663 epgand 696 epg, respectively (range: 207–8302 epg), while themean and median post-ivermectin FECs were 1455 epg and804 epg, respectively (range: 0–5956 epg). The mean andmedian overall reductions were −103% and −19%, respec-tively (range: −1667% to 100%). Negative reduction valuesindicate that the FEC increased after treatment with iver-mectin.
3.4. Fecal Egg Count Reduction Test
A FECRT was conducted on 29 farms with ivermectindrench failure. In the first year, tests were conducted on 11farms and in the second year, the FECRT was conducted on16 farms. In addition, a FECRT was performed on two farmsfrom the first year for which drench failure was reportedtoo late in the season. In the first year, fecal samples from5/11 (45%) farms were stored in the refrigerator for upto 3 weeks before being processed due to a backlog of
samples in the laboratory; in the second year, all samples
were analyzed within a week of collection on the farm.Due to a limited number of animals on some farms,fenbendazole and levamisole were evaluated for efficacyon fewer farms than ivermectin. Overall, ivermectin was
L.C. Falzon et al. / Veterinary Parasitology 193 (2013) 150– 162 155
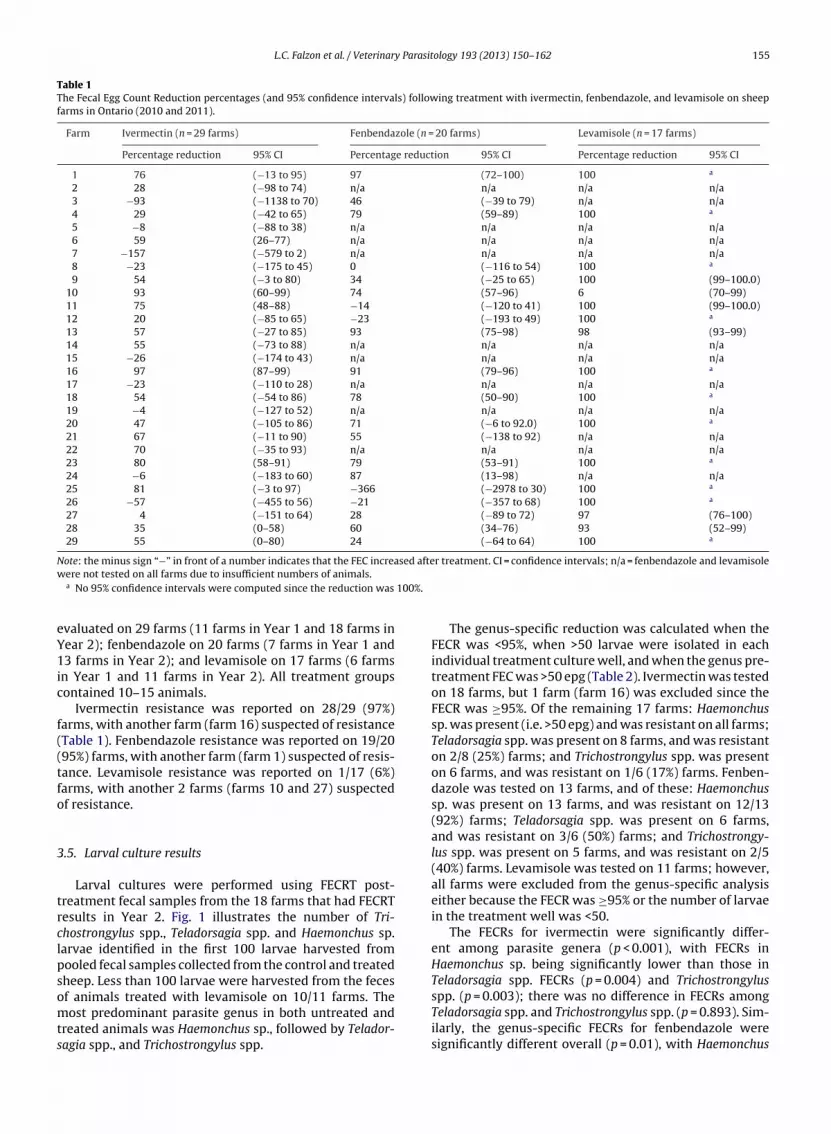
Table 1The Fecal Egg Count Reduction percentages (and 95% confidence intervals) following treatment with ivermectin, fenbendazole, and levamisole on sheepfarms in Ontario (2010 and 2011).
Farm Ivermectin (n = 29 farms) Fenbendazole (n = 20 farms) Levamisole (n = 17 farms)
Percentage reduction 95% CI Percentage reduction 95% CI Percentage reduction 95% CI
1 76 (−13 to 95) 97 (72–100) 100 a
2 28 (−98 to 74) n/a n/a n/a n/a3 −93 (−1138 to 70) 46 (−39 to 79) n/a n/a4 29 (−42 to 65) 79 (59–89) 100 a
5 −8 (−88 to 38) n/a n/a n/a n/a6 59 (26–77) n/a n/a n/a n/a7 −157 (−579 to 2) n/a n/a n/a n/a8 −23 (−175 to 45) 0 (−116 to 54) 100 a
9 54 (−3 to 80) 34 (−25 to 65) 100 (99–100.0)10 93 (60–99) 74 (57–96) 6 (70–99)11 75 (48–88) −14 (−120 to 41) 100 (99–100.0)12 20 (−85 to 65) −23 (−193 to 49) 100 a
13 57 (−27 to 85) 93 (75–98) 98 (93–99)14 55 (−73 to 88) n/a n/a n/a n/a15 −26 (−174 to 43) n/a n/a n/a n/a16 97 (87–99) 91 (79–96) 100 a
17 −23 (−110 to 28) n/a n/a n/a n/a18 54 (−54 to 86) 78 (50–90) 100 a
19 −4 (−127 to 52) n/a n/a n/a n/a20 47 (−105 to 86) 71 (−6 to 92.0) 100 a
21 67 (−11 to 90) 55 (−138 to 92) n/a n/a22 70 (−35 to 93) n/a n/a n/a n/a23 80 (58–91) 79 (53–91) 100 a
24 −6 (−183 to 60) 87 (13–98) n/a n/a25 81 (−3 to 97) −366 (−2978 to 30) 100 a
26 −57 (−455 to 56) −21 (−357 to 68) 100 a
27 4 (−151 to 64) 28 (−89 to 72) 97 (76–100)28 35 (0–58) 60 (34–76) 93 (52–99)29 55 (0–80) 24 (−64 to 64) 100 a
sed afte
100%.
Note: the minus sign “−” in front of a number indicates that the FEC increawere not tested on all farms due to insufficient numbers of animals.
a No 95% confidence intervals were computed since the reduction was
evaluated on 29 farms (11 farms in Year 1 and 18 farms inYear 2); fenbendazole on 20 farms (7 farms in Year 1 and13 farms in Year 2); and levamisole on 17 farms (6 farmsin Year 1 and 11 farms in Year 2). All treatment groupscontained 10–15 animals.
Ivermectin resistance was reported on 28/29 (97%)farms, with another farm (farm 16) suspected of resistance(Table 1). Fenbendazole resistance was reported on 19/20(95%) farms, with another farm (farm 1) suspected of resis-tance. Levamisole resistance was reported on 1/17 (6%)farms, with another 2 farms (farms 10 and 27) suspectedof resistance.
3.5. Larval culture results
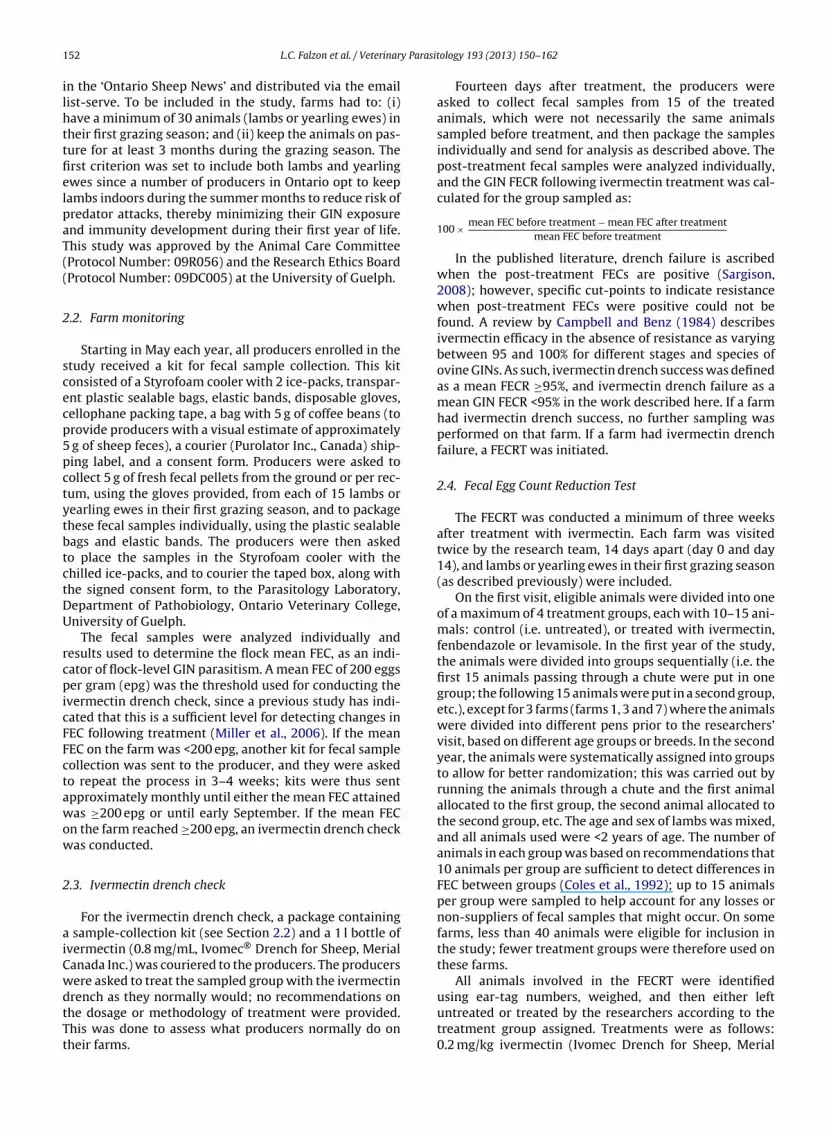
Larval cultures were performed using FECRT post-treatment fecal samples from the 18 farms that had FECRTresults in Year 2. Fig. 1 illustrates the number of Tri-chostrongylus spp., Teladorsagia spp. and Haemonchus sp.larvae identified in the first 100 larvae harvested frompooled fecal samples collected from the control and treatedsheep. Less than 100 larvae were harvested from the feces
of animals treated with levamisole on 10/11 farms. Themost predominant parasite genus in both untreated andtreated animals was Haemonchus sp., followed by Telador-sagia spp., and Trichostrongylus spp.r treatment. CI = confidence intervals; n/a = fenbendazole and levamisole
The genus-specific reduction was calculated when theFECR was <95%, when >50 larvae were isolated in eachindividual treatment culture well, and when the genus pre-treatment FEC was >50 epg (Table 2). Ivermectin was testedon 18 farms, but 1 farm (farm 16) was excluded since theFECR was ≥95%. Of the remaining 17 farms: Haemonchussp. was present (i.e. >50 epg) and was resistant on all farms;Teladorsagia spp. was present on 8 farms, and was resistanton 2/8 (25%) farms; and Trichostrongylus spp. was presenton 6 farms, and was resistant on 1/6 (17%) farms. Fenben-dazole was tested on 13 farms, and of these: Haemonchussp. was present on 13 farms, and was resistant on 12/13(92%) farms; Teladorsagia spp. was present on 6 farms,and was resistant on 3/6 (50%) farms; and Trichostrongy-lus spp. was present on 5 farms, and was resistant on 2/5(40%) farms. Levamisole was tested on 11 farms; however,all farms were excluded from the genus-specific analysiseither because the FECR was ≥95% or the number of larvaein the treatment well was <50.
The FECRs for ivermectin were significantly differ-ent among parasite genera (p < 0.001), with FECRs inHaemonchus sp. being significantly lower than those inTeladorsagia spp. FECRs (p = 0.004) and Trichostrongylus
spp. (p = 0.003); there was no difference in FECRs amongTeladorsagia spp. and Trichostrongylus spp. (p = 0.893). Sim-ilarly, the genus-specific FECRs for fenbendazole weresignificantly different overall (p = 0.01), with Haemonchus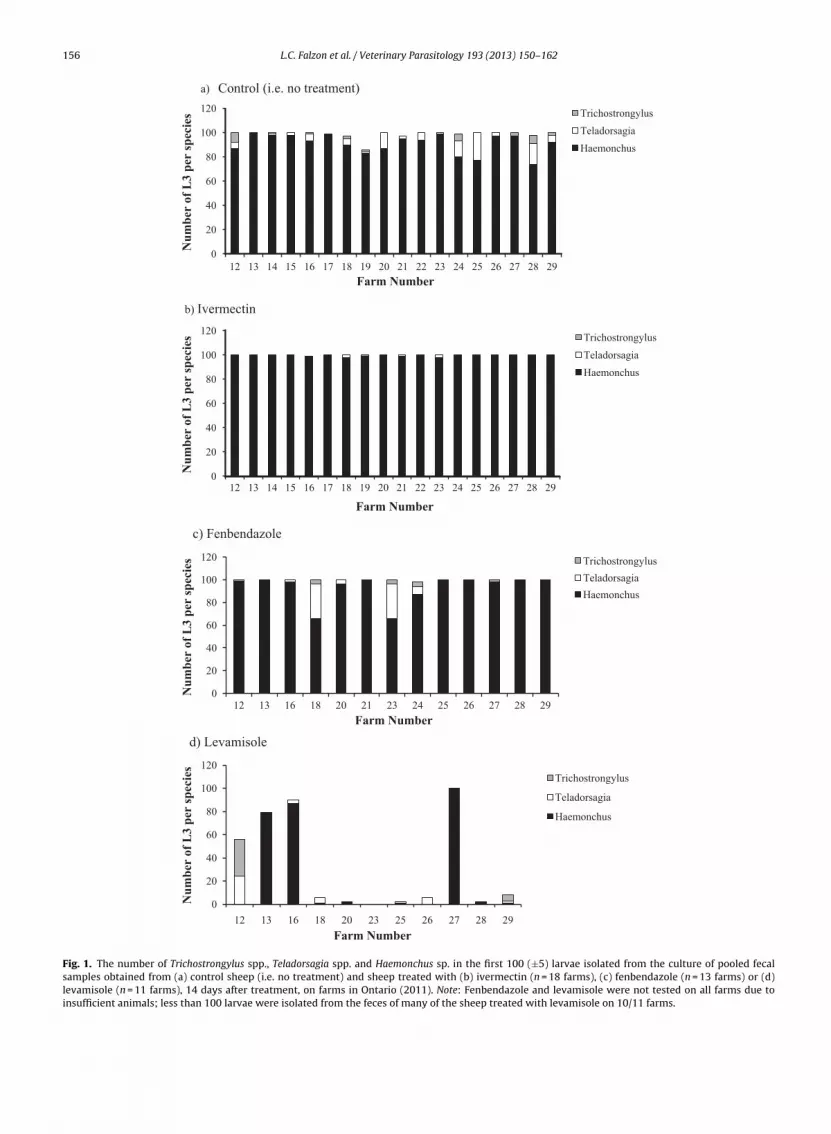
156 L.C. Falzon et al. / Veterinary Parasitology 193 (2013) 150– 162
0
20
40
60
80
100
120
12 13 14 15 16 17 18 19 20 21 22 23 24 25 26 27 28 29
Nu
mb
er o
f L
3 p
er s
pec
ies
Farm Number
Trichostr ongylus
Teladorsagia
Haemonch us
0
20
40
60
80
100
120
12 13 14 15 16 17 18 19 20 21 22 23 24 25 26 27 28 29
Nu
mb
er o
f L
3 p
er s
pec
ies
Farm Number
Trichostr ongylus
Teladorsagia
Haemonch us
b) Ivermectin
a) Control (i.e. no treatment)
d) Levamisole
0
20
40
60
80
100
120
12 13 16 18 20 21 23 24 25 26 27 28 29
Nu
mb
er o
f L
3 p
er s
pec
ies
Farm Number
Trichostr ongylus
Teladorsagia
Haemonch us
0
20
40
60
80
100
120
12 13 16 18 20 23 25 26 27 28 29
Nu
mb
er o
f L
3 p
er s
pec
ies
Farm Number
Trichostr ongylus
Teladorsagia
Haemonch us
c) Fenbendazole
Fig. 1. The number of Trichostrongylus spp., Teladorsagia spp. and Haemonchus sp. in the first 100 (±5) larvae isolated from the culture of pooled fecalsamples obtained from (a) control sheep (i.e. no treatment) and sheep treated with (b) ivermectin (n = 18 farms), (c) fenbendazole (n = 13 farms) or (d)levamisole (n = 11 farms), 14 days after treatment, on farms in Ontario (2011). Note: Fenbendazole and levamisole were not tested on all farms due toinsufficient animals; less than 100 larvae were isolated from the feces of many of the sheep treated with levamisole on 10/11 farms.
L.C. Falzon et al. / Veterinary Parasitology 193 (2013) 150– 162 157
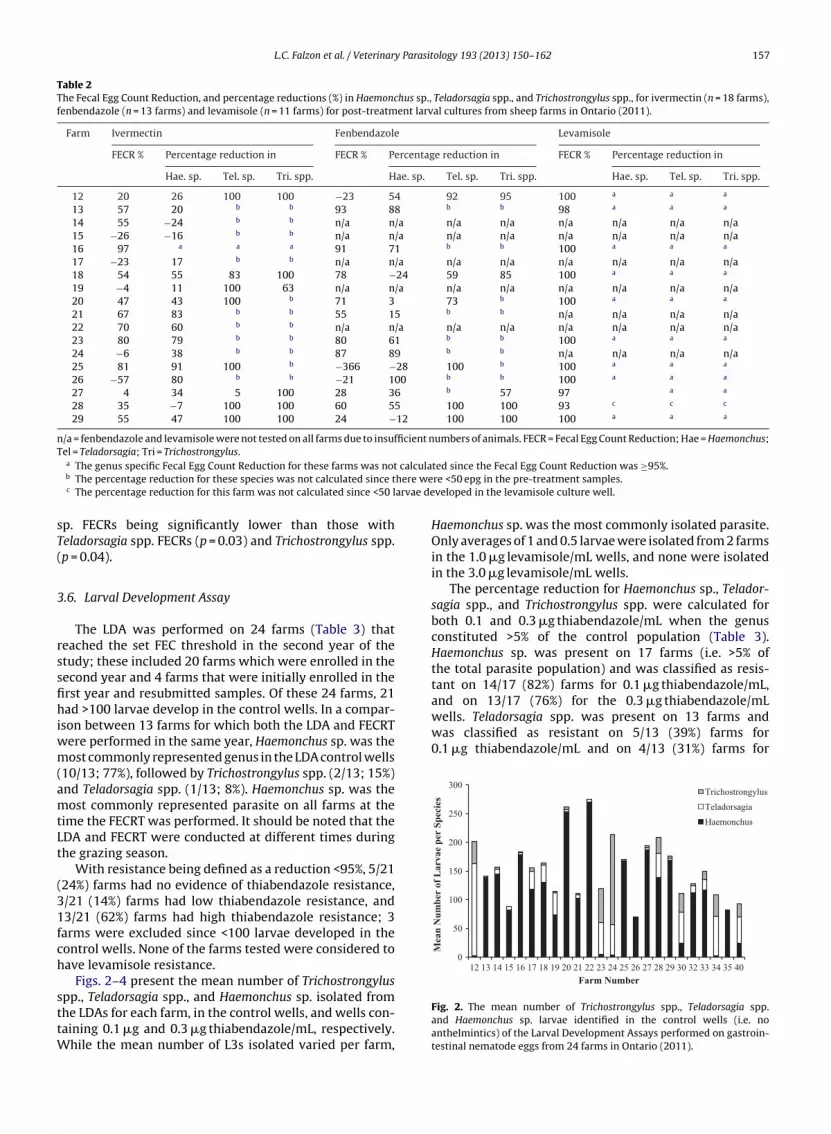
Table 2The Fecal Egg Count Reduction, and percentage reductions (%) in Haemonchus sp., Teladorsagia spp., and Trichostrongylus spp., for ivermectin (n = 18 farms),fenbendazole (n = 13 farms) and levamisole (n = 11 farms) for post-treatment larval cultures from sheep farms in Ontario (2011).
Farm Ivermectin Fenbendazole Levamisole
FECR % Percentage reduction in FECR % Percentage reduction in FECR % Percentage reduction in
Hae. sp. Tel. sp. Tri. spp. Hae. sp. Tel. sp. Tri. spp. Hae. sp. Tel. sp. Tri. spp.
12 20 26 100 100 −23 54 92 95 100 a a a
13 57 20 b b 93 88 b b 98 a a a
14 55 −24 b b n/a n/a n/a n/a n/a n/a n/a n/a15 −26 −16 b b n/a n/a n/a n/a n/a n/a n/a n/a16 97 a a a 91 71 b b 100 a a a
17 −23 17 b b n/a n/a n/a n/a n/a n/a n/a n/a18 54 55 83 100 78 −24 59 85 100 a a a
19 −4 11 100 63 n/a n/a n/a n/a n/a n/a n/a n/a20 47 43 100 b 71 3 73 b 100 a a a
21 67 83 b b 55 15 b b n/a n/a n/a n/a22 70 60 b b n/a n/a n/a n/a n/a n/a n/a n/a23 80 79 b b 80 61 b b 100 a a a
24 −6 38 b b 87 89 b b n/a n/a n/a n/a25 81 91 100 b −366 −28 100 b 100 a a a
26 −57 80 b b −21 100 b b 100 a a a
27 4 34 5 100 28 36 b 57 97 a a
28 35 −7 100 100 60 55 100 100 93 c c c
29 55 47 100 100 24 −12 100 100 100 a a a
n/a = fenbendazole and levamisole were not tested on all farms due to insufficient numbers of animals. FECR = Fecal Egg Count Reduction; Hae = Haemonchus;Tel = Teladorsagia; Tri = Trichostrongylus.
calculahere wearvae de
and on 13/17 (76%) for the 0.3 �g thiabendazole/mLwells. Teladorsagia spp. was present on 13 farms andwas classified as resistant on 5/13 (39%) farms for0.1 �g thiabendazole/mL and on 4/13 (31%) farms for
0
50
100
150
200
250
300
12 13 14 15 16 17 18 19 20 21 22 23 24 25 26 27 28 29 30 32 33 34 35 40
Mea
n N
um
ber
of
Larv
ae
per
Sp
ecie
s
Farm Number
Trichostr ongylus
Teladorsagia
Haemonch us
a The genus specific Fecal Egg Count Reduction for these farms was notb The percentage reduction for these species was not calculated since tc The percentage reduction for this farm was not calculated since <50 l
sp. FECRs being significantly lower than those withTeladorsagia spp. FECRs (p = 0.03) and Trichostrongylus spp.(p = 0.04).
3.6. Larval Development Assay
The LDA was performed on 24 farms (Table 3) thatreached the set FEC threshold in the second year of thestudy; these included 20 farms which were enrolled in thesecond year and 4 farms that were initially enrolled in thefirst year and resubmitted samples. Of these 24 farms, 21had >100 larvae develop in the control wells. In a compar-ison between 13 farms for which both the LDA and FECRTwere performed in the same year, Haemonchus sp. was themost commonly represented genus in the LDA control wells(10/13; 77%), followed by Trichostrongylus spp. (2/13; 15%)and Teladorsagia spp. (1/13; 8%). Haemonchus sp. was themost commonly represented parasite on all farms at thetime the FECRT was performed. It should be noted that theLDA and FECRT were conducted at different times duringthe grazing season.
With resistance being defined as a reduction <95%, 5/21(24%) farms had no evidence of thiabendazole resistance,3/21 (14%) farms had low thiabendazole resistance, and13/21 (62%) farms had high thiabendazole resistance; 3farms were excluded since <100 larvae developed in thecontrol wells. None of the farms tested were considered tohave levamisole resistance.
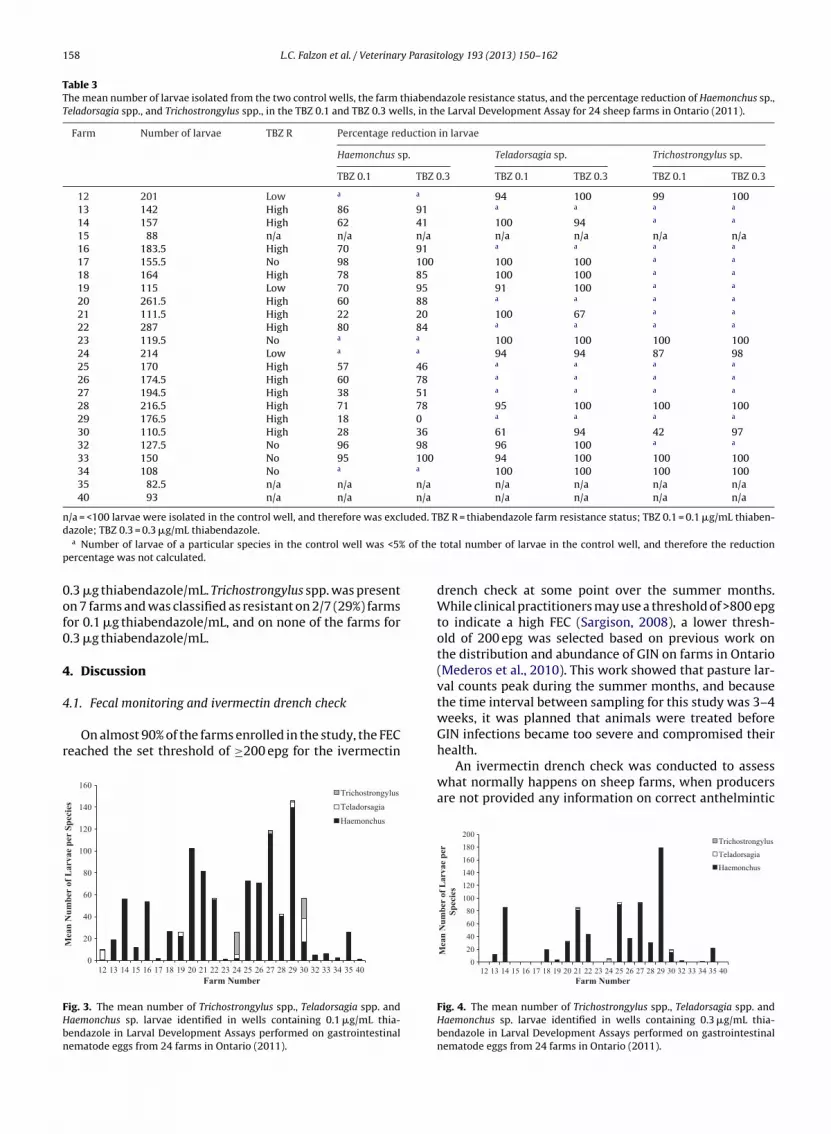
Figs. 2–4 present the mean number of Trichostrongylus
spp., Teladorsagia spp., and Haemonchus sp. isolated fromthe LDAs for each farm, in the control wells, and wells con-taining 0.1 �g and 0.3 �g thiabendazole/mL, respectively.While the mean number of L3s isolated varied per farm,ted since the Fecal Egg Count Reduction was ≥95%.re <50 epg in the pre-treatment samples.veloped in the levamisole culture well.
Haemonchus sp. was the most commonly isolated parasite.Only averages of 1 and 0.5 larvae were isolated from 2 farmsin the 1.0 �g levamisole/mL wells, and none were isolatedin the 3.0 �g levamisole/mL wells.
The percentage reduction for Haemonchus sp., Telador-sagia spp., and Trichostrongylus spp. were calculated forboth 0.1 and 0.3 �g thiabendazole/mL when the genusconstituted >5% of the control population (Table 3).Haemonchus sp. was present on 17 farms (i.e. >5% ofthe total parasite population) and was classified as resis-tant on 14/17 (82%) farms for 0.1 �g thiabendazole/mL,
Fig. 2. The mean number of Trichostrongylus spp., Teladorsagia spp.and Haemonchus sp. larvae identified in the control wells (i.e. noanthelmintics) of the Larval Development Assays performed on gastroin-testinal nematode eggs from 24 farms in Ontario (2011).
158 L.C. Falzon et al. / Veterinary Parasitology 193 (2013) 150– 162
Table 3The mean number of larvae isolated from the two control wells, the farm thiabendazole resistance status, and the percentage reduction of Haemonchus sp.,Teladorsagia spp., and Trichostrongylus spp., in the TBZ 0.1 and TBZ 0.3 wells, in the Larval Development Assay for 24 sheep farms in Ontario (2011).
Farm Number of larvae TBZ R Percentage reduction in larvae
Haemonchus sp. Teladorsagia sp. Trichostrongylus sp.
TBZ 0.1 TBZ 0.3 TBZ 0.1 TBZ 0.3 TBZ 0.1 TBZ 0.3
12 201 Low a a 94 100 99 10013 142 High 86 91 a a a a
14 157 High 62 41 100 94 a a
15 88 n/a n/a n/a n/a n/a n/a n/a16 183.5 High 70 91 a a a a
17 155.5 No 98 100 100 100 a a
18 164 High 78 85 100 100 a a
19 115 Low 70 95 91 100 a a
20 261.5 High 60 88 a a a a
21 111.5 High 22 20 100 67 a a
22 287 High 80 84 a a a a
23 119.5 No a a 100 100 100 10024 214 Low a a 94 94 87 9825 170 High 57 46 a a a a
26 174.5 High 60 78 a a a a
27 194.5 High 38 51 a a a a
28 216.5 High 71 78 95 100 100 10029 176.5 High 18 0 a a a a
30 110.5 High 28 36 61 94 42 9732 127.5 No 96 98 96 100 a a
33 150 No 95 100 94 100 100 10034 108 No a a 100 100 100 10035 82.5 n/a n/a n/a n/a n/a n/a n/a40 93 n/a n/a n/a n/a n/a n/a n/a
n/a = <100 larvae were isolated in the control well, and therefore was excluded. TBZ R = thiabendazole farm resistance status; TBZ 0.1 = 0.1 �g/mL thiaben-d
of the
p
0of0
4
4
r
FHbn
azole; TBZ 0.3 = 0.3 �g/mL thiabendazole.a Number of larvae of a particular species in the control well was <5%
ercentage was not calculated.
.3 �g thiabendazole/mL. Trichostrongylus spp. was presentn 7 farms and was classified as resistant on 2/7 (29%) farmsor 0.1 �g thiabendazole/mL, and on none of the farms for.3 �g thiabendazole/mL.
. Discussion
.1. Fecal monitoring and ivermectin drench check
On almost 90% of the farms enrolled in the study, the FECeached the set threshold of ≥200 epg for the ivermectin
0
20
40
60
80
100
120
140
160
12 13 14 15 16 17 18 19 20 21 22 23 24 25 26 27 28 29 30 32 33 34 35 40
Mea
n N
um
ber
of
Larv
ae
per
Sp
ecie
s
Farm Number
Trichostr ongylus
Telad orsagia
Haemonch us
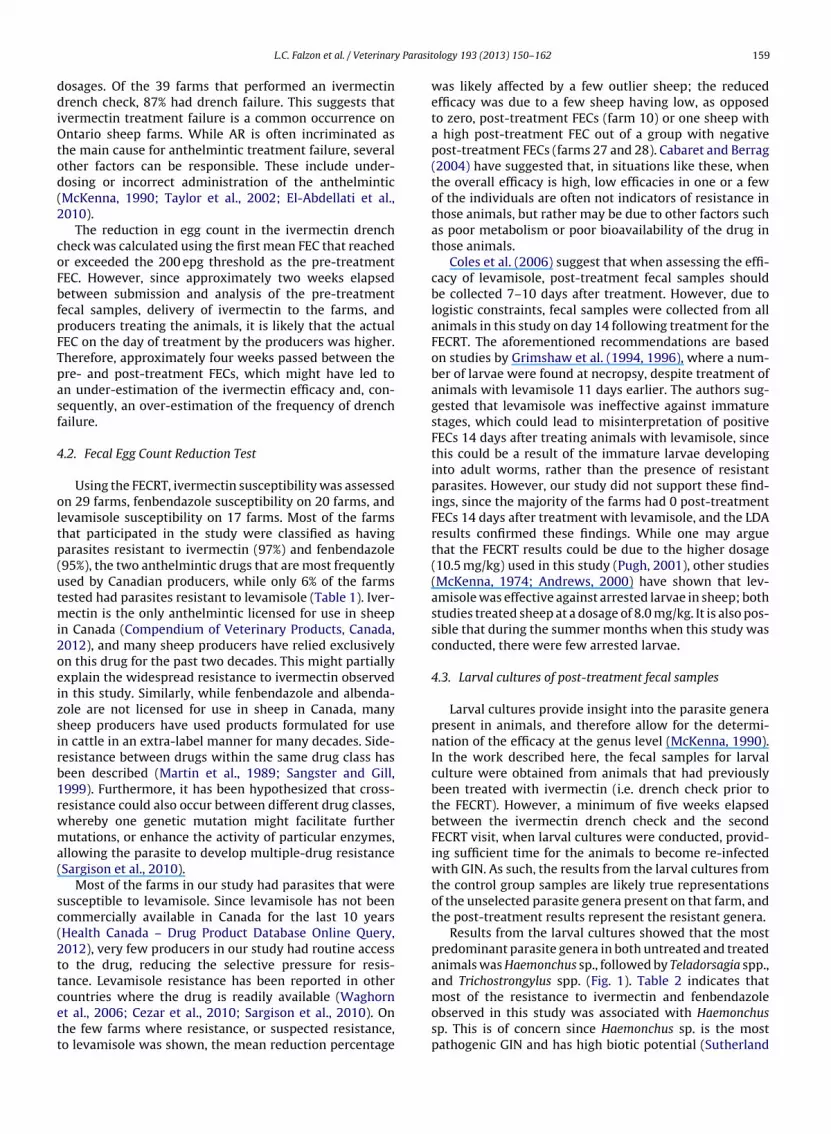
ig. 3. The mean number of Trichostrongylus spp., Teladorsagia spp. andaemonchus sp. larvae identified in wells containing 0.1 �g/mL thia-endazole in Larval Development Assays performed on gastrointestinalematode eggs from 24 farms in Ontario (2011).
total number of larvae in the control well, and therefore the reduction
drench check at some point over the summer months.While clinical practitioners may use a threshold of >800 epgto indicate a high FEC (Sargison, 2008), a lower thresh-old of 200 epg was selected based on previous work onthe distribution and abundance of GIN on farms in Ontario(Mederos et al., 2010). This work showed that pasture lar-val counts peak during the summer months, and becausethe time interval between sampling for this study was 3–4weeks, it was planned that animals were treated beforeGIN infections became too severe and compromised their
health.An ivermectin drench check was conducted to assesswhat normally happens on sheep farms, when producersare not provided any information on correct anthelmintic
0
20
40
60
80
100
120
140
160
180
200
12 13 14 15 16 17 18 19 20 21 22 23 24 25 26 27 28 29 30 32 33 34 35 40
Mea
n N
um
ber
of
Larv
ae
per
Sp
ecie
s
Farm Number
Trichostr ongylus
Teladorsagia
Haemonch us
Fig. 4. The mean number of Trichostrongylus spp., Teladorsagia spp. andHaemonchus sp. larvae identified in wells containing 0.3 �g/mL thia-bendazole in Larval Development Assays performed on gastrointestinalnematode eggs from 24 farms in Ontario (2011).
y Parasit
L.C. Falzon et al. / Veterinardosages. Of the 39 farms that performed an ivermectindrench check, 87% had drench failure. This suggests thativermectin treatment failure is a common occurrence onOntario sheep farms. While AR is often incriminated asthe main cause for anthelmintic treatment failure, severalother factors can be responsible. These include under-dosing or incorrect administration of the anthelmintic(McKenna, 1990; Taylor et al., 2002; El-Abdellati et al.,2010).
The reduction in egg count in the ivermectin drenchcheck was calculated using the first mean FEC that reachedor exceeded the 200 epg threshold as the pre-treatmentFEC. However, since approximately two weeks elapsedbetween submission and analysis of the pre-treatmentfecal samples, delivery of ivermectin to the farms, andproducers treating the animals, it is likely that the actualFEC on the day of treatment by the producers was higher.Therefore, approximately four weeks passed between thepre- and post-treatment FECs, which might have led toan under-estimation of the ivermectin efficacy and, con-sequently, an over-estimation of the frequency of drenchfailure.
4.2. Fecal Egg Count Reduction Test
Using the FECRT, ivermectin susceptibility was assessedon 29 farms, fenbendazole susceptibility on 20 farms, andlevamisole susceptibility on 17 farms. Most of the farmsthat participated in the study were classified as havingparasites resistant to ivermectin (97%) and fenbendazole(95%), the two anthelmintic drugs that are most frequentlyused by Canadian producers, while only 6% of the farmstested had parasites resistant to levamisole (Table 1). Iver-mectin is the only anthelmintic licensed for use in sheepin Canada (Compendium of Veterinary Products, Canada,2012), and many sheep producers have relied exclusivelyon this drug for the past two decades. This might partiallyexplain the widespread resistance to ivermectin observedin this study. Similarly, while fenbendazole and albenda-zole are not licensed for use in sheep in Canada, manysheep producers have used products formulated for usein cattle in an extra-label manner for many decades. Side-resistance between drugs within the same drug class hasbeen described (Martin et al., 1989; Sangster and Gill,1999). Furthermore, it has been hypothesized that cross-resistance could also occur between different drug classes,whereby one genetic mutation might facilitate furthermutations, or enhance the activity of particular enzymes,allowing the parasite to develop multiple-drug resistance(Sargison et al., 2010).
Most of the farms in our study had parasites that weresusceptible to levamisole. Since levamisole has not beencommercially available in Canada for the last 10 years(Health Canada – Drug Product Database Online Query,2012), very few producers in our study had routine accessto the drug, reducing the selective pressure for resis-tance. Levamisole resistance has been reported in other
countries where the drug is readily available (Waghornet al., 2006; Cezar et al., 2010; Sargison et al., 2010). Onthe few farms where resistance, or suspected resistance,to levamisole was shown, the mean reduction percentageology 193 (2013) 150– 162 159
was likely affected by a few outlier sheep; the reducedefficacy was due to a few sheep having low, as opposedto zero, post-treatment FECs (farm 10) or one sheep witha high post-treatment FEC out of a group with negativepost-treatment FECs (farms 27 and 28). Cabaret and Berrag(2004) have suggested that, in situations like these, whenthe overall efficacy is high, low efficacies in one or a fewof the individuals are often not indicators of resistance inthose animals, but rather may be due to other factors suchas poor metabolism or poor bioavailability of the drug inthose animals.
Coles et al. (2006) suggest that when assessing the effi-cacy of levamisole, post-treatment fecal samples shouldbe collected 7–10 days after treatment. However, due tologistic constraints, fecal samples were collected from allanimals in this study on day 14 following treatment for theFECRT. The aforementioned recommendations are basedon studies by Grimshaw et al. (1994, 1996), where a num-ber of larvae were found at necropsy, despite treatment ofanimals with levamisole 11 days earlier. The authors sug-gested that levamisole was ineffective against immaturestages, which could lead to misinterpretation of positiveFECs 14 days after treating animals with levamisole, sincethis could be a result of the immature larvae developinginto adult worms, rather than the presence of resistantparasites. However, our study did not support these find-ings, since the majority of the farms had 0 post-treatmentFECs 14 days after treatment with levamisole, and the LDAresults confirmed these findings. While one may arguethat the FECRT results could be due to the higher dosage(10.5 mg/kg) used in this study (Pugh, 2001), other studies(McKenna, 1974; Andrews, 2000) have shown that lev-amisole was effective against arrested larvae in sheep; bothstudies treated sheep at a dosage of 8.0 mg/kg. It is also pos-sible that during the summer months when this study wasconducted, there were few arrested larvae.
4.3. Larval cultures of post-treatment fecal samples
Larval cultures provide insight into the parasite generapresent in animals, and therefore allow for the determi-nation of the efficacy at the genus level (McKenna, 1990).In the work described here, the fecal samples for larvalculture were obtained from animals that had previouslybeen treated with ivermectin (i.e. drench check prior tothe FECRT). However, a minimum of five weeks elapsedbetween the ivermectin drench check and the secondFECRT visit, when larval cultures were conducted, provid-ing sufficient time for the animals to become re-infectedwith GIN. As such, the results from the larval cultures fromthe control group samples are likely true representationsof the unselected parasite genera present on that farm, andthe post-treatment results represent the resistant genera.
Results from the larval cultures showed that the mostpredominant parasite genera in both untreated and treatedanimals was Haemonchus sp., followed by Teladorsagia spp.,and Trichostrongylus spp. (Fig. 1). Table 2 indicates that
most of the resistance to ivermectin and fenbendazoleobserved in this study was associated with Haemonchussp. This is of concern since Haemonchus sp. is the mostpathogenic GIN and has high biotic potential (Sutherland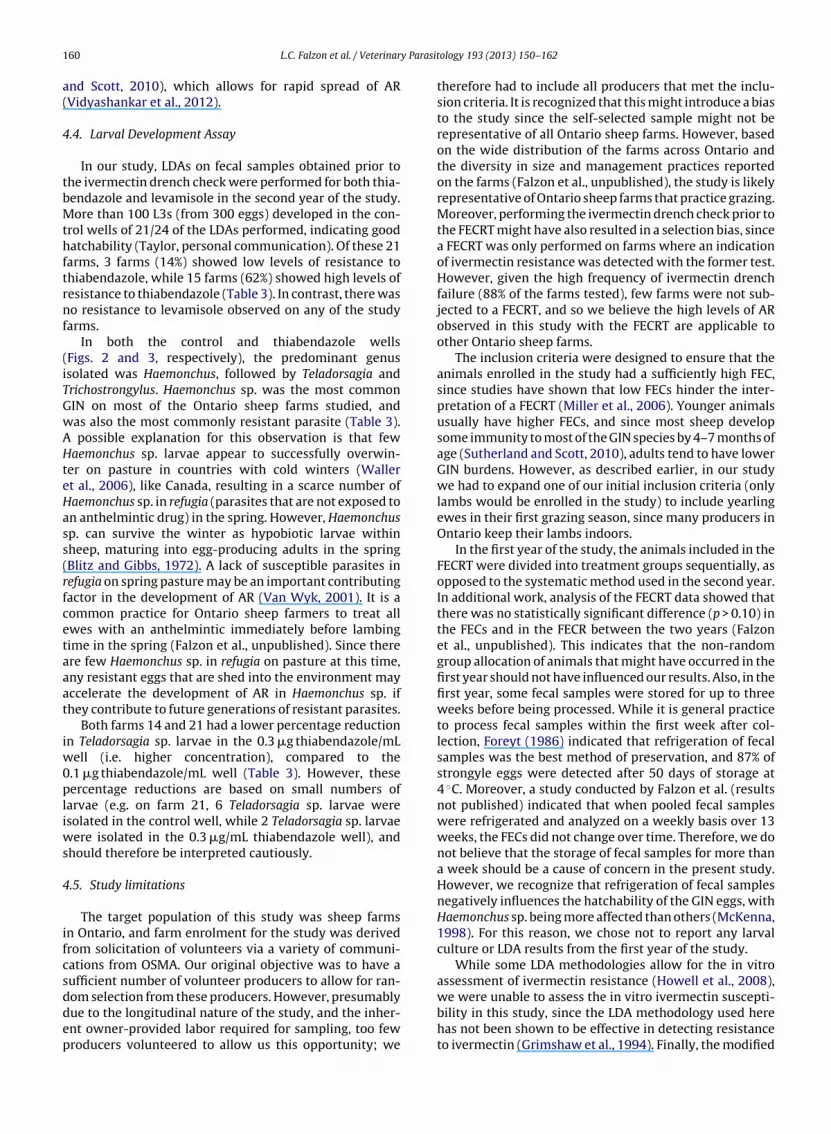
1 y Parasit
a(
4
tbMthftrnf
(iTGwAHteHass(rfcetaaat
iw0pliws
4
ifcsddep
60 L.C. Falzon et al. / Veterinar
nd Scott, 2010), which allows for rapid spread of ARVidyashankar et al., 2012).
.4. Larval Development Assay
In our study, LDAs on fecal samples obtained prior tohe ivermectin drench check were performed for both thia-endazole and levamisole in the second year of the study.ore than 100 L3s (from 300 eggs) developed in the con-
rol wells of 21/24 of the LDAs performed, indicating goodatchability (Taylor, personal communication). Of these 21
arms, 3 farms (14%) showed low levels of resistance tohiabendazole, while 15 farms (62%) showed high levels ofesistance to thiabendazole (Table 3). In contrast, there waso resistance to levamisole observed on any of the study
arms.In both the control and thiabendazole wells
Figs. 2 and 3, respectively), the predominant genussolated was Haemonchus, followed by Teladorsagia andrichostrongylus. Haemonchus sp. was the most commonIN on most of the Ontario sheep farms studied, andas also the most commonly resistant parasite (Table 3).
possible explanation for this observation is that fewaemonchus sp. larvae appear to successfully overwin-
er on pasture in countries with cold winters (Wallert al., 2006), like Canada, resulting in a scarce number ofaemonchus sp. in refugia (parasites that are not exposed ton anthelmintic drug) in the spring. However, Haemonchusp. can survive the winter as hypobiotic larvae withinheep, maturing into egg-producing adults in the springBlitz and Gibbs, 1972). A lack of susceptible parasites inefugia on spring pasture may be an important contributingactor in the development of AR (Van Wyk, 2001). It is aommon practice for Ontario sheep farmers to treat allwes with an anthelmintic immediately before lambingime in the spring (Falzon et al., unpublished). Since therere few Haemonchus sp. in refugia on pasture at this time,ny resistant eggs that are shed into the environment mayccelerate the development of AR in Haemonchus sp. ifhey contribute to future generations of resistant parasites.
Both farms 14 and 21 had a lower percentage reductionn Teladorsagia sp. larvae in the 0.3 �g thiabendazole/mL
ell (i.e. higher concentration), compared to the.1 �g thiabendazole/mL well (Table 3). However, theseercentage reductions are based on small numbers of
arvae (e.g. on farm 21, 6 Teladorsagia sp. larvae weresolated in the control well, while 2 Teladorsagia sp. larvae
ere isolated in the 0.3 �g/mL thiabendazole well), andhould therefore be interpreted cautiously.
.5. Study limitations
The target population of this study was sheep farmsn Ontario, and farm enrolment for the study was derivedrom solicitation of volunteers via a variety of communi-ations from OSMA. Our original objective was to have aufficient number of volunteer producers to allow for ran-
om selection from these producers. However, presumablyue to the longitudinal nature of the study, and the inher-nt owner-provided labor required for sampling, too fewroducers volunteered to allow us this opportunity; weology 193 (2013) 150– 162
therefore had to include all producers that met the inclu-sion criteria. It is recognized that this might introduce a biasto the study since the self-selected sample might not berepresentative of all Ontario sheep farms. However, basedon the wide distribution of the farms across Ontario andthe diversity in size and management practices reportedon the farms (Falzon et al., unpublished), the study is likelyrepresentative of Ontario sheep farms that practice grazing.Moreover, performing the ivermectin drench check prior tothe FECRT might have also resulted in a selection bias, sincea FECRT was only performed on farms where an indicationof ivermectin resistance was detected with the former test.However, given the high frequency of ivermectin drenchfailure (88% of the farms tested), few farms were not sub-jected to a FECRT, and so we believe the high levels of ARobserved in this study with the FECRT are applicable toother Ontario sheep farms.
The inclusion criteria were designed to ensure that theanimals enrolled in the study had a sufficiently high FEC,since studies have shown that low FECs hinder the inter-pretation of a FECRT (Miller et al., 2006). Younger animalsusually have higher FECs, and since most sheep developsome immunity to most of the GIN species by 4–7 months ofage (Sutherland and Scott, 2010), adults tend to have lowerGIN burdens. However, as described earlier, in our studywe had to expand one of our initial inclusion criteria (onlylambs would be enrolled in the study) to include yearlingewes in their first grazing season, since many producers inOntario keep their lambs indoors.
In the first year of the study, the animals included in theFECRT were divided into treatment groups sequentially, asopposed to the systematic method used in the second year.In additional work, analysis of the FECRT data showed thatthere was no statistically significant difference (p > 0.10) inthe FECs and in the FECR between the two years (Falzonet al., unpublished). This indicates that the non-randomgroup allocation of animals that might have occurred in thefirst year should not have influenced our results. Also, in thefirst year, some fecal samples were stored for up to threeweeks before being processed. While it is general practiceto process fecal samples within the first week after col-lection, Foreyt (1986) indicated that refrigeration of fecalsamples was the best method of preservation, and 87% ofstrongyle eggs were detected after 50 days of storage at4 ◦C. Moreover, a study conducted by Falzon et al. (resultsnot published) indicated that when pooled fecal sampleswere refrigerated and analyzed on a weekly basis over 13weeks, the FECs did not change over time. Therefore, we donot believe that the storage of fecal samples for more thana week should be a cause of concern in the present study.However, we recognize that refrigeration of fecal samplesnegatively influences the hatchability of the GIN eggs, withHaemonchus sp. being more affected than others (McKenna,1998). For this reason, we chose not to report any larvalculture or LDA results from the first year of the study.
While some LDA methodologies allow for the in vitroassessment of ivermectin resistance (Howell et al., 2008),
we were unable to assess the in vitro ivermectin suscepti-bility in this study, since the LDA methodology used herehas not been shown to be effective in detecting resistanceto ivermectin (Grimshaw et al., 1994). Finally, the modified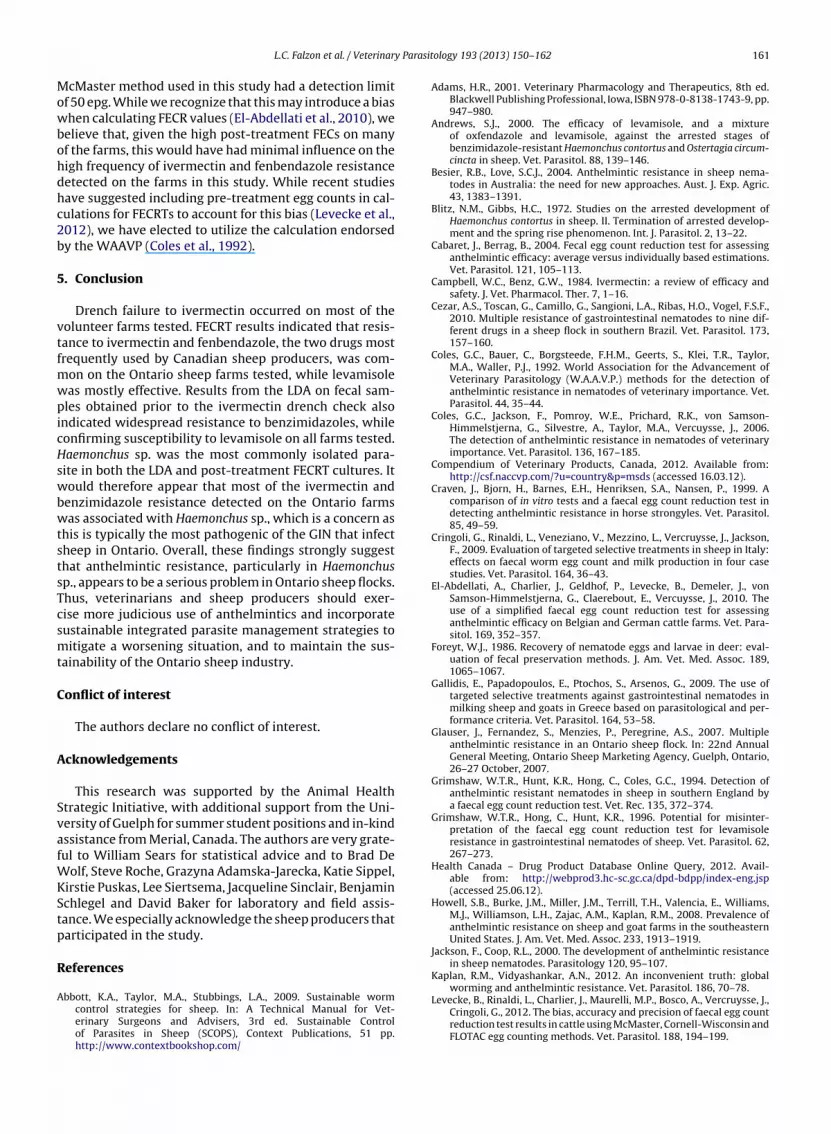
y Parasit
L.C. Falzon et al. / VeterinarMcMaster method used in this study had a detection limitof 50 epg. While we recognize that this may introduce a biaswhen calculating FECR values (El-Abdellati et al., 2010), webelieve that, given the high post-treatment FECs on manyof the farms, this would have had minimal influence on thehigh frequency of ivermectin and fenbendazole resistancedetected on the farms in this study. While recent studieshave suggested including pre-treatment egg counts in cal-culations for FECRTs to account for this bias (Levecke et al.,2012), we have elected to utilize the calculation endorsedby the WAAVP (Coles et al., 1992).
5. Conclusion
Drench failure to ivermectin occurred on most of thevolunteer farms tested. FECRT results indicated that resis-tance to ivermectin and fenbendazole, the two drugs mostfrequently used by Canadian sheep producers, was com-mon on the Ontario sheep farms tested, while levamisolewas mostly effective. Results from the LDA on fecal sam-ples obtained prior to the ivermectin drench check alsoindicated widespread resistance to benzimidazoles, whileconfirming susceptibility to levamisole on all farms tested.Haemonchus sp. was the most commonly isolated para-site in both the LDA and post-treatment FECRT cultures. Itwould therefore appear that most of the ivermectin andbenzimidazole resistance detected on the Ontario farmswas associated with Haemonchus sp., which is a concern asthis is typically the most pathogenic of the GIN that infectsheep in Ontario. Overall, these findings strongly suggestthat anthelmintic resistance, particularly in Haemonchussp., appears to be a serious problem in Ontario sheep flocks.Thus, veterinarians and sheep producers should exer-cise more judicious use of anthelmintics and incorporatesustainable integrated parasite management strategies tomitigate a worsening situation, and to maintain the sus-tainability of the Ontario sheep industry.
Conflict of interest
The authors declare no conflict of interest.
Acknowledgements
This research was supported by the Animal HealthStrategic Initiative, with additional support from the Uni-versity of Guelph for summer student positions and in-kindassistance from Merial, Canada. The authors are very grate-ful to William Sears for statistical advice and to Brad DeWolf, Steve Roche, Grazyna Adamska-Jarecka, Katie Sippel,Kirstie Puskas, Lee Siertsema, Jacqueline Sinclair, BenjaminSchlegel and David Baker for laboratory and field assis-tance. We especially acknowledge the sheep producers thatparticipated in the study.
References
Abbott, K.A., Taylor, M.A., Stubbings, L.A., 2009. Sustainable wormcontrol strategies for sheep. In: A Technical Manual for Vet-erinary Surgeons and Advisers, 3rd ed. Sustainable Controlof Parasites in Sheep (SCOPS), Context Publications, 51 pp.http://www.contextbookshop.com/
ology 193 (2013) 150– 162 161
Adams, H.R., 2001. Veterinary Pharmacology and Therapeutics, 8th ed.Blackwell Publishing Professional, Iowa, ISBN 978-0-8138-1743-9, pp.947–980.
Andrews, S.J., 2000. The efficacy of levamisole, and a mixtureof oxfendazole and levamisole, against the arrested stages ofbenzimidazole-resistant Haemonchus contortus and Ostertagia circum-cincta in sheep. Vet. Parasitol. 88, 139–146.
Besier, R.B., Love, S.C.J., 2004. Anthelmintic resistance in sheep nema-todes in Australia: the need for new approaches. Aust. J. Exp. Agric.43, 1383–1391.
Blitz, N.M., Gibbs, H.C., 1972. Studies on the arrested development ofHaemonchus contortus in sheep. II. Termination of arrested develop-ment and the spring rise phenomenon. Int. J. Parasitol. 2, 13–22.
Cabaret, J., Berrag, B., 2004. Fecal egg count reduction test for assessinganthelmintic efficacy: average versus individually based estimations.Vet. Parasitol. 121, 105–113.
Campbell, W.C., Benz, G.W., 1984. Ivermectin: a review of efficacy andsafety. J. Vet. Pharmacol. Ther. 7, 1–16.
Cezar, A.S., Toscan, G., Camillo, G., Sangioni, L.A., Ribas, H.O., Vogel, F.S.F.,2010. Multiple resistance of gastrointestinal nematodes to nine dif-ferent drugs in a sheep flock in southern Brazil. Vet. Parasitol. 173,157–160.
Coles, G.C., Bauer, C., Borgsteede, F.H.M., Geerts, S., Klei, T.R., Taylor,M.A., Waller, P.J., 1992. World Association for the Advancement ofVeterinary Parasitology (W.A.A.V.P.) methods for the detection ofanthelmintic resistance in nematodes of veterinary importance. Vet.Parasitol. 44, 35–44.
Coles, G.C., Jackson, F., Pomroy, W.E., Prichard, R.K., von Samson-Himmelstjerna, G., Silvestre, A., Taylor, M.A., Vercuysse, J., 2006.The detection of anthelmintic resistance in nematodes of veterinaryimportance. Vet. Parasitol. 136, 167–185.
Compendium of Veterinary Products, Canada, 2012. Available from:http://csf.naccvp.com/?u=country&p=msds (accessed 16.03.12).
Craven, J., Bjorn, H., Barnes, E.H., Henriksen, S.A., Nansen, P., 1999. Acomparison of in vitro tests and a faecal egg count reduction test indetecting anthelmintic resistance in horse strongyles. Vet. Parasitol.85, 49–59.
Cringoli, G., Rinaldi, L., Veneziano, V., Mezzino, L., Vercruysse, J., Jackson,F., 2009. Evaluation of targeted selective treatments in sheep in Italy:effects on faecal worm egg count and milk production in four casestudies. Vet. Parasitol. 164, 36–43.
El-Abdellati, A., Charlier, J., Geldhof, P., Levecke, B., Demeler, J., vonSamson-Himmelstjerna, G., Claerebout, E., Vercuysse, J., 2010. Theuse of a simplified faecal egg count reduction test for assessinganthelmintic efficacy on Belgian and German cattle farms. Vet. Para-sitol. 169, 352–357.
Foreyt, W.J., 1986. Recovery of nematode eggs and larvae in deer: eval-uation of fecal preservation methods. J. Am. Vet. Med. Assoc. 189,1065–1067.
Gallidis, E., Papadopoulos, E., Ptochos, S., Arsenos, G., 2009. The use oftargeted selective treatments against gastrointestinal nematodes inmilking sheep and goats in Greece based on parasitological and per-formance criteria. Vet. Parasitol. 164, 53–58.
Glauser, J., Fernandez, S., Menzies, P., Peregrine, A.S., 2007. Multipleanthelmintic resistance in an Ontario sheep flock. In: 22nd AnnualGeneral Meeting, Ontario Sheep Marketing Agency, Guelph, Ontario,26–27 October, 2007.
Grimshaw, W.T.R., Hunt, K.R., Hong, C., Coles, G.C., 1994. Detection ofanthelmintic resistant nematodes in sheep in southern England bya faecal egg count reduction test. Vet. Rec. 135, 372–374.
Grimshaw, W.T.R., Hong, C., Hunt, K.R., 1996. Potential for misinter-pretation of the faecal egg count reduction test for levamisoleresistance in gastrointestinal nematodes of sheep. Vet. Parasitol. 62,267–273.
Health Canada – Drug Product Database Online Query, 2012. Avail-able from: http://webprod3.hc-sc.gc.ca/dpd-bdpp/index-eng.jsp(accessed 25.06.12).
Howell, S.B., Burke, J.M., Miller, J.M., Terrill, T.H., Valencia, E., Williams,M.J., Williamson, L.H., Zajac, A.M., Kaplan, R.M., 2008. Prevalence ofanthelmintic resistance on sheep and goat farms in the southeasternUnited States. J. Am. Vet. Med. Assoc. 233, 1913–1919.
Jackson, F., Coop, R.L., 2000. The development of anthelmintic resistancein sheep nematodes. Parasitology 120, 95–107.
Kaplan, R.M., Vidyashankar, A.N., 2012. An inconvenient truth: global
worming and anthelmintic resistance. Vet. Parasitol. 186, 70–78.Levecke, B., Rinaldi, L., Charlier, J., Maurelli, M.P., Bosco, A., Vercruysse, J.,Cringoli, G., 2012. The bias, accuracy and precision of faecal egg countreduction test results in cattle using McMaster, Cornell-Wisconsin andFLOTAC egg counting methods. Vet. Parasitol. 188, 194–199.

1 y Parasit
L
M
M
M
M
M
M
M
M
M
P
P
S
S
S
efficacy of anthelmintic in ruminants (bovine, ovine, caprine). Vet.
62 L.C. Falzon et al. / Veterinar
ove, S.C., Johns, W.J., Coverdale, O.R., 1992. Anthelmintic resistance insheep nematodes in New England region of New South Wales. Aust.Vet. J. 69, 196–197.
artin, P.J., Anderson, N., Jarrett, R.G., 1989. Detecting benzimidazoleresistance with faecal egg count reduction test and in vitro assays.Aust. Vet. J. 66, 236–240.
cKenna, P.B., 1974. The anthelmintic efficacy of thiabendazole and lev-amisole against inhibited Haemonchus contortus larvae in sheep. N. Z.Vet. J. 22, 163–166.
cKenna, P.B., 1990. The detection of anthelmintic resistance by the fae-cal egg count reduction test: an examination of some of the factorsaffecting performance and interpretation. N. Z. Vet. J. 38, 142–147.
cKenna, P.B., 1998. The effect of previous cold storage on the subsequentrecovery of infective third stage nematode larvae from sheep faeces.Vet. Parasitol. 80, 167–172.
cKenna, P.B., 2006. A comparison of faecal egg count reduction testprocedures. N. Z. Vet. J. 54, 202–203.
ederos, A., Fernandes, S., VanLeeuwen, J., Peregrine, A.S., Kelton, D., Men-zies, P., LeBoeuf, A., Martin, R., 2010. Prevalence and distribution ofgastrointestinal nematodes on 32 organic and conventional commer-cial sheep farms in Ontario and Quebec Canada (2006–2008). Vet.Parasitol. 170, 244–252.
iller, C.M., Waghorn, T.S., Leathwick, D.M., Gilmour, M.L., 2006. Howrepeatable is a faecal egg count reduction test? N. Z. Vet. J. 54, 323–328.
inistry of Agriculture Fisheries Food, 1986. Manual of Veterinary Para-sitological Laboratory Techniques. Technical Bulletin No. 18. HMSO,London, 124 pp.
itchell, E.S.E., Hunt, K.R., Wood, R., McLean, B., 2010. Anthelmintic resis-tance on sheep farms in Wales. Vet. Rec. 166, 650–652.
apadopoulos, E., 2008. Anthelmintic resistance in sheep nematodes.Small Rumin. Res. 76, 99–103.
ugh, D.G., 2001. Sheep and Goat Medicine. W.B. Saunders Company,Philadelphia, PA, 439 pp.
angster, N.C., Gill, J., 1999. Pharmacology of anthelmintic resistance. Para-sitol. Today 15, 141–146.
argison, N.D., 2008. Sheep Flock Health: A Planned Approach. Black-well Publishing Ltd, United Kingdom, ISBN 978-1-4051-6044-5, pp.
149–191.argison, N.D., Jackson, R., Wilson, D.J., Bartley, D.J., Penny, C.D., Gil-leard, J.S., 2010. Characterisation of milbemycin-, avermectin-,imidazothiazole- and benzimidazole-resistant Teladorsagia circum-cincta from a sheep flock. Vet. Rec. 166, 681–686.
ology 193 (2013) 150– 162
Smart, J.A., 2009. Faecal egg count reduction test follies. In: The Soci-ety of Sheep and Beef Cattle Veterinarians – New Zealand VeterinaryAssociation Newsletter, vol. 35, pp. 21–25.
Sutherland, I., Scott, I., 2010. Gastrointestinal Nematodes of Sheep and Cat-tle. Blackwell Publishing/John Wiley & Sons Ltd, West Sussex, UnitedKingdom, ISBN 978-1-4051-8582-0, pp. 61–75.
Taylor, M.A., 1990. A larval development test for the detection ofanthelmintic resistance in nematodes of sheep. Res. Vet. Sci. 49,198–202.
Taylor, M.A., Hunt, K.R., Goodyear, K.L., 2002. Anthelmintic resistancedetection methods. Vet. Parasitol. 103, 183–194.
Van Wyk, J.A., 2001. Refugia – overlooked as perhaps the most potentfactor concerning the development of anthelmintic resistance. Onder-stepoort J. Vet. 68, 55–67.
Vidyashankar, A.N., Handlon, B.M., Kaplan, R.M., 2012. Statistical andbiological considerations in evaluating drug efficacy in equinestrongyle parasites using fecal egg count data. Vet. Parasitol. 185,45–56.
Waghorn, T.S., Leathwick, D.M., Rhodes, A.P., Lawrence, K.E., Jackson,R., Pomroy, W.E., West, D.M., Moffat, J.R., 2006. Prevalence ofanthelmintic resistance on sheep farms in New Zealand. N. Z. Vet. J.54, 271–277.
Waller, P.J., Echevarria, F., Eddi, C., Maciel, S., Nari, A., Hansen, J.W., 1996.The prevalence of anthelmintic resistance in nematode parasites ofsheep in Southern Latin America: general overview. Vet. Parasitol. 62,181–187.
Waller, P.J., Rydzik, A., Ljungström, B.L., Törnquist, M., 2006. Towards theeradication of Haemonchus contortus from sheep flocks in Sweden. Vet.Parasitol. 136, 367–372.
Wolstenholme, A.J., Fairweather, I., Prichard, R., von Samson-Himmelstjerna, G., Sangster, N.C., 2004. Drug resistance in veterinaryhelminths. Trends Parasitol. 20, 469–476.
Wood, I.B., Amaral, N.K., Bairden, K., Duncan, J.L., Kassai, T., Malone Jr., J.B.,Pankavich, J.A., Reinecke, R.K., Slocombe, O., Taylor, S.M., Vercuysse,J., 1995. World Association for the Advancement of Veterinary Para-sitology (W.A.A.V.P.) second edition of guidelines for evaluating the
Parasitol. 58, 181–213.World Maps of Köppen-Geiger Climate Classification, 2012. Avail-
able from: http://koeppen-geiger.vu-wien.ac.at/usa.htm (accessed05.07.12).