Embed Size (px)
Citation preview
© The Author(s) 2020. Published by Oxford University Press on behalf of the Annals of Botany Company.
• 1
This is an Open Access article distributed under the terms of the Creative Commons Attribution License (http://creativecommons.org/licenses/by/4.0/), which permits unrestricted reuse, distribution, and reproduction in any medium, provided the original work is properly cited.
in silico Plants Vol. 2, No. 1, pp. 1–17doi:10.1093/insilicoplants/diaa006Advance Access publication 8 August 2020Original Research
A new tool for discovering transcriptional regulators of co-expressed genes predicts gene regulatory
networks that mediate ethylene-controlled root development
Alexandria F. Harkey1, , Kira N. Sims1,2, and Gloria K. Muday1,* ,
1Department of Biology and Center for Molecular Signaling, Wake Forest University, 455 Vine Street, Winston-Salem, NC 27101, USA2Present address: Department of Biology, Indiana University, Bloomington, IN, USA
*Corresponding author’s e-mail address: [email protected]
Handling Editor: Amy Marshall-Colon
Citation: Harkey AF, Sims KN, Muday GK. 2020. A new tool for discovering transcriptional regulators of co-expressed genes predicts gene regulatory networks that mediate ethylene-controlled root development. In Silico Plants 2020: diaa006; doi: 10.1093/insilicoplants/diaa006
A B S T R A C TGene regulatory networks (GRNs) are defined by a cascade of transcriptional events by which signals, such as
hormones or environmental cues, change development. To understand these networks, it is necessary to link spe-cific transcription factors (TFs) to the downstream gene targets whose expression they regulate. Although multiple methods provide information on the targets of a single TF, moving from groups of co-expressed genes to the TF that controls them is more difficult. To facilitate this bottom-up approach, we have developed a web application named TF DEACoN. This application uses a publicly available Arabidopsis thaliana DNA Affinity Purification (DAP-Seq) data set to search for TFs that show enriched binding to groups of co-regulated genes. We used TF DEACoN to exam-ine groups of transcripts regulated by treatment with the ethylene precursor 1-aminocyclopropane-1-carboxylic acid (ACC), using a transcriptional data set performed with high temporal resolution. We demonstrate the utility of this application when co-regulated genes are divided by timing of response or cell-type-specific information, which pro-vides more information on TF/target relationships than when less defined and larger groups of co-regulated genes are used. This approach predicted TFs that may participate in ethylene-modulated root development including the TF NAM (NO APICAL MERISTEM). We used a genetic approach to show that a mutation in NAM reduces the nega-tive regulation of lateral root development by ACC. The combination of filtering and TF DEACoN used here can be applied to any group of co-regulated genes to predict GRNs that control coordinated transcriptional responses.
K E Y W O R D S : DAP-seq; ethylene; gene regulatory networks; lateral roots; transcription factors; transcriptomics.
1 . I N T R O D U C T I O NTranscription factors (TFs) are important regulators of gene expression across all kingdoms of life. In Arabidopsis thaliana, nearly 7 % of all protein-coding genes are predicted to encode TFs (1851 out of 27 655; Yilmaz et al. 2011; Cheng et al. 2017). In plants, the best-studied TFs include those that control developmental patterning and responses to hormones and environmental cues. Yet only a small fraction of all TFs have been well-characterized; 1152 out of 1851 predicted TFs in AGRIS have no
gene name and/or no description, and another 375 gene descriptions contain the word ‘putative’ (Yilmaz et al. 2011). The TFs whose functions are known are neither sufficient to control the diversity of responses that are seen in the transcriptome across different developmental stages and experimental conditions, nor the myriad of growth and developmental responses achieved under these conditions. Given the number of unchar-acterized TFs and the variety of plant signals and responses, matching TFs with biological function remains a considerable task.
Dow
nloaded from https://academ
ic.oup.com/insilicoplants/article/2/1/diaa006/5885168 by guest on 08 January 2022
2 • Harkey et al.
In Arabidopsis, traditional mutant screening has been a powerful tool in the discovery of key gene products that control hormone and stress response pathways, including important TFs (Page and Grossniklaus 2002). Yet, because this technique relies on striking phenotypes that result from mutations in individual genes, there is a point at which a particular pathway becomes saturated; that is, all genes that can be dis-covered by a particular screen have already been identified (Pollock and Larkin 2004; Tokunaga et al. 2014). Additionally, TFs often form com-plexes with other TFs, show redundancy across TF families or are part of larger signalling networks, all of which may result in subtle or absent phenotypes when single TF genes are mutated (e.g. Xu et al. 2020). Although creating double, triple and higher-order mutants can reveal roles for TF families, it is often a long process without guaranteed results. New tools are needed for identifying TFs linked to particular responses.
The rise of affordable technologies to monitor genome-wide changes in transcript abundance has given researchers a new suite of tools for understanding TF function. Microarray and RNA-Seq can reveal transcriptional responses with high spatial (Brady et al. 2007; Tang et al. 2009; Bargmann et al. 2013) and temporal resolution (Lewis et al. 2013; Harkey et al. 2018). Transcription factors of interest can be further characterized by performing transcriptomics with TF mutants or overexpression lines. However, these techniques will not find all TFs involved in a process because these TFs are not necessarily transcrip-tionally responsive themselves, and so will not always be identified in a transcriptomic data set; for example, the abundance of transcripts encoding the TF EIN3 (ETHYLENE-INSENSITIVE3), which plays a central role in many ethylene responses, does not change in abundance in response to ethylene (Chao et al. 1997). Co-regulated genes can also be analysed for common promoter elements to suggest candidate TFs. However, untargeted motif-searching methods are limited by the back-ground noise inherent in looking for a short motif (typically around 10 base pairs) among promoter sequences that are 1000 or more base pairs long (Bailey and Elkan 1994; Bailey et al. 2009). If a particular TF’s motif is found, its presence in a promoter region does not guaran-tee regulation of that gene by that TF. For example, one recent paper found that 91 % of all genes across 45 different species contained an auxin response element (AuxRE) (Lieberman-Lazarovich et al. 2019), but it is unlikely that all of these genes are auxin-responsive based on the numbers of auxin-responsive transcripts (Vanneste et al. 2005; Stepanova et al. 2007; Lewis et al. 2013), and it is not possible to pre-dict which auxin response factors (ARFs) might bind to a given pro-moter based on these data alone.
Perhaps the best method for identification of a TF’s downstream targets is examination of direct TF–target interactions through tech-niques such as yeast one-hybrid assays (Ouwerkerk and Meijer 2001) or ChIP-Seq (Robertson et al. 2007), the latter of which can identify the binding motif of a particular TF. Typically, ChIP-Seq is used after a TF has already been identified as important and is performed using chromatin samples isolated under specific growth and developmental conditions, leading to identification of only a subset of binding sites for a given TF (Bartlett et al. 2017). Although it is possible to perform ChIP-Seq across many TFs to create a new type of screen for tran-scriptional regulators, this approach would be both costly and time-consuming to repeat for multiple signalling pathways, responses and tissue types.
Another new method has been developed called DNA Affinity Purification (DAP)-Seq, which can be performed in vitro, allowing binding sites for a large number of TFs to be identified (Bartlett et al. 2017). The advantage of this method is that DNA binding is less biased by experimental conditions, although it may miss binding events that require TF protein complexes (O’Malley et al. 2016). The Arabidopsis DAP-Seq data set produced by O’Malley et al. contains data for 349 different TFs (which is ~20 % of the TFs in the Arabidopsis genome), providing a wealth of new information on targets of TFs (O’Malley et al. 2016). These DAP-Seq data create an opportunity to narrow down the list of potential regulators in an unbiased way.
We have used the ethylene response in roots to demonstrate the utility of combining DAP-Seq data with co-expression data to provide new insights into transcriptional regulators that control plant response to the hormone ethylene (Harkey et al. 2018, 2019). Ethylene regu-lates many aspects of plant development, including hypocotyl elonga-tion (Bleecker et al. 1988; Guzman and Ecker 1990; Chang et al. 1993), responses to stress (Wang et al. 2013; Dey and Vlot 2015), fruit ripen-ing (Cara and Giovannoni 2008; Chen et al. 2018; Fabi and Ramos do Prado 2019) and formation of lateral roots (Ivanchenko et al. 2008; Negi et al. 2008) and root hairs (Tanimoto et al. 1995).
One of the first Arabidopsis signalling pathways identified by mutant screens was the ethylene-signalling pathway (Merchante et al. 2013). Researchers used the ethylene ‘triple response’ during which dark-grown seedlings treated with ethylene, or its biosynthetic pre-cursor 1-aminocyclopropane-1-carboxylic acid (ACC), have shorter, thicker hypocotyls and roots, and an exaggerated apical hook, com-pared to their air-grown counterparts (Bleecker et al. 1988; Guzman and Ecker 1990; Chang et al. 1993). These screens identified ethylene-insensitive (EIN) or Ethylene Response (ETR) mutants as tall seed-lings among a lawn of short ethylene responders. Ethylene response genes identified include receptors such as ETR1 (Chang et al. 1993) and essential signalling proteins such as Ethylene-Insensitive2 (EIN2) (Alonso et al. 1999) and Constitutive Triple Response 1 (CTR1), a kinase that in the mutant has constitutive ethylene response (Kieber et al. 1993). These studies also revealed the basics of an ethylene-regu-lated transcriptional network. The EIN3 TF is necessary for most eth-ylene responses in dark-grown seedlings, and EIN3-LIKE (EIL) family members play a smaller role (Chao et al. 1997; Solano et al. 1998). Another group of TFs, Ethylene Response Factors (ERFs), function downstream of EIN3 (Solano et al. 1998).
However, several lines of evidence suggest that EIN3 and down-stream ERFs do not control all ethylene response in all tissues or under all growth conditions. A comparison of root ethylene response in seedlings grown under multiple light conditions suggested that EIN3 targets (as determined by DAP-Seq and ChIP-Seq) are mainly genes which respond to ethylene in all light conditions (Harkey et al. 2019). In contrast, few ethylene-responsive transcripts from light-grown seedlings were EIN3 targets, suggesting that other TFs regulate these conditional responses (Harkey et al. 2019). Similarly, when a group of ACC-responsive genes were sorted by expression changes over time in response to ACC treatment, EIN3 targets were limited primarily to a subset of transcripts which responded quickly and positively to ACC treatment (Harkey et al. 2018). Meanwhile, the majority of ACC-responsive transcripts were downregulated. Likewise, ERF targets
Dow
nloaded from https://academ
ic.oup.com/insilicoplants/article/2/1/diaa006/5885168 by guest on 08 January 2022
GRNs mediate ethylene-controlled root development • 3
made up only a small subset of the ethylene-responsive transcripts (Harkey et al. 2018).
In further support of EIN3-independent transcriptional responses in roots of light-grown seedlings, ein3 and ein3/eil1 mutants still exhibited root developmental changes in light-grown seedlings in response to ACC (Harkey et al. 2018). Yet, there is little information on what additional TFs may be responsible for the remaining transcriptional and developmental changes in these tissue types. A search of the Gene Expression Omnibus (GEO) (Barrett et al. 2013) for ethylene-related transcriptomic studies returns those using overexpression lines or mutants with defects in genes encoding ethylene-signalling proteins, EIN3, and a few ERFs (Harkey et al. 2019); the transcriptional profiles of other ethylene-responsive TFs has not been reported. However, DAP-Seq data may be able to provide insight into other transcriptional mediators of ethylene response by asking if clusters of genes encoding transcripts that respond to ethylene or ACC are enriched in genes targeted by specific TFs.
We have developed a tool for analysing all DAP-Seq data across groups of co-regulated genes to ‘screen’ for TFs that may control their concurrent changes in expression and have applied this tool to ethylene-regulated gene clusters. This tool enables the user to identify TFs which may be important for the co-regulation they observe. We demonstrate the utility of clustering co-regulated genes based on the similarity of their transcript abundance across time and space to find potential regulators that are evident only when clusters of co-expressed genes are examined. We have used this tool to analyse transcriptional data from roots treated with ACC to increase ethylene levels, reveal-ing TFs that may act downstream of this hormone signalling to con-trol changes in root development. Several TFs that are tied to root development showed enrichment of their targets within this group of ACC-regulated transcripts. The NAM (No Apical Meristem) TF shows reduced transcript abundance after ACC treatment (Harkey et al. 2018) and a T-DNA insertion mutant in this TF has enhanced lateral root formation and reduced response to ACC, consistent with a role for this TF in ACC-mediated changes to lateral root development. This finding supports the feasibility of identifying important TF–tar-get interactions using this method and approach.
2 . M ET H O D S2.1 TF DEACoN development
The tool ‘TF Discovery by Enrichment Analysis of Co-expression Networks’ (TF DEACoN, a nod to the Wake Forest University mas-cot) was developed using R Shiny (Chang et al. 2020) and the shinyBS package (Bailey 2015), and is shared under an open source license at https://github.com/aharkey/TFDEACoN.
2.2 Data sets used in analysisThe list of DAP-Seq target genes for each TF (as determined by O’Malley et al. 2016) was downloaded from http://neomorph.salk.edu/dap_web/pages/browse_table_aj.php. These text files listing TF–target relationships for each TF were grouped into one master file to be used by TF DEACoN. The ACC time-course data are avail-able as a supplementary file (Harkey et al. 2018), as well as at GEO,
accession number GSE84446. The cell-type-specific data set was downloaded from http://www-plb.ucdavis.edu/labs/brady/soft-ware/BradySpatiotemporalData/, and is also available on GEO, acces-sion number GSE8934.
2.3 UpSet plotThe UpSet plot that was used to examine NAC4 relationships was cre-ated using UpSetR (Conway et al. 2017). More information on UpSet plots can be found at Lex et al. (2014).
2.4 Phenotypic analysisArabidopsis (Arabidopsis thaliana) Col-0 seeds were purchased from Lehle Seeds. The nam mutant was obtained from the Arabidopsis Biological Resource Center, stock number WiscDsLox364F11/CS852962, donated by Patrick Krysan, Michael Sussman and Rick Amasino. The mutant was genotyped using two PCR reactions, one with wild-type gene-specific primers, and another with one gene-specific primer and one T-DNA primer to detect the insertion. Only plants homozygous for the insertion in the NAM gene (AT1G52880) were used for experiments. Additionally, RNA isolated from roots of wild-type (Col-0) and nam mutant plants were used in qPCR reac-tions using primers for the NAM transcript, which showed that nam has lower NAM transcript abundance than wild-type.
Plants were grown on 1× Murashige and Skoog medium (Caisson Laboratories), pH 5.6, Murashige and Skoog vitamins, and 0.8 % agar, buffered with 0.05 % MES (Sigma) and supplemented with 1 % Suc. After stratification for 48 h at 4 °C, plants were grown under 100 µmol m−2 s−1 continuous cool-white light. Wild-type and mutant plants were grown on control medium for 5 days and then transferred to control and 1 µM ACC-containing media. Five days later, seedling images were captured with an Olympus SZ40 microscope. Primary root growth was measured using Fiji (Schindelin et al. 2012), the number of emerged lateral roots was quantified manually, and lateral root density was calculated as lateral root number divided by primary root length individually for each plant.
3 . R E S U LT S3.1 TF DEACoN: a new tool for predicting
TF regulation of co-expressed genesTo look for groups of genes that are enriched for targets of specific TFs, we developed a new tool called TF Discovery by Enrichment Analysis of Co-expression Networks (TF DEACoN). This tool can be used to generate hypotheses about transcriptional regulators of groups of co-expressed genes. This app was written in R Shiny (R Core Team 2014; Chang et al. 2020) and is available to use at aharkey.shinyapps.io/tfdeacon; the code is available under an open source GPL-3.0 license at https://github.com/aharkey/TFDEACoN.
TF DEACoN works by searching for enrichment of TF targets in groups of co-expressed genes. The input for TF DEACoN is a list of Arabidopsis locus identifiers (called the query) which the user has identified as co-expressed in a specific tissue or developmental con-text, in response to a treatment, or in a mutant. The statistical basis for the analysis is a comparison of two ratios: the ratio of TF targets in the query to the total number of genes in the query, and the ratio
Dow
nloaded from https://academ
ic.oup.com/insilicoplants/article/2/1/diaa006/5885168 by guest on 08 January 2022
4 • Harkey et al.
of all TF targets in the genome to the number of genes in the whole genome. A TF that is important for driving transcription of a cluster of co-expressed genes would be expected to have a higher ratio of targets in the query than in the entire genome. Transcription factor DEACoN compares these two ratios for each TF for which DAP-Seq data are available using Fisher’s exact test. It also calculates a log2 fold change (logFC) in which the query ratio is divided by the genome ratio, such that a positive logFC means there is a higher proportion of TF targets in the query than in the entire genome, and a negative logFC means there is a lower proportion in the query. If the logFC is positive and Fisher’s exact test gives a significant P-value, we can consider this TF to show target enrichment in the query genes. After calculating these values for every TF, TF DEACoN uses a Benjamini–Hochberg P-value correction for multiple comparisons.
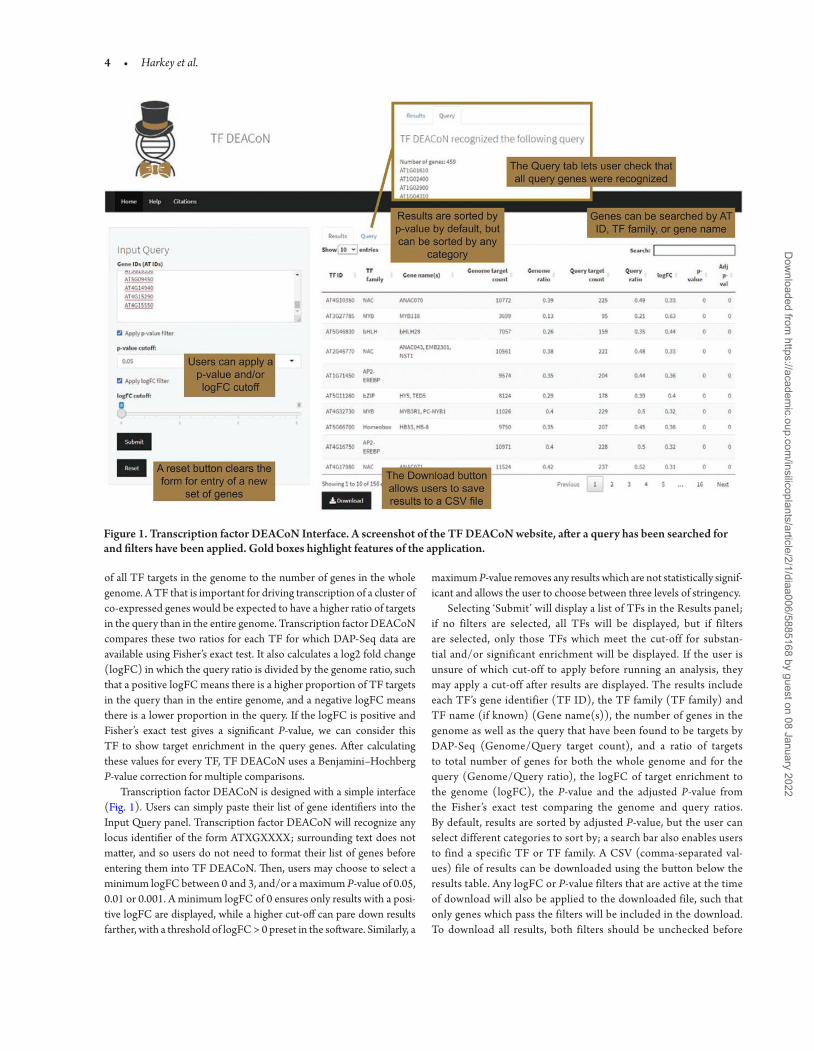
Transcription factor DEACoN is designed with a simple interface (Fig. 1). Users can simply paste their list of gene identifiers into the Input Query panel. Transcription factor DEACoN will recognize any locus identifier of the form ATXGXXXX; surrounding text does not matter, and so users do not need to format their list of genes before entering them into TF DEACoN. Then, users may choose to select a minimum logFC between 0 and 3, and/or a maximum P-value of 0.05, 0.01 or 0.001. A minimum logFC of 0 ensures only results with a posi-tive logFC are displayed, while a higher cut-off can pare down results farther, with a threshold of logFC > 0 preset in the software. Similarly, a
maximum P-value removes any results which are not statistically signif-icant and allows the user to choose between three levels of stringency.
Selecting ‘Submit’ will display a list of TFs in the Results panel; if no filters are selected, all TFs will be displayed, but if filters are selected, only those TFs which meet the cut-off for substan-tial and/or significant enrichment will be displayed. If the user is unsure of which cut-off to apply before running an analysis, they may apply a cut-off after results are displayed. The results include each TF’s gene identifier (TF ID), the TF family (TF family) and TF name (if known) (Gene name(s)), the number of genes in the genome as well as the query that have been found to be targets by DAP-Seq (Genome/Query target count), and a ratio of targets to total number of genes for both the whole genome and for the query (Genome/Query ratio), the logFC of target enrichment to the genome (logFC), the P-value and the adjusted P-value from the Fisher’s exact test comparing the genome and query ratios. By default, results are sorted by adjusted P-value, but the user can select different categories to sort by; a search bar also enables users to find a specific TF or TF family. A CSV (comma-separated val-ues) file of results can be downloaded using the button below the results table. Any logFC or P-value filters that are active at the time of download will also be applied to the downloaded file, such that only genes which pass the filters will be included in the download. To download all results, both filters should be unchecked before
Figure 1. Transcription factor DEACoN Interface. A screenshot of the TF DEACoN website, after a query has been searched for and filters have been applied. Gold boxes highlight features of the application.
Dow
nloaded from https://academ
ic.oup.com/insilicoplants/article/2/1/diaa006/5885168 by guest on 08 January 2022
GRNs mediate ethylene-controlled root development • 5
downloading. There is also an additional Query panel that allows the user to confirm that all the genes in the input were recognized.
3.2 TF-DEACoN finds enriched targets in clusters of genes with similar kinetics of response
to a hormonePreviously we generated a transcriptomic data set that examined the kinetics of ACC response in roots of light-grown seedlings across eight treatment times (Harkey et al. 2018). This data set was filtered to identify genes that were expressed above background and that showed consistent magnitude change and patterns of induction in response to ACC relative to time-matched controls across time in three separate replicates. This analysis yielded 449 transcripts, which were then clus-tered using k-means clustering to identify groups of transcripts with similar patterns of abundance change over time (Harkey et al. 2018). To illustrate these patterns, the average abundance of the 10 largest clusters and the annotations of those clusters are shown in Supporting Information—Fig. S1. This figure illustrates the unique patterns of transcript abundance changes across this data set, with some clusters
showing increased abundance and others showing decreased abun-dance and with each cluster have distinct kinetic of response. It is also clear from this figure that the majority of these largest clusters contain transcripts whose abundance decreases upon treatment.
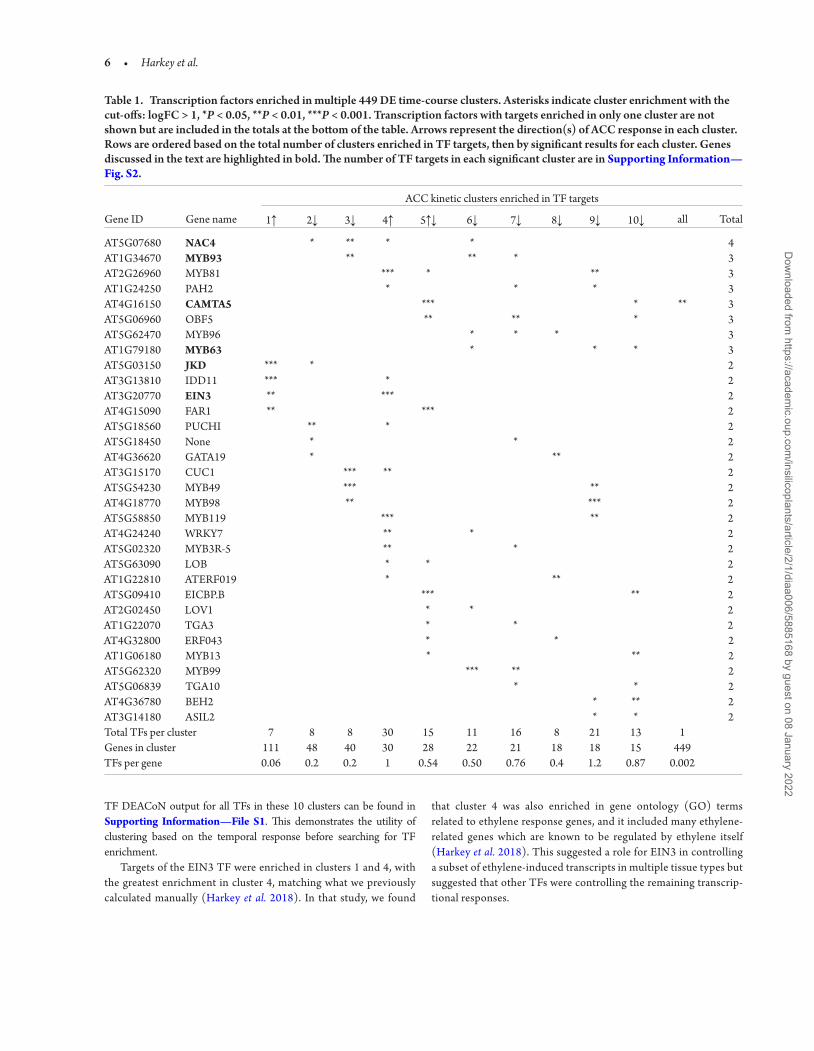
We used TF DEACoN to analyse this time-course transcriptomic data set, examining both the group of all ACC-responsive genes, as well as the top 10 largest clusters. When the entire set of 449 transcripts were used as a co-expression data set in TF DEACoN, only one TF, CAMTA5 (CALMODULIN-BINDING TRANSCRIPTION ACTIVATOR5), was found to be enriched with a log2FC ≥ 1, which is a 2-fold enrich-ment. This TF has reported roles in response to cold stress (Kidokoro et al. 2017), but no reports have linked it to ethylene or root develop-ment. However, when we ran the 10 individual clusters, targets of 97 TFs were enriched in at least one cluster with a logFC ≥ 1, and 31 of those were enriched in two or more clusters. Transcription factors with enrich-ment in two or more clusters are included in Table 1, which reports the P-values for this enrichment for each TF in each of 10 ACC response clusters. Additional information about the percentage of TF targets in each cluster can be found in Supporting Information—Fig. S2, and
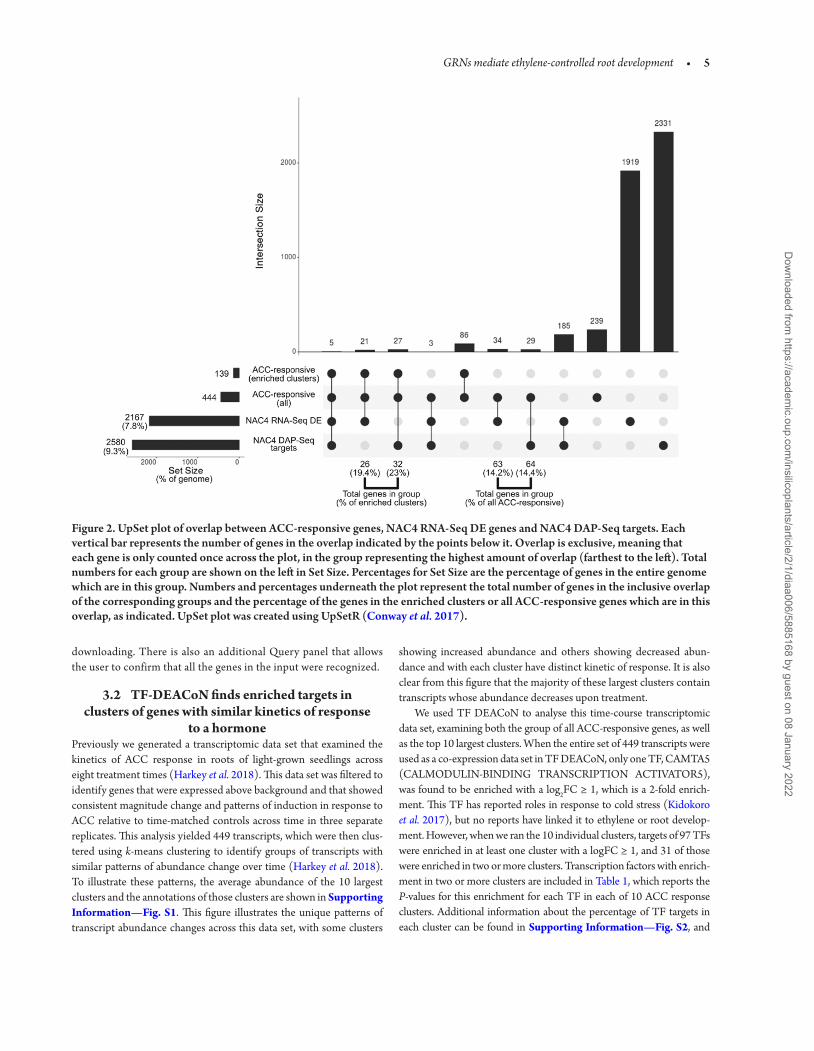
Figure 2. UpSet plot of overlap between ACC-responsive genes, NAC4 RNA-Seq DE genes and NAC4 DAP-Seq targets. Each vertical bar represents the number of genes in the overlap indicated by the points below it. Overlap is exclusive, meaning that each gene is only counted once across the plot, in the group representing the highest amount of overlap (farthest to the left). Total numbers for each group are shown on the left in Set Size. Percentages for Set Size are the percentage of genes in the entire genome which are in this group. Numbers and percentages underneath the plot represent the total number of genes in the inclusive overlap of the corresponding groups and the percentage of the genes in the enriched clusters or all ACC-responsive genes which are in this overlap, as indicated. UpSet plot was created using UpSetR (Conway et al. 2017).
Dow
nloaded from https://academ
ic.oup.com/insilicoplants/article/2/1/diaa006/5885168 by guest on 08 January 2022
6 • Harkey et al.
TF DEACoN output for all TFs in these 10 clusters can be found in Supporting Information—File S1. This demonstrates the utility of clustering based on the temporal response before searching for TF enrichment.
Targets of the EIN3 TF were enriched in clusters 1 and 4, with the greatest enrichment in cluster 4, matching what we previously calculated manually (Harkey et al. 2018). In that study, we found
that cluster 4 was also enriched in gene ontology (GO) terms related to ethylene response genes, and it included many ethylene-related genes which are known to be regulated by ethylene itself (Harkey et al. 2018). This suggested a role for EIN3 in controlling a subset of ethylene-induced transcripts in multiple tissue types but suggested that other TFs were controlling the remaining transcrip-tional responses.
Table 1. Transcription factors enriched in multiple 449 DE time-course clusters. Asterisks indicate cluster enrichment with the cut-offs: logFC > 1, *P < 0.05, **P < 0.01, ***P < 0.001. Transcription factors with targets enriched in only one cluster are not shown but are included in the totals at the bottom of the table. Arrows represent the direction(s) of ACC response in each cluster. Rows are ordered based on the total number of clusters enriched in TF targets, then by significant results for each cluster. Genes discussed in the text are highlighted in bold. The number of TF targets in each significant cluster are in Supporting Information—Fig. S2.
ACC kinetic clusters enriched in TF targets
Gene ID Gene name 1↑ 2↓ 3↓ 4↑ 5↑↓ 6↓ 7↓ 8↓ 9↓ 10↓ all Total
AT5G07680 NAC4 * ** * * 4AT1G34670 MYB93 ** ** * 3AT2G26960 MYB81 *** * ** 3AT1G24250 PAH2 * * * 3AT4G16150 CAMTA5 *** * ** 3AT5G06960 OBF5 ** ** * 3AT5G62470 MYB96 * * * 3AT1G79180 MYB63 * * * 3AT5G03150 JKD *** * 2AT3G13810 IDD11 *** * 2AT3G20770 EIN3 ** *** 2AT4G15090 FAR1 ** *** 2AT5G18560 PUCHI ** * 2AT5G18450 None * * 2AT4G36620 GATA19 * ** 2AT3G15170 CUC1 *** ** 2AT5G54230 MYB49 *** ** 2AT4G18770 MYB98 ** *** 2AT5G58850 MYB119 *** ** 2AT4G24240 WRKY7 ** * 2AT5G02320 MYB3R-5 ** * 2AT5G63090 LOB * * 2AT1G22810 ATERF019 * ** 2AT5G09410 EICBP.B *** ** 2AT2G02450 LOV1 * * 2AT1G22070 TGA3 * * 2AT4G32800 ERF043 * * 2AT1G06180 MYB13 * ** 2AT5G62320 MYB99 *** ** 2AT5G06839 TGA10 * * 2AT4G36780 BEH2 * ** 2AT3G14180 ASIL2 * * 2Total TFs per cluster 7 8 8 30 15 11 16 8 21 13 1 Genes in cluster 111 48 40 30 28 22 21 18 18 15 449 TFs per gene 0.06 0.2 0.2 1 0.54 0.50 0.76 0.4 1.2 0.87 0.002
Dow
nloaded from https://academ
ic.oup.com/insilicoplants/article/2/1/diaa006/5885168 by guest on 08 January 2022
GRNs mediate ethylene-controlled root development • 7
3.3 ACC response clusters identify candidate TFs for ACC-regulated root development
Several TFs identified as being enriched in binding targets within the ACC temporal clusters by TF DEACoN are linked to root devel-opmental processes that are regulated by ethylene. One TF that was enriched in multiple clusters (2, 3, 4 and 6) was NAC4/ANAC080/ANAC07, which is a member of the NAC (NAM, ATAF1/2 and CUC2) family of TFs. Previously NAC4 transcript abundance was reported to be nitrogen-responsive in roots (Vidal et al. 2014). To determine whether the transcript abundance of these NAC4 tar-gets identified by DAP-Seq is regulated by NAC4, we searched for overlap between the TF DEACoN predicted targets and an RNA-Seq data set in which this TF was overexpressed in root protoplasts (Brooks et al. 2019).
To illustrate relationships between these data sets we generated an UpSet plot, which is shown in Fig. 2. An alternative to complex Venn diagrams, UpSet plots show overlap between sets of data as a bar graph. Each combination of data sets, or overlap group, is repre-sented in a combination matrix by filled circles below the x-axis, and the number of genes in that overlap group is represented by a bar. The size of each data set is represented by horizontal bars to the left of the combination matrix. The table used to generate the UpSet plot can be found in Supporting Information—File S1. When the 2580 NAC4 DAP-Seq targets and 2167 RNA-Seq differentially expressed (DE) genes were compared (bottom two rows in the combination matrix), only 185 genes were shared. Consistent with this lack of agreement between the two data sets, when we compare both of them with the set of 444 ACC-responsive genes (which comes from 449 transcripts identified by microarray from Harkey et al. 2018, from which duplicate gene IDs and ‘no-match’ probes were removed for comparison to RNA-Seq data sets), only eight of the ACC-responsive genes were found to be NAC4 targets by both methods. Supporting Information—File S1 has been sorted so that these eight genes are at the top of the list these overlapping sets of genes. Of these eight genes, five were found in the clusters with NAC4 target enrichment (clus-ters 2, 3, 4 and 6; top row in combination matrix of Fig. 2), with an additional three in other clusters (‘all’ ACC-responsive, second row in combination matrix). However, when looking at the percentage of NAC4 targets found in the ACC clusters compared to the whole genome, both methods find NAC4 target enrichment in this ACC-responsive data set. These numbers and percentages are represented under their corresponding groups in Fig. 2. In the whole set of ACC-responsive genes, 14.2 % are DAP-Seq targets, and 14.4 % are RNA-Seq DE, and in the enriched clusters (2, 3, 4 and 6), 23 % are DAP-Seq targets, and 19.4 % are DE, compared to 9.3 % and 7.8 % of the entire genome, respectively. So, although the targets revealed by these two methods do not overlap perfectly, the observation of enrichment of NAC4 targets in this set of genes by two methods increases the likeli-hood that NAC4 is a regulator of this group of genes. This example demonstrates the utility of searching for TF targets in groups of co-regulated genes to form new hypotheses.
Another particularly interesting TF found in our analysis of ACC-responsive gene clusters was JKD ( JACKDAW), a BIRD family TF, which are involved in root cell patterning in the meristem (Hassan
et al. 2010). JKD-binding targets are enriched in clusters 1 and 2, which have opposite directional changes, increasing and decreasing in abundance, respectively, but respond to ACC with similar timing and magnitude of change. This suggests a role for JKD in ethylene response, perhaps in connection to root elongation, which is stunted by ethylene or ACC treatment (Qin et al. 2019). JKD is not a direct target of EIN3 in either ChIP-Seq and RNA-Seq experiments (Chang et al. 2013), but it has been shown to target NAM, a TF that is dis-cussed below. This example illustrates how clustering by response to a perturbation and looking for TF target enrichment can provide new insights and generate new, testable hypotheses about gene regulatory networks (GRNs).
3.4 Genes which respond to ACC or ethylene under many different conditions are enriched for targets of
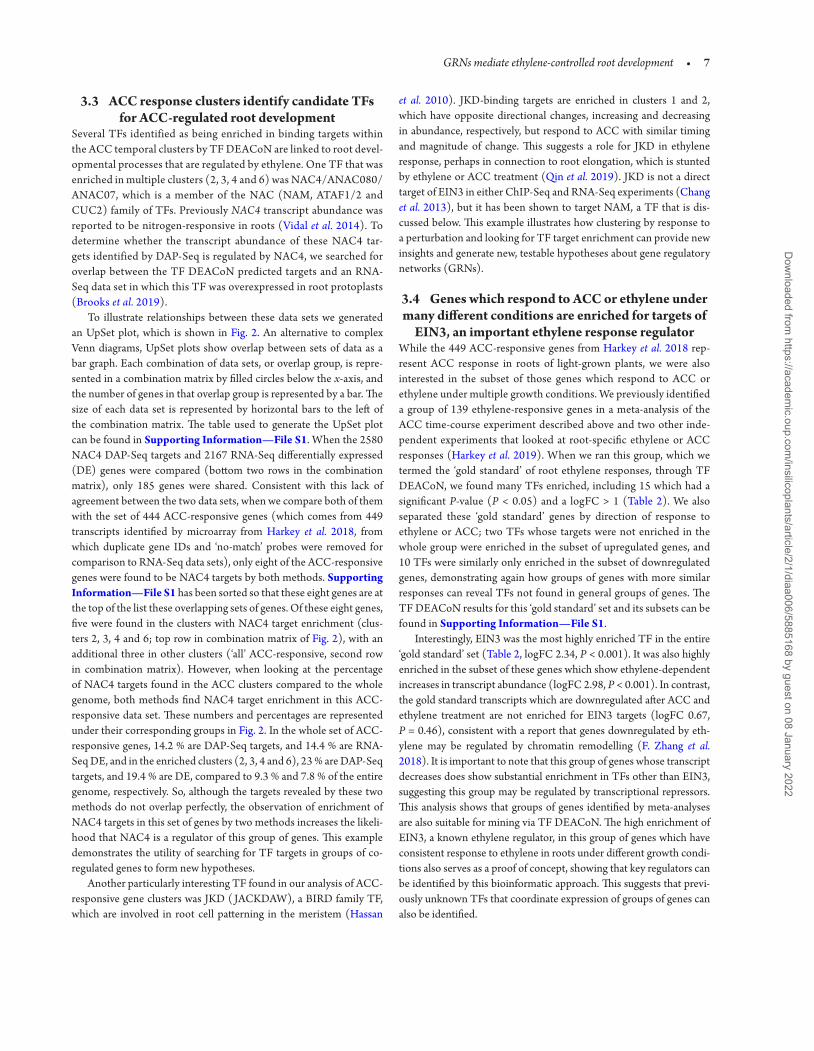
EIN3, an important ethylene response regulatorWhile the 449 ACC-responsive genes from Harkey et al. 2018 rep-resent ACC response in roots of light-grown plants, we were also interested in the subset of those genes which respond to ACC or ethylene under multiple growth conditions. We previously identified a group of 139 ethylene-responsive genes in a meta-analysis of the ACC time-course experiment described above and two other inde-pendent experiments that looked at root-specific ethylene or ACC responses (Harkey et al. 2019). When we ran this group, which we termed the ‘gold standard’ of root ethylene responses, through TF DEACoN, we found many TFs enriched, including 15 which had a significant P-value (P < 0.05) and a logFC > 1 (Table 2). We also separated these ‘gold standard’ genes by direction of response to ethylene or ACC; two TFs whose targets were not enriched in the whole group were enriched in the subset of upregulated genes, and 10 TFs were similarly only enriched in the subset of downregulated genes, demonstrating again how groups of genes with more similar responses can reveal TFs not found in general groups of genes. The TF DEACoN results for this ‘gold standard’ set and its subsets can be found in Supporting Information—File S1.
Interestingly, EIN3 was the most highly enriched TF in the entire ‘gold standard’ set (Table 2, logFC 2.34, P < 0.001). It was also highly enriched in the subset of these genes which show ethylene-dependent increases in transcript abundance (logFC 2.98, P < 0.001). In contrast, the gold standard transcripts which are downregulated after ACC and ethylene treatment are not enriched for EIN3 targets (logFC 0.67, P = 0.46), consistent with a report that genes downregulated by eth-ylene may be regulated by chromatin remodelling (F. Zhang et al. 2018). It is important to note that this group of genes whose transcript decreases does show substantial enrichment in TFs other than EIN3, suggesting this group may be regulated by transcriptional repressors. This analysis shows that groups of genes identified by meta-analyses are also suitable for mining via TF DEACoN. The high enrichment of EIN3, a known ethylene regulator, in this group of genes which have consistent response to ethylene in roots under different growth condi-tions also serves as a proof of concept, showing that key regulators can be identified by this bioinformatic approach. This suggests that previ-ously unknown TFs that coordinate expression of groups of genes can also be identified.
Dow
nloaded from https://academ
ic.oup.com/insilicoplants/article/2/1/diaa006/5885168 by guest on 08 January 2022
8 • Harkey et al.
3.5 ACC-responsive genes show cell-type-specific patterns of expression in the root
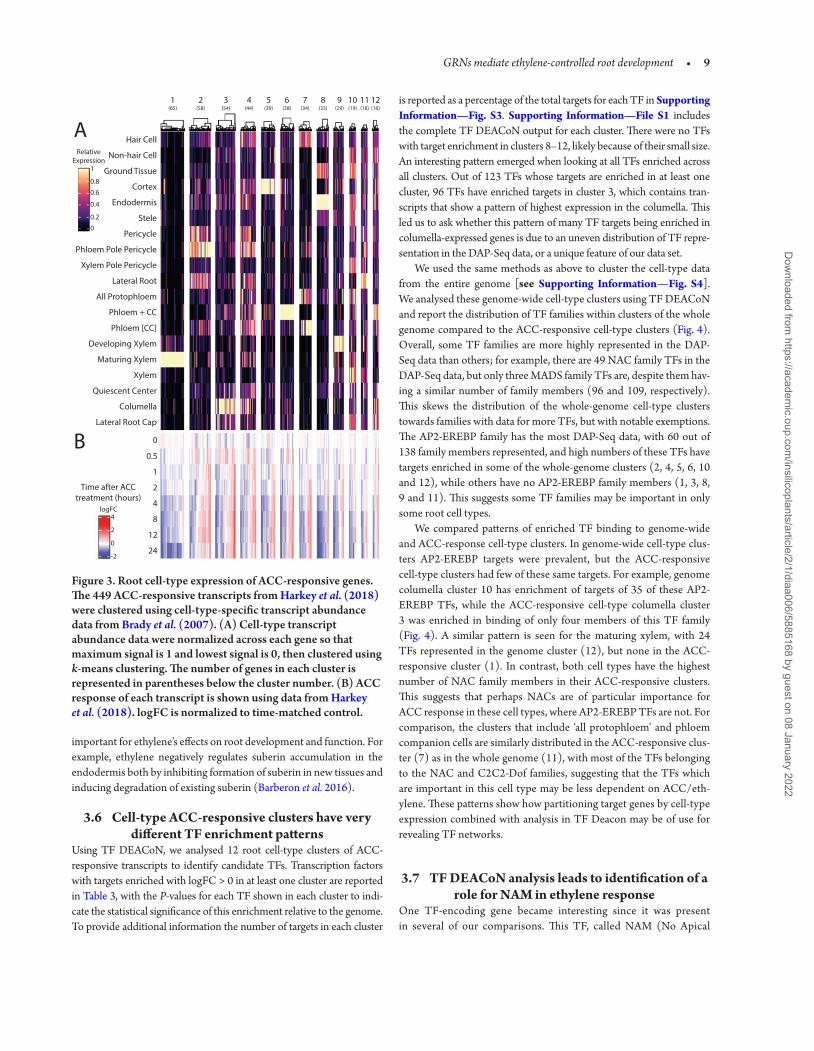
We also tested the hypothesis that we could identify TFs that control ethylene response by grouping ACC-responsive genes based on cell-type expression patterns. There is currently no root cell-type-specific transcrip-tomic data set performed with ethylene or ACC treatment, so we utilized a data set generated under growth conditions matched to the untreated ACC controls (Brady et al. 2007). While this comparison has limita-tions, it can still provide information on where ACC-responsive genes are expressed in untreated roots. The 449 ACC-responsive transcripts were clustered based on their expression across this root cell-type-specific microarray data set (Brady et al. 2007). These data were normalized across each gene on a 0–1 scale so that relative levels of expression could be more directly compared. The normalized data were used to perform k-means clustering of the 449 transcripts, resulting in 12 clusters. These clusters of ACC-responsive genes with similar cell-type expression patterns were represented in a heatmap in Fig. 3. The corresponding ACC response of the genes in each cell-type cluster is shown below the cell-type expression pattern of these genes.
Many of these clusters showing cell-type localization of ACC-responsive genes contain transcripts with high levels of abundance in one or a few cell types. For example, clusters 2 and 11 contain genes
that are highly expressed in lateral root cells and pericycle cells, from which lateral roots form, respectively, suggesting that genes in these clusters may be important for the ACC inhibition of lateral root ini-tiation (Ivanchenko et al. 2008; Negi et al. 2008; Lewis et al. 2011). Cluster 3 genes are expressed in the columella, suggesting a role in ethylene-inhibited root elongation and/or gravitropism (Buer et al. 2006; Swarup et al. 2007). Clusters 4, 10 and 12 show more compli-cated expression patterns, but when clusters 4 and 10 are compared it is evident that transcripts in these two clusters show expression patterns that are opposite across the alternating epidermal hair and non-hair cell files, suggesting these might contain genes that allow ethylene-stimulated root hair initiation and elongation (Tanimoto et al. 1995; Dolan 2001; Feng et al. 2017).
To determine how cell-type accumulation of transcripts overlays upon the ACC transcriptional response, we generated a heatmap that included both the cell-type clusters of the 449 ACC time-course data set shown next to the ACC response of those genes from our previous study (Harkey et al. 2018; Fig. 3). Most cell-type clusters had a fairly even distribution of ACC up- and downregulated genes, but clusters 1 and 8 (expressed in the maturing xylem and endodermis, respectively) had a higher proportion of ACC downregulated transcripts, suggest-ing decreased abundance of these transcripts may be particularly
Table 2. Transcription factors enriched in ethylene root ‘gold standard’ genes. Transcription factors which are enriched with a P < 0.05 and logFC > 1 in at least one of these groups: all gold standard genes (as defined in Harkey et al. 2019), upregulated gold standard genes or downregulated gold standard genes. TF family name is in italics where gene name was not available.
All Upregulated Downregulated
Gene ID Primary gene name/family logFC adj.pval logFC adj.pval logFC adj.pval
AT3G20770 EIN3 2.34 0.00 2.98 0.00 0.67 0.46AT5G11510 MYB3R4 1.54 0.00 1.35 0.08 1.74 0.00AT5G63090 LOB 1.35 0.01 1.12 0.22 1.59 0.03AT5G65130 AP2-EREBP 1.21 0.00 1.08 0.19 1.36 0.03AT1G46768 RAP2.1 1.17 0.00 1.10 0.16 1.24 0.04AT1G01250 AP2-EREBP 1.74 0.00 1.73 0.12 1.74 0.07AT5G47230 ERF5 1.53 0.02 1.40 0.22 1.67 0.08AT5G62020 HSFB2A 1.13 0.05 1.23 0.20 1.02 0.21AT2G41690 HSFB3 1.13 0.05 1.42 0.12 0.69 0.46AT5G13910 LEP, LET 1.69 0.02 0.56 0.70 2.42 0.01AT4G27950 CRF4 1.23 0.00 0.75 0.35 1.66 0.00AT1G43700 VIP1 1.07 0.03 0.62 0.59 1.48 0.03AT3G10030 None 1.03 0.01 0.90 0.24 1.17 0.04AT1G44830 AP2-EREBP 1.11 0.02 0.88 0.34 1.35 0.06AT3G23220 AP2-EREBP 1.07 0.03 0.94 0.32 1.21 0.10AT5G02320 MYB3R5 0.99 0.01 0.51 0.59 1.42 0.01AT1G03800 ERF10 0.99 0.00 0.82 0.12 1.17 0.00AT2G30340 LOB13 0.92 0.01 0.69 0.27 1.15 0.02AT1G70920 HB18 0.90 0.00 0.64 0.27 1.16 0.01AT5G18560 PUCHI 0.88 0.03 0.46 0.60 1.27 0.02AT1G50640 ERF3 0.86 0.02 -0.27 0.98 1.59 0.00AT4G34410 RRTF1 0.85 0.00 0.54 0.32 1.15 0.00AT5G23930 MTERF34 0.82 0.00 0.40 0.51 1.20 0.00AT1G53910 RAP2.12 0.81 0.00 0.52 0.30 1.10 0.00AT1G43160 RAP2.6 0.64 0.01 0.22 0.78 1.03 0.00
Dow
nloaded from https://academ
ic.oup.com/insilicoplants/article/2/1/diaa006/5885168 by guest on 08 January 2022
GRNs mediate ethylene-controlled root development • 9
important for ethylene’s effects on root development and function. For example, ethylene negatively regulates suberin accumulation in the endodermis both by inhibiting formation of suberin in new tissues and inducing degradation of existing suberin (Barberon et al. 2016).
3.6 Cell-type ACC-responsive clusters have very different TF enrichment patterns
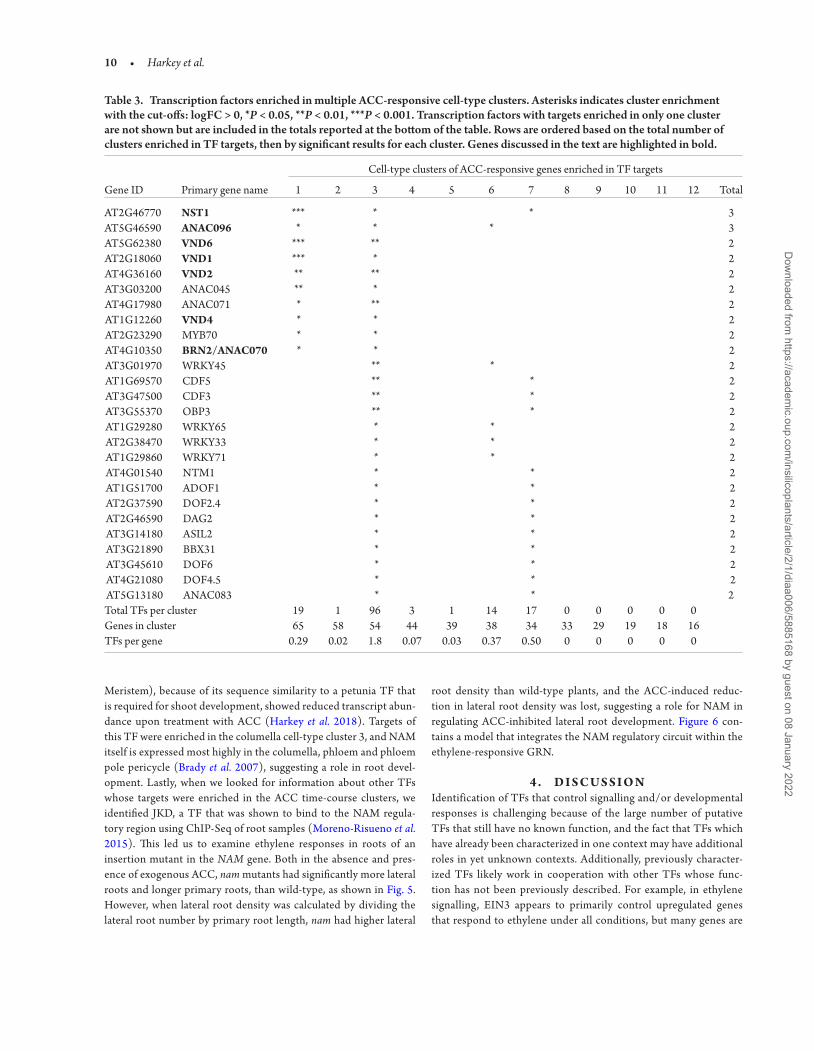
Using TF DEACoN, we analysed 12 root cell-type clusters of ACC-responsive transcripts to identify candidate TFs. Transcription factors with targets enriched with logFC > 0 in at least one cluster are reported in Table 3, with the P-values for each TF shown in each cluster to indi-cate the statistical significance of this enrichment relative to the genome. To provide additional information the number of targets in each cluster
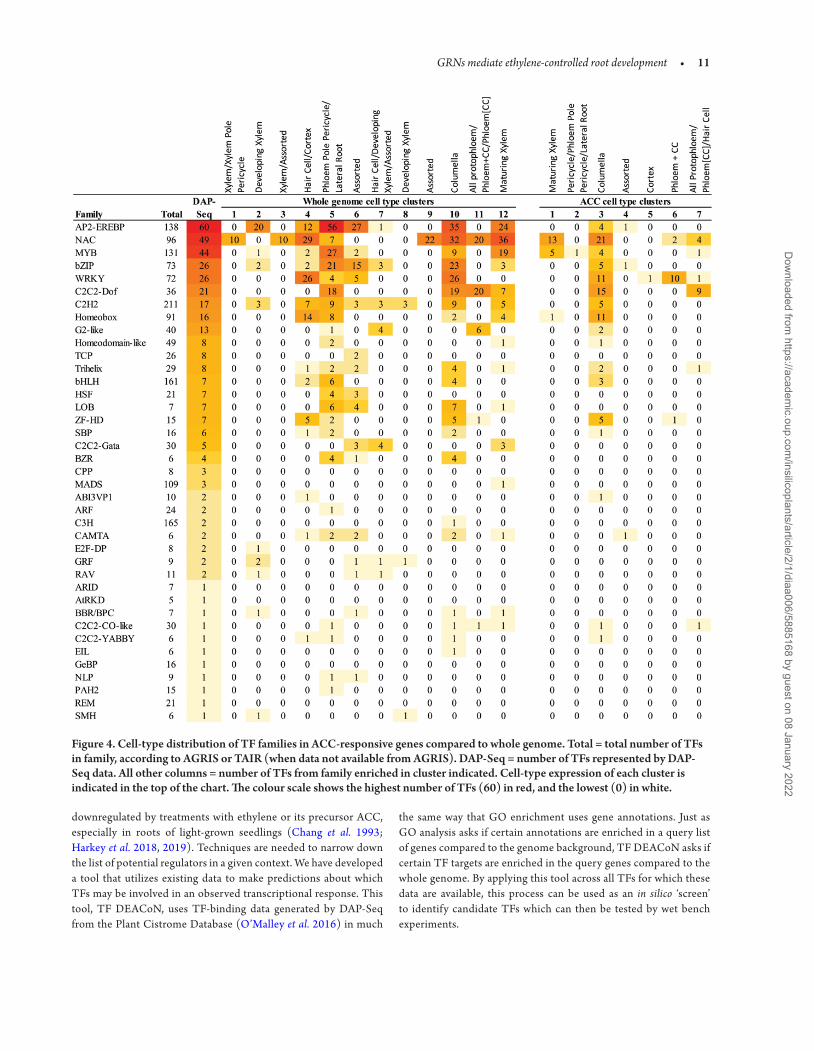
is reported as a percentage of the total targets for each TF in Supporting Information—Fig. S3. Supporting Information—File S1 includes the complete TF DEACoN output for each cluster. There were no TFs with target enrichment in clusters 8–12, likely because of their small size. An interesting pattern emerged when looking at all TFs enriched across all clusters. Out of 123 TFs whose targets are enriched in at least one cluster, 96 TFs have enriched targets in cluster 3, which contains tran-scripts that show a pattern of highest expression in the columella. This led us to ask whether this pattern of many TF targets being enriched in columella-expressed genes is due to an uneven distribution of TF repre-sentation in the DAP-Seq data, or a unique feature of our data set.
We used the same methods as above to cluster the cell-type data from the entire genome [see Supporting Information—Fig. S4]. We analysed these genome-wide cell-type clusters using TF DEACoN and report the distribution of TF families within clusters of the whole genome compared to the ACC-responsive cell-type clusters (Fig. 4). Overall, some TF families are more highly represented in the DAP-Seq data than others; for example, there are 49 NAC family TFs in the DAP-Seq data, but only three MADS family TFs are, despite them hav-ing a similar number of family members (96 and 109, respectively). This skews the distribution of the whole-genome cell-type clusters towards families with data for more TFs, but with notable exemptions. The AP2-EREBP family has the most DAP-Seq data, with 60 out of 138 family members represented, and high numbers of these TFs have targets enriched in some of the whole-genome clusters (2, 4, 5, 6, 10 and 12), while others have no AP2-EREBP family members (1, 3, 8, 9 and 11). This suggests some TF families may be important in only some root cell types.
We compared patterns of enriched TF binding to genome-wide and ACC-response cell-type clusters. In genome-wide cell-type clus-ters AP2-EREBP targets were prevalent, but the ACC-responsive cell-type clusters had few of these same targets. For example, genome columella cluster 10 has enrichment of targets of 35 of these AP2-EREBP TFs, while the ACC-responsive cell-type columella cluster 3 was enriched in binding of only four members of this TF family (Fig. 4). A similar pattern is seen for the maturing xylem, with 24 TFs represented in the genome cluster (12), but none in the ACC-responsive cluster (1). In contrast, both cell types have the highest number of NAC family members in their ACC-responsive clusters. This suggests that perhaps NACs are of particular importance for ACC response in these cell types, where AP2-EREBP TFs are not. For comparison, the clusters that include ‘all protophloem’ and phloem companion cells are similarly distributed in the ACC-responsive clus-ter (7) as in the whole genome (11), with most of the TFs belonging to the NAC and C2C2-Dof families, suggesting that the TFs which are important in this cell type may be less dependent on ACC/eth-ylene. These patterns show how partitioning target genes by cell-type expression combined with analysis in TF Deacon may be of use for revealing TF networks.
3.7 TF DEACoN analysis leads to identification of a role for NAM in ethylene response
One TF-encoding gene became interesting since it was present in several of our comparisons. This TF, called NAM (No Apical
Lateral Root Cap
Hair Cell
Non-hair Cell
Ground Tissue
Cortex
Endodermis
Stele
Pericycle
Phloem Pole Pericycle
Xylem Pole Pericycle
Lateral Root
All Protophloem
Phloem + CC
Phloem [CC]
Developing Xylem
Maturing Xylem
Quiescent Center
Columella
Xylem
0
0.5
1
2
4
8
12
24
Time after ACCtreatment (hours)
2(58)
3(54)
4(44)
5(39)
6(38)
7(34)
8(33)
9(29)
11(18)
12(16)
1(65)
10(19)
RelativeExpression
1
0
0.2
0.4
0.6
0.8
logFC4
-2
0
2
A
B
Figure 3. Root cell-type expression of ACC-responsive genes. The 449 ACC-responsive transcripts from Harkey et al. (2018) were clustered using cell-type-specific transcript abundance data from Brady et al. (2007). (A) Cell-type transcript abundance data were normalized across each gene so that maximum signal is 1 and lowest signal is 0, then clustered using k-means clustering. The number of genes in each cluster is represented in parentheses below the cluster number. (B) ACC response of each transcript is shown using data from Harkey et al. (2018). logFC is normalized to time-matched control.
Dow
nloaded from https://academ
ic.oup.com/insilicoplants/article/2/1/diaa006/5885168 by guest on 08 January 2022
10 • Harkey et al.
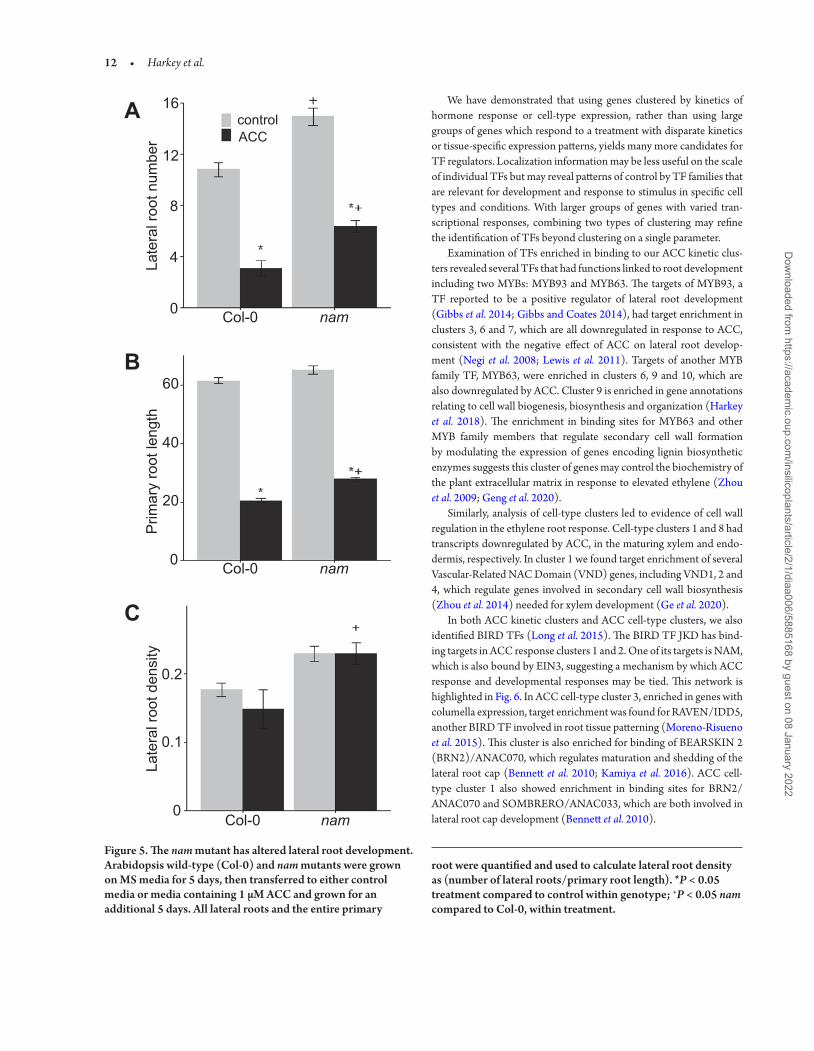
Meristem), because of its sequence similarity to a petunia TF that is required for shoot development, showed reduced transcript abun-dance upon treatment with ACC (Harkey et al. 2018). Targets of this TF were enriched in the columella cell-type cluster 3, and NAM itself is expressed most highly in the columella, phloem and phloem pole pericycle (Brady et al. 2007), suggesting a role in root devel-opment. Lastly, when we looked for information about other TFs whose targets were enriched in the ACC time-course clusters, we identified JKD, a TF that was shown to bind to the NAM regula-tory region using ChIP-Seq of root samples (Moreno-Risueno et al. 2015). This led us to examine ethylene responses in roots of an insertion mutant in the NAM gene. Both in the absence and pres-ence of exogenous ACC, nam mutants had significantly more lateral roots and longer primary roots, than wild-type, as shown in Fig. 5. However, when lateral root density was calculated by dividing the lateral root number by primary root length, nam had higher lateral
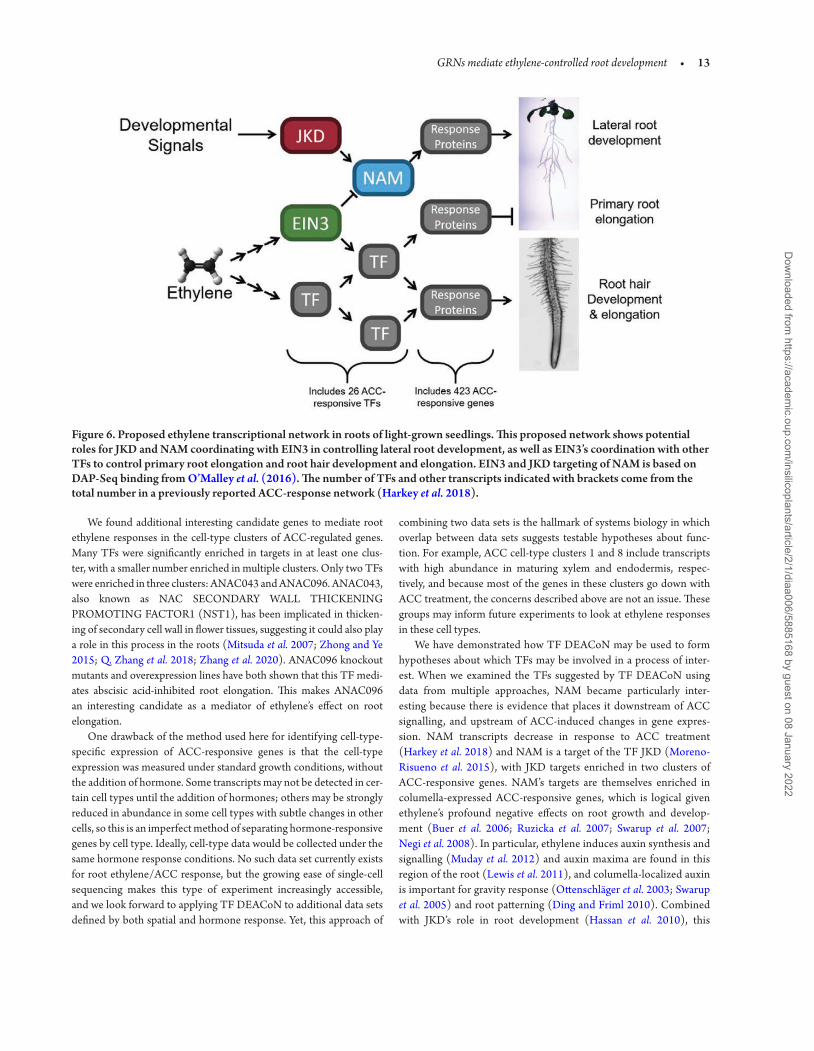
root density than wild-type plants, and the ACC-induced reduc-tion in lateral root density was lost, suggesting a role for NAM in regulating ACC-inhibited lateral root development. Figure 6 con-tains a model that integrates the NAM regulatory circuit within the ethylene-responsive GRN.
4 . D I S C U S S I O NIdentification of TFs that control signalling and/or developmental responses is challenging because of the large number of putative TFs that still have no known function, and the fact that TFs which have already been characterized in one context may have additional roles in yet unknown contexts. Additionally, previously character-ized TFs likely work in cooperation with other TFs whose func-tion has not been previously described. For example, in ethylene signalling, EIN3 appears to primarily control upregulated genes that respond to ethylene under all conditions, but many genes are
Table 3. Transcription factors enriched in multiple ACC-responsive cell-type clusters. Asterisks indicates cluster enrichment with the cut-offs: logFC > 0, *P < 0.05, **P < 0.01, ***P < 0.001. Transcription factors with targets enriched in only one cluster are not shown but are included in the totals reported at the bottom of the table. Rows are ordered based on the total number of clusters enriched in TF targets, then by significant results for each cluster. Genes discussed in the text are highlighted in bold.
Cell-type clusters of ACC-responsive genes enriched in TF targets
Gene ID Primary gene name 1 2 3 4 5 6 7 8 9 10 11 12 Total
AT2G46770 NST1 *** * * 3AT5G46590 ANAC096 * * * 3AT5G62380 VND6 *** ** 2AT2G18060 VND1 *** * 2AT4G36160 VND2 ** ** 2AT3G03200 ANAC045 ** * 2AT4G17980 ANAC071 * ** 2AT1G12260 VND4 * * 2AT2G23290 MYB70 * * 2AT4G10350 BRN2/ANAC070 * * 2AT3G01970 WRKY45 ** * 2AT1G69570 CDF5 ** * 2AT3G47500 CDF3 ** * 2AT3G55370 OBP3 ** * 2AT1G29280 WRKY65 * * 2AT2G38470 WRKY33 * * 2AT1G29860 WRKY71 * * 2AT4G01540 NTM1 * * 2AT1G51700 ADOF1 * * 2AT2G37590 DOF2.4 * * 2AT2G46590 DAG2 * * 2AT3G14180 ASIL2 * * 2AT3G21890 BBX31 * * 2AT3G45610 DOF6 * * 2AT4G21080 DOF4.5 * * 2AT5G13180 ANAC083 * * 2Total TFs per cluster 19 1 96 3 1 14 17 0 0 0 0 0 Genes in cluster 65 58 54 44 39 38 34 33 29 19 18 16 TFs per gene 0.29 0.02 1.8 0.07 0.03 0.37 0.50 0 0 0 0 0
Dow
nloaded from https://academ
ic.oup.com/insilicoplants/article/2/1/diaa006/5885168 by guest on 08 January 2022
GRNs mediate ethylene-controlled root development • 11
downregulated by treatments with ethylene or its precursor ACC, especially in roots of light-grown seedlings (Chang et al. 1993; Harkey et al. 2018, 2019). Techniques are needed to narrow down the list of potential regulators in a given context. We have developed a tool that utilizes existing data to make predictions about which TFs may be involved in an observed transcriptional response. This tool, TF DEACoN, uses TF-binding data generated by DAP-Seq from the Plant Cistrome Database (O’Malley et al. 2016) in much
the same way that GO enrichment uses gene annotations. Just as GO analysis asks if certain annotations are enriched in a query list of genes compared to the genome background, TF DEACoN asks if certain TF targets are enriched in the query genes compared to the whole genome. By applying this tool across all TFs for which these data are available, this process can be used as an in silico ‘screen’ to identify candidate TFs which can then be tested by wet bench experiments.
Figure 4. Cell-type distribution of TF families in ACC-responsive genes compared to whole genome. Total = total number of TFs in family, according to AGRIS or TAIR (when data not available from AGRIS). DAP-Seq = number of TFs represented by DAP-Seq data. All other columns = number of TFs from family enriched in cluster indicated. Cell-type expression of each cluster is indicated in the top of the chart. The colour scale shows the highest number of TFs (60) in red, and the lowest (0) in white.
Dow
nloaded from https://academ
ic.oup.com/insilicoplants/article/2/1/diaa006/5885168 by guest on 08 January 2022
12 • Harkey et al.
We have demonstrated that using genes clustered by kinetics of hormone response or cell-type expression, rather than using large groups of genes which respond to a treatment with disparate kinetics or tissue-specific expression patterns, yields many more candidates for TF regulators. Localization information may be less useful on the scale of individual TFs but may reveal patterns of control by TF families that are relevant for development and response to stimulus in specific cell types and conditions. With larger groups of genes with varied tran-scriptional responses, combining two types of clustering may refine the identification of TFs beyond clustering on a single parameter.
Examination of TFs enriched in binding to our ACC kinetic clus-ters revealed several TFs that had functions linked to root development including two MYBs: MYB93 and MYB63. The targets of MYB93, a TF reported to be a positive regulator of lateral root development (Gibbs et al. 2014; Gibbs and Coates 2014), had target enrichment in clusters 3, 6 and 7, which are all downregulated in response to ACC, consistent with the negative effect of ACC on lateral root develop-ment (Negi et al. 2008; Lewis et al. 2011). Targets of another MYB family TF, MYB63, were enriched in clusters 6, 9 and 10, which are also downregulated by ACC. Cluster 9 is enriched in gene annotations relating to cell wall biogenesis, biosynthesis and organization (Harkey et al. 2018). The enrichment in binding sites for MYB63 and other MYB family members that regulate secondary cell wall formation by modulating the expression of genes encoding lignin biosynthetic enzymes suggests this cluster of genes may control the biochemistry of the plant extracellular matrix in response to elevated ethylene (Zhou et al. 2009; Geng et al. 2020).
Similarly, analysis of cell-type clusters led to evidence of cell wall regulation in the ethylene root response. Cell-type clusters 1 and 8 had transcripts downregulated by ACC, in the maturing xylem and endo-dermis, respectively. In cluster 1 we found target enrichment of several Vascular-Related NAC Domain (VND) genes, including VND1, 2 and 4, which regulate genes involved in secondary cell wall biosynthesis (Zhou et al. 2014) needed for xylem development (Ge et al. 2020).
In both ACC kinetic clusters and ACC cell-type clusters, we also identified BIRD TFs (Long et al. 2015). The BIRD TF JKD has bind-ing targets in ACC response clusters 1 and 2. One of its targets is NAM, which is also bound by EIN3, suggesting a mechanism by which ACC response and developmental responses may be tied. This network is highlighted in Fig. 6. In ACC cell-type cluster 3, enriched in genes with columella expression, target enrichment was found for RAVEN/IDD5, another BIRD TF involved in root tissue patterning (Moreno-Risueno et al. 2015). This cluster is also enriched for binding of BEARSKIN 2 (BRN2)/ANAC070, which regulates maturation and shedding of the lateral root cap (Bennett et al. 2010; Kamiya et al. 2016). ACC cell-type cluster 1 also showed enrichment in binding sites for BRN2/ANAC070 and SOMBRERO/ANAC033, which are both involved in lateral root cap development (Bennett et al. 2010).
+
Late
ral r
oot n
umbe
rPr
imar
y ro
ot le
ngth
Late
ral r
oot d
ensi
ty
16
12
8
4
0
0
0
0.1
0.2
20
40
60
A
B
C
controlACC
Col-0 nam
Col-0 nam
Col-0 nam
Figure 5. The nam mutant has altered lateral root development. Arabidopsis wild-type (Col-0) and nam mutants were grown on MS media for 5 days, then transferred to either control media or media containing 1 µM ACC and grown for an additional 5 days. All lateral roots and the entire primary
root were quantified and used to calculate lateral root density as (number of lateral roots/primary root length). *P < 0.05 treatment compared to control within genotype; +P < 0.05 nam compared to Col-0, within treatment.
Dow
nloaded from https://academ
ic.oup.com/insilicoplants/article/2/1/diaa006/5885168 by guest on 08 January 2022
GRNs mediate ethylene-controlled root development • 13
We found additional interesting candidate genes to mediate root ethylene responses in the cell-type clusters of ACC-regulated genes. Many TFs were significantly enriched in targets in at least one clus-ter, with a smaller number enriched in multiple clusters. Only two TFs were enriched in three clusters: ANAC043 and ANAC096. ANAC043, also known as NAC SECONDARY WALL THICKENING PROMOTING FACTOR1 (NST1), has been implicated in thicken-ing of secondary cell wall in flower tissues, suggesting it could also play a role in this process in the roots (Mitsuda et al. 2007; Zhong and Ye 2015; Q. Zhang et al. 2018; Zhang et al. 2020). ANAC096 knockout mutants and overexpression lines have both shown that this TF medi-ates abscisic acid-inhibited root elongation. This makes ANAC096 an interesting candidate as a mediator of ethylene’s effect on root elongation.
One drawback of the method used here for identifying cell-type-specific expression of ACC-responsive genes is that the cell-type expression was measured under standard growth conditions, without the addition of hormone. Some transcripts may not be detected in cer-tain cell types until the addition of hormones; others may be strongly reduced in abundance in some cell types with subtle changes in other cells, so this is an imperfect method of separating hormone-responsive genes by cell type. Ideally, cell-type data would be collected under the same hormone response conditions. No such data set currently exists for root ethylene/ACC response, but the growing ease of single-cell sequencing makes this type of experiment increasingly accessible, and we look forward to applying TF DEACoN to additional data sets defined by both spatial and hormone response. Yet, this approach of
combining two data sets is the hallmark of systems biology in which overlap between data sets suggests testable hypotheses about func-tion. For example, ACC cell-type clusters 1 and 8 include transcripts with high abundance in maturing xylem and endodermis, respec-tively, and because most of the genes in these clusters go down with ACC treatment, the concerns described above are not an issue. These groups may inform future experiments to look at ethylene responses in these cell types.
We have demonstrated how TF DEACoN may be used to form hypotheses about which TFs may be involved in a process of inter-est. When we examined the TFs suggested by TF DEACoN using data from multiple approaches, NAM became particularly inter-esting because there is evidence that places it downstream of ACC signalling, and upstream of ACC-induced changes in gene expres-sion. NAM transcripts decrease in response to ACC treatment (Harkey et al. 2018) and NAM is a target of the TF JKD (Moreno-Risueno et al. 2015), with JKD targets enriched in two clusters of ACC-responsive genes. NAM’s targets are themselves enriched in columella-expressed ACC-responsive genes, which is logical given ethylene’s profound negative effects on root growth and develop-ment (Buer et al. 2006; Ruzicka et al. 2007; Swarup et al. 2007; Negi et al. 2008). In particular, ethylene induces auxin synthesis and signalling (Muday et al. 2012) and auxin maxima are found in this region of the root (Lewis et al. 2011), and columella-localized auxin is important for gravity response (Ottenschläger et al. 2003; Swarup et al. 2005) and root patterning (Ding and Friml 2010). Combined with JKD’s role in root development (Hassan et al. 2010), this
Figure 6. Proposed ethylene transcriptional network in roots of light-grown seedlings. This proposed network shows potential roles for JKD and NAM coordinating with EIN3 in controlling lateral root development, as well as EIN3’s coordination with other TFs to control primary root elongation and root hair development and elongation. EIN3 and JKD targeting of NAM is based on DAP-Seq binding from O’Malley et al. (2016). The number of TFs and other transcripts indicated with brackets come from the total number in a previously reported ACC-response network (Harkey et al. 2018).
Dow
nloaded from https://academ
ic.oup.com/insilicoplants/article/2/1/diaa006/5885168 by guest on 08 January 2022
14 • Harkey et al.
information suggests JKD and NAM may work together to modulate the ACC response.
We characterized the root growth and developmental phenotypes of a nam mutant, revealing a role of the NAM TF in lateral root devel-opment and primary root elongation. This finding supports the utility of this method to detect TFs that control hormone response by iden-tification of enrichment of binding targets in a group of co-expressed genes. The diagram in Fig. 6 summarizes this snapshot of a subset of the ethylene GRN in roots highlighting the reduction of NAM tran-scripts in the presence of elevated ethylene, suggesting that NAM is an upregulator of gene products which stimulate lateral root formation, such that its reduction leads to a subsequent reduction in lateral root formation.
Recently, another tool was developed which enabled a similar search for upstream regulators (Ran et al. 2020). The Plant Regulomics database includes a suite of tools, including the Binding Factor Enrichment tool, which uses a similar strategy to TF DEACoN. It dif-fers in that it employs both the DAP-Seq data set, but also a variety of ChIP-Seq data sets. When we ran clusters discussed here through Plant Regulomics, we found significant enrichment of the same TFs as those given by TF DEACoN, though the adjusted P-value differed as they used a different statistical test (Plant Regulomics employs a modified Fisher’s exact test) and performed a higher number of comparisons since they included ChIP-Seq data. In our experience, TF DEACoN returns results significantly more quickly. We believe these are complementary tools and highlight the simplicity of TF DEACoN, enabling rapid analysis of multiple clusters as demon-strated here, in comparison to the multifunctionality and complexity of Plant Regulomics.
Here we reveal the combined benefits of clustering genes based on the temporal responses to perturbations and developmental patterns to obtain additional information about regulators that cannot be seen when a larger group of genes is searched on either interface. This suggests an area of future improvement for TF DEACoN to incorporate these additional layers of information, which could be implemented in two ways. First, data sets that are likely to have broad appeal, such as those involving circadian rhythm (Michael et al. 2008), response to stresses or cell-type expression patterns could be built into TF DEACoN. Users could choose a data set to use for clustering their genes, and the tool would automatically sort their gene list into groups based on these data and then run the TF tar-get enrichment analysis on these groups individually. Second, the option to provide cluster numbers for each gene in the query list would enable users to pre-cluster their list of genes on whatever criteria or data they may find interesting, and then feed these clusters into TF DEACoN so that it performs the TF target enrichment analysis on each user identified cluster separately, but simultaneously.
Other directions for further development of TF DEACoN include the addition of data sets beyond DAP-Seq, such as ChIP-Seq and RNA-Seq. While these data sets do have their limitations for broad application to many experimental questions, they could prove useful for other researchers with similar interests. For example, in the case of NAC4 described above, RNA-Seq of samples isolated from root pro-toplasts overexpressing NAC4 revealed increased transcripts which are either direct or downstream of NAC4 targets (Brooks et al. 2019). Even though these transcripts did not align perfectly with NAC4
targets revealed by DAP-Seq, they did reveal enrichment of NAC4 targets in the same clusters of genes as the DAP-Seq data. Confirming results by multiple data sets can further narrow down TFs of interest. These additions could extend the usefulness of TF DEACoN to a wide variety of researchers in the plant community.
In summary, we have produced a tool which enables researchers to make use of public data to generate hypotheses about transcriptional regulators of their process of interest and shown how refining lists of target genes based on patterns of expression can strengthen these predictions. We have applied these methods to investigate transcrip-tional networks downstream of ethylene signalling in Arabidopsis roots, and demonstrated their utility by identifying multiple candi-date TFs from groups of genes clustered based on response to ACC and based on cell-type expression. We report the confirmation of one of these predicted TFs, NAM, as a previously unknown regulator of root development.
S U P P O RT I N G I N F O R M AT I O NThe following additional information is available in the online version of this article—Figure S1. Clusters of ACC-responsive genes. Figure S2. TFs enriched in multiple 449 DE time course clusters. Figure S3. TFs enriched in multiple ACC cell type clusters.Figure S4. Cell-type clustering of whole genome.Supplementary File S1. An XLSX file containing the cell type clus-ter number for each gene in the ACC-responsive 449 dataset, the TF DEACoN results for the ACC response clusters, the cell type clusters, and the root ethylene gold standard datasets, as well as the table used to generate the UpSet plot for the NAC4 comparison.
C O N T R I B U T I O N S B Y T H E AU T H O R SA.F.H. wrote the application, TF DEACoN, completed bioinformat-ics analyses, and drafted and edited the article; K.N.S. performed root developmental analyses, G.K.M. participated in experimental design and editing of the article.
S O U R C E S O F F U N D I N GThis work was supported by a grant from the United States National Science Foundation grant (1716279) to G.KM.
C O N F L I C T O F I N T E R E S TThe authors declare no conflict of interest.
D ATA AVA I L A B I L I T YThe ACC root microarray data set of 449 genes, along with their cluster identity is available as Supplementary Data 1 from Harkey et al. (2018) (http://www.plantphysiol.org/highwire/filestream/141925/field_highwire_adjunct_files/0/00907Supplemental_File_1_Harkey_et_al.xlsx). The 139 root ‘gold standard’ ethylene-responsive genes are available as Supplementary Dataset 1 from Harkey et al. (2019) (https://ndownloader.figstatic.com/files/17600846). The root cell-type data from Brady et al. (2007) is available from the Brady lab website (http://www-plb.ucdavis.edu/labs/brady/software/BradySpatiotemporalData/TOTALMEANS.xlsx).
Dow
nloaded from https://academ
ic.oup.com/insilicoplants/article/2/1/diaa006/5885168 by guest on 08 January 2022
GRNs mediate ethylene-controlled root development • 15
LITERATURE CITED
Alonso JM, Hirayama T, Roman G, Nourizadeh S, Ecker JR. 1999. EIN2, a bifunctional transducer of ethylene and stress responses in Arabidopsis. Science 284:2148–2152.
Bailey E. 2015. shinyBS: twitter bootstrap components for Shiny. R pack-age version 0.61. https://CRAN.R-project.org/package=shinyBS.
Bailey TL, Boden M, Buske FA, Frith M, Grant CE, Clementi L, Ren J, Li WW, Noble WS. 2009. MEME Suite: tools for motif discovery and searching. Nucleic Acids Research 37:202–208.
Bailey TL, Elkan C. 1994. Fitting a mixture model by expectation maximization to discover motifs in biopolymers. Proceedings. International Conference on Intelligent Systems for Molecular Biology 2:28–36.
Barberon M, Vermeer JE, De Bellis D, Wang P, Naseer S, Andersen TG, Humbel BM, Nawrath C, Takano J, Salt DE, Geldner N. 2016. Adaptation of root function by nutrient-induced plasticity of endo-dermal differentiation. Cell 164:447–459.
Bargmann BO, Vanneste S, Krouk G, Nawy T, Efroni I, Shani E, Choe G, Friml J, Bergmann DC, Estelle M, Birnbaum KD. 2013. A map of cell type-specific auxin responses. Molecular Systems Biology 9:688.
Barrett T, Wilhite SE, Ledoux P, Evangelista C, Kim IF, Tomashevsky M, Marshall KA, Phillippy KH, Sherman PM, Holko M, Yefanov A, Lee H, Zhang N, Robertson CL, Serova N, Davis S, Soboleva A. 2013. NCBI GEO: archive for functional genomics data sets—update. Nucleic Acids Research 41:D991–D995.
Bartlett A, O’Malley RC, Huang SC, Galli M, Nery JR, Gallavotti A, Ecker JR. 2017. Mapping genome-wide transcription-factor bind-ing sites using DAP-seq. Nature Protocols 12:1659–1672.
Bennett T, van den Toorn A, Sanchez-Perez GF, Campilho A, Willemsen V, Snel B, Scheres B. 2010. SOMBRERO, BEARSKIN1, and BEARSKIN2 regulate root cap maturation in Arabidopsis. The Plant Cell 22:640–654.
Bleecker AB, Estelle MA, Somerville C, Kende H. 1988. Insensitivity to ethylene conferred by a dominant mutation in Arabidopsis thali-ana. Science 241:1086–1089.
Brady SM, Orlando DA, Lee JY, Wang JY, Koch J, Dinneny JR, Mace D, Ohler U, Benfey PN. 2007. A high-resolution root spatiotemporal map reveals dominant expression patterns. Science 318:801–806.
Brooks MD, Cirrone J, Pasquino AV, Alvarez JM, Swift J, Mittal S, Juang C-L, Varala K, Gutiérrez RA, Krouk G, Shasha D, Coruzzi GM.. 2019. Network walking charts transcriptional dynamics of nitrogen signaling by integrating validated and pre-dicted genome-wide interactions. Nature Communications 10:1–13.
Buer CS, Sukumar P, Muday GK. 2006. Ethylene modulates flavonoid accumulation and gravitropic responses in roots of Arabidopsis. Plant Physiology 140:1384–1396.
Cara B, Giovannoni JJ. 2008. Molecular biology of ethylene dur-ing tomato fruit development and maturation. Plant Science 175:106–113.
Chang W, Cheng J, Allaire J, Xie Y, McPherson J. 2020. shiny: web application framework for R. R package version 1.4.0.2. https://CRAN.R-project.org/package=shiny
Chang C, Kwok SF, Bleecker AB, Meyerowitz EM. 1993. Arabidopsis ethylene-response gene ETR1: similarity of product to two-com-ponent regulators. Science 262:539–544.
Chang KN, Zhong S, Weirauch MT, Hon G, Pelizzola M, Li H, Huang S-SC, Schmitz RJ, Urich MA, Kuo D, Nery JR, Qiao H, Yang A, Jamali A, Chen H, Ideker T, Ren B, Bar-Joseph Z, Hughes TR, Ecker JR. 2013. Temporal transcriptional response to ethylene gas drives growth hormone cross-regulation in Arabidopsis. eLife 2:e00675.
Chao Q, Rothenberg M, Solano R, Roman G, Terzaghi W, Ecker JR. 1997. Activation of the ethylene gas response pathway in Arabidopsis by the nuclear protein ETHYLENE-INSENSITIVE3 and related proteins. Cell 89:1133–1144.
Chen Y, Grimplet J, David K, Castellarin SD, Terol J, Wong DCJ, Luo Z, Schaffer R, Celton J-M, Talon M, Gambetta GA, Chervin C. 2018. Ethylene receptors and related proteins in climacteric and non-climacteric fruits. Plant Science 276:63–72.
Cheng CY, Krishnakumar V, Chan AP, Thibaud-Nissen F, Schobel S, Town CD. 2017. Araport11: a complete reannotation of the Arabidopsis thaliana reference genome. The Plant Journal 89:789–804.
Conway JR, Lex A, Gehlenborg N. 2017. UpSetR: an R package for the visualization of intersecting sets and their properties. Bioinformatics 33:2938–2940.
Dey S, Vlot AC. 2015. Ethylene responsive factors in the orchestration of stress responses in monocotyledonous plants. Frontiers in Plant Science 6:640.
Ding Z, Friml J. 2010. Auxin regulates distal stem cell differentiation in Arabidopsis roots. Proceedings of the National Academy of Sciences of the United States of America 107:12046–12051.
Dolan L. 2001. The role of ethylene in root hair growth in Arabidopsis. Journal of Plant Nutrition and Soil Science 164:141–145.
Fabi JP, Ramos do Prado SB. 2019. Fast and furious: ethylene-triggered changes in the metabolism of papaya fruit during ripening. Frontiers in Plant Science 10:535.
Feng Y, Xu P, Li B, Li P, Wen X, An F, Gong Y, Xin Y, Zhu Z, Wang Y, Guo H. 2017. Ethylene promotes root hair growth through coor-dinated EIN3/EIL1 and RHD6/RSL1 activity in Arabidopsis. Proceedings of the National Academy of Sciences of the United States of America 114:13834–13839.
Ge S, Han X, Xu X, Shao Y, Zhu Q, Liu Y, Du J, Xu J, Zhang S. 2020. WRKY15 suppresses tracheary element differentiation upstream of VND7 during xylem formation. The Plant Cell. 32: 2307–2324.
Geng P, Zhang S, Liu J, Zhao C, Wu J, Cao Y, Fu C, Han X, He H, Zhao Q. 2020. MYB20, MYB42, MYB43, and MYB85 regulate phenylalanine and lignin biosynthesis during secondary cell wall formation. Plant Physiology 182:1272–1283.
Gibbs DJ, Coates JC. 2014. AtMYB93 is an endodermis-specific tran-scriptional regulator of lateral root development in Arabidopsis. Plant Signaling & Behavior 9:e970406.
Gibbs DJ, Voß U, Harding SA, Fannon J, Moody LA, Yamada E, Swarup K, Nibau C, Bassel GW, Choudhary A, Lavenus J, Bradshaw SJ, Stekel DJ, Bennett MJ, Coates JC. 2014. AtMYB93 is a novel negative regulator of lateral root development in Arabidopsis. The New Phytologist 203:1194–207.
Guzman P, Ecker JR. 1990. Exploiting the triple response of Arabidopsis to identify ethylene-related mutants. The Plant Cell 2:513–523.
Harkey AF, Watkins JM, Olex AL, DiNapoli KT, Lewis DR, Fetrow JS, Binder BM, Muday GK. 2018. Identification of transcriptional and
Dow
nloaded from https://academ
ic.oup.com/insilicoplants/article/2/1/diaa006/5885168 by guest on 08 January 2022
16 • Harkey et al.
receptor networks that control root responses to ethylene. Plant Physiology 176:2095–2118.
Harkey AF, Yoon GM, Seo DH, DeLong A, Muday GK. 2019. Light modulates ethylene synthesis, signaling, and downstream tran-scriptional networks to control plant development. Frontiers in Plant Science 10:1094.
Hassan H, Scheres B, Blilou I. 2010. JACKDAW controls epidermal patterning in the Arabidopsis root meristem through a non-cell-autonomous mechanism. Development 137:1523–1529.
Ivanchenko MG, Muday GK, Dubrovsky JG. 2008. Ethylene-auxin interactions regulate lateral root initiation and emergence in Arabidopsis thaliana. The Plant Journal 55:335–347.
Kamiya M, Higashio SY, Isomoto A, Kim JM, Seki M, Miyashima S, Nakajima K. 2016. Control of root cap maturation and cell detachment by BEARSKIN transcription factors in Arabidopsis. Development 143:4063–4072.
Kidokoro S, Yoneda K, Takasaki H, Takahashi F, Shinozaki K, Yamaguchi-Shinozaki K. 2017. Different cold-signaling pathways function in the responses to rapid and gradual decreases in tem-perature. The Plant Cell 29:760–774.
Kieber JJ, Rothenberg M, Roman G, Feldmann KA, Ecker JR. 1993. CTR1, a negative regulator of the ethylene response pathway in Arabidopsis, encodes a member of the raf family of protein kinases. Cell 72:427–441.
Lewis DR, Negi S, Sukumar P, Muday GK. 2011. Ethylene inhibits lat-eral root development, increases IAA transport and expression of PIN3 and PIN7 auxin efflux carriers. Development 138:3485–3495.
Lewis DR, Olex AL, Lundy SR, Turkett WH, Fetrow JS, Muday GK. 2013. A kinetic analysis of the auxin transcriptome reveals cell wall remodeling proteins that modulate lateral root development in Arabidopsis. The Plant Cell 25:3329–3346.
Lex A, Gehlenborg N, Strobelt H, Vuillemot R, Pfister H. 2014. UpSet: visualization of intersecting sets. IEEE Transactions on Visualization and Computer Graphics 20:1983–1992.
Lieberman-Lazarovich M, Yahav C, Israeli A, Efroni I. 2019. Deep conservation of cis-element variants regulating plant hormonal responses. The Plant Cell 31:2559–2572.
Long Y, Smet W, Cruz-Ramírez A, Castelijns B, de Jonge W, Mähönen AP, Bouchet BP, Perez GS, Akhmanova A, Scheres B, Blilou I. 2015. Arabidopsis BIRD zinc finger proteins jointly stabi-lize tissue boundaries by confining the cell fate regulator SHORT-ROOT and contributing to fate specification. The Plant Cell 27:1185–1199.
Merchante C, Alonso JM, Stepanova AN. 2013. Ethylene signaling: simple ligand, complex regulation. Current Opinion in Plant Biology 16:554–560.
Michael TP, Mockler TC, Breton G, McEntee C, Byer A, Trout JD, Hazen SP, Shen R, Priest HD, Sullivan CM, Givan SA, Yanovsky M, Hong F, Kay SA, Chory J. 2008. Network discovery pipeline eluci-dates conserved time-of-day-specific cis-regulatory modules. PLoS Genetics 4:e14.
Mitsuda N, Iwase A, Yamamoto H, Yoshida M, Seki M, Shinozaki K, Ohme-Takagi M. 2007. NAC transcription factors, NST1 and NST3, are key regulators of the formation of secondary walls in woody tissues of Arabidopsis. The Plant Cell 19:270–280.
Moreno-Risueno MA, Sozzani R, Yardımcı GG, Petricka JJ, Vernoux T, Blilou I, Alonso J, Winter CM, Ohler U, Scheres B, Benfey PN.
2015. Transcriptional control of tissue formation throughout root development. Science 350:426–430.
Muday GK, Rahman A, Binder BM. 2012. Auxin and ethylene: col-laborators or competitors? Trends in Plant Science 17:181–195.
Negi S, Ivanchenko MG, Muday GK. 2008. Ethylene regulates lateral root formation and auxin transport in Arabidopsis thaliana. The Plant Journal 55:175–187.
O’Malley RC, Huang SC, Song L, Lewsey MG, Bartlett A, Nery JR, Galli M, Gallavotti A, Ecker JR. 2016. Cistrome and epicistrome features shape the regulatory DNA landscape. Cell 165:1280–1292.
Ottenschläger I, Wolff P, Wolverton C, Bhalerao RP, Sandberg G, Ishikawa H, Evans M, Palme K. 2003. Gravity-regulated differential auxin transport from columella to lateral root cap cells. Proceedings of the National Academy of Sciences of the United States of America 100:2987–2991.
Ouwerkerk PBF, Meijer AH. 2001. Yeast one-hybrid screening for DNA-protein interactions. Current Protocols in Molecular Biology 55:12.12.1–12.12.12.
Page DR, Grossniklaus U. 2002. The art and design of genetic screens: Arabidopsis thaliana. Nature Reviews Genetics 3:124–136.
Pollock DD, Larkin JC. 2004. Estimating the degree of saturation in mutant screens. Genetics 168:489–502.
Qin H, He L, Huang R. 2019. The coordination of ethylene and other hormones in primary root development. Frontiers in Plant Science 10:874.
Ran X, Zhao F, Wang Y, Liu J, Zhuang Y, Ye L, Qi M, Cheng J, Zhang Y. 2020. Plant Regulomics: a data-driven interface for retrieving upstream regulators from plant multi-omics data. The Plant Journal 101:237–248.
R Core Team. 2014. R: a language and environment for statistical com-puting. Vienna, Austria: R Foundation for Statistical Computing.
Robertson G, Hirst M, Bainbridge M, Bilenky M, Zhao Y, Zeng T, Euskirchen G, Bernier B, Varhol R, Delaney A, Thiessen N, Griffith OL, He A, Marra M, Snyder M, Jones S. 2007. Genome-wide profiles of STAT1 DNA association using chromatin immu-noprecipitation and massively parallel sequencing. Nature Methods 4:651–657.
Růzicka K, Ljung K, Vanneste S, Podhorská R, Beeckman T, Friml J, Benková E. 2007. Ethylene regulates root growth through effects on auxin biosynthesis and transport-dependent auxin distribution. The Plant Cell 19:2197–2212.
Schindelin J, Arganda-Carreras I, Frise E, Kaynig V, Longair M, Pietzsch T, Preibisch S, Rueden C, Saalfeld S, Schmid B, Tinevez J-Y, White DJ, Hartenstein V, Eliceiri D, Tomancak P, Cardona A. 2012. Fiji: an open-source platform for biological-image analysis. Nature Methods 9:676–682.
Solano R, Stepanova A, Chao Q, Ecker JR. 1998. Nuclear events in ethylene signaling: a transcriptional cascade mediated by ETHYLENE-INSENSITIVE3 and ETHYLENE-RESPONSE-FACTOR1. Genes & Development 12:3703–3714.
Stepanova AN, Yun J, Likhacheva AV, Alonso JM. 2007. Multilevel interactions between ethylene and auxin in Arabidopsis roots. The Plant Cell 19:2169–2185.
Swarup R, Kramer EM, Perry P, Knox K, Leyser HM, Haseloff J, Beemster GT, Bhalerao R, Bennett MJ. 2005. Root gravitropism requires lateral root cap and epidermal cells for transport and response to a mobile auxin signal. Nature Cell Biology 7:1057–1065.
Dow
nloaded from https://academ
ic.oup.com/insilicoplants/article/2/1/diaa006/5885168 by guest on 08 January 2022
GRNs mediate ethylene-controlled root development • 17
Swarup R, Perry P, Hagenbeek D, Van Der Straeten D, Beemster GT, Sandberg G, Bhalerao R, Ljung K, Bennett MJ. 2007. Ethylene upregulates auxin biosynthesis in Arabidopsis seedlings to enhance inhibition of root cell elongation. The Plant Cell 19:2186–2196.
Tang F, Barbacioru C, Wang Y, Nordman E, Lee C, Xu N, Wang X, Bodeau J, Tuch BB, Siddiqui A, Lao K, Surani MA. 2009. mRNA-Seq whole-transcriptome analysis of a single cell. Nature Methods 6:377–382.
Tanimoto M, Roberts K, Dolan L. 1995. Ethylene is a positive regu-lator of root hair development in Arabidopsis thaliana. The Plant Journal 8:943–948.
Tokunaga M, Kokubu C, Maeda Y, Sese J, Horie K, Sugimoto N, Kinoshita T, Yusa K, Takeda J. 2014. Simulation and estimation of gene number in a biological pathway using almost complete satura-tion mutagenesis screening of haploid mouse cells. BMC Genomics 15:1016.
Vanneste S, Rybel BD, Beemster GTS, Ljung K, Smet ID, Isterdael GV, Daudts M, Iida R, Gruissem W, Tasaka M, Inzé D, Fukaki H, Beeckman T. 2005. Cell Cycle Progression in the Pericycle Is Not Sufficient for SOLITARY ROOT/IAA14-Mediated Lateral Root Initiation in Arabidopsis thaliana. The Plant Cell 17: 3035–3050.
Vidal EA, Álvarez JM, Gutiérrez RA. 2014. Nitrate regulation of AFB3 and NAC4 gene expression in Arabidopsis roots depends on NRT1.1 nitrate transport function. Plant Signaling & Behavior 9:e28501.
Wang F, Cui X, Sun Y, Dong CH. 2013. Ethylene signaling and reg-ulation in plant growth and stress responses. Plant Cell Reports 32:1099–1109.
Xu Y, Wang Y, Wang X, Pei S, Kong Y, Hu R, Zhou G. 2020. Transcription factors BLH2 and BLH4 regulate demethylesteri-fication of homogalacturonan in seed mucilage. Plant Physiology 183:96–111.
Yilmaz A, Mejia-Guerra MK, Kurz K, Liang X, Welch L, Grotewold E. 2011. AGRIS: the Arabidopsis Gene Regulatory Information Server, an update. Nucleic Acids Research 39: D1118–D1122.
Zhang Q, Luo F, Zhong Y, He J, Li L. 2020. Modulation of NAC transcription factor NST1 activity by XYLEM NAC DOMAIN1 regulates secondary cell wall formation in Arabidopsis. Journal of Experimental Botany 71:1449–1458.
Zhang F, Wang L, Ko EE, Shao K, Qiao H. 2018. Histone deacetylases SRT1 and SRT2 interact with ENAP1 to mediate ethylene-induced transcriptional repression. The Plant Cell 30:153–166.
Zhang Q, Xie Z, Zhang R, Xu P, Liu H, Yang H, Doblin MS, Bacic A, Li L. 2018. Blue light regulates secondary cell wall thickening via MYC2/MYC4 activation of the NST1-directed transcriptional network in Arabidopsis. The Plant Cell 30:2512–2528.
Zhong R, Ye ZH. 2015. The Arabidopsis NAC transcription factor NST2 functions together with SND1 and NST1 to regulate sec-ondary wall biosynthesis in fibers of inflorescence stems. Plant Signaling & Behavior 10:e989746.
Zhou J, Lee C, Zhong R, Ye ZH. 2009. MYB58 and MYB63 are transcrip-tional activators of the lignin biosynthetic pathway during secondary cell wall formation in Arabidopsis. The Plant Cell 21:248–266.
Zhou J, Zhong R, Ye ZH. 2014. Arabidopsis NAC domain proteins, VND1 to VND5, are transcriptional regulators of secondary wall biosynthesis in vessels. PLoS One 9:e105726.
Dow
nloaded from https://academ
ic.oup.com/insilicoplants/article/2/1/diaa006/5885168 by guest on 08 January 2022