Embed Size (px)
Citation preview
https://academic.oup.com/endo 1
Endocrinology, 2021, Vol. 162, No. 7, 1–20doi:10.1210/endocr/bqab096
Research Article
ISSN Online 1945-7170
© The Author(s) 2021. Published by Oxford University Press on behalf of the Endocrine Society.
Research Article
An RNAi Screening of Clinically Relevant Transcription Factors Regulating Human Adipogenesis and Adipocyte MetabolismChristel Björk,1,* Narmadha Subramanian,1,* Jianping Liu,2 Juan Ramon Acosta,1 Beatriz Tavira,1 Anders B. Eriksson,2 Peter Arner,1 and Jurga Laurencikiene1
1Lipid laboratory, Department of Medicine Huddinge, Karolinska Institutet, Stockholm, SE-14186, Sweden; and 2Karolinska High Throughput Center, Department of Medical Biochemistry and Biophysics (MBB), Division of Functional Genomics, Karolinska Institutet, Stockholm SE-171 77, Sweden
ORCiD number: 0000-0002-7032-2924 (J. Laurencikiene).
*Both authors contributed equally for this work.
Abbreviations: ANOVA, analysis of variance; BMI, body mass index; FDR, false discovery rate; hASC, human adipose tissue-derived stem cell(s); IPA, Ingenuity Pathway Analysis; IR, insulin resistance; PC1/2, principal components 1/2; PPARγ, peroxisome proliferator-activated receptor γ; RNAi, RNA interference; RT-qPCR, quantitative reverse transcription–polymerase chain reaction; scWAT, subcutaneous white adipose tissue; siRNA, small interfering RNA; SSMD, Strictly Standardized Mean Difference; TF, transcription factor; WAT, white adipose tissue
Received: 3 March 2021; Editorial Decision: 3 May 2021; First Published Online: 7 May 2021; Corrected and Typeset: 12 June 2021.
Abstract
Context: Healthy hyperplasic (many but smaller fat cells) white adipose tissue (WAT) ex-pansion is mediated by recruitment, proliferation and/or differentiation of new fat cells. This process (adipogenesis) is controlled by transcriptional programs that have been mostly identified in rodents.Objective: A systemic investigation of adipogenic human transcription factors (TFs) that are relevant for metabolic conditions has not been revealed previously.Methods: TFs regulated in WAT by obesity, adipose morphology, cancer cachexia, and insulin resistance were selected from microarrays. Their role in differentiation of human adipose tissue-derived stem cells (hASC) was investigated by RNA interference (RNAi) screen. Lipid accumulation, cell number, and lipolysis were measured for all screened factors (148 TFs). RNA (RNAseq), protein (Western blot) expression, insulin, and catechol-amine responsiveness were examined in hASC following siRNA treatment of selected target TFs.Results: Analysis of TFs regulated by metabolic conditions in human WAT revealed that many of them belong to adipogenesis-regulating pathways. The RNAi screen identified 39 genes that affected fat cell differentiation in vitro, where 11 genes were novel. Of the latter JARID2 stood out as being necessary for formation of healthy fat cell metabolic phenotype by regulating expression of multiple fat cell phenotype-specific genes.
This is an Open Access article distributed under the terms of the Creative Commons Attribution-NonCommercial-NoDerivs licence (http://creativecommons.org/licenses/by-nc-nd/4.0/), which permits non-commercial reproduction and distribution of the work, in any medium, provided the original work is not altered or transformed in any way, and that the work is properly cited. For commercial re-use, please contact [email protected]
Dow
nloaded from https://academ
ic.oup.com/endo/article/162/7/bqab096/6272286 by guest on 09 January 2022
2 Endocrinology, 2021, Vol. 162, No. 7
Conclusion: This comprehensive RNAi screening in hASC suggests that a large pro-portion of WAT TFs that are impacted by metabolic conditions might be important for hyperplastic adipose tissue expansion. The screen also identified JARID2 as a novel TF essential for the development of functional adipocytes.
Key Words: obesity, insulin resistance, RNAi, human adipose-derived stem cells, adipogenesis, RNAseq, JARID2
White adipose tissue (WAT) can expand by increase in size of existing adipocytes (hypertrophy) or by number of adi-pocytes (hyperplasia) (1). Fat tissue morphology resulting from the balance between hypertrophic and hyperplastic expansion within an individual has a profound impact on metabolic health (1). Expansion through hyperplasia associates with a benign metabolic phenotype, while ex-pansion through hypertrophy promotes obesity-associated metabolic complications (2). Hyperplasic adipose tissue ex-pansion is mediated by several adipogenic events including recruitment, proliferation, and/or differentiation of new fat cells, whereas hypertrophic expansion mainly is governed by size increase of already present adipocytes (1).
Adipogenesis is controlled by a large network of TFs that regulate phenotypic transition of adipose tissue mes-enchymal stem cells to mature adipocytes (3). The differen-tiation cascade can be divided into at least 2 waves of TFs that drive the adipogenesis. The first wave activates sev-eral early adipogenic factors including C/EBP β/δ, KLFs, CREB, and SREBP-1c (4-10). Such TFs, in turn, induce ex-pression/recruitment of the second wave of TFs, of which peroxisome proliferator-activated receptor γ (PPARγ) and C/EBPα are the key players that lead toward the mature adipocyte phenotype (11-13). Apart from these TFs which promote adipogenesis, there are secreted factors and TFs—WNT10b, GATA factors 2 and 3, KLFs 2 and 7—which inhibit fat cell differentiation and guide mesenchymal stem cells to different lineages (14, 15). Therefore, a balance be-tween positive and negative regulation is necessary to have a controlled effect on adipogenesis and adipocyte metab-olism (15).
It has been shown that 10% of adipocytes are renewed each year throughout adulthood (16) suggesting that adipogenesis continues throughout life. Adipocyte differen-tiation is known to be affected by WAT metabolic conditions such as obesity, insulin resistance (IR), and morphology (17-21), which is often also associated with the changes in transcriptional program (22-29). For example, PPARγ is downregulated while NFAT5 and HIF-1α are upregulated during obesity and IR (22-24); cancer cachexia, character-ized by high lipid mobilization and loss of both adipose tissue and muscle mass, is associated with reduction in ex-pression of C/EBP α, C/EBP β, PPARγ, and SREBP-1c in WAT (25); furthermore, reduced EBF1 levels cause adipose
hypertrophy (30). Taken together, adverse WAT metabolic conditions can result in or be dependent on impairment not only in the lipid and glucose metabolism, but also in altered transcriptional program regulating adipogenesis.
Although adipogenesis is a well-studied process, espe-cially in murine in vitro systems, systemic investigations of human adipocyte TFs impacted by metabolic conditions have not yet been reported. Our hypothesis was that altered fat cell function in such conditions was dependent on fluc-tuations in the expression of TFs regulating adipogenesis. RNA interference (RNAi) screening is a powerful tool for identification of functional genes. To our knowledge, only 2 previous studies used RNAi screens to identify fac-tors that regulate human adipogenesis (31, 32). In the first study, the focus was to find druggable protein targets af-fecting adipogenesis and the complete list of screen hits was not published. In the second study, the osteosarcoma cell line U2OS was employed to identify the small set of genes that work via PPARG. In this current study, we used RNAi screening in human primary adipose-derived stem cells (hASC) to identify TFs that are regulated by meta-bolic conditions in human WAT and that would affect fat cell differentiation. The role of a novel hit gene, JARID2, (Jumonji And AT-Rich Interaction Domain Containing 2), in adipogenesis was validated in some detail.
Methods
Human Cohorts
We re-investigated published global gene expression arrays in subcutaneous WAT (scWAT) from 4 different cohorts. The regional ethics board approved all studies and the donors gave their written informed consent. The first co-hort consists of 30 obese (body mass index [BMI] > 30 kg/m2) and 26 nonobese (BMI < 30 kg/m2) metabolically well-characterized women described previously (33). All women were of Caucasian origin, premenopausal, and free from any medication. Global gene expression from scWAT was used to select genes that were regulated by obesity (obese/nonobese) defined by false discovery rate (FDR) < 5%. Data from the 26 nonobese women from the same co-hort were used for picking genes regulated by morphology (hyperplasia/hypertrophy) as described in (30).
Dow
nloaded from https://academ
ic.oup.com/endo/article/162/7/bqab096/6272286 by guest on 09 January 2022
Endocrinology, 2021, Vol. 162, No. 7 3
The second cohort comprises 27 gastrointestinal cancer patients with (n = 13; 10 men and 3 women) or without (n = 14; 9 men and 5 women) cachexia (34). Cancer cachexia was defined as gastrointestinal cancer with self-reported unintentional weight loss of >5% of the habitual weight during last 3 months or >10% unintentional weight loss during last 6 months. Results from global gene expres-sion profiles of abdominal scWAT were used to define genes regulated by cancer cachexia (cachexia/control) as a proxy of weight loss using FDR < 5% as a cutoff (34).
The third cohort, which consists of 21 insulin-sensitive obese and 18 insulin-resistant obese women was used to find genes regulated by IR as described in (35). To define genes regulated by IR (insulin resistant/insulin sensitive) data from global gene expression profiles were used with ± 20% fold change and P < 0.05 as selection criteria.
The fourth cohort included 15 nonobese and 61 obese women, where purified subcutaneous adipocytes were avail-able (36). These samples were used to examine JARID2 ex-pression and correlate it to WAT morphology value.
Cell Culture
hASC were isolated from subcutaneous adipose tissue of a male donor (16 years old, BMI 24kg/m2), expanded and differentiated in vitro into adipocytes as previously de-scribed (37).
RNAi Screening Procedure
Confluent hASC were trypsinized and reverse transfec-tion was performed using an automated setup (Multidrop dispenser, Thermo Fisher Scientific, Waltham, MA USA) and BioMek plate aspirator/washer (Beckman Coulter, Indianapolis, IN, USA) in 96-well plates. Dharmafect3 transfection reagent (0.35 μL) (GE Healthcare Dharmacon Inc, Lafayette, CO, USA) was mixed with a specific small interfering RNA (siRNA) pool (ON-Target plus, GE Healthcare Dharmacon Inc), reaching a final concentration in cell culture media of 50nM. After 20 minutes of incuba-tion, 10 000 cells in proliferation medium were added to each well in a 96-well plate. A full list of siRNAs containing the order numbers and sequences of the 148 selected tran-scriptional regulators, nontargeting siRNA (Negative Control) pool, and siRNA targeting the known adipogenic TFs, such as PPARG and CEBPA, are given in Supplemental Table 1 (38). Each siRNA pool was run in triplicate. PPARG (n = 3) and nontargeting control (n = 6) were included on each test plate (in total 9 plates were utilized for 1 screen). At 24 hours after transfection, medium was changed to dif-ferentiation medium and the cells differentiated until day 9
as previously described (37). In addition to the 148 siRNAs used in the screen, siRNA targeting glucocorticoid receptor (GR) was used for optimization experiments (Supplemental Table 1) (38).
Neutral Lipid and Nuclei Staining
At day 9 of differentiation, cells were washed, fixed using 4% paraformaldehyde (PFA) and stained for neutral lipids (Bodipy 493/503, Molecular Probes, Thermo Fisher Scientific), cell nuclei (Hoechst 33342, Molecular Probes, Thermo Fisher Scientific) and quantified as previously de-scribed (39).
Data Normalization and Hit Identification in RNAi Screens
Data were normalized within each plate based on cell number and lipid accumulation in 6 negative control wells as previously described (40). For hit identification, the normalized values from each screen were used to calculate the Strictly Standardized Mean Difference (SSMD) = μ i- μ N/√s2
i+s2N where μ i and si are sample mean and variance
of each siRNA and μ N and sN are sample mean and vari-ance of the negative control per plate (41). The values and SSMD from each screen were put together to produce a mean outcome from both screens. To interpret the size of siRNA effects the following SSMD-based classification was used: ≥5 extremely strong, 5> to ≥3 very strong, 3> to ≥2 strong, 2> to ≥1.645 fairly strong, 1.645> to ≥1.28 mod-erate, 1.28> to ≥1 fairly moderate, 1> to ≥0.75 fairly weak, 0.75> to >0.5 weak, 0.5≥ to >0.25 very weak, and 0.25≥ to >0 extremely weak.
siRNA Transfections With Electroporation
Selected hits were verified using the Neon electropor-ation system (Invitrogen, Thermo Fisher Scientific) as transfection method. Parameters of 1600V/20ms pulse and 10 μL or 100 μL electroporation tips were used to transfect 1 × 10⁵ or 106 cells, respectively. Final concentration of 4nM siRNA was used for 10 μL and 20nM for 100 μL tips. After electroporation, cells were seeded in a proliferation media without FGF2 in a density of 40 000 cells/cm2. Differentiation was induced 24 hours posttransfection and cells were dif-ferentiated as previously described (37). To verify specificity of targeting in the RNAi screens, 1 or 2 dif-ferent siRNAs from Ambion (Silencer select, Thermo Fisher Scientific) were used for validation experiments (Supplemental Table 2) (38).
Dow
nloaded from https://academ
ic.oup.com/endo/article/162/7/bqab096/6272286 by guest on 09 January 2022
4 Endocrinology, 2021, Vol. 162, No. 7
RNA Isolation and Quantitative Reverse Transcription–Polymerase Chain Reaction
Total RNA from hASC was extracted either with RNAeasy Micro Kit (Qiagen, Hilden, Germany) (96-well plates) or nucleospin RNA Macherey Nagel kit (Macherey Nagel, Duren, Germany) (24-well plates) according to the manufacturer’s recommendation. The cDNA from total 50ng of RNA was prepared using iScript cDNA synthesis kit (Bio-Rad, Hercules, CA). Quantitative reverse transcrip-tion–polymerase chain reaction (RT-qPCR) was run on CFX96 Touch detection system (Bio-Rad). Taqman probes (Thermo Fisher Scientific) were used for quantification of CEBPA (Hs00269972.s1), NR3C1 (Hs00353740_m1) and JARID2 (Hs00192089_m1) (in differentiation kinetics ex-periment), whereas Sybr primers were utilized for the rest of the genes (sequences are listed in Supplemental Table 3) (38). Expression of mRNA was normalized to 18S ribo-somal RNA using the ΔΔCt –method (42).
Nuclear Protein Extraction
Nuclei were first isolated from the cells and then nuclear proteins were extracted using RIPA buffer (Thermo Fischer Scientific), as described previously in (43, 44). The protein concentrations were measured using Pierce BCA Protein Assay Kit (Pierce, Thermo Fischer Scientific) according to the manufacturer’s instructions.
Western Blot
For protein detection, 15 μg of nuclear protein was separ-ated on a 12% SDS-PAGE gel (Bio-Rad) and transferred to a polyvinyl difluoride membrane (GE Healthcare). The membrane was blocked in 3% ECL Advance blocking agent (GE Healthcare) and incubated with primary anti-bodies against JARID2 (D6M9X, 1:500 dilution, Cell Signaling Technology Danvers, MA, USA Cat# 13594, RRID:AB_2798269 (45)). Secondary anti-rabbit HRP anti-body was used at 1:10 000 (Sigma-Aldrich, St. Louis, MO, USA, Cat# A0545, RRID:AB_257896 (46)). The proteins were visualized by chemiluminescence using Amersham ECL Select Western Blotting Detection Reagent (GE Healthcare), ChemiDoc XRS+ system and Quantity One Software (Bio-Rad). Protein quantification was performed by Image lab software (Bio-Rad). JARID2 values were normalized to total nuclear proteins per lane (Supplemental Fig. 1) (38).
RNAseq
Total RNA from in vitro differentiated hASC was sub-jected to quality control with Agilent Tapestation (Agilent
Technologies Inc. Santa Clara, CA, USA) according to the manufacturer’s instructions. Libraries were constructed using Illumina TruSeq stranded mRNA sample prepar-ation protocol according to manufacturer instructions (Illumina, San Diego, CA, USA). The yield and quality of the amplified libraries were analyzed using Qubit (Thermo Fisher Scientific) and the Agilent Tapestation (Agilent). The indexed cDNA libraries were normalized, combined, and the pools were sequenced on the Illumina Nextseq 550 (Illumina) for a 75-cycle v2 sequencing run generating 75bp single-end reads. Sample demultiplexing was per-formed using bcl2fastq (v2.20.0). Sample quality was as-sessed using FastQC (v0.11.8) and MultiQC (v1.7). Reads were aligned to a reference built from Ensembl GRCh38 genome sequences using STAR (v2.6.1d). Counts for each gene were obtained by featureCounts (v1.5.1) using the GRCh38.99 GTF file from Ensembl. Bioconductor package DESEq2 was used for count normalization and sample group comparisons, generating log2 fold changes, Wald test P values and P values adjusted for multiple testing (Benjamini-Hochberg method). RNAseq data are accessible on GEO with the accession number GSE164413 (reviewer token ctonmgksrjqpdwz).
Glycerol Release and Stimulated Lipolysis
Cell culture medium (48 hours conditional media) was col-lected on day 9 of hASC differentiation and glycerol release as a measure of basal lipolysis was assessed and normalized as previously described (39). Stimulated lipolysis (also meas-ured by glycerol release) was determined in control and isoprenaline-treated (1μM) samples on day 13 of differen-tiation as described previously (39, 47, 48), except that in-sulin was removed from cell culture media 24 hours before the experiment. During lipolysis, fats (mainly triglycerides) in the lipid droplet of fat cells are broken down to glycerol and fatty acids, which are released from the cells. Glycerol is a more accurate lipolysis measure than fatty acids as it is not re-utilized to an important extent by the fat cells.
Total Glucose Uptake
Insulin (100nM)-stimulated and basal glucose uptake in hASC was assessed on day 13 of differentiation as previ-ously described (49). Glucose uptake was normalized to protein amount in each cell culture well measured by BCA assay.
Pathway Analysis
Ingenuity Pathway Analysis (IPA) software (Ingenuity Systems, QIAGEN, http://www.ingenuity.com) was
Dow
nloaded from https://academ
ic.oup.com/endo/article/162/7/bqab096/6272286 by guest on 09 January 2022
Endocrinology, 2021, Vol. 162, No. 7 5
used to determine the upstream regulators in RNAseq experiments and for canonical pathway analysis in the screening.
Statistical Analysis
The data were tested for normal distribution with the Shapiro-Wilk test. If the criteria for normal distribution were fulfilled, 1-way analysis of variance (ANOVA) with subsequent Bonferroni correction post hoc test was util-ized. If only 2 groups were compared, Student’s t-test was used. When the criteria for normal distribution were not achieved, the nonparametric Kruskal-Wallis and Mann-Whitney pair-wise comparison tests were applied. Pearson test was used to correlate normally distrib-uted measures (JARID2 expression with adipose tissue morphology, glycerol release with number of differenti-ated cells) and Spearman test was used to correlate the results from 2 screens. The level of statistical signifi-cance was set as 0.05 with *P < 0.05, **P < 0.01 and ***P < 0.001. IBM SPSS Statistics 22 software (SPSS, Chicago, IL, USA) or GraphPad Prism version 7 and 9 (GraphPad Software, La Jolla, California, USA) were used for statistical analysis. As regards power calcula-tion we focused on the published microarrays and used the method by Liu and Hwang (50) to determine the ap-propriate sample size for such experiments. Assuming that significant differences in gene expression between the 2 studied groups were defined with a false discovery rate (FDR) of 5%, the proportion of non-differentially expressed genes between groups was 0.95. Assuming a standard deviation for effect size of 1, a population con-sisting of 2 groups composed of 15 subjects each yields a power of approximately 90% to detect differentially expressed genes. This is close to the actual number of 13 cachectic and 14 weight stable patients used in the smallest of the examined groups (Cohort 2).
Results
Performing RNAi Screen for Adipogenesis-Regulating TFs
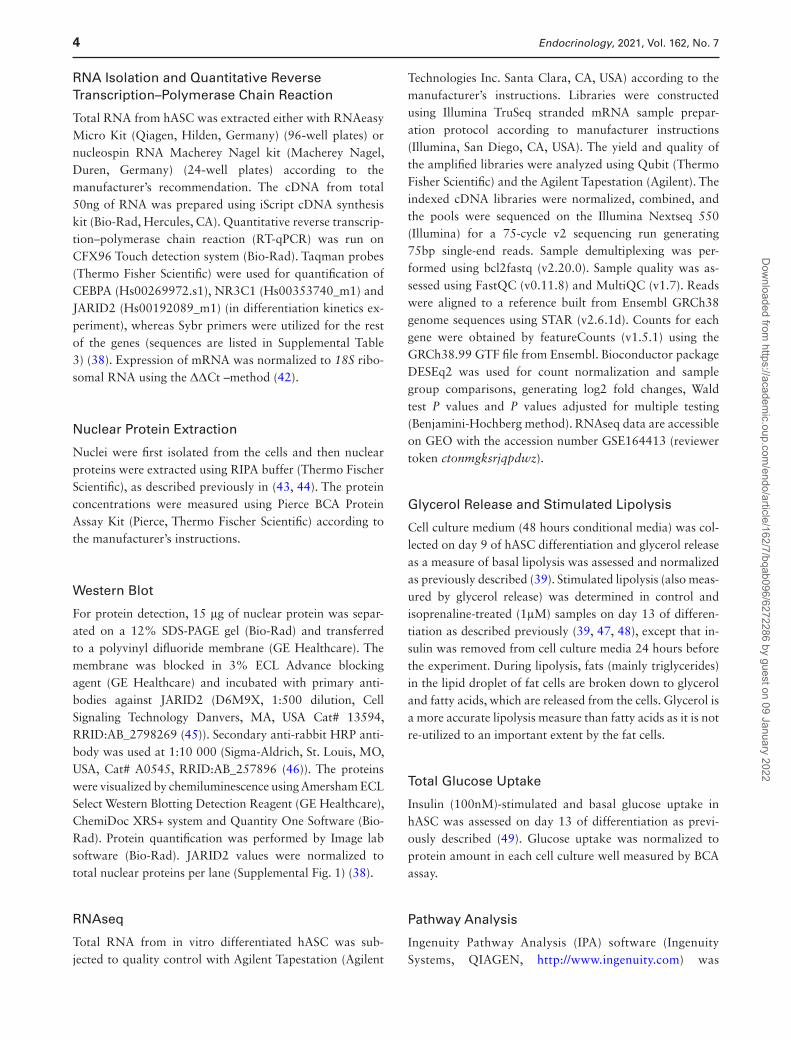
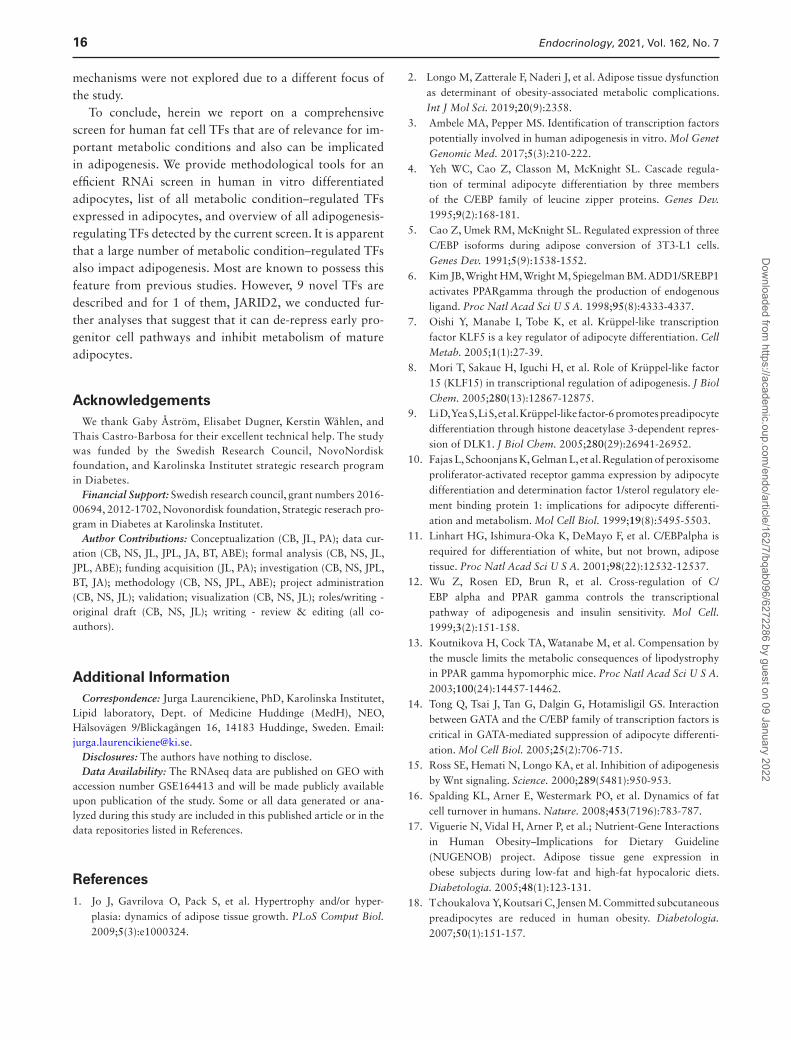
To screen for adipogenesis-regulating TFs affected by metabolic conditions, we selected genes present in the Dharmacon siRNA TF library (n = 1530) and influ-enced by adipose tissue metabolic status in our previ-ously described cohorts. We found that 115 TFs were regulated by obesity (33), 16 by cancer cachexia (34), 24 by IR (35), and 20 by adipose tissue morphology (30). Thereafter we utilized previously published FANTOM5 CAGE data (51) to verify if selected TFs are expressed at
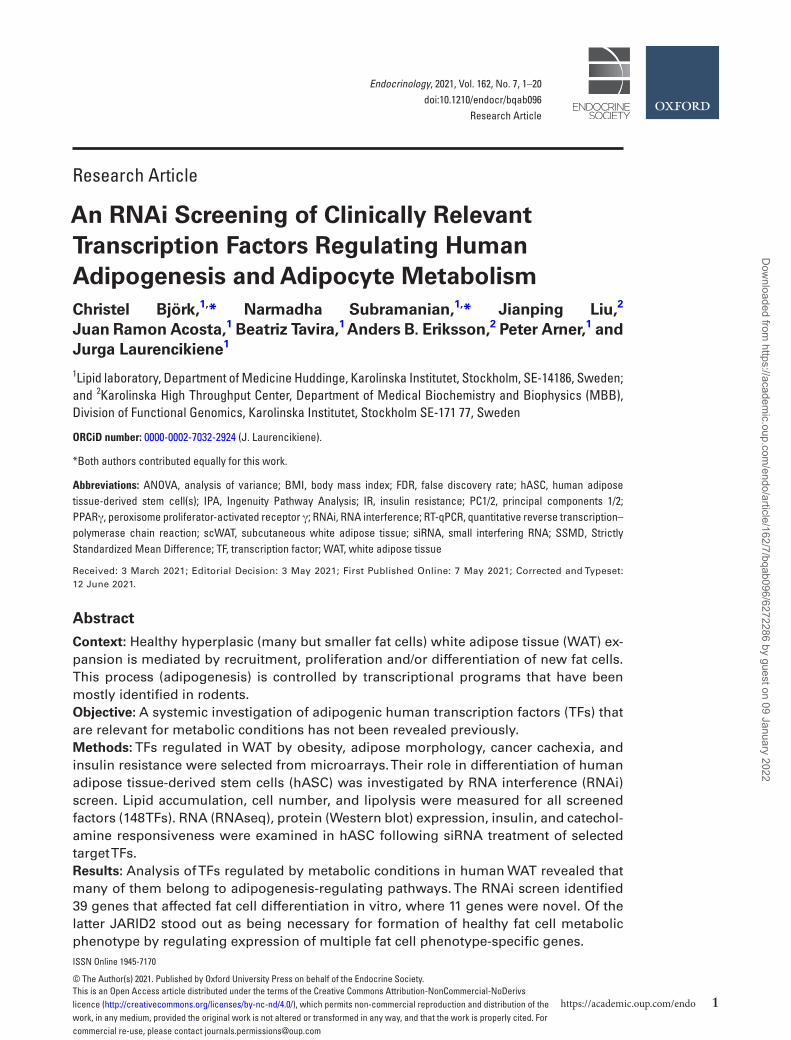
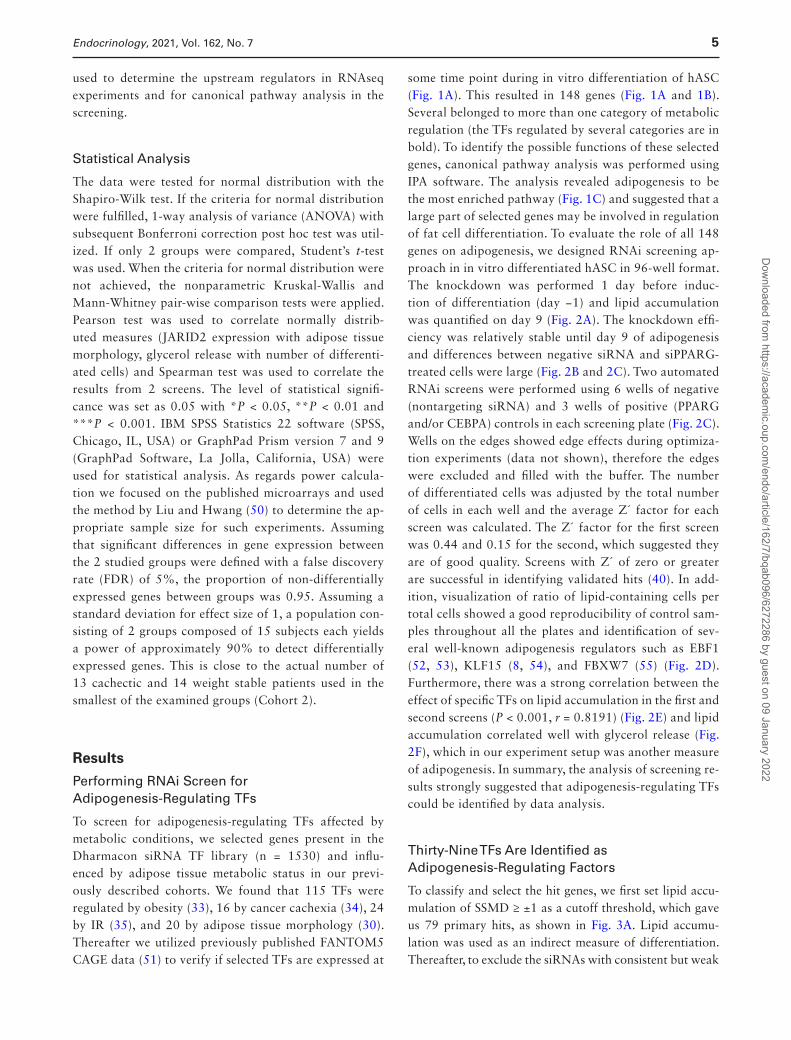
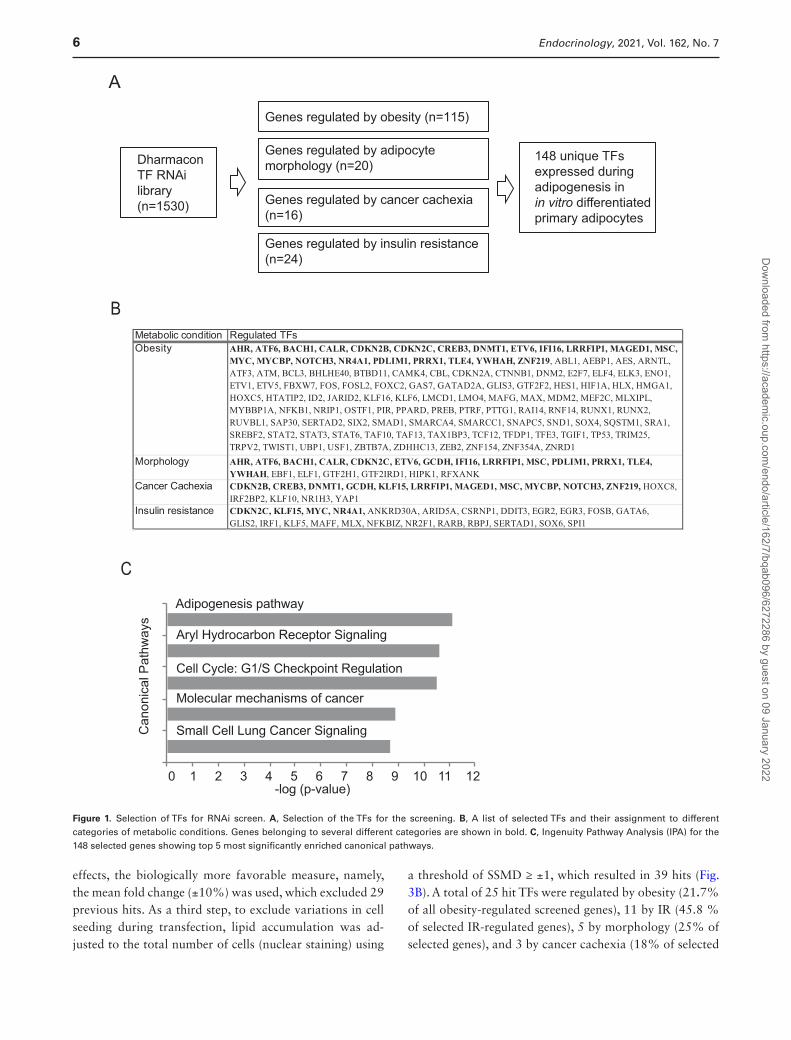
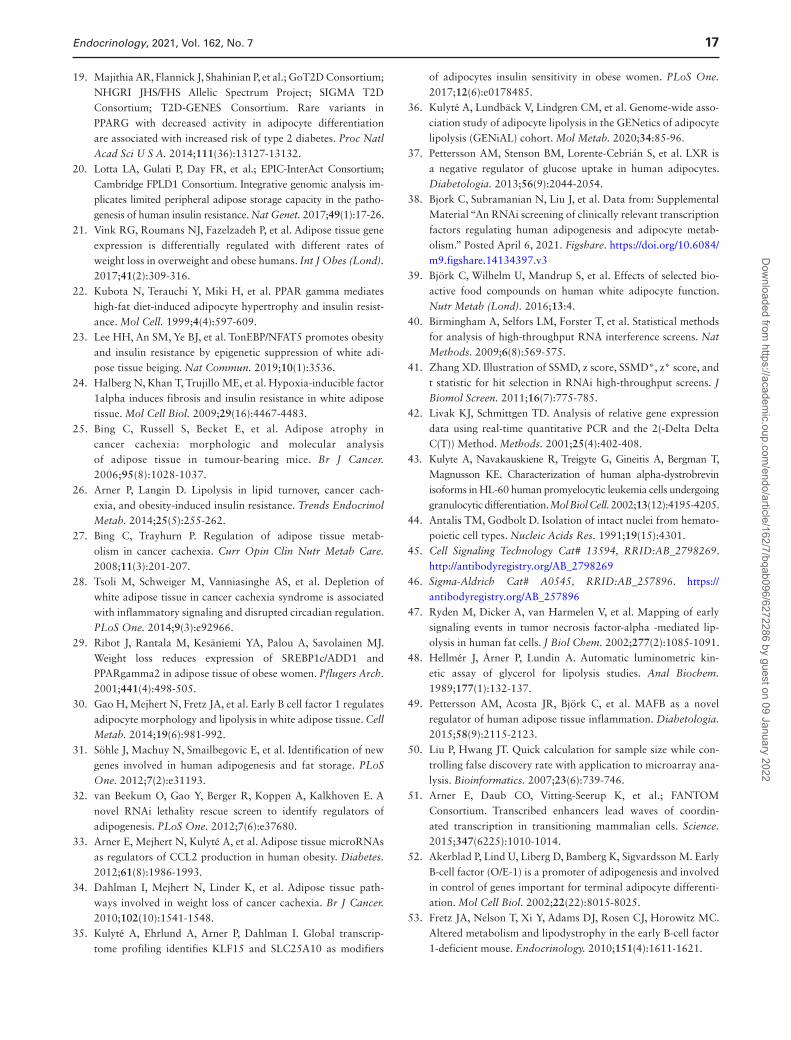
some time point during in vitro differentiation of hASC (Fig. 1A). This resulted in 148 genes (Fig. 1A and 1B). Several belonged to more than one category of metabolic regulation (the TFs regulated by several categories are in bold). To identify the possible functions of these selected genes, canonical pathway analysis was performed using IPA software. The analysis revealed adipogenesis to be the most enriched pathway (Fig. 1C) and suggested that a large part of selected genes may be involved in regulation of fat cell differentiation. To evaluate the role of all 148 genes on adipogenesis, we designed RNAi screening ap-proach in in vitro differentiated hASC in 96-well format. The knockdown was performed 1 day before induc-tion of differentiation (day −1) and lipid accumulation was quantified on day 9 (Fig. 2A). The knockdown effi-ciency was relatively stable until day 9 of adipogenesis and differences between negative siRNA and siPPARG-treated cells were large (Fig. 2B and 2C). Two automated RNAi screens were performed using 6 wells of negative (nontargeting siRNA) and 3 wells of positive (PPARG and/or CEBPA) controls in each screening plate (Fig. 2C). Wells on the edges showed edge effects during optimiza-tion experiments (data not shown), therefore the edges were excluded and filled with the buffer. The number of differentiated cells was adjusted by the total number of cells in each well and the average Z´ factor for each screen was calculated. The Z´ factor for the first screen was 0.44 and 0.15 for the second, which suggested they are of good quality. Screens with Z´ of zero or greater are successful in identifying validated hits (40). In add-ition, visualization of ratio of lipid-containing cells per total cells showed a good reproducibility of control sam-ples throughout all the plates and identification of sev-eral well-known adipogenesis regulators such as EBF1 (52, 53), KLF15 (8, 54), and FBXW7 (55) (Fig. 2D). Furthermore, there was a strong correlation between the effect of specific TFs on lipid accumulation in the first and second screens (P < 0.001, r = 0.8191) (Fig. 2E) and lipid accumulation correlated well with glycerol release (Fig. 2F), which in our experiment setup was another measure of adipogenesis. In summary, the analysis of screening re-sults strongly suggested that adipogenesis-regulating TFs could be identified by data analysis.
Thirty-Nine TFs Are Identified as Adipogenesis-Regulating Factors
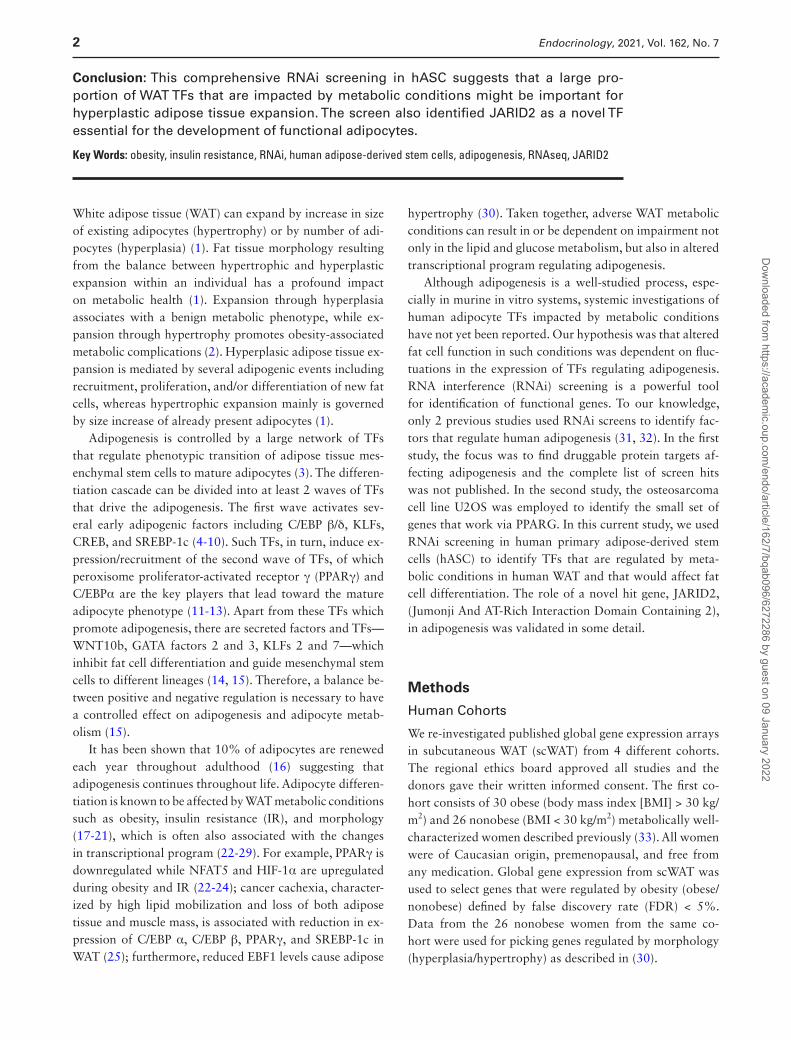
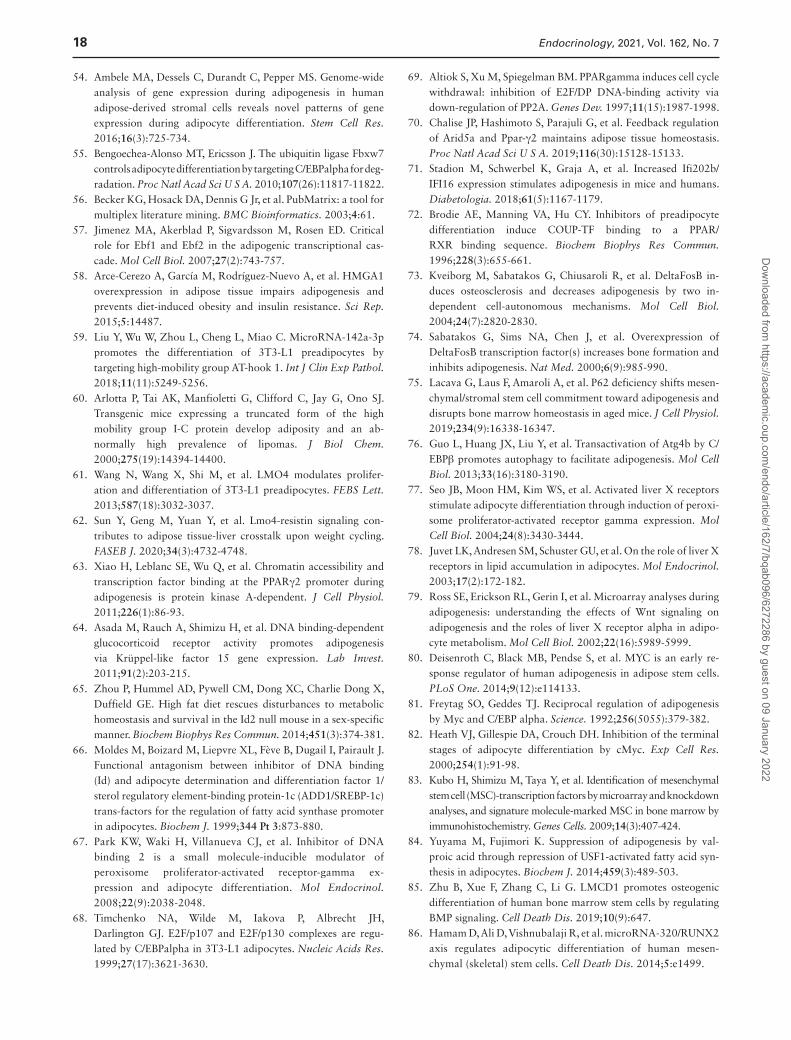
To classify and select the hit genes, we first set lipid accu-mulation of SSMD ≥ ±1 as a cutoff threshold, which gave us 79 primary hits, as shown in Fig. 3A. Lipid accumu-lation was used as an indirect measure of differentiation. Thereafter, to exclude the siRNAs with consistent but weak
Dow
nloaded from https://academ
ic.oup.com/endo/article/162/7/bqab096/6272286 by guest on 09 January 2022
6 Endocrinology, 2021, Vol. 162, No. 7
effects, the biologically more favorable measure, namely, the mean fold change (±10%) was used, which excluded 29 previous hits. As a third step, to exclude variations in cell seeding during transfection, lipid accumulation was ad-justed to the total number of cells (nuclear staining) using
a threshold of SSMD ≥ ±1, which resulted in 39 hits (Fig. 3B). A total of 25 hit TFs were regulated by obesity (21.7% of all obesity-regulated screened genes), 11 by IR (45.8 % of selected IR-regulated genes), 5 by morphology (25% of selected genes), and 3 by cancer cachexia (18% of selected
Aryl Hydrocarbon Receptor Signaling
Cell Cycle: G1/S Checkpoint Regulation
Molecular mechanisms of cancer
Small Cell Lung Cancer Signaling
DharmaconTF RNAilibrary(n=1530)
Genes regulated by obesity (n=115)
Genes regulated by insulin resistance(n=24)
Genes regulated by cancer cachexia (n=16)
148 unique TFs expressed during adipogenesis inin vitro differentiated primary adipocytes
Adipogenesis pathway
-log (p-value)
Can
onic
al P
athw
ays
A
B
0 1 2 3 4 5 6 7 8 9 10 11 12
C
Metabolic condition Regulated TFsObesity AHR, ATF6, BACH1, CALR, CDKN2B, CDKN2C, CREB3, DNMT1, ETV6, IFI16, LRRFIP1, MAGED1, MSC,
MYC, MYCBP, NOTCH3, NR4A1, PDLIM1, PRRX1, TLE4, YWHAH, ZNF219, ABL1, AEBP1, AES, ARNTL,ATF3, ATM, BCL3, BHLHE40, BTBD11, CAMK4, CBL, CDKN2A, CTNNB1, DNM2, E2F7, ELF4, ELK3, ENO1, ETV1, ETV5, FBXW7, FOS, FOSL2, FOXC2, GAS7, GATAD2A, GLIS3, GTF2F2, HES1, HIF1A, HLX, HMGA1, HOXC5, HTATIP2, ID2, JARID2, KLF16, KLF6, LMCD1, LMO4, MAFG, MAX, MDM2, MEF2C, MLXIPL, MYBBP1A, NFKB1, NRIP1, OSTF1, PIR, PPARD, PREB, PTRF, PTTG1, RAI14, RNF14, RUNX1, RUNX2, RUVBL1, SAP30, SERTAD2, SIX2, SMAD1, SMARCA4, SMARCC1, SNAPC5, SND1, SOX4, SQSTM1, SRA1, SREBF2, STAT2, STAT3, STAT6, TAF10, TAF13, TAX1BP3, TCF12, TFDP1, TFE3, TGIF1, TP53, TRIM25, TRPV2, TWIST1, UBP1, USF1, ZBTB7A, ZDHHC13, ZEB2, ZNF154, ZNF354A, ZNRD1
Morphology AHR, ATF6, BACH1, CALR, CDKN2C, ETV6, GCDH, IFI16, LRRFIP1, MSC, PDLIM1, PRRX1, TLE4, YWHAH, EBF1, ELF1, GTF2H1, GTF2IRD1, HIPK1, RFXANK
Cancer Cachexia CDKN2B, CREB3, DNMT1, GCDH, KLF15, LRRFIP1, MAGED1, MSC, MYCBP, NOTCH3, ZNF219, HOXC8, IRF2BP2, KLF10, NR1H3, YAP1
Insulin resistance CDKN2C, KLF15, MYC, NR4A1, ANKRD30A, ARID5A, CSRNP1, DDIT3, EGR2, EGR3, FOSB, GATA6, GLIS2, IRF1, KLF5, MAFF, MLX, NFKBIZ, NR2F1, RARB, RBPJ, SERTAD1, SOX6, SPI1
Genes regulated by adipocyte morphology (n=20)
Figure 1. Selection of TFs for RNAi screen. A, Selection of the TFs for the screening. B, A list of selected TFs and their assignment to different categories of metabolic conditions. Genes belonging to several different categories are shown in bold. C, Ingenuity Pathway Analysis (IPA) for the 148 selected genes showing top 5 most significantly enriched canonical pathways.
Dow
nloaded from https://academ
ic.oup.com/endo/article/162/7/bqab096/6272286 by guest on 09 January 2022
Endocrinology, 2021, Vol. 162, No. 7 7
BCL3E2F
7
Neg C
CEBPA
MDM
2PIR
SMAD1
0
1000
2000
3000
Plate numbers
Lipi
d dr
ople
ts/c
ell
Adipogenesis screening
1 2 3 4 5 6 7 8 9
EBF1
FBXW7
KLF15
Negative controlsiPPARGsiCEBPA
B
C
A
siRNA reverse transfection with
1 2 3 4 5 6 7 8 9 10 11 12ABCDEFGH
cell seeding Quantification of lipid droplets and cell nuclei
Adipose-derivedstemcells, hASC Adipocytes
NegativeControl
siPPARG
BODIPY Hoechst Merged
-1 9Differentiation day
Day 1
Day 2
Day 5
day 7
day 9
0
2
4
6
8
Rea
ltive
mR
NA
expr
essi
onPPARG
ctrsiPPARG
Day 1
Day 2
Day 5
day 7
day 9
0.0
0.5
1.0
1.5
2.0
Rel
ativ
em
RN
Aex
pres
sion
GRctr
siGR
Day 1
Day 2
day 7
day 9
036
100
200
300
400
500
Rea
ltive
mR
NA
expr
essi
on
CEBPA
ctrsiCEBPA
D
500 1000 1500 2000 2500 30001000
1500
2000
2500
1st screen
2nd s
cree
n
Average bodipy objects
rho= 0.6454p < 0.0001
50 100 1500
50
100
150
200
Normalized bodipy objects
Nor
mal
ized
gly
cero
lrel
ease
r = 0.8413p < 0.0001
E F
****
*** ***
*** *** *****
***
***
**
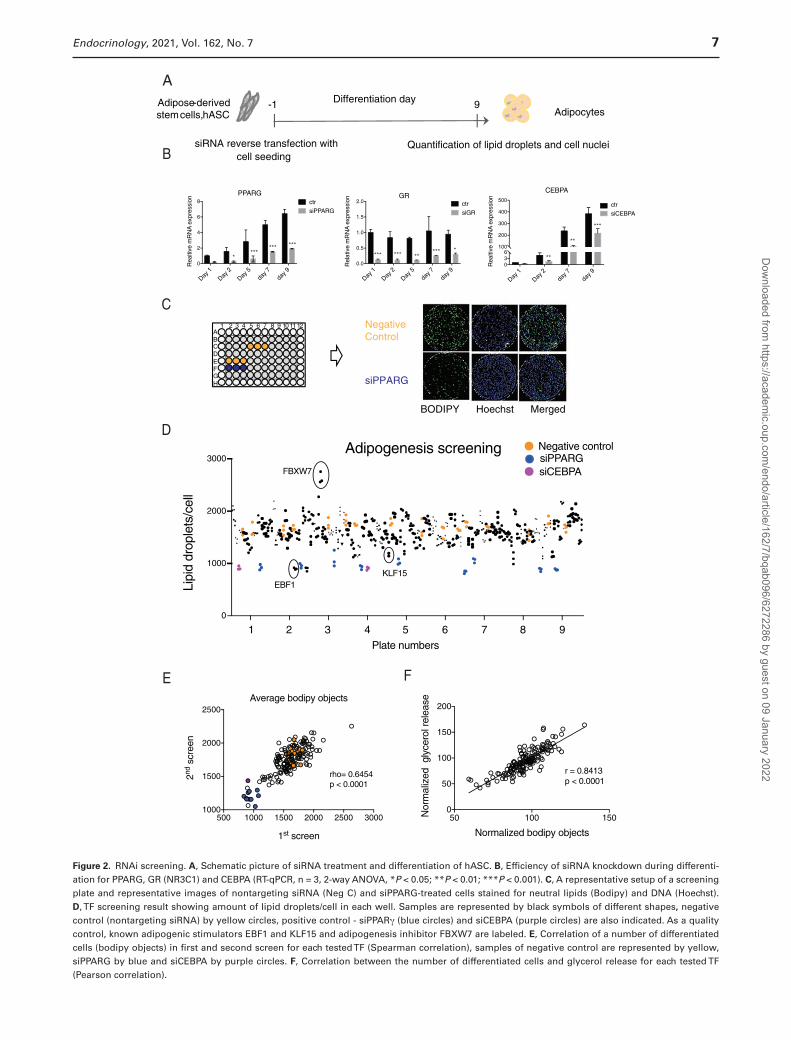
Figure 2. RNAi screening. A, Schematic picture of siRNA treatment and differentiation of hASC. B, Efficiency of siRNA knockdown during differenti-ation for PPARG, GR (NR3C1) and CEBPA (RT-qPCR, n = 3, 2-way ANOVA, *P < 0.05; **P < 0.01; ***P < 0.001). C, A representative setup of a screening plate and representative images of nontargeting siRNA (Neg C) and siPPARG-treated cells stained for neutral lipids (Bodipy) and DNA (Hoechst). D, TF screening result showing amount of lipid droplets/cell in each well. Samples are represented by black symbols of different shapes, negative control (nontargeting siRNA) by yellow circles, positive control - siPPARγ (blue circles) and siCEBPA (purple circles) are also indicated. As a quality control, known adipogenic stimulators EBF1 and KLF15 and adipogenesis inhibitor FBXW7 are labeled. E, Correlation of a number of differentiated cells (bodipy objects) in first and second screen for each tested TF (Spearman correlation), samples of negative control are represented by yellow, siPPARG by blue and siCEBPA by purple circles. F, Correlation between the number of differentiated cells and glycerol release for each tested TF (Pearson correlation).
Dow
nloaded from https://academ
ic.oup.com/endo/article/162/7/bqab096/6272286 by guest on 09 January 2022
8 Endocrinology, 2021, Vol. 162, No. 7
Insulinresistance
Morphology Cachexia
Obesity
A
B
D
1) Lipid accumulation comp to NegC;
SSMD ±1 (n=79)
2) Lipid accumulation 10% of NegC(n=50)
3) Lipid accumulation adj. for cell number comp to NegC; SSMD 1 (n=39)
C
E
±
0 2 4 6
Cell Cycle: G2/M DNA Damage Checkpoint Regulation
Adipogenesis pathway
Chronic Myeloid Leukemia Signaling
Bladder Cancer Signaling
Cell Cycle: G1/S Checkpoint Regulation
Aryl Hydrocarbon Receptor Signaling
-log(p-value)
Insulinresistance
CachexiaMorphology
Obesity
F G
EBF1
HMGA1TGIF1
DNM2LM
O4SOX4
ID2KLF
15IFI16FOS
TFDP1
NR2F1MYC
NR1H3
YWHAHHIPK1
SQSTM1USF1
JARID
2
LMCD1
KLF16
ARID5ABCL3
FOSB
NFKBIZGAS7
DDIT3
GATA6STA
T2
FBXW7
FOSL2
TCF12
GTF2F2
CDKN2AGCDH
EGR2ABL1
ANKRD30A
CSRNP1
0.5
1.0
1.5
Fold
cha
nge
Differentiated cells/total cells
GTF2F2
ETV1
ANKRD30A
ZNF219
WNT5A ATM
DNMT1ELF
1
SNAPC5GLIS
2
NOTCH3ETV6
ZNRD1
RNF14
SAP30KLF
5
HMGA1MAX
LRRFIP1
SPI1
FBXW7
0.5
1.0
1.5
Fold
cha
nge
Cell number
±
Ir
rphology Cachexi
sityyyyyyyyyyy
1 5
Insulresist
CachexiaMorphology
esity
0 1 2 3 4
DNA Double-Strand Break Repairby Homologous Recombination
Th1 and Th2 Activation Pathway
Th2 Pathway
Cell Cycle: G1/S CheckpointRegulation
DNA Methylation and Transcriptional Repression Signaling
Adipogenesis pathway
-log(p-value)
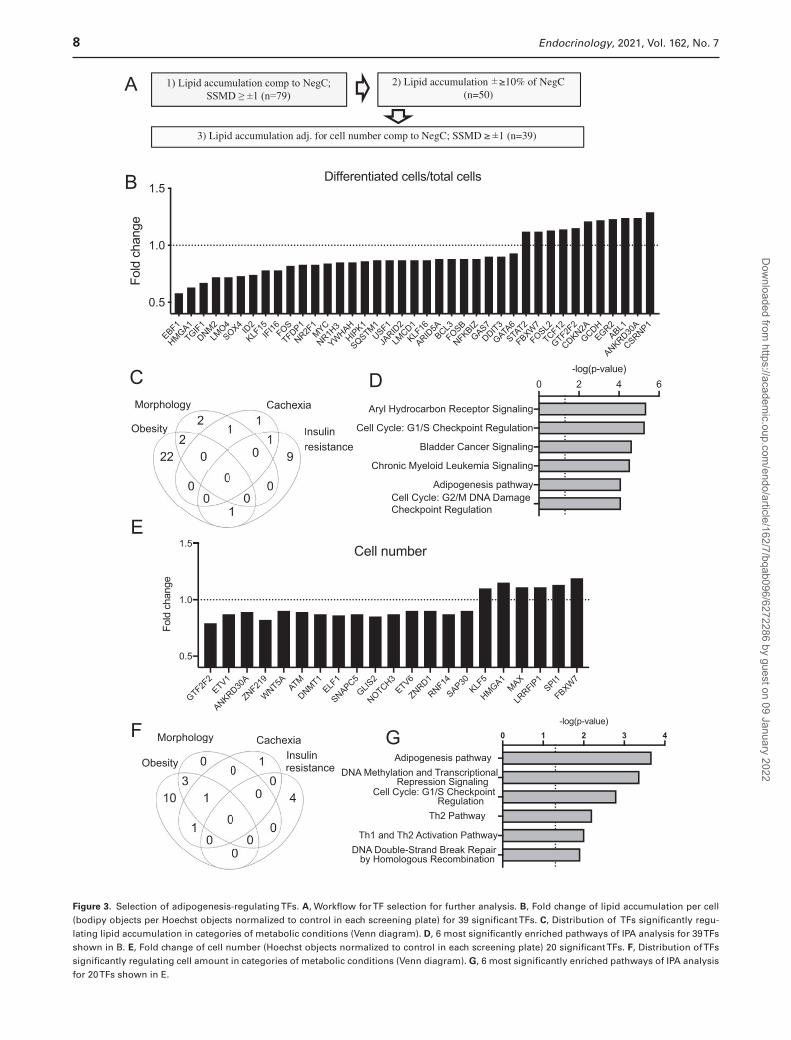
Figure 3. Selection of adipogenesis-regulating TFs. A, Workflow for TF selection for further analysis. B, Fold change of lipid accumulation per cell (bodipy objects per Hoechst objects normalized to control in each screening plate) for 39 significant TFs. C, Distribution of TFs significantly regu-lating lipid accumulation in categories of metabolic conditions (Venn diagram). D, 6 most significantly enriched pathways of IPA analysis for 39 TFs shown in B. E, Fold change of cell number (Hoechst objects normalized to control in each screening plate) 20 significant TFs. F, Distribution of TFs significantly regulating cell amount in categories of metabolic conditions (Venn diagram). G, 6 most significantly enriched pathways of IPA analysis for 20 TFs shown in E.
Dow
nloaded from https://academ
ic.oup.com/endo/article/162/7/bqab096/6272286 by guest on 09 January 2022
Endocrinology, 2021, Vol. 162, No. 7 9
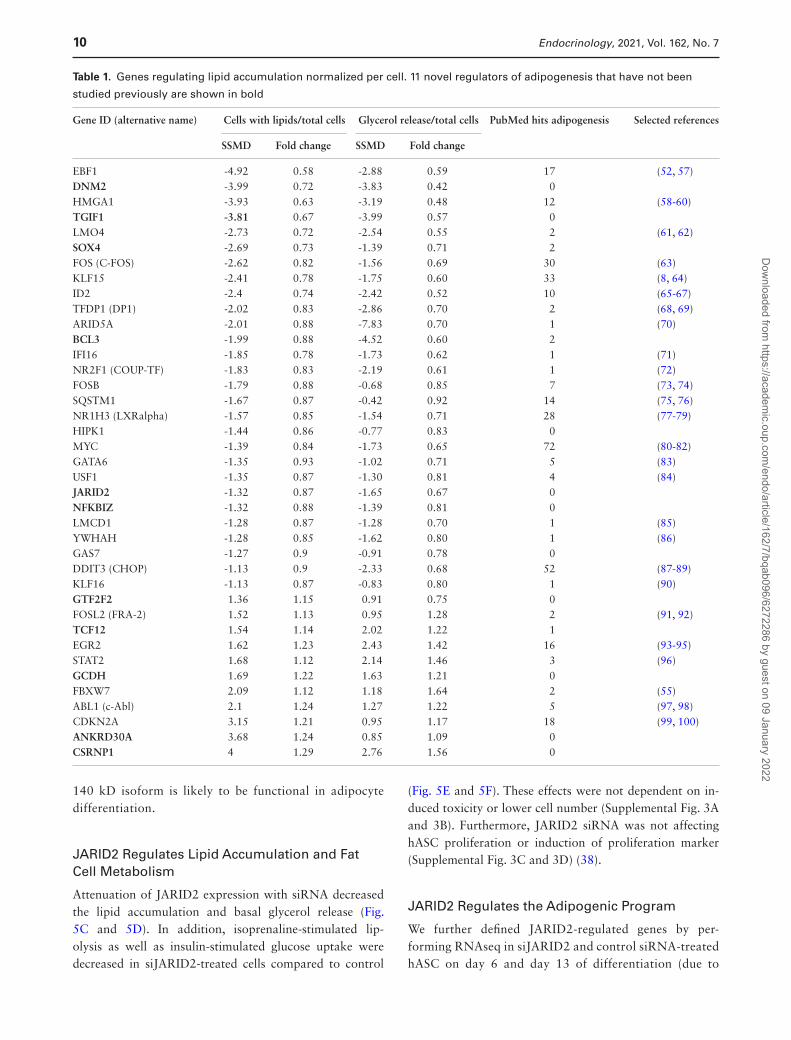
genes) (Fig. 3C). Among those, there were genes regulated by several conditions—2 by obesity and morphology, 1 by obesity and IR, 1 by cachexia and morphology, and 1 by cachexia and IR. Canonical pathway analysis of these 39 selected hits showed that adipogenesis was among the top 6 significantly regulated pathways. In addition, 2 cell cycle checkpoints were among most highly enriched pathways suggesting that cell cycle regulating TFs might have been affecting lipid accumulation in our screening setup (Fig. 3D). However, only 4 TFs among 39 hits were affecting cell numbers (with SSMD ≥ ±1 and 10% effect compared with nontargeting siRNA); GTF2F2 and ANKRD30A were decreasing cell number while HMGA1 and FBXW7 were increasing. The list of significantly enriched canonical path-ways included also several other adipogenesis-affecting pathways—PPARG, PDGF, Wnt/β-catenin, TGF-β, and FGF pathways (Supplemental Table 4) (38). Literature ana-lysis (Pubmatrix (56)) of these 39 hits revealed that many of the genes have been reported to regulate adipogenesis by earlier studies, but 11 genes were novel, with no reports on their function in adipogenic regulation (Table 1).
Twenty TFs Are Affecting hASC Cell Number
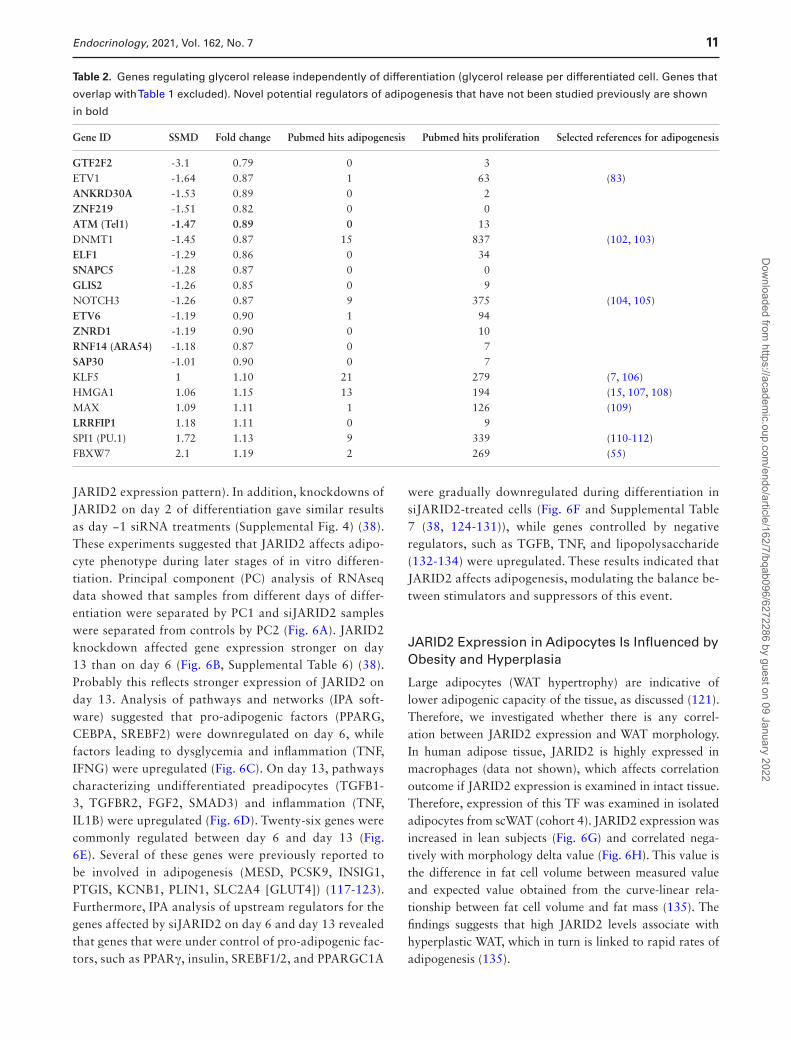
Enrichment of canonical pathways for adipogenesis-affecting TFs described above suggested that cell cycle regulation can be important for human adipocyte differ-entiation. In addition, previous reports indicated that ASCs need to re-enter cell cycle before releasing differentiation program (101), therefore we decided to investigate whether the screened TFs affect adipocyte cell number in vitro. In the analysis described above, the quantity of differen-tiated cells was normalized for total cell numbers; there-fore, TFs that affect cell number, but not differentiation/lipid accumulation efficiency, have been hidden the normal-ization. To reveal TFs possibly affecting cell proliferation, we performed the analysis of total cell numbers for each screened TF using the same cutoff as for quantification of differentiation (SSMD ≥ ±1 and 10% effect compared with nontargeting siRNA). This analysis identified 20 TFs that affected cell number in the RNAi screen (Fig. 3E and Table 2). The largest number (15) of these TFs were regulated by obesity, 4 by morphology, 3 by cancer cachexia and 4 by IR (Fig. 3F). Only for 8 out of 20 TFs, the role in adipogenesis regulation has been reported by previous studies, while al-most all of them (18/20) had a documented role in cell pro-liferation (Table 2). Interestingly, the adipogenesis pathway was the most significantly enriched pathway in IPA canon-ical pathway analysis while cell cycle regulation was a third one (Fig. 3G, Supplemental Table 5) (38). This strongly sug-gested that novel adipogenic regulators might be identified even by this analysis.
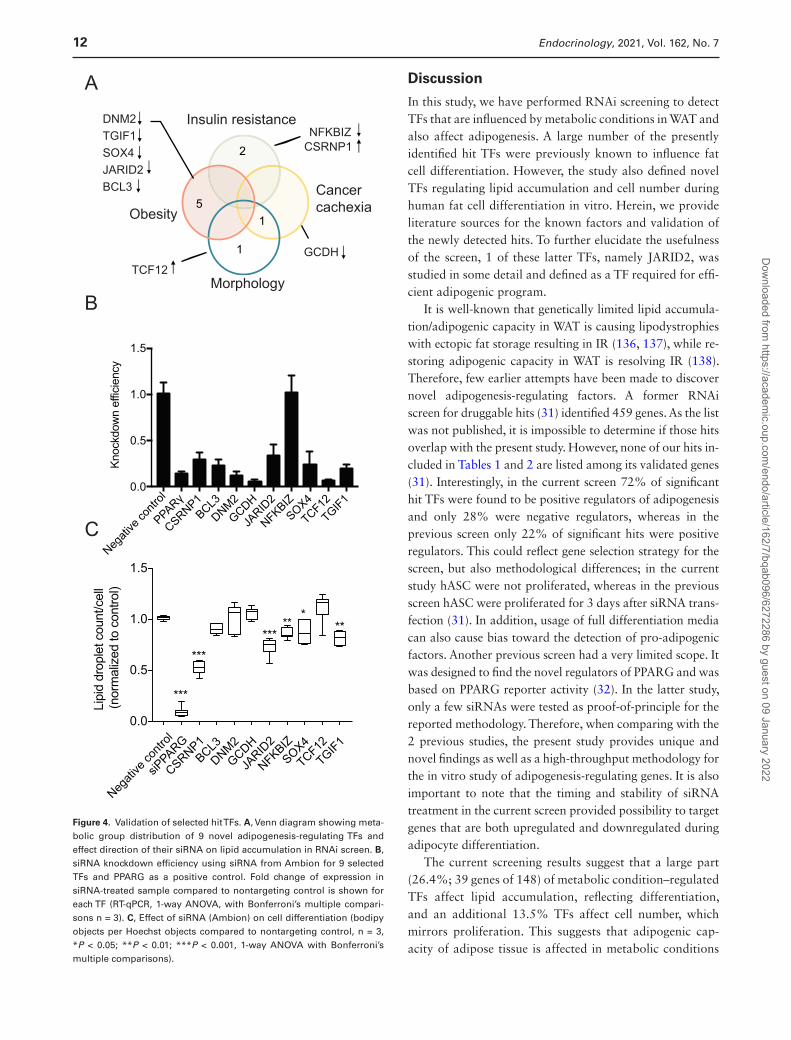
Validation of the Novel Hit TFs
To find novel hit TFs, regulating adipogenesis, we used a strict definition criteria, selecting TFs that (1) affected the percentage of differentiated cells in the screen and (2) which had not been previously reported to have a function in adipogenesis. Eleven such TFs were detected (Table 1, genes in bold). Among these genes, 2 genes (ANKRD30A and GTF2F2) had no significant effect on glycerol release and therefore were removed from further analysis. Most of these selected genes were regulated by obesity (5), 2 by IR, 1 by morphology, and 1 by cancer cachexia and morph-ology (Fig. 4A). Using siRNA from a different manufacturer (Ambion) and a different transfection method (electropor-ation), we have knocked down these 9 genes as well as PPARG to validate the effect on adipogenesis obtained by the RNAi screen. The knockdown was efficient and stable throughout differentiation (Supplemental Fig. 2A showing JARID2 suppression (38)) for all TFs except 1 (NFKBIZ) (Fig. 4B). The attenuation of TGIF1, SOX4, NFKBIZ, CSRNP1, and JARID2 expression resulted in significant re-duction of lipid accumulation. Strikingly, a knockdown of CSRNP1 using Ambion’s siRNA caused an opposite effect than siRNA from Dharmacon, suggesting possible off-target effects. Inhibition of JARID2 caused the most con-sistent and significant effect on lipid accumulation. JARID2 is a member of the Jumonji C (JmjC) and ARID domain protein family (113), which is essential for early embryonic development (114, 115), but its role in adipogenesis and fat cell function was unknown. Therefore, this gene was further validated.
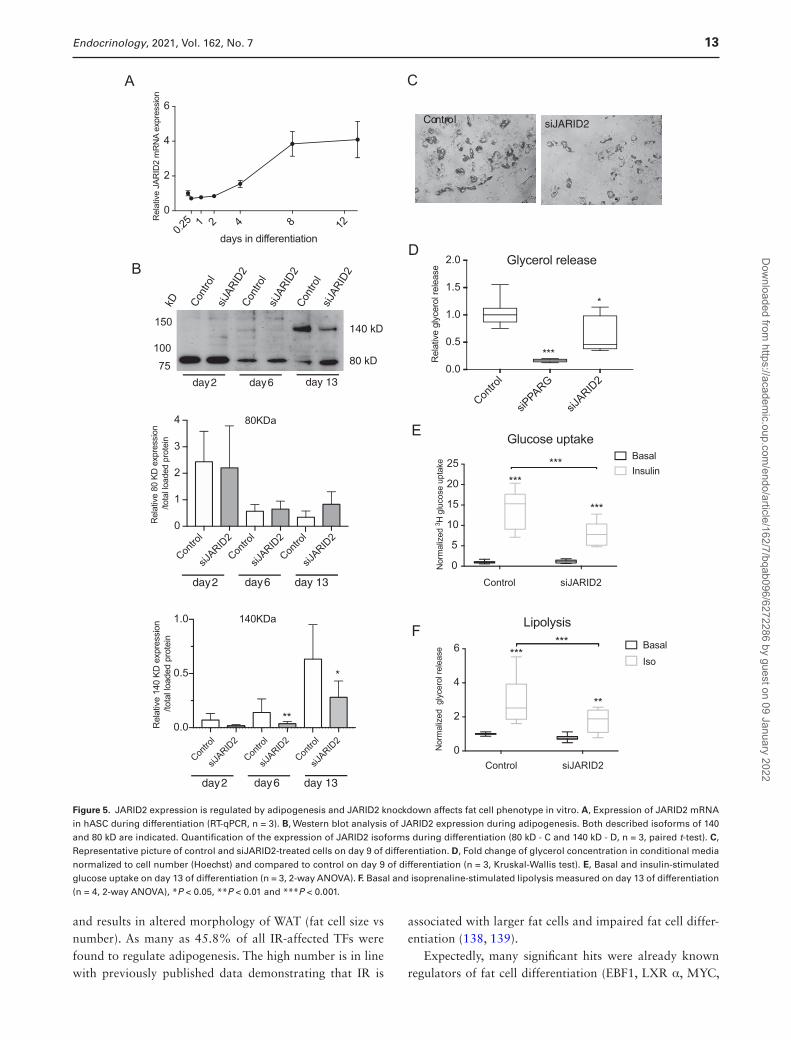
JARID2 Expression Is Regulated by Adipogenesis
JARID2 expression (RNA and protein) was examined during in vitro differentiation of human adipocytes. The mRNA expression of JARID2 increased between day 2 and 4 of adipogenesis and reached its maximum on day 8 (Fig. 5A). Western blot analysis detected 2 isoforms of JARID2 as described previously (116). Lower molecular weight isoform around 80kD was expressed from initial phase of adipogenesis (day 2), whereas the higher mo-lecular weight protein (around 140 kD) appeared only at later stage (day 6 and 13) (Fig. 5B). Image quantifi-cation showed that only the 140 kD isoform of JARID2 was downregulated by siRNA treatment (Fig. 5B), al-though 4 different oligonucleotides covering different re-gions of JARID2 sequence were used for the knockdown. Furthermore, only 1 transcription start site for JARID2 was found in hASC by CAGE analysis (Supplemental Fig. 2B) (38). Therefore, the observed 80 kD band could rep-resent unspecific binding of the antibody and that the
Dow
nloaded from https://academ
ic.oup.com/endo/article/162/7/bqab096/6272286 by guest on 09 January 2022
10 Endocrinology, 2021, Vol. 162, No. 7
140 kD isoform is likely to be functional in adipocyte differentiation.
JARID2 Regulates Lipid Accumulation and Fat Cell Metabolism
Attenuation of JARID2 expression with siRNA decreased the lipid accumulation and basal glycerol release (Fig. 5C and 5D). In addition, isoprenaline-stimulated lip-olysis as well as insulin-stimulated glucose uptake were decreased in siJARID2-treated cells compared to control
(Fig. 5E and 5F). These effects were not dependent on in-duced toxicity or lower cell number (Supplemental Fig. 3A and 3B). Furthermore, JARID2 siRNA was not affecting hASC proliferation or induction of proliferation marker (Supplemental Fig. 3C and 3D) (38).
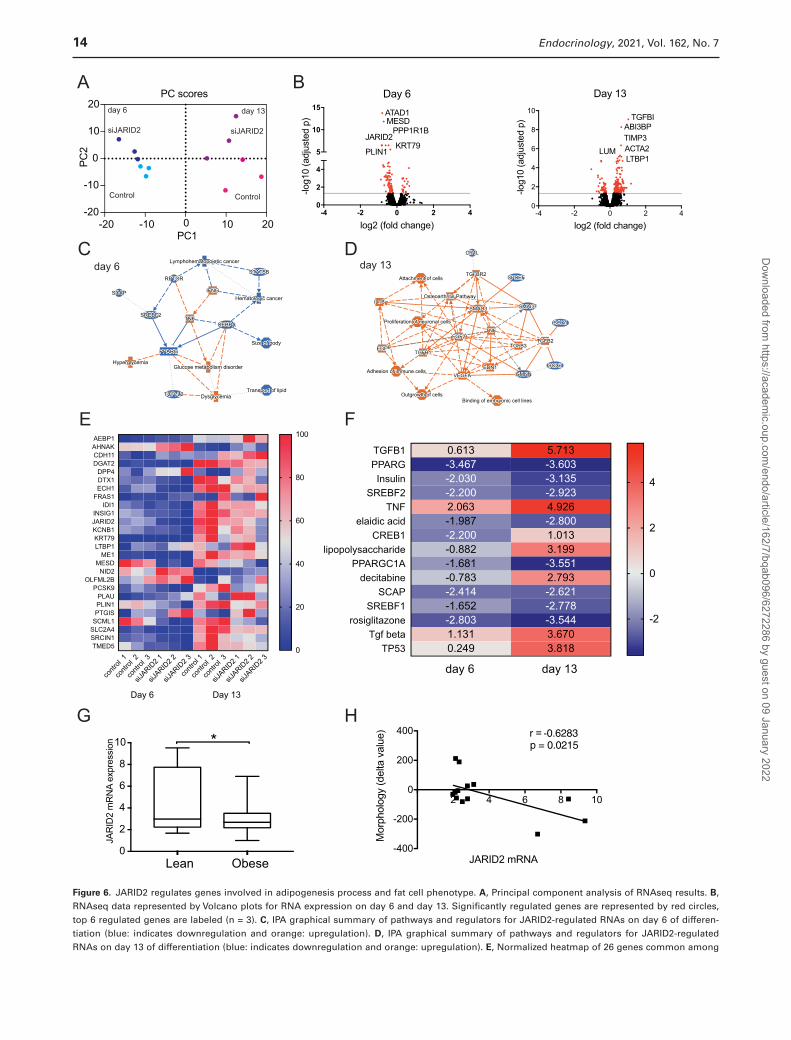
JARID2 Regulates the Adipogenic Program
We further defined JARID2-regulated genes by per-forming RNAseq in siJARID2 and control siRNA-treated hASC on day 6 and day 13 of differentiation (due to
Table 1. Genes regulating lipid accumulation normalized per cell. 11 novel regulators of adipogenesis that have not been
studied previously are shown in bold
Gene ID (alternative name) Cells with lipids/total cells Glycerol release/total cells PubMed hits adipogenesis Selected references
SSMD Fold change SSMD Fold change
EBF1 -4.92 0.58 -2.88 0.59 17 (52, 57)DNM2 -3.99 0.72 -3.83 0.42 0 HMGA1 -3.93 0.63 -3.19 0.48 12 (58-60)TGIF1 -3.81 0.67 -3.99 0.57 0 LMO4 -2.73 0.72 -2.54 0.55 2 (61, 62)SOX4 -2.69 0.73 -1.39 0.71 2 FOS (C-FOS) -2.62 0.82 -1.56 0.69 30 (63)KLF15 -2.41 0.78 -1.75 0.60 33 (8, 64)ID2 -2.4 0.74 -2.42 0.52 10 (65-67)TFDP1 (DP1) -2.02 0.83 -2.86 0.70 2 (68, 69)ARID5A -2.01 0.88 -7.83 0.70 1 (70)BCL3 -1.99 0.88 -4.52 0.60 2 IFI16 -1.85 0.78 -1.73 0.62 1 (71)NR2F1 (COUP-TF) -1.83 0.83 -2.19 0.61 1 (72)FOSB -1.79 0.88 -0.68 0.85 7 (73, 74)SQSTM1 -1.67 0.87 -0.42 0.92 14 (75, 76)NR1H3 (LXRalpha) -1.57 0.85 -1.54 0.71 28 (77-79)HIPK1 -1.44 0.86 -0.77 0.83 0 MYC -1.39 0.84 -1.73 0.65 72 (80-82)GATA6 -1.35 0.93 -1.02 0.71 5 (83)USF1 -1.35 0.87 -1.30 0.81 4 (84)JARID2 -1.32 0.87 -1.65 0.67 0 NFKBIZ -1.32 0.88 -1.39 0.81 0 LMCD1 -1.28 0.87 -1.28 0.70 1 (85)YWHAH -1.28 0.85 -1.62 0.80 1 (86)GAS7 -1.27 0.9 -0.91 0.78 0 DDIT3 (CHOP) -1.13 0.9 -2.33 0.68 52 (87-89)KLF16 -1.13 0.87 -0.83 0.80 1 (90)GTF2F2 1.36 1.15 0.91 0.75 0 FOSL2 (FRA-2) 1.52 1.13 0.95 1.28 2 (91, 92)TCF12 1.54 1.14 2.02 1.22 1 EGR2 1.62 1.23 2.43 1.42 16 (93-95)STAT2 1.68 1.12 2.14 1.46 3 (96)GCDH 1.69 1.22 1.63 1.21 0 FBXW7 2.09 1.12 1.18 1.64 2 (55)ABL1 (c-Abl) 2.1 1.24 1.27 1.22 5 (97, 98)CDKN2A 3.15 1.21 0.95 1.17 18 (99, 100)ANKRD30A 3.68 1.24 0.85 1.09 0 CSRNP1 4 1.29 2.76 1.56 0
Dow
nloaded from https://academ
ic.oup.com/endo/article/162/7/bqab096/6272286 by guest on 09 January 2022
Endocrinology, 2021, Vol. 162, No. 7 11
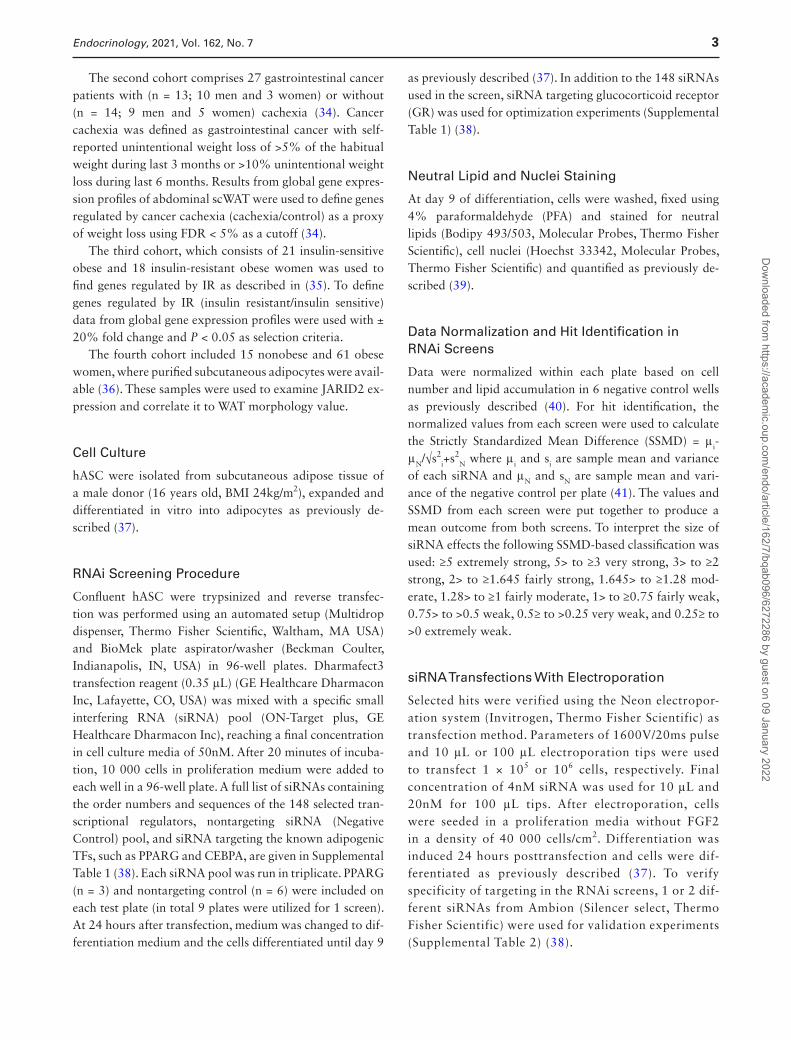
JARID2 expression pattern). In addition, knockdowns of JARID2 on day 2 of differentiation gave similar results as day −1 siRNA treatments (Supplemental Fig. 4) (38). These experiments suggested that JARID2 affects adipo-cyte phenotype during later stages of in vitro differen-tiation. Principal component (PC) analysis of RNAseq data showed that samples from different days of differ-entiation were separated by PC1 and siJARID2 samples were separated from controls by PC2 (Fig. 6A). JARID2 knockdown affected gene expression stronger on day 13 than on day 6 (Fig. 6B, Supplemental Table 6) (38). Probably this reflects stronger expression of JARID2 on day 13. Analysis of pathways and networks (IPA soft-ware) suggested that pro-adipogenic factors (PPARG, CEBPA, SREBF2) were downregulated on day 6, while factors leading to dysglycemia and inflammation (TNF, IFNG) were upregulated (Fig. 6C). On day 13, pathways characterizing undifferentiated preadipocytes (TGFB1-3, TGFBR2, FGF2, SMAD3) and inflammation (TNF, IL1B) were upregulated (Fig. 6D). Twenty-six genes were commonly regulated between day 6 and day 13 (Fig. 6E). Several of these genes were previously reported to be involved in adipogenesis (MESD, PCSK9, INSIG1, PTGIS, KCNB1, PLIN1, SLC2A4 [GLUT4]) (117-123). Furthermore, IPA analysis of upstream regulators for the genes affected by siJARID2 on day 6 and day 13 revealed that genes that were under control of pro-adipogenic fac-tors, such as PPARγ, insulin, SREBF1/2, and PPARGC1A
were gradually downregulated during differentiation in siJARID2-treated cells (Fig. 6F and Supplemental Table 7 (38, 124-131)), while genes controlled by negative regulators, such as TGFB, TNF, and lipopolysaccharide (132-134) were upregulated. These results indicated that JARID2 affects adipogenesis, modulating the balance be-tween stimulators and suppressors of this event.
JARID2 Expression in Adipocytes Is Influenced by Obesity and Hyperplasia
Large adipocytes (WAT hypertrophy) are indicative of lower adipogenic capacity of the tissue, as discussed (121). Therefore, we investigated whether there is any correl-ation between JARID2 expression and WAT morphology. In human adipose tissue, JARID2 is highly expressed in macrophages (data not shown), which affects correlation outcome if JARID2 expression is examined in intact tissue. Therefore, expression of this TF was examined in isolated adipocytes from scWAT (cohort 4). JARID2 expression was increased in lean subjects (Fig. 6G) and correlated nega-tively with morphology delta value (Fig. 6H). This value is the difference in fat cell volume between measured value and expected value obtained from the curve-linear rela-tionship between fat cell volume and fat mass (135). The findings suggests that high JARID2 levels associate with hyperplastic WAT, which in turn is linked to rapid rates of adipogenesis (135).
Table 2. Genes regulating glycerol release independently of differentiation (glycerol release per differentiated cell. Genes that
overlap with Table 1 excluded). Novel potential regulators of adipogenesis that have not been studied previously are shown
in bold
Gene ID SSMD Fold change Pubmed hits adipogenesis Pubmed hits proliferation Selected references for adipogenesis
GTF2F2 -3.1 0.79 0 3 ETV1 -1.64 0.87 1 63 (83)ANKRD30A -1.53 0.89 0 2 ZNF219 -1.51 0.82 0 0 ATM (Tel1) -1.47 0.89 0 13 DNMT1 -1.45 0.87 15 837 (102, 103)ELF1 -1.29 0.86 0 34 SNAPC5 -1.28 0.87 0 0 GLIS2 -1.26 0.85 0 9 NOTCH3 -1.26 0.87 9 375 (104, 105)ETV6 -1.19 0.90 1 94 ZNRD1 -1.19 0.90 0 10 RNF14 (ARA54) -1.18 0.87 0 7 SAP30 -1.01 0.90 0 7 KLF5 1 1.10 21 279 (7, 106)HMGA1 1.06 1.15 13 194 (15, 107, 108)MAX 1.09 1.11 1 126 (109)LRRFIP1 1.18 1.11 0 9 SPI1 (PU.1) 1.72 1.13 9 339 (110-112)FBXW7 2.1 1.19 2 269 (55)
Dow
nloaded from https://academ
ic.oup.com/endo/article/162/7/bqab096/6272286 by guest on 09 January 2022
12 Endocrinology, 2021, Vol. 162, No. 7
Discussion
In this study, we have performed RNAi screening to detect TFs that are influenced by metabolic conditions in WAT and also affect adipogenesis. A large number of the presently identified hit TFs were previously known to influence fat cell differentiation. However, the study also defined novel TFs regulating lipid accumulation and cell number during human fat cell differentiation in vitro. Herein, we provide literature sources for the known factors and validation of the newly detected hits. To further elucidate the usefulness of the screen, 1 of these latter TFs, namely JARID2, was studied in some detail and defined as a TF required for effi-cient adipogenic program.
It is well-known that genetically limited lipid accumula-tion/adipogenic capacity in WAT is causing lipodystrophies with ectopic fat storage resulting in IR (136, 137), while re-storing adipogenic capacity in WAT is resolving IR (138). Therefore, few earlier attempts have been made to discover novel adipogenesis-regulating factors. A former RNAi screen for druggable hits (31) identified 459 genes. As the list was not published, it is impossible to determine if those hits overlap with the present study. However, none of our hits in-cluded in Tables 1 and 2 are listed among its validated genes (31). Interestingly, in the current screen 72% of significant hit TFs were found to be positive regulators of adipogenesis and only 28% were negative regulators, whereas in the previous screen only 22% of significant hits were positive regulators. This could reflect gene selection strategy for the screen, but also methodological differences; in the current study hASC were not proliferated, whereas in the previous screen hASC were proliferated for 3 days after siRNA trans-fection (31). In addition, usage of full differentiation media can also cause bias toward the detection of pro-adipogenic factors. Another previous screen had a very limited scope. It was designed to find the novel regulators of PPARG and was based on PPARG reporter activity (32). In the latter study, only a few siRNAs were tested as proof-of-principle for the reported methodology. Therefore, when comparing with the 2 previous studies, the present study provides unique and novel findings as well as a high-throughput methodology for the in vitro study of adipogenesis-regulating genes. It is also important to note that the timing and stability of siRNA treatment in the current screen provided possibility to target genes that are both upregulated and downregulated during adipocyte differentiation.
The current screening results suggest that a large part (26.4%; 39 genes of 148) of metabolic condition–regulated TFs affect lipid accumulation, reflecting differentiation, and an additional 13.5% TFs affect cell number, which mirrors proliferation. This suggests that adipogenic cap-acity of adipose tissue is affected in metabolic conditions
5
2
1
1
A
B
CNeg
ative
contr
ol
PPAR
CSRNP1BCL3
DNM2GCDH
JARID
2
NFKBIZSOX4
TCF12TGIF1
0.0
0.5
1.0
1.5
Knoc
kdow
n ef
ficie
ncy
Negati
ve co
ntrol
siPPARG
CSRNP1BCL3
DNM2GCDH
JARID
2
NFKBIZSOX4
TCF12TGIF1
0.0
0.5
1.0
1.5
Lipi
d dr
ople
t cou
nt/c
ell
(nor
mal
ized
to c
ontro
l)
***
****** ****
*
Obesity
Morphology
Cancer cachexia
Insulin resistance
GCDHTCF12
CSRNP1NFKBIZ
DNM2TGIF1SOX4JARID2BCL3
Figure 4. Validation of selected hit TFs. A, Venn diagram showing meta-bolic group distribution of 9 novel adipogenesis-regulating TFs and effect direction of their siRNA on lipid accumulation in RNAi screen. B, siRNA knockdown efficiency using siRNA from Ambion for 9 selected TFs and PPARG as a positive control. Fold change of expression in siRNA-treated sample compared to nontargeting control is shown for each TF (RT-qPCR, 1-way ANOVA, with Bonferroni’s multiple compari-sons n = 3). C, Effect of siRNA (Ambion) on cell differentiation (bodipy objects per Hoechst objects compared to nontargeting control, n = 3, *P < 0.05; **P < 0.01; ***P < 0.001, 1-way ANOVA with Bonferroni’s multiple comparisons).
Dow
nloaded from https://academ
ic.oup.com/endo/article/162/7/bqab096/6272286 by guest on 09 January 2022
Endocrinology, 2021, Vol. 162, No. 7 13
and results in altered morphology of WAT (fat cell size vs number). As many as 45.8% of all IR-affected TFs were found to regulate adipogenesis. The high number is in line with previously published data demonstrating that IR is
associated with larger fat cells and impaired fat cell differ-entiation (138, 139).
Expectedly, many significant hits were already known regulators of fat cell differentiation (EBF1, LXR α, MYC,
0.25 1 2 4 8 12
0
2
4
6
days in differentiation
Rel
ativ
e JA
RID
2 m
RN
A ex
pres
sion
Cont
rol
siJAR
ID2
Cont
rol
siJAR
ID2
Cont
rol
siJAR
ID2
kD
day 2 day 13day 6
140 kD
80 kD75100
150
Contro
l
siJARID
2
Contro
l
siJARID
2
Contro
l
siJARID
20
1
2
3
4
Rel
ative
80 K
Dex
pres
sion
/tota
lload
edpr
otei
n
80KDa
day 2 day 13day 6
Contro
l
siJARID
2
Contro
l
siJARID
2
Con
trol
siJA
RID2
0.0
0.5
1.0
Rel
ativ
e 14
0 KD
exp
ress
ion
/tota
l load
ed p
rote
in
140KDa
day 2 day 13day 6
Contro
l
siPPARG
siJARID
20.0
0.5
1.0
1.5
2.0
Rel
ativ
e gl
ycer
ol re
leas
e Glycerol release
*
***
Control siJARID2
0
5
10
15
20
25
Nor
mal
ized
3 H g
luco
se u
ptak
eGlucose uptake
BasalInsulin
******
***
Control siJARID20
2
4
6
Nor
mal
ized
gly
cero
l rel
ease
Lipolysis
BasalIso
******
**
A
BD
E
F
C
Control siJARID2
*
**
Figure 5. JARID2 expression is regulated by adipogenesis and JARID2 knockdown affects fat cell phenotype in vitro. A, Expression of JARID2 mRNA in hASC during differentiation (RT-qPCR, n = 3). B, Western blot analysis of JARID2 expression during adipogenesis. Both described isoforms of 140 and 80 kD are indicated. Quantification of the expression of JARID2 isoforms during differentiation (80 kD - C and 140 kD - D, n = 3, paired t-test). C, Representative picture of control and siJARID2-treated cells on day 9 of differentiation. D, Fold change of glycerol concentration in conditional media normalized to cell number (Hoechst) and compared to control on day 9 of differentiation (n = 3, Kruskal-Wallis test). E, Basal and insulin-stimulated glucose uptake on day 13 of differentiation (n = 3, 2-way ANOVA). F. Basal and isoprenaline-stimulated lipolysis measured on day 13 of differentiation (n = 4, 2-way ANOVA), *P < 0.05, **P < 0.01 and ***P < 0.001.
Dow
nloaded from https://academ
ic.oup.com/endo/article/162/7/bqab096/6272286 by guest on 09 January 2022
14 Endocrinology, 2021, Vol. 162, No. 7
-4 -2 0 2 40
2
4
5
10
15
log2 (fold change)
-log10(adjustedp)
Day 6ATAD1MESD
JARID2KRT79
PLIN1
PPP1R1B
-4 -2 0 2 40
2
4
6
8
10
log2 (fold change)
-log1
0(a
djus
ted
p)
Day 13
TGFBIABI3BPTIMP3
LTBP1LUM ACTA2
A
C-20 -10 0 10 20
-20
-10
0
10
20PC scores
PC1
PC2
siJARID2 siJARID2
Control Control
day 6 day 13
contr
ol 1
contr
ol 2
contr
ol 3
siJARID
2 1
siJARID
2 2
siJARID
2 3
contr
ol 1
contr
ol 2
contr
ol 3
siJARID
2 1
siJARID
2 2
siJARID
2 3
AEBP1AHNAKCDH11DGAT2
DPP4DTX1ECH1
FRAS1IDI1
INSIG1JARID2KCNB1KRT79LTBP1
ME1MESD
NID2OLFML2B
PCSK9PLAUPLIN1PTGIS
SCML1SLC2A4SRCIN1TMED5 0
20
40
60
80
100
Day 6 Day 13
0.613 5.713-3.467 -3.603-2.030 -3.135-2.200 -2.9232.063 4.926-1.987 -2.800-2.200 1.013-0.882 3.199-1.681 -3.551-0.783 2.793-2.414 -2.621-1.652 -2.778-2.803 -3.5441.131 3.6700.249 3.818
day 6 day 13
TGFB1PPARGInsulin
SREBF2TNF
elaidic acidCREB1
lipopolysaccharidePPARGC1A
decitabineSCAP
SREBF1rosiglitazone
Tgf betaTP53
-2
0
2
4
B
Lean Obese0
2
4
6
8
10
JAR
ID2
mR
NA
expr
essi
on *
2 4 6 8 10
-400
-200
0
200
400
Mor
phol
ogy
(del
ta v
alue
)
JARID2 mRNA
r = -0.6283p = 0.0215
G H
Dday 13
E F
day 6
Figure 6. JARID2 regulates genes involved in adipogenesis process and fat cell phenotype. A, Principal component analysis of RNAseq results. B, RNAseq data represented by Volcano plots for RNA expression on day 6 and day 13. Significantly regulated genes are represented by red circles, top 6 regulated genes are labeled (n = 3). C, IPA graphical summary of pathways and regulators for JARID2-regulated RNAs on day 6 of differen-tiation (blue: indicates downregulation and orange: upregulation). D, IPA graphical summary of pathways and regulators for JARID2-regulated RNAs on day 13 of differentiation (blue: indicates downregulation and orange: upregulation). E, Normalized heatmap of 26 genes common among
Dow
nloaded from https://academ
ic.oup.com/endo/article/162/7/bqab096/6272286 by guest on 09 January 2022
Endocrinology, 2021, Vol. 162, No. 7 15
KLF15) (references within Table 1). This can be interpreted as a good quality of the current screen. On the other hand, many genes that were found to affect fat cell number (Table 2) were not previously defined as adipogenic factors but are well-known proliferation regulators mostly in cancer cells. For example, GLIS2 and ETV6 have been reported to regulate proliferation in leukemia (140), HMGA1 in gastric cancer (141), and FBXW7 in breast cancer (142). In addition, LRRFIP1 and ZNRD1 have been shown to regulate proliferation via Wnt/β-catenin pathway in mes-enchymal stem cells and in tumor cells, respectively (143, 144). Therefore, these genes might have a function in adi-pocyte progenitor expansion, which needs further studies.
It is important to acknowledge that the TF selection for the screen was done using gene expression profiling in the intact WAT; therefore, there is a risk that metabolic condi-tions were targeting TFs expressed in different cell types than adipocytes or adipocyte progenitors. Furthermore, not all the hits could be validated by using siRNA obtained from a different vendor. Such a drawback is a known phenom-enon and can be due to off-target effects (145). However, the reproducibility of siRNAs effects between the triplicate samples as well as between 2 screens was very high and a mixture of 4 different siRNAs were used to knock each gene in RNAi screen, which suggests that the screen pro-duced highly reliable results.
It should also be noted that our screen was performed on clinically relevant TFs from scWAT. In theory, additional important TFs might have been discovered if other WAT re-gions such as the visceral also were included. Unfortunately, the visceral depot cannot be investigated during the pres-ently used ambulatory conditions. In addition, one needs to point out that the hASC used for in vitro studies were from a male individual while our clinical cohorts were from female participants (except the cachexia cohort, which in-cluded both sexes). Unfortunately, larger male clinical co-horts with defined global gene expression in WAT were not available to us while the hASC used for in vitro studies is the best characterized primary cell model for such type of study. In addition, the screening identified a large number of known adipogenesis-related TFs that have been studied both in vitro and in in vivo murine models (mostly in male mice). Although we cannot exclude that some sex-specific TFs were not examined in our study, we think that it is not likely that screening results are largely affected by this gender difference.
Nine TFs were detected having a hitherto unknown role in adipogenesis. As mentioned, we selected JARID2 for further investigations. Its expression was upregulated during adipocyte differentiation and correlated with human WAT hyperplasia. Knockdown of JARID2 af-fected cell metabolism and the adipogenic transcriptional program. Jarid2 belongs to a family of Jumonji histone demethylases but lacks an enzymatic activity. Instead, it functions as a regulator of developmental processes in embryonic cells (146, 147). JARID2 depletion is embry-onically lethal (115) in mice and human mutations are associated with congenital defects (148). A short form of JARID2 (80 kDa) is present in lineage-committed cells (116). It is predominant in keratinocytes, where the gene influences cell cycle and epidermal differenti-ation (116). IPA analysis of siJARID2-affected genes re-vealed that TGF-β signaling could be a central affected pathway in JARID2-attenuated cells. TGFB inhibits adi-pocyte differentiation by mediating Smad3 interaction with C/EBPa (132). Furthermore, TGF-β signaling is inducing adipocyte progenitor cell proliferation (149), which if upregulated late during differentiation, can pos-sibly switch cell fate toward an undifferentiated state. In addition, pro-inflammatory signals, induced by JARID2 knockdown also drive hASC toward an undifferentiated state (134), which further supports a role of JARID2 for hASC differentiation to mature adipocyte.
Although the major focus of the study was the screening of clinically relevant TFs and JARID2 was studied to further prove the validity of this screen, we also made an attempt to further investigate the mechanism of JARID2 function by ChIP-seq analysis. JARID2 has been shown to recruit Polycomb Repressor Complex 2 (PRC2), which methylates histone H3 on lysine 27 (ie, H3K27me3) transcriptionally silencing the chromatin (146). Therefore, ChIP-seq analysis with the antibodies binding to PRC2 component EZH2 was also performed in control and siJARID2-treated cells. EZH2 was chosen due to its direct interaction to JARID2, which has been reported previously (150). Unfortunately, none of 3 different anti-JARID2 antibodies showed suffi-cient JARID2 affinity (no binding) or specificity (the same number of peaks in control and siJARID2-treated cells) in ChIP-seq experiments. The number of EZH2 peaks was not affected by JARID2 siRNA (data not shown). Although these results suggest that JARID2 might not act via recruit-ment of PRC2 complex in differentiating fat cells, further
JARID2-regulated genes on day 6 and 13 of differentiation. F, IPA analysis of upstream regulators based on significantly regulated genes by siJARID2. Top 15 most significantly enriched upstream regulators with Z-scores are shown. G, JARID2 expression in adipocytes obtained from scWAT of lean (n = 9) and obese (n = 60) patients (RT-qPCR) (t-test, *P < 0.05). H, Pearson’s correlation of JARID2 mRNA expression and cell morphology index in nonobese patients (n = 15).
Figure 6: continued
Dow
nloaded from https://academ
ic.oup.com/endo/article/162/7/bqab096/6272286 by guest on 09 January 2022
16 Endocrinology, 2021, Vol. 162, No. 7
mechanisms were not explored due to a different focus of the study.
To conclude, herein we report on a comprehensive screen for human fat cell TFs that are of relevance for im-portant metabolic conditions and also can be implicated in adipogenesis. We provide methodological tools for an efficient RNAi screen in human in vitro differentiated adipocytes, list of all metabolic condition–regulated TFs expressed in adipocytes, and overview of all adipogenesis-regulating TFs detected by the current screen. It is apparent that a large number of metabolic condition–regulated TFs also impact adipogenesis. Most are known to possess this feature from previous studies. However, 9 novel TFs are described and for 1 of them, JARID2, we conducted fur-ther analyses that suggest that it can de-repress early pro-genitor cell pathways and inhibit metabolism of mature adipocytes.
AcknowledgementsWe thank Gaby Åström, Elisabet Dugner, Kerstin Wåhlen, and
Thais Castro-Barbosa for their excellent technical help. The study was funded by the Swedish Research Council, NovoNordisk foundation, and Karolinska Institutet strategic research program in Diabetes.
Financial Support: Swedish research council, grant numbers 2016-00694, 2012-1702, Novonordisk foundation, Strategic reserach pro-gram in Diabetes at Karolinska Institutet.
Author Contributions: Conceptualization (CB, JL, PA); data cur-ation (CB, NS, JL, JPL, JA, BT, ABE); formal analysis (CB, NS, JL, JPL, ABE); funding acquisition (JL, PA); investigation (CB, NS, JPL, BT, JA); methodology (CB, NS, JPL, ABE); project administration (CB, NS, JL); validation; visualization (CB, NS, JL); roles/writing - original draft (CB, NS, JL); writing - review & editing (all co-authors).
Additional InformationCorrespondence: Jurga Laurencikiene, PhD, Karolinska Institutet,
Lipid laboratory, Dept. of Medicine Huddinge (MedH), NEO, Hälsovägen 9/Blickagången 16, 14183 Huddinge, Sweden. Email: [email protected].
Disclosures: The authors have nothing to disclose.Data Availability: The RNAseq data are published on GEO with
accession number GSE164413 and will be made publicly available upon publication of the study. Some or all data generated or ana-lyzed during this study are included in this published article or in the data repositories listed in References.
References 1. Jo J, Gavrilova O, Pack S, et al. Hypertrophy and/or hyper-
plasia: dynamics of adipose tissue growth. PLoS Comput Biol. 2009;5(3):e1000324.
2. Longo M, Zatterale F, Naderi J, et al. Adipose tissue dysfunction as determinant of obesity-associated metabolic complications. Int J Mol Sci. 2019;20(9):2358.
3. Ambele MA, Pepper MS. Identification of transcription factors potentially involved in human adipogenesis in vitro. Mol Genet Genomic Med. 2017;5(3):210-222.
4. Yeh WC, Cao Z, Classon M, McKnight SL. Cascade regula-tion of terminal adipocyte differentiation by three members of the C/EBP family of leucine zipper proteins. Genes Dev. 1995;9(2):168-181.
5. Cao Z, Umek RM, McKnight SL. Regulated expression of three C/EBP isoforms during adipose conversion of 3T3-L1 cells. Genes Dev. 1991;5(9):1538-1552.
6. Kim JB, Wright HM, Wright M, Spiegelman BM. ADD1/SREBP1 activates PPARgamma through the production of endogenous ligand. Proc Natl Acad Sci U S A. 1998;95(8):4333-4337.
7. Oishi Y, Manabe I, Tobe K, et al. Krüppel-like transcription factor KLF5 is a key regulator of adipocyte differentiation. Cell Metab. 2005;1(1):27-39.
8. Mori T, Sakaue H, Iguchi H, et al. Role of Krüppel-like factor 15 (KLF15) in transcriptional regulation of adipogenesis. J Biol Chem. 2005;280(13):12867-12875.
9. Li D, Yea S, Li S, et al. Krüppel-like factor-6 promotes preadipocyte differentiation through histone deacetylase 3-dependent repres-sion of DLK1. J Biol Chem. 2005;280(29):26941-26952.
10. Fajas L, Schoonjans K, Gelman L, et al. Regulation of peroxisome proliferator-activated receptor gamma expression by adipocyte differentiation and determination factor 1/sterol regulatory ele-ment binding protein 1: implications for adipocyte differenti-ation and metabolism. Mol Cell Biol. 1999;19(8):5495-5503.
11. Linhart HG, Ishimura-Oka K, DeMayo F, et al. C/EBPalpha is required for differentiation of white, but not brown, adipose tissue. Proc Natl Acad Sci U S A. 2001;98(22):12532-12537.
12. Wu Z, Rosen ED, Brun R, et al. Cross-regulation of C/EBP alpha and PPAR gamma controls the transcriptional pathway of adipogenesis and insulin sensitivity. Mol Cell. 1999;3(2):151-158.
13. Koutnikova H, Cock TA, Watanabe M, et al. Compensation by the muscle limits the metabolic consequences of lipodystrophy in PPAR gamma hypomorphic mice. Proc Natl Acad Sci U S A. 2003;100(24):14457-14462.
14. Tong Q, Tsai J, Tan G, Dalgin G, Hotamisligil GS. Interaction between GATA and the C/EBP family of transcription factors is critical in GATA-mediated suppression of adipocyte differenti-ation. Mol Cell Biol. 2005;25(2):706-715.
15. Ross SE, Hemati N, Longo KA, et al. Inhibition of adipogenesis by Wnt signaling. Science. 2000;289(5481):950-953.
16. Spalding KL, Arner E, Westermark PO, et al. Dynamics of fat cell turnover in humans. Nature. 2008;453(7196):783-787.
17. Viguerie N, Vidal H, Arner P, et al.; Nutrient-Gene Interactions in Human Obesity–Implications for Dietary Guideline (NUGENOB) project. Adipose tissue gene expression in obese subjects during low-fat and high-fat hypocaloric diets. Diabetologia. 2005;48(1):123-131.
18. Tchoukalova Y, Koutsari C, Jensen M. Committed subcutaneous preadipocytes are reduced in human obesity. Diabetologia. 2007;50(1):151-157.
Dow
nloaded from https://academ
ic.oup.com/endo/article/162/7/bqab096/6272286 by guest on 09 January 2022
Endocrinology, 2021, Vol. 162, No. 7 17
19. Majithia AR, Flannick J, Shahinian P, et al.; GoT2D Consortium; NHGRI JHS/FHS Allelic Spectrum Project; SIGMA T2D Consortium; T2D-GENES Consortium. Rare variants in PPARG with decreased activity in adipocyte differentiation are associated with increased risk of type 2 diabetes. Proc Natl Acad Sci U S A. 2014;111(36):13127-13132.
20. Lotta LA, Gulati P, Day FR, et al.; EPIC-InterAct Consortium; Cambridge FPLD1 Consortium. Integrative genomic analysis im-plicates limited peripheral adipose storage capacity in the patho-genesis of human insulin resistance. Nat Genet. 2017;49(1):17-26.
21. Vink RG, Roumans NJ, Fazelzadeh P, et al. Adipose tissue gene expression is differentially regulated with different rates of weight loss in overweight and obese humans. Int J Obes (Lond). 2017;41(2):309-316.
22. Kubota N, Terauchi Y, Miki H, et al. PPAR gamma mediates high-fat diet-induced adipocyte hypertrophy and insulin resist-ance. Mol Cell. 1999;4(4):597-609.
23. Lee HH, An SM, Ye BJ, et al. TonEBP/NFAT5 promotes obesity and insulin resistance by epigenetic suppression of white adi-pose tissue beiging. Nat Commun. 2019;10(1):3536.
24. Halberg N, Khan T, Trujillo ME, et al. Hypoxia-inducible factor 1alpha induces fibrosis and insulin resistance in white adipose tissue. Mol Cell Biol. 2009;29(16):4467-4483.
25. Bing C, Russell S, Becket E, et al. Adipose atrophy in cancer cachexia: morphologic and molecular analysis of adipose tissue in tumour-bearing mice. Br J Cancer. 2006;95(8):1028-1037.
26. Arner P, Langin D. Lipolysis in lipid turnover, cancer cach-exia, and obesity-induced insulin resistance. Trends Endocrinol Metab. 2014;25(5):255-262.
27. Bing C, Trayhurn P. Regulation of adipose tissue metab-olism in cancer cachexia. Curr Opin Clin Nutr Metab Care. 2008;11(3):201-207.
28. Tsoli M, Schweiger M, Vanniasinghe AS, et al. Depletion of white adipose tissue in cancer cachexia syndrome is associated with inflammatory signaling and disrupted circadian regulation. PLoS One. 2014;9(3):e92966.
29. Ribot J, Rantala M, Kesäniemi YA, Palou A, Savolainen MJ. Weight loss reduces expression of SREBP1c/ADD1 and PPARgamma2 in adipose tissue of obese women. Pflugers Arch. 2001;441(4):498-505.
30. Gao H, Mejhert N, Fretz JA, et al. Early B cell factor 1 regulates adipocyte morphology and lipolysis in white adipose tissue. Cell Metab. 2014;19(6):981-992.
31. Söhle J, Machuy N, Smailbegovic E, et al. Identification of new genes involved in human adipogenesis and fat storage. PLoS One. 2012;7(2):e31193.
32. van Beekum O, Gao Y, Berger R, Koppen A, Kalkhoven E. A novel RNAi lethality rescue screen to identify regulators of adipogenesis. PLoS One. 2012;7(6):e37680.
33. Arner E, Mejhert N, Kulyté A, et al. Adipose tissue microRNAs as regulators of CCL2 production in human obesity. Diabetes. 2012;61(8):1986-1993.
34. Dahlman I, Mejhert N, Linder K, et al. Adipose tissue path-ways involved in weight loss of cancer cachexia. Br J Cancer. 2010;102(10):1541-1548.
35. Kulyté A, Ehrlund A, Arner P, Dahlman I. Global transcrip-tome profiling identifies KLF15 and SLC25A10 as modifiers
of adipocytes insulin sensitivity in obese women. PLoS One. 2017;12(6):e0178485.
36. Kulyté A, Lundbäck V, Lindgren CM, et al. Genome-wide asso-ciation study of adipocyte lipolysis in the GENetics of adipocyte lipolysis (GENiAL) cohort. Mol Metab. 2020;34:85-96.
37. Pettersson AM, Stenson BM, Lorente-Cebrián S, et al. LXR is a negative regulator of glucose uptake in human adipocytes. Diabetologia. 2013;56(9):2044-2054.
38. Bjork C, Subramanian N, Liu J, et al. Data from: Supplemental Material “An RNAi screening of clinically relevant transcription factors regulating human adipogenesis and adipocyte metab-olism.” Posted April 6, 2021. Figshare. https://doi.org/10.6084/m9.figshare.14134397.v3
39. Björk C, Wilhelm U, Mandrup S, et al. Effects of selected bio-active food compounds on human white adipocyte function. Nutr Metab (Lond). 2016;13:4.
40. Birmingham A, Selfors LM, Forster T, et al. Statistical methods for analysis of high-throughput RNA interference screens. Nat Methods. 2009;6(8):569-575.
41. Zhang XD. Illustration of SSMD, z score, SSMD*, z* score, and t statistic for hit selection in RNAi high-throughput screens. J Biomol Screen. 2011;16(7):775-785.
42. Livak KJ, Schmittgen TD. Analysis of relative gene expression data using real-time quantitative PCR and the 2(-Delta Delta C(T)) Method. Methods. 2001;25(4):402-408.
43. Kulyte A, Navakauskiene R, Treigyte G, Gineitis A, Bergman T, Magnusson KE. Characterization of human alpha-dystrobrevin isoforms in HL-60 human promyelocytic leukemia cells undergoing granulocytic differentiation. Mol Biol Cell. 2002;13(12):4195-4205.
44. Antalis TM, Godbolt D. Isolation of intact nuclei from hemato-poietic cell types. Nucleic Acids Res. 1991;19(15):4301.
45. Cell Signaling Technology Cat# 13594, RRID:AB_2798269. http://antibodyregistry.org/AB_2798269
46. Sigma-Aldrich Cat# A0545, RRID:AB_257896. https://antibodyregistry.org/AB_257896
47. Ryden M, Dicker A, van Harmelen V, et al. Mapping of early signaling events in tumor necrosis factor-alpha -mediated lip-olysis in human fat cells. J Biol Chem. 2002;277(2):1085-1091.
48. Hellmér J, Arner P, Lundin A. Automatic luminometric kin-etic assay of glycerol for lipolysis studies. Anal Biochem. 1989;177(1):132-137.
49. Pettersson AM, Acosta JR, Björk C, et al. MAFB as a novel regulator of human adipose tissue inflammation. Diabetologia. 2015;58(9):2115-2123.
50. Liu P, Hwang JT. Quick calculation for sample size while con-trolling false discovery rate with application to microarray ana-lysis. Bioinformatics. 2007;23(6):739-746.
51. Arner E, Daub CO, Vitting-Seerup K, et al.; FANTOM Consortium. Transcribed enhancers lead waves of coordin-ated transcription in transitioning mammalian cells. Science. 2015;347(6225):1010-1014.
52. Akerblad P, Lind U, Liberg D, Bamberg K, Sigvardsson M. Early B-cell factor (O/E-1) is a promoter of adipogenesis and involved in control of genes important for terminal adipocyte differenti-ation. Mol Cell Biol. 2002;22(22):8015-8025.
53. Fretz JA, Nelson T, Xi Y, Adams DJ, Rosen CJ, Horowitz MC. Altered metabolism and lipodystrophy in the early B-cell factor 1-deficient mouse. Endocrinology. 2010;151(4):1611-1621.
Dow
nloaded from https://academ
ic.oup.com/endo/article/162/7/bqab096/6272286 by guest on 09 January 2022
18 Endocrinology, 2021, Vol. 162, No. 7
54. Ambele MA, Dessels C, Durandt C, Pepper MS. Genome-wide analysis of gene expression during adipogenesis in human adipose-derived stromal cells reveals novel patterns of gene expression during adipocyte differentiation. Stem Cell Res. 2016;16(3):725-734.
55. Bengoechea-Alonso MT, Ericsson J. The ubiquitin ligase Fbxw7 controls adipocyte differentiation by targeting C/EBPalpha for deg-radation. Proc Natl Acad Sci U S A. 2010;107(26):11817-11822.
56. Becker KG, Hosack DA, Dennis G Jr, et al. PubMatrix: a tool for multiplex literature mining. BMC Bioinformatics. 2003;4:61.
57. Jimenez MA, Akerblad P, Sigvardsson M, Rosen ED. Critical role for Ebf1 and Ebf2 in the adipogenic transcriptional cas-cade. Mol Cell Biol. 2007;27(2):743-757.
58. Arce-Cerezo A, García M, Rodríguez-Nuevo A, et al. HMGA1 overexpression in adipose tissue impairs adipogenesis and prevents diet-induced obesity and insulin resistance. Sci Rep. 2015;5:14487.
59. Liu Y, Wu W, Zhou L, Cheng L, Miao C. MicroRNA-142a-3p promotes the differentiation of 3T3-L1 preadipocytes by targeting high-mobility group AT-hook 1. Int J Clin Exp Pathol. 2018;11(11):5249-5256.
60. Arlotta P, Tai AK, Manfioletti G, Clifford C, Jay G, Ono SJ. Transgenic mice expressing a truncated form of the high mobility group I-C protein develop adiposity and an ab-normally high prevalence of lipomas. J Biol Chem. 2000;275(19):14394-14400.
61. Wang N, Wang X, Shi M, et al. LMO4 modulates prolifer-ation and differentiation of 3T3-L1 preadipocytes. FEBS Lett. 2013;587(18):3032-3037.
62. Sun Y, Geng M, Yuan Y, et al. Lmo4-resistin signaling con-tributes to adipose tissue-liver crosstalk upon weight cycling. FASEB J. 2020;34(3):4732-4748.
63. Xiao H, Leblanc SE, Wu Q, et al. Chromatin accessibility and transcription factor binding at the PPARγ2 promoter during adipogenesis is protein kinase A-dependent. J Cell Physiol. 2011;226(1):86-93.
64. Asada M, Rauch A, Shimizu H, et al. DNA binding-dependent glucocorticoid receptor activity promotes adipogenesis via Krüppel-like factor 15 gene expression. Lab Invest. 2011;91(2):203-215.
65. Zhou P, Hummel AD, Pywell CM, Dong XC, Charlie Dong X, Duffield GE. High fat diet rescues disturbances to metabolic homeostasis and survival in the Id2 null mouse in a sex-specific manner. Biochem Biophys Res Commun. 2014;451(3):374-381.
66. Moldes M, Boizard M, Liepvre XL, Fève B, Dugail I, Pairault J. Functional antagonism between inhibitor of DNA binding (Id) and adipocyte determination and differentiation factor 1/sterol regulatory element-binding protein-1c (ADD1/SREBP-1c) trans-factors for the regulation of fatty acid synthase promoter in adipocytes. Biochem J. 1999;344 Pt 3:873-880.
67. Park KW, Waki H, Villanueva CJ, et al. Inhibitor of DNA binding 2 is a small molecule-inducible modulator of peroxisome proliferator-activated receptor-gamma ex-pression and adipocyte differentiation. Mol Endocrinol. 2008;22(9):2038-2048.
68. Timchenko NA, Wilde M, Iakova P, Albrecht JH, Darlington GJ. E2F/p107 and E2F/p130 complexes are regu-lated by C/EBPalpha in 3T3-L1 adipocytes. Nucleic Acids Res. 1999;27(17):3621-3630.
69. Altiok S, Xu M, Spiegelman BM. PPARgamma induces cell cycle withdrawal: inhibition of E2F/DP DNA-binding activity via down-regulation of PP2A. Genes Dev. 1997;11(15):1987-1998.
70. Chalise JP, Hashimoto S, Parajuli G, et al. Feedback regulation of Arid5a and Ppar-γ2 maintains adipose tissue homeostasis. Proc Natl Acad Sci U S A. 2019;116(30):15128-15133.
71. Stadion M, Schwerbel K, Graja A, et al. Increased Ifi202b/IFI16 expression stimulates adipogenesis in mice and humans. Diabetologia. 2018;61(5):1167-1179.
72. Brodie AE, Manning VA, Hu CY. Inhibitors of preadipocyte differentiation induce COUP-TF binding to a PPAR/RXR binding sequence. Biochem Biophys Res Commun. 1996;228(3):655-661.
73. Kveiborg M, Sabatakos G, Chiusaroli R, et al. DeltaFosB in-duces osteosclerosis and decreases adipogenesis by two in-dependent cell-autonomous mechanisms. Mol Cell Biol. 2004;24(7):2820-2830.
74. Sabatakos G, Sims NA, Chen J, et al. Overexpression of DeltaFosB transcription factor(s) increases bone formation and inhibits adipogenesis. Nat Med. 2000;6(9):985-990.
75. Lacava G, Laus F, Amaroli A, et al. P62 deficiency shifts mesen-chymal/stromal stem cell commitment toward adipogenesis and disrupts bone marrow homeostasis in aged mice. J Cell Physiol. 2019;234(9):16338-16347.
76. Guo L, Huang JX, Liu Y, et al. Transactivation of Atg4b by C/EBPβ promotes autophagy to facilitate adipogenesis. Mol Cell Biol. 2013;33(16):3180-3190.
77. Seo JB, Moon HM, Kim WS, et al. Activated liver X receptors stimulate adipocyte differentiation through induction of peroxi-some proliferator-activated receptor gamma expression. Mol Cell Biol. 2004;24(8):3430-3444.
78. Juvet LK, Andresen SM, Schuster GU, et al. On the role of liver X receptors in lipid accumulation in adipocytes. Mol Endocrinol. 2003;17(2):172-182.
79. Ross SE, Erickson RL, Gerin I, et al. Microarray analyses during adipogenesis: understanding the effects of Wnt signaling on adipogenesis and the roles of liver X receptor alpha in adipo-cyte metabolism. Mol Cell Biol. 2002;22(16):5989-5999.
80. Deisenroth C, Black MB, Pendse S, et al. MYC is an early re-sponse regulator of human adipogenesis in adipose stem cells. PLoS One. 2014;9(12):e114133.
81. Freytag SO, Geddes TJ. Reciprocal regulation of adipogenesis by Myc and C/EBP alpha. Science. 1992;256(5055):379-382.
82. Heath VJ, Gillespie DA, Crouch DH. Inhibition of the terminal stages of adipocyte differentiation by cMyc. Exp Cell Res. 2000;254(1):91-98.
83. Kubo H, Shimizu M, Taya Y, et al. Identification of mesenchymal stem cell (MSC)-transcription factors by microarray and knockdown analyses, and signature molecule-marked MSC in bone marrow by immunohistochemistry. Genes Cells. 2009;14(3):407-424.
84. Yuyama M, Fujimori K. Suppression of adipogenesis by val-proic acid through repression of USF1-activated fatty acid syn-thesis in adipocytes. Biochem J. 2014;459(3):489-503.
85. Zhu B, Xue F, Zhang C, Li G. LMCD1 promotes osteogenic differentiation of human bone marrow stem cells by regulating BMP signaling. Cell Death Dis. 2019;10(9):647.
86. Hamam D, Ali D, Vishnubalaji R, et al. microRNA-320/RUNX2 axis regulates adipocytic differentiation of human mesen-chymal (skeletal) stem cells. Cell Death Dis. 2014;5:e1499.
Dow
nloaded from https://academ
ic.oup.com/endo/article/162/7/bqab096/6272286 by guest on 09 January 2022
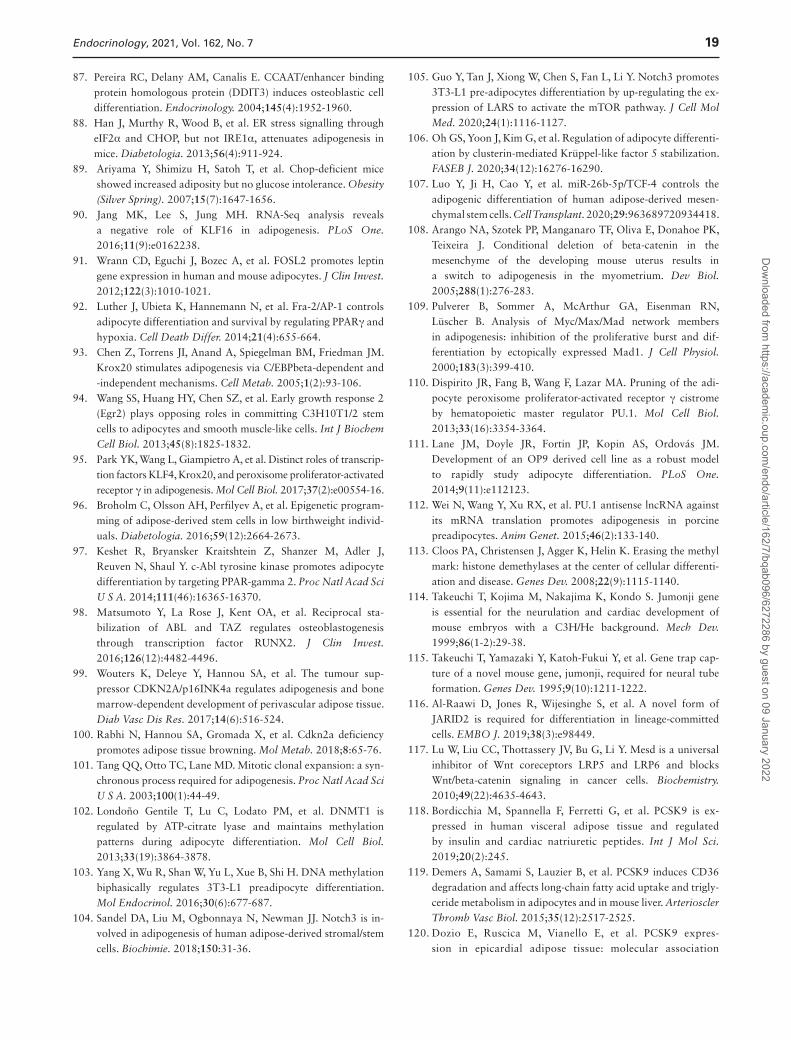
Endocrinology, 2021, Vol. 162, No. 7 19
87. Pereira RC, Delany AM, Canalis E. CCAAT/enhancer binding protein homologous protein (DDIT3) induces osteoblastic cell differentiation. Endocrinology. 2004;145(4):1952-1960.
88. Han J, Murthy R, Wood B, et al. ER stress signalling through eIF2α and CHOP, but not IRE1α, attenuates adipogenesis in mice. Diabetologia. 2013;56(4):911-924.
89. Ariyama Y, Shimizu H, Satoh T, et al. Chop-deficient mice showed increased adiposity but no glucose intolerance. Obesity (Silver Spring). 2007;15(7):1647-1656.
90. Jang MK, Lee S, Jung MH. RNA-Seq analysis reveals a negative role of KLF16 in adipogenesis. PLoS One. 2016;11(9):e0162238.
91. Wrann CD, Eguchi J, Bozec A, et al. FOSL2 promotes leptin gene expression in human and mouse adipocytes. J Clin Invest. 2012;122(3):1010-1021.
92. Luther J, Ubieta K, Hannemann N, et al. Fra-2/AP-1 controls adipocyte differentiation and survival by regulating PPARγ and hypoxia. Cell Death Differ. 2014;21(4):655-664.
93. Chen Z, Torrens JI, Anand A, Spiegelman BM, Friedman JM. Krox20 stimulates adipogenesis via C/EBPbeta-dependent and -independent mechanisms. Cell Metab. 2005;1(2):93-106.
94. Wang SS, Huang HY, Chen SZ, et al. Early growth response 2 (Egr2) plays opposing roles in committing C3H10T1/2 stem cells to adipocytes and smooth muscle-like cells. Int J Biochem Cell Biol. 2013;45(8):1825-1832.
95. Park YK, Wang L, Giampietro A, et al. Distinct roles of transcrip-tion factors KLF4, Krox20, and peroxisome proliferator-activated receptor γ in adipogenesis. Mol Cell Biol. 2017;37(2):e00554-16.
96. Broholm C, Olsson AH, Perfilyev A, et al. Epigenetic program-ming of adipose-derived stem cells in low birthweight individ-uals. Diabetologia. 2016;59(12):2664-2673.
97. Keshet R, Bryansker Kraitshtein Z, Shanzer M, Adler J, Reuven N, Shaul Y. c-Abl tyrosine kinase promotes adipocyte differentiation by targeting PPAR-gamma 2. Proc Natl Acad Sci U S A. 2014;111(46):16365-16370.
98. Matsumoto Y, La Rose J, Kent OA, et al. Reciprocal sta-bilization of ABL and TAZ regulates osteoblastogenesis through transcription factor RUNX2. J Clin Invest. 2016;126(12):4482-4496.
99. Wouters K, Deleye Y, Hannou SA, et al. The tumour sup-pressor CDKN2A/p16INK4a regulates adipogenesis and bone marrow-dependent development of perivascular adipose tissue. Diab Vasc Dis Res. 2017;14(6):516-524.
100. Rabhi N, Hannou SA, Gromada X, et al. Cdkn2a deficiency promotes adipose tissue browning. Mol Metab. 2018;8:65-76.
101. Tang QQ, Otto TC, Lane MD. Mitotic clonal expansion: a syn-chronous process required for adipogenesis. Proc Natl Acad Sci U S A. 2003;100(1):44-49.
102. Londoño Gentile T, Lu C, Lodato PM, et al. DNMT1 is regulated by ATP-citrate lyase and maintains methylation patterns during adipocyte differentiation. Mol Cell Biol. 2013;33(19):3864-3878.
103. Yang X, Wu R, Shan W, Yu L, Xue B, Shi H. DNA methylation biphasically regulates 3T3-L1 preadipocyte differentiation. Mol Endocrinol. 2016;30(6):677-687.
104. Sandel DA, Liu M, Ogbonnaya N, Newman JJ. Notch3 is in-volved in adipogenesis of human adipose-derived stromal/stem cells. Biochimie. 2018;150:31-36.
105. Guo Y, Tan J, Xiong W, Chen S, Fan L, Li Y. Notch3 promotes 3T3-L1 pre-adipocytes differentiation by up-regulating the ex-pression of LARS to activate the mTOR pathway. J Cell Mol Med. 2020;24(1):1116-1127.
106. Oh GS, Yoon J, Kim G, et al. Regulation of adipocyte differenti-ation by clusterin-mediated Krüppel-like factor 5 stabilization. FASEB J. 2020;34(12):16276-16290.
107. Luo Y, Ji H, Cao Y, et al. miR-26b-5p/TCF-4 controls the adipogenic differentiation of human adipose-derived mesen-chymal stem cells. Cell Transplant. 2020;29:963689720934418.
108. Arango NA, Szotek PP, Manganaro TF, Oliva E, Donahoe PK, Teixeira J. Conditional deletion of beta-catenin in the mesenchyme of the developing mouse uterus results in a switch to adipogenesis in the myometrium. Dev Biol. 2005;288(1):276-283.
109. Pulverer B, Sommer A, McArthur GA, Eisenman RN, Lüscher B. Analysis of Myc/Max/Mad network members in adipogenesis: inhibition of the proliferative burst and dif-ferentiation by ectopically expressed Mad1. J Cell Physiol. 2000;183(3):399-410.
110. Dispirito JR, Fang B, Wang F, Lazar MA. Pruning of the adi-pocyte peroxisome proliferator-activated receptor γ cistrome by hematopoietic master regulator PU.1. Mol Cell Biol. 2013;33(16):3354-3364.
111. Lane JM, Doyle JR, Fortin JP, Kopin AS, Ordovás JM. Development of an OP9 derived cell line as a robust model to rapidly study adipocyte differentiation. PLoS One. 2014;9(11):e112123.
112. Wei N, Wang Y, Xu RX, et al. PU.1 antisense lncRNA against its mRNA translation promotes adipogenesis in porcine preadipocytes. Anim Genet. 2015;46(2):133-140.
113. Cloos PA, Christensen J, Agger K, Helin K. Erasing the methyl mark: histone demethylases at the center of cellular differenti-ation and disease. Genes Dev. 2008;22(9):1115-1140.
114. Takeuchi T, Kojima M, Nakajima K, Kondo S. Jumonji gene is essential for the neurulation and cardiac development of mouse embryos with a C3H/He background. Mech Dev. 1999;86(1-2):29-38.
115. Takeuchi T, Yamazaki Y, Katoh-Fukui Y, et al. Gene trap cap-ture of a novel mouse gene, jumonji, required for neural tube formation. Genes Dev. 1995;9(10):1211-1222.
116. Al-Raawi D, Jones R, Wijesinghe S, et al. A novel form of JARID2 is required for differentiation in lineage-committed cells. EMBO J. 2019;38(3):e98449.
117. Lu W, Liu CC, Thottassery JV, Bu G, Li Y. Mesd is a universal inhibitor of Wnt coreceptors LRP5 and LRP6 and blocks Wnt/beta-catenin signaling in cancer cells. Biochemistry. 2010;49(22):4635-4643.
118. Bordicchia M, Spannella F, Ferretti G, et al. PCSK9 is ex-pressed in human visceral adipose tissue and regulated by insulin and cardiac natriuretic peptides. Int J Mol Sci. 2019;20(2):245.
119. Demers A, Samami S, Lauzier B, et al. PCSK9 induces CD36 degradation and affects long-chain fatty acid uptake and trigly-ceride metabolism in adipocytes and in mouse liver. Arterioscler Thromb Vasc Biol. 2015;35(12):2517-2525.
120. Dozio E, Ruscica M, Vianello E, et al. PCSK9 expres-sion in epicardial adipose tissue: molecular association
Dow
nloaded from https://academ
ic.oup.com/endo/article/162/7/bqab096/6272286 by guest on 09 January 2022
20 Endocrinology, 2021, Vol. 162, No. 7
with local tissue inflammation. Mediators Inflamm. 2020;2020:1348913.
121. Roubtsova A, Munkonda MN, Awan Z, et al. Circulating proprotein convertase subtilisin/kexin 9 (PCSK9) regulates VLDLR protein and triglyceride accumulation in visceral adi-pose tissue. Arterioscler Thromb Vasc Biol. 2011;31(4):785-791.
122. Carobbio S, Hagen RM, Lelliott CJ, et al. Adaptive changes of the Insig1/SREBP1/SCD1 set point help adipose tissue to cope with increased storage demands of obesity. Diabetes. 2013;62(11):3697-3708.
123. Michaud A, Lacroix-Pépin N, Pelletier M, et al. Expression of genes related to prostaglandin synthesis or signaling in human subcutaneous and omental adipose tissue: depot dif-ferences and modulation by adipogenesis. Mediators Inflamm. 2014;2014:451620.
124. Lefterova MI, Haakonsson AK, Lazar MA, Mandrup S. PPARγ and the global map of adipogenesis and beyond. Trends Endocrinol Metab. 2014;25(6):293-302.
125. Gustafson B, Hedjazifar S, Gogg S, Hammarstedt A, Smith U. Insulin resistance and impaired adipogenesis. Trends Endocrinol Metab. 2015;26(4):193-200.
126. Summers SA, Whiteman EL, Birnbaum MJ. Insulin signaling in the adipocyte. Int J Obes Relat Metab Disord. 2000;24 Suppl 4:S67-S70.
127. Ayala-Sumuano JT, Velez-Delvalle C, Beltrán-Langarica A, Marsch-Moreno M, Cerbón-Solorzano J, Kuri-Harcuch W. Srebf1a is a key regulator of transcriptional control for adipogenesis. Sci Rep. 2011;1:178.
128. Bauer S, Wanninger J, Schmidhofer S, et al. Sterol regulatory element-binding protein 2 (SREBP2) activation after excess tri-glyceride storage induces chemerin in hypertrophic adipocytes. Endocrinology. 2011;152(1):26-35.
129. Bertolio R, Napoletano F, Mano M, et al. Sterol regulatory ele-ment binding protein 1 couples mechanical cues and lipid me-tabolism. Nat Commun. 2019;10(1):1326.
130. Finck BN, Kelly DP. PGC-1 coactivators: inducible regulators of energy metabolism in health and disease. J Clin Invest. 2006;116(3):615-622.
131. Cuzzocrea S, Pisano B, Dugo L, et al. Rosiglitazone, a ligand of the peroxisome proliferator-activated receptor-gamma, reduces acute pancreatitis induced by cerulein. Intensive Care Med. 2004;30(5):951-956.
132. Choy L, Derynck R. Transforming growth factor-beta inhibits adipocyte differentiation by Smad3 interacting with CCAAT/enhancer-binding protein (C/EBP) and repressing C/EBP trans-activation function. J Biol Chem. 2003;278(11):9609-9619.
133. Shen H, Huang G, Hadi M, et al. Transforming growth factor-beta1 downregulation of Smad1 gene expression in rat hep-atic stellate cells. Am J Physiol Gastrointest Liver Physiol. 2003;285(3):G539-G546.
134. Zhao M, Chen X. Effect of lipopolysaccharides on adipogenic potential and premature senescence of adipocyte progenitors. Am J Physiol Endocrinol Metab. 2015;309(4):E334-E344.
135. Arner E, Westermark PO, Spalding KL, et al. Adipocyte turn-over: relevance to human adipose tissue morphology. Diabetes. 2010;59(1):105-109.
136. Kozusko K, Tsang V, Bottomley W, et al. Clinical and molecular characterization of a novel PLIN1 frameshift mutation identi-fied in patients with familial partial lipodystrophy. Diabetes. 2015;64(1):299-310.
137. Barroso I, Gurnell M, Crowley VE, et al. Dominant negative mutations in human PPARgamma associated with severe in-sulin resistance, diabetes mellitus and hypertension. Nature. 1999;402(6764):880-883.
138. Gustafson B, Smith U. The WNT inhibitor Dickkopf 1 and bone morphogenetic protein 4 rescue adipogenesis in hypertrophic obesity in humans. Diabetes. 2012;61(5):1217-1224.
139. Acosta JR, Douagi I, Andersson DP, et al. Increased fat cell size: a major phenotype of subcutaneous white adipose tissue in non-obese individuals with type 2 diabetes. Diabetologia. 2016;59(3):560-570.
140. Montaño A, Ordoñez JL, Alonso-Pérez V, et al. ETV6/RUNX1 fusion gene abrogation decreases the oncogenicity of tumour cells in a preclinical model of acute lymphoblastic leukaemia. Cells. 2020;9(1)215.
141. Jin GH, Shi Y, Tian Y, Cao TT, Mao Y, Tang TY. HMGA1 accelerates the malignant progression of gastric cancer through stimulating EMT. Eur Rev Med Pharmacol Sci. 2020;24(7):3642-3647.
142. Meyer AE, Furumo Q, Stelloh C, Minella AC, Rao S. Loss of Fbxw7 triggers mammary tumorigenesis associated with E2F/c-Myc activation and Trp53 mutation. Neoplasia. 2020;22(11):644-658.
143. Douchi D, Ohtsuka H, Ariake K, et al. Silencing of LRRFIP1 reverses the epithelial-mesenchymal transition via inhib-ition of the Wnt/β-catenin signaling pathway. Cancer Lett. 2015;365(1):132-140.
144. Hu X, Wang R, Ren Z, et al. MiR-26b suppresses hepatocellular carcinoma development by negatively regu-lating ZNRD1 and Wnt/β-catenin signaling. Cancer Med. 2019;8(17):7359-7371.
145. Persengiev SP, Zhu X, Green MR. Nonspecific, concentration-dependent stimulation and repression of mammalian gene expression by small interfering RNAs (siRNAs). Rna. 2004;10(1):12-18.
146. Peng JC, Valouev A, Swigut T, et al. Jarid2/Jumonji coordinates control of PRC2 enzymatic activity and target gene occupancy in pluripotent cells. Cell. 2009;139(7):1290-1302.
147. Sanulli S, Justin N, Teissandier A, et al. Jarid2 Methylation via the PRC2 Complex Regulates H3K27me3 Deposition during Cell Differentiation. Mol Cell. 2015;57(5):769-783.
148. Volcik KA, Zhu H, Finnell RH, Shaw GM, Canfield M, Lammer EJ. Evaluation of the jumonji gene and risk for spina bifida and congenital heart defects. Am J Med Genet A. 2004;126A(2):215-217.
149. Petrus P, Mejhert N, Corrales P, et al. Transforming growth factor-β3 regulates adipocyte number in subcutaneous white adipose tissue. Cell Rep. 2018;25(3):551-560.e5.
150. Boyd NH, Morgan JE, Greer SF. Polycomb recruitment at the class II transactivator gene. Mol Immunol. 2015;67(2 Pt B):482-491.
Dow
nloaded from https://academ
ic.oup.com/endo/article/162/7/bqab096/6272286 by guest on 09 January 2022