Embed Size (px)
Citation preview
Cyclase-associated protein 2 dimerizationregulates cofilin in synaptic plasticity andAlzheimer’s disease
Silvia Pelucchi,1,2,* Lina Vandermeulen,1,* Lara Pizzamiglio,3 Bahar Aksan,4 Jing Yan,4
Anja Konietzny,5 Elisa Bonomi,6 Barbara Borroni,6 Alessandro Padovani,6
Marco B. Rust,7,8,9 Daniele Di Marino,10 Marina Mikhaylova,5,11 Daniela Mauceri,4
Flavia Antonucci,3 Valeria Edefonti,12 Fabrizio Gardoni,1 Monica Di Luca1,† andElena Marcello1,†
*These authors are the co-first authors.
†These authors are the co-senior authors.
Regulation of actin cytoskeleton dynamics in dendritic spines is crucial for learning and memory formation. Hence, defects in the
actin cytoskeleton pathways are a biological trait of several brain diseases, including Alzheimer’s disease. Here, we describe a novel
synaptic mechanism governed by the cyclase-associated protein 2, which is required for structural plasticity phenomena and com-
pletely disrupted in Alzheimer’s disease. We report that the formation of cyclase-associated protein 2 dimers through its Cys32 is
important for cyclase-associated protein 2 binding to cofilin and for actin turnover. The Cys32-dependent cyclase-associated protein
2 homodimerization and association to cofilin are triggered by long-term potentiation and are required for long-term potentiation-
induced cofilin translocation into spines, spine remodelling and the potentiation of synaptic transmission. This mechanism is specif-
ically affected in the hippocampus, but not in the superior frontal gyrus, of both Alzheimer’s disease patients and APP/PS1 mice,
where cyclase-associated protein 2 is down-regulated and cyclase-associated protein 2 dimer synaptic levels are reduced. Notably,
cyclase-associated protein 2 levels in the cerebrospinal fluid are significantly increased in Alzheimer’s disease patients but not in
subjects affected by frontotemporal dementia. In Alzheimer’s disease hippocampi, cofilin association to cyclase-associated protein 2
dimer/monomer is altered and cofilin is aberrantly localized in spines. Taken together, these results provide novel insights into
structural plasticity mechanisms that are defective in Alzheimer’s disease.
1 Department of Pharmacological and Biomolecular Sciences, Universita degli Studi di Milano, Milan, Italy2 Department of Neurosciences, Psychology, Drug Research, and Child Health, University of Florence, Florence, Italy3 Department of Biotechnology and Translational Medicine, Universita degli Studi di Milano, Milan, Italy4 Department of Neurobiology, Interdisciplinary Centre for Neurosciences (IZN), Heidelberg University, INF 366 69120, Heidelberg,
Germany5 Emmy-Noether Group “Neuronal Protein Transport”, Center for Molecular Neurobiology Hamburg (ZMNH), University Medical
Center Hamburg-Eppendorf (UKE), Falkenried 94, 20251, Hamburg, Germany6 Neurology Unit, Centre for Neurodegenerative Disorders, Department of Clinical and Experimental Sciences, University of Brescia,
Brescia, Italy7 Faculty of Medicine, Molecular Neurobiology Group, Institute of Physiological Chemistry, University of Marburg, Marburg,
Germany8 DFG Research Training Group, Membrane Plasticity in Tissue Development and Remodeling, GRK 2213, Philipps-University of
Marburg, 35032, Marburg, Germany
Received January 24, 2020. Revised April 24, 2020. Accepted April 28, 2020. Advance Access publication June 26, 2020VC The Author(s) (2020). Published by Oxford University Press on behalf of the Guarantors of Brain.
This is an Open Access article distributed under the terms of the Creative Commons Attribution Non-Commercial License (http://creativecommons.org/licenses/by-nc/4.0/), which
permits non-commercial re-use, distribution, and reproduction in any medium, provided the original work is properly cited. For commercial re-use, please contact
BBRAIN COMMUNICATIONSAIN COMMUNICATIONSdoi:10.1093/braincomms/fcaa086 BRAIN COMMUNICATIONS 2020: Page 1 of 25 | 1
Dow
nloaded from https://academ
ic.oup.com/braincom
ms/article/2/2/fcaa086/5863245 by guest on 24 July 2022
9 Center for Mind, Brain and Behavior (CMBB), University of Marburg and Justus-Liebig-University Giessen, Hans-Meerwein-Strasse6, 35032, Marburg, Germany
10 Department of Life and Environmental Sciences, New York-Marche Structural Biology Center (NY-MaSBiC), Polytechnic Universityof Marche, Via Brecce Bianche, Ancona, Italy
11 Research Group “Optobiology”, Institute for Biology, Humboldt-Universitat zu Berlin, Invalidenstraße 42, 10115 Berlin, Germany12 Department of Clinical Sciences and Community Health, Branch of Medical Statistics, Biometry, and Epidemiology “G.A.
Maccacaro”, Universita degli Studi di Milano, Milan, Italy
Correspondence to: Monica Di Luca, Department of Pharmacological and Biomolecular Sciences,
Universita degli Studi di Milano, via Balzaretti 9, 20133 Milan, Italy
E-mail: [email protected]
Keywords: dementia, synapse, actin, cytoskeleton
Abbreviations: AMPA¼ a-amino-3-hydroxy-5-methyl-4-isoxazolepropionic acid; CAP2¼ cyclase-associated protein 2; CSF¼cerebrospinal fluid; F-actin¼ filamentous actin; G-actin¼ globular actin; HC¼ healthy controls; LTD¼ long-term depression;LTP¼ long-term potentiation; PLA¼proximity ligation assay; PSD-95¼ postsynaptic density protein 95; PSD¼postsynaptic den-sities; rAAV¼ recombinant adeno-associated virus; SFG¼ superior frontal gyrus; shr¼ shRNA-resistant; shRNA¼ small hairpinRNA; SIM¼ structured illumination microscopy; SS¼ synaptic stimulation; TIF¼ triton-insoluble fraction; WB¼western blot;WT¼wild-type
IntroductionDendritic spines are small dendritic protrusions contain-
ing excitatory postsynaptic machinery (Bourne and
Harris, 2008). Since changes in spine morphology ac-
count for functional differences at the synaptic level
(Yuste and Bonhoeffer, 2001), spine remodelling and
modifications in spine density are believed to be import-
ant for learning and memory (Holtmaat and Svoboda,
2009) and are thereby associated with brain diseases
characterized by cognitive decline, including Alzheimer’s
Disease (Penzes et al., 2011). Indeed, it is widely accepted
that spines constitute the anatomical locus of plasticity,
where short-term alterations in synaptic strength are con-
verted into long-lasting changes that are embedded in sta-
ble structural modifications (Sala and Segal, 2014).
Hence, spine structural plasticity is tightly coordinated
with synaptic function and plasticity: spine enlargement
parallels modification of the number, types and properties
of surface glutamate a-amino-3-hydroxy-5-methyl-4-isoxa-
zolepropionic acid (AMPA) receptors during long-term
potentiation (LTP), whereas during long-term depression
(LTD) the decrease in synaptic strength is associated with
spine shrinkage (Kasai et al., 2010).
In this frame, the actin cytoskeleton is important for
postsynaptic structure, function and plasticity as it con-
fers spine plasticity and stability (Cingolani and Goda,
2008; Hotulainen and Hoogenraad, 2010; Pelucchi et al.,
2020). Actin is highly enriched in spines and filamentous
actin (F-actin) is the major structural backbone of spines
since it forms organized bundles in spine necks (Star
et al., 2002). Only a relatively small fraction of actin in
spines is stable (Kasai et al., 2010), while the most abun-
dant dynamic fraction of the actin cytoskeleton provides
the driving force behind structural remodelling of spines
and contributes to synaptic plasticity (Matus, 2005).
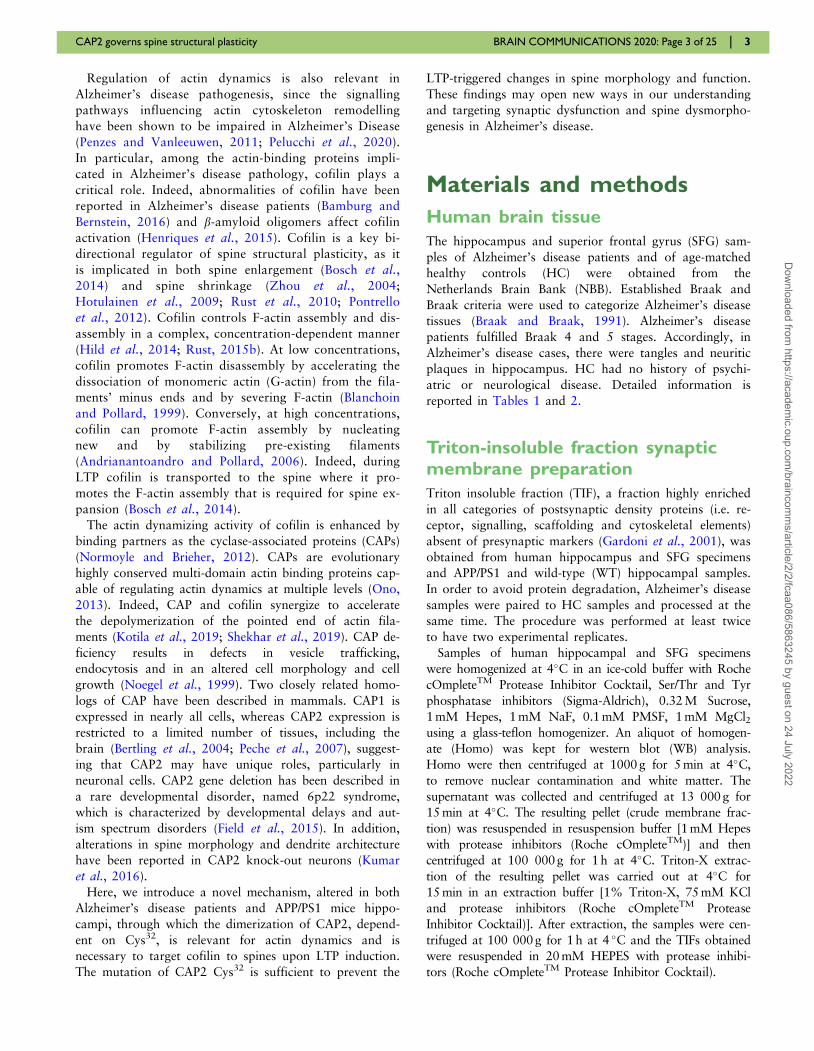
Graphical Abstract
2 | BRAIN COMMUNICATIONS 2020: Page 2 of 25 S. Pelucchi et al.
Dow
nloaded from https://academ
ic.oup.com/braincom
ms/article/2/2/fcaa086/5863245 by guest on 24 July 2022
Regulation of actin dynamics is also relevant in
Alzheimer’s disease pathogenesis, since the signalling
pathways influencing actin cytoskeleton remodelling
have been shown to be impaired in Alzheimer’s Disease
(Penzes and Vanleeuwen, 2011; Pelucchi et al., 2020).
In particular, among the actin-binding proteins impli-
cated in Alzheimer’s disease pathology, cofilin plays a
critical role. Indeed, abnormalities of cofilin have been
reported in Alzheimer’s disease patients (Bamburg and
Bernstein, 2016) and b-amyloid oligomers affect cofilin
activation (Henriques et al., 2015). Cofilin is a key bi-
directional regulator of spine structural plasticity, as it
is implicated in both spine enlargement (Bosch et al.,
2014) and spine shrinkage (Zhou et al., 2004;
Hotulainen et al., 2009; Rust et al., 2010; Pontrello
et al., 2012). Cofilin controls F-actin assembly and dis-
assembly in a complex, concentration-dependent manner
(Hild et al., 2014; Rust, 2015b). At low concentrations,
cofilin promotes F-actin disassembly by accelerating the
dissociation of monomeric actin (G-actin) from the fila-
ments’ minus ends and by severing F-actin (Blanchoin
and Pollard, 1999). Conversely, at high concentrations,
cofilin can promote F-actin assembly by nucleating
new and by stabilizing pre-existing filaments
(Andrianantoandro and Pollard, 2006). Indeed, during
LTP cofilin is transported to the spine where it pro-
motes the F-actin assembly that is required for spine ex-
pansion (Bosch et al., 2014).
The actin dynamizing activity of cofilin is enhanced by
binding partners as the cyclase-associated proteins (CAPs)
(Normoyle and Brieher, 2012). CAPs are evolutionary
highly conserved multi-domain actin binding proteins cap-
able of regulating actin dynamics at multiple levels (Ono,
2013). Indeed, CAP and cofilin synergize to accelerate
the depolymerization of the pointed end of actin fila-
ments (Kotila et al., 2019; Shekhar et al., 2019). CAP de-
ficiency results in defects in vesicle trafficking,
endocytosis and in an altered cell morphology and cell
growth (Noegel et al., 1999). Two closely related homo-
logs of CAP have been described in mammals. CAP1 is
expressed in nearly all cells, whereas CAP2 expression is
restricted to a limited number of tissues, including the
brain (Bertling et al., 2004; Peche et al., 2007), suggest-
ing that CAP2 may have unique roles, particularly in
neuronal cells. CAP2 gene deletion has been described in
a rare developmental disorder, named 6p22 syndrome,
which is characterized by developmental delays and aut-
ism spectrum disorders (Field et al., 2015). In addition,
alterations in spine morphology and dendrite architecture
have been reported in CAP2 knock-out neurons (Kumar
et al., 2016).
Here, we introduce a novel mechanism, altered in both
Alzheimer’s disease patients and APP/PS1 mice hippo-
campi, through which the dimerization of CAP2, depend-
ent on Cys32, is relevant for actin dynamics and is
necessary to target cofilin to spines upon LTP induction.
The mutation of CAP2 Cys32 is sufficient to prevent the
LTP-triggered changes in spine morphology and function.
These findings may open new ways in our understanding
and targeting synaptic dysfunction and spine dysmorpho-
genesis in Alzheimer’s disease.
Materials and methods
Human brain tissue
The hippocampus and superior frontal gyrus (SFG) sam-
ples of Alzheimer’s disease patients and of age-matched
healthy controls (HC) were obtained from the
Netherlands Brain Bank (NBB). Established Braak and
Braak criteria were used to categorize Alzheimer’s disease
tissues (Braak and Braak, 1991). Alzheimer’s disease
patients fulfilled Braak 4 and 5 stages. Accordingly, in
Alzheimer’s disease cases, there were tangles and neuritic
plaques in hippocampus. HC had no history of psychi-
atric or neurological disease. Detailed information is
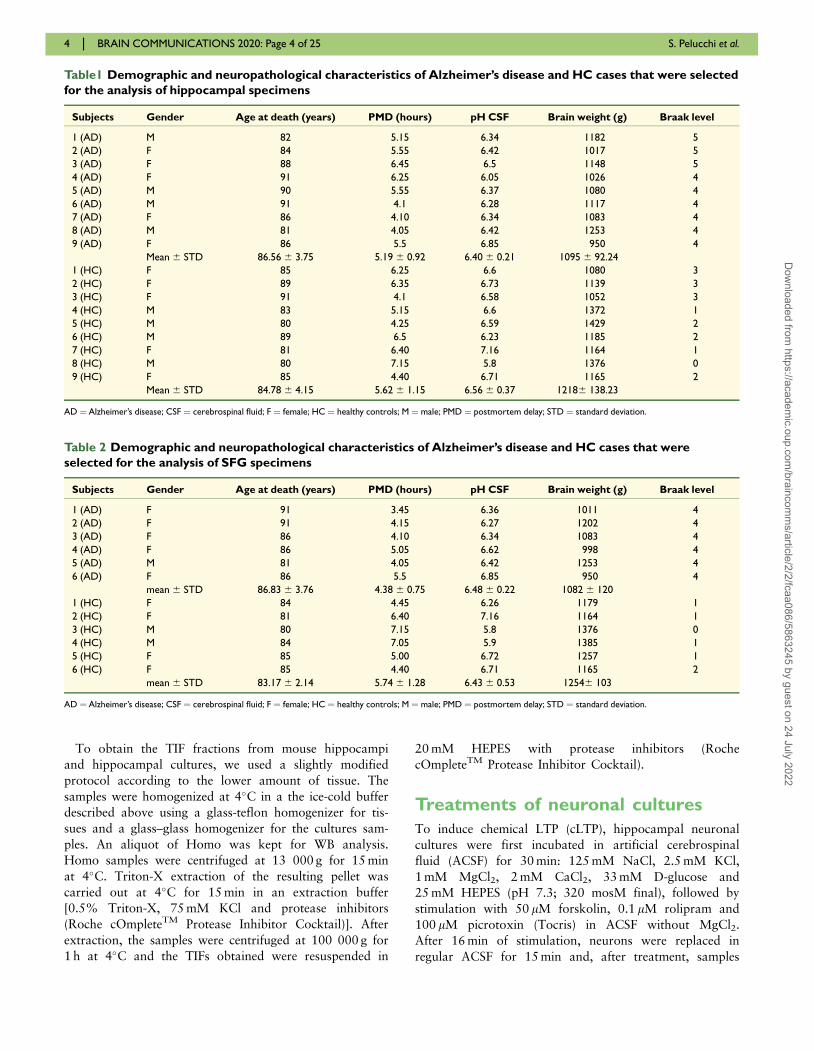
reported in Tables 1 and 2.
Triton-insoluble fraction synapticmembrane preparation
Triton insoluble fraction (TIF), a fraction highly enriched
in all categories of postsynaptic density proteins (i.e. re-
ceptor, signalling, scaffolding and cytoskeletal elements)
absent of presynaptic markers (Gardoni et al., 2001), was
obtained from human hippocampus and SFG specimens
and APP/PS1 and wild-type (WT) hippocampal samples.
In order to avoid protein degradation, Alzheimer’s disease
samples were paired to HC samples and processed at the
same time. The procedure was performed at least twice
to have two experimental replicates.
Samples of human hippocampal and SFG specimens
were homogenized at 4�C in an ice-cold buffer with Roche
cOmpleteTM Protease Inhibitor Cocktail, Ser/Thr and Tyr
phosphatase inhibitors (Sigma-Aldrich), 0.32 M Sucrose,
1 mM Hepes, 1 mM NaF, 0.1 mM PMSF, 1 mM MgCl2using a glass-teflon homogenizer. An aliquot of homogen-
ate (Homo) was kept for western blot (WB) analysis.
Homo were then centrifuged at 1000 g for 5 min at 4�C,
to remove nuclear contamination and white matter. The
supernatant was collected and centrifuged at 13 000 g for
15 min at 4�C. The resulting pellet (crude membrane frac-
tion) was resuspended in resuspension buffer [1 mM Hepes
with protease inhibitors (Roche cOmpleteTM)] and then
centrifuged at 100 000 g for 1 h at 4�C. Triton-X extrac-
tion of the resulting pellet was carried out at 4�C for
15 min in an extraction buffer [1% Triton-X, 75 mM KCl
and protease inhibitors (Roche cOmpleteTM Protease
Inhibitor Cocktail)]. After extraction, the samples were cen-
trifuged at 100 000 g for 1 h at 4 �C and the TIFs obtained
were resuspended in 20 mM HEPES with protease inhibi-
tors (Roche cOmpleteTM Protease Inhibitor Cocktail).
CAP2 governs spine structural plasticity BRAIN COMMUNICATIONS 2020: Page 3 of 25 | 3
Dow
nloaded from https://academ
ic.oup.com/braincom
ms/article/2/2/fcaa086/5863245 by guest on 24 July 2022
To obtain the TIF fractions from mouse hippocampi
and hippocampal cultures, we used a slightly modified
protocol according to the lower amount of tissue. The
samples were homogenized at 4�C in a the ice-cold buffer
described above using a glass-teflon homogenizer for tis-
sues and a glass–glass homogenizer for the cultures sam-
ples. An aliquot of Homo was kept for WB analysis.
Homo samples were centrifuged at 13 000 g for 15 min
at 4�C. Triton-X extraction of the resulting pellet was
carried out at 4�C for 15 min in an extraction buffer
[0.5% Triton-X, 75 mM KCl and protease inhibitors
(Roche cOmpleteTM Protease Inhibitor Cocktail)]. After
extraction, the samples were centrifuged at 100 000 g for
1 h at 4�C and the TIFs obtained were resuspended in
20 mM HEPES with protease inhibitors (Roche
cOmpleteTM Protease Inhibitor Cocktail).
Treatments of neuronal cultures
To induce chemical LTP (cLTP), hippocampal neuronal
cultures were first incubated in artificial cerebrospinal
fluid (ACSF) for 30 min: 125 mM NaCl, 2.5 mM KCl,
1 mM MgCl2, 2 mM CaCl2, 33 mM D-glucose and
25 mM HEPES (pH 7.3; 320 mosM final), followed by
stimulation with 50 lM forskolin, 0.1 lM rolipram and
100 lM picrotoxin (Tocris) in ACSF without MgCl2.
After 16 min of stimulation, neurons were replaced in
regular ACSF for 15 min and, after treatment, samples
Table1 Demographic and neuropathological characteristics of Alzheimer’s disease and HC cases that were selected
for the analysis of hippocampal specimens
Subjects Gender Age at death (years) PMD (hours) pH CSF Brain weight (g) Braak level
1 (AD) M 82 5.15 6.34 1182 5
2 (AD) F 84 5.55 6.42 1017 5
3 (AD) F 88 6.45 6.5 1148 5
4 (AD) F 91 6.25 6.05 1026 4
5 (AD) M 90 5.55 6.37 1080 4
6 (AD) M 91 4.1 6.28 1117 4
7 (AD) F 86 4.10 6.34 1083 4
8 (AD) M 81 4.05 6.42 1253 4
9 (AD) F 86 5.5 6.85 950 4
Mean 6 STD 86.56 6 3.75 5.19 6 0.92 6.40 6 0.21 1095 6 92.24
1 (HC) F 85 6.25 6.6 1080 3
2 (HC) F 89 6.35 6.73 1139 3
3 (HC) F 91 4.1 6.58 1052 3
4 (HC) M 83 5.15 6.6 1372 1
5 (HC) M 80 4.25 6.59 1429 2
6 (HC) M 89 6.5 6.23 1185 2
7 (HC) F 81 6.40 7.16 1164 1
8 (HC) M 80 7.15 5.8 1376 0
9 (HC) F 85 4.40 6.71 1165 2
Mean 6 STD 84.78 6 4.15 5.62 6 1.15 6.56 6 0.37 12186 138.23
AD ¼ Alzheimer’s disease; CSF ¼ cerebrospinal fluid; F ¼ female; HC ¼ healthy controls; M ¼ male; PMD ¼ postmortem delay; STD ¼ standard deviation.
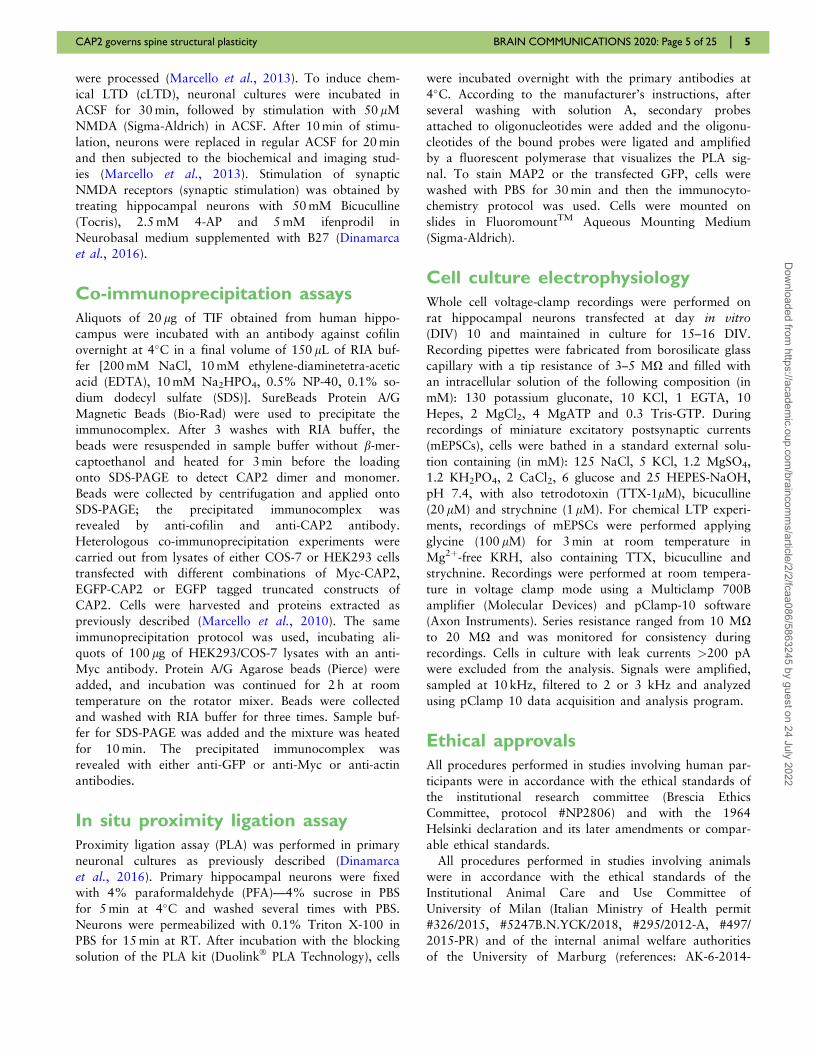
Table 2 Demographic and neuropathological characteristics of Alzheimer’s disease and HC cases that were
selected for the analysis of SFG specimens
Subjects Gender Age at death (years) PMD (hours) pH CSF Brain weight (g) Braak level
1 (AD) F 91 3.45 6.36 1011 4
2 (AD) F 91 4.15 6.27 1202 4
3 (AD) F 86 4.10 6.34 1083 4
4 (AD) F 86 5.05 6.62 998 4
5 (AD) M 81 4.05 6.42 1253 4
6 (AD) F 86 5.5 6.85 950 4
mean 6 STD 86.83 6 3.76 4.38 6 0.75 6.48 6 0.22 1082 6 120
1 (HC) F 84 4.45 6.26 1179 1
2 (HC) F 81 6.40 7.16 1164 1
3 (HC) M 80 7.15 5.8 1376 0
4 (HC) M 84 7.05 5.9 1385 1
5 (HC) F 85 5.00 6.72 1257 1
6 (HC) F 85 4.40 6.71 1165 2
mean 6 STD 83.17 6 2.14 5.74 6 1.28 6.43 6 0.53 12546 103
AD ¼ Alzheimer’s disease; CSF ¼ cerebrospinal fluid; F ¼ female; HC ¼ healthy controls; M ¼ male; PMD ¼ postmortem delay; STD ¼ standard deviation.
4 | BRAIN COMMUNICATIONS 2020: Page 4 of 25 S. Pelucchi et al.
Dow
nloaded from https://academ
ic.oup.com/braincom
ms/article/2/2/fcaa086/5863245 by guest on 24 July 2022
were processed (Marcello et al., 2013). To induce chem-
ical LTD (cLTD), neuronal cultures were incubated in
ACSF for 30 min, followed by stimulation with 50 lM
NMDA (Sigma-Aldrich) in ACSF. After 10 min of stimu-
lation, neurons were replaced in regular ACSF for 20 min
and then subjected to the biochemical and imaging stud-
ies (Marcello et al., 2013). Stimulation of synaptic
NMDA receptors (synaptic stimulation) was obtained by
treating hippocampal neurons with 50 mM Bicuculline
(Tocris), 2.5 mM 4-AP and 5 mM ifenprodil in
Neurobasal medium supplemented with B27 (Dinamarca
et al., 2016).
Co-immunoprecipitation assays
Aliquots of 20 lg of TIF obtained from human hippo-
campus were incubated with an antibody against cofilin
overnight at 4�C in a final volume of 150 lL of RIA buf-
fer [200 mM NaCl, 10 mM ethylene-diaminetetra-acetic
acid (EDTA), 10 mM Na2HPO4, 0.5% NP-40, 0.1% so-
dium dodecyl sulfate (SDS)]. SureBeads Protein A/G
Magnetic Beads (Bio-Rad) were used to precipitate the
immunocomplex. After 3 washes with RIA buffer, the
beads were resuspended in sample buffer without b-mer-
captoethanol and heated for 3 min before the loading
onto SDS-PAGE to detect CAP2 dimer and monomer.
Beads were collected by centrifugation and applied onto
SDS-PAGE; the precipitated immunocomplex was
revealed by anti-cofilin and anti-CAP2 antibody.
Heterologous co-immunoprecipitation experiments were
carried out from lysates of either COS-7 or HEK293 cells
transfected with different combinations of Myc-CAP2,
EGFP-CAP2 or EGFP tagged truncated constructs of
CAP2. Cells were harvested and proteins extracted as
previously described (Marcello et al., 2010). The same
immunoprecipitation protocol was used, incubating ali-
quots of 100 lg of HEK293/COS-7 lysates with an anti-
Myc antibody. Protein A/G Agarose beads (Pierce) were
added, and incubation was continued for 2 h at room
temperature on the rotator mixer. Beads were collected
and washed with RIA buffer for three times. Sample buf-
fer for SDS-PAGE was added and the mixture was heated
for 10 min. The precipitated immunocomplex was
revealed with either anti-GFP or anti-Myc or anti-actin
antibodies.
In situ proximity ligation assay
Proximity ligation assay (PLA) was performed in primary
neuronal cultures as previously described (Dinamarca
et al., 2016). Primary hippocampal neurons were fixed
with 4% paraformaldehyde (PFA)—4% sucrose in PBS
for 5 min at 4�C and washed several times with PBS.
Neurons were permeabilized with 0.1% Triton X-100 in
PBS for 15 min at RT. After incubation with the blocking
solution of the PLA kit (DuolinkVR PLA Technology), cells
were incubated overnight with the primary antibodies at
4�C. According to the manufacturer’s instructions, after
several washing with solution A, secondary probes
attached to oligonucleotides were added and the oligonu-
cleotides of the bound probes were ligated and amplified
by a fluorescent polymerase that visualizes the PLA sig-
nal. To stain MAP2 or the transfected GFP, cells were
washed with PBS for 30 min and then the immunocyto-
chemistry protocol was used. Cells were mounted on
slides in FluoromountTM Aqueous Mounting Medium
(Sigma-Aldrich).
Cell culture electrophysiology
Whole cell voltage-clamp recordings were performed on
rat hippocampal neurons transfected at day in vitro(DIV) 10 and maintained in culture for 15–16 DIV.
Recording pipettes were fabricated from borosilicate glass
capillary with a tip resistance of 3–5 MX and filled with
an intracellular solution of the following composition (in
mM): 130 potassium gluconate, 10 KCl, 1 EGTA, 10
Hepes, 2 MgCl2, 4 MgATP and 0.3 Tris-GTP. During
recordings of miniature excitatory postsynaptic currents
(mEPSCs), cells were bathed in a standard external solu-
tion containing (in mM): 125 NaCl, 5 KCl, 1.2 MgSO4,
1.2 KH2PO4, 2 CaCl2, 6 glucose and 25 HEPES-NaOH,
pH 7.4, with also tetrodotoxin (TTX-1lM), bicuculline
(20 lM) and strychnine (1 lM). For chemical LTP experi-
ments, recordings of mEPSCs were performed applying
glycine (100 lM) for 3 min at room temperature in
Mg2þ-free KRH, also containing TTX, bicuculline and
strychnine. Recordings were performed at room tempera-
ture in voltage clamp mode using a Multiclamp 700B
amplifier (Molecular Devices) and pClamp-10 software
(Axon Instruments). Series resistance ranged from 10 MXto 20 MX and was monitored for consistency during
recordings. Cells in culture with leak currents >200 pA
were excluded from the analysis. Signals were amplified,
sampled at 10 kHz, filtered to 2 or 3 kHz and analyzed
using pClamp 10 data acquisition and analysis program.
Ethical approvals
All procedures performed in studies involving human par-
ticipants were in accordance with the ethical standards of
the institutional research committee (Brescia Ethics
Committee, protocol #NP2806) and with the 1964
Helsinki declaration and its later amendments or compar-
able ethical standards.
All procedures performed in studies involving animals
were in accordance with the ethical standards of the
Institutional Animal Care and Use Committee of
University of Milan (Italian Ministry of Health permit
#326/2015, #5247B.N.YCK/2018, #295/2012-A, #497/
2015-PR) and of the internal animal welfare authorities
of the University of Marburg (references: AK-6-2014-
CAP2 governs spine structural plasticity BRAIN COMMUNICATIONS 2020: Page 5 of 25 | 5
Dow
nloaded from https://academ
ic.oup.com/braincom
ms/article/2/2/fcaa086/5863245 by guest on 24 July 2022
Rust), at which the studies were conducted. Animals
were maintained on a 12-h light/dark cycle in a tempera-
ture-controlled room (22�C) in cages with free access to
food and water. Housing in the animal facility is per-
formed in conformity with local and European
Community regulations under the control of veterinarians
with the assistance of trained personnel.
Experimental design andquantification of data
To minimize the possibility of bias in experimental
results, randomization and blinding were used in the ex-
perimental design, imaging acquisitions and analyses.
Acquisition and quantification of western blotting was
performed by means of computer-assisted imaging
(ChemiDoc system and Image lab 4.0 software; Bio-Rad).
Data obtained by coimmunoprecipitation assays were
normalized on the amount of immunoprecipitated pro-
tein. As far as concern imaging analysis, cells were ran-
domly chosen from at least two cultures. Morphological
analysis of dendritic spines was performed on the total
length of the dendrites using ImageJ software to measure
spine length, head and neck width (Malinverno et al.,
2010). Sholl analysis was performed using Fiji free soft-
ware as described in Mauceri et al. (2011).
Cofilin spine localization analysis was carried out
assuming that the spine volume and the amount of fusion
protein were proportional to the integrated intensity of
the RFP signal (Bosch et al., 2014). Z-stack images were
processed and analysed using Nikon Elements software
and ImageJ. To analyse the distribution of PSD-95 and
Bassoon within the spine, a line was drawn across the
spine head semi-perpendicular to the dendrite, and the
proteins intensity profiles were evaluated (Smith et al.,2014). The analysis of PLA experiments was performed
with ImageJ software and the number of clusters was
normalized on the total dendritic length. Total internal
reflection fluorescence image analysis was done using Fiji.
For spontaneous depolymerization, kymographs of single
filaments (30–50 filaments per condition) were generated
and depolymerization rates were calculated from the
slope of the graphs. To assess cofilin cutting rates, at
least 30 filaments in the frame were selected.
Statistical analysis
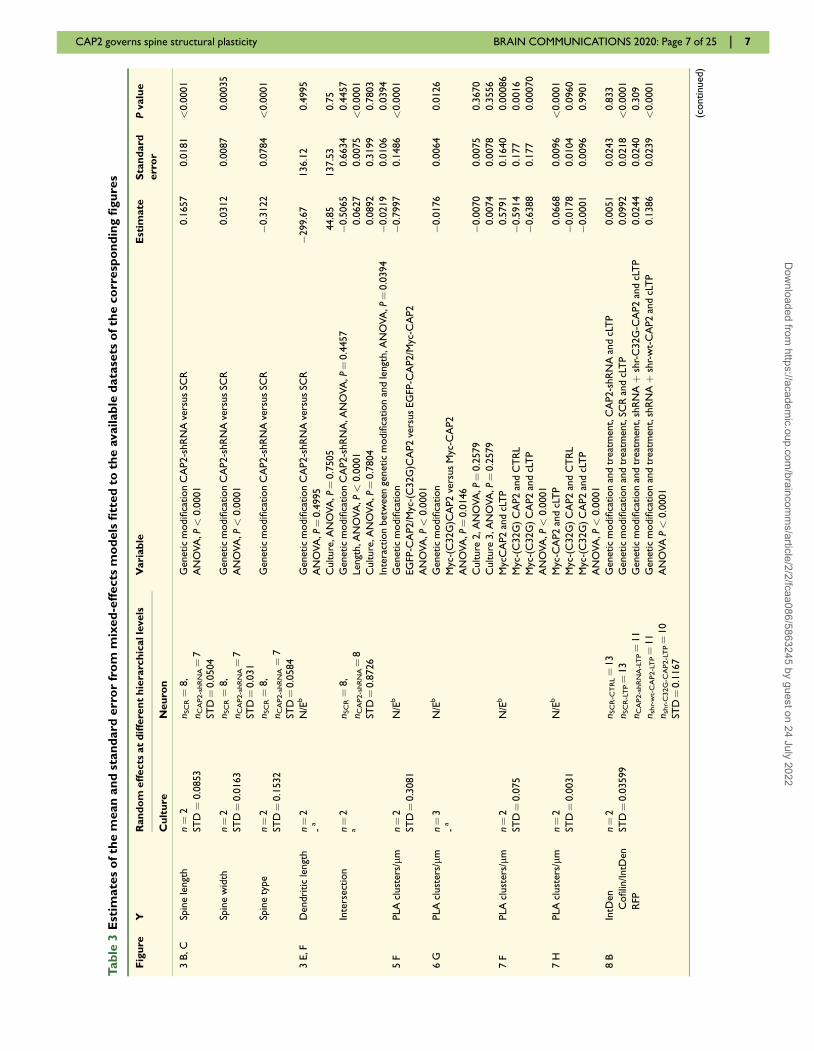
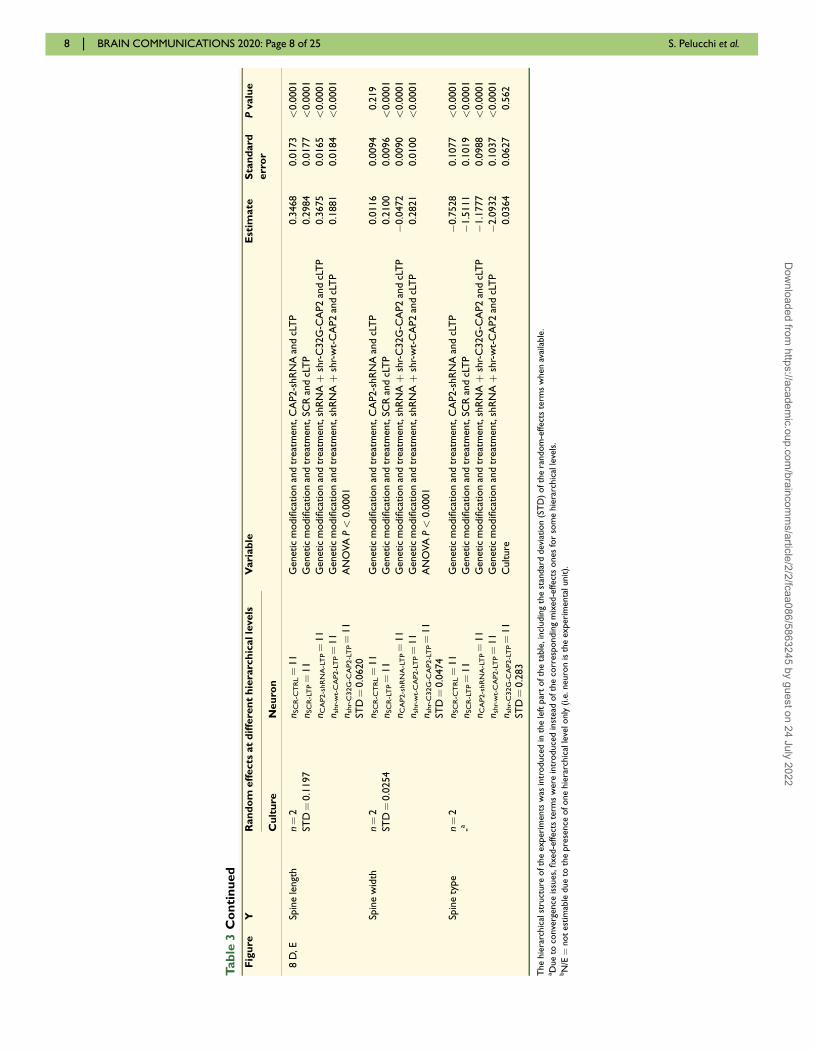
Linear mixed-effects (LMMs) models were used in most
of the imaging experiments (Tables 3 and 4) as outcome
variables were mostly continuous. To account for the
hierarchical structure of dendritic spine morphology
designs, we specified one mixed-effects model (Pinheiro
and Bates, 2006) for each experiment under investigation
and outcome variable of interest within the experiment
(Paternoster et al., 2018). Generalized linear mixed-effects
models with a logit link function and binomial family
were fitted for the Type outcome variable in the experi-
ments assessing spine morphology; in these analyses, the
outcome variable was restricted to assume categories
Mushroom (reference category) and Stubby only. For
each mixed-effects model, one or two random intercepts
were specified depending on the available levels of the
hierarchy. The culture random intercept was present in
any model, whereas the neuron level of the hierarchy
was present when the experimental unit of analysis was
spine and it was not estimable when neuron itself was
the experimental unit. Correlations between random
effects were allowed to be present and fitted within the
model to better capture the hierarchical structure of the
experiment. We reported information on which dependent
and independent variables were used within each mixed-
effects model in Table 3 (columns on the left). For model
fitting, restricted maximum likelihood (REML) estimates
were used, as they provided better estimates of variance
components. To test model assumptions, we plotted resid-
uals versus fitted values for each model; when outliers
were detected, they were checked at the experimental
level. When model convergence issues persisted after
changing the estimation method, we fitted an equivalent
model showing a fixed-effects term instead of the corre-
sponding mixed-effect one. If two hierarchical levels were
available in the experiment, the fitted model was still a
mixed-effects model splitting the hierarchical levels into
one random- and one fixed-effect term; when neuron was
the experimental unit, a fixed-effects model was estimated
using ordinary least squares method. Hypothesis testing
on the significance of single parameters was performed
within the linear mixed-effects or generalized linear
mixed-effects models with a Student t distribution or a
Gaussian distribution, respectively. The F statistics from
the ANOVA analysis provided information on the overall
significance of the independent variables entered into
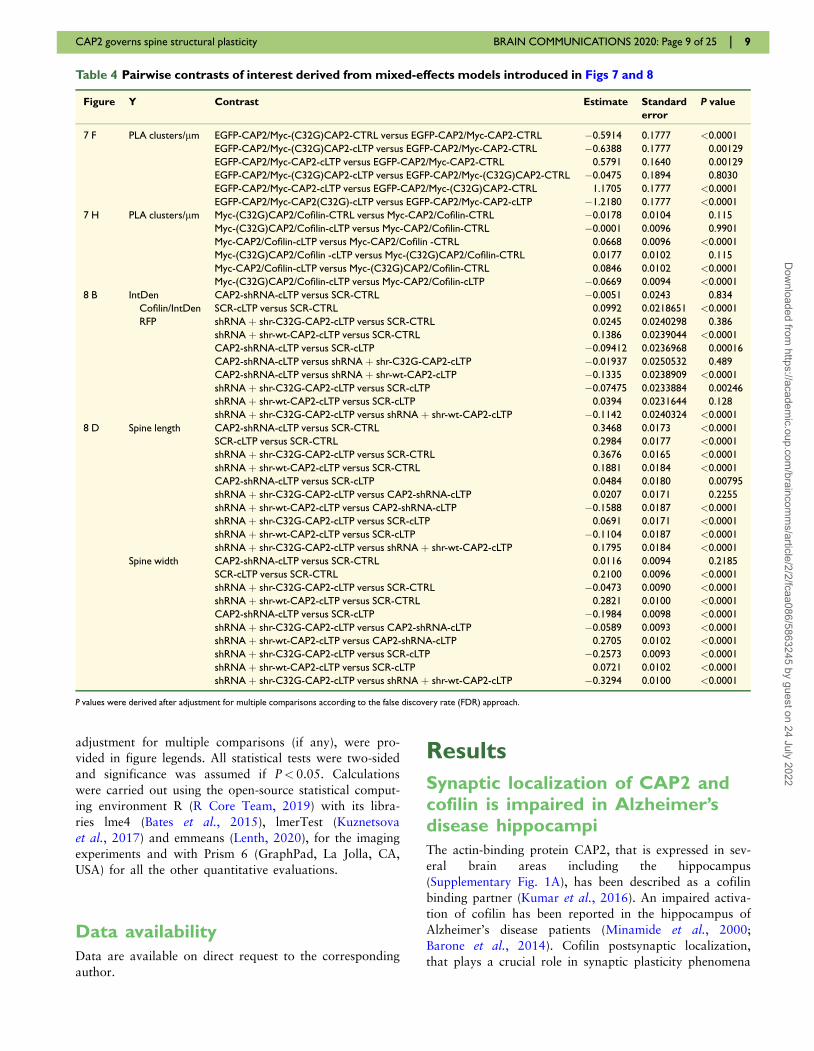
each model. When necessary, contrasts of interest were
extracted from the linear mixed-effects to calculate esti-
mated mean differences and Standard errors (SEs) be-
tween any pair of categories of the effect of interest. The
corresponding P-values were adjusted for multiple com-
parisons according to the False Discovery Rate (FDR) or
Benjamini–Hochberg method (Table 4) (Benjamini and
Hochberg, 1995). Finally, the chi-squared test of inde-
pendence was used to assess the presence of an associ-
ation between spine type and genetic modification.
For all the other experiments, as data followed a nor-
mal distribution, either Student t-test or one-way
ANOVA, followed by a post hoc adjustment, were car-
ried out.
Throughout the manuscript, when continuous variables
were considered, values were reported as mean 6 SE,
and when qualitative variables were analysed, absolute
frequencies (raw numbers) or percentages were indicated.
The type of parametric test used for each experiment and
the corresponding P-values, as well the type of
6 | BRAIN COMMUNICATIONS 2020: Page 6 of 25 S. Pelucchi et al.
Dow
nloaded from https://academ
ic.oup.com/braincom
ms/article/2/2/fcaa086/5863245 by guest on 24 July 2022
Tab
le3
Est
imate
so
fth
em
ean
an
dst
an
dard
err
or
fro
mm
ixed
-eff
ects
mo
dels
fitt
ed
toth
eavailab
led
ata
sets
ofth
eco
rresp
on
din
gfi
gu
res
Fig
ure
YR
an
do
meff
ects
at
dif
fere
nt
hie
rarc
hic
alle
vels
Vari
ab
leE
stim
ate
Sta
nd
ard
err
or
Pvalu
e
Cu
ltu
reN
eu
ron
3B,C
Spin
ele
ngt
hn¼
2
STD¼
0.0
853
n SC
R¼
8,
n CA
P2-s
hR
NA¼
7
STD¼
0.0
504
Genet
icm
odifi
cation
CA
P2-s
hR
NA
vers
us
SCR
AN
OVA
,P<
0.0
001
0.1
657
0.0
181
<0.0
001
Spin
ew
idth
n¼
2
STD¼
0.0
163
n SC
R¼
8,
n CA
P2-s
hR
NA¼
7
STD¼
0.0
31
Genet
icm
odifi
cation
CA
P2-s
hR
NA
vers
us
SCR
AN
OVA
,P<
0.0
001
0.0
312
0.0
087
0.0
0035
Spin
ety
pe
n¼
2
STD¼
0.1
532
n SC
R¼
8,
n CA
P2-s
hR
NA¼
7
STD¼
0.0
584
Genet
icm
odifi
cation
CA
P2-s
hR
NA
vers
us
SCR
�0.3
122
0.0
784
<0.0
001
3E,F
Dendri
tic
lengt
hn¼
2
-a
N/E
bG
enet
icm
odifi
cation
CA
P2-s
hR
NA
vers
us
SCR
AN
OVA
,P¼
0.4
995
�299.6
7136.1
20.4
995
Culture
,A
NO
VA
,P¼
0.7
505
44.8
5137.5
30.7
5
Inte
rsect
ion
n¼
2a
n SC
R¼
8,
n CA
P2-s
hR
NA¼
8
STD¼
0.8
726
Genet
icm
odifi
cation
CA
P2-s
hR
NA
,AN
OVA
,P¼
0.4
457
�0.5
065
0.6
634
0.4
457
Lengt
h,A
NO
VA
,P<
0.0
001
0.0
627
0.0
075
<0.0
001
Culture
,A
NO
VA
,P¼
0.7
804
0.0
892
0.3
199
0.7
803
Inte
ract
ion
betw
een
genet
icm
odifi
cation
and
lengt
h,A
NO
VA
,P¼
0.0
394
�0.0
219
0.0
106
0.0
394
5F
PLA
clust
ers/
lmn¼
2
STD¼
0.3
081
N/E
bG
enet
icm
odifi
cation
EG
FP-C
AP2/M
yc-(
C32G
)CA
P2
vers
us
EG
FP-C
AP2/M
yc-C
AP2
AN
OVA
,P<
0.0
001
�0.7
997
0.1
486
<0.0
001
6G
PLA
clust
ers/
lmn¼
3
-a
N/E
bG
enet
icm
odifi
cation
Myc
-(C
32G
)CA
P2
vers
us
Myc
-CA
P2
AN
OVA
,P¼
0.0
146
�0.0
176
0.0
064
0.0
126
Culture
2,A
NO
VA
,P¼
0.2
579
�0.0
070
0.0
075
0.3
670
Culture
3,A
NO
VA
,P¼
0.2
579
0.0
074
0.0
078
0.3
556
7F
PLA
clust
ers/
lmn¼
2
STD¼
0.0
75
N/E
bM
ycC
AP2
and
cLT
P0.5
791
0.1
640
0.0
0086
Myc
-(C
32G
)C
AP2
and
CT
RL
�0.5
914
0.1
77
0.0
016
Myc
-(C
32G
)C
AP2
and
cLT
P�
0.6
388
0.1
77
0.0
0070
AN
OVA
,P<
0.0
001
7H
PLA
clust
ers/
lmn¼
2
STD¼
0.0
031
N/E
bM
yc-C
AP2
and
cLT
P0.0
668
0.0
096
<0.0
001
Myc
-(C
32G
)C
AP2
and
CT
RL
�0.0
178
0.0
104
0.0
960
Myc
-(C
32G
)C
AP2
and
cLT
P�
0.0
001
0.0
096
0.9
901
AN
OVA
,P<
0.0
001
8B
IntD
en
Cofilin
/IntD
en
RFP
n¼
2
STD¼
0.0
3599
n SC
R-C
TR
L¼
13
n SC
R-L
TP¼
13
n CA
P2-s
hR
NA
-LT
P¼
11
n shr-
wt-
CA
P2-L
TP¼
11
n shr-
C32G
-CA
P2-L
TP¼
10
STD¼
0.1
167
Genet
icm
odifi
cation
and
treat
men
t,C
AP2-s
hR
NA
and
cLT
P0.0
051
0.0
243
0.8
33
Genet
icm
odifi
cation
and
treat
men
t,SC
Ran
dcL
TP
0.0
992
0.0
218
<0.0
001
Genet
icm
odifi
cation
and
treat
men
t,sh
RN
Aþ
shr-
C32G
-CA
P2
and
cLT
P0.0
244
0.0
240
0.3
09
Genet
icm
odifi
cation
and
treat
men
t,sh
RN
Aþ
shr-
wt-
CA
P2
and
cLT
P0.1
386
0.0
239
<0.0
001
AN
OVA
P<
0.0
001
(continued)
CAP2 governs spine structural plasticity BRAIN COMMUNICATIONS 2020: Page 7 of 25 | 7
Dow
nloaded from https://academ
ic.oup.com/braincom
ms/article/2/2/fcaa086/5863245 by guest on 24 July 2022
Tab
le3
Co
nti
nu
ed
Fig
ure
YR
an
do
meff
ects
at
dif
fere
nt
hie
rarc
hic
alle
vels
Vari
ab
leE
stim
ate
Sta
nd
ard
err
or
Pvalu
e
Cu
ltu
reN
eu
ron
8D
,ESp
ine
lengt
hn¼
2
STD¼
0.1
197
n SC
R-C
TR
L¼
11
n SC
R-L
TP¼
11
n CA
P2-s
hR
NA
-LT
P¼
11
n shr-
wt-
CA
P2-L
TP¼
11
n shr-
C32G
-CA
P2-L
TP¼
11
STD¼
0.0
620
Genet
icm
odifi
cation
and
treat
men
t,C
AP2-s
hR
NA
and
cLT
P0.3
468
0.0
173
<0.0
001
Genet
icm
odifi
cation
and
treat
men
t,SC
Ran
dcL
TP
0.2
984
0.0
177
<0.0
001
Genet
icm
odifi
cation
and
treat
men
t,sh
RN
Aþ
shr-
C32G
-CA
P2
and
cLT
P0.3
675
0.0
165
<0.0
001
Genet
icm
odifi
cation
and
treat
men
t,sh
RN
Aþ
shr-
wt-
CA
P2
and
cLT
P0.1
881
0.0
184
<0.0
001
AN
OVA
P<
0.0
001
Spin
ew
idth
n¼
2
STD¼
0.0
254
n SC
R-C
TR
L¼
11
n SC
R-L
TP¼
11
n CA
P2-s
hR
NA
-LT
P¼
11
n shr-
wt-
CA
P2-L
TP¼
11
n shr-
C32G
-CA
P2-L
TP¼
11
STD¼
0.0
474
Genet
icm
odifi
cation
and
treat
men
t,C
AP2-s
hR
NA
and
cLT
P0.0
116
0.0
094
0.2
19
Genet
icm
odifi
cation
and
treat
men
t,SC
Ran
dcL
TP
0.2
100
0.0
096
<0.0
001
Genet
icm
odifi
cation
and
treat
men
t,sh
RN
Aþ
shr-
C32G
-CA
P2
and
cLT
P�
0.0
472
0.0
090
<0.0
001
Genet
icm
odifi
cation
and
treat
men
t,sh
RN
Aþ
shr-
wt-
CA
P2
and
cLT
P0.2
821
0.0
100
<0.0
001
AN
OVA
P<
0.0
001
Spin
ety
pe
n¼
2
-a
n SC
R-C
TR
L¼
11
n SC
R-L
TP¼
11
n CA
P2-s
hR
NA
-LT
P¼
11
n shr-
wt-
CA
P2-L
TP¼
11
n shr-
C32G
-CA
P2-L
TP¼
11
STD¼
0.2
83
Genet
icm
odifi
cation
and
treat
men
t,C
AP2-s
hR
NA
and
cLT
P�
0.7
528
0.1
077
<0.0
001
Genet
icm
odifi
cation
and
treat
men
t,SC
Ran
dcL
TP
�1.5
111
0.1
019
<0.0
001
Genet
icm
odifi
cation
and
treat
men
t,sh
RN
Aþ
shr-
C32G
-CA
P2
and
cLT
P�
1.1
777
0.0
988
<0.0
001
Genet
icm
odifi
cation
and
treat
men
t,sh
RN
Aþ
shr-
wt-
CA
P2
and
cLT
P�
2.0
932
0.1
037
<0.0
001
Culture
0.0
364
0.0
627
0.5
62
The
hie
rarc
hic
alst
ruct
ure
ofth
eexperi
ments
was
intr
oduce
din
the
left
par
tofth
eta
ble
,in
cludin
gth
est
andar
ddev
iation
(ST
D)
ofth
era
ndom
-effect
ste
rms
when
avai
lable
.aD
ue
toco
nve
rgence
issu
es,
fixed-e
ffect
ste
rms
were
intr
oduce
din
stead
ofth
eco
rres
pondin
gm
ixed-e
ffect
sones
for
som
ehie
rarc
hic
alle
vels
.bN
/E¼
not
est
imab
ledue
toth
epre
sence
ofone
hie
rarc
hic
alle
velo
nly
(i.e
.neuro
nis
the
experi
menta
lunit).
8 | BRAIN COMMUNICATIONS 2020: Page 8 of 25 S. Pelucchi et al.
Dow
nloaded from https://academ
ic.oup.com/braincom
ms/article/2/2/fcaa086/5863245 by guest on 24 July 2022
adjustment for multiple comparisons (if any), were pro-
vided in figure legends. All statistical tests were two-sided
and significance was assumed if P< 0.05. Calculations
were carried out using the open-source statistical comput-
ing environment R (R Core Team, 2019) with its libra-
ries lme4 (Bates et al., 2015), lmerTest (Kuznetsova
et al., 2017) and emmeans (Lenth, 2020), for the imaging
experiments and with Prism 6 (GraphPad, La Jolla, CA,
USA) for all the other quantitative evaluations.
Data availability
Data are available on direct request to the corresponding
author.
Results
Synaptic localization of CAP2 andcofilin is impaired in Alzheimer’sdisease hippocampi
The actin-binding protein CAP2, that is expressed in sev-
eral brain areas including the hippocampus
(Supplementary Fig. 1A), has been described as a cofilin
binding partner (Kumar et al., 2016). An impaired activa-
tion of cofilin has been reported in the hippocampus of
Alzheimer’s disease patients (Minamide et al., 2000;
Barone et al., 2014). Cofilin postsynaptic localization,
that plays a crucial role in synaptic plasticity phenomena
Table 4 Pairwise contrasts of interest derived from mixed-effects models introduced in Figs 7 and 8
Figure Y Contrast Estimate Standard
error
P value
7 F PLA clusters/lm EGFP-CAP2/Myc-(C32G)CAP2-CTRL versus EGFP-CAP2/Myc-CAP2-CTRL �0.5914 0.1777 <0.0001
EGFP-CAP2/Myc-(C32G)CAP2-cLTP versus EGFP-CAP2/Myc-CAP2-CTRL �0.6388 0.1777 0.00129
EGFP-CAP2/Myc-CAP2-cLTP versus EGFP-CAP2/Myc-CAP2-CTRL 0.5791 0.1640 0.00129
EGFP-CAP2/Myc-(C32G)CAP2-cLTP versus EGFP-CAP2/Myc-(C32G)CAP2-CTRL �0.0475 0.1894 0.8030
EGFP-CAP2/Myc-CAP2-cLTP versus EGFP-CAP2/Myc-(C32G)CAP2-CTRL 1.1705 0.1777 <0.0001
EGFP-CAP2/Myc-CAP2(C32G)-cLTP versus EGFP-CAP2/Myc-CAP2-cLTP �1.2180 0.1777 <0.0001
7 H PLA clusters/lm Myc-(C32G)CAP2/Cofilin-CTRL versus Myc-CAP2/Cofilin-CTRL �0.0178 0.0104 0.115
Myc-(C32G)CAP2/Cofilin-cLTP versus Myc-CAP2/Cofilin-CTRL �0.0001 0.0096 0.9901
Myc-CAP2/Cofilin-cLTP versus Myc-CAP2/Cofilin -CTRL 0.0668 0.0096 <0.0001
Myc-(C32G)CAP2/Cofilin -cLTP versus Myc-(C32G)CAP2/Cofilin-CTRL 0.0177 0.0102 0.115
Myc-CAP2/Cofilin-cLTP versus Myc-(C32G)CAP2/Cofilin-CTRL 0.0846 0.0102 <0.0001
Myc-(C32G)CAP2/Cofilin-cLTP versus Myc-CAP2/Cofilin-cLTP �0.0669 0.0094 <0.0001
8 B IntDen
Cofilin/IntDen
RFP
CAP2-shRNA-cLTP versus SCR-CTRL �0.0051 0.0243 0.834
SCR-cLTP versus SCR-CTRL 0.0992 0.0218651 <0.0001
shRNA þ shr-C32G-CAP2-cLTP versus SCR-CTRL 0.0245 0.0240298 0.386
shRNA þ shr-wt-CAP2-cLTP versus SCR-CTRL 0.1386 0.0239044 <0.0001
CAP2-shRNA-cLTP versus SCR-cLTP �0.09412 0.0236968 0.00016
CAP2-shRNA-cLTP versus shRNA þ shr-C32G-CAP2-cLTP �0.01937 0.0250532 0.489
CAP2-shRNA-cLTP versus shRNA þ shr-wt-CAP2-cLTP �0.1335 0.0238909 <0.0001
shRNA þ shr-C32G-CAP2-cLTP versus SCR-cLTP �0.07475 0.0233884 0.00246
shRNA þ shr-wt-CAP2-cLTP versus SCR-cLTP 0.0394 0.0231644 0.128
shRNA þ shr-C32G-CAP2-cLTP versus shRNA þ shr-wt-CAP2-cLTP �0.1142 0.0240324 <0.0001
8 D Spine length CAP2-shRNA-cLTP versus SCR-CTRL 0.3468 0.0173 <0.0001
SCR-cLTP versus SCR-CTRL 0.2984 0.0177 <0.0001
shRNA þ shr-C32G-CAP2-cLTP versus SCR-CTRL 0.3676 0.0165 <0.0001
shRNA þ shr-wt-CAP2-cLTP versus SCR-CTRL 0.1881 0.0184 <0.0001
CAP2-shRNA-cLTP versus SCR-cLTP 0.0484 0.0180 0.00795
shRNA þ shr-C32G-CAP2-cLTP versus CAP2-shRNA-cLTP 0.0207 0.0171 0.2255
shRNA þ shr-wt-CAP2-cLTP versus CAP2-shRNA-cLTP �0.1588 0.0187 <0.0001
shRNA þ shr-C32G-CAP2-cLTP versus SCR-cLTP 0.0691 0.0171 <0.0001
shRNA þ shr-wt-CAP2-cLTP versus SCR-cLTP �0.1104 0.0187 <0.0001
shRNA þ shr-C32G-CAP2-cLTP versus shRNA þ shr-wt-CAP2-cLTP 0.1795 0.0184 <0.0001
Spine width CAP2-shRNA-cLTP versus SCR-CTRL 0.0116 0.0094 0.2185
SCR-cLTP versus SCR-CTRL 0.2100 0.0096 <0.0001
shRNA þ shr-C32G-CAP2-cLTP versus SCR-CTRL �0.0473 0.0090 <0.0001
shRNA þ shr-wt-CAP2-cLTP versus SCR-CTRL 0.2821 0.0100 <0.0001
CAP2-shRNA-cLTP versus SCR-cLTP �0.1984 0.0098 <0.0001
shRNA þ shr-C32G-CAP2-cLTP versus CAP2-shRNA-cLTP �0.0589 0.0093 <0.0001
shRNA þ shr-wt-CAP2-cLTP versus CAP2-shRNA-cLTP 0.2705 0.0102 <0.0001
shRNA þ shr-C32G-CAP2-cLTP versus SCR-cLTP �0.2573 0.0093 <0.0001
shRNA þ shr-wt-CAP2-cLTP versus SCR-cLTP 0.0721 0.0102 <0.0001
shRNA þ shr-C32G-CAP2-cLTP versus shRNA þ shr-wt-CAP2-cLTP �0.3294 0.0100 <0.0001
P values were derived after adjustment for multiple comparisons according to the false discovery rate (FDR) approach.
CAP2 governs spine structural plasticity BRAIN COMMUNICATIONS 2020: Page 9 of 25 | 9
Dow
nloaded from https://academ
ic.oup.com/braincom
ms/article/2/2/fcaa086/5863245 by guest on 24 July 2022
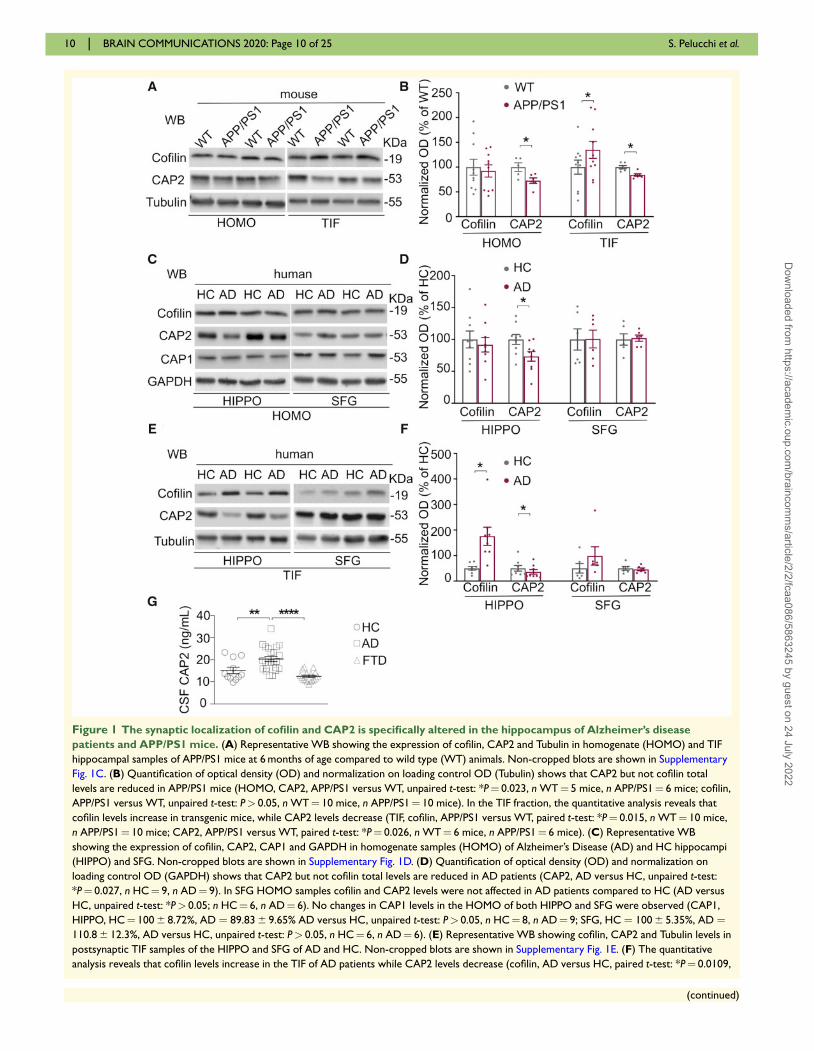
Figure 1 The synaptic localization of cofilin and CAP2 is specifically altered in the hippocampus of Alzheimer’s disease
patients and APP/PS1 mice. (A) Representative WB showing the expression of cofilin, CAP2 and Tubulin in homogenate (HOMO) and TIF
hippocampal samples of APP/PS1 mice at 6 months of age compared to wild type (WT) animals. Non-cropped blots are shown in Supplementary
Fig. 1C. (B) Quantification of optical density (OD) and normalization on loading control OD (Tubulin) shows that CAP2 but not cofilin total
levels are reduced in APP/PS1 mice (HOMO, CAP2, APP/PS1 versus WT, unpaired t-test: *P¼ 0.023, n WT¼ 5 mice, n APP/PS1¼ 6 mice; cofilin,
APP/PS1 versus WT, unpaired t-test: P> 0.05, n WT¼ 10 mice, n APP/PS1¼ 10 mice). In the TIF fraction, the quantitative analysis reveals that
cofilin levels increase in transgenic mice, while CAP2 levels decrease (TIF, cofilin, APP/PS1 versus WT, paired t-test: *P¼ 0.015, n WT¼ 10 mice,
n APP/PS1¼ 10 mice; CAP2, APP/PS1 versus WT, paired t-test: *P¼ 0.026, n WT¼ 6 mice, n APP/PS1¼ 6 mice). (C) Representative WB
showing the expression of cofilin, CAP2, CAP1 and GAPDH in homogenate samples (HOMO) of Alzheimer’s Disease (AD) and HC hippocampi
(HIPPO) and SFG. Non-cropped blots are shown in Supplementary Fig. 1D. (D) Quantification of optical density (OD) and normalization on
loading control OD (GAPDH) shows that CAP2 but not cofilin total levels are reduced in AD patients (CAP2, AD versus HC, unpaired t-test:
*P¼ 0.027, n HC¼ 9, n AD¼ 9). In SFG HOMO samples cofilin and CAP2 levels were not affected in AD patients compared to HC (AD versus
HC, unpaired t-test: *P> 0.05; n HC¼ 6, n AD¼ 6). No changes in CAP1 levels in the HOMO of both HIPPO and SFG were observed (CAP1,
HIPPO, HC¼ 100 6 8.72%, AD ¼ 89.83 6 9.65% AD versus HC, unpaired t-test: P> 0.05, n HC¼ 8, n AD¼ 9; SFG, HC ¼ 100 6 5.35%, AD ¼110.8 6 12.3%, AD versus HC, unpaired t-test: P> 0.05, n HC¼ 6, n AD¼ 6). (E) Representative WB showing cofilin, CAP2 and Tubulin levels in
postsynaptic TIF samples of the HIPPO and SFG of AD and HC. Non-cropped blots are shown in Supplementary Fig. 1E. (F) The quantitative
analysis reveals that cofilin levels increase in the TIF of AD patients while CAP2 levels decrease (cofilin, AD versus HC, paired t-test: *P¼ 0.0109,
10 | BRAIN COMMUNICATIONS 2020: Page 10 of 25 S. Pelucchi et al.
(continued)
Dow
nloaded from https://academ
ic.oup.com/braincom
ms/article/2/2/fcaa086/5863245 by guest on 24 July 2022
(Bosch et al., 2014; Mikhaylova et al., 2018), is not
altered in the frontal cortex of Alzheimer’s disease
patients and in the brain of animal models (Rush et al.,
2018). Considering that the hippocampus is one of the
first brain areas affected in Alzheimer’s disease patients
(Frisoni et al., 2010), we first assessed total and synaptic
levels of cofilin and CAP2 in the hippocampus of APP/
PS1 mice at 6 months of age, when they begin to develop
amyloid deposits (Jankowsky et al., 2004). We purified
the triton-insoluble fraction (TIF), which is highly
enriched in postsynaptic proteins (Gardoni et al., 2001).
WB analysis performed on the total homogenate and on
the TIF samples shows a significant increase in cofilin
synaptic levels in APP/PS1 mice hippocampi compared to
WT mice, while no changes in the total protein levels
were detected (Fig. 1A and B). Interestingly, the CAP2
protein levels in the total homogenate and, consistently,
in the postsynaptic fraction of APP/PS1 mice were signifi-
cantly reduced compared to WT mice (Fig. 1A and B).
These data suggest an altered synaptic availability of
cofilin and of its binding partner CAP2 in the hippocam-
pal synapses of APP/PS1 mice at the early stages of the
pathology.
To strengthen these results, and verify the relevance in
human pathology, we took advantage of autoptic speci-
mens obtained from sporadic Alzheimer’s Disease
patients, fulfilling criteria for Braak 4 and 5 stage, and
age-matched control subjects (HC) (Tables 1 and 2). In
particular, we examined hippocampus and SFG, two
areas differentially affected by the pathology.
The analysis of the total homogenate revealed no
changes in cofilin total protein levels and a significant
down-regulation of CAP2 in Alzheimer’s disease patients
hippocampi (Fig. 1C and D), as previously reported in
microarray studies (Blalock et al., 2004). This
Alzheimer’s disease-associated alteration of CAP2 is spe-
cific since no modifications in the total levels of the
homolog CAP1 have been detected in Alzheimer’s disease
patients’ hippocampi and SFG when compared to HC
(Fig. 1C and D). After the validation of the postsynaptic
fraction purification protocol from human specimens
(Supplementary Fig. 1B), we performed WB analysis of
the TIF samples. A significant increase in cofilin synaptic
levels and a concomitant decrease in CAP2 synaptic lo-
calization have been detected (Fig. 1E and F), as observed
in APP/PS1 hippocampi (Fig. 1A and B). Interestingly,
these alterations are specific for the hippocampus because
no modifications of CAP2 and cofilin total levels and
synaptic localization were found in SFG (Fig. 1 C–F),
consistent with previous data showing no changes of cofi-
lin levels in the postsynaptic densities (PSD) fraction of
the frontal cortex of Alzheimer’s disease patients (Rush
et al., 2018).
Furthermore, we challenged cerebrospinal fluid (CSF)
for the presence of CAP2. A preliminary screening experi-
ment of CAP2 levels in the CSF has been performed on
23 Alzheimer’s disease patients, 11 HC, 17 frontotempo-
ral dementia patients as non-Alzheimer’s disease neurode-
generative controls. CAP2 levels in Alzheimer’s disease
patients (20.34 6 1.12 ng/ml) were significantly higher
than in HC (15.13 6 1.45 ng/ml) and in frontotemporal
dementia patients (12.45 6 0.56 ng/ml) (Fig. 1G), suggest-
ing that the changes in CAP2 are specifically associated
to Alzheimer’s disease.
CAP2 is a synaptic protein relevantfor synaptic function and neuronalstructure
Since the Alzheimer’s disease-related alterations of CAP2
and cofilin have been detected in the postsynaptic com-
partment, we decided to further investigate CAP2 role in
dendritic spines. We employed stimulated emission deple-
tion nanoscopy to analyse primary hippocampal neurons
stained for endogenous CAP2, pre- and postsynaptic
markers and F-actin, labelled by phalloidin. Endogenous
CAP2 has a distribution pattern similar to phalloidin, is
localized throughout the dendrites and is detectable in
dendritic spines, as previously reported (Kumar et al.,
2016) (Supplementary Fig. 2A). A linescan through the
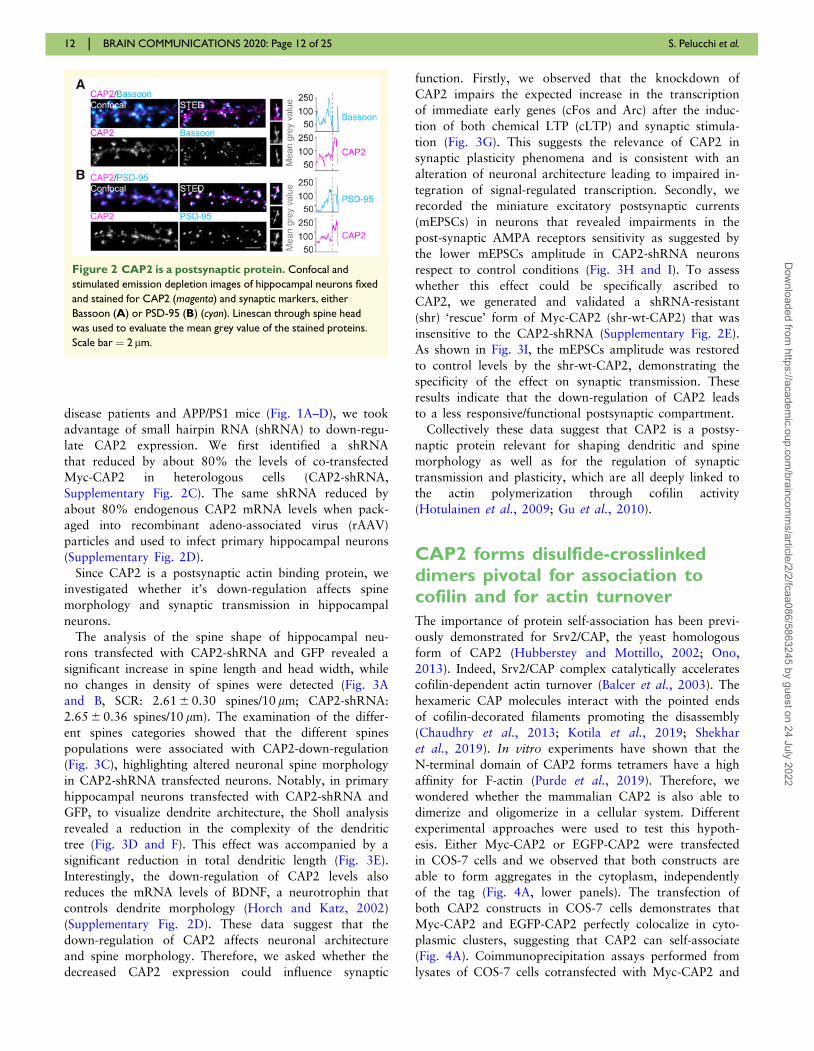
spine length shows that peaks of fluorescence for CAP2
and the presynaptic marker Bassoon do not overlap
(Fig. 2A), while CAP2 fluorescence profile shows a par-
tial overlap with the postsynaptic protein PSD-95 profile
(Fig. 2B) (Smith et al., 2014).
To further confirm the localization of CAP2 in the
postsynaptic compartment, we performed biochemical
fractionation of rat hippocampi to isolate the PSD. WB
analysis demonstrated that CAP2 is present in the synap-
tic fractions but not enriched in highly detergent-insoluble
fractions PSD2, which corresponds to the ‘core’ of the
PSD (Supplementary Fig. 2B).
To gain insights into the specific role of CAP2 in hip-
pocampal neuronal cells and considering the reduction of
CAP2 protein levels in the hippocampi of Alzheimer’s
Figure 1 Continued
n HC¼ 8, n AD¼ 8; CAP2, AD versus HC, paired t-test: *P¼ 0.0172, n HC¼ 8, n AD¼ 8). No significant modifications of cofilin and CAP2
synaptic localization were detected in the SFG (AD versus HC, paired t-test: *P> 0.05; n HC¼ 6, n AD¼ 6). (G) CSF concentration of CAP2 in
healthy controls (HC), Alzheimer’s Disease patients (AD) and frontotemporal dementia patients (FTD). CAP2 levels are higher in AD patients,
but not in FTD patients, compared to HC (HC: CAP2¼ 15.13 6 1.5 ng/ml, n¼ 11; AD: CAP2¼ 20.34 6 1.12 ng/ml, n¼ 23; FTD:
CAP2¼ 12.45 6 0.56 ng/ml, n¼ 17; one-way ANOVA, Bonferroni multiple comparison test: **P¼ 0.0075; ****P< 0.0001).
CAP2 governs spine structural plasticity BRAIN COMMUNICATIONS 2020: Page 11 of 25 | 11
Dow
nloaded from https://academ
ic.oup.com/braincom
ms/article/2/2/fcaa086/5863245 by guest on 24 July 2022
disease patients and APP/PS1 mice (Fig. 1A–D), we took
advantage of small hairpin RNA (shRNA) to down-regu-
late CAP2 expression. We first identified a shRNA
that reduced by about 80% the levels of co-transfected
Myc-CAP2 in heterologous cells (CAP2-shRNA,
Supplementary Fig. 2C). The same shRNA reduced by
about 80% endogenous CAP2 mRNA levels when pack-
aged into recombinant adeno-associated virus (rAAV)
particles and used to infect primary hippocampal neurons
(Supplementary Fig. 2D).
Since CAP2 is a postsynaptic actin binding protein, we
investigated whether it’s down-regulation affects spine
morphology and synaptic transmission in hippocampal
neurons.
The analysis of the spine shape of hippocampal neu-
rons transfected with CAP2-shRNA and GFP revealed a
significant increase in spine length and head width, while
no changes in density of spines were detected (Fig. 3A
and B, SCR: 2.61 6 0.30 spines/10 lm; CAP2-shRNA:
2.65 6 0.36 spines/10 lm). The examination of the differ-
ent spines categories showed that the different spines
populations were associated with CAP2-down-regulation
(Fig. 3C), highlighting altered neuronal spine morphology
in CAP2-shRNA transfected neurons. Notably, in primary
hippocampal neurons transfected with CAP2-shRNA and
GFP, to visualize dendrite architecture, the Sholl analysis
revealed a reduction in the complexity of the dendritic
tree (Fig. 3D and F). This effect was accompanied by a
significant reduction in total dendritic length (Fig. 3E).
Interestingly, the down-regulation of CAP2 levels also
reduces the mRNA levels of BDNF, a neurotrophin that
controls dendrite morphology (Horch and Katz, 2002)
(Supplementary Fig. 2D). These data suggest that the
down-regulation of CAP2 affects neuronal architecture
and spine morphology. Therefore, we asked whether the
decreased CAP2 expression could influence synaptic
function. Firstly, we observed that the knockdown of
CAP2 impairs the expected increase in the transcription
of immediate early genes (cFos and Arc) after the induc-
tion of both chemical LTP (cLTP) and synaptic stimula-
tion (Fig. 3G). This suggests the relevance of CAP2 in
synaptic plasticity phenomena and is consistent with an
alteration of neuronal architecture leading to impaired in-
tegration of signal-regulated transcription. Secondly, we
recorded the miniature excitatory postsynaptic currents
(mEPSCs) in neurons that revealed impairments in the
post-synaptic AMPA receptors sensitivity as suggested by
the lower mEPSCs amplitude in CAP2-shRNA neurons
respect to control conditions (Fig. 3H and I). To assess
whether this effect could be specifically ascribed to
CAP2, we generated and validated a shRNA-resistant
(shr) ‘rescue’ form of Myc-CAP2 (shr-wt-CAP2) that was
insensitive to the CAP2-shRNA (Supplementary Fig. 2E).
As shown in Fig. 3I, the mEPSCs amplitude was restored
to control levels by the shr-wt-CAP2, demonstrating the
specificity of the effect on synaptic transmission. These
results indicate that the down-regulation of CAP2 leads
to a less responsive/functional postsynaptic compartment.
Collectively these data suggest that CAP2 is a postsy-
naptic protein relevant for shaping dendritic and spine
morphology as well as for the regulation of synaptic
transmission and plasticity, which are all deeply linked to
the actin polymerization through cofilin activity
(Hotulainen et al., 2009; Gu et al., 2010).
CAP2 forms disulfide-crosslinkeddimers pivotal for association tocofilin and for actin turnover
The importance of protein self-association has been previ-
ously demonstrated for Srv2/CAP, the yeast homologous
form of CAP2 (Hubberstey and Mottillo, 2002; Ono,
2013). Indeed, Srv2/CAP complex catalytically accelerates
cofilin-dependent actin turnover (Balcer et al., 2003). The
hexameric CAP molecules interact with the pointed ends
of cofilin-decorated filaments promoting the disassembly
(Chaudhry et al., 2013; Kotila et al., 2019; Shekhar
et al., 2019). In vitro experiments have shown that the
N-terminal domain of CAP2 forms tetramers have a high
affinity for F-actin (Purde et al., 2019). Therefore, we
wondered whether the mammalian CAP2 is also able to
dimerize and oligomerize in a cellular system. Different
experimental approaches were used to test this hypoth-
esis. Either Myc-CAP2 or EGFP-CAP2 were transfected
in COS-7 cells and we observed that both constructs are
able to form aggregates in the cytoplasm, independently
of the tag (Fig. 4A, lower panels). The transfection of
both CAP2 constructs in COS-7 cells demonstrates that
Myc-CAP2 and EGFP-CAP2 perfectly colocalize in cyto-
plasmic clusters, suggesting that CAP2 can self-associate
(Fig. 4A). Coimmunoprecipitation assays performed from
lysates of COS-7 cells cotransfected with Myc-CAP2 and
Figure 2 CAP2 is a postsynaptic protein. Confocal and
stimulated emission depletion images of hippocampal neurons fixed
and stained for CAP2 (magenta) and synaptic markers, either
Bassoon (A) or PSD-95 (B) (cyan). Linescan through spine head
was used to evaluate the mean grey value of the stained proteins.
Scale bar ¼ 2 lm.
12 | BRAIN COMMUNICATIONS 2020: Page 12 of 25 S. Pelucchi et al.
Dow
nloaded from https://academ
ic.oup.com/braincom
ms/article/2/2/fcaa086/5863245 by guest on 24 July 2022
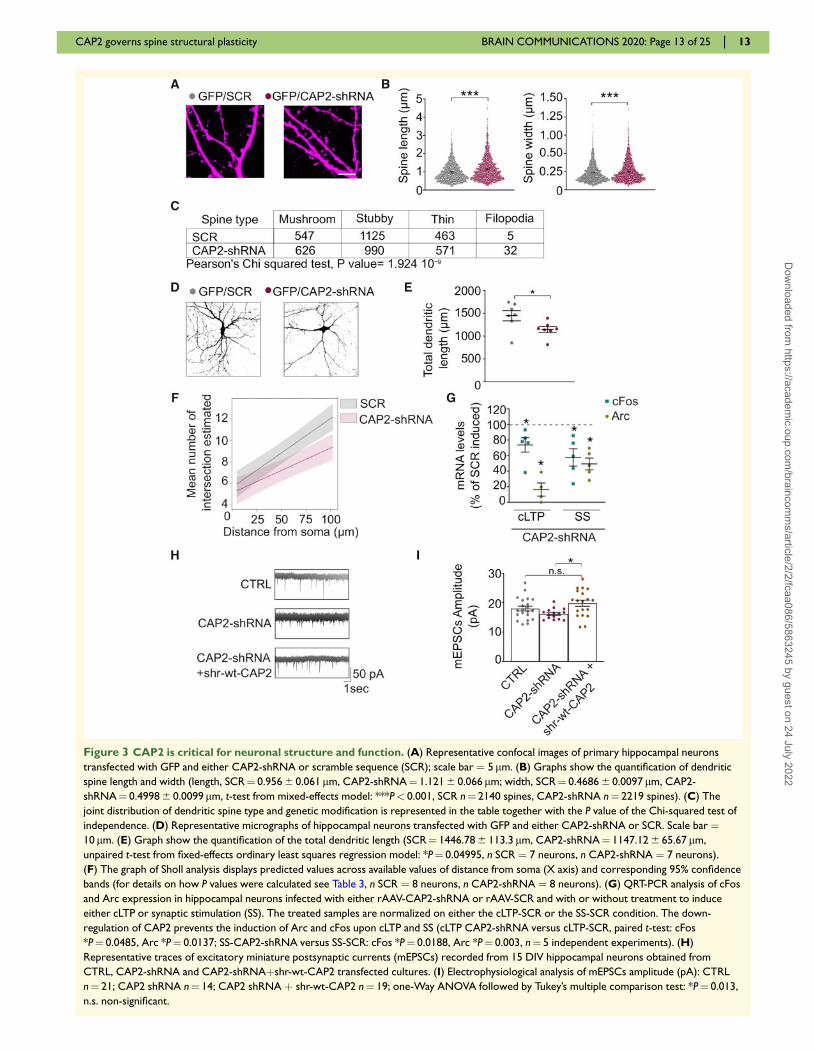
Figure 3 CAP2 is critical for neuronal structure and function. (A) Representative confocal images of primary hippocampal neurons
transfected with GFP and either CAP2-shRNA or scramble sequence (SCR); scale bar ¼ 5 lm. (B) Graphs show the quantification of dendritic
spine length and width (length, SCR¼ 0.956 6 0.061 lm, CAP2-shRNA¼ 1.121 6 0.066 lm; width, SCR¼ 0.4686 6 0.0097 lm, CAP2-
shRNA¼ 0.4998 6 0.0099 lm, t-test from mixed-effects model: ***P< 0.001, SCR n¼ 2140 spines, CAP2-shRNA n¼ 2219 spines). (C) The
joint distribution of dendritic spine type and genetic modification is represented in the table together with the P value of the Chi-squared test of
independence. (D) Representative micrographs of hippocampal neurons transfected with GFP and either CAP2-shRNA or SCR. Scale bar ¼10 lm. (E) Graph show the quantification of the total dendritic length (SCR¼ 1446.78 6 113.3 lm, CAP2-shRNA¼ 1147.12 6 65.67 lm,
unpaired t-test from fixed-effects ordinary least squares regression model: *P¼ 0.04995, n SCR ¼ 7 neurons, n CAP2-shRNA ¼ 7 neurons).
(F) The graph of Sholl analysis displays predicted values across available values of distance from soma (X axis) and corresponding 95% confidence
bands (for details on how P values were calculated see Table 3, n SCR ¼ 8 neurons, n CAP2-shRNA ¼ 8 neurons). (G) QRT-PCR analysis of cFos
and Arc expression in hippocampal neurons infected with either rAAV-CAP2-shRNA or rAAV-SCR and with or without treatment to induce
either cLTP or synaptic stimulation (SS). The treated samples are normalized on either the cLTP-SCR or the SS-SCR condition. The down-
regulation of CAP2 prevents the induction of Arc and cFos upon cLTP and SS (cLTP CAP2-shRNA versus cLTP-SCR, paired t-test: cFos
*P¼ 0.0485, Arc *P¼ 0.0137; SS-CAP2-shRNA versus SS-SCR: cFos *P¼ 0.0188, Arc *P¼ 0.003, n¼ 5 independent experiments). (H)
Representative traces of excitatory miniature postsynaptic currents (mEPSCs) recorded from 15 DIV hippocampal neurons obtained from
CTRL, CAP2-shRNA and CAP2-shRNAþshr-wt-CAP2 transfected cultures. (I) Electrophysiological analysis of mEPSCs amplitude (pA): CTRL
n¼ 21; CAP2 shRNA n¼ 14; CAP2 shRNA þ shr-wt-CAP2 n¼ 19; one-Way ANOVA followed by Tukey’s multiple comparison test: *P¼ 0.013,
n.s. non-significant.
CAP2 governs spine structural plasticity BRAIN COMMUNICATIONS 2020: Page 13 of 25 | 13
Dow
nloaded from https://academ
ic.oup.com/braincom
ms/article/2/2/fcaa086/5863245 by guest on 24 July 2022
EGFP-CAP2 confirmed that Myc-CAP2 interacts with
EGFP-CAP2 (Fig. 4B).
The full three-dimensional (3D) structure of the human
CAP2 is not available, but several studies have underlined
the multi-domains organization of the protein (Ono,
2013). The only structural information that can be useful
to propose a possible 3D organization of the CAP2 dimer
comes from the X-ray structure of the Helical Folded
Domain (HFD) of the CAP homolog from Dictyostelium
discoideum (Yusof et al., 2004). In details, this region is
composed of an initial Coiled-coil region followed by a
stable bundle of six antiparallel a-helices (HFD domain)
(Supplementary Fig. 3A). This region (i.e. Coiled-coil and
HFD) is not only conserved in CAP1 and CAP2 from
human and mouse but also in the homologous CAP
protein from Dictyostelium discoideum (Supplementary
Fig. 3B). This evidence strengthens the idea that the di-
merization/oligomerization of CAP2 is crucial for its cel-
lular functions, such as the interaction with other protein
partners (i.e. actin and cofilin).
To better characterize the region of CAP2 responsible
for the self-association, we transfected COS-7 cells with
Myc-CAP2 and either EGFP-CAP2 or the deletion mutant
EGFP-CAP2(1-311) deleted of the CARP domain or the
EGFP-CAP2(1-232) mutant lacking of the CARP domain,
the proline rich sequences and the WH2 region
(Peche et al., 2013) (Supplementary Fig. 3A).
Coimmunoprecipitation experiments revealed that CAP2
self-association depends on its N-terminal region, similar-
ly to what previously described for Srv2/CAP (Quintero-
Monzon et al., 2009) (Fig. 4B). To investigate the in-
volvement of N-terminus in CAP2-self-association, we
performed imaging analysis in COS-7. The deletion mu-
tant lacking the coiled-coil region and HFD, Myc-
CAP2(165-476), displayed a diffuse staining throughout
the cell, while Myc-CAP2 and Myc-CAP2(1-232) showed
a clustered cytoplasmic distribution (Fig. 4C). In addition,
coimmunoprecipitation assays confirmed that the deletion
of the region 1–164 significantly reduces the self-associ-
ation (Fig. 5A and B).
It has been recently demonstrated that CAP1 homodi-
merization depends on the formation of a disulfide bond
that requires the Cys29 of CAP1 (Liu et al., 2018).
Therefore, we verified the presence of a disulfide cross-
linked CAP2 dimer by loading an aliquot of hippocampal
homogenate onto a non-reducing SDS-PAGE. As shown
in Fig. 5C, both a band corresponding to CAP2 mono-
mer at 58 kDa and a species of CAP2 with an apparent
molecular weight of approximately double the CAP2
monomer (116 kDa) were detected. Importantly, the band
corresponding to CAP2 dimer was eliminated by DTT,
consistent with a disulfide cross-linked CAP2 dimer
(Fig. 5C). To exclude the possibility that intra- and inter-
molecular disulfide bonds were non-specifically formed
during the lysis process of the tissue, we carried-out the
homogenization of rat hippocampus using a buffer con-
taining iodoacetamide to protect free sulfhydryl groups.
The samples were loaded onto a non-reducing SDS-PAGE
and the WB analysis revealed the presence of both the
CAP2 monomer and the CAP2 DTT-sensitive dimer
(Supplementary Fig. 3C), thus confirming the existence of
specific CAP2 disulfide cross-linked dimers in the
hippocampus.
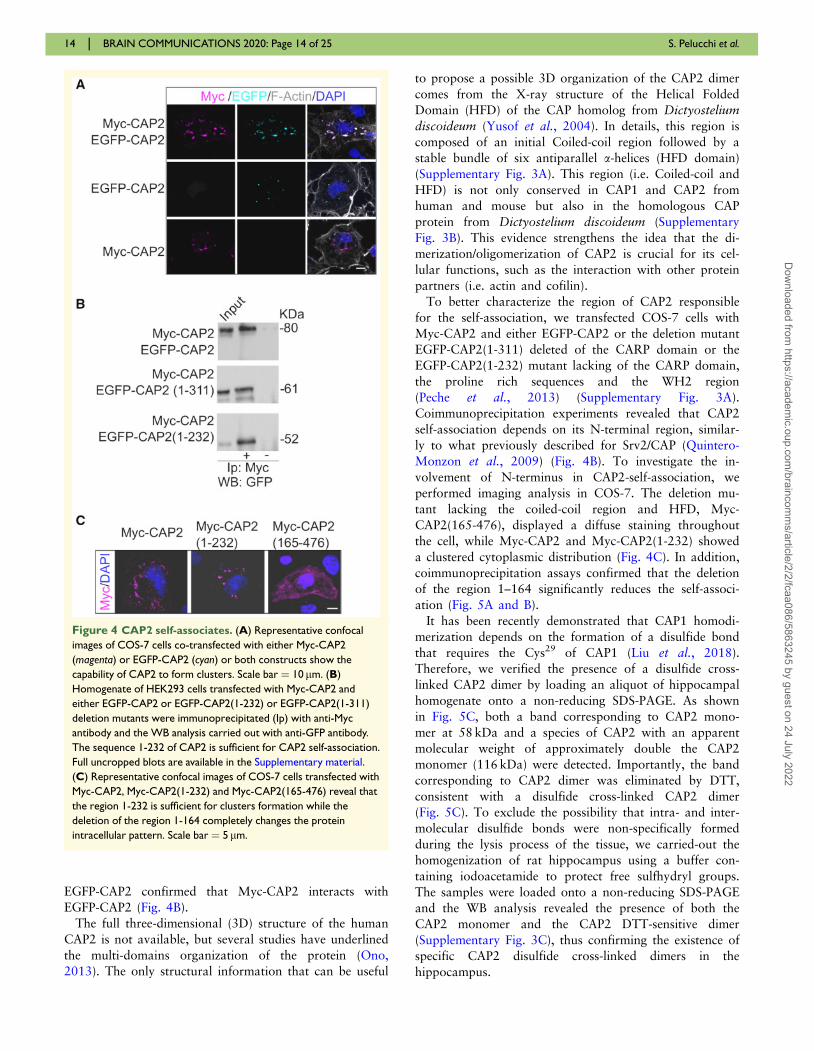
Figure 4 CAP2 self-associates. (A) Representative confocal
images of COS-7 cells co-transfected with either Myc-CAP2
(magenta) or EGFP-CAP2 (cyan) or both constructs show the
capability of CAP2 to form clusters. Scale bar ¼ 10 lm. (B)
Homogenate of HEK293 cells transfected with Myc-CAP2 and
either EGFP-CAP2 or EGFP-CAP2(1-232) or EGFP-CAP2(1-311)
deletion mutants were immunoprecipitated (Ip) with anti-Myc
antibody and the WB analysis carried out with anti-GFP antibody.
The sequence 1-232 of CAP2 is sufficient for CAP2 self-association.
Full uncropped blots are available in the Supplementary material.
(C) Representative confocal images of COS-7 cells transfected with
Myc-CAP2, Myc-CAP2(1-232) and Myc-CAP2(165-476) reveal that
the region 1-232 is sufficient for clusters formation while the
deletion of the region 1-164 completely changes the protein
intracellular pattern. Scale bar ¼ 5 lm.
14 | BRAIN COMMUNICATIONS 2020: Page 14 of 25 S. Pelucchi et al.
Dow
nloaded from https://academ
ic.oup.com/braincom
ms/article/2/2/fcaa086/5863245 by guest on 24 July 2022
To identify the region of CAP2 responsible for dimer-
ization, we transfected COS-7 cells with either Myc-
CAP2 or a deletion mutant lacking of the N-terminal
region [Myc-CAP2(165-476)] and the lysates were loaded
onto a non-reducing SDS-PAGE. As shown in Fig.5D,
CAP2 monomer and dimer were detectable when Myc-
CAP2 was expressed, while the deletion of the N-terminal
region [Myc-CAP2(165-476)] abolishes the CAP2 capabil-
ity to form dimers, demonstrating that this is the domain
involved in the dimerization. Interestingly, only one Cys
residue is present in the CAP2 region spanning from
amino acid 1 to 164. Notably, the Myc-CAP2 mutant
carrying the mutation of the Cys32 to Gly [Myc-
(C32G)CAP2] is not able to dimerize in non-reducing
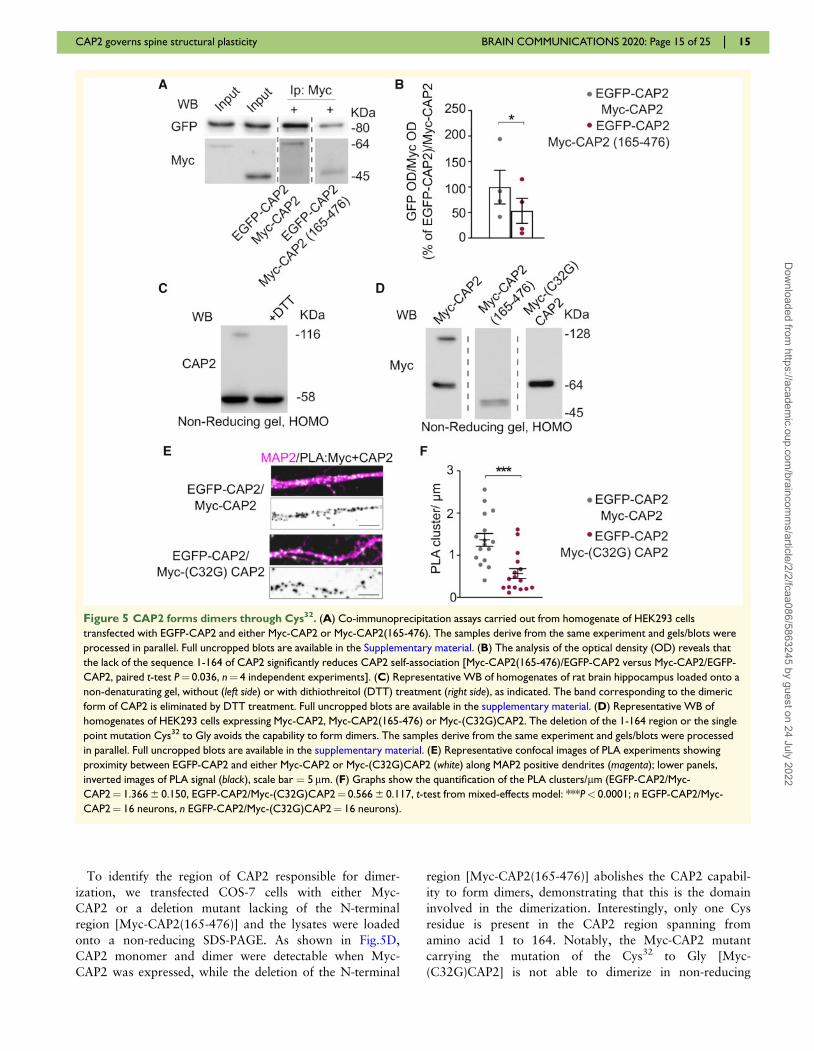
Figure 5 CAP2 forms dimers through Cys32. (A) Co-immunoprecipitation assays carried out from homogenate of HEK293 cells
transfected with EGFP-CAP2 and either Myc-CAP2 or Myc-CAP2(165-476). The samples derive from the same experiment and gels/blots were
processed in parallel. Full uncropped blots are available in the Supplementary material. (B) The analysis of the optical density (OD) reveals that
the lack of the sequence 1-164 of CAP2 significantly reduces CAP2 self-association [Myc-CAP2(165-476)/EGFP-CAP2 versus Myc-CAP2/EGFP-
CAP2, paired t-test P¼ 0.036, n¼ 4 independent experiments]. (C) Representative WB of homogenates of rat brain hippocampus loaded onto a
non-denaturating gel, without (left side) or with dithiothreitol (DTT) treatment (right side), as indicated. The band corresponding to the dimeric
form of CAP2 is eliminated by DTT treatment. Full uncropped blots are available in the supplementary material. (D) Representative WB of
homogenates of HEK293 cells expressing Myc-CAP2, Myc-CAP2(165-476) or Myc-(C32G)CAP2. The deletion of the 1-164 region or the single
point mutation Cys32 to Gly avoids the capability to form dimers. The samples derive from the same experiment and gels/blots were processed
in parallel. Full uncropped blots are available in the supplementary material. (E) Representative confocal images of PLA experiments showing
proximity between EGFP-CAP2 and either Myc-CAP2 or Myc-(C32G)CAP2 (white) along MAP2 positive dendrites (magenta); lower panels,
inverted images of PLA signal (black), scale bar ¼ 5 lm. (F) Graphs show the quantification of the PLA clusters/lm (EGFP-CAP2/Myc-
CAP2¼ 1.366 6 0.150, EGFP-CAP2/Myc-(C32G)CAP2¼ 0.566 6 0.117, t-test from mixed-effects model: ***P< 0.0001; n EGFP-CAP2/Myc-
CAP2¼ 16 neurons, n EGFP-CAP2/Myc-(C32G)CAP2¼ 16 neurons).
CAP2 governs spine structural plasticity BRAIN COMMUNICATIONS 2020: Page 15 of 25 | 15
Dow
nloaded from https://academ
ic.oup.com/braincom
ms/article/2/2/fcaa086/5863245 by guest on 24 July 2022
SDS-PAGE (Fig. 5D). To strengthen these data, we per-
formed a PLA in hippocampal neurons transfected with
EGFP-CAP2 and either Myc-CAP2 or Myc-(C32G)CAP2.
In neurons expressing EGFP-CAP2 and Myc-CAP2, a
large number of PLA signals were detected when the two
antibodies anti-GFP and anti-Myc were used, indicating
that these two CAP2 constructs are in close proximity to
each other along MAP2-positive dendrites (Fig. 5E). In
neurons transfected with EGFP-CAP2 and the mutant
Myc-(C32G)CAP2, the density of PLA signals significantly
decreased when compared to cells overexpressing EGFP-
CAP2 and Myc-CAP2 (Fig. 5F). For control experiments,
only the anti-Myc primary antibody was used and no
PLA signal was generated (Supplementary Fig. 3D).
Overall, these findings suggest that the Cys32 is funda-
mental for the formation of CAP2 dimers and for CAP2
clustering in neurons.
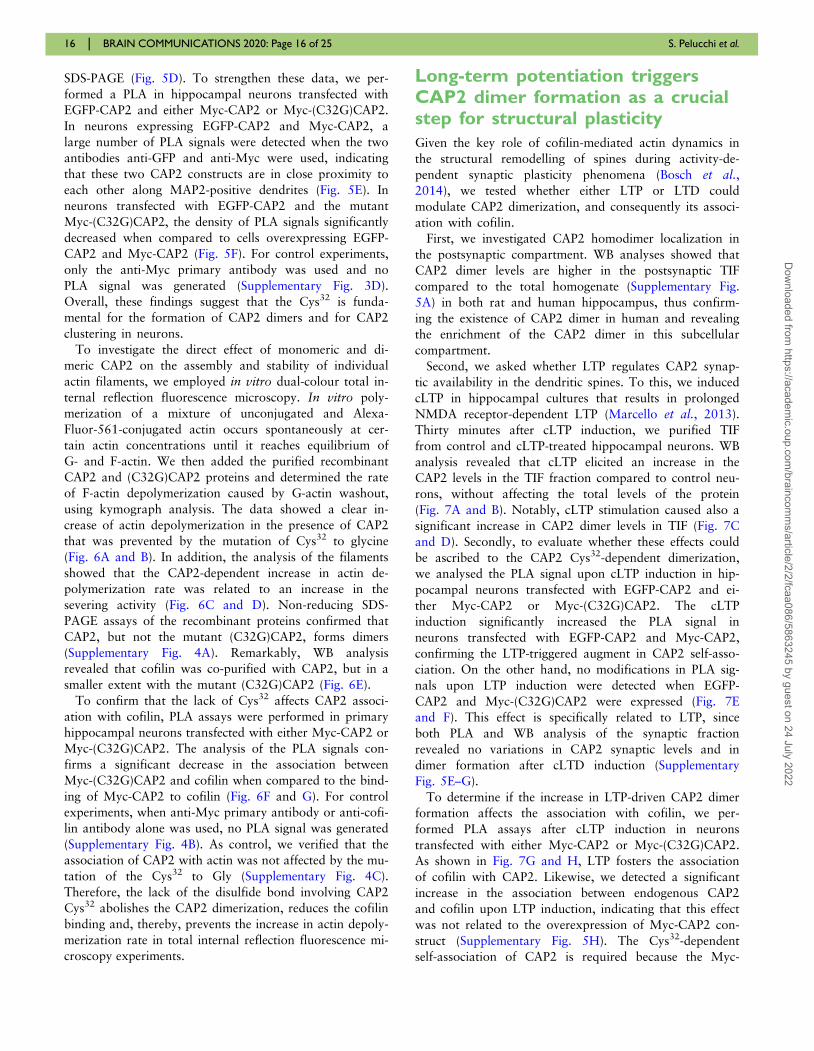
To investigate the direct effect of monomeric and di-
meric CAP2 on the assembly and stability of individual
actin filaments, we employed in vitro dual-colour total in-
ternal reflection fluorescence microscopy. In vitro poly-
merization of a mixture of unconjugated and Alexa-
Fluor-561-conjugated actin occurs spontaneously at cer-
tain actin concentrations until it reaches equilibrium of
G- and F-actin. We then added the purified recombinant
CAP2 and (C32G)CAP2 proteins and determined the rate
of F-actin depolymerization caused by G-actin washout,
using kymograph analysis. The data showed a clear in-
crease of actin depolymerization in the presence of CAP2
that was prevented by the mutation of Cys32 to glycine
(Fig. 6A and B). In addition, the analysis of the filaments
showed that the CAP2-dependent increase in actin de-
polymerization rate was related to an increase in the
severing activity (Fig. 6C and D). Non-reducing SDS-
PAGE assays of the recombinant proteins confirmed that
CAP2, but not the mutant (C32G)CAP2, forms dimers
(Supplementary Fig. 4A). Remarkably, WB analysis
revealed that cofilin was co-purified with CAP2, but in a
smaller extent with the mutant (C32G)CAP2 (Fig. 6E).
To confirm that the lack of Cys32 affects CAP2 associ-
ation with cofilin, PLA assays were performed in primary
hippocampal neurons transfected with either Myc-CAP2 or
Myc-(C32G)CAP2. The analysis of the PLA signals con-
firms a significant decrease in the association between
Myc-(C32G)CAP2 and cofilin when compared to the bind-
ing of Myc-CAP2 to cofilin (Fig. 6F and G). For control
experiments, when anti-Myc primary antibody or anti-cofi-
lin antibody alone was used, no PLA signal was generated
(Supplementary Fig. 4B). As control, we verified that the
association of CAP2 with actin was not affected by the mu-
tation of the Cys32 to Gly (Supplementary Fig. 4C).
Therefore, the lack of the disulfide bond involving CAP2
Cys32 abolishes the CAP2 dimerization, reduces the cofilin
binding and, thereby, prevents the increase in actin depoly-
merization rate in total internal reflection fluorescence mi-
croscopy experiments.
Long-term potentiation triggersCAP2 dimer formation as a crucialstep for structural plasticity
Given the key role of cofilin-mediated actin dynamics in
the structural remodelling of spines during activity-de-
pendent synaptic plasticity phenomena (Bosch et al.,2014), we tested whether either LTP or LTD could
modulate CAP2 dimerization, and consequently its associ-
ation with cofilin.
First, we investigated CAP2 homodimer localization in
the postsynaptic compartment. WB analyses showed that
CAP2 dimer levels are higher in the postsynaptic TIF
compared to the total homogenate (Supplementary Fig.
5A) in both rat and human hippocampus, thus confirm-
ing the existence of CAP2 dimer in human and revealing
the enrichment of the CAP2 dimer in this subcellular
compartment.
Second, we asked whether LTP regulates CAP2 synap-
tic availability in the dendritic spines. To this, we induced
cLTP in hippocampal cultures that results in prolonged
NMDA receptor-dependent LTP (Marcello et al., 2013).
Thirty minutes after cLTP induction, we purified TIF
from control and cLTP-treated hippocampal neurons. WB
analysis revealed that cLTP elicited an increase in the
CAP2 levels in the TIF fraction compared to control neu-
rons, without affecting the total levels of the protein
(Fig. 7A and B). Notably, cLTP stimulation caused also a
significant increase in CAP2 dimer levels in TIF (Fig. 7C
and D). Secondly, to evaluate whether these effects could
be ascribed to the CAP2 Cys32-dependent dimerization,
we analysed the PLA signal upon cLTP induction in hip-
pocampal neurons transfected with EGFP-CAP2 and ei-
ther Myc-CAP2 or Myc-(C32G)CAP2. The cLTP
induction significantly increased the PLA signal in
neurons transfected with EGFP-CAP2 and Myc-CAP2,
confirming the LTP-triggered augment in CAP2 self-asso-
ciation. On the other hand, no modifications in PLA sig-
nals upon LTP induction were detected when EGFP-
CAP2 and Myc-(C32G)CAP2 were expressed (Fig. 7E
and F). This effect is specifically related to LTP, since
both PLA and WB analysis of the synaptic fraction
revealed no variations in CAP2 synaptic levels and in
dimer formation after cLTD induction (Supplementary
Fig. 5E–G).
To determine if the increase in LTP-driven CAP2 dimer
formation affects the association with cofilin, we per-
formed PLA assays after cLTP induction in neurons
transfected with either Myc-CAP2 or Myc-(C32G)CAP2.
As shown in Fig. 7G and H, LTP fosters the association
of cofilin with CAP2. Likewise, we detected a significant
increase in the association between endogenous CAP2
and cofilin upon LTP induction, indicating that this effect
was not related to the overexpression of Myc-CAP2 con-
struct (Supplementary Fig. 5H). The Cys32-dependent
self-association of CAP2 is required because the Myc-
16 | BRAIN COMMUNICATIONS 2020: Page 16 of 25 S. Pelucchi et al.
Dow
nloaded from https://academ
ic.oup.com/braincom
ms/article/2/2/fcaa086/5863245 by guest on 24 July 2022
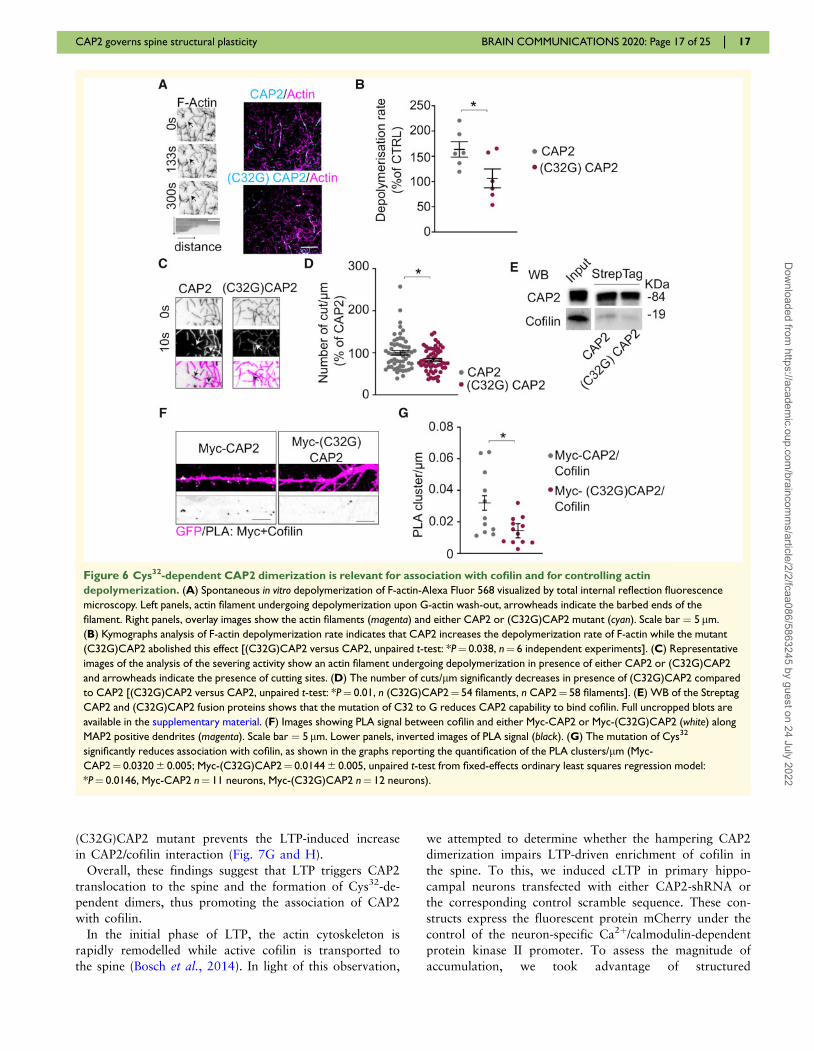
(C32G)CAP2 mutant prevents the LTP-induced increase
in CAP2/cofilin interaction (Fig. 7G and H).
Overall, these findings suggest that LTP triggers CAP2
translocation to the spine and the formation of Cys32-de-
pendent dimers, thus promoting the association of CAP2
with cofilin.
In the initial phase of LTP, the actin cytoskeleton is
rapidly remodelled while active cofilin is transported to
the spine (Bosch et al., 2014). In light of this observation,
we attempted to determine whether the hampering CAP2
dimerization impairs LTP-driven enrichment of cofilin in
the spine. To this, we induced cLTP in primary hippo-
campal neurons transfected with either CAP2-shRNA or
the corresponding control scramble sequence. These con-
structs express the fluorescent protein mCherry under the
control of the neuron-specific Ca2þ/calmodulin-dependent
protein kinase II promoter. To assess the magnitude of
accumulation, we took advantage of structured
Figure 6 Cys32-dependent CAP2 dimerization is relevant for association with cofilin and for controlling actin
depolymerization. (A) Spontaneous in vitro depolymerization of F-actin-Alexa Fluor 568 visualized by total internal reflection fluorescence
microscopy. Left panels, actin filament undergoing depolymerization upon G-actin wash-out, arrowheads indicate the barbed ends of the
filament. Right panels, overlay images show the actin filaments (magenta) and either CAP2 or (C32G)CAP2 mutant (cyan). Scale bar ¼ 5 lm.
(B) Kymographs analysis of F-actin depolymerization rate indicates that CAP2 increases the depolymerization rate of F-actin while the mutant
(C32G)CAP2 abolished this effect [(C32G)CAP2 versus CAP2, unpaired t-test: *P¼ 0.038, n¼ 6 independent experiments]. (C) Representative
images of the analysis of the severing activity show an actin filament undergoing depolymerization in presence of either CAP2 or (C32G)CAP2
and arrowheads indicate the presence of cutting sites. (D) The number of cuts/lm significantly decreases in presence of (C32G)CAP2 compared
to CAP2 [(C32G)CAP2 versus CAP2, unpaired t-test: *P¼ 0.01, n (C32G)CAP2¼ 54 filaments, n CAP2¼ 58 filaments]. (E) WB of the Streptag
CAP2 and (C32G)CAP2 fusion proteins shows that the mutation of C32 to G reduces CAP2 capability to bind cofilin. Full uncropped blots are
available in the supplementary material. (F) Images showing PLA signal between cofilin and either Myc-CAP2 or Myc-(C32G)CAP2 (white) along
MAP2 positive dendrites (magenta). Scale bar ¼ 5 lm. Lower panels, inverted images of PLA signal (black). (G) The mutation of Cys32
significantly reduces association with cofilin, as shown in the graphs reporting the quantification of the PLA clusters/lm (Myc-
CAP2¼ 0.0320 6 0.005; Myc-(C32G)CAP2¼ 0.0144 6 0.005, unpaired t-test from fixed-effects ordinary least squares regression model:
*P¼ 0.0146, Myc-CAP2 n¼ 11 neurons, Myc-(C32G)CAP2 n¼ 12 neurons).
CAP2 governs spine structural plasticity BRAIN COMMUNICATIONS 2020: Page 17 of 25 | 17
Dow
nloaded from https://academ
ic.oup.com/braincom
ms/article/2/2/fcaa086/5863245 by guest on 24 July 2022
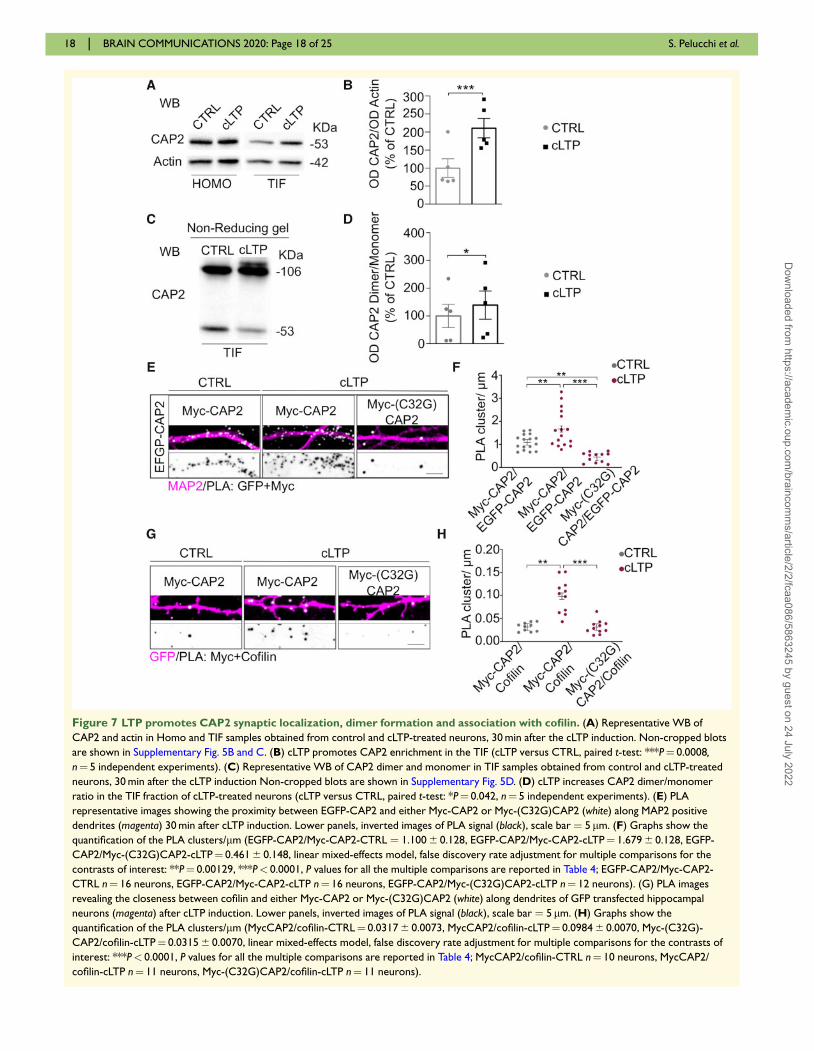
Figure 7 LTP promotes CAP2 synaptic localization, dimer formation and association with cofilin. (A) Representative WB of
CAP2 and actin in Homo and TIF samples obtained from control and cLTP-treated neurons, 30 min after the cLTP induction. Non-cropped blots
are shown in Supplementary Fig. 5B and C. (B) cLTP promotes CAP2 enrichment in the TIF (cLTP versus CTRL, paired t-test: ***P¼ 0.0008,
n¼ 5 independent experiments). (C) Representative WB of CAP2 dimer and monomer in TIF samples obtained from control and cLTP-treated
neurons, 30 min after the cLTP induction Non-cropped blots are shown in Supplementary Fig. 5D. (D) cLTP increases CAP2 dimer/monomer
ratio in the TIF fraction of cLTP-treated neurons (cLTP versus CTRL, paired t-test: *P¼ 0.042, n¼ 5 independent experiments). (E) PLA
representative images showing the proximity between EGFP-CAP2 and either Myc-CAP2 or Myc-(C32G)CAP2 (white) along MAP2 positive
dendrites (magenta) 30 min after cLTP induction. Lower panels, inverted images of PLA signal (black), scale bar ¼ 5 lm. (F) Graphs show the
quantification of the PLA clusters/lm (EGFP-CAP2/Myc-CAP2-CTRL ¼ 1.100 6 0.128, EGFP-CAP2/Myc-CAP2-cLTP¼ 1.679 6 0.128, EGFP-
CAP2/Myc-(C32G)CAP2-cLTP¼ 0.461 6 0.148, linear mixed-effects model, false discovery rate adjustment for multiple comparisons for the
contrasts of interest: **P¼ 0.00129, ***P< 0.0001, P values for all the multiple comparisons are reported in Table 4; EGFP-CAP2/Myc-CAP2-
CTRL n¼ 16 neurons, EGFP-CAP2/Myc-CAP2-cLTP n¼ 16 neurons, EGFP-CAP2/Myc-(C32G)CAP2-cLTP n¼ 12 neurons). (G) PLA images
revealing the closeness between cofilin and either Myc-CAP2 or Myc-(C32G)CAP2 (white) along dendrites of GFP transfected hippocampal
neurons (magenta) after cLTP induction. Lower panels, inverted images of PLA signal (black), scale bar ¼ 5 lm. (H) Graphs show the
quantification of the PLA clusters/lm (MycCAP2/cofilin-CTRL¼ 0.0317 6 0.0073, MycCAP2/cofilin-cLTP¼ 0.0984 6 0.0070, Myc-(C32G)-
CAP2/cofilin-cLTP¼ 0.0315 6 0.0070, linear mixed-effects model, false discovery rate adjustment for multiple comparisons for the contrasts of
interest: ***P< 0.0001, P values for all the multiple comparisons are reported in Table 4; MycCAP2/cofilin-CTRL n¼ 10 neurons, MycCAP2/
cofilin-cLTP n¼ 11 neurons, Myc-(C32G)CAP2/cofilin-cLTP n¼ 11 neurons).
18 | BRAIN COMMUNICATIONS 2020: Page 18 of 25 S. Pelucchi et al.
Dow
nloaded from https://academ
ic.oup.com/braincom
ms/article/2/2/fcaa086/5863245 by guest on 24 July 2022
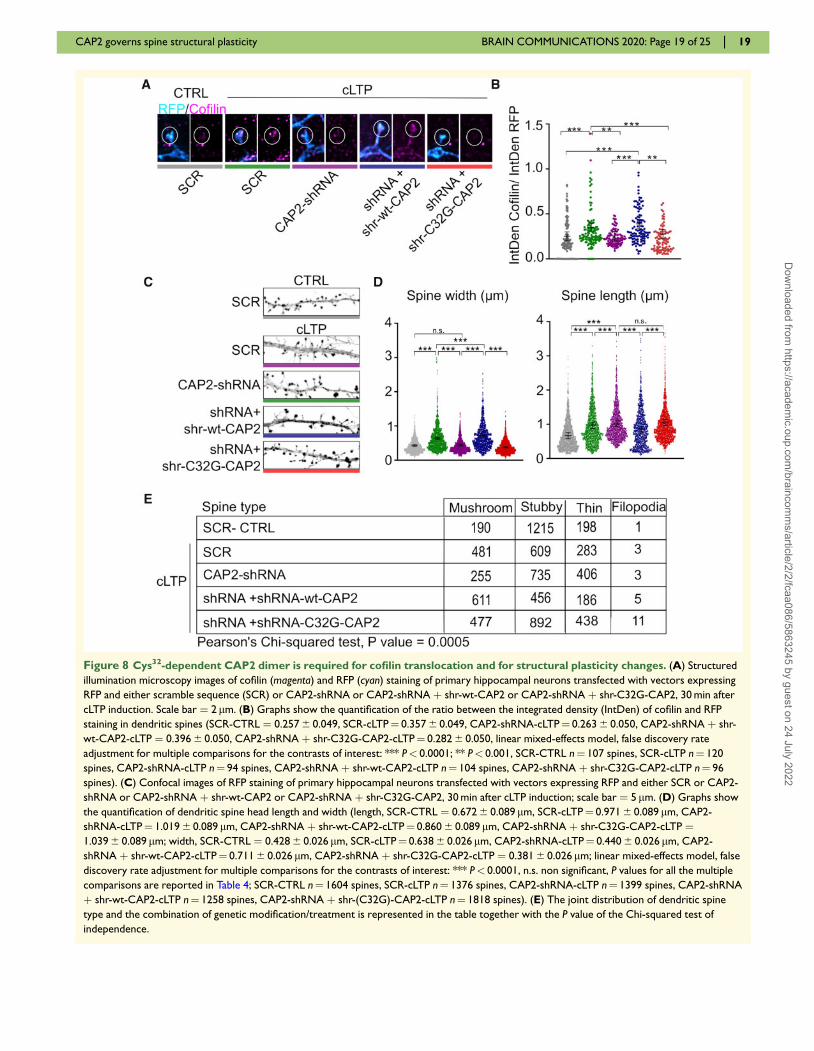
Figure 8 Cys32-dependent CAP2 dimer is required for cofilin translocation and for structural plasticity changes. (A) Structured
illumination microscopy images of cofilin (magenta) and RFP (cyan) staining of primary hippocampal neurons transfected with vectors expressing
RFP and either scramble sequence (SCR) or CAP2-shRNA or CAP2-shRNA þ shr-wt-CAP2 or CAP2-shRNA þ shr-C32G-CAP2, 30 min after
cLTP induction. Scale bar ¼ 2 lm. (B) Graphs show the quantification of the ratio between the integrated density (IntDen) of cofilin and RFP
staining in dendritic spines (SCR-CTRL ¼ 0.257 6 0.049, SCR-cLTP¼ 0.357 6 0.049, CAP2-shRNA-cLTP¼ 0.263 6 0.050, CAP2-shRNA þ shr-
wt-CAP2-cLTP ¼ 0.396 6 0.050, CAP2-shRNA þ shr-C32G-CAP2-cLTP¼ 0.282 6 0.050, linear mixed-effects model, false discovery rate
adjustment for multiple comparisons for the contrasts of interest: *** P< 0.0001; ** P< 0.001, SCR-CTRL n¼ 107 spines, SCR-cLTP n¼ 120
spines, CAP2-shRNA-cLTP n¼ 94 spines, CAP2-shRNA þ shr-wt-CAP2-cLTP n¼ 104 spines, CAP2-shRNA þ shr-C32G-CAP2-cLTP n¼ 96
spines). (C) Confocal images of RFP staining of primary hippocampal neurons transfected with vectors expressing RFP and either SCR or CAP2-
shRNA or CAP2-shRNA þ shr-wt-CAP2 or CAP2-shRNA þ shr-C32G-CAP2, 30 min after cLTP induction; scale bar ¼ 5 lm. (D) Graphs show
the quantification of dendritic spine head length and width (length, SCR-CTRL ¼ 0.672 6 0.089 lm, SCR-cLTP¼ 0.971 6 0.089 lm, CAP2-
shRNA-cLTP¼ 1.019 6 0.089 lm, CAP2-shRNA þ shr-wt-CAP2-cLTP¼ 0.860 6 0.089 lm, CAP2-shRNA þ shr-C32G-CAP2-cLTP ¼1.039 6 0.089 lm; width, SCR-CTRL ¼ 0.428 6 0.026 lm, SCR-cLTP¼ 0.638 6 0.026 lm, CAP2-shRNA-cLTP¼ 0.440 6 0.026 lm, CAP2-
shRNA þ shr-wt-CAP2-cLTP¼ 0.711 6 0.026 lm, CAP2-shRNA þ shr-C32G-CAP2-cLTP ¼ 0.381 6 0.026 lm; linear mixed-effects model, false
discovery rate adjustment for multiple comparisons for the contrasts of interest: *** P< 0.0001, n.s. non significant, P values for all the multiple
comparisons are reported in Table 4; SCR-CTRL n¼ 1604 spines, SCR-cLTP n¼ 1376 spines, CAP2-shRNA-cLTP n¼ 1399 spines, CAP2-shRNA
þ shr-wt-CAP2-cLTP n¼ 1258 spines, CAP2-shRNA þ shr-(C32G)-CAP2-cLTP n¼ 1818 spines). (E) The joint distribution of dendritic spine
type and the combination of genetic modification/treatment is represented in the table together with the P value of the Chi-squared test of
independence.
CAP2 governs spine structural plasticity BRAIN COMMUNICATIONS 2020: Page 19 of 25 | 19
Dow
nloaded from https://academ
ic.oup.com/braincom
ms/article/2/2/fcaa086/5863245 by guest on 24 July 2022
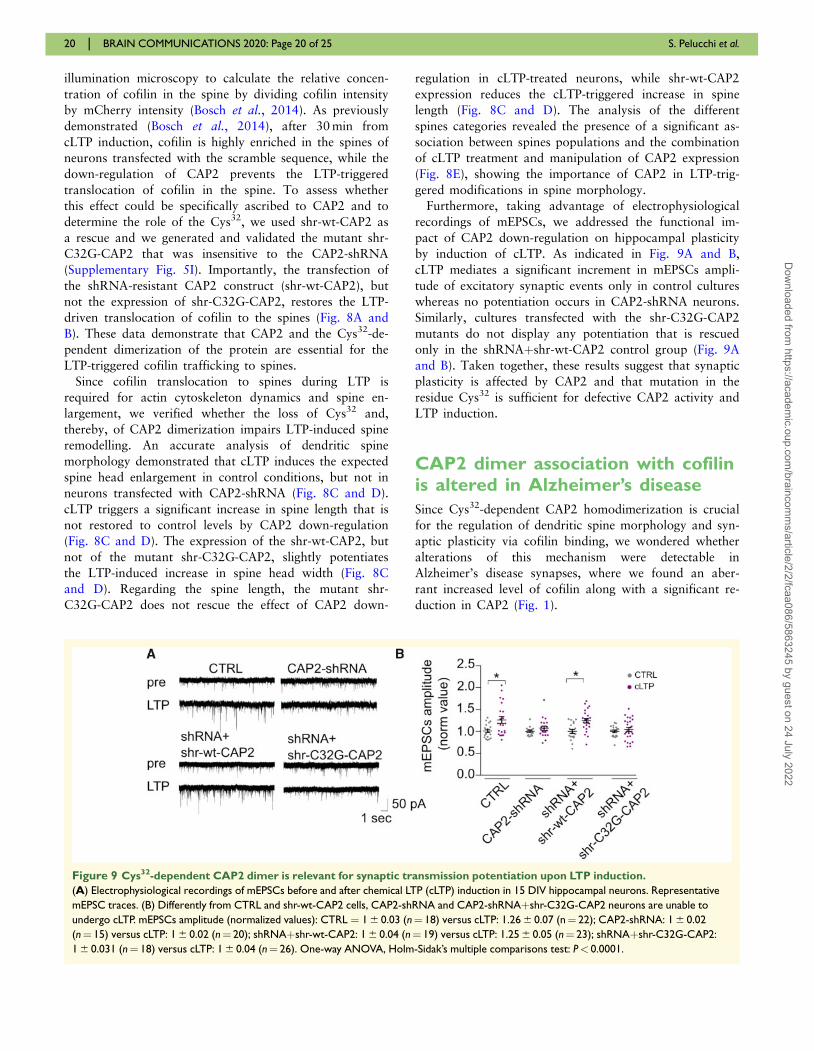
illumination microscopy to calculate the relative concen-
tration of cofilin in the spine by dividing cofilin intensity
by mCherry intensity (Bosch et al., 2014). As previously
demonstrated (Bosch et al., 2014), after 30 min from
cLTP induction, cofilin is highly enriched in the spines of
neurons transfected with the scramble sequence, while the
down-regulation of CAP2 prevents the LTP-triggered
translocation of cofilin in the spine. To assess whether
this effect could be specifically ascribed to CAP2 and to
determine the role of the Cys32, we used shr-wt-CAP2 as
a rescue and we generated and validated the mutant shr-
C32G-CAP2 that was insensitive to the CAP2-shRNA
(Supplementary Fig. 5I). Importantly, the transfection of
the shRNA-resistant CAP2 construct (shr-wt-CAP2), but
not the expression of shr-C32G-CAP2, restores the LTP-
driven translocation of cofilin to the spines (Fig. 8A and
B). These data demonstrate that CAP2 and the Cys32-de-
pendent dimerization of the protein are essential for the
LTP-triggered cofilin trafficking to spines.
Since cofilin translocation to spines during LTP is
required for actin cytoskeleton dynamics and spine en-
largement, we verified whether the loss of Cys32 and,
thereby, of CAP2 dimerization impairs LTP-induced spine
remodelling. An accurate analysis of dendritic spine
morphology demonstrated that cLTP induces the expected
spine head enlargement in control conditions, but not in
neurons transfected with CAP2-shRNA (Fig. 8C and D).
cLTP triggers a significant increase in spine length that is
not restored to control levels by CAP2 down-regulation
(Fig. 8C and D). The expression of the shr-wt-CAP2, but
not of the mutant shr-C32G-CAP2, slightly potentiates
the LTP-induced increase in spine head width (Fig. 8C
and D). Regarding the spine length, the mutant shr-
C32G-CAP2 does not rescue the effect of CAP2 down-
regulation in cLTP-treated neurons, while shr-wt-CAP2
expression reduces the cLTP-triggered increase in spine
length (Fig. 8C and D). The analysis of the different
spines categories revealed the presence of a significant as-
sociation between spines populations and the combination
of cLTP treatment and manipulation of CAP2 expression
(Fig. 8E), showing the importance of CAP2 in LTP-trig-
gered modifications in spine morphology.
Furthermore, taking advantage of electrophysiological
recordings of mEPSCs, we addressed the functional im-
pact of CAP2 down-regulation on hippocampal plasticity
by induction of cLTP. As indicated in Fig. 9A and B,
cLTP mediates a significant increment in mEPSCs ampli-
tude of excitatory synaptic events only in control cultures
whereas no potentiation occurs in CAP2-shRNA neurons.
Similarly, cultures transfected with the shr-C32G-CAP2
mutants do not display any potentiation that is rescued
only in the shRNAþshr-wt-CAP2 control group (Fig. 9A
and B). Taken together, these results suggest that synaptic
plasticity is affected by CAP2 and that mutation in the
residue Cys32 is sufficient for defective CAP2 activity and
LTP induction.
CAP2 dimer association with cofilinis altered in Alzheimer’s disease
Since Cys32-dependent CAP2 homodimerization is crucial
for the regulation of dendritic spine morphology and syn-
aptic plasticity via cofilin binding, we wondered whether
alterations of this mechanism were detectable in
Alzheimer’s disease synapses, where we found an aber-
rant increased level of cofilin along with a significant re-
duction in CAP2 (Fig. 1).
Figure 9 Cys32-dependent CAP2 dimer is relevant for synaptic transmission potentiation upon LTP induction.
(A) Electrophysiological recordings of mEPSCs before and after chemical LTP (cLTP) induction in 15 DIV hippocampal neurons. Representative
mEPSC traces. (B) Differently from CTRL and shr-wt-CAP2 cells, CAP2-shRNA and CAP2-shRNAþshr-C32G-CAP2 neurons are unable to
undergo cLTP. mEPSCs amplitude (normalized values): CTRL ¼ 1 6 0.03 (n¼ 18) versus cLTP: 1.26 6 0.07 (n¼ 22); CAP2-shRNA: 1 6 0.02
(n¼ 15) versus cLTP: 1 6 0.02 (n¼ 20); shRNAþshr-wt-CAP2: 1 6 0.04 (n¼ 19) versus cLTP: 1.25 6 0.05 (n¼ 23); shRNAþshr-C32G-CAP2:
1 6 0.031 (n¼ 18) versus cLTP: 1 6 0.04 (n¼ 26). One-way ANOVA, Holm-Sidak’s multiple comparisons test: P< 0.0001.
20 | BRAIN COMMUNICATIONS 2020: Page 20 of 25 S. Pelucchi et al.
Dow
nloaded from https://academ
ic.oup.com/braincom
ms/article/2/2/fcaa086/5863245 by guest on 24 July 2022
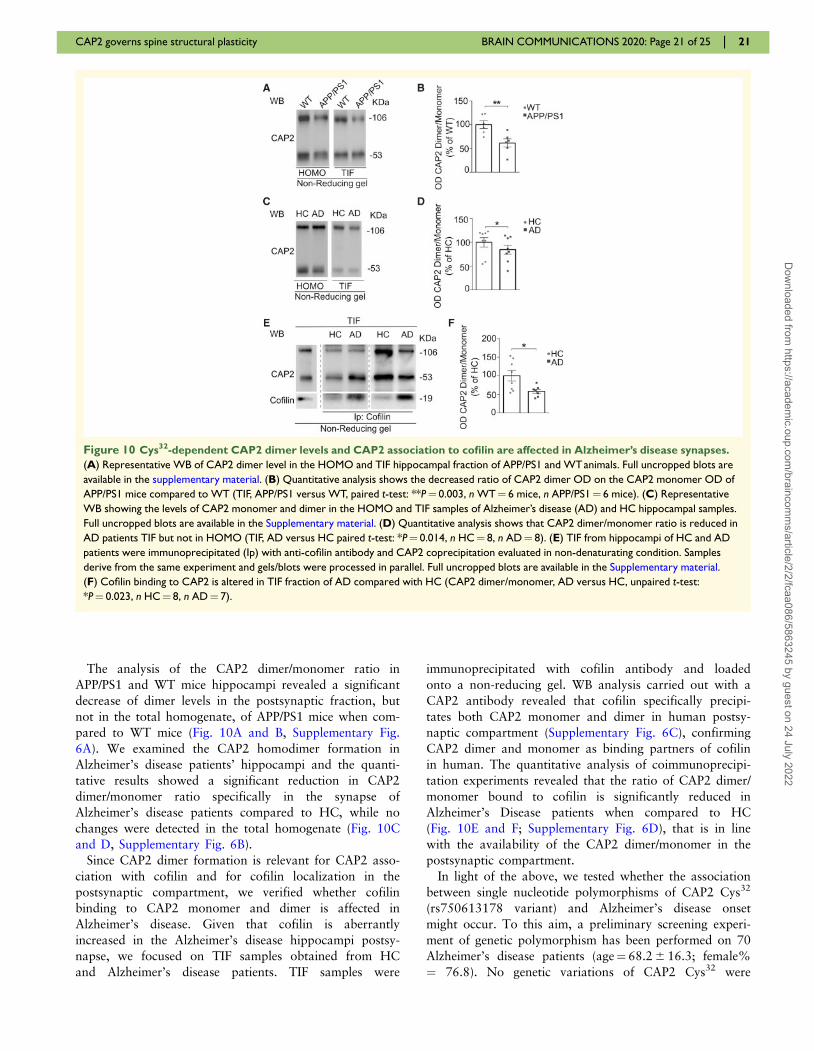
The analysis of the CAP2 dimer/monomer ratio in
APP/PS1 and WT mice hippocampi revealed a significant
decrease of dimer levels in the postsynaptic fraction, but
not in the total homogenate, of APP/PS1 mice when com-
pared to WT mice (Fig. 10A and B, Supplementary Fig.
6A). We examined the CAP2 homodimer formation in
Alzheimer’s disease patients’ hippocampi and the quanti-
tative results showed a significant reduction in CAP2
dimer/monomer ratio specifically in the synapse of
Alzheimer’s disease patients compared to HC, while no
changes were detected in the total homogenate (Fig. 10C
and D, Supplementary Fig. 6B).
Since CAP2 dimer formation is relevant for CAP2 asso-
ciation with cofilin and for cofilin localization in the
postsynaptic compartment, we verified whether cofilin
binding to CAP2 monomer and dimer is affected in
Alzheimer’s disease. Given that cofilin is aberrantly
increased in the Alzheimer’s disease hippocampi postsy-
napse, we focused on TIF samples obtained from HC
and Alzheimer’s disease patients. TIF samples were
immunoprecipitated with cofilin antibody and loaded
onto a non-reducing gel. WB analysis carried out with a
CAP2 antibody revealed that cofilin specifically precipi-
tates both CAP2 monomer and dimer in human postsy-
naptic compartment (Supplementary Fig. 6C), confirming
CAP2 dimer and monomer as binding partners of cofilin
in human. The quantitative analysis of coimmunoprecipi-
tation experiments revealed that the ratio of CAP2 dimer/
monomer bound to cofilin is significantly reduced in
Alzheimer’s Disease patients when compared to HC
(Fig. 10E and F; Supplementary Fig. 6D), that is in line
with the availability of the CAP2 dimer/monomer in the
postsynaptic compartment.
In light of the above, we tested whether the association
between single nucleotide polymorphisms of CAP2 Cys32
(rs750613178 variant) and Alzheimer’s disease onset
might occur. To this aim, a preliminary screening experi-
ment of genetic polymorphism has been performed on 70
Alzheimer’s disease patients (age¼ 68.2 6 16.3; female%
¼ 76.8). No genetic variations of CAP2 Cys32 were
Figure 10 Cys32-dependent CAP2 dimer levels and CAP2 association to cofilin are affected in Alzheimer’s disease synapses.
(A) Representative WB of CAP2 dimer level in the HOMO and TIF hippocampal fraction of APP/PS1 and WTanimals. Full uncropped blots are
available in the supplementary material. (B) Quantitative analysis shows the decreased ratio of CAP2 dimer OD on the CAP2 monomer OD of
APP/PS1 mice compared to WT (TIF, APP/PS1 versus WT, paired t-test: **P¼ 0.003, n WT¼ 6 mice, n APP/PS1¼ 6 mice). (C) Representative
WB showing the levels of CAP2 monomer and dimer in the HOMO and TIF samples of Alzheimer’s disease (AD) and HC hippocampal samples.
Full uncropped blots are available in the Supplementary material. (D) Quantitative analysis shows that CAP2 dimer/monomer ratio is reduced in
AD patients TIF but not in HOMO (TIF, AD versus HC paired t-test: *P¼ 0.014, n HC¼ 8, n AD¼ 8). (E) TIF from hippocampi of HC and AD
patients were immunoprecipitated (Ip) with anti-cofilin antibody and CAP2 coprecipitation evaluated in non-denaturating condition. Samples
derive from the same experiment and gels/blots were processed in parallel. Full uncropped blots are available in the Supplementary material.
(F) Cofilin binding to CAP2 is altered in TIF fraction of AD compared with HC (CAP2 dimer/monomer, AD versus HC, unpaired t-test:
*P¼ 0.023, n HC¼ 8, n AD¼ 7).
CAP2 governs spine structural plasticity BRAIN COMMUNICATIONS 2020: Page 21 of 25 | 21
Dow
nloaded from https://academ
ic.oup.com/braincom
ms/article/2/2/fcaa086/5863245 by guest on 24 July 2022
detected in Alzheimer’s disease patients, suggesting that
other cellular mechanisms might be responsible for the
decreased synaptic dimer levels in Alzheimer’s disease.
DiscussionA major question in Alzheimer’s disease pathogenesis is
to define the mechanism guiding alteration of synaptic
plasticity and spine dysmorphogenesis. Here, we show
that CAP2 is able to control cofilin synaptic availability
during activity-dependent plasticity phenomena.
Remarkably, this mechanism is specifically altered in the
hippocampus of Alzheimer’s disease patients and of an
Alzheimer’s disease mouse model.
CAP2 has been reported as a multi-domain actin bind-
ing protein, expressed in specific tissues, including the
brain (Peche et al., 2007; Kumar et al., 2016). Our study
provides a detailed characterization of CAP2 in neurons
bringing into focus conclusive evidences for both CAP2
localization in the postsynaptic compartment and its piv-
otal role in synaptic plasticity phenomena. This has been
demonstrated with different approaches. First, stimulated
emission depletion nanoscopy and biochemical fraction-
ation approaches showed that CAP2 is localized in the
postsynaptic compartment, in the region just underneath
the PSD where F-actin is enriched (Korobova and
Svitkina, 2010). Secondly, we observed that the down-
regulation of CAP2 impairs neuronal architecture and
spine shape, together with a decrease in synaptic excita-
tory transmission. Such alterations are translated into an
impairment of plasticity phenomena.
Furthermore, the down-regulation of CAP2 decreases
the levels of BDNF, a neurotrophin important for neur-
onal survival and synaptic plasticity (Lynch et al., 2008)
and reduced early in the course of the disease (Kaminari
et al., 2017). Its delivery could rescue memory deficits
dendrite outgrowth and spine loss (de Pins et al., 2019).
Therefore, we can hypothesize a role for CAP2 in the
alterations of BDNF in Alzheimer’s disease and in the
consequent impairment of plasticity phenomena.
It has been shown that CAPs and cofilin synergize to
depolymerize actin filaments (Chaudhry et al., 2013;
Kotila et al., 2019; Shekhar et al., 2019), highlighting the
critical role of this protein family in actin-dependent
processes. In line with these results, total internal reflec-
tion fluorescence experiments showed that CAP2
increases the actin depolymerization rate. Considering
that an efficient actin turnover in spines is required for
functional LTP (Okamoto et al., 2004), we observed that
the down-regulation of CAP2 leads to the lack of both
potentiation and spine head enlargement expected upon
cLTP induction.
Why is CAP2 critical for plasticity phenomena? CAP2
has been reported as a binding partner of cofilin (Kumar
et al., 2016), a master regulator of postsynaptic actin dy-
namics and structural plasticity (Rust, 2015a). Upon LTP
induction, cofilin activity is first increased and subse-
quently decreased, allowing first for actin remodelling
and then for an increase in F-actin and associated spine
enlargement (Fukazawa et al., 2003; Chen et al., 2007;
Gu et al., 2010). Even though cofilin phosphorylation is
considered one of the major mechanisms controlling its
activity (Van Troys et al., 2008; Bernstein and Bamburg,
2010; Rust, 2015a), the regulation of its availability and
retention in spines could also contribute to cofilin-de-
pendent sculpturing of the cytoskeleton. Cofilin indeed
accumulates in regions of the spine that contain a dy-
namic F-actin network responsible for spine morphologic-
al changes during synaptic plasticity (Racz and Weinberg,
2006). Importantly, cofilin is translocated to the spine
upon LTP induction (Bosch et al., 2014) and our findings
show that CAP2 down-regulation blocks the LTP-trig-
gered enrichment of cofilin in spines. The impaired cofilin
localization in spines and, thereby, the defects in struc-
tural and functional synaptic plasticity could be rescued
by cotransfection of the cells with an shRNA-resistant
CAP2 construct, confirming that the described CAP2-
knockdown phenotypes indeed resulted from diminished
CAP2 expression.
Furthermore, we also addressed the key question
regarding the molecular determinants relevant for CAP2/
cofilin association. A careful mapping of CAP2 structure
was carried out and, by using different approaches, we
showed that the N-terminal domain of CAP2 is respon-
sible for its self-association, as previously demonstrated
for Svr2/CAP protein (Quintero-Monzon et al., 2009). In
particular, in this region we identified the Cys32 as the
amino acid involved in the formation of disulfide cross-
linked CAP2 dimers. The mutation of Cys32 to Gly dra-
matically reduces, but not completely abolishes, CAP2
self-association and the binding to cofilin, suggesting that
CAP2 can still form aggregates capable of interacting
with cofilin. However, the lack of Cys32-dependent CAP2
homodimer results in a loss of function of CAP2/cofilin
complex on actin depolymerization, highlighting the im-
portance of such disulfide bond for the operational role
of CAP2. In fact, the CAP2 construct carrying the muta-
tion Cys32 to Gly significantly attenuates the capability of
CAP2 of promoting actin filaments depolymerization in
an in vitro assay. A similar molecular pathway has been
shown for CAP1, since Cys29-dependent homodimeriza-
tion of CAP1 affects binding to cofilin and F-actin stabil-
ity (Liu et al., 2018). Notably, the Cys29 residue of
CAP1 is not conserved in human, thus limiting the rele-
vance of CAP1-dependent mechanism and highlighting
the role of CAP2 as main regulator of cofilin in human
neuronal cells.
To strengthen the critical role of CAP2 homodimer in
the spine, we show that it is localized in the postsynaptic
compartment and it undergoes a dynamic regulation of
its synaptic levels by activity-dependent synaptic plasti-
city. The LTP-induced increase in CAP2 localization in
spines promotes the formation of CAP2 dimers through
22 | BRAIN COMMUNICATIONS 2020: Page 22 of 25 S. Pelucchi et al.
Dow
nloaded from https://academ
ic.oup.com/braincom
ms/article/2/2/fcaa086/5863245 by guest on 24 July 2022
Cys32, and thereby fosters CAP2 association with cofilin.
This event is required for LTP-induced translocation of
cofilin to the spine and for structural changes and the
potentiation of synaptic transmission underlying LTP ex-
pression. Indeed, the WT CAP2 construct, but not the
CAP2 mutant carrying the Cys32 mutated to Gly, restores
and slightly increases the LTP-triggered enlargement of
spine head in CAP2-knockdown neurons. In addition, the
structured illumination microscopy analysis of cofilin lo-
calization in spines revealed that the CAP2 mutant failed
to rescue the expected enrichment of cofilin in spines
upon LTP. These data suggest that the increased synaptic
availability of CAP2 monomers in the synapse triggers
the dimer formation and the downstream events, even
though we cannot exclude that post-translational modifi-
cations or interacting proteins could affect this pathway.
Of note, the induction of LTD does not affect CAP2 lo-
calization in the spine and dimer formation, highlighting
the specificity of this mechanism for LTP. Further experi-
ments are required in ex vivo systems stimulating specific
synaptic afferents, in order to assess input specificity of
LTP induction that cannot be evaluated using a global
chemical stimulation of the synapses.
Cofilin has been implicated in the pathophysiology of
Alzheimer’s disease, since cofilin accumulates in neurites
close to senile plaques in Alzheimer’s disease tissue and
Alzheimer’s disease mouse models (Bamburg and
Bernstein, 2016). However, the mechanisms by which
cofilin contributes to Alzheimer’s disease pathogenesis re-
main quite controversial, as either an excessive activation
(Kim et al., 2013) or inactivation (Barone et al., 2014;
Rush et al., 2018) have been reported in Alzheimer’s dis-
ease patients. Here, we changed perspective, and bring
into focus cofilin localization in spines in Alzheimer’s dis-
ease, because it is directly regulated by LTP, as well as
its association with CAP2 (Bosch et al., 2014). The
CAP2 dimer-dependent mechanism that regulates cofilin
availability at the synapse is specifically affected in the
hippocampus, but not in the SFG, of both Alzheimer’s
disease patients and APP/PS1 mice. Remarkably, we
detected a significant increase in the CSF CAP2 levels in
Alzheimer’s disease patients but not in frontotemporal de-
mentia patients, indicating the specificity of the alteration
for this form of dementia. Accurate early and differential
diagnosis across different forms of dementia represents a
clinical challenge due to the complexity of neurodegenera-
tive processes and is crucial for establishing prognosis
and accessing adequate treatment (Palop et al., 2006;
Oxtoby et al., 2017). Our preliminary study could set the
stage for further studies aimed at confirming CAP2 as a
potential biomarker of hippocampal synaptic dysfunction
in Alzheimer’s disease.
In the hippocampal synapses of Alzheimer’s disease
patients and Alzheimer’s disease mouse model, we meas-
ured a dramatic increase in cofilin levels, along with a re-
duction in CAP2 synaptic availability, and accordingly a
decrease in CAP2 dimer formation at the synapse.
Furthermore, we noticed that in Alzheimer’s disease
patients’ hippocampi cofilin precipitates a different pat-
tern of CAP2 monomeric and dimeric forms, suggesting
the presence of an ineffective CAP2/cofilin complex in
Alzheimer’s disease hippocampal synapses that could con-
tribute to the loss of structural plasticity of spines in
Alzheimer’s disease.
In the current paper, we explored the use of mixed-
effects models to fully account for the complex design of
multi-level hierarchically structured imaging data
(Paternoster et al., 2018); this approach improved our
ability to control variability at culture and neuron levels
and provided us more precise mean estimates (Lazic,
2010).
Together, our findings describe a novel CAP2-depend-
ent mechanism controlling cofilin synaptic availability
and actin turnover, which is closely interdependent to
LTP. Furthermore, we show that the main players of this
pathway are altered in Alzheimer’s disease, adding new
pieces to the puzzle in the understanding of the complex
and coordinated events leading to early synaptic dysfunc-
tion and plasticity alterations in Alzheimer’s disease
pathogenesis.
Supplementary materialSupplementary material is available at Brain
Communications online.
AcknowledgementsWe thank A. Longhi and E. Zianni for technical assistance
and Alessia Mariani, Filippo La Greca, Ramona Stringhi,
and Michael Wolf for excellent practical work, Chiara
Macchi and Massimiliano Ruscica for advice on ELISA
assays. We thank UMIF (UKE, Hamburg) for access to their
stimulated emission depletion imaging system. Part of this
work was carried out at NOLIMITS, an advanced imaging
facility established by the Universita degli Studi di Milano.
The brain tissues were obtained from the Netherlands Brain
Bank, Netherlands Institute for Neuroscience, Amsterdam.
FundingThis project has received funding from the European Union’s
Horizon 2020 research and innovation program under the
Marie Skłodowska-Curie grant agreement No 676144
(Synaptic Dysfunction in Alzheimer Disease, SyDAD) to
M.D.L., from the Italian Ministry of Education, University
and Research (MIUR) (PRIN 2015N4FKJ4 to M.D.L.,
PRIN 2017B9NCSX to E.M., Fondo per il Finanziamento
delle Attivita Base di Ricerca FFABR18_10 to E.M., MIUR
Progetto Eccellenza), from Fondazione Cariplo to E.M.
(Grant no. 2018—0511), from AIRAlzh Onlus-COOP Italia
(fellowship to S.P.), from Boehringer Ingelheim Fonds (travel
grant to S.P.), from an intramural grant of University of
CAP2 governs spine structural plasticity BRAIN COMMUNICATIONS 2020: Page 23 of 25 | 23
Dow
nloaded from https://academ
ic.oup.com/braincom
ms/article/2/2/fcaa086/5863245 by guest on 24 July 2022
Milan to E.M. (Fondo di sviluppo unimi- linea2—PSR2015-
1716GRACA02_05_M and PSR2017_DIP_022_03 and
PSR2019_EMARC) and to V.E. (PSR2015-1719FBRAV),
from the Deutsche Forschungsgemeinschaft (DFG) [Emmy-
Noether Programm (MI 1923/1-1) and FOR2419 (MI 1923/
2-1 and MI 1923/2-2)] to M.M. and from DFG (SFB1158,
project A08) to D.M. This work was supported by MIUR -
PON ‘Ricerca e Innovazione’ PerMedNet project
(ARS01_01226).
Competing interestsThe authors report no competing interests.
ReferencesAndrianantoandro E, Pollard TD. Mechanism of actin filament turn-
over by severing and nucleation at different concentrations of ADF/
cofilin. Mol Cell 2006; 24: 13–23.Balcer HI, Goodman AL, Rodal AA, Smith E, Kugler J, Heuser JE, et
al. Coordinated regulation of actin filament turnover by a high-mo-lecular-weight Srv2/CAP complex, cofilin, profilin, and Aip1. CurrBiol 2003; 13: 2159–69.
Bamburg JR, Bernstein BW. Actin dynamics and cofilin-actin rods inAlzheimer disease. Cytoskeleton (Hoboken) 2016; 73: 477–97.
Barone E, Mosser S, Fraering PC. Inactivation of brain cofilin-1 byage, Alzheimer’s disease and c-secretase. Biochim Biophys Acta2014; 1842: 2500–9.
Bates D, Machler M, Bolker B, Walker S. Fitting linear mixed-effectsmodels using lme4. J Stat Soft 2015; 67: 1–48.
Benjamini Y, Hochberg Y. Controlling the false discovery rate: a prac-tical and powerful approach to multiple testing. J R Stat Soc B1995; 57: 289–300.
Bernstein BW, Bamburg JR. ADF/cofilin: a functional node in cell biol-ogy. Trends Cell Biol 2010; 20: 187–95.
Bertling E, Hotulainen P, Mattila PK, Matilainen T, Salminen M,
Lappalainen P. Cyclase-associated protein 1 (CAP1) promotes cofi-lin-induced actin dynamics in mammalian nonmuscle cells. Mol Biol
Cell 2004; 15: 2324–34.Blalock EM, Geddes JW, Chen KC, Porter NM, Markesbery WR,
Landfield PW. Incipient Alzheimer’s disease: microarray correlation
analyses reveal major transcriptional and tumor suppressorresponses. Proc Natl Acad Sci USA 2004; 101: 2173–8.
Blanchoin L, Pollard TD. Mechanism of interaction of Acanthamoebaactophorin (ADF/Cofilin) with actin filaments. J Biol Chem 1999;274: 15538–46.
Bosch M, Castro J, Saneyoshi T, Matsuno H, Sur M, Hayashi Y.Structural and molecular remodeling of dendritic spine substructures
during long-term potentiation. Neuron 2014; 82: 444–59.Bourne JN, Harris KM. Balancing structure and function at hippocam-
pal dendritic spines. Annu Rev Neurosci 2008; 31: 47–67.
Braak H, Braak E. Neuropathological stageing of Alzheimer-relatedchanges. Acta Neuropathol 1991; 82: 239–59.
Chaudhry F, Breitsprecher D, Little K, Sharov G, Sokolova O, Goode
BL. Srv2/cyclase-associated protein forms hexameric shurikens thatdirectly catalyze actin filament severing by cofilin. Mol Biol Cell
2013; 24: 31–41.Chen LY, Rex CS, Casale MS, Gall CM, Lynch G. Changes in synap-
tic morphology accompany actin signaling during LTP. J. Neurosci
2007; 27: 5363–72.Cingolani LA, Goda Y. Actin in action: the interplay between the actin
cytoskeleton and synaptic efficacy. Nat Rev Neurosci 2008; 9:344–56.
de Pins B, Cifuentes-Dıaz C, Farah AT, Lopez-Molina L, Montalban
E, Sancho-Balsells A, et al. Conditional BDNF delivery from astro-cytes rescues memory deficits, spine density, and synaptic propertiesin the 5xFAD mouse model of Alzheimer disease. J Neurosci 2019;
39: 2441–58.Dinamarca MC, Guzzetti F, Karpova A, Lim D, Mitro N, Musardo S,
et al. Ring finger protein 10 is a novel synaptonuclear messengerencoding activation of NMDA receptors in hippocampus. Elife2016; 5: e12430.
Field J, Ye DZ, Shinde M, Liu F, Schillinger KJ, Lu M, et al. CAP2 incardiac conduction, sudden cardiac death and eye development. SciRep 2015; 5: 17256.
Frisoni GB, Fox NC, Jack CR, Scheltens P, Thompson PM. The clinic-al use of structural MRI in Alzheimer disease. Nat Rev Neurol
2010; 6: 67–77.Fukazawa Y, Saitoh Y, Ozawa F, Ohta Y, Mizuno K, Inokuchi K.
Hippocampal LTP is accompanied by enhanced F-actin content
within the dendritic spine that is essential for late LTP maintenancein vivo. Neuron 2003; 38: 447–60.
Gardoni F, Bellone C, Cattabeni F, Di Luca M. Protein kinase C acti-vation modulates alpha-calmodulin kinase II binding to NR2A sub-unit of N-methyl-D-aspartate receptor complex. J Biol Chem 2001;
276: 7609–13.Gu J, Lee CW, Fan Y, Komlos D, Tang X, Sun C, et al. ADF/cofilin-
mediated actin dynamics regulate AMPA receptor trafficking duringsynaptic plasticity. Nat Neurosci 2010; 13: 1208–15.
Henriques AG, Oliveira JM, Carvalho LP, da CE, Silva O. Ab influen-
ces cytoskeletal signaling cascades with consequences to Alzheimer’sdisease. Mol Neurobiol 2015; 52: 1391–407.
Hild G, Kalmar L, Kardos R, Nyitrai M, Bugyi B. The other side of
the coin: functional and structural versatility of ADF/cofilins. Eur JCell Biol 2014; 93: 238–51.
Holtmaat A, Svoboda K. Experience-dependent structural synapticplasticity in the mammalian brain. Nat Rev Neurosci 2009; 10:647–58.
Horch HW, Katz LC. BDNF release from single cells elicits local den-dritic growth in nearby neurons. Nat Neurosci 2002; 5: 1177–84.
Hotulainen P, Hoogenraad CC. Actin in dendritic spines: connectingdynamics to function. J Cell Biol 2010; 189: 619–29.
Hotulainen P, Llano O, Smirnov S, Tanhuanpaa K, Faix J, Rivera C,
et al. Defining mechanisms of actin polymerization and depolymer-ization during dendritic spine morphogenesis. J Cell Biol 2009; 185:
323–39.Hubberstey AV, Mottillo EP. Cyclase-associated proteins: CAPacity
for linking signal transduction and actin polymerization. FASEB J
2002; 16: 487–99.Jankowsky JL, Fadale DJ, Anderson J, Xu GM, Gonzales V, Jenkins
NA, et al. Mutant presenilins specifically elevate the levels of the 42residue beta-amyloid peptide in vivo: evidence for augmentation of a42-specific gamma secretase. Hum Mol Genet 2004; 13: 159–70.
Kaminari A, Giannakas N, Tzinia A, Tsilibary EC. Overexpression ofmatrix metalloproteinase-9 (MMP-9) rescues insulin-mediated im-pairment in the 5XFAD model of Alzheimer’s disease. Sci Rep 2017;
7: 683.Kasai H, Fukuda M, Watanabe S, Hayashi-Takagi A, Noguchi J.
Structural dynamics of dendritic spines in memory and cognition.Trends Neurosci 2010; 33: 121–9.
Kim T, Vidal GS, Djurisic M, William CM, Birnbaum ME, Garcia
KC, et al. Human LilrB2 is a b-amyloid receptor and its murinehomolog PirB regulates synaptic plasticity in an Alzheimer’s model.
Science 2013; 341: 1399–404.Korobova F, Svitkina T. Molecular architecture of synaptic actin cyto-
skeleton in hippocampal neurons reveals a mechanism of dendritic
spine morphogenesis. Mol Biol Cell 2010; 21: 165–76.Kotila T, Wioland H, Enkavi G, Kogan K, Vattulainen I, Jegou A,
et al. Mechanism of synergistic actin filament pointed end depoly-merization by cyclase-associated protein and cofilin. Nat Commun2019; 10: 5320.
24 | BRAIN COMMUNICATIONS 2020: Page 24 of 25 S. Pelucchi et al.
Dow
nloaded from https://academ
ic.oup.com/braincom
ms/article/2/2/fcaa086/5863245 by guest on 24 July 2022
Kumar A, Paeger L, Kosmas K, Kloppenburg P, Noegel AA, Peche VS.
Neuronal actin dynamics, spine density and neuronal dendriticcomplexity are regulated by CAP2. Front Cell Neurosci 2016; 10: 180.
Kuznetsova A, Brockhoff PB, Christensen R. lmerTest package: tests in
linear mixed effects models. J Stat Soft 2017; 82: 1–26.Lazic SE. The problem of pseudoreplication in neuroscientific studies:
is it affecting your analysis?. BMC Neurosci 2010; 11: 5.Lenth R. emmeans: Estimated Marginal Means, aka Least-Squares
Means. R package version 1.4.5, 2020. Available from: https://
CRAN.R-project.org/package¼emmeans (20 April 2020, date lastaccessed).
Liu Y, Xiao W, Shinde M, Field J, Templeton DM. Cadmium favors
F-actin depolymerization in rat renal mesangial cells by site-specific,disulfide-based dimerization of the CAP1 protein. Arch Toxicol
2018; 92: 1049–64.Lynch G, Rex CS, Chen LY, Gall CM. The substrates of memory:
defects, treatments, and enhancement. Eur J Pharmacol 2008; 585:
2–13.Malinverno M, Carta M, Epis R, Marcello E, Verpelli C, Cattabeni F,
et al. Synaptic localization and activity of ADAM10 regulate excita-tory synapses through N-cadherin cleavage. J. Neurosci 2010; 30:16343–55.
Marcello E, Gardoni F, Luca Perez-Ota~no DM. I. An arginine stretchlimits ADAM10 exit from the endoplasmic reticulum. J Biol Chem
2010; 285: 10376–84.Marcello E, Saraceno C, Musardo S, Vara H, la Fuente de AG,
Pelucchi S, et al. Endocytosis of synaptic ADAM10 in neuronal plas-
ticity and Alzheimer’s disease. J Clin Invest 2013; 123: 2523–38.Matus A. Growth of dendritic spines: a continuing story. Curr Opin
Neurobiol 2005; 15: 67–72.
Mauceri D, Freitag HE, Oliveira AMM, Bengtson CP, Bading H.Nuclear calcium-VEGFD signaling controls maintenance of dendrite
arborization necessary for memory formation. Neuron 2011; 71:117–30.
Mikhaylova M, Bar J, van Bommel B, Schatzle P, Yuanxiang P,
Raman R, et al. Caldendrin directly couples postsynaptic calciumsignals to actin remodeling in dendritic spines. Neuron 2018; 97:
1110–25.e14.Minamide LS, Striegl AM, Boyle JA, Meberg PJ, Bamburg JR.
Neurodegenerative stimuli induce persistent ADF/cofilin-actin rods
that disrupt distal neurite function. Nat Cell Biol 2000; 2: 628–36.Noegel AA, Rivero F, Albrecht R, Janssen KP, Kohler J, Parent CA, et
al. Assessing the role of the ASP56/CAP homologue ofDictyostelium discoideum and the requirements for subcellular local-ization. J Cell Sci 1999; 112: 3195–203.
Normoyle KPM, Brieher WM. Cyclase-associated protein (CAP) actsdirectly on F-actin to accelerate cofilin-mediated actin severing
across the range of physiological pH. J Biol Chem 2012; 287:35722–32.
Okamoto K-I, Nagai T, Miyawaki A, Hayashi Y. Rapid and persistent
modulation of actin dynamics regulates postsynaptic reorganizationunderlying bidirectional plasticity. Nat Neurosci 2004; 7: 1104–12.
Ono S. The role of cyclase-associated protein in regulating actin fila-
ment dynamics - more than a monomer-sequestration factor. J CellSci 2013; 126: 3249–58.
Oxtoby NP, Alexander DC, Consortium E. Imaging plus X: multi-modal models of neurodegenerative disease. Curr Opin Neurol2017; 30: 371–9.
Palop JJ, Chin J, Mucke L. A network dysfunction perspective on neu-rodegenerative diseases. Nature 2006; 443: 768–73.
Paternoster V, Rajkumar AP, Nyengaard JR, Børglum AD, Grove J,Christensen JH. The importance of data structure in statistical ana-lysis of dendritic spine morphology. J Neurosci Methods 2018; 296:
93–8.Peche V, Shekar S, Leichter M, Korte H, Schroder R, Schleicher M, et
al. CAP2, cyclase-associated protein 2, is a dual compartment pro-tein. Cell Mol Life Sci 2007; 64: 2702–15.
Peche VS, Holak TA, Burgute BD, Kosmas K, Kale SP, Wunderlich
FT, et al. Ablation of cyclase-associated protein 2 (CAP2) leads tocardiomyopathy. Cell Mol Life Sci 2013; 70: 527–43.
Pelucchi S, Stringhi R, Marcello E. Dendritic spines in Alzheimer’s dis-
ease: how the actin cytoskeleton contributes to synaptic failure. Int JMol Sci 2020; 21: 908.
Penzes P, Cahill ME, Jones KA, Vanleeuwen J-E, Woolfrey KM.Dendritic spine pathology in neuropsychiatric disorders. NatNeurosci 2011; 14: 285–93.
Penzes P, Vanleeuwen J-E. Impaired regulation of synaptic actin cyto-skeleton in Alzheimer’s disease. Brain Res Rev 2011; 67: 184–92.
Pinheiro J, Bates D. Mixed-effects models in S and S-PLUS. New York:
Springer-Verlag; 2006.Pontrello CG, Sun M-Y, Lin A, Fiacco TA, DeFea KA, Ethell IM.
Cofilin under control of b-arrestin-2 in NMDA-dependent dendriticspine plasticity, long-term depression (LTD), and learning. Proc NatlAcad Sci USA 2012; 109: E442–51.
Purde V, Busch F, Kudryashova E, Wysocki VH, Kudryashov DS.Oligomerization affects the ability of human cyclase-associated pro-
teins 1 and 2 to promote actin severing by cofilins. Int J Mol Sci2019; 20: 5647.
Quintero-Monzon O, Jonasson EM, Bertling E, Talarico L, Chaudhry
F, Sihvo M, et al. Reconstitution and dissection of the 600-kDaSrv2/CAP complex: roles for oligomerization and cofilin-actin bind-
ing in driving actin turnover. J Biol Chem 2009; 284: 10923–34.R Core Team. R: a language and environment for statistical comput-
ing. Vienna, Austria: R Foundation For Statistical Computing; 2019.
Racz B, Weinberg RJ. Spatial organization of cofilin in dendriticspines. Neuroscience 2006; 138: 447–56.
Rush T, Martinez-Hernandez J, Dollmeyer M, Frandemiche ML, Borel
E, Boisseau S, et al. Synaptotoxicity in Alzheimer’s disease involveda dysregulation of actin cytoskeleton dynamics through cofilin 1
phosphorylation. J Neurosci 2018; 38: 10349–61.Rust MB, Gurniak CB, Renner M, Vara H, Morando L, Gorlich A,
et al. Learning, AMPA receptor mobility and synaptic plasticity de-
pend on n-cofilin-mediated actin dynamics. Embo J 2010; 29:1889–902.
Rust MB. ADF/cofilin: a crucial regulator of synapse physiology andbehavior. Cell Mol Life Sci 2015a; 72: 3521–9.
Rust MB. Novel functions for ADF/cofilin in excitatory synapses - les-
sons from gene-targeted mice. Commun Integr Biol 2015b; 8:e1114194.
Sala C, Segal M. Dendritic spines: the locus of structural and function-al plasticity. Physiol Rev 2014; 94: 141–88.
Shekhar S, Chung J, Kondev J, Gelles J, Goode BL. Synergy between
cyclase-associated protein and Cofilin accelerates actin filament de-polymerization by two orders of magnitude. Nat Commun 2019;
10: 5319.Smith KR, Kopeikina KJ, Fawcett-Patel JM, Leaderbrand K, Gao R,
Schurmann B, et al. Psychiatric risk factor ANK3/ankyrin-G nano-
domains regulate the structure and function of glutamatergic synap-ses. Neuron 2014; 84: 399–415.
Star EN, Kwiatkowski DJ, Murthy VN. Rapid turnover of actin in
dendritic spines and its regulation by activity. Nat Neurosci 2002; 5:239–46.
Van Troys M, Huyck L, Leyman S, Dhaese S, Vandekerkhove J, AmpeC. Ins and outs of ADF/cofilin activity and regulation. Eur J CellBiol 2008; 87: 649–67.
Yusof AM, Hu N-J, Wlodawer A, Hofmann A. Structural evidence forvariable oligomerization of the N-terminal domain of cyclase-associ-
ated protein (CAP). Proteins 2004; 58: 255–62.Yuste R, Bonhoeffer T. Morphological changes in dendritic spines
associated with long-term synaptic plasticity. Annu Rev Neurosci
2001; 24: 1071–89.Zhou Q, Homma KJ, Poo M-M. Shrinkage of dendritic spines associ-
ated with long-term depression of hippocampal synapses. Neuron2004; 44: 749–57.
CAP2 governs spine structural plasticity BRAIN COMMUNICATIONS 2020: Page 25 of 25 | 25
Dow
nloaded from https://academ
ic.oup.com/braincom
ms/article/2/2/fcaa086/5863245 by guest on 24 July 2022