Embed Size (px)
Citation preview
Working Paper No. 813
Economic Policy in India: For Economic Stimulus, or for Austerity and Volatility?
by
Sunanda Sen* Levy Economics Institute of Bard College
Zico DasGupta
August 2014
The Levy Economics Institute Working Paper Collection presents research in progress by Levy Institute scholars and conference participants. The purpose of the series is to disseminate ideas to and elicit comments from academics and professionals.
Levy Economics Institute of Bard College, founded in 1986, is a nonprofit, nonpartisan, independently funded research organization devoted to public service. Through scholarship and economic research it generates viable, effective public policy responses to important economic problems that profoundly affect the quality of life in the United States and abroad.
Levy Economics Institute
P.O. Box 5000 Annandale-on-Hudson, NY 12504-5000
http://www.levyinstitute.org
Copyright © Levy Economics Institute 2014 All rights reserved
ISSN 1547-366X
1
Abstract
The implementation of economic reforms under new economic policies in India was associated
with a paradigmatic shift in monetary and fiscal policy. While monetary policies were solely
aimed at “price stability” in the neoliberal regime, fiscal policies were characterized by the
objective of maintaining “sound finance” and “austerity.” Such monetarist principles and
measures have also loomed over the global recession. This paper highlights the theoretical
fallacies of monetarism and analyzes the consequences of such policy measures in India,
particularly during the period of the global recession. Not only did such policies pose constraints
on the recovery of output and employment, with adverse impacts on income distribution; but they
also failed to achieve their stated goal in terms of price stability. By citing examples from
southern Europe and India, this paper concludes that such monetarist policy measures have been
responsible for stagnation, with a rise in price volatility and macroeconomic instability in the
midst of the global recession.
Keywords: Austerity; Development Expenditures; Exchange Rate Volatility; Fiscal Deficit;
Fiscal Policy; FRBMA; Inflation; Interest Payments; Interest Rates; Monetarism; Monetary
Policy; Sound Finance
JEL Classifications: E12, E31, E44, E50, E51, E52, E58, E62, E64
2
I CONFLICTING GOALS IN ECONOMIC POLICY
There seem to be conflicting notions in the goals set by the policy makers today, as well as in
their choice of tools to achieve these goals. The dominant theoretical frame which currently
drives the majority of policies includes monetarist principles which rely on inflation targeting as
a major tool to achieve financial stability. In contrast to this approach is the Keynesian
perspective which targets growth and full employment as the primary goal and relies on
aggregate demand management as the main tool to achieve this goal. Questioning the virtue of
the monetarist position which, as held by the Keynesians, may be at cost of growth and equity,
recommendations are offered for expansionary policies, especially when faced with
unemployment and under-utilization of resources.
One can, at the outset, consider the implications of the two policies mentioned above, and
their respective impacts. For the monetarists, financial stability demands a tight rein on
inflationary price movements, which, they hold, introduces disruptive price expectations, thus
deterring long-term investment and growth in the economy. Seen from this perspective,
expansionary fiscal policies are unacceptable for several reasons. One is the potential for
“crowding out” effects by public investments which, by raising the rate of interest, dampens the
prospects for private investment. However, the underlying assumption that there exists a fixed
pool of savings which is invested between the public and the private sectors, does not hold since
savings is liable to increase pari passu with the rising income created by public investment. Seen
from this angle, higher government expenditure always creates an equivalent level of additional
savings at any given interest rate,1
either by increasing the output level (through the Kahn-Keynes
multiplier in a demand-constrained system) or by raising the price level relative to money wages
(thus generating a “forced savings” by depressing the real wage, and hence the consumption, if
the system is supply-constrained).
The “crowding out” argument is also supported by recognizing that output can expand
with rise in public investments, thus causing the related rise in savings; this is because the related
excess demand in the money market itself can cause the rise in interest rates.2 An increase in
government expenditure, ceteris paribus, in terms of an endogenous supply of money (including
1 Interest rate is determined in the asset market and hence, in a stock equilibrium independent of the flow
equilibrium, and specifically depends on the decisions of the central monetary authority. 2 The argument goes back to Hicks, J.R. (1937). “Mr. Keynes and the Classics: A Suggested Interpretation,”
Econometrica, Vol 5, No. 2, pp 147–159
3
credit [Arestis and Sawyer, 2004]), would automatically expand the money supply without
raising the rate of interest, unless of course, the central bank deliberately raises the rate.
Finally, monetarists challenge the effectiveness of fiscal deficits as a policy tool which,
with its inflationary consequences, follows an automatic monetization of such deficits. Despite
its wide acceptance in policy making, the argument can be dismissed as a variant of quantity
theoretic premises which, as held by Keynesians, ignore the role of money as a financial asset to
speculate on, especially when the future is uncertain. Clearly, a rise in the money supply, as may
follow a monetized fiscal deficit (to the extent it is held in the form of financial assets, which are
used to operate in the secondary markets for stocks), will not necessarily cause a rise in prices in
the market.
Monetarist arguments against expansionary policies that rely on incurring debt to finance
fiscal deficits also take the form of what is described as “debt-sustainability,” or the stabilization
of debt with respect to the level of GDP (i.e., the debt-GDP ratio) over time. While such ratios
clearly are not dependent on the absolute level of debt (Pasinnetti, 1998) as pointed out,
stabilization of the debt-GDP ratio over time requires that the gross fiscal deficit (as a proportion
of GDP) should not exceed the product of growth rate and any given debt-to-GDP ratio at the
given time period (Evsey, 1944). Further, as pointed out, “solvency” may be compromised as the
discounted present value of the current and future liabilities of the government as a ratio of GDP
at any time period turns excessive (Buiter, 1990). However, such arguments are simply untenable
in view of the fact that governments are usually in a position to roll over debt and the private
sector usually continues to lend (Rakshit, 2005).
The dismissive approach of monetarist doctrines to policies that target full utilization of
capacity, as well as full employment via demand generation, can also be questioned from the
angle of a “balance-sheet” approach to the economy (Wray, 2012). The latter questions the
notion of “financial imbalance” for an economy, on the ground that surpluses/deficits by
definition have their counterparts as deficits/surpluses, both at the national and global levels. For
the circuit to operate without hindrances, sectoral deficits or surpluses, which cover those held by
the government, are in consonance with their opposite between the private (i.e., household and
corporate) and the external sector (i.e., the current account balance).
Pressure on the government to refrain from running deficits and incurring debt can be
viewed as a tactic by the high-powered financial community, which holds the surpluses in the
form of financial assets. This protects the respective values of these assets from possible
4
disruptions that could be caused by defaults on the part of government, and also avoids scaling
down their value in real terms. The global financial community is often in a position to exercise
its power over national governments by using several channels, including multilateral financial
institutions (e.g., the International Monetary Fund, World Bank, Bank of International
Settlement), along with the respective governments. The latter, taking on the role of a “predator
state (Galbraith, 2009),”fortifies its position by aligning itself with the global financial
community, which relies on devices best described as “money manager capitalism (Wray,
20120).”
Efforts to restrain expansionary policies of the state by limiting fiscal deficits introduce a
process of contraction in economies already suffering from demand shortage. The consequences
may include curtailed demand for bank credit from the private sector (corporates as well as
households), which further reduces aggregate demand in such economies (Koo, 2013).
Since financial assets held by the lenders can be deployed to leverage and speculate
during periods of market uncertainty, there can be changes in the composition of portfolios held
by the private sector, and especially by corporates. Assets deployed in the secondary markets for
stocks or currencies and commodities, while fetching handsome returns in terms of capital gains,
do not, in the first round, create more activity (Sen, 2003) in the real economy.
Monetary tightening sans expansionary fiscal policies, as mentioned above, is used by the
monetarists to monitor and contain inflation. In achieving such targets, policies often ignore or
even contradict other goals like growth, employment, and distribution, which are no less
important. Arguments that disapprove of fiscal spending that relies on budget deficits have been
described as the “Treasury view,” which relies on what it views as “sound finance.” In this view,
financial stability is the primary goal of monetary policy, notwithstanding the consequences in
terms of slow growth, unemployment, and underutilized capacity.
For countries managing their exchange rate in the face of unpredictable flows of finance
from overseas, the problem can become one in which policy makers face an “impossible
trilemma,” as described in the literature (Palley, 2009; Krugman, 1999). The trilemma is one of
managing the exchange rate of the domestic currency as well as the domestic price level, along
with free flows of overseas capital, which in turn become volatile, excessive, or inadequate.
Following monetarist practices, movements in exchange at a rate beyond the accepted range
demands the use of monetary policy to bring about the desired changes in interest rates and/or
credit flows in the economy. Thus when inflows of capital push up the exchange rate of the
5
domestic currency to levels which are unacceptable from the point of view of export
competitiveness as well as sustainability of debt in local currency, the central bank usually
intervenes, initially by purchasing foreign currency from the market, which in turn adds to
official reserves, entered as high-powered money. Related expansions in the credit supply,
considered as potentially inflationary in the monetarist lexicon, prompt further actions by the
central bank to control credit, including interest rate hikes and the tightening of credit by
commercial banks. On the whole, the direction of monetary policies in such cases remains pre-
determined by the pace of financial flows from overseas, which, in the absence of capital
controls, remains as one of the imponderables for domestic policy makers. These kinds of
policies are also launched when there is volatility in the foreign exchange market that causes
changes in exchange rates which are considered undesirable. The end result is a loss of autonomy
in monetary policy; countries operating under such policies thus cease to be sovereign in this
regard (Arestis and Paliginis, 2000).
What then remains of the other goals, such as growth, employment, and distribution, in an
economy where policies are driven by the monetarist pursuit of inflation targeting above all else?
Restraints on credit flows achieved by increasing the interest rate high and using other limits on
the expansion of bank credit may compromise growth and create austerity in such economies,
more so when policies that rely on fiscal expansion are censured because of a monetarist agenda.
II MONETARISM IN ACTION: THE CASE OF SOUTHERN EUROPE
It is not difficult to identify the contractionary effects of the conservative neo-liberal economic
policies in recent times. Let us refer very briefly to the Great Recession which started in 2008.
The underlying causes of the recession were related to the unbridled expansion of private
financial activities that contributed very little to proportionate growth in the real sector. In the
process some countries in southern Europe that were affected by the global crisis were badly hit
by the contagion and were close to insolvency. It is worth noting that the financial institutions
including the European Central Bank (ECB), European Union (EU) and the IMF actually added
to the crisis for debt-ridden countries like Greece, Portugal and Ireland by requiring them to
implement austerity measures which worsened the catastrophe.
Looking at Greece alone, the drop in its GDP has been about 5.6% on average during
2010 to 2013. The official figures for unemployment in Greece stand at 27% and the rate for
6
youth unemployment is 60%. Wages have dropped by 25% or more since 2010 (Polychroniou,
2014).
What were the proximate causes of outcomes? There was a loan package in May 2010
and March 2012 from international financial institutions for 110 billion euros to bail out Greece
from its debt trap. The bailout came with strict IMF austerity measures, which plunged the
economy into a deeper crisis. Exiting the euro was clearly not an acceptable alternative to big
capital and the eurozone. Greece was forced to comply with the conditions of the bailout, cutting
wages, pensions, social benefits, employment, raising direct taxes, and deregulating labor
markets and undertaking wide-ranging privatization in the economy (EUbusiness 2010).
In terms of a study by the South Commission (Polychroniou, 2014), cuts in government
expenditure in real terms during the period 2010–12 (as compared to 2008–09) amounted to
(-)8.6% in the developing countries and (-)6.5% in high-income countries. As a consequence, by
2014, persons affected by the crisis represented 85% and 95% of total population in developing
and high-income countries, respectively.
Citing some news clippings on the current level of misery for people in the crisis-ridden
Greek economy, one reads, “…Suddenly, hard-working Greeks in their late 30s and mid-40s
have no money to turn on the heat, to buy gifts for their children and loved ones, to fill the tank
with gas, to fill the fridge with food, to invite friends for dinner, to go out and enjoy a drink in
fine company.” Or again, “...Hundreds of striking Greek city workers are marching through
Athens to protest public sector job cuts.” Also, “Greek hospital doctors have embarked on a
three-day strike, joining high school teachers who walked off the job a day earlier in a week of
public sector strikes protesting planned job cuts.” And similarly, “…Suicides increased by 45
percent during the first four years of Greece's financial crisis, a mental health aid group said
(World Post, 2013).”
III MONETARISM IN ACTION: CASE OF INDIA
The actions outlined above, focusing on “austerity”’ as a cure-all for the ills of an economy,
prevailed not only in the crisis-stricken countries of southern Europe, but also in developing
countries which have recently been relatively integrated with overseas markets of finance. India
7
is among these countries described as an emerging economy,3 and has been receiving record
inflows of finance second only to China.
As in the other BRIC (Brazil, Russia, India and China) countries, India has been
experiencing rising inflows of overseas capital since the deregulation of its financial sector,
which started by the early 1990s. Between 2011–12 and 2012–13, net financial inflows to the
country amounted, on an annual basis, to $20.8 billion as foreign direct investment (FDI) and
$22.0 billion as Portfolios (RBI Handbook of Statistics on Indian Economy, 2012).
Financial opening in India was combined with a great many economic reforms starting
in 1991. This brought an end to a policy regime that had been subject to segregated banking,
which included manifold restrictions on overseas capital flows. Successive reforms,
implemented over the next decade and a half (during the 1990s and early 2000s), introduced
several changes, which included easier access of FDI, free access of (foreign indirect
investment [FII]) investments to stock markets, a gradual lifting of bans on derivative trading
in stocks, currencies and commodities, and over-the-counter (OTC) trading along with
liberalized norms for overseas investments and external commercial borrowings (ECBs) by
corporate businesses (and mutual funds). The country, in addition, initiated a move to limit the
fiscal deficit as a ratio of GDP by enacting the Fiscal Responsibility and Budget Management
Act (FRBMA) in 2003. Under the terms of the Act borrowing to meet budgetary expenditures
was no longer available from the central bank and had to be raised from the capital market.
Deregulated Finance and Booming Stock Markets
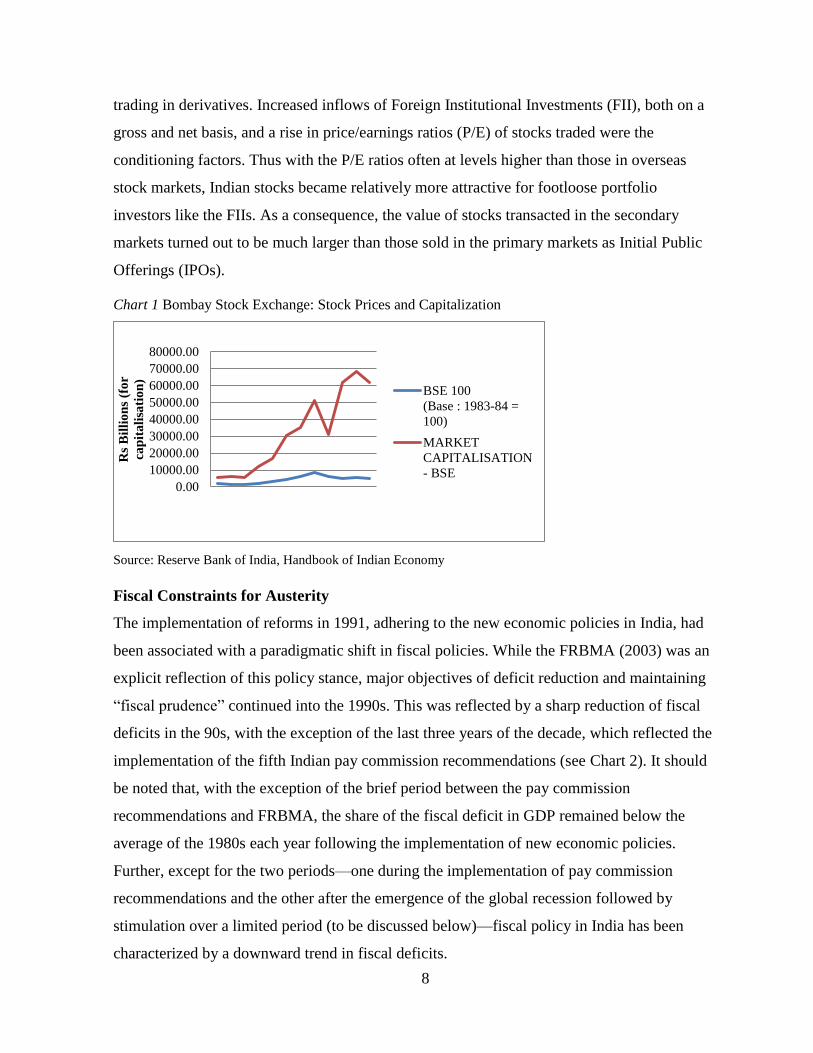
The events outlined above provide an indication of the pace of financialization in the economy,
which was triggered by finance deregulation. Deregulation created space for investments in
short-term assets of the high-risk, high-return variety. This was reflected in the rising turnovers
of the secondary stock market and the similar increases in prices of stocks (Chart 1).
Several rounds of liberalization, as above, have changed the pattern as well as the
magnitude of turnover in India’s financial sector. This can be noticed in the increased
transactions and the rising volatility in India’s stock markets, along with increased OTC
3 As for growth of GDP in the Emerging economies, India, along with China and three more countries( Brazil,
Russia, South Africa)) together described as BRICS, have consistently maintained growth rates much higher than
those in the rest of world including the advanced economies. The BRICS also has maintained an impressive
performance in terms of net FDI inflows, as recorded by the $425bn total FDI inflows on average during 2011 and
2012. Of the above, China alone accounted for nearly $200bn. See www.data.worldbank.org.
8
trading in derivatives. Increased inflows of Foreign Institutional Investments (FII), both on a
gross and net basis, and a rise in price/earnings ratios (P/E) of stocks traded were the
conditioning factors. Thus with the P/E ratios often at levels higher than those in overseas
stock markets, Indian stocks became relatively more attractive for footloose portfolio
investors like the FIIs. As a consequence, the value of stocks transacted in the secondary
markets turned out to be much larger than those sold in the primary markets as Initial Public
Offerings (IPOs).
Chart 1 Bombay Stock Exchange: Stock Prices and Capitalization
Source: Reserve Bank of India, Handbook of Indian Economy
Fiscal Constraints for Austerity
The implementation of reforms in 1991, adhering to the new economic policies in India, had
been associated with a paradigmatic shift in fiscal policies. While the FRBMA (2003) was an
explicit reflection of this policy stance, major objectives of deficit reduction and maintaining
“fiscal prudence” continued into the 1990s. This was reflected by a sharp reduction of fiscal
deficits in the 90s, with the exception of the last three years of the decade, which reflected the
implementation of the fifth Indian pay commission recommendations (see Chart 2). It should
be noted that, with the exception of the brief period between the pay commission
recommendations and FRBMA, the share of the fiscal deficit in GDP remained below the
average of the 1980s each year following the implementation of new economic policies.
Further, except for the two periods—one during the implementation of pay commission
recommendations and the other after the emergence of the global recession followed by
stimulation over a limited period (to be discussed below)—fiscal policy in India has been
characterized by a downward trend in fiscal deficits.
0.00
10000.00
20000.00
30000.00
40000.00
50000.00
60000.00
70000.00
80000.00
Rs
Bil
lio
ns
(fo
r
cap
ita
lisa
tio
n)
BSE 100
(Base : 1983-84 =
100)
MARKET
CAPITALISATION
- BSE
9
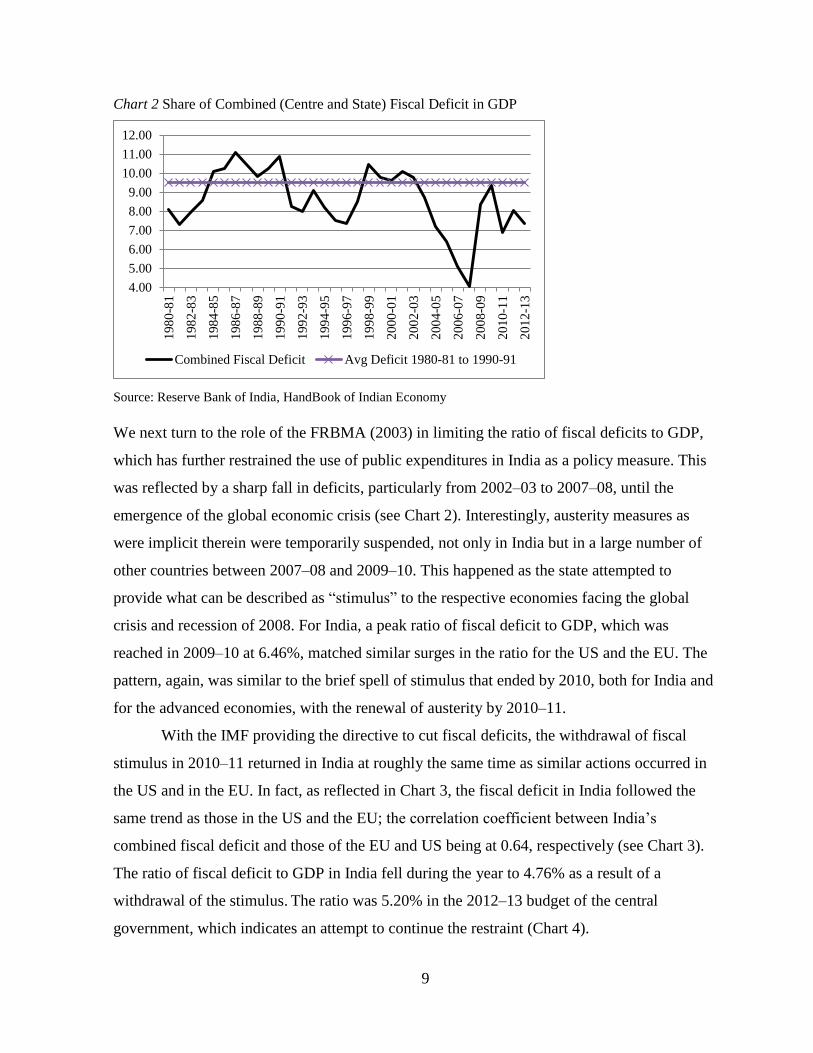
Chart 2 Share of Combined (Centre and State) Fiscal Deficit in GDP
Source: Reserve Bank of India, HandBook of Indian Economy
We next turn to the role of the FRBMA (2003) in limiting the ratio of fiscal deficits to GDP,
which has further restrained the use of public expenditures in India as a policy measure. This
was reflected by a sharp fall in deficits, particularly from 2002–03 to 2007–08, until the
emergence of the global economic crisis (see Chart 2). Interestingly, austerity measures as
were implicit therein were temporarily suspended, not only in India but in a large number of
other countries between 2007–08 and 2009–10. This happened as the state attempted to
provide what can be described as “stimulus” to the respective economies facing the global
crisis and recession of 2008. For India, a peak ratio of fiscal deficit to GDP, which was
reached in 2009–10 at 6.46%, matched similar surges in the ratio for the US and the EU. The
pattern, again, was similar to the brief spell of stimulus that ended by 2010, both for India and
for the advanced economies, with the renewal of austerity by 2010–11.
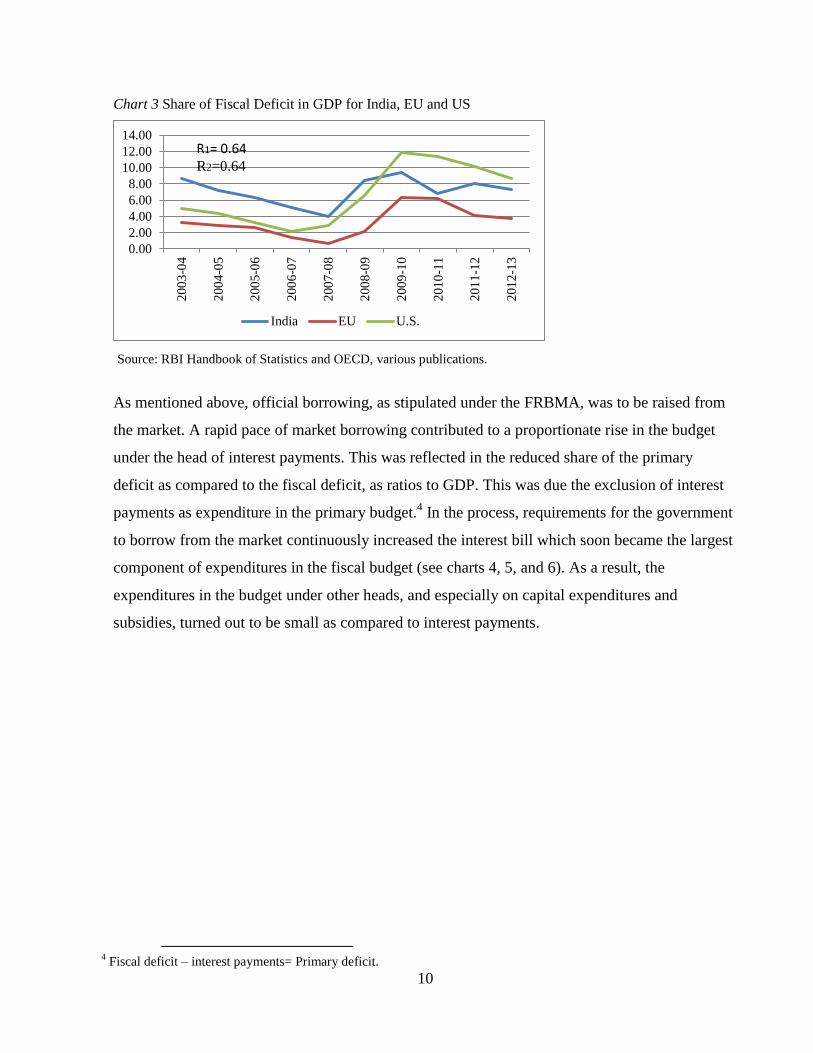
With the IMF providing the directive to cut fiscal deficits, the withdrawal of fiscal
stimulus in 2010–11 returned in India at roughly the same time as similar actions occurred in
the US and in the EU. In fact, as reflected in Chart 3, the fiscal deficit in India followed the
same trend as those in the US and the EU; the correlation coefficient between India’s
combined fiscal deficit and those of the EU and US being at 0.64, respectively (see Chart 3).
The ratio of fiscal deficit to GDP in India fell during the year to 4.76% as a result of a
withdrawal of the stimulus. The ratio was 5.20% in the 2012–13 budget of the central
government, which indicates an attempt to continue the restraint (Chart 4).
4.00
5.00
6.00
7.00
8.00
9.00
10.00
11.00
12.00
198
0-8
1
198
2-8
3
198
4-8
5
198
6-8
7
198
8-8
9
199
0-9
1
199
2-9
3
199
4-9
5
199
6-9
7
199
8-9
9
200
0-0
1
200
2-0
3
200
4-0
5
200
6-0
7
200
8-0
9
201
0-1
1
201
2-1
3
Combined Fiscal Deficit Avg Deficit 1980-81 to 1990-91
10
Chart 3 Share of Fiscal Deficit in GDP for India, EU and US
Source: RBI Handbook of Statistics and OECD, various publications.
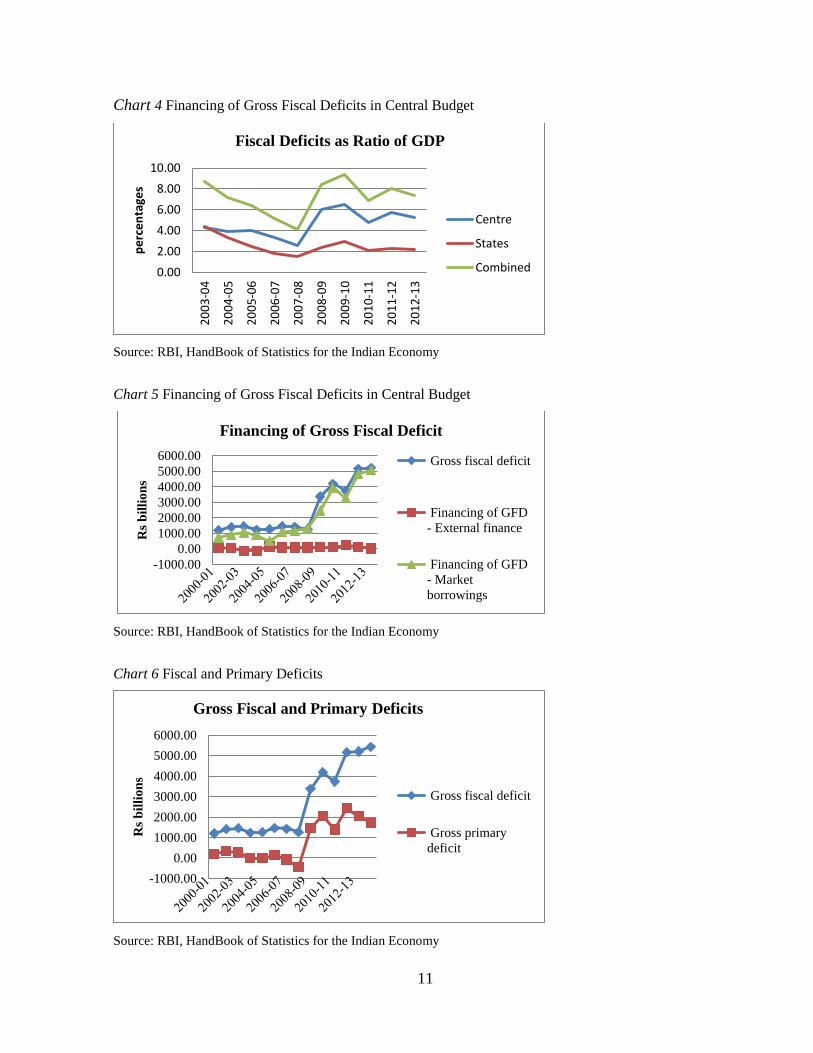
As mentioned above, official borrowing, as stipulated under the FRBMA, was to be raised from
the market. A rapid pace of market borrowing contributed to a proportionate rise in the budget
under the head of interest payments. This was reflected in the reduced share of the primary
deficit as compared to the fiscal deficit, as ratios to GDP. This was due the exclusion of interest
payments as expenditure in the primary budget.4 In the process, requirements for the government
to borrow from the market continuously increased the interest bill which soon became the largest
component of expenditures in the fiscal budget (see charts 4, 5, and 6). As a result, the
expenditures in the budget under other heads, and especially on capital expenditures and
subsidies, turned out to be small as compared to interest payments.
4 Fiscal deficit – interest payments= Primary deficit.
0.00
2.00
4.00
6.00
8.00
10.00
12.00
14.00
200
3-0
4
200
4-0
5
200
5-0
6
200
6-0
7
200
7-0
8
200
8-0
9
200
9-1
0
201
0-1
1
201
1-1
2
201
2-1
3
India EU U.S.
R1= 0.64 R2=0.64
11
Chart 4 Financing of Gross Fiscal Deficits in Central Budget
Source: RBI, HandBook of Statistics for the Indian Economy
Chart 5 Financing of Gross Fiscal Deficits in Central Budget
Source: RBI, HandBook of Statistics for the Indian Economy
Chart 6 Fiscal and Primary Deficits
Source: RBI, HandBook of Statistics for the Indian Economy
0.00
2.00
4.00
6.00
8.00
10.00
20
03
-04
20
04
-05
20
05
-06
20
06
-07
20
07
-08
20
08
-09
20
09
-10
20
10
-11
20
11
-12
20
12
-13
pe
rce
nta
ges
Fiscal Deficits as Ratio of GDP
Centre
States
Combined
-1000.00
0.00
1000.00
2000.00
3000.00
4000.00
5000.00
6000.00
Rs
bil
lio
ns
Financing of Gross Fiscal Deficit
Gross fiscal deficit
Financing of GFD
- External finance
Financing of GFD
- Market
borrowings
-1000.00
0.00
1000.00
2000.00
3000.00
4000.00
5000.00
6000.00
Rs
bil
lio
ns
Gross Fiscal and Primary Deficits
Gross fiscal deficit
Gross primary
deficit
12
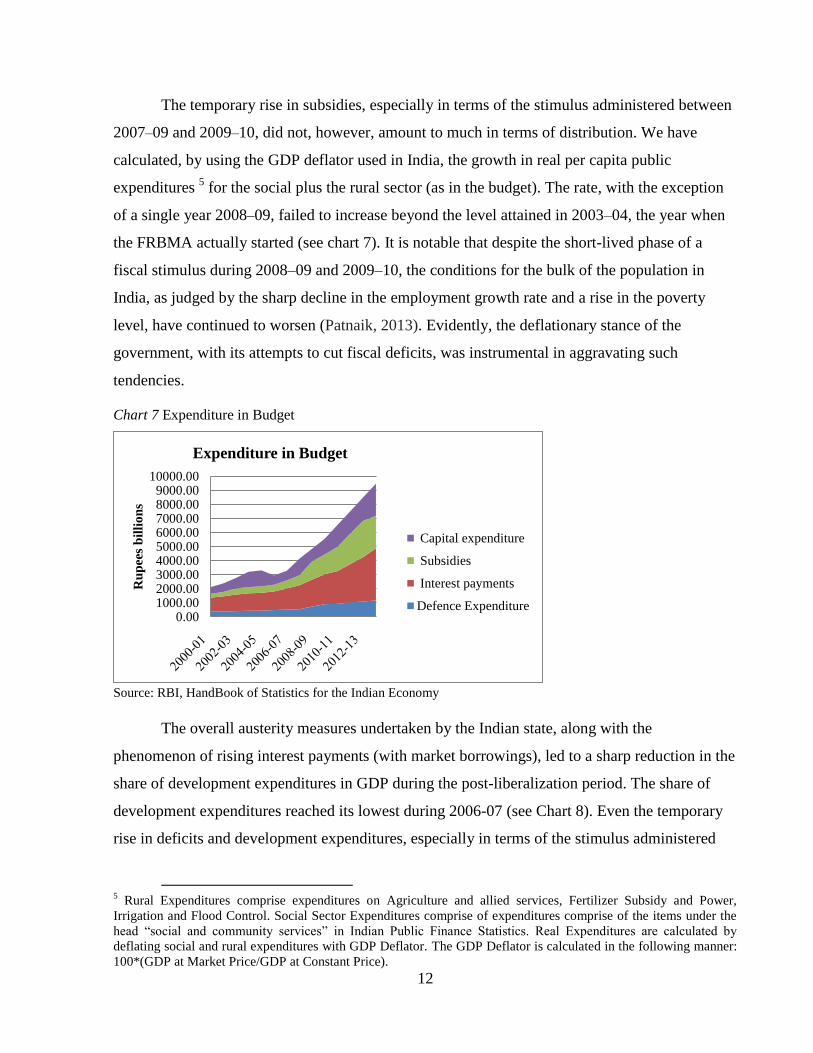
The temporary rise in subsidies, especially in terms of the stimulus administered between
2007–09 and 2009–10, did not, however, amount to much in terms of distribution. We have
calculated, by using the GDP deflator used in India, the growth in real per capita public
expenditures 5 for the social plus the rural sector (as in the budget). The rate, with the exception
of a single year 2008–09, failed to increase beyond the level attained in 2003–04, the year when
the FRBMA actually started (see chart 7). It is notable that despite the short-lived phase of a
fiscal stimulus during 2008–09 and 2009–10, the conditions for the bulk of the population in
India, as judged by the sharp decline in the employment growth rate and a rise in the poverty
level, have continued to worsen (Patnaik, 2013). Evidently, the deflationary stance of the
government, with its attempts to cut fiscal deficits, was instrumental in aggravating such
tendencies.
Chart 7 Expenditure in Budget
Source: RBI, HandBook of Statistics for the Indian Economy
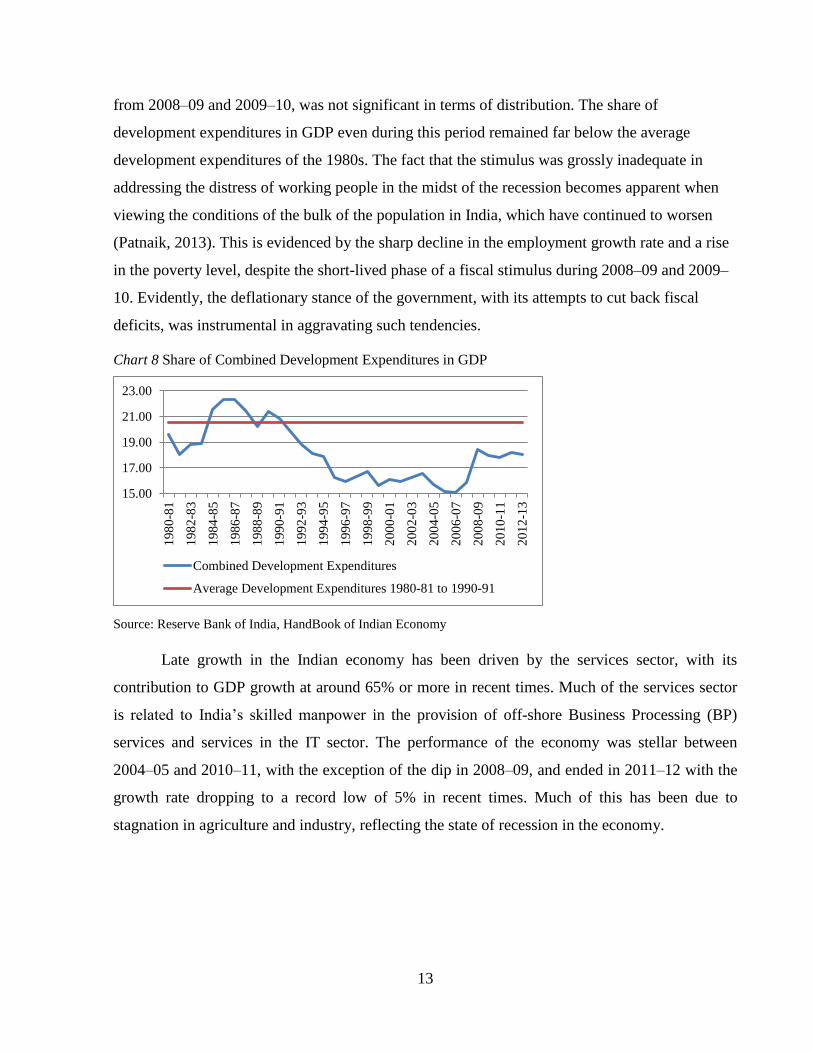
The overall austerity measures undertaken by the Indian state, along with the
phenomenon of rising interest payments (with market borrowings), led to a sharp reduction in the
share of development expenditures in GDP during the post-liberalization period. The share of
development expenditures reached its lowest during 2006-07 (see Chart 8). Even the temporary
rise in deficits and development expenditures, especially in terms of the stimulus administered
5 Rural Expenditures comprise expenditures on Agriculture and allied services, Fertilizer Subsidy and Power,
Irrigation and Flood Control. Social Sector Expenditures comprise of expenditures comprise of the items under the
head “social and community services” in Indian Public Finance Statistics. Real Expenditures are calculated by
deflating social and rural expenditures with GDP Deflator. The GDP Deflator is calculated in the following manner:
100*(GDP at Market Price/GDP at Constant Price).
0.001000.002000.003000.004000.005000.006000.007000.008000.009000.00
10000.00
Ru
pee
s b
illi
on
s
Expenditure in Budget
Capital expenditure
Subsidies
Interest payments
Defence Expenditure
13
from 2008–09 and 2009–10, was not significant in terms of distribution. The share of
development expenditures in GDP even during this period remained far below the average
development expenditures of the 1980s. The fact that the stimulus was grossly inadequate in
addressing the distress of working people in the midst of the recession becomes apparent when
viewing the conditions of the bulk of the population in India, which have continued to worsen
(Patnaik, 2013). This is evidenced by the sharp decline in the employment growth rate and a rise
in the poverty level, despite the short-lived phase of a fiscal stimulus during 2008–09 and 2009–
10. Evidently, the deflationary stance of the government, with its attempts to cut back fiscal
deficits, was instrumental in aggravating such tendencies.
Chart 8 Share of Combined Development Expenditures in GDP
Source: Reserve Bank of India, HandBook of Indian Economy
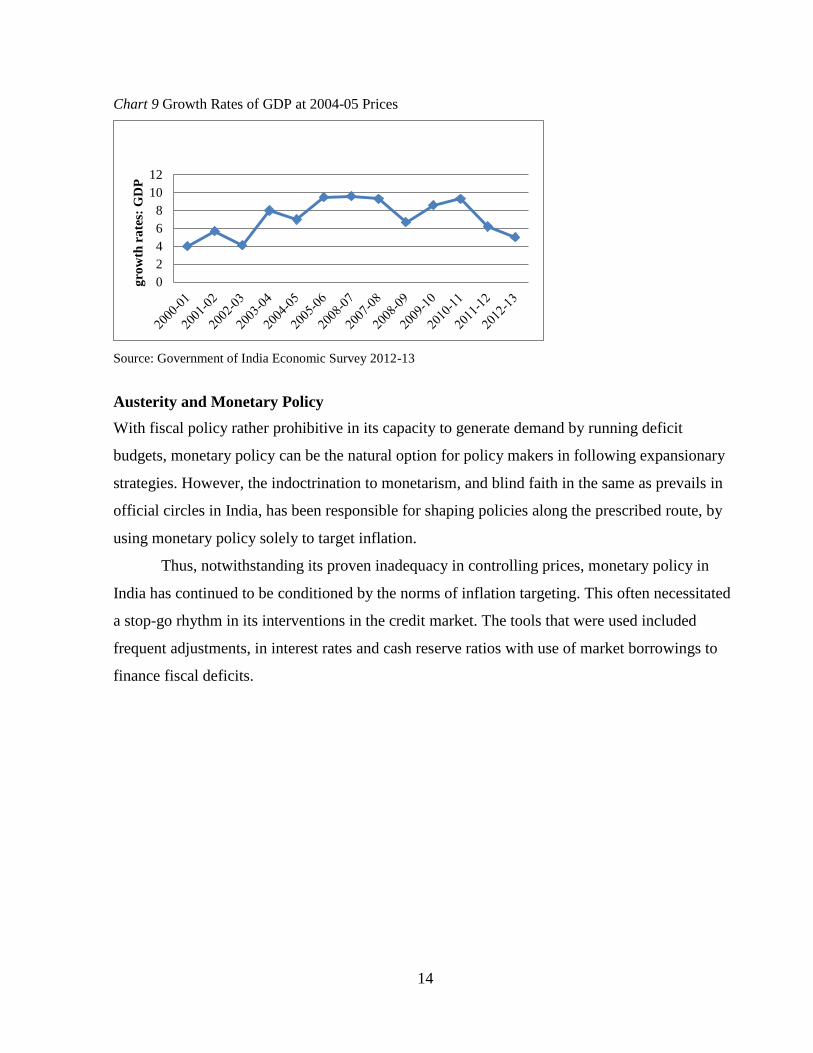
Late growth in the Indian economy has been driven by the services sector, with its
contribution to GDP growth at around 65% or more in recent times. Much of the services sector
is related to India’s skilled manpower in the provision of off-shore Business Processing (BP)
services and services in the IT sector. The performance of the economy was stellar between
2004–05 and 2010–11, with the exception of the dip in 2008–09, and ended in 2011–12 with the
growth rate dropping to a record low of 5% in recent times. Much of this has been due to
stagnation in agriculture and industry, reflecting the state of recession in the economy.
15.00
17.00
19.00
21.00
23.00
198
0-8
1
198
2-8
3
198
4-8
5
198
6-8
7
198
8-8
9
199
0-9
1
199
2-9
3
199
4-9
5
199
6-9
7
199
8-9
9
200
0-0
1
200
2-0
3
200
4-0
5
200
6-0
7
200
8-0
9
201
0-1
1
201
2-1
3
Combined Development Expenditures
Average Development Expenditures 1980-81 to 1990-91
14
Chart 9 Growth Rates of GDP at 2004-05 Prices
Source: Government of India Economic Survey 2012-13
Austerity and Monetary Policy
With fiscal policy rather prohibitive in its capacity to generate demand by running deficit
budgets, monetary policy can be the natural option for policy makers in following expansionary
strategies. However, the indoctrination to monetarism, and blind faith in the same as prevails in
official circles in India, has been responsible for shaping policies along the prescribed route, by
using monetary policy solely to target inflation.
Thus, notwithstanding its proven inadequacy in controlling prices, monetary policy in
India has continued to be conditioned by the norms of inflation targeting. This often necessitated
a stop-go rhythm in its interventions in the credit market. The tools that were used included
frequent adjustments, in interest rates and cash reserve ratios with use of market borrowings to
finance fiscal deficits.
0
2
4
6
8
10
12
gro
wth
ra
tes:
GD
P
15
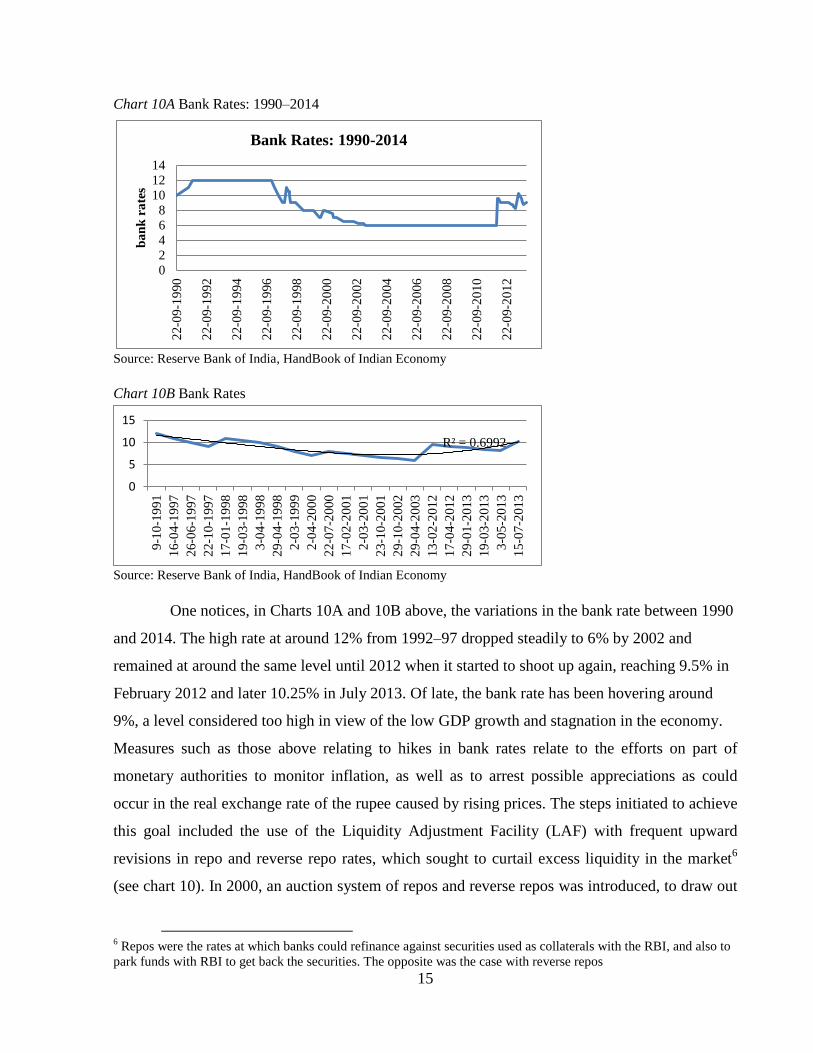
Chart 10A Bank Rates: 1990–2014
Source: Reserve Bank of India, HandBook of Indian Economy
Chart 10B Bank Rates
Source: Reserve Bank of India, HandBook of Indian Economy
One notices, in Charts 10A and 10B above, the variations in the bank rate between 1990
and 2014. The high rate at around 12% from 1992–97 dropped steadily to 6% by 2002 and
remained at around the same level until 2012 when it started to shoot up again, reaching 9.5% in
February 2012 and later 10.25% in July 2013. Of late, the bank rate has been hovering around
9%, a level considered too high in view of the low GDP growth and stagnation in the economy.
Measures such as those above relating to hikes in bank rates relate to the efforts on part of
monetary authorities to monitor inflation, as well as to arrest possible appreciations as could
occur in the real exchange rate of the rupee caused by rising prices. The steps initiated to achieve
this goal included the use of the Liquidity Adjustment Facility (LAF) with frequent upward
revisions in repo and reverse repo rates, which sought to curtail excess liquidity in the market6
(see chart 10). In 2000, an auction system of repos and reverse repos was introduced, to draw out
6 Repos were the rates at which banks could refinance against securities used as collaterals with the RBI, and also to
park funds with RBI to get back the securities. The opposite was the case with reverse repos
R² = 0.6992
0
5
10
15
9-1
0-1
99
1
16-0
4-1
997
26-0
6-1
997
22-1
0-1
997
17-0
1-1
998
19-0
3-1
998
3-0
4-1
99
8
29-0
4-1
998
2-0
3-1
99
9
2-0
4-2
00
0
22-0
7-2
000
17-0
2-2
001
2-0
3-2
00
1
23-1
0-2
001
29-1
0-2
002
29-0
4-2
003
13-0
2-2
012
17-0
4-2
012
29-0
1-2
013
19-0
3-2
013
3-0
5-2
01
3
15-0
7-2
013
02468
101214
22-0
9-1
990
22-0
9-1
992
22-0
9-1
994
22-0
9-1
996
22-0
9-1
998
22-0
9-2
000
22-0
9-2
002
22-0
9-2
004
22-0
9-2
006
22-0
9-2
008
22-0
9-2
010
22-0
9-2
012
ba
nk
ra
tes
Bank Rates: 1990-2014
16
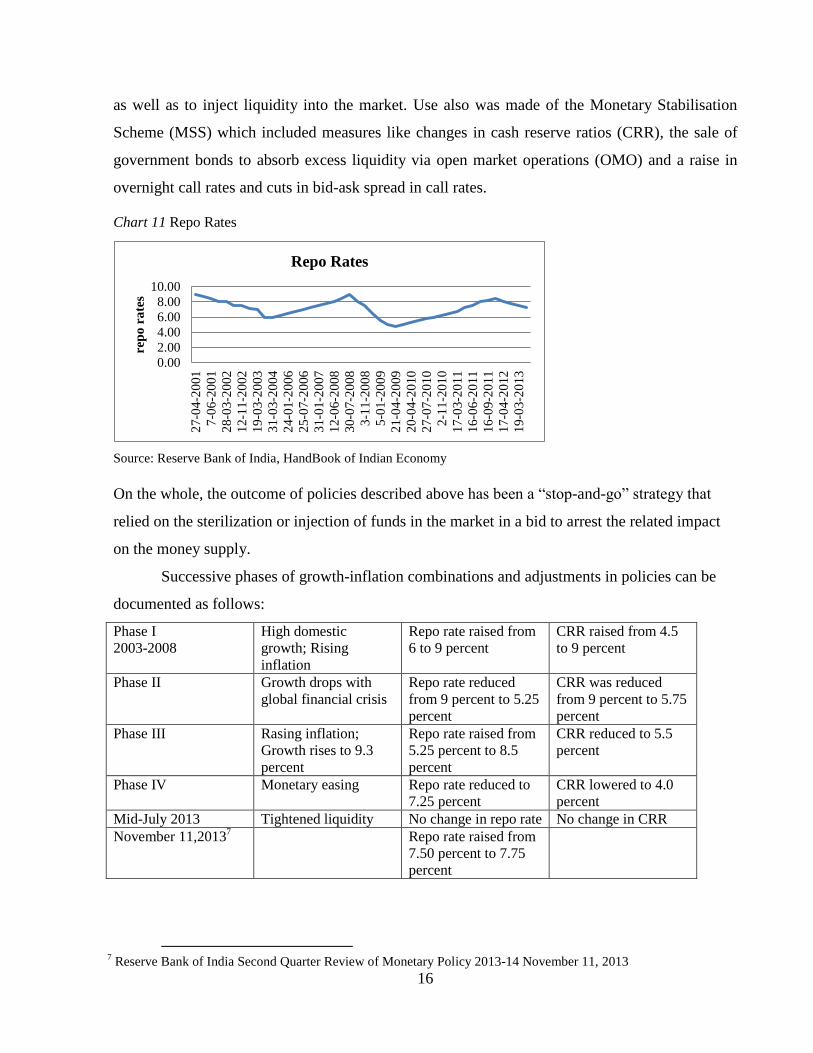
as well as to inject liquidity into the market. Use also was made of the Monetary Stabilisation
Scheme (MSS) which included measures like changes in cash reserve ratios (CRR), the sale of
government bonds to absorb excess liquidity via open market operations (OMO) and a raise in
overnight call rates and cuts in bid-ask spread in call rates.
Chart 11 Repo Rates
Source: Reserve Bank of India, HandBook of Indian Economy
On the whole, the outcome of policies described above has been a “stop-and-go” strategy that
relied on the sterilization or injection of funds in the market in a bid to arrest the related impact
on the money supply.
Successive phases of growth-inflation combinations and adjustments in policies can be
documented as follows:
Phase I
2003-2008
High domestic
growth; Rising
inflation
Repo rate raised from
6 to 9 percent
CRR raised from 4.5
to 9 percent
Phase II Growth drops with
global financial crisis
Repo rate reduced
from 9 percent to 5.25
percent
CRR was reduced
from 9 percent to 5.75
percent
Phase III Rasing inflation;
Growth rises to 9.3
percent
Repo rate raised from
5.25 percent to 8.5
percent
CRR reduced to 5.5
percent
Phase IV Monetary easing Repo rate reduced to
7.25 percent
CRR lowered to 4.0
percent
Mid-July 2013 Tightened liquidity No change in repo rate No change in CRR
November 11,20137 Repo rate raised from
7.50 percent to 7.75
percent
7 Reserve Bank of India Second Quarter Review of Monetary Policy 2013-14 November 11, 2013
0.00
2.00
4.00
6.00
8.00
10.00
27-0
4-2
001
7-0
6-2
00
1
28-0
3-2
002
12-1
1-2
002
19-0
3-2
003
31-0
3-2
004
24-0
1-2
006
25-0
7-2
006
31-0
1-2
007
12-0
6-2
008
30-0
7-2
008
3-1
1-2
00
8
5-0
1-2
00
9
21-0
4-2
009
20-0
4-2
010
27-0
7-2
010
2-1
1-2
01
0
17-0
3-2
011
16-0
6-2
011
16-0
9-2
011
17-0
4-2
012
19-0
3-2
013
rep
o r
ate
s
Repo Rates
17
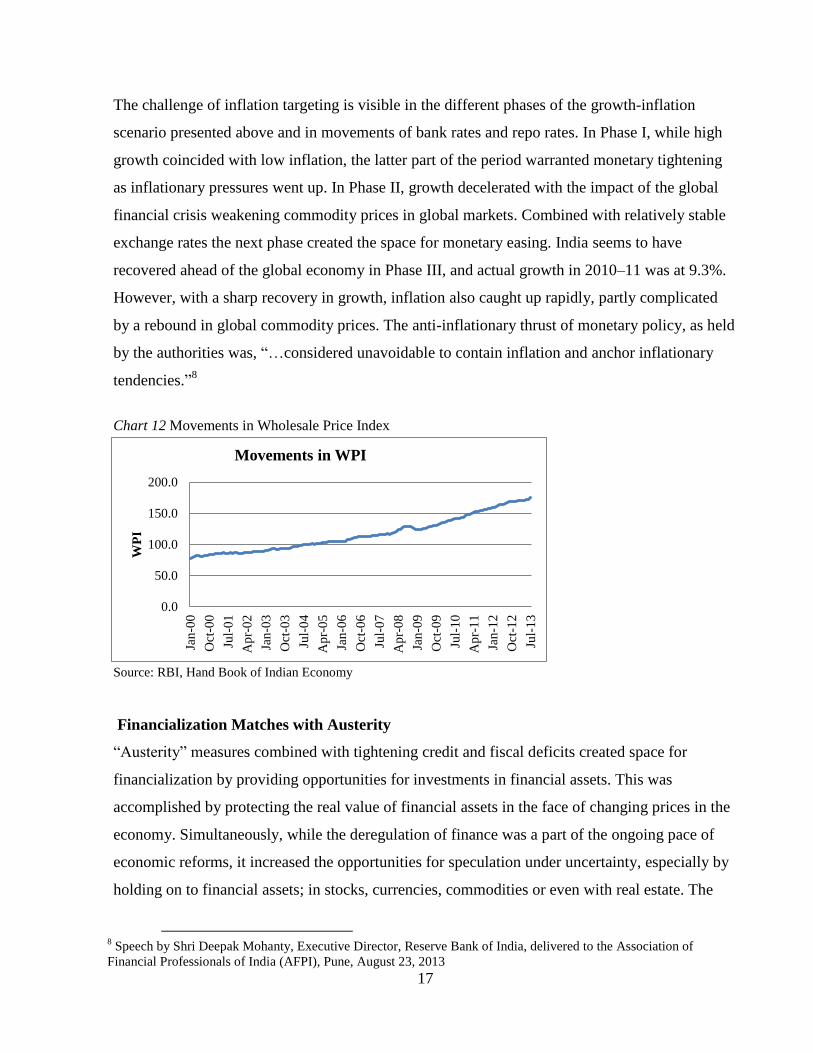
The challenge of inflation targeting is visible in the different phases of the growth-inflation
scenario presented above and in movements of bank rates and repo rates. In Phase I, while high
growth coincided with low inflation, the latter part of the period warranted monetary tightening
as inflationary pressures went up. In Phase II, growth decelerated with the impact of the global
financial crisis weakening commodity prices in global markets. Combined with relatively stable
exchange rates the next phase created the space for monetary easing. India seems to have
recovered ahead of the global economy in Phase III, and actual growth in 2010–11 was at 9.3%.
However, with a sharp recovery in growth, inflation also caught up rapidly, partly complicated
by a rebound in global commodity prices. The anti-inflationary thrust of monetary policy, as held
by the authorities was, “…considered unavoidable to contain inflation and anchor inflationary
tendencies.”8
Chart 12 Movements in Wholesale Price Index
Source: RBI, Hand Book of Indian Economy
Financialization Matches with Austerity
“Austerity” measures combined with tightening credit and fiscal deficits created space for
financialization by providing opportunities for investments in financial assets. This was
accomplished by protecting the real value of financial assets in the face of changing prices in the
economy. Simultaneously, while the deregulation of finance was a part of the ongoing pace of
economic reforms, it increased the opportunities for speculation under uncertainty, especially by
holding on to financial assets; in stocks, currencies, commodities or even with real estate. The
8 Speech by Shri Deepak Mohanty, Executive Director, Reserve Bank of India, delivered to the Association of
Financial Professionals of India (AFPI), Pune, August 23, 2013
0.0
50.0
100.0
150.0
200.0
Jan
-00
Oct
-00
Jul-
01
Ap
r-0
2
Jan
-03
Oct
-03
Jul-
04
Ap
r-0
5
Jan
-06
Oct
-06
Jul-
07
Ap
r-0
8
Jan
-09
Oct
-09
Jul-
10
Ap
r-1
1
Jan
-12
Oct
-12
Jul-
13
WP
I
Movements in WPI
18
liquidity needed to engage in speculation was forthcoming with easy inflows of finance provided
by the FIIs, which led short-term capital flows. The impact was evident in the rising turnovers as
well as in rising stock price indices in the secondary stock market. A large part of these
transactions was related to trade in derivatives, consisting of swaps, options, futures and similar
devices to hedge in the face of uncertainty. A similar pattern prevailed in markets for
commodities, real estate, and currencies where financial assets were held as hedges against
uncertainty. The spurts in turnovers and prices in the secondary stock market went hand in hand
with the ongoing pace of financial deregulation. As mentioned above, much of the above
circumstances were related to the uninterrupted FII-led short-term capital flows in the new
regime of liberalised capital inflows.
Between “austerity” measures to target inflation and the liberalised capital flows which
provided the liquidity in the market for speculation in holding assets, investments in financial
assets opened new opportunities for profits which were more lucrative as compared to those held
against real assets. The spurts in capitalisation as well as the rising stock prices, as observed in
the Bombay Stock Exchange (BSE), provide an indication of the same pattern. (Chart 12)
Financialization and Corporate Investments
Financialization in combination with austerity measures provided a strong impetus to hold
financial assets, both with good returns and prospects for capital gains. Tendencies of this can be
identified in the pattern of investments by the corporate sector. As pointed out in connection with
large corporates in advanced economies, one can detect some “owner-manager” conflict which
creates a “growth-profit trade-off” in business decisions at firm level (Crotty, 1990). Thus
shareholders typically prefer short-term profitability and low investments in capital stock which
can lead to long- term growth of the firms. In the process, managers also tend to become aligned
with shareholders’ preferences for short-term profits rather than for growth. This happens with
the introduction of “market-oriented remuneration schemes,” which link bonuses (or employees’
stock options, known as ESOP) to balance-sheet performance at the firm level. As pointed out,
“…the traditional managerial policy of ‘retain and invest’ is replaced by the shareholder-oriented
strategy of downsize and distribute (Hein, 2010).” The accuracy of this hypothesis has been
verified in the context of advanced economies using econometric evidence that “…
financialisation has caused a slowdown in accumulation (Stockhammer, 2004)”(van Treeck,
2008; Organhazi, 2008). As pointed out, this can be verified by considering that the “…rising
19
share of interest and dividends in profits of non-financial business (which is) an indicator for the
dominance of short-term profits in firms’ or in managements’ preferences …. (which are)
negatively associated with real investment (Hein, 2010).” The rising rentier income shares,
observed in advanced economies (Power et al., 2003), may not lead to a pattern of “finance-led-
growth” unless the consumption propensity of the rentiers are higher than the those as national
average (Boyer, 2000).
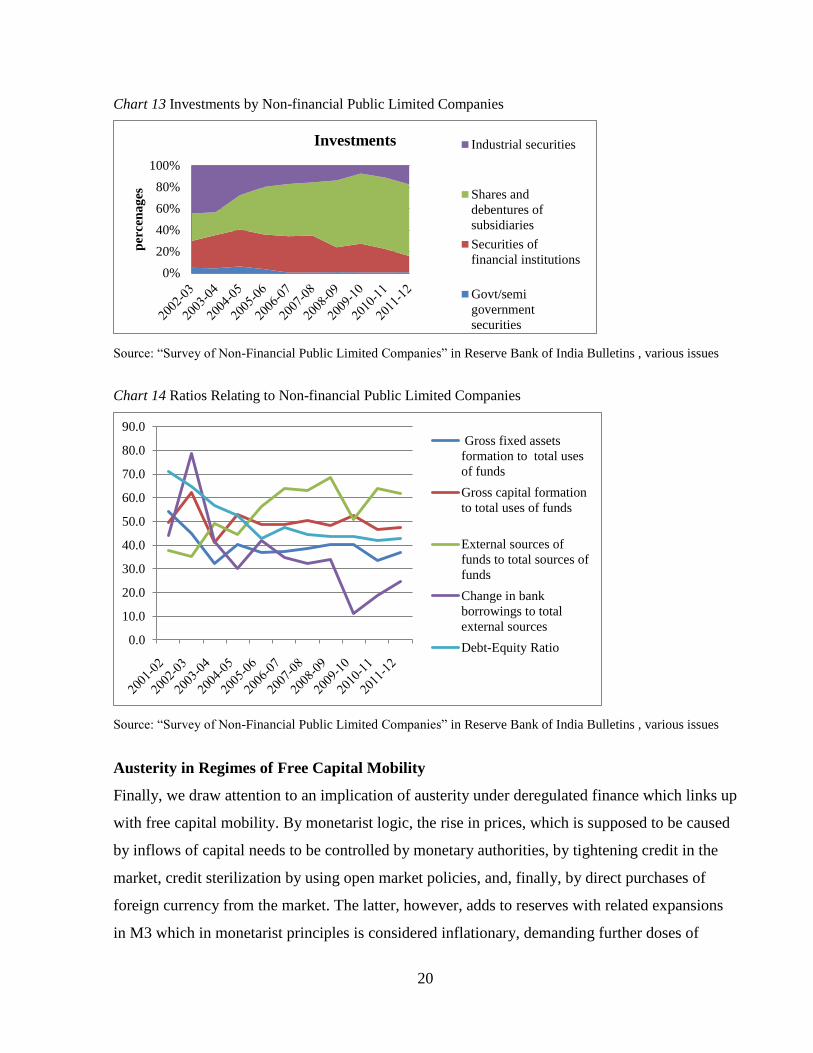
Preferences and trade-offs as described above are also reflected in the balance sheets of
corporates in terms of their distribution of investible resources between industrial and other
(primarily financial) securities. If one looks at India, where growth in the real economy has been
dismally low despite the high levels of activity in stocks, currency trading, commodity markets
and related activities like those in real estate, one notices similar effects of financialization in
corporate finance. We point to the changes in the balance sheet of corporates using estimates
provided by the RBI on corporate investments. The data show a steady drop in industrial
securities as a proportion of total investments by non-financial public limited companies.
(Chart14). The above were complemented by proportionate increases in financial securities
which were held between securities issued by the government, financial institutions and as
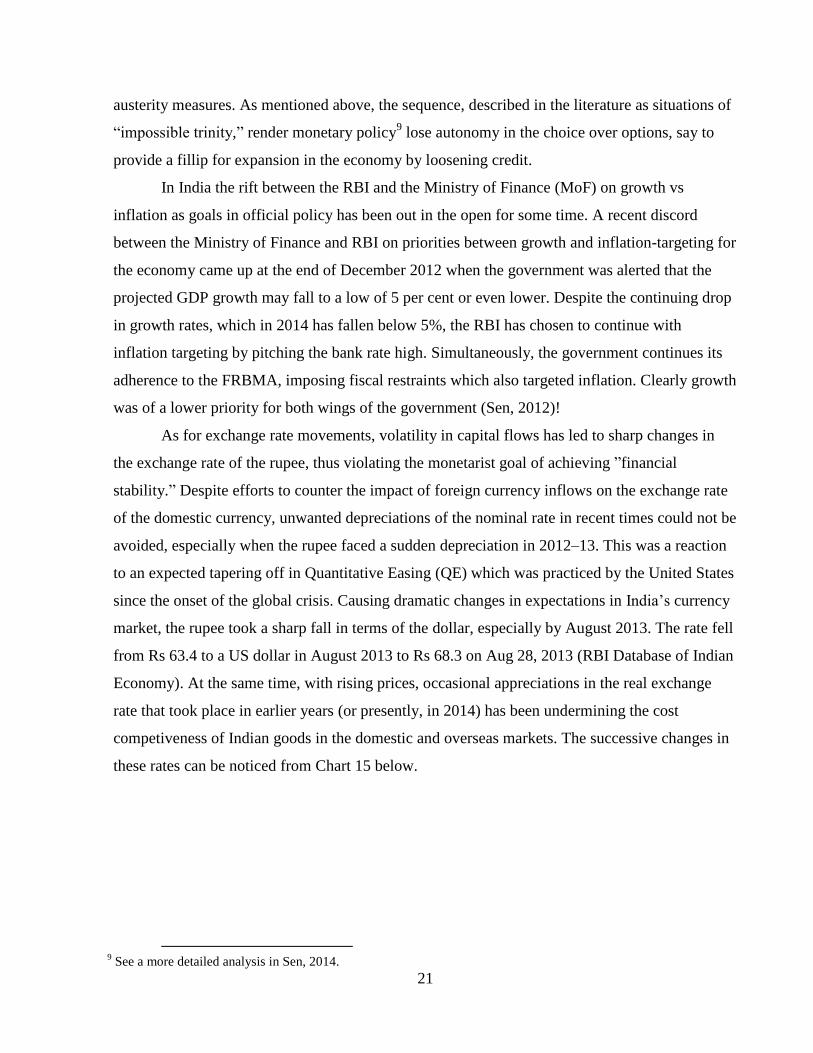
debentures. Corporates in India also have been less active recently, as compared to in the past, in
borrowing from banks, both with intermittent hikes in rates and also with the slowing down of
growth in the economy; especially in the industrial sector. This has led to sharp declines in the
ratios of gross fixed assets as well as in gross capital formation as a ratio of total use of funds by
these corporates (Chart 14). Evidently, changes in the economy, such as those above, indicate a
unidirectional pattern where issues relating to real sector investments have been of lower priority
to the private corporate sector.
20
Chart 13 Investments by Non-financial Public Limited Companies
Source: “Survey of Non-Financial Public Limited Companies” in Reserve Bank of India Bulletins , various issues
Chart 14 Ratios Relating to Non-financial Public Limited Companies
Source: “Survey of Non-Financial Public Limited Companies” in Reserve Bank of India Bulletins , various issues
Austerity in Regimes of Free Capital Mobility
Finally, we draw attention to an implication of austerity under deregulated finance which links up
with free capital mobility. By monetarist logic, the rise in prices, which is supposed to be caused
by inflows of capital needs to be controlled by monetary authorities, by tightening credit in the
market, credit sterilization by using open market policies, and, finally, by direct purchases of
foreign currency from the market. The latter, however, adds to reserves with related expansions
in M3 which in monetarist principles is considered inflationary, demanding further doses of
0%
20%
40%
60%
80%
100%
per
cen
ag
es
Investments Industrial securities
Shares and
debentures of
subsidiaries
Securities of
financial institutions
Govt/semi
government
securities
0.0
10.0
20.0
30.0
40.0
50.0
60.0
70.0
80.0
90.0 Gross fixed assets
formation to total uses
of funds
Gross capital formation
to total uses of funds
External sources of
funds to total sources of
funds
Change in bank
borrowings to total
external sources
Debt-Equity Ratio
21
austerity measures. As mentioned above, the sequence, described in the literature as situations of
“impossible trinity,” render monetary policy9 lose autonomy in the choice over options, say to
provide a fillip for expansion in the economy by loosening credit.
In India the rift between the RBI and the Ministry of Finance (MoF) on growth vs
inflation as goals in official policy has been out in the open for some time. A recent discord
between the Ministry of Finance and RBI on priorities between growth and inflation-targeting for
the economy came up at the end of December 2012 when the government was alerted that the
projected GDP growth may fall to a low of 5 per cent or even lower. Despite the continuing drop
in growth rates, which in 2014 has fallen below 5%, the RBI has chosen to continue with
inflation targeting by pitching the bank rate high. Simultaneously, the government continues its
adherence to the FRBMA, imposing fiscal restraints which also targeted inflation. Clearly growth
was of a lower priority for both wings of the government (Sen, 2012)!
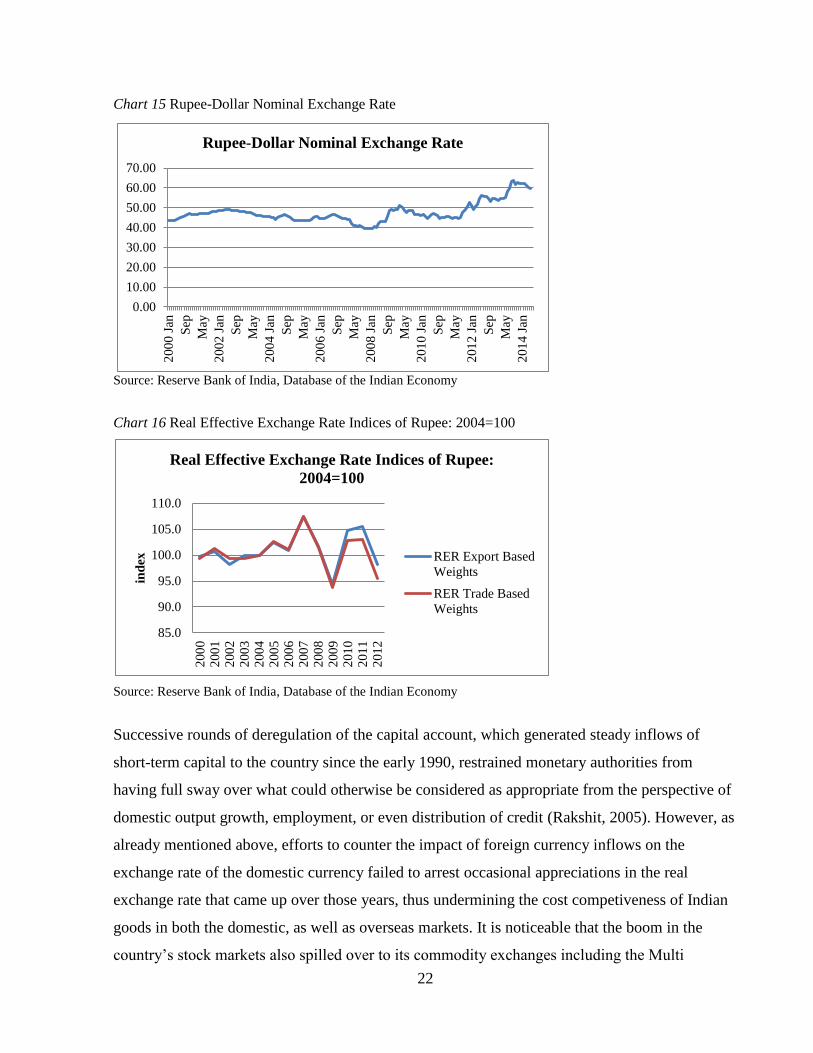
As for exchange rate movements, volatility in capital flows has led to sharp changes in
the exchange rate of the rupee, thus violating the monetarist goal of achieving ”financial
stability.” Despite efforts to counter the impact of foreign currency inflows on the exchange rate
of the domestic currency, unwanted depreciations of the nominal rate in recent times could not be
avoided, especially when the rupee faced a sudden depreciation in 2012–13. This was a reaction
to an expected tapering off in Quantitative Easing (QE) which was practiced by the United States
since the onset of the global crisis. Causing dramatic changes in expectations in India’s currency
market, the rupee took a sharp fall in terms of the dollar, especially by August 2013. The rate fell
from Rs 63.4 to a US dollar in August 2013 to Rs 68.3 on Aug 28, 2013 (RBI Database of Indian
Economy). At the same time, with rising prices, occasional appreciations in the real exchange
rate that took place in earlier years (or presently, in 2014) has been undermining the cost
competiveness of Indian goods in the domestic and overseas markets. The successive changes in
these rates can be noticed from Chart 15 below.
9 See a more detailed analysis in Sen, 2014.
22
Chart 15 Rupee-Dollar Nominal Exchange Rate
Source: Reserve Bank of India, Database of the Indian Economy
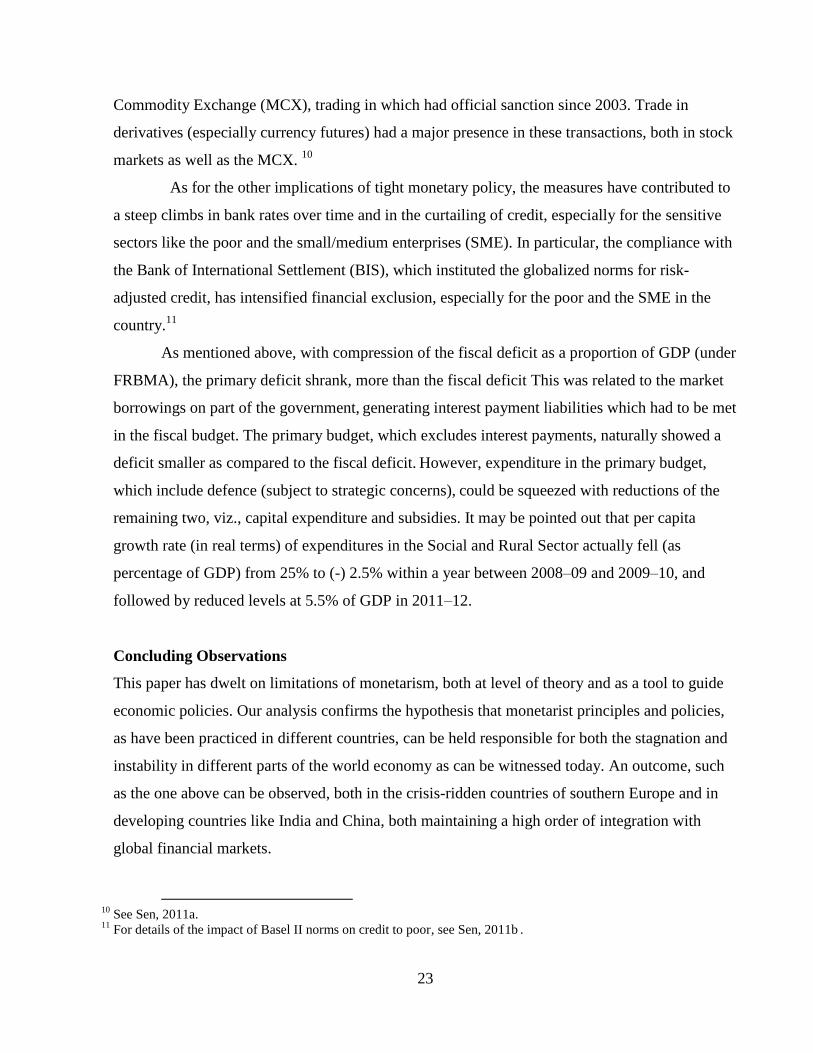
Chart 16 Real Effective Exchange Rate Indices of Rupee: 2004=100
Source: Reserve Bank of India, Database of the Indian Economy
Successive rounds of deregulation of the capital account, which generated steady inflows of
short-term capital to the country since the early 1990, restrained monetary authorities from
having full sway over what could otherwise be considered as appropriate from the perspective of
domestic output growth, employment, or even distribution of credit (Rakshit, 2005). However, as
already mentioned above, efforts to counter the impact of foreign currency inflows on the
exchange rate of the domestic currency failed to arrest occasional appreciations in the real
exchange rate that came up over those years, thus undermining the cost competiveness of Indian
goods in both the domestic, as well as overseas markets. It is noticeable that the boom in the
country’s stock markets also spilled over to its commodity exchanges including the Multi
0.00
10.00
20.00
30.00
40.00
50.00
60.00
70.002
00
0 J
an
Sep
May
200
2 J
an
Sep
May
200
4 J
an
Sep
May
200
6 J
an
Sep
May
200
8 J
an
Sep
May
201
0 J
an
Sep
May
201
2 J
an
Sep
May
201
4 J
an
Rupee-Dollar Nominal Exchange Rate
85.0
90.0
95.0
100.0
105.0
110.0
200
02
00
12
00
22
00
32
00
42
00
52
00
62
00
72
00
82
00
92
01
02
01
12
01
2
ind
ex
Real Effective Exchange Rate Indices of Rupee:
2004=100
RER Export Based
Weights
RER Trade Based
Weights
23
Commodity Exchange (MCX), trading in which had official sanction since 2003. Trade in
derivatives (especially currency futures) had a major presence in these transactions, both in stock
markets as well as the MCX. 10
As for the other implications of tight monetary policy, the measures have contributed to
a steep climbs in bank rates over time and in the curtailing of credit, especially for the sensitive
sectors like the poor and the small/medium enterprises (SME). In particular, the compliance with
the Bank of International Settlement (BIS), which instituted the globalized norms for risk-
adjusted credit, has intensified financial exclusion, especially for the poor and the SME in the
country.11
As mentioned above, with compression of the fiscal deficit as a proportion of GDP (under
FRBMA), the primary deficit shrank, more than the fiscal deficit This was related to the market
borrowings on part of the government, generating interest payment liabilities which had to be met
in the fiscal budget. The primary budget, which excludes interest payments, naturally showed a
deficit smaller as compared to the fiscal deficit. However, expenditure in the primary budget,
which include defence (subject to strategic concerns), could be squeezed with reductions of the
remaining two, viz., capital expenditure and subsidies. It may be pointed out that per capita
growth rate (in real terms) of expenditures in the Social and Rural Sector actually fell (as
percentage of GDP) from 25% to (-) 2.5% within a year between 2008–09 and 2009–10, and
followed by reduced levels at 5.5% of GDP in 2011–12.
Concluding Observations
This paper has dwelt on limitations of monetarism, both at level of theory and as a tool to guide
economic policies. Our analysis confirms the hypothesis that monetarist principles and policies,
as have been practiced in different countries, can be held responsible for both the stagnation and
instability in different parts of the world economy as can be witnessed today. An outcome, such
as the one above can be observed, both in the crisis-ridden countries of southern Europe and in
developing countries like India and China, both maintaining a high order of integration with
global financial markets.
10
See Sen, 2011a. 11
For details of the impact of Basel II norms on credit to poor, see Sen, 2011b .
24
As compared to Greece, one of the worst crisis-hit countries in southern Europe, India’s
trajectory in terms of austerity-driven stagnation has been somewhat different. While financial
deregulation has generated a spate of finance-driven activities in both countries, Greece
experienced a flood of unrestrained borrowing by private financial institutions which landed the
country in a state of near bankruptcy as an aftermath of the global financial crisis. This has
prompted the donors including the IMF and the international financial community (backed by the
European Central Bank and the rich countries of the Euro-land) to enforce strict fiscal and
monetary discipline in the country. The multiple compulsions faced by the Greek authorities
included first, the rules under the Maastritch Treaty, the movements in the euro which often
proved overvalued in terms of trade competitiveness and finally, the debt-peonage enforcing
austerity in terms of the conditional loan packages offered by the donors.
For India the story of finance-driven austerity and the pledge to adopt the package of
monetarism has followed a different path. India ceased to be a high external debtor country since
the late 1990s and the compulsions to enforce fiscal and monetary discipline as happened in 1991
in terms of the conditional loan package from the IMF has not recurred in later years. The
gradual shift in policies which came up over the next two decades can thus be related to the
change in the mind-set of those who controlled policies, with a leap in the direction of neoliberal
strategies which gave a free rein to global finance. As a consequence the latter had a full sway
over economic policies like limiting fiscal deficits, tightening credit (with high interest rates and
other devices), easy inflows of short-term capital (often used to fetch profits in speculation), tax
concessions on capital gains and corporates as well as households. Thus the Indian state was
found in a collaborative mood, or even as a predator to facilitate the above transformations. The
least was done to arrest the related consequences in the economy which include the sharp drops
in capital expenditure (and sometimes even social expenditure) by the state, reduced share of
investments by corporates in industrial securities as compared to the share in financial securities,
deployment of short term finance brought in by the FIIs for speculation in commodities, stocks
and real estates, loss of autonomy in monetary policy in the face of volatile as well as excessive
inflows of flight capital, and, finally, the related instabilities, in exchange rates, credit markets
and even in official reserves.
Faith in the neo-liberal doctrine of monetarism has thus oriented policy making in India
which has tacitly accepted the related compulsions by foregoing other goals like growth of the
economy or distribution as of concern. With a transformation like the one above India provides a
25
classic case, of a tacit compliance which came without compulsions (as could be identified in
situations like an urgency to fetch conditional official loans to avoid an imminent bankruptcy)
which happened in Greece and some other South European countries. The change was more
subtle, with a silent acceptance by the ruling elite in the country to the “order” which falls in line
for an entry to the lucrative arena of global finance for rentiers all over the world.
26
References
Arestis, Philip and Sawyer, M. (2004) “On Fiscal Policy and Budget Deficits,” Journal of
Economics , Vol. 1, No. 2.
Arestis, Philip and Paliginis, Eleni (2000) “Globalisation, Regionalism and National Economic
Policies” in Jan Toporowski, “Political Economy and the New Capitalism,” Routledge,
London and New York 2000
Boyer, Robert (2000) “Is a Finance-led Growth Regime a Viable Alternative to Fordism? A
Preliminary Analysis” Economy and Society, 29: 1, 111–145
Buiter, W.H. (1990) “The Arithmetic of Solvency” in W.H. Buiter (ed), Principles of Budgetary
and Financial Policy, MIT Press, U.S.A
Crotty, J. (1990) “Owner-Manager Conflict and financial theories of investment instability: A
Critical Assessment of Keynes, Tobin and Minsky,” Journal of Post Keynesian
Economics, 12 (4), pp. 519-42, Cited in Arestis, Philip and Malcolm Sawyer, “21st
Century Keynesian Economics,” Palgrave-Macmillan 2009, p. 123
Domar, Evsey (1944) “The Burden of the Debt and National Income,” The American Economic
Review, Vol. 34, No. 4
EUbusiness (2010). “Eurozone Agrees to 10 Billion Euro Help for Greece,” Published May 2,
2010. Accessed July 24, 2014, http://www.eubusiness.com/news-eu/greece-finance-
imf.4ew/
Galbraith, James K. (2009) “The Predator State: How Conservatives Abandoned the Free Market
and Why Liberals Should Too,” Free Press
Gatopoulos, Derek (2013) “Suicides in Greece Spike During Financial Crisis,” The World Post,
http://www.huffingtonpost.com/2013/09/10/greece-suicides_n_3900906.html, Accessed
July 25, 2014
Hein, Eckherd (2010) “A Keynesian Perspective on Financialisation” in Philip Arestis and
Malcolm Sawyer, op.cit p. 123
Hicks, J.R. (1937). “Mr. Keynes and the Classics: A Suggested Interpretation,” Econometrica,
Vol 5, No. 2, pp 147–159
Koo, Richard C. “Balance Sheet Recession as the ‘Other Half’of Macroeconomics” European
Journal of Economics and Economic Policies: Intervention, Vol. 10 No. 2, 2013, pp.
136–157
Krugman, Paul (1999) "O Canada – A Neglected Nation Gets its Nobel." Slate (magazine),
http://www.slate.com/articles/business/the_dismal_science/1999/10/o_canada.html,
Accessed July 24, 2014
27
Organhazi O. (2008) “Financialisation and Capital Accumulation in the Non-financial Corporate
Sector: A Theoretical and Empirical Investigation on the US Economy: 1973–2003,”
Cambridge Journal of Economics, 32 (6): 863-886
Palley, Tom (2009) “Rethinking the Economics of Capital Mobility and Capital Controls”
Political Economy Research Institute, University of Massachusetts Amherst,
http://www.peri.umass.edu/fileadmin/pdf/working_papers/working_papers_151-
200/WP193.pdf, Accessed July 24, 2014
Pasinnetti, L. (1998). “The myth (or Folly) of the 3% Deficit/GDP: Maastricht
‘Parameter,’”Cambridge Journal of Economics , 22 (1): 103-116.
Patnaik, U. (2013) “Poverty Trends in India 2004–05 to 2009–10,” Economic and Political
Weekly, Vol. 48, No. 40: 43-58
Polychroniou, C.J, “The Myth of the Greek Economic Success Story,” Levy Economics Institute
Of Bard College, Policy Note 2014/3
Power, D., Epstein, G., Abrena, M. (2003) “Trends in the Rentier Income Share in OECD
Countries, 1960-2000,” Political Economy Research Institute, University of
Massachusetts Amherst.
Rakshit, M. (2005). “Budget Deficit: Sustainability, Solvency and Optimality” in Amaresh
Bagchi edited Readings in Public Finance, Oxford University Press, Oxford
Reserve Bank of India (RBI) (2012) Handbook of Statistics on Indian Economy
Reserve Bank of India (RBI), Database of Indian Economy
Reserve Bank of India (RBI) “Survey of Non-Financial Public Limited Companies” in Reserve
Bank of India Bulletins, various issues
Stockhammer, E. (2004) “Financialisation and the Slowdown of Accumulation” Cambridge
Journal of Economics, 28 (5): 719-741
Sen, Sunanda (2003) “Global Crisis at Risk: On Stagnation and Instability in Real Economies,”
Palgrave-Macmillan
_____. (2011a) “Uncertainty and Speculation in the Keynesian Tradition: Relevance in
Commodity Futures” in edited volume by Oscar Dejuan, Eladio Febrero, and Maria
Cristina Marcuzzo, “The First Great Recession of the 21st Century: Competing
Explanations,” Edward Elgar Publishing
_____. (2011b) “Basel Norms in India and Brazil” in Ricardo Gottschalk (ed) “Basel II and
Developing Countries,” Palgrave Macmillan
_____. (2012) “Growth: Lost between RBI and North Block” The Hindu (Delhi), December 16,
2012
28
_____. (2014) “Managing Finance in Emerging Economies: The Case of India” in Sunanda Sen,
“Dominant Finance and Stagnant Economies,” Oxford University Press, pp 314-348
van Treeck, Till (2008) “Reconsidering the Investment-Profit Nexus in Finance-led Economies:
an ARDL-based Approach,” Metroeconomica, Vol. 59, Issue 3, pp. 371–404
World Bank data, data.worldbank.org, Accessed July 24, 2014
Wray, L. Randall (2012) “Imbalances? What Imbalances? A Dissenting View,” Levy Economics
Institute of Bard College, Working Paper No. 704


