Embed Size (px)
Citation preview

Arch Hydrobiol 159 1 1ndash23 Stuttgart January 2004
Predicting Mysis relicta vertical distribution in LakeOntario
Gideon Gal12 Lars G Rudstam3 and Ora E Johannsson4
With 6 figures and 3 tables
Abstract A model predicting the distribution and diel vertical migration (DVM) ofMysis relicta was constructed based on inferred temperature preferences determinedfrom published feeding experiments and light preferences estimated using observed insitu distributions under isothermal conditions Model predictions were compared todetailed (on a meter scale) observations of mysid vertical distributions using 420 kHzhydroacoustics at two stations during three seasons in Lake Ontario The modeldescribed the spring and summer distributions but failed to predict fall distributionswhen the thermocline was below 40 m depth Addition of a term representing avoid-ance of temperature gradients derived independently from the literature improved pre-dictions substantially during fall We hypothesize that the avoidance of a temperaturegradient may be the result of the presence of fish kairomones in the upper surface wa-ters Overlap between distributions predicted by the model including the temperaturegradient and observed distributions was over 60 for most time periods and seasonsThis model can be used to calculate likely overlap between mysid and their zooplank-ton prey and between mysids and their fish predators based on readily measured tem-perature and light profiles
Key words diel vertical migration model temperature preference hydroacoustics
1 Authorsrsquo addresses Ecology and Evolutionary Biology 2154 Snee Hall CornellUniversity Ithaca NY 14853 USA and Centre for Water Research University of We-stern Australia 35 Stirling Highway Crawley WA 6907 AustraliaE-mail galoceanorgil2 Present address Y Alon Kinneret Limnological Laboratory PO Box 447 MigdalIsrael 149503 Cornell Biological Field Station Department of Natural Resources 900 ShackeltonPt Road Bridgeport New York 13030 USA4 Great Lakes Laboratory for Fisheries and Aquatic Sciences Fisheries and OceansCanada Canada Centre for Inland Waters 867 Lakeshore Rd Burlington Ont L7R4A6 Canada
DOI 1011270003-913620040159-0001 0003-9136040159-0001 $ 600atilde 2004 E Schweizerbartrsquosche Verlagsbuchhandlung D-70176 Stuttgart
2 Gideon Gal Lars G Rudstam and Ora E Johannsson
Introduction
Diel vertical migrations (DVM) of invertebrates including mysid shrimps areubiquitous phenomena that have received considerable attention in the litera-ture DVM has been studied using field observations experiments and modelsField studies typically relate observed vertical migration behavior with bioticor abiotic cues such as light temperature or prey and predator distribution(eg Zaret amp Suffern 1976 Bollens amp Frost 1989 Lopez amp Huntley1995 Destasio et al 1996) Although many of the observational studies re-port the population distribution of the target organism the migration is usuallytied to conditions existing at the leading edge or mean depth of the migratinglayer The experimental studies have attempted to test migration behavior as afunction of similar cues typically concentrating on the behavior of a smallnumber of individuals in tanks or mesocosms In these cases the mean depthor the migration amplitude of the population is usually the response variableexamined (Dini amp Carpenter 1992 van Gool 1997) Modeling studies ofDVM have also focused on predicting the depth of the leading edge or migra-tion amplitude of the population (Ringelberg 1995 a) but not usually thewhole vertical distribution of the migratory layer (but see Andersen amp Nival1991 Richards et al 1996)
The opossum shrimp Mysis relicta is a freshwater member of a mainly ma-rine group of small crustaceans in the family Mysidacea It is a bentho-pelagicorganism that resides during the day in the dark waters of numerous lakes ac-ross North America and Scandinavia (Mauchline 1980) This species ascendsat dusk and forms a well defined dense layer in the metalimnetic or upperhypolimnetic waters (Beeton amp Bowers 1982) These DVMs allow mysidsto feed on more abundant zooplankton in the metalimnion at night when pred-ation by fish is low The depth and thickness of the mysid layer vary tempo-rally and spatially which will determine the degree of spatial overlap betweenmysids and their prey and predators Therefore understanding and quantifyingthe food-web interactions between mysids and their prey and predators re-quires information on mysid vertical distribution in the water column through-out the year
Previous studies have reported the leading edge or mean depth of the Mysisnighttime vertical distribution to be determined by either light intensity ortemperature (Teraguchi et al 1975) In this paper we extend these studies bydeveloping a model describing diel changes of the whole mysid distributionover the seasons not only the leading edge or mean depth
We approach this problem by combining independently determined prefer-ences to light and temperature into a predictive model of mysid vertical distri-bution Predictions from this model are then compared with detailed observa-tions of the vertical distribution of mysids at different time periods collectedwith 420 kHz hydroacoustics over three season and two stations We show that
Mysis relicta vertical distribution 3
preference to light and temperature was not sufficient to predict vertical distri-bution and that adding a term to the model accounting for mysid avoidance ofstrong temperature gradients substantially increased the predictability of themodel We hypothesize that this avoidance of the thermocline is due to pres-ence of fish kairomones However even though we anticipated that mysidvertical distribution would be affected by fish (predator) density we foundthat areal fish density had little effect on overlap between model predictionsand field observations
Methods
Field data
Temperature and light profiles
We collected temperature profiles at each of the stations simulated by the model dur-ing each of the three seasons (Table 1) Data were collected using a Hydrolab profilerlowered to the extent of the cable (60 m) Below this depth we assumed that temper-ature was the same as at 60 m Light extinction coefficient values over a wavelengthrange of 400ndash700 nm were determined from light profiles conducted simultaneouslywith the temperature profiles A calibrated LI-193 (Licor Inc) underwater sphericalquantum sensor was used to measure underwater irradiance (mmol photons mndash2 sndash1) atapproximately 1m intervals from surface down to the detection limit A LI-190 surfacequantum cell was used to collect surface irradiance during the profiles this was ap-plied to standardize the profile readings to the intensity of the surface light The light andtemperature profiles were conducted in daylight before we acoustically observed themysid distribution typically several hours before the onset of the acoustic sampling
Light conditions at other times of the diel cycle were simulated by applying the pre-dicted light intensity over 24 h periods at a 05 h resolution starting at noon (localtime) on the day in question Light predictions were based on a computer program thatconsiders the contributions of moon and sun illuminance for any location and time (Ja-niczek amp Deyoung 1987) In cases in which the moon is below the horizon themodel does not accurately predict light levels as the minimum light level is set to5 acute 10ndash4 lx whereas realistic starlight levels are approximately 65 acute 10ndash5 lx (Munz ampMcFarland 1973) Therefore we only used periods of the night in which the moonwas already above the horizon for determining light preference In order to test the va-lidity of the light prediction program we compared predicted and measured (Licor LI-190SA quantum sensor) daytime light levels There were no significant differences be-tween daytime light levels predicted by the program and those observed (paired t-testp gt005 n = 20) Following the convention put forward by Gal et al (1999 a) all lightintensity value were in units of mylux The concept of mylux units is similar to theconcept behind lux in that it is a scale adjusted to an organismrsquos relative spectral sensi-tivity for lux this organism is a human for mylux it is M relicta Under moonlightconditions in Lake Ontario 1 mylux is equal to approximately 175 lx (Gal et al1999 a) The estimated light at each depth was calculated by applying the measured ex-tinction coefficient for each station to Beerrsquos Law (Kirk 1994)
4 Gideon Gal Lars G Rudstam and Ora E Johannsson
Table 1 Sampling stations locations bottom depth (DB) sampling depth (SD) anddates of field data used for model simulations and analyses Time of day in bold repre-sent the times used for comparison between observed and predicted distributionsshown in Fig 4
Date Station Variables measured Time of day BD (m) SD (m)
6ndash7 May 96 Shallow Mysid acoustic density 2144 2153 2203 0029 77ndash85 10ndashbottom
Mysid net samples 2245 30 30ndash0
0029ndash0035 55 25ndash055ndash15
Light 1810ndash1845 0ndashDL
Temperature 1810ndash1845 0ndash60
Deep Mysid acoustic density 2015 2100 0203 120ndash130 10ndash100
Mysid net samples 0245ndash0305 150 40ndash060ndash0 90ndash60
Light 1915ndash1925 0ndashDL
Temperature 1915ndash1925 0ndash60
7ndash8 May 96 Shallow Mysid net samples 2320 30 30ndash0
0104ndash0125 60 30ndash060ndash30
Light 1900ndash1935 0ndashDL
Temperature 1900ndash1935 0ndash60
Deep Mysid vertical 0241ndash0252 0413 gt 120 2ndash100
distribution for
light preference
Mysid net samples 0305ndash0320 105 20ndash060ndash20 90ndash60
Light 2000ndash2025 0ndashDL
Temperature 2000ndash2025 0ndash60
15ndash16 Aug 95 Shallow Mysid acoustic density 1623 2347 0030 90 2ndashbottom
0553 0603
Mysid net samples 0100ndash0250 100 16ndash046ndash0 100ndash0
Light 1455ndash1520 (15 Aug) 0ndashDL
1530ndash1630 (16 Aug)
Temperature 1455ndash1520 (15 Aug) 0ndash60
1530ndash1630 (16 Aug)
1 Aug 95 Deep Mysid acoustic density 0037 0048 0056 0120 130 2ndash100
Mysid net samples 0300ndash0401 130 10ndash030ndash10
70ndash30120ndash70
Light 1000ndash1100 0ndashDL
Temperature 1000ndash1100 0ndash37
30 Sepndash2 Oct 96 Shallow Mysid acoustic density 1952 2100 0208 0318 80ndash95 2ndashbottom
Mysid net samples 2040 0110 30 30ndash0
2200ndash2220 70 50ndash060ndash50
0030ndash0040 60 45ndash055ndash45
Light 1540ndash1625 0ndashDL
Temperature 1540ndash1625 0ndash60
30 Sepndash2 Oct 96 Deep Mysid acoustic density 1935 2203 2214 2315 120ndash140 2ndash100
Mysid net samples 0005ndash0020 115 60ndash3080ndash60
2215ndash2230 120 30ndash070ndash30 90ndash70
Light 1700ndash1715 0ndashDL
Temperature 1700ndash1715 0ndash60
BD Bottom depth SD Sampling depth DL Detection limit
Mysis relicta vertical distribution 5
Observed mysid and fish distributions
Mysis distributions were measured during several cruises on Lake Ontario during thesummer of 1995 and during the spring and fall of 1996 (Table 1) All stations withexception of the deep summer station were located at the southeastern corner of LakeOntario several kilometers north of Oswego New York The deep summer station(BD = 130 m) was centrally located in Lake Ontario (station 41 Stockwell amp Jo-hansson 1997) The vertical distributions were measured during the night (unlessstated otherwise) with a 420 kHz acoustic system using the methods described by Galet al (1999 b) Ship lights were turned off during sampling For each cruise we se-lected segments of data from a shallow and deep station The near shore regions ofLake Ontario exhibit high densities of the main planktivorous fish of the lake (Goykeamp Brandt 1993) We therefore separated between shallow and deep stations based onthe anticipated regions of high fish densities over the course of the year Shallow sta-tions were defined as sites with a bottom depth of 90 m or shallower and deep stationswere at sites with bottom depths equal or greater than 120 m Sampling dates and timesat each of the stations and seasons included the following (see also Table 1) spring(May 6ndash7 1996) BD 77ndash 85 (0029) and 130ndash140 m (2100) summer BD 90 m (at0030 Aug 15ndash16 1995) and 130 m (0048 July 31ndashAug 1 1995) fall (Oct 1ndash21996) BD 80ndash 95 (0318) and 120 ndash140 m (2214) At each station 2 to 16 segments ofacoustic data that consisted of at least 25 pings each (at 1 ping per second) were ana-lyzed The total amount of acoustic volume backscattering (Ssv) between 10 and 100 mwas summed and a relative density (RD) for depth bin i was then calculated (RDi =sv i(Ssv) The upper 10 m (30 m in the fall) were not included in calculations of the rel-ative density due to high fish abundance and absence or very low mysid abundance(determined with net samples) While the acoustic backscattering from fish at night isdistinguished as individual echoes on an acoustic echogram mysid scattering is seenas a broad layer of weak acoustic scattering (Gal et al 1999 b) It was therefore evi-dent from the acoustic echogram that very few mysid were present in the upper watercolumn Acoustic observations of the ascending mysids and stratified net samples (1mdiameter net 05 mm mesh) collected during the night at each station confirmed theinterpretation of acoustic data Samples were collected from above the mysid layer tothe surface from below the mysid layer to just above it and from 90 or 100 m to justbelow the mysid layer Mysids were enumerated and sized The results of the net sam-ples provided information on the mysid density and size distribution and were used toconfirm our acoustic observations Mysid abundance was estimated from the acousticsbackscattering using the methods described by Gal et al (1999 b)
Fish densities were estimated with a Simrad EY-500 70 kHZ split-beam acousticsystem during the 1996 cruises All individual targets larger than ndash63 dB were assumedto be fish Both the 70 kHz and 420 kHz systems were towed on the same frame andcollected data simultaneously thereby providing both mysid and fish densities in sim-ilar volumes of water Fish densities were calculated using Simradrsquos EP-500 software(Ver 52) During the 1995 cruises the Simrad system was not available so the420 kHz Biosonics system was used to estimate fish abundance This was accom-plished by visually inspecting the echogram and selecting the regions of the water col-umn occupied by large individual acoustic targets and as close as possible in time (typ-
6 Gideon Gal Lars G Rudstam and Ora E Johannsson
ically minutes) to the mysid density analyses The acoustic volume backscattering (sv)and relative density were then calculated for that portion of the water column Entirewater column fish densities were estimated by dividing sv by the average targetstrength at 420 kHz calculated from the spring and fall cruises when both the 420 and70 kHz units were operating Density estimates were based on sampling conductedduring the night During those cruises average target strength at 420 kHz were calcu-lated by comparisons with the results from the 70 kHz split beam sounder insonifyingthe same water volume Fish species identification was verified based on mid-watertrawls conducted at each station
Model development
The Model
The diel vertical migration of mysids was predicted with a one-dimensional time-var-ying model Inputs to the model were temperature by depth surface light levels andlight extinction coefficients The model consisted of two functions related to light andtemperature These functions yielded an index of habitat preference for each depth bingiven specific light and temperature conditions We consider the possibility of findinga mysid at a given depth to be directly proportional to this preference index where theproportionality constant is chosen so that the probability of finding a mysid some-where in the water column equals 1 (Rudstam amp Magnuson 1985) Because we con-sider the two probability functions to be independent they are multiplicative (Papou-lis 1984) Hence the probability of finding a mysid at depth z (P(z)) and consequen-tially the distribution of the mysid population in the water column (we do not considerdensity dependent effects) is
P (z) =
S (ƒ (T )z acute g (L)z)(1)
ƒ (T )z acute g (L)zn
1
where f(T)z and g(L)z represent the temperature and light functions at depth z respec-tively and n is the maximum depth (Table 2) The denominator is the sum of this prod-uct over all depths considered
To evaluate the impact of the thermal gradient on the mysid vertical distribution weadded a third function to the model representing an avoidance of thermal gradientsThis function was modified from Beeton (1960) The values for the function rangedfrom 0 when the temperature differences between adjacent depth layers were largerthan 12 ƒC to 1 when there were no temperature differences Eq 1 was modified to in-clude the temperature gradient function (h(G)z) at depth z
P (z) =S ƒ (T )z acute g (L)z acute h (G)z
(2)ƒ (T )z acute g (L)z acute h (G)z
n
1
Cases in which the product of the preference function is equal to zero implies very ad-verse conditions to the mysids Model conditions prevented mysids from migratingpast such regions even if more suitable conditions were found above that layer
Mysis relicta vertical distribution 7
Table 2 Model equations
Function Forcing Functions Unit Data Source
Light function ndash for Lz pound 10ndash8 f(L)z = 0128 mylux this studyg (L)z for Lz gt 10ndash8
g (L)z = 5 074e3 ndash05 1 log10 (L) ndash (ndash686) 2 2 4 6
max(L)
056
Temperature ƒ (T )z = ndash00052 acute T 2 + 00929 acute T + 05611 ƒC Rudstamfunction ndash f (T)z et al 1999
Temperature Gz = Tz ndashTz ndash1 ƒC mndash1 Beeton 1960gradient function ndash if Gz = 0 h(G)z = 1 (Figs 1 3)h(G)z for Gz pound 07 h (G)z = G (ndash 1357) +1
for 07 lt Gz lt 12 h (G)z = G (ndash01) + 012for Gz sup3 12 h (G)z = 0
Temperature preference
There is no published information on mysid temperature preference Two recent stud-ies on the effect of temperature on feeding rates however indicated that mysid feedingrate is highest at an intermediate temperature of 10ndash14 ƒC (Chipps 1998 Rudstam etal 1999) Because the maximum feeding rate of fish is close to their preferred temper-ature (Coutant 1977) we used the relationship between mysid feeding rate and tem-perature as a first approximation of mysid temperature preference Rudstam et al(1999) conducted feeding rate experiments on sixty mysids with a mean length of134 mm (SD 10 mm range 11 to 155 mm) at 4 8 12 16 18 and 20 ƒC The resultswere scaled between 0 to 1 and a second-degree polynomial was fit to the data Thispolynomial (adjusted R2 = 091 Table 2) has a peak at 9 ƒC and decreases with temper-ature until reaching a value of 0 at approximately 22 ƒC (Fig 1 A) This curve was usedto describe mysid temperature preference in the DVM model Thus the model predictsthat no mysid will be found in temperatures above 22 ƒC regardless of light levels My-sis relicta show strong signs of stress at temperatures of 22 ƒC and above in experi-ments and only 1 out of 10 animals survived that temperature for 8 hours (Rudstam etal 1999)
Light preference
The light preference was determined from field observations of mysid night-time vert-ical distribution conducted during a spring cruise (May 1996) in Lake Ontario NewYork The isothermal conditions of the Lake Ontario water column during the springcruise provided an ideal opportunity to observe mysid vertical distribution independentof potential thermal effects The temperature varied lt1 ƒC between the surface and thebottom therefore we assumed that light was the only physical factor governing mysid
8 Gideon Gal Lars G Rudstam and Ora E Johannsson
Fig 1 Temperature and light functions applied to the migration model where a valueof unity indicates the preferred condition (A) Polynomial fit to the normalized averagefeeding rates from Rudstam et al (1999) symbols plusmn 95 confidence limits (B) aplot of normalized mysid distribution as a function of light (symbols) based on acous-tic data collected in Lake Ontario and a Gaussian curve fitted to the data (solid line)See Table 2 for the temperature and light function curve equations
vertical distribution The vertical distributions of mysids at deep-water stations (bot-tom depth BD gt 120 m) characterized by low predator density were measured as de-scribed above over four time periods during the night of May 7ndash8 1996 (0241 h0248 h 0252 h 0413 h) These time periods were selected as they provided times inwhich the acoustic returns from mysid populations were strongest and there were noobvious fish targets close to the mysid populations
Mysis relicta vertical distribution 9
We combined the mysid distribution data for these four time periods scaled the val-ues between 0 and 1 and plotted them against the logarithm of light (in myluxFig 1 B) A Gaussian distribution was fitted to these data for light levels above10ndash8 mylux (Sigmaplot ver 60 a = 0743 b = 0564 x0 = ndash6856 adjusted R2 = 088p lt0001 Table 2 Fig 1 B) The peak of the mysid distribution was found at approx-imately 10ndash7 mylux with animals extending between 28 acute 10ndash5 and the lowest lightlevel present (29 acute 10ndash11 mylux) Below a light intensity of 10ndash8 mylux the results indi-cated no change in preference thereby suggesting that mysids may not be sensitive tolight levels below that threshold The distribution as a function of light was then usedto determine light function values for the full range of light intensities found through-out the water column during the different seasons (01 to 10ndash20 mylux) As the max-imum value of the fitted curve was equal to 074 all function values were normalizedby 074 so the maximum possible value was unity A light value of 1 acute 10ndash8 mylux wasdetermined as the lower threshold value below which the light function was set to0128 (the function value for 10ndash8 mylux Table 2)
The model was run over a depth range of 1ndash100 m with a 1 m vertical resolutionand over a 24 h period with a 05 h time step Simulations were conducted for springsummer and fall conditions We simulated mysid vertical migration with the model attwo stations for each season in order to test the possible effect of biotic factors (iepredator abundance) on mysid vertical distribution The shallow station (BD = 77ndash95 m) represented a location with intermediate to high predator abundance and thedeep station (BD = 120 ndash140 m) represented a site with low predator density In orderto evaluate the mysid distribution predicted by the model we calculated Schoenerrsquos(Schoener 1970) Index of Overlap (S = (1 ndash 05 (S|Pi ndash Oi| )) 100 where Pi and Oi
are the predicted and observed proportions at depth i respectively on a seasonal ba-sis) In addition we compared the depth of the 10th 50th 90th percentiles for the ob-served and predicted distributions All comparisons between predicted and observedconditions were conducted on both versions of the model (with and without thethermal gradient function)
Results
Light and temperature conditions
During the time of the field work the light extinction coefficient valuesranged between 015 in May 1996 to 03 in Aug 1995 and 026 in Oct 1996Only minor differences in the light extinction coefficient values existed be-tween shallow and deep stations Variation was less than 10 in all cases andtypically did not exceed 5 Thermal conditions ranged between an iso-thermal water column in May 1996 with a water temperature of 2 ƒC to astrongly stratified water column during the summer of 1995 (Fig 2) Duringthe August 1995 cruises water temperature ranged between approximately24 ƒC at the surface and 4 ƒC at a depth of 60 m During the fall cruises (Oct
10 Gideon Gal Lars G Rudstam and Ora E Johannsson
Fig 2 Temperature profiles and the vertical distribution of fish and mysids for twostations and three seasons May (A B) August (C D) and October (E F) The left-hand panels represent the shallow stations (60ndash 90 m bottom depth) and the right-handpanels represent the deep stations (gt120 m bottom depth) Dashed lines correspond totemperature profiles measured on the date the fish (solid lines) and mysid (dottedlines) observations were carried out The fish and mysid abundance and distributionsare based on acoustic sampling of the water column Temperature measurements weredown to 60 m with the exception of the deep summer station in which data down to37 m were available Temperatures were extrapolated down to the desired bottomdepth at each station assuming there was no change in temperature between thedeepest measured depth and the bottom
Mysis relicta vertical distribution 11
1996) temperatures ranged between approximately 15 ƒC at the surface and45 ƒC at a depth of 60m
Mysid distribution
The mysids vertical distribution varied seasonally as expected (Fig 2) Thedifferences were mainly reflected in the depth of peak distribution going from
Fig 3 Changes in the seasonal density of mysids (A) and fish (B) as a function of thesampling stations Entire water column densities were estimated using the acoustictechniques described in the text Approximate bottom depths at each station are pro-vided Vertical lines indicate standard errors UA indicates stations for which datawere unavailable
12 Gideon Gal Lars G Rudstam and Ora E Johannsson
a broad layer in the spring a shallow and distinct layer in the summer to adeep broader layer in the fall There were also seasonal changes in the mysidsize distribution and density in the lake During the spring the mean length (plusmnSE n) of the mysid population was 96 mm (01 1188) during the summer itwas 69 mm (01 311) at the shallow stations and in the fall it was 131 mm(02 289) Mysid densities were greatest during the summer and lowest in thefall (Fig 3 A) In the summer and fall there was also a clear trend of increas-ing mysid density with increasing distance from the shore with only few my-sids found near the shore at the shallowest station
Fish density and distribution
The observed fish abundance and distribution varied both temporally betweenthe seasons and spatially For example while there was no clear trend in thehorizontal spatial distribution of fish in the spring and fall (Fig 3 B) there wasa trend of decreasing fish abundance with distance from the shore in the sum-mer During the spring cruise fish were scattered throughout the water columnalthough most were found in the deeper waters probably due to the slightlywarmer temperature (Figs 2 A B) During this period alewives (Alosa psue-doharengus ) were found during the night concentrated between 40ndash55 m atthe deep stations (BD 100 ndash160 m) and constituted gt85 of the catch at thatdepth range At shallow stations (60ndash80m) they constituted lt60 of the catchat a corresponding depth range and were not caught at all above 15 m at theshallow station (30ndash45 m) The remainder of the catch was typically rainbowsmelt (Osmerus mordax ) although there were instances in which other specieswere caught
In contrast to the spring during the summer the fish were concentrated inthe top 16 m at the shallow station and in the top 10 m at the deep station bothcorresponding to the epilimnetic layer (Figs 2 C D) During the day 100 ofthe catch of fish from tows conducted between 7ndash18 m were alewife whileduring the night at the deep station (BDgt160 m) 25 or less of the catch werealewife at the same tow depth range and the remainder were smelt Tows con-ducted at deeper depths (20ndash28 m) resulted in very low fish catch dominatedby rainbow smelt
During the fall the overall fish densities did not differ greatly from thesummer abundances with the exception of the two shallow stations Howeverthere was a marked difference between the vertical distributions (Figs 2 EF)The thermocline had eroded during the fall leading to a much deeper andweaker metalimnion The top of the thermocline (15 ƒC) during the fall cruisewas found between approximately 35ndash40 m while the bottom of the thermo-cline (5ndash6 ƒC) was found between 45 and 60 m Fish were distributed in twoportions of the water column a shallow portion within the upper epilimnion
Mysis relicta vertical distribution 13
(10ndash15m) and a deeper portion within the metalimnion region (approximately30 to 50 m) Results of the fish tows indicate that the shallow peak of fish canbe attributed to alewife (98 of the fish caught in the tows) while the deeperpeak of fish abundance was associated with both alewife (45ndash55) and smeltAnalysis of the percent overlap between predicted and observed distributionsindicated that there was no effect of fish density on the modelrsquos capability topredict mysid distribution
Comparison of observed and predicted distributions
We first present results using predictions from the first run of the model with-out the thermal gradient function
The simulated distribution for the May cruise predicted the depth of the my-sid distribution to within several meters of the observed peak at the deep sta-tion but predicted a shallower distribution than observed at the shallow station(Figs 4 A B) In the four time periods compared the model successfully pre-dicted the depths of the 10th 50th and 90th percentiles of the population duringtwo of the periods that included the migration period but underestimated (shal-lower) the depths at two other occasions (Fig 5 A) The model also succeededin predicting the change in the depth of the mysid layer over the course of thenight due to a change in light conditions (rising moon at approximately2300) The percent overlap between the predicted and observed distributionswas 41 and 65 for the shallow and deep stations respectively (Table 3)The relatively low percent overlap at the shallow station is a result of the dif-ference in the shape of the observed and predicted mysid distribution and notan overall difference in the depths of the mysids The observed distributionranged between a homogeneous distribution (Fig 4 A) from approximately25 m to one with a clear peak (Fig 2 A) while the predicted distribution wasone with an obvious peak in the distribution (Fig 4 A) In contrast to the lowpercent overlap both the observed and predicted distribution are in agreementthat mysids avoid migrating above approximately 22 m at the shallow stationin the spring
Table 3 A comparison of the percent overlap between predicted and observed distri-butions of mysids in the water column with and without the inclusion of the thermalgradient in the model
Season No Gradient With Gradient
Shallow Station Deep Station Shallow Station Deep Station
Spring 41 65 41 65 Summer 62 65 59 64 Fall 42 43 73 64
14 Gideon Gal Lars G Rudstam and Ora E Johannsson
Fig 4 The observed and predicted mysid vertical distributions with and without thethermal gradient at two stations during spring summer and fall cruises Sampling lo-cations were as follows Spring stations were at bottom depths (BD) of 77ndash85 m (A)and 120 ndash130 m (B) summer stations BD were 90 m (C) and 130 m (D) and fall sta-tions BD were 80ndash95 m (E) and 120 ndash140 m (F) The distributions are given as relativedensities therefore the total density for a given profile equals one Note that there areslight discrepancies between the observed mysid distributions in comparison to themysid distribution shown in Figure 2 due to differences in the times of observationsThe overall distribution pattern at any given station however is not different
Mysis relicta vertical distribution 15
Fig 5 Observed and predicted mysid distribution for spring (A) summer (B) and fall(C) For sake of figure clarity the legend is broken into two sections Symbols repre-sent the observed depth of the 10th 50th and 90th percentiles of the population andlines represent model simulation results when the thermal gradient was included Sim-ulated results are for 24 h cycles starting at noon local time Both the field and pre-dicted distributions are for the shallow station for each season Note that the modelsuccessfully tracks the observed increase in the depth of the mysid layer in the springfollowing the rising of the moon at approximately 2300
16 Gideon Gal Lars G Rudstam and Ora E Johannsson
Fig 6 Comparison of model results for the October cruises with and without thethermal gradient function Comparison is of the difference (in meters) between theobserved and predicted depth of 10th 50th and 90th percentiles Dark bar ndash with thegradient function included in the model light bar ndash without the gradient functionVertical lines indicate range of values
During the summer the model successfully simulated the general pattern ofdepth and relatively distinct distributions although the model predicted slightlyshallower distribution than observed (Figs 4C D)
During the fall there was a large discrepancy between simulation resultsand observations At both stations (Figs 4 E F) the model predicted a mysidlayer considerably shallower than observed leading to a relatively low overlapbetween the observed and predicted distributions at the shallow and deep sta-tions respectively Net samples obtained during the fall cruise verified thelack of mysids in the upper water column At the deep station no mysids werecollected in samples conducted from 30 m to the surface 81 of the mysidscollected at that station were taken from the 30 to 70m strata with the remain-der collected from below 70m
The addition of the thermal gradient function to the model enhanced its ca-pability to predict the mysid distribution especially during the fall (Table 3)As expected there was no difference in the predicted distribution between thetwo versions of the model for the spring due to the lack of thermal structureThere was limited benefit to the addition of the gradient function to the sum-
Mysis relicta vertical distribution 17
mer predictions resulting in closer simulation of the depth of the peak distribu-tion (Figs 4 C D) but a slight decrease in the overall overlap Model predic-tions of the 10th 50th and 90th percentiles of the population were in generalsimilar to those observed in the field At the shallow station (Fig 5 B) the pre-dicted 10th and 90th percentiles were typically within just a number of metersof the observed depths The model consistently underestimated the depth ofthe 90th percentile
During the fall the full model simulation successfully predicted the depthof the upper 10th percentile of the mysid population to within 1ndash4m of the ob-served depth (Fig 5 C) Additionally the model captured the observed ex-tended distribution of the mysid population (Figs 4 E F) although it did notsuccessfully capture the peak distributions The overlap between the observedand predicted distribution increased noticeably at the shallow and deep sta-tions
Comparing the observed and predicted percentiles in the fall clearly showsthe impact of the addition of the thermal gradient function (Fig 6) The addi-tion of the gradient function greatly improved the quality of the fall predic-tions and reduced the discrepancy between the observed and predicted Thiswas evident mainly for the 10th and 50th percentiles Without the addition thedeviation between predicted and observed depths of the 10th and 50th percent-iles was on average greater than 20 m extending in some cases to over 50 m(Fig 6) Addition of the gradient greatly reduced the discrepancy to an averageof less than 5m
Discussion
The model presented here is relatively simple and based on independent obser-vations and information reported in the literature Field data needed are re-stricted to light and temperature profiles Note that we did not fit the model toobserved distributions We compared predictions to high-resolution observa-tions of the mysid vertical distribution information that would be very timeconsuming to collect using net samples alone Although the model does notaccount directly for predatorprey distributions predation risk or foraginggain it successfully predicts general diel patterns of mysid distributionsthroughout the water column over three seasons While discrepancies do existthey may be due to errors in the model errors in the observed distributions er-ror in simulated light levels or effects of additional factors (predators preydistributions) We argue that analyses of these discrepancies suggest the im-portance of the various possible mechanisms determining mysid distributions
The distribution of mysids as a function of light observed in this study wassimilar to previous observations by Gal et al (1999 a) They reported mysids
18 Gideon Gal Lars G Rudstam and Ora E Johannsson
avoiding light levels above approximately 10 ndash6 mylux based on observationsof mysid distributions around a submersed light source consistent with ourobservations The observations we used to determine the light function wereobtained during the same period (May 1996) as the observations used to testthe spring DVM model predictions But the observations on which we basedthe light function were conducted 24 h later and over 20 km away from themodel validation sites The difference in time and space between sampling lo-cations ensures that these were independent observations However seasonalchanges in the structure of the mysid population may require seasonal adjust-ments to the light preference curve Smaller mysids may be more risk prone orless visible and therefore able to move into higher light levels (Rudstam et al1989) We did not make such adjustments in this paper
Light is generally agreed to be the most important external factor influenc-ing and initiating DVM (Haney et al 1990 Lampert 1991) It is howeverunclear if the role of light is governed by an optimum light intensity (isolumehypothesis) or by the rate of change in light intensity (rate of change hypothe-sis) Previous modeling studies examining DVM have either separately exam-ined the hypotheses (Richards et al 1996) or combined both hypothesizedmechanisms into a vertical migration model (Andersen amp Nival 1991)While the latter conclude that the rate of change is the dominant factor the re-sults of the former study suggests that both mechanisms could be applicable indifferent species Examining the mysid vertical distribution during the dawnand dusk period may shed light on which mechanism is more likely for my-sids but require continuous light measurements at dawn and dusk with an in-strument capable of measuring light changes at very low light levels as wellas transparency measures throughout the water column down to a depth of100 m or more We did not have access to such an instrument in our studiesand had to rely on calculations of light levels at night (see Methods) How-ever given the data available our analysis shows that the isolume hypothesisis reasonable for describing mysid migration in Lake Ontario Further discus-sion on this issue can be found in eg Ringelberg (1995 b) and Ringelbergamp Vangool (2003)
In contrast to previous studies (Teraguchi et al 1975 Beeton amp Bowers1982 Rudstam et al 1989) a response to preferred temperature and light lev-els was not sufficient in predicting the mysid nighttime vertical distributionover all seasons The importance of the temperature gradient in determiningthe extent of mysid DVM was evident from the differences in the results ob-tained from the model simulations when run with and without the thermal gra-dient function in the fall (Figs 4 6) Differences between the two versions ofthe model were not large enough in the summer to separate the effect of thetemperature gradient Beeton amp Bowers (1982) stressed the importance oflight in determining the upper limit of mysid DVM compared to the effect of
Mysis relicta vertical distribution 19
the thermal structure Our results indicate that the thermal structure specif-ically the thermal gradient plays a key role in determining the upper migrationlimit for M relicta in Lake Ontario And indeed when the model is run with-out the temperature function during the fall (not shown) the mysid predicteddistribution is in line with the light function distribution but greatly differentfrom the observed distribution
Two possible mechanisms can explain the limitations imposed by the ther-mocline on the upper extent of the mysid migration First the mysids maysense the change in temperature as they reach the lower limits of the thermo-cline and cease their migration Avoidance of high temperature may be astronger response than suggested by our temperature preference curve How-ever previous field (Beeton 1960 Beeton amp Bowers 1982) and laboratorystudies (Reynolds amp Degraeve 1972) have reported that mysids will movethrough the thermocline for brief excursions into warmer waters suggestingthat avoidance of higher temperatures is not very strong Second due to lowfecundity and large size mysids are very sensitive to predation and shouldevolve strong mechanisms for avoiding predation (Rudstam et al 1998 Jo-hansson et al in press) Mysids may therefore sense the presence of pred-ators in the water column above or within the thermocline The reluctance tocross the thermocline is even more puzzling if the mysid food source is con-sidered Zooplankton a major component of the mysid diet (Johansson et al2001) was observed during the period of this study to display a clear verticalgradient in its distribution with very high densities above the thermocline tolow densities below thermocline (Johannsson Rudstam amp Gal unpub-lished data) Barring other limiting factors it would then be expected that themysids intrude into the region above the thermocline in order to increase foodintake This does not seem to be the case suggesting that the predator avoid-ance mechanism is playing an important role
If mysids are sensing their predators it is likely through chemical cues Fewstudies have examined the impact of kairomones on the behavior of mysids al-though Hamreacuten amp Hansson (1999) reported a decrease in feeding rates byMysis mixta in the presence of fish odor Ringelberg (1995 a) reported thatreactivity of Daphnia in the form of DVM is increased in the presence of fishexudates Kairomones from several fish species in freshwater systems areknown to elicit escape responses in crustacean prey and others are reported tosense inter- and intra-species pheromones (Chivers amp Smith 1998 Kats ampDill 1998) The existence of a strong thermal gradient acts as a barrier inhib-iting the vertical mixing of water from the epilimnion down to the hypolim-nion thereby setting up a perceived shelter from predators Once an individualcrosses that thermal barrier it would be exposed to chemical stimuli producedby predators This mechanism would explain the mysid reluctance to crossthermal gradients as we have observed and the reports of only brief excursions
20 Gideon Gal Lars G Rudstam and Ora E Johannsson
above the thermocline by mysids in other lakes (Beeton 1960 Beeton ampBowers 1982)
What role then does light and absolute temperature play in determiningmysid distribution Prior to water column stratification light can be used topredict the entire vertical distribution of the mysid layer (Figs 4 B 5 A) notonly the upper migration limit The variation in the light dependent distribu-tion may be caused by variability in the response of individual mysids to lightAdditionally mysids exposed to low light levels lt10 ndash8 mylux (approx 35 acute10 ndash8 mmol photons mndash2 sndash1) did not show a clear preference indicating thatthey may not be sensitive to light levels below that intensity (Fig 1 B) This inturn may have lead to the broad deep distribution observed and predicted forthe fall (Figs 4 EF) similar to predictions by Richards et al (1996) for zoo-plankton DVM under conditions of light intensities below sensitivity thresh-old Frank amp Widder (1994) studied the behavioral sensitivity threshold forfive deep-sea crustaceans with a daytime residence depth ranging between490 ndash1200 m They reported thresholds ranging between 66 acute 10 ndash12 to63 acute 10 ndash11 mmol photons m ndash2 sndash1 for the five species (measured at 400 and500 nm) These values are lower by approximately 3ndash4 orders of magnitudethan the value we suggest as a threshold to mysid behavior However thesethresholds are for light of the wavelength for which the animals are most sen-sitive Forward et al (1984) on the other hand reported the lower thresholdfor a dark-adapted crab to be 10ndash7 W m ndash2 as measured at a wavelength of500 nm which is an order of magnitude higher than the 10 ndash8 mylux value sug-gested here for mysids
Although it was important to account for the effect of a temperature gra-dient our assumptions about temperature preference appear to have little ef-fect on the vertical distribution Even though mysid feeding rates in experi-ments are high at 12ndash14 ƒC and zooplankton in the summer and fall tend to beconcentrated in the epilimnion mysids were rarely observed in that temper-ature range For example the peak distribution observed at the deep station inAug 1995 coincided with a depth of 12 m that corresponded to a temperatureof 7 ƒC At the shallow station the peak distribution was at 24 m at a temper-ature of 62 ƒC Similar temperatures were observed in the fall Residence atthese low temperatures should lead to reduced growth rates (Berrill amp La-senby 1983) and suggest that mysids in the field to not reside at optimumtemperatures for growth
Based on the results of this study and evidence from previous studies wehypothesize that the vertical migration and distribution patterns progress sea-sonally as follows During the spring mysids migrate up following light levelsas previously reported (Teraguchi et al 1975 Beeton amp Bowers 1982) andthe vertical extent of the mysid layer can be explained by our light preferencefunction alone During the summer when they encounter a thermal barrier
Mysis relicta vertical distribution 21
(thermocline) they cease migration just below it and form a dense scatteringlayer When the thermocline is shallower than their preferred light conditionshowever their nighttime depth will be determined by light conditions Finallyif a thermal barrier is reached at depths with light levels not perceived by themysids the upper limit of migration will be determined by the thermoclinebut the mysids will be more widely distributed due to the lack of any taxiscues leading to aggregation This appears to be the case during the fall
Understanding the factors governing DVM is necessary for predicting food-web interactions of M relicta their prey and predators The results of thisstudy support previous studies documenting the impact of light and temper-ature on mysid vertical migration (Teraguchi et al 1975 Beeton amp Bowers1982 Rudstam et al 1989) This paper extends previous studies by providinga model describing the full extent of the vertical distribution of the mysid pop-ulation not just an upper limit Additionally our results point to the importantrole of the biological-physical interactions through the hypothesized effect offish kairomones and restricted vertical migration through thermal gradientsThis model provides necessary information for estimating predator-prey over-lap thereby setting the stage for analyzing the role of mysids in the Lake Onta-rio food web
Acknowledgements
We thank C Greene T Owens and L McGarry for valuable comments on themanuscript and the captains and crews of the RV Seth Green and RV Lauzier for theirassistance We also acknowledge the constructive comments provided by two anonym-ous reviewers This paper is a result of research funded by the National Oceanic andAtmospheric Administration award NA86RG0056 to the Research Foundation ofState University of New-York for New York Sea Grant The US Government is au-thorized to produce and distribute reprints for governmental purposes notwithstandingand copyright notation that may appear heron The views expressed herein are those ofthe authors and do not necessarily reflect the views of NOAA or any of its sub-agen-cies This is contribution No 218 of the Cornell Biological Field Station and CWRED 1478 GG
References
Andersen V amp Nival P (1991) A model of the diel vertical migration of zoo-plankton based on euphausiids ndash J Mar Res 49 153 ndash176
Beeton A M (1960) The vertical migration of Mysis relicta in Lakes Huron andMichigan ndash J Fish Res Board Can 14 517 ndash539
Beeton A M amp Bowers J A (1982) Vertical migration of Mysis relictaLovegraven ndash Hydrobiologia 93 53ndash61
Berrill M amp Lasenby D C (1983) Life cycles of the freshwater mysid shrimpMysis relicta reared at two temperatures ndash Trans Amer Fish Soc 112 551 ndash553
22 Gideon Gal Lars G Rudstam and Ora E Johannsson
Bollens S M amp Frost B W (1989) Predator-induced diel vertical migration in aplanktonic copepod ndash J Plankton Res 11 1047 ndash1066
Chipps S R (1998) Temperature-dependent consumption and gut-residence time inthe opossum shrimp Mysis relicta ndash J Plankton Res 20 2401 ndash 2411
Chivers D P amp Smith R J F (1998) Chemical alarm signalling in aquatic pred-ator-prey systems A review and prospectus ndash Ecoscience 5 338 ndash352
Coutant C C (1977) Compilation of temperature preference data ndash J Fish ResBoard Can 34 739 ndash745
Destasio B T Hill D K Kleinhans J M Nibbelink N P amp Magnuson JJ (1996) Potential effects of global climate change on small north-temperatelakes Physics fish and plankton ndash Limnol Oceanogr 41 1136 ndash1149
Dini M L amp Carpenter S R (1992) Fish predators food availability and diel vert-ical migration in daphnia ndash J Plankton Res 14 359 ndash377
Forward R B J Cronin T W amp Stearns D E (1984) Control of diel verticalmigration photoresponses of a larval crustacean ndash Limnol Oceanogr 29 145 ndash154
Frank T M amp Widder E A (1994) Comparative study of behavioral-sensitivitythresholds to near-UV and blue-green light in deep-sea crustaceans ndash Mar Biol121 229 ndash235
Gal G Loew E R Rudstam L G amp Mohammadian A M (1999 a) Light anddiel vertical migration spectral sensitivity and light avoidance by Mysis relicta ndashCan J Fish Aquat Sci 56 311 ndash 322
Gal G Rudstam L G amp Greene C H (1999 b) Acoustic characterization of My-sis relicta ndash Limnol Oceanogr 44 371 ndash 381
Goyke A P amp Brandt S B (1993) Spatial models of salmonine growth rates inLake Ontario ndash Trans Amer Fisher Soc 122 870 ndash883
Hamreacuten U amp Hansson S (1999) A mysid shrimp (Mysis mixta) is able to detectthe odour of its predator (Clupea harengus ) ndash Ophelia 51 187 ndash191
Haney J F Craggy A Kimball K amp Weeks F (1990) Light control of eveningvertical migrations by Chaoborus punctipennis larve ndash Limnol Oceanogr 351068 ndash1078
Janiczek P M amp Deyoung J A (1987) Computer programs for sun and moon il-luminance with contingent tables and diagram ndash Circ US Nav Obs 171 1ndash132
Johansson O E Leggett M F Rudstam L G Servos M R MohammadianM A Gal G Dermott R M amp Hesslein R H (2001) Diet of Mysis relictain Lake Ontario as revealed by stable isotope and gut content analysis ndash Can JFish Aquat Sci 58 1975 ndash1986
Johansson O E Rudstam L G Gal G amp Mills E L (in press) Mysis relictain Lake Ontario ndash Life History and Food Web Linkages ndash J Ecosys Health Man-agem
Kats L B amp Dill L M (1998) The scent of death Chemosensory assessment ofpredation risk by prey animals ndash Ecoscience 5 361 ndash394
Kirk J T O (1994) Light amp photosynthesis in aquatic ecosystems ndash CambridgeUniversity Press Melbourne 509 pp
Lampert W (1991) Ultimate causes of diel vertical migration of zooplankton Newevidence for the predator-avoidance hypothesis ndash Arch Hydrobiol Beih ErgebnLimnol 39 79ndash 88
Mysis relicta vertical distribution 23
Lopez M D G amp Huntley M E (1995) Feeding and diel vertical migration cy-cles of Metridia gerlachei (Giesbrecht) in coastal waters of the Antarctic Penin-sula ndash Polar Biol 15 21ndash30
Mauchline J (1980) The Biology of Mysids and Euphausiids ndash Academic PressLondon UK 680 pp
Munz F W amp McFarland W N (1973) The significance of spectral position inthe rhodopsins of tropical marine fishes ndash Vis Res 13 1829 ndash1874
Papoulis A (1984) Probability Random Variables and Stochastic Processes ndashMcGraw ndash Hill Book Company New York NY 576 pp
Reynolds J B amp Degraeve G M (1972) Seasonal population characteristics ofthe opossum shrimp Mysis relicta in southern Lake Michigan ndash Proceedings ofthe 15th conference of Great Lake Research pp 117 ndash131
Richards S A Possingham H P amp Noye J (1996) Diel vertical migration mod-elling light-mediated mechanism ndash J Plankton Res 18 2199 ndash2222
Ringelberg J (1995 a) Changes in light intensity and diel vertical migration Acomparison of marine and freshwater environments ndash J Mar Biol Assoc UK 7515ndash25
ndash (1995 b) Is diel vertical migration possible without a rhythmic signal ndash J Plank-ton Res 17 653 ndash655
Ringelberg J amp Vangool E (2003) On the combined analysis of proximate andultimate aspects in diel vertical migration (DVM) research ndash Hydrobiologia 49185ndash90
Rudstam L G Danielsson K Hansson S amp Johansson S (1989) Diel vert-ical migration and feeding patterns of Mysis-mixta (Crustacea Mysidacea) in theBaltic Sea ndash Mar Biol 101 43ndash52
Rudstam L G Hetherington A L amp Mohammadian A M (1999) Effect oftemperature on feeding and survival of Mysis relicta ndash J Great Lakes Res 25363 ndash371
Rudstam L G amp Magnuson J J (1985) Predicting the vertical distribution of fishpopulations Analysis of Cisco Coregonus artedii and Yellow Perch Perca fla-vescens ndash Can J Fish Aquat Sci 42 1178 ndash1188
Rudstam L G Melnik N G amp Shubenkov S G (1998) Invertebrate predatorsin pelagic food webs similarities between Macrohectopus branickii (CrustaceaAmphipoda) in Lake Baikal and Mysis relicta (Crustacea Mysidaceae) in LakeOntario ndash Siberian J Ecol 5 429 ndash434
Schoener T W (1970) Non-synchronous spatial overlap of lizards in patchy habi-tats ndash Ecology 51 408 ndash418
Stockwell J D amp Johansson O E (1997) Temperature-dependent allometricmodels to estimate zooplankton production in temperate freshwater lakes ndash CanJ Fish Aquat Sci 54 2350 ndash2360
Teraguchi M Hasler A D amp Beeton A M (1975) Seasonal changes in the re-sponse of Mysis relicta Lovegraven to illumination ndash Verh Internat Verein Limnol19 2989 ndash3000
van Gool E (1997) Light-induced swimming of Daphnia Can laboratory experi-ments predict diel vertical migration ndash Hydrobiologia 360 161 ndash167
Zaret T M amp Suffern J S (1976) Vertical migration in zooplankton as a pred-ator avoidance mechanism ndash Limnol Oceanogr 21 804 ndash813
Submitted 24 February 2003 accepted 10 October 2003
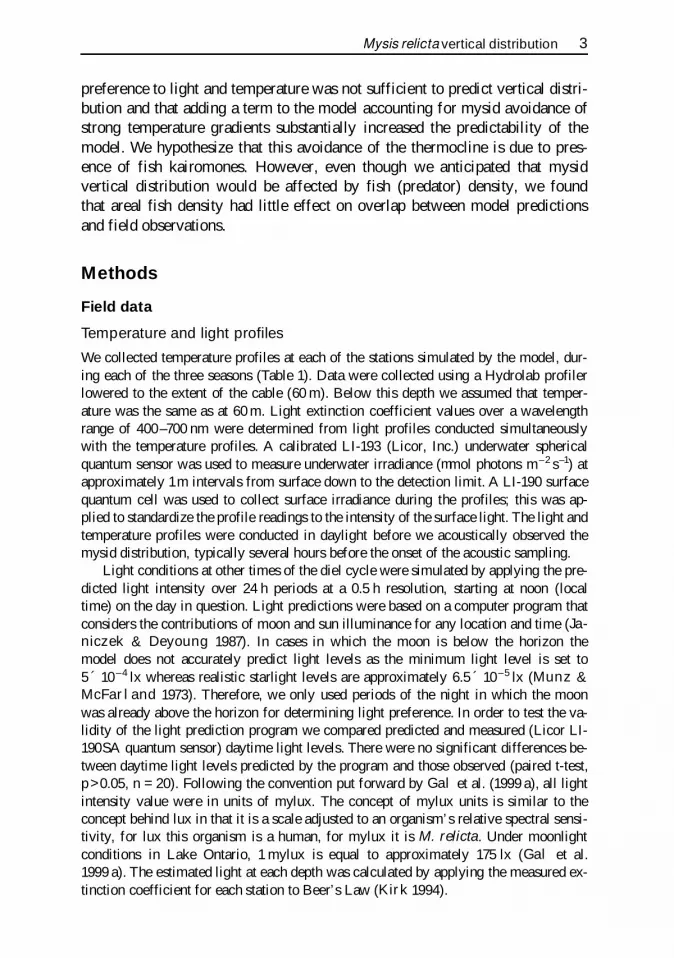
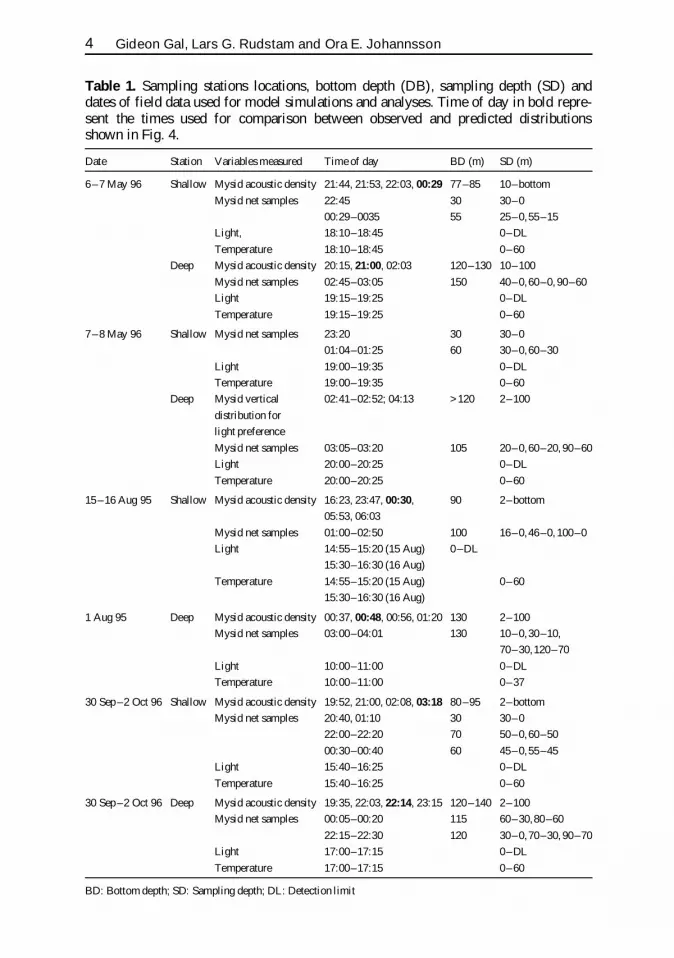
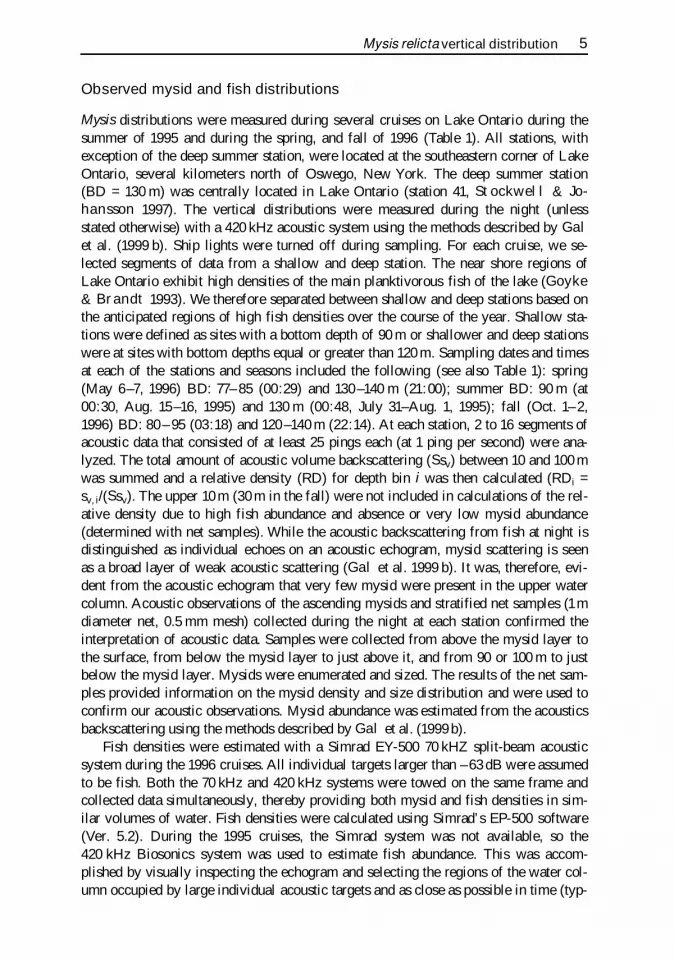
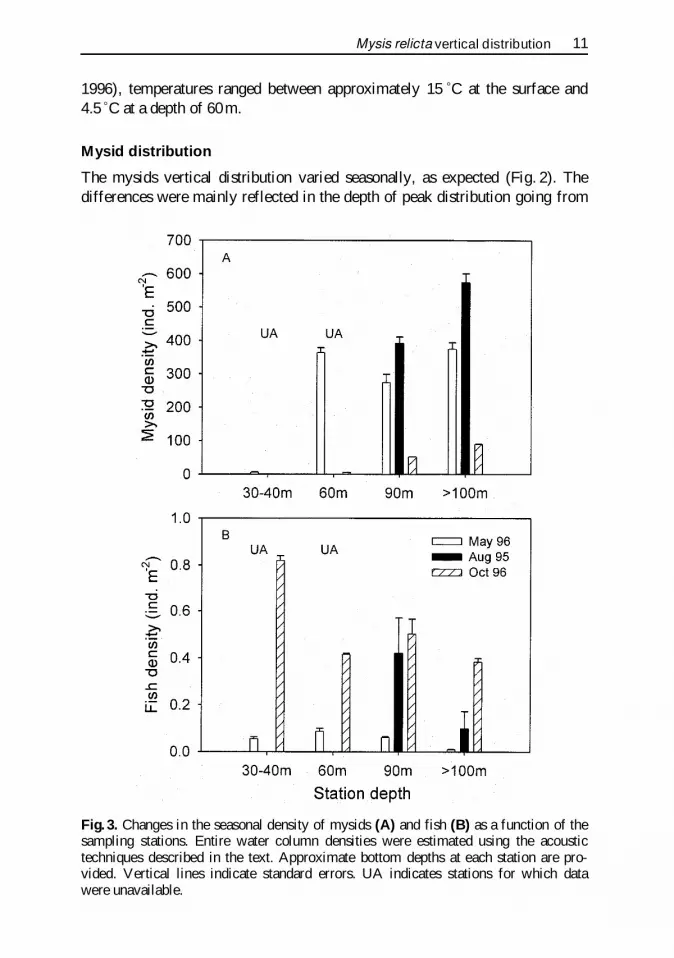