Embed Size (px)
Citation preview

U.S. Department of the InteriorU.S. Geological Survey
Scientific Investigations Report 2018–5074
Prepared in cooperation with the U.S. Fish and Wildlife Service
Assessment of Water Resources in Areas that Affect the Habitat of the Endangered Hine’s Emerald Dragonfly in the Lower Des Plaines River Valley, Illinois

Cover. View of Lockport Prairie Nature Preserve from Division Street at the Des Plaines River, Illinois, looking northwest. Photograph by Robert T. Kay, U.S. Geological Survey.

Assessment of Water Resources in Areas that Affect the Habitat of the Endangered Hine’s Emerald Dragonfly in the Lower Des Plaines River Valley, Illinois
By Robert T. Kay, Amy M. Gahala, and Clinton Bailey
Prepared in cooperation with the U.S. Fish and Wildlife Service
Scientific Investigations Report 2018–5074
U.S. Department of the InteriorU.S. Geological Survey

U.S. Department of the InteriorRYAN K. ZINKE, Secretary
U.S. Geological SurveyJames F. Reilly II, Director
U.S. Geological Survey, Reston, Virginia: 2018
For more information on the USGS—the Federal source for science about the Earth, its natural and living resources, natural hazards, and the environment—visit https://www.usgs.gov or call 1–888–ASK–USGS.
For an overview of USGS information products, including maps, imagery, and publications, visit https://store.usgs.gov.
Any use of trade, firm, or product names is for descriptive purposes only and does not imply endorsement by the U.S. Government.
Although this information product, for the most part, is in the public domain, it also may contain copyrighted materials as noted in the text. Permission to reproduce copyrighted items must be secured from the copyright owner.
Suggested citation:Kay, R.T., Gahala, A.M., and Bailey, C., 2018, Assessment of water resources in areas that affect the habitat of the endangered Hine’s emerald dragonfly in the Lower Des Plaines River Valley, Illinois: U.S. Geological Survey Scientific Investigations Report 2018–5074, 104 p., https://doi.org/10.3133/sir20185074.
ISSN 2328-0328 (online)

iii
ContentsAbstract ...........................................................................................................................................................1Introduction.....................................................................................................................................................1
Purpose and Scope ..............................................................................................................................4Life Cycle of the Hine’s Emerald Dragonfly .......................................................................................5
Assessment of Conditions that Affect the Water Resources in the Lockport Area ...........................6Surface Topography .............................................................................................................................6Geology ...................................................................................................................................................6
Silurian Deposits ..........................................................................................................................9Unconsolidated Deposits ...........................................................................................................9
Hydrology ...............................................................................................................................................9Water-Level Measurements .............................................................................................................13
Assessment of Conditions that Affect the Water Resources at Selected Hine’s Emerald Dragonfly Habitats in the Lower Des Plaines River Valley ......................................................23
Assessment of Water Resources in the Quarry Area ...................................................................23Topography .................................................................................................................................23Biology .........................................................................................................................................23Hydrogeology..............................................................................................................................23
Alluvial Aquifer ..................................................................................................................23Silurian Aquifer .................................................................................................................25
Surface Water ............................................................................................................................27Water Use ...................................................................................................................................27Effects of Quarry Dewatering and Pumping Mitigation ......................................................27Water Quality ..............................................................................................................................29
Assessment of Water Resources at the River South Parcel .......................................................29Topography .................................................................................................................................29Biology .........................................................................................................................................29Hydrogeology..............................................................................................................................33
Alluvial Aquifer ..................................................................................................................33Silurian Aquifer .................................................................................................................33
Surface Water ............................................................................................................................34Effects of Quarry Dewatering and Pumping Mitigation ......................................................35Water Quality ..............................................................................................................................37
Assessment of Water Resources at the Lockport Prairie Nature Preserve .............................37Topography .................................................................................................................................42Biology .........................................................................................................................................42Hydrogeology..............................................................................................................................42
Alluvial Aquifer ..................................................................................................................42Glacial Drift Aquifer ..........................................................................................................42Semiconfining Unit ...........................................................................................................44Silurian Aquifer .................................................................................................................44
Surface Water ............................................................................................................................48Water Use ...................................................................................................................................51Results of Groundwater Modeling ..........................................................................................52

iv
Model Focusing on the Water Resources at the Lockport Prairie Nature Preserve ................................................................................................................52
Model Focusing on the Effects of Quarry Operations on the Water Resources at the Lockport Prairie Nature Preserve .........................................................53
Water Quality ..............................................................................................................................53Continuous Monitoring of Groundwater .......................................................................61Future Monitoring .............................................................................................................61
Assessment of Water Resources at the Com Ed and Long Run Parcels ...................................61Topography .................................................................................................................................63Biology .........................................................................................................................................63Hydrogeology..............................................................................................................................63
Alluvial Aquifer ..................................................................................................................63Silurian Aquifer .................................................................................................................63
Surface Water ............................................................................................................................64Water Use ...................................................................................................................................66Water Quality ..............................................................................................................................66
Assessment of Water Resources at the Long Run Seep Nature Preserve ...............................66Topography .................................................................................................................................73Biology .........................................................................................................................................73Hydrogeology..............................................................................................................................73Surface Water ............................................................................................................................73Water Quality ..............................................................................................................................73
Assessment of Water Resources at the Romeoville Prairie Nature Preserve .........................75Topography .................................................................................................................................75Biology .........................................................................................................................................75Hydrogeology..............................................................................................................................75Surface Water ............................................................................................................................75Water Use ...................................................................................................................................77Water Quality ..............................................................................................................................77
Assessment of Water Resources at the Keepataw Forest Preserve .........................................77Topography .................................................................................................................................77Biology .........................................................................................................................................77Hydrogeology..............................................................................................................................77Surface Water ............................................................................................................................80Water Use ...................................................................................................................................80Water Quality ..............................................................................................................................80
Assessment of Water Resources at the Black Partridge Woods Nature Preserve ................80Topography .................................................................................................................................80Biology .........................................................................................................................................80Hydrogeology..............................................................................................................................85Surface Water ............................................................................................................................85Water Quality ..............................................................................................................................85
Assessment of Water Resources at the Waterfall Glen Forest Preserve .................................85Topography .................................................................................................................................85Biology .........................................................................................................................................85Hydrogeology..............................................................................................................................85

v
Surface Water ............................................................................................................................88Water Quality ..............................................................................................................................88
Assessment of Water Resources at the McMahon Fen Nature Preserve ...............................89Topography .................................................................................................................................89Biology .........................................................................................................................................89Hydrogeology..............................................................................................................................89Surface Water ............................................................................................................................92Water Quality ..............................................................................................................................93
Other Hine’s Emerald Dragonfly Habitats in Illinois ......................................................................93Implications for Habitat Preservation and Future Data Collection ......................................................94Summary and Conclusions .........................................................................................................................97References ....................................................................................................................................................99
Figures
1. Map showing location of selected features in the vicinity of the Lower Des Plaines River Valley near Lockport, Will County, Illinois ......................................................................2
2. Map showing location of Hine’s emerald dragonfly habitat in 2009 in the Lower Des Plaines River Valley near Lockport, Will County, Illinois ................................................3
3. Map showing location of selected features in the vicinity of the Lower Des Plaines River Valley, Will, DuPage, and Cook Counties, Illinois ..........................................................4
4. Map showing surface topography in the vicinity of the Lower Des Plaines River Valley near Lockport, Will County, Illinois ................................................................................7
5. Diagram showing geologic section A–A’, Lockport area, Will County, Illinois ..................8 6. Chart showing stratigraphy and lithology of Silurian deposits near Lockport, Will
County, Illinois .............................................................................................................................10 7. Map showing topography of bedrock surface in the vicinity of the Lower Des
Plaines River Valley near Lockport, Will County, Illinois ......................................................11 8. Map showing surficial geology in the vicinity of the Lower Des Plaines River Valley
near Lockport, Will County, Illinois ..........................................................................................12 9. Map showing potentiometric surface of the Silurian aquifer in the vicinity of the
Lower Des Plaines River Valley near Lockport, Will County, Illinois, July 19, 2012 .........20 10. Map showing potentiometric surface of the Silurian aquifer in the vicinity of the
Lower Des Plaines River Valley near Lockport, Will County, Illinois, November 26, 2012 ...............................................................................................................................................21
11. Map showing location of modeled capture zones and groundwater recharge areas in the Silurian aquifer for selected focus areas in the vicinity of the Lower Des Plaines River Valley near Lockport, Will County, Illinois ......................................................22
12. Map showing location of selected features and water-level data at the Middle Parcel Expansion Area, Will County, Illinois ..........................................................................24
13. Hydrograph for well MP-W1, Middle Parcel Expansion Area, Will County, Illinois, April 2006 through October 2011 .................................................................................26
14. Map showing location of selected features and water-level data at the River South Parcel, Will County, Illinois ........................................................................................................32
15. Diagram showing water levels in wells RP-1S,D and RP-2S,D at the River South Parcel, Will County, Illinois, 2005 through 2015 ..................................................................................34

vi
16. Map showing groundwater capture zones under 2012 and full build-out conditions at the West, East, and Middle Quarries and groundwater recharge area for the Silurian aquifer to the River South Parcel, Will County, Illinois ..........................................36
17. Map showing location of selected features and water-level data at the Lockport Prairie Nature Preserve, Will County, Illinois.........................................................................41
18. Map showing location of selected surface-water flow pathways at the Lockport Prairie Nature Preserve, Will County, Illinois.........................................................................43
19. Diagram showing water levels in wells MW-3A, MW-7C, MW-8A, and MW-9A in the vicinity of the Lockport Prairie Nature Preserve, Will County, Illinois, 2001 through 2012 ................................................................................................................................47
20. Diagram showing continuous readings of water level, temperature, and specific conductance for well MW-9B, Lockport Prairie Nature Preserve, Will County, Illinois, March 28, 2012, through February 24, 2014 ...............................................................48
21. Map showing groundwater recharge area for the Silurian aquifer, with buffers, and location of selected features in the vicinity of the Lockport Prairie Nature Preserve, Will County, Illinois .....................................................................................................................49
22. Map showing location of selected features and water-level data at the Com Ed and Long Run Parcels, Will County, Illinois ....................................................................................62
23. Hydrograph showing water levels at streamgage CES2, Com Ed Parcel, Will County, Illinois, April 2006 through October 2012 .................................................................................65
24. Map showing groundwater recharge area for the Com Ed and Long Run Parcels, and location of high-capacity pumping wells, Will County, Illinois ....................................67
25. Map showing concentration of benzene in surface water and groundwater after oil spill, Com Ed and Long Run Parcels, Will County, Illinois ....................................................71
26. Map showing location of selected features at the Long Run Seep Nature Preserve, Will County, Illinois .....................................................................................................................72
27. Map showing location of selected features in the central and northern part of the Romeoville Prairie Nature Preserve, Will County, Illinois ....................................................76
28. Map showing location of groundwater recharge area for the Silurian aquifer to the Romeoville Prairie Nature Preserve and selected high-capacity wells, Will County, Illinois ............................................................................................................................................78
29. Map showing location of selected features in the eastern part of the Keepataw Forest Preserve, Will County, Illinois .......................................................................................79
30. Map showing location of selected features at the Black Partridge Woods Nature Preserve, Cook County, Illinois .................................................................................................84
31. Map showing location of features in the vicinity of Emerald Fen at the Waterfall Glen Forest Preserve, DuPage County, Illinois ......................................................................87
32. Map showing location of selected features at the McMahon Fen Nature Preserve, Cook County, Illinois ...................................................................................................................91
33. Graph showing water level, specific conductance, and temperature of groundwater in well MF3, McMahon Fen Nature Preserve, Cook County, Illinois, April through November, 2013 ..................................................................................................92
34. Graph showing water level, specific conductance, and temperature of rivulet 9 at streamgage 414130087521301, McMahon Fen Nature Preserve, Cook County, Illinois, March through October, 2013 .....................................................................................93

vii
Tables
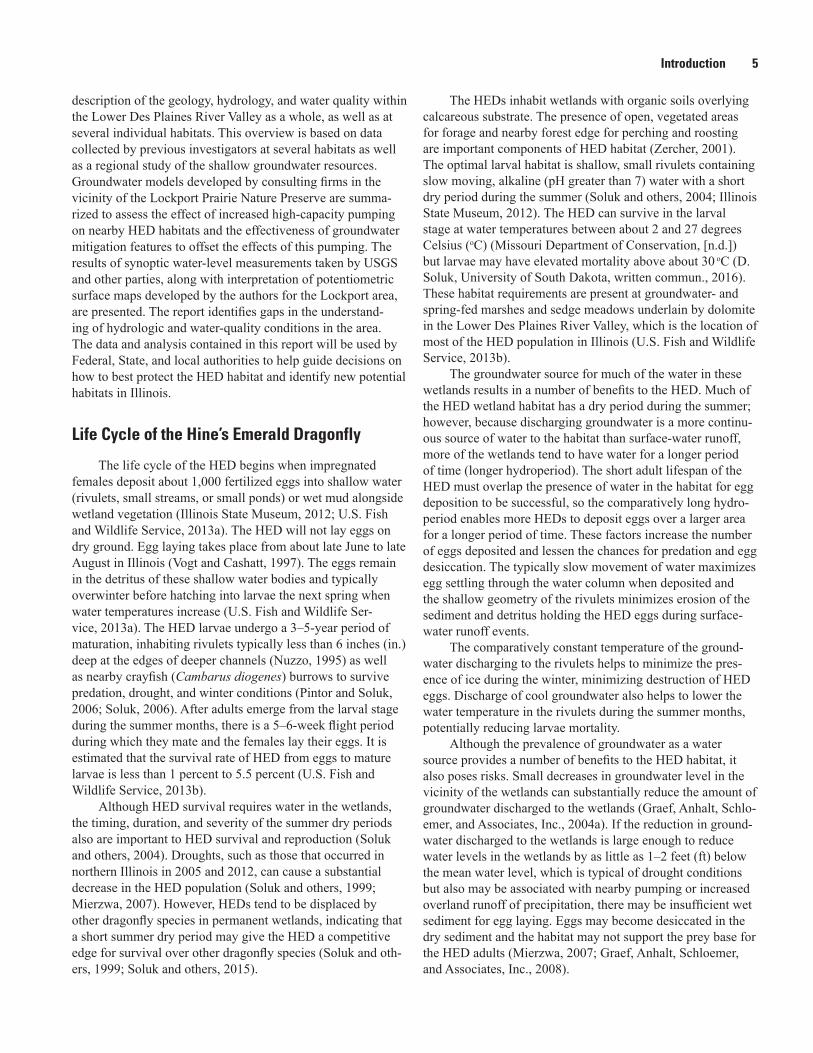
1. Well construction and groundwater-level data in the vicinity of the Lockport Prairie Nature Preserve, Will County, Illinois, July 19 and November 26, 2012.............................14
2. Streamgage information and water-level data in the vicinity of the Lockport Prairie Nature Preserve, Will County, Illinois, July 19 and November 26, 2012.............................19
3. Selected water-quality criteria ................................................................................................30 4. Concentration of major ions, nutrients, and metals in surface water and
groundwater at the Quarry Middle Parcel, Will County, Illinois, April 2006 through October 2007 ................................................................................................................................31
5. Concentration of selected constituents in surface water and groundwater at the River South Parcel, Will County, Illinois, September 1994 through November 2014 .......38
6. Summary of groundwater-level data for the Lockport Prairie Nature Preserve, Will County, Illinois, 2001 through 2014 ...........................................................................................45
7. Summary of surface-water discharge data for the Lockport Prairie Nature Preserve, Will County, Illinois ...................................................................................................51
8. Concentration of selected constituents in surface water at the Lockport Prairie Nature Preserve, Will County, Illinois, 1991 through 2001....................................................54
9. Concentration of selected constituents in surface water and groundwater at the Com Ed and Long Run Parcels, Will County, Illinois, 2005 through 2007............................68
10. Concentration of major ions and nutrients in surface water at the Long Run Seep Nature Preserve, Will County, Illinois, August 1997 through November 1998 ..................74
11. Concentration of major ions and nitrogen compounds in surface water at the Keepataw Forest Preserve, Will County, Illinois, August 1997 through November 1998 ..............................................................................................................................................81
12. Concentration of major ions, nitrogen compounds, and metals in surface water at the Black Partridge Woods Nature Preserve, Cook County, Illinois, 1991 through 2012 ...............................................................................................................................................86
13. Concentration of major ions and nitrogen compounds in surface water and groundwater at the Waterfall Glen Forest Preserve, DuPage County, Illinois, December 2007 through September 2008 ...............................................................................90
14. Summary of conditions at Hine’s emerald dragonfly habitats in Illinois ...........................95

viii
Conversion Factors
U.S. customary units to International System of Units
Multiply By To obtain
Length
inch (in.) 2.54 centimeter (cm)inch (in.) 25.4 millimeter (mm)foot (ft) 0.3048 meter (m)mile (mi) 1.609 kilometer (km)
Area
acre 0.4047 Hectare (ha)square foot (ft2) 0.09290 square meter (m2)square mile (mi2) 2.590 square kilometer (km2)
Flow rate
cubic foot per second (ft3/s) 0.02832 cubic meter per second (m3/s)cubic feet per day (ft3/d) 0.02832 cubic meter per day (m3/d)gallon per day (gal/d) 264.2 cubic meter per day (m3/d)gallon per minute (gal/min) 0.06309 liter per second (L/s)inch per year (in/yr) 2.54 centimeter per year (cm/yr)million gallons per day (Mgal/d) 0.04381 cubic meter per second (m3/s)
Hydraulic conductivity
foot per day (ft/d) 0.3048 meter per day (m/d)Transmissivity*
foot squared per day (ft2/d) 0.09290 meter squared per day (m2/d)
Temperature in degrees Celsius (°C) may be converted to degrees Fahrenheit (°F) as follows:
°F= (1.8×°C)+32
Temperature in degrees Fahrenheit (°F) may be converted to degrees Celsius (°C) as follows:
°C= (°F-32)/1.8
DatumVertical coordinate information is referenced to the North American Vertical Datum of 1988 (NAVD 88).
Horizontal coordinate information is referenced to the North American Datum of 1983 (NAD 83).
Elevation, as used in this report, refers to distance above the vertical datum.

ix
Supplemental InformationConstituent concentrations are given in milligrams per liter (mg/L) or micrograms per liter (μg/L).
Fecal coliform populations are presented in colonies per 100 milliliter (colonies/100mL).
*Transmissivity: The standard unit for transmissivity is cubic foot per day per square foot times foot of aquifer thickness [(ft3/d)/ft2]ft. In this report, the mathematically reduced form, foot squared per day (ft2/d), is used for convenience.
Specific conductance is given in microsiemens per centimeter at 25 degrees Celsius (μS/cm at 25 °C).
Concentrations of chemical constituents in water are given either in milligrams per liter (mg/L) or micrograms per liter (μg/L).
AbbreviationsCaCO3 calcium carbonate
CSSC Chicago Sanitary and Ship Canal
DO dissolved oxygen
EPA U.S. Environmental Protection Agency
HED Hine’s emerald dragonfly
ISGS Illinois State Geological Survey
MCL maximum contaminant level
NWIS National Water Information System
USFWS U.S. Fish and Wildlife Service
USGS U.S. Geological Survey


Assessment of Water Resources in Areas that Affect the Habitat of the Endangered Hine’s Emerald Dragonfly in the Lower Des Plaines River Valley, Illinois
By Robert T. Kay, Amy M. Gahala, and Clinton Bailey
AbstractReview of previous investigations indicates that potential
decreases in groundwater recharge and increased groundwater extraction in the vicinity of the Lower Des Plaines River Val-ley in Will County, Illinois, may reduce the amount of ground-water flow in the Silurian aquifer in this area. Groundwater discharge from the Silurian aquifer to wetlands in the Lower Des Plaines River Valley plays an important role in sustain-ing the habitat of the endangered Hine’s emerald dragonfly (Somatochlora hineana). Groundwater modeling performed by previous investigators indicates that increasing the amount of water pumped from the aquifer in support of expanded quarry operations near the Lockport Prairie Nature Preserve has the potential to reduce groundwater discharge to the most produc-tive Hine’s emerald dragonfly habitats in Illinois, potentially degrading the habitat. Model simulations indicate that mitiga-tion procedures designed to artificially enhance groundwater recharge in the vicinity of dragonfly habitats near the Lock-port Prairie Nature Preserve are likely to offset the effects of increased pumping. Several areas with smaller, often inter-mittent populations of Hine’s emerald dragonflies have been identified in other parts of the Lower Des Plaines River Valley and elsewhere in Illinois. Human activities have the potential to produce changes in hydrology and water quality that can threaten all of these habitats.
IntroductionHigh-capacity pumping for public-water supply and
quarry dewatering, and construction of impervious surfaces associated with urbanization, have altered the dynamics of groundwater discharge to a number of wetlands in the Lower Des Plaines River Valley in northeastern Illinois (fig. 1). These wetlands include the Lockport Prairie Nature Preserve and the River South Parcel, near Lockport, Illinois, which are home to the largest populations of Hine’s emerald dragonfly (Somatochlora hineana) in Illinois (fig. 2). The Hine’s emerald dragonfly (HED) was listed by the Illinois Department of
Natural Resources as an endangered species in 1991 and was placed on the Federal List of Endangered Species by the U.S. Fish and Wildlife Service in 1995 (U.S. Fish and Wildlife, 1995). A reduction in the volume of discharge from ground-water to these wetlands, as well as alteration of surface-water flow pathways within the wetlands, has the potential to substantially affect much of the best HED habitat remaining in Illinois. Changes to surface-water and groundwater quality associated with anthropogenic activities may also affect the quality of the habitat.
For the purposes of this report the Lower Des Plaines River Valley consists of the area surrounding the Des Plaines River from Route 83 (fig. 3) to the confluence of the Des Plaines River and the Chicago Sanitary and Ship Canal south of the Lockport Lock and Dam (fig. 1). For the purposes of this report the Lower Des Plaines River Valley also includes the area near the Calumet Sag Channel west of Route 45 (fig. 3).
The U.S. Fish and Wildlife Service (USFWS) is oversee-ing efforts to protect and restore the HED habitat in the Lower Des Plaines River Valley and the hydrology that supports it. The U.S. Geological Survey (USGS) has provided technical assistance in this effort. The primary objective of this assis-tance is to determine the effect of additional pumping associ-ated with proposed mining from the West Quarry and Middle Parcel Expansion Areas (fig. 1) on HED habitat at the Lock-port Prairie Nature Preserve and the River South, Com Ed, and Long Run Parcels. A secondary objective of this assistance is to identify the factors that affect the hydrogeology and water quality at several additional HED habitats within the Lower Des Plaines River Valley and other parts of Illinois. The USGS compiled and analyzed data collected by previous investiga-tors, but also collected and analyzed field data from the habitat area.
The primary study area for this investigation encom-passes the vicinity of the Des Plaines River Valley from the northern part of the Romeoville Prairie Nature Preserve to about 1 mile (mi) south of the Lockport Lock and Dam (fig. 1). This area includes parts of the cities of Lockport, Romeoville, and Crest Hill and is referred to as the “Lock-port area” in this report. The Lockport area is most likely to

2 Areas that Affect the Habitat of the Endangered Hine’s Emerald Dragonfly in the Lower Des Plaines River Valley, Illinois
Lockport Prairie Eastand Dellwood WestNature Preserve
EastQuarry
ROMEO ROAD
RENWICK ROAD
DIVISION STREET
AIRPORT ROAD
TAYLOR ROAD
DAOR HGI
H
Romeoville
Crest Hill
Illin
ois a
nd M
ichi
gan
Can
al
Long
Run
Run
Creek
Seep
LockportPrairieNature
Preserve
LOCKPORT LOCKAND DAM
Romeoville PrairieNature Preserve
Long Run SeepNature Preserve
River SouthParcel
Middle ParcelExpansion Area
Middle Quarry
WestQuarry
WestQuarry
ExpansionArea
Des
Pla
ines
Riv
er
College View Subdivision
WEB
ER R
OAD
Long
Lockport
Com Ed and
Long Run
Parcels
A
A'
Lockport Prairie Eastand Dellwood WestNature Preserves
Prairie BluffPreserve
53
53
7
171Lewis
University Airport
41°39'
41°38'
41°37'
41°36'
41°35'
41°34'
41°33'
88°03'88°04'88°05'88°06'88°07'88°08'88°09'
Maparea
ILLINOIS
EXPLANATIONMunicipality
RomeovilleLockportCrest Hill
Nature preserve
Existing quarry (2016)
Quarry expansion area
Parcel boundary
Line of geologic sectionA'A
0 1 2 MILES
0 1 2 KILOMETERS
Base from U.S. Geological Survey digital data, 1:100,000, 2001Albers Equal-Area Conic projection Standard parallels 33˚ N. and 45˚ N.Central meridian 89˚ W.North American Datum of 1927
Figure 1. Location of selected features in the vicinity of the Lower Des Plaines River Valley near Lockport, Will County, Illinois.

Introduction 3
WEB
ER R
OAD
EastQuarry
ROMEO ROAD
RENWICK ROAD
DIVISION STREET
AIRPORT ROAD
TAYLOR ROAD
DAOR HGI
H
Illin
ois a
nd M
ichi
gan
Can
al
Long
Long
Run
Run
Creek
Seep
Long Run SeepNature Preserve
Lockport
Lewis University
Airport
Middle Quarry
WestQuarry
WestQuarry
ExpansionArea
Com Ed and
Long Run
Parcels
Des
Pla
ines
Riv
er
Romeoville
Crest Hill
Romeoville PrairieNature Preserve
River SouthParcel
Middle ParcelExpansion Area
College View Subdivision
53
53
7
7
171
30
Lockport PrairieNature Preserve
Lockport Prairie Eastand Dellwood WestNature Preserves
Prairie BluffPreserve
LOCKPORT LOCKAND DAM
88°03'88°04'88°05'88°06'88°07'88°08'88°09'
41°39'
41°38'
41°37'
41°36'
41°35'
41°34'
41°33'
EXPLANATION
Municipality
Habitat status and type
Romeoville
Lockport
Crest Hill
Adult use only
Adult and larval use
Historically documented adult use (no evidence of larvae) Historically documented larval use
Nature preserve boundary
Existing quarry (2016)
Quarry expansion area
Parcel boundary
0 1 2 MILES
0 1 2 KILOMETERS
Base from U.S. Geological Survey digital data, 1:100,000, 2001Albers Equal-Area Conic projection Standard parallels 33˚ N. and 45˚ N.Central meridian 89˚ W.North American Datum of 1927
Figure 2. Location of Hine’s emerald dragonfly habitat in 2009 in the Lower Des Plaines River Valley near Lockport, Will County, Illinois (from Applied Ecological Services, Inc., 2009).

4 Areas that Affect the Habitat of the Endangered Hine’s Emerald Dragonfly in the Lower Des Plaines River Valley, Illinois
Des Plaines River
Chicago Sanitary and Ship Canal Calumet Sag Channel
355
55
171
83
5345
Romeoville PrairieNature Preserve
Black Partridge Woods Nature
Preserve
Romeoville PrairieNature Preserve
KeepatawForest
Preserve
Quarry
Black Partridge Woods Nature
Preserve
Waterfall GlenForest Preserve
McMahon FenNature Preserve
Cherry Hill WoodsForest Preserve
Horsetail LakeForest Preserve
Lemont
COOK COUNTYWILL COUNTY
CO
OK
CO
UN
TYD
UPA
GE C
OU
NTY
ArgonneNational
Laboratory
87°52'87°54'87°56'87°58'88°88°02'88°04'
41°44'
41°42'
41°40'
41°38'
0 1 2 3 4 MILES
0 1 2 3 4 KILOMETERS
Roads from Illinois Department of Transportation, 2014;Water from U.S. Geological Survey National Hydrography dataset, 2012
EXPLANATIONNature or forest preserve
Argonne National Laboratory
Quarry
City of Lemont
Figure 3. Location of selected features in the vicinity of the Lower Des Plaines River Valley, Will, DuPage, and Cook Counties, Illinois.
be affected by additional pumping at the quarry in the vicin-ity of Taylor Road and Route 53 and has been intensively investigated. It also is the area containing the most productive HED habitats with the largest HED populations in Illinois (U.S. Fish and Wildlife Service, 2013b). The secondary area of investigation encompasses the vicinity of the Des Plaines River Valley from the northern part of the Romeoville Prairie Nature Preserve to the northern part of the Argonne National Laboratory and east of the McMahon Fen Nature Preserve in the general vicinity of Lemont, Ill. (fig. 3), and is referred to as the “Lemont area” in this report. This area has been less intensively investigated but contains several areas where small HED populations have been identified or HED use is sus-pected on an intermittent basis.
With the exception of approximately half of the manual water-level measurements taken in July and November 2012 and continuous (reading every 15 minutes using a sensor and datalogger) monitoring of water levels, temperature, and specific conductance at three locations at the Lockport Prairie Nature Preserve and McMahon Fen Nature Preserve between
2011 and 2014, the data presented in this report were collected by entities other than the USGS. Water-level and water-quality data collected by the USGS was done in accordance with standard procedures (Wagner and others, 2006; Cunning-ham and Schalk, 2011) and are stored in the USGS National Water Information System (NWIS) database for Illinois (U.S. Geological Survey, 2017). The potentiometric surface maps based on the July and November 2012 data were developed by the authors. The USGS is unable to verify the quality of data collected by other entities.
Purpose and Scope
This report provides an assessment of the water resources in areas that affect the habitat of the HED and contains information related to the geologic, hydrologic, and water-quality requirements of the HED, an endangered dragonfly whose largest populations in Illinois are in the wetlands in the Des Plaines River Valley near Lockport. The report provides a general overview of the life cycle of the HED and
Introduction 5
description of the geology, hydrology, and water quality within the Lower Des Plaines River Valley as a whole, as well as at several individual habitats. This overview is based on data collected by previous investigators at several habitats as well as a regional study of the shallow groundwater resources. Groundwater models developed by consulting firms in the vicinity of the Lockport Prairie Nature Preserve are summa-rized to assess the effect of increased high-capacity pumping on nearby HED habitats and the effectiveness of groundwater mitigation features to offset the effects of this pumping. The results of synoptic water-level measurements taken by USGS and other parties, along with interpretation of potentiometric surface maps developed by the authors for the Lockport area, are presented. The report identifies gaps in the understand-ing of hydrologic and water-quality conditions in the area. The data and analysis contained in this report will be used by Federal, State, and local authorities to help guide decisions on how to best protect the HED habitat and identify new potential habitats in Illinois.
Life Cycle of the Hine’s Emerald Dragonfly
The life cycle of the HED begins when impregnated females deposit about 1,000 fertilized eggs into shallow water (rivulets, small streams, or small ponds) or wet mud alongside wetland vegetation (Illinois State Museum, 2012; U.S. Fish and Wildlife Service, 2013a). The HED will not lay eggs on dry ground. Egg laying takes place from about late June to late August in Illinois (Vogt and Cashatt, 1997). The eggs remain in the detritus of these shallow water bodies and typically overwinter before hatching into larvae the next spring when water temperatures increase (U.S. Fish and Wildlife Ser-vice, 2013a). The HED larvae undergo a 3–5-year period of maturation, inhabiting rivulets typically less than 6 inches (in.) deep at the edges of deeper channels (Nuzzo, 1995) as well as nearby crayfish (Cambarus diogenes) burrows to survive predation, drought, and winter conditions (Pintor and Soluk, 2006; Soluk, 2006). After adults emerge from the larval stage during the summer months, there is a 5–6-week flight period during which they mate and the females lay their eggs. It is estimated that the survival rate of HED from eggs to mature larvae is less than 1 percent to 5.5 percent (U.S. Fish and Wildlife Service, 2013b).
Although HED survival requires water in the wetlands, the timing, duration, and severity of the summer dry periods also are important to HED survival and reproduction (Soluk and others, 2004). Droughts, such as those that occurred in northern Illinois in 2005 and 2012, can cause a substantial decrease in the HED population (Soluk and others, 1999; Mierzwa, 2007). However, HEDs tend to be displaced by other dragonfly species in permanent wetlands, indicating that a short summer dry period may give the HED a competitive edge for survival over other dragonfly species (Soluk and oth-ers, 1999; Soluk and others, 2015).
The HEDs inhabit wetlands with organic soils overlying calcareous substrate. The presence of open, vegetated areas for forage and nearby forest edge for perching and roosting are important components of HED habitat (Zercher, 2001). The optimal larval habitat is shallow, small rivulets containing slow moving, alkaline (pH greater than 7) water with a short dry period during the summer (Soluk and others, 2004; Illinois State Museum, 2012). The HED can survive in the larval stage at water temperatures between about 2 and 27 degrees Celsius (oC) (Missouri Department of Conservation, [n.d.]) but larvae may have elevated mortality above about 30 oC (D. Soluk, University of South Dakota, written commun., 2016). These habitat requirements are present at groundwater- and spring-fed marshes and sedge meadows underlain by dolomite in the Lower Des Plaines River Valley, which is the location of most of the HED population in Illinois (U.S. Fish and Wildlife Service, 2013b).
The groundwater source for much of the water in these wetlands results in a number of benefits to the HED. Much of the HED wetland habitat has a dry period during the summer; however, because discharging groundwater is a more continu-ous source of water to the habitat than surface-water runoff, more of the wetlands tend to have water for a longer period of time (longer hydroperiod). The short adult lifespan of the HED must overlap the presence of water in the habitat for egg deposition to be successful, so the comparatively long hydro-period enables more HEDs to deposit eggs over a larger area for a longer period of time. These factors increase the number of eggs deposited and lessen the chances for predation and egg desiccation. The typically slow movement of water maximizes egg settling through the water column when deposited and the shallow geometry of the rivulets minimizes erosion of the sediment and detritus holding the HED eggs during surface-water runoff events.
The comparatively constant temperature of the ground-water discharging to the rivulets helps to minimize the pres-ence of ice during the winter, minimizing destruction of HED eggs. Discharge of cool groundwater also helps to lower the water temperature in the rivulets during the summer months, potentially reducing larvae mortality.
Although the prevalence of groundwater as a water source provides a number of benefits to the HED habitat, it also poses risks. Small decreases in groundwater level in the vicinity of the wetlands can substantially reduce the amount of groundwater discharged to the wetlands (Graef, Anhalt, Schlo-emer, and Associates, Inc., 2004a). If the reduction in ground-water discharged to the wetlands is large enough to reduce water levels in the wetlands by as little as 1–2 feet (ft) below the mean water level, which is typical of drought conditions but also may be associated with nearby pumping or increased overland runoff of precipitation, there may be insufficient wet sediment for egg laying. Eggs may become desiccated in the dry sediment and the habitat may not support the prey base for the HED adults (Mierzwa, 2007; Graef, Anhalt, Schloemer, and Associates, Inc., 2008).

6 Areas that Affect the Habitat of the Endangered Hine’s Emerald Dragonfly in the Lower Des Plaines River Valley, Illinois
Hydraulic and water-quality conditions in the Lower Des Plaines River Valley are such that permanent populations of adult and larval HED are present at the Lockport Prairie Nature Preserve, River South Parcel, Long Run Seep Nature Preserve (fig. 2), and the Waterfall Glen Forest Preserve (fig. 3). Adult and larval HED have been identified at the Com Ed and Long Run Parcels, Romeoville Prairie Nature Preserve, Keepataw Forest Preserve, Black Partridge Woods Forest Preserve, Argonne National Laboratory, McMahon Fen Nature Preserve, and southwest of the Lockport Lock and Dam during at least one survey (Soluk and Moss, 2003; Soluk and others, 2004; Mierzwa, 2008, 2013b; Soluk and others, 2012; Mierzwa and Webb, 2012a,b; Hanson Material Service Corporation, 2016). Larvae were historically present at the Middle Parcel Expansion Area but appear to have been extir-pated from the site before 1997 (Mierzwa, 2013a). Adult HED have been identified at the Lockport Prairie East and Dellwood West Nature Preserves (fig. 2). In addition to the presence of HED in the vicinity of the Lower Des Plaines River Valley, a sustainable population of HED has been identified in north-west Cook County at the Spring Lake Forest Preserve (Soluk and others, 2016), which is located about 30 mi northwest of the Lower Des Plaines River Valley.
Soluk and Mierzwa (2012) estimated that the Illinois HED population generates 86–313 adults per year and has been declining since at least the 1990s. The HED population in Illinois is especially vulnerable because approximately 55 percent of the population is located within the Lockport Prairie Nature Preserve and approximately 30 percent is located within the River South Parcel (Soluk and Mierzwa 2012). The proximity of these sites exposes the HED population to extirpation by demographic stochasticity (random changes in characteristics of a small population), and the loss of either site would represent at least a 30-percent decrease in the population.
Assessment of Conditions that Affect the Water Resources in the Lockport Area
Because the HED requires well-constrained conditions to survive, it is essential to understand the phenomena that affect the hydrology and water quality of the habitat, including its surface topography, geology, and hydrology. This report discusses these features within the Des Plaines River Valley in the Lockport area where there is a substantial amount of data available. This report also contains a less extensive discussion of conditions at HED habitats near the Des Plaines River Val-ley in the Lemont area and other parts of northeast Illinois.
Surface Topography
The Lockport area contains topographic uplands that slope toward the Des Plaines River or smaller surface-water drainages at elevations of about 675 to 625 ft above the North American Vertical Datum of 1988 (NAVD 88) (fig. 4). Surface topography slopes sharply toward the Des Plaines River along bluffs located near Illinois Route 53 on the west side of the Des Plaines River Valley, and near High Road and Illinois Route 171 on the east side of the valley. Surface elevation along the bluffs decreases from approximately 625 to 575 ft near the Lockport Prairie Nature Preserve, with similarly large changes in elevation throughout most of the Lockport area.
Surface topography in the valley of the Des Plaines River is somewhat flat, ranging from about 550 to 590 ft in the Lockport area, decreasing from north to south. Surface topography within the river valley slopes toward the Des Plaines River. Superimposed on this flat slope are a series of hummocks and swales that trend roughly parallel to the river. These features have about 1–5 ft of relief. Swales are the loca-tions of the ponds and rivulets constituting part of the HED larval habitat and where the HED lay their eggs. Hummocks are drier, slightly topographically elevated areas that can contain vegetation suitable for perching, which is a necessary process for HED larvae to emerge as adults.
The levees that define the Chicago Sanitary and Ship Canal (CSSC) are more than 30 ft above the surrounding land surface near the Lockport Lock and Dam. The height of the levees above land surface decreases to the north where the elevation of the surrounding land surface increases, converg-ing to more uniform topography. Although the pre-excavation topography is shown in figure 4, the West, East, and Middle Quarries (hereafter referred to collectively as “the Quarry”) have been excavated to an elevation of about 470 ft NAVD 88. The surface topography is the result of deposition of glacial drift on top of dolomite bedrock in northeast Illinois and the subsequent erosion of the drift deposits within the Lower Des Plaines River Valley.
Geology
The geologic deposits of concern to this investigation are Silurian dolomite bedrock (chemical formula CaMg(CO3)2) belonging to the Alexandrian and Niagaran Series. The bedrock deposits are overlain by unconsolidated deposits of glacial and post-glacial origin and are shown along geologic section A–A’, which covers most of the groundwater recharge area for the Lockport Prairie Nature Preserve (figs. 1, 5). The stratigraphic nomenclature used in this report is that of the Illinois State Geological Survey (Willman and others, 1975) and does not necessarily follow the usage of the USGS.

Assessment of Conditions that Affect the Water Resources in the Lockport Area 7
580
630
630630
560
560
650
650
660
560
630
580
650
570
570
640
650
650
670
640
570
650
650
640
620
590
650
620620
630
600
640
650
660
560
660
650
620
640650
650
650
630
630
580
580
640
600
590
670
590
660
610
640
620
620 600
570
610
660
650
580
550
550
630
630
550
640
660
640660
560 560
560
610
610
670
600
600
580
620
630
610
620
710
660
590
590
580
650
580
580
560
640
660
670
620
620
650
650
660
570
570
550
680
670
66061
0
670
650
570
660
650
610
640
640
640
620
660 630
590
650
640
640
660
670
610 600
600
600
650
650
640
540
690
640
640
590
660
600
630 630
580
680
620
580
580
650
670
620
650
650
650
680
630
590
670
610
650
640
650
670
640
680
660
640640
660
680
610
640
670
690
620
630
620
630
580
680
620610620
620
670
660
670
710
640
650
670
660650
670
690
640
680
660
67059
0
590
620 620
600
680
640
680
620
670
630
640
590
680
700
690
670
660
620
720
680
680
540
670
640
630
700
670
630
630
630
630
610
610
680
640
630
670
660660
610
600600
600
670
670
590
590
650
620
620
680
680
660
660
630
640
640
650
640
620620
620
660
660
660 580
640
640 640650
650
590
550
650
600
610
640
640
640
640
650
610
63064
0
630
630620
570
630
Des
Pla
ines
Riv
er
EastQuarry Ill
inoi
s and
Mic
higa
n C
anal
Long
Long
Run
Run
Creek
Seep
Long Run SeepNature Preserve
Lewis University
Airport
Com Ed and
Long Run
Parcels
Des
Pla
ines
Riv
er
Lockport
Romeoville PrairieNature
Preserve
Middle ParcelExpansion Area
53
53
7
7
171
30
College View Subdivision
Romeoville
WestQuarry
ExpansionArea
Middle Quarry
Crest Hill
LOCKPORT LOCKAND DAM
River SouthParcel
LockportPrairieNature
Preserve
WEB
ER R
OAD
ROMEO ROAD
RENWICK ROAD
DIVISION STREET
AIRPORT ROAD
TAYLOR ROAD
DAOR HGI
H
WestQuarry
Lockport Prairie Eastand Dellwood WestNature Preserves
Prairie BluffPreserve
41°39'
41°38'
41°37'
41°36'
41°35'
41°34'
41°33'
88°03'88°04'88°05'88°06'88°07'88°08'88°09'
0 1 2 MILES
0 1 2 KILOMETERS
Base from U.S. Geological Survey digital data, 1:100,000, 2001Albers Equal-Area Conic projection Standard parallels 33˚ N. and 45˚ N.Central meridian 89˚ W.North American Datum of 1927
Nature preserve
Existing quarry (2016)
Quarry expansion area
Parcel boundary
EXPLANATION
600600 Line of equal elevation— Contour interval is 10 feet. Datum is North American Vertical Datum of 1988
Figure 4. Surface topography in the vicinity of the Lower Des Plaines River Valley near Lockport, Will County, Illinois.

8 Areas that Affect the Habitat of the Endangered Hine’s Emerald Dragonfly in the Lower Des Plaines River Valley, Illinois
680
700
660
640
620
600
580
560
540
520
500
480
460
440
420
400
FEET
G111RMW
MW7A
MW7B
MW7C
MW7D
MW6C
MW9B
MW10C
MW10B
MW10AMW9A
MW6B
MW6A
Wilhemi Formation
Elwood Formation
Kankakee Formation
Joliet Formation
Sugar RunFormation
Sand and
Sand and
gravel
Alluvium
Des
Pla
ines
Riv
er
gravel
Till
A A′NORTHWEST SOUTHEAST
BEN
D IN
SECT
ION BE
ND
INSE
CTIO
N
BEN
D IN
SECT
ION
600
590
580570
560
550
Water-level elevation
RMWG111MW7AMW7BMW7CMW7DMW6AMW6BMW6CMW9AMW9BMW10AMW10BMW10C
609.81606.99663.67<606605.82605.70586.62586.03588.02567.20568.40551.08551.18550.51
607.98606.21658.47606.92605.92605.81586.41585.82585.73568.83568.58552.10552.08551.17
July 19, 2012 November 26, 2012Well
DATUM IS NORTH AMERICAN VERTICAL DATUM OF 1988VERTICAL SCALE GREATLY EXAGGERATED
0
0
1 MILE
1 KILOMETER
.25
.25
.50
.50
.75
.75
VERTICAL SCALE GREATLY EXAGGERATED
EXPLANATION
G111 Well location and name—Well log provides basis for lithologic interpretation
Open interval of well
Line of equal water-level elevation, in feet600600
Figure 5. Geologic section A–A’, Lockport area, Will County, Illinois.

Assessment of Conditions that Affect the Water Resources in the Lockport Area 9
Silurian DepositsThe stratigraphy, lithology, and other aspects of the Silu-
rian deposits are presented in figure 6. These deposits typically are between 150 and 300 ft thick in the Lockport area (Road-cap and others, 1993). The elevation of the top of the dolomite deposits in the Lockport area can exceed 625 ft NAVD 88 in the topographic uplands to the east and west of the Des Plaines River Valley, and is typically less than 575 ft within the valley (figs. 5, 7). The elevation of the top of the Silurian deposits decreases from north to south within the river valley. Dolomite deposits are exposed at the base of the bluffs at a number of locations on the west side of the Des Plaines River Valley.
The dolomite contains a network of secondary-perme-ability features consisting of high-angle (near vertical) and subhorizontal fractures and joints (break in the rock with-out measureable displacement), vugs (small cavities in the rock), and solution openings (void in the rock formed by its chemical dissolution). Secondary-permeability features are especially well developed in the top approximately 8–40 ft of the dolomite where weathering has been most extensive (Graef, Anhalt, Schloemer, and Associates, Inc., 2004a; STS/AECOM, 2009; AECOM, 2013a,b).
Investigators at sites along the Des Plaines River near the Calumet Sag Channel (fig. 3) have identified “sub-regional to regional” subhorizontal fractures in the dolomite at eleva-tions of about 415, 440, 460, 525, 550, 561, 570, and 575 ft (Nicholas and Healy, 1988; KPRG and Associates Inc., 2004). These fractures are located along bedding planes and may be continuous for more than a quarter of a mile. Lithologic logs described potential solution openings in the dolomite at 460 to 640 ft NAVD 88 at a well in Romeoville; fractures at 438, 565, 593, and 603 ft at a well in Lockport; fractures at 442 and 466 ft at a well in Crest Hill; and fractures at 529–539 ft at the College View Subdivision (fig. 1). Fractures along bed-ding planes in the lower part of the Kankakee Formation and the upper part of the Elwood Formation (about 460 ft at the Quarry) also are postulated (AECOM, 2012).
High-angle fractures, many infilled with clay, were iden-tified from near the bedrock surface to depths of at least 100 ft below ground surface in cores from wells drilled at the Lock-port Prairie Nature Preserve and at the Quarry (Graef, Anhalt, Schloemer, and Associates, Inc., 2004a; STS/AECOM, 2009; AECOM, 2013b). High-angle joints and fractures have a mean orientation of about N 35o E with a subsidiary orientation of N 65o W in the greater Romeoville area (Foote, 1982).
Unconsolidated DepositsIn most of the Lockport area the dolomite bedrock is
overlain by unconsolidated deposits composed predominately of glacial till (an unsorted mixture of clay, silt, sand, and gravel; fig. 5) belonging to the Wedron Formation (Willman and Lineback, 1970; fig. 8). Small, discontinuous, sand and gravel deposits are interspersed within the Wedron Formation. Till deposits are present in the topographic uplands away from
the Des Plaines River Valley and are as much as about 70 ft thick.
Sand and gravel deposits of the Henry Formation are present along the bluffs on the western edge of the Des Plaines River Valley and at low points in the surface topography west of the Romeoville Prairie Nature Preserve, west of the Quarry, southwest of the Lockport Lock and Dam, and near Long Run Creek (Willman and Lineback, 1970; figs. 5, 8). These spa-tially extensive sand and gravel deposits directly overlie the Silurian bedrock, are as much as 30 ft thick along the bluffs of the Des Plaines River, and typically extend about 1,500 ft west of the bluff (fig. 8; Graef, Anhalt, Schloemer, and Associates, Inc., 2004a). The sand and gravel was deposited by rivers fed by melting glaciers prior to erosion of the Lower Des Plaines River Valley.
Post-glacial alluvial deposits consisting of sand, silt, and clay are present within the Lower Des Plaines River Valley (fig. 5). These deposits typically are 1–4 ft thick and constitute the alluvial aquifer where saturated. Where these deposits are thin or the bedrock surface is low, wetland swales tend to be present. Hummocks may be present where the deposits are thicker or the bedrock surface is slightly higher.
Hydrology
Much of the water in the wetlands that constitute the HED habitat originates as recharge from groundwater. The source area, quantity, and chemistry of the groundwater recharge are affected by the composition of the geologic deposits through which the water moves.
The till deposits of the Wedron Formation (fig. 8) func-tion as a semiconfining unit. Isolated sand and gravel depos-its within the till deposits are considered to be part of the semiconfining unit unless they are in direct contact with the underlying dolomite.
The sand and gravel deposits of the Henry Formation along the bluffs of the Lower Des Plaines River Valley (fig. 8) function as an aquifer (referred to in this report as “the glacial drift aquifer”). Sand and gravel deposits can be associated with seeps where they intercept land surface along a bluff face. Where saturated, the alluvial deposits in the valley of the Des Plaines River are considered to be the alluvial aquifer in this report.
The Silurian dolomite deposits constitute the Silurian aquifer. Groundwater flow through the Silurian aquifer is primarily through the network of high-angle and subhorizontal secondary-permeability features in the dolomite, with smaller amounts of flow through the dolomite matrix. Because most of the groundwater flow in the aquifer is through secondary-permeability features, wetlands associated with numerous large, interconnected secondary-permeability features can be expected to receive more water than wetlands with a few small, isolated, clay-filled, secondary-permeability features. Secondary-permeability features tend to be concentrated in

10 Areas that Affect the Habitat of the Endangered Hine’s Emerald Dragonfly in the Lower Des Plaines River Valley, Illinois
SeriesSystem Formation Member Lithology Secondary Permeability Features
Inter-reef strata, highly cherty, argillaceous dolomite,overlain by massive, porous, crystalline, pure dolomite. These lithologies recur in higher strata. Other lithologies include bedded, porous, crystalline, pure dolomite; non-cherty argillaceous dolomite; thin dolomitic shales; and nodular dolomite. May become more argillaceous in upper strata, generally east of the study area. Typically about 80 feet thick in northern part of area of interest; thins to fully eroded in southern part. Generally under-represented by fossils; dominated by annelid worms.
Prone to dissolution along bedding planes, particularly above clay-rich beds and less porous, well-bedded Sugar Run Formation. North of Kingery Highway, permeable "regional" bedding-plane fractures at elevations of about 5 to 17 feet below the bed of the Des Plaines River. Karstic features identified (Nicholas and Healy, 1988).
Well-bedded, even-textured, dense, nonporous, argillaceous, gray dolomite, 10 to 30 feet thick. Strata generally flat lying. Prominent, thin, greenish-gray argillaceous partings cause the well-bedded appearance.
Fossils can be common and diverse. Thin, sinuous trails, up to 1 foot long often found on bedding surfaces, commonly filled with greenish-gray argillaceous material. Trilobite S. celebra characteristic of the unit; common to lower strata. Other trilobites, crinoids, brachiopods debris common, as is pelmatozoan debris. Orthoconic nautiloids up to 3 feet in length distributed throughout much of the formation. Sporadic occurrence of large, dendritic root systems.
Upper contact at the first appearance of rough-textured, abundantly cherty, brown dolomite.
Thick-bedded to massive, pure, porous to vuggy dolomite, 18 to 34 feet thick. Nodular chert near mid-unit; styolites common throughout.
In places a grainstone primarily consisting of pelmatozoan debris; locally very fossiliferous, containing cystoids, various crinoids, trilobites, gastropods, rugose corals, orthoconic nautiloids, and diverse brachiopods.
Upper contact gradational transition to the more argillaceous dolomite of the Sugar Run.
Medium-bedded dolomite, light gray, approximately 20 feet thick. Basal unit silty. Middle unit moderately argillaceous and silty with bands of chert. Upper unit slightly argillaceous with chert bands.
Lower part red crinoidal dolomite with interbedded argillaceous red to grey dolomite becoming less argillaceous, grey with red mottles in upper part. Top of unit is uppermost strong shaley parting. Approximately 30 feet thick.
Not prone to substantial dissolution along near-vertical joints or bedding planes. Local paleokarstic sinkholes infilled with younger clastics, may be eroded resulting as reentrants up to 10 feet deep along Canal walls west of I-355. Common near-vertical joints generally sealed.
Potentially prone to dissolution along clay-rich bedding planes.
Generally not prone to dissolution along bedding planes. Common near-vertical joints generally sealed.
Nia
gara
nAl
exan
dria
n
Suga
r Run
Jolie
t
Rom
eoM
arkg
raf
Bra
ndon
Brid
ge
Raci
ne (b
asal
)
Silu
rian
Kankakee
Elwood
Wilhelmi
White, pink, or grey fine-to-medium grained dolomite with variable amounts of clay and chert.
Brown to grey thinly bedded dolomite with numerous shale partings and large chert nodules.
Grey highly argillaceous dolomite and dolomitic shale grading upward to argillaceous dolomite.
About 45 feet thick. Elevation of top of formation 505 feet, North American Datum of 1988 at West Quarry.
About 48 feet thick. Elevation of top of Formation 462 feet, North American Datum of1988 at West Quarry. Only upper 5 feet mined.
Overlies Maquoketa Group. About 5 to 75 feet thick in Lockport area. Elevation of base between about 390 and 450 feet, North American Datum of 1988, top is about 413 feet near the West Quarry. Not mined at Quarry. Penetrated by high-capacity wells.
Figure 6. Stratigraphy and lithology of Silurian deposits near Lockport, Will County, Illinois (from Willman and others, 1975).

Assessment of Conditions that Affect the Water Resources in the Lockport Area 11
650
625
600
625
600
600
625
625
550
550
575
575
600
600
575
575
575
575
575
600
600
600
600
625
EastQuarry
ROMEO ROAD
RENWICK ROAD
DIVISION STREET
AIRPORT ROAD
TAYLOR ROAD
DAOR HGI
H
Crest Hill
Illin
ois a
nd M
ichi
gan
Can
al
Long
Long
Run
Run
Creek
Seep
Long Run SeepNature Preserve
Lewis University
Airport
Com Ed and
Long Run
Parcels
Des
Pla
ines
Riv
er
Lockport
Middle Quarry
WestQuarry
River SouthParcel
Romeoville
Lockport PrairieNature Preserve
Romeoville PrairieNature
Preserve
Middle ParcelExpansion Area
53
7
7
171
30
WestQuarry
ExpansionArea
College ViewSubdivision
WEB
ER R
OAD
Lockport Prairie East and Dellwood
West Nature Preserves
Prairie BluffPreserve
LOCKPORT LOCKAND DAM
41°39'
41°38'
41°37'
41°36'
41°35'
41°34'
41°33'
88°03'88°04'88°05'88°06'88°07'88°08'88°09'
Nature preserve
Existing quarry (2016)
Quarry expansion area
Parcel boundary
Bedrock topography— Contour interval is 25 feet. Datum is National Geodetic Vertical Datum of 1929
EXPLANATION
600
0 1 2 MILES
0 1 2 KILOMETERS
Base from U.S. Geological Survey digital data, 1:100,000, 2001Albers Equal-Area Conic projection Standard parallels 33˚ N. and 45˚ N.Central meridian 89˚ W.North American Datum of 1927
Figure 7. Topography of bedrock surface in the vicinity of the Lower Des Plaines River Valley near Lockport, Will County, Illinois (modified from Roadcap and others, 1993).

12 Areas that Affect the Habitat of the Endangered Hine’s Emerald Dragonfly in the Lower Des Plaines River Valley, Illinois
WEB
ER R
OAD
EastQuarry
ROMEO ROAD
RENWICK ROAD
DIVISION STREET
AIRPORT ROAD
TAYLOR ROAD
DAOR HGI
H
Crest Hill
Illin
ois a
nd M
ichi
gan
Can
al
Long
Long
Run
Run
Creek
Seep
Long Run Seep
Nature Preserve
Lewis University
Airport
Com Ed and
Long Run
Parcels
Des
Pla
ines
Riv
er
Lockport
Middle Quarry
WestQuarry
River SouthParcel
Romeoville
Lockport PrairieNature Preserve
Henry Formation sandand gravel removed
by quarrying
Middle ParcelExpansion Area
53
7
7
171
30
WestQuarry
ExpansionArea
College ViewSubdivision
RomeovillePrairie Nature
Preserve
Lockport Prairie Eastand Dellwood WestNature Preserves
Prairie BluffPreserve
LOCKPORT LOCKAND DAM
41°39'
41°38'
41°37'
41°36'
41°35'
41°34'
41°33'
88°03'88°04'88°05'88°06'88°07'88°08'88°09'
EXPLANATION
Surficial geology unit
Equality Formation—Glacial lake plain deposits
Henry Formation—Glacial outwash sand and gravel deposits
Alluvial deposits over Silurian dolomite
Wedron Formation—Wadsworth Till
Wedron Formation—Yorkville Till
Nature preserve
Existing quarry (2016)
Quarry expansion area
Parcel boundary
0 1 2 MILES
0 1 2 KILOMETERS
Base from U.S. Geological Survey digital data, 1:100,000, 2001Albers Equal-Area Conic projection Standard parallels 33˚ N. and 45˚ N.Central meridian 89˚ W.North American Datum of 1927
Figure 8. Surficial geology in the vicinity of the Lower Des Plaines River Valley near Lockport, Will County, Illinois (modified from Roadcap and others, 1993).

Assessment of Conditions that Affect the Water Resources in the Lockport Area 13
the weathered, uppermost part of the aquifer but are present throughout the Silurian aquifer.
Precipitation entering the groundwater system in that part of the Lockport area where the glacial drift aquifer is present, particularly near the bluffs of the Des Plaines River Valley, moves quickly downward through the glacial drift aquifer, recharging the Silurian aquifer. Groundwater in the glacial drift aquifer also flows laterally, discharging from seeps along the bluffs (Graef, Anhalt, Schloemer, and Associates, Inc., 2004a). Water levels (and flow) in the glacial drift aquifer are affected by the amount of precipitation, often rising several feet after a precipitation event and becoming unsaturated when precipitation is absent for an extended period of time (AECOM, 2013a,b).
Precipitation entering the groundwater system in that part of the Lockport area where the semiconfining unit (till) is present moves downward slowly, recharging the Silurian aquifer (Graef, Anhalt, Schloemer, and Associates, Inc., 2004a). During extended periods of below average amounts of precipitation, the base of the semiconfining unit and the top of the Silurian aquifer can become unsaturated in some areas, reducing the amount of recharge to the Silurian aquifer; however, flow through the semiconfining unit is affected less by individual precipitation events than flow through the glacial drift aquifer, making the semiconfining unit a more stable, continuous source of recharge to the Silurian aquifer than the glacial drift aquifer in areas where the aquifer is comparatively thin. As a consequence, wetlands whose groundwater recharge area includes a substantial portion of the semiconfining unit are likely to receive groundwater discharge for a longer period of time than wetlands that receive water primarily from the more hydrologically variable glacial drift aquifer. This process appears to be especially important to the hydrology in the vicinity of the River South Parcel and the Lockport Prairie Nature Preserve in the southwestern part of the Lower Des Plaines River Valley where the glacial drift aquifer can be comparatively thin. By the same token, the glacial drift aquifer is thick and capable of supporting flow for extended periods of time at the Long Run Seep Nature Preserve and several other parcels in the vicinity of the Lower Des Plaines River Valley.
Groundwater in the Silurian aquifer discharges to either the Des Plaines River, the wetlands in the valley of the Des Plaines River, or from seeps at the base of the bluffs along the Des Plaines River Valley (fig. 5; Roadcap and others, 1993; Graef, Anhalt, Schloemer, and Associates, Inc., 2004a; AECOM, 2013a,b). The Silurian aquifer is hydraulically iso-lated from surface-water bodies in the topographic uplands by the semiconfining unit. Groundwater that has discharged to the seeps, as well as groundwater that is discharged directly from the Silurian aquifer to the wetlands in the river valley, flows as surface water through the wetlands to the Des Plaines River.
Water-Level Measurements
It is critical to assess the potential effect of increased groundwater withdrawals and decreased recharge to the Silu-rian aquifer on water levels and groundwater discharge to the HED habitats. The first step in assessing the water resources in the Lockport area was the synoptic measurement of surface-water and groundwater levels on July 19, 2012 (tables 1, 2; fig. 9). A second synoptic measurement was done on Novem-ber 26, 2012 (fig. 10). These measurements were performed by the USGS in cooperation with a variety of other public and private entities and were compiled and contoured by the authors to
• define the potentiometric surface of the Silurian aquifer in the Lockport area,
• identify directions of groundwater flow in three dimen-sions,
• identify the nature of the interaction between surface water and groundwater,
• identify the groundwater recharge areas in the Silurian aquifer for selected HED habitats, and
• identify the effects of pumping from high-capacity wells.
In this report, “high-capacity wells” are pumped at greater than 75 gallons per minute (gal/min) and typically yield thousands of gallons on a daily basis, whereas “water-supply wells” are pumped at less than 20 gal/min and typically yield less than 500 gallons on a daily basis.
Much of Illinois was experiencing a drought during July 2012 and was still in a water deficit during November 2012, so these water levels are lower than usual (Illinois Department of Natural Resources, 2013). Additional synoptic measurements during more typical hydraulic conditions and over a larger portion of the Lower Des Plaines River Valley would improve the assessment of the area hydrology.
Water levels in the Silurian aquifer are highest beneath the topographic uplands and decrease overall toward the Des Plaines River Valley. These data indicate the regional direction of groundwater flow in the Silurian aquifer is from the topo-graphic uplands east and west of the Des Plaines River Valley toward the river. Within this regional flow pattern there are a few local variations.
The water level of the CSSC is maintained at an eleva-tion of about 576.7 ft NAVD 88 by the operation of the Lockport Lock and Dam to facilitate navigation (Jackson and others, 2012). The stage of the CSSC is substantially higher than nearby land surface and groundwater levels in most of the Lockport area, creating the potential for flow from the CSSC into the Silurian aquifer from the Lockport Lock and Dam to approximately the southern edge of the East Quarry (figs. 9, 10).
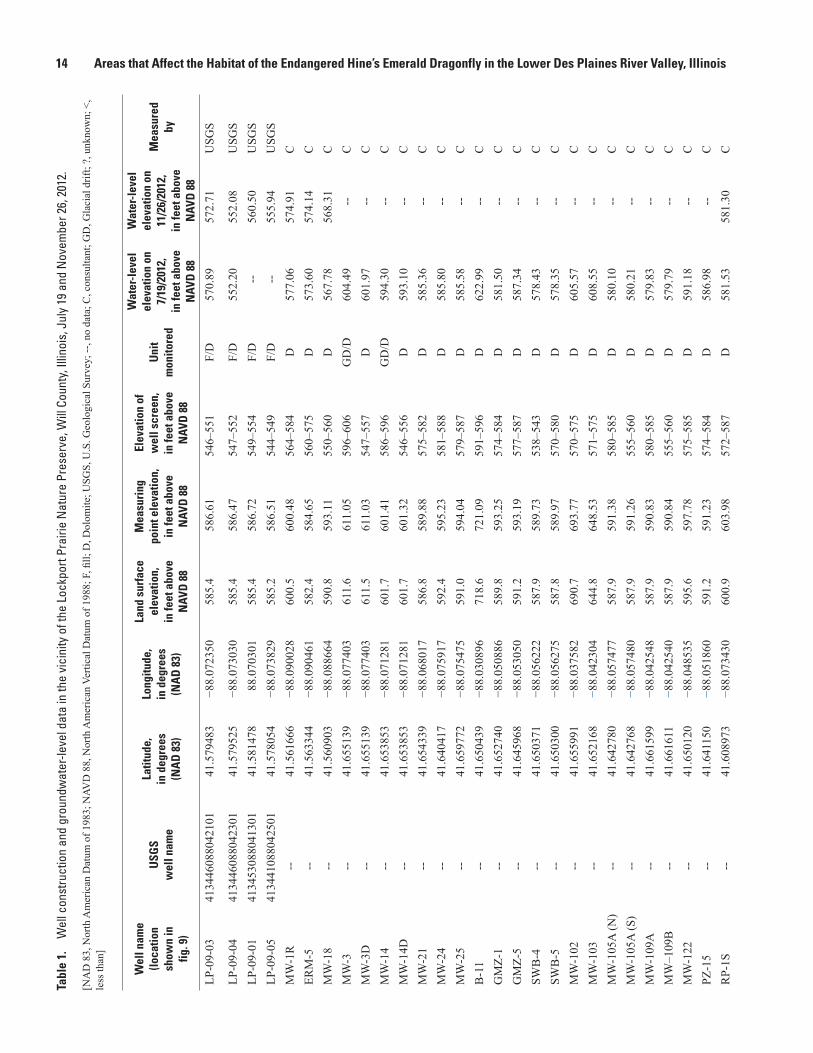
14 Areas that Affect the Habitat of the Endangered Hine’s Emerald Dragonfly in the Lower Des Plaines River Valley, IllinoisTa
ble
1.
Wel
l con
stru
ctio
n an
d gr
ound
wat
er-le
vel d
ata
in th
e vi
cini
ty o
f the
Loc
kpor
t Pra
irie
Nat
ure
Pres
erve
, Will
Cou
nty,
Illin
ois,
Jul
y 19
and
Nov
embe
r 26,
201
2.
[NA
D 8
3, N
orth
Am
eric
an D
atum
of 1
983;
NAV
D 8
8, N
orth
Am
eric
an V
ertic
al D
atum
of 1
988;
F, fi
ll; D
, Dol
omite
; USG
S, U
.S. G
eolo
gica
l Sur
vey;
--, n
o da
ta; C
, con
sulta
nt; G
D, G
laci
al d
rift;
?, u
nkno
wn;
<,
less
than
]
Wel
l nam
e
(loca
tion
show
n in
fig
. 9)
USG
S
wel
l nam
e
Latit
ude,
in
deg
rees
(N
AD
83)
Long
itude
, in
deg
rees
(N
AD
83)
Land
sur
face
el
evat
ion,
in
feet
abo
ve
NAV
D 8
8
Mea
suri
ng
poin
t ele
vatio
n,
in fe
et a
bove
N
AVD
88
Elev
atio
n of
w
ell s
cree
n,
in fe
et a
bove
N
AVD
88
Uni
t m
onito
red
Wat
er-l
evel
el
evat
ion
on
7/19
/201
2,
in fe
et a
bove
N
AVD
88
Wat
er-l
evel
el
evat
ion
on
11/2
6/20
12,
in fe
et a
bove
N
AVD
88
Mea
sure
d by
LP-0
9-03
4134
4608
8042
101
41.5
7948
3−8
8.07
2350
585.
458
6.61
546–
551
F/D
570.
8957
2.71
USG
S
LP-0
9-04
4134
4608
8042
301
41.5
7952
5−8
8.07
3030
585.
458
6.47
547–
552
F/D
552.
2055
2.08
USG
SLP
-09-
0141
3453
0880
4130
141
.581
478
88.0
7030
158
5.4
586.
7254
9–55
4F/
D--
560.
50U
SGS
LP-0
9-05
4134
4108
8042
501
41.5
7805
4−8
8.07
3829
585.
258
6.51
544–
549
F/D
--55
5.94
USG
SM
W-1
R--
41.5
6166
6−8
8.09
0028
600.
560
0.48
564–
584
D57
7.06
574.
91C
ERM
-5--
41.5
6334
4−8
8.09
0461
582.
458
4.65
560–
575
D57
3.60
574.
14C
MW
-18
--41
.560
903
−88.
0886
6459
0.8
593.
1155
0–56
0D
567.
7856
8.31
CM
W-3
--41
.655
139
−88.
0774
0361
1.6
611.
0559
6–60
6G
D/D
604.
49--
CM
W-3
D--
41.6
5513
9−8
8.07
7403
611.
561
1.03
547–
557
D60
1.97
--C
MW
-14
--41
.653
853
−88.
0712
8160
1.7
601.
4158
6–59
6G
D/D
594.
30--
CM
W-1
4D--
41.6
5385
3−8
8.07
1281
601.
760
1.32
546–
556
D59
3.10
--C
MW
-21
--41
.654
339
−88.
0680
1758
6.8
589.
8857
5–58
2D
585.
36--
CM
W-2
4--
41.6
4041
7−8
8.07
5917
592.
459
5.23
581–
588
D58
5.80
--C
MW
-25
--41
.659
772
−88.
0754
7559
1.0
594.
0457
9–58
7D
585.
58--
CB
-11
--41
.650
439
−88.
0308
9671
8.6
721.
0959
1–59
6D
622.
99--
CG
MZ-
1--
41.6
5274
0−8
8.05
0886
589.
859
3.25
574–
584
D58
1.50
--C
GM
Z-5
--41
.645
968
−88.
0530
5059
1.2
593.
1957
7–58
7D
587.
34--
CSW
B-4
--41
.650
371
−88.
0562
2258
7.9
589.
7353
8–54
3D
578.
43--
CSW
B-5
--41
.650
300
−88.
0562
7558
7.8
589.
9757
0–58
0D
578.
35--
CM
W-1
02--
41.6
5599
1−8
8.03
7582
690.
769
3.77
570–
575
D60
5.57
--C
MW
-103
--41
.652
168
−88.
0423
0464
4.8
648.
5357
1–57
5D
608.
55--
CM
W-1
05A
(N)
--41
.642
780
−88.
0574
7758
7.9
591.
3858
0–58
5D
580.
10--
CM
W-1
05A
(S)
--41
.642
768
−88.
0574
8058
7.9
591.
2655
5–56
0D
580.
21--
CM
W-1
09A
--41
.661
599
−88.
0425
4858
7.9
590.
8358
0–58
5D
579.
83--
CM
W–1
09B
--41
.661
611
−88.
0425
4058
7.9
590.
8455
5–56
0D
579.
79--
CM
W-1
22--
41.6
5012
0−8
8.04
8535
595.
659
7.78
575–
585
D59
1.18
--C
PZ-1
5--
41.6
4115
0−8
8.05
1860
591.
259
1.23
574–
584
D58
6.98
--C
RP-
1S--
41.6
0897
3−8
8.07
3430
600.
960
3.98
572–
587
D58
1.53
581.
30C
Assessment of Conditions that Affect the Water Resources in the Lockport Area 15Ta
ble
1.
Wel
l con
stru
ctio
n an
d gr
ound
wat
er-le
vel d
ata
in th
e vi
cini
ty o
f the
Loc
kpor
t Pra
irie
Nat
ure
Pres
erve
, Will
Cou
nty,
Illin
ois,
Jul
y 19
and
Nov
embe
r 26,
201
2.—
Cont
inue
d
[NA
D 8
3, N
orth
Am
eric
an D
atum
of 1
983;
NAV
D 8
8, N
orth
Am
eric
an V
ertic
al D
atum
of 1
988;
F, fi
ll; D
, Dol
omite
; USG
S, U
.S. G
eolo
gica
l Sur
vey;
--, n
o da
ta; C
, con
sulta
nt; G
D, G
laci
al d
rift;
?, u
nkno
wn;
<,
less
than
]
Wel
l nam
e
(loca
tion
show
n in
fig
. 9)
USG
S
wel
l nam
e
Latit
ude,
in
deg
rees
(N
AD
83)
Long
itude
, in
deg
rees
(N
AD
83)
Land
sur
face
el
evat
ion,
in
feet
abo
ve
NAV
D 8
8
Mea
suri
ng
poin
t ele
vatio
n,
in fe
et a
bove
N
AVD
88
Elev
atio
n of
w
ell s
cree
n,
in fe
et a
bove
N
AVD
88
Uni
t m
onito
red
Wat
er-l
evel
el
evat
ion
on
7/19
/201
2,
in fe
et a
bove
N
AVD
88
Wat
er-l
evel
el
evat
ion
on
11/2
6/20
12,
in fe
et a
bove
N
AVD
88
Mea
sure
d by
RP-
1D--
41.6
0899
7−8
8.07
3433
601.
260
3.19
483–
492
D58
1.06
580.
59C
RP-
2S--
41.6
0617
4−8
8.07
2000
579.
358
2.27
565–
575
D57
4.92
576.
42C
RP-
2D--
41.6
0616
0−8
8.07
1973
579.
258
1.88
533–
538
D57
5.27
576.
50C
MP-
1S--
41.6
2547
0−8
8.07
4743
582.
158
5.10
558–
572
D57
6.55
578.
86C
MP-
1D--
41.6
2547
0−8
8.07
4743
582.
858
4.92
475–
485
D57
7.59
579.
40C
MP-
2S--
41.6
2261
6−8
8.07
4771
581.
958
5.18
558–
573
D56
9.89
574.
13C
MP-
2D--
41.6
2259
1−8
8.07
4780
582.
358
3.46
474–
484
D57
1.90
575.
01C
MP-
3D--
41.6
2175
0−8
8.07
4780
581.
758
4.33
434–
?D
561.
5155
3.28
CC
EP-1
S--
41.6
3689
5−8
8.05
2703
586.
758
6.96
573–
583
D58
4.58
586.
16C
CEP
-1D
--41
.636
921
−88.
0527
1558
6.6
589.
7353
8–54
5D
584.
5858
6.43
CC
EP-2
S--
41.6
3093
3−8
8.05
0334
587.
259
0.29
568–
583
D58
4.76
585.
49C
CEP
-2D
--41
.630
912
−88.
0503
4758
7.5
590.
3253
5–54
0D
584.
6358
5.54
CC
EP-3
S--
41.6
3683
7−8
8.04
9806
592.
059
5.05
575–
590
D58
9.49
590.
46C
CEP
-3D
--41
.636
811
−88.
0498
0559
2.0
595.
0754
3–54
8D
590.
0759
0.80
CC
EP-4
S--
41.6
2994
7−8
8.05
6663
584.
558
7.40
565–
580
D57
9.07
582.
05C
CEP
-4D
--41
.636
837
−88.
0498
0658
4.4
587.
7353
4–53
8D
578.
9958
2.01
CC
EP-5
S--
41.6
3515
9−8
8.05
7559
585.
358
8.29
566–
580
D57
8.49
580.
17C
CEP
-6S
--41
.635
973
−88.
0530
3558
6.5
589.
0257
3–58
3D
584.
8958
6.01
CC
EP-7
S--
41.6
3639
0−8
8.05
2241
587.
158
9.80
575–
585
D58
5.65
586.
66C
CEP
-8W
T--
41.6
3575
5−8
8.05
2384
587.
258
9.91
583–
585
D58
6.09
586.
82C
CEP
-9W
T--
41.6
3692
9−8
8.05
2216
587.
359
0.76
583–
586
D58
5.66
586.
59C
CEP
-10S
--41
.631
606
−88.
0549
3958
4.7
587.
7356
6–57
1D
580.
7858
4.56
CC
EP-1
1S--
41.6
3256
2−8
8.05
4200
585.
058
7.90
571–
575
D58
0.45
584.
15C
CEP
-11D
--41
.632
554
−88.
0542
0258
4.9
587.
4853
5–53
9D
580.
4358
4.00
CC
EP-1
2S--
41.6
3174
8−8
8.05
2382
587.
359
0.76
571–
576
D58
4.28
587.
51C
MW
-3A
4134
4408
8045
901
41.5
7900
0−8
8.08
3111
611.
561
1.22
575–
585
D57
8.87
578.
22U
SGS
MW
-3B
4134
4408
8045
902
41.5
7900
0−8
8.08
3111
611.
561
1.07
545–
550
D56
0.68
563.
07U
SGS
MW
-6A
4135
2008
8043
901
41.5
8905
6−8
8.07
7583
616.
561
9.15
583–
593
GD
586.
6258
6.41
USG
S

16 Areas that Affect the Habitat of the Endangered Hine’s Emerald Dragonfly in the Lower Des Plaines River Valley, IllinoisTa
ble
1.
Wel
l con
stru
ctio
n an
d gr
ound
wat
er-le
vel d
ata
in th
e vi
cini
ty o
f the
Loc
kpor
t Pra
irie
Nat
ure
Pres
erve
, Will
Cou
nty,
Illin
ois,
Jul
y 19
and
Nov
embe
r 26,
201
2.—
Cont
inue
d
[NA
D 8
3, N
orth
Am
eric
an D
atum
of 1
983;
NAV
D 8
8, N
orth
Am
eric
an V
ertic
al D
atum
of 1
988;
F, fi
ll; D
, Dol
omite
; USG
S, U
.S. G
eolo
gica
l Sur
vey;
--, n
o da
ta; C
, con
sulta
nt; G
D, G
laci
al d
rift;
?, u
nkno
wn;
<,
less
than
]
Wel
l nam
e
(loca
tion
show
n in
fig
. 9)
USG
S
wel
l nam
e
Latit
ude,
in
deg
rees
(N
AD
83)
Long
itude
, in
deg
rees
(N
AD
83)
Land
sur
face
el
evat
ion,
in
feet
abo
ve
NAV
D 8
8
Mea
suri
ng
poin
t ele
vatio
n,
in fe
et a
bove
N
AVD
88
Elev
atio
n of
w
ell s
cree
n,
in fe
et a
bove
N
AVD
88
Uni
t m
onito
red
Wat
er-l
evel
el
evat
ion
on
7/19
/201
2,
in fe
et a
bove
N
AVD
88
Wat
er-l
evel
el
evat
ion
on
11/2
6/20
12,
in fe
et a
bove
N
AVD
88
Mea
sure
d by
MW
-6B
4135
2008
8043
902
41.5
8905
6−8
8.07
7583
616.
361
9.21
571–
576
D58
6.03
585.
82U
SGS
MW
-6C
4135
2008
8043
903
41.5
8905
6−8
8.07
7583
616.
361
9.11
546–
551
D58
9.91
585.
62U
SGS
MW
-6N
4135
2308
8044
401
41.5
8963
9−8
8.07
8778
622.
562
4.75
584–
?D
?58
8.43
--U
SGS
MW
-6S
4135
1508
8044
201
41.5
8750
0−8
8.07
8306
615.
961
8.65
578–
?D
?58
6.41
586.
21U
SGS
MW
-7A
4135
4308
8053
701
41.5
9533
3−8
8.09
3556
672.
167
4.83
652–
662
GD
663.
6765
8.47
USG
SM
W-7
B41
3543
0880
5370
241
.595
333
−88.
0935
5667
2.1
674.
9660
6–61
1G
D/D
<606
606.
92U
SGS
MW
-7C
4135
4308
8053
703
41.5
9533
3−8
8.09
3556
672.
167
4.75
597–
607
D60
5.82
605.
95U
SGS
MW
-7D
4135
4308
8053
704
41.5
9533
3−8
8.09
3556
672.
167
4.81
572–
577
D60
5.70
605.
81U
SGS
MW
-8A
4134
5408
8044
601
41.5
8177
8−8
8.07
9611
566.
556
9.33
557–
562
GD
/D56
1.51
563.
74U
SGS
MW
-8B
4134
5408
8044
602
41.5
8177
8−8
8.07
9611
566.
556
9.33
539–
544
D56
1.09
563.
82U
SGS
MW
-9A
4135
1608
8043
401
41.5
8786
1−8
8.07
6139
571.
757
4.64
559–
564
D56
7.20
568.
83U
SGS
MW
-9B
4135
1608
8043
402
41.5
8786
1−8
8.07
6139
571.
757
4.39
542–
547
D56
8.40
568.
58U
SGS
MW
-10A
4134
5408
8042
201
41.5
8177
8−8
8.07
2917
556.
356
0.69
543–
553?
D55
1.06
552.
08U
SGS
MW
-10B
4134
5408
8042
202
41.5
8177
8−8
8.07
2917
556.
656
0.40
532–
537?
D55
1.18
552.
08U
SGS
MW
-10C
4134
5408
8042
203
41.5
8177
8−8
8.07
2917
556.
456
0.10
499–
504?
D55
0.51
551.
17U
SGS
MW
-11A
4135
3308
8041
401
41.5
9238
9−8
8.07
0500
562.
656
7.37
555–
565?
D56
0.74
561.
90U
SGS
MW
-11B
4135
3308
8041
402
41.5
9238
9−8
8.07
0500
562.
556
7.40
539–
544?
D56
1.15
562.
05U
SGS
MW
-11C
4135
3308
8041
403
41.5
9238
9−8
8.07
0500
562.
556
7.46
503–
508?
D56
0.83
562.
07U
SGS
MW
-12A
4135
1908
8062
501
41.5
8855
6−8
8.10
6889
642.
064
4.99
622–
632?
GD
636.
7163
6.87
USG
SM
W-1
2B41
3519
0880
6250
241
.588
556
−88.
1068
8964
2.1
644.
6158
1–58
6?D
603.
1660
2.60
USG
SM
W-1
2C41
3519
0880
6250
341
.588
556
−88.
1068
8964
2.1
644.
6954
8–55
3?D
602.
94--
USG
SG
105
4135
4508
8043
701
41.5
9586
1−8
8.07
6861
595.
459
7.91
581–
591
D59
3.16
593.
90U
SGS
G10
641
3543
0880
4340
141
.595
361
−88.
0760
2859
5.0
598.
4357
6–58
6D
591.
1959
2.18
USG
SG
107
4135
4308
8043
601
41.5
9544
4−8
8.07
6639
596.
059
9.54
582–
592
D59
1.54
592.
74U
SGS
LRS1
4137
2208
8025
601
41.6
2263
9−8
8.04
9056
599.
460
359
8–?
GD
598.
20--
USG
SLR
S341
3721
0880
2590
141
.622
389
−88.
0497
7859
3.4
597
590–
?G
D59
3.69
--U
SGS
LRS4
4137
2108
8025
601
41.6
2247
2−8
8.04
9056
589.
959
5.4
587–
?G
D59
0.00
--U
SGS
RP1
4139
1908
8041
001
41.6
5516
7−8
8.06
9556
592.
859
5.78
591–
592?
GD
591.
0159
1.59
USG
S
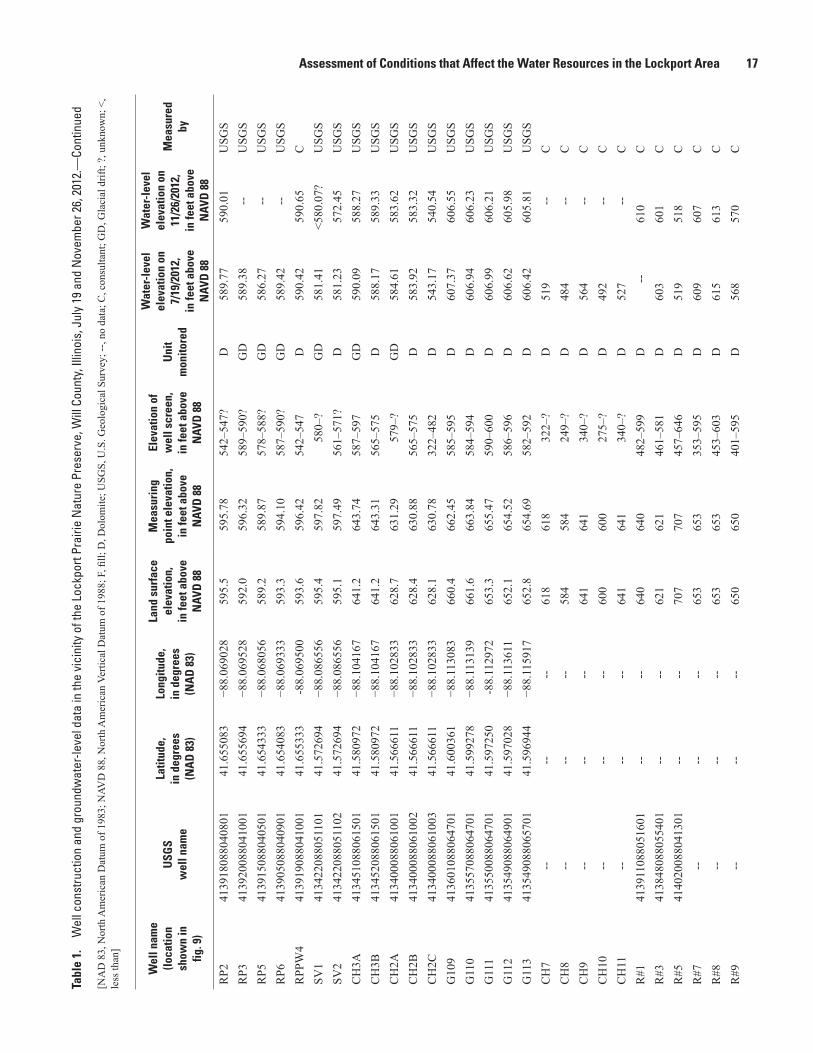
Assessment of Conditions that Affect the Water Resources in the Lockport Area 17Ta
ble
1.
Wel
l con
stru
ctio
n an
d gr
ound
wat
er-le
vel d
ata
in th
e vi
cini
ty o
f the
Loc
kpor
t Pra
irie
Nat
ure
Pres
erve
, Will
Cou
nty,
Illin
ois,
Jul
y 19
and
Nov
embe
r 26,
201
2.—
Cont
inue
d
[NA
D 8
3, N
orth
Am
eric
an D
atum
of 1
983;
NAV
D 8
8, N
orth
Am
eric
an V
ertic
al D
atum
of 1
988;
F, fi
ll; D
, Dol
omite
; USG
S, U
.S. G
eolo
gica
l Sur
vey;
--, n
o da
ta; C
, con
sulta
nt; G
D, G
laci
al d
rift;
?, u
nkno
wn;
<,
less
than
]
Wel
l nam
e
(loca
tion
show
n in
fig
. 9)
USG
S
wel
l nam
e
Latit
ude,
in
deg
rees
(N
AD
83)
Long
itude
, in
deg
rees
(N
AD
83)
Land
sur
face
el
evat
ion,
in
feet
abo
ve
NAV
D 8
8
Mea
suri
ng
poin
t ele
vatio
n,
in fe
et a
bove
N
AVD
88
Elev
atio
n of
w
ell s
cree
n,
in fe
et a
bove
N
AVD
88
Uni
t m
onito
red
Wat
er-l
evel
el
evat
ion
on
7/19
/201
2,
in fe
et a
bove
N
AVD
88
Wat
er-l
evel
el
evat
ion
on
11/2
6/20
12,
in fe
et a
bove
N
AVD
88
Mea
sure
d by
RP2
4139
1808
8040
801
41.6
5508
3−8
8.06
9028
595.
559
5.78
542–
547?
D58
9.77
590.
01U
SGS
RP3
4139
2008
8041
001
41.6
5569
4−8
8.06
9528
592.
059
6.32
589–
590?
GD
589.
38--
USG
SR
P541
3915
0880
4050
141
.654
333
−88.
0680
5658
9.2
589.
8757
8–58
8?G
D58
6.27
--U
SGS
RP6
4139
0508
8040
901
41.6
5408
3−8
8.06
9333
593.
359
4.10
587–
590?
GD
589.
42--
USG
SR
PPW
441
3919
0880
4100
141
.655
333
-88.
0695
0059
3.6
596.
4254
2–54
7D
590.
4259
0.65
CSV
141
3422
0880
5110
141
.572
694
−88.
0865
5659
5.4
597.
8258
0–?
GD
581.
41<5
80.0
7?U
SGS
SV2
4134
2208
8051
102
41.5
7269
4−8
8.08
6556
595.
159
7.49
561–
571?
D58
1.23
572.
45U
SGS
CH
3A41
3451
0880
6150
141
.580
972
−88.
1041
6764
1.2
643.
7458
7–59
7G
D59
0.09
588.
27U
SGS
CH
3B41
3452
0880
6150
141
.580
972
−88.
1041
6764
1.2
643.
3156
5–57
5D
588.
1758
9.33
USG
SC
H2A
4134
0008
8061
001
41.5
6661
1−8
8.10
2833
628.
763
1.29
579–
?G
D58
4.61
583.
62U
SGS
CH
2B41
3400
0880
6100
241
.566
611
−88.
1028
3362
8.4
630.
8856
5–57
5D
583.
9258
3.32
USG
SC
H2C
4134
0008
8061
003
41.5
6661
1−8
8.10
2833
628.
163
0.78
322–
482
D54
3.17
540.
54U
SGS
G10
941
3601
0880
6470
141
.600
361
−88.
1130
8366
0.4
662.
4558
5–59
5D
607.
3760
6.55
USG
SG
110
4135
5708
8064
701
41.5
9927
8−8
8.11
3139
661.
666
3.84
584–
594
D60
6.94
606.
23U
SGS
G11
141
3550
0880
6470
141
.597
250
-88.
1129
7265
3.3
655.
4759
0–60
0D
606.
9960
6.21
USG
SG
112
4135
4908
8064
901
41.5
9702
8−8
8.11
3611
652.
165
4.52
586–
596
D60
6.62
605.
98U
SGS
G11
341
3549
0880
6570
141
.596
944
−88.
1159
1765
2.8
654.
6958
2–59
2D
606.
4260
5.81
USG
SC
H7
----
--61
861
832
2–?
D51
9--
CC
H8
----
--58
458
424
9–?
D48
4--
CC
H9
----
--64
164
134
0–?
D56
4--
CC
H10
----
--60
060
027
5–?
D49
2--
CC
H11
----
--64
164
134
0–?
D52
7--
CR
#141
3911
0880
5160
1--
--64
064
048
2–59
9D
--61
0C
R#3
4138
4808
8055
401
----
621
621
461–
581
D60
360
1C
R#5
4140
2008
8041
301
----
707
707
457–
646
D51
951
8C
R#7
----
--65
365
335
3–59
5D
609
607
CR
#8--
----
653
653
453–
603
D61
561
3C
R#9
----
--65
065
040
1–59
5D
568
570
C

18 Areas that Affect the Habitat of the Endangered Hine’s Emerald Dragonfly in the Lower Des Plaines River Valley, IllinoisTa
ble
1.
Wel
l con
stru
ctio
n an
d gr
ound
wat
er-le
vel d
ata
in th
e vi
cini
ty o
f the
Loc
kpor
t Pra
irie
Nat
ure
Pres
erve
, Will
Cou
nty,
Illin
ois,
Jul
y 19
and
Nov
embe
r 26,
201
2.—
Cont
inue
d
[NA
D 8
3, N
orth
Am
eric
an D
atum
of 1
983;
NAV
D 8
8, N
orth
Am
eric
an V
ertic
al D
atum
of 1
988;
F, fi
ll; D
, Dol
omite
; USG
S, U
.S. G
eolo
gica
l Sur
vey;
--, n
o da
ta; C
, con
sulta
nt; G
D, G
laci
al d
rift;
?, u
nkno
wn;
<,
less
than
]
Wel
l nam
e
(loca
tion
show
n in
fig
. 9)
USG
S
wel
l nam
e
Latit
ude,
in
deg
rees
(N
AD
83)
Long
itude
, in
deg
rees
(N
AD
83)
Land
sur
face
el
evat
ion,
in
feet
abo
ve
NAV
D 8
8
Mea
suri
ng
poin
t ele
vatio
n,
in fe
et a
bove
N
AVD
88
Elev
atio
n of
w
ell s
cree
n,
in fe
et a
bove
N
AVD
88
Uni
t m
onito
red
Wat
er-l
evel
el
evat
ion
on
7/19
/201
2,
in fe
et a
bove
N
AVD
88
Wat
er-l
evel
el
evat
ion
on
11/2
6/20
12,
in fe
et a
bove
N
AVD
88
Mea
sure
d by
R#1
2--
----
623
623
378–
57D
604
603
CC
V#1
----
--67
567
533
3–62
8D
540
--C
CV
#2--
----
682
682
386–
635
D53
0--
CC
V#3
----
--68
068
035
3–63
8D
532
--C
CO
4136
4508
8044
301
----
628.
262
9.00
449–
?D
518?
--U
SGS
CG
4136
4708
8044
401
----
625.
462
6.83
320–
?D
469.
2247
0.12
USG
SA
L41
3648
0880
4360
1--
--62
0.2
620.
5932
0–?
D47
1.29
472.
54U
SGS
RM
W41
3608
0880
7200
1--
--64
7.3
648.
2052
3–59
2D
609.
8160
7.98
USG
SR
ME
4136
0908
8071
101
----
650.
565
2.22
523–
595
D61
0.17
608.
03U
SGS
AR
4136
3508
8063
301
----
663.
866
4.88
?–?
D62
0.87
624.
98U
SGS
CB
W41
3807
0880
2490
1--
--67
9.7
681.
17?–
?D
613.
93--
USG
SLG
C41
3648
0880
2580
1--
--64
8.1
650.
3845
0–50
7D
596.
78--
USG
SR
RR
4135
4808
8050
601
----
655.
165
6.97
?–?
D59
9.22
599.
15U
SGS
LUFH
4136
0008
8042
901
----
612.
161
3.17
?–?
D--
575.
63U
SGS
TR41
3732
0880
5140
1--
--63
6.1
635.
6741
0–?
D--
572?
USG
SW
C41
3642
0880
4440
1--
--63
2.0
633.
1333
0–?
D54
0.10
USG
S

Assessment of Conditions that Affect the Water Resources in the Lockport Area 19
Table 2. Streamgage information and water-level data in the vicinity of the Lockport Prairie Nature Preserve, Will County, Illinois, July 19 and November 26, 2012.
[NAD 83, North American Datum of 1983; NAVD 88, North American Vertical Datum of 1988; USGS, U.S. Geological Survey; --, no data]
Location (shown in fig. 9)
USGS streamgage
name
Latitude, in degrees (NAD 83)
Longitude, in degrees (NAD 83)
Measuring point elevation,
in feet above NAVD 88
Water-level elevation on
7/19/2012, in feet above
NAVD 88
Water-level elevation on 11/26/2012,
in feet above NAVD 88
Measured by
Illinois and Michigan Canal
Old Romeo Road -- 41.640661 -88.058009 593.05 578.30 578.40 USGS Middle Gage -- 41.657507 -88.048899 593.27 578.72 -- ConsultantSouth Gage -- 41.648228 -88.057267 577.31 578.81 -- Consultant
Des Plaines River
Romeo Road 05534000 41.640279 -88.058009 571.47 580.52 584.55 USGS9th Avenue -- 41.592550 -88.069550 579.77 562.19 562.08 USGSDivision Street 05534100 41.581993 -88.072030 579.77 558.68 558.41 USGSMaterial Service Road 05534050 41.596377 -88.068517 579.77 563.88 -- USGS
Chicago Sanitary and Ship Canal
Lockport Lock Control Works 05537000 41.597500 -88.066111 579.78 577.26 576.84 USGSBruce Lake
Bruce Lake (shown in fig. 22) -- 41.639441 -88.056858 591.88 583.48 -- Consultant
A cone of depression surrounds the Quarry due to high-capacity pumping to dewater the dolomite and to support Quarry operations. The cone of depression appears to extend to HED habitats at the Middle Parcel Expansion Area and the River South Parcel. Additional groundwater withdrawals from the Silurian aquifer associated with the proposed expansion of quarry operations in the West Quarry and Middle Parcel Expansion Areas (fig. 1) would increase the size of the cone of depression in the vicinity of the Quarry. Note the process affecting flow from the CSSC to the Silurian aquifer near the East Quarry (pumping from the East Quarry) differs from the process affecting flow to the aquifer (approximately) south of the quarry (elevated water levels in the canal) discussed in the previous paragraph.
Lower water levels also were observed at high-capacity wells CH7, CH10, and CH11 in the southern part of the Lockport area (fig. 9). All of the high-capacity wells in this area are open to most or all of the Silurian aquifer. Static water levels are lower in the deeper part of the Silurian aquifer than in the shallow part in the vicinity of some of these wells; for example, high-capacity well CH10 is about 325 ft deep and had a water-level elevation of about 492 ft during July 2012 (table 1). Nearby monitoring wells CH2C (depth about 300 ft) and CH2B (depth about 65 ft) had static water-level elevations of about 543 and 584 ft, respectively, during July 2012. These data indicate that fractures located in the deeper part of the Silurian aquifer can provide substantial amounts of ground-water to the high-capacity wells and that the vertical intercon-nectedness of the fracture network within the Silurian aquifer
is somewhat limited in this area and potentially in the Silurian aquifer as a whole. It is unclear if the extraction of groundwater from secondary-permeability features in the deeper part of the Silurian aquifer diverts substantial amounts of water from the shallower parts of the aquifer and the wetlands.
The potentiometric surface depicted in figures 9 and 10 and from previous investigations (Roadcap and others, 1993) indicates that the groundwater recharge area (the land area where water infiltrates into the ground and contributes to the groundwater that flows to or through a given feature) for the Silurian aquifer to the River South Parcel and the Lockport Prairie Nature Preserve extends west to the vicinity of the intersection of Airport and Weber Roads (fig. 11). The recharge areas are separated by a groundwater divide that extends from the vicinity of the AR well to well RRR and wells G105 through G107 north of the Lockport Prairie Nature Preserve (fig. 9). The groundwater recharge zones show some overlap with the capture zones (the area around a pumping center con-tributing groundwater to the pumped wells) for the Quarry.
To account for uncertainties in the flow direction, a 0.5-mi wide “buffer area” is drawn around the groundwater recharge area to identify the area that could be affecting the hydrology of the River South Parcel and the Lockport Prairie Nature Pre-serve. An additional 2-mi buffer was added to account for the area where drawdown or capture from high-capacity pumping wells might affect flow in the recharge areas. The hydrology within a groundwater recharge area and changes to the hydrol-ogy within the recharge area have the potential to affect the HED habitat.

620
610
610
600
600
590
590
580570
570
470470
570
580
580
470
560
620
610
610
600
600590
590
580
580
600
590
570
56058
0
reviR senialP seD
Long
Run
Creek
Illin
ois a
nd M
ichi
gan
Can
al
Chi
cago
Sa
nita
ry a
nd S
hip
Can
al
Long
Run
Seep
Lewis University
Airport
Middle Parcel
Expansion Area
Romeoville PrairieNature
Preserve
ComEd andLong Run
Parcels
EastQuarry
WestQuarry
Middle Quarry
Lockport PrairieNature Preserve
Long Run Seep
Nature Preserve
WestQuarry
ExpansionArea
College View
Subdivision
DAMRiver SouthParcel
TEXACO
Lockport Prairie East and Dellwood WestNature Preserve s
Prairie BluffPreserve
DIVISION STREET
DAOR HGI
H
WEBBER ROAD
WEBBER ROAD
ROMEO ROAD
RENWICK ROAD
AIRPORT ROAD
TAYLOR ROAD
Crest Hill
Lewis University
Airport
Lockport
Romeoville
Middle Parcel
Expansion Area
Romeoville PrairieNature
Preserve
7
53
171
7
Com Ed andLong Run
Parcels
EastQuarry
WestQuarry
Middle Quarry
Lockport PrairieNature Preserve
Long Run Seep
Nature Preserve
55
WestQuarry
ExpansionArea
College View
Subdivision
53
DAMRiver SouthParcel
TEXACO
Lockport Prairie East and Dellwood WestNature Preserves
Prairie BluffPreserve
LOCKPORT LOCKAND DAM
CEP-8WT586.09
CEP-7S585.65
9th Avenue562.19
LP-09-03570.89
LP-09-04552.2
MW-1R577.06
ERM-5573.6
MW-3D601.97
MW-14D593.1 MW-21
585.36
MW-24585.8
MW-25585.58
R#3603
R#1608
R#7609R#8615
B-11622.99
GMZ-1581.5
MW-102605.57
MW-103608.55
MW-105A(N)580.1MW-105A(S)580.21
MW-109A579.83
MW-109B579.79
MP-1S576.55MP-1D577.59
MP-2S569.89 MP-3D
(TAMSD3)561.51
CEP-1D584.58CEP-1S584.58
CEP-2D584.63CEP-2S584.76
CEP-6S584.89
MW 3B560.68
MW-6B586.03
MW-6C589.91
MW-6N588.43
MW6S586.41
MW-7C605.82
MW-7D605.7
MW-9A567.2MW-9B568.4
MW-10A551.06
MW-10C550.21
MW-12B603.16MW-12C602.94
G105593.16
G106591.19
G107591.54
RPPW4590.42
SV 2581.23
CH3B588.17
CH2B583.92
CH2C543.17
G109607.37
G110606.94
G111606.99
G112606.62
G113606.42
CV#1540
AL471.29
RMW
RME610.17
AR620.87
CBW613.95
LGC596.78
RRR599.22
RomeoRoad580.52
Lockport Lock577.26
Bruce Lake
583.48
7519
10492
11527
CEP-12S584.28
CEP-11D580.43CEP-11S580.45
CO518.28
CG469.22
CV#3532
CV#2530
MP-2D571.9
RP-1S581.53
RP-1D581.06
RP-2S574.92
RP-2D575.27
MW-11A560.74
MW-11B561.15
MW-11C560.83
Division Street558.68
MW-18567.78
RP2589.77
SWB-4578.43
SWB-5578.35
I&M Canal South Gage
578.81
Old Romeo Road
578.25
I&M Canal Mid-Gage578.72
MW-122591.18
GMZ-5587.34
CEP-3S589.49CEP-3D590.07
CEP-4S579.07CEP-4D579.0
CEP-5S578.49
CEP-10S580.78
CEP-9WT585.66
PZ-15586.98
MW-8B561.09
MW-10B550.91
CEP-8WT586.09
CEP-7S585.65
9th Avenue562.19
LP-09-03570.89
LP-09-04552.2
MW-1R577.06
ERM-5573.6
MW-3D601.97
MW-14D593.1 MW-21
585.36
MW-24585.8
MW-25585.58
R#3603
R#1608
R#7609R#8615
B-11622.99
GMZ-1581.5
MW-102605.57
MW-103608.55
MW-105A(N)580.1MW-105A(S)580.21
MW-109A579.83
MW-109B579.79
MP-1S576.55MP-1D577.59
MP-2S569.89 MP-3D
(TAMSD3)561.51
CEP-1D584.58CEP-1S584.58
CEP-2D584.63CEP-2S584.76
CEP-6S584.89
MW 3B560.68
MW-6B586.03
MW-6C589.91
MW-6N588.43
MW6S586.41
MW-7C605.82
MW-7D605.7
MW-9A567.2MW-9B568.4
MW-10A551.06
MW-10C550.21
MW-12B603.16MW-12C602.94
G105593.16
G106591.19
G107591.54
RPPW4590.42
SV 2581.23
CH3B588.17
CH2B583.92
CH2C543.17
G109607.37
G110606.94
G111606.99
G112606.62
G113606.42
CV#1540
AL471.29
RMW
RME610.17
AR620.87
CBW613.95
LGC596.78
RRR599.22
RomeoRoad580.52
Lockport Lock577.26
Bruce Lake
583.48
CH7519
CH10492
CH11527
CEP-12S584.28
CEP-11D580.43CEP-11S580.45
CO518.28
CG469.22
CV#3532
CV#2530
MP-2D571.9
RP-1S581.53
RP-1D581.06
RP-2S574.92
RP-2D575.27
MW-11A560.74
MW-11B561.15
MW-11C560.83
Division Street558.68
MW-18567.78
RP2589.77
SWB-4578.43
SWB-5578.35
I&M Canal South Gage
578.81
Old Romeo Road
578.25
I&M Canal Mid-Gage578.72
MW-122591.18
GMZ-5587.34
CEP-3S589.49CEP-3D590.07
CEP-4S579.07CEP-4D579.0
CEP-5S578.49
CEP-10S580.78
CEP-9WT585.66
PZ-15586.98
MW-8B561.09
MW-10B550.91
609.81
88°02'88°03'88°04'88°05'88°06'88°07'
41°39'
41°38'
41°37'
41°36'
41°35'
41°34'
EXPLANATION
R#3603
AR620.87
MW-12B603.16
9th Avenue561.9
Nature preserve
Existing quarry (2016)
Quarry expansion area
Parcel boundary
Water-level elevation—Dashed where inferred. Contour interval 10 feet. Datum is North American Vertical Datum of 1988. Contour based on data from shallowest well at location Streamgage location with name and stage
Monitoring well with name and water-level elevation
Water-supply well with name and water-level elevation
High-capacity well with name and water-level elevation
600600
0 1 MILE
0 1 KILOMETER
Base from U.S. Geological Survey digital data, 1:100,000, 2001Albers Equal-Area Conic projection Standard parallels 33˚ N. and 45˚ N.Central meridian 89˚ W.North American Datum of 1927
20 Areas that Affect the Habitat of the Endangered Hine’s Emerald Dragonfly in the Lower Des Plaines River Valley, Illinois
Figure 9. Potentiometric surface of the Silurian aquifer in the vicinity of the Lower Des Plaines River Valley near Lockport, Will County, Illinois, July 19, 2012.
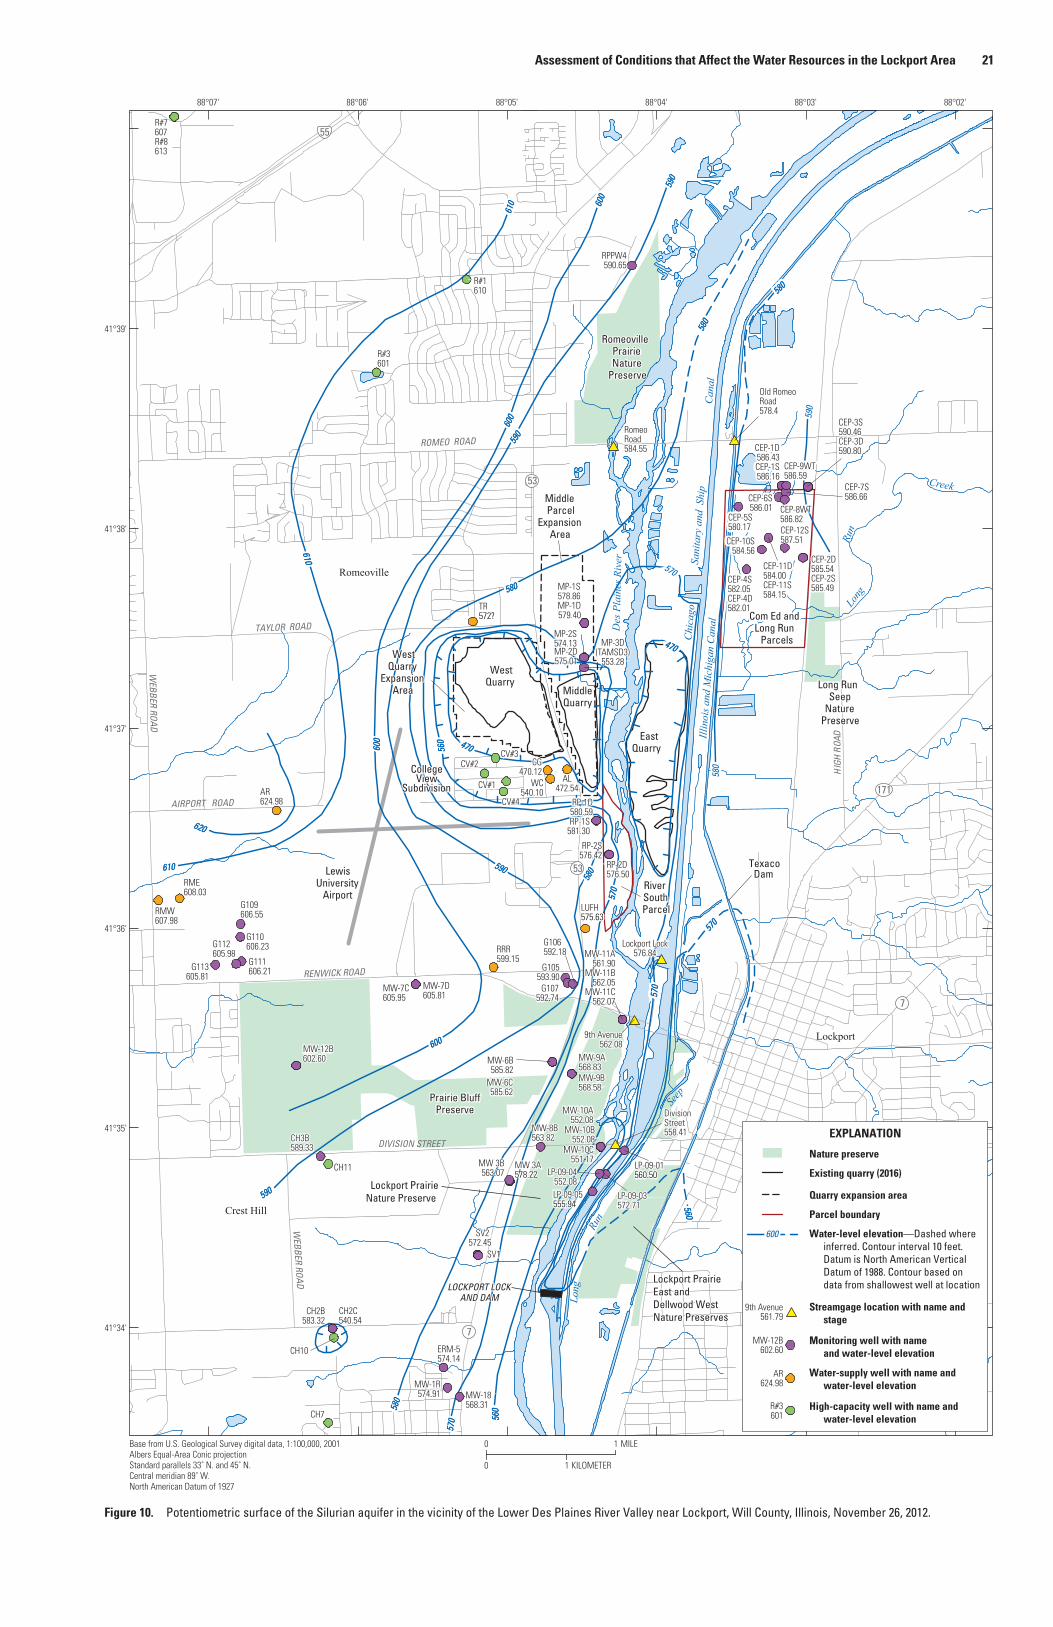
620620
610610
610610
610
610 60
060
0
600
600
600
600
600600
590590
590590
590
590
580580
590
590
580
580
570
570
570
570
570
570
580
580
570
570
570
570
560
560
560560
580
580
580
580
560
560 470470
470470
580
620620
610610
610610
610
610 60
060
0
600
600
600
600
600600
590590
590590
590
590
580580
590
590
580
580
570
570
570
570
570
570
580
580
590
570
570
570
560
560
560560
580
580
580
580
560
560 470470
470470
580
reviR senialP seD
Long
Run
Creek
Illin
ois a
nd M
ichi
gan
Can
al
Chi
cago
Sa
nita
ry a
nd S
hip
Can
al
Long
Run
Seep
Lewis University
Airport
Middle Parcel
Expansion Area
Romeoville PrairieNature
Preserve
ComEd andLong Run
Parcels
EastQuarry
WestQuarry
Middle Quarry
Lockport PrairieNature Preserve
Long Run Seep
Nature Preserve
LOCKPORT LOCKAND DAM
WestQuarry
ExpansionArea
College View
Subdivision
DamRiver SouthParcel
Texaco
Lockport Prairie East and Dellwood WestNature Preserve s
Prairie BluffPreserve
DIVISION STREET
DAOR HGI
H
ROMEO ROAD
RENWICK ROAD
AIRPORT ROAD
TAYLOR ROAD
Crest Hill
Lewis University
Airport
Lockport
Romeoville
Middle Parcel
Expansion Area
Romeoville PrairieNature
Preserve
7
53
171
7
Com Ed andLong Run
Parcels
EastQuarry
WestQuarry
Middle Quarry
Lockport PrairieNature Preserve
Long Run Seep
Nature Preserve
55
LOCKPORT LOCKAND DAM
WestQuarry
ExpansionArea
College View
Subdivision
53 DamRiver SouthParcel
Texaco
Lockport Prairie East and Dellwood WestNature Preserves
Prairie BluffPreserve
WEBBER ROAD
WEBBER ROAD
LP-09-01560.50
TR572?
CEP-7S586.66
R#3601
R#1610
R#7607R#8613
MP-1S578.86MP-1D579.40
CEP-1D586.43CEP-1S586.16
CEP-2D585.54CEP-2S585.49
CEP-3S590.46CEP-3D590.80
CEP-4S582.05CEP-4D582.01
CEP-6S586.01
MW 3B563.07
MW-6B585.82
MW-6C585.62
MW605.95
MW-7D605.81
MW-9A568.83MW-9B568.58
MW-10A552.08
MW-12B602.60
G105593.90
G106592.18
G107592.74
RPPW4590.65
SV 2572.45
CH3B589.33
G109606.55
G110606.23
G111606.21
G112605.98
G113605.81
WC540.10
CV#3CV#2
CV#1AL
472.54
RMW607.98
RME608.03
AR624.98
RRR599.15
11
CEP-12S587.51
CEP-11D584.00CEP-11S584.15
MW 3A578.22
SV1
LP-09-03572.71
LP-09-05555.94
LP-09-04552.08
MW552.08
MW551.17
9th Avenue562.08
RomeoRoad584.55
Lockport Lock576.84
Division Street558.41
MW-11A561.90
MW-11B562.05
MW-11C562.07
RP-2S576.42
RP-2D576.50
CV#4
RP-1S581.30
RP-1D580.59
CG470.12
MP-2S574.13MP-2D575.01
MP-3D(TAMSD3)
553.28
-8B563.82
LUFH575.63
CEP-8WT586.82CEP-5S
580.17
CEP-10S584.56
CEP-9WT586.59
Old Romeo Road578.4
-7C
-10B
-10C
MW
MW574.91
ERM-5574.14
MW-18568.31
CH2B583.32
CH2C540.54
7
-1R
LP-09-01560.50
TR572?
CEP-7S586.66
R#3601
R#1610
R#7607R#8613
MP-1S578.86MP-1D579.40
CEP-1D586.43CEP-1S586.16
CEP-2D585.54CEP-2S585.49
CEP-3S590.46CEP-3D590.80
CEP-4S582.05CEP-4D582.01
CEP-6S586.01
MW 3B563.07
MW-6B585.82
MW-6C585.62
MW605.95
MW-7D605.81
MW-9A568.83MW-9B568.58
MW-10A552.08
MW-12B602.60
G105593.90
G106592.18
G107592.74
RPPW4590.65
SV2572.45
CH3B589.33
G109606.55
G110606.23
G111606.21
G112605.98
G113605.81
WC540.10
CV#3CV#2
CV#1AL
472.54
RMW607.98
RME608.03
AR624.98
RRR599.15
CH11
CEP-12S587.51
CEP-11D584.00CEP-11S584.15
MW 3A578.22
SV1
LP-09-03572.71
LP-09-05555.94
LP-09-04552.08
MW552.08
MW551.17
9th Avenue562.08
RomeoRoad584.55
Lockport Lock576.84
Division Street558.41
MW-11A561.90
MW-11B562.05
MW-11C562.07
RP-2S576.42
RP-2D576.50
CV#4
RP-1S581.30
RP-1D580.59
CG470.12
MP-2S574.13MP-2D575.01
MP-3D(TAMSD3)
553.28
-8B563.82
LUFH575.63
CEP-8WT586.82CEP-5S
580.17
CEP-10S584.56
CEP-9WT586.59
Old Romeo Road578.4
-7C
-10B
-10C
MW
MW574.91
ERM-5574.14
MW-18568.31
CH2B583.32
CH2C540.54
CH7
CH10
-1R
88°02'88°03'88°04'88°05'88°06'88°07'
41°39'
41°38'
41°37'
41°36'
41°35'
41°34'
EXPLANATION
R#3601
AR624.98
MW-12B602.60
9th Avenue561.79
Nature preserve
Existing quarry (2016)
Quarry expansion area
Parcel boundary
Water-level elevation—Dashed where inferred. Contour interval 10 feet. Datum is North American Vertical Datum of 1988. Contour based on data from shallowest well at location Streamgage location with name and stage
Monitoring well with name and water-level elevation
Water-supply well with name and water-level elevation
High-capacity well with name and water-level elevation
600600
0 1 MILE
0 1 KILOMETER
Base from U.S. Geological Survey digital data, 1:100,000, 2001Albers Equal-Area Conic projection Standard parallels 33˚ N. and 45˚ N.Central meridian 89˚ W.North American Datum of 1927
Assessment of Conditions that Affect the Water Resources in the Lockport Area 21
Figure 10. Potentiometric surface of the Silurian aquifer in the vicinity of the Lower Des Plaines River Valley near Lockport, Will County, Illinois, November 26, 2012.
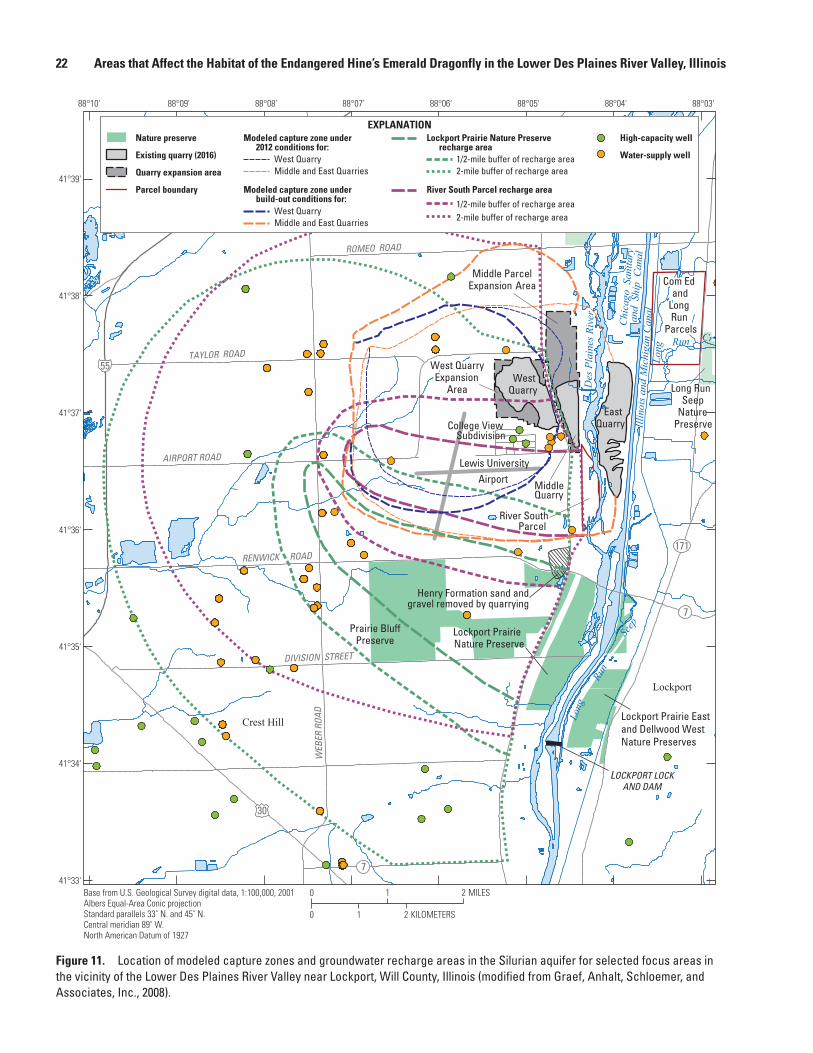
22 Areas that Affect the Habitat of the Endangered Hine’s Emerald Dragonfly in the Lower Des Plaines River Valley, Illinois
Lockport Prairie Eastand Dellwood WestNature Preserve
WEB
ER R
OAD
ROMEO ROAD
RENWICK ROAD
DIVISION STREET
AIRPORT ROAD
TAYLOR ROAD
Crest Hill
reviR senialP seD
Lockport
River SouthParcel
Middle ParcelExpansion Area
Romeoville PrairieNature
Preserve
7
30
171
7
Com Ed and
Long Run
Parcels
EastQuarry
WestQuarry
MiddleQuarry
Lockport PrairieNature Preserve
Henry Formation sand andgravel removed by quarrying
Long Run Cr
Long Run Seep
Nature PreserveIll
inoi
s and
Mic
higa
n C
anal
Chi
cago
San
itary
and
Shi
p C
anal
LOCKPORT LOCKAND DAM
Long
Run
Seep
College View
Lewis UniversityAirport
Subdivision
ExpansionArea
55 West Quarry
Lockport Prairie Eastand Dellwood WestNature Preserves
Prairie BluffPreserve
88°03'88°04'88°05'88°06'88°07'88°08'88°09'88°10'
41°39'
41°38'
41°37'
41°36'
41°35'
41°34'
41°33'
EXPLANATIONNature preserve
Existing quarry (2016)
Quarry expansion area
Parcel boundary
High-capacity well
Water-supply well
Modeled capture zone under 2012 conditions for:
West QuarryMiddle and East Quarries
West QuarryMiddle and East Quarries
Modeled capture zone under build-out conditions for:
Lockport Prairie Nature Preserve recharge area
1/2-mile buffer of recharge area2-mile buffer of recharge area
1/2-mile buffer of recharge area2-mile buffer of recharge area
River South Parcel recharge area
0 1 2 MILES
0 1 2 KILOMETERS
Base from U.S. Geological Survey digital data, 1:100,000, 2001Albers Equal-Area Conic projection Standard parallels 33˚ N. and 45˚ N.Central meridian 89˚ W.North American Datum of 1927
Figure 11. Location of modeled capture zones and groundwater recharge areas in the Silurian aquifer for selected focus areas in the vicinity of the Lower Des Plaines River Valley near Lockport, Will County, Illinois (modified from Graef, Anhalt, Schloemer, and Associates, Inc., 2008).

Assessment of Conditions that Affect the Water Resources at Selected Hine’s Emerald Dragonfly Habitats in the Lower Des Plaines River Valley
Assessment of Conditions that Affect the Water Resources at Selected Hine’s Emerald Dragonfly Habitats 23
Assessment of Conditions that Affect the Water Resources at Selected Hine’s Emerald Dragonfly Habitats
This assessment focuses on the Quarry, the River South Parcel, the Lockport Prairie Nature Preserve, and the Com Ed/Long Run Parcels. These parcels have been most intensively characterized; are most likely to be affected by increased pumping at the Quarry; and in the case of River South and the Lockport Prairie Nature Preserve, have the best HED habitat (highest populations). Other habitats (Long Run Seep Nature Preserve, Romeoville Prairie Nature Preserve, Keepataw For-est Preserve, Black Partridge Woods Forest Preserve, Waterfall Glen Forest Preserve, and McMahon Fen Nature Preserve) will be discussed in lesser detail because they (1) are outside of the areas likely to be affected by pumping at the Quarry, (2) have been subjected to less investigation and have less data, and (3) contain smaller HED populations.
Assessment of Water Resources in the Quarry Area
The Quarry is located on Route 53 near Romeoville, Ill. (fig. 1) and consists of several parcels. The West Quarry and the West Quarry Expansion Area are located west of Illinois Route 53 and total about 269 acres. The Middle Quarry is located on the southern part of the property between Route 53 and the Des Plaines River and is about 80 acres in size. The East Quarry is located between the CSSC and the Des Plaines River and is about 219 acres. The Middle Parcel Expansion Area is 125 acres and is located north of the Middle Quarry. The River South Parcel is 66 acres and is located between the Des Plaines River and a north-south trending railroad line that is present east of the bluffs defining the western edge of the Des Plaines River Valley.
Mining began in 1973 at the East Quarry, in 1993 at the Middle Quarry, and in 1994 at the West Quarry. Silurian dolo-mite has been mined to an elevation of approximately 475 ft NAVD 88 at the West Quarry; 475 ft (northern two-thirds) to 525 ft (southern one-third) at the Middle Quarry; and 475 ft (northern), 497 ft (south-central) and 505 ft (southern) at the East Quarry as of 2016 (STS/AECOM, 2008a, 2009). The draft mining plan that is expected to govern future operations calls for mining the West Quarry Expansion Area, followed by parts of the Middle Quarry and the Middle Parcel Expan-sion Area once mining in the West Quarry Expansion Area has been completed. The parcels will be mined to an elevation of about 475 ft to the boundaries shown in figure 1. Once mining of the West Quarry is completed, a culvert connecting the West Quarry to the Middle Quarry will be blocked, dewatering at the West Quarry will stop, and the West Quarry will fill with water.
TopographyThe Middle Parcel Expansion Area is located between
topographic uplands near Route 53 to the west and the Des Plaines River to the east (figs. 4, 12). A narrow berm is pres-ent in the western part of the property. The elevation of the land surface in most of the Middle Parcel Expansion Area is between about 580 and 590 ft, increasing to more than 600 ft along the berm and bluffs to the west.
BiologyThe HED has historically documented larval use at
the Middle Parcel Expansion Area (fig. 2; Cashatt and oth-ers, 1993). Larval use has not been documented since 1996 (Mierzwa, 2013a,b) and successful recruitment of larvae to breeding adults is considered unlikely since at least the 2005 drought due to a lack of sustained wet conditions. This lack of sustained wet conditions is related to the effects of quarry operations on the hydrology at the Middle Parcel Expansion Area, particularly during the summer months when surface water is needed for egg deposition and hydration.
Ongoing use of the property by HED adults has been documented for foraging and transit (Mierzwa, 2009, 2013a,b; Mierzwa and Webb, 2012b). The total HED population at the Middle Parcel Expansion Area typically was estimated to be less than 5 individuals for most of 1994–2013. Peak popula-tions of 51 and 36 individuals were observed in 1999 and 2000, respectively. The current (2018) adult and former larval HED habitat at the Middle Parcel Expansion Area is in a topo-graphically flat, wetland area east of the bluff and adjacent to a drainage system that traverses the parcel (fig. 12).
HydrogeologyThe geologic deposits at the Quarry that are of concern
to this investigation consist of the Silurian dolomite and the overlying glacial and alluvial deposits. The Silurian dolomite deposits constitute the Silurian aquifer. Sand and gravel depos-its of the Henry Formation overlie the bedrock in most of the Quarry area west of Route 53 (fig. 8). Alluvial deposits are present east of Route 53 at the Middle Parcel Expansion Area and in the river valley and constitute the alluvial aquifer.
Alluvial Aquifer
The thickness of the unconsolidated deposits at the Quarry generally increases from east to west. Unconsolidated deposits typically are 1–2 ft thick near the Des Plaines River, 2–5 ft thick in the eastern part of the Middle Parcel Expan-sion Area, 8–12 ft thick in the eastern part of the West Quarry, and 15–23 ft thick in the western part of the West Quarry. Hydric soils, but not histosols (organic-rich soil), are present in much of the Middle Parcel Expansion Area (Hanson Mate-rial Service Corporation, 2016). Hydric soils are permanently or seasonally saturated by water, resulting in anaerobic (low

24 Areas that Affect the Habitat of the Endangered Hine’s Emerald Dragonfly in the Lower Des Plaines River Valley, Illinois
606 614
612
616
604
608
616602
590
590
590
586 584
586
584
598
588
586
592
598
590
582
580
582
582
285
588
582
592
<580.1
MP-2S579.24565.91569.89574.13
MP-2D579.19565.82571.90575.01
MP-3D576.42543.25561.51553.28
MP-S1584.70
<583.70–– MP-S2
579.80<577.4
––
MP-1S579.59572.92576.55578.86
MP-1D581.48573.72577.59579.40
MP-W1583.4
<580.1––
MP-W2581.5
––
MP-2S579.24565.91569.89574.13
MP-2D579.19565.82571.90575.01
MP-3D576.42543.25561.51553.28
––
––
MP-1S579.59572.92576.55578.86
MP-1D581.48573.72577.59579.40
MP-W1583.4
<580.1––
MP-W2581.5
––
<580.1
MP-S1584.70
<583.70
MP-S2579.80<577.4TAYLOR ROAD
ROUTE 53West
Quarry
MiddleQuarry
MIDDLE PARCELEXPANSION AREA
Northern
drainage
Southern drainage
MIDDLE PARCELEXPANSION AREA
MiddleQuarry
WestQuarry
TAYLOR ROAD
ROUTE 53
88°04'20"88°04'30"88°04'40"88°04'50"
41°37'40"
41°37'30"
41°37'20"
0 0.1 MILE
0 0.1 KILOMETER
Orthography from the U.S. Department of Agriculture Farm Service AgencyAerial Photography Field Office 2012 National Agriculture Imagery Program (NAIP) Natural Color Imagery for Illinois
EXPLANATIONParcel boundary
Fill area
Wetland area
Drainage
MP-1D581.48573.72577.59579.40
582
MP-S1584.70
<583.70
Streamgage location and name with: High water level Low water level
Well location and name with: High water level Low water level July 19, 2012, water level November 26, 2012, water level
Note: Water level datum is North American Vertical Datum of 1988
Line of equal elevation— Contour interval is 2 feet. Datum is North American Vertical Datum of 1988
Figure 12. Location of selected features and water-level data at the Middle Parcel Expansion Area, Will County, Illinois.

Assessment of Conditions that Affect the Water Resources at Selected Hine’s Emerald Dragonfly Habitats 25
oxygen) conditions, as found in wetlands. Horizontal hydrau-lic conductivity values for the alluvial aquifer at the Quarry range from about 0.9 to 100 feet per day (ft/d; STS/AECOM, 2009).
Water levels at wells MP-W1 (fig. 13) and MP-W2, which are open to the alluvial aquifer at the wetland, indicated seasonal variations that are likely in response to seasonal variations in precipitation and evapotranspiration (Applied Ecological Services, 2012, 2013). The alluvial aquifer at these wells (and the nearby wetland) appears to have been unsaturated during the late spring through fall (June–Sep-tember 2006, June–December 2007, July–December 2008, June–October 2009, June–December 2010, and June to at least October 2011) and at least partly saturated during late fall through early spring. Water levels increased, typically by less than 1 ft, in response to precipitation events. Response to precipitation events typically was observed during the fall and spring when baseline water levels were higher but was only occasionally detected during the summer when water levels typically were below the sensor.
Silurian Aquifer
The Silurian deposits in the vicinity of the Quarry consist of dolomites of the Wilhelmi, Elwood, Kankakee, Joliet, Sugar Run, and Racine Formations (fig. 5, 6). The Racine, Sugar Run, Joliet, Kankakee, and upper part of the Elwood Formations are mined at the Quarry, but not the more argilla-ceous deposits of the lower Elwood and Wilhelmi Formations (AECOM, 2012). Secondary-permeability features are most prevalent in the weathered, upper 40 ft of the bedrock. These features become less prevalent with depth, but they were pres-ent at depths of at least 135 ft (elevation about 450 ft NAVD 88) in cores drilled at the Quarry.
The Silurian dolomite constitutes the Silurian aquifer. Horizontal hydraulic conductivity values for the aquifer at the Quarry range from 1.7 × 10⁻⁴ to 2.8 × 10⁻¹ ft/d (STS/AECOM, 2009; AECOM, 2013a) and tend to decrease with depth (AECOM, 2012), indicating the uppermost part of the aquifer tends to transmit more water than the lower part. Two separate long-term, constant-discharge aquifer tests performed at the West Quarry yielded calculated transmissivities of 55 and 1.2 × 10⁻² feet squared per day (ft2/d) and a storage coefficient of about 4.0 × 10⁻⁵ (STS/AECOM, 2009; AECOM, 2013a). These tests indicate low permeability for the Silurian aquifer in the vicinity of the West Quarry and few substantial, intercon-nected secondary-permeability features in the aquifer within the tested area (above 475 ft NAVD 88). The presence of high-capacity wells CV#1, CV#2, CV#3, and CV#4 south of the Quarry (all of these wells are shown in figure 10 but water level was not measured in well CV#4), which are open to the Silurian aquifer below 475 ft, indicates that highly conductive secondary-permeability features may be present in the aquifer below 475 ft.
Water levels in the Silurian aquifer at the West Quarry were approximately 610 ft NAVD 88 prior to mining (STS/
AECOM, 2009) and were likely about 575 ft near the East Quarry prior to mining. Because the bottoms of these quar-ries are dry at a minimum elevation of about 475 ft, pumping associated with quarry dewatering has reduced the water level in the Silurian aquifer by about 135 ft near the West Quarry and by about 100 ft near the East Quarry.
Periodic measurements (taken at no set interval and typically taken manually) of water levels in wells open to the Silurian aquifer at the Middle Parcel Expansion Area (MP-1S,D; MP-2S,D; MP-3D) from September 2005 through August 2008 and in July and November 2012 indicated a decrease in water levels from north to south, toward a cone of depression associated with dewatering of the Quarry (figs. 9, 10; STS/AECOM, 2008b, 2009). Note that use of the conven-tion MP-1S,D or similar designations (MW-7A, B, C, D) in this report refers to clustered wells MP-1S and MP-1D, with “S” or “A” designating the shallowest well in the cluster and “D” designating the deepest. The direction of groundwater flow in the Silurian aquifer in the vicinity of the Quarry is toward the quarries and represents a diversion of the natural flow in the Silurian aquifer, which was to the wetlands and the Des Plaines River. The cone of depression appears to extend at least 1,000 ft into the southern part of the Middle Parcel Expansion Area and to the south of the West Quarry.
Water levels within the Silurian aquifer at the Middle Parcel Expansion Area are increasingly variable from north to south, with the difference between the measured high and low value ranging from about 7 ft at the MP-1S,D well cluster to more than 30 ft at well MP-3D (fig. 12; STS/AECOM, 2008b, 2009). This variation in water levels is attributed primarily to proximity to dewatering at the Middle Quarry and West Quarry. Comparison of water levels in the wells open to the Silurian aquifer at the Middle Parcel Expansion Area (fig. 12) with the elevation of the top of the dolomite at wells MP-1S,D (top of dolomite about 581 ft), wells MP-2S,D (top of dolo-mite 575 ft), and MP-3D (top of dolomite about 575 ft) indi-cates that water levels are occasionally to typically below the top of the Silurian aquifer. These data, and especially the low water level at well MP-3D, indicate that the Silurian aquifer does not discharge to the glacial drift aquifer or surface water during dry conditions. In addition, surface water and water in the glacial drift aquifer typically drains to the Silurian aquifer in at least part of the Middle Parcel Expansion Area, drying out the property.
Water levels in wells open to the Elwood Formation (elevation about 433–462 ft) at the southwest part of the West Quarry during July 2013 were less than 535 ft NAVD 88, whereas water levels in shallower wells tended to be above 550 ft (AECOM, 2013b). Low water levels in the Elwood Formation may indicate the deeper Silurian deposits function as part of the underlying confining unit (STS/AECOM, 2008a) and are diverting water in the deeper part of the Silurian aquifer to the underlying deposits. Alternatively, these deposits may be experiencing drawdown from pumping in wells CV#1, CV#2, CV#3, and CV#4 that is being transmitted through a deep fracture that is hypothesized to be below the base of the

26 Areas that Affect the Habitat of the Endangered Hine’s Emerald Dragonfly in the Lower Des Plaines River Valley, Illinois
Water level above North American Vertical Datum of 1988, in feet
Date
581.
0
581.
5
580.
0
580.
5
579.
0
579.
5
582.
0
2006
2007
2008
2009
2010
2011
Jan.Feb.Mar.Apr.May
JuneJulyAug.
Sept.Oct.Nov.Dec.
Apr.May
JuneJulyAug.
Sept.Oct.Nov.Dec.
Jan.Feb.Mar.Apr.May
JuneJulyAug.
Sept.Oct.Nov.Dec.Jan.Feb.Mar.Apr.May
JuneJulyAug.
Sept.Oct.Nov.Dec.Jan.Feb.Mar.Apr.May
JuneJulyAug.
Sept.Oct.
Jan.Feb.Mar.Apr.May
JuneJulyAug.
Sept.Oct.
Nov.Dec.
Sens
or e
leva
tion
= 58
0.13
feet
Grou
nd e
leva
tion
= 58
1.71
feet
Wat
er le
vel b
elow
bot
tom
of s
enso
r
Figu
re 1
3.
Hydr
ogra
ph fo
r wel
l MP-
W1,
Mid
dle
Parc
el E
xpan
sion
Are
a, W
ill C
ount
y, Il
linoi
s, A
pril
2006
thro
ugh
Octo
ber 2
011
(mod
ified
from
App
lied
Ecol
ogic
al
Serv
ices
, Inc
., 20
13).

Assessment of Conditions that Affect the Water Resources at Selected Hine’s Emerald Dragonfly Habitats 27
West Quarry (AECOM, 2013b), indicating limited vertical hydraulic connection within the Silurian aquifer in this area.
Water levels measured in wells open to the shallow part of the Silurian aquifer north of the Middle Parcel Expansion Area and east of Route 53 in September 2013 decreased from about 592 ft in the western part of the parcel to about 580 ft in the east (AECOM, 2013b). This pattern is generally consistent with the potentiometric surface for the Silurian aquifer shown in figures 9 and 10 and likely indicates the effects of the large change in surface topography along the bluffs on groundwater levels.
Surface WaterThe surface-water drainage system in the Middle Parcel
Expansion Area consists of a northern and southern drainage (fig. 12). The northern drainage receives water from the Route 53 right-of-way and perhaps west of Route 53. The southern drainage appears to have historically received water from a watershed located west of Route 53, which is now largely occupied by the West Quarry. Currently (2018), the southern drainage receives runoff from the Route 53 right-of-way. Both drainages flow down the bluff before diverting toward the wet-land in the center of the Middle Parcel Expansion Area. The drainages converge on the southeast side of the Middle Parcel Expansion Area and exit the parcel at streamgage MP-S2 (fig. 12).
Most of the Middle Parcel Expansion Area, including all portions with potential HED habitat, was described as being completely dry during HED surveys in the summer of 2009, even immediately after heavy rainfall (Mierzwa, 2009). Dry-ness throughout the Middle Parcel Expansion Area also was observed in the latter part of the summer of 2011 (Mierzwa and Webb, 2012c).
These observations were supported by continuous mea-surements of surface-water levels at streamgage MP-S1 from April 2006 through April 2009 and at streamgage MP-S2 from April 2006 through October 2011 (fig. 12; Applied Ecologi-cal Services, Inc., 2012, 2013). Streamgage MP-S1 monitors the northern surface-water drainage upstream of the wetland. Streamgage MP-S2 monitors the surface-water drainage as it exits the Middle Parcel Expansion Area.
Water was measured at streamgage MP-S1 from Sep-tember 2006 through April 2007, January through May 2008, and February through March 2009, but typically was below the sensor for the rest of the monitoring period. Increases in water level of typically less than 1 ft were observed for several days following precipitation events before returning to “baseline” levels. These data indicate that surface-water inputs to the upgradient part of the Middle Parcel Expansion Area (primarily surface-water runoff and precipitation) typi-cally are exceeded by losses (primarily evapotranspiration and discharge to groundwater) during the summer and fall, with inputs exceeding losses during the winter and spring.
Water was present at streamgage MP-S2 for most of the 2006–11 monitoring period, with the exception of August
2008, July–September 2009, and most of July–October 2010 and 2011. Baseline water levels were consistently lowest during the summer and highest during the winter and spring in response to annual cycles in snowmelt, precipitation, and evapotranspiration. Superimposed on these broad baseline trends were 1–3-ft increases in water level lasting several days that were associated with individual precipitation events. These data indicate the potential for surface-water flow from the Middle Parcel Expansion Area during most of the year, with dry conditions in the mid-summer through mid-fall.
Water UseThe Silurian aquifer is dewatered to keep water levels in
the Quarry below the elevation of the excavations. Water is pumped from West and East Quarries to the Middle Quarry. Water from the Middle Quarry then goes to the processing plant, where it is used to support Quarry operations. Water from the processing plant is partly recirculated back to the Middle Quarry, with excess water being discharged to the Des Plaines River (AECOM, 2010).
An estimated 3,180 gal/min of water derived from groundwater (precipitation being the other major source of water in the discharge following a precipitation event) is pumped from the Quarry (AECOM, 2010). This pumping rate comes out to a total of about 4.6 million gallons per day (Mgal/d). About 1,200 gal/min of this groundwater is ulti-mately discharged to the Des Plaines River. Of the 3,180 gal/min taken from groundwater, about 500 gal/min is pumped from the West Quarry, about 2,080 gal/min is pumped from the East Quarry, and about 600 gal/min is pumped from the Middle Quarry. The high groundwater input to the East Quarry is attributed to the need to remove large amounts of recharge from the Des Plaines River and CSSC to the Silurian aquifer at the East Quarry.
High-capacity pumping from the Silurian aquifer takes place south of the West Quarry at wells CV#1, CV#2, CV#3, and CV#4. The pumping rate and volume of discharge from these wells is not known. These wells supply 188 homes. Assuming per capita water use of about 80 gallons per day (gal/d; U.S. Geological Survey, 2016b) and an average house-hold population of 2.8 for Lockport (U.S. Census Bureau, 2017), these wells combine to pump about 42,100 gal/d. Although not inconsequential, withdrawals from these high-capacity wells are less than 1 percent of the withdrawals from the Quarry.
Effects of Quarry Dewatering and Pumping Mitigation
A groundwater flow model was developed by STS/AECOM in 2009 and used to assess the effects of ground-water withdrawals from the Silurian aquifer associated with the expansion of quarry operations at the West and Middle Quarries as well as assessing the effects of mitigation features

28 Areas that Affect the Habitat of the Endangered Hine’s Emerald Dragonfly in the Lower Des Plaines River Valley, Illinois
designed to offset the effects of these withdrawals. The 2009 groundwater flow model was substantially refined in response to peer-review comments (Daniel Feinstein and Douglas Yes-kis, U.S. Geological Survey, written commun., 2011) and the collection of additional data; therefore, this discussion focuses exclusively on simulations done with the 2012 and 2013 revisions of the model (AECOM, 2012, 2013a). The model uses MODFLOW (McDonald and Harbaugh, 1984; Harbaugh and McDonald, 1996a,b; Harbaugh and others, 2000) to run flow simulations and MODPATH (Pollock, 1998) to identify capture zones associated with pumping from the quarries and the groundwater recharge area for the Silurian aquifer to the Quarry, River South Parcel, and the Lockport Prairie Nature Preserve. The model grid has 261 rows, 277 columns, and 14 layers to encompass an area of 191 square miles (mi2). Cell dimensions range from 100 to 1,200 square feet (ft2). The model was calibrated to groundwater levels collected in the vicinity of the Quarry from 2004 through 2006 and to the rate of flow to the Quarry and the Des Plaines River. In the model the Silurian aquifer is assumed to function as an equivalent porous medium. Sensitivity, the evaluation of the degree to which changes in input parameters affect output values in the model, was analyzed.
A review of the 2009 groundwater flow model (Daniel Feinstein and Douglas Yeskis, U.S. Geological Survey, writ-ten commun., 2011) and review and verification of the 2012 and 2013 versions of the model was performed by the USGS and provided to USFWS (Daniel Feinstein and Andrew Leaf, U.S. Geological Survey, written commun., 2013, 2014). These reviews concluded that the 2013 version of the model was likely to adequately simulate large-scale aspects of the flow system, such as volumes of groundwater discharge to the wetlands; however, the review suggested that the model scale was too large to optimally simulate the local conditions in the Silurian aquifer that could potentially affect the performance of the mitigation features installed to offset the effects of the additional pumping in the West Quarry Expansion Area, par-ticularly when accounting for seasonal changes in conditions. Pilot-scale testing of the mitigation features and intensive groundwater monitoring were recommended to more accu-rately identify potential issues and to assess the effectiveness of the mitigation features. Modeling results as they pertain to the River South Parcel and the Lockport Prairie Nature Preserve will be discussed in the sections assessing conditions at those sites.
Groundwater modeling performed by AECOM (2012, 2013a) indicates that dewatering associated with the 2012 operations at the West Quarry produces a capture zone in the Silurian aquifer that encompasses most of the natural ground-water recharge area for the River South Parcel and is within about a quarter of a mile of the groundwater recharge area for the Lockport Prairie Nature Preserve (fig. 11). The overlap of the capture zone for the Quarry with the groundwater recharge area of the Silurian aquifer to the River South Parcel indicates that some of the groundwater that would flow to the River
South Parcel under natural conditions is being diverted to the West Quarry.
Model simulations indicate increased groundwater withdrawals from the Silurian aquifer associated with min-ing the West Quarry Expansion Area will expand the capture zone to the south and west of its 2012 location, further into the recharge area for the River South Parcel (fig. 11) and will induce about 1 ft of drawdown within the recharge area for the Lockport Prairie Nature Preserve. The effects of mining in the West Quarry will dissipate after mining operations cease and the West Quarry fills with water, which is projected to be complete approximately 14 years after mining of the West Quarry Expansion Area begins (AECOM, 2013a). Simula-tions of increased dewatering in support of mining the Middle Parcel Expansion Area and remnant areas of the East Quarry (most of this mining will be done after the West Quarry has filled with water) indicate the capture zone for the Middle and East Quarries will expand to the north and slightly to the west but will have no additional effect on hydraulic conditions at the River South Parcel or at the Romeoville Prairie Nature Preserve north of the quarry (fig. 10; AECOM, 2013a). The eastern extent of the capture zone for the quarries is modeled as corresponding to the East Quarry because of the presumed hydraulic effects of the groundwater divide in the Silurian aquifer beneath the CSSC (fig. 9).
Infiltration galleries will be installed prior to expansion of Quarry operations immediately west of the River South Parcel and an infiltration pond will be installed southwest of the inter-section of Renwick Road and Route 53 north of the Lockport Prairie Nature Preserve (fig. 1). These features are expected to add sufficient water to the Silurian aquifer to offset the volume of water diverted from the River South Parcel and the Lock-port Prairie Nature Preserve due to increased pumping from the West Quarry Expansion Area (AECOM, 2013a). Mitiga-tion efforts should be able to effectively replicate seasonal variations in groundwater discharge into the River South Parcel and Lockport Prairie Nature Preserve. Failure to do so may alter their suitability as HED habitat. As part of the effort to ensure mitigation is effective, and to verify the absence of impacts from operations at the West Quarry Expansion Area, surface-water and groundwater levels will be measured by the Quarry operators on an ongoing basis as described by Hanson Material Service Corporation (2016). These measure-ments will be analyzed to verify that water levels, adjusted for seasonal variation and background trends, are within histori-cal ranges. Adult and larvae HED populations also will be monitored on an ongoing basis. If water levels become too low or too high, the flow to the infiltration galleries or the level of the infiltration pond will be adjusted to optimize the HED habitat (Hanson Material Service Corporation, 2016). If declining water levels are identified in the Silurian aquifer at the Romeoville Prairie Nature Preserve, an infiltration pond will be installed north of the Middle Quarry to offset the drop in water level. Additional adaptive management strategies to offset pumping effects will be developed by the Quarry opera-tors, if necessary.

Assessment of Conditions that Affect the Water Resources at Selected Hine’s Emerald Dragonfly Habitats 29
Water QualityThe U.S. Environmental Protection Agency (EPA) has
established standards for the maximum concentration of a constituent in drinking water supplied by a public-water system as well as for aquatic life (U.S. Environmental Protec-tion Agency, 2015, 2016a,b). These standards are provided in table 3 as a means of assessing whether water samples collected from the HED habitats pose a threat to human health or aquatic life. The EPA criteria for total phosphorus in flow-ing water is 0.1 milligram per liter (mg/L) and is considered an applicable criteria for the surface water analyzed for this report.
In this report, concentrations reported as less than (<) a value indicate the analyte was not detected at the detection limit of the analysis. For example, arsenic (<0.01 mg/L) means that arsenic was not detected in the sample at a detection limit of 0.01 mg/L.
Surface-water samples were collected from the northern drainage in the wetland of the Middle Parcel Expansion Area during August 30, September 29, and November 20, 1995 (TAMS Consultants, Inc., 1995a) and analyzed for a variety of major ions, metals, and organic compounds. Alkalinity values ranged from 284 to 484 mg/L as calcium carbonate (CaCO3). Concentrations of iron (0.2–15 mg/L), phosphorus (<0.05–0.5 mg/L) and manganese (0.02–0.99 mg/L) exceeded regulatory criteria in at least one sample (table 3). Concentrations of the remaining analytes, including several metals, mercury, nitro-gen compounds, and pesticides were either not detected (often at a detection limit above regulatory criteria) or were detected at concentrations below regulatory criteria.
Groundwater samples collected in 1996 from six private wells assumed to be open to the Silurian aquifer along the perimeter of the West Quarry were analyzed (STS/AECOM, 2009). Calcium (68–120 mg/L) and magnesium (44–67 mg/L) were the cations present at highest concentrations. Alkalinity was measured at concentrations of 285–355 mg/L as CaCO3. At the near-neutral pH of these waters, alkalinity is likely to consist mostly of bicarbonate (HCO3
-), indicating that bicar-bonate was the anion present at highest concentration in the samples. Chloride concentrations ranged from 21 to 113 mg/L, which exceeds the probable concentration of chloride derived from natural sources (<20 mg/L) in near-surface deposits in the Chicago area (Kelly and Wilson, 2008). Nitrate concen-trations exceeded the maximum contaminant level (MCL) of 10 mg/L as nitrogen in one well (10.1 mg/L) northwest of the West Quarry. Analyses for pesticides, herbicides, volatile organic compounds, and polycyclic aromatic hydrocarbons detected only toluene (a component of gasoline) in two wells at concentrations of 16 and 24 micrograms per liter (µg/L), which is below the most stringent regulatory criteria (table 3).
Surface-water samples were collected from streamgages MP-S1 and MP-S2 and groundwater samples were collected from the alluvial aquifer at wells MP-W1 and MP-W2 during April, July, and October 2006 and 2007 at the Middle Parcel Expansion Area (fig. 12; Applied Ecological Services, Inc.,
2012). Calcium typically was the dominant cation in all water. Sulfate was the dominant anion in surface water (table 4). Bicarbonate was the dominant anion in groundwater based on the alkalinity values. Chloride concentrations were high-est during the April 2006 sampling event at each site, likely reflecting the presence of runoff affected by road salt.
Water quality in the Quarry area (excepting the 2006 and 2007 samples from streamgages MP-S1 and MP-S2) is domi-nated by calcium, magnesium, and bicarbonate, which reflects the interaction with dolomite for much of this water. Concen-trations of major ions (calcium, magnesium, sodium, chloride, sulfate, and bicarbonate) in surface water at streamgages MP-S1 and MP-S2 typically were higher than in groundwater from the alluvial aquifer during 2006 and 2007, indicating some hydraulic separation between these water bodies. At least one sample of surface water or groundwater exceeded regulatory criteria for chloride, iron, phosphorus, and ammo-nia (assuming all of the total Kjeldahl nitrogen is ammonia). The data also indicate that leaking septic systems may yield elevated concentrations of nitrate; leaking gasoline storage tanks may yield detectable concentrations of toluene; and the application of road salts produces elevated concentrations of chloride, especially during spring.
Assessment of Water Resources at the River South Parcel
The River South Parcel is located south of the Quarry, west of the Des Plaines River, east of Route 53, north of Route 7, and south of about Airport Road in Romeoville, Ill. (figs. 1, 14). The 110.1-acre parcel is about 1 mi long; a maxi-mum of 1,000 ft wide; and includes extensive sedge meadow, marsh, and scattered flood-plain forest communities. Smaller areas of dolomite prairie, pond, successional field, and shrub thicket also are present. There is no water use by humans at the River South Parcel.
TopographySurface topography at the River South Parcel ranges
from about 577 ft NAVD 88 in the northern part of the parcel to about 570 ft in the southern edge and increases from about 574 ft NAVD 88 near the Des Plaines River to about 578–584 ft at the base of the bluff in the western part of the parcel (figs. 4, 14). The berm for the railroad track near the western edge of the River South Parcel and the road bank in the center of the parcel are approximately 1–3 ft above the sur-rounding land surface. Land-surface elevation at the top of the bluff (west of the area showing topography in fig. 14) is about 605 ft at the RP-1 well cluster.
BiologyThere is documented larval use of HED along sev-
eral rivulets in the River South Parcel, with the greatest

30 Areas that Affect the Habitat of the Endangered Hine’s Emerald Dragonfly in the Lower Des Plaines River Valley, Illinois
Table 3. Selected water-quality criteria (U.S. Environmental Protection Agency, 2015, 2016a,b).
[EPA, U.S. Environmental Protection Agency; MCL, maximum contaminant level; mg/L, milligram per liter; µg/L, microgram per liter]
Constituent and units EPA MCLEPA aquatic life acute threshold
EPA aquatic life chronic threshold
Aluminum (µg/L) None 750 87Ammonia as nitrogen (mg/L) None 17a 1.9a
Arsenic (µg/L) 10 340 150Barium (µg/L) 2,000 2,000 220Boron (µg/L) None 34,000 7,200Cadmium (µg/L) 5 1.8 0.72Chloride (mg/L) None 860 230Chromium (total) (µg/L) 100 570 74Cobalt (µg/L) None None None.Copper (µg/L) 1,300 13 9Dissolved oxygen (mg/L) None 3.0 None.Fecal coliform (colonies per 100 milliliters) 0 (goal) None None.Fluoride (mg/L) 4 1,400 None.Iron (mg/L) None None 1Lead (µg/L) 0 goal 65 2.5Lithium (µg/L) None 910Manganese (µg/L) None 1,680 93Mercury (µg/L) 2 1.4 0.77Nickel (µg/L) None 470 52Nitrate and nitrite, as nitrogen (mg/L) 10 None None.Phosphorus (mg/L) None None 1 (elemental)Potassium (mg/L) None None 53Strontium (µg/L) None 48,000 5,300Suspended solids (mg/L) None Calculated Calculated.Zinc (µg/L) None 120 120Alachlor (µg/L) 2 None None.Atrazine (µg/L) 3 330 12Cyanazine (µg/L) None 2,420 270Metolachlor (µg/L) None 110 15Simazine (µg/L) 4 80 9Toluene (µg/L) 1,000 560 62Benzene (µg/L) 5 700 160
aAssumed pH is 7.0 and temperature is 20 degrees Celsius.
440

Assessment of Conditions that Affect the Water Resources at Selected Hine’s Emerald Dragonfly Habitats 31Ta
ble
4.
Conc
entra
tion
of m
ajor
ions
, nut
rient
s, a
nd m
etal
s in
sur
face
wat
er a
nd g
roun
dwat
er a
t the
Qua
rry
Mid
dle
Parc
el, W
ill C
ount
y, Il
linoi
s, A
pril
2006
thro
ugh
Octo
ber 2
007
(from
App
lied
Ecol
ogic
al S
ervi
ces,
Inc.
, 201
2).
[mg/
L, m
illig
ram
per
lite
r; C
aCO
3, ca
lciu
m c
arbo
nate
; <, l
ess t
han;
--, n
o sa
mpl
e; b
old
deno
tes e
xcee
danc
e of
regu
lato
ry c
riter
ia]
Dat
e A
lkal
inity
, in
mg/
L as
Ca
CO3
Sulfa
te,
in m
g/L
Chlo
ride
, in
mg/
LCa
lciu
m,
in m
g/L
Mag
nesi
um,
in m
g/L
Sodi
um,
in m
g/L
Iron
, in
mg/
L
Nitr
ate
as
nitr
ogen
, in
mg/
L
Phos
phor
ous,
in
mg/
L
Tota
l Kje
ldah
l ni
trog
en,
in m
g/L
Stre
amga
ge M
P-S1
(loc
atio
n sh
own
in fi
g. 1
2)
04/1
8/06
232
<542
024
268
178
<0.0
112
<0.0
21.
09
07/1
9/06
226
830
160
279
7972
0.62
<0.0
50.
024
0.40
10/1
9/06
256
470
180
201
6614
8<0
.11
0.55
<0.0
2<0
.12
04/3
0/07
146
380
280
181
6416
00.
015
0.73
<0.0
20.
7307
/25/
07--
----
----
----
----
--10
/24/
07--
----
----
----
----
--St
ream
gage
MP-
S2 (l
ocat
ion
show
n in
fig.
12)
04/1
8/06
203
<528
035
785
800.
060.
23<0
.02
0.78
07/1
9/06
----
----
----
----
----
10/1
9/06
236
410
9718
657
620.
340.
13<0
.02
<0.1
204
/30/
0712
846
099
280
5661
0.19
0.15
<0.0
22.
807
/25/
0730
324
016
015
760
511.
60.
780.
021.
410
/24/
0735
637
022
032
180
800.
610.
53<0
.02
<0.0
2W
ell M
P-W
1 (lo
catio
n sh
own
in fi
g. 1
2)
04/1
8/06
221
130
6715
967
373.
333.
50.
15--
07/1
9/06
----
----
----
----
----
10/1
9/06
254
100
3014
860
290.
61<0
.05
<0.0
2<0
.12
04/3
0/07
129
100
3686
3222
0.24
0.16
<0.0
21.
407
/25/
07--
----
----
----
----
--10
/24/
07--
----
----
----
----
--W
ell M
P-W
2 (lo
catio
n sh
own
in fi
g. 1
2)
04/1
8/06
244
113
8577
2937
0.44
0.12
0.05
--07
/19/
06--
----
----
----
----
--10
/19/
0623
682
2483
3124
1.1
<0.0
5<0
.02
<0.0
204
/30/
0716
731
1977
2522
1.0
0.24
0.41
2.6
07/2
5/07
----
----
----
----
----
10/2
4/07
----
----
----
----
----

32 Areas that Affect the Habitat of the Endangered Hine’s Emerald Dragonfly in the Lower Des Plaines River Valley, Illinois
Des Plaines R
iver
Chi
cago
San
itary
and
Shi
p C
anal
ILLI
NOI
S RO
UTE
53
AIRPORT ROAD
RAIL
ROAD
TRA
CK
Des Plaines R
iver
Chi
cago
San
itary
and
Shi
p C
anal
578
578 57
6
574
87558
2
576
574
584
596
574
572 57
0
578
580
580
11
22AA
33
44
55
66
RP-2S577.15574.34574.92576.42
WL1
WL2
RP-2D577.26543.99575.27576.50
RP-1D588.03578.40581.06580.59
RP-1S585.22580.52581.53581.30
RS-S1577.60<574.28--
RS-S2573.50<568.53--
RS-W1>573.92<572.34--
RS-W2573.91<568.37--
RP-2S577.15574.34574.92576.42
RS-S1577.60<574.28--
WL1
WL2
RS-S2573.50<568.53--
RS-W1>573.92<572.34--
RS-W2573.91<568.37--
RP-2D577.26543.99575.27576.50
RP-1D588.03578.40581.06580.59
RP-1S585.22580.52581.53581.30
88°03'50"88°04'88°04'10"88°04'20"88°04'30"88°04'40"88°04'50"
41°36'40"
41°36'50"
41°36'30"
41°36'20"
41°36'10"
41°36'
RP-2D577.26543.99575.27–
EXPLANATIONParcel boundary
Wetland area
Rivulet
Road bank
Seep and identifier
Culvert with identifier
Streamgage location and name with: High water level Low water level July 19, 2012, water level November 26, 2012, water level
578 Line of equal elevation— Contour interval is 2 feet. Datum is North American Vertical Datum of 1988
Well location and name with: High water level Low water level July 19, 2012, water level November 26, 2012, water level
Note: Water level datum is North American Vertical Datum of 1988
RS-S1577.60<574.28--
RS-S1577.60<574.28--
11AA
Orthography from Esri World Imagery for Chicago, 2011Map image is the intellectual property of Esri and is used herein under license. Copyright © 2017 Esri and its licensors. All rights reserved.
0
0
0.1
0.1
0.2
0.2
0.3 MILE
0.3 KILOMETER
Figure 14. Location of selected features and water-level data at the River South Parcel, Will County, Illinois.

Assessment of Conditions that Affect the Water Resources at Selected Hine’s Emerald Dragonfly Habitats 33
populations at the rivulets south of the road (figs. 2, 14; Soluk, 2006). Larvae were absent at the rivulet near wells RS-W1 and RS-W2. Adult HED use has been documented near the rivulets peripheral to the wetland south of the road and near culvert 1 at the northern edge of the River South Parcel (Mierzwa, 2007, 2009; Mierzwa and Webb, 2012a,c). Adult HED activi-ties at the River South Parcel consist of perching, feeding, territorial patrols, and breeding (Cashatt and Vogt, 1996). The total number of adult HED at the River South Parcel typically was estimated to be in the 100–310 range from 1995 to 2002 but has been less than 75 since 2002 and was 36, 13, 71, and 71 in 2009, 2010, 2011, and 2012, respectively (Mierzwa, 2009; Mierzwa and Webb, 2012a,c). The reduction in popula-tion appears to be at least partly due to the effects of the 2005 drought. The River South Parcel contains the second most productive breeding habitat in Illinois, housing approximately 40 percent of the larval HED population and 34 percent of the adult HED population in the Lower Des Plaines River Valley (Soluk and Mierzwa 2012).
HydrogeologyThe geologic deposits of concern at the River South Par-
cel consist of the Silurian dolomite and the overlying uncon-solidated deposits. The Silurian dolomite deposits constitute the Silurian aquifer. Alluvial deposits in the river valley consti-tute the alluvial aquifer where saturated.
Alluvial Aquifer
Alluvial deposits consist mostly of sand and silt, are less than 4 ft thick at the River South Parcel, and are capped by hydric soils in wetland areas. Continuous measurements of groundwater levels at wells RS-W1 and RS-W2 were collected from April 2006 through December 2012 and from April 2006 through October 2009, respectively (Applied Ecologi-cal Services, Inc., 2012, 2013). These wells are located in the southern part of the wetland south of the road bank (fig. 14) and are open to the alluvial aquifer. Water levels in well RS-W1 indicated seasonal trends that were typically within about 0.5 ft of land surface (land-surface elevation 573.9 ft) during the winter and spring and below the sensor (elevation less than 572.3 ft) during parts of the summer and early fall, with the longest dry period occurring during the drought of 2012. Water levels in well RS-W1 frequently rose and fell by as much as 2.5 ft following precipitation (and Des Plaines River flood) events, occasionally exceeding the elevation of the land surface. Water levels in well RS-W2 typically were within 1 ft of land surface (land-surface elevation 570.9 ft) from April 2006 through September 2007. Water levels in the well typically were below the sensor (568.4 ft) during a period of low precipitation from October 2007 through September 2008, rose to land surface by April 2009, and were above land surface for most of April through October 2009. Water levels frequently rose and fell by as much as 4 ft for several days following precipitation events, often exceeding land surface.
Water-level increases of this magnitude and water levels above land surface likely are related to flooding of the Des Plaines River. The 2012 drought lowered water levels in the alluvial aquifer by about 1.7 ft, further indicating that extreme events can result in small, but important, changes in the hydrology of the River South Parcel.
Water levels in the alluvial aquifer in the southern part of the River South Parcel varied seasonally in response to precipitation, recharge, and evapotranspiration. Longer-term trends in response to drought also were observed. Large, short-term increases in water level indicate hydraulic interaction with the Des Plaines River during flooding in the southern part of the River South Parcel, which may explain the absence of HED larvae in this area.
Silurian Aquifer
The Silurian aquifer at the River South Parcel has a hori-zontal hydraulic conductivity ranging from 1.1 × 10⁻² to 4.2 × 101 ft/d, with the geometric mean for the shallow part of the aquifer (elevation greater than 560 ft NAVD 88) being 9.8 × 10⁻¹ ft/d and the value for the deep part (elevation about 480–530 ft) being 6.8 × 10⁻² ft/d (STS/AECOM, 2009; AECOM, 2013b). These values indicate the shallow, more weathered part of the Silurian aquifer has moderate aquifer permeability and will transmit more water than the deeper, less permeable part of the aquifer. About 5 ft of dolomite deposits are exposed along the bluff in the western part of the River South Parcel (AECOM, 2015a).
Measurements of groundwater levels in the Silurian aquifer from September 2005 through June 2015 indicate groundwater flow in the River South Parcel is from west to east, toward the Des Plaines River, possibly with intermittent components of flow north toward the Middle Quarry (STS/AECOM, 2009; AECOM, 2013b). Water levels in the Silurian aquifer in the upland area west of the bluff varied from about 580 to 592 ft NAVD 88 at well RP-1S and about 578 to 592 ft at well RP-1D (figs. 14, 15). Water levels in these wells show changes of about 10 ft in response to precipitation events (AECOM, 2013a, 2015a). Water levels showed substantially less variation at the RP-2S,D well cluster in the Des Plaines River Valley, with water levels typically about 575–577 ft. Water levels at wells RP-2S and RP-2D showed less variation than water levels in the alluvial aquifer and the Des Plaines River. These data, combined with upward hydraulic gradients at the well cluster, indicate stable discharge from the Silurian aquifer to the wetlands.
Water levels at the RP-2S,D well cluster typically were above the elevation of the top of the Silurian dolomite (about 575.2 ft), indicating the potential for the Silurian aquifer to discharge to the overlying alluvial aquifer and at least some of the wetlands in the valley. Water levels in wells RP-2S and RP-2D were about 2–3 ft lower than typical during the droughts of 2005 and 2012 and showed 1–2-ft drops during the summers of 2008, 2009, and 2013. Water levels were at or below the top of the Silurian aquifer during the droughts

34 Areas that Affect the Habitat of the Endangered Hine’s Emerald Dragonfly in the Lower Des Plaines River Valley, Illinois
570
575
580
585
590
595
Wat
er le
vel a
bove
Nor
th A
mer
ican
Ver
tical
Dat
um o
f 198
8, in
feet
2007 2008 20092005 2006 2010 2011 2012 2013 2014 2015
Date
EXPLANATIONRP-1DRP-1SRP-2DRP-2S
Figure 15. Water levels in wells RP-1S,D and RP-2S,D at the River South Parcel, Will County, Illinois, 2005 through 2015.
of 2005 and 2012 and the summer of 2013, indicating the absence of discharge from the Silurian aquifer to the alluvial aquifer and wetlands in at least part of the valley at the River South Parcel during these times.
Water levels at the RP-1S,D well cluster indicate that flow within the Silurian aquifer at the bluffs is upward toward the seeps during typical conditions (fig. 15). Water levels indicate the potential for flow in the Silurian aquifer from the bluffs to the wetlands in the river valley during drier condi-tions when seep flow is minimal (AECOM, 2013a).
Water-level data indicate that precipitation rapidly recharges the Silurian aquifer and discharges to the seeps in the bluff area. Flow conditions in the aquifer in the valley area are more stable, but small reductions in water level in the val-ley are associated with drought conditions that are harmful to the HED.
Surface Water
Surface-water flow at the River South Parcel begins as discharge (average of about 7,700 cubic feet per day [ft3/d]) from several seeps emanating from the dolomite deposits exposed along the bluffs in the western part of the River South Parcel (fig. 14; Christopher B. Burke Engineering, Ltd., 1997; AECOM, 2013a, 2015a). There are too few measurements to
establish a stage-discharge relationship and the discharge rate at the individual seeps has not been quantified; however, the discharge rate from the seeps increases as groundwater levels at the bluff increase (AECOM, 2015a). Water from the seeps pools west of the railroad bed and enters the eastern part of the River South Parcel by way of culverts, at least three of which discharge directly to rivulets that flow to the wetlands north and south of the road bank (fig. 14). Measurements of discharge in the rivulet emanating from culvert 5 during August, September, and November 1995 were 4,750; 4,320; and 6,912 ft3/d, respectively (TAMS Consultants, Inc., 1995b). Discharge was not detected in the rivulet emanating from culvert 4 during the September measurement. Pooling water behind the berms and diversion of water to the culverts rep-resent a disruption from the natural surface-water hydrology of this area, adding water to some areas and diverting it from others. The effect of this diversion on the HED is unknown but may have detrimental effects not only in areas where water loss has dried the habitat, but also in areas (such as down-stream of culverts) where the concentration of surface flow has increased water inputs, stream velocity, and erosion.
The wetland north of the road bank contains a small area of open water that has a maximum depth of 1–2 ft (STS/AECOM, 2009). The wetland south of the road bank has no open water and typically has a depth of less than 1 ft. These areas are surrounded by shallower, more discontinuous

Assessment of Conditions that Affect the Water Resources at Selected Hine’s Emerald Dragonfly Habitats 35
wetlands. Water flows through rivulets from the wetlands to the Des Plaines River.
Water levels in the deepest part of the wetland north of the road bank were continuously monitored at streamgage WL2 (fig. 14) from October 2005 through March 2007 and from December 2007 through July 2008 (STS/AECOM, 2009). Water levels rose from about 573.2 ft NAVD 88 dur-ing late October 2005 to about 575.8 ft by March 2006 and remained at that approximate level for the remainder of the monitoring period. This trend in water levels is attributed to the effects of increased precipitation following the end of the 2005 drought.
Water levels at the wetland south of the road bank were continuously monitored at streamgage WL1 from March 2006 through February 2007 (STS/AECOM, 2009). The stage at streamgage WL1 was consistently about 574.5 ft NAVD 88 with only minor deviations. Water levels typically showed less than 1 ft increases associated with individual precipitation events but may have begun to increase by several inches near the end of the monitoring period in response to precipitation or snowmelt events.
Water levels were continuously monitored at streamgage RS-S1 for most of the period from April 2006 through November 2012 (Applied Ecological Services, Inc., 2012, 2013). Streamgage RS-S1 is located at a culvert and monitors a ponded area between the bluffs and the railroad tracks in the southern part of the River South Parcel (fig. 14). This area received water from seeps, producing baseline water levels of about 576 ft NAVD 88 that typically varied seasonally by less than about 0.5 ft. Superimposed on these baseline levels were short-term (few days) increases of as much as 1.5 ft associated with overland runoff of precipitation from the watershed west of the River South Parcel (STS/AECOM, 2009). Water levels at the streamgage typically were above the elevation of the base of the culvert, indicating that there was flow to the wet-lands. Water levels decreased by about 1.7 ft (elevation about 574.3 ft NAVD 88) and the culvert was dry during drought conditions in July and August 2012.
Water levels were continuously monitored at streamgage RS-S2 for most of the period from April 2006 through Novem-ber 2012 (Applied Ecological Services, Inc., 2012, 2013). Streamgage RS-S2 monitors a wetland area in the southern part of the River South Parcel adjacent to the Des Plaines River (fig. 14). Water was present at a base elevation of about 569 ft NAVD 88 for almost the entire monitoring period, indicating consistent discharge from the wetland south of the road bank to the river. Water level dropped below the eleva-tion of the sensor (568.5 ft) in response to the 2012 drought. Water levels at this streamgage frequently showed as much as 4 ft increases associated with precipitation events followed by a gradual (several days) decline to base level, indicating intermittent flow of water from the Des Plaines River to the wetland when the river stage is high.
Surface-water levels tended to show minimal varia-tion in those parts of the River South Parcel not near the Des Plaines River except during drought periods and following
precipitation events. These data indicate the monitored surface-water features at the River South Parcel have consis-tent amounts of inflow and outflow except during drought. Changes in water level during droughts were small on an abso-lute scale, less than 3 ft, but appear to have resulted in substan-tial drying of the HED habitat at the River South Parcel. The effects of at least some of the droughts appear to have resulted in a substantial reduction in the HED population (Soluk and Mierzwa, 2012).
Effects of Quarry Dewatering and Pumping Mitigation
The 2012 and 2013 versions of the groundwater flow model developed on behalf of the Quarry operators (AECOM, 2012, 2013b) were used to assess (1) the effects of the 2012 withdrawals from the Silurian aquifer associated with opera-tion of the West Quarry and the combined East and Middle Quarries, (2) the effects of future withdrawals associated with dewatering of the West Quarry and Middle Parcel Expansion Areas on the aquifer, and (3) the effects of the proposed infil-tration galleries at the River South Parcel.
The natural groundwater recharge area for the Silurian aquifer to the River South Parcel appears to have extended about 2 mi to the west-northwest of the parcel (fig. 11) based on water-level measurements collected by Roadcap and oth-ers (1993). Much of the natural groundwater recharge area is within the modeled 2012 capture zone for the pumping at the West Quarry and much of the River South Parcel itself is within the capture zone for the Middle and East Quarries.
Groundwater modeling indicates that additional pump-ing from the Silurian aquifer associated with dewatering of the West Quarry Expansion area will induce more than 1 ft of water-level decrease (drawdown) in the aquifer beneath the River South Parcel as well as in the River South Parcel groundwater recharge area (AECOM, 2013a). One foot of drawdown is at the lower range of decrease in water lev-els measured during the drought of 2005, which adversely affected the HED population. Additional pumping at the West Quarry Expansion Area will reduce the saturated thickness of the Silurian aquifer at the River South Parcel seeps and reduce the differential hydraulic pressure driving groundwater discharge from the aquifer to the wetlands in the Des Plaines River Valley.
Model simulations indicate that increased pumping associated with mining the West Quarry Expansion Area will expand the capture zone of the West Quarry to the southwest, diverting water that would have gone to the River South Parcel under 2012 conditions to the West Quarry (compare recharge area for River South Parcel with captures zones for West Quarry in figs. 11 and 16). Increased pumping will reduce the volume of groundwater discharge from the Silurian aquifer to the River South Parcel from about 4,200 ft3/d at the start of mining to about 3,000 ft3/d when mining is completed (AECOM, 2013b), a reduction of about 30 percent. The

36 Areas that Affect the Habitat of the Endangered Hine’s Emerald Dragonfly in the Lower Des Plaines River Valley, Illinois
WEB
ER R
OAD
EastQuarry
ROMEO ROAD
RENWICK ROAD
DIVISION STREET
AIRPORT ROAD
TAYLOR ROAD
daoR hgi H
Crest Hill
Illin
ois a
nd M
ichi
gan
Can
al
Long
Long
Run
Run
Creek
Seep
Long Run SeepNature Preserve
Lewis University
Airport
Com Ed and
Long Run
Parcels
Des
Pla
ines
Riv
er
Lockport
Middle Quarry
WestQuarry
River SouthParcel
Romeoville
Lockport PrairieNature Preserve
LOCKPORT LOCKAND DAM
Romeoville PrairieNature
Preserve
Middle ParcelExpansion Area 53
7
7
171
30
WestQuarry
ExpansionArea
College ViewSubdivision
College ViewSubdivision
Lockport Prairie Eastand Dellwood WestNature Preserves
Prairie BluffPreserve
41°39'
41°38'
41°37'
41°36'
41°35'
41°34'
41°33'
88°03'88°04'88°05'88°06'88°07'88°08'88°09'
Nature preserve
Existing quarry (2016)
Quarry expansion area
Parcel boundary
Recharge area
Modeled capture zone under 2012 conditions
West Quarry Middle and East Quarries
Modeled capture zone under build-out conditions
West Quarry Middle and East Quarries
EXPLANATION
0 1 2 MILES
0 1 2 KILOMETERS
Base from U.S. Geological Survey digital data, 1:100,000, 2001Albers Equal-Area Conic projection Standard parallels 33˚ N. and 45˚ N.Central meridian 89˚ W.North American Datum of 1927
Figure 16. Groundwater capture zones under 2012 and full build-out conditions (excluding mitigation features) at the West, East, and Middle Quarries and groundwater recharge area for the Silurian aquifer to the River South Parcel, Will County, Illinois.

Assessment of Conditions that Affect the Water Resources at Selected Hine’s Emerald Dragonfly Habitats 37
reduction in discharge within the River South Parcel is not apportioned between the northern and southern parts of the River South Parcel but is expected to be higher in the northern part of the parcel than in the southern (AECOM, 2012) due to proximity to the Quarry. These effects will dissipate after the West Quarry Expansion Area has been fully mined and fills with water.
To offset the loss of flow from the Silurian aquifer to the River South Parcel due to increased pumping at the West Quarry Expansion Area, a series of infiltration galleries will be installed on top of the bluffs immediately west of the parcel (AECOM, 2013a; Hanson Material Service Corporation, 2016). The infiltration galleries will use water from the Quarry to recharge the Silurian aquifer, thereby increasing flow to the seeps and the River South Parcel. The infiltration galler-ies will be operated until the West Quarry refills with water. Model simulations and pilot testing of the infiltration galleries (AECOM, 2015b) indicate the infiltration galleries will be capable of providing more than 6,400 ft3/d of recharge to the Silurian aquifer. This volume of water is expected to be suf-ficient to offset the reduction in groundwater discharge to the River South Parcel caused by dewatering of the West Quarry Expansion Area. Surface- and groundwater-level monitoring will be performed by the Quarry operators at a variety of loca-tions and at a variety of time scales (20 minutes to quarterly) to ensure that seasonally adjusted water levels in the vicinity of the River South Parcel remain within historical values. If water levels decline below trigger levels, operation of the infil-tration galleries will be adjusted to offset pumping effects.
Water Quality Several surface-water and groundwater sampling efforts
have been performed at the River South Parcel from 1994 through 2014 (TAMS Consultants Inc., 1995a,b; Christo-pher B. Burke Engineering, Ltd., 1997; STS/AECOM, 2009; Applied Ecological Services, Inc., 2012; AECOM, 2015b). These data indicate that calcium typically was the dominant cation and bicarbonate (measured as alkalinity) was the dominant anion in surface water and groundwater at the River South Parcel (table 5). Chloride concentrations typically were high enough to indicate the presence of effects from road salt application, particularly in surface water and particularly during the spring. The reduction in sulfate concentrations at well RS-W2 during the summer of 2006 and during 2007 may reflect the presence of sulfate-reducing conditions in the alluvial aquifer during that time.
The surface-water temperature was below air tempera-ture at the time of sampling (table 5), indicating that surface-water temperature may have been affected by the temperature of the groundwater source of this water. The pH ranged from 6.9 to 7.8. Nitrate concentrations in surface water in the southern part of the River South Parcel near culverts 5 and 6 often exceeded 3 mg/L. Concentrations of nitrate derived from natural sources are generally considered to be below 3 mg/L (Madison and Brunett, 1985) or less (Nolan and Hitt,
2003; Mueller and Helsel, 1996), indicating the potential effects of fertilizer application within the recharge area of the River South Parcel.
Concentrations of phosphorus, chloride, ammonia (as total Kjehldahl nitrogen), and iron exceeded regulatory crite-ria in at least one sample (table 5). Concentrations of several dissolved metals, polycyclic aromatic hydrocarbons, and pesticides were either not detected, or detected at concentra-tions below regulatory criteria.
Water samples also were collected from wells RP-8S-West, RP-10S, RP-8S-East, and RP-9S-South; the seep near culvert 2; and from the Middle Quarry during pilot testing of one of the proposed infiltration galleries on Novem-ber 10 and 14, 2014 (table 5). The wells are not shown on a map but are open to the Silurian aquifer at the bluffs west of the seep near culvert 2 (fig. 14; AECOM, 2015b). Major-ion chemistry of the quarry sample was similar to that of the Silurian aquifer at the wells. Because water from the quarry is likely to be the source of the water in the infiltration galleries, these data indicate that the water from the infiltration galleries will not substantially alter the chemistry of the water in the Silurian aquifer or the wetlands. To further assess the effects of the infiltration water on aquifer chemistry during the pilot testing, the water in the infiltration gallery was heated to about 30 oC. Continuous monitoring of water temperature in the Silurian aquifer at a well and a seep downgradient of the infiltration gallery were 13.1 and 12.5–13.7 oC, respec-tively (AECOM, 2015b). Temperatures showed no change that could be attributed to the presence of the heated water, indicating that ambient conditions in the aquifer will rapidly modify the temperature of the infiltration water to near that of the aquifer.
Assessment of Water Resources at the Lockport Prairie Nature Preserve
The Lockport Prairie Nature Preserve is a 222-acre tract located west of the Des Plaines River in Will County, Ill. (figs. 1, 17). The Lockport Prairie East Nature Preserve, located east of the CSSC, is not included in this discussion. The Lockport Prairie Nature Preserve is owned by the Forest Preserve District of Will County, as is the adjacent Prairie Bluff Preserve. The Prairie Bluff Preserve is used to help maintain the natural hydrology of the Lockport Prairie Nature Preserve.
Because of the important role groundwater plays on the ecology of the Lockport Prairie Nature Preserve, there has been concern over the effects of urbanization and groundwa-ter withdrawals in the vicinity of the Lockport Prairie Nature Preserve on its hydrology. Increased groundwater withdraw-als within and near the groundwater recharge area for the Lockport Prairie Nature Preserve may reduce the volume of groundwater discharge to the preserve by removing water from the Silurian aquifer that would otherwise flow to the preserve. Increased urbanization within the recharge area has

38 Areas that Affect the Habitat of the Endangered Hine’s Emerald Dragonfly in the Lower Des Plaines River Valley, IllinoisTa
ble
5.
Conc
entra
tion
of s
elec
ted
cons
titue
nts
in s
urfa
ce w
ater
and
gro
undw
ater
at t
he R
iver
Sou
th P
arce
l, W
ill C
ount
y, Il
linoi
s, S
epte
mbe
r 199
4 th
roug
h N
ovem
ber 2
014.
[mg/
L, m
illig
ram
per
lite
r; C
aCO
3, ca
lciu
m c
arbo
nate
; <, l
ess t
han;
--, n
o sa
mpl
e; b
old
deno
tes e
xcee
danc
e of
regu
lato
ry c
riter
ia]
Dat
e
Alk
alin
ity,
in m
g/L
as
CaCO
3
Tem
pera
ture
ai
r,
in d
egre
es
Cels
ius
Tem
pera
ture
w
ater
, in
deg
rees
Ce
lsiu
s
Calc
ium
ha
rdne
ss,
in m
g/L
as
CaCO
3
Mag
nesi
um
hard
ness
, in
mg/
L as
Ca
CO3
Dis
solv
ed
oxyg
en,
in m
g/L
pH,
in s
tand
ard
units
Nitr
ate
as
nitr
ogen
, in
mg/
L
Phos
phor
ous,
in
mg/
L
Am
mon
ia
nitr
ogen
, in
mg/
L
Rivu
let d
owns
tream
from
cul
vert
5 (lo
catio
n sh
own
in fi
g. 1
4; d
ata
from
TAM
S Co
nsul
tant
s, In
c., 1
995
a,b)
9/26
/94
368
1914
216
158
8.5
7.8
3.1
0.03
0.70
8/30
/95
364
3414
256
200
8.8
7.4
4.1
<0.0
50.
50
9/29
/95
356
2713
252
204
9.2
7.5
4.8
<0.0
20.
17
11/2
0/95
362
119
300
192
10.6
7.0
3.3
0.51
<0.0
5
Rivu
let d
owns
tream
from
cul
vert
6 (lo
catio
n sh
own
in fi
g. 1
4; d
ata
from
TAM
S Co
nsul
tant
s, In
c., 1
995a
)
9/26
/94
382
2014
162
156
8.7
7.7
8.6
0.02
50.
70
Rivu
let d
owns
tream
from
cul
vert
4 (lo
catio
n sh
own
in fi
g. 1
4; d
ata
from
TAM
S Co
nsul
tant
s, In
c., 1
995b
)
8/30
/95
488
3326
412
324
0.4
7.1
0.63
<0.0
50.
73
11/2
0/95
382
125
288
224
10.1
6.9
1.7
0.37
<0.0
5

Assessment of Conditions that Affect the Water Resources at Selected Hine’s Emerald Dragonfly Habitats 39Ta
ble
5.
Conc
entra
tion
of s
elec
ted
cons
titue
nts
in s
urfa
ce w
ater
and
gro
undw
ater
at t
he R
iver
Sou
th P
arce
l, W
ill C
ount
y, Il
linoi
s, S
epte
mbe
r 199
4 th
roug
h N
ovem
ber 2
014.
—Co
ntin
ued
[mg/
L, m
illig
ram
per
lite
r; C
aCO
3, ca
lciu
m c
arbo
nate
; <, l
ess t
han;
--, n
o sa
mpl
e; b
old
deno
tes e
xcee
danc
e of
regu
lato
ry c
riter
ia]
Dat
e A
lkal
inity
, in
mg/
L as
Ca
CO3
Sulfa
te,
in m
g/L
Chlo
ride
, in
mg/
LCa
lciu
m,
in m
g/L
Mag
nesi
um,
in m
g/L
Sodi
um,
in m
g/L
Iron
, in
mg/
L
Nitr
ate
as
nitr
ogen
, in
mg/
L
Phos
phor
ous,
in
mg/
L
Tota
l Kj
elda
hl
nitr
ogen
, in
mg/
L
Surfa
ce w
ater
at s
tream
gage
RS-
S1 (l
ocat
ion
show
n in
fig.
14;
dat
a fro
m A
pplie
d Ec
olog
ical
Ser
vice
s, In
c., 2
012)
4/19
/06
279
9721
087
4075
0.09
1.7
<0.0
21.
6
7/19
/06
233
7611
090
4164
0.07
1.3
0.02
2.1
10/1
9/06
249
5968
7532
450.
160.
780.
09<0
.60
5/02
/07
105
3893
5624
570.
090.
94<0
.02
3.0
7/25
/07
337
3891
5733
440.
392.
00.
042.
0
10/2
4/07
422
1910
010
848
543.
40.
640.
03<0
.60
Surfa
ce w
ater
at s
tream
gage
RS-
S2 (l
ocat
ion
show
n in
fig.
14;
dat
a fro
m A
pplie
d Ec
olog
ical
Ser
vice
s, In
c., 2
012)
4/18
/06
274
130
250
9445
920.
290.
91<0
.02
20
7/19
/06
233
8611
095
4758
0.14
2.0
0.13
7.8
10/1
9/06
257
5198
8841
670.
230.
57<0
.02
<0.6
0
5/02
/07
129
6816
078
3789
0.15
0.69
0.04
2.6
7/25
/07
351
4997
6440
430.
202.
0<0
.02
0.96
10/2
4/07
452
2414
012
257
620.
290.
50<0
.02
<0.6
0
Surfa
ce w
ater
at s
eep
A (lo
catio
n sh
own
in fi
g. 1
4; d
ata
from
AEC
OM, 2
015b
)
11/1
0/14
327
5317
910
150
84--
----
--
11/1
4/14
353
5617
196
4876
----
----
11/1
0/14
251
109
121
7254
58<0
.34
----
--
Allu
vial
dep
osits
at w
ell R
S-W
2 (lo
catio
n sh
own
in fi
g. 1
4; d
ata
from
App
lied
Ecol
ogic
al S
ervi
ces,
Inc.
, 201
2
4/18
/06
289
130
210
111
4265
0.73
0.08
0.11
--
7/19
/06
234
3712
012
748
742.
80.
240.
741.
5
10/1
9/06
264
340
100
123
5075
0.98
<0.0
10.
180.
74
4/30
/07
151
3511
089
3763
0.84
0.16
0.08
3.6
7/25
/07
436
915
077
4054
0.05
0.50
<0.0
61.
1
10/2
4/07
493
<111
010
343
870.
150.
770.
160.
81

40 Areas that Affect the Habitat of the Endangered Hine’s Emerald Dragonfly in the Lower Des Plaines River Valley, IllinoisTa
ble
5.
Conc
entra
tion
of s
elec
ted
cons
titue
nts
in s
urfa
ce w
ater
and
gro
undw
ater
at t
he R
iver
Sou
th P
arce
l, W
ill C
ount
y, Il
linoi
s, S
epte
mbe
r 199
4 th
roug
h N
ovem
ber 2
014.
—Co
ntin
ued
[mg/
L, m
illig
ram
per
lite
r; C
aCO
3, ca
lciu
m c
arbo
nate
; <, l
ess t
han;
--, n
o sa
mpl
e; b
old
deno
tes e
xcee
danc
e of
regu
lato
ry c
riter
ia]
Dat
e A
lkal
inity
, in
mg/
L as
Ca
CO3
Sulfa
te,
in m
g/L
Chlo
ride
, in
mg/
LCa
lciu
m,
in m
g/L
Mag
nesi
um,
in m
g/L
Sodi
um,
in m
g/L
Iron
, in
mg/
L
Nitr
ate
as
nitr
ogen
, in
mg/
L
Phos
phor
ous,
in
mg/
L
Tota
l Kj
elda
hl
nitr
ogen
, in
mg/
L
Silu
rian
aqui
fer a
t wel
l RP-
1S (l
ocat
ion
show
n in
fig.
14;
dat
a fro
m S
TS/A
ECOM
, 200
9)
10/2
8/05
420
7192
9158
31<0
.01
----
--
6/06
/06
310
4258
6634
27--
----
--
Silu
rian
aqui
fer a
t w
ell R
P-1D
(loc
atio
n sh
own
in fi
g. 1
4; d
ata
from
STS
/AEC
OM, 2
009)
10/2
8/05
410
8619
8548
20<0
.01
----
--
6/06
/06
370
8516
8347
8.9
----
----
Silu
rian
aqui
fer a
t w
ell R
P-2S
(loc
atio
n sh
own
in fi
g. 1
4; d
ata
from
STS
/AEC
OM, 2
009)
11/0
1/05
470
7776
123
6328
<0.0
1--
----
6/06
/06
380
8084
9946
31--
----
--
Silu
rian
aqui
fer a
t w
ell R
P-2D
(loc
atio
n sh
own
in fi
g. 1
4; d
ata
from
STS
/AEC
OM, 2
009)
11/0
1/05
450
172
112
8384
96<0
.01
----
--
6/05
/06
410
189
110
6974
96--
----
--
Silu
rian
aqui
fer a
t wel
l RP-
8S-W
est (
loca
tion
not s
how
n; d
ata
from
AEC
OM, 2
015b
)
11/1
0/14
329
5117
597
4874
<0.3
4--
---
Silu
rian
aqui
fer a
t wel
l RP-
10S-
Sout
h (lo
catio
n no
t sho
wn;
dat
a fro
m A
ECOM
, 201
5b)
11/1
0/14
282
2855
7839
26--
----
--
Silu
rian
aqui
fer a
t wel
l RP-
8S-E
ast (
loca
tion
not s
how
n; d
ata
from
AEC
OM, 2
015b
)
11/1
4/14
333
5317
312
160
120
----
----
Silu
rian
aqui
fer a
t wel
l RP-
9S-S
outh
(loc
atio
n no
t sho
wn;
dat
a fro
m A
ECOM
, 201
5b)
11/1
4/14
382
6914
110
259
62--
----
--

Assessment of Conditions that Affect the Water Resources at Selected Hine’s Emerald Dragonfly Habitats 41
Des
Pla
ines
Riv
er
Chic
ago
Sani
tary
and
Shi
p Ca
nal
ILLI
NOIS
ROU
TE 53
RAIL
ROAD
ILLINOIS ROUTE 7
DIVISION STREET
Des
Pla
ines
Riv
er
Chic
ago
Sani
tary
and
Shi
p Ca
nal
56657
261
0
560
564
554
550
570
614
614
566
564
562
562
558
558564
564
626
566
566
568
572
562
560
560
558
624
618
568
622
628
616
568
568
570
3
4
1
2
5
MW-3A586.3
578.22578.87578.22
SV1––
581.41<580.07
MW-3B570.1
560.68560.68563.07
SV2––
581.23572.46
Division Street––558.68558.41
554.9551.06551.06552.08
MW-10C552.7
550.51550.51551.17
MW-10B555.2551.18551.18552.08
MW-8A565.5560.9561.51563.74
MW-8B565.1560.6561.09563.82
MW-10A
MW-11A564.0561.2
560.74561.90
MW-11B564.1560.89561.15562.05
MW-11C564.2
560.77560.83562.07
MW-6A591.5584.4586.62586.41
MW-6B591.3583.5586.03585.82
MW-6C589.5583.9
588.02585.73
MW-6N593.7587.7588.43
–
MW6S––
586.41
MW-9A570.4566.5567.20568.83
MW-9B569.4567.3568.40568.58
586.21
MW-3A586.3
578.22578.87578.22
SV1––
581.41<580.07
MW-3B570.1
560.68560.68563.07
SV2––
581.23572.46
Division Street ––558.68558.41
554.9551.06551.06552.08
MW-10C552.7550.51550.51551.17
MW-10B555.2551.18551.18552.08
MW-8A565.5560.9
561.51563.74
MW-8B565.1560.6
561.09563.82
MW-10A
MW-11A564.0561.2560.74561.90
MW-11B564.1560.89561.15562.05
MW-11C564.2560.77560.83562.07
MW-6A591.5584.4586.62586.41
MW-6B591.3583.5586.03585.82
MW-6C589.5583.9588.02585.73
MW-6N593.7587.7588.43
–
MW6S––
586.41586.21
MW-9A570.4566.5567.20568.83
MW-9B569.4567.3568.40568.58
88°04'88°04'10"88°04'20"88°04'30"88°04'40"88°04'50"88°05'88°05'10"88°05'20"
41°35'40"
41°35'30"
41°35'20"
41°35'10"
41°35'
41°34'50"
41°34'40"
41°34'30"
Streamgage location and name with: High water level Low water level July 19, 2012, gage height November 26, 2012, gage height
Well location and name with: High water level Low water level July 19, 2012, water level November 26, 2012, water level
558.68558.41
Division Street––558.68558.41
EXPLANATION
Note: Water level datum is North American Vertical Datum of 1988
586 Line of equal elevation— Contour interval is 2 feet. Datum is North American Vertical Datum of 1988
562
Seep
Culvert with identifier1
MW-6A591.5584.4586.62586.41
0 0.1 0.2 0.3 0.4 0.5 MILE
0 0.1 0.2 0.3 0.4 0.5 KILOMETER
Orthography from the U.S. Department of Agriculture Farm Service AgencyAerial Photography Field Office 2012 National Agriculture Imagery Program (NAIP) Natural Color Imagery for Illinois
Figure 17. Location of selected features and water-level data at the Lockport Prairie Nature Preserve, Will County, Illinois.

42 Areas that Affect the Habitat of the Endangered Hine’s Emerald Dragonfly in the Lower Des Plaines River Valley, Illinois
the potential to alter the quality and quantity of groundwater discharged to the preserve because urban landscapes typi-cally contain larger areas of impermeable surfaces that reduce recharge to groundwater and increase overland runoff of precipitation to streams or wetlands. Urban landscapes also tend to have elevated levels of sediment, fertilizers, and road salts in the water (U.S. Geological Survey, 2016c) that could degrade the habitat at the Lockport Prairie Nature Preserve.
TopographySurface topography at the Lockport Prairie Nature Pre-
serve ranges from about 550 ft NAVD 88 near the Des Plaines River to about 575 ft at the base of the bluff in the western part of the preserve (figs. 4, 17). The berm for the railroad track near the western edge of the Lockport Prairie Nature Preserve and for Division Street in the center of the preserve are approximately 1–3 and 1–8 ft, respectively, above the sur-rounding land surface. The elevation of the top of the bluffs in the western part of the preserve is about 610–620 ft near Route 53. Surface topography west of the Lockport Prairie Nature Preserve increases to as much as 650 ft.
BiologyAdult HED use has been documented in virtually all
of the Lockport Prairie Nature Preserve (fig. 2). Adult HED activities include feeding, territorial patrol (Cashatt and Vogt, 1996), breeding, and egg laying (Cashatt and Vogt, 1992) with five verified breeding areas. The rivulet emanating from cul-vert 5 (fig. 18) is the most productive larval HED habitat at the Lockport Prairie Nature Preserve (Soluk and Mierzwa, 2012). Rivulets emanating from culvert 2, culvert 4, and the French drains also contain larval habitat. Egg laying was observed at rivulet 2 (Cashatt and Vogt, 1992) and near the seeps at the base of the bluffs (Cashatt and others, 1993).
The mean total adult HED population at the Lockport Prairie Nature Preserve in 2003 was estimated to be 134 individuals, which was 66 percent of the estimated adult population in the Lower Des Plaines River Valley. Popula-tion estimates from 1996 to 2008 indicate between 3 and 563 larvae at the Lockport Prairie Nature Preserve (Soluk and Mierzwa, 2012). The mean total larval HED population at the Lockport Prairie Nature Preserve in 2003 was estimated to be 988 individuals, which was nearly 48 percent of the estimated larvae population in the Lower Des Plaines River Valley. The HED population at the Lockport Prairie Nature Preserve has been on a decreasing trend since the 1990s, with an estimated adult population of 66 in 2011 (U.S. Fish and Wildlife Service, 2013b). The downward trend has been exacerbated by the 2002–03 and 2005 droughts.
HydrogeologyGroundwater in the vicinity of the Lockport Prairie
Nature Preserve is contained in the till deposits (the semicon-fining unit) in the topographic uplands, the sand and gravel deposits (the glacial drift aquifer) along the bluffs, the alluvial deposits located in the valley of the Des Plaines River (the alluvial aquifer), and the Silurian aquifer. The spatial relation of these units is shown in figures 5 and 8. Each of these units affects the hydrology of the Lockport Prairie Nature Preserve.
Alluvial AquiferThe alluvial aquifer has a saturated thickness of about
1–5 ft and consists predominately of sand with substantial amounts of silt and clay (Graef, Anhalt, Schloemer, and Associates, Inc., 2004a). This unit exchanges water with the surface-water bodies in the Lockport Prairie Nature Preserve. Hydric soils can be present in association with the alluvial aquifer in wetland areas.
Periodic measurements of groundwater levels were taken from August 2001 through September 2008 in 18 well points open to the alluvial aquifer in the Lockport Prairie Nature Pre-serve (Graef, Anhalt, Schloemer, and Associates, Inc., 2004a, 2009a). Water levels typically showed seasonal variations of less than about 1 ft, with the lowest water levels being present during the summer months. Water levels in the alluvial aquifer varied by a total of less than about 2 ft during most of the monitoring period but decreased by as much as 4 ft during the drought of 2005. These data indicate the alluvial deposit gen-erally has consistent amounts of water except during droughts but that small (2–4 ft) changes in water level may result in substantial detriment to the HED habitat.
Glacial Drift AquiferThe glacial drift aquifer near the Lockport Prairie Nature
Preserve consists of the sand-and-gravel deposits located within about 1,500 ft of the bluffs west of the valley of the Des Plaines River (figs. 5, 8). The glacial drift aquifer has a horizontal hydraulic conductivity ranging from 5.4 to 62 ft/d and can transmit water readily (Graef, Anhalt, Schloemer, and Associates, Inc., 2004a). Vertical flow in the glacial drift aquifer is directed downward to the Silurian aquifer at a rate of about 25 inches per year (in/yr) so that 47,800 ft3/d of water flows from the glacial drift aquifer into the Silurian aquifer within the groundwater recharge area for the Lockport Prairie Nature Preserve (Graef, Anhalt, Schloemer, and Associates, Inc., 2004a).
Horizontal flow in the glacial drift aquifer is directed toward the seeps along the bluff of the Des Plaines River Val-ley. Discharge to the seeps from the aquifer was measured to range from 140 to 1,300 ft3/d and is affected by the groundwa-ter elevation (Graef, Anhalt, Schloemer, and Associates, Inc., 2004a).
Groundwater levels in the glacial drift aquifer were measured in wells MW-6A and SV1 (fig. 17) by previous
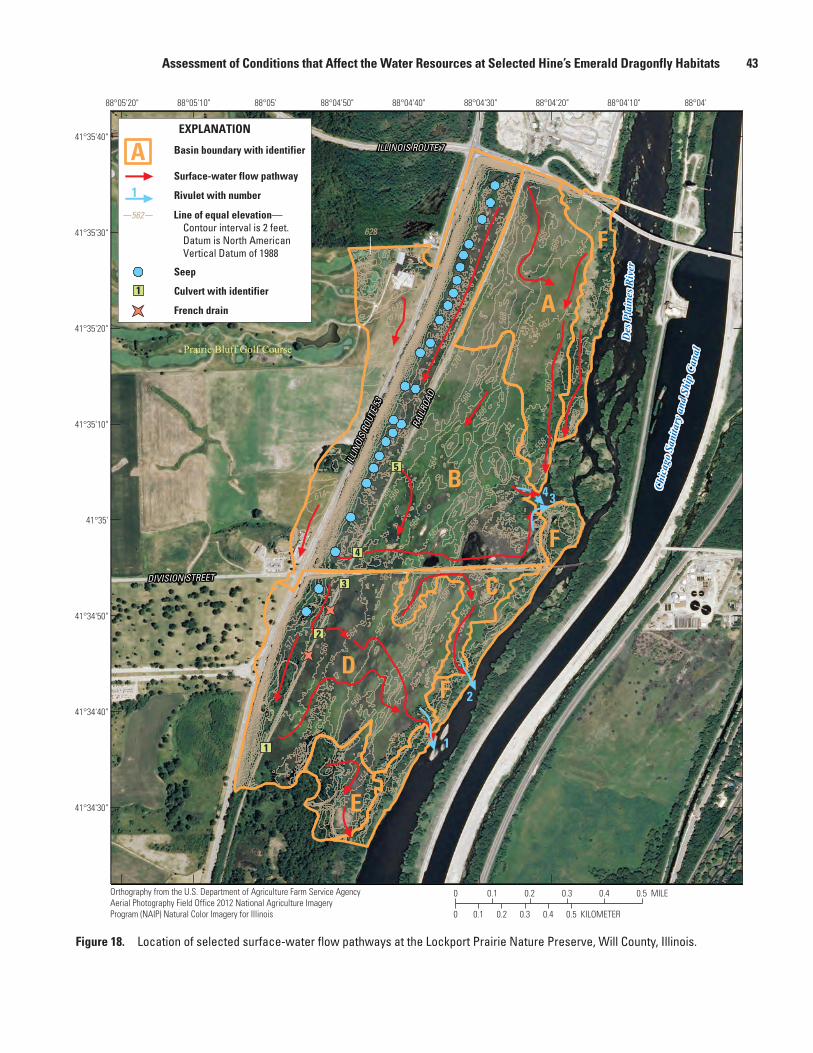
Assessment of Conditions that Affect the Water Resources at Selected Hine’s Emerald Dragonfly Habitats 43
A
B
D
F
C
F
F
E
1
2
34
3
4
1
2
5
56657
261
0
560
564
554
554
550
554
556
570 56
4
614
614
566
564
564
562
562
558
558564
564
626
566
566
566
568
57057
2
562
560
560
558
624
618
560
568
622
628
616
568
568
Des
Pla
ines
Riv
er
Chic
ago
Sani
tary
and
Shi
p Ca
nalPrairie Bluff Golf Course
ILLINOIS ROUTE 7
DIVISION STREET
Des
Pla
ines
Riv
er
Chic
ago
Sani
tary
and
Shi
p Ca
nal
ILLI
NOIS
ROU
TE 53
RAIL
ROAD
88°04'88°04'10"88°04'20"88°04'30"88°04'40"88°04'50"88°05'88°05'10"88°05'20"
41°35'40"
41°35'30"
41°35'20"
41°35'10"
41°34'50"
41°34'40"
41°34'30"
41°35'
Basin boundary with identifier
Surface-water flow pathway
Rivulet with number
Seep
Culvert with identifier
French drain
EXPLANATION
1
A
1
562 Line of equal elevation— Contour interval is 2 feet. Datum is North American Vertical Datum of 1988
562
0 0.1 0.2 0.3 0.4 0.5 MILE
0 0.1 0.2 0.3 0.4 0.5 KILOMETER
Orthography from the U.S. Department of Agriculture Farm Service AgencyAerial Photography Field Office 2012 National Agriculture Imagery Program (NAIP) Natural Color Imagery for Illinois
Figure 18. Location of selected surface-water flow pathways at the Lockport Prairie Nature Preserve, Will County, Illinois.

44 Areas that Affect the Habitat of the Endangered Hine’s Emerald Dragonfly in the Lower Des Plaines River Valley, Illinois
investigators (Graef, Anhalt, Schloemer, and Associates, Inc., 2008, 2009a) and the USGS (U.S. Geological Survey, 2016a; tables 1, 6). Groundwater levels within the glacial drift aquifer rise and fall by as much as 6 ft in response to recharge from individual precipitation events, seasonal variations in recharge, and drought. This fluctuation in water levels affects the location, frequency, and volume of groundwater flow to the Lockport Prairie Nature Preserve. When water levels are high, the volume of discharge from the glacial drift aquifer to the seeps and to the underlying Silurian aquifer is high. When water levels are low, the volume of discharge from the glacial drift aquifer to the seeps and to the underlying Silurian aquifer is low (or absent when the glacial drift aquifer is unsaturated). During low-flow conditions, a higher percentage of the water in the Lockport Prairie Nature Preserve originates as flow through the semiconfining unit.
Semiconfining Unit
The semiconfining unit consists of glacial till deposits, which are predominately of silt and clay with small amounts of interspersed sand and gravel (figs. 5, 8). The till deposits are between 30 and 65 ft thick and are present in the topographic uplands west of the glacial drift aquifer near the Lockport Prairie Nature Preserve. The semiconfining unit is present throughout most of the groundwater recharge area for the Lockport Prairie Nature Preserve (figs. 8, 11) and has an aver-age vertical hydraulic conductivity of 2.3 × 10⁻⁴ ft/d (Graef, Anhalt, Schloemer, and Associates, Inc., 2004a). Vertical flow in the semiconfining unit is directed downward at a rate of 1–2 in/yr, so that about 14,700–20,000 ft3/d of groundwater flows from the semiconfining unit into the underlying Silurian aquifer within the groundwater recharge area for the Lockport Prairie Nature Preserve (Graef, Anhalt, Schloemer, and Asso-ciates, Inc., 2004a).
Groundwater levels were measured in wells MW-7A and MW-12A by previous investigators (Graef, Anhalt, Schloemer, and Associates, Inc., 2008, 2009a) and the USGS (U.S. Geo-logical Survey, 2016a; tables 1, 6). These wells are open to the shallow part of the semiconfining unit west of the Lockport Prairie Nature Preserve (location of the deep wells in the clus-ters are shown in fig. 9; MW-7C and MW-7D, MW-12B and MW-12D, respectively). Water levels in well MW-7A showed more than 10 ft of variation during the measurement period, with numerous changes of 2–3 ft in response to individual precipitation events. Declines of about 4–11 ft were observed in well MW-7A during drought periods from about May 2002 through May 2003, from about May through November 2005, and during July and November 2012. Well MW-12A, which has a shorter period of record and less frequent measurements, had about 2.5 ft of water level change and had lower water levels during the 2012 drought.
Periodic measurements of water levels were taken from well MW-7B, which is clustered with shallower well MW-7A (Graef, Anhalt, Schloemer, and Associates, Inc., 2009a). Well MW-7B monitors the bottom of the semiconfining unit, a sand
deposit between the base of the semiconfining unit and the top of the Silurian aquifer, and the uppermost 1–2 ft of the Silu-rian aquifer (table 1). Water levels in well MW-7B were below the bottom of the well screen for about 5 months following well construction, possibly because of pumping from a nearby irrigation well. Water levels also were below the bottom of the well screen during the drought in July 2012 and perhaps during the latter part of the drought in 2005. In addition, the water level in the well was below the elevation of the bottom of the semiconfining unit during most of the period of moni-toring. These data indicate that at least parts of the base of the semiconfining unit may become unsaturated during prolonged dry periods or in response to pumping, reducing recharge to the Silurian aquifer.
Periodic measurements were taken from wells CH2A and CH3A, which also monitor the bottom of the semiconfining unit (Graef, Anhalt, Schloemer, and Associates, Inc., 2009a; table 6). Well CH2A is about 330 ft north of high-capacity well CH10 and is clustered with well CH2B and CH2C (shown in fig. 9). Well CH3A is about 140 ft northwest of high-capacity well CH11 and is clustered with well CH3B (fig. 9). Water levels in wells CH2A and CH3A declined by 6–8 ft after the initiation of pumping in wells CH10 and CH11, and have remained several feet lower than pre-pumping water levels. These declines indicate that the deep part of the semiconfining unit is exhibiting drawdown in response to high-capacity withdrawals from the underlying Silurian aquifer within at least a few hundred feet of the pumped wells, diverting water from the deepest part of the semiconfining unit to the Silurian aquifer in these areas.
Water levels in the shallow part of the semiconfining unit show fairly large changes in response to individual precipita-tion events as well as seasonal changes in precipitation and droughts. Water levels in the deeper part of the semiconfining unit typically show no response to individual precipitation events but respond to longer term changes in precipitation and to high-capacity pumping in localized areas.
Silurian Aquifer
The Silurian aquifer is approximately 200 ft thick near the Lockport Prairie Nature Preserve (Roadcap and others, 1993). The dolomite is present at or near the land surface in the valley of the Des Plaines River and has about 10–15 ft of outcrop along the base of the bluffs (fig. 5). The dolomite contains a variety of secondary-permeability features, particu-larly in the uppermost 15–40 ft where the dolomite is most weathered.
Water in the Silurian aquifer flows from west to east in the vicinity of the Lockport Prairie Nature Preserve (figs. 9, 10). Water from the weathered, upper part of the aquifer dis-charges to the seeps at the base of the bluff in the western edge of the preserve. A smaller amount of water discharges to the alluvial aquifer in the Lockport Prairie Nature Preserve (Graef, Anhalt, Schloemer, and Associates, Inc., 2004a). The horizon-tal hydraulic conductivity of the Silurian aquifer is moderately

Assessment of Conditions that Affect the Water Resources at Selected Hine’s Emerald Dragonfly Habitats 45
Table 6. Summary of groundwater-level data for the Lockport Prairie Nature Preserve, Will County, Illinois, 2001 through 2014.
[MM, month; YY, year; NAVD 88; North American Datum of 1988; C, continuous measurement; P, periodic measurement; <, less than; ~, approximate]
Well nameDate of measurement
(MM/YY–MM/YY)Range of water levels, in feet above NAVD 88
Factors affecting water level
Glacial drift aquifer
MW-6A 06/01–09/05 C09/11–08/14 C07/01–11/12 P
584.4–591.5 Precipitation events, seasonal variation, drought.
SV1 03/03–11/12 P <580.1–~588 Precipitation events, seasonal variation, drought.Shallow part of semiconfining unit
MW-7A 07/01–04/04 C07/01–11/12 P
657.2–668.0 Precipitation events, seasonal variation, drought.
MW-12A 08/07–11/12 P 636.4–639.9 Seasonal variation, drought, possibly precipitation events.Deep part of semiconfining unit
MW-7B 07/01–11/12 P <606–608.2 Drought, possibly pumping, possibly seasonal variation.CH2A 03/03–11/12 P 583.6–594.5 Pumping, precipitation, seasonal variation, drought.CH3A 03/03–11/12 P 584.3–597.7 Pumping, precipitation, seasonal variation, drought.
Silurian aquifer overlain by semiconfining unit
MW-7C 07/01–10/05 C07/01–11/12 P
604.1–609.2 Pumping, drought, possibly seasonal variation.
MW-7D 10/11–05/13 C07/01–11/12 P
603.7–609.2 Pumping, drought, possibly seasonal variation.
MW-12B 08/07/11/12 P 602.5–603.1 Pumping, drought, possibly seasonal variation.MW-12C 08/07/11/12 P 602.2–602.9 Drought, possibly seasonal variation.CH2B 03/03–11/12 P 583.9–592.1 Pumping, drought, possibly seasonal variation.CH2C 03/03–11/12 P 540.5–579.7 Pumping, drought, possibly seasonal variation.
CH3B 03/03–11/12 P 585.6–599.3 Pumping, drought, possibly seasonal variation.
Silurian aquifer overlain by glacial drift aquifer
MW-3A 04/01–07/04 C07/01–11/12 P
578.2–584.8 Precipitation, drought, possibly seasonal variation.
MW-3B 05/13–09/13 C07/01–11/12 P
561.6–570.0 Seasonal variation, drought, possibly precipitation events.
MW-6B 07/01–04/01 C 08/12–09/13 C07/01–11/12 P
583.5–589.8 Precipitation, seasonal variation, drought.
MW-6C 07/01–11/12 P 583.9–589.9 Drought, possibly seasonal variation.SV2 03/03–11/12 P 572.4–588.2 Seasonal variation, drought.
Silurian aquifer in Des Plaines River Valley
MW-8B 07/01–12/04 C07/01–11/12 P
560.7–564.4 Precipitation, seasonal variation, drought.
MW-9A 11/01–11/05 C07/01–11/12 P
566.5–570.4 Precipitation, seasonal variation, drought.
MW-9B 04/02–06/05 C03/12–02/14 C07/01–11/12 P
567.2–569.4 Drought, possibly seasonal variation.
MW-10A 10/06–11/12 P 551.1–555.0 Drought, possibly seasonal variation.MW-10B 10/06–11/12 P 551.2–555.2 Seasonal variation, drought.MW-10C 10/06–11/12 P 550.5–552.7 Seasonal variation, drought.

46 Areas that Affect the Habitat of the Endangered Hine’s Emerald Dragonfly in the Lower Des Plaines River Valley, Illinois
Table 6. Summary of groundwater-level data for the Lockport Prairie Nature Preserve, Will County, Illinois, 2001 through 2014.—Continued
[MM, month; YY, year; NAVD 88; North American Datum of 1988; C, continuous measurement; P, periodic measurement; <, less than; ~, approximate]
Well nameDate of measurement
(MM/YY–MM/YY)Range of water levels, in feet above NAVD 88
Factors affecting water level
Silurian aquifer in Des Plaines River Valley—Continued
MW-11A 10/06–11/12 P 560.7–563.6 Seasonal variation, drought.MW-11B 10/06–11/12 P 561.2–564.2 Seasonal variation, drought.MW-11C 10/06–11/12 P 560.8–564.2 Seasonal variation, drought.
low at the Lockport Prairie Nature Preserve, ranging from 1.8 × 10⁻¹ to 6.8 × 10⁻¹ ft/d (Graef, Anhalt, Schloemer, and Associ-ates, Inc., 2004a).
Continuous and periodic measurements of groundwater levels were taken in wells open to the Silurian aquifer in the vicinity of the Lockport Prairie Nature Preserve at various times from 2001 through 2013 (table 6). The wells monitored the Silurian aquifer where the semiconfining unit was pres-ent, where the glacial drift aquifer was present, and in the Des Plaines River Valley. Measurements were taken by previous investigators (Graef, Anhalt, Schloemer, and Associates, Inc., 2008, 2009a) and by the USGS as part of this investigation (U.S. Geological Survey, 2016a).
Groundwater levels were measured in wells MW-7C,D; MW-12B,C; CH2B,C; and CH3B (Graef, Anhalt, Schloemer, and Associates, Inc., 2009a; table 6). These wells are open to various depths of the Silurian aquifer where the aquifer is overlain by the semiconfining unit west of the Lockport Prairie Nature Preserve (table 1; fig. 9). Water levels in wells MW-7C,D appear to have been periodically lowered (see 2001 and 2008 data for well MW-7C in fig. 19) by pumping from a nearby irrigation well that is no longer in operation and varied by a total of about 5 ft. Low water levels were present during the 2012 drought but not the 2005 drought (Graef, Anhalt, Schloemer, and Associates, Inc., 2009a), potentially reflecting the effects of nearby pumping in 2012. Water levels in wells MW-12B,C varied by less than 1 ft, which is a reflection of the stability in the flow system and its isolation from surface influ-ences as well as the shorter monitoring period.
Water levels in well CH3B, open to the shallow part of the Silurian aquifer about 140 ft from high-capacity well CH11, showed an overall decline of about 14 ft during the period of monitoring (table 6; Graef, Anhalt, Schloemer, and Associates, Inc., 2009a). This decline reflects drawdown caused by the diversion of water from the aquifer as a result of pumping from well CH11. Water levels also have responded to the droughts in 2005 and 2012.
Water levels in well CH2B, open to the shallow part of the Silurian aquifer (table 1) declined overall by about 8 ft during the period of monitoring (table 6; Graef, Anhalt, Schlo-emer, and Associates, Inc., 2009a). Water levels in well CH2C, open to the deep part of the Silurian aquifer (table 1), declined by nearly 40 ft during the same period. These wells are located
about 330 ft from high-capacity well CH10 (fig. 9), which began pumping in August 2003. Pumping from high-capacity well CH10 is the cause of the large water-level decreases at the CH2B,C well cluster. Drawdown is substantially greater in the deeper part of the aquifer than in the shallow part, which indicates that the secondary-permeability feature(s) supplying most of the water to well CH10 are located in the deeper part of the Silurian aquifer. These deep features have good hydrau-lic connection with (deep) well CH2C but have somewhat limited vertical interconnection in this area and perhaps the aquifer as a whole.
Water levels in some of the Silurian-aquifer wells screened beneath the semiconfining unit were below the top of the Silurian dolomite during drought periods, indicating that horizontal flow through the Silurian aquifer exceeded recharge from the semiconfining unit during these times. Water levels in these wells showed (1) minimal variation where not affected by nearby pumping, (2) no response to individual precipitation events, (3) no clear response to seasonal changes in precipita-tion, and (4) muted response to droughts. The muted response to precipitation likely is due to the slow movement of recharge water through the overlying semiconfining unit.
Groundwater levels were measured in wells MW-3A,B; MW-6B,C; and well SV2 (Graef, Anhalt, Schloemer, and Associates, Inc., 2008, 2009a; U.S. Geological Survey, 2016a). These wells are open to the Silurian aquifer where it is overlain by the glacial drift aquifer on the bluff west of the Lockport Prairie Nature Preserve. Water levels in these wells typically varied by 6–8 ft during the period of record (see data for well MW-3A in fig. 19; table 6). Water levels varied in response to individual precipitation events and typically were near the bottom of the range during drought events in 2002–03, 2005, and 2012. The large (nearly 16 ft) range in water levels at well SV2 is due to the abnormally low (about 11 ft below typical) water levels measured during the droughts of 2005 and 2012. These low water levels may reflect dewatering of fractures in the upper part of the Silurian aquifer near well SV2 in the absence of recharge from the overlying glacial drift aquifer during the droughts. The large difference in water levels at the MW-3A,B well cluster also indicates periodic unsatu-rated conditions (likely affected by flow through a complex secondary-permeability network in the upper part of the aquifer in this area) within the Silurian aquifer between the open

Assessment of Conditions that Affect the Water Resources at Selected Hine’s Emerald Dragonfly Habitats 47
603
604
605
606
607
608
609
610
560
565
570
575
580
585
590
2001 2002 2003 2004 2005 2006 2007 2008 2009 2010 2011 2012
Wat
er le
vel i
n w
ells
MW
-3A,
MW
-8A,
MW
-9A,
ab
ove
Nor
th A
mer
ican
Ver
tical
Dat
um o
f 198
8, in
feet
Wat
er le
vel i
n w
ell M
W-7
C ab
ove
Nor
th A
mer
ican
Ver
tical
Dat
um o
f 198
8, in
feet
Date
MW-3A
MW-8AMW-9A
MW-7C
EXPLANATION
Figure 19. Water levels in wells MW-3A, MW-7C, MW-8A, and MW-9A in the vicinity of the Lockport Prairie Nature Preserve, Will County, Illinois, 2001 through 2012.
interval at these wells (about 550–575 ft). Unsaturated condi-tions in the upper part of the Silurian aquifer in the vicinity of well SV2 may explain the lack of seeps in this area (fig. 17).
Water levels in some of the Silurian-aquifer wells screened beneath the glacial drift aquifer showed substantial variation in response to individual precipitation events, sea-sonal variations, and drought. These responses are due to the rapid movement of recharge water through both aquifers to the seeps. The low water level at well SV2 during drought indi-cates the potential for a substantial reduction in flow from the Silurian aquifer in this area during drought conditions.
Groundwater levels were measured in wells MW-8B; MW-9A (fig. 19),MW-9B (fig. 20); MW-10A,B,C; and MW-11A,B,C (Graef, Anhalt, Schloemer, and Associates, Inc., 2009a; U.S. Geological Survey, 2016a; table 6). These wells monitor the Silurian aquifer at the Lockport Prairie Nature Pre-serve in the valley of the Des Plaines River (fig. 17). Water lev-els in these wells typically varied by about 4 ft or less, showed less than 1 ft response to individual precipitation events, and were at the low end of the range during the droughts of 2005 and 2012. Water levels in these wells were above the top of the Silurian aquifer, excepting the MW-10 cluster. Water levels in the MW-10 cluster are affected by hydraulic interaction with the Des Plaines River. During the 2012 drought measurements, water levels were typically less than 1 ft above the top of the
dolomite. These data indicate that flow from the Silurian aqui-fer directly to the wetlands in the river valley is a stable source of the water sustaining the wetlands at most of the Lockport Prairie Nature Preserve but that small changes in water level associated with extreme hydrologic events can dry out the HED habitat.
Comparison of water-level data from wells open to dif-ferent elevations in the Silurian aquifer in the vicinity of the Lockport Prairie Nature Preserve indicates variable vertical flow within the aquifer (fig. 17, table 1). For example, the July 2012 measurements indicate upward flow within the aquifer at the MW-9 well cluster (higher water levels in the deep well [MW-9B]) but downward flow during November 2012 (fig. 17). These data indicate that the volume of groundwa-ter discharge from the Silurian aquifer to the wetlands at the Lockport Prairie Nature Preserve may be affected by drought or other factors.
The groundwater recharge area for the Silurian aquifer to the Lockport Prairie Nature Preserve (fig. 21) was determined by Graef, Anhalt, Schloemer, and Associates, Inc. (2004a). The area of groundwater recharge to that part of the Silurian aquifer that flows to Lockport Prairie Nature Preserve is about 2.6 mi2. In about 2.3 mi2 of this area the Silurian aquifer is overlain by the semiconfining unit. In the remainder of this area the Silurian aquifer is overlain by the glacial drift aquifer.

48 Areas that Affect the Habitat of the Endangered Hine’s Emerald Dragonfly in the Lower Des Plaines River Valley, Illinois
Spec
ific
cond
ucta
nce,
in m
icro
siem
ens
per
cent
imet
er a
t 25
degr
ees
Cels
ius
0.0
2.0
4.0
6.0
8.0
10.0
12.0
14.0
16.0
18.0
Tem
pera
ture
, in
degr
ees
Cels
ius
1,200
1,220
1,240
1,260
1,280
1,300
1,320
1,340
1,360
1,380
1,400
Wat
er le
vel a
bove
Nor
th A
mer
ican
Verti
cal D
atum
of 1
988,
in fe
et
567.0
567.5
568.0
568.5
569.0
569.5
570.0
2013 20142012
Jan.
Feb.
Jan.
Feb.
Mar
.
Apr.
May
June Ju
ly
Aug.
Sept
.
Oct.
Nov
.
Dec.
Mar
.
Apr.
May
June Ju
ly
Aug.
Sept
.
Oct.
Nov
.
Dec.
Water levelSpecific conductanceTemperature
EXPLANATION
Figure 20. Continuous readings of water level, temperature, and specific conductance for well MW-9B, Lockport Prairie Nature Preserve, Will County, Illinois, March 28, 2012, through February 24, 2014.
The total recharge from precipitation within the groundwater recharge area to the Lockport Prairie Nature Preserve is about 66,000 ft3/d, of which about 37,000 ft3/d enters the Silurian aquifer and 29,000 ft3/d enters the glacial drift aquifer (Graef, Anhalt, Schloemer, and Associates, Inc., 2004a).
Surface Water
Surface-water flow at the Lockport Prairie Nature Pre-serve begins as discharge from seeps along the bluffs in the western part of the preserve at an elevation of about 578–585 ft NAVD 88 (fig. 18; Christopher B. Burke Engineering, Ltd, 1996; Graef, Anhalt, Schloemer, and Associates, Inc., 2004a,b). Depending on groundwater levels, these seeps ema-nate from the glacial drift and Silurian aquifers, or from only the Silurian aquifer. Field reconnaissance done in March 1996 identified 25 seeps between the bluff and the railroad tracks (Christopher B. Burke Engineering, Ltd, 1996). All but one of these seeps were north of Division Street, with the most active seeps being approximately halfway between Route 7 and Division Street. Field reconnaissance done in 2000 identified 40 distinct seeps, with additional diffuse areas where seeps were present (Graef, Anhalt, Schloemer, and Associates, Inc., 2004a). All but two of these seeps were located north of Divi-sion Street. The location of the seeps indicates that saturated, permeable, geologic material intersecting the bluff face is more common north of Division Street than south. This inter-pretation is consistent with the decrease in groundwater-level elevations from north to south along the bluffs at the Lockport Prairie Nature Preserve (figs. 9, 10).
On an unspecified date during the winter of 2002, described as a period of low groundwater levels, an estimated
14,000 ft3/d of water was discharged from the seeps (Graef, Anhalt, Schloemer, and Associates, Inc., 2004a). On March 28, 2002, an estimated 36,200 ft3/d was discharged from the seeps (Graef, Anhalt, Schloemer, and Associates, Inc., 2008). During May 2002, described as a period of high groundwater levels, an estimated 21,500 ft3/d of water was discharged from the seeps (Graef, Anhalt, Schloemer, and Associates, Inc., 2004a). If normal seasonal trends in water level were pres-ent during the winter and spring of 2002, these data indicate that the volume of discharge from the seeps increases with increased groundwater levels.
Water from the seeps collects in pools located west of the railroad tracks and enters the eastern part of the Lockport Prai-rie Nature Preserve as flow through culverts and French drains beneath the railroad bed (fig. 18). Water discharging through the culverts and French drains flows in rivulets through the wetlands within the Lockport Prairie Nature Preserve and out to the Des Plaines River. The wetlands also are discharge points for groundwater from the Silurian aquifer, receiving an estimated 850–1,000 ft3/d of groundwater discharge (Graef, Anhalt, Schloemer, and Associates, Inc., 2004a). The volume of direct discharge from the Silurian aquifer to the wetland is substantially less than the volume of discharge measured from the seeps in 2002.
There are six surface-water basins (A through F) within the wetlands of the Lockport Prairie Nature Preserve (Graef, Anhalt, Schloemer, and Associates, Inc., 2004b; fig. 18). Major basin boundaries are associated with the topographic highs at the railroad tracks and Division Street, which along with the culverts represents an alteration from the natural surface-water hydrology at the Lockport Prairie Nature Pre-serve. Smaller topographic high points (hummocks) control

Assessment of Conditions that Affect the Water Resources at Selected Hine’s Emerald Dragonfly Habitats 49
CH4
CH5
CH6
CH7CH8
CH9
CH10
CH11
R1
R3
R#9
R#12
CV#1CV#2
CV#3CV#4
WEB
ER R
OAD
ROMEO ROAD
RENWICK ROAD
DIVISION STREET
TAYLOR ROAD
Crest Hill
Lewis University
Airport
reviR senialP seD
Lockport
River SouthParcel
Romeoville
Middle ParcelExpansion Area
WestQuarry
ExpansionArea
7
30
53
171
7
Com Ed and
Long Run
Parcels
EastQuarry
WestQuarry
Middle Quarry
Long Run Cr
Long Run Seep
Nature Preserve
Illin
ois a
nd M
ichi
gan
Can
al
Chi
cago
San
itary
\an
d S
hip
Can
al
55
55
LOCKPORT LOCK AND DAM
Long
Seep
College View Subdivision
Romeoville PrairieNature
Preserve
AIRPORT ROAD
Lockport PrairieNature Preserve
Lockport Prairie East and Dellwood WestNature Preserves
Prairie BluffPreserve
Run
Henry Formation sandand gravel removed
by quarrying
88°03'88°04'88°05'88°06'88°07'88°08'88°09'88°10'
41°39'
41°38'
41°37'
41°36'
41°35'
41°34'
41°33'
Surficial geology unit
Equality Formation—Glacial lake plain depositsHenry Formation—Glacial out- wash sand and gravel deposits
Silurian dolomiteWedron Formation
Recharge area
1/2-mile buffer of recharge area2-mile buffer of recharge area
High-capacity well and name
R#12
Nature preserve boundaryExisting quarry (2016)
Quarry expansion area
Parcel boundary
EXPLANATION
0 1 2 MILES
0 1 2 KILOMETERS
Base from U.S. Geological Survey digital data, 1:100,000, 2001Albers Equal-Area Conic projection Standard parallels 33˚ N. and 45˚ N.Central meridian 89˚ W.North American Datum of 1927
Figure 21. Groundwater recharge area for the Silurian aquifer, with buffers, and location of selected features in the vicinity of the Lockport Prairie Nature Preserve, Will County, Illinois (modified from Graef, Anhalt, Schloemer, and Associates, Inc., 2004a).

50 Areas that Affect the Habitat of the Endangered Hine’s Emerald Dragonfly in the Lower Des Plaines River Valley, Illinois
surface-water flow within the basins in the Des Plaines River Valley. Larval HED use appears to be focused in basins B and D.
Basin A receives water directly from precipitation, direct groundwater discharge to the basin (in contrast to flow from the seeps), and overland runoff of precipitation from topo-graphic highs at Route 7 (Graef, Anhalt, Schloemer, and Asso-ciates, Inc., 2004b). Due to the absence of a culvert, Basin A, which likely received some overland runoff under natural conditions, does not receive surface-water flow from west of the railroad tracks. Basin A does not have a defined outflow channel, but flow is to the Des Plaines River at the southern part of the basin. Installation of a culvert beneath the railroad tracks at Basin A would increase the volume of flow into Basin A and would decrease flow to Basin B, partly restoring the natural hydrology of the northern part of the Lockport Prairie Nature Preserve.
Basin B receives water directly from precipitation, direct groundwater discharge to the basin, overland runoff of precipi-tation near Route 53, and from numerous seeps along the bluff (Graef, Anhalt, Schloemer, and Associates, Inc., 2004b). Water is ponded west of the berm associated with the railroad tracks and north of Division Street. Surface water flows through culverts 4 and 5 in the berm to rivulets and ponds within the basin, then discharges to the Des Plaines River at rivulets 3 and 4 (fig. 18). Inflow at the culverts produces a concentration of flow that likely was not present under natural conditions and may result in greater erosion near the culverts.
Discharge through weirs installed at the culverts beneath the railroad tracks on the west side of the Lockport Prairie Nature Preserve and through weirs at rivulets near the Des Plaines River was measured during monitoring events in 1995, fall 2001, and spring through winter 2002 to provide insight into the water budget for Basin B (Christopher B. Burke Engineering, Ltd, 1996; Graef, Anhalt, Schloemer, and Associates, Inc., 2004b). The typical and maximum discharge into Basin B by way of culverts 4 and 5 was low in absolute terms but substantially higher at culvert 4 than at culvert 5 (table 7). This difference likely is affected by the position of culvert 4 in the lower part of the basin (fig. 18) where water collects near Division Street and the railroad tracks. Note that culvert 5 flows to the most productive HED habitat, possibly reflecting the effects of the lower discharge rate on the habitat. Discharge into basin B at culverts 4 and 5 typically exceeded discharge out to the Des Plaines River at rivulets 3 and 4, except during some of the precipitation events. Discharge pat-terns in Basin B likely reflect the comparatively high volume of surface-water inflow from the numerous seeps north of Division Street. Discharge patterns also indicate that evapo-transpiration removes a substantial amount of water from Basin B during the summer months. Discharge into and out of Basin B varied seasonally, with both typical and maximum discharge being highest in spring and fall. Inflow and outflow typically were absent during the summer except for infrequent flow during sustained periods of elevated precipitation.
Basin C receives water directly from precipitation, direct groundwater discharge to the basin, and perhaps groundwater discharge from basin B through the berm at Division Street (Christopher B. Burke Engineering, Ltd, 1996; Graef, Anhalt, Schloemer, and Associates, Inc., 2004b). Because Division Street blocks the natural surface-water flow from Basin B to Basin C, Basin C is likely drier under current (2018) condi-tions than under natural conditions. Surface water flows through rivulets and sheet flow in the wetlands and discharges to the Des Plaines River at rivulet 2. Outflow from Basin C to the Des Plaines River at rivulet 2 varied seasonally, being highest in spring and fall (2001 but not 2002) and typically absent during the summer (table 7). Flow at rivulet 2 during the summer is frequent during precipitation events, possibly due to backflow from the river.
Basin D receives water directly from precipitation, direct groundwater discharge to the basin, overland runoff of precipi-tation near Route 53, and from seeps along the bluff (Graef, Anhalt, Schloemer, and Associates, Inc., 2004b). Water is pon-ded west of the berm associated with the railroad tracks. Sur-face water flows through culverts 1, 2, and (to a small extent) 3 in the berm and (after 1997) three French drains to rivulets within the basin, then discharges to the Des Plaines River at rivulet 1 (fig. 18). As was the case with the other basins, cur-rent (2018) flow in Basin D differs from natural conditions.
The typical inflow to Basin D was substantially higher at culvert 2 than at culvert 1 (table 7). Based on a single mea-surement during spring of 1996, inflow at culvert 3 exceeds that at culverts 1 and 2 (Christopher B. Burke Engineering, Ltd., 1996; Graef, Anhalt, Schloemer, and Associates, Inc., 2004b). If these measurements are representative, these differences indicate increased inflow from south to north (fig. 18) toward Division Street prior to construction of the French drains in 1997. After construction of the French drains, culvert 3 was blocked with sediment and did not transmit water. Flow readings at the culverts and French drains during 2001 and 2002 (table 7) indicate minimal surface-water flow into Basin B, with most of the flow being through culvert 2, which drains to the second most productive HED habitat at the Lockport Prairie Nature Preserve. Outflow from Basin D to the Des Plaines River by way of rivulet 1 was typically less than 0.1 cubic feet per second (ft3/s), indicating that evapo-transpiration removes a substantial amount of water from the basin during the summer months. Discharge into Basin D at culverts 1, 2, and 3 and out of the basin at rivulet 1 showed no clear differences in the 2002 data. It is noted, however, that the typical outflow at rivulet 1 during the latter part of the 2001 (about 0.5 ft3/s) exceeded the total inflow (about 0.1 ft3/s). To make up the deficit in the volume of water exiting the basin, there must be an additional source of water entering Basin D between the culverts and the rivulets. Discharge patterns in basin D likely reflect the low volume of inflow from the two seeps south of Division Street and a high volume of groundwater recharge in comparison to surface-water inflow. Flow into and out of Basin D varied seasonally, being high-est in spring and fall and absent during the summer except

Assessment of Conditions that Affect the Water Resources at Selected Hine’s Emerald Dragonfly Habitats 51
Table 7. Summary of surface-water discharge data for the Lockport Prairie Nature Preserve, Will County, Illinois.
[MM, month; YY, year; <, less than; Dec., December; Apr., April; Oct., October; ~, approximate]
Well nameType of
flow
Date of measurement
(MM/YY–MM/YY)
Typical flow, in cubic feet per
secondRange of flow, in cubic feet per second
Basin B (all locations shown in fig. 18)
Culvert 4 Inflow 03/96 0.7 Single measurement.10/01–12/01 1.0–2.0 1.0–12.0 decrease with time.04/02–12/02 <0.1–1.0 <0.1–3.0 decrease with time.
Culvert 5 Inflow 03/96 0.1 Single measurement.10/01–12/01 <0.1 <0.1–0.11 precipitation dependent.04/02–12/02 <0.1 <0.1–2.7 no flow late July–Dec.
Rivulet 3 Outflow 09/01–12/01 <0.1 <0.1–10 precipitation dependent.04/02–12/02 <0.1 <0.1–3.0 almost no flow June–Dec. except during substantial
precipitation.Rivulet 4 Outflow 09/01–12/01 0.4 <0.1–2.0 base flow higher Oct.–Dec.
04/02–12/02 >0.4 (Apr.–June) <0.1 (June–Dec.)
<0.1–1.8 minimal flow July–Dec.
Basin C (all locations shown in fig. 18)
Rivulet 2 Outflow 08/01–12/01 0.25 <0.1–0.70 flashy, base flow higher in Oct.–Dec.04/02–12/02 ~0.2 (Apr.–June)
<0.1 (June–Dec.)<0.1–1.1 decreases after mid-June, fairly frequent summer
flow during precipitation.Basin D (all locations shown in fig. 18)
Culvert 1 Inflow 10/01–12/01 <0.1 <0.1–0.3 flow requires substantial precipitation.04/02–12/02 <0.1 <0.1–3.0 decreases after mid-June.
Culvert 2 Inflow 03/96 0.1 Single measurement.10/01–12/01 0.1 <0.1–1.7 consistent base flow.04/02–12/02 <0.1 <0.1–2.1 minimal flow after May.
Culvert 3 Inflow 03/96 0.5 Single measurement.04/02–12/02 <0.1 Blocked with sediment, 2002 flow reduced by 1997 construc-
tion of French drains.North French drain Inflow 04/02–12/02 <0.1 <0.1–1.8 minimal flow.South French drain Inflow 04/02–12/02 <0.1 <0.1–0.1 minimal flow.Rivulet 1 Outflow 08/01–12/01 <0.1–0.5 <0.1–6.0 base flow higher in Oct.–Dec.
04/02–12/02 <0.1 <0.1–3.0 little flow after mid-June.
for infrequent flow during sustained periods of elevated precipitation.
Basins E and F were not well characterized but receive water directly from precipitation, direct groundwater discharge to the basin, and perhaps surface-water inflow from adjacent basins during high water events (Graef, Anhalt, Schloemer, and Associates, Inc., 2004b). Basin F also may receive water from flooding of the Des Plaines River. Surface water in these basins flows through rivulets (basin E) or indistinct channels (basin F) whose discharge point is not identified.
Water Use
There are no high-capacity pumping wells within the groundwater recharge area for the Silurian aquifer to the Lock-port Prairie Nature Preserve, but there is one high-capacity well open to the Silurian aquifer within the 0.5 mi buffer of the recharge area (fig. 21). An additional nine high-capacity wells in the Silurian aquifer are within the 2-mi buffer of the Lockport Prairie Nature Preserve recharge area, as is the Quarry. Combined withdrawals from high-capacity wells R#9 and R#12 within the 2-mi buffer increased from about 0.37 Mgal/d in 2000 to more than 0.9 Mgal/d in 2011 (Village of Romeoville, written commun., 2012). Withdrawals from

52 Areas that Affect the Habitat of the Endangered Hine’s Emerald Dragonfly in the Lower Des Plaines River Valley, Illinois
high-capacity wells (CH7, CH9, CH10, CH11) within the 2-mi buffer had an average combined discharge of 1.0 Mgal/d during 2011 and 2012 (City of Crest Hill, written commun., 2012).
Nonpumping water levels collected from well R#9 located west of Weber Road and south of Romeo Road during July and November 2012 appear to have been anomalously low (about 568 ft NAVD 88), indicating this well was pump-ing more water from the Silurian aquifer than was being readily replenished at the time of measurement. The water level collected from well R#12 located at Airport Road west of Weber Road during July and November 2012 (about 604 ft) also was somewhat low in comparison to the nearby AR well (fig. 9).
Water levels in high-capacity wells CH7, CH10, and CH11 taken on July 19, 2012, were substantially lower than the stage of the Des Plaines River at the Lockport Prairie Nature Preserve (tables 1, 2) and nearby shallow monitoring wells (fig. 9). The three-dimensional extent of the pumping effects from these wells within the Silurian aquifer is not known, but the presence of drawdown in nearby monitoring wells CH3A,B and CH2A,B,C indicates pumping effects are present within a few hundred feet of the pumped well, espe-cially in the deeper part of the aquifer. Water-level measure-ments collected from monitoring wells within the groundwater recharge area for the Silurian aquifer to the Lockport Prairie Nature Preserve show no obvious effects from pumping in high-capacity wells. These data do not indicate that pumping from these wells is diverting water from the Lockport Prairie Nature Preserve; however, a detailed assessment of the flow pathways and the location and magnitude of drawdown within the Silurian aquifer associated with pumping from the high-capacity wells would help to clarify the potential effects of pumping on the habitat.
Results of Groundwater ModelingTwo numerical groundwater-flow models have been
developed to simulate the groundwater system in the vicinity of the Lockport Prairie Nature Preserve. The first model was developed by Graef, Anhalt, Schloemer, and Associates, Inc. (2008) to assess the hydrology in the vicinity of the Lockport Prairie Nature Preserve and the effects of urbanization on flow to the Lockport Prairie Nature Preserve. The second model was developed by AECOM (2012, 2013a) and used to assess the effects of proposed future quarry operations on the hydrol-ogy in the vicinity of the Quarry as well as the effectiveness of groundwater mitigation structures. Those aspects of the AECOM model that are pertinent to conditions at the Lockport Prairie Nature Preserve are discussed in this section.
Model Focusing on the Water Resources at the Lockport Prairie Nature Preserve
The discussion in this section is restricted to ground-water modeling performed by Graef, Anhalt, Schloemer,
and Associates, Inc. (2008). This model used MODFLOW (McDonald and Harbaugh, 1984; Harbaugh and McDonald, 1996a,b; Harbaugh and others, 2000) to run flow simulations and MODPATH (Pollock, 1998) to delineate groundwater recharge areas. The model grid has 162 rows with a width of 100 to 500 ft and 124 columns with a width ranging from 25 to 530 ft. The model used 16 layers to simulate various units in the unconsolidated and Silurian deposits. The model encompassed the Crest Hill area west of the CSSC. The model was calibrated to groundwater levels collected in the vicinity of the Lockport Prairie Nature Preserve from 2004 through 2006 and to the rate of flow to the Des Plaines River and other surface-water bodies. Sensitivity analysis was performed. The Silurian aquifer is assumed to function as an equivalent porous medium. A review of this model was performed by the USGS and provided to USFWS (Daniel Feinstein and Douglas Yeskis, U.S. Geological Survey, written commun., 2011). The review concluded this model was professionally constructed with appropriate quality assurance and quality control mea-sures (calibration, verification, scenario testing). The review also concluded that the model does yield output relevant to issues related to representing the groundwater flow system and recharge area and evaluating the effects of a variety of poten-tial stresses to the system. Limitations to the model as applied to this investigation include an inability to provide a detailed simulation of the effects of quarry operations on the hydrol-ogy of the Lockport Prairie Nature Preserve. The absence of accurate field measurements of the volume of discharge from the seeps along the bluffs also limits the ability of the model to simulate this discharge.
Groundwater modeling indicates that during periods of normal or above average precipitation about 36,000 ft3/d of groundwater discharges from the Silurian aquifer to seeps at the bluffs near the Lockport Prairie Nature Preserve, whereas about 11,000 ft3/d of groundwater discharges from the aquifer directly to the wetlands within the Lockport Prairie Nature Preserve. During periods of normal or above average precipi-tation most of the water entering the Lockport Prairie Nature Preserve (at the seeps and in the valley) is recharged to the Silurian aquifer from the glacial drift aquifer near the bluffs west of the Lockport Prairie Nature Preserve. As the amount of recharge from the glacial drift aquifer to the Silurian aquifer decreases, a greater percentage of the groundwater discharge to the Lockport Prairie Nature Preserve originates as recharge to the Silurian aquifer from the semiconfining unit in the western part of the groundwater recharge area and discharges directly to the wetlands. A 50-percent reduction in the rate of recharge to the Silurian aquifer from the glacial drift aquifer, either as a seasonal or drought-related decrease in the amount of precipitation or due to increased runoff of precipitation, results in a simulated decrease in discharge to the seeps and direct discharge to the wetlands of 58 and 24 percent, respec-tively. These simulations are consistent with the water-level monitoring in the Silurian aquifer that indicates flow in the river valley is lower, but more stable, than at the bluffs. These simulations indicate that maintaining recharge to the glacial

Assessment of Conditions that Affect the Water Resources at Selected Hine’s Emerald Dragonfly Habitats 53
drift aquifer along the bluffs near the Lockport Prairie Nature Preserve, and likely other habitats in the Lower Des Plaines River Valley, is crucial to ensuring sufficient water supply to the HED habitat, but that maintaining flow in the rest of the groundwater recharge area also is important as a buffer against drought and other sources of decreased recharge.
Model simulations indicate that pumping at the Quarry and other high-capacity wells in the Silurian aquifer based on 2005 pumping volumes reduced flows to the seeps at Lockport Prairie Nature Preserve by 13–26 percent and to the wetlands in the river valley by 9–14 percent relative to conditions in which there was no pumping. The lower end of the range in the reduction of flow assumes typical recharge, whereas the upper end assumes a 50-percent reduction in recharge. Model simulations of discharge to the Lockport Prairie Nature Pre-serve assuming pumping volumes from the Quarry and nearby high-capacity wells based on 2030 population estimates indicate a decrease in flow to the seeps of 4–9 percent and in direct discharge to the wetlands of 3–4 percent in comparison to 2005 conditions. The effects of this reduction on the HED habitat are outside the scope of the model.
Model Focusing on the Effects of Quarry Operations on the Water Resources at the Lockport Prairie Nature Preserve
The discussion in this section is restricted to the modeling performed by AECOM (2012, 2013a). Simulations performed using this model indicate that the groundwater recharge area for the Lockport Prairie Nature Preserve is just outside of the groundwater capture zone in the Silurian aquifer associated with the maximum impacts of the dewatering of the Quarry at build-out conditions (fig. 11); however, model simulations indicate increased pumping in support of mining the West Quarry Expansion Area will induce as much as 1 ft of draw-down within the groundwater recharge area for the Lockport Prairie Nature Preserve west of Route 53. Groundwater mod-eling also indicates that increased pumping from the Silurian aquifer associated with the expansion of dewatering operations at the West Quarry will induce an estimated maximum of 0.20 ft of drawdown in the Silurian aquifer at the MW-9 well clus-ter in the north-central part of the Lockport Prairie Nature Pre-serve (AECOM, 2013a). The total difference in water levels in the Silurian aquifer within the groundwater recharge area for the Lockport Prairie Nature Preserve exceeds 30 ft based on the July 2012 measurements (fig. 9), so this drawdown will only slightly reduce the hydraulic gradient within that part of the Silurian aquifer flowing to the Lockport Prairie Nature Preserve. Modeling indicates the amount of discharge from the Silurian aquifer to the Lockport Prairie Nature Preserve will decrease from about 16,400 ft3/d at the start of the expan-sion process to about 16,000 ft3/d when mining is completed (AECOM, 2013b). These effects will dissipate once mining in the West Quarry ceases and the West Quarry fills with water.
To offset the effects of increased pumping from the West Quarry Expansion Area on the Lockport Prairie Nature
Preserve, a stormwater retention and infiltration pond has been proposed for construction in part of a former sand and gravel quarry near the northern boundary of the Lockport Prairie Nature Preserve south of Renwick Road and west of Route 53 (fig. 8). This pond will collect runoff from a 186-acre water-shed west of Route 53, enhancing the amount of recharge to the Silurian aquifer along the bluff northwest of the Lockport Prairie Nature Preserve. Simulations indicate that the pond will recharge about 5,660 ft3/d to the Silurian aquifer, exceed-ing the modeled decrease in flow from the aquifer to the Lock-port Prairie Nature Preserve associated with increased pump-ing at the West Quarry Expansion Area (AECOM, 2013a).
Water QualityThere were numerous surface-water sampling efforts
during 1991–2001 at the Lockport Prairie Nature Preserve (table 8). Surface-water samples were collected from four locations at the Lockport Prairie Nature Preserve during 1991 (Cashatt and Vogt, 1992). The sample location(s) and precise date of sampling are not described. Measurements of surface-water temperature, specific conductance, hardness, pH, and dissolved oxygen (DO) were taken approximately weekly at three locations (upstream, midstream, downstream) in each of three rivulets from May 26 through July 29, 1993 (Lin and others, 1993). The locations of the measurement sites are not precisely known, but the rivulets are described as being close to the river and on the north (near culvert 4) and south (near culvert 5) sides of the road next to the railroad tracks (fig. 17). Surface-water samples were collected approximately monthly from August 1997 through November 1998 and from April through December 2001 at culverts 2 and 5 (fig. 17) and at an unspecified seep described as being near Route 53 (Soluk and others, 1999; Soluk and Moss, 2002). These samples were analyzed for a variety of metals, field parameters, nutrients, major ions, and general water-quality indicators.
Calcium was the cation present at the highest concen-trations at every site. Bicarbonate, as indicated by the high alkalinity values, was the dominant anion. Alkalinity values showed an overall increase from April through December at the seep near Route 53 and at culverts 2 and 5 (table 8). Seasonal changes in concentrations of sulfate, sodium, and magnesium also were observed, particularly in the 1997 and 1998 sampling at the seep and culvert 5. The timing of these seasonal changes was not uniform between constituents or locations. Seasonal changes in geochemically sensitive con-stituents, such as sulfate, where present, may reflect variations in the intensity of microbiologic activity and sources of water.
Chloride concentrations next to the road at culvert 2 (geo-metric mean 128 mg/L) were higher than at culvert 5 (geomet-ric mean 66 mg/L) and the seep (geometric mean 42 mg/L). The presence of elevated chloride at culvert 2, which is near Division Street, likely indicates the increased presence of overland runoff of precipitation and snowmelt affected by the application of road salt at culvert 2 relative to culvert 5. Much of the water at culvert 5 likely is derived from the groundwater

54 Areas that Affect the Habitat of the Endangered Hine’s Emerald Dragonfly in the Lower Des Plaines River Valley, IllinoisTa
ble
8.
Conc
entra
tion
of s
elec
ted
cons
titue
nts
in s
urfa
ce w
ater
at t
he L
ockp
ort P
rairi
e N
atur
e Pr
eser
ve, W
ill C
ount
y, Il
linoi
s, 1
991
thro
ugh
2001
.
[mg/
L, m
illig
ram
per
lite
r; C
aCO
3, ca
lciu
m c
arbo
nate
; <, l
ess t
han;
--, n
o da
ta; b
old
deno
tes e
xcee
danc
e of
crit
eria
]
Dat
e A
lkal
inity
, in
mg/
L as
Ca
CO3
Sulfa
te,
in m
g/L
Chlo
ride
, in
mg/
LCa
lciu
m,
in m
g/L
Mag
nesi
um,
in m
g/L
Sodi
um,
in m
g/L
Iron
, in
mg/
L
Nitr
ate
as
nitr
ogen
, in
mg/
L
pH,
in s
tand
ard
units
Man
gane
se,
in m
g/L
Site
1, p
reci
se lo
catio
n an
d sa
mpl
ing
date
unk
now
n (d
ata
from
Cas
hatt
and
Vogt
, 199
2)
1991
272
6765
9341
310.
2931
8.0
0.01
3
Site
2, p
reci
se lo
catio
n an
d sa
mpl
ing
date
unk
now
n (d
ata
from
Cas
hatt
and
Vogt
, 199
2)
1991
263
6872
104
4031
0.12
388.
0<0
.004
Site
3, p
reci
se lo
catio
n an
d sa
mpl
ing
date
unk
now
n (d
ata
from
Cas
hatt
and
Vogt
, 199
2)
1991
290
8665
9743
260.
2022
8.2
0.02
0
Site
4, p
reci
se lo
catio
n an
d sa
mpl
ing
date
unk
now
n (d
ata
from
Cas
hatt
and
Vogt
, 199
2)
1991
421
249
9447
1510
<0.1
7.8
0.43
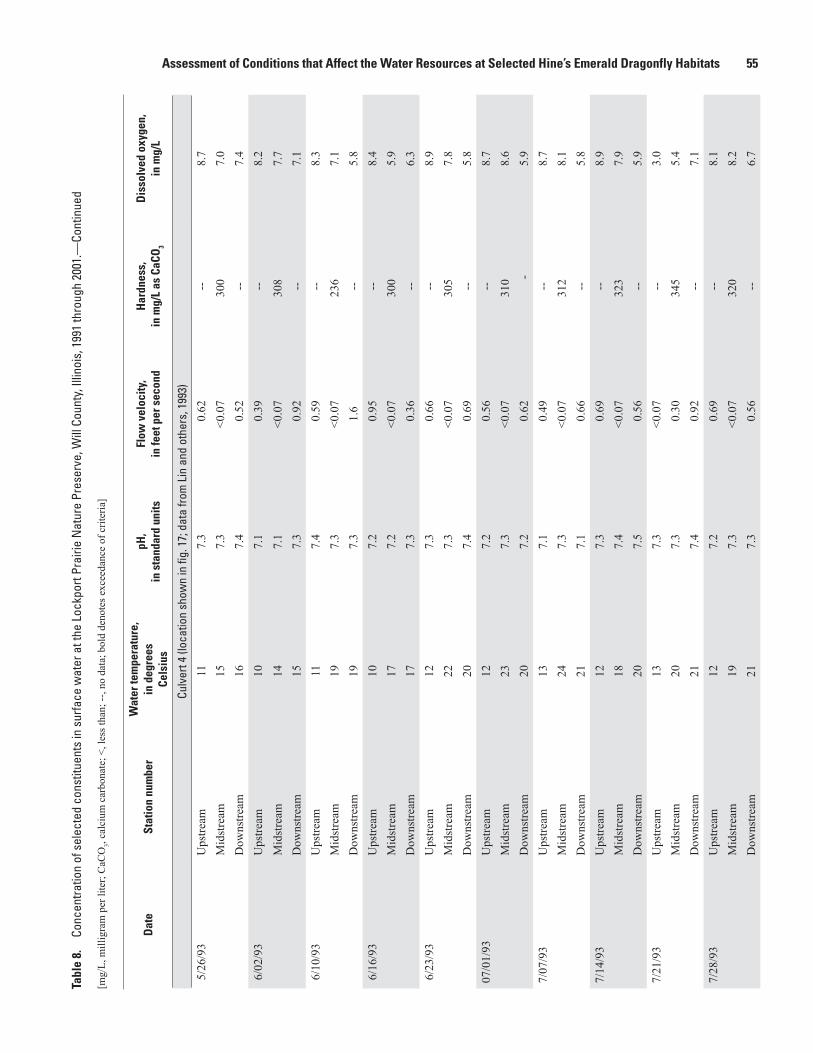
Assessment of Conditions that Affect the Water Resources at Selected Hine’s Emerald Dragonfly Habitats 55Ta
ble
8.
Conc
entra
tion
of s
elec
ted
cons
titue
nts
in s
urfa
ce w
ater
at t
he L
ockp
ort P
rairi
e N
atur
e Pr
eser
ve, W
ill C
ount
y, Il
linoi
s, 1
991
thro
ugh
2001
.—Co
ntin
ued
[mg/
L, m
illig
ram
per
lite
r; C
aCO
3, ca
lciu
m c
arbo
nate
; <, l
ess t
han;
--, n
o da
ta; b
old
deno
tes e
xcee
danc
e of
crit
eria
]
Dat
eSt
atio
n nu
mbe
rW
ater
tem
pera
ture
, in
deg
rees
Ce
lsiu
s
pH,
in s
tand
ard
units
Flow
vel
ocity
, in
feet
per
sec
ond
Har
dnes
s,
in m
g/L
as C
aCO
3
Dis
solv
ed o
xyge
n,
in m
g/L
Culv
ert 4
(loc
atio
n sh
own
in fi
g. 1
7; d
ata
from
Lin
and
oth
ers,
199
3)
5/2
6/93
Ups
tream
117.
30.
62--
8.7
Mid
stre
am15
7.3
<0.0
730
07.
0D
owns
tream
167.
40.
52--
7.4
6/0
2/93
Ups
tream
107.
10.
39--
8.2
Mid
stre
am14
7.1
<0.0
730
87.
7D
owns
tream
157.
30.
92--
7.1
6/1
0/93
Ups
tream
117.
40.
59--
8.3
Mid
stre
am19
7.3
<0.0
723
67.
1D
owns
tream
197.
31.
6--
5.8
6/1
6/93
Ups
tream
107.
20.
95--
8.4
Mid
stre
am17
7.2
<0.0
730
05.
9D
owns
tream
177.
30.
36--
6.3
6/2
3/93
Ups
tream
127.
30.
66--
8.9
Mid
stre
am22
7.3
<0.0
730
57.
8D
owns
tream
207.
40.
69--
5.8
07/0
1/93
Ups
tream
127.
20.
56--
8.7
Mid
stre
am23
7.3
<0.0
731
08.
6D
owns
tream
207.
20.
62-
5.9
7/07
/93
Ups
tream
137.
10.
49--
8.7
Mid
stre
am24
7.3
<0.0
731
28.
1D
owns
tream
217.
10.
66--
5.8
7/14
/93
Ups
tream
127.
30.
69--
8.9
Mid
stre
am18
7.4
<0.0
732
37.
9D
owns
tream
207.
50.
56--
5.9
7/21
/93
Ups
tream
137.
3<0
.07
--3.
0M
idst
ream
207.
30.
3034
55.
4D
owns
tream
217.
40.
92--
7.1
7/28
/93
Ups
tream
127.
20.
69--
8.1
Mid
stre
am19
7.3
<0.0
732
08.
2D
owns
tream
217.
30.
56--
6.7

56 Areas that Affect the Habitat of the Endangered Hine’s Emerald Dragonfly in the Lower Des Plaines River Valley, IllinoisTa
ble
8.
Conc
entra
tion
of s
elec
ted
cons
titue
nts
in s
urfa
ce w
ater
at t
he L
ockp
ort P
rairi
e N
atur
e Pr
eser
ve, W
ill C
ount
y, Il
linoi
s, 1
991
thro
ugh
2001
.—Co
ntin
ued
[mg/
L, m
illig
ram
per
lite
r; C
aCO
3, ca
lciu
m c
arbo
nate
; <, l
ess t
han;
--, n
o da
ta; b
old
deno
tes e
xcee
danc
e of
crit
eria
]
Dat
eSt
atio
n nu
mbe
rW
ater
tem
pera
ture
, in
deg
rees
Ce
lsiu
s
pH,
in s
tand
ard
units
Flow
vel
ocity
, in
feet
per
sec
ond
Har
dnes
s,
in m
g/L
as C
aCO
3
Dis
solv
ed o
xyge
n,
in m
g/L
Culv
ert 3
(loc
atio
n sh
own
in fi
g. 1
7; d
ata
from
Lin
and
oth
ers,
199
3)
5/2
6/93
Ups
tream
127.
60.
72--
7.4
Mid
stre
am14
7.6
0.56
328
8.1
Dow
nstre
am14
7.6
0.23
--8.
8
6/0
2/93
Ups
tream
127.
20.
49--
8.6
Mid
stre
am12
7.3
0.33
330
7.1
Dow
nstre
am12
7.4
0.33
--7.
9 6
/10/
93U
pstre
am13
7.6
0.92
--8.
2M
idst
ream
147.
80.
7535
28.
5D
owns
tream
157.
70.
20--
8.3
6/1
6/93
Ups
tream
137.
50.
66--
7.5
Mid
stre
am15
7.6
0.95
380
7.1
Dow
nstre
am16
7.6
0.56
--7.
5 6
/23/
93U
pstre
am15
7.5
0.62
--7.
3M
idst
ream
177.
60.
9234
57.
7D
owns
tream
187.
60.
49--
7.4
7/01
/93
Ups
tream
167.
40.
69--
7.1
Mid
stre
am17
7.5
0.85
362
7.7
Dow
nstre
am17
7.6
0.59
--7.
47/
07/9
3U
pstre
am15
7.4
0.79
--7.
1M
idst
ream
177.
81.
036
27.
8D
owns
tream
177.
50.
69--
7.5
7/14
/93
Ups
tream
157.
30.
69--
7.3
Mid
stre
am18
7.7
0.85
335
7.7
Dow
nstre
am19
7.8
0.59
--7.
87/
21/9
3U
pstre
am19
7.3
0.75
--6.
9M
idst
ream
217.
60.
9833
27.
5D
owns
tream
207.
40.
43--
7.7
7/28
/93
Ups
tream
167.
20.
62--
7.0
Mid
stre
am17
7.4
0.85
328
7.9
Dow
nstre
am18
7.6
0.59
--7.
4

Assessment of Conditions that Affect the Water Resources at Selected Hine’s Emerald Dragonfly Habitats 57Ta
ble
8.
Conc
entra
tion
of s
elec
ted
cons
titue
nts
in s
urfa
ce w
ater
at t
he L
ockp
ort P
rairi
e N
atur
e Pr
eser
ve, W
ill C
ount
y, Il
linoi
s, 1
991
thro
ugh
2001
.—Co
ntin
ued
[mg/
L, m
illig
ram
per
lite
r; C
aCO
3, ca
lciu
m c
arbo
nate
; <, l
ess t
han;
--, n
o da
ta; b
old
deno
tes e
xcee
danc
e of
crit
eria
]
Dat
eSt
atio
n nu
mbe
rW
ater
tem
pera
ture
, in
deg
rees
Ce
lsiu
s
pH,
in s
tand
ard
units
Flow
vel
ocity
, in
feet
per
sec
ond
Har
dnes
s,
in m
g/L
as C
aCO
3
Dis
solv
ed o
xyge
n,
in m
g/L
Surfa
ce w
ater
clo
se to
Des
Pla
ines
Riv
er (p
reci
se lo
catio
n un
know
n; d
ata
from
Lin
and
oth
ers,
199
3)
5/2
6/93
Ups
tream
177.
5<0
.07
--4.
4M
idst
ream
137.
50.
4335
66.
8
Dow
nstre
am12
7.2
0.95
--7.
5
6/0
2/93
Ups
tream
177.
0<0
.07
--3.
0M
idst
ream
147.
30.
5936
06.
7D
owns
tream
147.
40.
75--
7.6
6/1
0/93
Ups
tream
187.
2<0
.07
--3.
5M
idst
ream
177.
50.
4632
07.
4D
owns
tream
167.
51.
5--
6.9
6/1
6/93
Ups
tream
207.
2<0
.07
--3.
1M
idst
ream
197.
40.
5634
07.
8D
owns
tream
197.
30.
98--
7.5
6/2
3/93
Ups
tream
237.
1<0
.07
--2.
2M
idst
ream
197.
60.
7235
06.
7D
owns
tream
197.
41.
1--
7.0
7/01
/93
Ups
tream
177.
2<0
.07
--3.
5M
idst
ream
167.
30.
4335
67.
0D
owns
tream
167.
31.
1--
6.9
7/07
/93
Ups
tream
237.
0<0
.07
--2.
8M
idst
ream
227.
20.
3935
45.
8D
owns
tream
217.
51.
0--
6.9
7/14
/93
Ups
tream
187.
1<0
.07
--2.
8M
idst
ream
177.
20.
3333
25.
7D
owns
tream
167.
40.
85--
7.0
7/21
/93
Ups
tream
197.
0<0
.07
--3.
0M
idst
ream
177.
30.
2934
55.
4D
owns
tream
167.
40.
92--
7.1
7/28
/93
Ups
tream
217.
1<0
.07
--2.
8M
idst
ream
207.
10.
2636
85.
3D
owns
tream
207.
51.
1--
7.4

58 Areas that Affect the Habitat of the Endangered Hine’s Emerald Dragonfly in the Lower Des Plaines River Valley, IllinoisTa
ble
8.
Conc
entra
tion
of s
elec
ted
cons
titue
nts
in s
urfa
ce w
ater
at t
he L
ockp
ort P
rairi
e N
atur
e Pr
eser
ve, W
ill C
ount
y, Il
linoi
s, 1
991
thro
ugh
2001
.—Co
ntin
ued
[mg/
L, m
illig
ram
per
lite
r; C
aCO
3, ca
lciu
m c
arbo
nate
; <, l
ess t
han;
--, n
o da
ta; b
old
deno
tes e
xcee
danc
e of
crit
eria
]
Dat
e A
lkal
inity
, in
mg/
L as
Ca
CO3
Sulfa
te,
in m
g/L
Chlo
ride
, in
mg/
LCa
lciu
m,
in m
g/L
Mag
nesi
um,
in m
g/L
Sodi
um,
in m
g/L
Iron
, in
mg/
L
Nitr
ate
as
nitr
ogen
, in
mg/
L
Dis
solv
ed
oxyg
en,
in m
g/L
Man
gane
se,
in m
g/L
Culv
ert 5
(loc
atio
n sh
own
in fi
g. 1
7; d
ata
from
Sol
uk a
nd o
ther
s, 1
999;
Sol
uk a
nd M
oss,
200
2)
8/21
/97
328
8049
109
5224
0.34
0.09
2.5
0.25
9/24
/97
328
1757
8343
210.
140.
132.
70.
01
10/3
0/97
309
2756
7940
190.
120.
203.
3<0
.01
11/1
9/97
344
2457
9248
240.
270.
076.
30.
04
12/1
7/97
308
4758
9547
250.
170.
84--
0.07
1/30
/98
250
5975
8947
36<0
.04
3.1
9.7
<0.0
1
3/26
/98
233
5612
191
4553
0.04
1.6
6.1
<0.0
1
4/29
/98
244
3577
7637
37<0
.04
1.0
7.7
<0.0
1
5/21
/98
264
2578
7237
390.
040.
504.
20.
03
6/19
/98
289
1053
7737
280.
150.
303.
00.
13
7/23
/98
352
1045
153
4325
0.11
<0.0
13.
50.
26
8/25
/98
422
748
107
5245
0.37
<0.0
14.
30.
50
9/15
/98
410
350
103
5128
0.20
0.01
4.7
0.37
10/3
0/98
347
1056
9447
280.
230.
082.
30.
13
11/1
9/98
341
1656
9246
280.
020.
326.
60.
14
4/23
/01
148
3989
5637
380.
070.
656.
70.
01
5/11
/01
306
3370
9247
42<0
.01
0.77
9.3
<0.0
04
6/1
6/01
319
2675
9445
38<0
.01
0.49
3.1
0.00
4
7/26
/01
363
2753
101
4931
0.04
0.06
1.3
<0.0
02
08/2
9/01
----
----
----
<0.0
1--
----
09/2
8/01
424
4473
127
6035
<0.0
10.
011.
70.
23
10/2
9/01
260
8815
1--
----
<0.0
10.
526.
4--
12/2
0/01
548
6588
----
--<0
.01
0.58
8.7
--

Assessment of Conditions that Affect the Water Resources at Selected Hine’s Emerald Dragonfly Habitats 59Ta
ble
8.
Conc
entra
tion
of s
elec
ted
cons
titue
nts
in s
urfa
ce w
ater
at t
he L
ockp
ort P
rairi
e N
atur
e Pr
eser
ve, W
ill C
ount
y, Il
linoi
s, 1
991
thro
ugh
2001
.—Co
ntin
ued
[mg/
L, m
illig
ram
per
lite
r; C
aCO
3, ca
lciu
m c
arbo
nate
; <, l
ess t
han;
--, n
o da
ta; b
old
deno
tes e
xcee
danc
e of
crit
eria
]
Dat
e A
lkal
inity
, in
mg/
L as
Ca
CO3
Sulfa
te,
in m
g/L
Chlo
ride
, in
mg/
LCa
lciu
m,
in m
g/L
Mag
nesi
um,
in m
g/L
Sodi
um,
in m
g/L
Iron
, in
mg/
L
Nitr
ate
as
nitr
ogen
, in
mg/
L
Dis
solv
ed
oxyg
en,
in m
g/L
Man
gane
se,
in m
g/L
Culv
ert 2
(loc
atio
n sh
own
in fi
g. 1
7; d
ata
from
Sol
uk a
nd o
ther
s, 1
999;
Sol
uk a
nd M
oss,
200
2)
8/21
/97
357
155
109
144
6164
0.04
0.51
7.9
0.04
9/24
/97
362
143
116
131
5458
0.05
0.43
7.8
0.03
10/3
0/97
371
146
103
124
5046
<0.0
10.
428.
30.
02
11/1
9/97
368
143
100
127
5556
<0.0
10.
418.
80.
02
12/1
7/97
357
129
100
130
5653
0.03
0.39
--0.
03
1/30
/98
335
133
9212
957
60<0
.01
0.60
10.
<0.0
1
3/26
/98
307
110
102
130
5476
0.05
1.6
7.5
<0.0
1
4/29
/98
312
9915
511
549
67<0
.01
1.0
8.1
<0.0
1
5/21
/98
345
8514
711
248
690.
031.
05.
90.
03
6/19
/98
359
7315
111
750
670.
031.
16.
50.
05
7/23
/98
383
8212
318
053
650.
022.
07.
10.
14
8/25
/98
372
9312
813
355
650.
051.
36.
90.
10
9/15
/98
386
9512
613
157
66<0
.01
1.1
7.2
0.05
10/3
0/98
374
117
125
135
5970
0.07
0.8
6.2
0.04
11/1
9/98
362
117
138
128
5665
0.05
0.8
10.2
0.04
4/23
/01
165
7313
264
4450
0.01
4.0
8.5
0.00
3
5/11
/01
300
8613
411
055
71<0
.01
3.7
8.9
<0.0
02
6/16
/01
345
8515
914
457
78<0
.01
0.67
6.0
0.00
9
7/26
/01
361
205
160
136
5981
<0.0
10.
646.
40.
004
8/29
/01
352
111
158
146
6074
<0.0
10.
556.
10.
050
9/28
/01
376
112
156
146
6181
<0.0
10.
447.
30.
058
10/2
9/01
289
113
158
----
--<0
.01
0.33
5.1
--
12/2
0/01
732
106
120
----
--<0
.01
0.57
6.9
--

60 Areas that Affect the Habitat of the Endangered Hine’s Emerald Dragonfly in the Lower Des Plaines River Valley, IllinoisTa
ble
8.
Conc
entra
tion
of s
elec
ted
cons
titue
nts
in s
urfa
ce w
ater
at t
he L
ockp
ort P
rairi
e N
atur
e Pr
eser
ve, W
ill C
ount
y, Il
linoi
s, 1
991
thro
ugh
2001
.—Co
ntin
ued
[mg/
L, m
illig
ram
per
lite
r; C
aCO
3, ca
lciu
m c
arbo
nate
; <, l
ess t
han;
--, n
o da
ta; b
old
deno
tes e
xcee
danc
e of
crit
eria
]
Dat
e A
lkal
inity
, in
mg/
L as
Ca
CO3
Sulfa
te,
in m
g/L
Chlo
ride
, in
mg/
LCa
lciu
m,
in m
g/L
Mag
nesi
um,
in m
g/L
Sodi
um,
in m
g/L
Iron
, in
mg/
L
Nitr
ate
as
nitr
ogen
, in
mg/
L
Dis
solv
ed
oxyg
en,
in m
g/L
Man
gane
se,
in m
g/L
Seep
nea
r Rou
te 5
3 (p
reci
se lo
catio
n un
know
n; d
ata
from
Sol
uk a
nd o
ther
s, 1
999;
Sol
uk a
nd M
oss,
200
2)
8/21
/97
234
6069
8946
310.
039.
810
.6--
9/24
/97
229
5228
7437
11<0
.02
9.7
9.8
--
10/3
0/97
228
4439
6934
16<0
.02
6.5
9.2
--
11/1
9/97
224
3927
7136
22<0
.02
5.4
9.2
--
12/1
7/97
235
3638
7236
17<0
.02
5.1
---
1/30
/98
224
3535
8040
23<0
.02
12.0
10.1
--
3/26
/98
205
3711
279
3859
<0.0
210
.010
.8--
4/29
/98
187
3741
6532
20<0
.02
8.0
11.2
--
5/21
/98
197
3649
5930
38<0
.02
7.9
7.5
--
6/19
/98
186
3624
6031
12<0
.02
7.2
13.7
--
7/23
/98
196
3719
149
3210
<0.0
27.
010
.4--
8/25
/98
202
3718
6034
9<0
.02
6.0
10.6
--
9/15
/98
210
3520
6232
12<0
.02
5.0
8.6
--
10/3
0/98
235
3528
6835
21<0
.02
4.3
10.1
--
11/1
9/98
241
3419
6735
16<0
.02
4.1
11.2
--
4/23
/01
124
3612
441
3351
0.04
3.8
9.4
<0.0
2
5/11
/01
209
4682
8339
44<0
.01
4.3
8.8
0.00
7
6/16
/01
214
4691
7638
47<0
.01
4.3
9.3
<0.0
02
7/26
/01
214
4838
7037
22<0
.01
4.7
9.5
<0.0
02
8/29
/01
221
4969
7539
37<0
.01
5.0
9.3
<0.0
04
9/28
/01
233
4970
7638
43<0
.01
4.1
9.3
<0.0
04
10/2
9/01
186
4111
7--
----
<0.0
17.
39.
4--
12/2
0/01
388
4825
----
--<0
.01
3.9
7.6
--

Assessment of Conditions that Affect the Water Resources at Selected Hine’s Emerald Dragonfly Habitats 61
that has discharged to the seeps, with a small amount of water derived from overland runoff. Chloride concentrations showed no clear temporal trends; however, the high chloride concen-trations likely indicate the presence of effects from road salts.
Nitrate concentrations substantially exceeded the MCL of 10 mg/L in three of the samples collected during 1991 (Cashatt and Vogt, 1992) and in several samples collected from the seep near Route 53 during 1998 (Soluk and others, 1999). The elevated concentration of nitrate at the seep likely indicates fertilizer application in the recharge area for the seep (likely over the glacial drift aquifer) is affecting water quality. Nitrate concentrations in 1997–2001 at the culverts typically were higher during the spring than the rest of the monitoring period and (as was the case with chloride concentrations) were higher at culvert 2 than at culvert 5. Nitrate concentrations in many of these samples are high enough to indicate the effects of fertilizers on surface water and shallow groundwater in the vicinity of the Lockport Prairie Nature Preserve. Seasonal trends in nitrate concentrations at the culverts may reflect the presence of increased amounts of fertilizer-affected runoff during the spring. Ammonia typically was not detected (detec-tion limit of 0.01 mg/L) during the sampling, except during April 2001, when it was detected at all three sampling sites at concentrations ranging from 0.01 to 0.07 mg/L, potentially reflecting the presence of fertilize-affected runoff.
Water-quality data from the culverts and seep likely indi-cate seasonal differences in the water sources to the Lockport Prairie Nature Preserve. During a typical year, water quality at the seep would be most affected by the chemistry of the water recharging the glacial drift aquifer during the winter and spring and increasingly by the water quality of the semiconfin-ing unit during the summer and fall. Water quality at culvert 2 may have contained a higher percentage of water derived from overland runoff of precipitation during the winter months in comparison to the seep and culvert 5. These sources could have resulted in increased chloride and decreased alkalinity during the winter and spring in comparison to the rest of the year. The variations in the amount of water from different sources (overland runoff of precipitation and groundwater) may affect the quality of the water in the wetland and thereby the HED habitat.
Water temperatures tended to be lower at the upstream parts of the rivulets in the western part of the Lockport Prairie Nature Preserve than in the downstream areas and near the Des Plaines River (table 8). Cooler water may be associated with proximity to the seeps and other areas of groundwater discharge.
Concentrations of DO typically were above 2.0 mg/L, making these waters slightly oxic. Concentrations of DO showed no consistent spatial pattern or temporal trends.
Additional analyses for phosphorous, mercury, and trace metals was done (Cashatt and Vogt, 1992; Soluk and others, 1999; Soluk and Moss, 2002). With the exception of manga-nese (<0.02–0.37 mg/L) and phosphorus (<0.01–0.11 mg/L), these compounds either were not detected, or were detected at concentrations below regulatory criteria.
Concentrations of manganese exceeded the aquatic life chronic threshold (table 3) in several samples from culverts 2 and 5 and in one of the samples collected during 1991. The MCL for nitrate was exceeded in most of the samples col-lected during 1991 and in some of the seep samples. Phospho-rous concentrations (not shown in table 8) exceeded the EPA criteria for flowing water in one sample from culvert 5.
Continuous Monitoring of Groundwater
Continuous measurements of groundwater temperature and specific conductance were collected from March 28, 2012, through February 24, 2014, in well MW-9B (fig. 20). Ground-water temperatures showed seasonal variation, increasing from about 7 °C in February or March to about 16 °C in September. This trend likely is an effect of the conductive transfer of heat from the atmosphere and soil (Taylor and Stefan, 2009). Specific conductance values in well MW-9B showed a small overall decrease but were generally stable at 1,220 to 1,300 microsiemens per centimeter at 25 degrees Celsius (µS/cm). Specific conductance values often showed small decreases during periods of increased water levels, reflecting the pres-ence of low-conductivity precipitation in the groundwater.
Future Monitoring
Land use in the drainage area for the proposed infiltration pond north of the Lockport Prairie Nature Preserve indi-cates that water in the pond could be affected by runoff from roadways and a golf course south of Renwick Road and west of Route 53. The effect of these land uses on the quality of the water in the pond, and the effect of recharge of this water on the quality of the groundwater (including temperature) entering the Lockport Prairie Nature Preserve, is not known. Pond water and downgradient groundwater will be sampled periodically by the Quarry operators to evaluate the effect of water from the infiltration pond on the HED habitat (Hanson Material Service Corporation, 2016).
Assessment of Water Resources at the Com Ed and Long Run Parcels
The Com Ed and adjacent Long Run Parcels occupy about 300 acres east of the Illinois and Michigan Canal, approximately 0.5 mi south of Romeo Road, and west of New Avenue (figs. 1, 22). A railroad is located along the eastern edge of the parcels. Buried oil pipelines are present along the railroad tracks and at the boundary between the parcels.
A subterranean pipeline break occurred on December 14, 2010, just north of the boundary between the parcels (fig. 22; Groundwater and Environmental Services, Inc., 2017). Crude oil from this break drained to a ditch along New Avenue, through a culvert that drains to a depression along the bound-ary between the parcels, to a marsh in the northeast part of the Long Run Parcel that currently (2018) is a pond created by the excavation of sediment down into bedrock. Oil from this leak

62 Areas that Affect the Habitat of the Endangered Hine’s Emerald Dragonfly in the Lower Des Plaines River Valley, Illinois
578
578
578
588
586584
592
588
588
584
586
588
095
095
584
685
586
584
588
584
586
586
584
584
586
588
586
584582
600
600
602
596
586
586
584
584
586
586
586584
Com EdParcel
Long Run Parcel
HIG
H R
OA
D
Approximatearea ofpipeline break
Chi
cago
San
itary
and
Shi
p C
anal
Illin
ois a
nd M
ichi
gan
Can
al
South Ditch
Long Run
Creek
BruceLake
Com EdParcel
Long Run Parcel
HIG
H R
OA
D
Approximatearea ofpipeline break
Long
BruceLake
Run
Creek
Chi
cago
San
itary
and
Shi
p C
anal
Illin
ois a
nd M
ichi
gan
Can
al
South Ditch
NEW
AVE
NU
E
RAIL
ROA
D T
RACK
88°03'20"88°03'30"88°03'40"88°03'50"
41°38'10"
41°38'
41°37'50"
41°37'40"
41°37'30"
41°37'20"
88°02'50"88°03'88°03'10"
CEP-2S586.5584.5584.76585.49
CEP-2D586.4584.3584.63585.54CEP-4S
583.7577.8
579.07582.05
CEP-10S––
580.78584.56
LRW1
LRS1
CEP-3S591.2589.5589.49590.46
CEP-3D591.3589.5590.07590.8
CEP-4D583.6577.7578.99582.01
CEP-7S
585.65586.66
CEP-9WT––585.66586.59
CEW2
CEP-11S––
580.45584.15
CEP-12S––584.28587.51
CEP-11D––580.43584.00
CEP-5S583.5578.1578.49580.17
CEP-1S587583.5584.58586.16
CEP-6S––
584.89586.01
CEP-8WT––586.09586.82
CES2
CEP-1D587
583.5584.58586.43
––
WL4585.0
<581.0
WL5585.0<581.0––
––
WL3585.0<581.0––
CEW1
––
587.5<586.27
CEP-2S586.5584.5584.76585.49
CEP-2D586.4584.3584.63585.54CEP-4S
583.7577.8
579.07582.05
CEP-10S––
580.78584.56
LRW1
LRS1
CEP-3S591.2589.5589.49590.46
CEP-3D591.3589.5590.07590.8
CEP-4D583.6577.7578.99582.01
CEP-7S
585.65586.66
CEP-9WT––585.66586.59
CEW2
CEP-11S––
580.45584.15
CEP-12S––584.28587.51
CEP-11D––580.43584.00
CEP-5S583.5578.1578.49580.17
CEP-1S587583.5584.58586.16
CEP-6S––
584.89586.01
CEW1
––
587.5<586.27
CEP-8WT––586.09586.82
CEP-1D587
583.5584.58586.43
––
CES2
WL4585.0
<581.0
WL5585.0<581.0––
––
WL3585.0<581.0––
Wetland depression
Excavated sediment
Pond
Parcel boundary
Drainage
Rivulet
Streamgage location and name with: High water level Low water levelWell location and name with: High water level Low water level July 19, 2012, water level November 26, 2012, water level
CEP-3S591.2589.5589.49590.46
EXPLANATION
WL3585.0<581.0
Note: Water-level datum is North American Vertical Datumof 1988
586 Line of equal elevation— Contour interval is 2 feet. Datum is North American Vertical Datum of 1988
590
Orthography from Esri World Imagery for Chicago, 2011Map image is the intellectual property of Esri and is used herein under license. Copyright © 2017 Esri and its licensors. All rights reserved.
0 0.1 0.2 MILE
0 0.1 0.2 KILOMETER
Figure 22. Location of selected features and water-level data at the Com Ed and Long Run Parcels, Will County, Illinois.

Assessment of Conditions that Affect the Water Resources at Selected Hine’s Emerald Dragonfly Habitats 63
entered surface water, sediments, and groundwater, mostly near the boundary between the parcels. The leak is being remediated, partly by excavation of contaminated sediment, but some residual oil remains.
Topography
The area east of the Com Ed and Long Run Parcels (fig. 22) is bluff rising in elevation from about 590 ft NAVD 88 near New Avenue to more than 650 ft near High Road (fig. 4). The parcel itself consists of flat land surface with an elevation between about 591 ft in the northeastern edge of the parcel to 584 ft near the Illinois and Michigan Canal. The ele-vation of most of the parcel is between about 587 and 584 ft. The Illinois and Michigan Canal is a vertical drop of 5–7 ft from the western edge of the Com Ed and Long Run Parcels. Excavation to remove contaminated sediment in the northeast part of the Long Run Parcel has lowered the land surface in this area from natural, pre-spill conditions, potentially altering the hydrology.
Biology
Larval HED use was documented during August 2011 at crayfish burrows near the pond south of well CEP-10S (Brown and Soluk, 2012; Soluk and Mierzwa, 2012; fig. 22). Adult HED use has been documented in the vicinity of rivulets in the eastern part of the Com Ed Parcel and the northern part of the Long Run Parcel (fig. 2). Adult use includes perching, transit, territorial patrol, and breeding (Mierzwa and Webb, 2010; Soluk and Mierzwa, 2012). Some of these areas were affected by the oil spill. The leafy prairie clover (Dalea foliosa) inhab-its the site but is mainly present in the drier portion of the Com Ed Parcel. The Blanding’s turtle (Emys blandingii) also inhabits the Com Ed and Long Run Parcel but little is known regarding the species use of the site.
Hydrogeology
Groundwater is present in parts of the alluvial deposits that constitute the alluvial aquifer and the underlying Silurian aquifer within the Com Ed and Long Run Parcels. These units are hydraulically connected to each other and to the surface-water bodies.
Alluvial Aquifer
The alluvial deposits at the Com Ed and Long Run Par-cels consist of 1–2 ft of sand. Alluvial sands were excavated prior to the oil spill in areas within the north-central part of the Com Ed Parcel and after the oil spill in the northeast part of the Long Run Parcel (AECOM, 2011, 2013b). Hydric soils are present in wetland areas where the alluvial deposits have not been excavated (Hanson Material Service Corporation, 2016).
Continuous measurements of groundwater levels were taken from April 2006 through December 2012 in wells CEW1 and LRW1, which are open to the alluvial aquifer (Applied Ecological Services, Inc., 2012, 2013). Water levels in well CEW1 typically were below the sensor, indicating that the alluvial deposits typically were unsaturated in the north-central part of the Com Ed Parcel. Water levels occasionally rose to within about 0.3 ft of land surface for short periods following precipitation events in the fall through spring. Sum-mer precipitation events typically did not produce an increase in water levels sufficient to raise the water level to the level of the sensor. Water levels in well LRW1 typically were within 1.5 ft of land surface during the fall through spring, occasion-ally increasing to above land surface for short periods follow-ing precipitation events during the fall through spring. Water levels typically were below the sensor (more than 2 ft below land surface) during the summer months, even following precipitation events.
Silurian Aquifer
At the Com Ed and Long Run Parcels, the top of the Silurian dolomite is present at about 583–591 ft NAVD 88, generally decreasing from east to west. The Silurian aquifer at the Com Ed and Long Run Parcels has a horizontal hydraulic conductivity ranging from 2.1 × 10⁻¹ to 1.0 × 101 ft/d (STS/AECOM, 2009). The geometric mean horizontal hydraulic conductivity value for the upper 25 ft of the aquifer was 2.1 × 100 ft/d and was 1.0 × 10⁻¹ ft/d for the deeper part. These values are indicative of moderately low to moderately high aquifer permeability, with the shallow part of the Silurian aquifer being more permeable than the deep part.
Periodic measurements of groundwater levels in wells open to the Silurian aquifer from October 2005 through November 2013 indicate that the overall direction of ground-water flow in this area is from east to west, approximately per-pendicular to the Illinois and Michigan Canal (figs. 9, 10; STS Consultants, 2007; STS/AECOM, 2009; AECOM, 2013a). These data, combined with continuous monitoring data from May 2011 through April 2012 (AECOM, 2013a), indicate that water levels in the Silurian aquifer (1) were lowest during the summer and highest during winter and spring, (2) often exceeded the elevation of land surface during the spring and fall, and (3) indicate periodic discharge from the Silurian aquifer to the wetlands. The lowest water levels were observed during drought conditions in October through December 2005 and were less than about 3.5 ft below their highest recorded level at the CEP-1 and CEP-2 well clusters. Groundwater levels in the Silurian aquifer also tended to show progressively more variation from the eastern part of the parcel (about 2.5 ft) to the western part (about 6 ft) (AECOM, 2013a), reflecting the effects of increased drainage from the aquifer to the Illi-nois and Michigan Canal with proximity to the canal.
Water levels in Silurian-aquifer wells CEP-1S,D often exceeded the stage of nearby streamgages WL3, 4, and 5, indi-cating that groundwater from the Silurian aquifer discharges

64 Areas that Affect the Habitat of the Endangered Hine’s Emerald Dragonfly in the Lower Des Plaines River Valley, Illinois
to surface water in the northern part of the Com Ed Parcel. Groundwater levels in other well clusters indicate variable ver-tical hydraulic gradients at the site. Water levels at the CEP-1S,D; CEP-3S,D; and CEP-4S,D well clusters frequently or typically have upward hydraulic gradients (AECOM, 2013a), whereas the CEP-2S,D and CEP-11S,D clusters typically have downward gradients. These variations of vertical gradients indicate groundwater discharge to surface water at Com Ed and Long Run Parcels is affected by localized changes in the flow regime, similar to those at Lockport Prairie Nature Preserve.
Surface WaterLong Run Creek enters the center of the Long Run Parcel
then bifurcates, with one branch flowing west to the Illinois and Michigan Canal and a second branch flowing south beyond the parcel boundary (fig. 22). The watershed for Long Run Creek is about 16,800 acres and extends about 8 mi east of the Long Run Parcel (Integrated Lakes Management, Inc., 2008). Discharge of Long Run Creek was measured monthly at the approximate middle of the bluff between High Road and New Avenue from March through September 2008 and ranged from 5.2 to 28.5 ft3/s (Integrated Lakes Management, Inc., 2008).
The “south ditch” is present a few hundred feet south of the Long Run Parcel (fig. 22). This ditch flows from the bluff east of the parcel to the Illinois and Michigan Canal. South ditch intercepts Long Run Creek south of the Long Run Par-cel, potentially diverting some of the creek flow.
Continuous measurements of surface-water levels were taken at streamgage LRS1 from June 2009 through Decem-ber 2012 (Applied Ecological Services, Inc., 2012, 2013). This streamgage monitors Long Run Creek near its entrance to the Long Run Parcel (fig. 22). Water was present at the streamgage for most of the monitoring period, indicating inflow from the creek is a potentially substantial source of water to the wetlands in the southern part of the Long Run Parcel. Baseline water levels varied by less than 2 ft for most of the monitoring period and were lowest during the summer and highest during the winter and spring in response to annual cycles in snowmelt, precipitation, and evapotranspiration. Increases of as much as 4 ft were superimposed on these base-line water levels during precipitation events. Water levels were below the sensor during parts of September and October 2010 and from April through December 2012. The low water levels during 2012 were a response to drought.
There are a number of ponds, ditches, and rivulets in the Com Ed Parcel and the northern part of the Long Run Parcel that are hydraulically connected to Bruce Lake north-west of the Com Ed Parcel (fig. 22). Hourly measurements of surface-water levels were taken at streamgages WL3 and WL4, located at the pond at the northern edge of the Com Ed Parcel, and streamgage WL5, located at a rivulet in the west-central part of the parcel, from October 2005 through August 2008 (STS Consultants, 2007; STS/AECOM, 2008b, 2009).
These streamgages were dry in response to drought prior to about December 2005 but had about 2 ft of water for the rest of the monitoring period. The average water level at all three streamgages was approximately 584.2 ft NAVD 88, with water levels at streamgage WL5 often being somewhat lower, particularly during the summer months. These data indicate that once the stage of the pond at streamgage WL4 exceeds about 582.5 ft NAVD 88, surface water can flow from Bruce Lake through the rivulets and ditches in the northeast part of the Com Ed Parcel into the Illinois and Michigan Canal near streamgage CES2 (STS Consultants, 2007; STS/AECOM, 2008b, 2009). Water from Bruce Lake is potentially a substan-tial source of water in the wetlands in the northwestern part of the Com Ed Parcel.
Surface water enters the northeast part of the Long Run Parcel through a culvert transmitting water from the upland area east of the Long Run Parcel, including the area of the oil spill. Water from the upland area is partly derived from seep flow. This water flowed to a former marsh area that is the cur-rent (2018) site of a pond associated with the excavated sedi-ment in the northeast part of the Long Run Parcel. The marsh (pond) also receives discharge from upwelling groundwater and seeps. Surface water in the northern part of the Long Run Parcel flows from the pond through rivulets for about 1,000 ft to the west-northwest (fig. 22; STS Consultants, 2007; STS/AECOM, 2008b, 2009; AECOM, 2011). The drainage then intersects a rivulet draining from a small pond in the north-central part of the Long Run Parcel, which appears to be partly fed by rivulets draining wetlands to the south. The rivulets flow to the north, entering a wetland area that discharges to the Illinois and Michigan Canal near streamgage CES2 (STS/AECOM, 2009; AECOM, 2011). Discharge rates and surface-water levels in this area, which includes the HED larval habi-tat, have not been measured.
Continuous measurements of surface-water levels were taken from April 2006 through December 2012 at streamgage CES2 (Applied Ecological Services, Inc., 2012, 2013). This streamgage monitors water levels in soil adjacent to a rivulet that drains most of the Com Ed Parcel and the northern part of the Long Run Parcel at the point of discharge to the Illinois and Michigan Canal. Measurements at this streamgage are assumed to be representative of water levels in the rivulet. Water was present at the streamgage for most of the period of monitoring but was typically below ground surface (fig. 23), indicating only periodic flow of surface water from the Com Ed and Long Run Parcels. Baseline water levels typically varied by less than 1 ft and were consistently lowest dur-ing the summer and highest during the winter and spring in response to annual cycles in snowmelt, precipitation, and evapotranspiration. Water-level increases of as much as 4 ft were occasionally superimposed on these broad trends. These increases lasted 7–10 days and were associated with precipita-tion events resulting in surface-water discharge to the canal. There is nothing clearly anomalous in the 2011 water-level data at streamgage CES2 that could be attributed to the effects of post-December 2010 oil-spill remediation activities. Low

Assessment of Conditions that Affect the Water Resources at Selected Hine’s Emerald Dragonfly Habitats 65
Sens
or e
leva
tion
= 58
2.17
feet
Grou
nd e
leva
tion
= 58
4.84
feet
Wat
er le
vel b
elow
sen
sor
Water level above North American Vertical Datum of 1988, in feet
Date
584.
84
583.
84
582.
84
581.
84
580.
84
585.
84
586.
84
587.
84
588.
84
2006
2007
2008
2009
2010
2011
2012
Jan.Feb.Mar.Apr.May
JuneJulyAug.
Sept.Oct.Nov.Dec.
Apr.May
JuneJulyAug.
Sept.Oct.Nov.Dec.
Jan.Feb.Mar.Apr.May
JuneJulyAug.
Sept.Oct.Nov.Dec.Jan.Feb.Mar.Apr.May
JuneJulyAug.
Sept.Oct.Nov.Dec.Jan.Feb.Mar.Apr.May
JuneJulyAug.
Sept.Oct.Nov.Dec.Jan.Feb.Mar.Apr.May
JuneJulyAug.
Sept.Oct.Nov.Dec.Jan.Feb.Mar.Apr.May
JuneJulyAug.
Sept.Oct.Nov.Dec.
Figu
re 2
3.
Wat
er le
vels
at s
tream
gage
CES
2, C
om E
d Pa
rcel
, Will
Cou
nty,
Illin
ois,
Apr
il 20
06 th
roug
h Oc
tobe
r 201
2 (fr
om A
pplie
d Ec
olog
ical
Ser
vice
s, In
c., 2
012,
201
3).

66 Areas that Affect the Habitat of the Endangered Hine’s Emerald Dragonfly in the Lower Des Plaines River Valley, Illinois
water levels observed after September 2011, although present for a somewhat longer than typical period of time, appear to be part of normal seasonal variations resulting from a lack of precipitation and elevated evapotranspiration in the wetlands. The low water levels observed during much of 2012 are likely a response to drought conditions.
Water Use
The groundwater recharge area for the Silurian aquifer at the Com Ed and Long Run Parcels (fig. 24) encompasses about 14,500 acres extending approximately 11 mi to the southeast of the parcels based on AECOM (2011) flow-net analysis of the potentiometric surface of the Silurian aquifer provided by Roadcap and others (1993). Several homes at the bluffs east of the Com Ed and Long Run Parcels draw water for domestic use from the Silurian aquifer. In addition, at least five high-capacity wells that draw water from the Silurian aquifer are located within the groundwater recharge area for the Com Ed and Long Run Parcels, with additional wells being contemplated. The volume of water discharged from the high-capacity wells on an annual basis is unknown but is likely to exceed 2.0 Mgal/d based on 2016 population estimates for Lockport (U.S. Census Bureau, 2017) and an 80-gal/d per capita water use. The effect of pumping from these wells on water levels and flow at the Com Ed and Long Run Parcels has not been investigated.
It is assumed that the CSSC is a hydraulic boundary to groundwater flow that prevents drawdown due to pumping at the East Quarry from migrating to the east beneath the CSSC in the deeper part of the Silurian aquifer (figs. 9, 10); there-fore, increased pumping in support of quarry expansion at the West or Middle Quarries is expected to have no effect on the hydrology of the Com Ed and Long Run Parcels (AECOM, 2013a). The validity of this assumption will be checked by ongoing water-level monitoring at the parcels by the Quarry operators (Hanson Material Service Corporation, 2016).
Water Quality
Groundwater samples were collected from 2005 through 2007 from several wells open to the alluvial aquifer and the Silurian aquifer at the Com Ed and Long Run Parcels (STS/AECOM, 2009; Applied Ecological Services, Inc., 2012; AECOM, 2013a,b). Surface-water samples were collected dur-ing 2006 and 2007 from the two ponds in the northwest part of the Com Ed Parcel (Applied Ecological Services, Inc., 2012). This sampling was done in support of investigations into the HED habitat (table 9).
Calcium and bicarbonate (measured as alkalinity) were the dominant cation and anion in these samples (table 9). Chloride concentrations typically were high enough to indicate the presence of road salts and were higher in the shallow wells at each well cluster. Sulfate concentrations were higher in the deep well, indicating a natural source. Phosphorous
concentrations in surface water were often above regulatory criteria for flowing water (0.1 mg/L), especially at streamgage CES2. Total Kjeldahl nitrogen concentrations (if present as ammonia) also exceeded regulatory criteria in some of the surface-water samples. Nitrate as nitrogen concentrations were less than 1.5 mg/L, which is below levels indicative of the presence of anthropogenic contamination. The pH values were slightly alkaline at 7.5–7.8.
Surface-water samples were collected during December 2010 and January 2011 to assess the effects of the pipeline break in the east-central part of the Com Ed and Long Run Parcels. Benzene was detected in the rivulet flowing from the excavated area to the outfall to the Illinois and Michigan Canal at S12 (fig. 25). Concentrations were above acute screening levels (table 3) near the pond excavation. Post-remediation sampling performed during September 2016 did not detect benzene in surface water at the locations where samples were collected.
Groundwater samples also were collected during 2013 from 13 wells open to the Silurian aquifer to assess the effects of the pipeline break (fig. 25). Benzene was detected at the northeast part of the boundary between the parcels at con-centrations as high as 3,780 µg/L; however, concentrations were below 1 µg/L within about 1,000 ft of the pipeline break. Post-remediation sampling from these wells performed in September 2016 detected benzene concentrations in ground-water that were substantially lower than during April 2012, with detections only in the vicinity of the railroad. Benzene concentrations remain above the MCL (table 3) near the loca-tion of the pipeline break. Residual contamination in the form of oil sheen and seeps was observed near the railroad tracks (Groundwater and Environmental Services, Inc., 2017).
Surface water and groundwater in the Com Ed and Long Run Parcel is alkaline with a neutral to alkaline pH. Ranges in constituent concentrations typically were similar for surface water and groundwater and indicate the Silurian aquifer is the primary source of surface water. The EPA flowing water crite-ria for phosphorus are exceeded in some samples. The chem-istry of this water, particularly the surface water, is affected by anthropogenic processes such as the application of road salts. The presence of oil associated with a historical pipeline break affected surface-water quality along the flow pathways in much of the center of the parcel and groundwater quality in the eastern part of property along the boundary between the parcels.
Assessment of Water Resources at the Long Run Seep Nature Preserve
The Long Run Seep Nature Preserve is an 80-acre parcel located east of the Com Ed and Long Run Parcels (fig. 1). The portion of the parcel of concern for the HED is the hillside between New Avenue, High Road, South Ditch, and Long Run Creek where a number of groundwater seep-fed rivulets are located (fig. 26).

Assessment of Conditions that Affect the Water Resources at Selected Hine’s Emerald Dragonfly Habitats 67
!
!!
!
!!
LongRun
Long Run Seep Nature Preserve
Com Ed andLong Run Parcels
Lockport Prairie Eastand Dellwood WestNature Preserves
Romeoville PrairieNature Preserve
L11
L10L14
L12L13
L6
Creek
Creek
Lockport
Romeoville
7
171
83
53
355
355
80
55
Spring
45
Des Plaines River
Chicago Sanitaryand Ship Canal
87°50'88°05' 87°55'88°00'
41°40'
41°35'
EXPLANATIONNature preserve
Lockport city limits
Romeoville city limits
Parcel boundary
Groundwater recharge area for Silurian aquifer at Com Ed and Long Run parcels, Will County, Illinois (modified from AECOM, 2010)
High-capacity well and nameL6!
0 1 2 3 4 5 MILES
0 1 2 3 4 5 KILOMETERS
Base from U.S. Geological Survey digital data, 1:100,000, 2001Albers Equal-Area Conic projection Standard parallels 33˚ N. and 45˚ N.Central meridian 89˚ W.North American Datum of 1927
Figure 24. Groundwater recharge area for the Com Ed and Long Run Parcels, and location of high-capacity pumping wells, Will County, Illinois (modified from AECOM, 2011).

68 Areas that Affect the Habitat of the Endangered Hine’s Emerald Dragonfly in the Lower Des Plaines River Valley, IllinoisTa
ble
9.
Conc
entra
tion
of s
elec
ted
cons
titue
nts
in s
urfa
ce w
ater
and
gro
undw
ater
at t
he C
om E
d an
d Lo
ng R
un P
arce
ls, W
ill C
ount
y, Il
linoi
s, 2
005
thro
ugh
2007
.
[mg/
L, m
illig
ram
per
lite
r; C
aCO
3, ca
lciu
m c
arbo
nate
; <, l
ess t
han;
--, n
o sa
mpl
e; b
old
deno
tes e
xcee
danc
e of
regu
lato
ry c
riter
ia]
Dat
e A
lkal
inity
, in
mg/
L as
Ca
CO3
Sulfa
te,
in m
g/L
Chlo
ride
, in
mg/
LCa
lciu
m,
in m
g/L
Mag
nesi
um,
in m
g/L
Sodi
um,
in m
g/L
Iron
, in
mg/
L
Nitr
ate
as
nitr
ogen
, in
mg/
L
Phos
phor
ous,
in
mg/
L
Tota
l Kj
elda
hl
nitr
ogen
, in
mg/
L
Silu
rian
aqui
fer w
ell C
EP-5
S (lo
catio
n sh
own
in fi
g. 2
2, d
ata
from
STS
/AEC
OM, 2
009)
10/2
7/05
360
8215
102
4613
<0.0
1--
----
6/05
/06
310
7316
8035
9.8
----
----
Silu
rian
aqui
fer w
ell C
EP-1
S (lo
catio
n sh
own
in fi
g. 2
2, d
ata
from
STS
/AEC
OM, 2
009)
10/2
5/05
280
184
109
104
5348
<0.0
1--
----
6/05
/06
310
172
9688
4644
----
----
Silu
rian
aqui
fer w
ell C
EP-1
D (lo
catio
n sh
own
in fi
g. 2
2, d
ata
from
STS
/AEC
OM, 2
009)
10/2
7/05
450
188
6914
870
27<0
.01
----
--
6/05
/06
430
220
4813
561
20--
----
--
Silu
rian
aqui
fer w
ell C
EP-3
S (lo
catio
n sh
own
in fi
g. 2
2, d
ata
from
STS
/AEC
OM, 2
009;
AEC
OM, 2
013a
)
10/2
7/05
490
126
120
132
6048
<0.0
1--
----
6/02
/06
380
148
128
121
5445
----
----
5/20
/11
280
130
140
160
8580
----
----
10/1
3/11
380
110
160
160
8068
----
----
Silu
rian
aqui
fer w
ell C
EP-3
D (lo
catio
n sh
own
in fi
g. 2
2, d
ata
from
STS
/AEC
OM, 2
009;
AEC
OM, 2
013a
)
10/2
7/05
460
125
128
131
612
49<0
.01
----
--
6/02
/06
410
160
110
117
5439
----
----
5/20
/11
310
150
100
150
7951
----
----
10/1
3/11
390
150
110
130
6742
----
----
Silu
rian
aqui
fer w
ell C
EP-2
S (lo
catio
n sh
own
in fi
g. 2
2, d
ata
from
STS
/AEC
OM, 2
009;
AEC
OM, 2
013a
)
10/2
7/05
430
173
108
133
6076
<0.0
1--
----
6/02
/06
380
189
118
124
5446
----
----
5/20
/11
220
130
130
130
5772
----
---
--
10/1
3/11
360
180
3911
057
30--
----
--

Assessment of Conditions that Affect the Water Resources at Selected Hine’s Emerald Dragonfly Habitats 69Ta
ble
9.
Conc
entra
tion
of s
elec
ted
cons
titue
nts
in s
urfa
ce w
ater
and
gro
undw
ater
at t
he C
om E
d an
d Lo
ng R
un P
arce
ls, W
ill C
ount
y, Il
linoi
s, 2
005
thro
ugh
2007
.—Co
ntin
ued
[mg/
L, m
illig
ram
per
lite
r; C
aCO
3, ca
lciu
m c
arbo
nate
; <, l
ess t
han;
-, n
o sa
mpl
e; b
old
deno
tes e
xcee
danc
e of
regu
lato
ry c
riter
ia]
Dat
e A
lkal
inity
, in
mg/
L as
Ca
CO3
Sulfa
te,
in m
g/L
Chlo
ride
, in
mg/
LCa
lciu
m,
in m
g/L
Mag
nesi
um,
in m
g/L
Sodi
um,
in m
g/L
Iron
, in
mg/
L
Nitr
ate
as
nitr
ogen
, in
mg/
L
Phos
phor
ous,
in
mg/
L
Tota
l Kj
elda
hl
nitr
ogen
, in
mg/
L
Silu
rian
aqui
fer w
ell C
EP-2
D (lo
catio
n sh
own
in fi
g. 2
2, d
ata
from
STS
/AEC
OM, 2
009;
AEC
OM, 2
013a
)
10/2
5/05
450
178
6211
659
42<0
.01
----
--
6/02
/06
410
208
4647
5110
0--
----
--
5/20
/11
260
180
3811
058
31--
----
--
10/1
3/11
370
130
130
120
5663
----
----
Silu
rian
aqui
fer w
ell C
EP-4
S (lo
catio
n sh
own
in fi
g. 2
2, d
ata
from
STS
/AEC
OM, 2
009)
10/
25/0
547
016
914
013
164
80<0
.01
----
-
6/0
5/06
230
203
130
112
4994
----
---
10/1
3/11
360
160
180
120
5694
----
---
Silu
rian
aqui
fer w
ell C
EP-4
D (lo
catio
n sh
own
in fi
g. 2
2, d
ata
from
STS
/AEC
OM, 2
009)
10/2
5/05
410
263
9416
178
36<0
.01
----
--
6/05
/06
430
267
8815
372
33--
----
--
Allu
vial
dep
osit
wel
l CE-
W1
(loca
tion
not s
how
n, d
ata
from
App
lied
Ecol
ogic
al S
ervi
ces,
Inc.
, 201
2)
04/1
9/06
280
304.
268
298.
90.
501.
4<0
.02
--
10/1
9/06
255
401.
083
3713
0.35
0.09
<0.0
2<0
.60
Surfa
ce w
ater
at s
tream
gage
WL4
(loc
atio
n sh
own
in fi
g. 2
2, d
ata
from
App
lied
Ecol
ogic
al S
ervi
ces,
Inc.
, 201
2)
4/18
/06
314
1413
011
651
400.
131.
3<0
.02
1.0
7/19
/06
148
6898
2036
480.
16<0
.05
0.04
3.0
10/1
9/06
255
6290
8645
490.
04<0
.01
<0.0
2<0
.60
4/30
/07
126
7377
6340
430.
530.
15<0
.02
0.93
7/25
/07
308
4791
4840
340.
610.
17<0
.02
<0.6
0
10/2
4/07
299
5015
068
6338
0.19
0.09
0.35
<0.6
0

70 Areas that Affect the Habitat of the Endangered Hine’s Emerald Dragonfly in the Lower Des Plaines River Valley, IllinoisTa
ble
9.
Conc
entra
tion
of s
elec
ted
cons
titue
nts
in s
urfa
ce w
ater
and
gro
undw
ater
at t
he C
om E
d an
d Lo
ng R
un P
arce
ls, W
ill C
ount
y, Il
linoi
s, 2
005
thro
ugh
2007
.—Co
ntin
ued
[mg/
L, m
illig
ram
per
lite
r; C
aCO
3, ca
lciu
m c
arbo
nate
; <, l
ess t
han;
-, n
o sa
mpl
e; b
old
deno
tes e
xcee
danc
e of
regu
lato
ry c
riter
ia]
Dat
e A
lkal
inity
, in
mg/
L as
Ca
CO3
Sulfa
te,
in m
g/L
Chlo
ride
, in
mg/
LCa
lciu
m,
in m
g/L
Mag
nesi
um,
in m
g/L
Sodi
um,
in m
g/L
Iron
, in
mg/
L
Nitr
ate
as
nitr
ogen
, in
mg/
L
Phos
phor
ous,
in
mg/
L
Tota
l Kj
elda
hl
nitr
ogen
, in
mg/
L
Surfa
ce w
ater
at s
tream
gage
CES
2 (lo
catio
n sh
own
in fi
g. 2
2, d
ata
from
App
lied
Ecol
ogic
al S
ervi
ces,
Inc.
, 201
2)
4/18
/06
184
130
180
6329
560.
731.
40.
191.
0
7/19
/06
232
3181
9244
440.
09<0
.05
0.26
2.7
10/1
9/06
226
7066
6831
410.
650.
140.
22<0
.60
4/30
/07
102
6576
6132
430.
280.
170.
090.
73
7/25
/07
318
150
6375
4428
0.36
0.18
0.06
<0.6
0
10/2
4/07
472
9483
150
6338
0.86
0.58
0.10
<0.6
0
Silu
rian
aqui
fer w
ell C
EP-1
0S (l
ocat
ion
show
n in
fig.
22,
dat
a fro
m A
ECOM
, 201
3a)
5/27
/11
280
110
9598
4755
----
----
10/1
3/11
430
4515
012
053
55--
----
--
Silu
rian
aqui
fer w
ell C
EP-1
1S (l
ocat
ion
show
n in
fig.
22,
dat
a fro
m A
ECOM
, 201
3a)
5/20
/11
200
7713
7950
12--
----
--
10/1
3/11
300
8918
7743
8.6
----
----
Silu
rian
aqui
fer w
ell C
EP-1
1D (l
ocat
ion
show
n in
fig.
22,
dat
a fro
m A
ECOM
, 201
3a)
5/20
/11
280
190
7.5
9166
48--
----
--
10/1
3/11
340
210
3.7
110
6223
----
----
Silu
rian
aqui
fer w
ell C
EP-1
2S (l
ocat
ion
show
n in
fig.
22,
dat
a fro
m A
ECOM
, 201
3a)
5/20
/11
270
230
7711
064
55--
----
--
10/1
3/11
360
190
6911
056
74--
----
--

Assessment of Conditions that Affect the Water Resources at Selected Hine’s Emerald Dragonfly Habitats 71
Illin
ois a
nd M
ichi
gan
Can
al
Com Ed Parcel
Long Run Parcel
RAIL
ROA
D T
RACK
NEW
AVE
NU
E
HIG
H R
OA
D
Approximatearea ofpipeline break
Com Ed Parcel
Long Run Parcel
RAIL
ROA
D T
RACK
NEW
AVE
NU
E
HIG
H R
OA
D
Approximatearea ofpipeline break
BruceLake
Illin
ois a
nd M
ichi
gan
Can
al BruceLake
MW1117<0.5
MW2<1
<0.5
MW33,780
39
MW4463160
MW5<1
<0.5
MW623
<0.5MW7
<1<0.5
MW828
<0.5
MW9FP
105
MW1045612
MW11<1
<0.5
MW12<1
<0.5
MW13<1
<0.5
MW1428
<0.5
MW15<1
<0.5
MW16<1
<0.5
MW17<1
<0.5
MW18<1
<0.5
CEP2S574
<0.5
CEP2D<1
<0.5
S12–
S2229<0.5
S3192<0.5S4
350–
S51,560
– S6769<0.5
S7<1–
S8455<0.5
S9<1
<0.5
S10142–
S11<1–
S1218–
S1339–
S14293–
S152
<0.5
S16<1
<0.5
P376
–
#
##
#
#
#
#
#
#
#
#
#
#
#
#
#
#
!
!
!
!
!
!
!
!
!
!!
!
!!
!
!
!
!
!!
88°03'20"88°03'30"
41°38'10"
41°38'
41°37'50"
88°02'50"88°03'88°03'10"
EXPLANATION
Wetland depression
Excavated sediment
Pond
Parcel boundary
Rivulet
Streamgage location and name with: Maximum benzene concentration in 2011 samples, in micrograms per liter; Benzene concentration in samples collected during September 2016, in micrograms per liter
Well location and name with: Maximum benzene concentration in samples collected during December 2010 and January 2011, in micrograms per liter; Benzene concentration in samples collected during September 2016, in micrograms per liter
Note: FP, Free Product; –, no data; <, less than
S9<1
<0.5#
MW5<1
<0.5!
0 0.1 0.2 MILE
0 0.1 0.2 KILOMETER
Base image from U.S. Department of Agriculture Farm Service Agency, 2015 National Agriculture Imagery Program (NAIP), Illinois
Figure 25. Concentration of benzene in surface water and groundwater after oil spill, Com Ed and Long Run Parcels, Will County, Illinois (modified from Antea Group, 2012).

72 Areas that Affect the Habitat of the Endangered Hine’s Emerald Dragonfly in the Lower Des Plaines River Valley, Illinois
612
628
588
632
590604
590
626
588
63
4
656
592
6 08
594
60059
4
588
6 52
588
5 96
592
610
586
624
606
652
6 1 2
614
5 9 0
630
612
586
598
592
602
590
594596
652
626
588
630
644
588
628
590
640
590
588
654
620
5 88
642
608
592
630
586
6 14
590
590
588
588
610
624
608
590
652
652
646
638
610
634
592
636
624
588
622
632
592
606
5 90
610
632
592
618
652
592
592
596
594
604
622
648
652
652
586
616
6 10
616
612
618
592
656
602
588
590
620
598
622
614
650
608
61 0
594
588
588
612
592
60 0
598
594
594
6 54
654656
590
588
658
608
658
586
586
612
628
588
632
590604
590
626
588
63
4
656
592
6 08
594
60059
4
588
6 52
588
5 96
592
610
586
624
606
652
6 1 2
614
5 9 0
630
612
586
598
592
602
590
594596
652
626
588
630
644
588
628
590
640
590
588
654
620
5 88
642
608
592
630
586
6 14
590
590
588
588
610
624
608
590
652
652
646
638
610
634
592
636
624
588
622
632
592
606
5 90
610
632
592
618
652
592
592
596
594
604
622
648
652
652
586
616
6 10
616
612
618
592
656
602
588
590
620
598
622
614
650
608
61 0
594
588
588
612
592
60 0
598
594
594
6 54
654656
590
588
658
608
658
586
586
W1
W2W3
W5
W6
LRS1LRS2
LRS3
S1
S4
S5
S6
S8
S2
S3W4
LRS4
W1
W2W3
W5
W6
LRS1
LRS4
LRS2
LRS3
S1
S4
S5
S6
S8
S2
S3W4
HIGH ROAD
South Ditch
Long Run Creek
HIGH ROAD
NEW
AVE
NUE
NEW
AVE
NUE
South Ditch
Long Run Creek
88°02'50"88°03'00"88°03'10"
41°37'40"
41°37'30"
41°37'20"
0 0.20.05 0.1 0.15 MILE
0 0.20.05 0.1 0.15 KILOMETER
Imagery from the U.S. Department of Agriculture Farm Service Agency, Aerial Photography Field Office, 2015 National Agriculture Imagery Program (NAIP) Natural Color Imagery for Illinois, accessed through Esri World ImageryMap image is the intellectual property of Esri and is used herein under license. Copyright © 2017 Esri and its licensors. All rights reserved.
EXPLANATION
Rivulet
Seep location and name
Well location and nameW1
S1
586
Nature preserve boundary
Line of equal elevation— Contour interval is 2 feet. Datum is North American Vertical Datum of 1988
590
Figure 26. Location of selected features at the Long Run Seep Nature Preserve, Will County, Illinois.

Assessment of Conditions that Affect the Water Resources at Selected Hine’s Emerald Dragonfly Habitats 73
Topography
The Long Run Seep Nature Preserve occupies the hillside near the bluff along the eastern part of the Des Plaines River Valley (fig. 26). The parcel slopes toward the river from an elevation of about 650 ft NAVD 88 near the top of the bluff in the eastern part of the parcel near High Road to about 590 ft at the base of the bluff at New Avenue (figs. 4, 26).
Biology
The HED has documented larval and adult use at the Long Run Seep Nature Preserve (fig. 2). Larval habitat is pres-ent along the rivulet emanating from seep S4 (fig. 26; Hanson Material Service Corporation, 2016). Larval populations were estimated to average 46 individuals during surveys from 1995 through 2011, making the Long Run Seep Nature Preserve at least periodically the third most productive larval habitat in Illinois (Soluk and Mierzwa, 2012). Adult use at the site includes egg laying, feeding, foraging, and territorial patrols (Cashatt and Vogt, 1996). Adult populations were estimated to be between 2 and 9 individuals (Mierzwa and Webb, 2010; U.S. Fish and Wildlife Service, 2013b).
Hydrogeology
Construction logs for residential wells in the vicinity of the Long Run Seep Nature Preserve obtained from the Illinois State Geological Survey (ISGS) from their well log database (Illinois State Geological Survey, [n.d.]) indicate that the Silu-rian aquifer is present below an elevation of about 590 ft, the approximate elevation of the land surface at New Avenue (fig. 4, 26). The Silurian aquifer is overlain by 2–50 ft of sand and gravel constituting the glacial drift aquifer, which intersects the lower part of the hillside at the Long Run Seep Nature Preserve. The glacial drift aquifer is overlain by 15–30 ft of silt and clay deposits forming a semiconfining unit, which intersects the topographic upland.
Periodic measurements of groundwater levels taken from September 20, 2006, through December 4, 2008, in wells open to the upper 5 ft of the glacial drift aquifer (fig. 26) indicate the depth to water was less than 1.5 ft below land surface in every well except LRS1; was periodically less than 0.5 ft above land surface at wells W5, W6, and LRS3 on the lower part of the bluff; and varied by less than 1 ft in any well (Inte-grated Lakes Management, Inc., 2008). Water levels collected by the USGS during July 2012 varied from less than 1.5 ft below land surface at wells LRS1 and LRS2 to less than 0.5 ft above land surface at wells LRS3 and LRS4 (table 1). These data indicate that recharge to the glacial drift aquifer through the overlying semiconfining unit is likely to sustain at least some of the seeps in this area, even during drought conditions. These data are consistent with the seeps being derived from groundwater emanating from the glacial drift aquifer.
Surface Water Long Run Creek is present in the northern part of the
Long Run Seep Nature Preserve and South Ditch approxi-mates the southern boundary. The Long Run Creek watershed (which includes South Ditch) occupies an area of 26.3 mi2 and extends about 5 mi east of the preserve (Integrated Lakes Management, Inc., 2008). Because conditions at Long Run Creek and South Ditch do not affect the HED habitat, they are not discussed in this report.
Seep-fed rivulets are located along the hillside between Long Run Creek and South Ditch at elevations below about 610 ft (fig. 26; Integrated Lakes Management, Inc., 2008). These seeps emanate from the unconsolidated deposits. Water from these rivulets is blocked by ditches along New Avenue and diverts to the South Ditch. Seeps also have been identified along the hillslope in the southeast part of the Long Run Seep Nature Preserve north of South Ditch (TAMS Consultants, Inc., 1995b).
Water QualitySurface water was collected at the Long Run Seep
Nature Preserve on four occasions during 1991 (Cashatt and Vogt, 1992). The samples were analyzed for major ions, several metals, and nutrients. The water body, location, and dates of sampling are not described. Concentrations of major ions showed minimal variation. Calcium was the dominant cation (112–132 mg/L) with substantial concentrations of magnesium (about 59 mg/L) and sodium (about 35 mg/L). Alkalinity ranged from 358 to 375 mg/L as CaCO3, with sub-stantial concentrations of chloride (70–75 mg/L) and sulfate (114–131 mg/L). The pH values were alkaline at 7.9–8.2. Nitrate concentrations ranged from 2.1 to 7.6 mg/L, indicating an anthropogenic component to at least some of the samples. Concentrations of all constituents, including serval trace met-als and nutrients, were below regulatory criteria.
Surface-water samples were collected approximately monthly from August 1997 through November 1998 at an unidentified location at the Long Run Seep Nature Preserve (Soluk and others, 1999). These samples were analyzed for a variety of metals, nutrients, and major ions. Bicarbonate was the dominant anion (as measured from alkalinity values) with approximately equal concentrations of sulfate and chloride (table 10). Concentrations of DO were greater than 7.0 mg/L and typically were higher during 1998 than 1997 sampling events. No constituent was detected above regulatory criteria.
Water samples were collected at the seeps four times from March 9 through April 21, 2006 (Integrated Lakes Man-agement, Inc., 2008). The average temperature ranged from about 7.3–10.5 oC and typically was substantially higher on April 21 than during the other sampling events, indicating that the readings were influenced by atmospheric temperatures. Concentrations of DO typically ranged from 4 to 10 mg/L and tended to be lowest at seeps 4 and 8. The pH was 7.0–8.2. Alkalinity values were typically between 350 and 450 mg/L

74 Areas that Affect the Habitat of the Endangered Hine’s Emerald Dragonfly in the Lower Des Plaines River Valley, IllinoisTa
ble
10.
Conc
entra
tion
of m
ajor
ions
and
nut
rient
s in
sur
face
wat
er a
t the
Lon
g Ru
n Se
ep N
atur
e Pr
eser
ve, W
ill C
ount
y, Il
linoi
s, A
ugus
t 199
7 th
roug
h N
ovem
ber 1
998
(from
So
luk
and
othe
rs, 1
998)
.
[mg/
L, m
illig
ram
per
lite
r; C
aCO
3, ca
lciu
m c
arbo
nate
; <, l
ess t
han;
--, n
o da
ta]
Dat
e A
lkal
inity
, in
mg/
L as
Ca
CO3
Sulfa
te,
in m
g/L
Chlo
ride
, in
mg/
LCa
lciu
m,
in m
g/L
Mag
nesi
um,
in m
g/L
Sodi
um,
in m
g/L
Am
noni
a,
in m
g/L
Nitr
ate
as
nitr
ogen
, in
mg/
L
Dis
solv
ed
oxyg
en,
in m
g/L
Tota
l ph
osph
orou
s,
in m
g/L
8/21
/97
375
134
113
129
6959
0.04
1.4
8.7
0.02
9/24
/97
315
144
124
123
6457
0.04
1.5
7.9
0.02
10/3
0/97
385
152
129
119
6046
0.01
1.5
7.7
<0.0
1
11/1
9/97
386
141
119
127
6762
<0.0
11.
58.
30.
02
12/1
7/97
382
122
105
132
6759
0.05
1.4
--0.
02
1/30
/98
375
132
106
133
7165
<0.0
11.
39.
00.
02
3/26
/98
367
154
122
141
7467
0.03
1.3
9.5
<0.0
1
4/29
/98
370
184
150
131
6965
0.02
1.0
10.6
0.03
5/21
/98
384
150
127
121
6461
0.02
1.3
8.8
0.02
6/19
/98
360
146
107
124
6558
0.04
1.2
10.0
0.03
7/23
/98
355
147
112
139
6762
0.02
1.0
9.5
0.06
8/25
/98
374
144
111
127
6962
0.03
1.2
9.4
0.03
9/15
/98
368
150
114
129
7062
<0.0
11.
28.
40.
04
10/3
0/98
341
159
133
136
7367
0.05
1.2
9.5
0.03
11/1
9/98
326
155
122
131
6932
0.04
1.2
10.5
0.05

Assessment of Conditions that Affect the Water Resources at Selected Hine’s Emerald Dragonfly Habitats 75
as CaCO3. Average chloride concentrations ranged from 85 to 280 mg/L, with several samples exceeding the EPA chronic threshold for aquatic life of 230 mg/L (table 3).
Samples were collected in April and December 2007 and April, July, and October 2008 from each of the wells (fig. 26; Integrated Lakes Management, Inc., 2008). These wells are open to the glacial drift aquifer. Alkalinity ranged from 257 to 1,000 mg/L as CaCO3 but was typically between 300 and 500 mg/L as CaCO3. Chloride concentrations ranged from 160 to 260 mg/L, exceeding the EPA chronic threshold for aquatic life of 230 mg/L in several samples. Chloride concentrations tended to be highest in April 2008, likely indicating the pres-ence of roadside runoff. Groundwater temperature varied sea-sonally, being lowest (about 4–9 oC) during December 2007 and highest (about 15–19 oC) during July 2008. The pH was neutral to alkaline, ranging from about 6.6 to 8.2. Concentra-tions of nitrogen as nitrate ranged from <0.01 to 2.2 mg/L and typically were less than 1 mg/L. Concentrations of DO ranged from about 2 to 10 mg/L. Concentrations of total phospho-rus as P often were above the EPA criteria for open water of 0.1 mg/L.
Water quality at the Long Run Seep Nature Preserve is affected mainly by the dissolution of dolomite and other carbonate minerals present in the unconsolidated deposits. Application of road salts appears to result in the concentra-tions of chloride occasionally above regulatory limits in both surface water and groundwater. The presence of somewhat elevated concentrations of nitrate in some of the surface-water samples indicates that fertilizer application or discharge from nearby septic systems may be affecting water quality.
Assessment of Water Resources at the Romeoville Prairie Nature Preserve
The Romeoville Prairie Nature Preserve is located north of the Quarry in Will County (figs. 1, 27). The Rome-oville Prairie Nature Preserve is about 155 acres in size and has been the subject of minimal biologic and hydrologic characterization.
TopographyThe Romeoville Prairie Nature Preserve occupies the
flood plain of the Des Plaines River Valley. Surface topogra-phy at the Romeoville Prairie Nature Preserve has minimal relief, with a typical elevation of 585–590 ft NAVD 88 (figs. 4, 27). The bluff that defines the boundary of the Des Plaines River Valley has lower relief than at some of the other sites and is located as much as about 0.5 mi west of the Romeoville Prairie Nature Preserve.
BiologyAdult use for transit has been documented at the site
during a small number of surveys. Recent observations of a
copulating pair of HED and a teneral adult (an adult that has recently molted) indicate that larval habitat may exist along a rivulet in the center of the Romeoville Prairie Nature Preserve (fig. 27; Soluk and Mierzwa, 2012). This site has less forest vegetation than many of the other HED habitats, potentially reducing its suitability as habitat.
Hydrogeology
The Romeoville Prairie Nature Preserve is underlain by 1–2.5 ft of partly saturated alluvium and clayey topsoil. Con-tinuous measurements of groundwater levels were taken from January through September 2006 at well points 1 through 4 (Graef, Anhalt, Schloemer, and Associates, Inc., 2007a). These well points are open to the alluvial aquifer along a northwest-southeast transect (fig. 27). Baseline water levels decreased from about 585.6 ft in the northwest well 2 to about 584.2 ft in the southeast well 4, indicating flow toward the river under typical conditions. Water levels showed numerous several-day-long increases of about 1 ft in response to precipitation events and possibly high water in the Des Plaines River. Water levels also showed numerous several-day-long decreases of about 0.5 ft during June through August that were likely in response to evapotranspiration.
Continuous measurements of groundwater levels were taken from May 2005 through August 2006 in well RPPW4 and well S (Graef, Anhalt, Schloemer, and Associates, Inc., 2007a). These wells are open to the upper part of the Silurian aquifer in the west-central part of the Romeoville Prairie Nature Preserve. Water levels in well RPPW4 were about 591.5 ft during the summer months in 2005 and 2006 and increased to about 592.7 ft during the intervening winter. Numerous increases of about 1–2 ft associated with precipi-tation events were superimposed on the baseline, indicating hydraulic interconnection within the upper part of the aquifer. Baseline water levels in well S increased from about 588 ft during the (drought) summer of 2005 to about 590.8 ft after January 2006 as the 2005 drought ended.
Surface Water
A creek is located along the southwestern boundary of the Romeoville Prairie Nature Preserve (fig. 1). Numerous creeks and ponds also are present in the northern part of the Romeoville Prairie Nature Preserve. These water bodies do not appear to affect hydrologic conditions at the HED habitat in the center of the Romeoville Prairie Nature Preserve and are not discussed further.
Several seeps are present along a northeast to southwest trending line in the middle of the preserve at an elevation of about 587 to 589 ft (fig. 27). Unlike many of the other sites where discharging groundwater at the base of the bluffs is the source of water to the seeps, these seeps appear to be recharged by upwelling groundwater. The location of the seeps and identified upwelling groundwater may indicate flow from

76 Areas that Affect the Habitat of the Endangered Hine’s Emerald Dragonfly in the Lower Des Plaines River Valley, Illinois
598
594
614
586
5 86
606
602
598
588
586
586
592
588
6 00
592602
592
590
5 88
592
608
586
604
594
6 04
586
602
586
586
600
594
586
604
588
606
6 00
60 4
600
600
5 86
6 04
596
598
6 02
604
598
6 00
602
598
602
586
586
600
594
6 0 2
5 94
58 8
608
602
5 88
602
588
592
606
59 2
602
604
602
610
600
604
606
586
604
608
598
606
586
602
594596
590
602
602
66 02
594
600600
602
588
600
610
60 2
60
0
602
586
588
604
604
586
602
600
602
60 4
592
604
588
602
592
598
594
614
586
5 86
606
602
598
588
586
586
592
588
6 00
592602
592
590
5 88
592
608
586
604
594
6 04
586
602
586
586
600
594
586
604
588
606
6 00
60 4
600
600
5 86
6 04
596
598
6 02
604
598
6 00
602
598
602
586
586
600
594
6 0 2
5 94
58 8
608
602
5 88
602
588
588588588
58859
059
0
592
606
59 2
602
604
602
610
600
604
606
586
604
608
598
606
586
602
594596
590
602
602
66 02
594
600600
602
588
600
610
60 2
60
0
602
586
588
604
604
586
602
600
602
60 4
592
592
592
604
588
602
592
1/585.0
2/585.6
3/584.4
4/584.2
RPPW4/591.5–592.7
S/588–590.8
S1
S2
S3
S4
S5
Upwelling
1/585.0
2/585.6
3/584.4
4/584.2
RPPW4/591.5–592.7
S/588–590.8
S1
S2
S3
S4
S5
Upwelling
88°04'00"88°04'10"88°04'20"
41°39'30"
41°39'20"
41°39'10"
0 0.20.05 0.1 0.15 MILE
0 0.20.05 0.1 0.15 KILOMETER
Imagery from the U.S. Department of Agriculture Farm Service Agency, Aerial Photography Field Office, 2015 National Agriculture Imagery Program (NAIP) Natural Color Imagery for Illinois, accessed through Esri World ImageryMap image is the intellectual property of Esri and is used herein under license. Copyright © 2017 Esri and its licensors. All rights reserved.
EXPLANATION
Rivulet
Seep location and name
Well location, name, and water level
1/585.0
S1
586
Nature preserve boundary
590 Line of equal elevation— Contour interval is 2 feet. Datum is North American Vertical Datum of 1988
Note: Water-level datum is North American Vertical Datumof 1988
Figure 27. Location of selected features in the central and northern part of the Romeoville Prairie Nature Preserve, Will County, Illinois. Baseline water levels, May 2005–September 2006, from Graef, Anhalt, Schloemer, and Associates, Inc., (2007a).
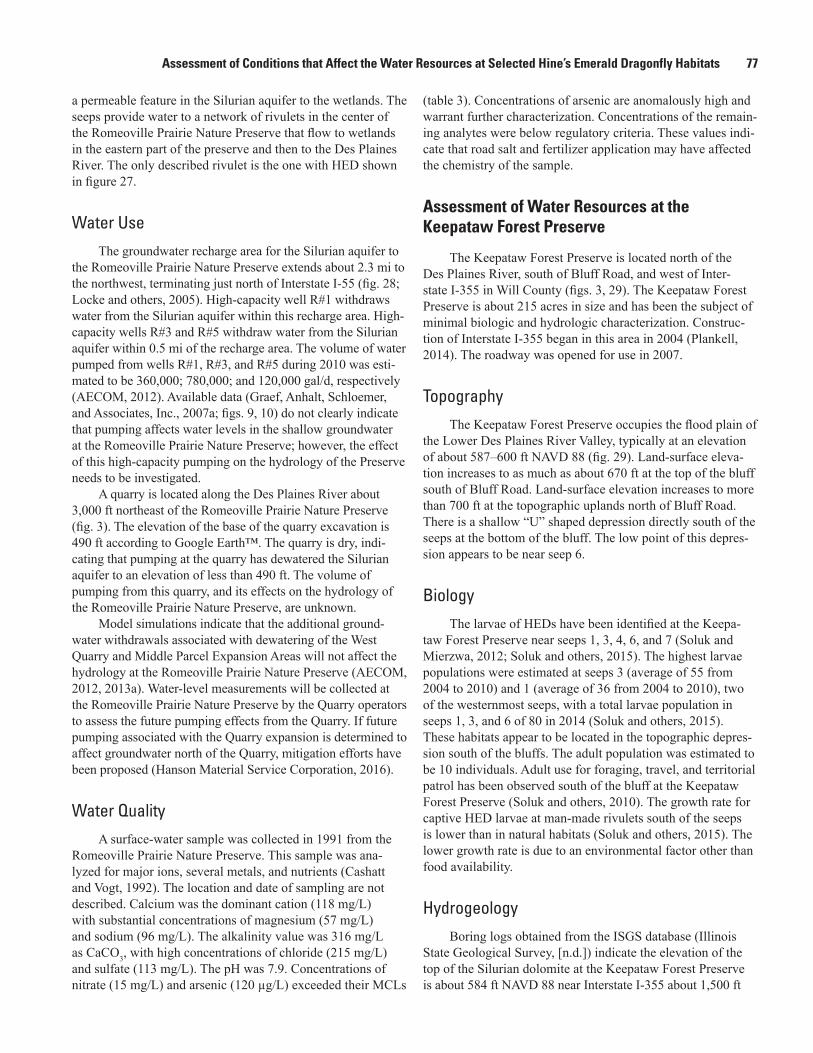
Assessment of Conditions that Affect the Water Resources at Selected Hine’s Emerald Dragonfly Habitats 77
a permeable feature in the Silurian aquifer to the wetlands. The seeps provide water to a network of rivulets in the center of the Romeoville Prairie Nature Preserve that flow to wetlands in the eastern part of the preserve and then to the Des Plaines River. The only described rivulet is the one with HED shown in figure 27.
Water Use
The groundwater recharge area for the Silurian aquifer to the Romeoville Prairie Nature Preserve extends about 2.3 mi to the northwest, terminating just north of Interstate I-55 (fig. 28; Locke and others, 2005). High-capacity well R#1 withdraws water from the Silurian aquifer within this recharge area. High-capacity wells R#3 and R#5 withdraw water from the Silurian aquifer within 0.5 mi of the recharge area. The volume of water pumped from wells R#1, R#3, and R#5 during 2010 was esti-mated to be 360,000; 780,000; and 120,000 gal/d, respectively (AECOM, 2012). Available data (Graef, Anhalt, Schloemer, and Associates, Inc., 2007a; figs. 9, 10) do not clearly indicate that pumping affects water levels in the shallow groundwater at the Romeoville Prairie Nature Preserve; however, the effect of this high-capacity pumping on the hydrology of the Preserve needs to be investigated.
A quarry is located along the Des Plaines River about 3,000 ft northeast of the Romeoville Prairie Nature Preserve (fig. 3). The elevation of the base of the quarry excavation is 490 ft according to Google Earth™. The quarry is dry, indi-cating that pumping at the quarry has dewatered the Silurian aquifer to an elevation of less than 490 ft. The volume of pumping from this quarry, and its effects on the hydrology of the Romeoville Prairie Nature Preserve, are unknown.
Model simulations indicate that the additional ground-water withdrawals associated with dewatering of the West Quarry and Middle Parcel Expansion Areas will not affect the hydrology at the Romeoville Prairie Nature Preserve (AECOM, 2012, 2013a). Water-level measurements will be collected at the Romeoville Prairie Nature Preserve by the Quarry operators to assess the future pumping effects from the Quarry. If future pumping associated with the Quarry expansion is determined to affect groundwater north of the Quarry, mitigation efforts have been proposed (Hanson Material Service Corporation, 2016).
Water Quality
A surface-water sample was collected in 1991 from the Romeoville Prairie Nature Preserve. This sample was ana-lyzed for major ions, several metals, and nutrients (Cashatt and Vogt, 1992). The location and date of sampling are not described. Calcium was the dominant cation (118 mg/L) with substantial concentrations of magnesium (57 mg/L) and sodium (96 mg/L). The alkalinity value was 316 mg/L as CaCO3, with high concentrations of chloride (215 mg/L) and sulfate (113 mg/L). The pH was 7.9. Concentrations of nitrate (15 mg/L) and arsenic (120 µg/L) exceeded their MCLs
(table 3). Concentrations of arsenic are anomalously high and warrant further characterization. Concentrations of the remain-ing analytes were below regulatory criteria. These values indi-cate that road salt and fertilizer application may have affected the chemistry of the sample.
Assessment of Water Resources at the Keepataw Forest Preserve
The Keepataw Forest Preserve is located north of the Des Plaines River, south of Bluff Road, and west of Inter-state I-355 in Will County (figs. 3, 29). The Keepataw Forest Preserve is about 215 acres in size and has been the subject of minimal biologic and hydrologic characterization. Construc-tion of Interstate I-355 began in this area in 2004 (Plankell, 2014). The roadway was opened for use in 2007.
Topography
The Keepataw Forest Preserve occupies the flood plain of the Lower Des Plaines River Valley, typically at an elevation of about 587–600 ft NAVD 88 (fig. 29). Land-surface eleva-tion increases to as much as about 670 ft at the top of the bluff south of Bluff Road. Land-surface elevation increases to more than 700 ft at the topographic uplands north of Bluff Road. There is a shallow “U” shaped depression directly south of the seeps at the bottom of the bluff. The low point of this depres-sion appears to be near seep 6.
Biology
The larvae of HEDs have been identified at the Keepa-taw Forest Preserve near seeps 1, 3, 4, 6, and 7 (Soluk and Mierzwa, 2012; Soluk and others, 2015). The highest larvae populations were estimated at seeps 3 (average of 55 from 2004 to 2010) and 1 (average of 36 from 2004 to 2010), two of the westernmost seeps, with a total larvae population in seeps 1, 3, and 6 of 80 in 2014 (Soluk and others, 2015). These habitats appear to be located in the topographic depres-sion south of the bluffs. The adult population was estimated to be 10 individuals. Adult use for foraging, travel, and territorial patrol has been observed south of the bluff at the Keepataw Forest Preserve (Soluk and others, 2010). The growth rate for captive HED larvae at man-made rivulets south of the seeps is lower than in natural habitats (Soluk and others, 2015). The lower growth rate is due to an environmental factor other than food availability.
Hydrogeology
Boring logs obtained from the ISGS database (Illinois State Geological Survey, [n.d.]) indicate the elevation of the top of the Silurian dolomite at the Keepataw Forest Preserve is about 584 ft NAVD 88 near Interstate I-355 about 1,500 ft

78 Areas that Affect the Habitat of the Endangered Hine’s Emerald Dragonfly in the Lower Des Plaines River Valley, Illinois
55
R#3
R#1
R#5
NORMANTOWN ROAD
JOLIET ROAD
NORTH IN
DEPENDEN
CE ROAD
DALHART AVENUE
VETERANS PARKWAY
CROSSROADS PARKWAYMARQUETTE DRIVE
ENTERPRISE DRIVE
BOLINGBROOK
DRIVE
ROMEO ROAD
88°04'00"88°04'30"88°05'00"88°05'30"88°06'00"
41°40'00"
41°39'30"
41°39'00"
41°38'30"
0 0.5 MILE
0 0.5 KILOMETER
Roads from Illinois Department of Transportation, 2014Water from U.S. Geological Survey National Hydrography Dataset, 2012
EXPLANATION
Romeoville Prairie Nature Preserve
Groundwater recharge area
Well location and nameR#1
Figure 28. Location of groundwater recharge area for the Silurian aquifer to the Romeoville Prairie Nature Preserve and selected high-capacity wells, Will County, Illinois (modified from Locke and others, 2005).

Assessment of Conditions that Affect the Water Resources at Selected Hine’s Emerald Dragonfly Habitats 79
650
654
608610
598
662
590
678
606
678
6 02
626
596
590
666
660
588
588
692
602
596
616
628
6 06
604
586584
596
646
588
646674
600
588
642 604
670
682
646
590590
662
59
2
596
614
676
648
600
602
596
604
5 92
666
664
5 88
6
00
690
6 00
588
650
660
672
59 6
634
590
596
588
634612
664
590
652
66 6588
664654
616
602
67 2
602
6 76
674
5
88
614
594
60
4
620
668
592
6 0
0
674
590
674
5 92
59 0
592
658
652
59
660 4
664
636
656
642
62459
4
598
602
686
654
612
59 0
696
652
6 00
652
65 6
592
590
590
596
670
59 6
590
658
660
628
660
632
656
644
600676
600
598
620
6 22
588
600
6 326 8 0
610
662
58 8
588
674
590
650
596
682
670
590
704
632
608
6 20
622
588
586
630
588
596
588
692
62 8
602
642
688
594
658
598
700
596
702
638
640
600
588
624
59 0
6 18
636
640
672
598
668
592
602672
596
630
594
590
598
644
600
604
644
69
0
658
656
660690
668
694
694
600
662
680
584
684
680
692
698
588
688
686682
70
650
654
608610
598
662
590
678
606
678
6 02
626
596
590
666
660
588
8
588
692
602
596
616
628
6 06
604
586584
596
646
588
646674
600
588
642 604
670
682
646
590590
662
59
2
596
614
676
648
600
602
596
604
5 92
98
666
664
5 88
6
00
690
6 00
588
650
660
672
59 6
634
590
596
588
634612
664
590
652
66 6588
664654
616
602
67 2
602
6 76
674
5
88
614
594
60
4
620
668
592
6 0
0
674
590
674
5 92
59 0
592
658
652
59
660 4
664
636
656
642
62459
4
598
602
686
654
612
59 0
696
638
652
6 00
652
65 6
592
590
590
596
670
59 6
590
658
660
628
660
632
656
644
600676
600
598
620
6 22
588
600
6 326 8 0
610
662
58 8
588
674
590
650
596
682
670
590
704
632
608
6 20
618
622
588
586
630
588
596
588
692
62 8
602
642
688
594
658
598
700
596
702
638
640
600
588
624
59 0
6 18
636
640
672
598
668
592
602672
596
630
594
590
598
644
600
678
604
644
69
0
658
656
660690
668
694
694
600
662
680
584
684
680
692
698
588
688
686682
6 70
Seep1Seep2
Seep3
Seep4
Seep5Seep6
Seep7
Seep8
Seep9
Seep1Seep2
Seep3
Seep4
Seep5Seep6
Seep7
Seep8
Seep9
Des Plaines River
BLUFF ROAD
Des Plaines River
I-355
BLUFF ROAD
88°01'50"88°02'00"88°02'10"88°02'20"
41°40'50"
41°40'40"
41°40'30"
41°40'20"
0 0.20.05 0.1 0.15 MILE
0 0.20.05 0.1 0.15 KILOMETER
Imagery from the U.S. Department of Agriculture Farm Service Agency, Aerial Photography Field Office, 2015National Agriculture Imagery Program (NAIP) Natural Color Imagery for Illinois
EXPLANATION
Seep location and nameSeep1
Line of equal elevation— Contour interval is 5 feet. Datum is North American Vertical Datum of 1988
586590
Forest preserve boundary
Figure 29. Location of selected features in the eastern part of the Keepataw Forest Preserve, Will County, Illinois.

80 Areas that Affect the Habitat of the Endangered Hine’s Emerald Dragonfly in the Lower Des Plaines River Valley, Illinois
north of the Des Plaines River. The overlying unconsolidated deposits consist of a mixture of silt and clay till with sand and gravel lenses. The unconsolidated deposits are likely to be 1–2 ft thick near the Des Plaines River, increasing to about 20 ft south of the bluff, and are more than 90 ft north of Bluff Road. Groundwater is present in the unconsolidated deposits and the underlying Silurian aquifer at the Keepataw Forest Preserve.
Surface Water Several seeps are present in the Keepataw Forest Preserve
along a northeast to southwest trending line on the face of the bluff at an elevation between about 590 and 597 ft NAVD 88 (fig. 29). Based on the bedrock elevation at nearby borings, the seeps are emanating from the unconsolidated deposits. These seeps were documented as having water during the entirety of the droughts of 1988–89 and 2005 (Soluk and Mierzwa, 2012), which indicates stable flow from the lower part of the thick unconsolidated deposits in the topographic uplands north of the Keepataw Forest Preserve.
The shallow topographic depression south of the seeps appears to be part of an intermittent surface-water drainage entering from the northeast part of the Keepataw Forest Pre-serve. This drainage receives overland runoff from Interstate I-355 east of the preserve and a commercial park north of the preserve. Some portion of this runoff may flow south out of the depression by way of a rivulet in the topographic gap south of seep 6, potentially reducing water velocity and erosion west of seep 6 at the primary HED habitats near seeps 1 and 3. A network of additional rivulets is present at the Keepataw Forest Preserve that transmits surface water to ponds and wetlands in the southern part of the Keepataw Forest Preserve and to the Des Plaines River (Soluk and others, 2010). The elevation of the ponds in the center of the preserve south of the seeps is about 587 to 589 ft NAVD 88 based on figure 29.
Water Use The elevation of the base of the quarry southwest of the
Keepataw Forest Preserve (fig. 3) is about 481 ft according to Google Earth™. The quarry is dry, indicating that pumping at the quarry has dewatered the Silurian aquifer to an elevation of less than 481 ft. The volume of pumping from the Silurian aquifer and its effect on the hydrology of the Keepataw Forest Preserve is unknown.
Water QualitySurface-water samples were collected approximately
monthly from August 1997 through November 1998 from seeps 1, 2, 3, and 4 (fig. 29; Soluk and others, 1999). All of the waters were alkaline (table 11), with substantial concentra-tions of sulfate and chloride. Calcium was the dominant cation, with substantial concentrations of magnesium and sodium.
Excepting the (potentially erroneous) calcium, magnesium, and sodium data from seeps 1 and 2 during March 1998 and per-haps the periodically low chloride at seep 3 (the westernmost seep) during August 1997 and December 1997 through April 1998, concentrations of major ions were generally consistent between sampling events and sites. Nitrate and ammonia con-centrations were low at all sites.
Samples from seeps 1, 2, 3, and 4 collected from August 1997 through November 1998 also were analyzed for concen-trations of several trace metals and phosphorous. Only manga-nese (<0.02–0.10 mg/L) was detected at a concentration above regulatory criteria (table 3).
Temperature of water in the rivulets measured at the Keepataw Forest Preserve during June 2011 ranged from about 11 to 13.3 oC, likely reflecting the temperature of the ground-water source of the water in the rivulets (Soluk and others, 2012). Temperatures increased with increasing distance down-stream, reflecting the influence of atmospheric temperature.
Assessment of Water Resources at the Black Partridge Woods Nature Preserve
The Black Partridge Woods Nature Preserve is located north of Bluff Road, west of Lemont Road, and east of Inter-state I-355 at the western edge of Cook County (fig. 30). The Black Partridge Woods Forest Preserve is located south of Bluff Road. For the purposes of this report, these two entities are combined to constitute the Black Partridge Woods Nature Preserve (figs. 3, 30). The Black Partridge Woods Nature Pre-serve is about 80 acres in size and has been the subject of some biologic, hydrogeologic, and water-quality characterization.
TopographyMuch of the Black Partridge Woods Nature Preserve
occupies the flood plain of the Des Plaines River Valley. Land-surface elevation in the valley typically is about 580–585 ft NAVD 88 (fig. 30). In the northern and western parts of the Black Partridge Woods Nature Preserve, the land-surface elevation increases to about 590–625 ft near Bluff Road and exceeds 675 ft north of Bluff Road.
BiologyAdult use for undescribed purposes was documented at
the Black Partridge Woods Nature Preserve in 1990 and 1992, primarily near the edge of a seepage marsh in the northeast part of the preserve (Cashatt and Vogt, 1996). Although small num-bers of larvae have been identified at the preserve, breeding areas have not been confirmed and HED populations have not been calculated (U.S. Fish and Wildlife Service, 2013b). The area of potential adult HED habitat is estimated to be about 6.4 acres south of Bluff Road that is interspersed within the larger preserve where HED habitat is not present (TAMS Consul-tants, Inc., 1995a).

Assessment of Conditions that Affect the Water Resources at Selected Hine’s Emerald Dragonfly Habitats 81Ta
ble
11.
Conc
entra
tion
of m
ajor
ions
and
nitr
ogen
com
poun
ds in
sur
face
wat
er a
t the
Kee
pata
w F
ores
t Pre
serv
e, W
ill C
ount
y, Il
linoi
s, A
ugus
t 199
7 th
roug
h N
ovem
ber 1
998
(from
Sol
uk a
nd o
ther
s, 1
998)
.
[mg/
L, m
illig
ram
per
lite
r; C
aCO
3, ca
lciu
m c
arbo
nate
; --,
no d
ata;
<, l
ess t
han]
Dat
e A
lkal
inity
, in
mg/
L as
Ca
CO3
Sulfa
te,
in m
g/L
Chlo
ride
, in
mg/
LCa
lciu
m,
in m
g/L
Mag
nesi
um,
in m
g/L
Sodi
um,
in m
g/L
Am
noni
a,
in m
g/L
Nitr
ate,
in
mg/
L
Dis
solv
ed
oxyg
en,
in m
g/L
Seep
1 (l
ocat
ion
show
n in
fig.
29)
8/21
/97
376
236
5613
267
190.
060.
097.
3
9/24
/97
336
244
5413
467
200.
100.
053.
8
10/3
0/97
396
166
6312
259
150.
050.
082.
0
11/1
9/97
395
238
5513
367
220.
030.
032.
4
12/1
7/97
403
230
4912
767
200.
050.
04--
1/30
/98
374
126
4813
367
220.
060.09
3.6
3/26
/98
386
140
5461
3911
0.06
<0.01
4.7
4/29
/98
375
177
5412
864
200.
03<0
.01
5.6
5/21
/98
387
152
5412
664
200.
04<0
.01
5.0
6/19
/98
366
149
5713
164
200.
070.
024.
1
7/23
/98
366
151
5713
366
220.
02<0
.01
3.5
8/25
/98
380
151
5913
369
220.
090.
026.
9
9/15
/98
366
151
5713
870
220.
040.
014.
6
10/3
0/98
362
161
6613
971
240.
110.
034.
6
11/1
9/98
354
161
6313
669
230.
08<0
.01
1.7
Seep
2 (l
ocat
ion
show
n in
fig.
29)
8/21
/97
375
141
4812
866
160.
10<0
.01
4.8
9/24
/97
327
149
4612
863
140.
12<0
.01
2.6
10/3
0/97
385
160
4613
165
160.
08<0
.01
2.7
11/1
9/97
381
145
4412
665
160.
07<0
.01
3.6
12/1
7/97
379
127
4113
265
150.
11<0
.01
--
1/30
/98
327
137
3512
967
14<0
.01
0.11
9.5
3/26
/98
357
143
4242
215
0.09
<0.0
14.
9
4/29
/98
370
155
5312
764
150.
02<0
.01
6.1
5/21
/98
379
153
5112
665
160.
08<0
.01
5.3

82 Areas that Affect the Habitat of the Endangered Hine’s Emerald Dragonfly in the Lower Des Plaines River Valley, IllinoisTa
ble
11.
Conc
entra
tion
of m
ajor
ions
and
nitr
ogen
com
poun
ds in
sur
face
wat
er a
t the
Kee
pata
w F
ores
t Pre
serv
e, W
ill C
ount
y, Il
linoi
s, A
ugus
t 199
7 th
roug
h N
ovem
ber 1
998
(from
Sol
uk a
nd o
ther
s, 1
998)
.—Co
ntin
ued
[mg/
L, m
illig
ram
per
lite
r; C
aCO
3, ca
lciu
m c
arbo
nate
; --,
no d
ata;
<, l
ess t
han]
Dat
e A
lkal
inity
, in
mg/
L as
Ca
CO3
Sulfa
te,
in m
g/L
Chlo
ride
, in
mg/
LCa
lciu
m,
in m
g/L
Mag
nesi
um,
in m
g/L
Sodi
um,
in m
g/L
Am
noni
a,
in m
g/L
Nitr
ate,
in
mg/
L
Dis
solv
ed
oxyg
en,
in m
g/L
Seep
2 (l
ocat
ion
show
n in
fig.
29)
—Co
ntin
ued
6/19
/98
361
155
4913
065
160.
080.
024.
7
7/23
/98
357
158
4913
866
160.
03<0
.01
3.2
8/25
/98
365
154
5113
269
170.
10<0
.01
4.6
9/15
/98
360
162
5113
369
170.
07<0
.01
5.3
10/3
0/98
352
161
5713
670
180.
150.
024.
3
11/1
9/98
344
165
5313
468
180.
08<0
.01
5.6
Seep
3 (l
ocat
ion
show
n in
fig.
29)
8/21
/97
367
7421
105
4811
0.10
0.09
2.8
9/24
/97
339
150
4312
863
130.
14<0
.01
4.0
10/3
0/97
394
156
4612
964
170.
07<0
.01
2.8
11/1
9/97
395
145
4212
864
150.
04<0
.01
3.9
12/1
7/97
376
169
2414
568
100.
060.
06--
1/30
/98
336
153
2612
460
110.
100.
147.
1
3/26
/98
340
163
2812
660
130.
180.
016.
3
4/29
/98
346
186
2912
359
120.
07<0
.01
7.4
5/21
/98
374
166
4312
965
150.
10<0
.01
4.8
6/19
/98
357
160
4313
064
150.
070.
094.
6
7/23
/98
369
153
4415
565
150.
08<0
.01
4.7
8/25
/98
366
160
4313
067
150.
130.
025.
0
9/15
/98
370
154
4313
167
150.
080.
024.
3
10/3
0/98
349
152
4012
864
150.
110.
044.
9
11/1
9/98
333
200
5913
035
160.
140.
017.
4
Seep
4 (l
ocat
ion
show
n in
fig.
29)
8/21
/97
377
131
5613
368
170.
04<0
.01
3.3
9/24
/97
344
138
5913
668
160.
10<0
.01
1.6

Assessment of Conditions that Affect the Water Resources at Selected Hine’s Emerald Dragonfly Habitats 83Ta
ble
11.
Conc
entra
tion
of m
ajor
ions
and
nitr
ogen
com
poun
ds in
sur
face
wat
er a
t the
Kee
pata
w F
ores
t Pre
serv
e, W
ill C
ount
y, Il
linoi
s, A
ugus
t 199
7 th
roug
h N
ovem
ber 1
998
(from
Sol
uk a
nd o
ther
s, 1
998)
.—Co
ntin
ued
[mg/
L, m
illig
ram
per
lite
r; C
aCO
3, ca
lciu
m c
arbo
nate
; --,
no d
ata;
<, l
ess t
han]
Dat
e A
lkal
inity
, in
mg/
L as
Ca
CO3
Sulfa
te,
in m
g/L
Chlo
ride
, in
mg/
LCa
lciu
m,
in m
g/L
Mag
nesi
um,
in m
g/L
Sodi
um,
in m
g/L
Am
noni
a,
in m
g/L
Nitr
ate,
in
mg/
L
Dis
solv
ed
oxyg
en,
in m
g/L
Seep
4 (l
ocat
ion
show
n in
fig.
29)
—Co
ntin
ued
10/3
0/97
404
148
5613
567
170.
05<0
.01
1.7
11/1
9/97
398
136
5513
468
18<0
.01
<0.0
13.
8
12/1
7/97
404
124
5314
471
170.
09<0
.01
--
1/30
/98
356
134
5113
569
17<0
.01
<0.0
16.
1
3/26
/98
377
150
5114
370
170.
05<0
.01
3.6
4/29
/98
367
147
5913
266
17<0
.01
<0.0
16.
3
5/21
/98
388
147
5413
167
180.
01<0
.01
6.7
6/19
/98
377
144
5013
166
170.
07<0
.01
4.9
7/23
/98
356
153
5016
066
170.
04<0
.01
4.7
8/25
/98
380
139
5213
268
180.
09<0
.01
3.4
9/15
/98
372
142
5113
570
180.
06<0
.01
1.5
10/3
0/98
367
149
5613
367
180.
15<0
.01
1.3
11/1
9/98
342
151
5413
467
180.
09<0
.01
3.2

84 Areas that Affect the Habitat of the Endangered Hine’s Emerald Dragonfly in the Lower Des Plaines River Valley, Illinois
625 620
650 645630
605
615
610 59
5
670 645
675
640
665
615
590
660 63
5
620605
600
595
590
585
580
685
680
585
580
600
595
590
585
600
590
650
580
575
585
580
575
595
590
690
590
595
590
585
585
625 620
650 645630
605
615
610 59
5
670 645
675
640
665
615
590
660 63
5
620605
600
595
590
585
580
685
680
590
585
580
600
595
590
585
600
590
650
580
575
585
580
575
595
590
690
590
595
590
585
585
DU
PA
GE
CO
UN
TY
CO
OK
CO
UN
TY
Goo
se L
ake
Des
Pla
ines
Riv
er
Black
Partridge Creek
1S
4S2S3S
5S
BLU
FF R
OA
D
I-355
Goo
se L
ake
Des
Pla
ines
Riv
er
LEMONT ROAD
Black
Partridge Creek
1S
4S2S3S
5S
DU
PA
GE
CO
UN
TY
CO
OK
CO
UN
TY
COOK COUNTYWILL COUNTYCOOK COUNTYWILL COUNTY
BLU
FF R
OA
D
88°0
0'10
"88
°00'
20"
88°0
0'30
"88
°00'
40"
88°0
0'50
"88
°01'
00"
88°0
1'10
"88
°01'
20"
88°0
1'30
"88
°01'
40"
88°0
1'50
"
41°4
1'10
"
41°4
1'00
"
41°4
0'50
"
41°4
0'40
"
41°4
0'30
"
41°4
0'20
"
00.
50.
10.
20.
30.
4M
ILE
00.
50.
10.
20.
30.
4KI
LOM
ETER
Imag
ery
from
the
U.S.
Dep
artm
ent o
f Agr
icul
ture
Far
m S
ervi
ce A
genc
y, A
eria
l Pho
togr
aphy
Fie
ld O
ffice
, 201
5 N
atio
nal A
gric
ultu
re Im
ager
y Pr
ogra
m (N
AIP)
Nat
ural
Col
or Im
ager
y fo
r Illi
nois
586
EXPL
AN
ATI
ON
Rivu
let a
nd n
ame
Nat
ure
pres
erve
bou
ndar
y
Line
of e
qual
ele
vatio
n—
Con
tour
inte
rval
is 5
feet
.
Dat
um is
Nor
th A
mer
ican
V
ertic
al D
atum
of 1
988
590
1S1S
Figu
re 3
0.
Loca
tion
of s
elec
ted
feat
ures
at t
he B
lack
Par
tridg
e W
oods
Nat
ure
Pres
erve
, Coo
k Co
unty
, Illi
nois
.

Assessment of Conditions that Affect the Water Resources at Selected Hine’s Emerald Dragonfly Habitats 85
Hydrogeology
There are no wells in the Black Partridge Woods Nature Preserve, but an investigation performed due south of the pre-serve between the Des Plaines River and the CSSC indicated that the top of the Silurian dolomite at the Black Partridge Woods Nature Preserve is present at about 582–588 ft (Kay and others, 2016). Observations at outcrops in the southern part of the preserve along the bank of the Des Plaines River indicate the dolomite is overlain by 1 to 2.5 ft of silt and clay alluvium in the river valley. The depth to water beneath the site is not known but is at or near land surface in wells open to the Silurian aquifer south of Black Partridge Woods Nature Preserve across the Des Plaines River and is likely shallow at the wetlands in the Black Partridge Woods Nature Preserve. The horizontal hydraulic conductivity in the upper 70 ft of the Silurian aquifer typically was less than 0.05 ft/d south of the Black Partridge Woods Nature Preserve (Kay and others, 2016). Water collects on top of the dolomite, ponding in areas where the surface of the dolomite forms a basin. If these con-ditions are representative of the Black Partridge Woods Nature Preserve, groundwater flow to the wetlands would be focused in the alluvial aquifer.
Surface Water
Black Partridge Creek is located near the western part of the Black Partridge Woods Nature Preserve (fig. 30). The creek drains a predominately residential and commercial area north of Bluff Road. Several ponds and wetlands, including Goose Lake, are present in the central and southern parts of the Black Partridge Woods Nature Preserve. Several rivulets are present north and west of Goose Lake.
Water Quality
Samples of surface water were collected twice during 1991 at the Black Partridge Woods Nature Preserve (Cashatt and Vogt, 1992). These samples were analyzed for major ions, several metals, and nutrients (table 12). The location and dates of sampling are not described. Calcium was the dominant cation and alkalinity (as bicarbonate) was the dominant anion. Concentrations of nitrate were less than 3 mg/L, indicat-ing the absence of an anthropogenic component (Mueller and Helsel, 1996). The pH readings were 7.8–8.2, indicating alkaline water. With the exception of iron (1.1–1.4 mg/L) and manganese (0.04–0.18 mg/L), which were detected above the above the EPA chronic threshold for aquatic life in at least one sample (table 3), concentrations of trace metals were below regulatory criteria.
Samples collected monthly during May 2011 through May 2012 from Black Partridge Creek immediately south of Bluff Road also were analyzed for major ions, nutrients, and metals (Plankell, 2014). Sodium typically was the cation present at highest concentrations in these samples and chloride
was the cation typically present at highest concentrations (table 12). Concentrations of the major ions showed seasonal variation, being high in May 2011, lower in June through December 2011, and higher in January through May 2012. The high concentrations of chloride and sodium and the seasonality in the values indicate likely effects of road salt application on the water quality of the creek. The pH readings were 7.9–8.2. Nitrate concentrations were below the threshold indicating anthropogenic sources. Trace metals were either not detected in the Creek samples, or were detected at concentrations below regulatory criteria. Concentrations of chloride were above the EPA chronic threshold for aquatic life (230 mg/L) and phos-phorus was detected above the EPA criteria for open water of 0.1 mg/L.
Assessment of Water Resources at the Waterfall Glen Forest Preserve
The Waterfall Glen Forest Preserve is located north of the Des Plaines River and east of Bluff Road in DuPage County (fig. 31). The Waterfall Glen Forest Preserve surrounds Argonne National Laboratory (fig. 3) and is nearly 2,500 acres in size. The focus area for this discussion is the southwest part of the preserve at the drainages to Emerald Fen.
Topography
The Emerald Fen part of the Waterfall Glen Forest Preserve is located at the base of the bluff along the north-ern part of the Des Plaines River Valley (fig. 31). The parcel slopes toward the river from a surface elevation of about 605 ft NAVD 88 in the northern area near the 1U,L well cluster to about 590 ft near the 3U,L well cluster (Plankell and others, 2009). Land surface at the fen typically is between 590 and 595 ft.
Biology
The HED has documented larval and adult use in the vicinity of the natural rivulet draining to the Emerald Fen (Soluk and others, 2008). Larval use in historical habitat at Emerald Fen has not been identified since 2009. Adult use at the site includes traveling, foraging, perching, and territorial patrol (Cashatt and Vogt, 1996; Soluk and others, 2010, 2011). Attempts are being made to create HED habitat at a series of artificial rivulets north of the fen (Plankell and others, 2009).
Hydrogeology
Groundwater at the Waterfall Glen Forest Preserve is present in the semiconfining unit, glacial drift aquifer, and the Silurian aquifer (Plankell and others, 2009). The top of the dolomite that constitutes the Silurian aquifer slopes toward the river, ranging in elevation from about 593 ft NAVD 88 near

86 Areas that Affect the Habitat of the Endangered Hine’s Emerald Dragonfly in the Lower Des Plaines River Valley, IllinoisTa
ble
12.
Conc
entra
tion
of m
ajor
ions
, nitr
ogen
com
poun
ds, a
nd m
etal
s in
sur
face
wat
er a
t the
Bla
ck P
artri
dge
Woo
ds N
atur
e Pr
eser
ve, C
ook
Coun
ty, I
llino
is, 1
991
thro
ugh
2012
.
[mg/
L, m
illig
ram
per
lite
r; C
aCO
3, ca
lciu
m c
arbo
nate
; - -,
no
data
; <, l
ess t
han;
bol
d de
note
s exc
eeda
nce
of re
gula
tory
crit
eria
]
Dat
e A
lkal
inity
, in
mg/
L as
Ca
CO3
Sulfa
te,
in m
g/L
Chlo
ride
, in
mg/
LCa
lciu
m,
in m
g/L
Mag
nesi
um,
in m
g/L
Sodi
um,
in m
g/L
Am
noni
a,
in m
g/L
Nitr
ate,
in
mg/
LIr
on,
in m
g/L
Man
gane
se,
in m
g/L
Surfa
ce w
ater
(loc
atio
n an
d da
tes
of s
ampl
ing
unkn
own;
dat
a fro
m C
asha
tt an
d Vo
gt, 1
992)
1991
336
170
5312
854
22--
2.1
1.4
0.04
3
1991
356
145
9912
857
44--
0.4
1.1
0.18
2
Blac
k Pa
rtrid
ge C
reek
dire
ctly
sou
th o
f Blu
ff Ro
ad (l
ocat
ion
show
n in
fig.
30;
dat
a fro
m P
lank
ell,
2014
)
5/18
/11
253
7634
694
4421
60.
160.
330.
027
0.01
8
6/20
/11
107
2323
333
2399
<0.0
30.
230.
062
0.00
6
7/27
/11
139
3826
446
3011
6<0
.03
0.20
0.02
4<0
.002
8/24
/11
144
3724
944
1994
<0.0
30.
210.
037
0.00
5
92/2
8/11
141
4115
648
2110
5<0
.03
0.25
0.05
80.
007
11/0
9/11
141
4015
243
1998
<0.0
30.
300.
032
0.00
7
12/0
7/11
218
6717
772
2910
5<0
.03
0.19
<0.0
240.
005
1/11
/12
249
8321
683
3712
7<0
.03
0.09
<0.0
240.
005
2/27
/12
222
8249
695
4227
6<0
.03
<0.0
7<0
.024
0.00
5
3/27
/12
227
7847
092
4426
5<0
.03
0.09
<0.0
240.
008
5/01
/12
180
6635
667
3321
6<0
.03
0.19
<0.0
240.
006

Assessment of Conditions that Affect the Water Resources at Selected Hine’s Emerald Dragonfly Habitats 87
620
590
590
615
590
610
605
600
595
620
590
590
615
590
610
605
600
595
AW
1
AW
2
AW
3
AW
4
AW
5
AW
6A
W7
3U/3
L
2U
1U/1
L
4L
6L
D
C
H2
AW
1
AW
2
AW
3
AW
4
AW
5
AW
6A
W7
3U/3
L
2U
1U/1
L
4L
6L
D
C
H2
LEMONT ROAD
BLUFF ROAD
87°5
9'55
"88
°00'
00"
88°0
0'05
"88
°00'
10"
88°0
0'15
"
41°4
1'15
"
41°4
1'10
"
00.
10.
020.
040.
060.
08M
ILE
00.
10.
020.
040.
060.
08KI
LOM
ETER
Imag
ery
from
Esr
i Wor
ld Im
ager
y fo
r Chi
cago
, 201
5M
ap im
age
is th
e in
telle
ctua
l pro
perty
of E
sri a
nd is
use
d he
rein
und
er li
cens
e.
Copy
right
© 2
017
Esri
and
its li
cens
ors.
All
right
s re
serv
ed.
EXPL
AN
ATI
ON
Emer
ald
Fen
boun
dary
586
Art
ifici
al ri
vule
t
Nat
ural
rivu
let
590
Stre
amga
ge lo
catio
n an
d na
me
Wel
l loc
atio
n an
d na
me
4LC
Line
of e
qual
ele
vatio
n—Co
ntou
r
inte
rval
is 5
feet
. Dat
um is
Nor
th
A
mer
ican
Ver
tical
Dat
um o
f 198
8
Figu
re 3
1.
Loca
tion
of fe
atur
es in
the
vici
nity
of E
mer
ald
Fen
at th
e W
ater
fall
Glen
For
est P
rese
rve,
DuP
age
Coun
ty, I
llino
is.
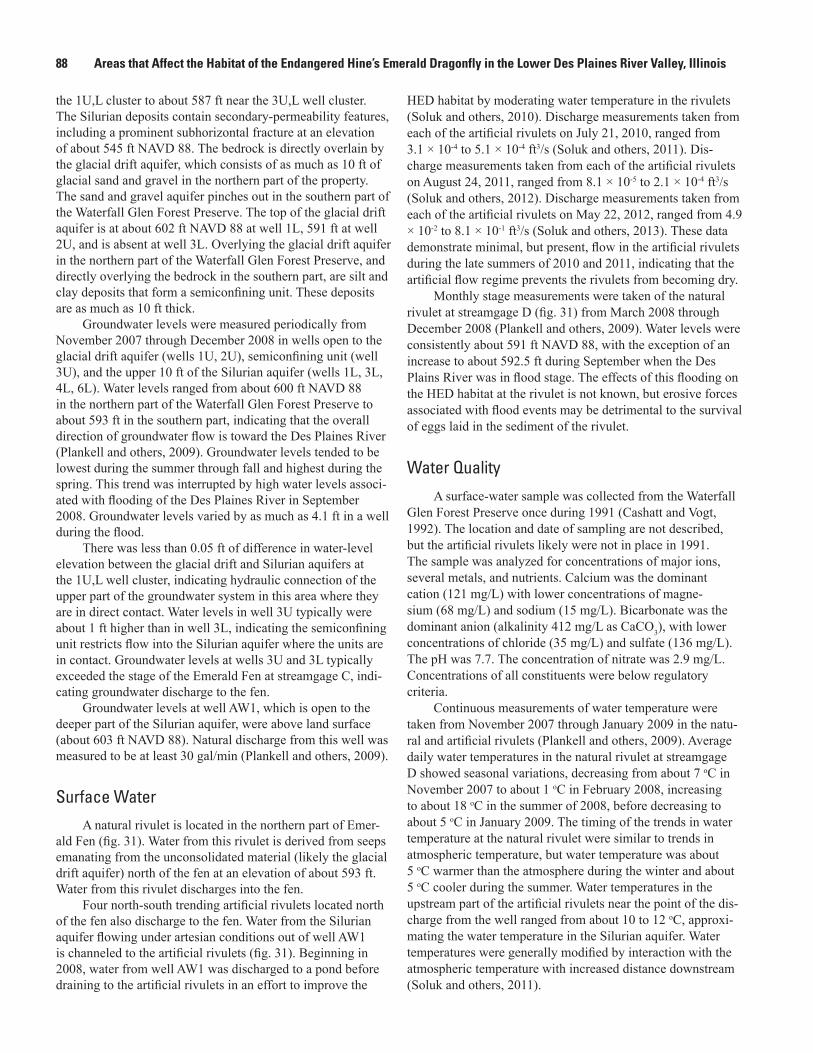
88 Areas that Affect the Habitat of the Endangered Hine’s Emerald Dragonfly in the Lower Des Plaines River Valley, Illinois
the 1U,L cluster to about 587 ft near the 3U,L well cluster. The Silurian deposits contain secondary-permeability features, including a prominent subhorizontal fracture at an elevation of about 545 ft NAVD 88. The bedrock is directly overlain by the glacial drift aquifer, which consists of as much as 10 ft of glacial sand and gravel in the northern part of the property. The sand and gravel aquifer pinches out in the southern part of the Waterfall Glen Forest Preserve. The top of the glacial drift aquifer is at about 602 ft NAVD 88 at well 1L, 591 ft at well 2U, and is absent at well 3L. Overlying the glacial drift aquifer in the northern part of the Waterfall Glen Forest Preserve, and directly overlying the bedrock in the southern part, are silt and clay deposits that form a semiconfining unit. These deposits are as much as 10 ft thick.
Groundwater levels were measured periodically from November 2007 through December 2008 in wells open to the glacial drift aquifer (wells 1U, 2U), semiconfining unit (well 3U), and the upper 10 ft of the Silurian aquifer (wells 1L, 3L, 4L, 6L). Water levels ranged from about 600 ft NAVD 88 in the northern part of the Waterfall Glen Forest Preserve to about 593 ft in the southern part, indicating that the overall direction of groundwater flow is toward the Des Plaines River (Plankell and others, 2009). Groundwater levels tended to be lowest during the summer through fall and highest during the spring. This trend was interrupted by high water levels associ-ated with flooding of the Des Plaines River in September 2008. Groundwater levels varied by as much as 4.1 ft in a well during the flood.
There was less than 0.05 ft of difference in water-level elevation between the glacial drift and Silurian aquifers at the 1U,L well cluster, indicating hydraulic connection of the upper part of the groundwater system in this area where they are in direct contact. Water levels in well 3U typically were about 1 ft higher than in well 3L, indicating the semiconfining unit restricts flow into the Silurian aquifer where the units are in contact. Groundwater levels at wells 3U and 3L typically exceeded the stage of the Emerald Fen at streamgage C, indi-cating groundwater discharge to the fen.
Groundwater levels at well AW1, which is open to the deeper part of the Silurian aquifer, were above land surface (about 603 ft NAVD 88). Natural discharge from this well was measured to be at least 30 gal/min (Plankell and others, 2009).
Surface Water A natural rivulet is located in the northern part of Emer-
ald Fen (fig. 31). Water from this rivulet is derived from seeps emanating from the unconsolidated material (likely the glacial drift aquifer) north of the fen at an elevation of about 593 ft. Water from this rivulet discharges into the fen.
Four north-south trending artificial rivulets located north of the fen also discharge to the fen. Water from the Silurian aquifer flowing under artesian conditions out of well AW1 is channeled to the artificial rivulets (fig. 31). Beginning in 2008, water from well AW1 was discharged to a pond before draining to the artificial rivulets in an effort to improve the
HED habitat by moderating water temperature in the rivulets (Soluk and others, 2010). Discharge measurements taken from each of the artificial rivulets on July 21, 2010, ranged from 3.1 × 10⁻⁴ to 5.1 × 10⁻⁴ ft3/s (Soluk and others, 2011). Dis-charge measurements taken from each of the artificial rivulets on August 24, 2011, ranged from 8.1 × 10⁻⁵ to 2.1 × 10⁻⁴ ft3/s (Soluk and others, 2012). Discharge measurements taken from each of the artificial rivulets on May 22, 2012, ranged from 4.9 × 10⁻² to 8.1 × 10⁻¹ ft3/s (Soluk and others, 2013). These data demonstrate minimal, but present, flow in the artificial rivulets during the late summers of 2010 and 2011, indicating that the artificial flow regime prevents the rivulets from becoming dry.
Monthly stage measurements were taken of the natural rivulet at streamgage D (fig. 31) from March 2008 through December 2008 (Plankell and others, 2009). Water levels were consistently about 591 ft NAVD 88, with the exception of an increase to about 592.5 ft during September when the Des Plains River was in flood stage. The effects of this flooding on the HED habitat at the rivulet is not known, but erosive forces associated with flood events may be detrimental to the survival of eggs laid in the sediment of the rivulet.
Water Quality
A surface-water sample was collected from the Waterfall Glen Forest Preserve once during 1991 (Cashatt and Vogt, 1992). The location and date of sampling are not described, but the artificial rivulets likely were not in place in 1991. The sample was analyzed for concentrations of major ions, several metals, and nutrients. Calcium was the dominant cation (121 mg/L) with lower concentrations of magne-sium (68 mg/L) and sodium (15 mg/L). Bicarbonate was the dominant anion (alkalinity 412 mg/L as CaCO3), with lower concentrations of chloride (35 mg/L) and sulfate (136 mg/L). The pH was 7.7. The concentration of nitrate was 2.9 mg/L. Concentrations of all constituents were below regulatory criteria.
Continuous measurements of water temperature were taken from November 2007 through January 2009 in the natu-ral and artificial rivulets (Plankell and others, 2009). Average daily water temperatures in the natural rivulet at streamgage D showed seasonal variations, decreasing from about 7 oC in November 2007 to about 1 oC in February 2008, increasing to about 18 oC in the summer of 2008, before decreasing to about 5 oC in January 2009. The timing of the trends in water temperature at the natural rivulet were similar to trends in atmospheric temperature, but water temperature was about 5 oC warmer than the atmosphere during the winter and about 5 oC cooler during the summer. Water temperatures in the upstream part of the artificial rivulets near the point of the dis-charge from the well ranged from about 10 to 12 oC, approxi-mating the water temperature in the Silurian aquifer. Water temperatures were generally modified by interaction with the atmospheric temperature with increased distance downstream (Soluk and others, 2011).

Assessment of Conditions that Affect the Water Resources at Selected Hine’s Emerald Dragonfly Habitats 89
Continuous measurements of the specific conductance of water in the natural and artificial rivulets were taken from November 2007 through January 2009 (Plankell and oth-ers, 2009). Specific conductance values in the natural rivu-let at streamgage D typically ranged from about 1,000 to 1,300 µS/cm. Large decreases in specific conductance were associated with precipitation events, reflecting the presence of overland runoff from precipitation. Specific conductance values in the natural rivulet were lower during the spring than the rest of the year, indicating dilution of natural rivulet water by overland runoff from snowmelt and precipitation. The lower conductivity during the spring also may reflect the effects of increased amounts of low-conductivity recharge from snowmelt and precipitation to the shallow groundwater that discharges to the natural rivulet. Specific conductance values in the artificial rivulet at streamgage H2 typically were consistently between 1,200 and 1,300 µS/cm but also showed large decreases during precipitation events.
Continuous measurements of the pH of water in the natural and artificial rivulets were taken from January 2008 through December 2008 (Plankell and others, 2009). Values in the natural rivulet showed an overall decrease from about 7.7 in January to about 6.3 in December. Values in the artificial rivulet typically were between 7.0 and 7.5, reflecting the pH of its source water from the Silurian aquifer.
Groundwater samples were collected at least once and as often as quarterly from December 2007 through September 2008 from wells 1U, 1L, 2U, 3L, 4L, 6L and AW2; from an artificial rivulet fed by artesian water from well AW1; and from the natural rivulet at streamgage D (table 13). These samples were analyzed for concentrations of metals, major ions, and nutrients, and organic carbon (Plankell and others, 2009). Water-quality criteria were exceeded in the Silurian aquifer for iron at wells 3L (1.3 mg/L), 6L (11 mg/L), and AW2 (1.1 mg/L); manganese at well 3L (0.92 mg/L) and 6L (1.7 mg/L); and phosphorus at well 6L (0.17 mg/L; table 3). Water quality criteria also were exceeded in some samples from the natural rivulet for manganese (geometric mean 0.12 mg/L). The data indicate calcium was the dominant cation and that the water was alkaline, indicating that dissolu-tion of carbonate minerals in the unconsolidated and bedrock deposits affected water quality at the Waterfall Glen Forest Preserve. Chloride concentrations greater than 75 mg/L in both surface and groundwater indicate the effect of road salts. Constituent concentrations in the artificial rivulet are similar to those in well AW2. This similarity is expected because wells AW1 and AW2 are both open to the deeper part of the Silurian aquifer and well AW1 is the water source for the artificial rivu-lets. Constituent concentrations in the natural rivulet typically are lower than in the artificial rivulet and are generally consis-tent with concentrations in well 1U, indicating the water in the natural rivulet is derived from the unconsolidated deposits.
Assessment of Water Resources at the McMahon Fen Nature Preserve
The McMahon Fen Nature Preserve occupies 373 acres approximately 4 mi east of the Des Plaines River in southwest Cook County (fig. 3). The McMahon Fen Nature Preserve is bounded by the Calumet Sag Channel to the south, 107th Street to the north, Willow Springs Road to the west, and Route 45 to the east (figs. 3, 32). The area of concern to this investigation is in the west-central part of the preserve south of Crooked Creek (fig. 32).
Topography
The McMahon Fen Nature Preserve contains a northwest-southeast trending topographic high at an elevation of about 610 ft NAVD 88 (fig. 32). North of this high, land surface slopes toward Crooked Creek at a minimum elevation of about 604 ft near 107th Street. South of the high, land surface slopes down to the Calumet Sag Channel at an elevation of about 587 ft. North of 107th Street, land surface increases to more than 700 ft. Berms are present near the western and southern parts of the preserve.
Biology
Adult HED use of the McMahon Fen Nature Preserve for foraging, territorial patrol, and breeding has been periodi-cally documented (Cashatt and others, 1993; Cashatt and Vogt, 1996; Soluk and others, 2014), often in the vicinity of spring-fed rivulets near the east end of the preserve. HED larvae have been identified at rivulets in the eastern part of the McMahon Fen Nature Preserve (Soluk and others, 2010, 2014).
Hydrogeology
The surficial geology transitions from glacial river bottom sand and gravel in much of the northern part of the preserve to peat and muck in the southern part at the approxi-mate location of the tree line south of the open area in the center of the preserve (Graef, Anhalt, Schloemer, and Associ-ates, Inc., 2007b). The berms in the western and southern parts of the preserve consist of fill. Lithologic logs obtained from the ISGS database (Illinois State Geological Survey, [n.d.]) indicate the top of the Silurian dolomite, which constitutes the Silurian aquifer, is present at an elevation of about 575 ft. The unconsolidated deposits are 10–30 ft thick in this area.
Lithologic logs for well MF1D installed by the USGS in the northwest corner of the McMahon Fen Nature Preserve during the spring of 2013 (fig. 32) indicate the presence of at least 12 ft of semiconfining unit consisting of silt and clay till. The log for USGS well MF3 indicates the presence of a sand deposit constituting the glacial drift aquifer at a depth of about 6 ft (elevation of about 600 ft) overlain by silt and clay.

90 Areas that Affect the Habitat of the Endangered Hine’s Emerald Dragonfly in the Lower Des Plaines River Valley, IllinoisTa
ble
13.
Conc
entra
tion
of m
ajor
ions
and
nitr
ogen
com
poun
ds in
sur
face
wat
er a
nd g
roun
dwat
er a
t the
Wat
erfa
ll Gl
en F
ores
t Pre
serv
e, D
uPag
e Co
unty
, Illi
nois
, Dec
embe
r 20
07 th
roug
h Se
ptem
ber 2
008.
[mg/
L, m
illig
ram
per
lite
r; C
aCO
3, ca
lciu
m c
arbo
nate
; GM
, geo
met
ric m
ean
valu
e of
all
sam
ples
from
loca
tion;
<, l
ess t
han]
Sam
ple
loca
tion
(sho
wn
in
fig. 3
1)Sa
mpl
e da
teU
nit m
onito
red
Calc
ium
, in
mg/
LM
agne
sium
, in
mg/
LSo
dium
, in
mg/
L
Alk
alin
ity,
in m
g/L
as
CaCO
3
Chlo
ride
, in
mg/
LSu
lfate
, in
mg/
L
Nitr
ate
as
nitr
ogen
, in
mg/
L
Am
mon
ia a
s ni
trog
en,
in m
g/L
1U12
/18/
07U
ncon
solid
ated
93 G
M47
GM
77 G
M29
4 G
M15
8 G
M73
GM
0.62
GM
All
<0.0
6 3/
11/0
8
6/17
/08
9/16
/08
1L12
/18/
07Sh
allo
w S
iluria
n aq
uife
r10
0 G
M48
GM
60 G
M31
5 G
M21
3 G
M84
GM
0.44
GM
0.09
GM
3/11
/08
6/17
/08
9/16
/08
2U12
/18/
07U
ncon
solid
ated
128
5152
317
130
143
0.31
<0.0
63L
12/1
8/07
Shal
low
Silu
rian
aqui
fer
121
5035
388
7875
<0.0
70.
964L
12/1
8/07
Shal
low
Silu
rian
aqui
fer
119
5483
356
188
102
0.34
<0.0
6A
rtific
ial r
ivul
et
flow
from
wel
l AW
1
12/1
8/07
Surfa
ce w
ater
der
ived
fro
m d
eep
Silu
rian
aqui
fer
140
GM
55 G
M56
GM
342
GM
134
GM
148
GM
<0.0
70.
57 G
M
3/11
/08
6/17
/08
9/16
/084
Nat
ural
rivu
let
12/1
8/07
Surfa
ce w
ater
87 G
M44
GM
63 G
M27
3 G
M12
6 G
M70
GM
0.22
GM
All
<0.0
63/
11/0
8
6/17
/08
9/16
/08
AW2
12/1
8/07
Dee
p Si
luria
n aq
uife
r14
454
5433
912
815
4<0
.07
0.60

Assessment of Conditions that Affect the Water Resources at Selected Hine’s Emerald Dragonfly Habitats 91
630
625
620
615
610
605
600
595
590
590
60558
5
590
580
620
615610
595 590
630
625
620
635
630
625
595
590
590
585
580
595
595
630
615
600
590
630
620
615
610
600
600
595
630
625
620
615
615
615
610
610
610
605
605
605
600
600
600
595
595
595
590
590
590
590
60558
5
590
580
620
615610
595 590
630
625
620
635
630
625
595
590
590
585
580
595
595
630
615
600
590
630
620
615
610
600
600
595
MF3
MF1
S/D
CCG
R1
R2
R9
4141
3008
7521
301
MF3
MF1
S/D
CCG
R1
R2
R9
4141
3008
7521
301
107T
H S
TREE
T
WILLOW SPRINGS ROAD
Calu
met
Sag
Cha
nnel
Croo
ked
Cree
k
Croo
ked
Cree
k
Calu
met
Sag
Cha
nnel
WILLOW SPRINGS ROAD
107T
H S
TREE
T
87°5
1'40
"87
°51'
50"
87°5
2'00
"87
°52'
10"
87°5
2'20
"87
°52'
30"
41°4
1'40
"
41°4
1'30
"
41°4
1'20
"
00.
250.
050.
10.
150.
2M
ILE
00.
250.
050.
10.
150.
2KI
LOM
ETER
Imag
ery
from
the
U.S.
Dep
artm
ent o
f Agr
icul
ture
Far
m S
ervi
ce A
genc
y, A
eria
l Pho
togr
aphy
Fie
ld O
ffice
, 201
5 N
atio
nal A
gric
ultu
re Im
ager
y Pr
ogra
m (N
AIP)
Nat
ural
Col
or Im
ager
y fo
r Illi
nois
EXPL
AN
ATI
ON
586
Rivu
let a
nd n
ame—
Rivu
let
lo
catio
n fro
m G
oogl
eEar
th™
Seep
Croo
ked
Cree
k
590
Stre
amga
ge lo
catio
n an
d na
me
Wel
l loc
atio
n an
d na
me
MF3
CCG
Nat
ure
pres
erve
bou
ndar
y
Line
of e
qual
ele
vatio
n—
Con
tour
inte
rval
is 5
feet
.
Dat
um is
Nor
th A
mer
ican
V
ertic
al D
atum
of 1
988
R1 R1
Figu
re 3
2.
Loca
tion
of s
elec
ted
feat
ures
at t
he M
cMah
on F
en N
atur
e Pr
eser
ve, C
ook
Coun
ty, I
llino
is.

92 Areas that Affect the Habitat of the Endangered Hine’s Emerald Dragonfly in the Lower Des Plaines River Valley, Illinois
The USGS measured water levels in wells MF1S and MF1D five times from June 10 through November 27, 2013 (U.S. Geological Survey, 2016a). Individual measurements are presented in the USGS NWIS database (U.S. Geological Survey, 2017). Well MF1S is open to the semiconfining unit from 5 to 8 ft below land surface. Well MF1D is open to the semiconfining unit from 9 to 12 ft. Depth to water was 1–4.5 ft below land surface (water elevation 596.5–599.75 ft) at well MF1S and about 1.3 ft above land surface to 1.6 ft below land surface at well MF1D (elevation 600.4–603.3 ft). Water levels showed seasonal variation, being highest in June and Novem-ber and lowest in September. Water levels in well MW1D were consistently higher than in well MW1S, indicating the potential for upward groundwater flow in this area. This flow may help sustain the surface-water bodies.
The USGS took continuous and periodic water-level mea-surements at well MF3 from April through November 2013 (fig. 33; U.S. Geological Survey, 2016a). Well MF3 is open to the glacial drift aquifer from 3.6 to 6.6 ft below land surface. Water levels decreased by as much as about 3 ft overall from April to late October, likely in response to a seasonal reduction in the amount of recharge to groundwater, before increasing in November. There were also a number of short-term increases that could exceed 1 ft associated with recharge from precipi-tation events. Water levels did not drop below the top of the sand layer (about 600 ft), indicating the glacial drift aquifer is connected to a stable source of recharge that may extend north of the McMahon Fen Nature Preserve. Water levels in well MF3 were consistently below the elevation of the land surface (606 ft).
Surface Water Crooked Creek traverses the northern part of the McMa-
hon Fen Nature Preserve. The elevation of the base of the creek ranges from about 615 ft at 107th St in the northeastern part of the McMahon Fen Nature Preserve to about 605 ft at 107th St in the northwestern part. Surface-water modeling indicates that the stage of Crooked Creek may occasion-ally flood the center and southern parts of the McMahon Fen Nature Preserve, partly due to constriction of flow by the west culvert beneath 107th Street (Graef, Anhalt, Schloemer, and Associates, Inc., 2009b). A larger culvert in this area would decrease the magnitude of flooding in the McMahon Fen Nature Preserve. If the floodwater extends to HED habitat, it could result in erosion and other effects that are detrimental to HED survival.
A large seep is located near the center of the McMahon Fen Nature Preserve at an elevation of about 600 ft (fig. 32). The location of the seep roughly corresponds to the area where the geology transitions from river bottom deposits to the north to peat and muck deposits to the south (Graef, Anhalt, Schlo-emer, and Associates, Inc., 2007b). The seep is present where the elevation of land surface is equal to the elevation of the top of the sand deposit identified at well MF3.
Seep-fed rivulets are located in the center of the McMa-hon Fen Nature Preserve. The rate of base flow is about 0.2 ft3/s at rivulet R9 and about 0.01 ft3/s at rivulets R1 and R2. There typically is no flow at the rivulets near rivulet R9, pos-sibly because the groundwater flow that would sustain flow in these rivulets is diverted to rivulet R9. The bed of much of
0.0
2.0
4.0
6.0
8.0
10.0
12.0
14.0
16.0
18.0
0
200
100
300
400
500
600
700
800
900
599
600
601
602
603
604
605
April May June July August September October November
Spec
ific
cond
ucta
nce,
in m
icro
siem
ens
per
cent
imet
er a
t 25
degr
ees
Cels
ius
Wat
er le
vel a
bove
Nor
th A
mer
ican
Verti
cal D
atum
of 1
988,
in fe
et
2013
Tem
pera
ture
, in
degr
ees
Cels
ius
Water levelSpecific conductanceTemperature
EXPLANATION
Figure 33. Water level, specific conductance, and temperature of groundwater in well MF3, McMahon Fen Nature Preserve, Cook County, Illinois, April through November, 2013.

Assessment of Conditions that Affect the Water Resources at Selected Hine’s Emerald Dragonfly Habitats 93
rivulet R9 has eroded through the surficial geologic deposits and contains gravel-sized sediment with minimal detritus. Ero-sion likely is caused by high water velocities associated with the elevated flow and topographic gradient at some segments of rivulet R9. The lack of detritus and high water velocities likely reduce the chance for survival of any HED eggs depos-ited in rivulet R9.
Continuous water-level measurements taken from March through October 2013 by the USGS at rivulet R9 (U.S. Geo-logical Survey, 2016a) indicate baseline water levels are near land surface with periodic increases of as much as 0.60 ft asso-ciated with precipitation events (fig. 34). The spike in water level in April may be associated with flooding of Crooked Creek. Water was present at the rivulet throughout the mea-surement period, indicating stable discharge from the seep supplying the rivulet.
Water Quality
Continuous measurements of specific conductance and temperature were taken by the USGS at well MF3 (fig. 33) and rivulet R9 (fig. 34) during most of 2013 (U.S. Geologi-cal Survey, 2016a). Specific conductance values in ground-water at well MF3 typically were about 650–700 µS/cm but tended to change when water levels increased during recharge events. Specific conductance values in the water at rivulet R9 increased from about 700 to 1,200 µS/cm from March through June and showed a small overall decrease to about 1,100 µS/cm by late October. Numerous short-term decreases in spe-cific conductance were observed during precipitation events.
Although specific conductance values are lower at MF3 than at rivulet R9, the baseline specific conductance values at rivulet R9 likely are a reflection of the specific conductance of the groundwater discharging to the rivulets. Increasing conductance values observed in the rivulet during the spring likely reflect the presence of water derived from snowmelt and spring rains being replaced by groundwater derived from longer-term recharge entering the glacial drift aquifer north of the McMahon Fen Nature Preserve. Sharply lower conduc-tance values reflect the presence of precipitation in the rivulet. Water temperatures in well MF3 and rivulet R9 were similar, ranging from about 6 ºC in March to about 15 ºC in Septem-ber before decreasing to about 10 ºC in late November. These values reflect the effects of groundwater temperature, modified by atmospheric interaction, on water temperature at rivulet R9.
Other Hine’s Emerald Dragonfly Habitats in Illinois
In addition to the HED habitats described, HED adults have been documented at the Lockport Prairie East and Dellwood West Nature Preserves (Hanson Material Service Corporation, 2016), which are located across the Des Plaines River from the Lockport Prairie Nature Preserve (fig. 2). These properties appear to be used for foraging by HED from the Lockport Prairie Nature Preserve (Hanson Material Service Corporation, 2016). Biologic, hydrologic, and water-quality conditions at this property have not been investigated. Geologic conditions are likely to be similar to those at the Lockport Prairie Nature Preserve.
AprilMarch May June July August September October
Spec
ific
cond
ucta
nce,
in m
icro
siem
ens
per
cent
imet
er a
t 25
degr
ees
Cels
ius
2013
0.0
2.0
4.0
6.0
8.0
10.0
12.0
14.0
16.0
18.0
Tem
pera
ture
, in
degr
ees
Cels
ius
592.0
592.2
592.4
592.6
592.8
593.0
593.2
593.4
0
200
400
600
800
1,000
1,200
1,400
1,600
1,800
Wat
er le
vel a
bove
Nor
th A
mer
ican
Verti
cal D
atum
of 1
988,
in fe
et
Water levelSpecific conductanceTemperature
EXPLANATION
Figure 34. Water level, specific conductance, and temperature of rivulet 9 at streamgage 414130087521301, McMahon Fen Nature Preserve, Cook County, Illinois, March through October, 2013.

94 Areas that Affect the Habitat of the Endangered Hine’s Emerald Dragonfly in the Lower Des Plaines River Valley, Illinois
HED larval and adult use has been documented south-west of the Lockport Lock and Dam (fig. 2; Hanson Material Service Corporation, 2016). This property is near a wastewater treatment plant, which may affect the hydrology and water quality of the habitat. Biologic, hydrologic, and water-quality conditions at this property have not been investigated. Geo-logic conditions are likely to be similar to those at the Lock-port Prairie Nature Preserve.
Larvae of the HED have been identified in the northwest corner of the Argonne National Laboratory and adult use has been observed in the southeast corner of the Laboratory (fig. 3; Danial Soluk, University of South Dakota, written commun., 2016, 2017). This habitat consists of a small wetland area in the topographic uplands approximately 1.8 mi north of the bluffs of the Des Plaines River Valley. This wetland is associ-ated with seeps located in the upper few feet of the uncon-solidated deposits. Depth to the Silurian bedrock in this area is more than 100 ft according to well logs obtained from the ISGS (Illinois State Geological Survey, [n.d.]). The habitat in the southeast corner of the Argonne National Labora-tory appears to be associated with a wastewater discharge. Biologic, hydrologic, geologic, and water-quality conditions associated with HED use at the Argonne National Laboratory have not been investigated.
HED adults have been documented at the Cherry Hill Woods and Horsetail Lake Forest Preserves (Cashatt, 2015). These sites are south of McMahon Fen (fig. 3). Territorial patrols have been observed at both sites. Biologic, hydrologic, and water-quality conditions at these properties have not been investigated.
In addition to areas in and near the Lower Des Plaines River Valley, HED larval and adult use has been documented at the Spring Lake Forest Preserve in northwest Cook County. The Spring Lake Forest Preserve is approximately 35 mi northwest of the Lockport Prairie Nature Preserve (Soluk and others, 2016). HED habitat in this area is associated with springs emanating from unconsolidated deposits. Well logs indicate the depth to bedrock in this area exceeds 120 ft (Illinois State Geological Survey, [n.d.]). Biologic, hydrologic, geologic, and water-quality conditions at this property have not been investigated.
Implications for Habitat Preservation and Future Data Collection
A summary of the conditions at selected HED habitats (table 14) demonstrates that HED habitat in Illinois is associ-ated with alkaline seeps emanating from dolomite bedrock or unconsolidated deposits that can be more than 100 ft above bedrock. Because alkaline seeps in unconsolidated deposits are present in much of Illinois and the northern United States, suitable conditions for HED habitat may extend beyond the Lower Des Plaines River Valley; however, the (apparent) requirement for seep flow makes the quality of the HED
habitat susceptible to small changes in the groundwater flow system that take place seasonally, over periods of months or years, or that are permanent.
Hydraulic, geologic, and water-quality conditions at many of the HED habitats discussed in this report are inad-equately understood. The source of water to seeps (bedrock or unconsolidated deposits), surface-water flow pathways, loca-tion of the groundwater recharge area, water use within the groundwater recharge area, discharge rates from seeps, water chemistry, variations in water levels, volume of direct dis-charge from groundwater to the wetlands, location where there is direct discharge from groundwater to the wetlands, and the relation of these hydraulic and chemical phenomena to the HED populations requires characterization at many habitats.
The water-quality characterization at many of the habitats is limited by a lack of precise information on sample loca-tion and date of collection. Many of the analyses, especially pesticides and mercury, have elevated detection limits relative to their regulatory criteria. Re-sampling many of these water bodies using currently available (2018) analytical techniques would improve the understanding of the threat these constitu-ents pose to the HED. Finally, anomalous sample results were observed in some areas, such as arsenic at the Romeoville Prairie Nature Preserve. Confirmation sampling to verify anomalous data should improve understanding of water-qual-ity conditions.
Changes in the hydraulics within areas supplying groundwater to the HED habitats can be caused by altering the timing and amount of recharge to groundwater associated with seasonal cycles in recharge from precipitation, multiyear droughts, as well as long-term climate change. Understanding the effects of changes in precipitation on water levels and flow at, and within, the groundwater recharge areas that support dif-ferent HED habitats can be useful in assessing the long-term potential for HED survival. For example, the conditions that result in comparatively stable discharge from the Silurian and (to a lesser extent) glacial drift aquifers to the Lockport Prairie Nature Preserve render this site somewhat less susceptible to the effects of variations in precipitation than the shallow unconsolidated deposits at sites such as Romeoville Prairie; however, even small reductions in water levels in the Silurian aquifer at many of the HED habitats could result in a substan-tial decrease in the quality of the habitat. Ongoing periodic and continuous measurement of water levels at selected loca-tions within the Lower Des Plaines River Valley would help to identify hydraulic stresses on the flow system and the source of the stress.
In addition to the effects of climate on the timing and amount of precipitation, changes in the groundwater flow system can be caused by a reduction in the amount of recharge to groundwater associated with an increase in the amount of overland runoff of precipitation from impervious sur-faces within the groundwater recharge area for a particular habitat. Of particular importance for the HED habitat in the Lower Des Plaines River Valley is maximizing the amount of recharge to the glacial drift aquifer along the bluffs at the

Implications for Habitat Preservation and Future Data Collection 95Ta
ble
14.
Sum
mar
y of
con
ditio
ns a
t Hin
e’s
emer
ald
drag
onfly
hab
itats
in Il
linoi
s (c
ompi
led
from
Cas
hatt
and
Vogt
, 199
2, 1
996;
Mie
rzw
a an
d W
ebb,
201
0, 2
012a
,b)
[A, a
dult;
T, t
rans
it; F
, fee
ding
/fora
ging
; L, l
arva
l; B
, bre
edin
g; P
, per
chin
g; T
P, te
rrito
rial p
atro
l; E,
egg
layi
ng; D
, dol
omite
; U, u
ncon
solid
ated
dep
osits
]
Site
nam
es
(sho
wn
in
figs.
1, 2
, or 3
)
Hin
e’s
emer
ald
drag
onfly
use
Hin
e’s
emer
ald
dr
agon
fly b
ehav
ior
Site
of l
arva
l hab
itat
Sour
ce o
f se
eps
Pote
ntia
l hyd
rolo
gic
and
wat
er-q
ualit
y th
reat
s to
hab
itat
Qua
rry
AT,
FN
ot si
nce
at le
ast 2
005
No
seep
s id
entifi
edR
educ
tion
in fl
ow d
ue to
hig
h-ca
paci
ty p
umpi
ng a
nd re
duct
ion
in w
ater
shed
are
a du
e to
exc
avat
ion.
Wat
er-q
ualit
y ch
ange
s du
e to
app
licat
ion
of ro
ad sa
lt.R
iver
Sou
th P
arce
lA
,LB
, F, T
, P, T
P, E
Riv
ulet
s in
sout
hern
par
t of
pro
perty
DR
educ
tion
in w
ater
due
to h
igh-
capa
city
pum
ping
in re
char
ge
area
; im
perv
ious
surf
ace
in re
char
ge a
rea.
Flo
w d
isru
ptio
n fr
om ro
adbe
d in
hab
itat.
Wat
er-q
ualit
y ch
ange
s due
to a
p-pl
icat
ion
of ro
ad sa
lt, fe
rtiliz
er, a
nd p
ossi
bly
pest
icid
es.
Lock
port
Prai
rie N
atur
e Pr
eser
veA
, LB
, TP,
E, F
, P, T
Riv
ulet
s nea
r cen
ter o
f pr
oper
ty
U, D
Red
uctio
n in
wat
er d
ue to
hig
h-ca
paci
ty p
umpi
ng n
ear r
e-ch
arge
are
a an
d in
crea
sed
impe
rvio
us su
rfac
es in
rech
arge
ar
ea. F
low
dis
rupt
ion
from
cul
vert
and
road
bed
in h
abita
t. W
ater
-qua
lity
chan
ges d
ue to
app
licat
ion
of ro
ad sa
lt, fe
rtil-
izer
, and
pos
sibl
y pe
stic
ides
. C
om E
d/Lo
ng R
un P
arce
lsA
,LF,
TP,
T, B
Riv
ulet
s nea
r ope
n w
ater
so
uth
of b
ound
ary
betw
een
parc
els
DR
educ
tion
in w
ater
due
to h
igh-
capa
city
pum
ping
in a
nd n
ear
rech
arge
are
a; im
perv
ious
surf
ace
in re
char
ge a
rea.
Flo
w
disr
uptio
n fr
om ro
adbe
d in
hab
itat a
nd se
dim
ent e
xcav
atio
n.
Wat
er-q
ualit
y ch
ange
s due
to o
il sp
ill a
nd a
pplic
atio
n of
ro
ad sa
lt.Lo
ng R
un S
eep
Nat
ure
Pres
erve
A,L
B, T
P, F
, ER
ivul
ets i
n w
este
rn p
art
of p
rope
rtyU
Red
uctio
n in
wat
er d
ue to
impe
rvio
us su
rfac
e in
rech
arge
are
a.
Wat
er-q
ualit
y ch
ange
s due
to a
pplic
atio
n of
road
salt,
ferti
l-iz
er, a
nd p
ossi
bly
pest
icid
es.
Rom
eovi
lle P
rairi
e N
atur
e Pr
eser
veA
B, T
Poss
ibly
in ri
vule
t in
cent
er o
f site
DR
educ
tion
in w
ater
due
to h
igh-
capa
city
pum
ping
in a
nd n
ear
rech
arge
are
a; im
perv
ious
surf
ace
in re
char
ge a
rea.
Wat
er-
qual
ity c
hang
es d
ue to
app
licat
ion
of ro
ad sa
lt an
d fe
rtiliz
er.
Floo
ding
on
Des
Pla
ines
Riv
er.
Kee
pata
w F
ores
t Pre
serv
eA
,LF,
T, T
PSe
eps a
rea
UR
educ
tion
in w
ater
due
to h
igh-
capa
city
pum
ping
nea
r re
char
ge a
rea;
impe
rvio
us su
rfac
e in
rech
arge
are
a. W
ater
-qu
ality
cha
nges
due
to a
pplic
atio
n of
road
salt.
Hyd
rolo
gic
and
eros
ive
effe
cts o
f int
erm
itten
t dra
inag
e in
nor
thea
st p
art
of p
rope
rty.
Bla
ck P
artri
dge
Woo
ds F
ores
t Pr
eser
veA
,LU
nkno
wn
Non
e id
entifi
edU
Insu
ffici
ent c
hara
cter
izat
ion
to a
sses
s hyd
rolo
gic
thre
ats.
Wat
er-q
ualit
y ch
ange
s due
to a
pplic
atio
n of
road
salt.
Wat
erfa
ll G
len
Fore
st P
rese
rve
A,L
T, F
, P, T
P N
atur
al ri
vule
tU
Wat
er-q
ualit
y ch
ange
s due
to a
pplic
atio
n of
road
salt.
Arti
ficia
l riv
ulet
wat
er m
ay b
e to
o co
ld. F
low
rate
may
be
too
high
in
artifi
cial
rivu
let.
Floo
ding
of D
es P
lain
es R
iver
.

96 Areas that Affect the Habitat of the Endangered Hine’s Emerald Dragonfly in the Lower Des Plaines River Valley, IllinoisTa
ble
14.
Sum
mar
y of
con
ditio
ns a
t Hin
e’s
emer
ald
drag
onfly
hab
itats
in Il
linoi
s (c
ompi
led
from
Cas
hatt
and
Vogt
, 199
2, 1
996;
Mie
rzw
a an
d W
ebb,
201
0, 2
012a
,b)—
Cont
inue
d
[A, a
dult;
T, t
rans
it; F
, fee
ding
/fora
ging
; L, l
arva
l; B
, bre
edin
g; P
, per
chin
g; T
P, te
rrito
rial p
atro
l; E,
egg
layi
ng; D
, dol
omite
; U, u
ncon
solid
ated
dep
osits
]
Site
nam
es
(sho
wn
in
figs.
1, 2
, or 3
)
Hin
e’s
emer
ald
drag
onfly
use
Hin
e’s
emer
ald
dr
agon
fly b
ehav
ior
Site
of l
arva
l hab
itat
Sour
ce o
f se
eps
Pote
ntia
l hyd
rolo
gic
and
wat
er-q
ualit
y th
reat
s to
hab
itat
McM
ahon
Fen
Nat
ure
Pres
erve
A,L
B, F
, TP
Riv
ulet
in e
aste
rn p
art
prop
erty
UPe
riodi
c lo
ss o
f wat
er in
seep
s due
to b
elow
ave
rage
pre
cipi
ta-
tion.
Wat
er-q
ualit
y ch
ange
s due
to a
pplic
atio
n of
road
salt.
Er
osio
n an
d di
vers
ion
of fl
ow in
som
e riv
ulet
s.D
ellw
ood
Wes
t and
Loc
kpor
t Pr
airie
Eas
t Nat
ure
Pres
erev
esA
T, F
Non
e id
entifi
edU
nkno
wn
Insu
ffici
ent c
hara
cter
izat
ion
to a
sses
s thr
eats
.
Sout
hwes
t of L
ockp
ort L
ock
and
Dam
A,L
Unk
now
nU
nkno
wn
Unk
now
nIn
suffi
cien
t cha
ract
eriz
atio
n to
ass
ess t
hrea
ts.
Arg
onne
Nat
iona
l Lab
orat
ory
LU
nkno
wn
Wet
land
in n
orth
east
par
t of
pro
perty
UIn
suffi
cien
t cha
ract
eriz
atio
n to
ass
ess t
hrea
ts.
Sprin
g La
ke N
atur
e Pr
eser
veA
,LU
nkno
wn
Sprin
gs
UIn
suffi
cien
t cha
ract
eriz
atio
n to
ass
ess t
hrea
ts.
valley boundaries. Use of best management practices, which has been done in parts of the recharge area for the Lockport Prairie Nature Preserve, has the potential to offset the effects of the reductions in groundwater recharge due to runoff from impervious surfaces. Reducing overland flow of runoff from precipitation has the potential to reduce erosion and sediment deposition in some of the habitats and has the potential to improve some components of water quality.
Changes in the groundwater system can be caused by high-capacity pumping in and near the groundwater recharge areas by removing water from the Silurian aquifer that would otherwise have discharged to HED habitat. The area within which pumping from a high-capacity well open to the Silurian aquifer can divert water from a particular HED habitat and the volume of water diverted are affected by the hydraulic proper-ties of the aquifer, the location and degree of interconnection between the secondary-permeability features at the well and the habitat, and the volume of pumping from the well. None of these factors are well understood within the Lower Des Plaines River Valley as a whole or within the groundwater recharge area for any of the HED habitats. Better under-standing of these factors would be gained from monitoring the timing of pumping as well as monthly assessment of the volume of discharge from the high-capacity wells. Detailed characterization of the flow system within the Silurian aqui-fer by performance of continuous water-level monitoring, geophysical logging, and aquifer testing would enable more accurate identification of how the hydraulic stresses will affect the habitats. This characterization is of particular importance at the Lockport Prairie Nature Preserve, River South Parcel, Com Ed and Long Run Parcels, and the Romeoville Prairie Nature Preserve.
Surface-water flow pathways within many of the wet-lands have been substantially altered by the construction of culverts, roads, and railroads. This alteration likely has affected the HED habitat by drying some areas and increas-ing water levels, streamflow, and erosion in others, particu-larly near culverts. An important consideration during future construction is to replicate the natural hydrology, particularly with regard to the placement of culverts at locations that result in flow to natural drainages. Accurate assessment of discharge, velocity, sedimentation, and erosion at these features along with ongoing identification of the location of HED populations has the potential to add insight to the hydraulic and chemical effects on the HED habitat so that more effective mitigation can be devised. This characterization is of particular impor-tance at the Lockport Prairie Nature Preserve, the River South Parcel, the Com Edison and Long Run Parcels, and the McMa-hon Fen site.
Flooding of the Lower Des Plaines River has the poten-tial to result in HED mortality. The extent of floodwater needs to be identified and compared to locations of HED use to better identify and protect potential HED habitat. For example, larval HED use at the Lockport Prairie Nature Preserve and the River South Parcel are near the western parts of the river valley, away from the river. The area inundated by the Des

Summary and Conclusions 97
Plaines River at sites subject to periodic flooding could be evaluated to determine if high water, sediment deposition, and erosion have affected the HED population.
The water balance (volume of water entering a habitat as surface-water flow, groundwater flow, and precipitation as compared to the amount of water exiting the site as surface-water flow and evapotranspiration) is unknown for all of the sites. This information is critical to assessing the stability of the various HED habitats. Collection of the geologic, climate, water use, and hydrologic information outlined in this section should enable an accurate water balance to be developed for at least some of the sites.
The effects of oil spills, as well as the application of road salts and fertilizers at many of the sites, is a potential concern to the HED habitat, particularly with regard to its effects on the flora and fauna that support the HED. Additionally, the alteration of surface-water flow pathways has altered water temperatures at some of the HED habitats. Of particular con-cern is the effect of damming seep discharge behind the berms of the railroad tracks and diverting flow to the culverts on the temperature of the water entering the wetlands. A reduction in the amount of groundwater discharge to the wetlands also has the potential to alter the temperature and water chemistry in the habitats. Collection of periodic and continuous data on temperature, alkalinity, chloride, nutrients, suspended solids, and pesticides in surface and groundwater would improve the understanding of the sources and types of water-quality stress-ors in the Lower Des Plaines River Valley. This information could be used to improve HED productivity and mortality.
Understanding how changes in hydrology affect the HED habitats also requires an understanding of how (if at all) current and natural hydraulic conditions differ, with natural conditions presumably being closer to optimal for the HED. The natural hydrology of the Lower Des Plaines River Valley has been altered by construction of canals, modification of the course of the Des Plaines River, urbanization, groundwa-ter pumping, and other processes. Water-level data collected from well 414217087592801 open to the Silurian aquifer at Argonne National Laboratory showed a decrease of about 15 ft from 1948 through 1990 (U.S. Geological Survey, 2016), partly in response to nearby high-capacity pumping that ceased in January 1997. Water levels only recovered about 5 ft when pumping ceased, indicating that long-term processes may have permanently altered hydraulic conditions in the Silurian aquifer—and the wetlands they discharge to—in at least parts of the Lower Des Plaines River Valley. Modeling efforts designed to assess natural groundwater flow conditions have been completed at the Lockport Prairie Nature Preserve (Graef, Anhalt, Schloemer, and Associates, Inc., 2008) but are not available for any of the other focus areas. Application of groundwater-flow modeling to assess natural conditions is particularly important for the River South Parcel.
Summary and ConclusionsThe federally endangered Hine’s emerald dragonfly
(HED) inhabits wetlands in parts of the Lower Des Plaines River Valley and other areas in northeast Illinois that are recharged by cool, slow moving, alkaline groundwater derived from Silurian dolomite or unconsolidated deposits consisting partly of eroded Silurian dolomite. The habitat requirements of the dragonfly are constrained so that small changes in the amount and quality of groundwater being discharged into the wetlands can have a substantial effect on the habitat. Previous investigations of the biology, geology, hydrology, and water quality at the various HED habitats in the Lower Des Plaines River Valley have identified potential threats to the habitats, as well as potential work activities that could improve the quality of the various habitats.
The West, East, and Middle Quarries (hereafter referred to collectively as “the Quarry”) contain a flat wetland area in the center of the Middle Parcel Expansion Area that is cur-rently (2018) used by adult HED mainly for foraging and as a flight corridor. The wetland receives water from precipitation and inflow of surface water from small drainages near Route 53 offsite and perhaps some groundwater discharge from the Silurian and glacial drift aquifers during short periods of high water. Water exits the Middle Parcel Expansion Area as evapo-transpiration, through surface-water drainage, as drainage to the Silurian aquifer during periods of lower water levels, and as drainage from the Silurian aquifer to the quarries in at least the southern part of the Middle Parcel Expansion Area. Water-quality data indicate a variety of contaminants in surface water and, to a lesser extent, groundwater.
Removal of much of the watershed that fed the southern drainage and diversion of groundwater to quarry dewatering centers has produced a hydrologic regime at the Middle Parcel Expansion Area that is substantially drier than would occur if the Quarry did not exist. These drier conditions have degraded the Middle Parcel Expansion Area as HED habitat. Because HED activities at the Quarry are restricted to transit and forag-ing, increased pumping to support expanded mining at the East and Middle Quarries is expected to have minimal effect on the HED at the Quarry. Model simulations indicate that increased pumping to support expanded mining at the West Quarry will substantially reduce the amount of groundwater discharged to the River South Parcel and will reduce groundwater discharge to the Lockport Prairie Nature Preserve by a small amount. Model simulations indicate that recharge from groundwater mitigation features will be sufficient to offset this decrease.
The River South Parcel contains wetland areas that are the second most productive HED breeding habitat in Illi-nois. The wetlands receive water directly from precipitation, surface-water inflow derived from the Silurian aquifer at seeps along the bluffs, groundwater discharge from the Silurian aquifer in the river valley, and periodic inflow from the Des Plaines River in the southern part of the River South Parcel. Water exits the River South Parcel as evapotranspiration and surface-water drainage to the Des Plaines River in the eastern

98 Areas that Affect the Habitat of the Endangered Hine’s Emerald Dragonfly in the Lower Des Plaines River Valley, Illinois
and southern parts of the parcel. Water levels show large variations in the Silurian aquifer near the bluffs in response to changes in precipitation, resulting in substantial variation in the amount of flow to the seeps. Water-level data show fairly small variation in the river valley, indicating stable flow to the wetland from the Silurian aquifer. Small changes in water level at the River South Parcel appear to have potentially large effects on HED habitat. Surface-water and groundwater quality data indicate predominately calcium and alkaline water derived from the Silurian aquifer with some modification by anthropogenic sources of chloride, nitrate, and phosphorus.
The hydrologic regime at the River South Parcel has been altered by pumping at the Quarry. Expansion of quarry operations into the West Quarry Expansion Area is expected to divert additional water from the River South Parcel. Artificial infiltration to shallow groundwater in this area, coupled with intensive monitoring, is anticipated to ameliorate the expected hydrologic effects of quarry expansion.
The Lockport Prairie Nature Preserve contains wetlands that constitute the largest single HED habitat in Illinois. The wetlands receive water directly from precipitation, surface-water inflow derived from seeps fed by the glacial drift aquifer and the upper part of the Silurian aquifer along the bluffs and groundwater discharge from the Silurian aquifer in the river valley. Flow from the seeps appears to constitute a larger portion of the flow into the Lockport Prairie Nature Pre-serve north of Division Street than south. Discharge from the Silurian aquifer to the wetlands appears to constitute a higher percentage of the total volume of water in the wetland south of Division Street than north. Water exits the Lockport Prairie Nature Preserve as evapotranspiration and surface-water drainage to the Des Plaines River in the eastern part of the preserve. The amount of discharge from the glacial drift and Silurian aquifers to the seeps at the bluff varies in response to changes in the amount of groundwater recharge that takes place at a variety of time scales. Discharge from the Silurian aquifer to the alluvial deposit in the valley of the Des Plaines River is more consistent due to an increased amount of water originating from the semiconfining unit in this part of the flow regime. Water levels in the Silurian aquifer in the river valley consistently indicate the potential for consistent, stable flow to the alluvial aquifer and the wetlands at most of the Lockport Prairie Nature Preserve but show less potential to recharge to these deposits during droughts. The stable flow helps to sus-tain the wetlands during drier periods when water from other sources is reduced.
Surface water at the Lockport Prairie Nature Preserve is alkaline and calcium rich. Lower surface-water temperatures presumably associated with areas of groundwater discharge have been observed. Temperatures are increasingly affected by atmospheric temperature with increased distance from the point of discharge. Water quality shows inconsistent seasonal trends and appears to be affected by changes in the source water, roadside runoff, and fertilizer application.
Modeling indicates the hydrologic regime at the Lockport Prairie Nature Preserve may have been altered by pumping
from nearby high-capacity wells and possibly the Quarry, but this pumping has no obvious effects on water levels measured within the groundwater recharge area for the Silurian aquifer at the Lockport Prairie Nature Preserve. Model results also indicate that small changes in water level in the Silurian aqui-fer at the Lockport Prairie Nature Preserve may substantially affect the volume of discharge to the wetlands. Model simula-tions indicate that future pumping associated with dewatering of the West Quarry will reduce the volume of water discharged from the Silurian aquifer to the Lockport Prairie Nature Pre-serve, but that increased recharge from proposed mitigation features will be sufficient to offset this reduction.
The Com Ed and Long Run Parcels contain substantial wetland areas used by HED larvae and adults. These wetlands receive water from precipitation, inflow of surface water from offsite sources such and Bruce Lake and Long Run Creek, and groundwater discharge from the Silurian aquifer in at least the eastern and central parts of the Com Ed Parcel. Water levels in the parcels are affected by seasonal and longer term varia-tions in recharge from precipitation and groundwater, which periodically results in the wetlands and alluvial aquifer going dry in parts of this area. Water levels at a location typically vary by less than a few feet, even during drought condi-tions. Surface water drains from the wetlands to the Illinois and Michigan Canal and to the Silurian aquifer in the west-ern part of the parcels. Water-quality data indicate this area contains alkaline water derived primarily from the Silurian aquifer, with the likely presence of road-salt constituents in the shallow water. Expansion of dewatering operations at the Quarry is not expected to affect the hydrology of the Com Ed and Long Run Parcels. The effect of increased high-capacity pumping within the groundwater recharge area for the parcels has not been investigated.
The Long Run Seep Nature Preserve contains larval HED habitat associated with seep-fed rivulets discharging from the glacial drift aquifer. Water chemistry in the rivulets and shallow groundwater likely are affected by dissolution of carbonate minerals in the unconsolidated materials, road salt and fertilizer application, and possibly discharge from nearby septic systems.
The Romeoville Prairie Nature Preserve is used by adult HED in areas of seep-fed rivulets discharging from the thin unconsolidated deposits, potentially from a fracture in the near-surface bedrock. Water levels in the unconsolidated deposits and shallow bedrock are typically stable but are affected by precipitation events. Water levels in the uncon-solidated deposits also are affected by evapotranspiration during the summer months. The Silurian aquifer is used for high-capacity groundwater withdrawals within and near the groundwater recharge area for the Romeoville Prairie Nature Preserve. The effects of this pumping on the hydrology of the Romeoville Prairie Nature Preserve have not been assessed. Elevated concentrations of chloride, nitrate, and arsenic indicate that human activities are affecting water quality at an unidentified surface-water feature in the Romeoville Prairie Nature Preserve.

References 99
The Keepataw Forest Preserve is used by adult HED in areas of seep-fed rivulets likely discharging from unconsoli-dated deposits and partly fed by surface-water drainage from the northeast part of the property. The hydrology and geology at the Keepataw Forest Preserve have not been characterized, particularly the effects of seep flow and surface-water runoff on the HED habitat in the topographic depression south of the seeps. The effect of groundwater withdrawals from the Silu-rian aquifer south of the Keepataw Forest Preserve also has not been characterized. Water quality at the seeps is calcium bicarbonate in type with substantial concentrations of sulfate and chloride. The effects of surface-water runoff from Inter-state I-355 on surface-water quality at the HED habitats in the Keepataw Forest Preserve are unknown.
The Black Partridge Woods Forest Preserve is occasion-ally used by larvae and adult HED near a seepage marsh in the northeast part of the preserve. Biologic, hydrologic, and water-quality conditions at the habitat have not been character-ized. Elevated concentrations of chloride indicate that anthro-pogenic activities are affecting surface-water quality at Black Partridge Creek.
The natural rivulet in the Emerald Fen area of the Waterfall Glen Forest Preserve contains larval and adult HED habitat. The fen receives water from a natural seep-fed rivulet discharging from the unconsolidated deposits as well as four artificial rivulets whose water is derived from artesian flow from a water-supply well open to the Silurian aquifer. The rivulets appear to have flowing water year round. Discharge at the natural rivulet is occasionally affected by flooding of the Des Plaines River. Water temperature, specific conductance, and pH in the natural rivulet display more variation than in the artificial rivulets. In combination with differences in the major ion chemistry, these differences reflect differences in the source of the water in the rivulets and the amount of modifi-cation in water temperature due to atmospheric interaction. Water chemistry indicates the dissolution of carbonate miner-als in the unconsolidated deposits and the Silurian aquifer affects water chemistry, as does the application of road salts.
Seeps associated with groundwater discharging from the glacial drift aquifer at the McMahon Fen Nature Preserve pro-vide water to a number of rivulets that provide at least periodic adult and larval HED habitat. Discharge to the seeps is likely to be sustained by recharge to the glacial drift aquifer near the seeps, in areas north of the preserve, and perhaps upwelling from the underlying semiconfining unit. Bed erosion along some of the rivulets may reduce the quality of this habitat for the survival of HED eggs and larvae.
In addition to the above mentioned habitats, uncharacter-ized and recently discovered (2016) HED habitats are present in Illinois. These habitats indicate HED habitat may exist in areas of Illinois beyond the Lower Des Plaines River Valley and in areas not directly overlying dolomite bedrock.
References
AECOM, 2010, Estimate of groundwater inflow to Rome-oville quarry: Thornton, Ill., Prepared for Hanson Material Service Corporation, 11 p.
AECOM, 2011, Ground water recharge evaluation of the ComED and Long Run parcels of the Hanson Material Service Romeoville quarry, Romeoville, Illinois: Thornton, Ill., Prepared for Hanson Material Service Corporation, [variously paged].
AECOM, 2012, Groundwater modeling evaluation of surface mining impacts of the Romeoville Quarry, Romeoville, Illi-nois: Thornton, Ill., Prepared for Hanson Material Service Corporation, [variously paged].
AECOM, 2013a, Addendum to the groundwater modeling evaluation of surface mining impacts at the Romeoville Quarry, Romeoville, Illinois: Thornton, Ill., Prepared for Hanson Material Service Corporation, [variously paged].
AECOM, 2013b, Groundwater monitoring data submission—Hydrologic support of habitat conservation plan: Thornton, Ill., Prepared for Hanson Material Service Corporation, [variously paged].
AECOM, 2015a, River South infiltration gallery design devel-opment—Design considerations: Thornton, Ill., Prepared for Hanson Material Service Corporation, [variously paged].
AECOM, 2015b, River South infiltration gallery design development—Preliminary tracer test results: Thornton, Ill., Prepared for Hanson Material Service Corporation, [vari-ously paged].
Antea Group, 2012, West pipeline oil spill report: Chicago, Ill., Prepared for U.S. Environmental Protection Agency, [variously paged].
Applied Ecological Services, Inc., 2009, Hine’s emerald drag-onfly habitats in the Des Plaines River Valley: Thornton, Ill., Prepared for Hanson Material Service Corporation, 1 p.
Applied Ecological Services, Inc., 2012, Summary of HMS surface and soil water monitoring program—April 2006 to December 2010: Thornton, Ill., Prepared for Hanson Mate-rial Service Corporation, [variously paged].
Applied Ecological Services, Inc., 2013, Summary of HMS surface and soil water monitoring program—January 2011 to December 2012: Thornton, Ill., Prepared for Hanson Material Service Corporation, [variously paged].
Brown, J.R., and Soluk, D.A., 2012, Lockport crude oil release—Hine’s emerald dragonfly (Somatochlora hineana Williamson) surveys near New Avenue, Lockport, Illinois: Chicago, Ill., Submitted to Cardno ENTIRX, 13 p.

100 Areas that Affect the Habitat of the Endangered Hine’s Emerald Dragonfly in the Lower Des Plaines River Valley, Illinois
Cashatt, E.D., 2015, Summary of the 2014 Hine’s emerald dragonfly (Somatochlora hineana) survey and field studies: Fort Snelling, Minn., Submitted to the U.S. Fish and Wild-life Service, Region 3, 132 p.
Cashatt, E.D., and Vogt, T.E., 1992, The Illinois 1991 survey for the Hine’s emerald dragonfly (Somatochlora hineana Williamson): Barrington, Ill., Submitted to the U.S. Fish and Wildlife Service Corporation, 13 p.
Cashatt, E.D., and Vogt, T.E., 1996, Population and habitat monitoring of Hine’s emerald dragonfly (Somatochlora hineana Williamson) in northeastern Illinois in 1995: Barrington, Ill., Submitted to the U.S. Fish and Wildlife Service, 77 p.
Cashatt, E.D., Wiker, J.R., and Sims, B.G., 1993, Survey for the Hine’s emerald dragonfly and habitat on the Material Service property Yard 61, Kirman property, Romeoville, Illinois: Springfield, Illinois State Museum, [variously paged].
Christopher B. Burke Engineering, Ltd., 1996, Concept report Illinois State Toll Highway Authority, Lockport prairie I-355 wetland mitigation: Downers Grove, Ill., Prepared for the Illinois Highway Toll Authority, [variously paged].
Christopher B. Burke Engineering, Ltd., 1997, Hydrologic study Commonwealth Edison Will county generating station rail coal delivery project: Chicago, Ill., Prepared for Com-monwealth Edison, 11 p.
Cunningham, W.L., and Schalk, C.W., comps., 2011, Ground-water technical procedures of the U.S. Geological Survey: U.S. Geological Survey Techniques and Methods, book 1, chap. A1, 151 p., accessed January 2015 at https://pubs.usgs.gov/tm/1a1/.
Foote, G.R., 1982, Fracture analysis in northeastern Illinois and northern Michigan: Champaign, Ill., University of Illi-nois at Urbana-Champaign, M.S. thesis, 193 p.
Graef, Anhalt, Schloemer, and Associates, Inc., 2004a, Lock-port Prairie Nature Preserve ecological assessment, hydro-geologic assessment: Joliet, Ill., Prepared for the Forest Preserve District of Will County, [variously paged].
Graef, Anhalt, Schloemer, and Associates, Inc., 2004b, Lockport Prairie Nature Preserve ecological assessment, hydrologic assessment: Joliet, Ill., Prepared for the Forest Preserve District of Will County, [variously paged].
Graef, Anhalt, Schloemer, and Associates, Inc., 2007a, Rome-oville Prairie Nature Preserve water level monitoring report: Chicago, Ill., Prepared for CorLands, 6 p.
Graef, Anhalt, Schloemer, and Associates, Inc., 2007b, Sec-ondary source investigation for McMahon Woods: Chicago, Ill., Prepared for CorLands, 14 p.
Graef, Anhalt, Schloemer, and Associates, Inc., 2008, Lock-port Prairie Nature Preserve recharge area ground water model: Prepared for the Forest Preserve District of Will County, [variously paged].
Graef, Anhalt, Schloemer, and Associates, Inc., 2009a, Sum-mary of ground water monitoring from 2001 through 2008 Lockport Prairie Nature Preserve and 2008 ground water monitoring data: Chicago, Ill., Prepared for Corlands, 67 p.
Graef, Anhalt, Schloemer, and Associates, Inc., 2009b, Pos-sible perm at McMahon Woods: Chicago, Ill., Prepared for CorLands, 8 p.
Groundwater and Environmental Services, Inc., 2017, Site investigation report, West Shore Pipeline Company, Lock-port crude oil release: Breinigville, Pa., Prepared for West Shore Pipeline Company, [variously paged].
Hanson Material Service Corporation, 2016, Draft Habitat conservation plan for the Hine’s emerald dragonfly, Blan-ding’s Turtle, Spotted Turtle, Leafy Prairie Clover, and Lakeside Daisy, Romeoville area, Will County, Illinois: Barrington, Ill., Submitted to the U.S. Fish and Wildlife Service, [variously paged].
Harbaugh, A.W., and McDonald, M.G., 1996a, User’s docu-mentation for MODFLOW-96 an update to the U.S. Geo-logical Survey modular finite-difference ground-water flow model: U.S. Geological Survey Open-File Report 96–485, 56 p.
Harbaugh, A.W., and McDonald, M.G., 1996b, Programmer’s documentation for MODFLOW-96, an update to the U.S. Geological Survey modular finite-difference ground-water flow model: U.S. Geological Survey Open-File Report 96–486, 220 p.
Harbaugh, A.W., Banta, E.R., Hill, M.C., and McDonald, M.G., 2000, MODFLOW-2000, the U.S. Geological Survey modular ground-water model—User guide to modulariza-tion concepts and the ground-water flow process: U.S. Geological Survey Open-File Report 00–92, 121 p.
Illinois Department of Natural Resources, 2013, The drought of 2012: Drought Response Task Force, [variously paged].
Illinois State Geological Survey, [n.d.], Illinois water and related wells: Illinois State Geological Survey database, accessed October 6, 2015, at http://maps.isgs.illinois.edu/ILWATER/.
Illinois State Museum, 2012, Hine’s emerald dragonfly: accessed May 6, 2014, at http://www.museum.state.il.us/research/entomology/hines/mainpage.html.
Integrated Lakes Management, Inc., 2008, Hydrologic char-acterization Long Run seep 2007-2008: Homer Glen, Ill., Prepared for Long Run Creek Planning Committee, [vari-ously paged].

References 101
Jackson, P.R., Johnson, K.K., and Duncker, J.J., 2012, Comparison of index velocity measurements made with a horizontal acoustic Doppler current profiler and a three-path acoustic velocity meter for computation of discharge in the Chicago Sanitary and Ship Canal near Lemont, Illinois: U.S. Geological Survey Scientific Investigations Report 2011–5205, 42 p.
Kay, R.T., Mills, P.C., and Jackson, P.R., 2016, Geology, hydrology, water quality, and potential for interbasin invasive-species spread by way of the groundwater pathway near Lemont, Illinois: U.S. Geological Survey Scientific Investigations Report 2016–5095, 91 p., accessed June 1, 2016, at http://dx.doi.org/10.3133/sir20165095.
Kelly, W.R., and Wilson, S.D., 2008, An evaluation of tempo-ral changes in shallow groundwater quality in northeastern Illinois using historical data: Illinois State Water Survey Scientific Report 2008–001, 64 p.
KPRG and Associates, Inc., 2004, Site investigation and interim remedial objectives report, IMTT, Lemont, Illinois: Springfield, Ill., Prepared for the Illinois Environmental Protection Agency, [variously paged].
Lin, J.J., Wu, T.T., and Holsen, T.M., 1993, Water character-ization of the Hine’s emerald dragonfly breeding habitat: Illinois Institute of Technology, Pritzker Department of Environmental Engineering, Draft Mid-Project Report, 77 p.
Locke, R.A., II, Miner, J.J., Sinclair, S.V., Anliker, M.A., Pociask, G.E., Robinson, B.J., and Dey, W.S., 2005, A method for estimating groundwater contribution areas for Illinois nature preserves and other natural areas: Cham-paign, Ill., Illinois State Water Survey and the Illinois State Geological Survey Contract Report 2005–11, 57 p.
Madison, R.J., and Brunett, J.O., 1985, Overview of the occurrence of nitrate in ground water of the United States, in National Water Summary, 1984—Hydrogeologic events, selected water-quality trends, and ground-water resources: U.S. Geological Survey Water-Supply Paper 2275, p. 93–106.
McDonald, M.G., and Harbaugh, A.W., 1984, A modular three-dimensional finite-difference ground-water flow model: U.S. Geological Survey Open-File Report 83–875, 528 p.
Mierzwa, K.S., 2007, The Hine’s emerald dragonfly (Somato-chlora hineana) in Illinois—2007 Population and habitat monitoring at the River South and Middle Parcels: Prepared for Hanson Material Service Corporation, [variously paged].
Mierzwa, K.S., 2008, A qualitative assessment of Hine’s emerald dragonfly habitat at the River South Parcel, Middle Parcel, and Long Run/Com Ed Parcel, Will County, Illinois: Thornton, Ill., Prepared for Hanson Material Service Corpo-ration, [variously paged].
Mierzwa, K.S., 2009, The Hine’s emerald dragonfly (Somato-chlora hineana) in Illinois—2009 Population and habitat monitoring at the River South and Middle Parcels: Thorn-ton, Ill., Prepared for Hanson Material Service Corporation, [variously paged].
Mierzwa, K.S., 2013a, The Hine’s emerald dragonfly on the Middle Parcel: Thornton, Ill., Technical Memorandum Pre-pared for Hanson Material Service Corporation, 8 p.
Mierzwa, K.S., 2013b, The Hine’s emerald dragonfly (Somato-chlora hineana) in Illinois—2013 population and habitat monitoring at the River South and Middle Parcels: Thorn-ton, Ill., Prepared for Hanson Material Service Corporation, [variously paged].
Mierzwa, K.S., and Webb, L.L., 2010, The Hine’s emer-ald dragonfly (Somatochlora hineana) in Illinois—2010 population and habitat studies at the Long Run/Com Ed Parcel: Thornton, Ill., Prepared for Hanson Material Service Corporation, 29 p.
Mierzwa, K.S., and Webb, L.L., 2012a, The Hine’s emerald dragonfly (Somatochlora hineana) in Illinois—2011 popula-tion monitoring at the Hanson Material Service Long Run/Com Ed Parcel: Thornton, Ill., Prepared for Hanson Mate-rial Service Corporation, [variously paged].
Mierzwa, K.S., and Webb, L.L., 2012b, The Hine’s emerald dragonfly (Somatochlora hineana) in Illinois—2011 larval surveys: Thornton, Ill., Prepared for Hanson Material Ser-vice Corporation, [variously paged].
Mierzwa, K.S., and Webb, L.L., 2012c, The Hine’s emer-ald dragonfly (Somatochlora hineana) in Illinois—2012 monitoring at the Hanson Material Service Thornton, Ill., Romeoville Quarry: Prepared for Hanson Material Service Corporation, [variously paged].
Missouri Department of Conservation, [n.d.], Missouri fish and wildlife information system species report: Missouri Department of Conservation Hine’s emerald dragonfly web page, accessed October 7, 2016, at http://mdc7.mdc.mo.gov/applications/mofwis/Mofwis_Detail.aspx?id=0900003.
Mueller, D.K., and Helsel, D.R., 1996, Nutrients in the nation’s waters—Too much of a good thing?: U.S. Geologi-cal Survey Circular 1136, 24 p.
Nicholas, J.R., and Healy, R.W., 1988, Tritium migration from a low-level radioactive-waste disposal site near Chicago, Illinois: U.S. Geological Survey Water Supply Paper 2333, 46 p.

102 Areas that Affect the Habitat of the Endangered Hine’s Emerald Dragonfly in the Lower Des Plaines River Valley, Illinois
Nolan, B.T., and Hitt, K.J., 2003, Nutrients in shallow ground waters beneath relatively undeveloped areas in the con-terminous United States: U.S. Geological Survey Water-Resources Investigations Report 2002–4289, 17 p.
Nuzzo, V.A., 1995, Hine’s emerald dragonfly (Somatochlora hineana) breeding and foraging habitat at three sites in the lower Des Plaines River Valley, Illinois, in Mierzwa, K.S., ed., The Hine’s emerald dragonfly in Illinois—An assess-ment of population dynamics and habitat use: Chicago, Ill., TAMS Consultants, Inc., p. 49–75.
Pintor, L.M., and Soluk, D.A., 2006, Evaluating the non-con-sumptive, positive effects of a predator in the persistence of an endangered species: Biological Conservation, v. 130, p. 584–591.
Plankell, E.T., 2014, Water quality in Black Partridge Creek before and after construction of I-355, Cook and DuPage County, Illinois: Illinois State Geological Survey Open File Series 2014-3, 98 p.
Plankell, E.T., Miner, J.J., and Bryant, K.E., 2009, Hydrogeo-logic characterization of the former fish farm at Waterfall Glen Forest Preserve, DuPage County, Illinois: Illinois State Geological Survey Open-File Series-2009-1, 63 p.
Pollock, D.W., 1998, MODPATH, Documentation of computer programs to compute and display pathlines using results from U.S. Geological Survey modular three-dimensional finite-difference ground-water flow model: U.S. Geological Survey Open-File Report 89–381, 188 p.
Roadcap, G.S., Cravens, S.J., and Smith, E.C., 1993, An evaluation of the shallow ground water resources in Will County and southern Cook Counties, Illinois: Illinois State Water Survey Research Report 123, 78 p.
Soluk, D.A., 2006, Monitoring larvae of Somatochlora hineana in the Material Services Corporation River South Parcel, near Lockport, Illinois: Illinois Natural History Survey, Center for Aquatic Ecology Technical Report Part II, 15 p.
Soluk, D.A., and Mierzwa, K.S., 2012, An assessment of Hine’s emerald dragonfly (Somatochlora hineana) popula-tion size in the lower Des Plaines River Valley, Illinois: Submitted to The Habitat Conservation Planning Partners, 26 p.
Soluk, D.A., and Moss, K., 2002, The distribution and quality of Hine’s emerald dragonfly habitat in relation to surface and groundwater dynamics in the Lockport Prairie Preserve: Illinois Natural History Survey, Center for Aquatic Ecology Technical Report 02/01, 15 p.
Soluk, D.A., and Moss, K., 2003, Roadway and exuvial surveys of the Hine’s emerald dragonfly (Somatochlora hineana) in Door County, Wisconsin, Part II—Roadway fatalities: Champaign, Ill., Illinois Natural History Survey, Center for Aquatic Ecology, Technical Report 03/09, 29 p.
Soluk, D.A., Britten, H., Monroe, E.M., DeMots, R.L., Kij-owski, A.M., Furness, A.N., Soluk, T.D., Brown, J.R., and Pitcher, K.A., 2012, Evaluation of the potential impacts of the I355 extension on the ecology, behavior, population genetics and distribution of the endangered Hine’s emerald dragonfly (Somatochlora hineana) in the Des Plaines River Valley, Report of Activities 2011: Submitted to Illinois State Toll Highway Authority and the U.S. Fish and Wildlife Service Corporation, 77 p.
Soluk, D.A., Britten, H., Monroe, E.M., Kijowski, A.M., Pitcher, K.A., Furness, A.N., Soluk, T.D., and DeMots, R.L., 2013, Evaluation of the potential impacts of the I355 extension on the ecology, behavior, population genetics and distribution of the endangered Hine’s emerald dragonfly (Somatochlora hineana) in the Des Plaines River Val-ley—2012 report: Department of Biology, University of South Dakota, 45 p.
Soluk, D.A., Britten, H., Satyshur, C.D., Holmes, J., Blas, E., and Lynch, C., 2008, Evaluation of the potential impacts of the I355 extension on the ecology, behavior, population genetics and distribution of the endangered Hine’s emerald dragonfly (Somatochlora hineana) in the Des Plaines River Valley, Report of Activities (2007): Department of Biology, University of South Dakota, 31 p.
Soluk, D.A., Britten, H., Worthington, A.M., Monroe, E.M., DeMots, R.L., and Hinkel, A.T., 2010, Evaluation of the potential impacts of the I355 extension on the ecology, behavior, population genetics and distribution of the endan-gered Hine’s emerald dragonfly (Somatochlora hineana) in the Des Plaines River Valley—2009 report: Department of Biology, University of South Dakota, 49 p.
Soluk, D.A., Britten, H., Worthington, A.M., Monroe, E.M., DeMots, R.L., Kijowski, A.M., Soluk, T.D., and Hinkel, A.T., 2011, Evaluation of the potential impacts of the I355 extension on the ecology, behavior, population genetics and distribution of the endangered Hine’s emerald dragonfly (Somatochlora hineana) in the Des Plaines River Val-ley—2010 report: Department of Biology, University of South Dakota, 35 p.
Soluk, D.A., DeMots, R.L., Pitcher, K.A., Furness, A.N., and Soluk, T.D., 2015, Evaluation of the potential impacts of the I355 extension on the ecology, distribution, and behavior of the federally endangered Hine’s emerald dragonfly (Somato-chlora hineana) in the Des Plaines River Valley—2014 report: Department of Biology, University of South Dakota, 44 p.
References 103
Soluk, D.A., DeMots, R.L., Pitcher, K.A., Furness, A.N., Wollman, R.E., and Soluk, T.D., 2014, Evaluation of the potential impacts of the I355 extension on the ecology, dis-tribution, and behavior of the federally endangered Hine’s emerald dragonfly (Somatochlora hineana) in the Des Plaines River Valley—2013 report: Department of Biology, University of South Dakota, 39 p.
Soluk, D.A., Hoekstra, J.D., and Moss, K., 2004, Habitat parameters of the Hine’s emerald dragonfly: using tem-perature loggers to assess hydrological regime in wetlands supporting the larval stages: Illinois Natural History Survey, Center for Aquatic Ecology Technical Report 04/07, 40 p.
Soluk, D.A., Pitcher, K.A., Mize, E.L., Soluk, T.D., Furness, A.N., Soluk, T.D., and Dombrowski, P.A., 2016, Evalua-tion of the potential impacts of the I355 extension on the ecology, distribution, and behavior of the federally endan-gered Hine’s emerald dragonfly (Somatochlora hineana) in the Des Plaines River Valley—2015 report: Department of Biology, University of South Dakota, 26 p.
Soluk, D.A., Zercher, D.S., Pintor, L.M., Herbert, M.E., Hults, A.B., Gittinger, E.J., and Stalzer, S.A., 1999, Evaluation of habitat and ecology of the larvae of Hine’s emerald drag-onfly (Somatochlora hineana) in Wisconsin and Illinois—Final report of findings September 1997-June 1999: Illinois Natural History Survey, Center for Aquatic Ecology Report 00/1, 86 p.
STS Consultants, 2007, Surface and ground water monitoring summary (Oct. 2006-Mar. 2007): Thornton, Ill., Prepared for Hanson Material Service Corporation, 5 p.
STS/AECOM, 2008a, Evaluation of the potential for leak-age through the Maquoketa Group from mining within the Galena-Platteville formations, Yard 61 in Romeoville, Illi-nois: Thornton, Ill., Prepared for Material Service Corpora-tion, [variously paged].
STS/AECOM, 2008b, Surface and ground water evaluation summary Hanson Material Service Yard 61, Romeoville, Illinois: Thornton, Ill., Prepared for Material Service Corpo-ration, [variously paged].
STS/AECOM, 2009, Surface and groundwater evaluation summary, vicinity of the Hanson Materials Service Yard 61, Romeoville, Illinois: Thornton, Ill., Prepared for Hanson Material Service Corporation, [variously paged].
TAMS Consultants, Inc., 1995a, Draft report on assessment of hydrologic impacts, MSC Yard 61 Expansion: Thornton, Ill., Prepared for Hanson Material Service Corporation, [variously paged].
TAMS Consultants, Inc., 1995b, The Hine’s emerald drag-onfly in Illinois—An assessment of population dynamics and habitat use: Chicago, Ill., Prepared for Material Service Corporation, 43 p.
Taylor, C.A., and Stefan, H.G., 2009, Shallow groundwater temperature response to climate change and urbanization: Journal of Hydrology, v. 375, p. 601–612: accessed May 23, 2017, at https://www.sciencedirect.com/science/article/pii/S0022169409004004.
U.S. Census Bureau, 2017, Quick facts—Lockport city, Illi-nois: accessed May 23, 2017, at https://www.census.gov/quickfacts/table/PST045215/1744225.
U.S. Environmental Protection Agency, 2015, Region 4 ecological risk assessment supplemental guidance interim draft: accessed May 16, 2016, at https://www.epa.gov/sites/production/files/2015-09/documents/r4_era_guidance_document_draft_final_8-25-2015.pdf.
U.S. Environmental Protection Agency, 2016a, Ground water and drinking water table of regulated contaminants: accessed May 16, 2016, at https://www.epa.gov/ground-water-and-drinking-water/table-regulated-drinking-water-contaminants.
U.S. Environmental Protection Agency, 2016b, National recommended water quality criteria—Aquatic life cri-teria table: accessed May 16, 2016, at http://water.epa.gov/scitech/swguidance/standards/criteria/current/index.cfm#altable.
U.S. Fish and Wildlife Service, 1995, Endangered and threated wildlife and plants; Determination of endangered status for the Hine’s emerald dragonfly (Somatochlora hineana): Federal Register, v. 60, no. 17, p. 5267–5273.
U.S. Fish and Wildlife Service, 2013a, Hine’s emerald dragon-fly (Somatochlora hineana): Fact Sheet, 2 p. [Also available at https://www.fws.gov/midwest/endangered/insects/hed/pdf/hed-color.pdf.]
U.S. Fish and Wildlife Service, 2013b, Hine’s emerald dragon-fly (Somatochlora hineana), 5-year review—Summary and evaluation: Barrington, Ill., U.S. Fish and Wildlife Service, Midwest Region, 50 p.
U.S. Geological Survey, 2016a, USGS groundwater data for Illinois: U.S. Geological Survey National Water Informa-tion System Web interface, accessed September 29, 2016, at http://waterdata.usgs.gov/il/nwis/gw.
U.S. Geological Survey, 2016b, How much water does the average person use at home per day?: U.S. Geological Sur-vey web page, accessed July 26, 2016, at http://water.usgs.gov/edu/qa-home-percapita.html.
U.S. Geological Survey, 2016c, Runoff (surface water runoff): U.S. Geological Survey web page, accessed July 26, 2016, at http://water.usgs.gov/edu/runoff.html.
U.S. Geological Survey, 2017, National Water Information System—Web interface: accessed June 12, 2017, at https://doi.org/10.5066/F7P55KJN.

104 Areas that Affect the Habitat of the Endangered Hine’s Emerald Dragonfly in the Lower Des Plaines River Valley, Illinois
Vogt, T.E., and Cashatt, E.D., 1997, The 1996 population mon-itoring and adult ecological studies of Hine’s emerald drag-onfly (Somatochlora hineana) at Material Service Corpora-tion Yard 61, Romeoville, Illinois: Thornton, Ill., Prepared for Material Service Corporation, [variously paged].
Wagner, R.J., Boulger, R.W., Oblinger, C.J., and Smith, B.A., 2006, Guidelines and standard procedures for continuous water-quality monitors—Station operation, record computa-tion, and data reporting: U.S. Geological Survey Techniques and Methods, book 1, chap. D3, [variously paged].
Willman, H.B., and Lineback, J.A., 1970, Map of the surficial geology of the Chicago Region, in Willman, H.B., Sum-mary of the geology of the Chicago area: Illinois State Geological Survey Circular 460, 77 p.
Willman, H.B., Atherton, E., Buschbach, T.C., Collinson, C., J.C., Frye, Hopkins, M.E., Lineback J.A., and Simon, J.A., 1975, Handbook of Illinois Stratigraphy: Illinois State Geo-logical Survey Bulletin 95, 261 p.
Zercher, Deanna, 2001, Hine’s emerald dragonfly (Somato-chlora hineana) recovery plan: Fort Snelling, Minn., U.S. Fish and Wildlife Service Region 3, 133 p.
For more information about this publication, contactDirector, USGS Central Midwest Water Science Center 405 N. Goodwin Urbana, IL 61801(217) 328–8747
For additional information visit https://il.water.usgs.gov
Publishing support provided by the Madison and Rolla Publishing Service Centers


Kay and others—A
reas that Affect the H
abitat of the Endangered Hine’s Em
erald Dragonfly in the Low
er Des Plaines River Valley, Illinois—
SIR 2018–5074
ISSN 2328-0328 (online)https://doi.org/10.3133/sir20185074