Embed Size (px)
Citation preview
U.S. Department of the InteriorU.S. Geological Survey
Water Availability and Use Science Program
Assessment of Groundwater Availability in the Northern Atlantic Coastal Plain Aquifer System From Long Island, New York, to North Carolina
Professional Paper 1829

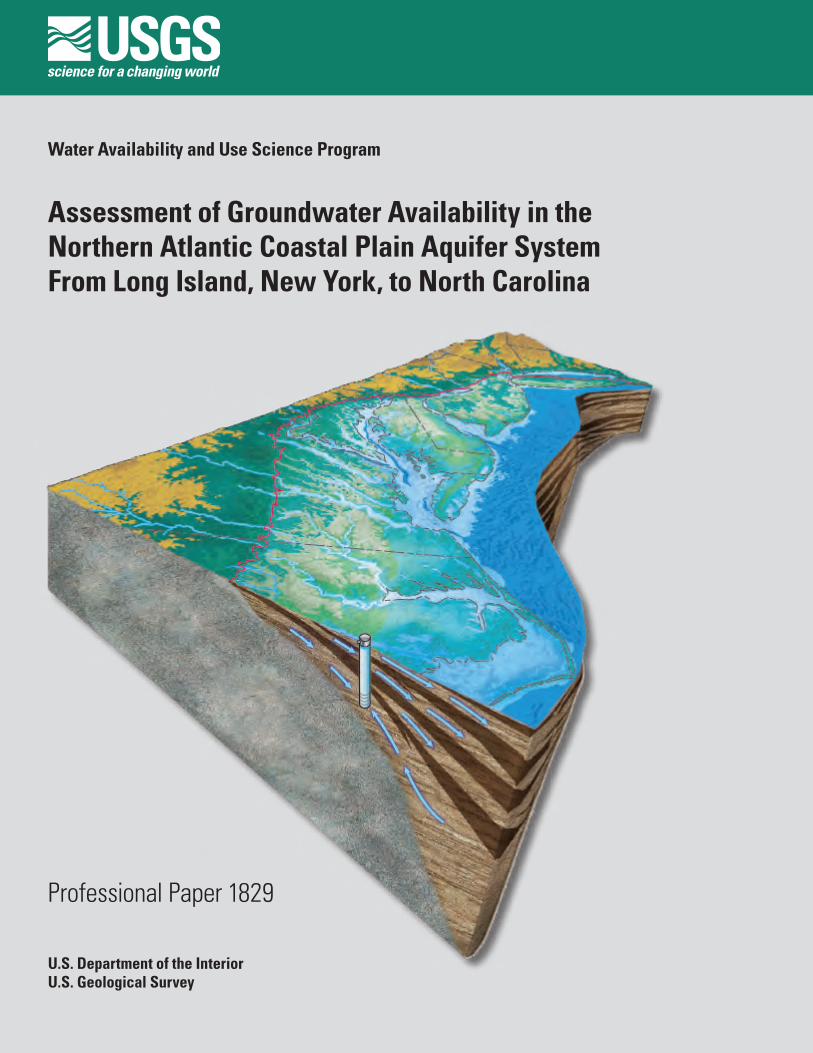
Cover. Block diagram of the Northern Atlantic Coastal Plain aquifer system, which includes the areas east of the Fall Line, from Long Island, New York, to northern North Carolina. This multilayer system consists of confined aquifers and confining units capped by an unconfined, surficial aquifer. Groundwater flows predominantly from west to east from the Fall Line to the Atlantic Ocean, except where high-capacity pumping wells alter this regional flow pattern.
Assessment of Groundwater Availability in the Northern Atlantic Coastal Plain Aquifer System From Long Island, New York, to North Carolina
By John P. Masterson, Jason P. Pope, Michael N. Fienen, Jack Monti, Jr., Mark R. Nardi, and Jason S. Finkelstein
Water Availability and Use Science Program
Professional Paper 1829
U.S. Department of the InteriorU.S. Geological Survey
U.S. Department of the InteriorSALLY JEWELL, Secretary
U.S. Geological SurveySuzette M. Kimball, Director
U.S. Geological Survey, Reston, Virginia: 2016
For more information on the USGS—the Federal source for science about the Earth, its natural and living resources, natural hazards, and the environment—visit http://www.usgs.gov or call 1–888–ASK–USGS.
For an overview of USGS information products, including maps, imagery, and publications, visit http://store.usgs.gov.
Any use of trade, firm, or product names is for descriptive purposes only and does not imply endorsement by the U.S. Government.
Although this information product, for the most part, is in the public domain, it also may contain copyrighted materials as noted in the text. Permission to reproduce copyrighted items must be secured from the copyright owner.
Suggested citation:Masterson, J.P., Pope, J.P., Fienen, M.N., Monti, Jack, Jr., Nardi, M.R., and Finkelstein, J.S., 2016, Assessment of groundwater availability in the Northern Atlantic Coastal Plain aquifer system from Long Island, New York, to North Carolina: U.S. Geological Survey Professional Paper 1829, 76 p., http://dx.doi.org/10.3133/pp1829.
Library of Congress Cataloging-in-Publication Data
Names: Masterson, John P., author. | Geological Survey (U.S.), issuing body. | Water Availability and Use Science Program, author.Title: Assessment of groundwater availability in the northern Atlantic coastal plain aquifer system from Long Island, New York, to North Carolina / by John P. Masterson [and five others].Other titles: U.S. Geological Survey professional paper ; 1829.Description: Reston, Virginia : U.S. Department of the Interior, U.S. Geological Survey, 2016. | Series: Professional paper, ISSN 1044-9612 ; 1829 | At head of title: Water Availability and Use Science Program. Includes bibliographical references.Identifiers: LCCN 2016028190 | ISBN 9781411340572 (paperback)Subjects: LCSH: Groundwater--Atlantic Coast (U.S.) | Aquifers--Atlantic Coast (U.S.)Classification: LCC GB1016 .M37 2016 | DDC 551.490975--dc23 | SUDOC I 19.16:1829LC record available at https://lccn.loc.gov/2016028190
ISSN 1044-9612 (print) ISSN 2330-7102 (online)
iii
Foreword
Although often overlooked, groundwater is increasingly important to all our lives. Groundwater is the Nation’s principal reserve of freshwater. It provides half our drinking water, is essential to U.S. food production, and facilitates business and industry in developing economic wellbeing. Groundwater is also an important source of water for sustaining the ecosystem health of rivers, wetlands, and estuaries throughout the country.
Large-scale development of groundwater resources with accompanying decreases in groundwater levels and other effects of pumping have led to concerns about the future availability of groundwater to meet all our Nation’s needs. The depletion of groundwater to satisfy the country’s thirst and the compounding effects of recent droughts emphasize the need for an updated status of the Nation’s groundwater resources. Assessments of groundwater availability provide the science and information needed by the public and decision makers to manage water resources and use them responsibly. Adding to this already complex task of resource assessment is the analysis of potential future effects due to climate variability, which can further exacerbate an already challenging situation.
The U.S. Geological Survey’s Water Availability and Use Science Program is conducting large-scale multidisciplinary regional studies of groundwater availability, such as this study of the Northern Atlantic Coastal Plain aquifer system. These regional studies are intended to provide citizens, communities, and natural resource managers with clearer knowledge of the status of the Nation’s groundwater resources and how changes in land use, water use, and climate have affected those resources and to develop tools that enable scientists to forecast how these resources may change in the future. Over time, the findings from these individual regionally integrated groundwater assessments of principal aquifers will be combined to provide a national assessment. Results derived from these studies will provide much needed answers to basic questions about the Nation’s ability to meet current and future demands for groundwater.
Donald Cline Associate Director for Water

v
Contents
Foreword ........................................................................................................................................................iiiExecutive Summary .......................................................................................................................................1Introduction.....................................................................................................................................................3
Purpose and Scope ..............................................................................................................................7Description of Study Area ...................................................................................................................7
Hydrogeologic Setting ................................................................................................................7Land Use ......................................................................................................................................12Groundwater Use .......................................................................................................................14
Previous Investigations......................................................................................................................16Methods.........................................................................................................................................................16
Data Compilation .................................................................................................................................17Numerical Model ................................................................................................................................17
Conceptualization of the Hydrologic System ..........................................................................................17Simulation of the Hydrologic System .......................................................................................................19
Comparison of the Conceptualized and Simulated Hydrologic Systems ..................................20Comparison of Predevelopment Conditions ..........................................................................20Comparison of Postdevelopment Conditions ........................................................................20
Hydrologic Budget ..............................................................................................................................22Changes in Hydrologic Budgets Over Time ...........................................................................22Comparison of Predevelopment and Current [2013] Conditions ........................................38Comparison of Current [2013] and Future [2043] Conditions ...............................................42
Changes in Groundwater Storage and Water Levels ...................................................................44Comparison of Predevelopment and Current [2013] Conditions ........................................50Comparison of Current [2013] and Future [2043] Conditions ...............................................52
Changes in the Boundary Between the Fresh and Saline Groundwater Flow Systems .........56Reduction in Groundwater Discharge to Saline Coastal Waters ......................................56Landward Movement of Saline Groundwater .......................................................................58
Simulation of Effects of Climate Change ..................................................................................................60Effects of Drought Conditions on Water Resources .....................................................................60Effects of Sea-Level Rise on the Groundwater Flow System ......................................................66
Use of Numerical Models to Inform Groundwater Monitoring Networks .........................................68Challenges for Future Groundwater Availability Assessments—Lessons Learned .........................69Acknowledgments .......................................................................................................................................71References Cited..........................................................................................................................................72
vi
Figures
1. Map showing location and extent of the Northern Atlantic Coastal Plain aquifer system ...............................................................................................................................4
2. Map showing groundwater withdrawals by county in the Northern Atlantic Coastal Plain aquifer system in 2010 .........................................................................................5
3. Maps showing changes in water levels in the Potomac-Patapsco regional aquifer of the Northern Atlantic Coastal Plain aquifer system for 1900 to 1980 and 1980 to 2000 ................................................................................................6
4. Generalized cross section showing generalized geology of the Northern Atlantic Coastal Plain aquifer system from the Fall Zone to the coast of the Atlantic Ocean ........8
5. Correlation chart showing regional hydrogeologic units and corresponding state-level hydrogeologic units for the Northern Atlantic Coastal Plain aquifer system ...............................................................................................................................9
6. Cross sections showing regional variations in the hydrologic framework of the Northern Atlantic Coastal Plain aquifer system .................................................................10
7. Map and pie charts showing land use and land cover for the northern Atlantic Coastal Plain physiographic province for conditions in 2006 ...............................13
8. Pie charts showing distribution of drinking water sources by State across the Northern Atlantic Coastal Plain aquifer system .............................................................14
9. Pie charts showing distribution of groundwater use by State across the Northern Atlantic Coastal Plain aquifer system ....................................................................14
10. Schematic diagram showing the conceptual hydrogeologic model of the Northern Atlantic Coastal Plain aquifer system ....................................................................18
11. Schematic diagram showing hydrologic budget for predevelopment (before 1900) and average current conditions for the conceptual model of Masterson and others and the numerical analysis in this report for the Northern Atlantic Coastal Plain aquifer system ....................................................................21
12. Map showing geographic areas delineated for hydrologic budget computations within the Northern Atlantic Coastal Plain aquifer system .................................................23
13. Graph showing groundwater withdrawal rates from the Northern Atlantic Coastal Plain aquifer system from 1900 to 2010 .....................................................................24
14. Graph showing groundwater withdrawals for the Northern Atlantic Coastal Plain aquifer system by geographic area for the historical period, the period of emphasis, and the future period .......................................................................24
15. Graphs showing groundwater withdrawals for the Northern Atlantic Coastal Plain aquifer system and regional aquifers in New York, New Jersey, Delmarva, Maryland, Virginia, and North Carolina geographic areas for the historical period, the period of emphasis, and a future period ...........................................25
16. Pie charts showing distribution of groundwater withdrawals in 2008 by regional aquifer for each geographic area in the Northern Atlantic Coastal Plain aquifer system .......................................................................................................28
17. Graph showing hydrologic budget for the historical period, period of emphasis, and a future period for the Northern Atlantic Coastal Plain aquifer system ....................29
18. Graphs showing changes in hydrologic budget components as a function of pumping for the historical period, period of emphasis, and a future period for the Northern Atlantic Coastal Plain aquifer system and regional aquifers in the New York, New Jersey, Delmarva, Maryland, Virginia, and North Carolina geographic areas ............................................................................................31
vii
19. Graphs showing cumulative changes in hydrologic budget components in response to pumping for the historical period, period of emphasis, and a future period for the Northern Atlantic Coastal Plain aquifer system and regional aquifers in the New York, New Jersey, Delmarva, Maryland, Virginia, and North Carolina geographic areas .....................................................................35
20. Pie charts showing distribution of the cumulative response of the hydrologic budget components to changes in groundwater pumping for the historical period, period of emphasis, and a future period for the Northern Atlantic Coastal Plain aquifer system and regional aquifers in the New York, New Jersey, Delmarva, Maryland, Virginia, and North Carolina geographic areas ..............................40
21. Pie charts showing changes in hydrologic budget components with the removal of wastewater return flow for current conditions across the Northern Atlantic Coastal Plain aquifer system ....................................................................43
22. Graphs showing change in aquifer storage by hydrogeologic unit for the historical period, the period of emphasis, and a future period for the Northern Atlantic Coastal Plain aquifer system and regional aquifers in the New York, New Jersey, Delmarva, Maryland, Virginia, and North Carolina geographic areas ........................................................................................................................44
23. Graphs showing cumulative change in aquifer storage by hydrogeologic unit for the historical period, the period of emphasis, and a future period for the Northern Atlantic Coastal Plain aquifer system and regional aquifers in the New York, New Jersey, Delmarva, Maryland, Virginia, and North Carolina geographic areas ........................................................................................................................47
24. Pie charts showing distribution of cumulative aquifer storage change by hydrogeologic unit for the historical period, period of emphasis, and a future period for the Northern Atlantic Coastal Plain aquifer system and regional aquifers in the New York, New Jersey, Delmarva, Maryland, Virginia, and North Carolina geographic areas .....................................................................50
25. Map showing change in water levels in response to groundwater withdrawals from 1900 to 1985 in the Potomac-Patapsco aquifer of the Northern Atlantic Coastal Plain aquifer system ....................................................................................................53
26. Map showing change in water levels in response to groundwater withdrawals from 1986 to 2013 in the Potomac-Patapsco aquifer of the Northern Atlantic Coastal Plain aquifer system ....................................................................................................54
27. Map showing change in water levels in projected response to groundwater withdrawals from 2013 to 2043 in the Potomac-Patapsco aquifer of the Northern Atlantic Coastal Plain aquifer system ....................................................................55
28. Map showing change in water levels in the surficial aquifer on Long Island, New York, of the Northern Atlantic Coastal Plain aquifer system with the removal of wastewater return flow for current conditions .................................................57
29. Graph showing change in coastal groundwater discharge in the Northern Atlantic Coastal Plain aquifer system in response to groundwater pumping for the historical period, the period of emphasis, and a future period by geographic area ....................................................................................................................57
30. Schematic diagram showing the effects of pumping on groundwater flow in the Northern Atlantic Coastal Plain aquifer system .........................................................58
31. Pie charts showing distribution of change in coastal groundwater discharge as inflow from saline groundwater in response to pumping for the surficial aquifer system in 2013 and 2043, and the confined aquifer system in 2013 and 2043 ...................59
viii
32. Pie charts showing distribution of change in coastal groundwater discharge as a net reduction in total groundwater discharge to the coast for in response to pumping for the surficial aquifer system in 2013 and 2043, and the confined aquifer system in 2013 and 2043 ...............................................................................................59
33. Pie charts showing distribution of changes in hydrologic budget components in response to a simulated 8-year drought for pumping conditions in 2013 across the Northern Atlantic Coastal Plain aquifer system ................................................60
34. Pie charts showing distribution of the change as a percentage of the total in reduction in recharge and increase in irrigation withdrawals in response to a simulated 8-year drought for current conditions by geographic area across the Northern Atlantic Coastal Plain aquifer system .............................................................61
35. Map showing difference between average recharge and average drought recharge in inches per year calculated by the Soil Water Balance model for the Delmarva geographic area of the Northern Atlantic Coastal Plain aquifer system .............................................................................................................................62
36. Graph showing distribution of monthly precipitation in inches for the growing season months for the drought of 1960 –1967 and average conditions from 1980 to 2010 for the Delmarva geographic area of the Northern Atlantic Coastal Plain aquifer system ....................................................................................................63
37. Pie chart showing increase in withdrawals for irrigation, in million gallons per day, in response to drought conditions in the Delmarva geographic area of the Northern Atlantic Coastal Plain aquifer system .........................................................63
38. Maps showing simulated water-level response of the surficial aquifer in the Delmarva geographic area of the Northern Atlantic Coastal Plain aquifer system to drought conditions as decrease in water levels and percentage of water-level decreases attributed to increased withdrawals for irrigation ............................................64
39. Maps showing simulated water-level response of Piney Point aquifer to drought conditions as decreases in water levels and percentage of water-level decreases attributed to increased withdrawals for irrigation ............................................65
40. Map showing model-simulated increase in water levels in the surficial aquifer in response to a 3-foot increase in the current sea-level position across the Northern Atlantic Coastal Plain aquifer system ....................................................................67
41. Pie charts showing distribution of simulated increase in groundwater discharge to streams in response to sea-level rise and net groundwater discharge to streams in 2013 across the Northern Atlantic Coastal Plain aquifer system ...................68
42. Map showing variance of water-level change from the difference between annually varying and average annual recharge from 1986 to 2008 for the Potomac-Patapsco aquifer of the Northern Atlantic Coastal Plain aquifer system........70
Tables
1. Distribution of drinking water sources in 2010 by State in the Northern Atlantic Coastal Plain aquifer system ....................................................................15
2. Distribution of groundwater use in 2010 by State in the Northern Atlantic Coastal Plain aquifer system ....................................................................15
3. Percentage of groundwater withdrawals in 2008 by aquifer and geographic area in the Northern Atlantic Coastal Plain ......................................................28
4. Comparison of total net volumetric groundwater depletion for the Northern Atlantic Coastal Plain aquifer system from 1900 to 2000 and from 1900 to 2008 .................................................................................................................39
ix
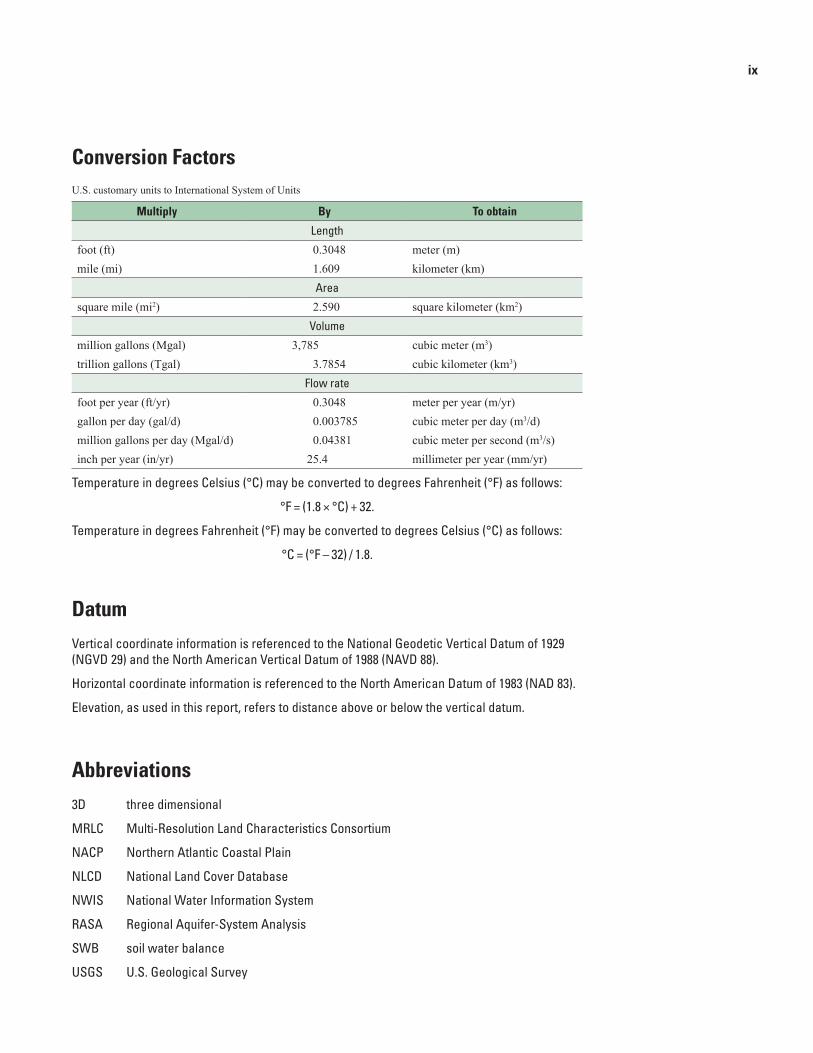
Conversion FactorsU.S. customary units to International System of Units
Multiply By To obtain
Length
foot (ft) 0.3048 meter (m)mile (mi) 1.609 kilometer (km)
Area
square mile (mi2) 2.590 square kilometer (km2) Volume
million gallons (Mgal) 3,785 cubic meter (m3)trillion gallons (Tgal) 3.7854 cubic kilometer (km3)
Flow rate
foot per year (ft/yr) 0.3048 meter per year (m/yr)gallon per day (gal/d) 0.003785 cubic meter per day (m3/d)million gallons per day (Mgal/d) 0.04381 cubic meter per second (m3/s)inch per year (in/yr) 25.4 millimeter per year (mm/yr)
Temperature in degrees Celsius (°C) may be converted to degrees Fahrenheit (°F) as follows:
°F = (1.8 × °C) + 32.
Temperature in degrees Fahrenheit (°F) may be converted to degrees Celsius (°C) as follows:
°C = (°F – 32) / 1.8.
DatumVertical coordinate information is referenced to the National Geodetic Vertical Datum of 1929 (NGVD 29) and the North American Vertical Datum of 1988 (NAVD 88).
Horizontal coordinate information is referenced to the North American Datum of 1983 (NAD 83).
Elevation, as used in this report, refers to distance above or below the vertical datum.
Abbreviations3D three dimensional
MRLC Multi-Resolution Land Characteristics Consortium
NACP Northern Atlantic Coastal Plain
NLCD National Land Cover Database
NWIS National Water Information System
RASA Regional Aquifer-System Analysis
SWB soil water balance
USGS U.S. Geological Survey

Assessment of Groundwater Availability in the Northern Atlantic Coastal Plain Aquifer System From Long Island, New York, to North Carolina
By John P. Masterson, Jason P. Pope, Michael N. Fienen, Jack Monti, Jr., Mark R. Nardi, and Jason S. Finkelstein
Executive SummaryThe U.S. Geological Survey began a multiyear regional
assessment of groundwater availability in the Northern Atlantic Coastal Plain (NACP) aquifer system in 2010 as part of its ongoing regional assessments of groundwater availability of the principal aquifers of the Nation. The goals of this national assessment are to document effects of human activities on water levels and groundwater storage, explore climate variability effects on the regional water budget, and provide consistent and integrated information that is useful to those who use and manage the groundwater resource. As part of this nationwide assessment, the USGS evaluated available groundwater resources within the NACP aquifer system from Long Island, New York, to northeastern North Carolina.
The northern Atlantic Coastal Plain physiographic province depends heavily on groundwater to meet agricultural, industrial, and municipal needs. The groundwater assessment of the NACP aquifer system included an evaluation of how water use has changed over time; this evaluation primarily used groundwater budgets and development of a numerical modeling tool to assess system responses to stresses from future human uses and climate trends.
This assessment focused on multiple spatial and temporal scales to examine changes in groundwater pumping, storage, and water levels. The regional scale provides a broad view of the sources and demands on the system with time. The sub-regional scale provides an evaluation of the differing response of the aquifer system across geographic areas allowing for closer examination of the interaction between different aquifers and confining units and the changes in these interactions under pumping and recharge conditions in 2013 and hydrologic stresses as much as 45 years in the future. By focusing on multiple scales, water-resource managers may utilize this study to understand system response to changes as they affect the system as a whole.
The NACP aquifer system extends from Long Island to northeastern North Carolina, and includes aquifers primarily within New York, New Jersey, Delaware, Maryland, Virginia,
and North Carolina. The seaward-dipping sedimentary wedge that underlies the northern Atlantic Coastal Plain physiographic province forms a complex groundwater system. Although the NACP aquifer system is recognized by the U.S. Geological Survey as one of the smallest of the 66 principal aquifer systems in the Nation, it ranks 13th overall in terms of total groundwater withdrawals and is 7th in population served. Despite abundant precipitation [about 45 inches per year (in/yr)], the supply of fresh surface water in this region is limited because many of the surface waters in this area are brackish estuaries, contributing to why many communities in the northern Atlantic Coastal Plain physiographic province rely heavily on groundwater to meet their water needs.
Increases in population and changes in land use during the past 100 years have resulted in diverse increased demands for freshwater throughout the northern Atlantic Coastal Plain physiographic province with groundwater serving as a vital source of drinking water for the nearly 20 million people who live in the region. Total groundwater withdrawal in 2013 was estimated to be about 1,300 million gallons per day (Mgal/d) and accounts for about 40 percent of the drinking water supply with the densely populated areas tending to have the highest rates of withdrawals and, therefore, being most susceptible to effects from these withdrawals over time.
Water levels in many of the confined aquifers are decreasing by as much as 2 feet per year (ft/yr) in response to extensive development and subsequent increased with-drawals throughout the region. Total water-level decreases (drawdowns) are more than 100 feet (ft) in some aquifers from their predevelopment (before 1900) levels. These drawdowns extend across State lines and under the Chesapeake and Delaware Bays, creating the potential for interstate aquifer management issues. Regional water-resources managers in the northern Atlantic Coastal Plain physiographic province face challenges beyond competing local domestic, industrial, agricultural, and environmental demands for water. Large changes in regional water use have made the State-level management of aquifer resources more difficult because of hydrologic effects that extend beyond State boundaries.
2 Assessment of Groundwater Availability in the Northern Atlantic Coastal Plain Aquifer System
The northern Atlantic Coastal Plain physiographic province is underlain by a wedge of unconsolidated to partially consolidated sediments that are typically thousands of feet thick along the coastline with a maximum thickness of about 10,000 ft near the edge of the continental shelf. The NACP aquifer system consists of nine confined aquifers and nine confining units capped by an unconfined surficial aquifer that is bounded laterally from the west by the contact between Coastal Plain sediments and the upland Piedmont bedrock. This aquifer system extends to the east to the limit of the Continental Shelf, however, the boundary between fresh and saline groundwater is considered to be much closer to the shoreline and varies vertically by aquifer.
Precipitation over the region for average conditions from 2005 to 2009 is about 61,800 Mgal/d, but about 70 percent of it is lost to evapotranspiration resulting in an inflow of about 19,600 Mgal/d entering the groundwater system as aquifer recharge. Most of this recharge enters the aquifer system and flows through the shallow unconfined aquifer and either discharges to streams or directly to coastal waters without reaching the deep, confined aquifer system. In addition to recharge from precipitation, other sources of water include the return of wastewater from domestic septic systems of about 230 Mgal/d, about 60 Mgal/d of water released from storage in the confined system, and about 30 Mgal/d of lateral inflow at the boundary between freshwater and saltwater in response to pumping for conditions in 2013.
The outflow needed to balance the inflows was subdivided between streamflow, discharge to tidal portions of streams, and coastal discharge. The hydrologic budget developed for current [2013] conditions determined that 93 percent of the total outflow was to surface waters with about 70 percent divided evenly between streamflow and shallow coastal discharge and 23 percent as discharge to tidal waters. The remaining 7 percent of the total outflow components include withdrawals from both the surficial and confined aquifers of the groundwater system.
The groundwater availability assessment of the NACP aquifer system highlights the importance of analyses at both the regional and local scales to understand how changes in land use, water use, and climate have affected groundwater resources and how these resources may change in the future. The investigation included assessments of the regional changes in water levels and budgets across State lines, the importance of considering storage change in the confining units, the response of the aquifer system to a continuation of current [2013] hydrologic stresses into the future, and the potential effects of climate change and sea-level rise on the aquifer system.
The Potomac aquifer group includes two of the most widely used aquifers in the NACP aquifer system, the Potomac-Patapsco and Potomac-Patuxent regional aquifers, providing about 24 percent of the total groundwater used in the region. Withdrawals from large pumping centers in this deep, confined aquifer group have resulted in substantial decreases in water-levels across state lines, particularly
between southern Virginia and northeastern North Carolina as well as between southern New Jersey and northern Delaware where water levels in the Potomac-Patapsco aquifer have decreased by as much as 200 ft and 50 ft, respectively from predevelopment to current [2013] conditions. This response in water levels also is reflected in changes in water budgets where, for example, about 20 percent of the total response to pumping in Virginia is met by inducing flow from adjacent States. Understanding and quantifying these hydrologic effects that extend beyond State boundaries is critical for the State- and regional-level management of aquifer resources.
The cumulative storage loss from the intervening confining units throughout the entire NACP aquifer system was about 35 percent of the total storage loss from predevel-opment to current [2013] conditions. In geographic areas such as the Delmarva Peninsula, Maryland, and New Jersey, the water released from storage in the confining units makes up the majority of the total storage release from the groundwater system and is becoming proportionally more important over time as the surficial aquifer approaches equilibrium with respect to pumping and recharge stresses as of 2013.
Storage loss from the confining units is of particular concern because, unlike in the sands that comprise the confined aquifers, water removed from the clayey confining unit sediments cannot be replenished as these units gradually compress. This nonrecoverable storage loss, if great enough, can result in land subsidence where these units are thick and the release from storage is relatively large and contributes to increased concerns for sea-level rise in areas such as the lower portion of the Chesapeake Bay.
Groundwater usage increased dramatically in the NACP aquifer system during post-World War II era from the mid-1940s to early the 1980s, with withdrawals increasing from about 400 Mgal/d to more than 1,300 Mgal/d. Although groundwater withdrawals have been relatively constant since the early 1980s, about half of the total groundwater withdrawn from the NACP aquifer system since 1900 was withdrawn in the past 30 years. An analysis of the response of the ground-water system to a continuation of the current [2013] pumping for an additional 30 years into the future shows that the flow system continues to adjust in terms of changes in water budget components, water levels, and the boundary between fresh-water and saltwater as it approaches equilibrium. The largest change in water budget components over this timeframe is the reduction in the amount of water released from storage.
Across the entire NACP aquifer system, the reduction of storage release from 7 to 4 percent of the total water budget change is accounted for by reductions in groundwater discharge to streams and coastal waters. Locally, a similar response is calculated for each of the geographic areas except for Virginia where the amount of water released from storage accounts for about 25 percent of the total change in water budget. This finding suggests that the groundwater flow system in Virginia is not approaching equilibrium under the current [2013] stresses and, therefore, water levels will continue to decrease even if the pumping remains constant.
Introduction 3
An analysis of the change in water levels in the Potomac-Patapsco aquifer as pumping is continued 30 years into the future reveals that the largest decreases in water levels throughout the NACP aquifer system will occur in the southern Virginia and northeastern North Carolina parts of the study area. It is these areas that also see the greatest potential for increased lateral movement of saline groundwater in the deep, confined portion of the groundwater flow system in response to a continuation of the current [2013] pumping rates.
The potential effects of long-term climate change and variability on the hydrologic system and availability of water resources in the NACP aquifer system continue to be of serious societal concern. These concerns include the effects of changes in aquifer recharge and in sea-level rise on the groundwater flow system. An assessment of the potential effects of a prolonged drought during current [2013] pumping conditions indicated that the reductions in recharge associated with droughts, including additional irrigation withdrawals required to meet increased crop water demand, have the greatest effects on water levels and streamflows in the surficial aquifer, and changes in water levels in the confined aquifers primarily resulted from the increased withdrawals associated with increased irrigation pumping; this response was most apparent in the Delmarva Peninsula. These results suggest that water levels may not be susceptible to the effects of droughts in the confined aquifers of the NACP aquifer system not used for irrigation, unlike in the unconfined surficial aquifer.
A second analysis also was conducted to assess the effects of sea-level rise on the groundwater system throughout the northern Atlantic Coastal Plain physiographic province because recent analyses of the relative rates of sea-level rise along the Atlantic coast indicate that the Mid-Atlantic region represents a hot spot with anomalously higher rates of sea-level rise than observed elsewhere in the United States. Groundwater levels rose from 0 to 3 ft in response to a 3-ft simulated change in sea-level position, with the largest response occurring along the shoreline and away from non-tidal streams. About 37 percent (or 10,000 square miles) of the area of the northern Atlantic Coastal Plain physiographic province may experience about a 0.5-ft or more increase in water levels with the 3-ft increase in sea-level position, whereas about 18 percent (almost 5,000 square miles) of land of the northern Atlantic Coastal Plain physiographic province may experience a 2-ft or more increase in water levels with the 3-ft increase in sea-level position.
These increases in the water table are of particular concern in low-lying areas where the unsaturated (vadose) zone is already thin, thus creating concerns for groundwater inundation of subsurface infrastructure, such as basements, septic systems, and subway systems. This increase in the water table also will likely alter the distribution of groundwater discharge to surface-water bodies thus increasing groundwater flow to streams that would have otherwise discharged directly to coastal waters. Throughout the NACP aquifer system, this redistribution of groundwater discharge results in an additional 2 percent of baseflow in streams. Although the increases
in groundwater discharge to streams (and corresponding decreases in discharge to coastal waters) calculated for the entire NACP aquifer system and its geographic areas represent only a small increase compared with current [2013] condi-tions, this redistribution of groundwater discharge from the coast to streams locally can alter the delivery of freshwater input to coastal receiving waters and have ecohydrological implications on the sensitive ecosystems which rely on a balance of groundwater discharge and surface-water flow.
Introduction
The seaward-dipping sedimentary wedge that underlies the embayed section of the Coastal Plain physiographic province of the Atlantic Plain (referred to as the northern Atlantic Coastal Plain province in this report; Fenneman, 1917) forms the Northern Atlantic Coastal Plain (NACP) aquifer system. The NACP aquifer system extends from Long Island, New York, to northeastern North Carolina (fig. 1) and includes aquifers primarily within New York, New Jersey, Delaware, Maryland, Virginia, and North Carolina. Although the NACP aquifer system is recognized by the U.S. Geological Survey (USGS) as one of the smallest in area of the 66 principal aquifer systems in the Nation (Miller, 1999), it ranks 13th overall in terms of total groundwater withdrawals (Reilly and others, 2008) and 7th in population served (Maupin and Barber, 2005).
Many communities in the northern Atlantic Coastal Plain province rely heavily on groundwater to meet their water needs because of the limited supply of fresh surface water in this region. This major source of water provides public and domestic supply and serves as a vital source of freshwater for agricultural, commercial, and industrial uses throughout the region. However, water supplies in this region can be limited by the amount of allowable drawdown, droughts, saltwater intrusion, and contamination by agricultural and industrial sources. Some communities also rely on surface water imported from outside the northern Atlantic Coastal Plain province, which may be discharged into shallow aquifers, streams, or coastal waters after use.
Increases in population and changes in land use during the past 100 years have resulted in diverse increased demands for freshwater throughout the northern Atlantic Coastal Plain province. Substantial groundwater withdrawals had begun in the northern part of the study area by the late 1800s. By 1900, about 100 million gallons per day (Mgal/d) of water was pumped from the NACP aquifer system, about half of which was from western Long Island to provide for the water-supply system of New York City (Buxton and Shernoff, 1999).
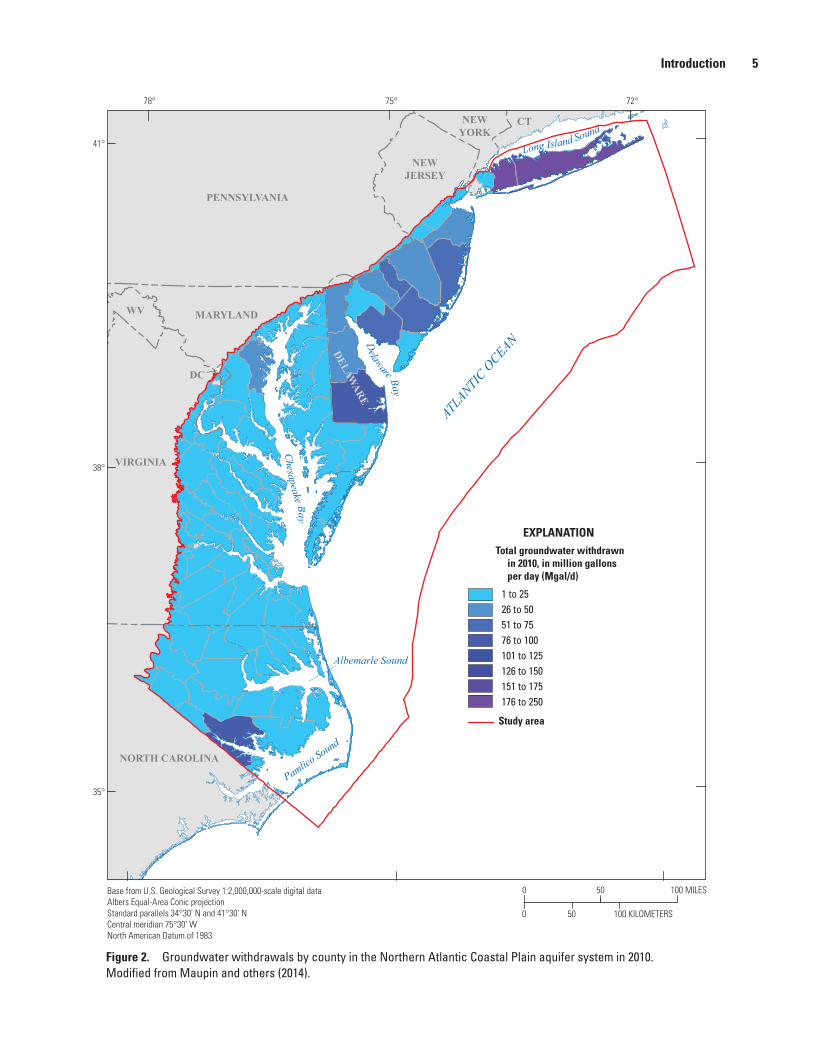
Groundwater still serves as a vital source for drinking water for the people who live in the region; densely populated areas tend to have higher rates of groundwater withdrawals than less densely populated areas (fig. 2) and, therefore, are most susceptible to effects from withdrawal over time.
4 Assessment of Groundwater Availability in the Northern Atlantic Coastal Plain Aquifer System
James River
PotomacRiver
masterson_nacp_fig 01_v3
Long Island
Trenton
New York City
Philadelphia
DoverBaltimore
Annapolis
Richmond
CapeMay
VirginiaBeach
DC
Base from U.S. Geological Survey 1:2,000,000-scale digital dataAlbers Equal-Area Conic projectionStandard parallels 34°30' N and 41°30' NCentral meridian 75°30' W North American Datum of 1983
Chesapeake Bay
Delaware Bay
Long Island Sound
Susquehanna
MARI
CONNECTICUTNEW YORK
NEWJERSEY
PENNSYLVANIA
VIRGINIA
Pamlico Sound
AlbemarleSound
ATLANTIC OCEAN
Continental S
helf margin
River
DelmarvaPeninsula
0 50 100 MILES
0 50 100 KILOMETERS
Studyarea
Raritan Bay
Fall Zone
WV
James River
Potomac River
Potomac River
James River
MARYLAND
DELA
WA
RE
NORTH CAROLINA
Greenville
EXPLANATION
Elevation, in feet above or below NAVD 88
High : 0
Low : –7,105
Bathymetry—Data from National Oceanic and Atmospheric Administration (undated) and Amante and Eakins (2009)
Topography—Data from U.S. Geological Survey (undated)
High : 563
Low : 1
Northern Atlantic Coastal Plain study area
Chesapeake Bay impact crater
41°
38°
35°
72°78° 75°
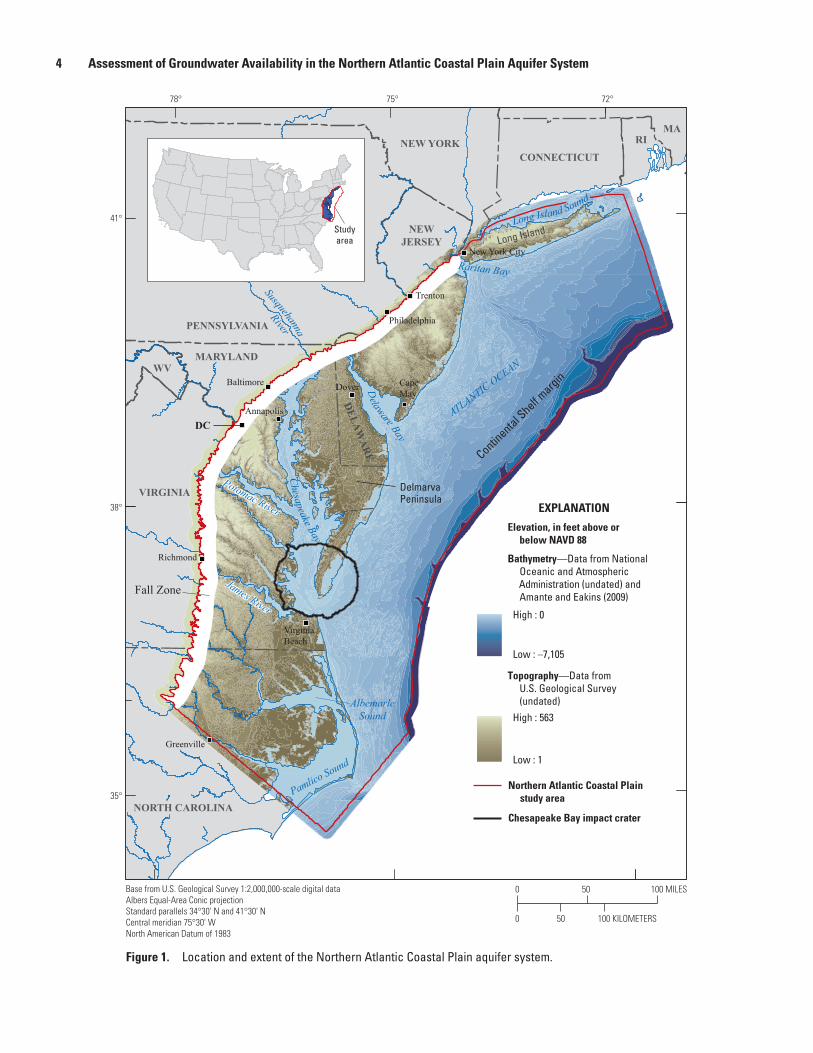
Figure 1. Location and extent of the Northern Atlantic Coastal Plain aquifer system.
Introduction 5
masterson_nacp_fig02_new
Base from U.S. Geological Survey 1:2,000,000-scale digital dataAlbers Equal-Area Conic projectionStandard parallels 34°30' N and 41°30' NCentral meridian 75°30' W North American Datum of 1983
Chesapeake Bay
Delaware Bay
Long Island SoundCTNEW
YORK
NEWJERSEY
PENNSYLVANIA
MARYLAND
DC
DELAWARE
VIRGINIA
NORTH CAROLINA
ATLANTI
C OCEAN
Pamlico Sound
Albemarle Sound
WV
EXPLANATIONTotal groundwater withdrawn in 2010, in million gallons per day (Mgal/d)
1 to 2526 to 5051 to 7576 to 100101 to 125126 to 150151 to 175176 to 250
Study area
0 100 KILOMETERS
0 50
50
100 MILES
72°78° 75°
41°
38°
35°
Figure 2. Groundwater withdrawals by county in the Northern Atlantic Coastal Plain aquifer system in 2010. Modified from Maupin and others (2014).
6 Assessment of Groundwater Availability in the Northern Atlantic Coastal Plain Aquifer System
Total groundwater withdrawal in 2010 was estimated to be about 1,500 Mgal/d and accounts for about 40 percent of the drinking water supply in the areas served by the NACP aquifer system (Maupin and others, 2014).
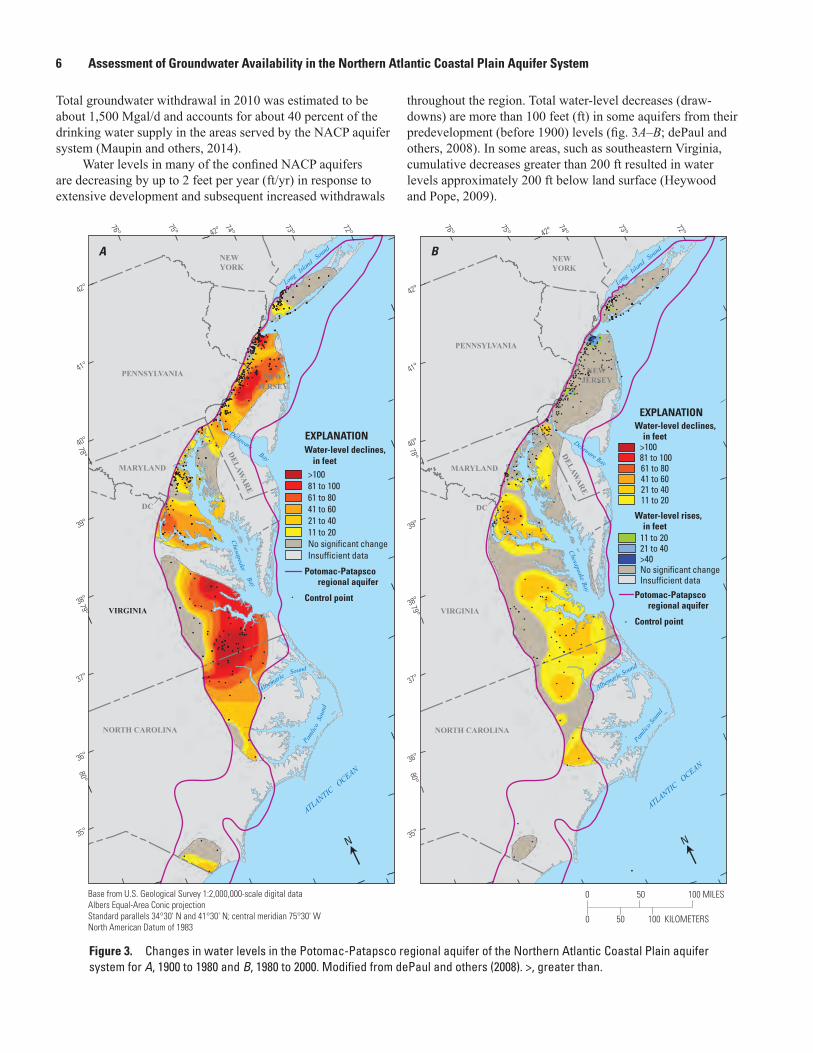
Water levels in many of the confined NACP aquifers are decreasing by up to 2 feet per year (ft/yr) in response to extensive development and subsequent increased withdrawals
throughout the region. Total water-level decreases (draw-downs) are more than 100 feet (ft) in some aquifers from their predevelopment (before 1900) levels (fig. 3A–B; dePaul and others, 2008). In some areas, such as southeastern Virginia, cumulative decreases greater than 200 ft resulted in water levels approximately 200 ft below land surface (Heywood and Pope, 2009).
>10081 to 10061 to 8041 to 6021 to 4011 to 20No significant changeInsufficient data
Water-level declines, in feet
EXPLANATION
Potomac-Patapscoregional aquifer
Control point Potomac-Patapscoregional aquifer
Control point
Water-level declines, in feet >100 81 to 100 61 to 80 41 to 60 21 to 40 11 to 20
Water-level rises, in feet
EXPLANATION
11 to 20 21 to 40 >40 No significant change Insufficient data
A B
Pamlic
o Sou
nd
Chesapeake Bay
ATLANTIC OCEAN
Delaware Bay
Albemarle Sound
Long Isla
nd Sound
Pamlic
o S
ound
NORTH CAROLINA
NEWJERSEY
MARYLAND
VIRGINIA
NEW YORK
PENNSYLVANIA
DELAWARE
42°
41°
40°
39°
38°
37°
36°
35°
76°
75°
74°
73°
72°
80°79°
78°
42°
500
500 100 MILES
100 KILOMETERS
42°
41°
40°
39°
38°
37°
36°
35°
80°79°
78°
lN
lN
DC
Chesapeake Bay
ATLANTIC OCEAN
Delaware Bay
Albemarle Sound
Long Isla
nd Sound
NORTH CAROLINA
NEWJERSEY
MARYLAND
VIRGINIA
NEW YORK
PENNSYLVANIA
DELAWARE
76°
75°
74°
73°
72°42°
Base from U.S. Geological Survey 1:2,000,000-scale digital dataAlbers Equal-Area Conic projectionStandard parallels 34°30' N and 41°30' N; central meridian 75°30' W North American Datum of 1983
masterson_nacp_fig03_new
DC
Figure 3. Changes in water levels in the Potomac-Patapsco regional aquifer of the Northern Atlantic Coastal Plain aquifer system for A, 1900 to 1980 and B, 1980 to 2000. Modified from dePaul and others (2008). >, greater than.
Introduction 7
Drawdowns also extend across State lines and under the Chesapeake and Delaware Bays, creating the potential for interstate aquifer management issues. Regional water-resources managers in the northern Atlantic Coastal Plain province face challenges beyond those imposed by competing local agricultural, domestic, and industrial demands for water and the various environmental issues faced by water-resource managers nationwide. Large changes in regional water use have made the state-level management of groundwater resources more difficult because of hydrologic effects that extend beyond State boundaries. Understanding how ground-water flow is affected regionally by natural and human stresses is vital to managing and protecting the groundwater resource, leading to the need for a comprehensive assessment of water availability in the NACP aquifer system.
In 2010, the USGS began a multiyear regional assessment of groundwater availability in the NACP aquifer system as part of ongoing regional assessments of groundwater availability of the principal aquifers of the Nation (Alley and others, 2013). The primary goal of these regional assessments is to provide consis-tent and integrated information that is useful to those who use and manage the groundwater resource (Reilly and others, 2008).
The initial phase of the assessment of the NACP aquifer system (Masterson and others, 2013b) included revisions to the regional aquifer nomenclature and hydrogeologic corre lations and an updated hydrologic budget of this aquifer system from the previous regional aquifer system assessment that had been completed by the USGS in the 1980s (Trapp and Meisler, 1992). The final phase of the assessment in this report included a comprehensive analysis of groundwater availability of the NACP aquifer system.
Purpose and Scope
The purpose of this report is to describe the groundwater availability of the Northern Atlantic Coastal Plain aquifer system by quantifying the resource for current [2013] condi-tions, describing how this resource has changed since 1900 (predevelopment conditions), and assessing how the resource may change in response to future anthropogenic and envi-ronmental stresses. Results of a numerical analysis to assess groundwater availability from New York to North Carolina are presented in this report both in terms of changes to hydrologic budgets and as water-level change maps.
The spatial extent of what was defined previously as the NACP aquifer system has been reduced from the area defined in the first analysis of the aquifer system (Trapp and Meisler, 1992) for this report to focus primarily on the area from Long Island to northeastern part of North Carolina. This approach complements a recently completed regional groundwater availability assessment of the Atlantic Coastal Plain aquifer system of North and South Carolina (Campbell and Coes, 2010). Consequently, several regional aquifer names have been revised in this report to remove references to units in North Carolina and emphasize nomenclature from the
primary States of the study area, which are New York, New Jersey, Delaware, Maryland, and Virginia; the hydrogeologic units of North Carolina are included in the discussion in this report to provide the information needed to correlate hydro-geologic units across the Virginia-North Carolina border.
The description of the groundwater model developed and used for this analysis is presented in Masterson and others (2016). A detailed description of the hydrogeologic conditions of the NACP aquifer system is presented in Masterson and others (2013b). Digital data on the extents and elevations of the units composing the revised hydrogeologic framework of the NACP can be found in Pope and others (2016).
Description of Study Area
The part of the northern Atlantic Coastal Plain prov-ince included in this investigation occupies a land area of approximately 27,000 square miles (mi2) along the eastern seaboard of the United States from Long Island southward to the northeastern part of North Carolina (fig. 1). A seaward-dipping wedge of mostly unconsolidated stratified sediments comprising clay, silt, sand, and gravel underlies this area. This sedimentary wedge forms a complex groundwater system in which strata of sand and gravel function predominantly as aquifers, and those of silt and clay function as confining units. The aquifers within the NACP aquifer system are major sources of water for public and domestic supply and serve as a vital source of water for agricultural, commercial, and industrial uses throughout the region.
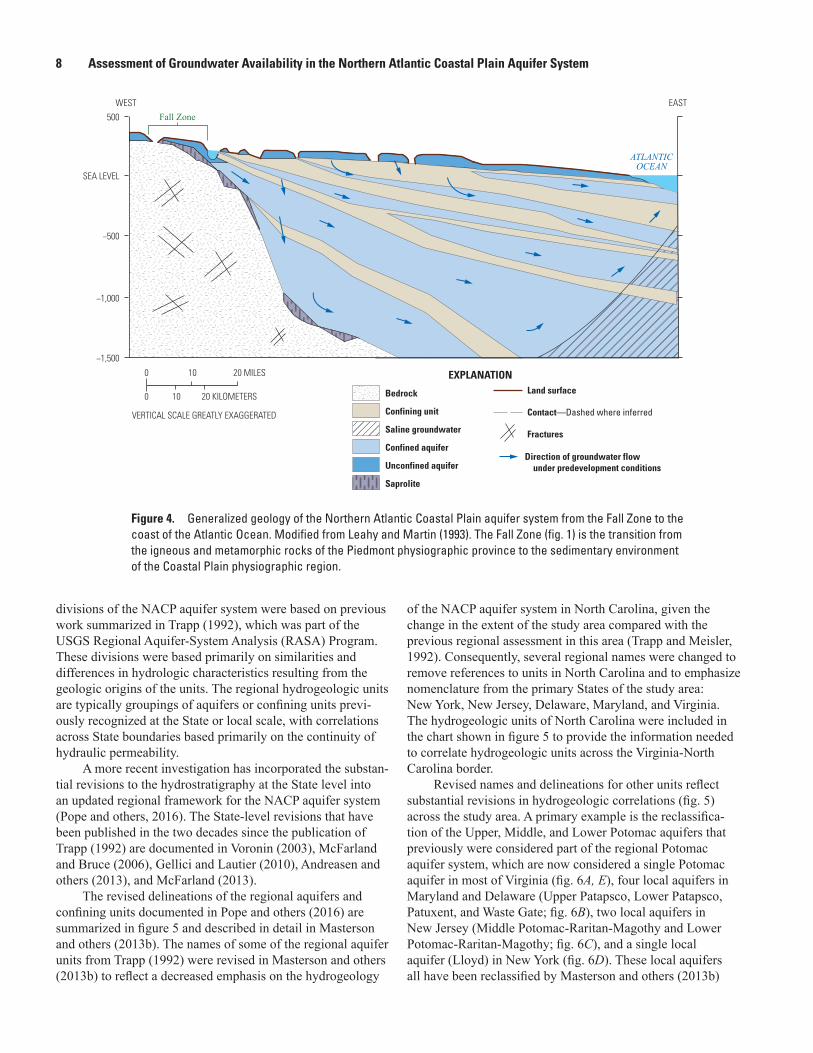
Hydrogeologic SettingThe NACP aquifer system is composed of unconsolidated
to partially consolidated sediments that range in age from Early Cretaceous to Holocene. These sediments unconform-ably overlie a basement of Precambrian to Paleozoic-age consolidated bedrock. The western limit of the NACP aquifer system is the Atlantic seaboard Fall Zone (fig. 1), which is the transition from the igneous and metamorphic rocks of the Piedmont physiographic province to the sedimentary environ-ment of the Coastal Plain physiographic region.
The sedimentary wedge of the Coastal Plain is aligned approximately parallel to the Fall Zone and dips and thickens to the east and south. It is typically thousands of feet thick at the coastline and as much as 2 miles thick where it terminates to the east along the edge the Continental Shelf margin (fig. 4). The Coastal Plain sediments are continuous approximately from Newfoundland in Canada in the north to Honduras in the south, covering the Continental Shelf, but they are entirely submerged north of Cape Cod (Trapp, 1992). The eastern end of Long Island is considered to be the northern limit of their continuous exposure (fig. 1).
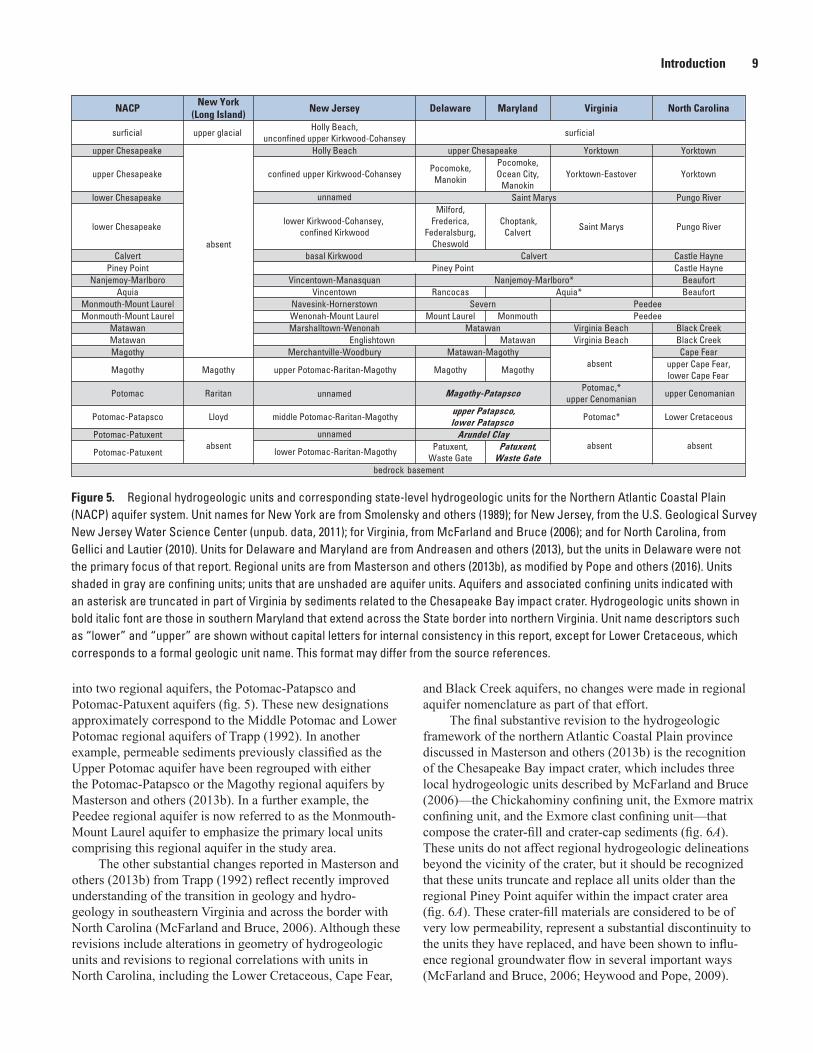
The sediments that underlie the northern Atlantic Coastal Plain province have been divided into 10 regional aquifers and 9 interlayered regional confining units. These regional
8 Assessment of Groundwater Availability in the Northern Atlantic Coastal Plain Aquifer System
divisions of the NACP aquifer system were based on previous work summarized in Trapp (1992), which was part of the USGS Regional Aquifer-System Analysis (RASA) Program. These divisions were based primarily on similarities and differences in hydrologic characteristics resulting from the geologic origins of the units. The regional hydrogeologic units are typically groupings of aquifers or confining units previ-ously recognized at the State or local scale, with correlations across State boundaries based primarily on the continuity of hydraulic permeability.
A more recent investigation has incorporated the substan-tial revisions to the hydrostratigraphy at the State level into an updated regional framework for the NACP aquifer system (Pope and others, 2016). The State-level revisions that have been published in the two decades since the publication of Trapp (1992) are documented in Voronin (2003), McFarland and Bruce (2006), Gellici and Lautier (2010), Andreasen and others (2013), and McFarland (2013).
The revised delineations of the regional aquifers and confining units documented in Pope and others (2016) are summarized in figure 5 and described in detail in Masterson and others (2013b). The names of some of the regional aquifer units from Trapp (1992) were revised in Masterson and others (2013b) to reflect a decreased emphasis on the hydrogeology
of the NACP aquifer system in North Carolina, given the change in the extent of the study area compared with the previous regional assessment in this area (Trapp and Meisler, 1992). Consequently, several regional names were changed to remove references to units in North Carolina and to emphasize nomenclature from the primary States of the study area: New York, New Jersey, Delaware, Maryland, and Virginia. The hydrogeologic units of North Carolina were included in the chart shown in figure 5 to provide the information needed to correlate hydrogeologic units across the Virginia-North Carolina border.
Revised names and delineations for other units reflect substantial revisions in hydrogeologic correlations (fig. 5) across the study area. A primary example is the reclassifica-tion of the Upper, Middle, and Lower Potomac aquifers that previously were considered part of the regional Potomac aquifer system, which are now considered a single Potomac aquifer in most of Virginia (fig. 6A, E), four local aquifers in Maryland and Delaware (Upper Patapsco, Lower Patapsco, Patuxent, and Waste Gate; fig. 6B), two local aquifers in New Jersey (Middle Potomac-Raritan-Magothy and Lower Potomac-Raritan-Magothy; fig. 6C), and a single local aquifer (Lloyd) in New York (fig. 6D). These local aquifers all have been reclassified by Masterson and others (2013b)
SEA LEVEL
500
−500
−1,000
−1,500
10 20 KILOMETERS
10 20 MILES0
0
Fractures
EXPLANATION
Bedrock
Confining unit
Saline groundwater
Confined aquifer
Unconfined aquiferDirection of groundwater flow under predevelopment conditions
Land surface
Saprolite
Contact—Dashed where inferred
ATLANTICOCEAN
Fall ZoneWEST EAST
VERTICAL SCALE GREATLY EXAGGERATED
masterson_nacp_fig04
Figure 4. Generalized geology of the Northern Atlantic Coastal Plain aquifer system from the Fall Zone to the coast of the Atlantic Ocean. Modified from Leahy and Martin (1993). The Fall Zone (fig. 1) is the transition from the igneous and metamorphic rocks of the Piedmont physiographic province to the sedimentary environment of the Coastal Plain physiographic region.
Introduction 9
into two regional aquifers, the Potomac-Patapsco and Potomac-Patuxent aquifers (fig. 5). These new designations approximately correspond to the Middle Potomac and Lower Potomac regional aquifers of Trapp (1992). In another example, permeable sediments previously classified as the Upper Potomac aquifer have been regrouped with either the Potomac-Patapsco or the Magothy regional aquifers by Masterson and others (2013b). In a further example, the Peedee regional aquifer is now referred to as the Monmouth-Mount Laurel aquifer to emphasize the primary local units comprising this regional aquifer in the study area.
The other substantial changes reported in Masterson and others (2013b) from Trapp (1992) reflect recently improved understanding of the transition in geology and hydro-geology in southeastern Virginia and across the border with North Carolina (McFarland and Bruce, 2006). Although these revisions include alterations in geometry of hydrogeologic units and revisions to regional correlations with units in North Carolina, including the Lower Cretaceous, Cape Fear,
and Black Creek aquifers, no changes were made in regional aquifer nomenclature as part of that effort.
The final substantive revision to the hydrogeologic framework of the northern Atlantic Coastal Plain province discussed in Masterson and others (2013b) is the recognition of the Chesapeake Bay impact crater, which includes three local hydrogeologic units described by McFarland and Bruce (2006)—the Chickahominy confining unit, the Exmore matrix confining unit, and the Exmore clast confining unit—that compose the crater-fill and crater-cap sediments (fig. 6A). These units do not affect regional hydrogeologic delineations beyond the vicinity of the crater, but it should be recognized that these units truncate and replace all units older than the regional Piney Point aquifer within the impact crater area (fig. 6A). These crater-fill materials are considered to be of very low permeability, represent a substantial discontinuity to the units they have replaced, and have been shown to influ-ence regional groundwater flow in several important ways (McFarland and Bruce, 2006; Heywood and Pope, 2009).
NACPNew York
(Long Island)New Jersey Delaware Maryland Virginia North Carolina
surficial upper glacialHolly Beach,
unconfined upper Kirkwood-Cohansey surficial
upper Chesapeake Holly Beach upper Chesapeake Yorktown Yorktown
upper Chesapeake confined upper Kirkwood-CohanseyPocomoke,
Manokin
Pocomoke, Ocean City,
ManokinYorktown-Eastover Yorktown
lower Chesapeake Saint Marys Pungo River
lower Chesapeake lower Kirkwood-Cohansey,confined Kirkwood
Milford, Frederica,
Federalsburg, Cheswold
Choptank, Calvert Saint Marys Pungo River
Calvert basal Kirkwood Calvert Castle HaynePiney Point Piney Point Castle Hayne
Nanjemoy-Marlboro Vincentown-Manasquan Nanjemoy-Marlboro* BeaufortAquia Vincentown Rancocas Aquia* Beaufort
Monmouth-Mount Laurel Navesink-Hornerstown Severn PeedeeMonmouth-Mount Laurel Wenonah-Mount Laurel Mount Laurel Monmouth Peedee
Matawan Marshalltown-Wenonah Matawan Virginia Beach Black CreekMatawan Englishtown Matawan Virginia Beach Black CreekMagothy Merchantville-Woodbury Matawan-Magothy Cape Fear
Magothy Magothy upper Potomac-Raritan-Magothy Magothy Magothyupper Cape Fear, lower Cape Fear
Potomac Raritan Magothy-Patapsco Potomac,*upper Cenomanian upper Cenomanian
Potomac-Patapsco Lloyd middle Potomac-Raritan-Magothyupper Patapsco,lower Patapsco Potomac* Lower Cretaceous
Potomac-Patuxent Arundel Clay
Potomac-Patuxent lower Potomac-Raritan-Magothy Patuxent, Waste Gate
Patuxent, Waste Gate
bedrock basement
absent
unnamed
unnamed
unnamedabsent absent
absent
absent
masterson_nacp_fig 05_new
Figure 5. Regional hydrogeologic units and corresponding state-level hydrogeologic units for the Northern Atlantic Coastal Plain (NACP) aquifer system. Unit names for New York are from Smolensky and others (1989); for New Jersey, from the U.S. Geological Survey New Jersey Water Science Center (unpub. data, 2011); for Virginia, from McFarland and Bruce (2006); and for North Carolina, from Gellici and Lautier (2010). Units for Delaware and Maryland are from Andreasen and others (2013), but the units in Delaware were not the primary focus of that report. Regional units are from Masterson and others (2013b), as modified by Pope and others (2016). Units shaded in gray are confining units; units that are unshaded are aquifer units. Aquifers and associated confining units indicated with an asterisk are truncated in part of Virginia by sediments related to the Chesapeake Bay impact crater. Hydrogeologic units shown in bold italic font are those in southern Maryland that extend across the State border into northern Virginia. Unit name descriptors such as “lower” and “upper” are shown without capital letters for internal consistency in this report, except for Lower Cretaceous, which corresponds to a formal geologic unit name. This format may differ from the source references.
10 Assessment of Groundwater Availability in the Northern Atlantic Coastal Plain Aquifer System
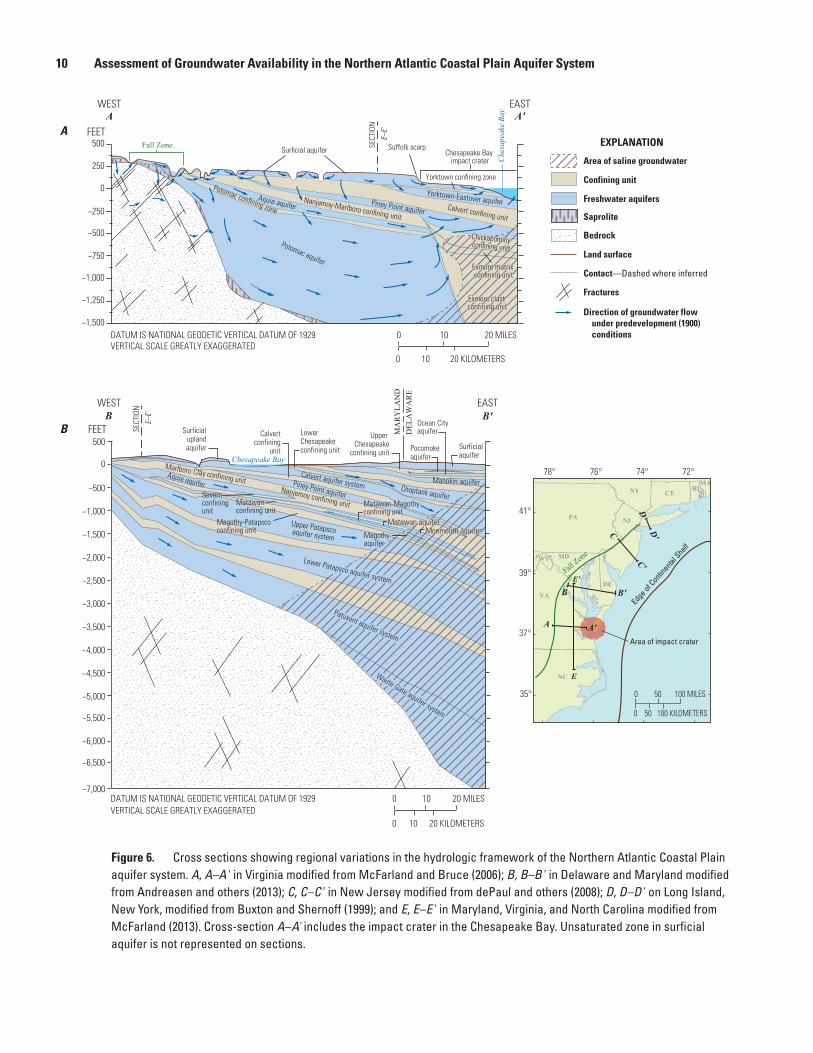
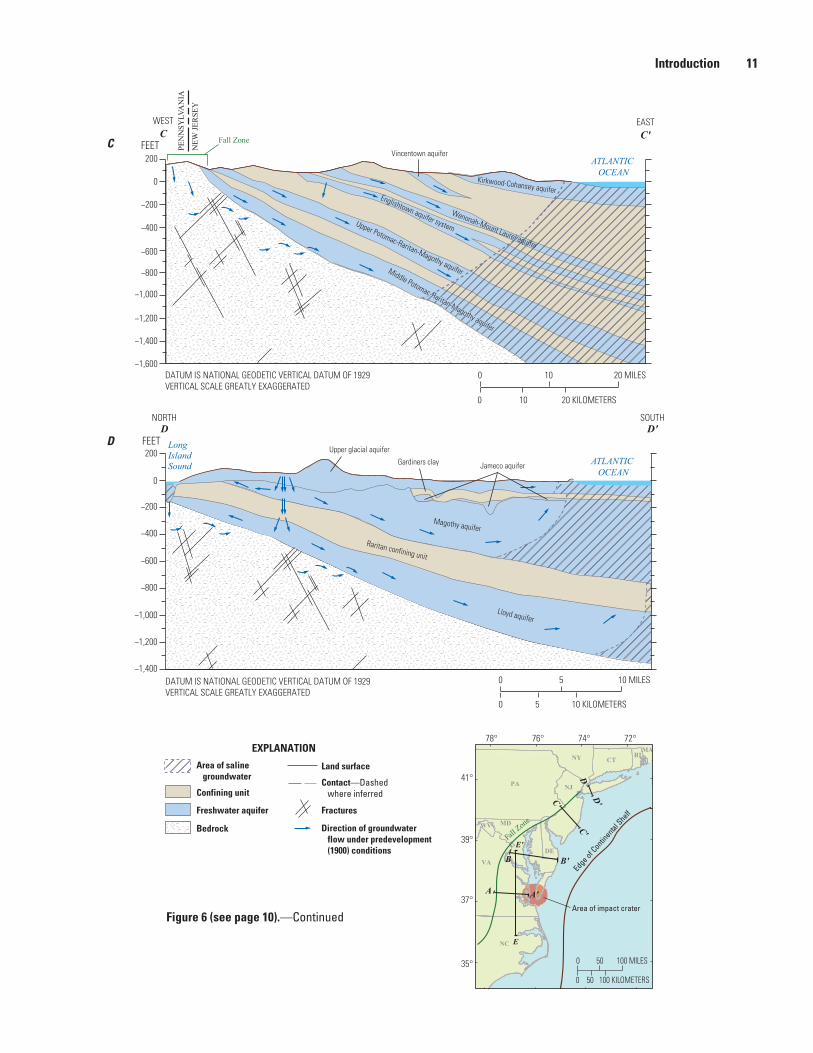
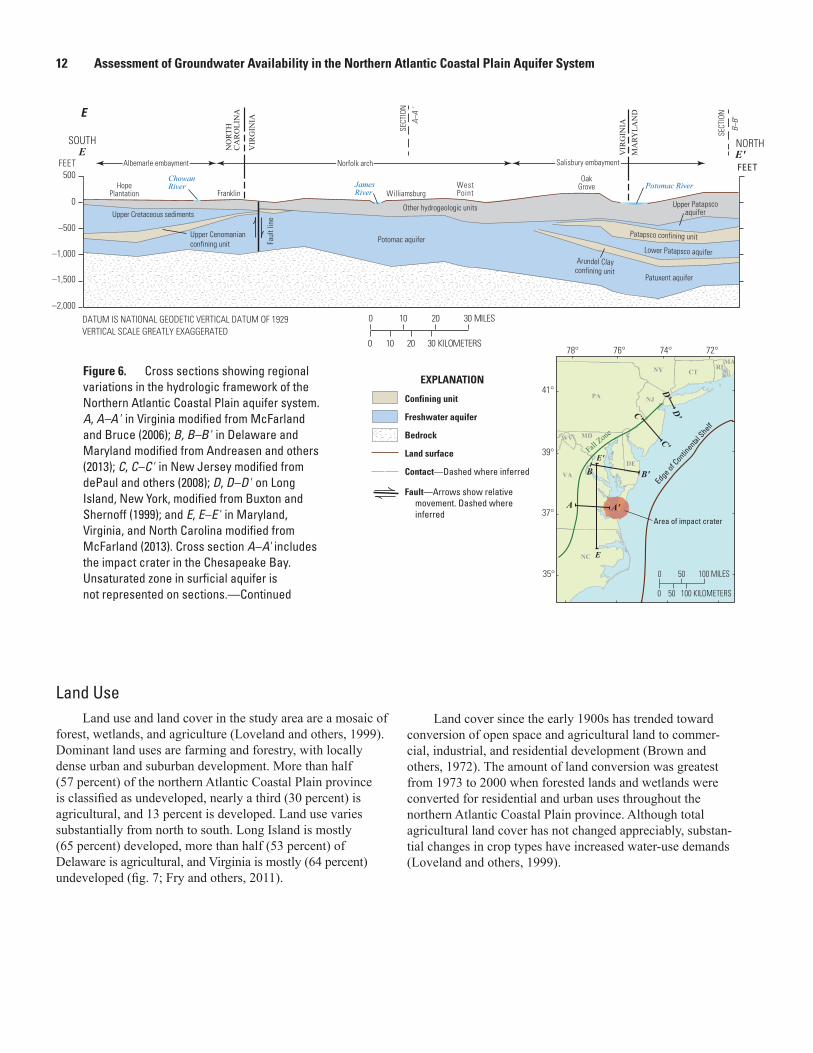
Figure 6. Cross sections showing regional variations in the hydrologic framework of the Northern Atlantic Coastal Plain aquifer system. A, A–A' in Virginia modified from McFarland and Bruce (2006); B, B–B' in Delaware and Maryland modified from Andreasen and others (2013); C, C– C' in New Jersey modified from dePaul and others (2008); D, D– D' on Long Island, New York, modified from Buxton and Shernoff (1999); and E, E– E' in Maryland, Virginia, and North Carolina modified from McFarland (2013). Cross-section A –A' includes the impact crater in the Chesapeake Bay. Unsaturated zone in surficial aquifer is not represented on sections.
Fall Z
one
Edge of Contin
ental Shelf
Area of impact crater
C
C'
B B'
DD'
A A'
0
0 50 100 KILOMETERS
50 100 MILES
41°
39°
37°
35°
78° 76° 74° 72°
PA
NC
VA
NY
NJ
CTRI
WV MD
DE
MA
E
E'
Area of saline groundwater
Freshwater aquifers
Bedrock
Fractures
EXPLANATION
Confining unit
Direction of groundwater flow under predevelopment (1900) conditions
Contact—Dashed where inferred
Land surface
Saprolite
SECT
ION
E–
E'
SECT
ION
E–
E'
Lower Patapsco aquifer system
Upper Patapsco aquifer system
Choptank aquifer
Lower Chesapeake confining unit
Matawan confining unit
Monmouth aquifer
Matawan-Magothy confining unit
Matawan aquifer
Severn confining unit
Magothy aquifer
Patuxent aquifer system
Waste Gate aquifer system
A A'
Aquia aquifer
Yorktown-Eastover aquifer
Suffolk scarpSurficial aquifer
Yorktown confining zone
Nanjemoy-Marlboro confining unit
Potomac confining zone
Potomac aquifer
Calvert confining unit
Piney Point aquifer
Fall Zone
Chickahominy confining unit
Chesapeake Bay impact crater
500
250
−500
−750
−250
−1,000
−1,250
−1,500
Che
sape
ake
Bay
0
FEET
WEST EAST
Ocean City aquifer
Surficial aquifer
Pocomoke aquifer
Surficialuplandaquifer
Chesapeake Bay
500
−500
−1,000
−1,500
−2,000
−2,500
−3,000
−3,500
−4,000
−4,500
−5,000
−5,500
−6,000
−6,500
−7,000
0
B B'FEET
WEST EAST
Upper Chesapeake
confining unit
DATUM IS NATIONAL GEODETIC VERTICAL DATUM OF 1929VERTICAL SCALE GREATLY EXAGGERATED
DATUM IS NATIONAL GEODETIC VERTICAL DATUM OF 1929VERTICAL SCALE GREATLY EXAGGERATED
Manokin aquiferCalvert aquifer systemNanjemoy confining unit
Piney Point aquifer
Marlboro Clay confining unitAquia aquifer
Calvertconfining
unit
Magothy-Patapsco confining unit
Exmore matrix confining unit
Exmore clast confining unit
MA
RY
LAN
DD
ELA
WA
RE
0 10 20 KILOMETERS
0 10 20 MILES
0 10 20 KILOMETERS
0 10 20 MILES
A
B
Introduction 11
Figure 6 (see page 10).—Continued
Area of saline groundwater
Freshwater aquifer
Bedrock
Fractures
EXPLANATION
Confining unit
Direction of groundwater flow under predevelopment (1900) conditions
Contact—Dashed where inferred
Land surface
D
masterson_nacp_fig 6cd
Fall Z
one
Edge of Contin
ental Shelf
Area of impact crater
C
C'
B B'
DD'
A A'
0
0 50 100 KILOMETERS
50 100 MILES
41°
39°
37°
35°
78° 76° 74° 72°
PA
NC
VA
NY
NJ
CTRI
WV MD
DE
MA
E
E'
C C'
Kirkwood-Cohansey aquifer
200
0
−200
−400
−600
−800
−1,000
−1,200
−1,400
−1,600
FEET
WEST EAST
NORTH SOUTH
Lloyd aquifer
Magothy aquifer
Upper glacial aquifer
Gardiners clay Jameco aquifer ATLANTIC OCEAN
ATLANTIC OCEAN
200
0
−200
−400
−600
−800
−1,000
−1,200
−1,400
FEETD D'
LongIslandSound
Raritan confining unit
Englishtown aquifer system
Wenonah-Mount Laurel aquifer
Upper Potomac-Raritan-Magothy aquiferMiddle Potomac-Raritan-Magothy aquifer
Vincentown aquifer
PEN
NSY
LVA
NIA
NEW
JER
SEY
Fall Zone
DATUM IS NATIONAL GEODETIC VERTICAL DATUM OF 1929VERTICAL SCALE GREATLY EXAGGERATED
DATUM IS NATIONAL GEODETIC VERTICAL DATUM OF 1929VERTICAL SCALE GREATLY EXAGGERATED
0 5 10 KILOMETERS
0 5 10 MILES
0 10 20 KILOMETERS
0 10 20 MILES
C
D
12 Assessment of Groundwater Availability in the Northern Atlantic Coastal Plain Aquifer System
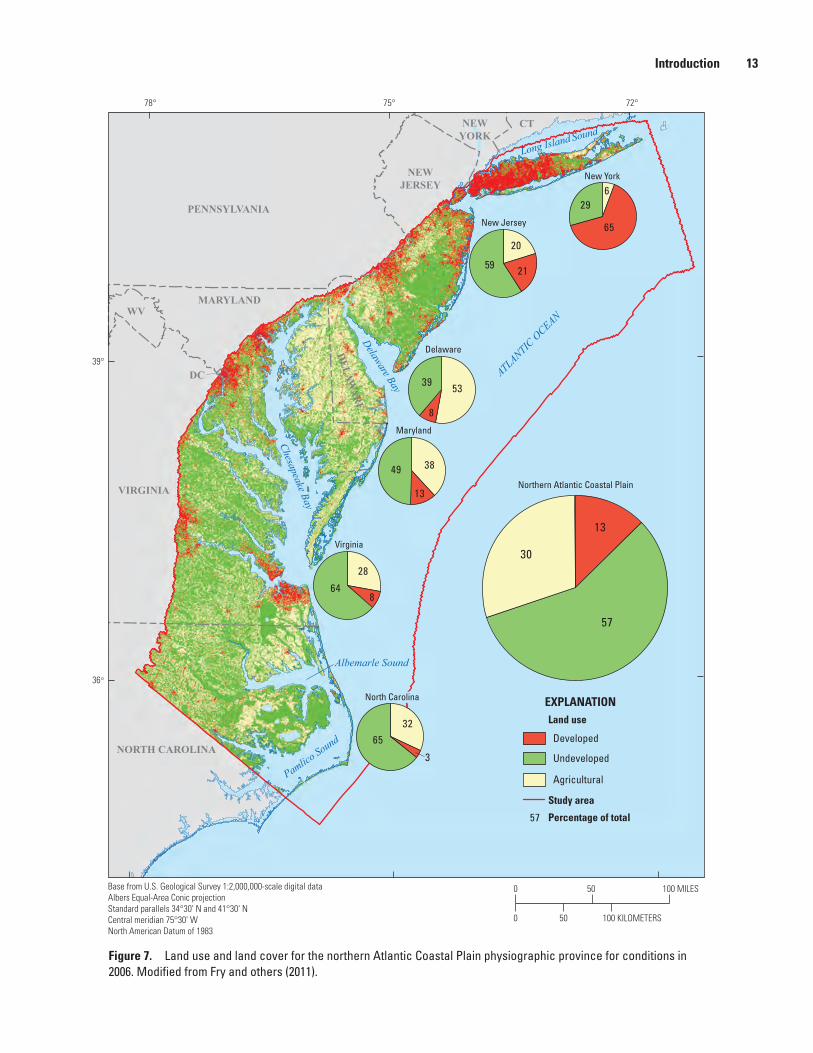
Land UseLand use and land cover in the study area are a mosaic of
forest, wetlands, and agriculture (Loveland and others, 1999). Dominant land uses are farming and forestry, with locally dense urban and suburban development. More than half (57 percent) of the northern Atlantic Coastal Plain province is classified as undeveloped, nearly a third (30 percent) is agricultural, and 13 percent is developed. Land use varies substantially from north to south. Long Island is mostly (65 percent) developed, more than half (53 percent) of Delaware is agricultural, and Virginia is mostly (64 percent) undeveloped (fig. 7; Fry and others, 2011).
Land cover since the early 1900s has trended toward conversion of open space and agricultural land to commer-cial, industrial, and residential development (Brown and others, 1972). The amount of land conversion was greatest from 1973 to 2000 when forested lands and wetlands were converted for residential and urban uses throughout the northern Atlantic Coastal Plain province. Although total agricultural land cover has not changed appreciably, substan-tial changes in crop types have increased water-use demands (Loveland and others, 1999).
FEET
masterson_nacp_fig 6e
Other hydrogeologic units0
–500
–1,000
–1,500
500
–2,000
Upper Cretaceous sediments
Potomac aquifer
HopePlantation
OakGroveJames
RiverPotomac River
E E'SOUTH NORTH
ChowanRiver
Norfolk arch Salisbury embayment
Upper Cenomanianconfining unit
Patuxent aquifer
Lower Patapsco aquiferArundel Clayconfining unit
Upper Patapscoaquifer
WestPointFranklin Williamsburg
Patapsco confining unit
Faul
t lin
e
VIR
GIN
IA
0 10 20 30 KILOMETERS
0 10 20 30 MILES
NO
RTH
C
AR
OLI
NA
MA
RYLA
ND
VIR
GIN
IA
FEET Albemarle embayment
SECT
ION
A–
A '
SECT
ION
B–B'
Freshwater aquifer
Bedrock
EXPLANATION
Confining unit
Contact—Dashed where inferred
Land surface Fall Z
one
Edge of Contin
ental Shelf
Area of impact crater
C
C'
B B'
DD'
A A'
0
0 50 100 KILOMETERS
50 100 MILES
41°
39°
37°
35°
78° 76° 74° 72°
PA
NC
VA
NY
NJ
CTRI
WV MD
DE
MA
E
E'
Fault—Arrows show relative movement. Dashed where inferred
E
DATUM IS NATIONAL GEODETIC VERTICAL DATUM OF 1929VERTICAL SCALE GREATLY EXAGGERATED
Figure 6. Cross sections showing regional variations in the hydrologic framework of the Northern Atlantic Coastal Plain aquifer system. A, A–A' in Virginia modified from McFarland and Bruce (2006); B, B–B' in Delaware and Maryland modified from Andreasen and others (2013); C, C– C' in New Jersey modified from dePaul and others (2008); D, D– D' on Long Island, New York, modified from Buxton and Shernoff (1999); and E, E– E' in Maryland, Virginia, and North Carolina modified from McFarland (2013). Cross section A –A' includes the impact crater in the Chesapeake Bay. Unsaturated zone in surficial aquifer is not represented on sections.—Continued
Introduction 13
Developed
Undeveloped
Agricultural
EXPLANATION
Study area
Land use
Percentage of total57
65
59
629
21
20
8
13
13
30
57
49 38
8
3
6532
64
28
39 53
NORTH CAROLINA
DELAW
AR
E
DC
PENNSYLVANIA
VIRGINIA
MARYLAND
NEWJERSEY
NEWYORK
CT
Base from U.S. Geological Survey 1:2,000,000-scale digital dataAlbers Equal-Area Conic projectionStandard parallels 34°30' N and 41°30' NCentral meridian 75°30' W North American Datum of 1983
0 50 100 MILES
0 50 100 KILOMETERS
masterson_nacp_fig 07
72°75°78°
39°
36°
Albemarle Sound
Pamlico Sound
ATLANTIC O
CEAN
Chesapeake Bay
Delaware Bay
Long Island Sound
New York
New Jersey
Maryland
Delaware
Virginia
Northern Atlantic Coastal Plain
North Carolina
WV
Figure 7. Land use and land cover for the northern Atlantic Coastal Plain physiographic province for conditions in 2006. Modified from Fry and others (2011).
14 Assessment of Groundwater Availability in the Northern Atlantic Coastal Plain Aquifer System
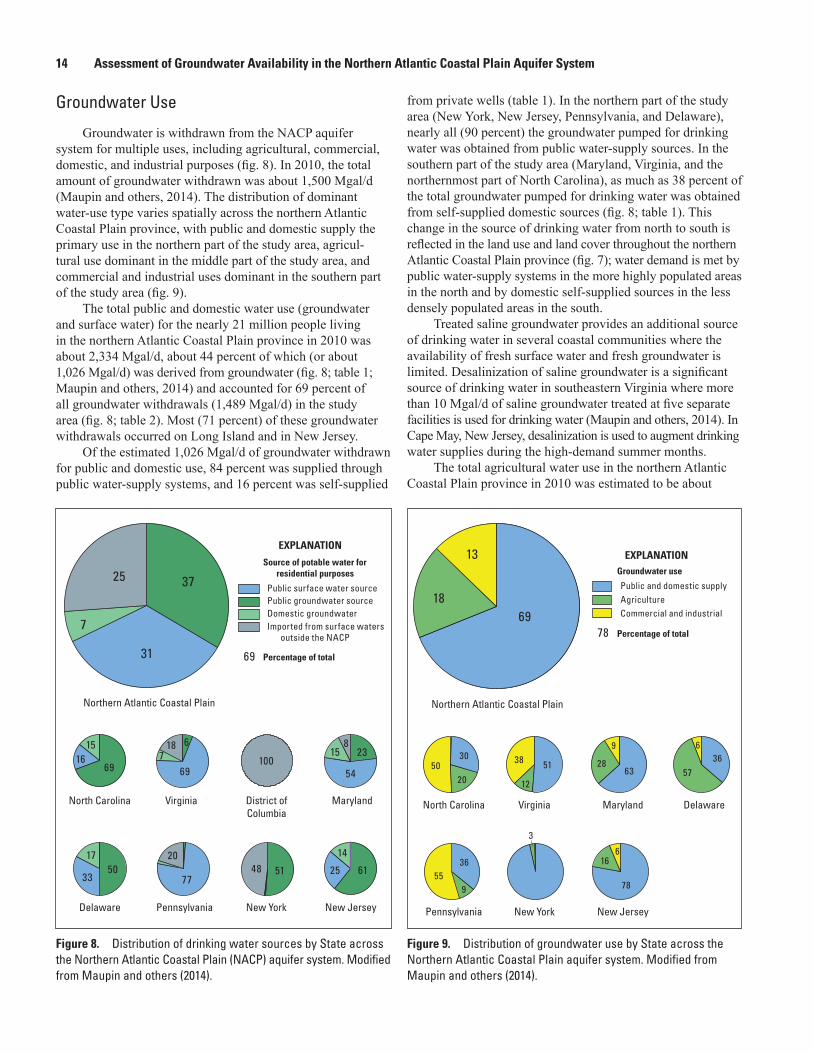
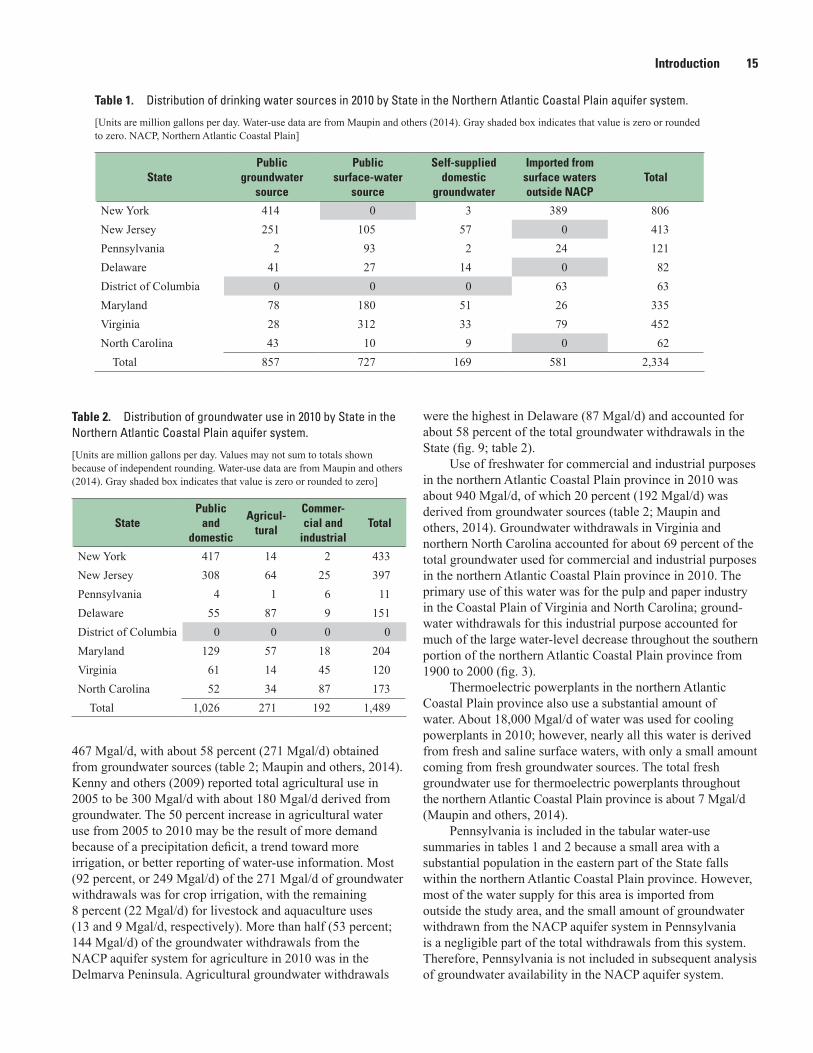
Groundwater Use
Groundwater is withdrawn from the NACP aquifer system for multiple uses, including agricultural, commercial, domestic, and industrial purposes (fig. 8). In 2010, the total amount of groundwater withdrawn was about 1,500 Mgal/d (Maupin and others, 2014). The distribution of dominant water-use type varies spatially across the northern Atlantic Coastal Plain province, with public and domestic supply the primary use in the northern part of the study area, agricul-tural use dominant in the middle part of the study area, and commercial and industrial uses dominant in the southern part of the study area (fig. 9).
The total public and domestic water use (groundwater and surface water) for the nearly 21 million people living in the northern Atlantic Coastal Plain province in 2010 was about 2,334 Mgal/d, about 44 percent of which (or about 1,026 Mgal/d) was derived from groundwater (fig. 8; table 1; Maupin and others, 2014) and accounted for 69 percent of all groundwater withdrawals (1,489 Mgal/d) in the study area (fig. 8; table 2). Most (71 percent) of these groundwater withdrawals occurred on Long Island and in New Jersey.
Of the estimated 1,026 Mgal/d of groundwater withdrawn for public and domestic use, 84 percent was supplied through public water-supply systems, and 16 percent was self-supplied
from private wells (table 1). In the northern part of the study area (New York, New Jersey, Pennsylvania, and Delaware), nearly all (90 percent) the groundwater pumped for drinking water was obtained from public water-supply sources. In the southern part of the study area (Maryland, Virginia, and the northernmost part of North Carolina), as much as 38 percent of the total groundwater pumped for drinking water was obtained from self-supplied domestic sources (fig. 8; table 1). This change in the source of drinking water from north to south is reflected in the land use and land cover throughout the northern Atlantic Coastal Plain province (fig. 7); water demand is met by public water-supply systems in the more highly populated areas in the north and by domestic self-supplied sources in the less densely populated areas in the south.
Treated saline groundwater provides an additional source of drinking water in several coastal communities where the availability of fresh surface water and fresh groundwater is limited. Desalinization of saline groundwater is a significant source of drinking water in southeastern Virginia where more than 10 Mgal/d of saline groundwater treated at five separate facilities is used for drinking water (Maupin and others, 2014). In Cape May, New Jersey, desalinization is used to augment drinking water supplies during the high-demand summer months.
The total agricultural water use in the northern Atlantic Coastal Plain province in 2010 was estimated to be about
Public surface water sourcePublic groundwater sourceDomestic groundwaterImported from surface waters
outside the NACP
EXPLANATION
Source of potable water forresidential purposes
Percentage of total
Northern Atlantic Coastal Plain
North Carolina District ofColumbia
New JerseyPennsylvania New YorkDelaware
MarylandVirginia
10069
1516
69
69
187
6
54
23158
5033
17
77
206125
14
5148
3725
31
7
masterson_nacp_fig08_new
EXPLANATION
Public and domestic supplyAgricultureCommercial and industrial
Northern Atlantic Coastal Plain
Groundwater use
Percentage of total
North Carolina
New JerseyPennsylvania New York
DelawareMarylandVirginia
5030
205138
1263
9
2857
636
955
36 16
78
78
6
3
69
13
18
masterson_nacp_fig09_new
Figure 8. Distribution of drinking water sources by State across the Northern Atlantic Coastal Plain (NACP) aquifer system. Modified from Maupin and others (2014).
Figure 9. Distribution of groundwater use by State across the Northern Atlantic Coastal Plain aquifer system. Modified from Maupin and others (2014).
Introduction 15
467 Mgal/d, with about 58 percent (271 Mgal/d) obtained from groundwater sources (table 2; Maupin and others, 2014). Kenny and others (2009) reported total agricultural use in 2005 to be 300 Mgal/d with about 180 Mgal/d derived from groundwater. The 50 percent increase in agricultural water use from 2005 to 2010 may be the result of more demand because of a precipitation deficit, a trend toward more irrigation, or better reporting of water-use information. Most (92 percent, or 249 Mgal/d) of the 271 Mgal/d of groundwater withdrawals was for crop irrigation, with the remaining 8 percent (22 Mgal/d) for livestock and aquaculture uses (13 and 9 Mgal/d, respectively). More than half (53 percent; 144 Mgal/d) of the groundwater withdrawals from the NACP aquifer system for agriculture in 2010 was in the Delmarva Peninsula. Agricultural groundwater withdrawals
were the highest in Delaware (87 Mgal/d) and accounted for about 58 percent of the total groundwater withdrawals in the State (fig. 9; table 2).
Use of freshwater for commercial and industrial purposes in the northern Atlantic Coastal Plain province in 2010 was about 940 Mgal/d, of which 20 percent (192 Mgal/d) was derived from groundwater sources (table 2; Maupin and others, 2014). Groundwater withdrawals in Virginia and northern North Carolina accounted for about 69 percent of the total groundwater used for commercial and industrial purposes in the northern Atlantic Coastal Plain province in 2010. The primary use of this water was for the pulp and paper industry in the Coastal Plain of Virginia and North Carolina; ground-water withdrawals for this industrial purpose accounted for much of the large water-level decrease throughout the southern portion of the northern Atlantic Coastal Plain province from 1900 to 2000 (fig. 3).
Thermoelectric powerplants in the northern Atlantic Coastal Plain province also use a substantial amount of water. About 18,000 Mgal/d of water was used for cooling powerplants in 2010; however, nearly all this water is derived from fresh and saline surface waters, with only a small amount coming from fresh groundwater sources. The total fresh groundwater use for thermoelectric powerplants throughout the northern Atlantic Coastal Plain province is about 7 Mgal/d (Maupin and others, 2014).
Pennsylvania is included in the tabular water-use summaries in tables 1 and 2 because a small area with a substantial population in the eastern part of the State falls within the northern Atlantic Coastal Plain province. However, most of the water supply for this area is imported from outside the study area, and the small amount of groundwater withdrawn from the NACP aquifer system in Pennsylvania is a negligible part of the total withdrawals from this system. Therefore, Pennsylvania is not included in subsequent analysis of groundwater availability in the NACP aquifer system.
Table 1. Distribution of drinking water sources in 2010 by State in the Northern Atlantic Coastal Plain aquifer system.
[Units are million gallons per day. Water-use data are from Maupin and others (2014). Gray shaded box indicates that value is zero or rounded to zero. NACP, Northern Atlantic Coastal Plain]
StatePublic
groundwater source
Public surface-water
source
Self-supplied domestic
groundwater
Imported from surface waters outside NACP
Total
New York 414 0 3 389 806New Jersey 251 105 57 0 413Pennsylvania 2 93 2 24 121Delaware 41 27 14 0 82District of Columbia 0 0 0 63 63Maryland 78 180 51 26 335Virginia 28 312 33 79 452North Carolina 43 10 9 0 62 Total 857 727 169 581 2,334
Table 2. Distribution of groundwater use in 2010 by State in the Northern Atlantic Coastal Plain aquifer system.
[Units are million gallons per day. Values may not sum to totals shown because of independent rounding. Water-use data are from Maupin and others (2014). Gray shaded box indicates that value is zero or rounded to zero]
StatePublic
and domestic
Agricul-tural
Commer-cial and
industrialTotal
New York 417 14 2 433New Jersey 308 64 25 397Pennsylvania 4 1 6 11Delaware 55 87 9 151District of Columbia 0 0 0 0Maryland 129 57 18 204Virginia 61 14 45 120North Carolina 52 34 87 173 Total 1,026 271 192 1,489
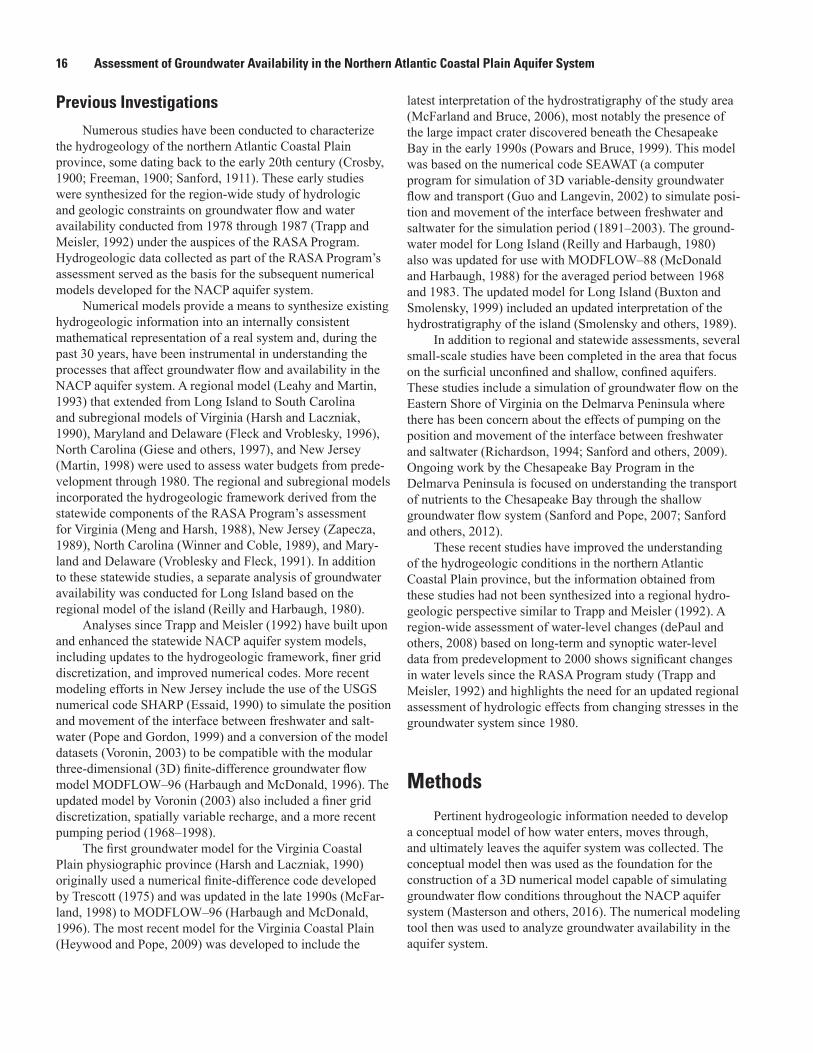
16 Assessment of Groundwater Availability in the Northern Atlantic Coastal Plain Aquifer System
Previous Investigations
Numerous studies have been conducted to characterize the hydrogeology of the northern Atlantic Coastal Plain province, some dating back to the early 20th century (Crosby, 1900; Freeman, 1900; Sanford, 1911). These early studies were synthesized for the region-wide study of hydrologic and geologic constraints on groundwater flow and water availability conducted from 1978 through 1987 (Trapp and Meisler, 1992) under the auspices of the RASA Program. Hydrogeologic data collected as part of the RASA Program’s assessment served as the basis for the subsequent numerical models developed for the NACP aquifer system.
Numerical models provide a means to synthesize existing hydrogeologic information into an internally consistent mathematical representation of a real system and, during the past 30 years, have been instrumental in understanding the processes that affect groundwater flow and availability in the NACP aquifer system. A regional model (Leahy and Martin, 1993) that extended from Long Island to South Carolina and subregional models of Virginia (Harsh and Laczniak, 1990), Maryland and Delaware (Fleck and Vroblesky, 1996), North Carolina (Giese and others, 1997), and New Jersey (Martin, 1998) were used to assess water budgets from prede-velopment through 1980. The regional and subregional models incorporated the hydrogeologic framework derived from the statewide components of the RASA Program’s assessment for Virginia (Meng and Harsh, 1988), New Jersey (Zapecza, 1989), North Carolina (Winner and Coble, 1989), and Mary-land and Delaware (Vroblesky and Fleck, 1991). In addition to these statewide studies, a separate analysis of groundwater availability was conducted for Long Island based on the regional model of the island (Reilly and Harbaugh, 1980).
Analyses since Trapp and Meisler (1992) have built upon and enhanced the statewide NACP aquifer system models, including updates to the hydrogeologic framework, finer grid discretization, and improved numerical codes. More recent modeling efforts in New Jersey include the use of the USGS numerical code SHARP (Essaid, 1990) to simulate the position and movement of the interface between freshwater and salt-water (Pope and Gordon, 1999) and a conversion of the model datasets (Voronin, 2003) to be compatible with the modular three-dimensional (3D) finite-difference groundwater flow model MODFLOW–96 (Harbaugh and McDonald, 1996). The updated model by Voronin (2003) also included a finer grid discretization, spatially variable recharge, and a more recent pumping period (1968–1998).
The first groundwater model for the Virginia Coastal Plain physiographic province (Harsh and Laczniak, 1990) originally used a numerical finite-difference code developed by Trescott (1975) and was updated in the late 1990s (McFar-land, 1998) to MODFLOW–96 (Harbaugh and McDonald, 1996). The most recent model for the Virginia Coastal Plain (Heywood and Pope, 2009) was developed to include the
latest interpretation of the hydrostratigraphy of the study area (McFarland and Bruce, 2006), most notably the presence of the large impact crater discovered beneath the Chesapeake Bay in the early 1990s (Powars and Bruce, 1999). This model was based on the numerical code SEAWAT (a computer program for simulation of 3D variable-density groundwater flow and transport (Guo and Langevin, 2002) to simulate posi-tion and movement of the interface between freshwater and saltwater for the simulation period (1891–2003). The ground-water model for Long Island (Reilly and Harbaugh, 1980) also was updated for use with MODFLOW–88 (McDonald and Harbaugh, 1988) for the averaged period between 1968 and 1983. The updated model for Long Island (Buxton and Smolensky, 1999) included an updated interpretation of the hydrostratigraphy of the island (Smolensky and others, 1989).
In addition to regional and statewide assessments, several small-scale studies have been completed in the area that focus on the surficial unconfined and shallow, confined aquifers. These studies include a simulation of groundwater flow on the Eastern Shore of Virginia on the Delmarva Peninsula where there has been concern about the effects of pumping on the position and movement of the interface between freshwater and saltwater (Richardson, 1994; Sanford and others, 2009). Ongoing work by the Chesapeake Bay Program in the Delmarva Peninsula is focused on understanding the transport of nutrients to the Chesapeake Bay through the shallow groundwater flow system (Sanford and Pope, 2007; Sanford and others, 2012).
These recent studies have improved the understanding of the hydrogeologic conditions in the northern Atlantic Coastal Plain province, but the information obtained from these studies had not been synthesized into a regional hydro-geologic perspective similar to Trapp and Meisler (1992). A region-wide assessment of water-level changes (dePaul and others, 2008) based on long-term and synoptic water-level data from predevelopment to 2000 shows significant changes in water levels since the RASA Program study (Trapp and Meisler, 1992) and highlights the need for an updated regional assessment of hydrologic effects from changing stresses in the groundwater system since 1980.
MethodsPertinent hydrogeologic information needed to develop
a conceptual model of how water enters, moves through, and ultimately leaves the aquifer system was collected. The conceptual model then was used as the foundation for the construction of a 3D numerical model capable of simulating groundwater flow conditions throughout the NACP aquifer system (Masterson and others, 2016). The numerical modeling tool then was used to analyze groundwater availability in the aquifer system.
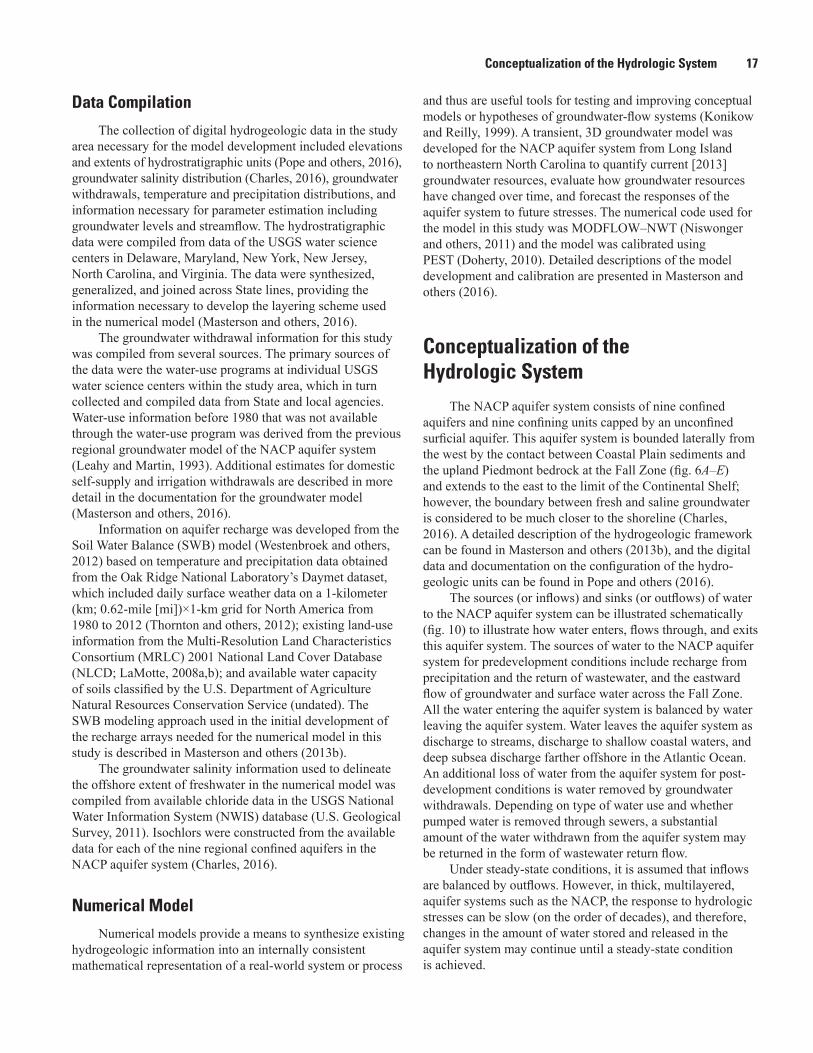
Conceptualization of the Hydrologic System 17
Data Compilation
The collection of digital hydrogeologic data in the study area necessary for the model development included elevations and extents of hydrostratigraphic units (Pope and others, 2016), groundwater salinity distribution (Charles, 2016), groundwater withdrawals, temperature and precipitation distributions, and information necessary for parameter estimation including groundwater levels and streamflow. The hydrostratigraphic data were compiled from data of the USGS water science centers in Delaware, Maryland, New York, New Jersey, North Carolina, and Virginia. The data were synthesized, generalized, and joined across State lines, providing the information necessary to develop the layering scheme used in the numerical model (Masterson and others, 2016).
The groundwater withdrawal information for this study was compiled from several sources. The primary sources of the data were the water-use programs at individual USGS water science centers within the study area, which in turn collected and compiled data from State and local agencies. Water-use information before 1980 that was not available through the water-use program was derived from the previous regional groundwater model of the NACP aquifer system (Leahy and Martin, 1993). Additional estimates for domestic self-supply and irrigation withdrawals are described in more detail in the documentation for the groundwater model (Masterson and others, 2016).
Information on aquifer recharge was developed from the Soil Water Balance (SWB) model (Westenbroek and others, 2012) based on temperature and precipitation data obtained from the Oak Ridge National Laboratory’s Daymet dataset, which included daily surface weather data on a 1-kilometer (km; 0.62-mile [mi])×1-km grid for North America from 1980 to 2012 (Thornton and others, 2012); existing land-use information from the Multi-Resolution Land Characteristics Consortium (MRLC) 2001 National Land Cover Database (NLCD; LaMotte, 2008a,b); and available water capacity of soils classified by the U.S. Department of Agriculture Natural Resources Conservation Service (undated). The SWB modeling approach used in the initial development of the recharge arrays needed for the numerical model in this study is described in Masterson and others (2013b).
The groundwater salinity information used to delineate the offshore extent of freshwater in the numerical model was compiled from available chloride data in the USGS National Water Information System (NWIS) database (U.S. Geological Survey, 2011). Isochlors were constructed from the available data for each of the nine regional confined aquifers in the NACP aquifer system (Charles, 2016).
Numerical Model
Numerical models provide a means to synthesize existing hydrogeologic information into an internally consistent mathematical representation of a real-world system or process
and thus are useful tools for testing and improving conceptual models or hypotheses of groundwater-flow systems (Konikow and Reilly, 1999). A transient, 3D groundwater model was developed for the NACP aquifer system from Long Island to northeastern North Carolina to quantify current [2013] groundwater resources, evaluate how groundwater resources have changed over time, and forecast the responses of the aquifer system to future stresses. The numerical code used for the model in this study was MODFLOW–NWT (Niswonger and others, 2011) and the model was calibrated using PEST (Doherty, 2010). Detailed descriptions of the model development and calibration are presented in Masterson and others (2016).
Conceptualization of the Hydrologic System
The NACP aquifer system consists of nine confined aquifers and nine confining units capped by an unconfined surficial aquifer. This aquifer system is bounded laterally from the west by the contact between Coastal Plain sediments and the upland Piedmont bedrock at the Fall Zone (fig. 6A–E) and extends to the east to the limit of the Continental Shelf; however, the boundary between fresh and saline groundwater is considered to be much closer to the shoreline (Charles, 2016). A detailed description of the hydrogeologic framework can be found in Masterson and others (2013b), and the digital data and documentation on the configuration of the hydro-geologic units can be found in Pope and others (2016).
The sources (or inflows) and sinks (or outflows) of water to the NACP aquifer system can be illustrated schematically (fig. 10) to illustrate how water enters, flows through, and exits this aquifer system. The sources of water to the NACP aquifer system for predevelopment conditions include recharge from precipitation and the return of wastewater, and the eastward flow of groundwater and surface water across the Fall Zone. All the water entering the aquifer system is balanced by water leaving the aquifer system. Water leaves the aquifer system as discharge to streams, discharge to shallow coastal waters, and deep subsea discharge farther offshore in the Atlantic Ocean. An additional loss of water from the aquifer system for post-development conditions is water removed by groundwater withdrawals. Depending on type of water use and whether pumped water is removed through sewers, a substantial amount of the water withdrawn from the aquifer system may be returned in the form of wastewater return flow.
Under steady-state conditions, it is assumed that inflows are balanced by outflows. However, in thick, multilayered, aquifer systems such as the NACP, the response to hydrologic stresses can be slow (on the order of decades), and therefore, changes in the amount of water stored and released in the aquifer system may continue until a steady-state condition is achieved.
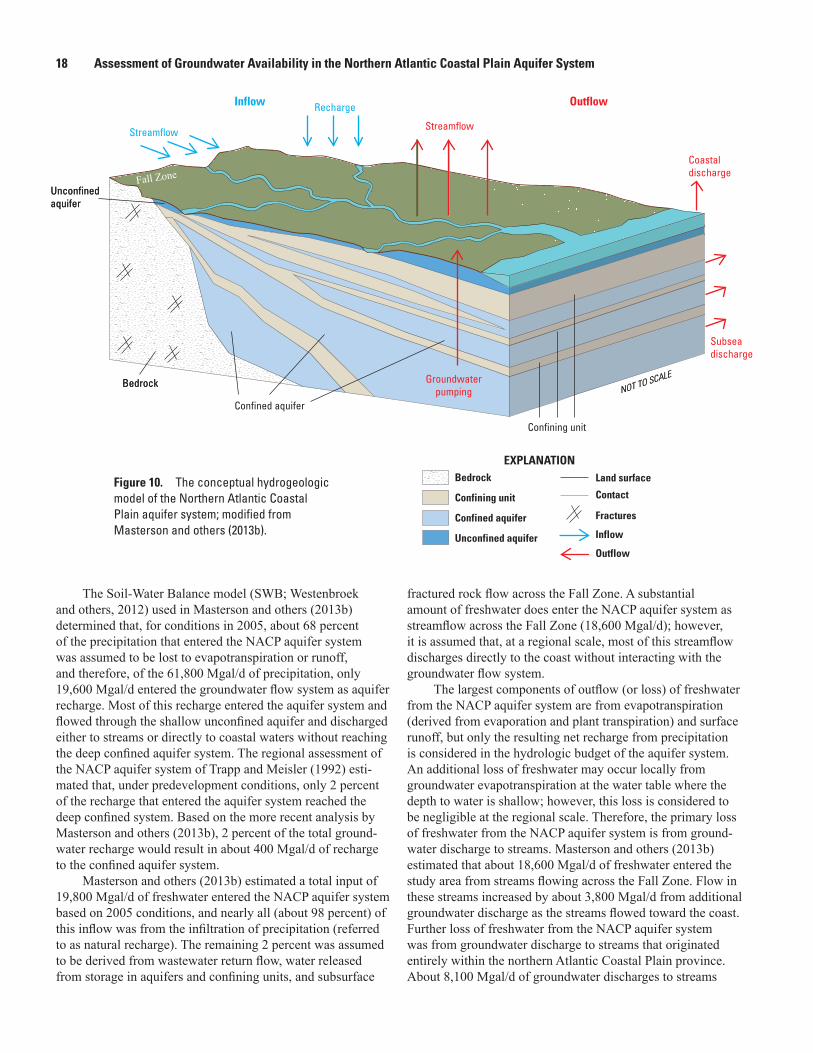
18 Assessment of Groundwater Availability in the Northern Atlantic Coastal Plain Aquifer System
The Soil-Water Balance model (SWB; Westenbroek and others, 2012) used in Masterson and others (2013b) determined that, for conditions in 2005, about 68 percent of the precipitation that entered the NACP aquifer system was assumed to be lost to evapotranspiration or runoff, and therefore, of the 61,800 Mgal/d of precipitation, only 19,600 Mgal/d entered the groundwater flow system as aquifer recharge. Most of this recharge entered the aquifer system and flowed through the shallow unconfined aquifer and discharged either to streams or directly to coastal waters without reaching the deep confined aquifer system. The regional assessment of the NACP aquifer system of Trapp and Meisler (1992) esti-mated that, under predevelopment conditions, only 2 percent of the recharge that entered the aquifer system reached the deep confined system. Based on the more recent analysis by Masterson and others (2013b), 2 percent of the total ground-water recharge would result in about 400 Mgal/d of recharge to the confined aquifer system.
Masterson and others (2013b) estimated a total input of 19,800 Mgal/d of freshwater entered the NACP aquifer system based on 2005 conditions, and nearly all (about 98 percent) of this inflow was from the infiltration of precipitation (referred to as natural recharge). The remaining 2 percent was assumed to be derived from wastewater return flow, water released from storage in aquifers and confining units, and subsurface
fractured rock flow across the Fall Zone. A substantial amount of freshwater does enter the NACP aquifer system as streamflow across the Fall Zone (18,600 Mgal/d); however, it is assumed that, at a regional scale, most of this streamflow discharges directly to the coast without interacting with the groundwater flow system.
The largest components of outflow (or loss) of freshwater from the NACP aquifer system are from evapotranspiration (derived from evaporation and plant transpiration) and surface runoff, but only the resulting net recharge from precipitation is considered in the hydrologic budget of the aquifer system. An additional loss of freshwater may occur locally from groundwater evapotranspiration at the water table where the depth to water is shallow; however, this loss is considered to be negligible at the regional scale. Therefore, the primary loss of freshwater from the NACP aquifer system is from ground-water discharge to streams. Masterson and others (2013b) estimated that about 18,600 Mgal/d of freshwater entered the study area from streams flowing across the Fall Zone. Flow in these streams increased by about 3,800 Mgal/d from additional groundwater discharge as the streams flowed toward the coast. Further loss of freshwater from the NACP aquifer system was from groundwater discharge to streams that originated entirely within the northern Atlantic Coastal Plain province. About 8,100 Mgal/d of groundwater discharges to streams
masterson_nacp_fig 10
Fall Zone
Fractures
Inflow
Outflow
EXPLANATIONBedrock
Confining unit
Confined aquifer
Unconfined aquifer
Land surface
Contact
Confining unit
Confined aquifer
UnconfinedaquiferUnconfinedaquifer
BedrockBedrockNOT TO SCALE
NOT TO SCALE
Recharge
Fall Zone
Inflow Outflow
Coastaldischarge
Streamflow
Subseadischarge
Groundwaterpumping
Streamflow
Figure 10. The conceptual hydrogeologic model of the Northern Atlantic Coastal Plain aquifer system; modified from Masterson and others (2013b).
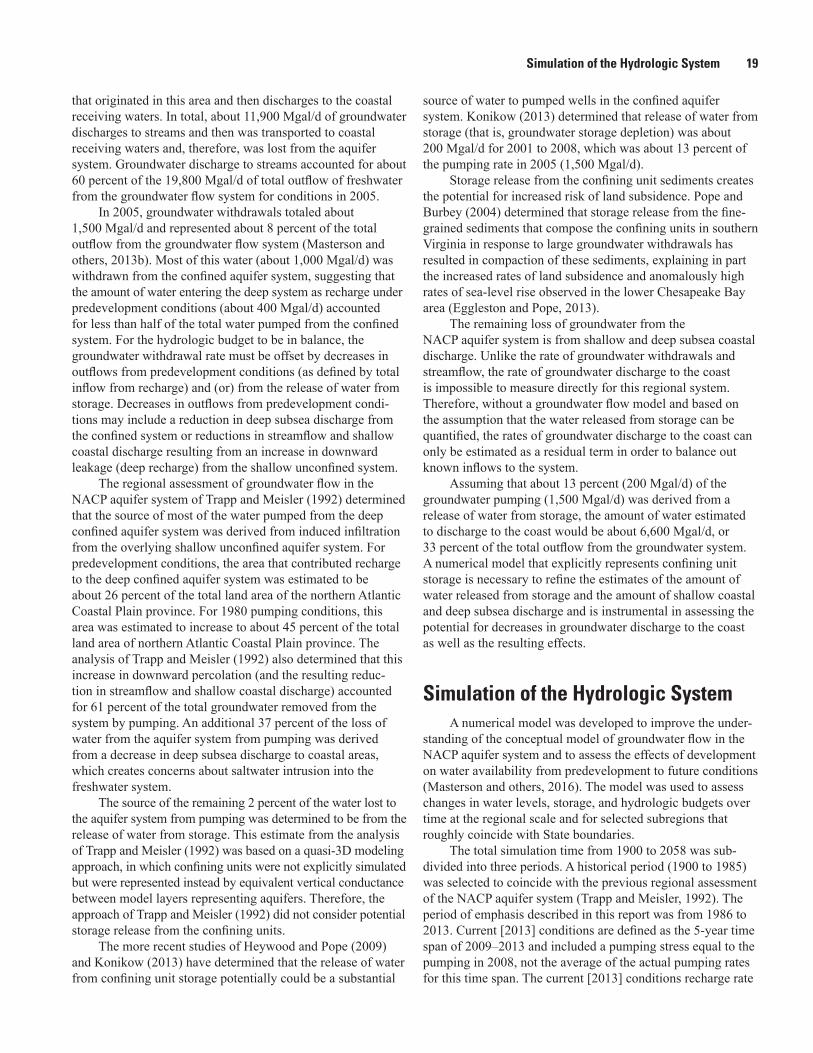
Simulation of the Hydrologic System 19
that originated in this area and then discharges to the coastal receiving waters. In total, about 11,900 Mgal/d of groundwater discharges to streams and then was transported to coastal receiving waters and, therefore, was lost from the aquifer system. Groundwater discharge to streams accounted for about 60 percent of the 19,800 Mgal/d of total outflow of freshwater from the groundwater flow system for conditions in 2005.
In 2005, groundwater withdrawals totaled about 1,500 Mgal/d and represented about 8 percent of the total outflow from the groundwater flow system (Masterson and others, 2013b). Most of this water (about 1,000 Mgal/d) was withdrawn from the confined aquifer system, suggesting that the amount of water entering the deep system as recharge under predevelopment conditions (about 400 Mgal/d) accounted for less than half of the total water pumped from the confined system. For the hydrologic budget to be in balance, the groundwater withdrawal rate must be offset by decreases in outflows from predevelopment conditions (as defined by total inflow from recharge) and (or) from the release of water from storage. Decreases in outflows from predevelopment condi-tions may include a reduction in deep subsea discharge from the confined system or reductions in streamflow and shallow coastal discharge resulting from an increase in downward leakage (deep recharge) from the shallow unconfined system.
The regional assessment of groundwater flow in the NACP aquifer system of Trapp and Meisler (1992) determined that the source of most of the water pumped from the deep confined aquifer system was derived from induced infiltration from the overlying shallow unconfined aquifer system. For predevelopment conditions, the area that contributed recharge to the deep confined aquifer system was estimated to be about 26 percent of the total land area of the northern Atlantic Coastal Plain province. For 1980 pumping conditions, this area was estimated to increase to about 45 percent of the total land area of northern Atlantic Coastal Plain province. The analysis of Trapp and Meisler (1992) also determined that this increase in downward percolation (and the resulting reduc-tion in streamflow and shallow coastal discharge) accounted for 61 percent of the total groundwater removed from the system by pumping. An additional 37 percent of the loss of water from the aquifer system from pumping was derived from a decrease in deep subsea discharge to coastal areas, which creates concerns about saltwater intrusion into the freshwater system.
The source of the remaining 2 percent of the water lost to the aquifer system from pumping was determined to be from the release of water from storage. This estimate from the analysis of Trapp and Meisler (1992) was based on a quasi-3D modeling approach, in which confining units were not explicitly simulated but were represented instead by equivalent vertical conductance between model layers representing aquifers. Therefore, the approach of Trapp and Meisler (1992) did not consider potential storage release from the confining units.
The more recent studies of Heywood and Pope (2009) and Konikow (2013) have determined that the release of water from confining unit storage potentially could be a substantial
source of water to pumped wells in the confined aquifer system. Konikow (2013) determined that release of water from storage (that is, groundwater storage depletion) was about 200 Mgal/d for 2001 to 2008, which was about 13 percent of the pumping rate in 2005 (1,500 Mgal/d).
Storage release from the confining unit sediments creates the potential for increased risk of land subsidence. Pope and Burbey (2004) determined that storage release from the fine-grained sediments that compose the confining units in southern Virginia in response to large groundwater withdrawals has resulted in compaction of these sediments, explaining in part the increased rates of land subsidence and anomalously high rates of sea-level rise observed in the lower Chesapeake Bay area (Eggleston and Pope, 2013).
The remaining loss of groundwater from the NACP aquifer system is from shallow and deep subsea coastal discharge. Unlike the rate of groundwater withdrawals and streamflow, the rate of groundwater discharge to the coast is impossible to measure directly for this regional system. Therefore, without a groundwater flow model and based on the assumption that the water released from storage can be quantified, the rates of groundwater discharge to the coast can only be estimated as a residual term in order to balance out known inflows to the system.
Assuming that about 13 percent (200 Mgal/d) of the groundwater pumping (1,500 Mgal/d) was derived from a release of water from storage, the amount of water estimated to discharge to the coast would be about 6,600 Mgal/d, or 33 percent of the total outflow from the groundwater system. A numerical model that explicitly represents confining unit storage is necessary to refine the estimates of the amount of water released from storage and the amount of shallow coastal and deep subsea discharge and is instrumental in assessing the potential for decreases in groundwater discharge to the coast as well as the resulting effects.
Simulation of the Hydrologic SystemA numerical model was developed to improve the under-
standing of the conceptual model of groundwater flow in the NACP aquifer system and to assess the effects of development on water availability from predevelopment to future conditions (Masterson and others, 2016). The model was used to assess changes in water levels, storage, and hydrologic budgets over time at the regional scale and for selected subregions that roughly coincide with State boundaries.
The total simulation time from 1900 to 2058 was sub-divided into three periods. A historical period (1900 to 1985) was selected to coincide with the previous regional assessment of the NACP aquifer system (Trapp and Meisler, 1992). The period of emphasis described in this report was from 1986 to 2013. Current [2013] conditions are defined as the 5-year time span of 2009–2013 and included a pumping stress equal to the pumping in 2008, not the average of the actual pumping rates for this time span. The current [2013] conditions recharge rate
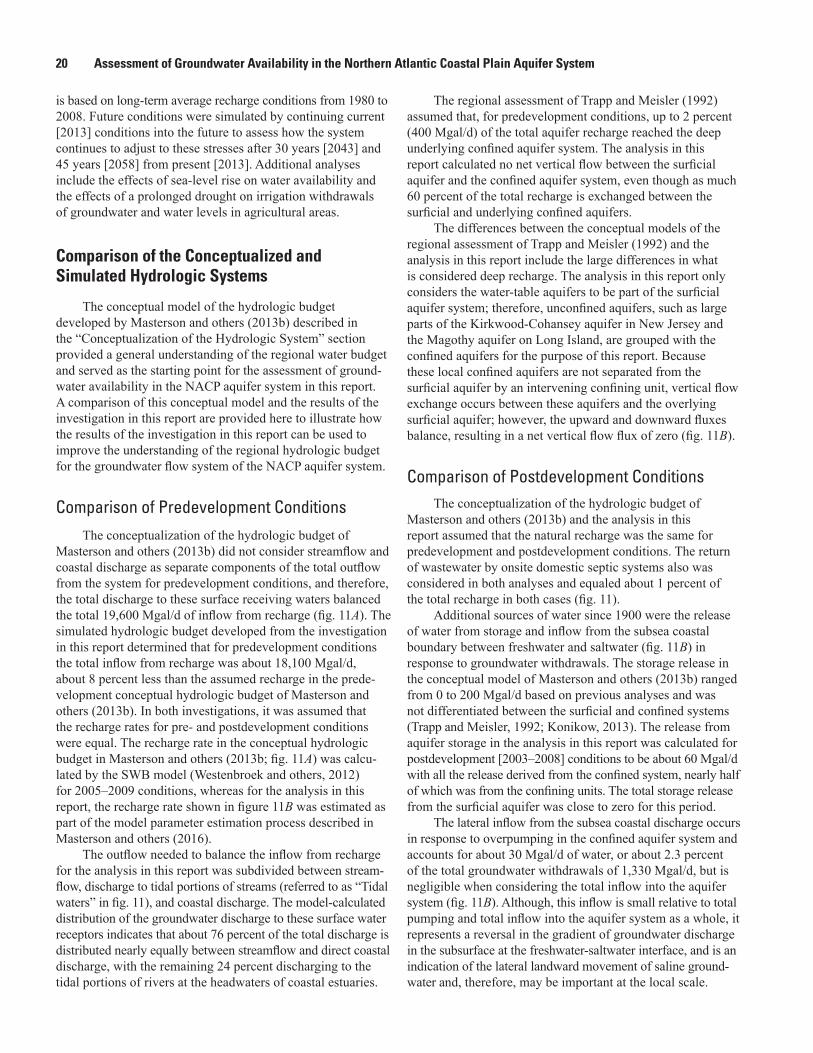
20 Assessment of Groundwater Availability in the Northern Atlantic Coastal Plain Aquifer System
is based on long-term average recharge conditions from 1980 to 2008. Future conditions were simulated by continuing current [2013] conditions into the future to assess how the system continues to adjust to these stresses after 30 years [2043] and 45 years [2058] from present [2013]. Additional analyses include the effects of sea-level rise on water availability and the effects of a prolonged drought on irrigation withdrawals of groundwater and water levels in agricultural areas.
Comparison of the Conceptualized and Simulated Hydrologic Systems
The conceptual model of the hydrologic budget developed by Masterson and others (2013b) described in the “Conceptualization of the Hydrologic System” section provided a general understanding of the regional water budget and served as the starting point for the assessment of ground-water availability in the NACP aquifer system in this report. A comparison of this conceptual model and the results of the investigation in this report are provided here to illustrate how the results of the investigation in this report can be used to improve the understanding of the regional hydrologic budget for the groundwater flow system of the NACP aquifer system.
Comparison of Predevelopment ConditionsThe conceptualization of the hydrologic budget of
Masterson and others (2013b) did not consider streamflow and coastal discharge as separate components of the total outflow from the system for predevelopment conditions, and therefore, the total discharge to these surface receiving waters balanced the total 19,600 Mgal/d of inflow from recharge (fig. 11A). The simulated hydrologic budget developed from the investigation in this report determined that for predevelopment conditions the total inflow from recharge was about 18,100 Mgal/d, about 8 percent less than the assumed recharge in the prede-velopment conceptual hydrologic budget of Masterson and others (2013b). In both investigations, it was assumed that the recharge rates for pre- and postdevelopment conditions were equal. The recharge rate in the conceptual hydrologic budget in Masterson and others (2013b; fig. 11A) was calcu-lated by the SWB model (Westenbroek and others, 2012) for 2005–2009 conditions, whereas for the analysis in this report, the recharge rate shown in figure 11B was estimated as part of the model parameter estimation process described in Masterson and others (2016).
The outflow needed to balance the inflow from recharge for the analysis in this report was subdivided between stream-flow, discharge to tidal portions of streams (referred to as “Tidal waters” in fig. 11), and coastal discharge. The model-calculated distribution of the groundwater discharge to these surface water receptors indicates that about 76 percent of the total discharge is distributed nearly equally between streamflow and direct coastal discharge, with the remaining 24 percent discharging to the tidal portions of rivers at the headwaters of coastal estuaries.
The regional assessment of Trapp and Meisler (1992) assumed that, for predevelopment conditions, up to 2 percent (400 Mgal/d) of the total aquifer recharge reached the deep underlying confined aquifer system. The analysis in this report calculated no net vertical flow between the surficial aquifer and the confined aquifer system, even though as much 60 percent of the total recharge is exchanged between the surficial and underlying confined aquifers.
The differences between the conceptual models of the regional assessment of Trapp and Meisler (1992) and the analysis in this report include the large differences in what is considered deep recharge. The analysis in this report only considers the water-table aquifers to be part of the surficial aquifer system; therefore, unconfined aquifers, such as large parts of the Kirkwood-Cohansey aquifer in New Jersey and the Magothy aquifer on Long Island, are grouped with the confined aquifers for the purpose of this report. Because these local confined aquifers are not separated from the surficial aquifer by an intervening confining unit, vertical flow exchange occurs between these aquifers and the overlying surficial aquifer; however, the upward and downward fluxes balance, resulting in a net vertical flow flux of zero (fig. 11B).
Comparison of Postdevelopment ConditionsThe conceptualization of the hydrologic budget of
Masterson and others (2013b) and the analysis in this report assumed that the natural recharge was the same for predevelopment and postdevelopment conditions. The return of wastewater by onsite domestic septic systems also was considered in both analyses and equaled about 1 percent of the total recharge in both cases (fig. 11).
Additional sources of water since 1900 were the release of water from storage and inflow from the subsea coastal boundary between freshwater and saltwater (fig. 11B) in response to groundwater withdrawals. The storage release in the conceptual model of Masterson and others (2013b) ranged from 0 to 200 Mgal/d based on previous analyses and was not differentiated between the surficial and confined systems (Trapp and Meisler, 1992; Konikow, 2013). The release from aquifer storage in the analysis in this report was calculated for post development [2003–2008] conditions to be about 60 Mgal/d with all the release derived from the confined system, nearly half of which was from the confining units. The total storage release from the surficial aquifer was close to zero for this period.
The lateral inflow from the subsea coastal discharge occurs in response to overpumping in the confined aquifer system and accounts for about 30 Mgal/d of water, or about 2.3 percent of the total groundwater withdrawals of 1,330 Mgal/d, but is negligible when considering the total inflow into the aquifer system (fig. 11B). Although, this inflow is small relative to total pumping and total inflow into the aquifer system as a whole, it represents a reversal in the gradient of groundwater discharge in the subsurface at the freshwater-saltwater interface, and is an indication of the lateral landward movement of saline ground-water and, therefore, may be important at the local scale.
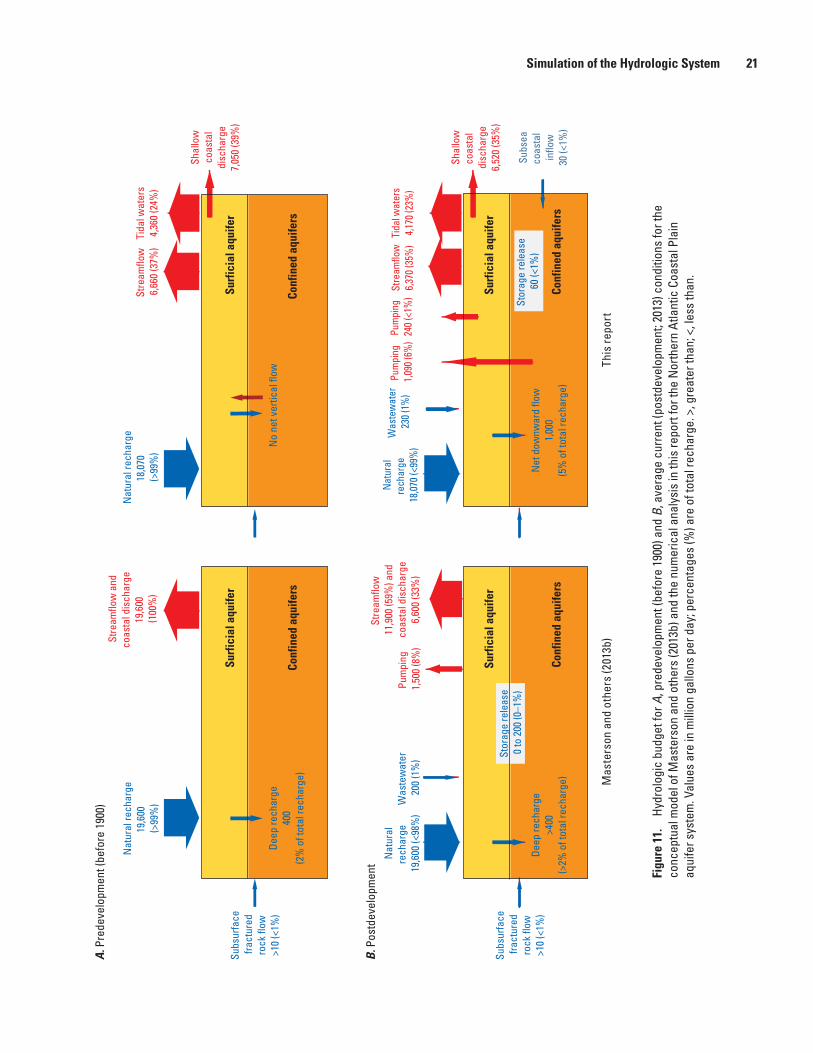
Simulation of the Hydrologic System 21
mas
ters
on_n
acp_
fig11
Subs
urfa
ce
fract
ured
rock
flow
>1
0 (<
1%)
Stre
amflo
w a
ndco
asta
l dis
char
ge
19,6
00
(100
%)
Nat
ural
rech
arge
19,6
00
(>99
%)
Surf
icia
l aqu
ifer
Conf
ined
aqu
ifers
Deep
rech
arge
400
(2%
of t
otal
rech
arge
)
Nat
ural
rech
arge
19
,600
(<98
%)
Subs
urfa
ce
fract
ured
rock
flow
>1
0 (<
1%)
Pum
ping
1,
500
(8%
)W
aste
wat
er
200
(1%
)
Stre
amflo
w
11,9
00 (5
9%) a
ndco
asta
l dis
char
ge6,
600
(33%
)
Conf
ined
aqu
ifers
Deep
rech
arge
>400
(>2%
of t
otal
rech
arge
)
Stor
age
rele
ase
0 to
200
(0–1
%)
Nat
ural
rech
arge
18,0
70
(>99
%)
Surf
icia
l aqu
ifer
Surf
icia
l aqu
ifer
Surf
icia
l aqu
ifer
Conf
ined
aqu
ifers
No
net v
ertic
al fl
ow
Nat
ural
rech
arge
18
,070
(<99
%)
Pum
ping
24
0 (<
1%)
Pum
ping
1,
090
(6%
)W
aste
wat
er
230
(1%
)St
ream
flow
6,
370
(35%
)
Subs
eaco
asta
l in
flow
30 (<
1%)
Shal
low
coas
tal
disc
harg
e6,
520
(35%
)
Shal
low
coas
tal
disc
harg
e7,
050
(39%
)
Stre
amflo
w
6,66
0 (3
7%)
Tida
l wat
ers
4,36
0 (2
4%)
Conf
ined
aqu
ifers
Net
dow
nwar
d flo
w1,
000
(5%
of t
otal
rech
arge
)
Stor
age
rele
ase
60 (<
1%)
Tida
l wat
ers
4,17
0 (2
3%)
Mas
ters
on a
nd o
ther
s (2
013b
)Th
is re
port
A. P
rede
velo
pmen
t (be
fore
190
0)
B. P
ostd
evel
opm
ent
Figu
re 1
1.
Hydr
olog
ic b
udge
t for
A, p
rede
velo
pmen
t (be
fore
190
0) a
nd B
, ave
rage
cur
rent
(pos
tdev
elop
men
t; 20
13) c
ondi
tions
for t
he
conc
eptu
al m
odel
of M
aste
rson
and
oth
ers
(201
3b) a
nd th
e nu
mer
ical
ana
lysi
s in
this
repo
rt fo
r the
Nor
ther
n At
lant
ic C
oast
al P
lain
aq
uife
r sys
tem
. Val
ues
are
in m
illio
n ga
llons
per
day
; per
cent
ages
(%) a
re o
f tot
al re
char
ge. >
, gre
ater
than
; <, l
ess
than
.
22 Assessment of Groundwater Availability in the Northern Atlantic Coastal Plain Aquifer System
The inflows in the conceptualization of the hydrologic budget of Masterson and others (2013b) for the postdevelop-ment condition are balanced by streamflow, groundwater discharge to the coast, and groundwater removed by pumping (fig. 11B). The streamflows were totaled by period of record by hydrologic basin using NHDPlus geospatial data on surface-water hydrology (Dewald and others, 2010). The groundwater withdrawals were based on estimates of reported pumping for conditions in 2005. The discharge to coastal waters was calculated as a residual to balance the total inflows with outflows. For the conceptual hydrologic budget of Masterson and others (2013b), the distribution of the outflows indicates that streamflow accounts for about 59 percent of the outflow and groundwater withdrawals represent about 8 percent of the outflow; the remaining 33 percent was assumed to be groundwater discharge to the coast (fig. 11B).
The hydrologic budget developed for postdevelopment conditions for this report had 93 percent of the total outflow allocated to surface receiving waters, with 70 percent divided evenly between streamflow and shallow coastal discharge and the remaining 23 percent of the total outflow discharging to tidal waters (fig. 11B). The remaining 7 percent of the total outflow includes withdrawals from the surficial and confined aquifers of the groundwater system.
The main difference between the postdevelopment conceptual hydrologic budget of Masterson and others (2013b) and the hydrologic budget calculated with the numerical model in this report is the refinement of the discharge to surface receiving waters. The conceptual hydrologic budget (Masterson and others, 2013b) calculated streamflow from the NHDPlus attribute data (Dewald and others, 2010) and assumed the remainder of the inflow was balanced by coastal discharge without considering discharge to tidal parts of rivers; all nonstreamflow was assumed to be coastal discharge (fig. 11A). Therefore, the largest difference in the hydrologic budget components is the discharge to the streams that cannot be accounted for by discharge to tidal waters.
Average streamflow for postdevelopment conditions totaled 11,900 Mgal/d in the conceptual hydrologic budget (Masterson and others, 2013b); whereas the groundwater discharge to streams calculated with the numerical model (this report) totaled 6,370 Mgal/d. This difference can be explained by the fact that the NHDPlus data provided average streamflows, not average base flows. When the base flow correction of 59 percent determined as part of this inves-tigation (Masterson and others, 2016), which is consistent with base flow analyses published for other aquifers in the Coastal Plain physiographic province (Priest, 2004; Sanford and others, 2012), was applied to the NHDPlus estimates, the base flow estimate of 7,020 Mgal/d is more in line with the 6,370 Mgal/d calculated for this report. Reducing the streamflow estimate in the conceptual hydrologic budget from 11,900 Mgal/d to 7,020 Mgal/d then would require more discharge to the coastal waters outflow component or the addition of a tidal waters component of 4,880 Mgal/d.
Hydrologic Budget
Hydrologic budgets account for the inputs to, outputs from, and changes in the amount of water in the various components of the water cycle and provide the hydrologic foundation for analysis of water availability. Basic compo-nents of water budgets are precipitation, evapotranspiration, surface-water and groundwater flow into and out of an aquifer system, change in surface-water and groundwater storage, and human withdrawals and interbasin transfers. Knowing where, when, and how much water is flowing into or out of a hydro-logic budget can illuminate how much is left for other uses (water availability) and reveal where stresses to the hydrologic budget exist or are developing (Alley and others, 2013). Hydrologic budget analyses are necessary to understanding the sources of water to a groundwater system and how water withdrawals change the components of the hydrologic cycle (Reilly and others, 2008).
The changes to the hydrologic budget for the entire NACP aquifer system and to six subregions (geographic areas) within the NACP aquifer system (fig. 12) were calculated using the numerical model to simulate changes in pumping and recharge conditions from 1900 to 2013 and projected to 2058. Analyses of hydrologic budgets in this report are presented both as total changes over time and as the changes over time in hydrologic budget components as a function of pumping.
Changes in Hydrologic Budgets Over TimeThe initiation of large-scale groundwater withdrawals in
the NACP aquifer system in the early 1900s resulted in shifts in the hydrologic budget components to balance the effects of this new stress on the system. When groundwater is removed, the aquifer system adjusts accordingly. This adjustment can consist of reductions in discharge to surface receiving waters (streams, tidal waters, and coastal waters), reductions in aquifer storage, induced infiltration from surface waters, and in some areas, the addition of a new source of water from the return of wastewater from septic systems.
Groundwater withdrawal in the NACP aquifer system increased substantially from 1900 to 2013, with the largest increases in pumping occurring during the post-World War II era from the mid-1940s to the early 1980s (fig. 13). Although pumping rates have been relatively constant from 1986 to 2013, about half the total volume of water removed from the aquifer system (13.4 trillion gallons [Tgal] of 27 Tgal) since large-scale groundwater withdrawals began around 1900, was removed in just the past 28 years. Therefore, the long-term hydrologic effects of the large removal of groundwater from the NACP aquifer system during a rela-tively short time span (28 years) may not have yet occurred, particularly with respect to decreases in groundwater discharge to streams and coastal receiving waters and in areas of suspected compaction of confining units and the resulting land subsidence.
Simulation of the Hydrologic System 23
masterson_nacp_fig 12
100 KILOMETERS0
0 50
50
100 MILES
North Carolina
Study area
Geographic region
MarylandVirginia
Delmarva
New York
New Jersey
EXPLANATIONC
hesapeake Bay
Delaware Bay
Long Island SoundCTNEW
YORK
NEWJERSEY
PENNSYLVANIA
MARYLAND
DC
DELAW
AR
EVIRGINIA
NORTH CAROLINA
ATLANTI
C OCEAN
Pamlico Sound
Albemarle Sound
Base from U.S. Geological Survey 1:2,000,000-scale digital dataAlbers Equal-Area Conic projectionStandard parallels 34°30' N and 41°30' NCentral meridian 75°30' W North American Datum of 1983
WV
72°75°78°
39°
36°
Figure 12. Geographic areas delineated for hydrologic budget computations within the Northern Atlantic Coastal Plain aquifer system.
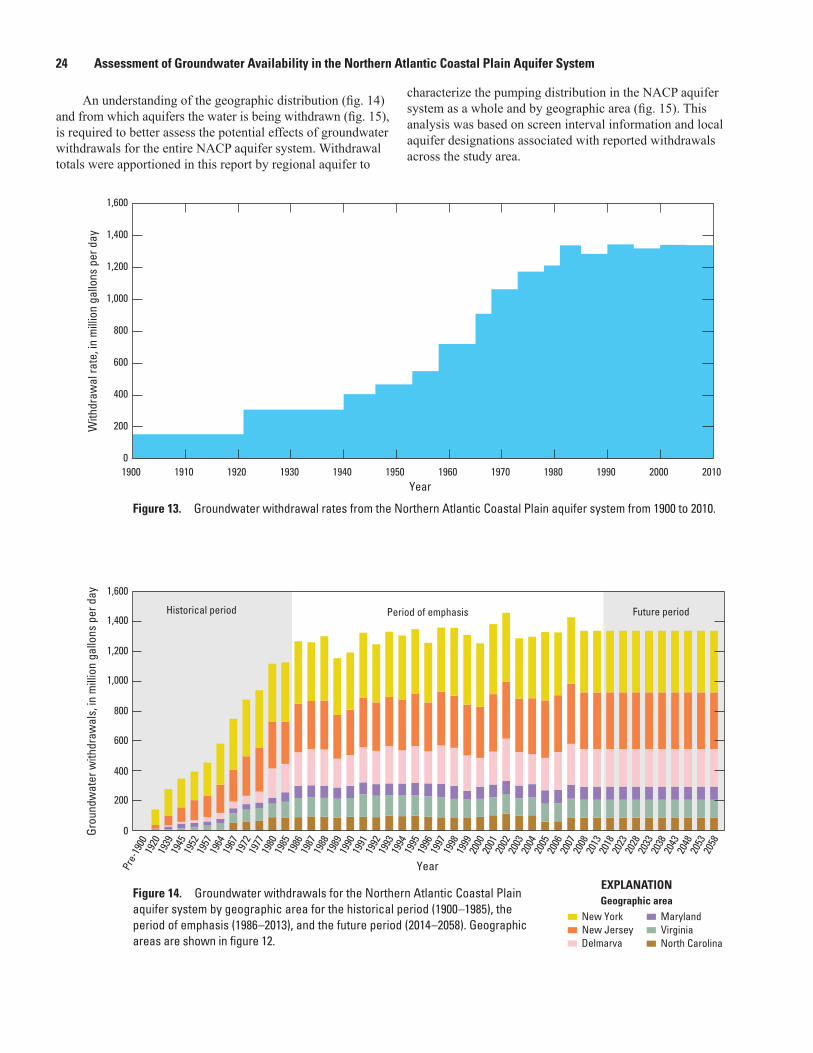
24 Assessment of Groundwater Availability in the Northern Atlantic Coastal Plain Aquifer System
An understanding of the geographic distribution (fig. 14) and from which aquifers the water is being withdrawn (fig. 15), is required to better assess the potential effects of groundwater withdrawals for the entire NACP aquifer system. Withdrawal totals were apportioned in this report by regional aquifer to
characterize the pumping distribution in the NACP aquifer system as a whole and by geographic area (fig. 15). This analysis was based on screen interval information and local aquifer designations associated with reported withdrawals across the study area.
Figure 14. Groundwater withdrawals for the Northern Atlantic Coastal Plain aquifer system by geographic area for the historical period (1900 –1985), the period of emphasis (1986 –2013), and the future period (2014 –2058). Geographic areas are shown in figure 12.
masterson_nacp_fig 13
0
200
400
600
800
1,000
1,200
1,400
1,600
With
draw
al ra
te, i
n m
illio
n ga
llons
per
day
1900 1910 1920 1930 1940 1950 1960 1970 1980 1990 2000 2010Year
masterson_nacp_fig14
Period of emphasisHistorical period Future period
2058
2053
2048
2043
2038
2033
2028
2023
2018
2013
2008
2007
2006
2005
2004
2003
2002
2001
2000
1999
1998
1997
1996
1995
1994
1993
1992
1991
1990
1989
1988
1987
1986
1985
1980
1977
1972
1967
1964
1957
1952
1945
1939
1920
Pre-
1900
Year
Grou
ndw
ater
with
draw
als,
in m
illio
n ga
llons
per
day
1,400
1,200
1,000
800
600
400
200
0
1,600
North Carolina
MarylandVirginia
Delmarva
New YorkNew Jersey
EXPLANATIONGeographic area
Figure 13. Groundwater withdrawal rates from the Northern Atlantic Coastal Plain aquifer system from 1900 to 2010.
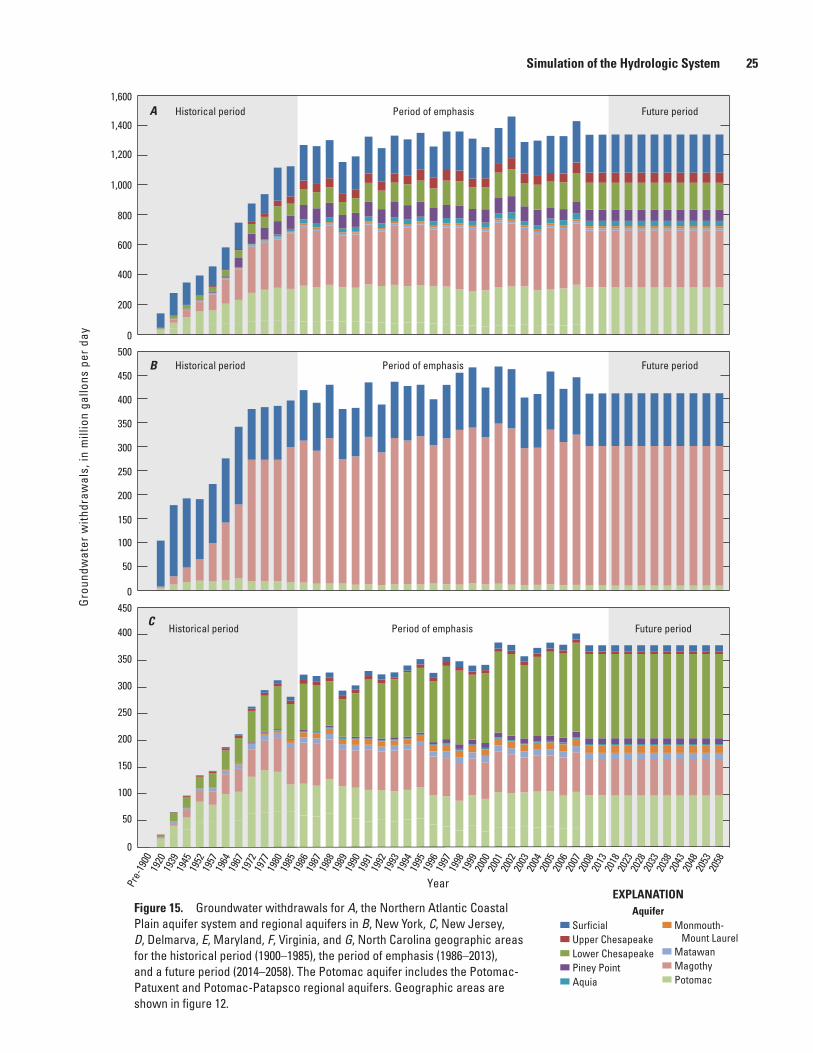
Simulation of the Hydrologic System 25
Figure 15. Groundwater withdrawals for A, the Northern Atlantic Coastal Plain aquifer system and regional aquifers in B, New York, C, New Jersey, D, Delmarva, E, Maryland, F, Virginia, and G, North Carolina geographic areas for the historical period (1900–1985), the period of emphasis (1986–2013), and a future period (2014–2058). The Potomac aquifer includes the Potomac-Patuxent and Potomac-Patapsco regional aquifers. Geographic areas are shown in figure 12.
masterson_nacp_fig15ab
Historical period Future period
Historical period Future period
Period of emphasisHistorical period Future period
1,400
1,200
1,000
800
600
400
200
0
1,600
200
150
100
50
0
500
450
400
350
300
250
200
150
100
50
0
400
350
300
250
450Gro
undw
ater
with
draw
als,
in m
illio
n ga
llons
per
day
2058
2053
2048
2043
2038
2033
2028
2023
2018
2013
2008
2007
2006
2005
2004
2003
2002
2001
2000
1999
1998
1997
1996
1995
1994
1993
1992
1991
1990
1989
1988
1987
1986
1985
1980
1977
1972
1967
1964
1957
1952
1945
1939
1920
Pre-
1900
Year
Period of emphasis
Period of emphasis
Monmouth- Mount LaurelMatawanMagothyPotomac
SurficialUpper ChesapeakeLower ChesapeakePiney PointAquia
EXPLANATION
A
B
Aquifer
C
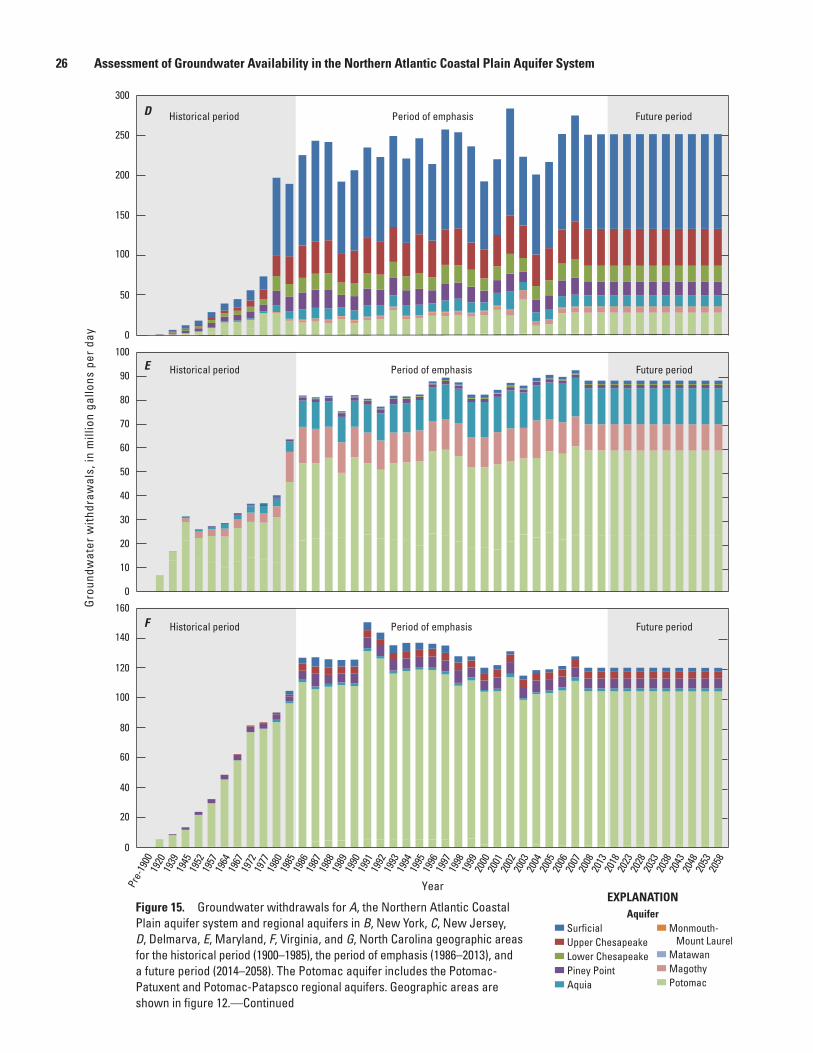
26 Assessment of Groundwater Availability in the Northern Atlantic Coastal Plain Aquifer System
Figure 15. Groundwater withdrawals for A, the Northern Atlantic Coastal Plain aquifer system and regional aquifers in B, New York, C, New Jersey, D, Delmarva, E, Maryland, F, Virginia, and G, North Carolina geographic areas for the historical period (1900–1985), the period of emphasis (1986–2013), and a future period (2014–2058). The Potomac aquifer includes the Potomac-Patuxent and Potomac-Patapsco regional aquifers. Geographic areas are shown in figure 12.—Continued
Period of emphasis
Period of emphasis
Historical period Future period
Historical period Future period
Period of emphasisHistorical period Future period
50
0
90
80
70
60
40
30
20
10
100
20
100
0
80
60
40
160
140
120
200
150
100
50
0
300
250
2058
2053
2048
2043
2038
2033
2028
2023
2018
2013
2008
2007
2006
2005
2004
2003
2002
2001
2000
1999
1998
1997
1996
1995
1994
1993
1992
1991
1990
1989
1988
1987
1986
1985
1980
1977
1972
1967
1964
1957
1952
1945
1939
1920
Pre-
1900
Year
Gro
undw
ater
with
draw
als,
in m
illio
n ga
llons
per
day
E
F
Monmouth- Mount LaurelMatawanMagothyPotomac
SurficialUpper ChesapeakeLower ChesapeakePiney PointAquia
EXPLANATIONAquifer
D
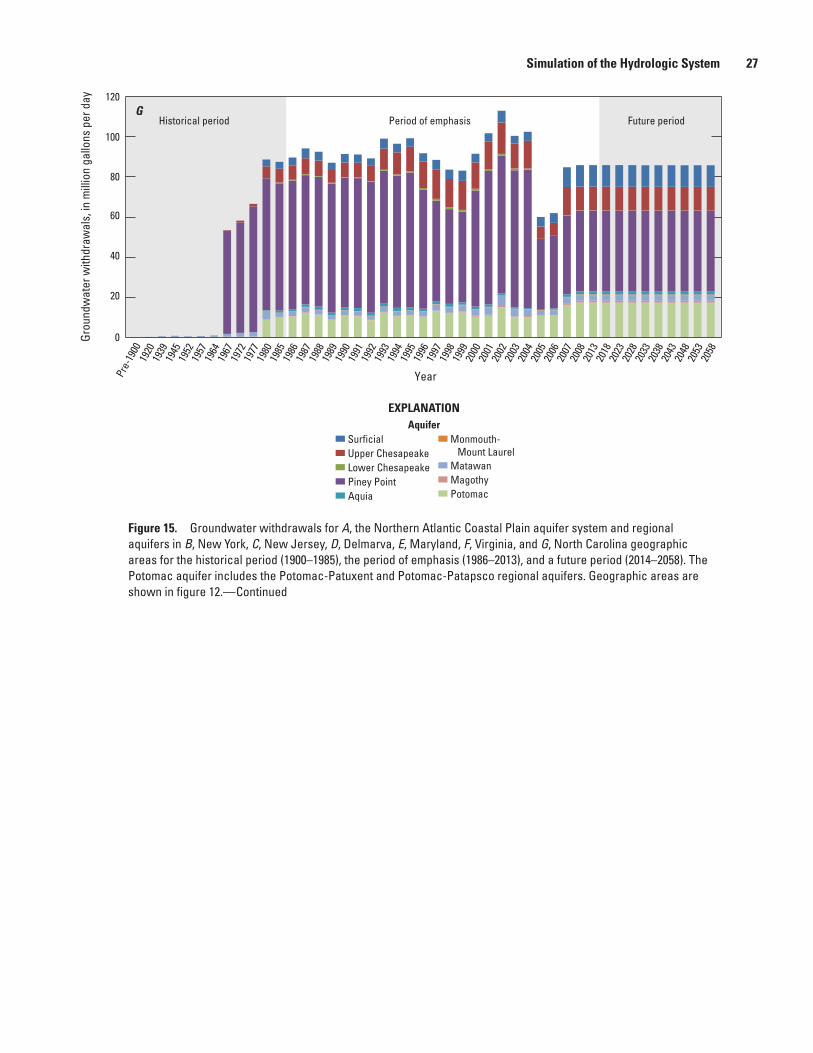
Simulation of the Hydrologic System 27
Period of emphasisHistorical period Future period
0
80
60
40
20
100
120
Year
Monmouth- Mount LaurelMatawanMagothyPotomac
SurficialUpper ChesapeakeLower ChesapeakePiney PointAquia
EXPLANATIONAquifer
2058
2053
2048
2043
2038
2033
2028
2023
2018
2013
2008
2007
2006
2005
2004
2003
2002
2001
2000
1999
1998
1997
1996
1995
1994
1993
1992
1991
1990
1989
1988
1987
1986
1985
1980
1977
1972
1967
1964
1957
1952
1945
1939
1920
Pre-
1900
G
Grou
ndw
ater
with
draw
als,
in m
illio
n ga
llons
per
day
Figure 15. Groundwater withdrawals for A, the Northern Atlantic Coastal Plain aquifer system and regional aquifers in B, New York, C, New Jersey, D, Delmarva, E, Maryland, F, Virginia, and G, North Carolina geographic areas for the historical period (1900–1985), the period of emphasis (1986–2013), and a future period (2014–2058). The Potomac aquifer includes the Potomac-Patuxent and Potomac-Patapsco regional aquifers. Geographic areas are shown in figure 12.— Continued
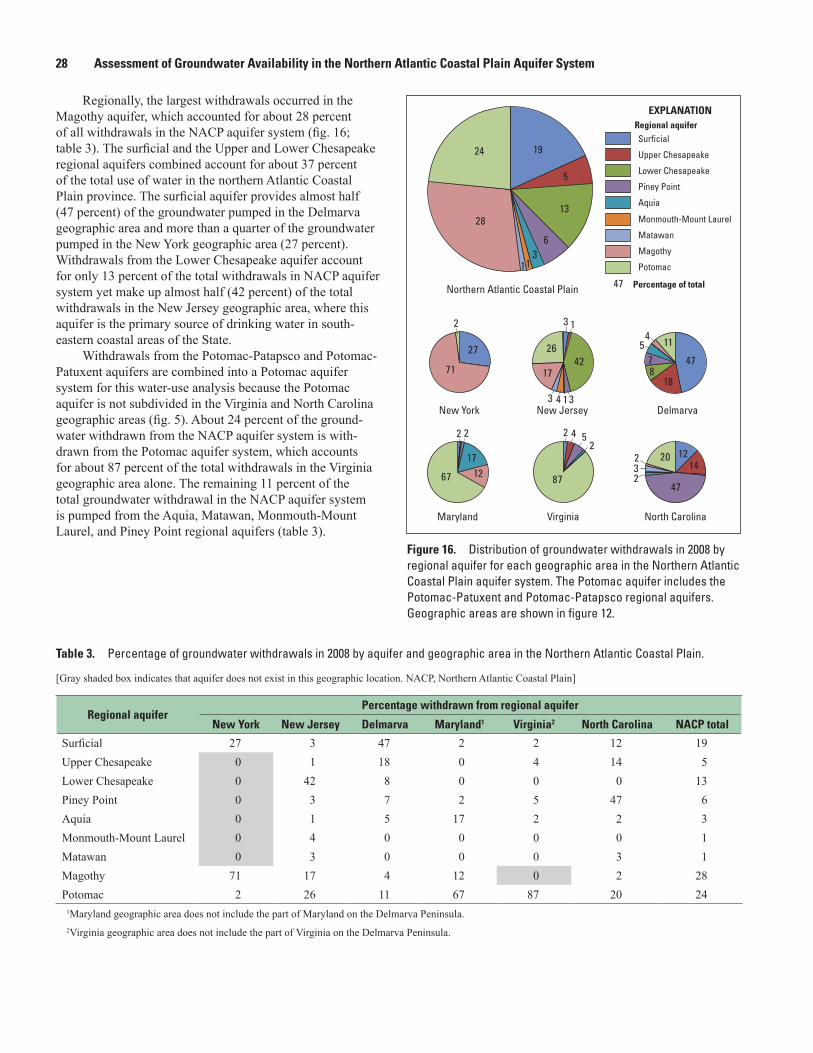
28 Assessment of Groundwater Availability in the Northern Atlantic Coastal Plain Aquifer System
Regionally, the largest withdrawals occurred in the Magothy aquifer, which accounted for about 28 percent of all withdrawals in the NACP aquifer system (fig. 16; table 3). The surficial and the Upper and Lower Chesapeake regional aquifers combined account for about 37 percent of the total use of water in the northern Atlantic Coastal Plain province. The surficial aquifer provides almost half (47 percent) of the groundwater pumped in the Delmarva geographic area and more than a quarter of the groundwater pumped in the New York geographic area (27 percent). Withdrawals from the Lower Chesapeake aquifer account for only 13 percent of the total withdrawals in NACP aquifer system yet make up almost half (42 percent) of the total withdrawals in the New Jersey geographic area, where this aquifer is the primary source of drinking water in south-eastern coastal areas of the State.
Withdrawals from the Potomac-Patapsco and Potomac-Patuxent aquifers are combined into a Potomac aquifer system for this water-use analysis because the Potomac aquifer is not subdivided in the Virginia and North Carolina geographic areas (fig. 5). About 24 percent of the ground-water withdrawn from the NACP aquifer system is with-drawn from the Potomac aquifer system, which accounts for about 87 percent of the total withdrawals in the Virginia geographic area alone. The remaining 11 percent of the total groundwater withdrawal in the NACP aquifer system is pumped from the Aquia, Matawan, Monmouth-Mount Laurel, and Piney Point regional aquifers (table 3).
Table 3. Percentage of groundwater withdrawals in 2008 by aquifer and geographic area in the Northern Atlantic Coastal Plain.
[Gray shaded box indicates that aquifer does not exist in this geographic location. NACP, Northern Atlantic Coastal Plain]
Regional aquiferPercentage withdrawn from regional aquifer
New York New Jersey Delmarva Maryland1 Virginia2 North Carolina NACP total
Surficial 27 3 47 2 2 12 19Upper Chesapeake 0 1 18 0 4 14 5Lower Chesapeake 0 42 8 0 0 0 13Piney Point 0 3 7 2 5 47 6Aquia 0 1 5 17 2 2 3Monmouth-Mount Laurel 0 4 0 0 0 0 1Matawan 0 3 0 0 0 3 1Magothy 71 17 4 12 0 2 28Potomac 2 26 11 67 87 20 24
1Maryland geographic area does not include the part of Maryland on the Delmarva Peninsula.2Virginia geographic area does not include the part of Virginia on the Delmarva Peninsula.
EXPLANATIONRegional aquifer
Percentage of totalNorthern Atlantic Coastal Plain
New JerseyNew York Delmarva
Maryland Virginia North Carolina
47
47
1420 12
232
2
87
52 4
171267
2 2
11
18
4787
54
1742
343
26
3 1
1
71
27
2
13
24
28
19
5
63
11
masterson_nacp_fig16_new
Surficial
Upper Chesapeake
Lower Chesapeake
Piney Point
Aquia
Monmouth-Mount Laurel
Matawan
Magothy
Potomac
Figure 16. Distribution of groundwater withdrawals in 2008 by regional aquifer for each geographic area in the Northern Atlantic Coastal Plain aquifer system. The Potomac aquifer includes the Potomac-Patuxent and Potomac-Patapsco regional aquifers. Geographic areas are shown in figure 12.
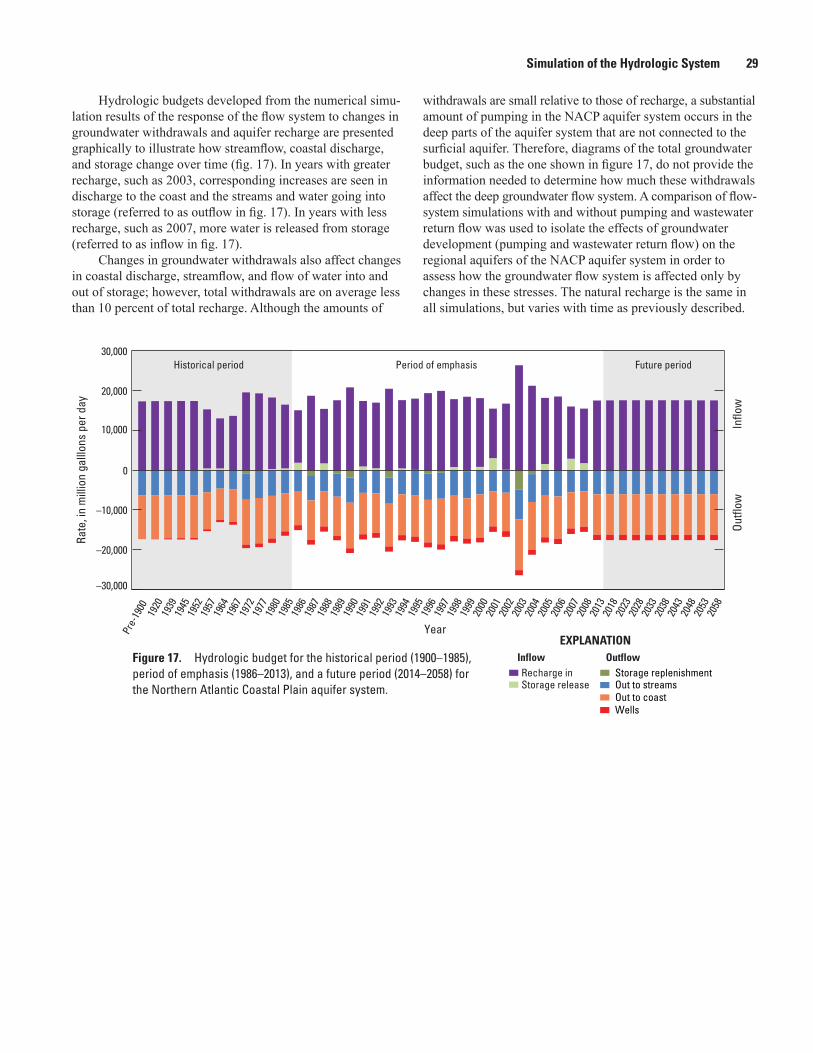
Simulation of the Hydrologic System 29
Hydrologic budgets developed from the numerical simu-lation results of the response of the flow system to changes in groundwater withdrawals and aquifer recharge are presented graphically to illustrate how streamflow, coastal discharge, and storage change over time (fig. 17). In years with greater recharge, such as 2003, corresponding increases are seen in discharge to the coast and the streams and water going into storage (referred to as outflow in fig. 17). In years with less recharge, such as 2007, more water is released from storage (referred to as inflow in fig. 17).
Changes in groundwater withdrawals also affect changes in coastal discharge, streamflow, and flow of water into and out of storage; however, total withdrawals are on average less than 10 percent of total recharge. Although the amounts of
withdrawals are small relative to those of recharge, a substantial amount of pumping in the NACP aquifer system occurs in the deep parts of the aquifer system that are not connected to the surficial aquifer. Therefore, diagrams of the total groundwater budget, such as the one shown in figure 17, do not provide the information needed to determine how much these withdrawals affect the deep groundwater flow system. A comparison of flow-system simulations with and without pumping and wastewater return flow was used to isolate the effects of groundwater development (pumping and wastewater return flow) on the regional aquifers of the NACP aquifer system in order to assess how the groundwater flow system is affected only by changes in these stresses. The natural recharge is the same in all simulations, but varies with time as previously described.
2058
2053
2048
2043
2038
2033
2028
2023
2018
2013
2008
2007
2006
2005
2004
2003
2002
2001
2000
1999
1998
1997
1996
1995
1994
1993
1992
1991
1990
1989
1988
1987
1986
1985
1980
1977
1972
1967
1964
1957
1952
1945
1939
1920
Pre-
1900
Year
–30,000
–20,000
–10,000
0
10,000
20,000
30,000
Rate
, in
mill
ion
galll
ons
per d
ay
Inflo
wOu
tflow
Recharge inInflow Outflow
Storage release
WellsOut to coastOut to streamsStorage replenishment
EXPLANATION
pp_masterson_nacp_fig17_new
Period of emphasisHistorical period Future period
Figure 17. Hydrologic budget for the historical period (1900–1985), period of emphasis (1986–2013), and a future period (2014–2058) for the Northern Atlantic Coastal Plain aquifer system.
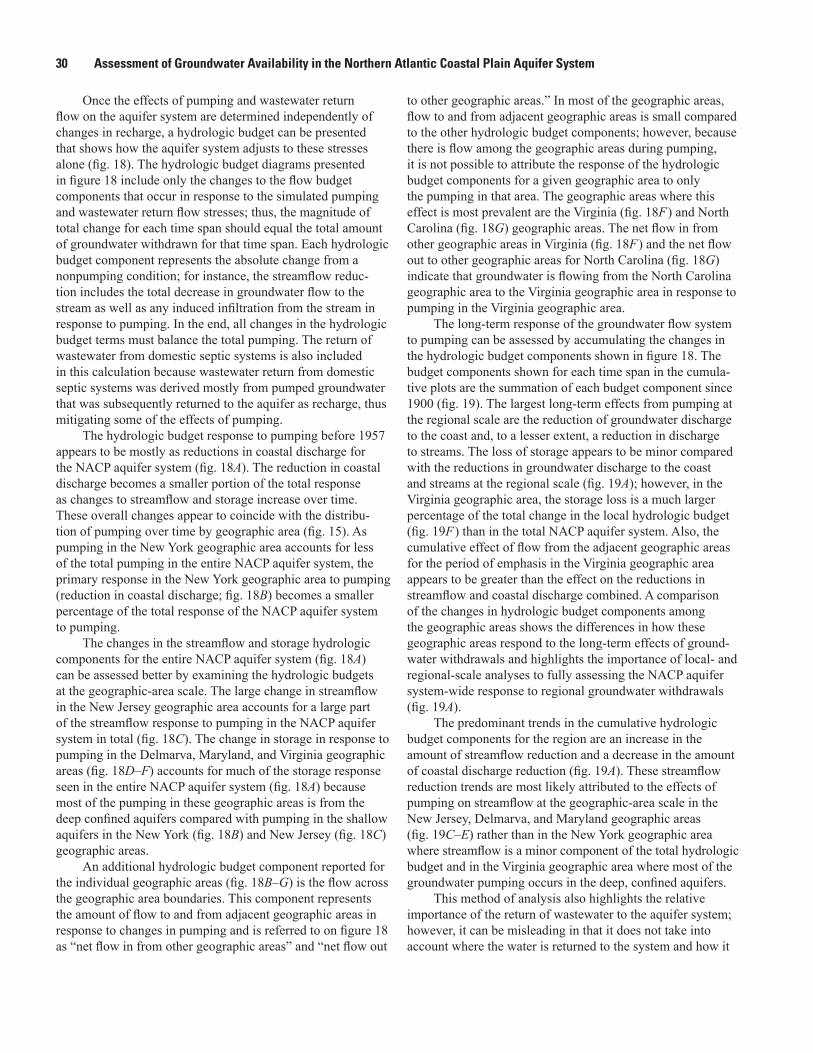
30 Assessment of Groundwater Availability in the Northern Atlantic Coastal Plain Aquifer System
Once the effects of pumping and wastewater return flow on the aquifer system are determined independently of changes in recharge, a hydrologic budget can be presented that shows how the aquifer system adjusts to these stresses alone (fig. 18). The hydrologic budget diagrams presented in figure 18 include only the changes to the flow budget components that occur in response to the simulated pumping and wastewater return flow stresses; thus, the magnitude of total change for each time span should equal the total amount of groundwater withdrawn for that time span. Each hydrologic budget component represents the absolute change from a nonpumping condition; for instance, the streamflow reduc-tion includes the total decrease in groundwater flow to the stream as well as any induced infiltration from the stream in response to pumping. In the end, all changes in the hydrologic budget terms must balance the total pumping. The return of wastewater from domestic septic systems is also included in this calculation because wastewater return from domestic septic systems was derived mostly from pumped groundwater that was subsequently returned to the aquifer as recharge, thus mitigating some of the effects of pumping.
The hydrologic budget response to pumping before 1957 appears to be mostly as reductions in coastal discharge for the NACP aquifer system (fig. 18A). The reduction in coastal discharge becomes a smaller portion of the total response as changes to streamflow and storage increase over time. These overall changes appear to coincide with the distribu-tion of pumping over time by geographic area (fig. 15). As pumping in the New York geographic area accounts for less of the total pumping in the entire NACP aquifer system, the primary response in the New York geographic area to pumping (reduction in coastal discharge; fig. 18B) becomes a smaller percentage of the total response of the NACP aquifer system to pumping.
The changes in the streamflow and storage hydrologic components for the entire NACP aquifer system (fig. 18A) can be assessed better by examining the hydrologic budgets at the geographic-area scale. The large change in streamflow in the New Jersey geographic area accounts for a large part of the streamflow response to pumping in the NACP aquifer system in total (fig. 18C). The change in storage in response to pumping in the Delmarva, Maryland, and Virginia geographic areas (fig. 18D–F) accounts for much of the storage response seen in the entire NACP aquifer system (fig. 18A) because most of the pumping in these geographic areas is from the deep confined aquifers compared with pumping in the shallow aquifers in the New York (fig. 18B) and New Jersey (fig. 18C) geographic areas.
An additional hydrologic budget component reported for the individual geographic areas (fig. 18B–G) is the flow across the geographic area boundaries. This component represents the amount of flow to and from adjacent geographic areas in response to changes in pumping and is referred to on figure 18 as “net flow in from other geographic areas” and “net flow out
to other geographic areas.” In most of the geographic areas, flow to and from adjacent geographic areas is small compared to the other hydrologic budget components; however, because there is flow among the geographic areas during pumping, it is not possible to attribute the response of the hydrologic budget components for a given geographic area to only the pumping in that area. The geographic areas where this effect is most prevalent are the Virginia (fig. 18F ) and North Carolina (fig. 18G) geographic areas. The net flow in from other geographic areas in Virginia (fig. 18F ) and the net flow out to other geographic areas for North Carolina (fig. 18G) indicate that groundwater is flowing from the North Carolina geographic area to the Virginia geographic area in response to pumping in the Virginia geographic area.
The long-term response of the groundwater flow system to pumping can be assessed by accumulating the changes in the hydrologic budget components shown in figure 18. The budget components shown for each time span in the cumula-tive plots are the summation of each budget component since 1900 (fig. 19). The largest long-term effects from pumping at the regional scale are the reduction of groundwater discharge to the coast and, to a lesser extent, a reduction in discharge to streams. The loss of storage appears to be minor compared with the reductions in groundwater discharge to the coast and streams at the regional scale (fig. 19A); however, in the Virginia geographic area, the storage loss is a much larger percentage of the total change in the local hydrologic budget (fig. 19F ) than in the total NACP aquifer system. Also, the cumulative effect of flow from the adjacent geographic areas for the period of emphasis in the Virginia geographic area appears to be greater than the effect on the reductions in streamflow and coastal discharge combined. A comparison of the changes in hydrologic budget components among the geographic areas shows the differences in how these geographic areas respond to the long-term effects of ground-water withdrawals and highlights the importance of local- and regional-scale analyses to fully assessing the NACP aquifer system-wide response to regional groundwater withdrawals (fig. 19A).
The predominant trends in the cumulative hydrologic budget components for the region are an increase in the amount of streamflow reduction and a decrease in the amount of coastal discharge reduction (fig. 19A). These streamflow reduction trends are most likely attributed to the effects of pumping on streamflow at the geographic-area scale in the New Jersey, Delmarva, and Maryland geographic areas (fig. 19C–E) rather than in the New York geographic area where streamflow is a minor component of the total hydrologic budget and in the Virginia geographic area where most of the groundwater pumping occurs in the deep, confined aquifers.
This method of analysis also highlights the relative importance of the return of wastewater to the aquifer system; however, it can be misleading in that it does not take into account where the water is returned to the system and how it
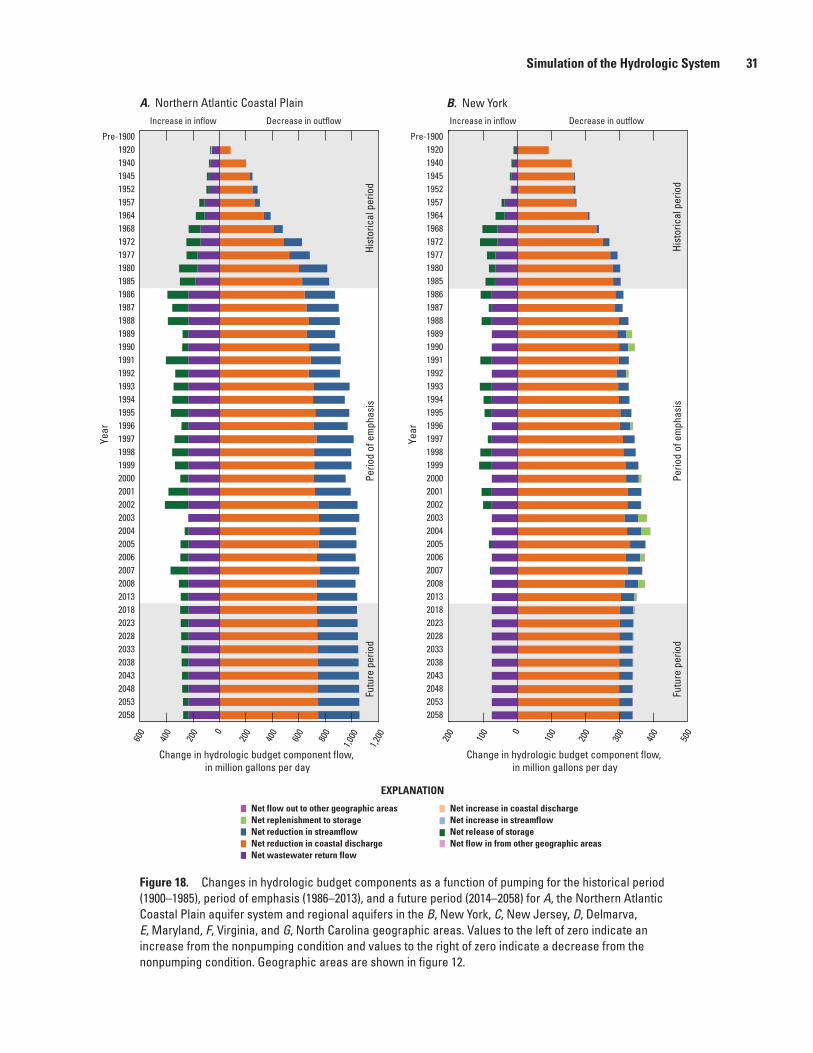
Simulation of the Hydrologic System 31
Perio
d of
em
phas
isHi
stor
ical
per
iod
Futu
re p
erio
d
Perio
d of
em
phas
isHi
stor
ical
per
iod
Futu
re p
erio
d
Change in hydrologic budget component flow, in million gallons per day
Decrease in outflowIncrease in inflow Decrease in outflowIncrease in inflow
Change in hydrologic budget component flow, in million gallons per day
A. Northern Atlantic Coastal Plain B. New York
EXPLANATION
Net flow in from other geographic areas
Net flow out to other geographic areasNet replenishment to storage
Net release of storageNet reduction in streamflowNet increase in streamflow
Net reduction in coastal discharge
Net increase in coastal discharge
Net wastewater return flow
Pre-190019201940194519521957196419681972197719801985198619871988198919901991199219931994199519961997199819992000200120022003200420052006200720082013201820232028203320382043204820532058
Year
Pre-190019201940194519521957196419681972197719801985198619871988198919901991199219931994199519961997199819992000200120022003200420052006200720082013201820232028203320382043204820532058
Year
600
400
200 0
200
400
600
800
1,000
1,200 200
100 0
100
200
300
400
500
pp_masterson_nacp_fig18ab
Figure 18. Changes in hydrologic budget components as a function of pumping for the historical period (1900–1985), period of emphasis (1986–2013), and a future period (2014–2058) for A, the Northern Atlantic Coastal Plain aquifer system and regional aquifers in the B, New York, C, New Jersey, D, Delmarva, E, Maryland, F, Virginia, and G, North Carolina geographic areas. Values to the left of zero indicate an increase from the nonpumping condition and values to the right of zero indicate a decrease from the nonpumping condition. Geographic areas are shown in figure 12.
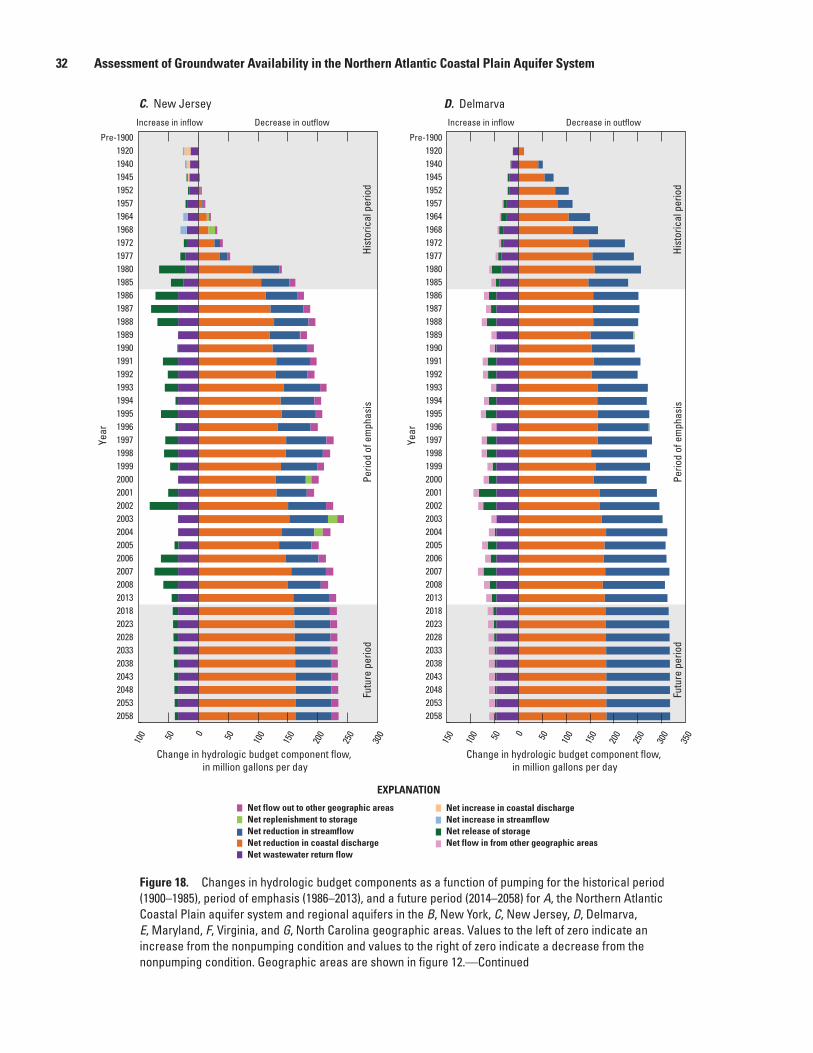
32 Assessment of Groundwater Availability in the Northern Atlantic Coastal Plain Aquifer System
Perio
d of
em
phas
isHi
stor
ical
per
iod
Futu
re p
erio
d
Perio
d of
em
phas
isHi
stor
ical
per
iod
Futu
re p
erio
d
Change in hydrologic budget component flow, in million gallons per day
Change in hydrologic budget component flow, in million gallons per day
C. New Jersey D. Delmarva
EXPLANATION
Net flow in from other geographic areas
Net flow out to other geographic areasNet replenishment to storage
Net release of storageNet reduction in streamflowNet increase in streamflow
Net reduction in coastal discharge
Net increase in coastal discharge
Net wastewater return flow
150
100 50 0 50 100
150
200
250
300
350
Pre-190019201940194519521957196419681972197719801985198619871988198919901991199219931994199519961997199819992000200120022003200420052006200720082013201820232028203320382043204820532058
Year
Pre-190019201940194519521957196419681972197719801985198619871988198919901991199219931994199519961997199819992000200120022003200420052006200720082013201820232028203320382043204820532058
Year
100 50 0 50 100
150
200
250
300
pp_masterson_nacp_fig18cd_new
Decrease in outflowIncrease in inflow Decrease in outflowIncrease in inflow
Figure 18. Changes in hydrologic budget components as a function of pumping for the historical period (1900–1985), period of emphasis (1986–2013), and a future period (2014–2058) for A, the Northern Atlantic Coastal Plain aquifer system and regional aquifers in the B, New York, C, New Jersey, D, Delmarva, E, Maryland, F, Virginia, and G, North Carolina geographic areas. Values to the left of zero indicate an increase from the nonpumping condition and values to the right of zero indicate a decrease from the nonpumping condition. Geographic areas are shown in figure 12.—Continued
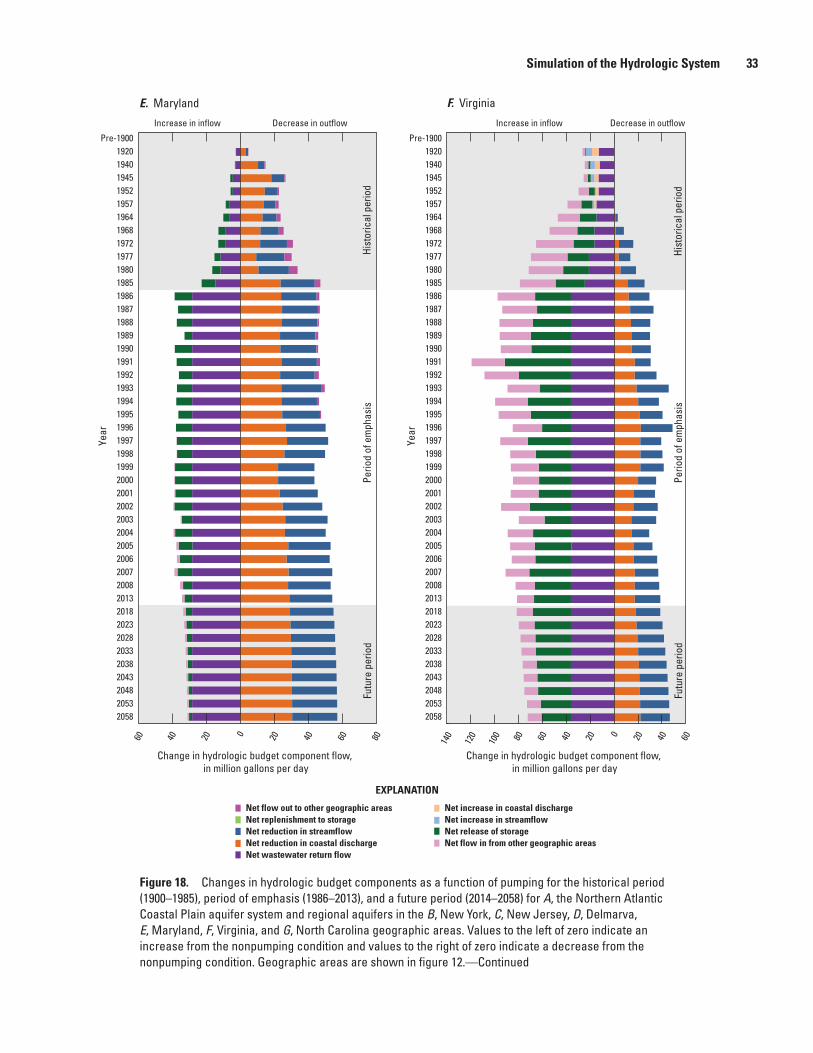
Simulation of the Hydrologic System 33
Perio
d of
em
phas
isHi
stor
ical
per
iod
Futu
re p
erio
d
Perio
d of
em
phas
isHi
stor
ical
per
iod
Futu
re p
erio
d
Change in hydrologic budget component flow, in million gallons per day
Change in hydrologic budget component flow, in million gallons per day
E. Maryland F. Virginia
EXPLANATION
Net flow in from other geographic areas
Net flow out to other geographic areasNet replenishment to storage
Net release of storageNet reduction in streamflowNet increase in streamflow
Net reduction in coastal discharge
Net increase in coastal discharge
Net wastewater return flow
Pre-190019201940194519521957196419681972197719801985198619871988198919901991199219931994199519961997199819992000200120022003200420052006200720082013201820232028203320382043204820532058
Year
Pre-190019201940194519521957196419681972197719801985198619871988198919901991199219931994199519961997199819992000200120022003200420052006200720082013201820232028203320382043204820532058
Year
60 40 20
0
20 40 60 80 140
120
100 80 60 40 20
0
20 40 60
pp_masterson_nacp_fig18ef
Decrease in outflowIncrease in inflow Decrease in outflowIncrease in inflow
Figure 18. Changes in hydrologic budget components as a function of pumping for the historical period (1900–1985), period of emphasis (1986–2013), and a future period (2014–2058) for A, the Northern Atlantic Coastal Plain aquifer system and regional aquifers in the B, New York, C, New Jersey, D, Delmarva, E, Maryland, F, Virginia, and G, North Carolina geographic areas. Values to the left of zero indicate an increase from the nonpumping condition and values to the right of zero indicate a decrease from the nonpumping condition. Geographic areas are shown in figure 12.—Continued
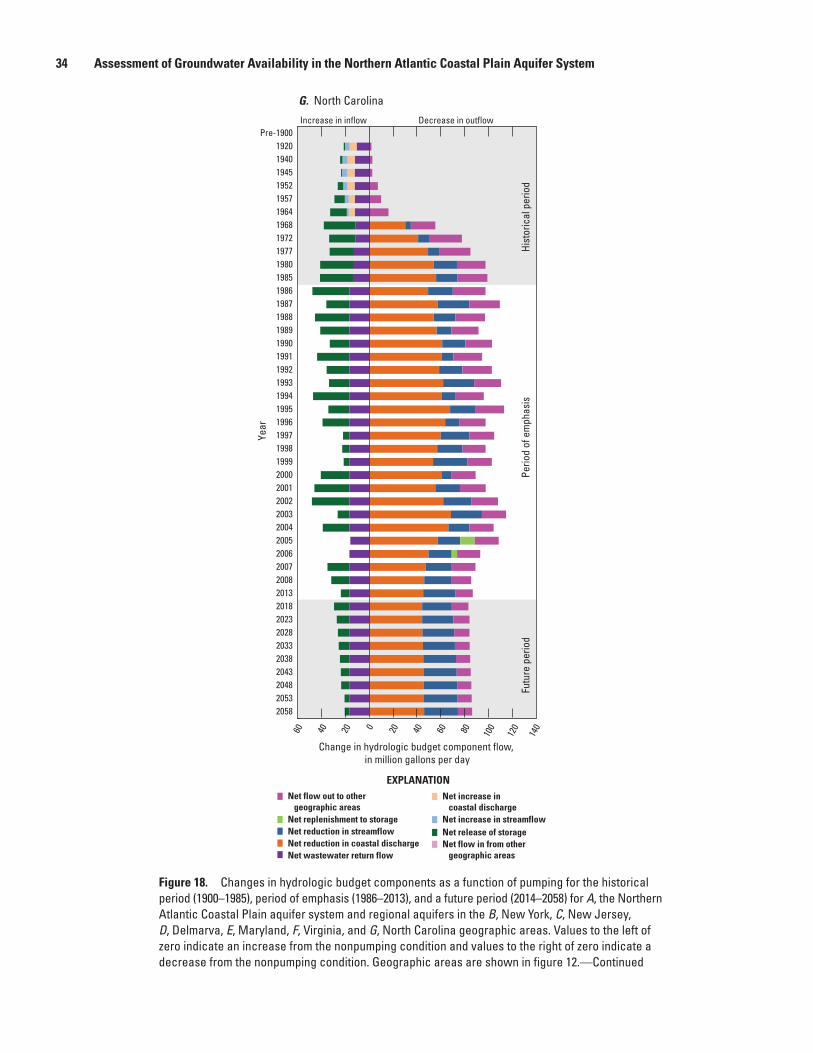
34 Assessment of Groundwater Availability in the Northern Atlantic Coastal Plain Aquifer System
Perio
d of
em
phas
isHi
stor
ical
per
iod
Futu
re p
erio
d
Change in hydrologic budget component flow, in million gallons per day
G. North Carolina
EXPLANATION
Net flow in from other geographic areas
Net flow out to other geographic areasNet replenishment to storage
Net release of storageNet reduction in streamflowNet increase in streamflow
Net reduction in coastal discharge
Net increase in coastal discharge
Net wastewater return flow
60 40 20 0 20 40 60 80 100
120
140
Pre-190019201940194519521957196419681972197719801985198619871988198919901991199219931994199519961997199819992000200120022003200420052006200720082013201820232028203320382043204820532058
Year
pp_masterson_nacp_fig18g_new
Decrease in outflowIncrease in inflow
Figure 18. Changes in hydrologic budget components as a function of pumping for the historical period (1900–1985), period of emphasis (1986–2013), and a future period (2014–2058) for A, the Northern Atlantic Coastal Plain aquifer system and regional aquifers in the B, New York, C, New Jersey, D, Delmarva, E, Maryland, F, Virginia, and G, North Carolina geographic areas. Values to the left of zero indicate an increase from the nonpumping condition and values to the right of zero indicate a decrease from the nonpumping condition. Geographic areas are shown in figure 12.—Continued
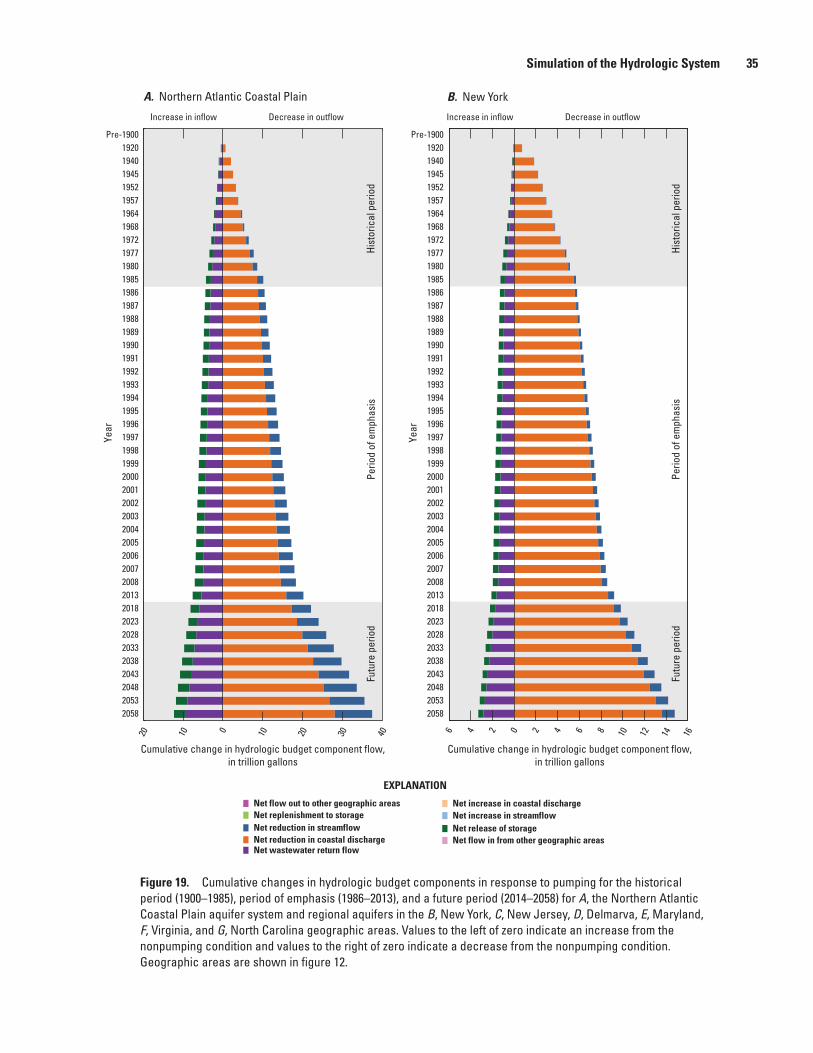
Simulation of the Hydrologic System 35
Perio
d of
em
phas
isHi
stor
ical
per
iod
Futu
re p
erio
d
Perio
d of
em
phas
isHi
stor
ical
per
iod
Futu
re p
erio
d
Cumulative change in hydrologic budget component flow,in trillion gallons
Cumulative change in hydrologic budget component flow,in trillion gallons
A. Northern Atlantic Coastal Plain B. New York
EXPLANATION
Net flow in from other geographic areas
Net flow out to other geographic areasNet replenishment to storage
Net release of storageNet reduction in streamflowNet increase in streamflow
Net reduction in coastal discharge
Net increase in coastal discharge
Net wastewater return flow
Pre-190019201940194519521957196419681972197719801985198619871988198919901991199219931994199519961997199819992000200120022003200420052006200720082013201820232028203320382043204820532058
Year
Pre-190019201940194519521957196419681972197719801985198619871988198919901991199219931994199519961997199819992000200120022003200420052006200720082013201820232028203320382043204820532058
Year
20 10 0 10 20 30 40 6 4 2 0 2 4 6 8 10 12 14 16
pp_masterson_nacp_fig19ab_new
Decrease in outflowIncrease in inflow Decrease in outflowIncrease in inflow
Figure 19. Cumulative changes in hydrologic budget components in response to pumping for the historical period (1900–1985), period of emphasis (1986–2013), and a future period (2014–2058) for A, the Northern Atlantic Coastal Plain aquifer system and regional aquifers in the B, New York, C, New Jersey, D, Delmarva, E, Maryland, F, Virginia, and G, North Carolina geographic areas. Values to the left of zero indicate an increase from the nonpumping condition and values to the right of zero indicate a decrease from the nonpumping condition. Geographic areas are shown in figure 12.
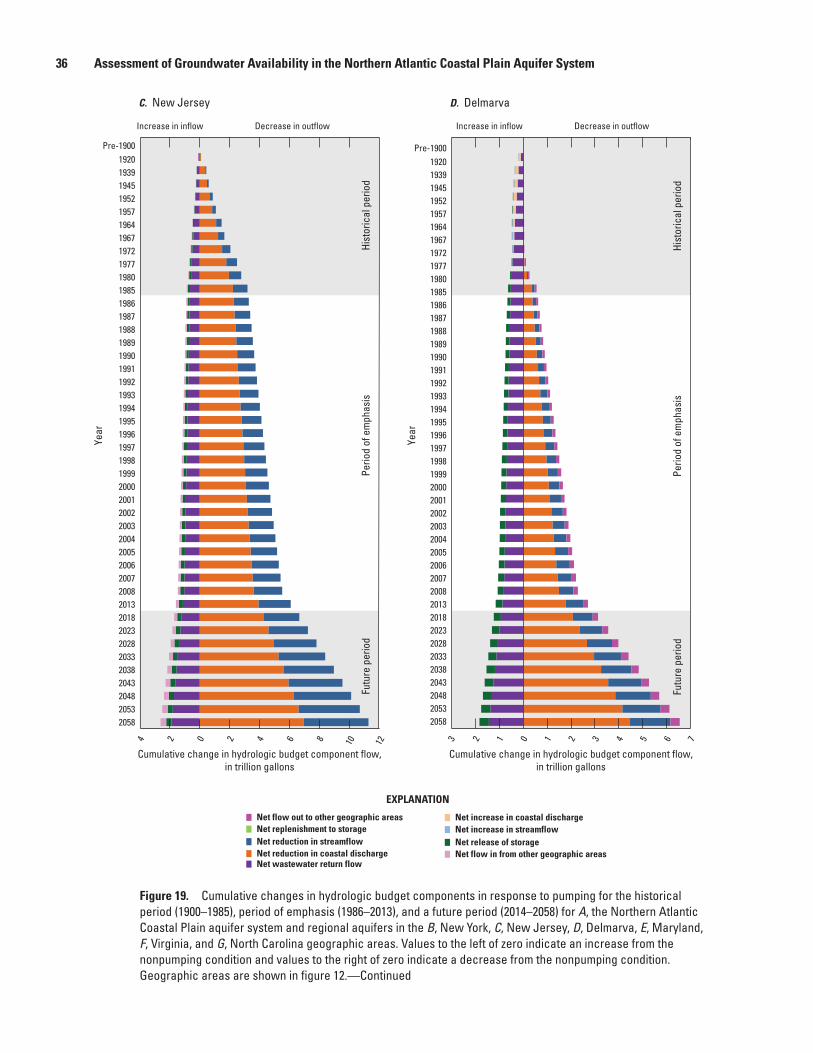
36 Assessment of Groundwater Availability in the Northern Atlantic Coastal Plain Aquifer System
pp_masterson_nacp_fig19cd_new
C. New Jersey
20582053204820432038203320282023201820132008200720062005200420032002200120001999199819971996199519941993199219911990198919881987198619851980197719721967196419571952194519391920
Pre-1900
D. Delmarva
20582053204820432038203320282023201820132008200720062005200420032002200120001999199819971996199519941993199219911990198919881987198619851980197719721967196419571952194519391920
Pre-1900
Year
Year
Perio
d of
em
phas
isHi
stor
ical
per
iod
Futu
re p
erio
d
Hist
oric
al p
erio
d Fu
ture
per
iod
Perio
d of
em
phas
is
EXPLANATION
Net flow in from other geographic areas
Net flow out to other geographic areasNet replenishment to storage
Net release of storageNet reduction in streamflowNet increase in streamflow
Net reduction in coastal discharge
Net increase in coastal discharge
Net wastewater return flow
4 2 0 2 4 6 8 10 12 2 1 0 1 2 33 4 5 6 7
Decrease in outflowIncrease in inflow Decrease in outflowIncrease in inflow
Cumulative change in hydrologic budget component flow,in trillion gallons
Cumulative change in hydrologic budget component flow,in trillion gallons
Figure 19. Cumulative changes in hydrologic budget components in response to pumping for the historical period (1900–1985), period of emphasis (1986–2013), and a future period (2014–2058) for A, the Northern Atlantic Coastal Plain aquifer system and regional aquifers in the B, New York, C, New Jersey, D, Delmarva, E, Maryland, F, Virginia, and G, North Carolina geographic areas. Values to the left of zero indicate an increase from the nonpumping condition and values to the right of zero indicate a decrease from the nonpumping condition. Geographic areas are shown in figure 12.—Continued
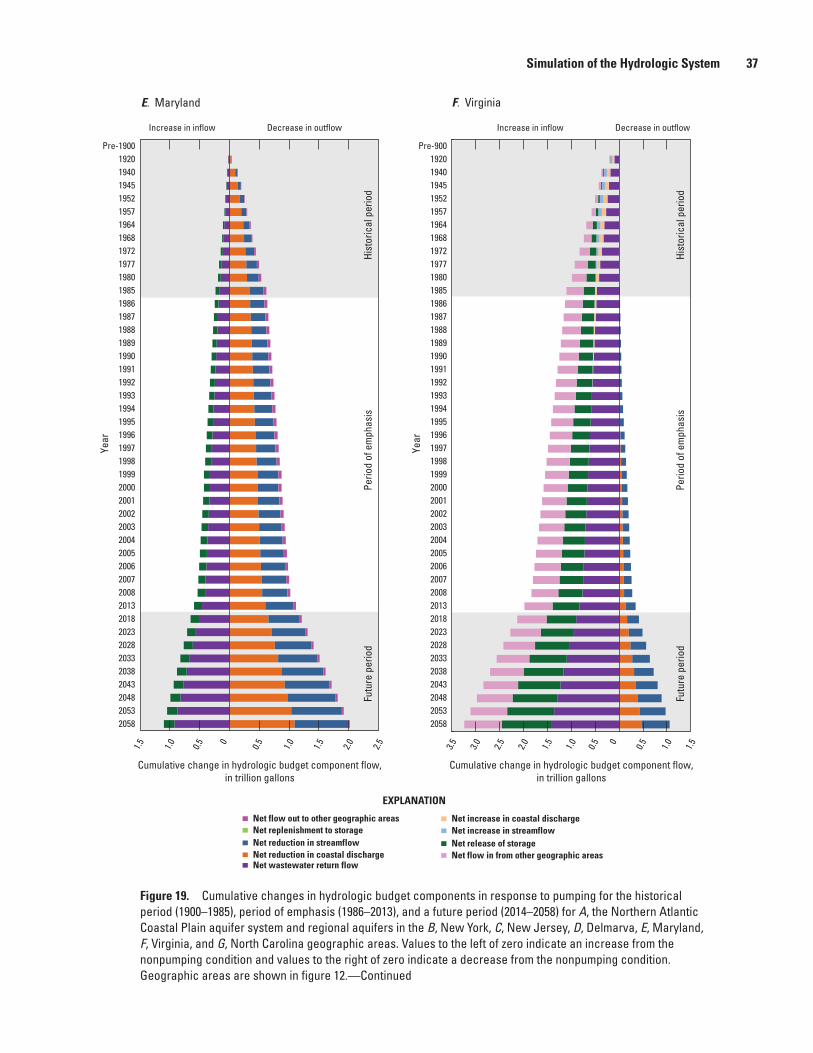
Simulation of the Hydrologic System 37
Perio
d of
em
phas
isHi
stor
ical
per
iod
Futu
re p
erio
d
Perio
d of
em
phas
isHi
stor
ical
per
iod
Futu
re p
erio
d
E. Maryland F. Virginia
EXPLANATION
Net flow in from other geographic areas
Net flow out to other geographic areasNet replenishment to storage
Net release of storageNet reduction in streamflowNet increase in streamflow
Net reduction in coastal discharge
Net increase in coastal discharge
Net wastewater return flow
Pre-190019201940194519521957196419681972197719801985198619871988198919901991199219931994199519961997199819992000200120022003200420052006200720082013201820232028203320382043204820532058
Year
Pre-90019201940194519521957196419681972197719801985198619871988198919901991199219931994199519961997199819992000200120022003200420052006200720082013201820232028203320382043204820532058
Year
1.5 1.0 0.5 0 0.5 1.0 1.5 2.0 2.5 3.5 3.0 2.5 2.0 1.5 1.0 0.5 0 0.5 1.0 1.5
pp_masterson_nacp_fig19ef_new
Decrease in outflowIncrease in inflow Decrease in outflowIncrease in inflow
Cumulative change in hydrologic budget component flow,in trillion gallons
Cumulative change in hydrologic budget component flow,in trillion gallons
Figure 19. Cumulative changes in hydrologic budget components in response to pumping for the historical period (1900–1985), period of emphasis (1986–2013), and a future period (2014–2058) for A, the Northern Atlantic Coastal Plain aquifer system and regional aquifers in the B, New York, C, New Jersey, D, Delmarva, E, Maryland, F, Virginia, and G, North Carolina geographic areas. Values to the left of zero indicate an increase from the nonpumping condition and values to the right of zero indicate a decrease from the nonpumping condition. Geographic areas are shown in figure 12.—Continued
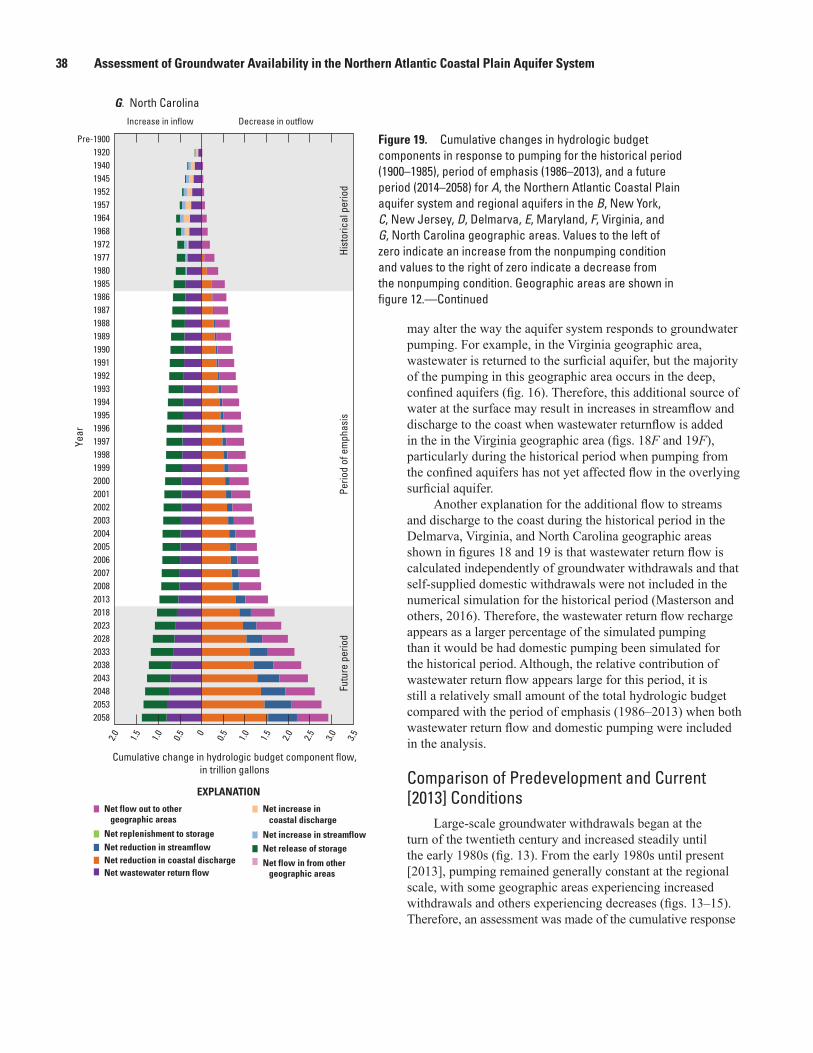
38 Assessment of Groundwater Availability in the Northern Atlantic Coastal Plain Aquifer System
may alter the way the aquifer system responds to groundwater pumping. For example, in the Virginia geographic area, wastewater is returned to the surficial aquifer, but the majority of the pumping in this geographic area occurs in the deep, confined aquifers (fig. 16). Therefore, this additional source of water at the surface may result in increases in streamflow and discharge to the coast when wastewater returnflow is added in the in the Virginia geographic area (figs. 18F and 19F), particularly during the historical period when pumping from the confined aquifers has not yet affected flow in the overlying surficial aquifer.
Another explanation for the additional flow to streams and discharge to the coast during the historical period in the Delmarva, Virginia, and North Carolina geographic areas shown in figures 18 and 19 is that wastewater return flow is calculated independently of groundwater withdrawals and that self-supplied domestic withdrawals were not included in the numerical simulation for the historical period (Masterson and others, 2016). Therefore, the wastewater return flow recharge appears as a larger percentage of the simulated pumping than it would be had domestic pumping been simulated for the historical period. Although, the relative contribution of wastewater return flow appears large for this period, it is still a relatively small amount of the total hydrologic budget compared with the period of emphasis (1986–2013) when both wastewater return flow and domestic pumping were included in the analysis.
Comparison of Predevelopment and Current [2013] Conditions
Large-scale groundwater withdrawals began at the turn of the twentieth century and increased steadily until the early 1980s (fig. 13). From the early 1980s until present [2013], pumping remained generally constant at the regional scale, with some geographic areas experiencing increased withdrawals and others experiencing decreases (figs. 13–15). Therefore, an assessment was made of the cumulative response
Perio
d of
em
phas
isHi
stor
ical
per
iod
Futu
re p
erio
d
G. North Carolina
EXPLANATION
Net flow out to other geographic areas
Net flow in from other geographic areas
Net replenishment to storage
Net release of storageNet reduction in streamflowNet increase in streamflow
Net reduction in coastal discharge
Net increase in coastal discharge
Net wastewater return flow
Pre-190019201940194519521957196419681972197719801985198619871988198919901991199219931994199519961997199819992000200120022003200420052006200720082013201820232028203320382043204820532058
Year
2.0 2.0 3.02.5 3.51.5 1.51.0 1.00.5 0.50
pp_masterson_nacp_fig19g_new
Decrease in outflowIncrease in inflow
Cumulative change in hydrologic budget component flow,in trillion gallons
Figure 19. Cumulative changes in hydrologic budget components in response to pumping for the historical period (1900–1985), period of emphasis (1986–2013), and a future period (2014–2058) for A, the Northern Atlantic Coastal Plain aquifer system and regional aquifers in the B, New York, C, New Jersey, D, Delmarva, E, Maryland, F, Virginia, and G, North Carolina geographic areas. Values to the left of zero indicate an increase from the nonpumping condition and values to the right of zero indicate a decrease from the nonpumping condition. Geographic areas are shown in figure 12.—Continued
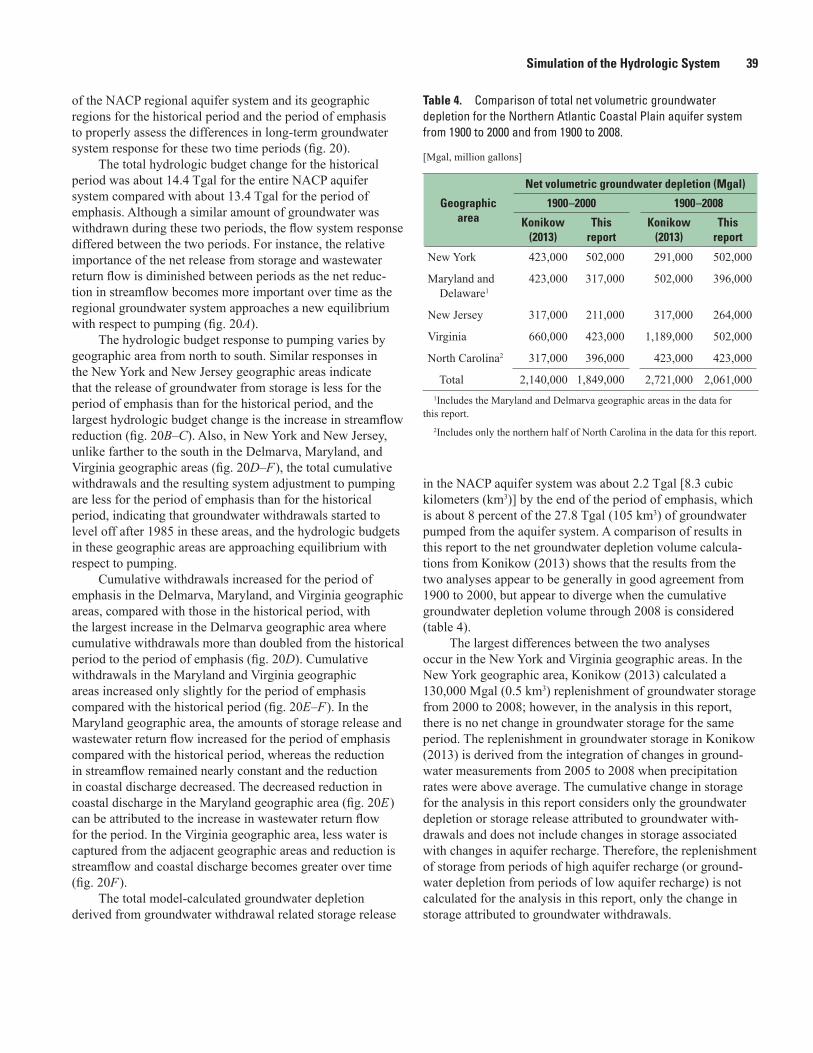
Simulation of the Hydrologic System 39
of the NACP regional aquifer system and its geographic regions for the historical period and the period of emphasis to properly assess the differences in long-term groundwater system response for these two time periods (fig. 20).
The total hydrologic budget change for the historical period was about 14.4 Tgal for the entire NACP aquifer system compared with about 13.4 Tgal for the period of emphasis. Although a similar amount of groundwater was withdrawn during these two periods, the flow system response differed between the two periods. For instance, the relative importance of the net release from storage and wastewater return flow is diminished between periods as the net reduc-tion in streamflow becomes more important over time as the regional groundwater system approaches a new equilibrium with respect to pumping (fig. 20A).
The hydrologic budget response to pumping varies by geographic area from north to south. Similar responses in the New York and New Jersey geographic areas indicate that the release of groundwater from storage is less for the period of emphasis than for the historical period, and the largest hydrologic budget change is the increase in streamflow reduction (fig. 20B–C). Also, in New York and New Jersey, unlike farther to the south in the Delmarva, Maryland, and Virginia geographic areas (fig. 20D–F ), the total cumulative withdrawals and the resulting system adjustment to pumping are less for the period of emphasis than for the historical period, indicating that groundwater withdrawals started to level off after 1985 in these areas, and the hydrologic budgets in these geographic areas are approaching equilibrium with respect to pumping.
Cumulative withdrawals increased for the period of emphasis in the Delmarva, Maryland, and Virginia geographic areas, compared with those in the historical period, with the largest increase in the Delmarva geographic area where cumulative withdrawals more than doubled from the historical period to the period of emphasis (fig. 20D). Cumulative withdrawals in the Maryland and Virginia geographic areas increased only slightly for the period of emphasis compared with the historical period (fig. 20E–F ). In the Maryland geographic area, the amounts of storage release and wastewater return flow increased for the period of emphasis compared with the historical period, whereas the reduction in streamflow remained nearly constant and the reduction in coastal discharge decreased. The decreased reduction in coastal discharge in the Maryland geographic area (fig. 20E ) can be attributed to the increase in wastewater return flow for the period. In the Virginia geographic area, less water is captured from the adjacent geographic areas and reduction is streamflow and coastal discharge becomes greater over time (fig. 20F ).
The total model-calculated groundwater depletion derived from groundwater withdrawal related storage release
Table 4. Comparison of total net volumetric groundwater depletion for the Northern Atlantic Coastal Plain aquifer system from 1900 to 2000 and from 1900 to 2008.
[Mgal, million gallons]
Geographic area
Net volumetric groundwater depletion (Mgal)
1900 –2000 1900 –2008
Konikow (2013)
This report
Konikow (2013)
This report
New York 423,000 502,000 291,000 502,000
Maryland and Delaware1
423,000 317,000 502,000 396,000
New Jersey 317,000 211,000 317,000 264,000
Virginia 660,000 423,000 1,189,000 502,000
North Carolina2 317,000 396,000 423,000 423,000
Total 2,140,000 1,849,000 2,721,000 2,061,0001Includes the Maryland and Delmarva geographic areas in the data for
this report.2Includes only the northern half of North Carolina in the data for this report.
in the NACP aquifer system was about 2.2 Tgal [8.3 cubic kilometers (km3)] by the end of the period of emphasis, which is about 8 percent of the 27.8 Tgal (105 km3) of groundwater pumped from the aquifer system. A comparison of results in this report to the net groundwater depletion volume calcula-tions from Konikow (2013) shows that the results from the two analyses appear to be generally in good agreement from 1900 to 2000, but appear to diverge when the cumulative groundwater depletion volume through 2008 is considered (table 4).
The largest differences between the two analyses occur in the New York and Virginia geographic areas. In the New York geographic area, Konikow (2013) calculated a 130,000 Mgal (0.5 km3) replenishment of groundwater storage from 2000 to 2008; however, in the analysis in this report, there is no net change in groundwater storage for the same period. The replenishment in groundwater storage in Konikow (2013) is derived from the integration of changes in ground-water measurements from 2005 to 2008 when precipitation rates were above average. The cumulative change in storage for the analysis in this report considers only the groundwater depletion or storage release attributed to groundwater with-drawals and does not include changes in storage associated with changes in aquifer recharge. Therefore, the replenishment of storage from periods of high aquifer recharge (or ground-water depletion from periods of low aquifer recharge) is not calculated for the analysis in this report, only the change in storage attributed to groundwater withdrawals.
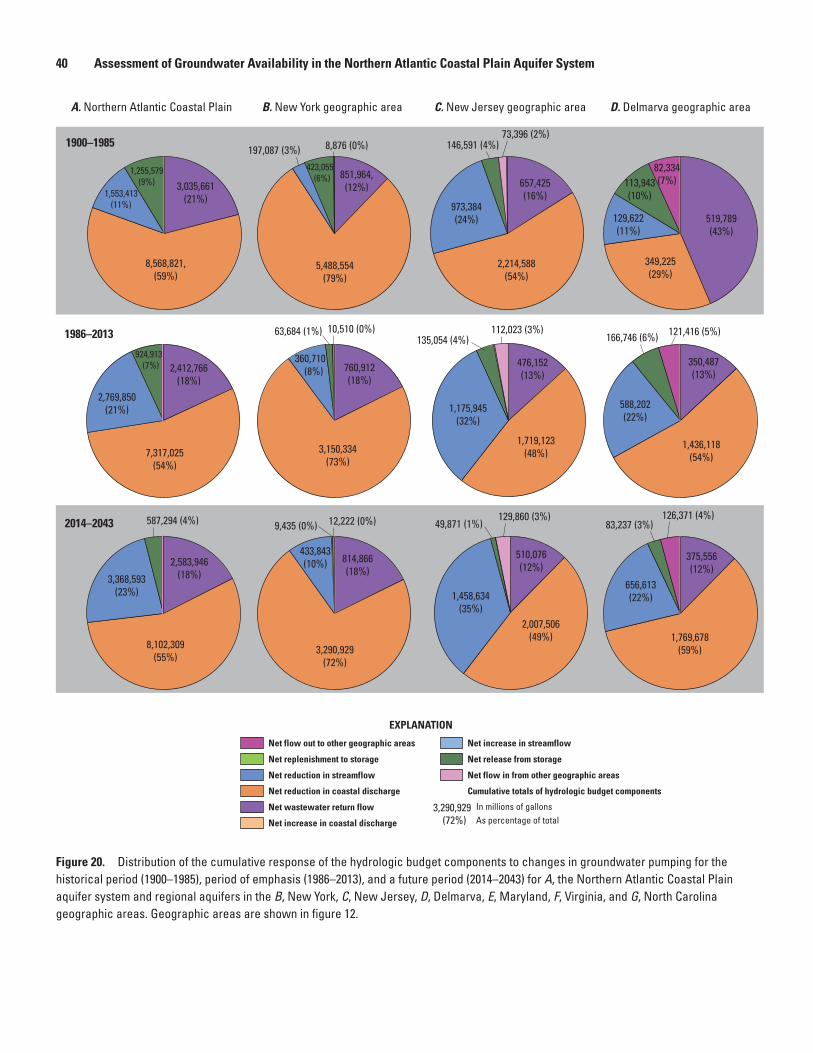
40 Assessment of Groundwater Availability in the Northern Atlantic Coastal Plain Aquifer System
3,035,661(21%)
8,568,821,(59%)
1,553,413(11%)
1,255,579(9%)
1900–1985
2,412,766(18%)
7,317,025(54%)
2,769,850(21%)
924,913 (7%)
1986–2013
2,583,946(18%)
8,102,309(55%)
3,368,593(23%)
587,294 (4%)2014–2043
A. Northern Atlantic Coastal Plain
pp_masterson_nacp_fig20abcd_new
851,964,(12%)
5,488,554(79%)
197,087 (3%)423,055 (6%)
8,876 (0%)
B. New York geographic area
760,912(18%)
3,150,334(73%)
360,710 (8%)
63,684 (1%) 10,510 (0%)
814,866(18%)
3,290,929(72%)
433,843(10%)
9,435 (0%) 12,222 (0%)
Net flow out to other geographic areas
Net replenishment to storage
Net reduction in streamflow
Net reduction in coastal discharge
Net wastewater return flow
Net increase in coastal discharge
Net increase in streamflow
Net release from storage
Net flow in from other geographic areas
Cumulative totals of hydrologic budget components
EXPLANATION
3,290,929(72%)
657,425(16%)
2,214,588(54%)
973,384(24%)
146,591 (4%)73,396 (2%)
C. New Jersey geographic area
476,152(13%)
1,719,123(48%)
1,175,945(32%)
135,054 (4%)112,023 (3%)
510,076(12%)
2,007,506(49%)
1,458,634(35%)
49,871 (1%)129,860 (3%)
519,789(43%)
349,225(29%)
129,622(11%)
113,943(10%)
82,334(7%)
D. Delmarva geographic area
350,487(13%)
1,436,118(54%)
588,202(22%)
166,746 (6%) 121,416 (5%)
375,556(12%)
1,769,678(59%)
656,613(22%)
83,237 (3%)126,371 (4%)
In millions of gallonsAs percentage of total
Figure 20. Distribution of the cumulative response of the hydrologic budget components to changes in groundwater pumping for the historical period (1900–1985), period of emphasis (1986–2013), and a future period (2014–2043) for A, the Northern Atlantic Coastal Plain aquifer system and regional aquifers in the B, New York, C, New Jersey, D, Delmarva, E, Maryland, F, Virginia, and G, North Carolina geographic areas. Geographic areas are shown in figure 12.
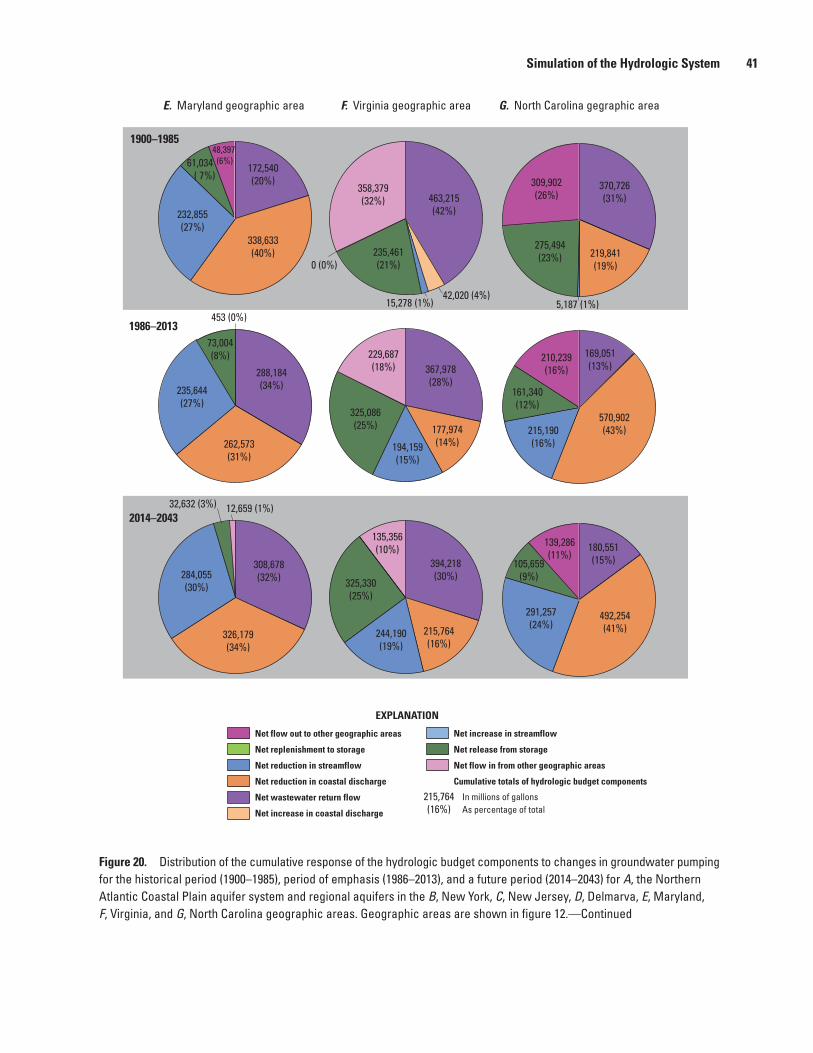
Simulation of the Hydrologic System 41
1900–1985
1986–2013
2014–2043
pp_masterson_nacp_fig20efg_new
172,540(20%)
338,633(40%)
232,855(27%)
61,034 ( 7%)
48,397 (6%)
E. Maryland geographic area
288,184(34%)
262,573(31%)
235,644(27%)
73,004(8%)
453 (0%)
308,678(32%)
326,179(34%)
284,055(30%)
32,632 (3%) 12,659 (1%)
463,215(42%)
42,020 (4%) 15,278 (1%)
235,461(21%)0 (0%)
358,379(32%)
F. Virginia geographic area
367,978(28%)
177,974(14%)194,159
(15%)
325,086(25%)
229,687(18%)
394,218(30%)
215,764(16%)
215,764(16%)
244,190(19%)
325,330(25%)
135,356(10%)
370,726(31%)
219,841(19%)
5,187 (1%)
275,494(23%)
309,902(26%)
G. North Carolina gegraphic area
169,051(13%)
570,902(43%)215,190
(16%)
161,340(12%)
210,239(16%)
180,551(15%)
492,254(41%)
291,257(24%)
105,659(9%)
139,286(11%)
Net flow out to other geographic areas
Net replenishment to storage
Net reduction in streamflow
Net reduction in coastal discharge
Net wastewater return flow
Net increase in coastal discharge
Net increase in streamflow
Net release from storage
Net flow in from other geographic areas
Cumulative totals of hydrologic budget components
EXPLANATION
In millions of gallonsAs percentage of total
Figure 20. Distribution of the cumulative response of the hydrologic budget components to changes in groundwater pumping for the historical period (1900–1985), period of emphasis (1986–2013), and a future period (2014–2043) for A, the Northern Atlantic Coastal Plain aquifer system and regional aquifers in the B, New York, C, New Jersey, D, Delmarva, E, Maryland, F, Virginia, and G, North Carolina geographic areas. Geographic areas are shown in figure 12.—Continued
42 Assessment of Groundwater Availability in the Northern Atlantic Coastal Plain Aquifer System
The difference in calculated volumetric groundwater depletion between the two analyses is largest in the Virginia geographic area (table 4). The analysis in Konikow (2013) for 1900 to 2000 calculates groundwater depletion to be about 660,000 Mgal (2.5 km3), which is about 60 percent greater than the 423,000 Mgal (1.6 km3) calculated for the analysis in this report. This difference becomes more pronounced when considering the additional groundwater depletion calculated from 2000 to 2008. The analysis in Konikow (2013) calcu-lates an additional 529,000 Mgal (2.0 km3) of groundwater depletion for this 9-year period compared with the additional 79,000 Mgal (0.3 km3) groundwater depletion calculated in the analysis of this report (table 4). This large discrepancy in depletion totals between the two analyses for this period can be attributed to the Konikow (2013) analysis including storage changes in response to both pumping and recharge whereas in the analysis in this report only the changes in storage associ-ated with groundwater withdrawals are considered.
Cumulative changes in groundwater storage in the New York geographic area that consider changes in both recharge and groundwater withdrawals may better reflect the total response of the aquifer system to changes in stresses over time because pumping from the Magothy aquifer accounts for more than 70 percent of the total withdrawals (table 3) and the Magothy is in good hydrologic connection with the overlying surficial (upper glacial) aquifer (fig. 6D), which is the aquifer most affected by changes in recharge. Conversely, in the Virginia geographic area, nearly 90 percent of the ground-water withdrawals come from the Potomac aquifer (table 3), which is not in good connection with the surficial aquifer (fig. 6A), and therefore, the storage changes in the surficial aquifer from changes in recharge should not be grouped with the storage changes from pumping that occur in the deep, confined aquifers in the assessment of the potential effects of groundwater withdrawals on changes in aquifer storage in the primary aquifers for this geographic area. However, despite the differences in methodologies between the two analyses, the differences in the cumulative net groundwater depletion volumes are less than 15 percent from 1900 to 2000 and less than 25 percent from 1900 to 2008 for the entire NACP aquifer system.
Comparison of Current [2013] and Future [2043] Conditions
Two hypothetical conditions were considered in order to assess how the groundwater flow system may respond in the future. Those conditions included first maintaining the current [2013] pumping and recharge stresses for an additional 30 years. The second condition assumed that the wastewater return flow from all domestic onsite septic systems was captured by sewers and treated at centralized wastewater
treatment facilities along the coast, effectively removing all wastewater from the groundwater system.
In the first condition, the same stresses were continued for 30 years into 2043 to determine how the system would respond with a continuation of the current [2013] stresses; the 30-year period was chosen because nearly half of the total groundwater withdrawn from the groundwater system in the 113-year period from 1900 to 2013, was withdrawn in just the past 30 years. The results indicate that the system-wide distribution of the hydrologic budget components appears similar from 2014 to 2043 compared with that from 1986 to 2013, with the only differences being less release from storage and greater reductions in discharges to streams and the coast.
A comparison between the New York (Long Island) and Virginia geographic areas illustrates the differences in hydrologic responses between an area where groundwater withdrawals are primarily from the unconfined part of the flow system (Long Island) and an area where withdrawals are primarily from the deep, confined portion of the flow system (Virginia). In the case of the New York geographic area (fig. 20B), the flow system has achieved approximate equilib-rium with respect to pumping because the change in storage by the end of 2043 is zero. A zero change in storage indicates that the withdrawals in this geographic area are balanced by corresponding reductions in discharge to streams and the coast as well as the addition of the return of wastewater. This response in the New York geographic area is because nearly all the groundwater withdrawals are from the surficial (locally referred to as the upper glacial) and Magothy aquifers (figs. 15B and 16) that either include the water table or are not separated to any large extent by confining units from the aquifer including the water table (fig. 6D).
The flow system in the Virginia geographic area, in contrast to the New York geographic area, is still responding by the end of 2043 to the cumulative effects of groundwater withdrawals because the amount of water released from storage continues to account for nearly 25 percent of the flow system response to withdrawals in that area (fig. 20F ). Also, the amount of water derived from other geographic areas continues to decrease over time, indicating that, as groundwater withdrawals increase in adjacent areas such as North Carolina, the amount of water flowing into Virginia becomes less of a contribution to the total response to ground-water withdrawals within this area.
A comparison of the geographic areas in New Jersey (fig. 20C ), Delmarva (fig. 20D), and Maryland (fig. 20E ) shows that the general adjustment of the flow system to the continuation of current [2013] groundwater withdrawal rates is a decrease in the amount of water released from storage, which is then compensated for by more reductions in discharge to streams and coastal waters. The flow systems in these geographic areas are more similar to those in the
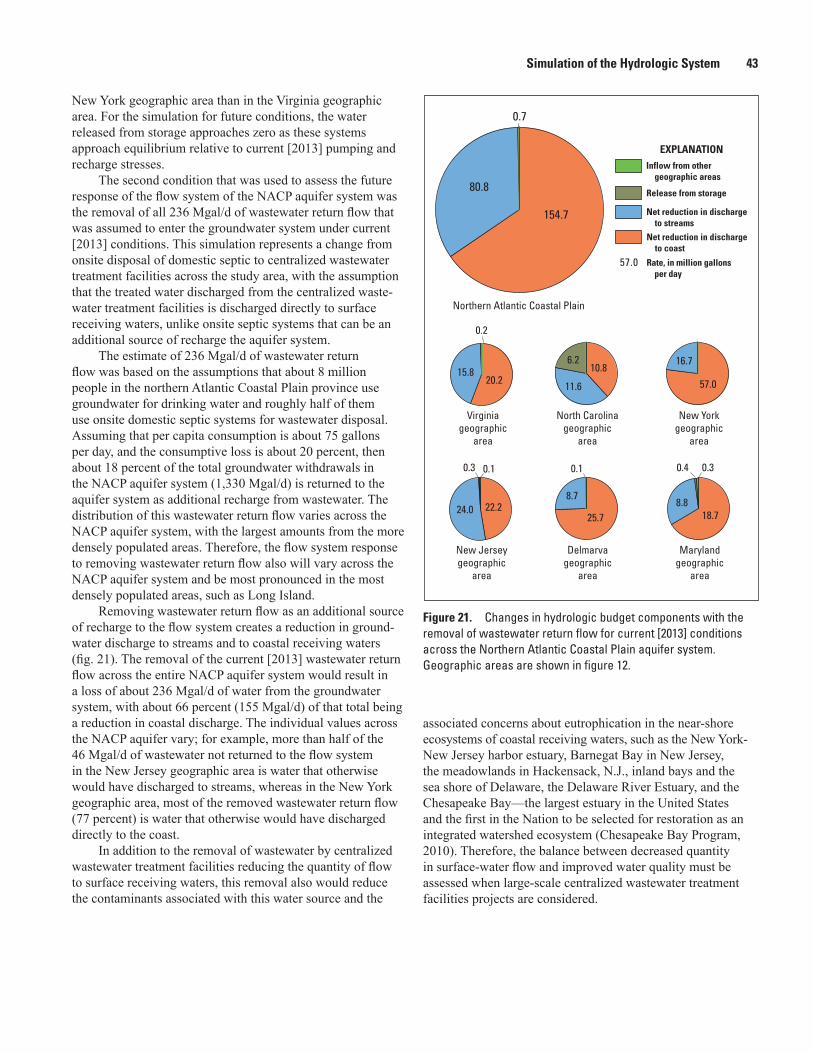
Simulation of the Hydrologic System 43
New York geographic area than in the Virginia geographic area. For the simulation for future conditions, the water released from storage approaches zero as these systems approach equilibrium relative to current [2013] pumping and recharge stresses.
The second condition that was used to assess the future response of the flow system of the NACP aquifer system was the removal of all 236 Mgal/d of wastewater return flow that was assumed to enter the groundwater system under current [2013] conditions. This simulation represents a change from onsite disposal of domestic septic to centralized wastewater treatment facilities across the study area, with the assumption that the treated water discharged from the centralized waste-water treatment facilities is discharged directly to surface receiving waters, unlike onsite septic systems that can be an additional source of recharge the aquifer system.
The estimate of 236 Mgal/d of wastewater return flow was based on the assumptions that about 8 million people in the northern Atlantic Coastal Plain province use groundwater for drinking water and roughly half of them use onsite domestic septic systems for wastewater disposal. Assuming that per capita consumption is about 75 gallons per day, and the consumptive loss is about 20 percent, then about 18 percent of the total groundwater withdrawals in the NACP aquifer system (1,330 Mgal/d) is returned to the aquifer system as additional recharge from wastewater. The distribution of this wastewater return flow varies across the NACP aquifer system, with the largest amounts from the more densely populated areas. Therefore, the flow system response to removing wastewater return flow also will vary across the NACP aquifer system and be most pronounced in the most densely populated areas, such as Long Island.
Removing wastewater return flow as an additional source of recharge to the flow system creates a reduction in ground-water discharge to streams and to coastal receiving waters (fig. 21). The removal of the current [2013] wastewater return flow across the entire NACP aquifer system would result in a loss of about 236 Mgal/d of water from the groundwater system, with about 66 percent (155 Mgal/d) of that total being a reduction in coastal discharge. The individual values across the NACP aquifer vary; for example, more than half of the 46 Mgal/d of wastewater not returned to the flow system in the New Jersey geographic area is water that otherwise would have discharged to streams, whereas in the New York geographic area, most of the removed wastewater return flow (77 percent) is water that otherwise would have discharged directly to the coast.
In addition to the removal of wastewater by centralized wastewater treatment facilities reducing the quantity of flow to surface receiving waters, this removal also would reduce the contaminants associated with this water source and the
associated concerns about eutrophication in the near-shore ecosystems of coastal receiving waters, such as the New York-New Jersey harbor estuary, Barnegat Bay in New Jersey, the meadowlands in Hackensack, N.J., inland bays and the sea shore of Delaware, the Delaware River Estuary, and the Chesapeake Bay—the largest estuary in the United States and the first in the Nation to be selected for restoration as an integrated watershed ecosystem (Chesapeake Bay Program, 2010). Therefore, the balance between decreased quantity in surface-water flow and improved water quality must be assessed when large-scale centralized wastewater treatment facilities projects are considered.
EXPLANATION
Rate, in million gallons per day
57.0
154.7
80.8
0.7
16.7
57.0
22.224.0
0.10.3
8.7
25.7
0.1
18.7
0.30.4
8.8
15.820.2
0.2
6.2
11.6
10.8
North Carolinageographic
area
New Jerseygeographic
area
New Yorkgeographic
area
Delmarvageographic
area
Marylandgeographic
area
Virginiageographic
area
Northern Atlantic Coastal Plain
Inflow from other geographic areas
Release from storage
Net reduction in discharge to streamsNet reduction in discharge to coast
pp_masterson_nacp_fig21_new
Figure 21. Changes in hydrologic budget components with the removal of wastewater return flow for current [2013] conditions across the Northern Atlantic Coastal Plain aquifer system. Geographic areas are shown in figure 12.
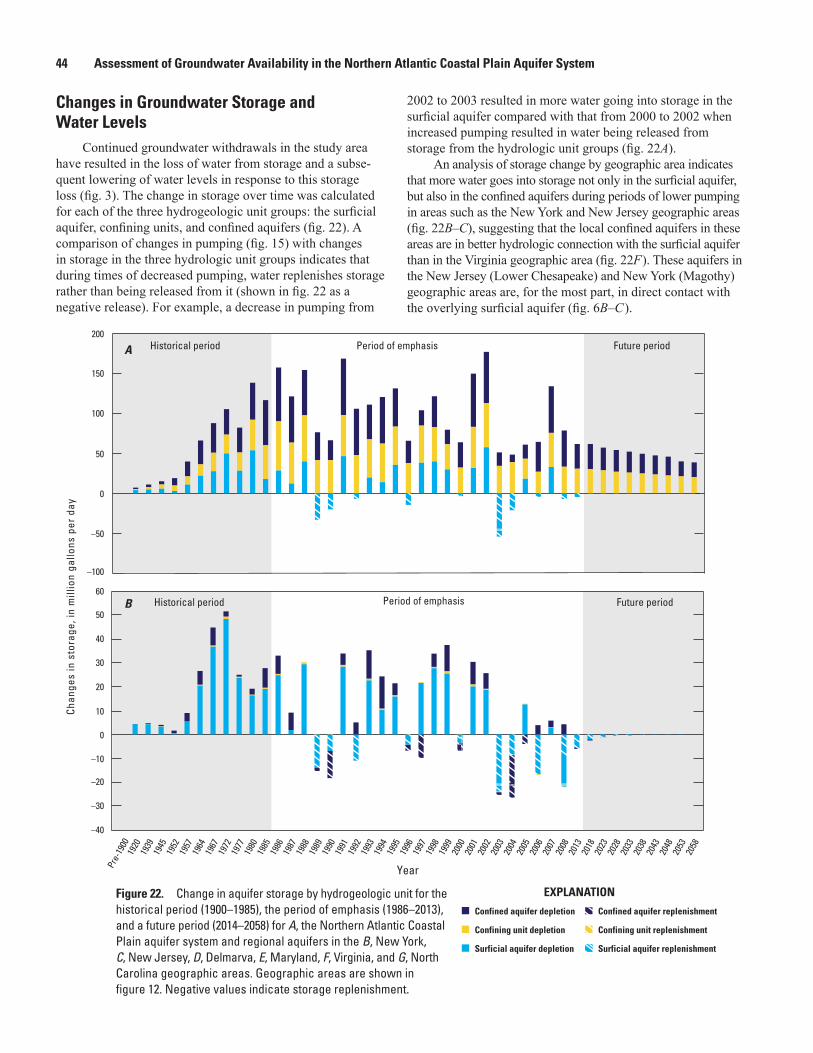
44 Assessment of Groundwater Availability in the Northern Atlantic Coastal Plain Aquifer System
Changes in Groundwater Storage and Water Levels
Continued groundwater withdrawals in the study area have resulted in the loss of water from storage and a subse-quent lowering of water levels in response to this storage loss (fig. 3). The change in storage over time was calculated for each of the three hydrogeologic unit groups: the surficial aquifer, confining units, and confined aquifers (fig. 22). A comparison of changes in pumping (fig. 15) with changes in storage in the three hydrologic unit groups indicates that during times of decreased pumping, water replenishes storage rather than being released from it (shown in fig. 22 as a negative release). For example, a decrease in pumping from
2002 to 2003 resulted in more water going into storage in the surficial aquifer compared with that from 2000 to 2002 when increased pumping resulted in water being released from storage from the hydrologic unit groups (fig. 22A).
An analysis of storage change by geographic area indicates that more water goes into storage not only in the surficial aquifer, but also in the confined aquifers during periods of lower pumping in areas such as the New York and New Jersey geographic areas (fig. 22B–C), suggesting that the local confined aquifers in these areas are in better hydrologic connection with the surficial aquifer than in the Virginia geographic area (fig. 22F ). These aquifers in the New Jersey (Lower Chesapeake) and New York (Magothy) geographic areas are, for the most part, in direct contact with the overlying surficial aquifer (fig. 6B–C ).
pp_masterson_nacp_fig22ab_new
Period of emphasisHistorical period Future period
150
100
50
0
–50
–100
Chan
ges
in s
tora
ge, i
n m
illio
n ga
llons
per
day
200
Confined aquifer depletion
Confining unit depletion
Surficial aquifer depletion
Confined aquifer replenishment
Confining unit replenishment
Surficial aquifer replenishment
Period of emphasisHistorical period Future period50
30
10
0
–10
–20
60
40
20
–30
–40
Year
EXPLANATION
A
B
2058
2053
2048
2043
2038
2033
2028
2023
2018
2013
2008
2007
2006
2005
2004
2003
2002
2001
2000
1999
1998
1997
1996
1995
1994
1993
1992
1991
1990
1989
1988
1987
1986
1985
1980
1977
1972
1967
1964
1957
1952
1945
1939
1920
Pre-
1900
Figure 22. Change in aquifer storage by hydrogeologic unit for the historical period (1900–1985), the period of emphasis (1986–2013), and a future period (2014–2058) for A, the Northern Atlantic Coastal Plain aquifer system and regional aquifers in the B, New York, C, New Jersey, D, Delmarva, E, Maryland, F, Virginia, and G, North Carolina geographic areas. Geographic areas are shown in figure 12. Negative values indicate storage replenishment.
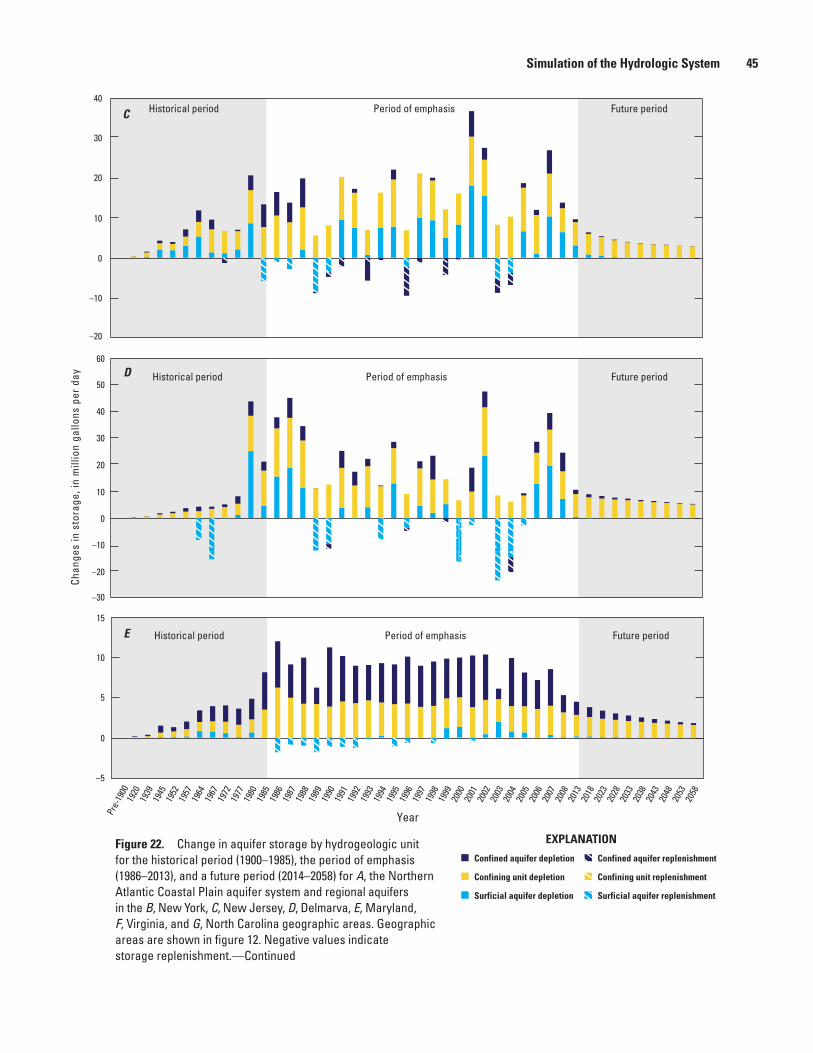
Simulation of the Hydrologic System 45
pp_masterson_nacp_fig22ef_new
Chan
ges
in s
tora
ge, i
n m
illio
n ga
llons
per
day
Confined aquifer depletion
Confining unit depletion
Surficial aquifer depletion
Confined aquifer replenishment
Confining unit replenishment
Surficial aquifer replenishment
Year
Period of emphasisHistorical period Future period
10
5
0
–5
15
Period of emphasisHistorical period Future period
60
50
40
30
20
10
0
–10
–20
–30
EXPLANATION
2058
2053
2048
2043
2038
2033
2028
2023
2018
2013
2008
2007
2006
2005
2004
2003
2002
2001
2000
1999
1998
1997
1996
1995
1994
1993
1992
1991
1990
1989
1988
1987
1986
1985
1980
1977
1972
1967
1964
1957
1952
1945
1939
1920
Pre-
1900
E
D
Period of emphasisHistorical period Future period
30
20
10
0
–10
–20
40
C
Figure 22. Change in aquifer storage by hydrogeologic unit for the historical period (1900–1985), the period of emphasis (1986–2013), and a future period (2014–2058) for A, the Northern Atlantic Coastal Plain aquifer system and regional aquifers in the B, New York, C, New Jersey, D, Delmarva, E, Maryland, F, Virginia, and G, North Carolina geographic areas. Geographic areas are shown in figure 12. Negative values indicate storage replenishment.—Continued
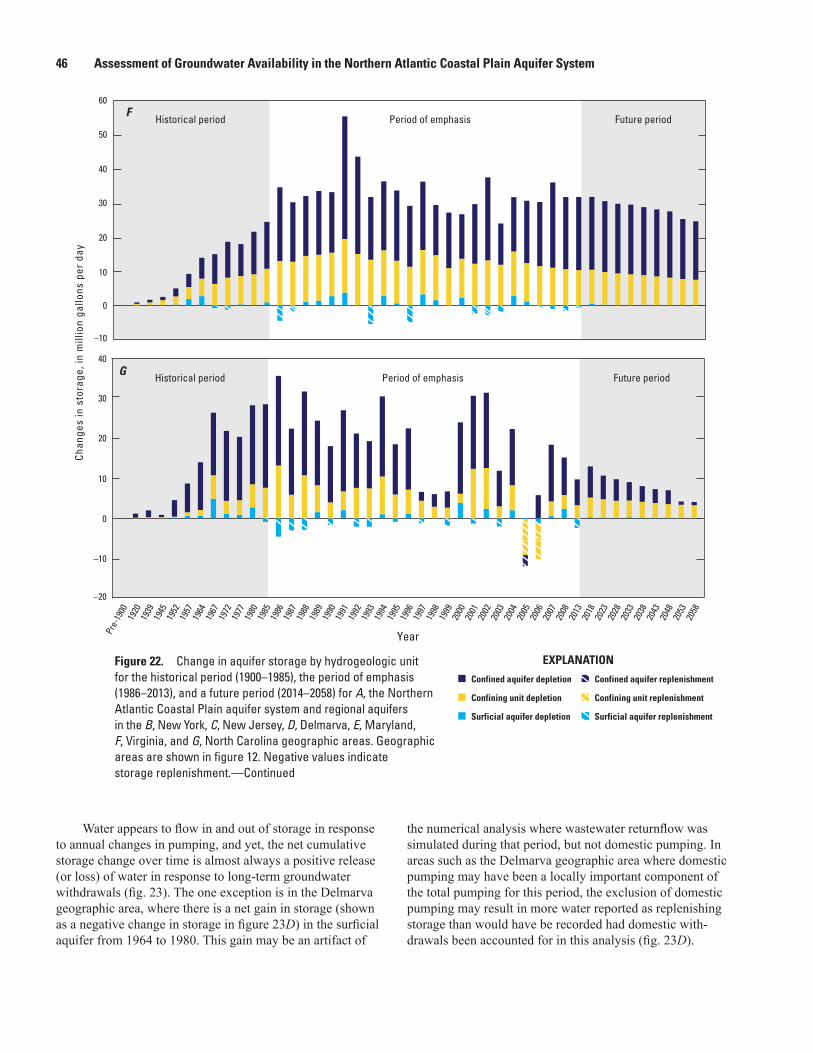
46 Assessment of Groundwater Availability in the Northern Atlantic Coastal Plain Aquifer System
pp_masterson_nacp_fig22g _new
Chan
ges
in s
tora
ge, i
n m
illio
n ga
llons
per
day
Confined aquifer depletion
Confining unit depletion
Surficial aquifer depletion
Confined aquifer replenishment
Confining unit replenishment
Surficial aquifer replenishment
Year
EXPLANATION
2058
2053
2048
2043
2038
2033
2028
2023
2018
2013
2008
2007
2006
2005
2004
2003
2002
2001
2000
1999
1998
1997
1996
1995
1994
1993
1992
1991
1990
1989
1988
1987
1986
1985
1980
1977
1972
1967
1964
1957
1952
1945
1939
1920
Pre-
1900
Period of emphasis Historical period Future period
30
20
10
0
–10
–20
40G
Period of emphasisHistorical period Future period
60
50
40
30
20
10
0
–10
F
Water appears to flow in and out of storage in response to annual changes in pumping, and yet, the net cumulative storage change over time is almost always a positive release (or loss) of water in response to long-term groundwater withdrawals (fig. 23). The one exception is in the Delmarva geographic area, where there is a net gain in storage (shown as a negative change in storage in figure 23D) in the surficial aquifer from 1964 to 1980. This gain may be an artifact of
the numerical analysis where wastewater returnflow was simulated during that period, but not domestic pumping. In areas such as the Delmarva geographic area where domestic pumping may have been a locally important component of the total pumping for this period, the exclusion of domestic pumping may result in more water reported as replenishing storage than would have be recorded had domestic with-drawals been accounted for in this analysis (fig. 23D).
Figure 22. Change in aquifer storage by hydrogeologic unit for the historical period (1900–1985), the period of emphasis (1986–2013), and a future period (2014–2058) for A, the Northern Atlantic Coastal Plain aquifer system and regional aquifers in the B, New York, C, New Jersey, D, Delmarva, E, Maryland, F, Virginia, and G, North Carolina geographic areas. Geographic areas are shown in figure 12. Negative values indicate storage replenishment.—Continued
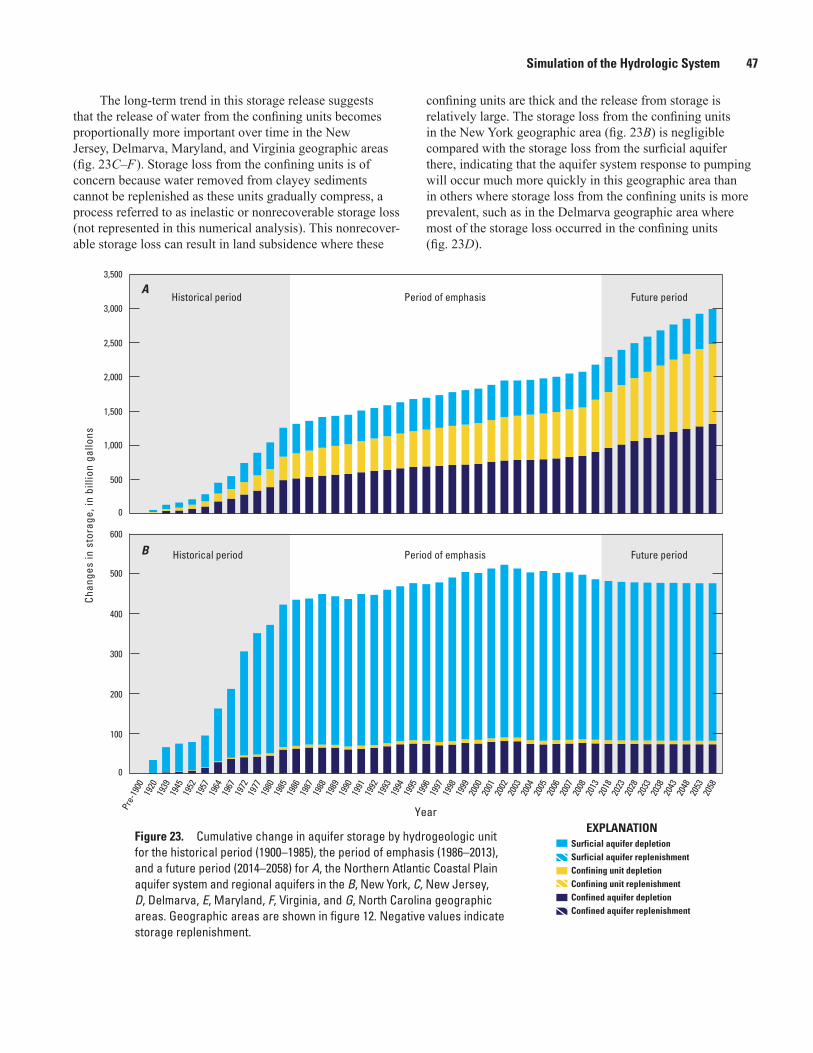
Simulation of the Hydrologic System 47
The long-term trend in this storage release suggests that the release of water from the confining units becomes proportionally more important over time in the New Jersey, Delmarva, Maryland, and Virginia geographic areas (fig. 23C–F ). Storage loss from the confining units is of concern because water removed from clayey sediments cannot be replenished as these units gradually compress, a process referred to as inelastic or nonrecoverable storage loss (not represented in this numerical analysis). This nonrecover-able storage loss can result in land subsidence where these
pp_masterson_nacp_fig23ab_new
Chan
ges
in s
tora
ge, i
n bi
llion
gal
lons
3,500
3,000
2,500
2,000
1,500
1,000
500
0
600
500
400
300
200
100
0
Year
Period of emphasisHistorical period Future period
Period of emphasisHistorical period Future period
Confined aquifer depletion
Confining unit depletion
Surficial aquifer depletion
Confined aquifer replenishment
Confining unit replenishment
Surficial aquifer replenishment
EXPLANATION
2058
2053
2048
2043
2038
2033
2028
2023
2018
2013
2008
2007
2006
2005
2004
2003
2002
2001
2000
1999
1998
1997
1996
1995
1994
1993
1992
1991
1990
1989
1988
1987
1986
1985
1980
1977
1972
1967
1964
1957
1952
1945
1939
1920
Pre-
1900
A
B
confining units are thick and the release from storage is relatively large. The storage loss from the confining units in the New York geographic area (fig. 23B) is negligible compared with the storage loss from the surficial aquifer there, indicating that the aquifer system response to pumping will occur much more quickly in this geographic area than in others where storage loss from the confining units is more prevalent, such as in the Delmarva geographic area where most of the storage loss occurred in the confining units (fig. 23D).
Figure 23. Cumulative change in aquifer storage by hydrogeologic unit for the historical period (1900–1985), the period of emphasis (1986–2013), and a future period (2014–2058) for A, the Northern Atlantic Coastal Plain aquifer system and regional aquifers in the B, New York, C, New Jersey, D, Delmarva, E, Maryland, F, Virginia, and G, North Carolina geographic areas. Geographic areas are shown in figure 12. Negative values indicate storage replenishment.
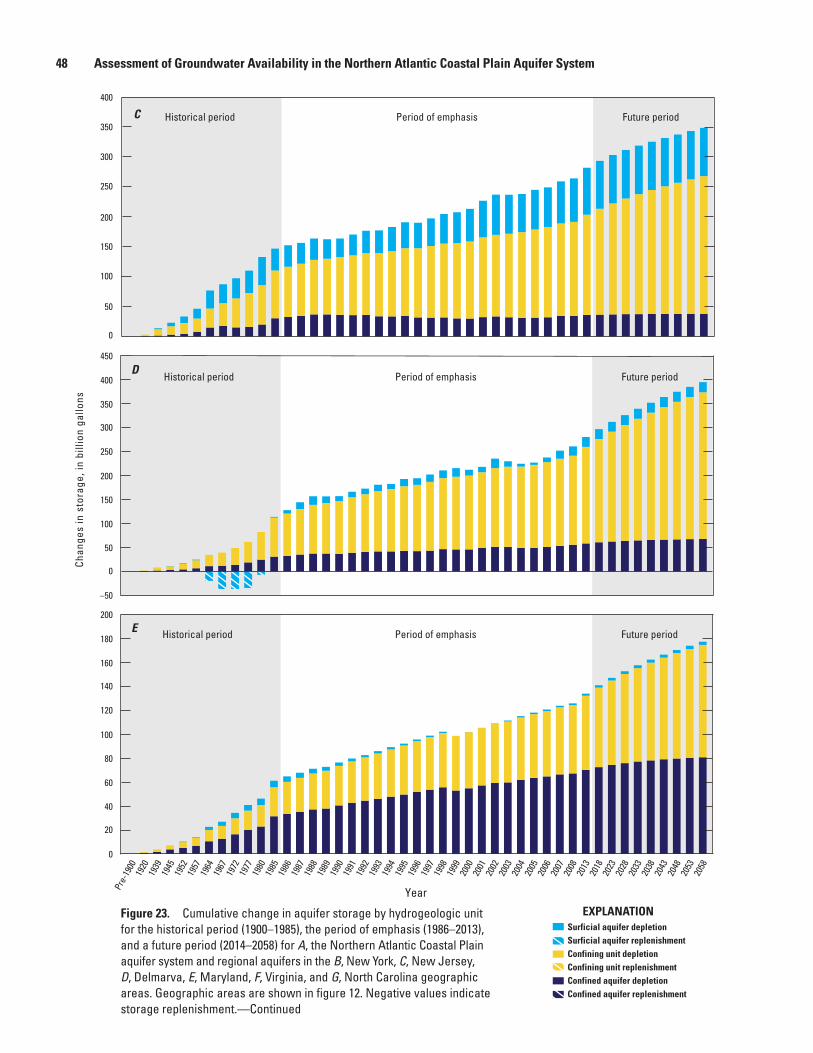
48 Assessment of Groundwater Availability in the Northern Atlantic Coastal Plain Aquifer System
Figure 23. Cumulative change in aquifer storage by hydrogeologic unit for the historical period (1900–1985), the period of emphasis (1986–2013), and a future period (2014–2058) for A, the Northern Atlantic Coastal Plain aquifer system and regional aquifers in the B, New York, C, New Jersey, D, Delmarva, E, Maryland, F, Virginia, and G, North Carolina geographic areas. Geographic areas are shown in figure 12. Negative values indicate storage replenishment.—Continued
pp_masterson_nacp_fig23ef_new
2058
2053
2048
2043
2038
2033
2028
2023
2018
2013
2008
2007
2006
2005
2004
2003
2002
2001
2000
1999
1998
1997
1996
1995
1994
1993
1992
1991
1990
1989
1988
1987
1986
1985
1980
1977
1972
1967
1964
1957
1952
1945
1939
1920
Pre-
1900
Chan
ges
in s
tora
ge, i
n bi
llion
gal
lons
Year
200
180
140
160
120
100
80
60
40
20
0
Period of emphasisHistorical period Future period
450
400
300
350
250
200
150
100
50
0
–50
Period of emphasisHistorical period Future period
E
D
400
350
300
250
200
150
100
50
0
Period of emphasisHistorical period Future periodC
Confined aquifer depletion
Confining unit depletion
Surficial aquifer depletion
Confined aquifer replenishment
Confining unit replenishment
Surficial aquifer replenishment
EXPLANATION
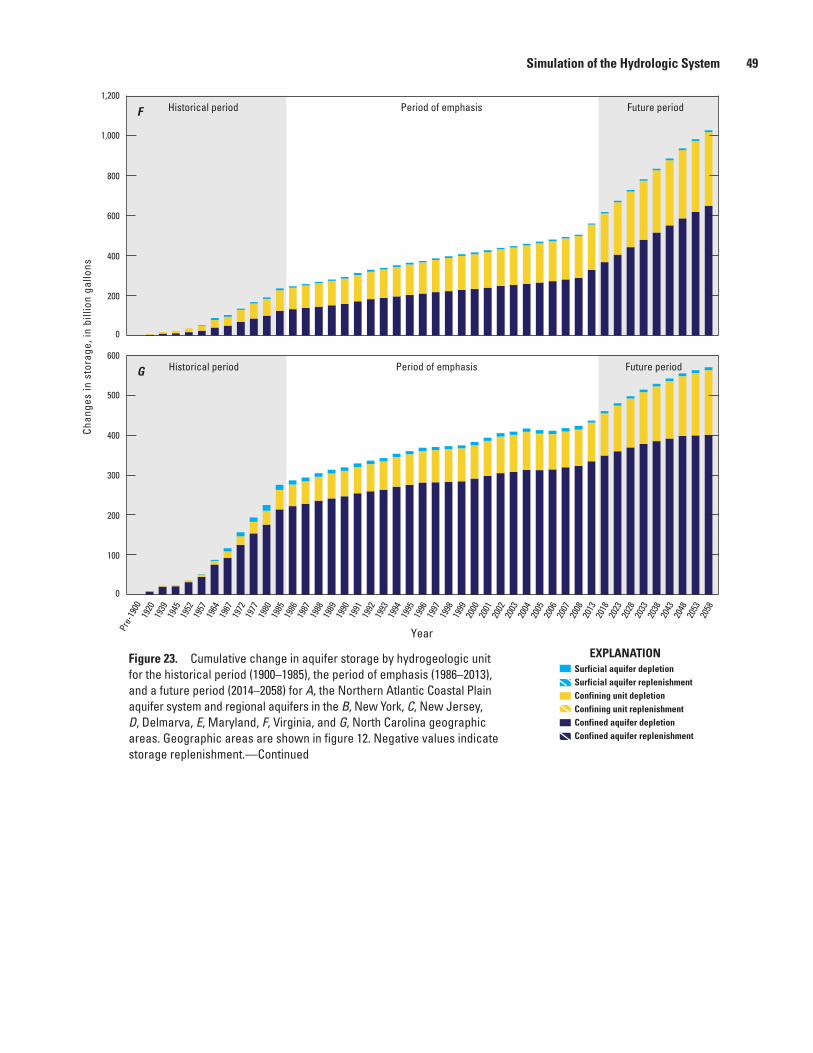
Simulation of the Hydrologic System 49
pp_masterson_nacp_fig23g _new
Chan
ges
in s
tora
ge, i
n bi
llion
gal
lons
600
500
400
300
200
100
0
Year
G
2058
2053
2048
2043
2038
2033
2028
2023
2018
2013
2008
2007
2006
2005
2004
2003
2002
2001
2000
1999
1998
1997
1996
1995
1994
1993
1992
1991
1990
1989
1988
1987
1986
1985
1980
1977
1972
1967
1964
1957
1952
1945
1939
1920
Pre-
1900
Period of emphasis Historical period Future period
1,200
1,000
800
600
400
200
0
Period of emphasisHistorical period Future periodF
Confined aquifer depletion
Confining unit depletion
Surficial aquifer depletion
Confined aquifer replenishment
Confining unit replenishment
Surficial aquifer replenishment
EXPLANATIONFigure 23. Cumulative change in aquifer storage by hydrogeologic unit for the historical period (1900–1985), the period of emphasis (1986–2013), and a future period (2014–2058) for A, the Northern Atlantic Coastal Plain aquifer system and regional aquifers in the B, New York, C, New Jersey, D, Delmarva, E, Maryland, F, Virginia, and G, North Carolina geographic areas. Geographic areas are shown in figure 12. Negative values indicate storage replenishment.—Continued
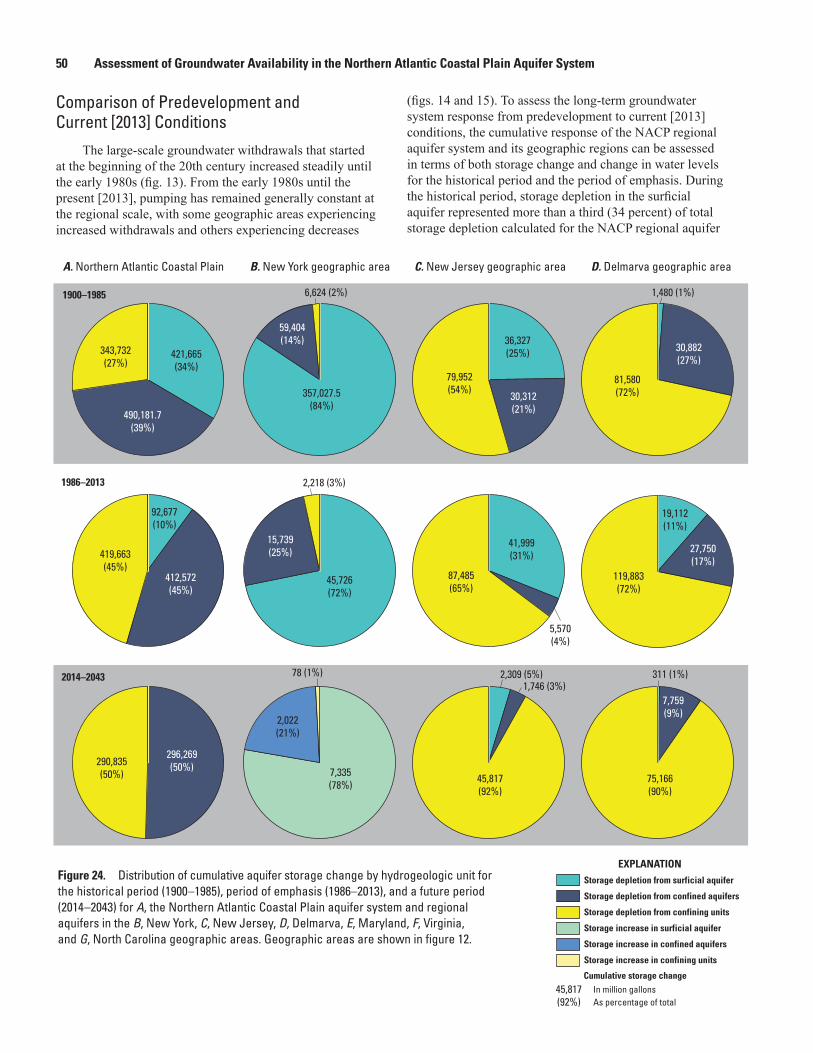
50 Assessment of Groundwater Availability in the Northern Atlantic Coastal Plain Aquifer System
Comparison of Predevelopment and Current [2013] Conditions
The large-scale groundwater withdrawals that started at the beginning of the 20th century increased steadily until the early 1980s (fig. 13). From the early 1980s until the present [2013], pumping has remained generally constant at the regional scale, with some geographic areas experiencing increased withdrawals and others experiencing decreases
(figs. 14 and 15). To assess the long-term groundwater system response from predevelopment to current [2013] conditions, the cumulative response of the NACP regional aquifer system and its geographic regions can be assessed in terms of both storage change and change in water levels for the historical period and the period of emphasis. During the historical period, storage depletion in the surficial aquifer represented more than a third (34 percent) of total storage depletion calculated for the NACP regional aquifer
1900–1985
1986–2013
2014–2043
A. Northern Atlantic Coastal Plain
pp_masterson_nacp_fig24abcd_new
B. New York geographic area
Storage depletion from surficial aquifer
Storage depletion from confined aquifers
Storage depletion from confining units
Storage increase in surficial aquifer
Storage increase in confined aquifers
Storage increase in confining units
Cumulative storage change
EXPLANATION
45,817(92%)
C. New Jersey geographic area D. Delmarva geographic area
421,665(34%)
490,181.7(39%)
343,732(27%)
92,677(10%)
412,572(45%)
419,663(45%)
296,269(50%)290,835
(50%)
357,027.5(84%)
59,404(14%)
6,624 (2%)
45,726(72%)
15,739(25%)
2,218 (3%)
7,335(78%)
2,022(21%)
78 (1%)
36,327(25%)
30,312(21%)
79,952(54%)
41,999(31%)
5,570(4%)
87,485(65%)
2,309 (5%)1,746 (3%)
45,817(92%)
1,480 (1%)
30,882(27%)
81,580(72%)
19,112(11%)
27,750(17%)
119,883(72%)
311 (1%)
7,759(9%)
75,166(90%)
In million gallonsAs percentage of total
Figure 24. Distribution of cumulative aquifer storage change by hydrogeologic unit for the historical period (1900 –1985), period of emphasis (1986–2013), and a future period (2014 –2043) for A, the Northern Atlantic Coastal Plain aquifer system and regional aquifers in the B, New York, C, New Jersey, D, Delmarva, E, Maryland, F, Virginia, and G, North Carolina geographic areas. Geographic areas are shown in figure 12.
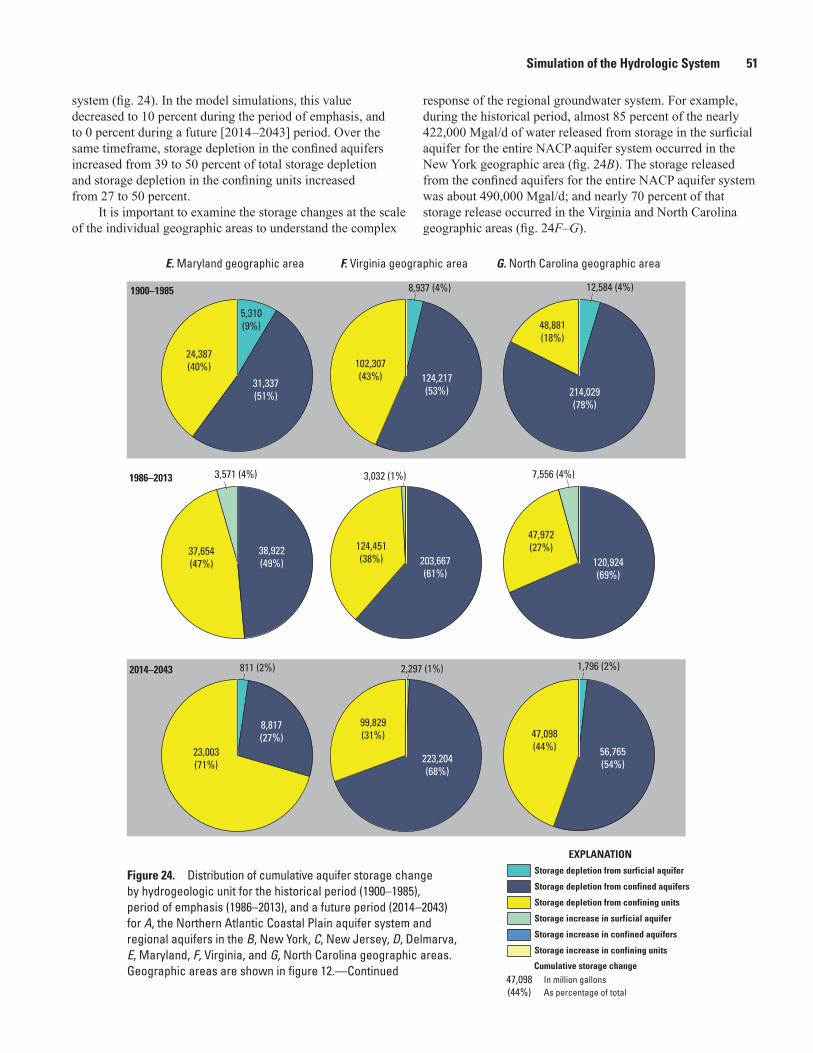
Simulation of the Hydrologic System 51
1900–1985
1986–2013
2014–2043
pp_masterson_nacp_fig24efg_new
E. Maryland geographic area F. Virginia geographic area G. North Carolina geographic area
5,310(9%)
31,337(51%)
24,387(40%)
38,922(49%)
37,654(47%)
3,571 (4%)
811 (2%)
8,817(27%)
23,003(71%)
8,937 (4%)
124,217(53%)
102,307(43%)
203,667(61%)
124,451(38%)
3,032 (1%)
2,297 (1%)
223,204(68%)
99,829(31%)
12,584 (4%)
214,029(78%)
48,881(18%)
120,924(69%)
47,972(27%)
7,556 (4%)
1,796 (2%)
56,765(54%)
47,098(44%)
Storage depletion from surficial aquifer
Storage depletion from confined aquifers
Storage depletion from confining units
Storage increase in surficial aquifer
Storage increase in confined aquifers
Storage increase in confining units
Cumulative storage change
EXPLANATION
47,098(44%)
In million gallonsAs percentage of total
system (fig. 24). In the model simulations, this value decreased to 10 percent during the period of emphasis, and to 0 percent during a future [2014 –2043] period. Over the same timeframe, storage depletion in the confined aquifers increased from 39 to 50 percent of total storage depletion and storage depletion in the confining units increased from 27 to 50 percent.
It is important to examine the storage changes at the scale of the individual geographic areas to understand the complex
response of the regional groundwater system. For example, during the historical period, almost 85 percent of the nearly 422,000 Mgal/d of water released from storage in the surficial aquifer for the entire NACP aquifer system occurred in the New York geographic area (fig. 24B). The storage released from the confined aquifers for the entire NACP aquifer system was about 490,000 Mgal/d; and nearly 70 percent of that storage release occurred in the Virginia and North Carolina geographic areas (fig. 24F–G).
Figure 24. Distribution of cumulative aquifer storage change by hydrogeologic unit for the historical period (1900–1985), period of emphasis (1986–2013), and a future period (2014 –2043) for A, the Northern Atlantic Coastal Plain aquifer system and regional aquifers in the B, New York, C, New Jersey, D, Delmarva, E, Maryland, F, Virginia, and G, North Carolina geographic areas. Geographic areas are shown in figure 12.—Continued
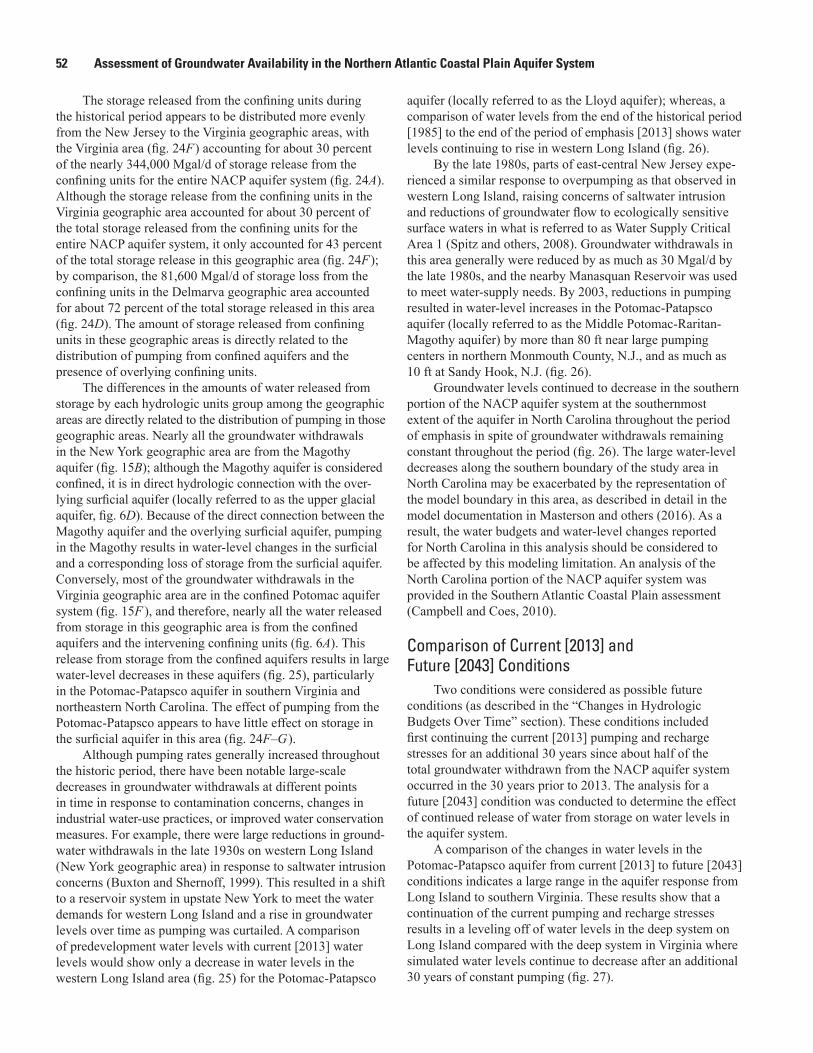
52 Assessment of Groundwater Availability in the Northern Atlantic Coastal Plain Aquifer System
The storage released from the confining units during the historical period appears to be distributed more evenly from the New Jersey to the Virginia geographic areas, with the Virginia area (fig. 24F ) accounting for about 30 percent of the nearly 344,000 Mgal/d of storage release from the confining units for the entire NACP aquifer system (fig. 24A). Although the storage release from the confining units in the Virginia geographic area accounted for about 30 percent of the total storage released from the confining units for the entire NACP aquifer system, it only accounted for 43 percent of the total storage release in this geographic area (fig. 24F ); by comparison, the 81,600 Mgal/d of storage loss from the confining units in the Delmarva geographic area accounted for about 72 percent of the total storage released in this area (fig. 24D). The amount of storage released from confining units in these geographic areas is directly related to the distribution of pumping from confined aquifers and the presence of overlying confining units.
The differences in the amounts of water released from storage by each hydrologic units group among the geographic areas are directly related to the distribution of pumping in those geographic areas. Nearly all the groundwater withdrawals in the New York geographic area are from the Magothy aquifer (fig. 15B); although the Magothy aquifer is considered confined, it is in direct hydrologic connection with the over-lying surficial aquifer (locally referred to as the upper glacial aquifer, fig. 6D). Because of the direct connection between the Magothy aquifer and the overlying surficial aquifer, pumping in the Magothy results in water-level changes in the surficial and a corresponding loss of storage from the surficial aquifer. Conversely, most of the groundwater withdrawals in the Virginia geographic area are in the confined Potomac aquifer system (fig. 15F ), and therefore, nearly all the water released from storage in this geographic area is from the confined aquifers and the intervening confining units (fig. 6A). This release from storage from the confined aquifers results in large water-level decreases in these aquifers (fig. 25), particularly in the Potomac-Patapsco aquifer in southern Virginia and northeastern North Carolina. The effect of pumping from the Potomac-Patapsco appears to have little effect on storage in the surficial aquifer in this area (fig. 24F–G ).
Although pumping rates generally increased throughout the historic period, there have been notable large-scale decreases in groundwater withdrawals at different points in time in response to contamination concerns, changes in industrial water-use practices, or improved water conservation measures. For example, there were large reductions in ground-water withdrawals in the late 1930s on western Long Island (New York geographic area) in response to saltwater intrusion concerns (Buxton and Shernoff, 1999). This resulted in a shift to a reservoir system in upstate New York to meet the water demands for western Long Island and a rise in groundwater levels over time as pumping was curtailed. A comparison of predevelopment water levels with current [2013] water levels would show only a decrease in water levels in the western Long Island area (fig. 25) for the Potomac-Patapsco
aquifer (locally referred to as the Lloyd aquifer); whereas, a comparison of water levels from the end of the historical period [1985] to the end of the period of emphasis [2013] shows water levels continuing to rise in western Long Island (fig. 26).
By the late 1980s, parts of east-central New Jersey expe-rienced a similar response to overpumping as that observed in western Long Island, raising concerns of saltwater intrusion and reductions of groundwater flow to ecologically sensitive surface waters in what is referred to as Water Supply Critical Area 1 (Spitz and others, 2008). Groundwater withdrawals in this area generally were reduced by as much as 30 Mgal/d by the late 1980s, and the nearby Manasquan Reservoir was used to meet water-supply needs. By 2003, reductions in pumping resulted in water-level increases in the Potomac-Patapsco aquifer (locally referred to as the Middle Potomac-Raritan-Magothy aquifer) by more than 80 ft near large pumping centers in northern Monmouth County, N.J., and as much as 10 ft at Sandy Hook, N.J. (fig. 26).
Groundwater levels continued to decrease in the southern portion of the NACP aquifer system at the southernmost extent of the aquifer in North Carolina throughout the period of emphasis in spite of groundwater withdrawals remaining constant throughout the period (fig. 26). The large water-level decreases along the southern boundary of the study area in North Carolina may be exacerbated by the representation of the model boundary in this area, as described in detail in the model documentation in Masterson and others (2016). As a result, the water budgets and water-level changes reported for North Carolina in this analysis should be considered to be affected by this modeling limitation. An analysis of the North Carolina portion of the NACP aquifer system was provided in the Southern Atlantic Coastal Plain assessment (Campbell and Coes, 2010).
Comparison of Current [2013] and Future [2043] Conditions
Two conditions were considered as possible future conditions (as described in the “Changes in Hydrologic Budgets Over Time” section). These conditions included first continuing the current [2013] pumping and recharge stresses for an additional 30 years since about half of the total groundwater withdrawn from the NACP aquifer system occurred in the 30 years prior to 2013. The analysis for a future [2043] condition was conducted to determine the effect of continued release of water from storage on water levels in the aquifer system.
A comparison of the changes in water levels in the Potomac-Patapsco aquifer from current [2013] to future [2043] conditions indicates a large range in the aquifer response from Long Island to southern Virginia. These results show that a continuation of the current pumping and recharge stresses results in a leveling off of water levels in the deep system on Long Island compared with the deep system in Virginia where simulated water levels continue to decrease after an additional 30 years of constant pumping (fig. 27).
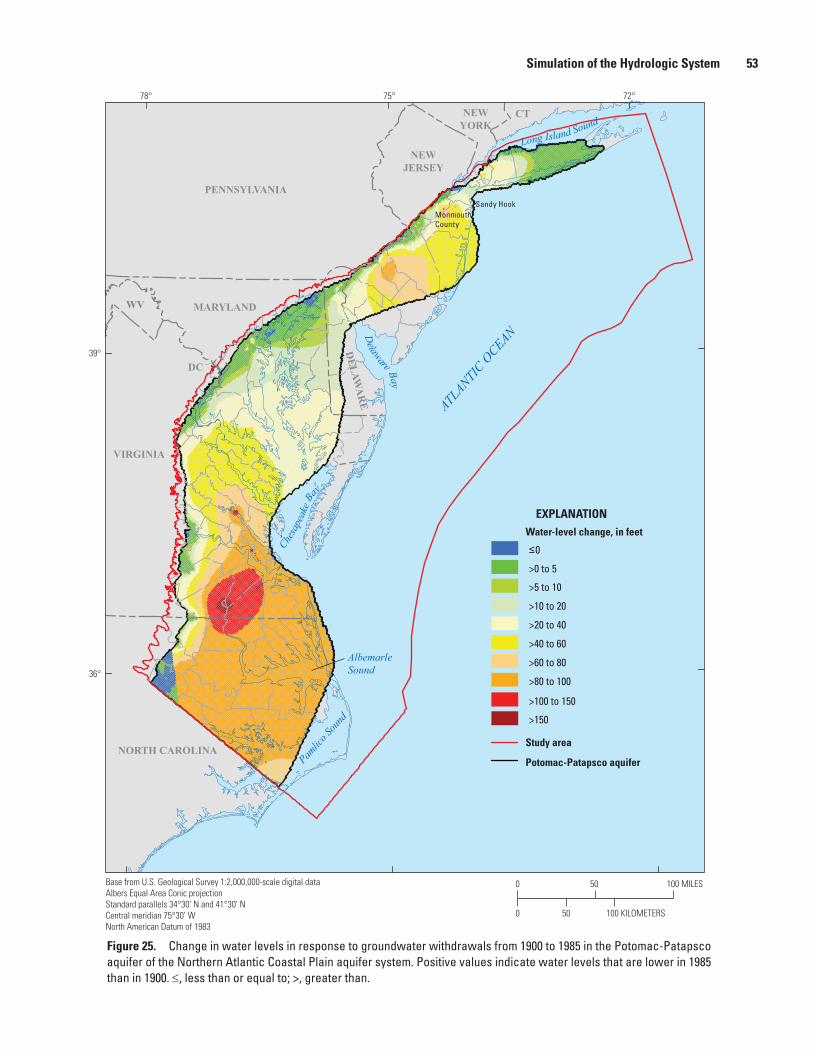
Simulation of the Hydrologic System 53
Study area
EXPLANATION
Potomac-Patapsco aquifer
Water-level change, in feet
≤0
>0 to 5
>5 to 10
>10 to 20
>20 to 40
>40 to 60
>60 to 80
>80 to 100
>100 to 150
>150
0 50 100 MILES
0 50 100 KILOMETERS
Base from U.S. Geological Survey 1:2,000,000-scale digital dataAlbers Equal Area Conic projectionStandard parallels 34°30' N and 41°30' NCentral meridian 75°30' W North American Datum of 1983
MonmouthCounty
Sandy Hook
72°75°78°
39°
36°
Chesa
peak
e Ba
y
Delaware Bay
Long Island SoundCTNEW
YORK
NEWJERSEY
PENNSYLVANIA
MARYLAND
DC
DELAW
AR
EVIRGINIA
NORTH CAROLINA
ATLANTI
C OCEAN
Pamlic
o Sou
nd
Albemarle Sound
pp_masterson_nacp_fig25_new
WV
Figure 25. Change in water levels in response to groundwater withdrawals from 1900 to 1985 in the Potomac-Patapsco aquifer of the Northern Atlantic Coastal Plain aquifer system. Positive values indicate water levels that are lower in 1985 than in 1900. ≤, less than or equal to; >, greater than.
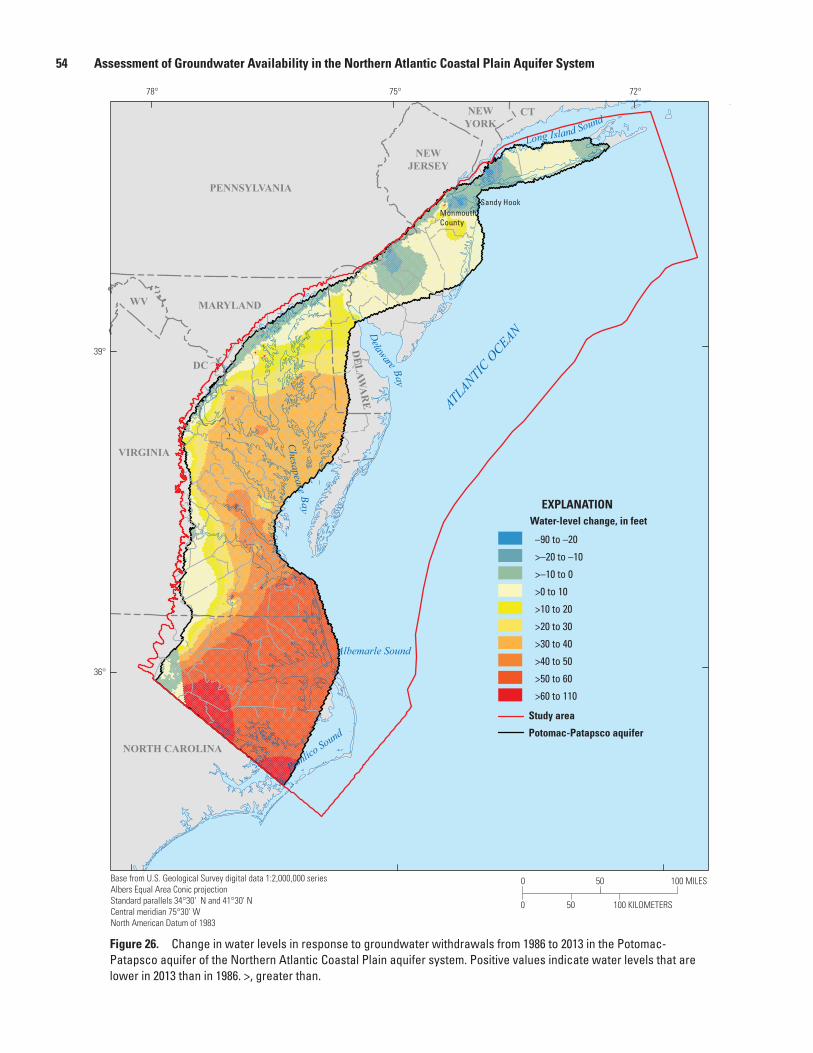
54 Assessment of Groundwater Availability in the Northern Atlantic Coastal Plain Aquifer System
Study area
EXPLANATION
Potomac-Patapsco aquifer
Water-level change, in feet
–90 to –20
>–20 to –10
>–10 to 0
>0 to 10
>10 to 20
>20 to 30
>30 to 40
>40 to 50
>50 to 60
>60 to 110
0 100 KILOMETERS
0 50
50
100 MILES
MonmouthCounty
Sandy Hook
Base from U.S. Geological Survey digital data 1:2,000,000 seriesAlbers Equal Area Conic projectionStandard parallels 34°30' N and 41°30' NCentral meridian 75°30' W North American Datum of 1983
72°75°78°
39°
36°
Chesapeake Bay
Delaware Bay
Long Island SoundCTNEW
YORK
NEWJERSEY
PENNSYLVANIA
MARYLAND
DC
DELAW
AR
EVIRGINIA
NORTH CAROLINA
ATLANTI
C OCEAN
Pamlico Sound
Albemarle Sound
pp_masterson_nacp_fig26_new
WV
Figure 26. Change in water levels in response to groundwater withdrawals from 1986 to 2013 in the Potomac-Patapsco aquifer of the Northern Atlantic Coastal Plain aquifer system. Positive values indicate water levels that are lower in 2013 than in 1986. >, greater than.
Simulation of the Hydrologic System 55
Study area
EXPLANATION
Potomac-Patapsco aquifer
Water-level change, in feet
≤0.1
>0.1 to 5
>5 to 10
>10 to 15
>15 to 20
>20 to 25
>25 to 30
≥30
0 100 KILOMETERS
0 50
50
100 MILES
MonmouthCounty
Sandy Hook
Base from U.S. Geological Survey 1:2,000,000-scale digital dataAlbers Equal Area Conic projectionStandard parallels 34°30' N and 41°30' NCentral meridian 75°30' W North American Datum of 1983
72°75°78°
39°
36°
Chesapeake Bay
Delaware Bay
Long Island SoundCTNEW
YORK
NEWJERSEY
PENNSYLVANIA
MARYLAND
DC
VIRGINIA
NORTH CAROLINA
ATLANTI
C OCEAN
Pamlic
o Sou
nd
Albemarle Sound
DELAW
AR
E
WV
pp_masterson_nacp_fig27_new
Figure 27. Change in water levels in projected response to groundwater withdrawals from 2013 to 2043 in the Potomac-Patapsco aquifer of the Northern Atlantic Coastal Plain aquifer system. Positive values indicate water levels that are lower in 2043 than in 2013. ≤, less than or equal to; ≥, greater than or equal to.
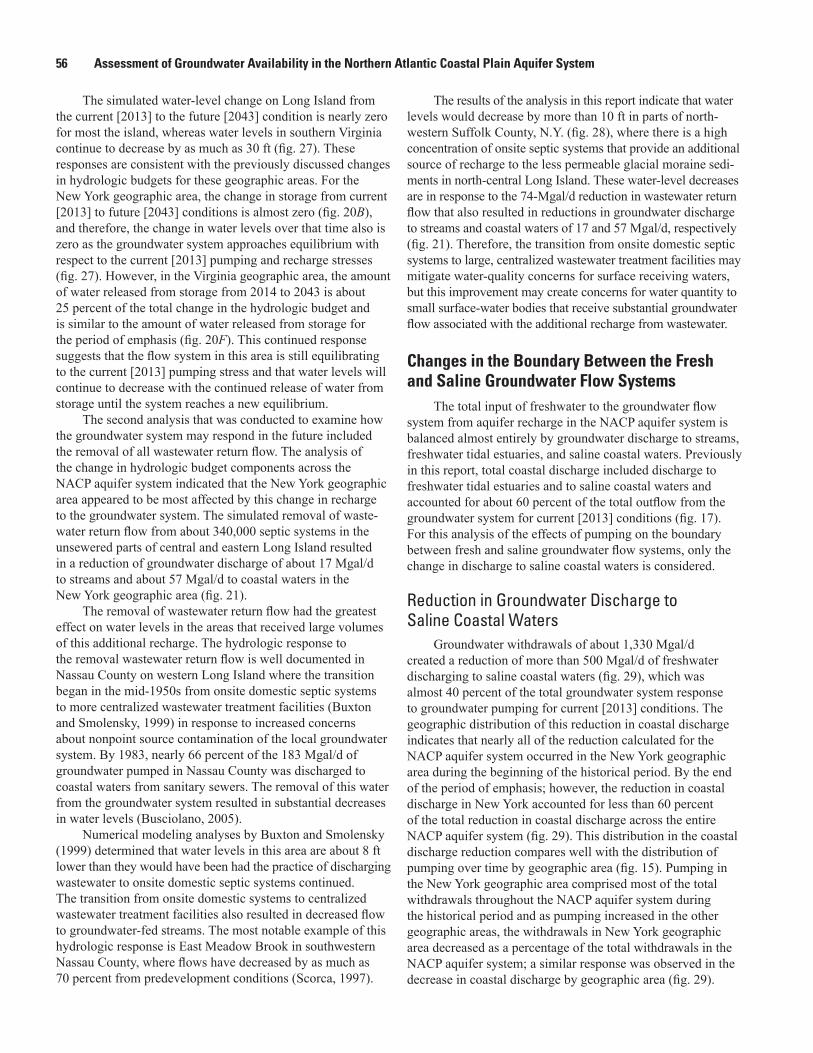
56 Assessment of Groundwater Availability in the Northern Atlantic Coastal Plain Aquifer System
The simulated water-level change on Long Island from the current [2013] to the future [2043] condition is nearly zero for most the island, whereas water levels in southern Virginia continue to decrease by as much as 30 ft (fig. 27). These responses are consistent with the previously discussed changes in hydrologic budgets for these geographic areas. For the New York geographic area, the change in storage from current [2013] to future [2043] conditions is almost zero (fig. 20B), and therefore, the change in water levels over that time also is zero as the groundwater system approaches equilibrium with respect to the current [2013] pumping and recharge stresses (fig. 27). However, in the Virginia geographic area, the amount of water released from storage from 2014 to 2043 is about 25 percent of the total change in the hydrologic budget and is similar to the amount of water released from storage for the period of emphasis (fig. 20F). This continued response suggests that the flow system in this area is still equilibrating to the current [2013] pumping stress and that water levels will continue to decrease with the continued release of water from storage until the system reaches a new equilibrium.
The second analysis that was conducted to examine how the groundwater system may respond in the future included the removal of all wastewater return flow. The analysis of the change in hydrologic budget components across the NACP aquifer system indicated that the New York geographic area appeared to be most affected by this change in recharge to the groundwater system. The simulated removal of waste-water return flow from about 340,000 septic systems in the unsewered parts of central and eastern Long Island resulted in a reduction of groundwater discharge of about 17 Mgal/d to streams and about 57 Mgal/d to coastal waters in the New York geographic area (fig. 21).
The removal of wastewater return flow had the greatest effect on water levels in the areas that received large volumes of this additional recharge. The hydrologic response to the removal wastewater return flow is well documented in Nassau County on western Long Island where the transition began in the mid-1950s from onsite domestic septic systems to more centralized wastewater treatment facilities (Buxton and Smolensky, 1999) in response to increased concerns about nonpoint source contamination of the local groundwater system. By 1983, nearly 66 percent of the 183 Mgal/d of groundwater pumped in Nassau County was discharged to coastal waters from sanitary sewers. The removal of this water from the groundwater system resulted in substantial decreases in water levels (Busciolano, 2005).
Numerical modeling analyses by Buxton and Smolensky (1999) determined that water levels in this area are about 8 ft lower than they would have been had the practice of discharging wastewater to onsite domestic septic systems continued. The transition from onsite domestic systems to centralized wastewater treatment facilities also resulted in decreased flow to groundwater-fed streams. The most notable example of this hydrologic response is East Meadow Brook in southwestern Nassau County, where flows have decreased by as much as 70 percent from predevelopment conditions (Scorca, 1997).
The results of the analysis in this report indicate that water levels would decrease by more than 10 ft in parts of north-western Suffolk County, N.Y. (fig. 28), where there is a high concen tration of onsite septic systems that provide an additional source of recharge to the less permeable glacial moraine sedi-ments in north-central Long Island. These water-level decreases are in response to the 74-Mgal/d reduction in wastewater return flow that also resulted in reductions in groundwater discharge to streams and coastal waters of 17 and 57 Mgal/d, respectively (fig. 21). Therefore, the transition from onsite domestic septic systems to large, centralized wastewater treatment facilities may mitigate water-quality concerns for surface receiving waters, but this improvement may create concerns for water quantity to small surface-water bodies that receive substantial groundwater flow associated with the additional recharge from wastewater.
Changes in the Boundary Between the Fresh and Saline Groundwater Flow Systems
The total input of freshwater to the groundwater flow system from aquifer recharge in the NACP aquifer system is balanced almost entirely by groundwater discharge to streams, freshwater tidal estuaries, and saline coastal waters. Previously in this report, total coastal discharge included discharge to freshwater tidal estuaries and to saline coastal waters and accounted for about 60 percent of the total outflow from the groundwater system for current [2013] conditions (fig. 17). For this analysis of the effects of pumping on the boundary between fresh and saline groundwater flow systems, only the change in discharge to saline coastal waters is considered.
Reduction in Groundwater Discharge to Saline Coastal Waters
Groundwater withdrawals of about 1,330 Mgal/d created a reduction of more than 500 Mgal/d of freshwater discharging to saline coastal waters (fig. 29), which was almost 40 percent of the total groundwater system response to groundwater pumping for current [2013] conditions. The geographic distribution of this reduction in coastal discharge indicates that nearly all of the reduction calculated for the NACP aquifer system occurred in the New York geographic area during the beginning of the historical period. By the end of the period of emphasis; however, the reduction in coastal discharge in New York accounted for less than 60 percent of the total reduction in coastal discharge across the entire NACP aquifer system (fig. 29). This distribution in the coastal discharge reduction compares well with the distribution of pumping over time by geographic area (fig. 15). Pumping in the New York geographic area comprised most of the total withdrawals throughout the NACP aquifer system during the historical period and as pumping increased in the other geographic areas, the withdrawals in New York geographic area decreased as a percentage of the total withdrawals in the NACP aquifer system; a similar response was observed in the decrease in coastal discharge by geographic area (fig. 29).
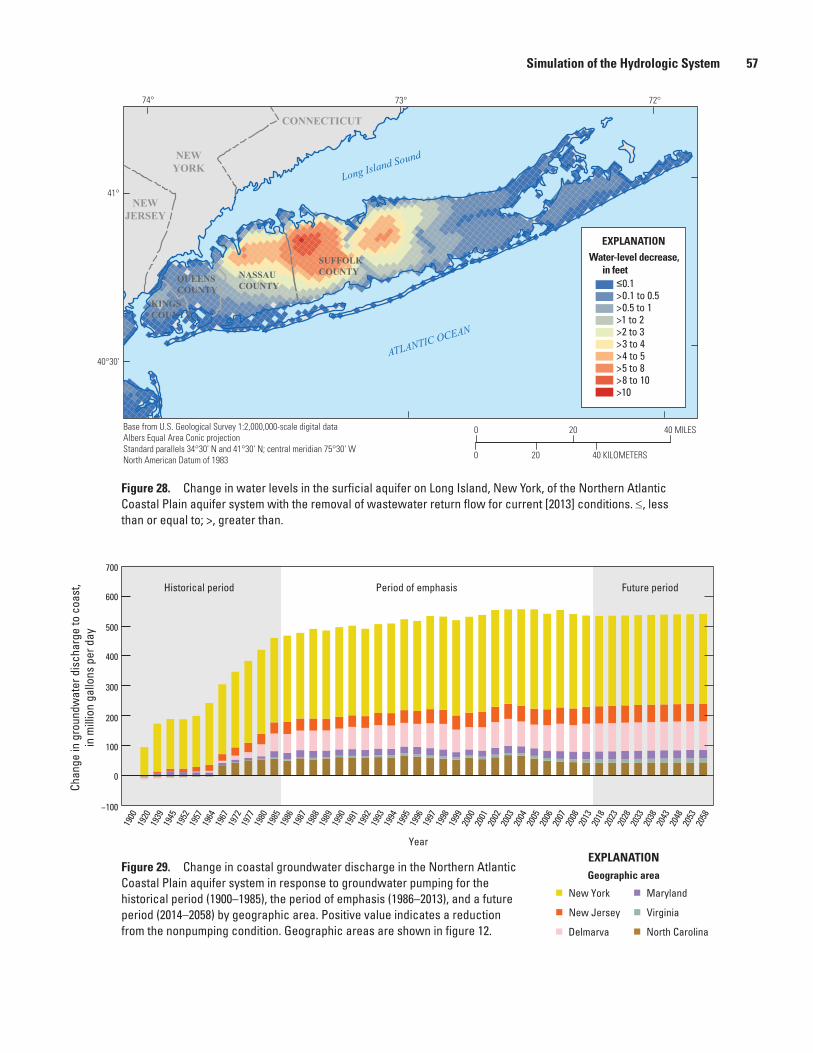
Simulation of the Hydrologic System 57
40°30'
74°
41°
73° 72°
ATLANTIC OCEAN
NEWYORK
CONNECTICUT
NEWJERSEY
SUFFOLKCOUNTYNASSAU
COUNTYQUEENSCOUNTY
KINGSCOUNTY
Long Island Sound
0 20
20
40 MILES
0 40 KILOMETERS
EXPLANATIONWater-level decrease,
in feet≤0.1>0.1 to 0.5>0.5 to 1>1 to 2>2 to 3>3 to 4>4 to 5>5 to 8>8 to 10>10
Base from U.S. Geological Survey 1:2,000,000-scale digital dataAlbers Equal Area Conic projectionStandard parallels 34°30' N and 41°30' N; central meridian 75°30' W North American Datum of 1983
pp_masterson_nacp_fig28_new
North Carolina
Maryland
Virginia
Delmarva
New York
New Jersey
EXPLANATION
2058
2053
2048
2043
2038
2033
2028
2023
2018
2013
2008
2007
2006
2005
2004
2003
2002
2001
2000
1999
1998
1997
1996
1995
1994
1993
1992
1991
1990
1989
1988
1987
1986
1985
1980
1977
1972
1967
1964
1957
1952
1945
1939
1920
1900
Year
Chan
ge in
gro
undw
ater
dis
char
ge to
coa
st,
in m
illio
n ga
llons
per
day
300
200
100
0
−100
400
500
600
700
Historical period Future periodPeriod of emphasis
Geographic area
pp_masterson_nacp_fig29_new
Figure 28. Change in water levels in the surficial aquifer on Long Island, New York, of the Northern Atlantic Coastal Plain aquifer system with the removal of wastewater return flow for current [2013] conditions. ≤, less than or equal to; >, greater than.
Figure 29. Change in coastal groundwater discharge in the Northern Atlantic Coastal Plain aquifer system in response to groundwater pumping for the historical period (1900–1985), the period of emphasis (1986–2013), and a future period (2014–2058) by geographic area. Positive value indicates a reduction from the nonpumping condition. Geographic areas are shown in figure 12.
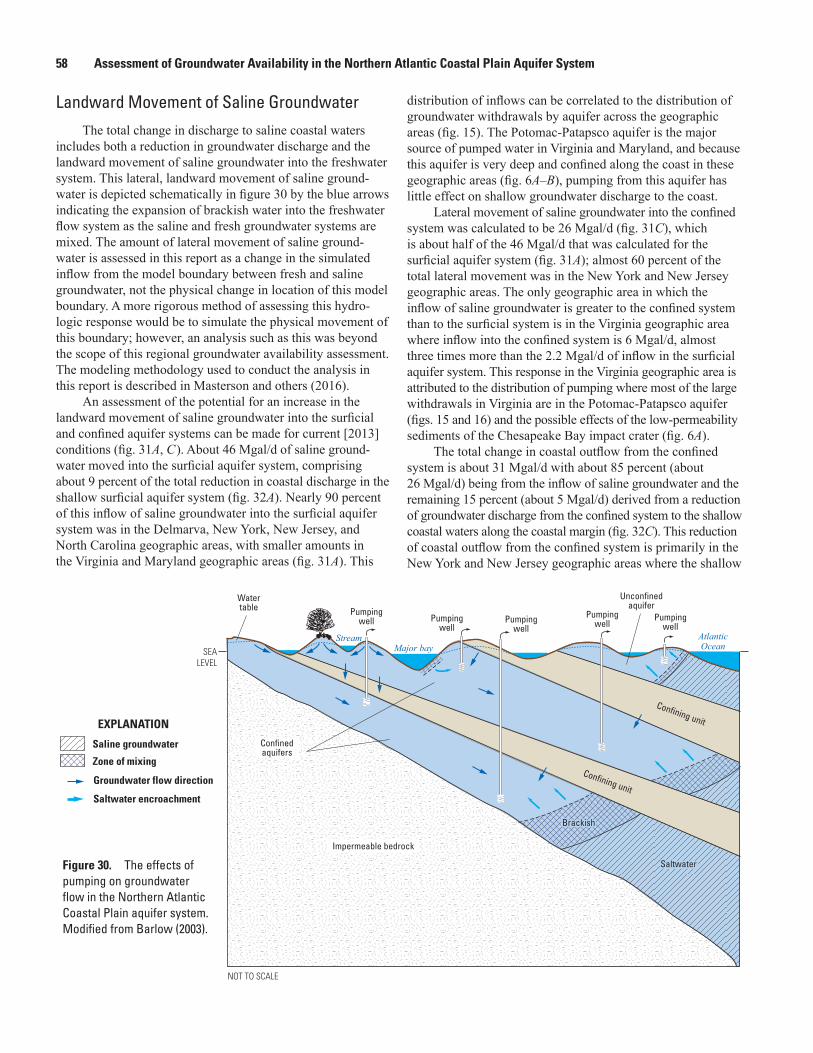
58 Assessment of Groundwater Availability in the Northern Atlantic Coastal Plain Aquifer System
Landward Movement of Saline GroundwaterThe total change in discharge to saline coastal waters
includes both a reduction in groundwater discharge and the landward movement of saline groundwater into the freshwater system. This lateral, landward movement of saline ground-water is depicted schematically in figure 30 by the blue arrows indicating the expansion of brackish water into the freshwater flow system as the saline and fresh groundwater systems are mixed. The amount of lateral movement of saline ground-water is assessed in this report as a change in the simulated inflow from the model boundary between fresh and saline groundwater, not the physical change in location of this model boundary. A more rigorous method of assessing this hydro-logic response would be to simulate the physical movement of this boundary; however, an analysis such as this was beyond the scope of this regional groundwater availability assessment. The modeling methodology used to conduct the analysis in this report is described in Masterson and others (2016).
An assessment of the potential for an increase in the landward movement of saline groundwater into the surficial and confined aquifer systems can be made for current [2013] conditions (fig. 31A, C ). About 46 Mgal/d of saline ground-water moved into the surficial aquifer system, comprising about 9 percent of the total reduction in coastal discharge in the shallow surficial aquifer system (fig. 32A). Nearly 90 percent of this inflow of saline groundwater into the surficial aquifer system was in the Delmarva, New York, New Jersey, and North Carolina geographic areas, with smaller amounts in the Virginia and Maryland geographic areas (fig. 31A). This
distribution of inflows can be correlated to the distribution of groundwater withdrawals by aquifer across the geographic areas (fig. 15). The Potomac-Patapsco aquifer is the major source of pumped water in Virginia and Maryland, and because this aquifer is very deep and confined along the coast in these geographic areas (fig. 6A–B), pumping from this aquifer has little effect on shallow groundwater discharge to the coast.
Lateral movement of saline groundwater into the confined system was calculated to be 26 Mgal/d (fig. 31C), which is about half of the 46 Mgal/d that was calculated for the surficial aquifer system (fig. 31A); almost 60 percent of the total lateral movement was in the New York and New Jersey geographic areas. The only geographic area in which the inflow of saline groundwater is greater to the confined system than to the surficial system is in the Virginia geographic area where inflow into the confined system is 6 Mgal/d, almost three times more than the 2.2 Mgal/d of inflow in the surficial aquifer system. This response in the Virginia geographic area is attributed to the distribution of pumping where most of the large withdrawals in Virginia are in the Potomac-Patapsco aquifer (figs. 15 and 16) and the possible effects of the low-permeability sediments of the Chesapeake Bay impact crater (fig. 6A).
The total change in coastal outflow from the confined system is about 31 Mgal/d with about 85 percent (about 26 Mgal/d) being from the inflow of saline groundwater and the remaining 15 percent (about 5 Mgal/d) derived from a reduction of groundwater discharge from the confined system to the shallow coastal waters along the coastal margin (fig. 32C). This reduction of coastal outflow from the confined system is primarily in the New York and New Jersey geographic areas where the shallow
Confining unit
Confining unit
Unconfinedaquifer
Pumpingwell Pumping
wellPumping
wellPumping
wellPumping
well
NOT TO SCALE
StreamMajor bay
AtlanticOcean
Watertable
SEALEVEL
Saltwater
Confinedaquifers
Impermeable bedrock
Groundwater flow direction
Saltwater encroachment
Brackish
EXPLANATION
Saline groundwater
Zone of mixing
pp_masterson_nacp_fig30_new
Figure 30. The effects of pumping on groundwater flow in the Northern Atlantic Coastal Plain aquifer system. Modified from Barlow (2003).
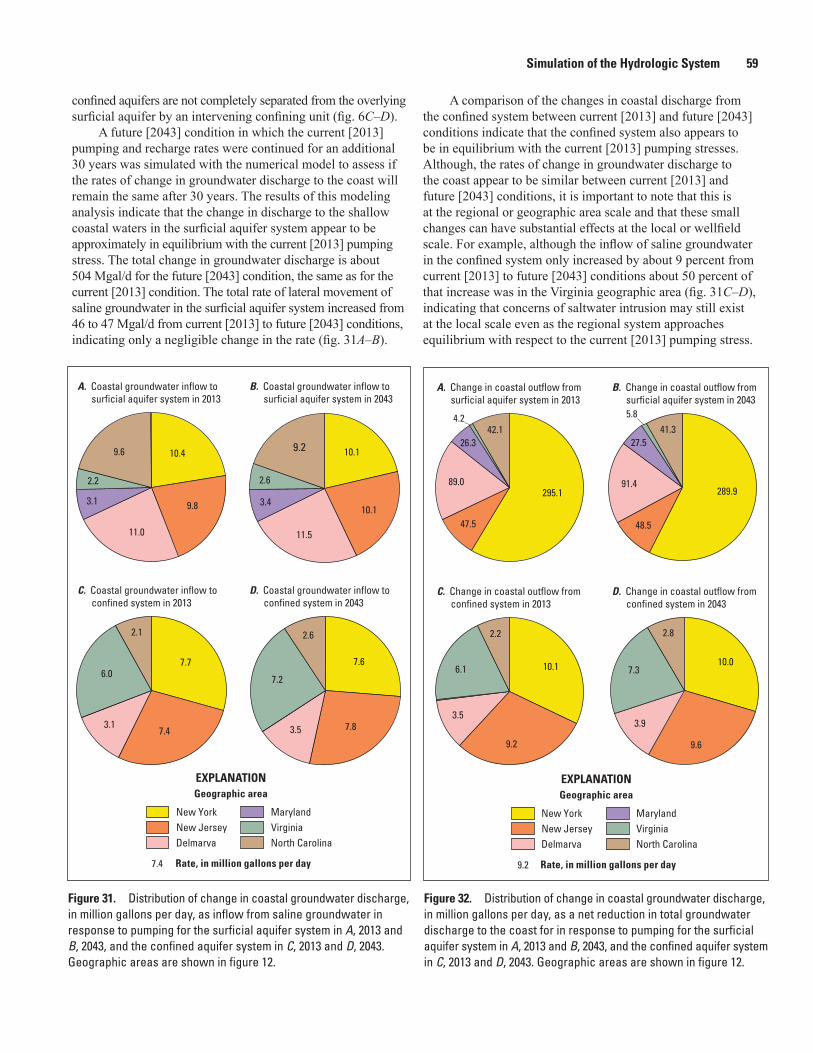
Simulation of the Hydrologic System 59
confined aquifers are not completely separated from the overlying surficial aquifer by an intervening confining unit (fig. 6C–D).
A future [2043] condition in which the current [2013] pumping and recharge rates were continued for an additional 30 years was simulated with the numerical model to assess if the rates of change in groundwater discharge to the coast will remain the same after 30 years. The results of this modeling analysis indicate that the change in discharge to the shallow coastal waters in the surficial aquifer system appear to be approximately in equilibrium with the current [2013] pumping stress. The total change in groundwater discharge is about 504 Mgal/d for the future [2043] condition, the same as for the current [2013] condition. The total rate of lateral movement of saline groundwater in the surficial aquifer system increased from 46 to 47 Mgal/d from current [2013] to future [2043] conditions, indicating only a negligible change in the rate (fig. 31A–B).
A comparison of the changes in coastal discharge from the confined system between current [2013] and future [2043] conditions indicate that the confined system also appears to be in equilibrium with the current [2013] pumping stresses. Although, the rates of change in groundwater discharge to the coast appear to be similar between current [2013] and future [2043] conditions, it is important to note that this is at the regional or geographic area scale and that these small changes can have substantial effects at the local or wellfield scale. For example, although the inflow of saline groundwater in the confined system only increased by about 9 percent from current [2013] to future [2043] conditions about 50 percent of that increase was in the Virginia geographic area (fig. 31C–D), indicating that concerns of saltwater intrusion may still exist at the local scale even as the regional system approaches equilibrium with respect to the current [2013] pumping stress.
pp_masterson_nacp_fig31_new
North Carolina
MarylandVirginia
Delmarva
New YorkNew Jersey
EXPLANATIONGeographic area
9.6
3.1
2.2
11.0
9.8
10.4
A. Coastal groundwater inflow to surficial aquifer system in 2013
7.6
2.6
7.2
3.5 7.8
D. Coastal groundwater inflow to confined system in 2043
9.2
3.4
2.6
11.5
10.1
10.1
B. Coastal groundwater inflow to surficial aquifer system in 2043
7.7
2.1
6.0
3.17.4
7.4
C. Coastal groundwater inflow to confined system in 2013
Rate, in million gallons per day
pp_masterson_nacp_fig32_new
10.1
2.2
6.1
3.5
9.2
C. Change in coastal outflow from confined system in 2013
42.14.2
89.0
47.5
26.3
295.1
A. Change in coastal outflow from surficial aquifer system in 2013
41.3
5.8
91.4
48.5
27.5
289.9
B. Change in coastal outflow from surficial aquifer system in 2043
10.0
2.8
7.3
3.9
9.6
D. Change in coastal outflow from confined system in 2043
North Carolina
MarylandVirginia
Delmarva
New YorkNew Jersey
EXPLANATIONGeographic area
9.2 Rate, in million gallons per day
Figure 31. Distribution of change in coastal groundwater discharge, in million gallons per day, as inflow from saline groundwater in response to pumping for the surficial aquifer system in A, 2013 and B, 2043, and the confined aquifer system in C, 2013 and D, 2043. Geographic areas are shown in figure 12.
Figure 32. Distribution of change in coastal groundwater discharge, in million gallons per day, as a net reduction in total groundwater discharge to the coast for in response to pumping for the surficial aquifer system in A, 2013 and B, 2043, and the confined aquifer system in C, 2013 and D, 2043. Geographic areas are shown in figure 12.
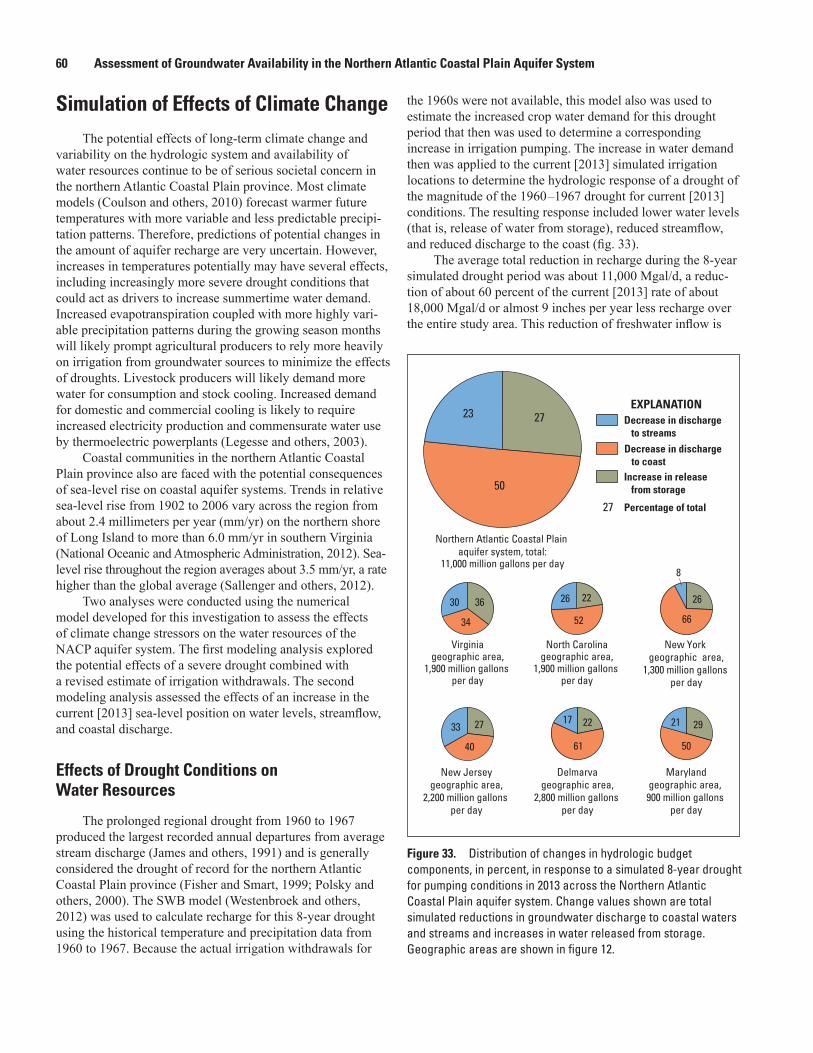
60 Assessment of Groundwater Availability in the Northern Atlantic Coastal Plain Aquifer System
Simulation of Effects of Climate ChangeThe potential effects of long-term climate change and
variability on the hydrologic system and availability of water resources continue to be of serious societal concern in the northern Atlantic Coastal Plain province. Most climate models (Coulson and others, 2010) forecast warmer future temperatures with more variable and less predictable precipi-tation patterns. Therefore, predictions of potential changes in the amount of aquifer recharge are very uncertain. However, increases in temperatures potentially may have several effects, including increasingly more severe drought conditions that could act as drivers to increase summertime water demand. Increased evapotranspiration coupled with more highly vari-able precipitation patterns during the growing season months will likely prompt agricultural producers to rely more heavily on irrigation from groundwater sources to minimize the effects of droughts. Livestock producers will likely demand more water for consumption and stock cooling. Increased demand for domestic and commercial cooling is likely to require increased electricity production and commensurate water use by thermoelectric powerplants (Legesse and others, 2003).
Coastal communities in the northern Atlantic Coastal Plain province also are faced with the potential consequences of sea-level rise on coastal aquifer systems. Trends in relative sea-level rise from 1902 to 2006 vary across the region from about 2.4 millimeters per year (mm/yr) on the northern shore of Long Island to more than 6.0 mm/yr in southern Virginia (National Oceanic and Atmospheric Administration, 2012). Sea-level rise throughout the region averages about 3.5 mm/yr, a rate higher than the global average (Sallenger and others, 2012).
Two analyses were conducted using the numerical model developed for this investigation to assess the effects of climate change stressors on the water resources of the NACP aquifer system. The first modeling analysis explored the potential effects of a severe drought combined with a revised estimate of irrigation withdrawals. The second modeling analysis assessed the effects of an increase in the current [2013] sea-level position on water levels, streamflow, and coastal discharge.
Effects of Drought Conditions on Water Resources
The prolonged regional drought from 1960 to 1967 produced the largest recorded annual departures from average stream discharge (James and others, 1991) and is generally considered the drought of record for the northern Atlantic Coastal Plain province (Fisher and Smart, 1999; Polsky and others, 2000). The SWB model (Westenbroek and others, 2012) was used to calculate recharge for this 8-year drought using the historical temperature and precipitation data from 1960 to 1967. Because the actual irrigation withdrawals for
the 1960s were not available, this model also was used to estimate the increased crop water demand for this drought period that then was used to determine a corresponding increase in irrigation pumping. The increase in water demand then was applied to the current [2013] simulated irrigation locations to determine the hydrologic response of a drought of the magnitude of the 1960 –1967 drought for current [2013] conditions. The resulting response included lower water levels (that is, release of water from storage), reduced streamflow, and reduced discharge to the coast (fig. 33).
The average total reduction in recharge during the 8-year simulated drought period was about 11,000 Mgal/d, a reduc-tion of about 60 percent of the current [2013] rate of about 18,000 Mgal/d or almost 9 inches per year less recharge over the entire study area. This reduction of freshwater inflow is
pp_masterson_nacp_fig33_new
27
27
50
23
26
66
8
27
40
33 22
61
17 29
50
21
36
34
30 22
52
26
Increase in release from storage
Percentage of total
Decrease in discharge to streamsDecrease in discharge to coast
EXPLANATION
Northern Atlantic Coastal Plain aquifer system, total:
11,000 million gallons per day
Virginiageographic area,
1,900 million gallons per day
North Carolinageographic area,
1,900 million gallons per day
New York geographic area,
1,300 million gallons per day
New Jerseygeographic area,
2,200 million gallons per day
Delmarvageographic area,
2,800 million gallons per day
Marylandgeographic area, 900 million gallons
per day
Figure 33. Distribution of changes in hydrologic budget components, in percent, in response to a simulated 8-year drought for pumping conditions in 2013 across the Northern Atlantic Coastal Plain aquifer system. Change values shown are total simulated reductions in groundwater discharge to coastal waters and streams and increases in water released from storage. Geographic areas are shown in figure 12.
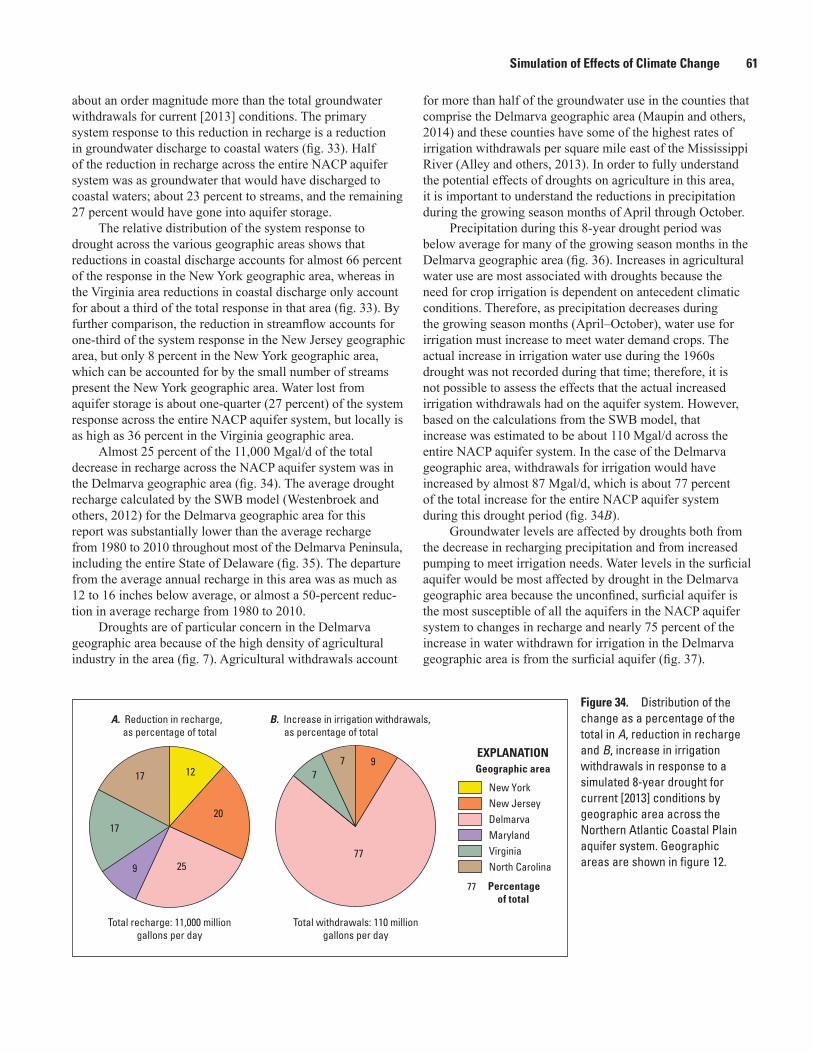
Simulation of Effects of Climate Change 61
about an order magnitude more than the total groundwater withdrawals for current [2013] conditions. The primary system response to this reduction in recharge is a reduction in groundwater discharge to coastal waters (fig. 33). Half of the reduction in recharge across the entire NACP aquifer system was as groundwater that would have discharged to coastal waters; about 23 percent to streams, and the remaining 27 percent would have gone into aquifer storage.
The relative distribution of the system response to drought across the various geographic areas shows that reductions in coastal discharge accounts for almost 66 percent of the response in the New York geographic area, whereas in the Virginia area reductions in coastal discharge only account for about a third of the total response in that area (fig. 33). By further comparison, the reduction in streamflow accounts for one-third of the system response in the New Jersey geographic area, but only 8 percent in the New York geographic area, which can be accounted for by the small number of streams present the New York geographic area. Water lost from aquifer storage is about one-quarter (27 percent) of the system response across the entire NACP aquifer system, but locally is as high as 36 percent in the Virginia geographic area.
Almost 25 percent of the 11,000 Mgal/d of the total decrease in recharge across the NACP aquifer system was in the Delmarva geographic area (fig. 34). The average drought recharge calculated by the SWB model (Westenbroek and others, 2012) for the Delmarva geographic area for this report was substantially lower than the average recharge from 1980 to 2010 throughout most of the Delmarva Peninsula, including the entire State of Delaware (fig. 35). The departure from the average annual recharge in this area was as much as 12 to 16 inches below average, or almost a 50-percent reduc-tion in average recharge from 1980 to 2010.
Droughts are of particular concern in the Delmarva geographic area because of the high density of agricultural industry in the area (fig. 7). Agricultural withdrawals account
for more than half of the groundwater use in the counties that comprise the Delmarva geographic area (Maupin and others, 2014) and these counties have some of the highest rates of irrigation withdrawals per square mile east of the Mississippi River (Alley and others, 2013). In order to fully understand the potential effects of droughts on agriculture in this area, it is important to understand the reductions in precipitation during the growing season months of April through October.
Precipitation during this 8-year drought period was below average for many of the growing season months in the Delmarva geographic area (fig. 36). Increases in agricultural water use are most associated with droughts because the need for crop irrigation is dependent on antecedent climatic conditions. Therefore, as precipitation decreases during the growing season months (April–October), water use for irrigation must increase to meet water demand crops. The actual increase in irrigation water use during the 1960s drought was not recorded during that time; therefore, it is not possible to assess the effects that the actual increased irrigation withdrawals had on the aquifer system. However, based on the calculations from the SWB model, that increase was estimated to be about 110 Mgal/d across the entire NACP aquifer system. In the case of the Delmarva geographic area, withdrawals for irrigation would have increased by almost 87 Mgal/d, which is about 77 percent of the total increase for the entire NACP aquifer system during this drought period (fig. 34B).
Groundwater levels are affected by droughts both from the decrease in recharging precipitation and from increased pumping to meet irrigation needs. Water levels in the surficial aquifer would be most affected by drought in the Delmarva geographic area because the unconfined, surficial aquifer is the most susceptible of all the aquifers in the NACP aquifer system to changes in recharge and nearly 75 percent of the increase in water withdrawn for irrigation in the Delmarva geographic area is from the surficial aquifer (fig. 37).
Figure 34. Distribution of the change as a percentage of the total in A, reduction in recharge and B, increase in irrigation withdrawals in response to a simulated 8-year drought for current [2013] conditions by geographic area across the Northern Atlantic Coastal Plain aquifer system. Geographic areas are shown in figure 12.
pp_masterson_nacp_fig34_new
9
77
77
12
20
259
17
17
Total withdrawals: 110 milliongallons per day
Total recharge: 11,000 milliongallons per day
A. Reduction in recharge, as percentage of total
B. Increase in irrigation withdrawals, as percentage of total
North Carolina
MarylandVirginia
Delmarva
New YorkNew Jersey
EXPLANATIONGeographic area
77 Percentage of total
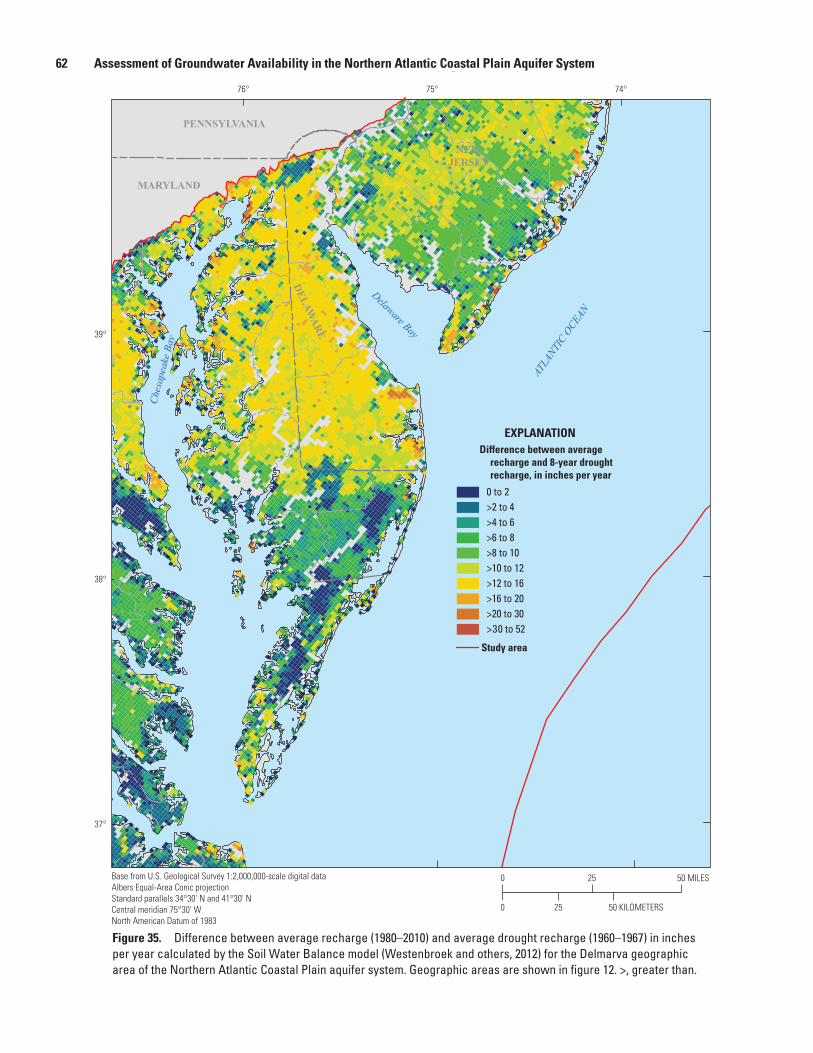
62 Assessment of Groundwater Availability in the Northern Atlantic Coastal Plain Aquifer System
Base from U.S. Geological Survey 1:2,000,000-scale digital dataAlbers Equal-Area Conic projectionStandard parallels 34°30' N and 41°30' NCentral meridian 75°30' W North American Datum of 1983
0 to 2>2 to 4>4 to 6>6 to 8>8 to 10>10 to 12>12 to 16>16 to 20>20 to 30>30 to 52
EXPLANATIONDifference between average
recharge and 8-year drought recharge, in inches per year
Study area
pp_masterson_nacp_fig35_new
0 25 50 MILES
0 25 50 KILOMETERS
39°
38°
37°
76° 75° 74°
NEWJERSEY
PENNSYLVANIA
MARYLAND
DELAWARE
Ches
apea
ke B
ay
Delaware Bay
ATLA
NTIC O
CEAN
Figure 35. Difference between average recharge (1980–2010) and average drought recharge (1960–1967) in inches per year calculated by the Soil Water Balance model (Westenbroek and others, 2012) for the Delmarva geographic area of the Northern Atlantic Coastal Plain aquifer system. Geographic areas are shown in figure 12. >, greater than.
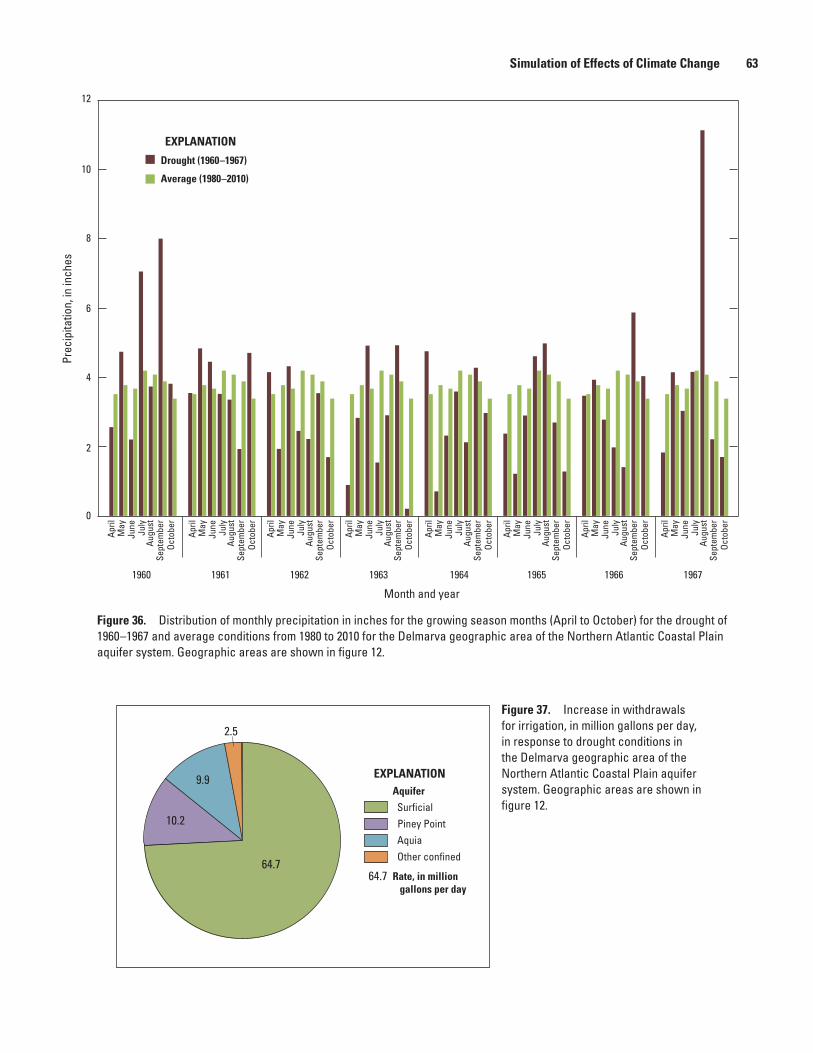
Simulation of Effects of Climate Change 63
Month and year
1960 1961 1962 1963 1964 1965 1966 1967
Prec
ipita
tion,
in in
ches
Drought (1960–1967)
Average (1980–2010)
EXPLANATION
April
May
June
July
Augu
stSe
ptem
ber
Octo
ber
April
May
June
July
Augu
stSe
ptem
ber
Octo
ber
April
May
June
July
Augu
stSe
ptem
ber
Octo
ber
April
May
June
July
Augu
stSe
ptem
ber
Octo
ber
April
May
June
July
Augu
stSe
ptem
ber
Octo
ber
April
May
June
July
Augu
stSe
ptem
ber
Octo
ber
April
May
June
July
Augu
stSe
ptem
ber
Octo
ber
April
May
June
July
Augu
stSe
ptem
ber
Octo
ber
12
10
8
6
4
2
0
pp_masterson_nacp_fig36_new
Other confinedAquia
Surficial Aquifer
Rate, in million gallons per day
Piney Point
EXPLANATION
2.5
64.764.7
10.2
9.9
pp_masterson_nacp_fig37_new
Figure 36. Distribution of monthly precipitation in inches for the growing season months (April to October) for the drought of 1960 –1967 and average conditions from 1980 to 2010 for the Delmarva geographic area of the Northern Atlantic Coastal Plain aquifer system. Geographic areas are shown in figure 12.
Figure 37. Increase in withdrawals for irrigation, in million gallons per day, in response to drought conditions in the Delmarva geographic area of the Northern Atlantic Coastal Plain aquifer system. Geographic areas are shown in figure 12.
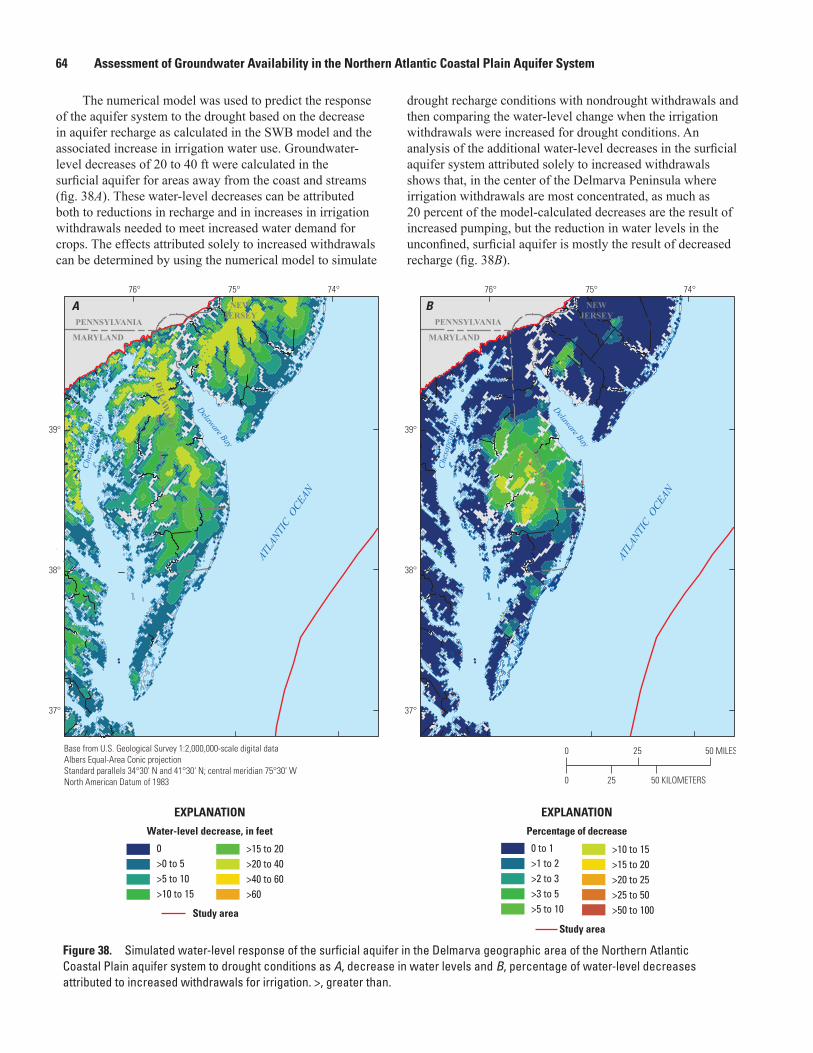
64 Assessment of Groundwater Availability in the Northern Atlantic Coastal Plain Aquifer System
The numerical model was used to predict the response of the aquifer system to the drought based on the decrease in aquifer recharge as calculated in the SWB model and the associated increase in irrigation water use. Groundwater-level decreases of 20 to 40 ft were calculated in the surficial aquifer for areas away from the coast and streams (fig. 38A). These water-level decreases can be attributed both to reductions in recharge and in increases in irrigation withdrawals needed to meet increased water demand for crops. The effects attributed solely to increased withdrawals can be determined by using the numerical model to simulate
drought recharge conditions with nondrought withdrawals and then comparing the water-level change when the irrigation withdrawals were increased for drought conditions. An analysis of the additional water-level decreases in the surficial aquifer system attributed solely to increased withdrawals shows that, in the center of the Delmarva Peninsula where irrigation withdrawals are most concentrated, as much as 20 percent of the model-calculated decreases are the result of increased pumping, but the reduction in water levels in the unconfined, surficial aquifer is mostly the result of decreased recharge (fig. 38B).
masterson_nacp_fig38_new
Study area
EXPLANATION
Water-level decrease, in feet
>0 to 5>5 to 10>10 to 15
0 >15 to 20>20 to 40>40 to 60>60
EXPLANATION
Percentage of decrease
0 to 1>1 to 2>2 to 3>3 to 5>5 to 10
>10 to 15>15 to 20>20 to 25>25 to 50>50 to 100
Study area
A B
Base from U.S. Geological Survey 1:2,000,000-scale digital dataAlbers Equal-Area Conic projectionStandard parallels 34°30' N and 41°30' N; central meridian 75°30' W North American Datum of 1983
NEWJERSEY
PENNSYLVANIA
MARYLAND
DELAW
AR
E
DELAW
AR
E
Ches
apea
ke B
ay
Delaware Bay
ATLA
NTIC O
CEAN
ATLA
NTIC O
CEAN
76°
39°
75° 74°
38°
37°
NEWJERSEY
PENNSYLVANIA
MARYLAND
Ches
apea
ke B
ay
Delaware Bay
76° 75° 74°
39°
38°
37°
0 25 50 MILES
0 25 50 KILOMETERS
Figure 38. Simulated water-level response of the surficial aquifer in the Delmarva geographic area of the Northern Atlantic Coastal Plain aquifer system to drought conditions as A, decrease in water levels and B, percentage of water-level decreases attributed to increased withdrawals for irrigation. >, greater than.
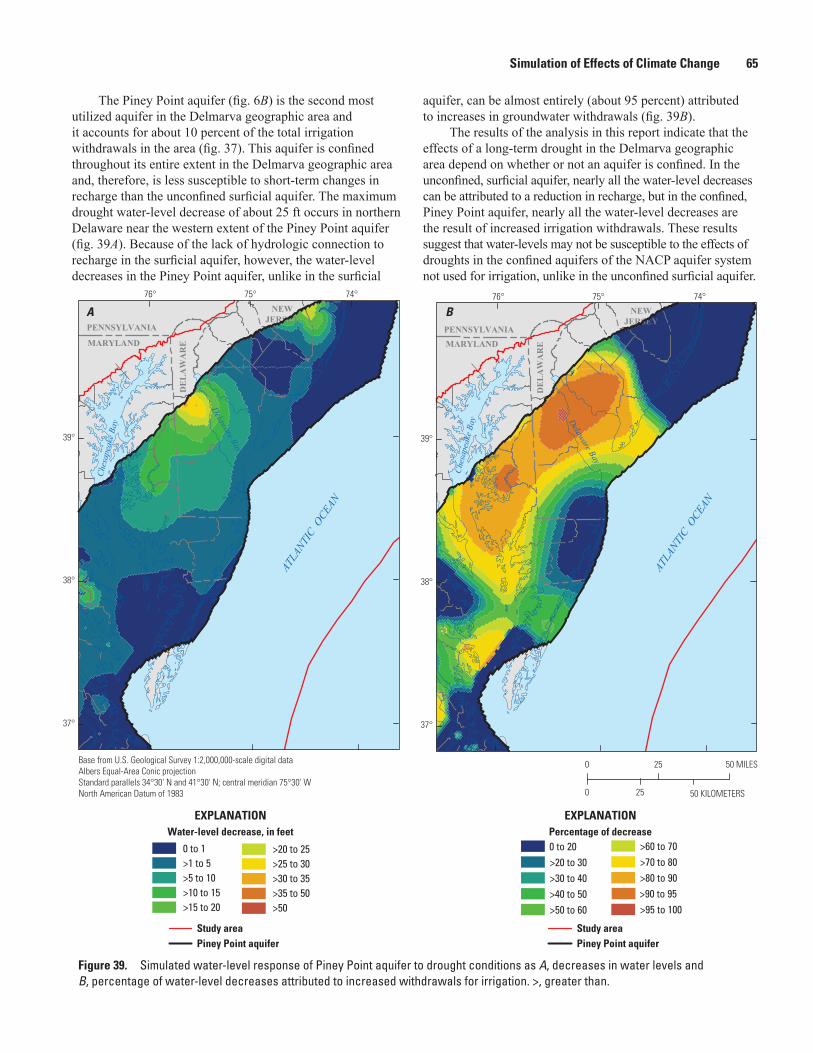
Simulation of Effects of Climate Change 65
The Piney Point aquifer (fig. 6B) is the second most utilized aquifer in the Delmarva geographic area and it accounts for about 10 percent of the total irrigation withdrawals in the area (fig. 37). This aquifer is confined throughout its entire extent in the Delmarva geographic area and, therefore, is less susceptible to short-term changes in recharge than the unconfined surficial aquifer. The maximum drought water-level decrease of about 25 ft occurs in northern Delaware near the western extent of the Piney Point aquifer (fig. 39A). Because of the lack of hydrologic connection to recharge in the surficial aquifer, however, the water-level decreases in the Piney Point aquifer, unlike in the surficial
aquifer, can be almost entirely (about 95 percent) attributed to increases in groundwater withdrawals (fig. 39B).
The results of the analysis in this report indicate that the effects of a long-term drought in the Delmarva geographic area depend on whether or not an aquifer is confined. In the unconfined, surficial aquifer, nearly all the water-level decreases can be attributed to a reduction in recharge, but in the confined, Piney Point aquifer, nearly all the water-level decreases are the result of increased irrigation withdrawals. These results suggest that water-levels may not be susceptible to the effects of droughts in the confined aquifers of the NACP aquifer system not used for irrigation, unlike in the unconfined surficial aquifer.
0 to 1>1 to 5>5 to 10>10 to 15>15 to 20
>20 to 25>25 to 30>30 to 35>35 to 50>50
EXPLANATIONWater-level decrease, in feet
Study areaPiney Point aquifer
0 to 20>20 to 30>30 to 40>40 to 50>50 to 60
>60 to 70>70 to 80>80 to 90>90 to 95>95 to 100
EXPLANATIONPercentage of decrease
Study areaPiney Point aquifer
A B
0 25 50 MILES
0 25 50 KILOMETERS
NEWJERSEY
PENNSYLVANIAMARYLAND
DE
LA
WA
RE
Ches
apea
ke B
ay Delaware Bay
76° 75° 74°
39°
38°
37°
Base from U.S. Geological Survey 1:2,000,000-scale digital dataAlbers Equal-Area Conic projectionStandard parallels 34°30' N and 41°30' N; central meridian 75°30' W North American Datum of 1983
NEWJERSEY
PENNSYLVANIA
MARYLAND
DE
LA
WA
RE
Ches
apea
ke B
ay
Delaware Bay
ATLA
NTIC O
CEAN
ATLA
NTIC O
CEAN
76°
39°
75° 74°
38°
37°
masterson_nacp_fig39_new
Figure 39. Simulated water-level response of Piney Point aquifer to drought conditions as A, decreases in water levels and B, percentage of water-level decreases attributed to increased withdrawals for irrigation. >, greater than.
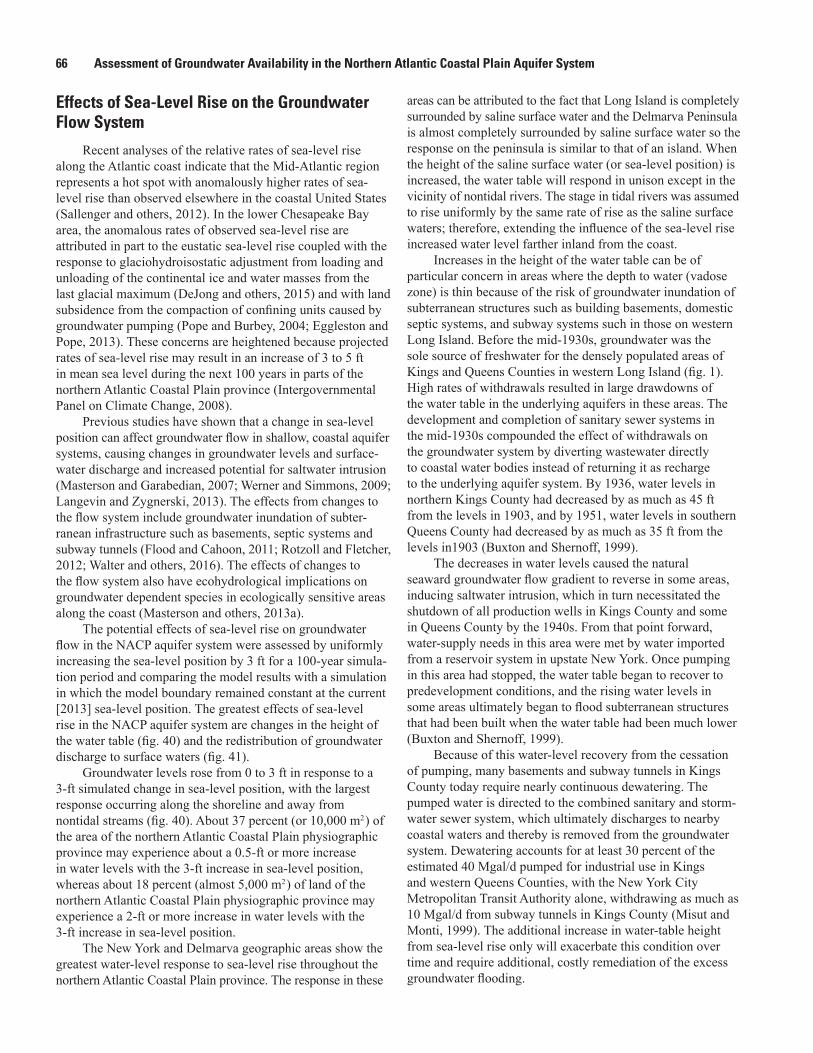
66 Assessment of Groundwater Availability in the Northern Atlantic Coastal Plain Aquifer System
Effects of Sea-Level Rise on the Groundwater Flow System
Recent analyses of the relative rates of sea-level rise along the Atlantic coast indicate that the Mid-Atlantic region represents a hot spot with anomalously higher rates of sea-level rise than observed elsewhere in the coastal United States (Sallenger and others, 2012). In the lower Chesapeake Bay area, the anomalous rates of observed sea-level rise are attributed in part to the eustatic sea-level rise coupled with the response to glaciohydroisostatic adjustment from loading and unloading of the continental ice and water masses from the last glacial maximum (DeJong and others, 2015) and with land subsidence from the compaction of confining units caused by groundwater pumping (Pope and Burbey, 2004; Eggleston and Pope, 2013). These concerns are heightened because projected rates of sea-level rise may result in an increase of 3 to 5 ft in mean sea level during the next 100 years in parts of the northern Atlantic Coastal Plain province (Intergovernmental Panel on Climate Change, 2008).
Previous studies have shown that a change in sea-level position can affect groundwater flow in shallow, coastal aquifer systems, causing changes in groundwater levels and surface-water discharge and increased potential for saltwater intrusion (Masterson and Garabedian, 2007; Werner and Simmons, 2009; Langevin and Zygnerski, 2013). The effects from changes to the flow system include groundwater inundation of subter-ranean infrastructure such as basements, septic systems and subway tunnels (Flood and Cahoon, 2011; Rotzoll and Fletcher, 2012; Walter and others, 2016). The effects of changes to the flow system also have ecohydrological implications on groundwater dependent species in ecologically sensitive areas along the coast (Masterson and others, 2013a).
The potential effects of sea-level rise on groundwater flow in the NACP aquifer system were assessed by uniformly increasing the sea-level position by 3 ft for a 100-year simula-tion period and comparing the model results with a simulation in which the model boundary remained constant at the current [2013] sea-level position. The greatest effects of sea-level rise in the NACP aquifer system are changes in the height of the water table (fig. 40) and the redistribution of groundwater discharge to surface waters (fig. 41).
Groundwater levels rose from 0 to 3 ft in response to a 3-ft simulated change in sea-level position, with the largest response occurring along the shoreline and away from nontidal streams (fig. 40). About 37 percent (or 10,000 m2 ) of the area of the northern Atlantic Coastal Plain physiographic province may experience about a 0.5-ft or more increase in water levels with the 3-ft increase in sea-level position, whereas about 18 percent (almost 5,000 m2 ) of land of the northern Atlantic Coastal Plain physiographic province may experience a 2-ft or more increase in water levels with the 3-ft increase in sea-level position.
The New York and Delmarva geographic areas show the greatest water-level response to sea-level rise throughout the northern Atlantic Coastal Plain province. The response in these
areas can be attributed to the fact that Long Island is completely surrounded by saline surface water and the Delmarva Peninsula is almost completely surrounded by saline surface water so the response on the peninsula is similar to that of an island. When the height of the saline surface water (or sea-level position) is increased, the water table will respond in unison except in the vicinity of nontidal rivers. The stage in tidal rivers was assumed to rise uniformly by the same rate of rise as the saline surface waters; therefore, extending the influence of the sea-level rise increased water level farther inland from the coast.
Increases in the height of the water table can be of particular concern in areas where the depth to water (vadose zone) is thin because of the risk of groundwater inundation of subterranean structures such as building basements, domestic septic systems, and subway systems such in those on western Long Island. Before the mid-1930s, groundwater was the sole source of freshwater for the densely populated areas of Kings and Queens Counties in western Long Island (fig. 1). High rates of withdrawals resulted in large drawdowns of the water table in the underlying aquifers in these areas. The development and completion of sanitary sewer systems in the mid-1930s compounded the effect of withdrawals on the groundwater system by diverting wastewater directly to coastal water bodies instead of returning it as recharge to the underlying aquifer system. By 1936, water levels in northern Kings County had decreased by as much as 45 ft from the levels in 1903, and by 1951, water levels in southern Queens County had decreased by as much as 35 ft from the levels in1903 (Buxton and Shernoff, 1999).
The decreases in water levels caused the natural seaward groundwater flow gradient to reverse in some areas, inducing saltwater intrusion, which in turn necessitated the shutdown of all production wells in Kings County and some in Queens County by the 1940s. From that point forward, water-supply needs in this area were met by water imported from a reservoir system in upstate New York. Once pumping in this area had stopped, the water table began to recover to predevelopment conditions, and the rising water levels in some areas ultimately began to flood subterranean structures that had been built when the water table had been much lower (Buxton and Shernoff, 1999).
Because of this water-level recovery from the cessation of pumping, many basements and subway tunnels in Kings County today require nearly continuous dewatering. The pumped water is directed to the combined sanitary and storm-water sewer system, which ultimately discharges to nearby coastal waters and thereby is removed from the groundwater system. Dewatering accounts for at least 30 percent of the estimated 40 Mgal/d pumped for industrial use in Kings and western Queens Counties, with the New York City Metropolitan Transit Authority alone, withdrawing as much as 10 Mgal/d from subway tunnels in Kings County (Misut and Monti, 1999). The additional increase in water-table height from sea-level rise only will exacerbate this condition over time and require additional, costly remediation of the excess groundwater flooding.
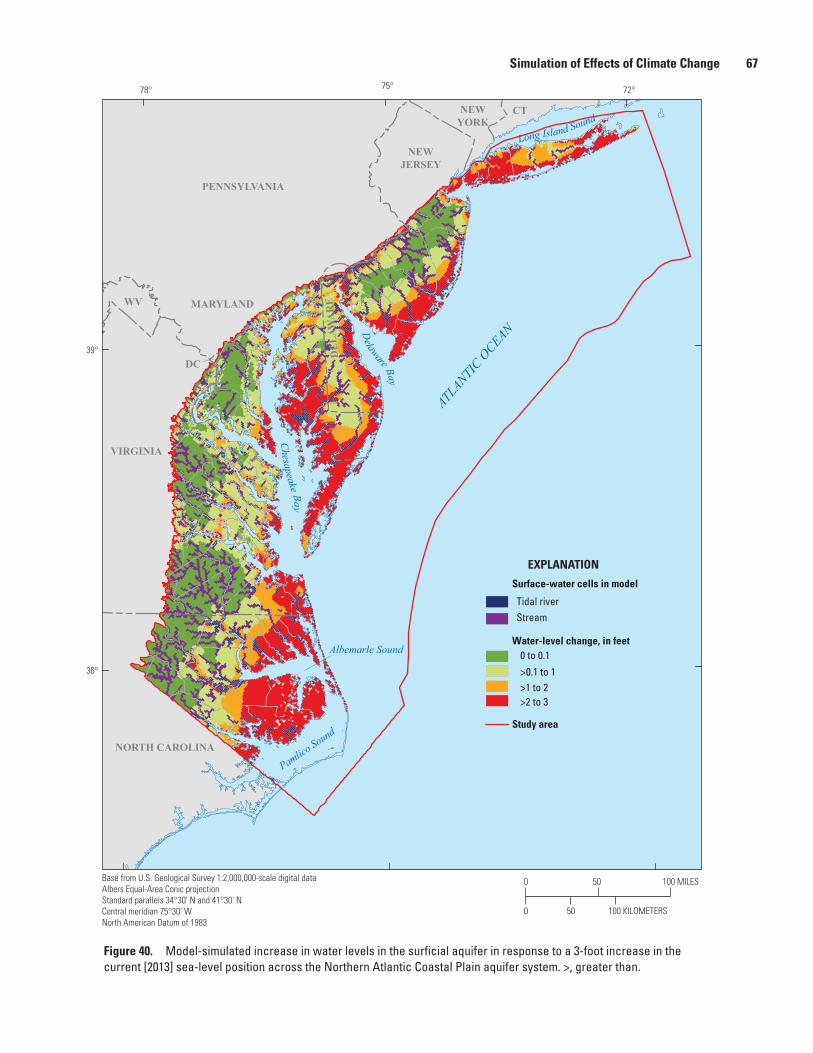
Simulation of Effects of Climate Change 67
masterson_nacp_fig40_new
72°75°78°
39°
36°
Study area
EXPLANATION
Water-level change, in feet 0 to 0.1
>0.1 to 1>1 to 2>2 to 3
StreamTidal river
Chesapeake Bay
Delaware Bay
Long Island SoundCTNEW
YORK
NEWJERSEY
PENNSYLVANIA
MARYLAND
DC
DE
LAW
AR
E
VIRGINIA
NORTH CAROLINA
ATLANTI
C OCEAN
Pamlico Sound
Albemarle Sound
Base from U.S. Geological Survey 1:2,000,000-scale digital dataAlbers Equal-Area Conic projectionStandard parallels 34°30' N and 41°30' NCentral meridian 75°30' W North American Datum of 1983
0 50 100 MILES
0 50 100 KILOMETERS
Surface-water cells in model
WV
Figure 40. Model-simulated increase in water levels in the surficial aquifer in response to a 3-foot increase in the current [2013] sea-level position across the Northern Atlantic Coastal Plain aquifer system. >, greater than.
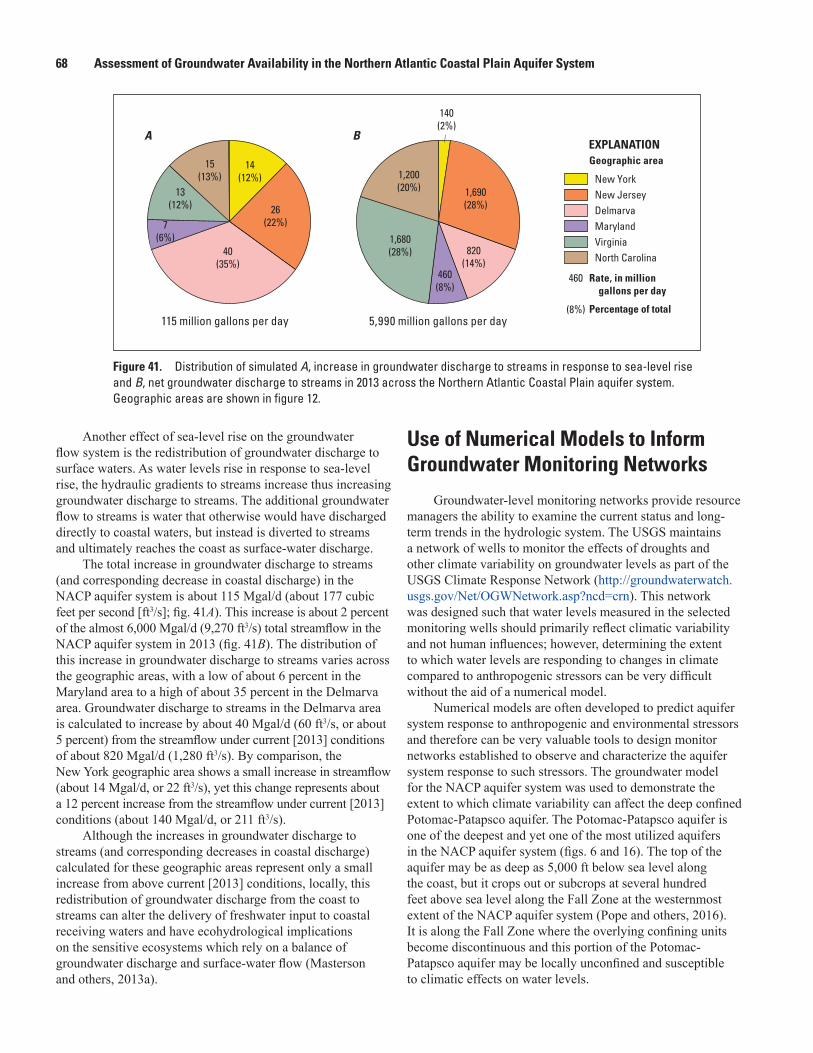
68 Assessment of Groundwater Availability in the Northern Atlantic Coastal Plain Aquifer System
Another effect of sea-level rise on the groundwater flow system is the redistribution of groundwater discharge to surface waters. As water levels rise in response to sea-level rise, the hydraulic gradients to streams increase thus increasing groundwater discharge to streams. The additional groundwater flow to streams is water that otherwise would have discharged directly to coastal waters, but instead is diverted to streams and ultimately reaches the coast as surface-water discharge.
The total increase in groundwater discharge to streams (and corresponding decrease in coastal discharge) in the NACP aquifer system is about 115 Mgal/d (about 177 cubic feet per second [ft3/s]; fig. 41A). This increase is about 2 percent of the almost 6,000 Mgal/d (9,270 ft3/s) total streamflow in the NACP aquifer system in 2013 (fig. 41B). The distribution of this increase in groundwater discharge to streams varies across the geographic areas, with a low of about 6 percent in the Maryland area to a high of about 35 percent in the Delmarva area. Groundwater discharge to streams in the Delmarva area is calculated to increase by about 40 Mgal/d (60 ft3/s, or about 5 percent) from the streamflow under current [2013] conditions of about 820 Mgal/d (1,280 ft3/s). By comparison, the New York geographic area shows a small increase in streamflow (about 14 Mgal/d, or 22 ft3/s), yet this change represents about a 12 percent increase from the streamflow under current [2013] conditions (about 140 Mgal/d, or 211 ft3/s).
Although the increases in groundwater discharge to streams (and corresponding decreases in coastal discharge) calculated for these geographic areas represent only a small increase from above current [2013] conditions, locally, this redistribution of groundwater discharge from the coast to streams can alter the delivery of freshwater input to coastal receiving waters and have ecohydrological implications on the sensitive ecosystems which rely on a balance of groundwater discharge and surface-water flow (Masterson and others, 2013a).
Use of Numerical Models to Inform Groundwater Monitoring Networks
Groundwater-level monitoring networks provide resource managers the ability to examine the current status and long-term trends in the hydrologic system. The USGS maintains a network of wells to monitor the effects of droughts and other climate variability on groundwater levels as part of the USGS Climate Response Network (http://groundwaterwatch.usgs.gov/Net/OGWNetwork.asp?ncd=crn). This network was designed such that water levels measured in the selected monitoring wells should primarily reflect climatic variability and not human influences; however, determining the extent to which water levels are responding to changes in climate compared to anthropogenic stressors can be very difficult without the aid of a numerical model.
Numerical models are often developed to predict aquifer system response to anthropogenic and environmental stressors and therefore can be very valuable tools to design monitor networks established to observe and characterize the aquifer system response to such stressors. The groundwater model for the NACP aquifer system was used to demonstrate the extent to which climate variability can affect the deep confined Potomac-Patapsco aquifer. The Potomac-Patapsco aquifer is one of the deepest and yet one of the most utilized aquifers in the NACP aquifer system (figs. 6 and 16). The top of the aquifer may be as deep as 5,000 ft below sea level along the coast, but it crops out or subcrops at several hundred feet above sea level along the Fall Zone at the westernmost extent of the NACP aquifer system (Pope and others, 2016). It is along the Fall Zone where the overlying confining units become discontinuous and this portion of the Potomac-Patapsco aquifer may be locally unconfined and susceptible to climatic effects on water levels.
masterson_nacp_fig41_new
1,200(20%)
140(2%)
1,690(28%)
460(8%)
1,680(28%) 820
(14%)
15(13%)
7(6%)
26(22%)
40(35%)
13(12%)
14(12%)
460
(8%)5,990 million gallons per day115 million gallons per day
A B
Rate, in million gallons per day
North Carolina
MarylandVirginia
Delmarva
New YorkNew Jersey
EXPLANATIONGeographic area
Percentage of total
Figure 41. Distribution of simulated A, increase in groundwater discharge to streams in response to sea-level rise and B, net groundwater discharge to streams in 2013 across the Northern Atlantic Coastal Plain aquifer system. Geographic areas are shown in figure 12.
Challenges for Future Groundwater Availability Assessments—Lessons Learned 69
A numerical analysis was conducted to determine the extent to which the Potomac-Patapsco aquifer may be suscep-tible to climatic variability and thus can be used to inform monitoring network placement. The average recharge rate for the 1986–2008 was simulated in this analysis for the entire 23-year period and the model-calculated water levels (heads) then were compared with heads in which the recharge rate was varied annually for the same period. Because the groundwater withdrawals were the same in both cases, the calculated head differences between these two simulations can be attributed solely to the change in recharge.
The variance in heads calculated for this 23-year period was used to assess which areas in the Potomac-Patapsco aquifer have the potential to be susceptible to climatic variability (fig. 42). The regions with the greatest calculated head variance are along the Fall Zone in Maryland, Delaware, and New Jersey. Head changes calculated for the Potomac-Patapsco on Long Island (locally referred to as the Lloyd aquifer) also are affected by changes in aquifer recharge and may be the result of the leaky confining unit (Raritan) separating the Lloyd from the overlying unconfined (Magothy) aquifer. Monitoring wells selected in these areas would have greater potential to measure water levels that reflect climatic variability than in areas with lower head variance (shown in green) away from the Fall Zone.
Challenges for Future Groundwater Availability Assessments— Lessons Learned
Regional assessments of groundwater availability of major aquifers across the Nation, such as the one described in this report for the NACP aquifer system, benefit greatly from the information and knowledge developed from previous investigations at both the regional and local scales. The regional assessment from the 1980s (Trapp and Meisler, 1992) and the numerous subregional investigations since the last regional assessment provided the foundational knowledge on water use, hydrogeologic framework, and hydrologic boundaries in the NACP aquifer system; however, many challenges still exist as advancement to this knowledge base continues into the future. Some of the main challenges include the quality and availability of hydrologic data, model discreti-zation of space and time, and the balance between regional and local expectations.
The successful execution of all quantitative assessments, whether regional or local, depends in large part on the quality and availability of basic hydrologic data in the study area. The primary hydrologic data types include water use, monitoring, and hydrogeologic information. Issues with these data often are magnified for regional studies given the scale of these efforts and the time needed to synthesize and compile the necessary information.
The availability of accurate and complete groundwater withdrawal data is needed for a comprehensive assessment of groundwater availability because the response of the aquifer system to changing stresses can only be properly evaluated if those stresses are correctly quantified and applied. Therefore, withdrawals from wells must be reported and recorded correctly and completely, along with information on well screen depths and aquifers they intersect. Information on groundwater withdrawal and use initially available at the regional scale for this study was from existing databases supported by NWIS (U.S. Geological Survey, 2011). This database includes detailed withdrawal information aggre-gated to the county and watershed scale that is adequate to support compilations like those provided every 5 years by the USGS National Water-Use Information Program (http://water.usgs.gov/watuse/wunwup.html). However, a data-base of site-specific withdrawal information with the spatial and attribute detail necessary to properly represent stresses in a numerical model is not available. Such information was compiled specifically for this study from various sources, with variable levels of quality and completeness. For areas or times for which such information was unreliable or unattainable, the accuracy of the numerical simulations of the groundwater system was affected accordingly.
Similar concerns can be raised for the monitoring or observation data of groundwater levels and streamflows. These data also are stored in the NWIS database and the accuracy of the measurements and the reported spatial and vertical locations of these observations are critical to correctly under-standing how the physical system is responding to hydrologic stresses, which is information critical to determining how well the numerical representation of the system matches reality. Therefore, the importance of basic data of high quality on water use and monitoring cannot be overstated for water availability studies.
Hydrogeologic information (such as aquifer-test results, lithologic borings, and geophysical logs and the hydrostrati-graphic surfaces that are developed from this information) also is necessary to understanding the distribution and movement of groundwater flow in the subsurface. The analysis of the hydrologic conditions in the NACP aquifer system relied heavily on the hydrostratigraphic extents and elevations that were developed initially as part of the previous regional assessment and subsequently updated locally by more site-specific studies. This information is often difficult and expensive to obtain but is key to developing a conceptual understanding of the aquifer framework that is then applied to the numerical model used in groundwater availability assess-ments. Missing or incomplete hydrogeologic information can increase uncertainty in the accuracy of the study results.
Discretizing space and time also can be a challenge for regional groundwater availability studies. Advancements in groundwater modeling software and computing capabilities have allowed for the synthesis of the available hydrologic information into a much finer discretized and detailed numer-ical representation of the groundwater flow system than was
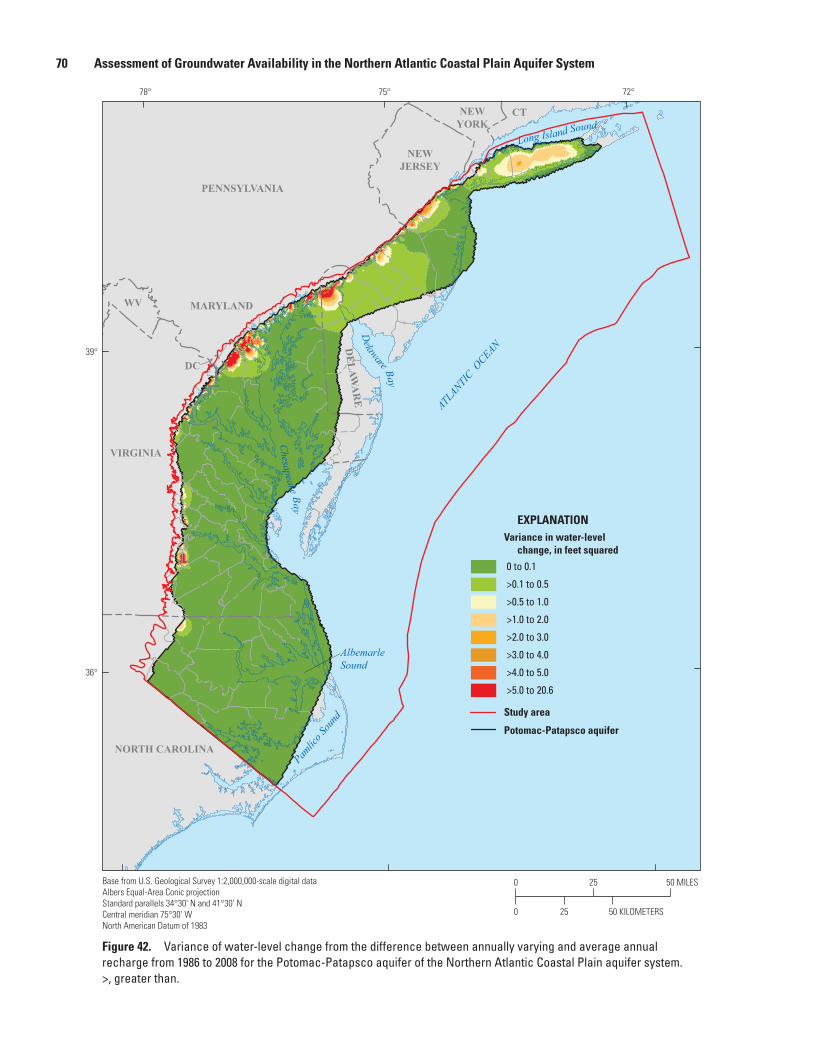
70 Assessment of Groundwater Availability in the Northern Atlantic Coastal Plain Aquifer System
Study area
EXPLANATION
Potomac-Patapsco aquifer
Variance in water-level change, in feet squared
0 to 0.1
>0.1 to 0.5
>0.5 to 1.0
>1.0 to 2.0
>2.0 to 3.0
>3.0 to 4.0
>4.0 to 5.0
>5.0 to 20.6
Base from U.S. Geological Survey 1:2,000,000-scale digital dataAlbers Equal-Area Conic projectionStandard parallels 34°30' N and 41°30' NCentral meridian 75°30' W North American Datum of 1983
72°78°
39°
36°
Chesapeake Bay
Delaware Bay
Long Island SoundCTNEW
YORK
NEWJERSEY
PENNSYLVANIA
MARYLAND
DC
DELAW
AR
EVIRGINIA
NORTH CAROLINA
ATLANTI
C OCEAN
Pamlic
o Sou
nd
Albemarle Sound
0 25 50 MILES
0 25 50 KILOMETERS
masterson_nacp_fig42_new
WV
75°
Figure 42. Variance of water-level change from the difference between annually varying and average annual recharge from 1986 to 2008 for the Potomac-Patapsco aquifer of the Northern Atlantic Coastal Plain aquifer system. >, greater than.
Acknowledgments 71
possible during the original RASA study for the NACP aquifer system. However, limitations inherent in regional assessments still pose challenges for these studies; for instance, even if the basic hydrologic data are of good quality and readily available and much is known of the detailed hydrogeologic framework, this information needs to be represented numerically in a groundwater flow model. The numerical representation of this hydrologic information is completely dependent upon how the aquifer system and stresses are subdivided (or discretized) in space and time, and, is dependent in large part on what software and computing capabilities are available at the time of the analysis. Lumping hydraulic parameters in space and pumping stresses and time-varying observational data in time can limit the capabilities of the tools developed to simulate how the groundwater flow system responds to changes in hydrologic stresses and can make accurate representation of the actual flow system more difficult, particularly at the local scale. Therefore, development of the tools to conduct water availability analyses needs to consider the scale of the problem to be addressed and the limitations associated with scale.
An additional challenge of groundwater availability studies is balancing regional and local expectations. For instance, regional tools that span multiple States are not the appropriate choice to assess the potential effect of a particular pumping well on a nearby surface-water body and, conversely, a detailed, site-specific numerical model developed to local-scale groundwater and surface-water interactions does not provide guidance on the response of groundwater resources to global changes in climate on a regional scale. However, often times it is the site-specific issues that are of greatest interest locally, making it more challenging for the reader to understand the benefits of large, regional-scale groundwater availability assessments and for the authors to associate the benefits of large, regional-scale groundwater availability studies to the local-level concerns.
Regional-scale studies, such as the one described in this report, are not designed to address local-scale issues. The modeling tools developed to address local-scale issues often times have problems with artificial boundaries used in models with limited aerial extent, which may have unacceptable influence on results. Therefore, regional-scale analyses can provide the hydrogeologic framework and boundaries that the local-scale efforts can build upon.
In the case of the NACP aquifer system, the water-level response in the deep confined Potomac aquifer group to large-scale multistate pumping extends well beyond individual State lines. The numerical model developed for the analysis of regional groundwater flow in the NACP aquifer system provided the tool necessary to fully characterize the extent of this water-level decrease and quantify the change in system-wide hydrologic budget components and can serve as the foundation for small, fine-scale models needed to fully assess the effects and ramifications of these regional stresses on a local level.
All models, whether regional or local in scale, are at best oversimplifications of complex natural systems but can provide useful information in light of their limitations. Therefore, it is important to understand how these tools can be used to further the science and improve the understanding of the groundwater availability for the Nation.
AcknowledgmentsThe authors wish to thank the following individuals for
their assistance and guidance throughout this investigation: Kevin Dennehy (retired), Tom Reilly (emeritus), Arlen Harbaugh (retired), Rod Sheets, Chris Langevin, and Joe Hughes of the USGS. The authors also would like to thank Jack Eggleston, Brian Clark, and Tom Mack of the USGS for providing technical reviews for this report.
72 Assessment of Groundwater Availability in the Northern Atlantic Coastal Plain Aquifer System
References CitedAlley, W.M., Evenson, E.J., Barber, N.L., Bruce, B.W.,
Dennehy, K.F., Freeman, M.C., Freeman, W.O., Fischer, J.M., Hughes, W.B., Kennen, J.G., Kiang, J.E., Maloney, K.O., Musgrove, Mary Lynn, Ralston, Barbara, Tessler, Steven, and Verdin, J.P., 2013, Progress toward establishing a national assessment of water availability and use: U.S. Geological Survey Circular 1384, 34 p., accessed March 11, 2013, at http://pubs.usgs.gov/circ/1384.
Amante, Christopher, and Eakins, B.W., 2009, ETOPO1 1 arc-minute global relief model—Procedures, data sources and analysis: National Oceanic and Atmospheric Administration Technical Memorandum NESDIS NGDC–24, 19 p. [Also available at https://www.ngdc.noaa.gov/mgg/global/relief/ETOPO1/docs/ETOPO1.pdf.]
Andreasen, D.C., Staley, A.W., and Achmad, Grufron, 2013, Maryland coastal plain aquifer information system— Hydrogeologic framework: Maryland Department of Natural Resources, Maryland Geological Survey Open-File Report 12–02–20, 121 p. [Also available at http://www.mgs.md.gov/reports/OFR_12-02-20.pdf.]
Barlow, P.M., 2003, Ground water in freshwater-saltwater environments of the Atlantic Coast: U.S. Geological Survey Circular 1262, 113 p., accessed March 11, 2013, at https://pubs.er.usgs.gov/publication/cir1262.
Brown, P.M., Miller, J.A., and Swain, F.M., 1972, Structural and stratigraphic framework, and spatial distribution of permeability of the Atlantic coastal plain, North Carolina to New York: U.S. Geological Survey Professional Paper 796, 79 p., 59 pls. [Also available at http://pubs.er.usgs.gov/publication/pp796.]
Busciolano, R.J., 2005, Statistical analysis of long-term hydrologic records for selection of drought-monitoring sites on Long Island, New York: U.S. Geological Survey Scientific Investigations Report 2004–5152, 14 p., accessed March 11, 2013, at http://pubs.er.usgs.gov/publication/sir20045152.
Buxton, H.T., and Shernoff, P.K., 1999, Ground-water resources of Kings and Queens Counties, Long Island, New York: U.S. Geological Survey Water-Supply Paper 2498, 113 p., 7 pls., accessed March 11, 2013, at http://pubs.er.usgs.gov/publication/wsp2498.
Buxton, H.T., and Smolensky, D.A., 1999, Simulation of the effects of development of the ground-water flow system of Long Island, New York: U.S. Geological Survey Water-Resources Investigations Report 98–4069, 57 p., accessed March 11, 2013, at http://pubs.er.usgs.gov/publication/wri984069.
Campbell, B.G., and Coes, A.L., eds., 2010, Groundwater availability in the Atlantic coastal plain of North and South Carolina: U.S. Geological Survey Professional Paper 1773, 241 p., 7 pls., accessed March 11, 2013, at http://pubs.er.usgs.gov/publication/pp1773.
Charles, E.G., 2016, Regional chloride distribution in the Northern Atlantic Coastal Plain aquifer system from Long Island, New York, to North Carolina: U.S. Geological Survey Scientific Investigations Report 2016 –5034, 37 p. accessed August 31, 2016, at http://dx.doi.org/10.3133/sir20165034.
Chesapeake Bay Program, 2010, Chesapeake Bay Program— Science, restoration, partnership: Chesapeake Bay Program Web site, accessed March 11, 2013, at http://www.chesapeakebay.net/.
Coulson, D.P., Joyce, L.A., Price, D.T., McKenney, D.W., Siltanen, R.M., Papadopol, Pia, and Lawrence, Kevin, 2010, Climate scenarios for the conterminous United States at the 5 arc minute grid spatial scale using SRES scenarios A1B and A2 and PRISM climatology: U.S. Department of Agriculture Forest Service data, accessed March 11, 2013, at http://dx.doi.org/10.2737/RDS-2010-0017.
Crosby, W.O., 1900, Outline of the geology of Long Island in its relations to the public water supplies, appendix 16 of Freeman, J.R., ed., Report upon New York’s water supply: New York, Martin B. Brown, p. 553–572.
DeJong, B.D., Bierman, P.R., Newell, W.L., Rittenour, T.M., Mahan, S.A., Balco, Greg, and Rood, D.H., 2015, Pleisto-cene relative sea levels in the Chesapeake Bay region and their implications for the next century: GSA Today, v. 25, no. 8, p. 4–10, accessed March 11, 2013, at http://dx.doi.org/ 10.1130/GSATG223A.1.
dePaul, V.T., Rice, D.E., and Zapecza, O.S., 2008, Water-level changes in aquifers of the Atlantic Coastal Plain, predevelopment to 2000: U.S. Geological Survey Scientific Investigations Report 2007–5247, 88 p., 1 pl., accessed March 11, 2013, at http://pubs.er.usgs.gov/publication/sir20075247.
Dewald, Tommy, Bondelid, Tim, Johnston, Craig, McKay, Cindy, Moore, Rich, and Rea, Alan, 2010, NHDPlus version 1— User guide: U.S. Environmental Protection Agency and U.S. Geological Survey, 115 p., accessed June 10, 2011, at http://www.horizon-systems.com/nhdplus/NHDPlusV1_documentation.php.
Doherty, John, 2010, PEST—Model-independent parameter estimation—User manual (5th ed.): Brisbane, Australia, Watermark Numerical Computing, [variously paged], accessed November 13, 2014, at http://www.pesthomepage.org/files/pestman.pdf.
Eggleston, Jack, and Pope, Jason, 2013, Land subsidence and relative sea-level rise in the southern Chesapeake Bay region: U.S. Geological Survey Circular 1392, 30 p. [Also available at http://pubs.er.usgs.gov/publication/cir1392.]
Essaid, H.I., 1990, The computer model SHARP, a quasi-three-dimensional finite-difference model to simulate freshwater and saltwater flow in layered coastal aquifer systems: U.S. Geological Survey Water-Resources Investi-gations Report 90–4130, 181 p., accessed March 11, 2013, at http://pubs.er.usgs.gov/publication/wri904130.
References Cited 73
Fenneman, N.M., 1917, Physiographic subdivision of the United States: Proceedings of the National Academy of Sciences, v. 3, no. 1, p. 17–22. [Also available at http://www.jstor.org/stable/83422.]
Fisher, Ann, and Smart, Ron, eds., 1999, Climate change impacts in the mid-Atlantic region—A workshop report: University Park, Pa., Pennsylvania State University, 93 p. [Also available at http://www.climateimpacts.org/us- climate-assess-2000/regions/mid-atlantic/mara-workshop-report-1997.pdf.]
Fleck, W.B., and Vroblesky, D.A., 1996, Simulation of ground-water flow of the coastal plain aquifers in parts of Maryland, Delaware, and the District of Columbia: U.S. Geological Survey Professional Paper 1404–J, 40 p., 9 pls., accessed March 11, 2013, at http://pubs.er.usgs.gov/publication/pp1404J.
Flood, J.F., and Cahoon, L.B., 2011, Risks to coastal waste water collection systems from sea-level rise and climate change: Journal of Coastal Research, v. 27, no. 4, p. 652–660.
Freeman, J.R., 1900, Brooklyn, appendix 15 of Freeman, J.R., ed., Report upon New York’s water supply: New York, Martin B. Brown, p. 532–552.
Fry, J.A., Xian, George, Jin, Suming, Dewitz, J.A., Homer, C.G., Yang, Limin, Barnes, C.A., Herold, N.D., and Wickham, J.D., 2011, Completion of the 2006 national land cover database for the conterminous United States: Photogrammetric Engineering and Remote Sensing, v. 77, no. 9, p. 858–864, accessed March 31, 2015, at http://www.mrlc.gov/download-file2.php?file=September2011PERS.pdf.
Gellici, J.A., and Lautier, J.C., 2010, Hydrogeologic framework of the Atlantic Coastal Plain, North and South Carolina, chap. B of Campbell, B.G., and Coes, A.L., eds., Groundwater availability in the Atlantic coastal plain of North and South Carolina: U.S. Geological Survey Professional Paper 1773, p. 49–162, accessed March 11, 2013, at http://pubs.er.usgs.gov/publication/pp1773.
Giese, B.L., Eimers, J.L., and Coble, R.W., 1997, Simulation of ground-water flow in the coastal plain aquifer system of North Carolina: U.S. Geological Survey Professional Paper 1404–M, 142 p., accessed March 11, 2013, at http://pubs.er.usgs.gov/publication/pp1404M.
Guo, Weixing, and Langevin, C.D., 2002, User’s guide to SEAWAT—A computer program for simulation of three- dimensional variable-density ground-water flow: U.S. Geo- logical Survey Techniques of Water-Resources Investigations, book 6, chap. A7, 77 p., accessed March 11, 2013, at http://pubs.er.usgs.gov/publication/twri06A7.
Harbaugh, A.W., and McDonald, M.G., 1996, User’s documentation for MODFLOW–96, an update to the U.S. Geological Survey modular finite-difference ground-water flow model: U.S. Geological Survey Open-File Report 96– 485, 56 p., accessed March 11, 2013, at http://pubs.er.usgs.gov/publication/ofr96485.
Harsh, J.F., and Laczniak, R.J., 1990, Conceptualization and analysis of the ground-water flow system in the coastal plain of Virginia and adjacent parts of Maryland and North Carolina: U.S. Geological Survey Profes-sional Paper 1404–F, 80 p., accessed March 11, 2013, at http://pubs.er.usgs.gov/publication/pp1404F.
Heywood, C.E., and Pope, J.P., 2009, Simulation of groundwater flow in the coastal plain aquifer system of Virginia: U.S. Geological Survey Scientific Investigations Report 2009–5039, 115 p., accessed March 11, 2013, at http://pubs.er.usgs.gov/publication/sir20095039.
Intergovernmental Panel on Climate Change, 2008, Climate change 2007—Synthesis report; Contribution of Working Groups I, II and III to the Fourth Assessment Report of the Intergovernmental Panel on Climate Change: Inter-governmental Panel on Climate Change, 73 p., accessed March 11, 2013, at http://www.ipcc.ch/publications_and_data/ publications_and_data_reports.shtml.
James, R.W., Jr., Moyer, W.J., Wagner, A.J., and Setzer, G.T., 1991, Maryland and the District of Columbia—Floods and droughts, in Paulson, R.W., and others, comps., National water summary 1988–89—Hydrologic events and floods and droughts: U.S. Geological Survey Water-Supply Paper 2375, p. 319–326. [Also available at http://md.water.usgs.gov/publications/wsp-2375/md-dc/md-dc-html.html.]
Kenny, J.F., Barber, N.L., Hutson, S.S., Linsey, K.S., Lovelace, J.K., and Maupin, M.A., 2009, Estimated use of water in the United States in 2005: U.S. Geological Survey Circular 1344, 52 p., accessed March 11, 2013, at http://pubs.er.usgs.gov/publication/cir1344.
Konikow, L.F., 2013, Groundwater depletion in the United States (1900–2008): U.S. Geological Survey Scientific Investigations Report 2013–5079, 63 p., accessed June 23, 2013, at http://pubs.er.usgs.gov/ publication/sir20135079.
Konikow, L.F., and Reilly, T.E., 1999, Seawater intrusion in the United States, chap. 13 of Bear, Jacob, Cheng, A.H.-D., Sorek, Shaul, Ouazar, Driss, and Herrera, Ismael, eds., Sea water intrusion in coastal aquifers—Concepts, methods, and practices: Dordrecht, Netherlands, Kluwer Academic Publishers, p. 463–506.
LaMotte, A.E., 2008a, National land cover database 2001 (NLCD01) tile 2, northeast United States—NLCD01_2: U.S. Geological Survey Data Series 383–B, accessed January 2011 at http://water.usgs.gov/lookup/getspatial?nlcd01_2.
LaMotte, A.E., 2008b, National land cover database 2001 (NLCD01) tile 4, southeast United States–NLCD01_4: U.S. Geological Survey Data Series 383–D, accessed January 2011 at http://water.usgs.gov/lookup/getspatial?nlcd01_4.
74 Assessment of Groundwater Availability in the Northern Atlantic Coastal Plain Aquifer System
Langevin, C.D., and Zygnerski, Michael, 2013, Effect of sea-level rise on salt water intrusion near a coastal well field in southeastern Florida: Groundwater, v. 51, no. 5, p. 781–803, accessed March 11, 2013, at http://dx.doi.org/10.1111/ j.1745-6584.2012.01008.x.
Leahy, P.P., and Martin, Mary, 1993, Geohydrology and simu-lation of ground-water flow in the Northern Atlantic Coastal Plain aquifer system: U.S. Geological Survey Professional Paper 1404–K, 81 p., 22 pl., accessed March 11, 2013, at http://pubs.er.usgs.gov/publication/pp1404K.
Legesse, D.B., Vallet-Coulomb, Christine, and Gasse, Francoise, 2003, Hydrological response of a catchment to climate and land use changes in tropical Africa—Case study south central Ethiopia: Journal of Hydrology, v. 275, nos. 1–2, p. 67–85. [Also available at http://dx.doi.org/10.1016/S0022-1694(03)00019-2.]
Loveland, T.R., Sohl, T.L., Sayler, Kristi, Gallant, Alisa, Dwyer, John, Vogelmann, J.E., Zylstra, G.J., Wade, Tim, Edmonds, Curt, Chaloud, Deb, and Jones, Bruce, 1999, Land cover trends—Rates, causes, and consequences of late-twentieth century U.S. land cover change: U.S. Envi-ronmental Protection Agency EPA/600/R–99/105, 38 p., accessed March 11, 2013, at http://www.epa.gov/esd/ land-sci/trends/pdf/trends_research_plan.pdf.
Martin, Mary, 1998, Ground-water flow in the New Jersey coastal plain: U.S. Geological Survey Professional Paper 1404–H, 146 p., accessed March 11, 2013, at http://pubs.er.usgs.gov/publication/pp1404H.
Masterson, J.P., Fienen, M.N., Thieler, E.R., Gesch, D.B., Gutierrez, B.T., and Plant, N.G., 2013a, Effects of sea-level rise on barrier island groundwater system dynamics—Ecohydrological implications: Ecohydrology, v. 7, no. 3, p. 1064–1071. [Also available at http://dx.doi.org/10.1002/eco.1442.]
Masterson, J.P., and Garabedian, S.P., 2007, Effects of sea-level rise on ground-water flow in a coastal aquifer system: Ground Water, v. 45, no. 2, p. 209–217. [Also available at http://dx.doi.org/10.1111/j.1745-6584.2006.00279.x.]
Masterson, J.P., Pope, J.P., Fienen, M.N., Monti, Jack, Jr., Nardi, M.R., and Finkelstein, J.S., 2016, Documentation of a groundwater flow model developed to assess groundwater availability in the Northern Atlantic Coastal Plain aquifer system from Long Island, New York, to North Carolina: U.S. Geological Survey Scientific Investigations Report 2016–5076, 70 p., accessed August 31, 2016, at http://dx.doi.org/10.3133/sir20165076.
Masterson, J.P., Pope, J.P., Monti, Jack, Jr., Nardi, M.R., Finkelstein, J.S., and McCoy, K.J., 2013b, Hydrogeology and hydrologic conditions of the Northern Atlantic Coastal Plain aquifer system from Long Island, New York, to North Carolina: U.S. Geological Survey Scientific Investigations Report 2013–5133, 76 p. [Also available at http://dx.doi.org/10.3133/sir20135133.]
Maupin, M.A., and Barber, N.L., 2005, Estimated with-drawals from principal aquifers in the United States, 2000: U.S. Geological Survey Circular 1279, 46 p. [Also available at http://pubs.er.usgs.gov/publication/cir1279.]
Maupin, M.A., Kenny, J.F., Hutson, S.S., Lovelace, J.K., Barber, N.L., and Linsey, K.S., 2014, Estimated use of water in the United States in 2010: U.S. Geological Survey Circular 1405, 56 p. [Also available at http://dx.doi.org/ 10.3133/cir1405.]
McDonald, M.G., and Harbaugh, A.W., 1988, A modular three-dimensional finite-difference groundwater flow model: U.S. Geological Survey Techniques of Water-Resources Investigations, book 6, chap. A1, 586 p. [Also available at http://pubs.usgs.gov/twri/twri6a1/.]
McFarland, E.R., 1998, Design, revisions, and considerations for continued use of a ground-water-flow model of the coastal plain aquifer system in Virginia: U.S. Geological Survey Water-Resources Investigations Report 98–4085, 49 p., accessed March 11, 2013, at http://pubs.er.usgs.gov/publication/wri984085.
McFarland, E.R., 2013, Sediment distribution and hydrologic conditions of the Potomac aquifer, Virginia coastal plain: U.S. Geological Survey Scientific Investigations Report 2013–5116, 67 p., 2 pls., 3 attachments. [Also available at http://pubs.er.usgs.gov/publication/sir20135116.]
McFarland, E.R., and Bruce, T.S., 2006, The Virginia coastal plain hydrogeologic framework: U.S. Geological Survey Professional Paper 1731, 118 p., 25 pls., accessed March 11, 2013, at http://pubs.er.usgs.gov/publication/pp1731/.
Meng, A.A., III, and Harsh, J.F., 1988, Hydrogeologic frame-work of the Virginia coastal plain: U.S. Geological Survey Professional Paper 1404– C, 82 p., accessed March 11, 2013, at http://pubs.er.usgs.gov/publication/pp1404C.
Miller, J.A., 1999, Introduction and national summary, in Ground water atlas of the United States: U.S. Geological Survey Hydrologic Investigations Atlas 730–A, 36 p. [Also available at http://pubs.er.usgs.gov/publication/ha730A.]
Misut, P.E., and Monti, Jack, Jr., 1999, Simulation of ground-water flow and pumpage in Kings and Queens Counties, Long Island, New York: U.S. Geological Survey Water-Resources Investigations Report 98–4071, 50 p., accessed March 11, 2013, at http://pubs.er.usgs.gov/publication/wri984071.
National Oceanic and Atmospheric Administration, 2012, Sea level trends: National Oceanic and Atmospheric Administration Web interface, accessed March 11, 2013, at http://co-ops.nos.noaa.gov/sltrends/sltrends.html.
National Oceanic and Atmospheric Administration, [undated], U.S. coastal relief model: National Oceanic and Atmo-spheric Administration National Centers for Environ-mental Information Web site, accessed October 2011 at http://www.ngdc.noaa.gov/mgg/coastal/crm.html.
References Cited 75
Niswonger, R.G., Panday, Sorab, and Ibaraki, Motomu, 2011, MODFLOW–NWT, A Newton formulation for MODFLOW– 2005: U.S. Geological Survey Techniques and Methods, book 6, chap. A37, 44 p., accessed March 28, 2013, at http://pubs.er.usgs.gov/publication/tm6A37.
Polsky, Colin, Allard, Jason, Curritt, Nate, Crane, Robert, and Yarnal, Brent, 2000, The mid-Atlantic region and its climate—Past, present, and future: Climate Research, v. 14, no. 3, p. 161–173.
Pope, D.A., and Gordon, A.D., 1999, Simulation of ground-water flow and movement of the freshwater-saltwater interface in the New Jersey coastal plain: U.S. Geological Survey Water-Resources Investigations Report 98– 4216, 159 p., accessed March 11, 2013, at http://pubs.er.usgs.gov/publication/wri984216.
Pope, J.P., Andreasen, D.C., McFarland, E.R., and Watt, M.K., 2016, Digital elevations and extents of regional hydro-geologic units in the Northern Atlantic Coastal Plain aquifer system from Long Island, New York, to North Carolina: U.S. Geological Survey Data Series 996, 28 p., accessed August 31, 2016, at http://dx.doi.org/10.3133/ds996.
Pope, J.P., and Burbey, T.J., 2004, Multiple-aquifer char-acterization from single borehole extensometer records: Ground Water, v. 42, no. 1, p. 45–58. [Also available at http://dx.doi.org/10.1111/j.1745-6584.2004.tb02449.x.]
Powars, D.S., and Bruce, T.S., 1999, The effects of the Chesapeake Bay impact crater on the geological framework and correlation of hydrogeologic units of the lower York-James Peninsula, Virginia: U.S. Geological Survey Professional Paper 1612, 82 p., 9 pls. [Also available at http://pubs.er.usgs.gov/publication/pp1612.]
Priest, Sherlyn, 2004, Evaluation of ground-water contribution to streamflow in coastal Georgia and adjacent parts of Florida and South Carolina: U.S. Geological Survey Scientific Investigations Report 2004 –5265, 46 p., accessed March 28, 2013, at http://pubs.er.usgs.gov/publication/sir20045265.
Reilly, T.E., Dennehy, K.F., Alley, W.M., and Cunningham, W.L., 2008, Ground-water availability in the United States: U.S. Geological Survey Circular 1323, 70 p., accessed March 11, 2013, at http://pubs.er.usgs.gov/publication/cir1323.
Reilly, T.E., and Harbaugh, A.W., 1980, A comparison of analog and digital modeling techniques for simulating three-dimensional ground-water flow on Long Island, New York: U.S. Geological Survey Water-Resources Investi gations Report 80 –14, 40 p., accessed March 11, 2013, at http://pubs.er.usgs.gov/publication/wri8014.
Richardson, D.L., 1994, Hydrogeology and analysis of the ground-water-flow system of the Eastern Shore, Virginia: U.S. Geological Survey Water-Supply Paper 2401, 108 p., 1 pl., accessed March 11, 2013, at http://pubs.er.usgs.gov/publication/wsp2401.
Rotzoll, Kolja, and Fletcher, C.H., 2012, Assessment of groundwater inundation as a consequence of sea-level rise: Nature Climate Change, v. 3, no. 5, p. 477–481, accessed March 28, 2013, at http://dx.doi.org/10.1038/NCLIMATE1725.
Sallenger, A.H., Jr., Doran, K.S., and Howd, P.A., 2012, Hotspot of accelerated sea-level rise on the Atlantic coast of North America: Nature Climate Change, v. 2, no. 12, p. 884–888, accessed March 11, 2013, at http://dx.doi.org/ 10.1038/nclimate1597.
Sanford, Samuel, 1911, Saline artesian waters of the Atlantic coastal plain, in Fuller, M.L., Clapp, F.G., Matson, G.C., Sanford, Samuel, and Wolff, H.C., Underground water papers, 1910: U.S. Geological Survey Water-Supply Paper 258, p. 75–86. [Also available at http://pubs.er.usgs.gov/publication/wsp258.]
Sanford, W.E., Nelms, D.L., Pope, J.P., and Selnick, D.L., 2012, Quantifying components of the hydrologic cycle in Virginia using chemical hydrograph separation and multiple regression analysis: U.S. Geological Survey Scientific Investigations Report 2011–5198, 152 p., accessed March 28, 2013, at http://pubs.er.usgs.gov/publication/sir20115198.
Sanford, W.E., and Pope, J.P., 2007, A simulation of ground-water discharge and nitrate delivery to Chesapeake Bay from the lowermost Delmarva Peninsula, USA, in A New Focus on Groundwater-Seawater Interactions, Perugia, Italy, July 2007, proceedings: International Association of Hydrological Sciences Publication 312, p. 326 –333.
Sanford, W.E., Pope, J.P., and Nelms, D.L., 2009, Simulation of groundwater-level and salinity changes in the Eastern Shore, Virginia: U.S. Geological Survey Scientific Investigations Report 2009–5066, 125 p. [Also available at http://pubs.er.usgs.gov/publication/sir20095066.]
Scorca, M.P., 1997, Urbanization and recharge in the vicinity of East Meadow Brook, Nassau County, New York—Part 1—Streamflow and water-table altitude, 1939–90: U.S. Geological Survey Water-Resources Investigations Report 96 – 4187, 39 p., accessed March 11, 2013, at http://pubs.er.usgs.gov/publication/wri964187.
Smolensky, D.A., Buxton, H.T., and Shernoff, P.K., 1989, Hydrogeologic framework of Long Island, New York: U.S. Geological Survey Hydrologic Investigations Atlas HA–709, 3 pls. [Also available at http://pubs.er.usgs.gov/publication/ha709.]
Spitz, F.J., Watt, M.K., and dePaul, V.T., 2008, Recovery of ground-water levels from 1998 to 2003 and analysis of potential water-supply management options in critical area 1, east-central New Jersey: U.S. Geological Survey Scientific Investigations Report 2007–5193, 40 p., accessed March 11, 2013, at http://pubs.er.usgs.gov/publication/sir20075193.
76 Assessment of Groundwater Availability in the Northern Atlantic Coastal Plain Aquifer System
Thornton, P.E., Thornton, M.M., Mayer, B.W., Wilhelmi, N., Wei, Y., and Cook, R.B., 2012, Daymet—Daily surface weather data on a 1-km grid for North America: Oak Ridge National Laboratory dataset, accessed April 15, 2015, at https://www.sciencebase.gov/catalog/item/54dd5e37e 4b08de9379b38f6.
Trapp, Henry, Jr., 1992, Hydrogeologic framework of the Northern Atlantic Coastal Plain in parts of North Carolina, Virginia, Maryland, Delaware, New Jersey, and New York: U.S. Geological Survey Professional Paper 1404–G, 59 p., 13 pls., accessed March 11, 2013, at http://pubs.er.usgs.gov/publication/pp1404G.
Trapp, Henry, Jr., and Meisler, Harold, 1992, The regional aquifer system underlying the Northern Atlantic Coastal Plain in parts of North Carolina, Virginia, Maryland, Delaware, New Jersey, and New York—Summary: U.S. Geological Survey Professional Paper 1404 –A, 59 p., 13 pls., accessed March 11, 2013, at http://pubs.er.usgs.gov/publication/pp1404A.
Trescott, P.C., 1975, Documentation of finite-difference model for simulation of three-dimensional ground-water flow: U.S. Geological Survey Open-File Report 75– 438, 32 p., 6 appendixes. [Also available at http://pubs.er.usgs.gov/publication/ofr75438.]
U.S. Department of Agriculture, Natural Resources Conser-vation Service, [undated], Description of U.S. general soil map (STATSGO2): Natural Resources Conservation Service Digital General Soil Map of the United States Web page, accessed March 28, 2013, at http://soils.usda.gov/survey/ geography/ssurgo/description_statsgo2.html.
U.S. Geological Survey, 2011, USGS water data for the Nation: U.S. Geological Survey National Water Infor-mation System Web interface, accessed May 2, 2011, at http://waterdata.usgs.gov/nwis.
U.S. Geological Survey, [undated], Elevation: U.S. Geological Survey National Elevation Dataset 1 arc-second data, accessed October 2011 at http://nationalmap.gov/elevation.html.
Voronin, L.M., 2003, Documentation of revisions to the regional aquifer system analysis model of the New Jersey coastal plain: U.S. Geological Survey Water-Resources Investigations Report 03– 4268, 49 p., 1 pl., accessed March 11, 2013, at http://pubs.usgs.gov/wri/wri03-4268/.
Vroblesky, D.A., and Fleck, W.B., 1991, Hydrogeologic framework of the coastal plain of Maryland, Delaware, and the District of Columbia: U.S. Geological Survey Professional Paper 1404–E, 45 p., 2 pls., accessed March 11, 2013, at http://pubs.er.usgs.gov/publication/pp1404E.
Walter, D.A., McCobb, T.D., Masterson, J.P., and Fienen, M.N., 2016, Potential effects of sea-level rise on the depth to saturated sediments of the Sagamore and Monomoy flow lenses on Cape Cod, Massachusetts: U.S. Geological Survey Scientific Investigations Report 2016 –5058, 55 p., accessed May 25, 2016, at http://dx.doi.org/10.3133/sir20165058.
Werner, A.D., Simmons, C.T., 2009, Impact of sea-level rise on sea water intrusion in coastal aquifers: Ground Water, v. 47 no. 2, p. 197–204.
Westenbroek, S.M., Kelson, V.A., Dripps, W.R., Hunt, R.J., and Bradbury, K.R., 2012, SWB—A modified Thornthwaite- Mather soil-water-balance code for estimating groundwater recharge [revised]: U.S. Geological Survey Techniques and Methods, book 6, chap. A31, 60 p., accessed March 11, 2013, at https://pubs.er.usgs.gov/publication/tm6A31.
Winner, M.D., Jr., and Coble, R.W., 1989, Hydrogeologic framework of the North Carolina Coastal Plain: U.S. Geological Survey Professional Paper 1404–I, 106 p., 24 pls., accessed March 11, 2013, at http://pubs.er.usgs.gov/publication/pp1404I.
Zapecza, O.S., 1989, Hydrogeologic framework of the New Jersey Coastal Plain: U.S. Geological Survey Professional Paper 1404–B, 49 p., 24 pls. [Also available at http://pubs.er.usgs.gov/publication/pp1404B.]

Manuscript approved May 31, 2016
Prepared by the USGS Science Publishing Network Edited by Anna Glover and Kay P. Naugle
Pembroke and Reston Publishing Service Centers Illustrations by James E. Banton
Lafayette Publishing Service Center Layout by Caryl J. Wipperfurth
Reston Publishing Service Center
For more information concerning this report, please contact:
Water Availability and Use Science Program U.S. Geological Survey 150 National Center 12201 Sunrise Valley Drive Reston, VA 20192 http://water.usgs.gov/wausp/

Masterson and others—
Assessm
ent of Groundw
ater Availability in the Northern A
tlantic Coastal Plain Aquifer System
—Professional Paper 1829
ISSN 1044-9612 (print) ISSN 2330-7102 (online)http://dx.doi.org/10.3133/pp1829