Embed Size (px)
Citation preview
Version 1.1, November 2014
Version 1.1, November 2014
First release 1998, version 1.0Revised November 2014, as version 1.1, to replace table 2
Suggested citation:Werner, A.B.T., Sinclair, W.D., and Amey, E.B., 2014, International strategic mineral issues summary report—Tungsten (ver. 1.1, November 2014): U.S. Geological Survey Circular 930–O, 74 p., http://pubs.usgs.gov/circ/0930/o/. [Supersedes version 1.0 published in 1998; revisions in 2014 by John H. DeYoung, Jr., and Kim B. Shedd.]
PREFACE
IV
Earth-science and mineral-resource agencies from several countries started the Inter-national Strategic Minerals Inventory, later renamed International Strategic MineralIssues, in order to cooperatively gather information about major sources of mineral rawmaterials. This circular summarizes inventory information about major deposits oftungsten.
The report was prepared by Antony B.T. Werner, Canadian Department of NaturalResources (NRCan), Minerals and Metals Sector (MMS) (retired); W. David Sinclair,NRCan, Geological Survey of Canada (GSC); and Earle B. Amey, United States Geologi-cal Survey (USGS). Tungsten inventory information was compiled by James E. Elliott,USGS; S. Warren Hobbs, USGS; Alfred Johnson and L.S. Jen, NRCan/MMS; NeridaKnight and John Olley, Australian Geological Survey Organisation; W. David Sinclair andA. Pasitschniak, NRCan/GSC; and Klaus Fesefeldt and Ilse Häusser, German FederalInstitute for Geosciences and Natural Resources.
Additional contributions to the report were made by Jan Zwartendyk, NRCan/MMS(retired); Stuart Girvan and Ian Lambert, Bureau of Resource Sciences of the AustralianDepartment of Primary Industries and Energy; Erik C.I. Hammerbeck, South AfricanCouncil for Geoscience; Michael Bowles, Geological Survey of South Africa; GregoryR. Chapman, Peter Harris, and Gordon Riddler, British Geological Survey; John H.DeYoung, Jr., Ebraham Shekarchi, and David M. Sutphin, USGS; and T.F. Anstett, U.S.Bureau of Mines (USBM), and P.T. Stafford, USBM (deceased).
Revision History for Circular 930–O............................................................................. 72
CONTENTS
VIII
TABLES
1. Tungsten resources in the world’s deposits and districts, by geologic deposit type and resource category ................ 42. Ten largest tungsten deposits or groups of deposits in the world ................................................................................ 123. Tungsten resources in the world’s deposits and districts, by economic class of country and resource category ........ 13
4, 5. Estimated cumulative and annual mine production of tungsten contained in ore and concentrate—4. By economic class of country for all countries having tungsten deposits or districts ........................................... 135. For each country having a tungsten deposit or district listed in the ISMI tungsten inventory............................... 16
6. Tungsten resources in the world’s deposits and districts in the R1 and R2 categories, listed by mining method and economic class of country..................................................................................................................................... 16
7. Major world tungsten processing plants ...................................................................................................................... 208. Abbreviations used in tables 9 and 10 ......................................................................................................................... 279. Selected geologic and location information from ISMI records for tungsten deposits and districts........................... 28
10. Selected production and mineral-resource information from ISMI records for tungsten deposits and districts ......... 50
CONVERSION FACTORS
Multiply By To obtain
gram (g) 0.03527 ounce avoirdupoisgram per metric ton (g/t) 0.0292 ounce per ton (2,000 pounds)
kilogram (kg) 2.205 poundkilometer (km) 0.6214 mile
meter (m) 3.281 footmetric ton (t) 1.102 short ton (2,000 pounds)
1
INTERNATIONAL STRATEGIC MINERAL ISSUESSUMMARY REPORT—TUNGSTEN
By Antony B.T. Werner,
1
W. David Sinclair,
2
and Earle B. Amey
3
ABSTRACT
Scheelite and wolframite are the principal mineralscurrently mined for tungsten.
Both occur in hard-rockdeposits; wolframite is also recovered from placer deposits.Most current mine production of tungsten is from vein/stockwork, skarn, porphyry, and strata-bound deposits.Minor amounts are produced from disseminated, pegmatite,breccia, and placer deposits.
Most tungsten is used to make tungsten carbide andtungsten alloys for use in machine tools and drilling equip-ment.
Other important applications are in lamp filamentsand cathodes, high-speed steels, textile dyes, paints, andcatalysts.
The world is well endowed with tungsten resources.China and the former Soviet Union have 8 of the world’s 10largest deposits; these 8 contain about half of the world’sresources of tungsten. If economic conditions are suitable,world tungsten resources in known deposits and their exten-sions (categories R1 and R2), including economic, mar-ginal, and subeconomic resources, are sufficient to permitworld production to continue at 1995 levels until well intothe 21st century.
World tungsten resources in identified deposits and dis-tricts that are currently economically exploitable (categoryR1E) appear to be sufficient to meet world demand at 1995levels only until the year 2007. However, the figure forresources of this kind does not include or reflect resourceswhose economic parameters are unknown in major produc-ing areas in the former Soviet Union, China, and other
1
Retired from Canadian Department of Natural Resources, Mineralsand Metals Sector.
2
Canadian Department of Natural Resources, Geological Survey ofCanada (the GSC component of this document is recognized as GeologicalSurvey of Canada Contribution 34988), 675–601 Booth Street, Ottawa,ON, Canada K1A 0E8.
3
U.S. Geological Survey, 989 National Center, Reston, VA 20192U.S.A.
nonmarket-economy countries and thus severely underesti-mates future tungsten availability.
In 1995, China and the former Soviet Union accountedfor over three-fourths of the world’s mine production oftungsten. China alone produced about two-thirds of worldoutput. Given its vast resources, China will likely maintainits prominent role in world tungsten supply. By the year2020, changes in supply patterns are likely to result fromdeclining output from individual deposits in Australia, Aus-tria, and Portugal and the opening of new mines in Canada,China, and the United Kingdom.
PART I—OVERVIEW
INTRODUCTION
The reliability of future supplies of minerals is of con-cern to many nations. This widespread concern has led toduplication of effort in the gathering of information on theworld’s major sources of minerals. With the aim of poolingsuch information, a cooperative effort named InternationalStrategic Minerals Inventory (ISMI) was started in 1981 byofficials of the governments of the United States, Canada,and West Germany. It was subsequently joined by SouthAfrica, Australia, and the United Kingdom. In 1997, ISMIwas renamed International Strategic Mineral Issues.
The objective of ISMI reports is to make publiclyavailable, in convenient form, nonproprietary data and char-acteristics of major deposits of mineral commodities forpolicy considerations in regard to short-term, medium-term,and long-term world supply. This report provides a sum-mary statement of the data compiled and an overview of thesupply aspects of tungsten in a format designed to be ofbenefit to policy analysts and geologists. Knowledge of thegeologic aspects of mineral resources is essential in order todiscover and develop mineral deposits. However, technical,financial, and political decisions must be made, and oftentransportation and marketing systems must be constructed,before ore can be mined and processed and the products
2
INTERNATIONAL STRATEGIC MINERAL ISSUES SUMMARY REPORT—TUNGSTEN
transported to the consumer; the technical, financial, andpolitical aspects of mineral-resource development are notspecifically addressed in this report. The report addressesthe primary stages in the supply process for tungsten anddoes not include considerations of tungsten demand.
To date, the ISMI Working Group has published stud-ies on chromium, cobalt, graphite, lithium, manganese,nickel, niobium (columbium), phosphate, platinum-groupmetals, rare-earth oxides, tantalum, tin, titanium, tungsten(this report), vanadium, and zirconium; these studies arechapters A–O of U.S. Geological Survey Circular 930. Aregional survey of the strategic minerals of subequatorialAfrica has been published (Coakley and others, 1991), and asurvey of mineral resources in eastern Europe is underway.Deposits (or districts) were selected for the inventory on thebasis of their present or expected future contribution toworld supply.
Data in the ISMI tungsten inventory were mostly col-lected from November 1984 to March 1987. The report hadsome additional updating to March 1996 and was submittedfor review and publication May 19, 1997. Information usedwas the best available to the various agencies of the coun-tries that contributed to the preparation of this report. Thoseagencies were the U.S. Geological Survey of the U.S.Department of the Interior; the Geological Survey of Can-ada and the Minerals and Metals Sector of the CanadianDepartment of Natural Resources; the Federal Institute forGeosciences and Natural Resources of Germany; the Coun-cil for Geoscience and the Minerals Bureau of the Depart-ment of Mineral and Energy Affairs of South Africa; theBureau of Resource Sciences of the Australian Departmentof Primary Industries and Energy and the Australian Geo-logical Survey Organisation; and the British GeologicalSurvey.
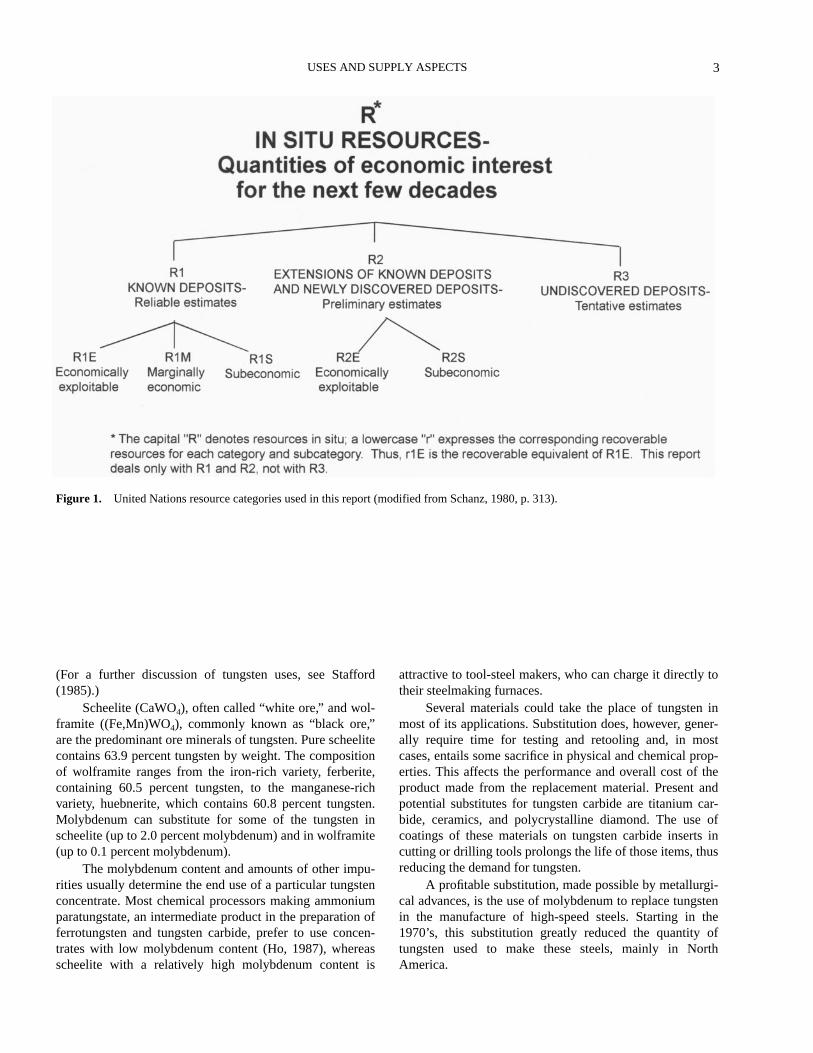
The ISMI record collection and this report on tungstenuse the international classification system for mineralresources recommended by the United Nations Group ofExperts on Definitions and Terminology for MineralResources (United Nations Economic and Social Council,1979; Schanz, 1980). The terms, definitions, and resourcecategories of this system were established in 1979 to facili-tate international exchange of mineral-resource data; theUnited Nations experts sought a system that would be com-patible with the several systems already in use in severalcountries. Figure 1 shows the United Nations (U.N.)resource classification used in this report. The term“reserves,“ which many would consider to be equivalent tocategory r1E or R1E, has been interpreted inconsistentlyand thus has been deliberately avoided in the U.N. classifi-cation. Category R3, undiscovered deposits, is not dealtwith in this report.
Not all companies or countries report resource data inthe same way. Little information is available on tungstenresources in China and the former Soviet Union. Most of theproduction and resource numbers for these two countries,
which together probably have more than half of the world’sresources of tungsten, are estimates.
In this report, almost all resource data are quoted asbeing in place. Mining recovery from an orebody dependson individual conditions and may vary considerably. It typi-cally ranges from 75 to 90 percent for underground mining;that is, 10 to 25 percent of the in-place resources are notrecovered from the ground. After mining, additionalamounts of economic mineral content are lost in processing(concentrating, milling, and chemical treatment).
Overall, an assessment made of mines in market-econ-omy countries has shown that, on average, nearly 69 percentof the tungsten trioxide (WO
3
) contained in the ground wasrecovered in marketable form (Anstett and others, 1985, p.40). Tungsten resource information is reported by industryin terms of either “percent W” or “percent WO
3
.” Unlessotherwise specified, information in this report is expressedin percent W. Where necessary, the factor 0.7931 has beenused to convert amounts expressed in WO
3
to amounts of W.
The World Bank economic classification of countries(World Bank, 1996), which is based primarily on grossnational product (GNP) per capita, has been used in this andother ISMI reports to illustrate distribution of resources andproduction according to economic groupings of countries.This classification was chosen because it relies primarily onobjective economic criteria and does not contain political-bloc labels that might be perceived differently by differentcountries.
USES AND SUPPLY ASPECTS
Tungsten is a dense, corrosion-resistant metal and hasthe highest melting point among metals. When alloyed withother metals or combined with carbon, it increases hardness,durability, and resistance to corrosion for the resultant alloyor compound. Because of these desirable properties, indus-trialized countries consider tungsten essential in metal-cut-ting and oil-well-drilling tools, in ordnance, and inspecialized high-temperature items and alloys for the aero-space industry.
The world’s metallurgical and chemical industriesannually use some 33,000 metric tons of tungsten (U.S.Geological Survey, 1996). Most tungsten goes into tungstencarbide and tungsten alloys for use in machine tools and oil-well-drilling equipment. In the United States, for example,55 percent of the tungsten consumed in 1995 was used incutting and wear-resistant materials in welding and hard-facing rods (tungsten carbide). An additional 10 percent wasused, in the form of tungsten metal, principally to makelamp filaments, cathodes, and ammunition. The remaining35 percent went primarily into the manufacture of high-speed and tool-and-die steels, high-temperature and oxida-tion-resistant superalloys, textile dyes, paints, and catalysts.
USES AND SUPPLY ASPECTS
3
(For a further discussion of tungsten uses, see Stafford(1985).)
Scheelite (CaWO
4
), often called “white ore,” and wol-framite ((Fe,Mn)WO
4
), commonly known as “black ore,”are the predominant ore minerals of tungsten. Pure scheelitecontains 63.9 percent tungsten by weight. The compositionof wolframite ranges from the iron-rich variety, ferberite,containing 60.5 percent tungsten, to the manganese-richvariety, huebnerite, which contains 60.8 percent tungsten.Molybdenum can substitute for some of the tungsten inscheelite (up to 2.0 percent molybdenum) and in wolframite(up to 0.1 percent molybdenum).
The molybdenum content and amounts of other impu-rities usually determine the end use of a particular tungstenconcentrate. Most chemical processors making ammoniumparatungstate, an intermediate product in the preparation offerrotungsten and tungsten carbide, prefer to use concen-trates with low molybdenum content (Ho, 1987), whereasscheelite with a relatively high molybdenum content is
attractive to tool-steel makers, who can charge it directly totheir steelmaking furnaces.
Several materials could take the place of tungsten inmost of its applications. Substitution does, however, gener-ally require time for testing and retooling and, in mostcases, entails some sacrifice in physical and chemical prop-erties. This affects the performance and overall cost of theproduct made from the replacement material. Present andpotential substitutes for tungsten carbide are titanium car-bide, ceramics, and polycrystalline diamond. The use ofcoatings of these materials on tungsten carbide inserts incutting or drilling tools prolongs the life of those items, thusreducing the demand for tungsten.
A profitable substitution, made possible by metallurgi-cal advances, is the use of molybdenum to replace tungstenin the manufacture of high-speed steels. Starting in the1970’s, this substitution greatly reduced the quantity oftungsten used to make these steels, mainly in NorthAmerica.
Figure 1.
United Nations resource categories used in this report (modified from Schanz, 1980, p. 313).
4
INTERNATIONAL STRATEGIC MINERAL ISSUES SUMMARY REPORT—TUNGSTEN
As subsequent sections of this report show, tungstenresources, production, and processing plants are irregularlydistributed around the world. The natural distribution oftungsten deposits and the geographical history of economicdevelopment are such that many industrialized nationsimport tungsten in a raw form (scheelite or wolframite con-centrate) or an intermediate form (synthetic scheelite,ammonium paratungstate, ferrotungsten, or tungsten metalpowder). Historically, two main economic factors havedetermined world demand for tungsten and consequentlyworld supply: (1) the needs of defense industries, whichconsider tungsten essential for producing machine tools,ordnance, and superalloys for aircraft engineers, and (2) therequirements of the world’s metal-fabricating and oil-drill-ing industries.
During World War I, the first widespread use of tung-sten in armaments, which was eventually accompanied byvery high prices, stimulated production in the United Statesand launched the Chinese tungsten mining industry. Rear-mament in the 1930’s and interruptions to supplies fromBurma and China during World War II led to the opening ofnew mines in Brazil and boosted production in Bolivia,Japan, and Spain.
In the 1950’s, during and after the Korean War, theU.S. stockpiling program spurred the development of tung-sten deposits, especially in Australia, Peru, Portugal, and theUnited States, through its offer of purchase contracts to U.S.and foreign suppliers.
Since the early 1970’s, the levels and patterns of worldtungsten supply also have been influenced by—• sales of tungsten from the U.S. stockpile;• the increasingly preeminent role of China in world tung-
sten production; and• the growing tendency of a number of major producing
nations, notably South Korea and China, to shift from theexport of concentrates to the production and export oftungsten in intermediate and upgraded/value-addedforms such as synthetic scheelite, ammonium paratung-state, ferrotungsten, and tungsten metal powder.
In the 1980’s, industrial intermediate and upgraded/value-added products from China and South Korea weresold to consumers in industrial market countries at priceswell below those charged by domestic processors, causingplant closures in those countries. In 1986, for example, allproduction of ferrotungsten ceased in France and West Ger-many, because it could be imported more cheaply fromChina (Bunting, 1987). Over the years, tungsten prices havefluctuated to a greater extent than prices for any otherwidely traded mineral commodity. This fluctuation has ledmany producers of scheelite and wolframite to open andclose their operations in response to price changes. Forexample, the decline in price of a metric ton unit (7.93 kgtungsten) of wolframite concentrate from a high of US$144in 1980 to US$20 (not adjusted for inflation) in August 1993resulted in numerous mine closures (estimated at 85 percentof Western world mine capacity). In some cases, however,tungsten is produced as a coproduct with other commoditiessuch as tin, or as a byproduct in the mining of molybdenum,copper, lead, and zinc. Such mining operations are, ofcourse, less sensitive to fluctuations in the price of tungsten.
TYPES OF TUNGSTEN DEPOSITS
Major tungsten deposits in this report are classified asseven types: vein/stockwork, skarn, porphyry, strata-bound,disseminated, placer, and brine/evaporite (table 1). Of rela-tively minor interest are pegmatite, breccia, pipe, and hotspring deposits. All are discussed below. Most of the currentmine production of tungsten is from vein/stockwork, skarn,porphyry, and strata-bound deposits. Minor amounts oftungsten are produced from disseminated, pegmatite, brec-cia, and placer deposits. The tungsten content of brine/evaporite deposits is large, but no tungsten is currently pro-duced from such deposits.
Vein/stockwork deposits
.—Collectively, vein/stockworkdeposits accounted for more than 50 percent of world tung-sten production in 1986, mainly from deposits in China
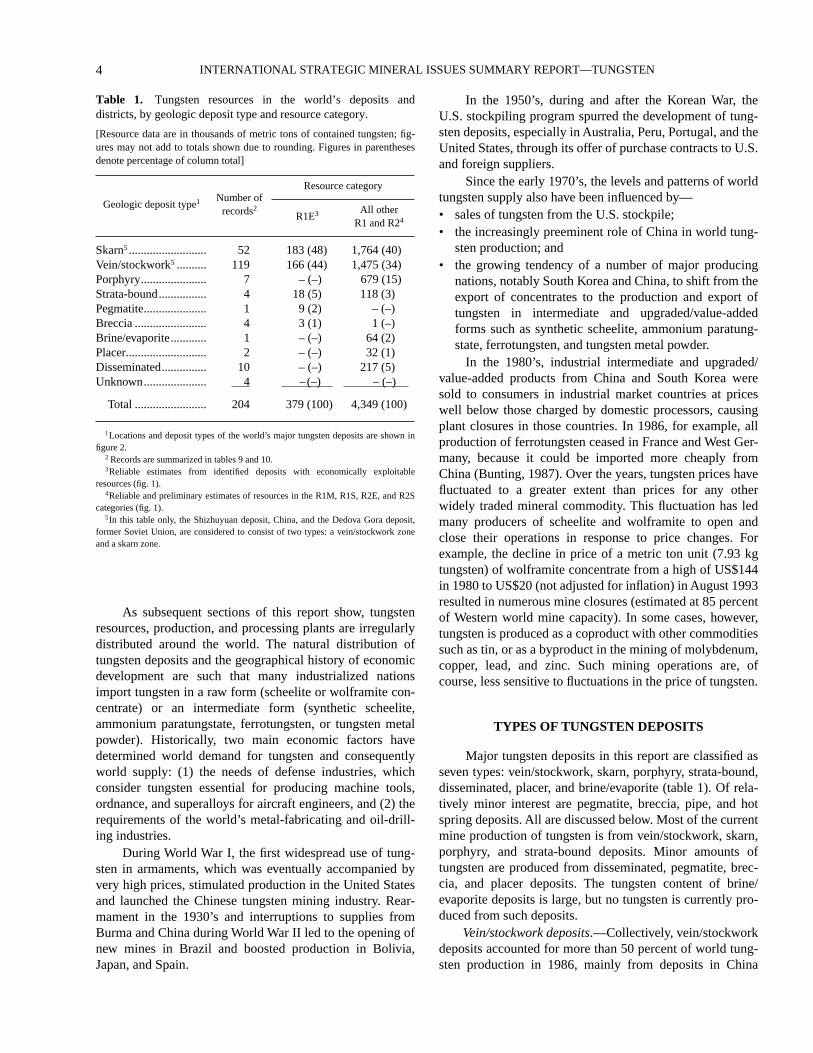
Table 1.
Tungsten resources in the world’s deposits anddistricts, by geologic deposit type and resource category.
[Resource data are in thousands of metric tons of contained tungsten; fig-ures may not add to totals shown due to rounding. Figures in parenthesesdenote percentage of column total]
1
Locations and deposit types of the world’s major tungsten deposits are shown infigure 2.
2
Records are summarized in tables 9 and 10.
3
Reliable estimates from identified deposits with economically exploitableresources (fig. 1).
4
Reliable and preliminary estimates of resources in the R1M, R1S, R2E, and R2Scategories (fig. 1).
5
In this table only, the Shizhuyuan deposit, China, and the Dedova Gora deposit,former Soviet Union, are considered to consist of two types: a vein/stockwork zoneand a skarn zone.
Geologic deposit type
1
Number ofrecords
2
Resource category
R1E
3
All other R1 and R2
4
Skarn
5
.......................... 52 183 (48) 1,764 (40)Vein/stockwork
5
.......... 119 166 (44) 1,475 (34)Porphyry...................... 7 – (–) 679 (15)Strata-bound................ 4 18 (5) 118 (3)Pegmatite..................... 1 9 (2) – (–)Breccia ........................ 4 3 (1) 1 (–)Brine/evaporite............ 1 – (–) 64 (2)Placer........................... 2 – (–) 32 (1)Disseminated............... 10 – (–) 217 (5)Unknown..................... 4 – (–) – (–)
Total ........................ 204 379 (100) 4,349 (100)
TYPES OF TUNGSTEN DEPOSITS
5
(southern Jiangxi region), Bolivia, Peru, Portugal, and theformer Soviet Union. These deposits typically consist oftungsten-bearing quartz veins or vein stockworks that occurin or near granitic intrusions. Wolframite is commonly theprincipal tungsten mineral; scheelite is important in somedeposits. Tin, copper, molybdenum, and bismuth mineralsare also present in some vein/stockwork tungsten depositsand may be economically important.
Most vein deposits are relatively small, on the order ofa few hundred thousand metric tons of ore; few vein depos-its contain more than 1 million metric tons of ore. Largevein deposits may contain hundreds of minable veins. Instockwork deposits, swarms of parallel to subparallel veins,commonly with interconnecting veins and veinlets, form“sheeted” veins or stockworks that can be exploited by bulkmining methods (as at Mount Carbine, Australia). Suchdeposits may contain tens to hundreds of millions of metrictons of ore but are generally of low grade (the Mount Car-bine deposit in Australia, for example, contains 0.1 percentWO
3
). The world's largest known deposit, Verkhne-Kayrakty in the former Soviet Union (872,000 metric tonsof tungsten in 1.1 million metric tons of WO
3
in the ore),which is shown as a vein/stockwork deposit in figures 2 and3, consists mainly of a scheelite-bearing stockwork in agranite pluton. In some vein/stockwork deposits, tungstenminerals may also replace altered wall rocks adjacent toveins. The extent of such replacement is generally minor,with the exception of some deposits in carbonate host rocks(such as Morococha, Peru).
Skarn deposits
.—Skarn deposits accounted for about30 percent of world tungsten production in 1986, mainlyfrom deposits in Brazil, Canada, the former Soviet Union,Australia, South Korea, Turkey, and the United States. Inthis report, the term “skarn” refers generally to an assem-blage of calcium-iron-magnesium-aluminum-silicate miner-als that have developed in carbonate-bearing rocks at or nearcontacts with granitic intrusions. Scheelite is the principaltungsten mineral in skarn deposits and occurs both as dis-seminated grains and in veinlets or fractures. In some tung-sten-bearing skarn deposits, copper, molybdenum, andbismuth minerals are also present and may be economicallyrecoverable.
Exploitable skarn deposits generally contain 0.3 to 1.5percent WO
3
and range in size from hundreds to millions ofmetric tons of ore. They include some of the world's largesttungsten deposits, such as Mactung in Canada and Tyrnyauzand Vostok-2 in the former Soviet Union.
Porphyry deposits.
—Porphyry deposits overallaccounted for about 6 percent of world tungsten productionin 1986. Such deposits consist of large, equidimensional toirregular stockwork zones of tungsten-bearing veins, vein-lets, and fractures that occur in or near epizonal to subvolca-nic felsic granitic intrusions. Mineralized breccia zones,either irregular or pipe shaped, may also be present. Tung-sten occurs as wolframite or scheelite, and in
some deposits
both minerals may be present. Molybdenum is commonlypresent in porphyry tungsten deposits and may represent aviable coproduct or byproduct. Small amounts of tungstenare present in some porphyry molybdenum deposits (suchas Climax, United States, where it has been an importantbyproduct) and in porphyry tin deposits (such as Chorolque,Bolivia).
Porphyry deposits typically are hundreds of metersacross and tens to hundreds of meters thick and contain tensto hundreds of millions of metric tons of ore. Nonetheless,such deposits are currently only of marginal economic inter-est because their average grade is low (about 0.1 to 0.4 per-cent WO
3
); for example, a mining operation in the MountPleasant deposit in Canada started in April 1984 and closedin July 1985 even though it still contains more than 8 mil-lion metric tons of material averaging 0.4 percent WO
3
aswell as molybdenum, tin, and other potentially recoverablemetals. Yet, because of their large size, porphyry depositsrepresent significant tungsten resources for the future.Important examples are the Lianhuashan, Yangchuling, andXingluokeng deposits in China (fig. 4). The Logtung depositin Yukon Territory, Canada, containing 168,000 metric tonsof tungsten in 162 million metric tons of material averaging0.13 percent WO
3
, might be exploited some decades fromnow.
Strata-bound deposits
.—Production from strata-bounddeposits in 1986 was less than 5 percent of world tungstenproduction. Mittersill, Austria, and possibly Damingshan,China, where the current production status could not beascertained, are the main deposits. In this report, the term“strata-bound” refers to deposits in which the distribution oftungsten minerals is strongly controlled by bedding in thehost rocks and for which a syngenetic origin may beinferred. It does not include skarn deposits, which may belargely controlled by host-rock lithology but are essentiallyepigenetic. However, many strata-bound deposits appear tohave been affected by later mobilization and reconcentra-tion, and a syngenetic origin for such deposits, includingMittersill, is questionable. Strata-bound deposits range insize from one to tens of millions of metric tons of ore, withaverage grade ranging from 0.2 to 1 percent WO
3
.
Disseminated deposits
.—Output from disseminateddeposits in 1986 probably amounted to less than 1 percentof total world tungsten production, although some of theknown deposits are moderately large. The best examples ofthis type of deposit are the Hub stock in the Krasno depositin the Czech Republic, the Spokoinyi deposit in the formerSoviet Union, and the Torrington deposit in Australia. Tung-sten is recovered also from some disseminated tin depositssuch as Zaaiplaats in South Africa. Most disseminateddeposits consist of tungsten minerals disseminated inaltered (greisenized) granite. Tungsten generally occurs aswolframite; scheelite may be important in some deposits.Disseminated deposits may contain tens of millions of met-
6
INT
ER
NA
TIO
NA
L ST
RA
TE
GIC
MIN
ER
AL
ISSUE
S SUM
MA
RY
RE
POR
T—
TU
NG
STE
N
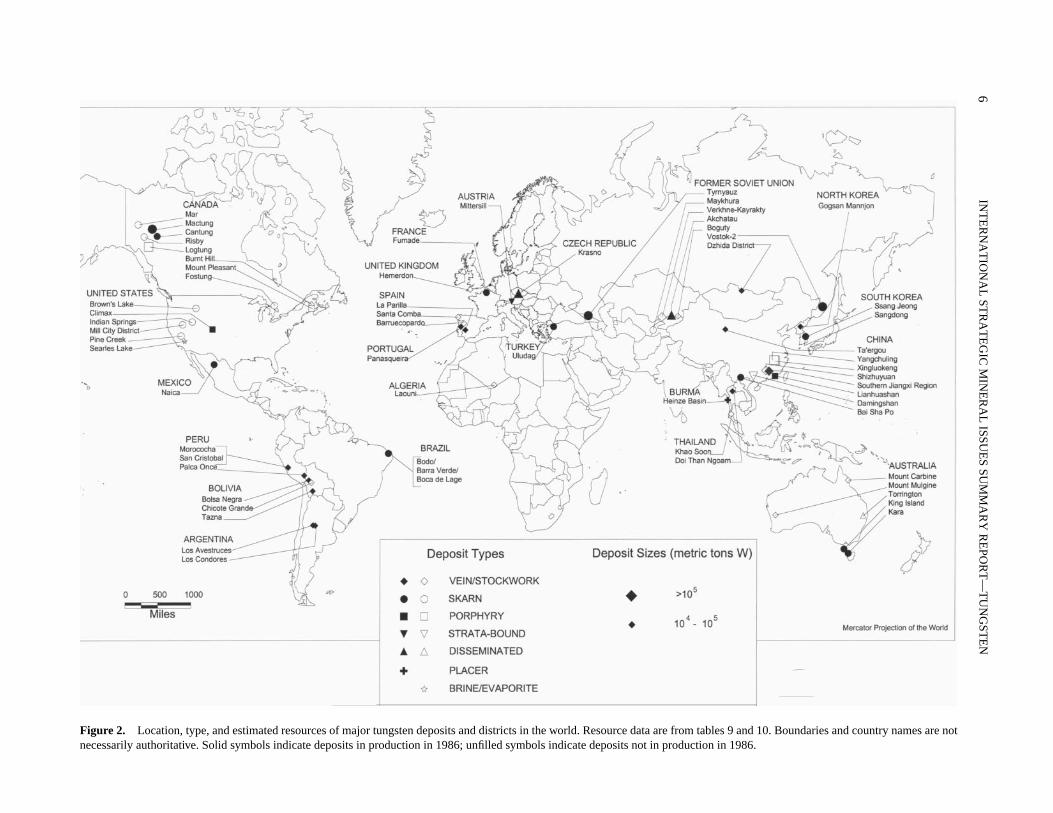
Figure 2.
Location, type, and estimated resources of major tungsten deposits and districts in the world. Resource data are from tables 9 and 10. Boundaries and country names are notnecessarily authoritative. Solid symbols indicate deposits in production in 1986; unfilled symbols indicate deposits not in production in 1986.
TY
PES O
F TU
NG
STE
N D
EPO
SITS
7
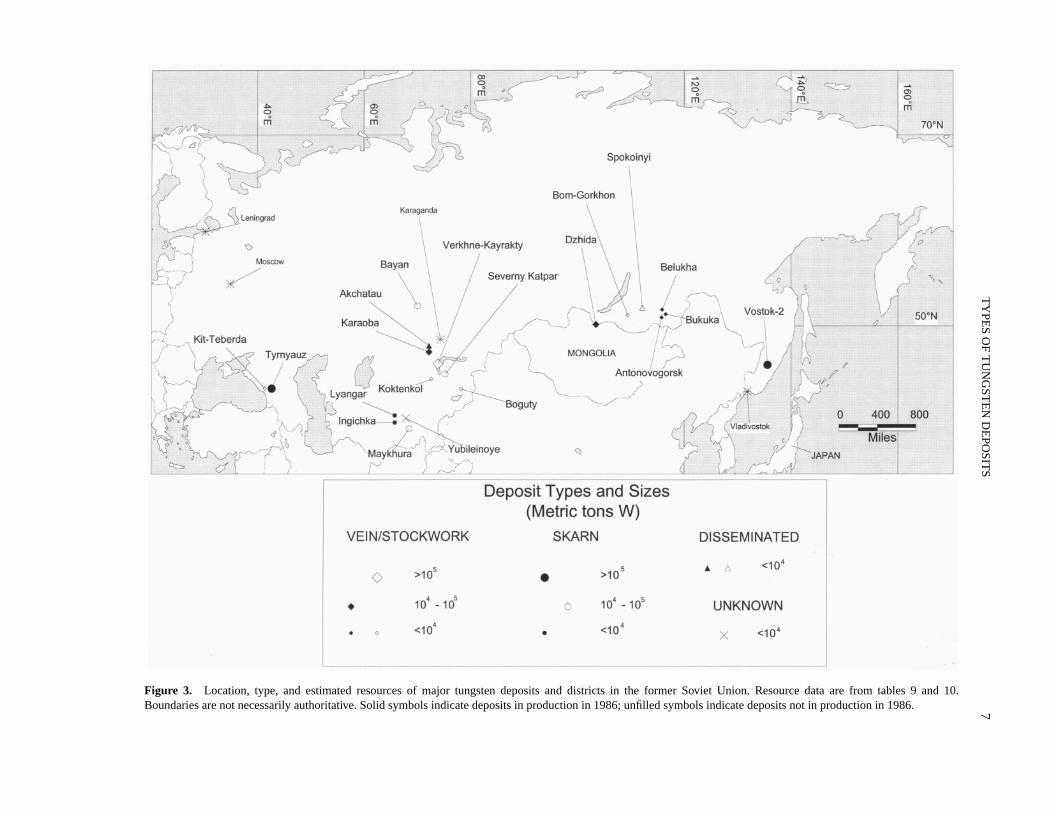
Figure 3.
Location, type, and estimated resources of major tungsten deposits and districts in the former Soviet Union. Resource data are from tables 9 and 10.Boundaries are not necessarily authoritative. Solid symbols indicate deposits in production in 1986; unfilled symbols indicate deposits not in production in 1986.
8
INTERNATIONAL STRATEGIC MINERAL ISSUES SUMMARY REPORT—TUNGSTEN
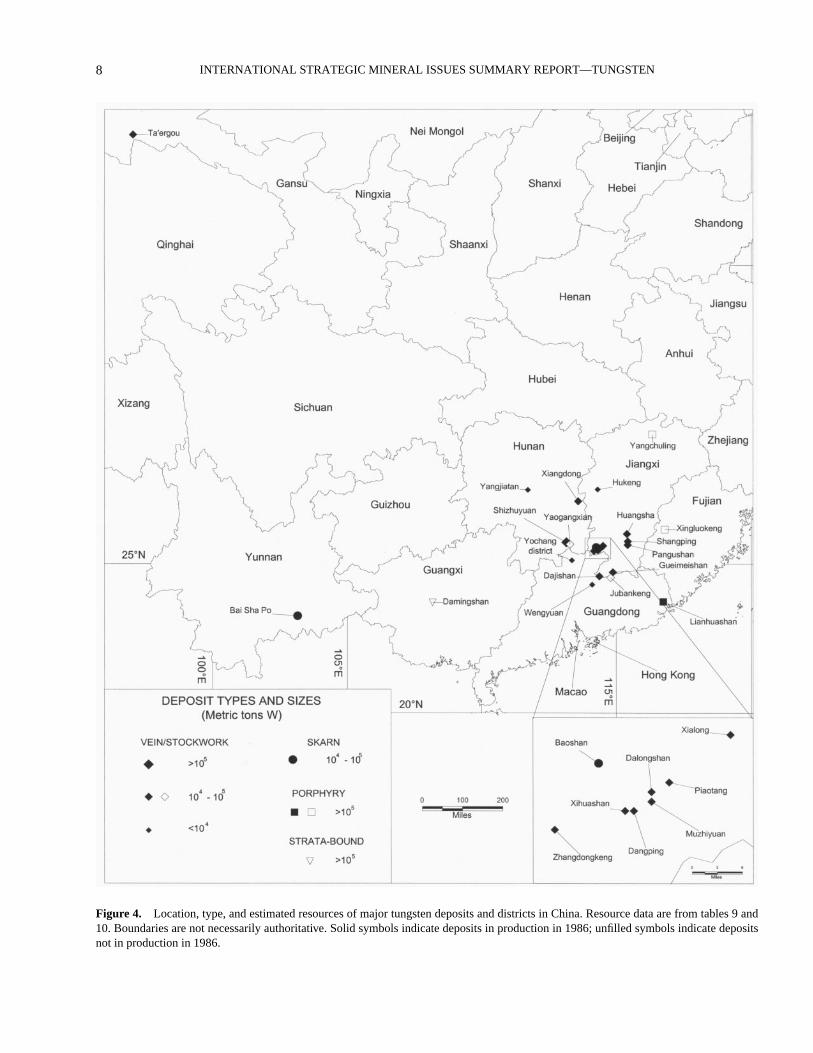
Figure 4.
Location, type, and estimated resources of major tungsten deposits and districts in China. Resource data are from tables 9 and10. Boundaries are not necessarily authoritative. Solid symbols indicate deposits in production in 1986; unfilled symbols indicate depositsnot in production in 1986.
GEOGRAPHIC DISTRIBUTION OF TUNGSTEN DEPOSITS AND DISTRICTS
9
ric tons of material but are of low grade, generally averaginga few tenths of one percent WO
3
.
Placer deposits.
—Production of tungsten from placerdeposits has been important historically, but 1986 produc-tion from such deposits was probably less than a few per-cent of total world production. Placer deposits consist ofsedimentary concentrations of scheelite or wolframite inalluvial, eluvial, and, in some cases, marine sediments. Suchdeposits are typically associated with, or only slightlyremoved from, bedrock tungsten-bearing deposits fromwhich they were derived by processes of weathering anderosion. Scheelite and even wolframite will eventuallydecompose upon weathering and hence, unlike cassiterite,tungsten minerals tend not to be preserved long enough toform widespread sedimentary deposits.
Some placer tungsten deposits may be large enough towarrant the use of heavy equipment for mining (such asHeinze Basin, Burma). Deposits in the former Soviet Unionin the Dzhida district possibly are in this category. However,most placer deposits are relatively small, and in many places(such as China), tungsten is recovered by hand mining.
Brine/evaporite deposits
.—Tungsten-bearing brinesand evaporites occur in arid regions of the former SovietUnion and Western United States. For example, the SearlesLake deposit in California, which covers an area of 90square kilometers, contains 70 parts per million of tungsten,or a total of 61,000 metric tons of tungsten (Anstett and oth-ers, 1985, p. 20) in highly concentrated brines. If tungstencould be recovered here profitably, which is not the case atpresent, this brine-charged lake bed would represent animportant source of supply.
Pegmatite deposits
.—Tungsten is not a common con-stituent of pegmatites, and significant pegmatite deposits oftungsten are rare. The Okbang deposit in South Korea is theonly example of a deposit of this type of any significance inthe context of current world production or potential supply.
Breccia deposits
.—Breccia zones, consisting of rockfragments of varied shapes and sizes, commonly form inte-gral parts of many vein/stockwork and porphyry deposits.However, some tungsten-bearing breccia bodies, many pipeshaped, appear to have formed independently of otherdeposit types. An example is the Washington breccia pipe inSonora, Mexico, where tungsten (as scheelite) is associatedwith copper and molybdenum minerals.
Pipe deposits
.—Pipe deposits range from almost per-fectly cylindrical to irregular, elongated, bulbous masses ofquartz that occur in the margins of granitic intrusions. Wol-framite, along with molybdenite and native bismuth, iserratically distributed in high-grade shoots or pockets. Someof those pockets contain up to 20 percent wolframite. Thedeposits, however, are small, and although they are histori-cally important, particularly in Australia (for example, theWolfram Camp deposits in Queensland), there is little pro-duction from them at present.
Hot spring deposits
.—Tungsten occurs in hot springdeposits of calcareous tuffs or travertine, such as Golconda,(Nevada, United States) and Uincia (Bolivia); these depositsare too small to be listed in tables 9 and 10. Hot springdeposits are commonly associated with bedrock tungstendeposits, from which they were probably derived by circu-lating hot ground water. The deposits are small, andalthough there has been minor production from them in thepast, current production, if any, is insignificant.
GEOLOGIC AGES OF TUNGSTEN DEPOSITS
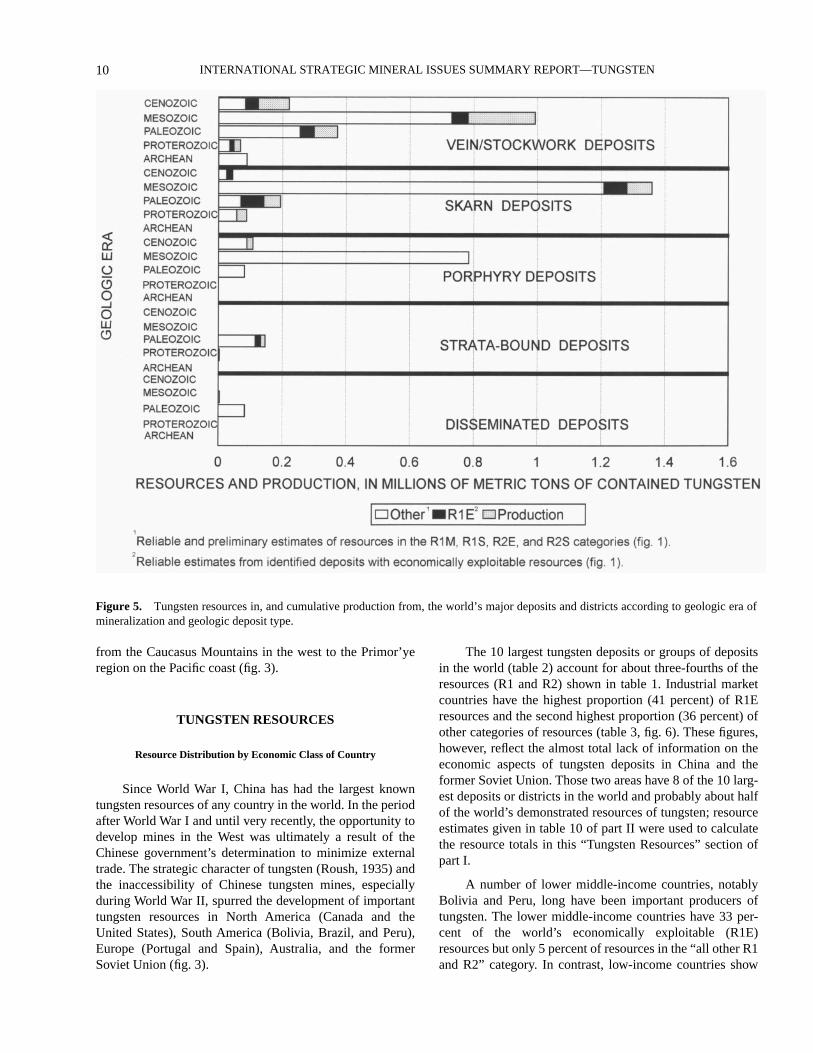
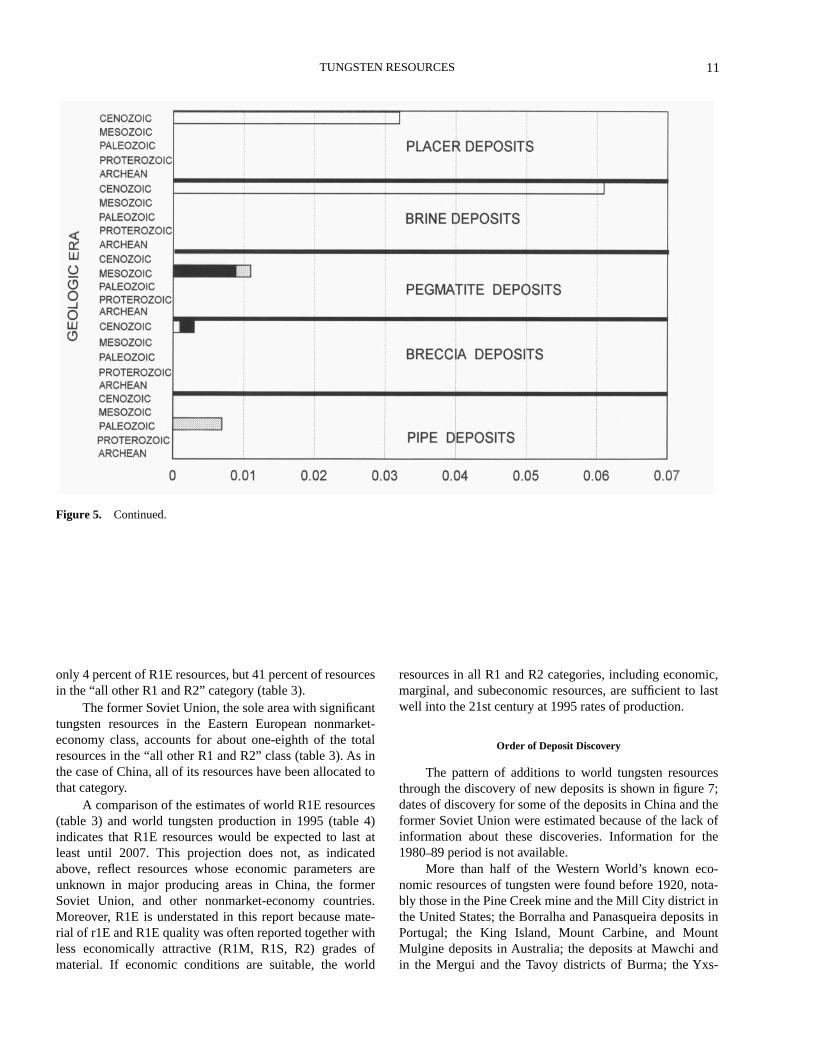
The geologic eons and eras in which tungsten depositsin the inventory were formed are shown in figure 5. Of theimportant deposit types, only vein/stockwork deposits oftungsten are represented in every time period; skarn depos-its are Proterozoic or younger, porphyry deposits are Paleo-zoic or younger, and strata-bound deposits are eitherProterozoic or Paleozoic in age. By far the largest propor-tion of the tungsten resources (70 percent), representedmainly by vein/stockwork, skarn, and porphyry-type tung-sten deposits, is Mesozoic in age.
One of the main factors that determine where the tung-sten deposits are located is not so much geologic age, butproximity to orogenic belts. Hence, many of the world’stungsten mines are found in the Rockies/Andes, Pyrenees,Alps, and Hercynian (Hemerdon) and Caledonian (Carrock)mountain belts.
GEOGRAPHIC DISTRIBUTION OF TUNGSTEN DEPOSITS AND DISTRICTS
Although tungsten deposits and districts are wide-spread, the largest deposits (those containing more than100,000 metric tons of tungsten) are concentrated in China(foremost), the former Soviet Union (a distant second), andCanada (fig. 2 and table 2). Deposits of a lesser rank, butstill economically important (10,000 to 100,000 metric tonsof tungsten), are found in many countries, notably in theUnited States, Australia, Brazil, Burma, Peru, North Korea,South Korea, Turkey, Thailand, and in some western Euro-pean countries such as the United Kingdom, Portugal,Spain, France, and Austria. Africa, despite its large size anddiverse geology, is particularly lacking in large known tung-sten deposits, although a medium-size deposit occurs inAlgeria, and small deposits (less than 10,000 metric tons oftungsten) are reported in Namibia, Rwanda, South Africa,Sudan, Uganda, and Zimbabwe.
In China, the largest deposits are in southern JiangxiProvince and in adjacent areas in Hunan, Fujian, andGuangdong Provinces, in the southeastern part of the coun-try (fig. 4). Except for a single deposit in the northeasterncorner of Siberia, significant deposits in the former SovietUnion occur in a belt across the southern part of the country
10
INTERNATIONAL STRATEGIC MINERAL ISSUES SUMMARY REPORT—TUNGSTEN
from the Caucasus Mountains in the west to the Primor’yeregion on the Pacific coast (fig. 3).
TUNGSTEN RESOURCES
Resource Distribution by Economic Class of Country
Since World War I, China has had the largest knowntungsten resources of any country in the world. In the periodafter World War I and until very recently, the opportunity todevelop mines in the West was ultimately a result of theChinese government’s determination to minimize externaltrade. The strategic character of tungsten (Roush, 1935) andthe inaccessibility of Chinese tungsten mines, especiallyduring World War II, spurred the development of importanttungsten resources in North America (Canada and theUnited States), South America (Bolivia, Brazil, and Peru),Europe (Portugal and Spain), Australia, and the formerSoviet Union (fig. 3).
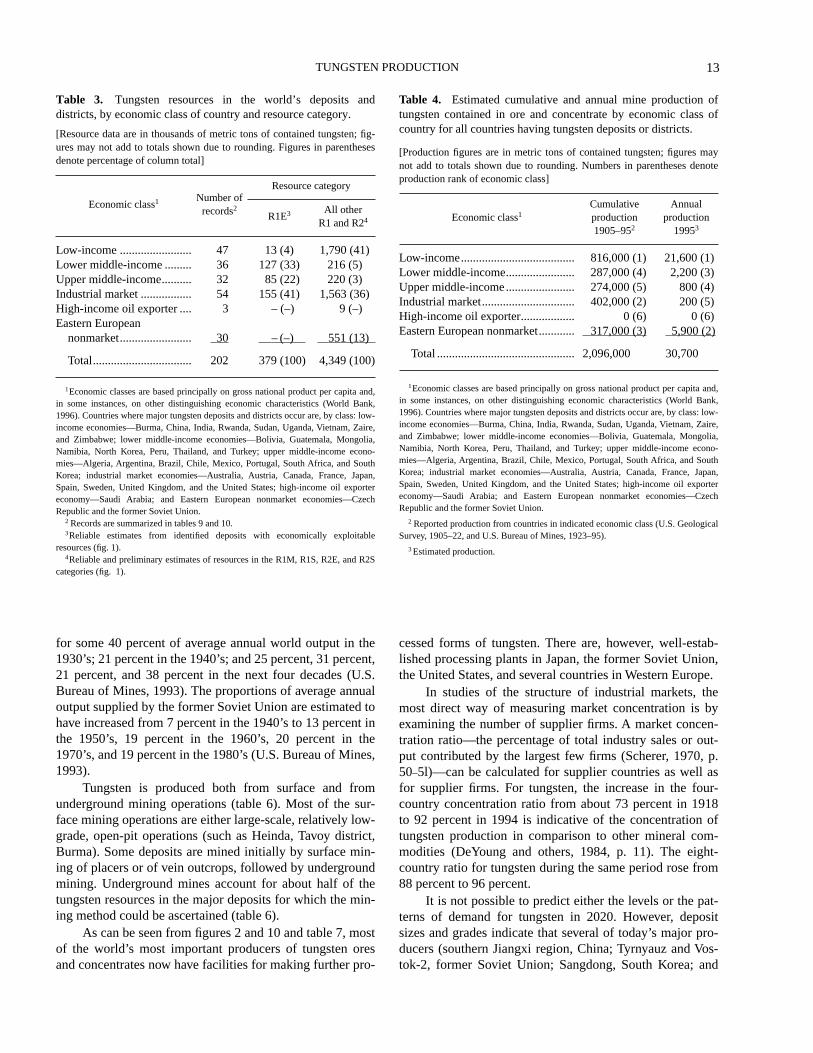
The 10 largest tungsten deposits or groups of depositsin the world (table 2) account for about three-fourths of theresources (R1 and R2) shown in table 1. Industrial marketcountries have the highest proportion (41 percent) of R1Eresources and the second highest proportion (36 percent) ofother categories of resources (table 3, fig. 6). These figures,however, reflect the almost total lack of information on theeconomic aspects of tungsten deposits in China and theformer Soviet Union. Those two areas have 8 of the 10 larg-est deposits or districts in the world and probably about halfof the world’s demonstrated resources of tungsten; resourceestimates given in table 10 of part II were used to calculatethe resource totals in this “Tungsten Resources” section ofpart I.
A number of lower middle-income countries, notablyBolivia and Peru, long have been important producers oftungsten. The lower middle-income countries have 33 per-cent of the world’s economically exploitable (R1E)resources but only 5 percent of resources in the “all other R1and R2” category. In contrast, low-income countries show
Figure 5.
Tungsten resources in, and cumulative production from, the world’s major deposits and districts according to geologic era ofmineralization and geologic deposit type.
TUNGSTEN RESOURCES
11
only 4 percent of R1E resources, but 41 percent of resourcesin the “all other R1 and R2” category (table 3).
The former Soviet Union, the sole area with significanttungsten resources in the Eastern European nonmarket-economy class, accounts for about one-eighth of the totalresources in the “all other R1 and R2” class (table 3). As inthe case of China, all of its resources have been allocated tothat category.
A comparison of the estimates of world R1E resources(table 3) and world tungsten production in 1995 (table 4)indicates that R1E resources would be expected to last atleast until 2007. This projection does not, as indicatedabove, reflect resources whose economic parameters areunknown in major producing areas in China, the formerSoviet Union, and other nonmarket-economy countries.Moreover, R1E is understated in this report because mate-rial of r1E and R1E quality was often reported together withless economically attractive (R1M, R1S, R2) grades ofmaterial. If economic conditions are suitable, the world
resources in all R1 and R2 categories, including economic,marginal, and subeconomic resources, are sufficient to lastwell into the 21st century at 1995 rates of production.
Order of Deposit Discovery
The pattern of additions to world tungsten resourcesthrough the discovery of new deposits is shown in figure 7;dates of discovery for some of the deposits in China and theformer Soviet Union were estimated because of the lack ofinformation about these discoveries. Information for the1980
–
89 period is not available. More than half of the Western World’s known eco-
nomic resources of tungsten were found before 1920, nota-bly those in the Pine Creek mine and the Mill City district inthe United States; the Borralha and Panasqueira deposits inPortugal; the King Island, Mount Carbine, and MountMulgine deposits in Australia; the deposits at Mawchi andin the Mergui and the Tavoy districts of Burma; the Yxs-
Figure 5.
Continued.
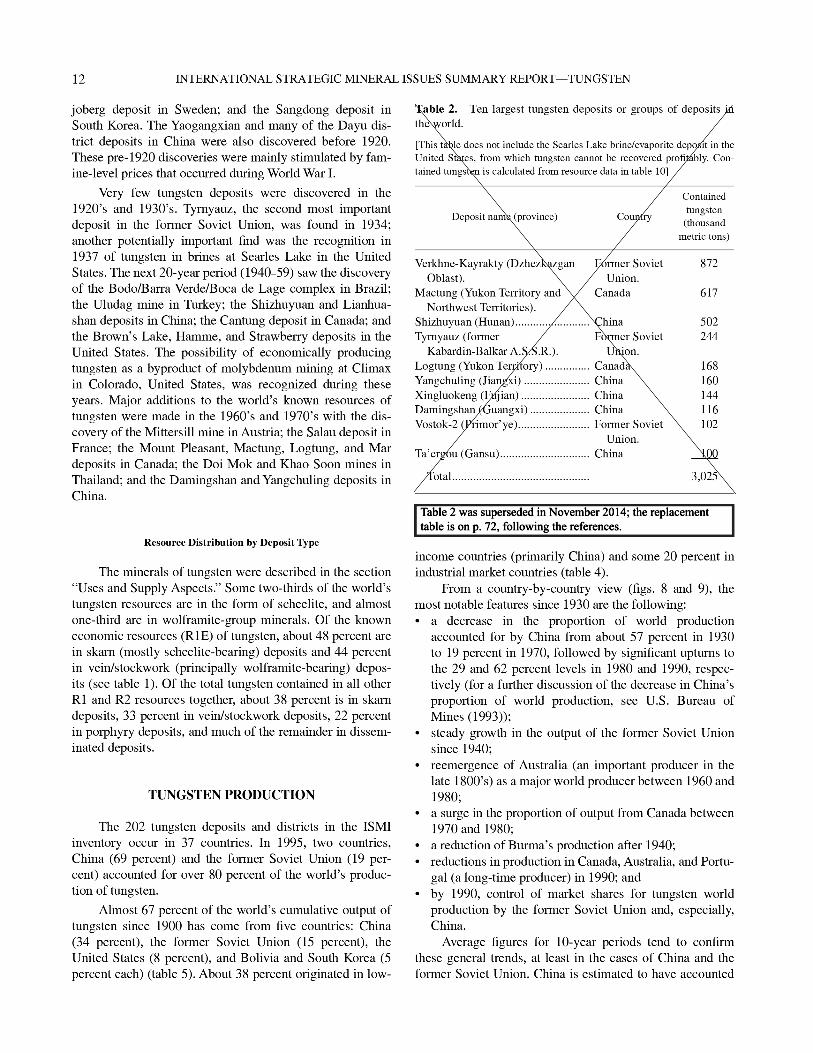
Table 2 was superseded in November 2014; the replacement table is on p. 72, following the references.
TUNGSTEN PRODUCTION
13
for some 40 percent of average annual world output in the1930’s; 21 percent in the 1940’s; and 25 percent, 31 percent,21 percent, and 38 percent in the next four decades (U.S.Bureau of Mines, 1993). The proportions of average annualoutput supplied by the former Soviet Union are estimated tohave increased from 7 percent in the 1940’s to 13 percent inthe 1950’s, 19 percent in the 1960’s, 20 percent in the1970’s, and 19 percent in the 1980’s (U.S. Bureau of Mines,1993).
Tungsten is produced both from surface and fromunderground mining operations (table 6). Most of the sur-face mining operations are either large-scale, relatively low-grade, open-pit operations (such as Heinda, Tavoy district,Burma). Some deposits are mined initially by surface min-ing of placers or of vein outcrops, followed by undergroundmining. Underground mines account for about half of thetungsten resources in the major deposits for which the min-ing method could be ascertained (table 6).
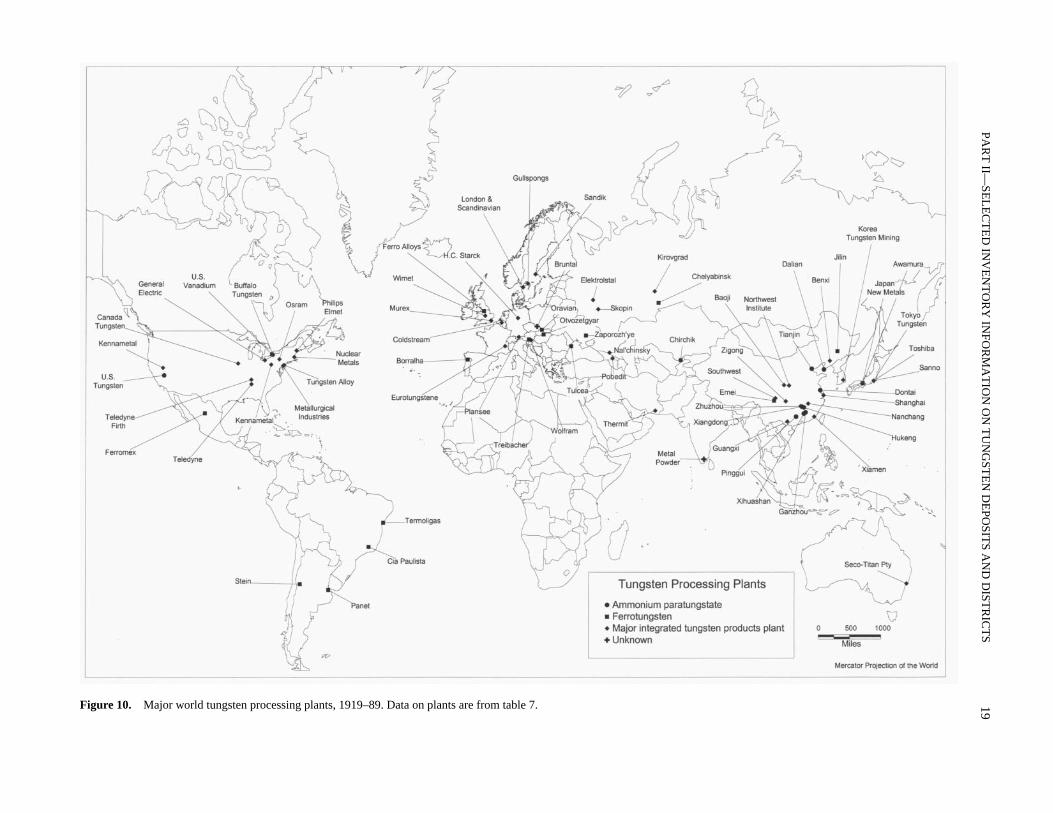
As can be seen from figures 2 and 10 and table 7, mostof the world’s most important producers of tungsten oresand concentrates now have facilities for making further pro-
cessed forms of tungsten. There are, however, well-estab-lished processing plants in Japan, the former Soviet Union,the United States, and several countries in Western Europe.
In studies of the structure of industrial markets, themost direct way of measuring market concentration is byexamining the number of supplier firms. A market concen-tration ratio—the percentage of total industry sales or out-put contributed by the largest few firms (Scherer, 1970, p.50
–
5l)—can be calculated for supplier countries as well asfor supplier firms. For tungsten, the increase in the four-country concentration ratio from about 73 percent in 1918to 92 percent in 1994 is indicative of the concentration oftungsten production in comparison to other mineral com-modities (DeYoung and others, 1984, p. 11). The eight-country ratio for tungsten during the same period rose from88 percent to 96 percent.
It is not possible to predict either the levels or the pat-terns of demand for tungsten in 2020. However, depositsizes and grades indicate that several of today’s major pro-ducers (southern Jiangxi region, China; Tyrnyauz and Vos-tok-2, former Soviet Union; Sangdong, South Korea; and
Table 3.
Tungsten resources in the world’s deposits anddistricts, by economic class of country and resource category.
[Resource data are in thousands of metric tons of contained tungsten; fig-ures may not add to totals shown due to rounding. Figures in parenthesesdenote percentage of column total]
1
Economic classes are based principally on gross national product per capita and,in some instances, on other distinguishing economic characteristics (World Bank,1996). Countries where major tungsten deposits and districts occur are, by class: low-income economies—Burma, China, India, Rwanda, Sudan, Uganda, Vietnam, Zaire,and Zimbabwe; lower middle-income economies—Bolivia, Guatemala, Mongolia,Namibia, North Korea, Peru, Thailand, and Turkey; upper middle-income econo-mies—Algeria, Argentina, Brazil, Chile, Mexico, Portugal, South Africa, and SouthKorea; industrial market economies—Australia, Austria, Canada, France, Japan,Spain, Sweden, United Kingdom, and the United States; high-income oil exportereconomy—Saudi Arabia; and Eastern European nonmarket economies—CzechRepublic and the former Soviet Union.
2
Records are summarized in tables 9 and 10.
3
Reliable estimates from identified deposits with economically exploitableresources (fig. 1).
4
Reliable and preliminary estimates of resources in the R1M, R1S, R2E, and R2Scategories (fig. 1).
Economic class
1
Number ofrecords
2
Resource category
R1E
3
All other R1 and R2
4
Low-income ........................ 47 13 (4) 1,790 (41)Lower middle-income ......... 36 127 (33) 216 (5)Upper middle-income.......... 32 85 (22) 220 (3)Industrial market ................. 54 155 (41) 1,563 (36)High-income oil exporter .... 3 – (–) 9 (–)Eastern European
nonmarket........................ 30 – (–) 551 (13)
Total................................. 202 379 (100) 4,349 (100)
Table 4.
Estimated cumulative and annual mine production oftungsten contained in ore and concentrate by economic class ofcountry for all countries having tungsten deposits or districts.
[Production figures are in metric tons of contained tungsten; figures maynot add to totals shown due to rounding. Numbers in parentheses denoteproduction rank of economic class]
1
Economic classes are based principally on gross national product per capita and,in some instances, on other distinguishing economic characteristics (World Bank,1996). Countries where major tungsten deposits and districts occur are, by class: low-income economies—Burma, China, India, Rwanda, Sudan, Uganda, Vietnam, Zaire,and Zimbabwe; lower middle-income economies—Bolivia, Guatemala, Mongolia,Namibia, North Korea, Peru, Thailand, and Turkey; upper middle-income econo-mies—Algeria, Argentina, Brazil, Chile, Mexico, Portugal, South Africa, and SouthKorea; industrial market economies—Australia, Austria, Canada, France, Japan,Spain, Sweden, United Kingdom, and the United States; high-income oil exportereconomy—Saudi Arabia; and Eastern European nonmarket economies—CzechRepublic and the former Soviet Union.
2
Reported production from countries in indicated economic class (U.S. GeologicalSurvey, 1905–22, and U.S. Bureau of Mines, 1923–95).
3
Estimated production.
Economic class
1
Cumulativeproduction 1905–95
2
Annualproduction
1995
3
Low-income...................................... 816,000 (1) 21,600 (1)Lower middle-income....................... 287,000 (4) 2,200 (3)Upper middle-income....................... 274,000 (5) 800 (4)Industrial market............................... 402,000 (2) 200 (5)High-income oil exporter.................. 0 (6) 0 (6)Eastern European nonmarket............ 317,000 (3) 5,900 (2)
Total .............................................. 2,096,000 30,700
14
INT
ER
NA
TIO
NA
L ST
RA
TE
GIC
MIN
ER
AL
ISSUE
S SUM
MA
RY
RE
POR
T—
TU
NG
STE
N
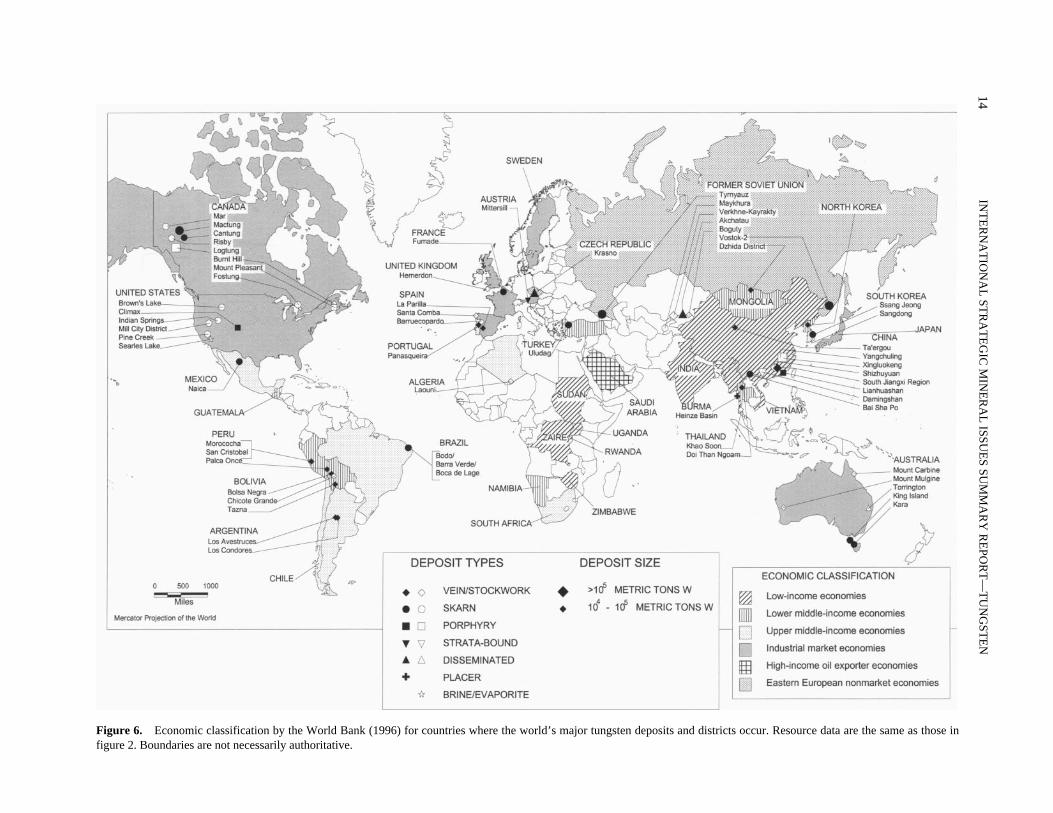
Figure 6.
Economic classification by the World Bank (1996) for countries where the world’s major tungsten deposits and districts occur. Resource data are the same as those infigure 2. Boundaries are not necessarily authoritative.
TUNGSTEN PRODUCTION
15
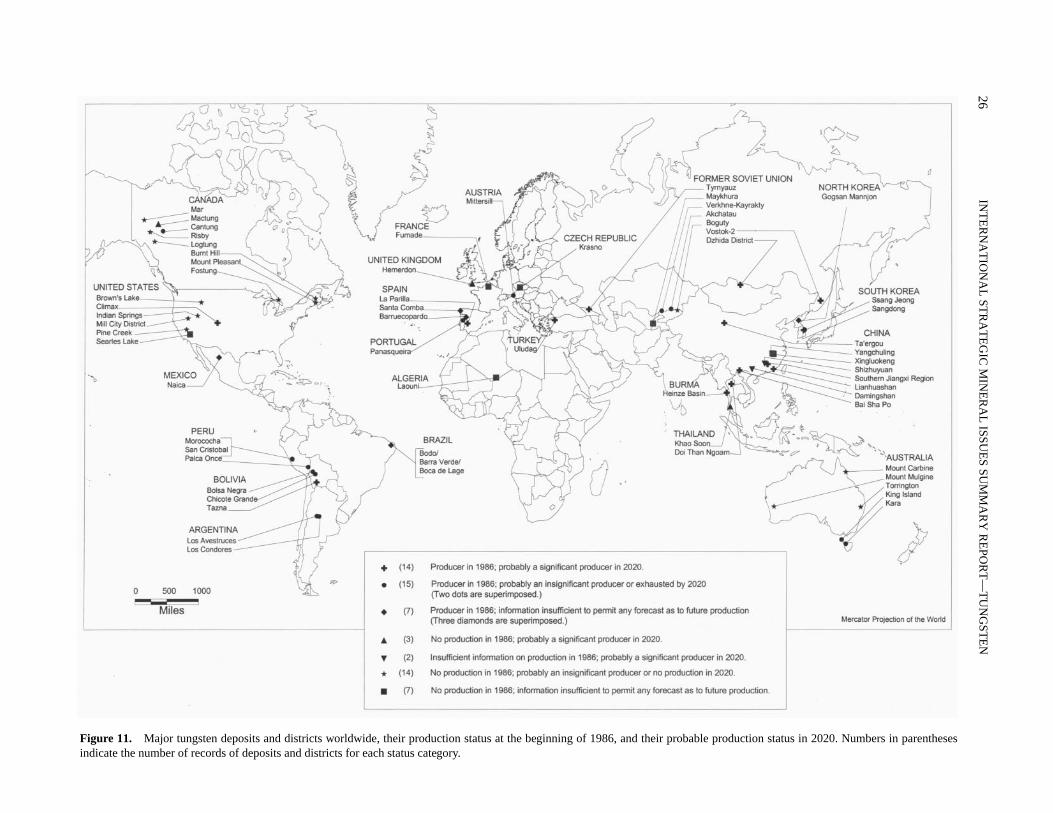
Climax, United States) will probably continue to be impor-tant producers in the year 2020 (fig. 11). The period of1990
–
2020 will likely see important changes in tungstensupply from other areas. Unless additional minable reservesare discovered, decreases in output can be expected fromcertain deposits (probably Mittersill, Austria; Kara, Austra-lia; Panasqueira, Portugal; and some of the deposits in thesouthern Jiangxi region, China). Major deposits such as theHemerdon deposit, United Kingdom; the former Cantungmine and the Mactung deposit, Canada; and the Daming-shan, Shizhuyuan, and other deposits in China, now subeco-nomic, may become economically viable because of theirlarge size and amenability to low-cost bulk mining. Produc-tion from large deposits in a limited number of low-incomeeconomy countries (such as China and Burma) may becomerelatively more important in the future, and the country con-centration ratios for tungsten may accordingly increase.Large size and low-cost mining, however, will not help ifthe price is too low for profitable extraction. Because of thevery speculative nature of tungsten metal prices, mines oflow capital intensity that can be discontinued without much
financial penalty in periods of economic downturn are in abetter position to reopen when a market recovers.
Tungsten is also recovered as a coproduct or byproductof mining operations in deposits that are mined primarilyfor other metals, such as tin, molybdenum, copper, lead,zinc, or bismuth. In the future, such deposits may becomemore important sources of tungsten, especially if new minesare opened in large deposits, such as those of the molybde-num-tungsten porphyry variety.
The largest proportion of world tungsten resourcesidentified in this inventory is in China; Canada and theformer Soviet Union also have significant resources.Because China and, at the time of the inventory, the formerSoviet Union do not provide details of their tungstenresources, the quality and degree of minability of theirdeposits could not be ascertained. Other countries withimportant tungsten resources are Australia, Bolivia, Brazil,Peru, Portugal, Spain, South Korea, and the United King-dom. In these countries, the geologic and economic aspectsof the local deposits are more widely known and often betterdefined.
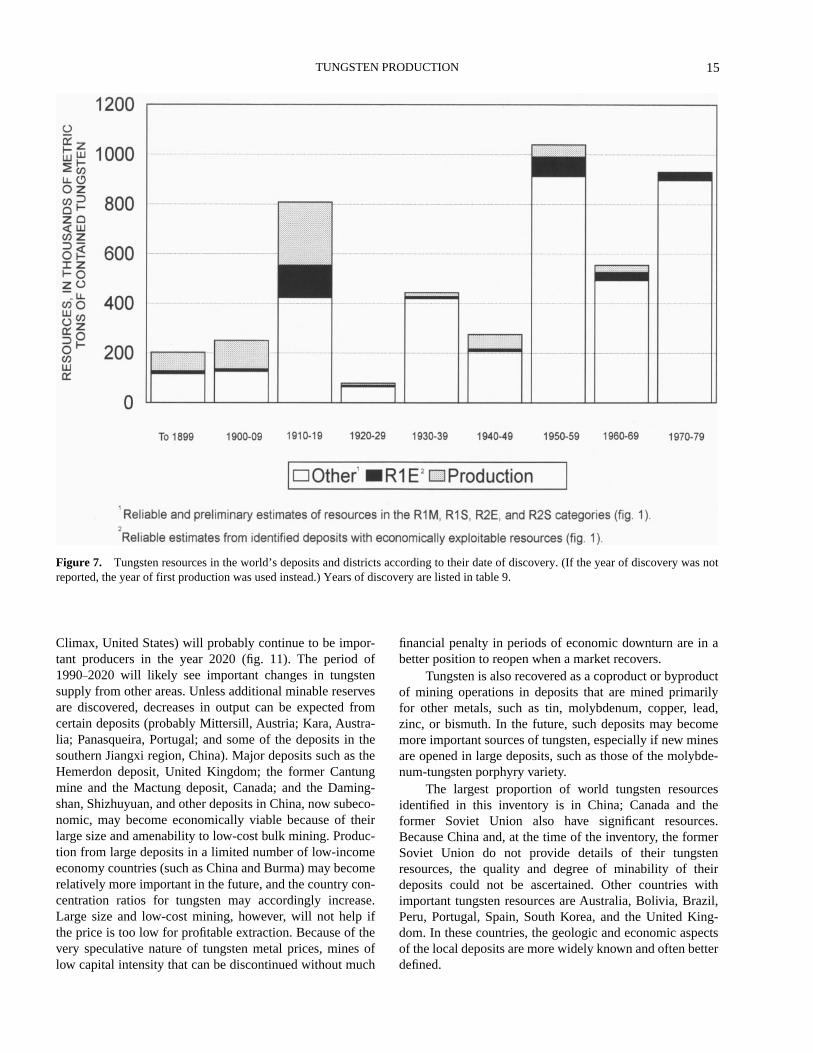
Figure 7.
Tungsten resources in the world’s deposits and districts according to their date of discovery. (If the year of discovery was notreported, the year of first production was used instead.) Years of discovery are listed in table 9.
16
INTERNATIONAL STRATEGIC MINERAL ISSUES SUMMARY REPORT—TUNGSTEN
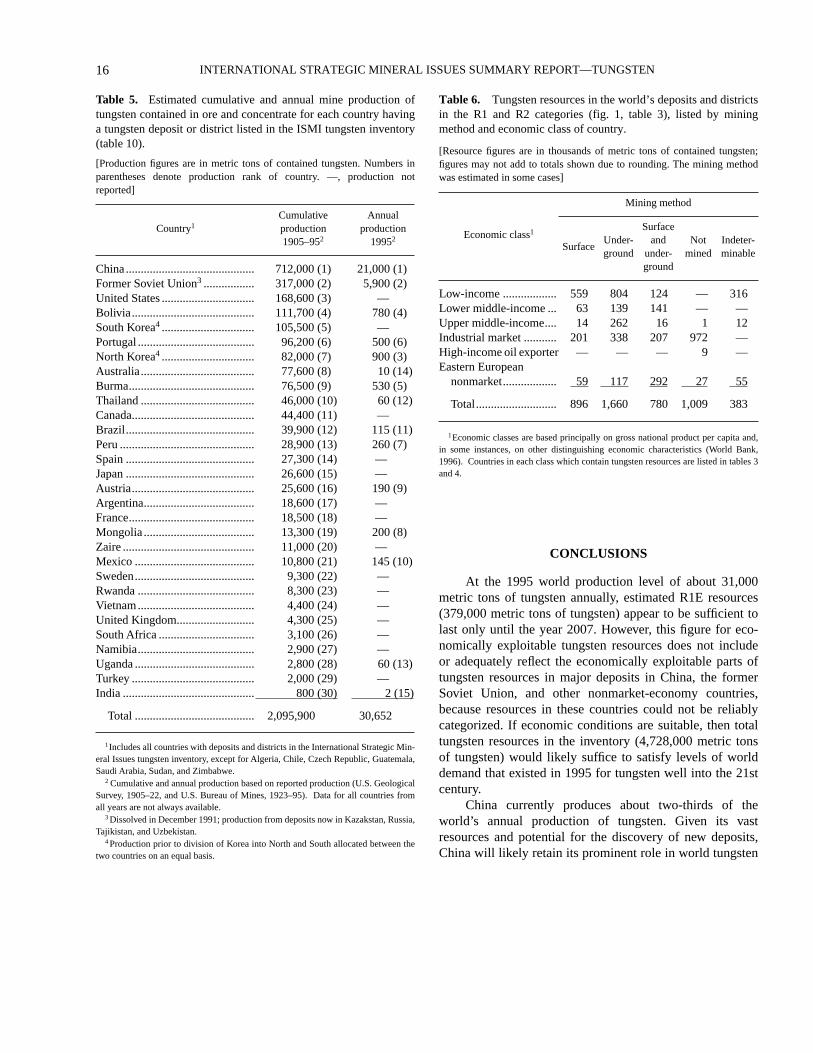
Table 5.
Estimated cumulative and annual mine production oftungsten contained in ore and concentrate for each country havinga tungsten deposit or district listed in the ISMI tungsten inventory(table 10).
[Production figures are in metric tons of contained tungsten. Numbers inparentheses denote production rank of country. —, production notreported]
1
Includes all countries with deposits and districts in the International Strategic Min-eral Issues tungsten inventory, except for Algeria, Chile, Czech Republic, Guatemala,Saudi Arabia, Sudan, and Zimbabwe.
2
Cumulative and annual production based on reported production (U.S. GeologicalSurvey, 1905–22, and U.S. Bureau of Mines, 1923–95). Data for all countries fromall years are not always available.
3
Dissolved in December 1991; production from deposits now in Kazakstan, Russia,Tajikistan, and Uzbekistan.
4
Production prior to division of Korea into North and South allocated between thetwo countries on an equal basis.
Country
1
Cumulativeproduction 1905–95
2
Annualproduction
1995
2
China ........................................... 712,000 (1) 21,000 (1)Former Soviet Union
3
................. 317,000 (2) 5,900 (2)United States ............................... 168,600 (3) —Bolivia......................................... 111,700 (4) 780 (4)South Korea
4
............................... 105,500 (5) —Portugal ....................................... 96,200 (6) 500 (6)North Korea
4
............................... 82,000 (7) 900 (3)Australia...................................... 77,600 (8) 10 (14)Burma.......................................... 76,500 (9) 530 (5)Thailand ...................................... 46,000 (10) 60 (12)Canada......................................... 44,400 (11) —Brazil........................................... 39,900 (12) 115 (11)Peru ............................................. 28,900 (13) 260 (7)Spain ........................................... 27,300 (14) —Japan ........................................... 26,600 (15) —Austria......................................... 25,600 (16) 190 (9)Argentina..................................... 18,600 (17) —France.......................................... 18,500 (18) —Mongolia ..................................... 13,300 (19) 200 (8)Zaire ............................................ 11,000 (20) —Mexico ........................................ 10,800 (21) 145 (10)Sweden........................................ 9,300 (22) —Rwanda ....................................... 8,300 (23) —Vietnam....................................... 4,400 (24) —United Kingdom.......................... 4,300 (25) —South Africa ................................ 3,100 (26) —Namibia....................................... 2,900 (27) —Uganda ........................................ 2,800 (28) 60 (13)Turkey ......................................... 2,000 (29) —India ............................................ 800 (30) 2 (15)
Total ........................................ 2,095,900 30,652
Table 6.
Tungsten resources in the world’s deposits and districtsin the R1 and R2 categories (fig. 1, table 3), listed by miningmethod and economic class of country.
[Resource figures are in thousands of metric tons of contained tungsten;figures may not add to totals shown due to rounding. The mining methodwas estimated in some cases]
1
Economic classes are based principally on gross national product per capita and,in some instances, on other distinguishing economic characteristics (World Bank,1996). Countries in each class which contain tungsten resources are listed in tables 3and 4.
Economic class
1
Mining method
SurfaceUnder-ground
Surface and
under-ground
Not mined
Indeter-minable
Low-income .................. 559 804 124 — 316Lower middle-income ... 63 139 141 — —Upper middle-income.... 14 262 16 1 12Industrial market ........... 201 338 207 972 —High-income oil exporter — — — 9 —Eastern European
nonmarket.................. 59 117 292 27 55
Total........................... 896 1,660 780 1,009 383
CONCLUSIONS
At the 1995 world production level of about 31,000metric tons of tungsten annually, estimated R1E resources(379,000 metric tons of tungsten) appear to be sufficient tolast only until the year 2007. However, this figure for eco-nomically exploitable tungsten resources does not includeor adequately reflect the economically exploitable parts oftungsten resources in major deposits in China, the formerSoviet Union, and other nonmarket-economy countries,because resources in these countries could not be reliablycategorized. If economic conditions are suitable, then totaltungsten resources in the inventory (4,728,000 metric tonsof tungsten) would likely suffice to satisfy levels of worlddemand that existed in 1995 for tungsten well into the 21stcentury.
China currently produces about two-thirds of theworld’s annual production of tungsten. Given its vastresources and potential for the discovery of new deposits,China will likely retain its prominent role in world tungsten
CONCLUSIONS
17
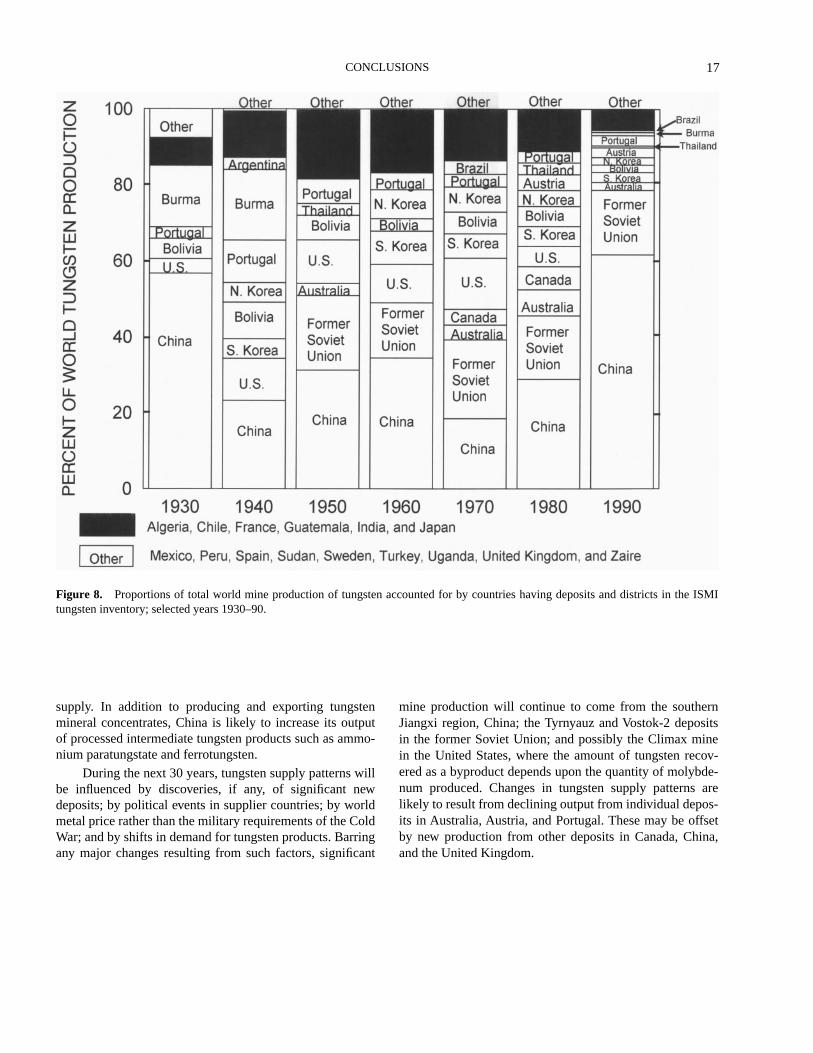
Figure 8.
Proportions of total world mine production of tungsten accounted for by countries having deposits and districts in the ISMItungsten inventory; selected years 1930–90.
supply. In addition to producing and exporting tungstenmineral concentrates, China is likely to increase its outputof processed intermediate tungsten products such as ammo-nium paratungstate and ferrotungsten.
During the next 30 years, tungsten supply patterns willbe influenced by discoveries, if any, of significant newdeposits; by political events in supplier countries; by worldmetal price rather than the military requirements of the ColdWar; and by shifts in demand for tungsten products. Barringany major changes resulting from such factors, significant
mine production will continue to come from the southernJiangxi region, China; the Tyrnyauz and Vostok-2 depositsin the former Soviet Union; and possibly the Climax minein the United States, where the amount of tungsten recov-ered as a byproduct depends upon the quantity of molybde-num produced. Changes in tungsten supply patterns arelikely to result from declining output from individual depos-its in Australia, Austria, and Portugal. These may be offsetby new production from other deposits in Canada, China,and the United Kingdom.
18
INTERNATIONAL STRATEGIC MINERAL ISSUES SUMMARY REPORT—TUNGSTEN
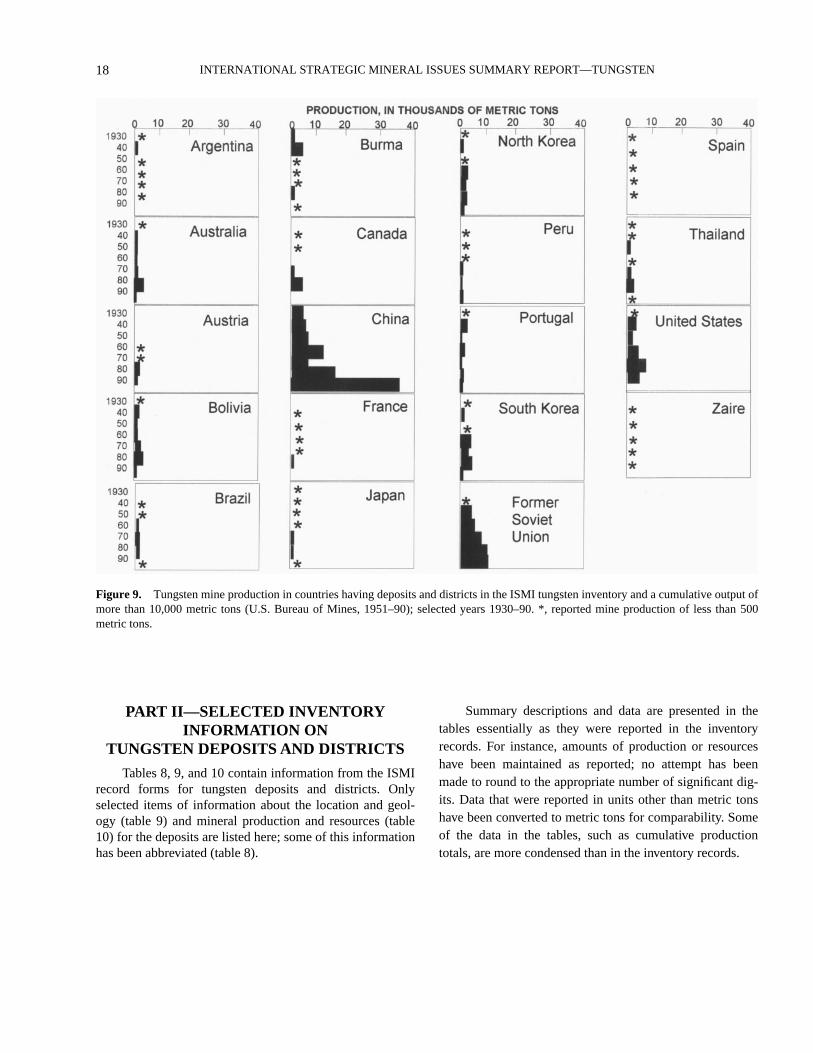
Figure 9.
Tungsten mine production in countries having deposits and districts in the ISMI tungsten inventory and a cumulative output ofmore than 10,000 metric tons (U.S. Bureau of Mines, 1951–90); selected years 1930–90. *, reported mine production of less than 500metric tons.
PART II—SELECTED INVENTORY INFORMATION ON
TUNGSTEN DEPOSITS AND DISTRICTS
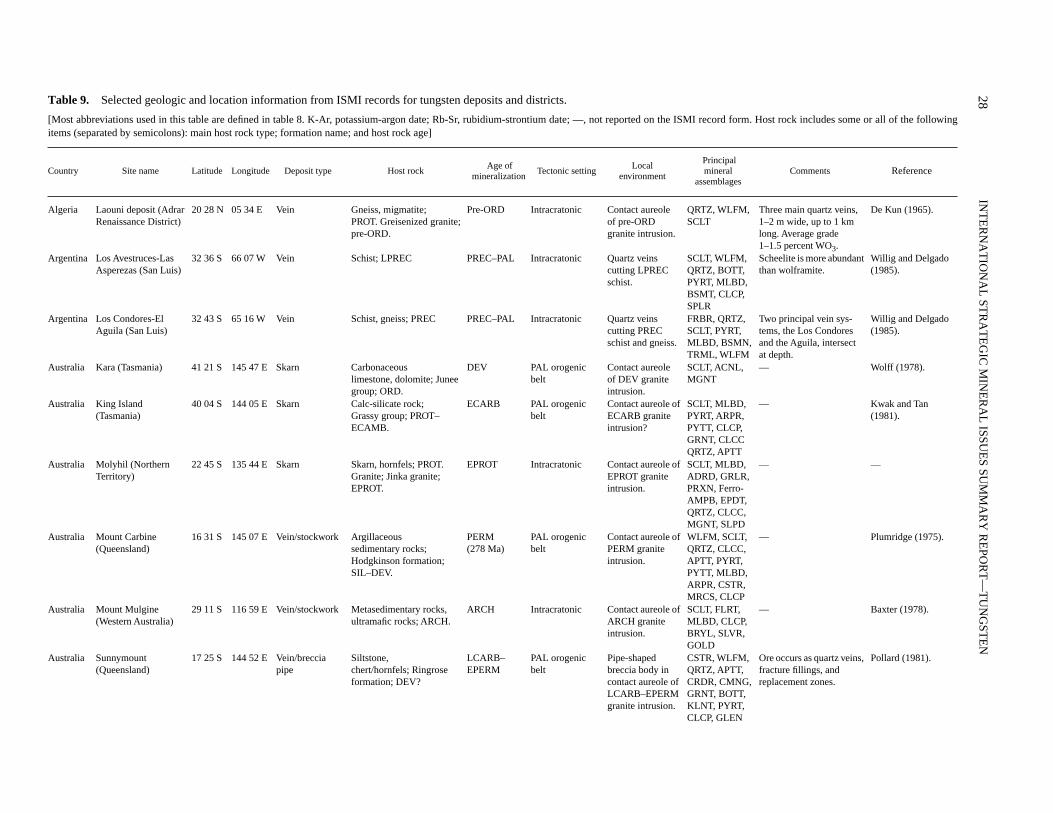
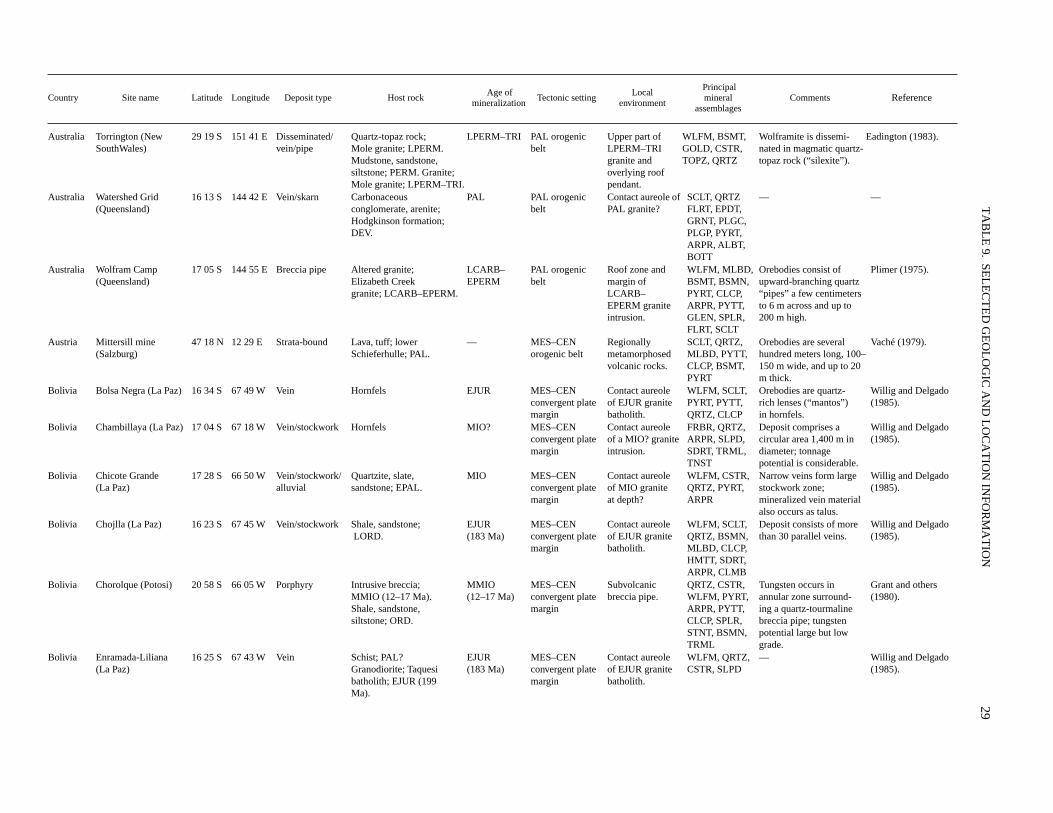
Tables 8, 9, and 10 contain information from the ISMIrecord forms for tungsten deposits and districts. Onlyselected items of information about the location and geol-ogy (table 9) and mineral production and resources (table10) for the deposits are listed here; some of this informationhas been abbreviated (table 8).
Summary descriptions and data are presented in thetables essentially as they were reported in the inventoryrecords. For instance, amounts of production or resourceshave been maintained as reported; no attempt has beenmade to round to the appropriate number of significant dig-its. Data that were reported in units other than metric tonshave been converted to metric tons for comparability. Someof the data in the tables, such as cumulative productiontotals, are more condensed than in the inventory records.
PAR
T II—
SEL
EC
TE
D IN
VE
NT
OR
Y IN
FOR
MA
TIO
N O
N T
UN
GST
EN
DE
POSIT
S AN
D D
ISTR
ICT
S
19
Figure 10.
Major world tungsten processing plants, 1919–89. Data on plants are from table 7.
20
INT
ER
NA
TIO
NA
L ST
RA
TE
GIC
MIN
ER
AL
ISSUE
S SUM
MA
RY
RE
POR
T—
TU
NG
STE
N
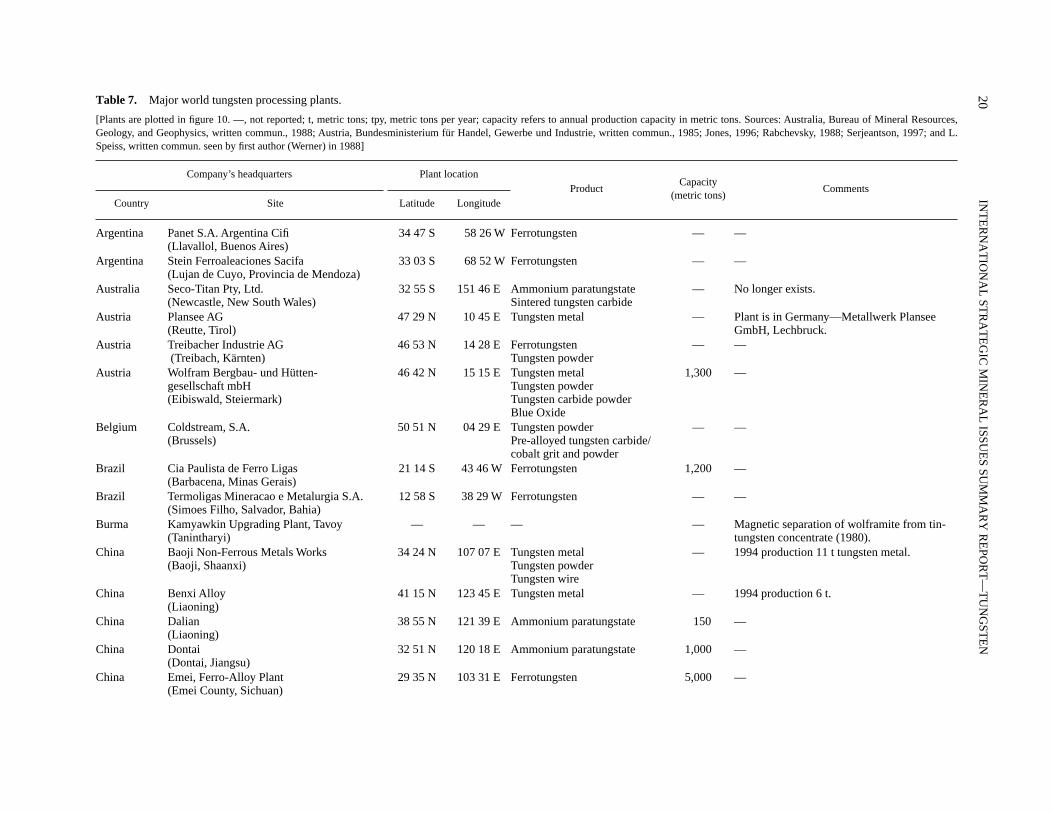
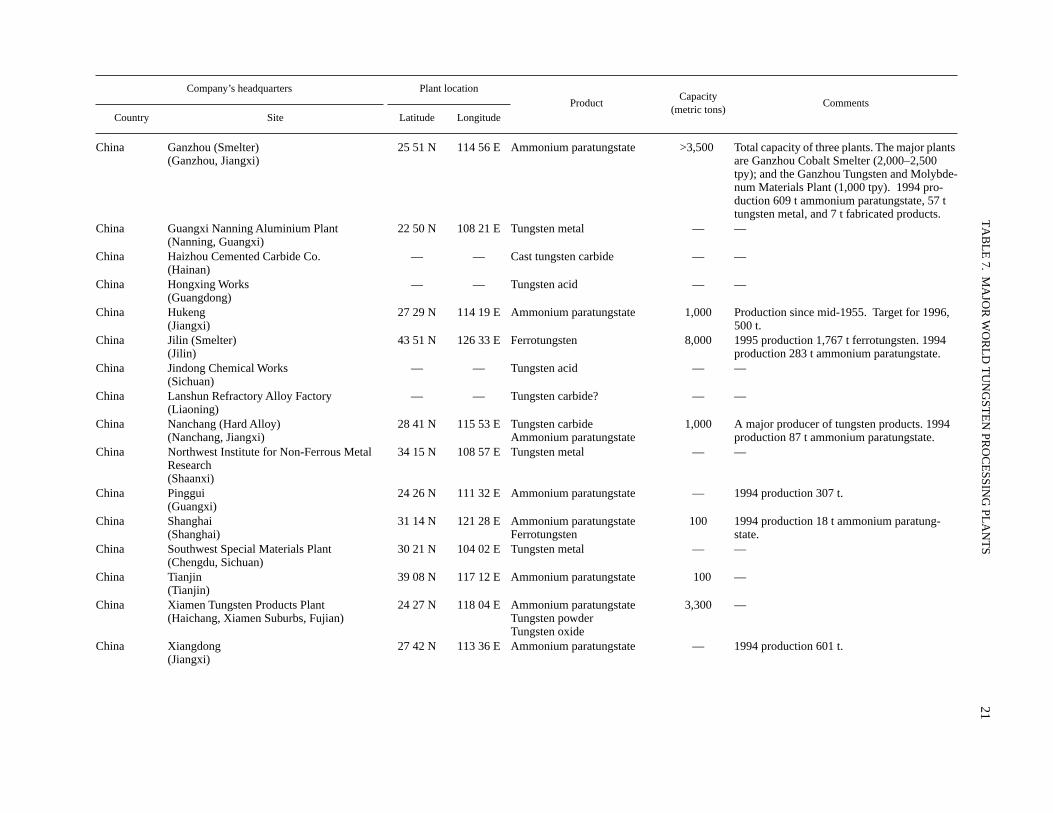
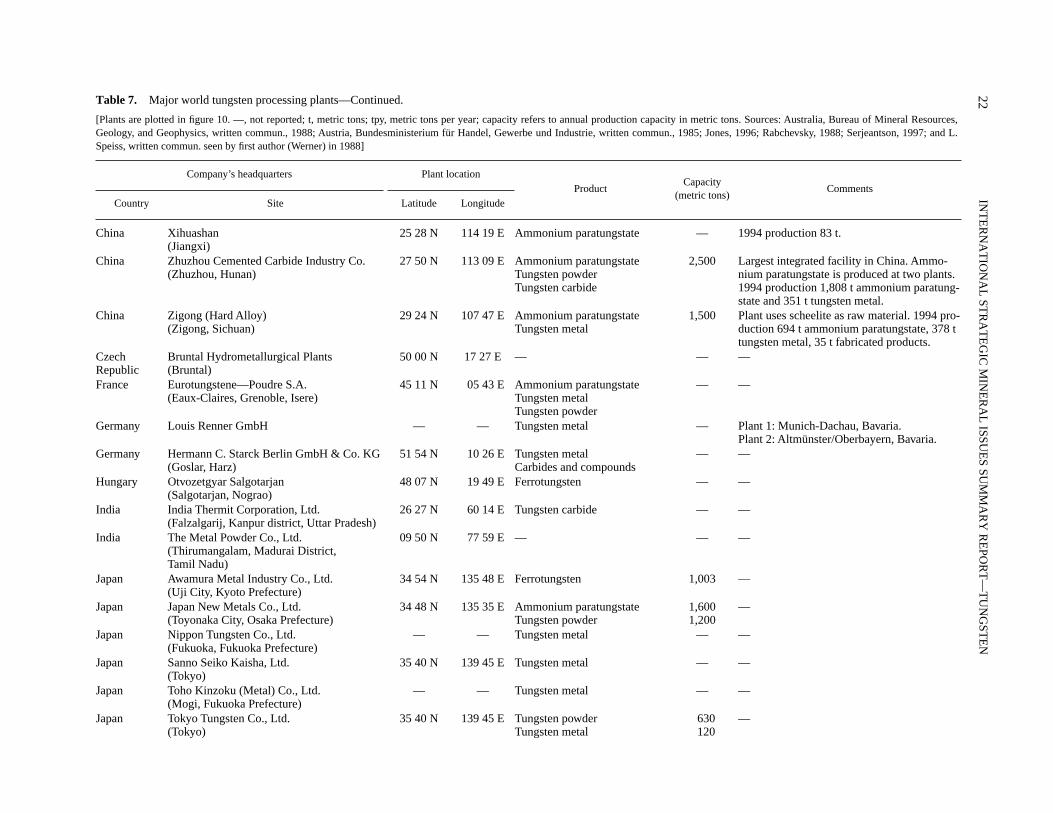
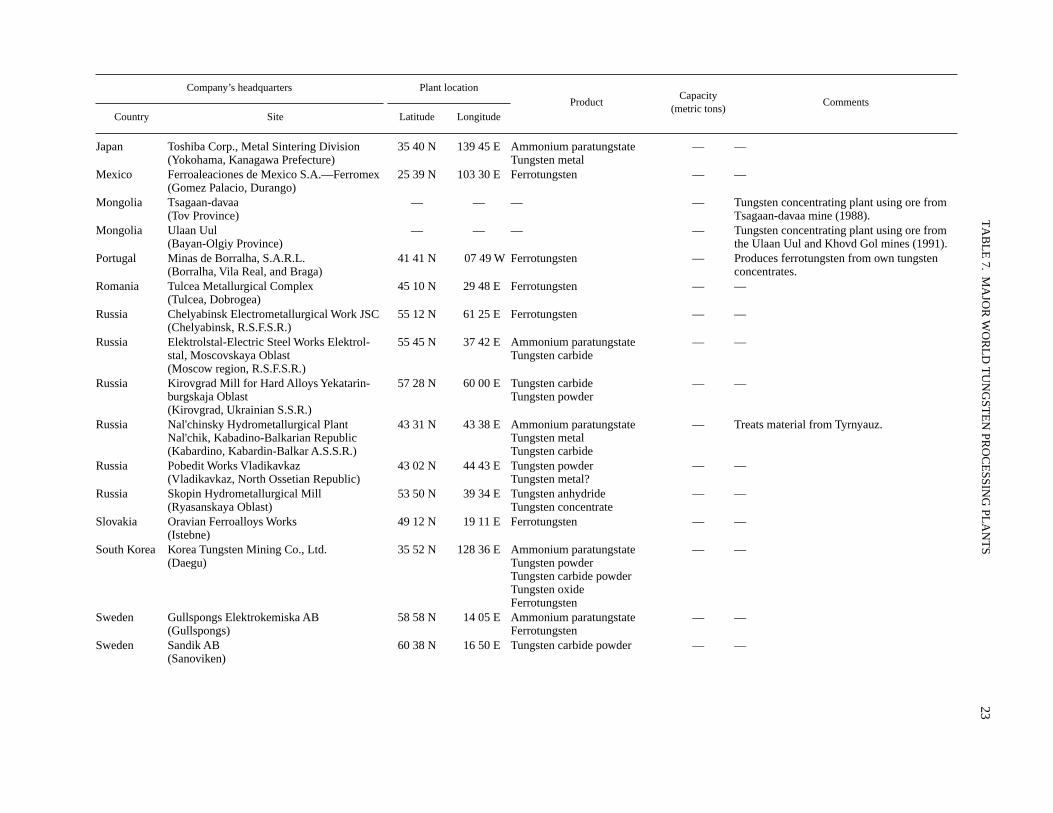
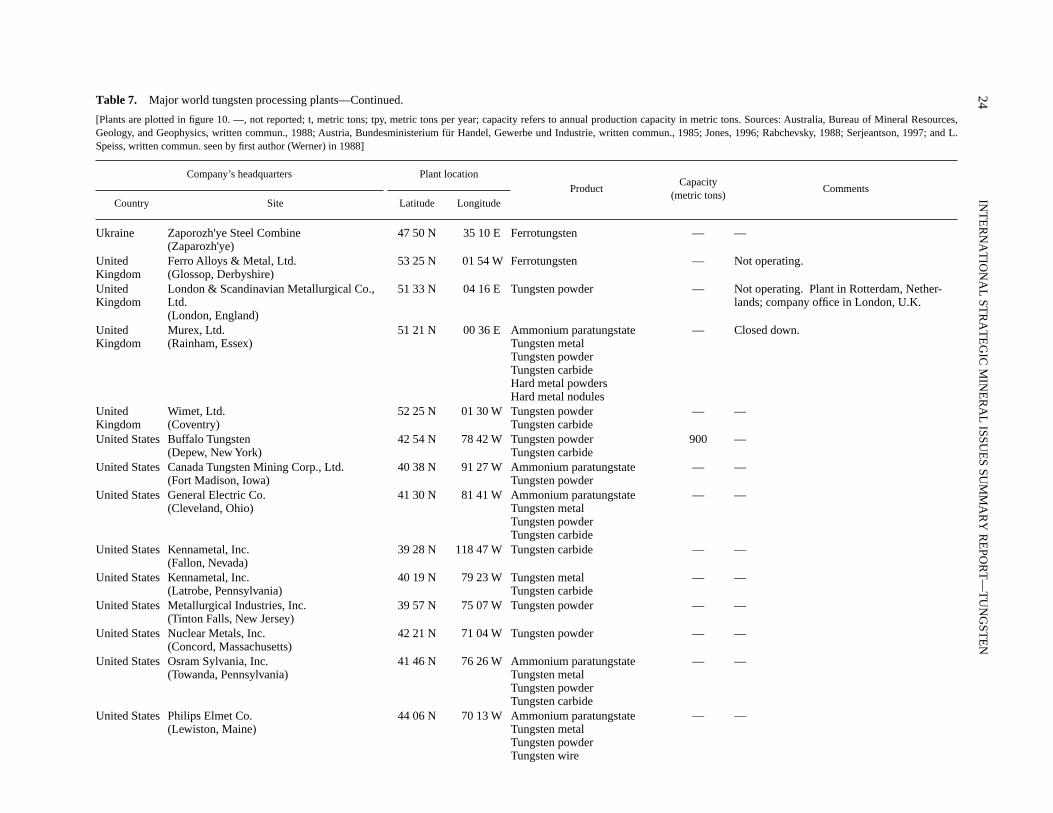
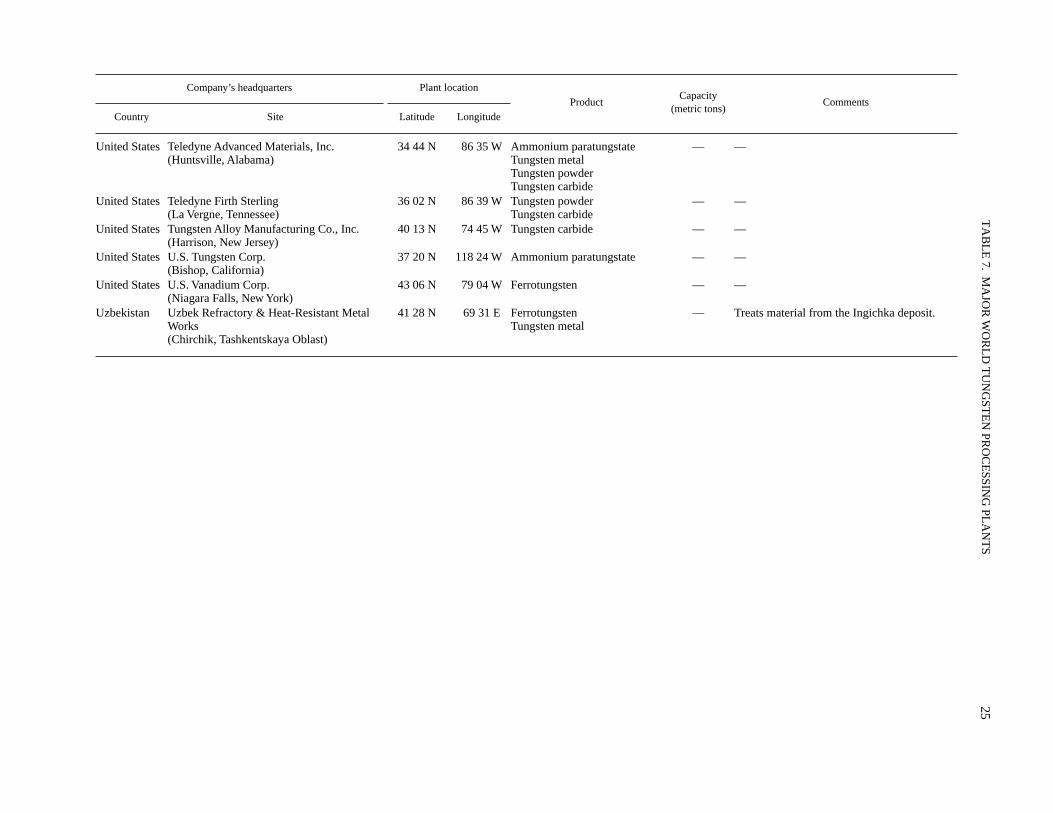
Table 7.
Major world tungsten processing plants.
[Plants are plotted in figure 10. —, not reported; t, metric tons; tpy, metric tons per year; capacity refers to annual production capacity in metric tons. Sources: Australia, Bureau of Mineral Resources,Geology, and Geophysics, written commun., 1988; Austria, Bundesministerium für Handel, Gewerbe und Industrie, written commun., 1985; Jones, 1996; Rabchevsky, 1988; Serjeantson, 1997; and L.Speiss, written commun. seen by first author (Werner) in 1988]
Company’s headquarters Plant locationProduct
Capacity (metric tons)
CommentsCountry Site Latitude Longitude
Argentina Panet S.A. Argentina Cifi (Llavallol, Buenos Aires)
34 47 S 58 26 W Ferrotungsten — —
Argentina Stein Ferroaleaciones Sacifa (Lujan de Cuyo, Provincia de Mendoza)
33 03 S 68 52 W Ferrotungsten — —
Australia Seco-Titan Pty, Ltd. (Newcastle, New South Wales)
32 55 S 151 46 E Ammonium paratungstate Sintered tungsten carbide
— No longer exists.
Austria Plansee AG (Reutte, Tirol)
47 29 N 10 45 E Tungsten metal — Plant is in Germany—Metallwerk Plansee GmbH, Lechbruck.
Austria Treibacher Industrie AG (Treibach, Kärnten)
46 53 N 14 28 E Ferrotungsten Tungsten powder
— —
Austria Wolfram Bergbau- und Hütten- gesellschaft mbH (Eibiswald, Steiermark)
46 42 N 15 15 E Tungsten metal Tungsten powder Tungsten carbide powder Blue Oxide
1,300 —
Belgium Coldstream, S.A. (Brussels)
50 51 N 04 29 E Tungsten powder Pre-alloyed tungsten carbide/cobalt grit and powder
— —
Brazil Cia Paulista de Ferro Ligas (Barbacena, Minas Gerais)
21 14 S 43 46 W Ferrotungsten 1,200 —
Brazil Termoligas Mineracao e Metalurgia S.A. (Simoes Filho, Salvador, Bahia)
12 58 S 38 29 W Ferrotungsten — —
Burma Kamyawkin Upgrading Plant, Tavoy (Tanintharyi)
— — — — Magnetic separation of wolframite from tin-tungsten concentrate (1980).
China Baoji Non-Ferrous Metals Works(Baoji, Shaanxi)
34 24 N 107 07 E Tungsten metal Tungsten powder Tungsten wire
— 1994 production 11 t tungsten metal.
China Benxi Alloy (Liaoning)
41 15 N 123 45 E Tungsten metal — 1994 production 6 t.
China Dalian (Liaoning)
38 55 N 121 39 E Ammonium paratungstate 150 —
China Dontai (Dontai, Jiangsu)
32 51 N 120 18 E Ammonium paratungstate 1,000 —
China Emei, Ferro-Alloy Plant(Emei County, Sichuan)
29 35 N 103 31 E Ferrotungsten 5,000 —
TA
BL
E 7.
MA
JOR
WO
RL
D T
UN
GST
EN
PRO
CE
SSING
PLA
NT
S
21
Company’s headquarters Plant locationProduct
Capacity (metric tons)
CommentsCountry Site Latitude Longitude
China Ganzhou (Smelter) (Ganzhou, Jiangxi)
25 51 N 114 56 E Ammonium paratungstate >3,500 Total capacity of three plants. The major plants are Ganzhou Cobalt Smelter (2,000–2,500 tpy); and the Ganzhou Tungsten and Molybde-num Materials Plant (1,000 tpy). 1994 pro-duction 609 t ammonium paratungstate, 57 t tungsten metal, and 7 t fabricated products.
China Guangxi Nanning Aluminium Plant(Nanning, Guangxi)
22 50 N 108 21 E Tungsten metal — —
China Haizhou Cemented Carbide Co.(Hainan)
— — Cast tungsten carbide — —
China Hongxing Works (Guangdong)
— — Tungsten acid — —
China Hukeng (Jiangxi)
27 29 N 114 19 E Ammonium paratungstate 1,000 Production since mid-1955. Target for 1996, 500 t.
China Jilin (Smelter)(Jilin)
43 51 N 126 33 E Ferrotungsten 8,000 1995 production 1,767 t ferrotungsten. 1994 production 283 t ammonium paratungstate.
China Jindong Chemical Works (Sichuan)
— — Tungsten acid — —
China Lanshun Refractory Alloy Factory (Liaoning)
— — Tungsten carbide? — —
China Nanchang (Hard Alloy) (Nanchang, Jiangxi)
28 41 N 115 53 E Tungsten carbide Ammonium paratungstate
1,000 A major producer of tungsten products. 1994 production 87 t ammonium paratungstate.
China Northwest Institute for Non-Ferrous Metal Research (Shaanxi)
34 15 N 108 57 E Tungsten metal — —
China Pinggui (Guangxi)
24 26 N 111 32 E Ammonium paratungstate — 1994 production 307 t.
China Shanghai (Shanghai)
31 14 N 121 28 E Ammonium paratungstate Ferrotungsten
100 1994 production 18 t ammonium paratung-state.
China Southwest Special Materials Plant (Chengdu, Sichuan)
30 21 N 104 02 E Tungsten metal — —
China Tianjin (Tianjin)
39 08 N 117 12 E Ammonium paratungstate 100 —
China Xiamen Tungsten Products Plant (Haichang, Xiamen Suburbs, Fujian)
24 27 N 118 04 E Ammonium paratungstateTungsten powder Tungsten oxide
3,300 —
China Xiangdong (Jiangxi)
27 42 N 113 36 E Ammonium paratungstate — 1994 production 601 t.
22
INT
ER
NA
TIO
NA
L ST
RA
TE
GIC
MIN
ER
AL
ISSUE
S SUM
MA
RY
RE
POR
T—
TU
NG
STE
N
Table 7.
Major world tungsten processing plants—Continued.
[Plants are plotted in figure 10. —, not reported; t, metric tons; tpy, metric tons per year; capacity refers to annual production capacity in metric tons. Sources: Australia, Bureau of Mineral Resources,Geology, and Geophysics, written commun., 1988; Austria, Bundesministerium für Handel, Gewerbe und Industrie, written commun., 1985; Jones, 1996; Rabchevsky, 1988; Serjeantson, 1997; and L.Speiss, written commun. seen by first author (Werner) in 1988]
Company’s headquarters Plant locationProduct
Capacity (metric tons)
CommentsCountry Site Latitude Longitude
China Xihuashan (Jiangxi)
25 28 N 114 19 E Ammonium paratungstate — 1994 production 83 t.
China Zhuzhou Cemented Carbide Industry Co. (Zhuzhou, Hunan)
27 50 N 113 09 E Ammonium paratungstateTungsten powder Tungsten carbide
2,500 Largest integrated facility in China. Ammo-nium paratungstate is produced at two plants. 1994 production 1,808 t ammonium paratung-state and 351 t tungsten metal.
China Zigong (Hard Alloy) (Zigong, Sichuan)
29 24 N 107 47 E Ammonium paratungstateTungsten metal
1,500 Plant uses scheelite as raw material. 1994 pro-duction 694 t ammonium paratungstate, 378 t tungsten metal, 35 t fabricated products.
Czech Republic
Bruntal Hydrometallurgical Plants(Bruntal)
50 00 N 17 27 E — — —
France Eurotungstene—Poudre S.A. (Eaux-Claires, Grenoble, Isere)
45 11 N 05 43 E Ammonium paratungstate Tungsten metal Tungsten powder
— —
Germany Louis Renner GmbH — — Tungsten metal — Plant 1: Munich-Dachau, Bavaria. Plant 2: Altmünster/Oberbayern, Bavaria.
Germany Hermann C. Starck Berlin GmbH & Co. KG (Goslar, Harz)
51 54 N 10 26 E Tungsten metal Carbides and compounds
— —
Hungary Otvozetgyar Salgotarjan (Salgotarjan, Nograo)
48 07 N 19 49 E Ferrotungsten — —
India India Thermit Corporation, Ltd. (Falzalgarij, Kanpur district, Uttar Pradesh)
26 27 N 60 14 E Tungsten carbide — —
India The Metal Powder Co., Ltd. (Thirumangalam, Madurai District, Tamil Nadu)
09 50 N 77 59 E — — —
Japan Awamura Metal Industry Co., Ltd. (Uji City, Kyoto Prefecture)
34 54 N 135 48 E Ferrotungsten 1,003 —
Japan Japan New Metals Co., Ltd. (Toyonaka City, Osaka Prefecture)
34 48 N 135 35 E Ammonium paratungstateTungsten powder
1,6001,200
—
Japan Nippon Tungsten Co., Ltd. (Fukuoka, Fukuoka Prefecture)
— — Tungsten metal — —
Japan Sanno Seiko Kaisha, Ltd. (Tokyo)
35 40 N 139 45 E Tungsten metal — —
Japan Toho Kinzoku (Metal) Co., Ltd. (Mogi, Fukuoka Prefecture)
— — Tungsten metal — —
Japan Tokyo Tungsten Co., Ltd.(Tokyo)
35 40 N 139 45 E Tungsten powder Tungsten metal
630120
—
TA
BL
E 7.
MA
JOR
WO
RL
D T
UN
GST
EN
PRO
CE
SSING
PLA
NT
S
23
Company’s headquarters Plant locationProduct
Capacity (metric tons)
CommentsCountry Site Latitude Longitude
Japan Toshiba Corp., Metal Sintering Division(Yokohama, Kanagawa Prefecture)
35 40 N 139 45 E Ammonium paratungstate Tungsten metal
— —
Mexico Ferroaleaciones de Mexico S.A.—Ferromex (Gomez Palacio, Durango)
25 39 N 103 30 E Ferrotungsten — —
Mongolia Tsagaan-davaa(Tov Province)
— — — — Tungsten concentrating plant using ore from Tsagaan-davaa mine (1988).
Mongolia Ulaan Uul (Bayan-Olgiy Province)
— — — — Tungsten concentrating plant using ore from the Ulaan Uul and Khovd Gol mines (1991).
Portugal Minas de Borralha, S.A.R.L. (Borralha, Vila Real, and Braga)
41 41 N 07 49 W Ferrotungsten — Produces ferrotungsten from own tungsten concentrates.
Romania Tulcea Metallurgical Complex(Tulcea, Dobrogea)
45 10 N 29 48 E Ferrotungsten — —
Russia Chelyabinsk Electrometallurgical Work JSC (Chelyabinsk, R.S.F.S.R.)
55 12 N 61 25 E Ferrotungsten — —
Russia Elektrolstal-Electric Steel Works Elektrol-stal, Moscovskaya Oblast (Moscow region, R.S.F.S.R.)
55 45 N 37 42 E Ammonium paratungstate Tungsten carbide
— —
Russia Kirovgrad Mill for Hard Alloys Yekatarin-burgskaja Oblast (Kirovgrad, Ukrainian S.S.R.)
57 28 N 60 00 E Tungsten carbide Tungsten powder
— —
Russia Nal'chinsky Hydrometallurgical Plant Nal'chik, Kabadino-Balkarian Republic (Kabardino, Kabardin-Balkar A.S.S.R.)
43 31 N 43 38 E Ammonium paratungstate Tungsten metal Tungsten carbide
— Treats material from Tyrnyauz.
Russia Pobedit Works Vladikavkaz (Vladikavkaz, North Ossetian Republic)
43 02 N 44 43 E Tungsten powder Tungsten metal?
— —
Russia Skopin Hydrometallurgical Mill (Ryasanskaya Oblast)
53 50 N 39 34 E Tungsten anhydride Tungsten concentrate
— —
Slovakia Oravian Ferroalloys Works (Istebne)
49 12 N 19 11 E Ferrotungsten — —
South Korea Korea Tungsten Mining Co., Ltd. (Daegu)
35 52 N 128 36 E Ammonium paratungstate Tungsten powder Tungsten carbide powder Tungsten oxide Ferrotungsten
— —
Sweden Gullspongs Elektrokemiska AB (Gullspongs)
58 58 N 14 05 E Ammonium paratungstate Ferrotungsten
— —
Sweden Sandik AB (Sanoviken)
60 38 N 16 50 E Tungsten carbide powder — —
24IN
TE
RN
AT
ION
AL
STR
AT
EG
IC M
INE
RA
L ISSU
ES SU
MM
AR
Y R
EPO
RT
—T
UN
GST
EN
Table 7. Major world tungsten processing plants—Continued.
[Plants are plotted in figure 10. —, not reported; t, metric tons; tpy, metric tons per year; capacity refers to annual production capacity in metric tons. Sources: Australia, Bureau of Mineral Resources,Geology, and Geophysics, written commun., 1988; Austria, Bundesministerium für Handel, Gewerbe und Industrie, written commun., 1985; Jones, 1996; Rabchevsky, 1988; Serjeantson, 1997; and L.Speiss, written commun. seen by first author (Werner) in 1988]
Company’s headquarters Plant locationProduct
Capacity (metric tons)
CommentsCountry Site Latitude Longitude
Ukraine Zaporozh'ye Steel Combine (Zaparozh'ye)
47 50 N 35 10 E Ferrotungsten — —
United Kingdom
Ferro Alloys & Metal, Ltd. (Glossop, Derbyshire)
53 25 N 01 54 W Ferrotungsten — Not operating.
United Kingdom
London & Scandinavian Metallurgical Co., Ltd. (London, England)
51 33 N 04 16 E Tungsten powder — Not operating. Plant in Rotterdam, Nether-lands; company office in London, U.K.
United Kingdom
Murex, Ltd. (Rainham, Essex)
51 21 N 00 36 E Ammonium paratungstate Tungsten metalTungsten powder Tungsten carbide Hard metal powders Hard metal nodules
— Closed down.
United Kingdom
Wimet, Ltd. (Coventry)
52 25 N 01 30 W Tungsten powder Tungsten carbide
— —
United States Buffalo Tungsten (Depew, New York)
42 54 N 78 42 W Tungsten powder Tungsten carbide
900 —
United States Canada Tungsten Mining Corp., Ltd. (Fort Madison, Iowa)
40 38 N 91 27 W Ammonium paratungstate Tungsten powder
— —
United States General Electric Co. (Cleveland, Ohio)
41 30 N 81 41 W Ammonium paratungstate Tungsten metal Tungsten powder Tungsten carbide
— —
United States Kennametal, Inc. (Fallon, Nevada)
39 28 N 118 47 W Tungsten carbide — —
United States Kennametal, Inc. (Latrobe, Pennsylvania)
40 19 N 79 23 W Tungsten metal Tungsten carbide
— —
United States Metallurgical Industries, Inc. (Tinton Falls, New Jersey)
39 57 N 75 07 W Tungsten powder — —
United States Nuclear Metals, Inc. (Concord, Massachusetts)
42 21 N 71 04 W Tungsten powder — —
United States Osram Sylvania, Inc.(Towanda, Pennsylvania)
41 46 N 76 26 W Ammonium paratungstate Tungsten metal Tungsten powder Tungsten carbide
— —
United States Philips Elmet Co. (Lewiston, Maine)
44 06 N 70 13 W Ammonium paratungstate Tungsten metal Tungsten powder Tungsten wire
— —
TA
BL
E 7.
MA
JOR
WO
RL
D T
UN
GST
EN
PRO
CE
SSING
PLA
NT
S25
Company’s headquarters Plant locationProduct
Capacity (metric tons)
CommentsCountry Site Latitude Longitude
United States Teledyne Advanced Materials, Inc. (Huntsville, Alabama)
34 44 N 86 35 W Ammonium paratungstate Tungsten metal Tungsten powder Tungsten carbide
— —
United States Teledyne Firth Sterling (La Vergne, Tennessee)
36 02 N 86 39 W Tungsten powder Tungsten carbide
— —
United States Tungsten Alloy Manufacturing Co., Inc. (Harrison, New Jersey)
40 13 N 74 45 W Tungsten carbide — —
United States U.S. Tungsten Corp. (Bishop, California)
37 20 N 118 24 W Ammonium paratungstate — —
United States U.S. Vanadium Corp. (Niagara Falls, New York)
43 06 N 79 04 W Ferrotungsten — —
Uzbekistan Uzbek Refractory & Heat-Resistant Metal Works (Chirchik, Tashkentskaya Oblast)
41 28 N 69 31 E Ferrotungsten Tungsten metal
— Treats material from the Ingichka deposit.
26IN
TE
RN
AT
ION
AL
STR
AT
EG
IC M
INE
RA
L ISSU
ES SU
MM
AR
Y R
EPO
RT
—T
UN
GST
EN
Figure 11. Major tungsten deposits and districts worldwide, their production status at the beginning of 1986, and their probable production status in 2020. Numbers in parenthesesindicate the number of records of deposits and districts for each status category.
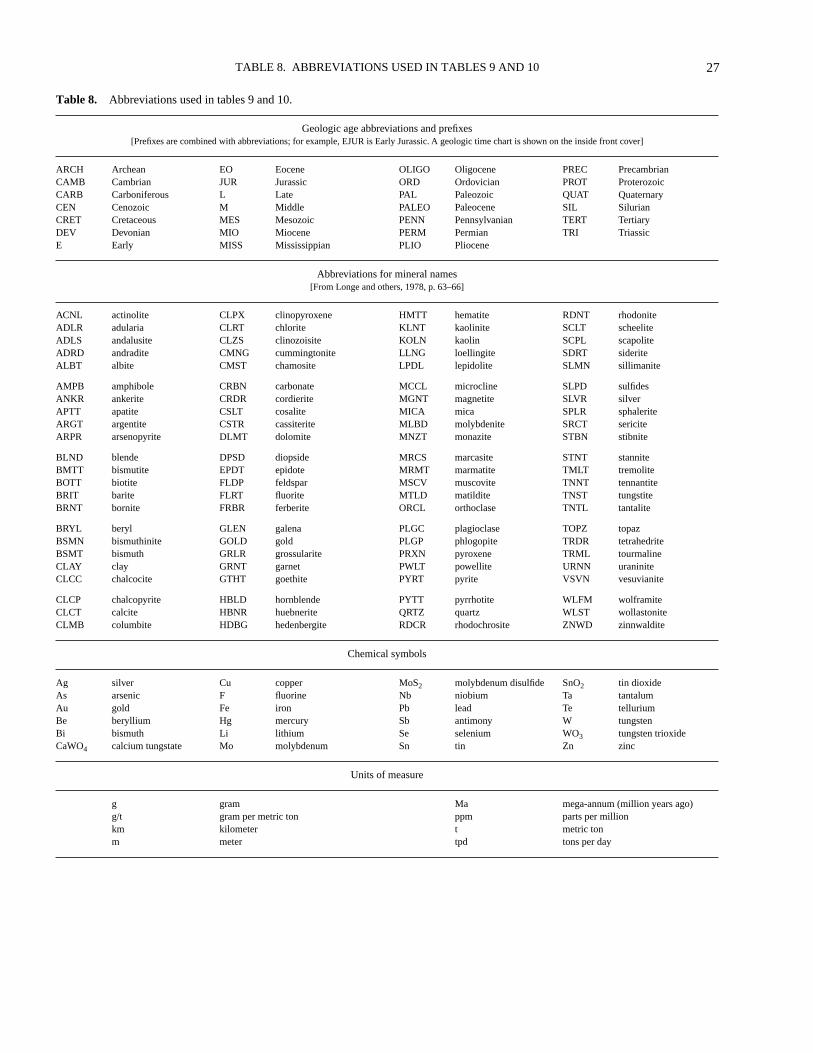
TABLE 8. ABBREVIATIONS USED IN TABLES 9 AND 10
27
Table 8.
Abbreviations used in tables 9 and 10.
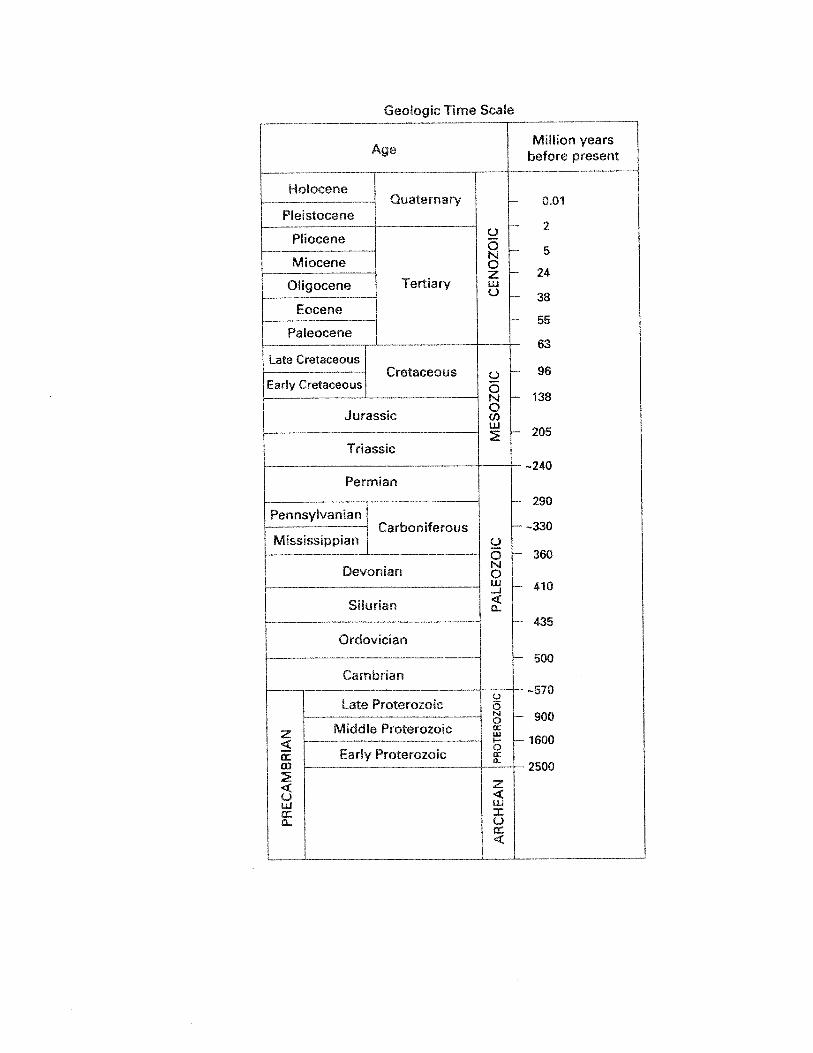
Geologic age abbreviations and prefixes
[Prefixes are combined with abbreviations; for example, EJUR is Early Jurassic. A geologic time chart is shown on the inside front cover]
ARCH Archean EO Eocene OLIGO Oligocene PREC PrecambrianCAMB Cambrian JUR Jurassic ORD Ordovician PROT ProterozoicCARB Carboniferous L Late PAL Paleozoic QUAT QuaternaryCEN Cenozoic M Middle PALEO Paleocene SIL SilurianCRET Cretaceous MES Mesozoic PENN Pennsylvanian TERT TertiaryDEV Devonian MIO Miocene PERM Permian TRI TriassicE Early MISS Mississippian PLIO Pliocene
Abbreviations for mineral names
[From Longe and others, 1978, p. 63–66]
ACNL actinolite CLPX clinopyroxene HMTT hematite RDNT rhodoniteADLR adularia CLRT chlorite KLNT kaolinite SCLT scheeliteADLS andalusite CLZS clinozoisite KOLN kaolin SCPL scapoliteADRD andradite CMNG cummingtonite LLNG loellingite SDRT sideriteALBT albite CMST chamosite LPDL lepidolite SLMN sillimanite
AMPB amphibole CRBN carbonate MCCL microcline SLPD sulfidesANKR ankerite CRDR cordierite MGNT magnetite SLVR silverAPTT apatite CSLT cosalite MICA mica SPLR sphaleriteARGT argentite CSTR cassiterite MLBD molybdenite SRCT sericiteARPR arsenopyrite DLMT dolomite MNZT monazite STBN stibnite
BLND blende DPSD diopside MRCS marcasite STNT stanniteBMTT bismutite EPDT epidote MRMT marmatite TMLT tremoliteBOTT biotite FLDP feldspar MSCV muscovite TNNT tennantiteBRIT barite FLRT fluorite MTLD matildite TNST tungstiteBRNT bornite FRBR ferberite ORCL orthoclase TNTL tantalite
BRYL beryl GLEN galena PLGC plagioclase TOPZ topazBSMN bismuthinite GOLD gold PLGP phlogopite TRDR tetrahedriteBSMT bismuth GRLR grossularite PRXN pyroxene TRML tourmalineCLAY clay GRNT garnet PWLT powellite URNN uraniniteCLCC chalcocite GTHT goethite PYRT pyrite VSVN vesuvianite
CLCP chalcopyrite HBLD hornblende PYTT pyrrhotite WLFM wolframiteCLCT calcite HBNR huebnerite QRTZ quartz WLST wollastoniteCLMB columbite HDBG hedenbergite RDCR rhodochrosite ZNWD zinnwaldite
Chemical symbols
Ag silver Cu copper MoS
2
molybdenum disulfide SnO
2
tin dioxideAs arsenic F fluorine Nb niobium Ta tantalumAu gold Fe iron Pb lead Te telluriumBe beryllium Hg mercury Sb antimony W tungstenBi bismuth Li lithium Se selenium WO
3
tungsten trioxideCaWO
4
calcium tungstate Mo molybdenum Sn tin Zn zinc
Units of measure
g gram Ma mega-annum (million years ago)g/t gram per metric ton ppm parts per millionkm kilometer t metric tonm meter tpd tons per day
28
INT
ER
NA
TIO
NA
L ST
RA
TE
GIC
MIN
ER
AL
ISSUE
S SUM
MA
RY
RE
POR
T—
TU
NG
STE
N
Table 9.
Selected geologic and location information from ISMI records for tungsten deposits and districts.
[Most abbreviations used in this table are defined in table 8. K-Ar, potassium-argon date; Rb-Sr, rubidium-strontium date; —, not reported on the ISMI record form. Host rock includes some or all of the followingitems (separated by semicolons): main host rock type; formation name; and host rock age]
Country Site name Latitude Longitude Deposit type Host rock Age of
mineralizationTectonic setting
Localenvironment
Principalmineral
assemblagesComments
Reference
Algeria Laouni deposit (AdrarRenaissance District)
20 28 N 05 34 E Vein Gneiss, migmatite;PROT. Greisenized granite; pre-ORD.
Pre-ORD Intracratonic Contact aureole of pre-ORD granite intrusion.
QRTZ, WLFM, SCLT
Three main quartz veins, 1–2 m wide, up to 1 km long. Average grade 1–1.5 percent WO
3
.
De Kun (1965).
Argentina Los Avestruces-LasAsperezas (San Luis)
32 36 S 66 07 W Vein Schist; LPREC PREC–PAL Intracratonic Quartz veinscutting LPREC schist.
SCLT, WLFM, QRTZ, BOTT, PYRT, MLBD, BSMT, CLCP, SPLR
Scheelite is more abundant than wolframite.
Willig and Delgado (1985).
Argentina Los Condores-El Aguila (San Luis)
32 43 S 65 16 W Vein Schist, gneiss; PREC PREC–PAL Intracratonic Quartz veins cutting PREC schist and gneiss.
FRBR, QRTZ, SCLT, PYRT, MLBD, BSMN, TRML, WLFM
Two principal vein sys-tems, the Los Condores and the Aguila, intersect at depth.
Willig and Delgado (1985).
Australia Kara (Tasmania) 41 21 S 145 47 E Skarn Carbonaceous limestone, dolomite; Junee group; ORD.
DEV PAL orogenic belt
Contact aureoleof DEV granite intrusion.
SCLT, ACNL, MGNT
— Wolff (1978).
Australia King Island(Tasmania)
40 04 S 144 05 E Skarn Calc-silicate rock; Grassy group; PROT–ECAMB.
ECARB PAL orogenic belt
Contact aureole of ECARB granite intrusion?
SCLT, MLBD, PYRT, ARPR, PYTT, CLCP, GRNT, CLCC QRTZ, APTT
— Kwak and Tan (1981).
Australia Molyhil (Northern Territory)
22 45 S 135 44 E Skarn Skarn, hornfels; PROT. Granite; Jinka granite; EPROT.
EPROT Intracratonic Contact aureole of EPROT granite intrusion.
SCLT, MLBD, ADRD, GRLR, PRXN, Ferro-AMPB, EPDT, QRTZ, CLCC,MGNT, SLPD
— —
Australia Mount Carbine(Queensland)
16 31 S 145 07 E Vein/stockwork Argillaceous sedimentary rocks; Hodgkinson formation; SIL–DEV.
PERM (278 Ma)
PAL orogenic belt
Contact aureole of PERM granite intrusion.
WLFM, SCLT, QRTZ, CLCC, APTT, PYRT, PYTT, MLBD,ARPR, CSTR, MRCS, CLCP
— Plumridge (1975).
Australia Mount Mulgine (Western Australia)
29 11 S 116 59 E Vein/stockwork Metasedimentary rocks, ultramafic rocks; ARCH.
ARCH Intracratonic Contact aureole of ARCH granite intrusion.
SCLT, FLRT, MLBD, CLCP, BRYL, SLVR, GOLD
— Baxter (1978).
Australia Sunnymount (Queensland)
17 25 S 144 52 E Vein/breccia pipe
Siltstone, chert/hornfels; Ringrose formation; DEV?
LCARB–EPERM
PAL orogenic belt
Pipe-shaped breccia body in contact aureole of LCARB–EPERM granite intrusion.
CSTR, WLFM, QRTZ, APTT, CRDR, CMNG, GRNT, BOTT, KLNT, PYRT, CLCP, GLEN
Ore occurs as quartz veins, fracture fillings, and replacement zones.
Pollard (1981).
TA
BL
E 9.
SEL
EC
TE
D G
EO
LO
GIC
AN
D L
OC
AT
ION
INFO
RM
AT
ION
29
Country Site name Latitude Longitude Deposit type Host rock Age of
mineralizationTectonic setting
Localenvironment
Principalmineral
assemblagesComments
Reference
Australia Torrington (New SouthWales)
29 19 S 151 41 E Disseminated/vein/pipe
Quartz-topaz rock; Mole granite; LPERM. Mudstone, sandstone, siltstone; PERM. Granite; Mole granite; LPERM–TRI.
LPERM–TRI PAL orogenic belt
Upper part of LPERM–TRI granite and overlying roof pendant.
WLFM, BSMT, GOLD, CSTR, TOPZ, QRTZ
Wolframite is dissemi-nated in magmatic quartz-topaz rock (“silexite”).
Eadington (1983).
Australia Watershed Grid(Queensland)
16 13 S 144 42 E Vein/skarn Carbonaceousconglomerate, arenite; Hodgkinson formation; DEV.
PAL PAL orogenic belt
Contact aureole of PAL granite?
SCLT, QRTZFLRT, EPDT, GRNT, PLGC, PLGP, PYRT,ARPR, ALBT,BOTT
— —
Australia Wolfram Camp(Queensland)
17 05 S 144 55 E Breccia pipe Altered granite; Elizabeth Creekgranite; LCARB–EPERM.
LCARB–EPERM
PAL orogenic belt
Roof zone andmargin of LCARB–EPERM graniteintrusion.
WLFM, MLBD,BSMT, BSMN,PYRT, CLCP,ARPR, PYTT,GLEN, SPLR,FLRT, SCLT
Orebodies consist of upward-branching quartz “pipes” a few centimeters to 6 m across and up to 200 m high.
Plimer (1975).
Austria Mittersill mine (Salzburg)
47 18 N 12 29 E Strata-bound Lava, tuff; lower Schieferhulle; PAL.
— MES–CEN orogenic belt
Regionally metamorphosedvolcanic rocks.
SCLT, QRTZ,MLBD, PYTT,CLCP, BSMT,PYRT
Orebodies are severalhundred meters long, 100–150 m wide, and up to 20 m thick.
Vaché (1979).
Bolivia Bolsa Negra (La Paz) 16 34 S 67 49 W Vein Hornfels EJUR MES–CENconvergent platemargin
Contact aureoleof EJUR granitebatholith.
WLFM, SCLT,PYRT, PYTT,QRTZ, CLCP
Orebodies are quartz-rich lenses (“mantos”)in hornfels.
Willig and Delgado (1985).
Bolivia Chambillaya (La Paz) 17 04 S 67 18 W Vein/stockwork Hornfels MIO? MES–CENconvergent platemargin
Contact aureoleof a MIO? graniteintrusion.
FRBR, QRTZ,ARPR, SLPD,SDRT, TRML,TNST
Deposit comprises a circular area 1,400 m in diameter; tonnage potential is considerable.
Willig and Delgado (1985).
Bolivia Chicote Grande (La Paz)
17 28 S 66 50 W Vein/stockwork/alluvial
Quartzite, slate,sandstone; EPAL.
MIO MES–CENconvergent platemargin
Contact aureoleof MIO graniteat depth?
WLFM, CSTR,QRTZ, PYRT,ARPR
Narrow veins form large stockwork zone; mineralized vein material also occurs as talus.
Willig and Delgado (1985).
Bolivia Chojlla (La Paz) 16 23 S 67 45 W Vein/stockwork Shale, sandstone; LORD.
EJUR (183 Ma)
MES–CENconvergent platemargin
Contact aureoleof EJUR granitebatholith.
WLFM, SCLT,QRTZ, BSMN,MLBD, CLCP,HMTT, SDRT,ARPR, CLMB
Deposit consists of more than 30 parallel veins.
Willig and Delgado (1985).
Bolivia Chorolque (Potosi) 20 58 S 66 05 W Porphyry Intrusive breccia; MMIO (12–17 Ma).Shale, sandstone,siltstone; ORD.
MMIO (12–17 Ma)
MES–CENconvergent platemargin
Subvolcanic breccia pipe.
QRTZ, CSTR,WLFM, PYRT,ARPR, PYTT,CLCP, SPLR,STNT, BSMN,TRML
Tungsten occurs in annular zone surround-ing a quartz-tourmaline breccia pipe; tungsten potential large but low grade.
Grant and others (1980).
Bolivia Enramada-Liliana (La Paz)
16 25 S 67 43 W Vein Schist; PAL?Granodiorite; Taquesibatholith; EJUR (199Ma).
EJUR (183 Ma)
MES–CENconvergent platemargin
Contact aureoleof EJUR granitebatholith.
WLFM, QRTZ,CSTR, SLPD
— Willig and Delgado (1985).
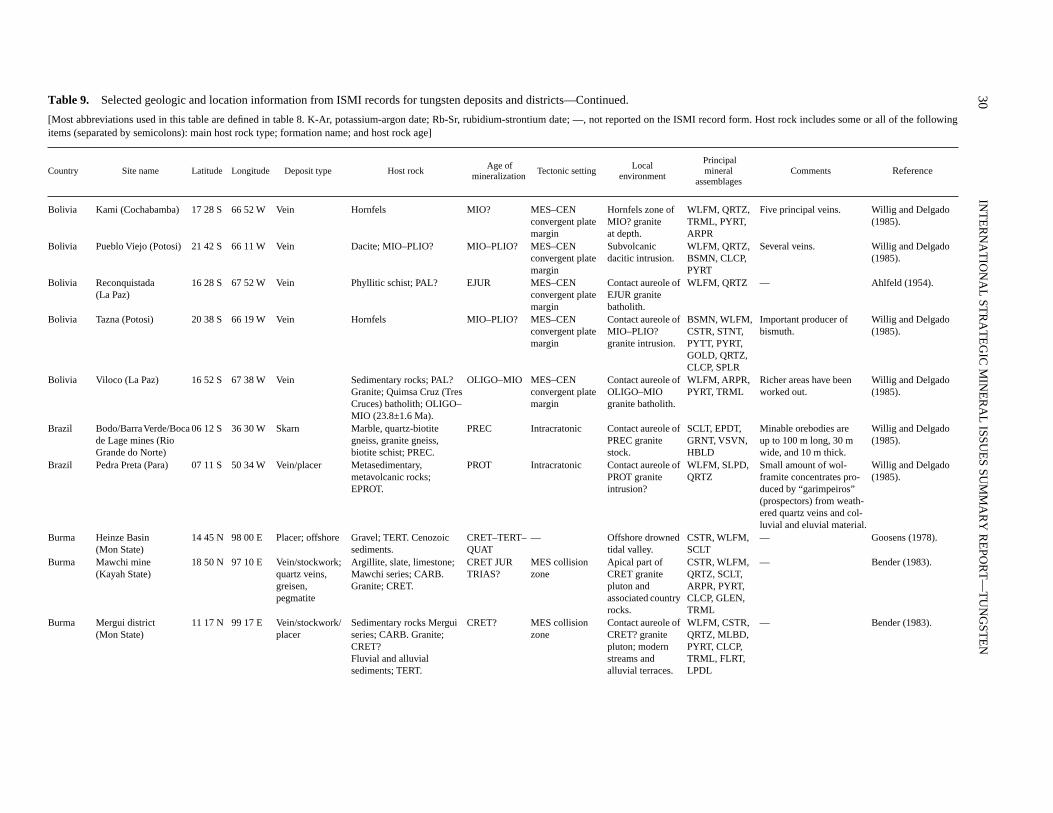
30
INT
ER
NA
TIO
NA
L ST
RA
TE
GIC
MIN
ER
AL
ISSUE
S SUM
MA
RY
RE
POR
T—
TU
NG
STE
N
Table 9.
Selected geologic and location information from ISMI records for tungsten deposits and districts—Continued.
[Most abbreviations used in this table are defined in table 8. K-Ar, potassium-argon date; Rb-Sr, rubidium-strontium date; —, not reported on the ISMI record form. Host rock includes some or all of the followingitems (separated by semicolons): main host rock type; formation name; and host rock age]
Country Site name Latitude Longitude Deposit type Host rock Age of
mineralizationTectonic setting
Localenvironment
Principalmineral
assemblagesComments
Reference
Bolivia Kami (Cochabamba) 17 28 S 66 52 W Vein Hornfels MIO? MES–CENconvergent platemargin
Hornfels zone ofMIO? graniteat depth.
WLFM, QRTZ,TRML, PYRT, ARPR
Five principal veins. Willig and Delgado (1985).
Bolivia Pueblo Viejo (Potosi) 21 42 S 66 11 W Vein Dacite; MIO–PLIO? MIO–PLIO? MES–CENconvergent platemargin
Subvolcanic dacitic intrusion.
WLFM, QRTZ, BSMN, CLCP, PYRT
Several veins. Willig and Delgado (1985).
Bolivia Reconquistada (La Paz)
16 28 S 67 52 W Vein Phyllitic schist; PAL? EJUR MES–CENconvergent platemargin
Contact aureole of EJUR granite batholith.
WLFM, QRTZ — Ahlfeld (1954).
Bolivia Tazna (Potosi) 20 38 S 66 19 W Vein Hornfels MIO–PLIO? MES–CENconvergent platemargin
Contact aureole of MIO–PLIO? granite intrusion.
BSMN, WLFM, CSTR, STNT, PYTT, PYRT, GOLD, QRTZ, CLCP, SPLR
Important producer of bismuth.
Willig and Delgado (1985).
Bolivia Viloco (La Paz) 16 52 S 67 38 W Vein Sedimentary rocks; PAL? Granite; Quimsa Cruz (Tres Cruces) batholith; OLIGO–MIO (23.8±1.6 Ma).
OLIGO–MIO MES–CEN convergent plate margin
Contact aureole of OLIGO–MIO granite batholith.
WLFM, ARPR, PYRT, TRML
Richer areas have been worked out.
Willig and Delgado (1985).
Brazil Bodo/Barra Verde/Boca de Lage mines (Rio Grande do Norte)
06 12 S 36 30 W Skarn Marble, quartz-biotite gneiss, granite gneiss, biotite schist; PREC.
PREC Intracratonic Contact aureole of PREC granite stock.
SCLT, EPDT, GRNT, VSVN, HBLD
Minable orebodies are up to 100 m long, 30 m wide, and 10 m thick.
Willig and Delgado (1985).
Brazil Pedra Preta (Para) 07 11 S 50 34 W Vein/placer Metasedimentary, metavolcanic rocks; EPROT.
PROT Intracratonic Contact aureole of PROT graniteintrusion?
WLFM, SLPD, QRTZ
Small amount of wol-framite concentrates pro-duced by “garimpeiros” (prospectors) from weath-ered quartz veins and col-luvial and eluvial material.
Willig and Delgado (1985).
Burma Heinze Basin (Mon State)
14 45 N 98 00 E Placer; offshore Gravel; TERT. Cenozoic sediments.
CRET–TERT–QUAT
— Offshore drowned tidal valley.
CSTR, WLFM, SCLT
— Goosens (1978).
Burma Mawchi mine (Kayah State)
18 50 N 97 10 E Vein/stockwork; quartz veins, greisen, pegmatite
Argillite, slate, limestone; Mawchi series; CARB. Granite; CRET.
CRET JURTRIAS?
MES collision zone
Apical part of CRET granite pluton and associated country rocks.
CSTR, WLFM, QRTZ, SCLT, ARPR, PYRT, CLCP, GLEN, TRML
— Bender (1983).
Burma Mergui district (Mon State)
11 17 N 99 17 E Vein/stockwork/placer
Sedimentary rocks Mergui series; CARB. Granite; CRET? Fluvial and alluvial sediments; TERT.
CRET? MES collision zone
Contact aureole of CRET? granitepluton; modern streams and alluvial terraces.
WLFM, CSTR, QRTZ, MLBD,PYRT, CLCP, TRML, FLRT, LPDL
— Bender (1983).
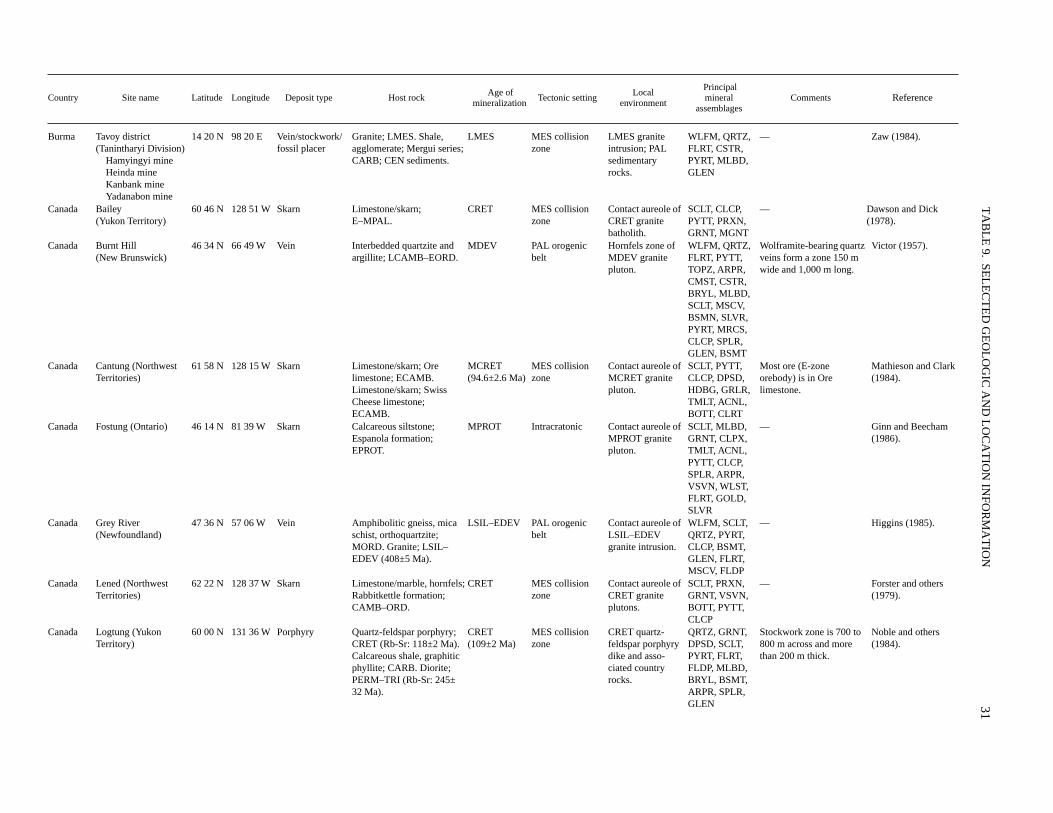
TA
BL
E 9.
SEL
EC
TE
D G
EO
LO
GIC
AN
D L
OC
AT
ION
INFO
RM
AT
ION
31
Country Site name Latitude Longitude Deposit type Host rock Age of
mineralizationTectonic setting
Localenvironment
Principalmineral
assemblagesComments
Reference
Burma Tavoy district (Tanintharyi Division)
Hamyingyi mineHeinda mineKanbank mineYadanabon mine
14 20 N 98 20 E Vein/stockwork/fossil placer
Granite; LMES. Shale, agglomerate; Mergui series; CARB; CEN sediments.
LMES MES collision zone
LMES granite intrusion; PAL sedimentary rocks.
WLFM, QRTZ, FLRT, CSTR, PYRT, MLBD, GLEN
— Zaw (1984).
Canada Bailey (Yukon Territory)
60 46 N 128 51 W Skarn Limestone/skarn; E–MPAL.
CRET MES collision zone
Contact aureole of CRET granite batholith.
SCLT, CLCP, PYTT, PRXN, GRNT, MGNT
— Dawson and Dick (1978).
Canada Burnt Hill (New Brunswick)
46 34 N 66 49 W Vein Interbedded quartzite and argillite; LCAMB–EORD.
MDEV PAL orogenic belt
Hornfels zone of MDEV granite pluton.
WLFM, QRTZ, FLRT, PYTT, TOPZ, ARPR, CMST, CSTR, BRYL, MLBD, SCLT, MSCV, BSMN, SLVR, PYRT, MRCS, CLCP, SPLR, GLEN, BSMT
Wolframite-bearing quartz veins form a zone 150 m wide and 1,000 m long.
Victor (1957).
Canada Cantung (Northwest Territories)
61 58 N 128 15 W Skarn Limestone/skarn; Ore limestone; ECAMB. Limestone/skarn; Swiss Cheese limestone; ECAMB.
MCRET (94.6±2.6 Ma)
MES collision zone
Contact aureole of MCRET granite pluton.
SCLT, PYTT, CLCP, DPSD, HDBG, GRLR, TMLT, ACNL, BOTT, CLRT
Most ore (E-zone orebody) is in Ore limestone.
Mathieson and Clark (1984).
Canada Fostung (Ontario) 46 14 N 81 39 W Skarn Calcareous siltstone; Espanola formation; EPROT.
MPROT Intracratonic Contact aureole of MPROT granite pluton.
SCLT, MLBD, GRNT, CLPX, TMLT, ACNL, PYTT, CLCP, SPLR, ARPR, VSVN, WLST, FLRT, GOLD, SLVR
— Ginn and Beecham (1986).
Canada Grey River (Newfoundland)
47 36 N 57 06 W Vein Amphibolitic gneiss, mica schist, orthoquartzite; MORD. Granite; LSIL–EDEV (408±5 Ma).
LSIL–EDEV PAL orogenic belt
Contact aureole of LSIL–EDEV granite intrusion.
WLFM, SCLT, QRTZ, PYRT, CLCP, BSMT, GLEN, FLRT, MSCV, FLDP
— Higgins (1985).
Canada Lened (Northwest Territories)
62 22 N 128 37 W Skarn Limestone/marble, hornfels; Rabbitkettle formation; CAMB–ORD.
CRET MES collision zone
Contact aureole of CRET granite plutons.
SCLT, PRXN, GRNT, VSVN, BOTT, PYTT, CLCP
— Forster and others (1979).
Canada Logtung (Yukon Territory)
60 00 N 131 36 W Porphyry Quartz-feldspar porphyry; CRET (Rb-Sr: 118±2 Ma). Calcareous shale, graphitic phyllite; CARB. Diorite; PERM–TRI (Rb-Sr: 245±32 Ma).
CRET (109±2 Ma)
MES collision zone
CRET quartz-feldspar porphyry dike and asso-ciated country rocks.
QRTZ, GRNT, DPSD, SCLT, PYRT, FLRT, FLDP, MLBD, BRYL, BSMT, ARPR, SPLR, GLEN
Stockwork zone is 700 to 800 m across and more than 200 m thick.
Noble and others (1984).
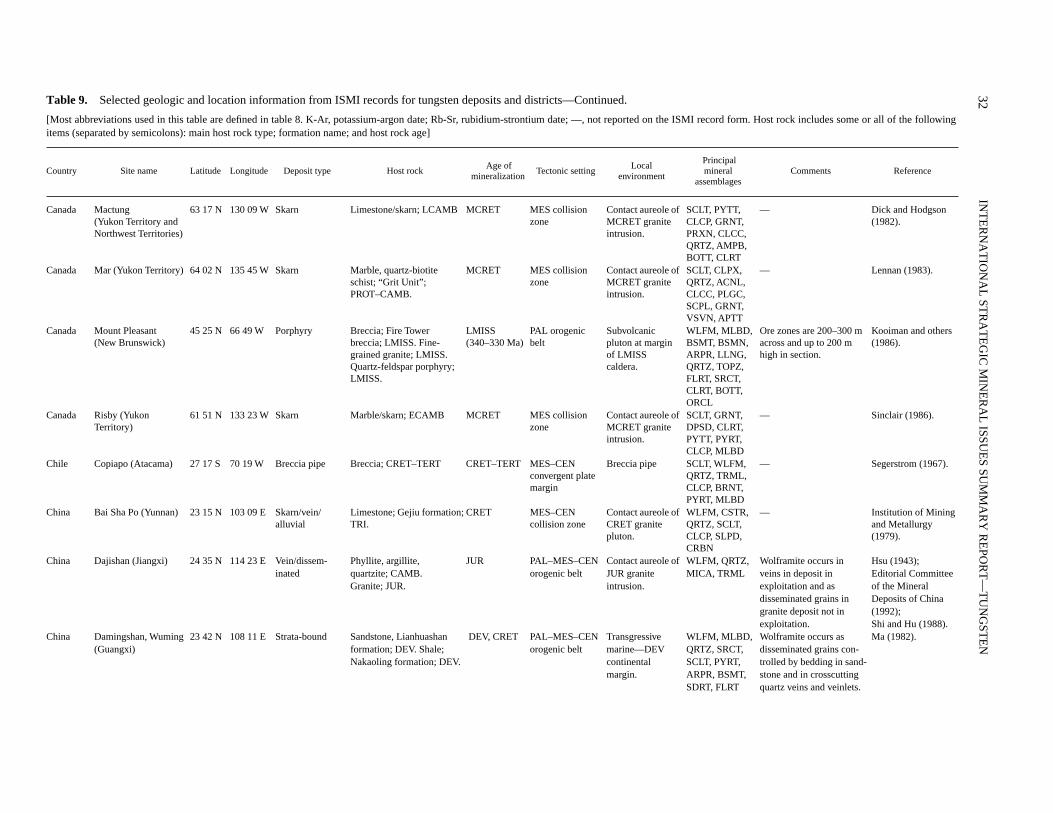
32
INT
ER
NA
TIO
NA
L ST
RA
TE
GIC
MIN
ER
AL
ISSUE
S SUM
MA
RY
RE
POR
T—
TU
NG
STE
N
Table 9.
Selected geologic and location information from ISMI records for tungsten deposits and districts—Continued.
[Most abbreviations used in this table are defined in table 8. K-Ar, potassium-argon date; Rb-Sr, rubidium-strontium date; —, not reported on the ISMI record form. Host rock includes some or all of the followingitems (separated by semicolons): main host rock type; formation name; and host rock age]
Country Site name Latitude Longitude Deposit type Host rock Age of
mineralizationTectonic setting
Localenvironment
Principalmineral
assemblagesComments Reference
Canada Mactung (Yukon Territory and Northwest Territories)
63 17 N 130 09 W Skarn Limestone/skarn; LCAMB MCRET MES collision zone
Contact aureole of MCRET granite intrusion.
SCLT, PYTT, CLCP, GRNT, PRXN, CLCC, QRTZ, AMPB, BOTT, CLRT
— Dick and Hodgson (1982).
Canada Mar (Yukon Territory) 64 02 N 135 45 W Skarn Marble, quartz-biotite schist; “Grit Unit”; PROT–CAMB.
MCRET MES collision zone
Contact aureole of MCRET granite intrusion.
SCLT, CLPX, QRTZ, ACNL, CLCC, PLGC, SCPL, GRNT, VSVN, APTT
— Lennan (1983).
Canada Mount Pleasant (New Brunswick)
45 25 N 66 49 W Porphyry Breccia; Fire Tower breccia; LMISS. Fine-grained granite; LMISS. Quartz-feldspar porphyry; LMISS.
LMISS (340–330 Ma)
PAL orogenic belt
Subvolcanic pluton at margin of LMISS caldera.
WLFM, MLBD,BSMT, BSMN, ARPR, LLNG, QRTZ, TOPZ, FLRT, SRCT, CLRT, BOTT, ORCL
Ore zones are 200–300 m across and up to 200 m high in section.
Kooiman and others (1986).
Canada Risby (YukonTerritory)
61 51 N 133 23 W Skarn Marble/skarn; ECAMB MCRET MES collision zone
Contact aureole of MCRET granite intrusion.
SCLT, GRNT, DPSD, CLRT, PYTT, PYRT, CLCP, MLBD
— Sinclair (1986).
Chile Copiapo (Atacama) 27 17 S 70 19 W Breccia pipe Breccia; CRET–TERT CRET–TERT MES–CEN convergent plate margin
Breccia pipe SCLT, WLFM, QRTZ, TRML, CLCP, BRNT, PYRT, MLBD
— Segerstrom (1967).
China Bai Sha Po (Yunnan) 23 15 N 103 09 E Skarn/vein/alluvial
Limestone; Gejiu formation; TRI.
CRET MES–CEN collision zone
Contact aureole of CRET granite pluton.
WLFM, CSTR, QRTZ, SCLT, CLCP, SLPD, CRBN
— Institution of Mining and Metallurgy (1979).
China Dajishan (Jiangxi) 24 35 N 114 23 E Vein/dissem-inated
Phyllite, argillite, quartzite; CAMB. Granite; JUR.
JUR PAL–MES–CEN orogenic belt
Contact aureole of JUR granite intrusion.
WLFM, QRTZ, MICA, TRML
Wolframite occurs in veins in deposit in exploitation and as disseminated grains in granite deposit not in exploitation.
Hsu (1943);Editorial Committee of the Mineral Deposits of China (1992);Shi and Hu (1988).
China Damingshan, Wuming (Guangxi)
23 42 N 108 11 E Strata-bound Sandstone, Lianhuashan formation; DEV. Shale; Nakaoling formation; DEV.
DEV, CRET PAL–MES–CEN orogenic belt
Transgressive marine—DEV continental margin.
WLFM, MLBD, QRTZ, SRCT, SCLT, PYRT, ARPR, BSMT, SDRT, FLRT
Wolframite occurs as disseminated grains con-trolled by bedding in sand-stone and in crosscutting quartz veins and veinlets.
Ma (1982).
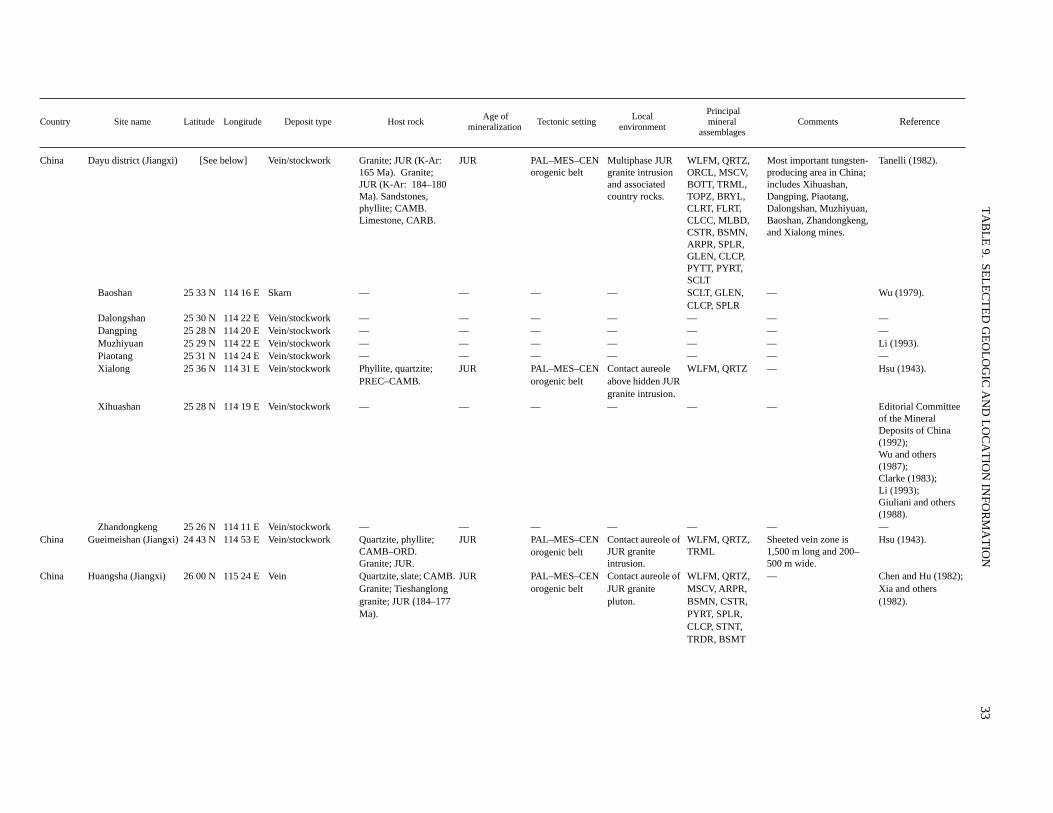
TA
BL
E 9.
SEL
EC
TE
D G
EO
LO
GIC
AN
D L
OC
AT
ION
INFO
RM
AT
ION
33
Country Site name Latitude Longitude Deposit type Host rock Age of
mineralizationTectonic setting
Localenvironment
Principalmineral
assemblagesComments
Reference
China Dayu district (Jiangxi) [See below] Vein/stockwork Granite; JUR (K-Ar: 165 Ma). Granite; JUR (K-Ar: 184–180 Ma). Sandstones, phyllite; CAMB. Limestone, CARB.
JUR PAL–MES–CEN orogenic belt
Multiphase JUR granite intrusion and associated country rocks.
WLFM, QRTZ, ORCL, MSCV, BOTT, TRML, TOPZ, BRYL, CLRT, FLRT, CLCC, MLBD, CSTR, BSMN, ARPR, SPLR, GLEN, CLCP, PYTT, PYRT, SCLT
Most important tungsten-producing area in China; includes Xihuashan, Dangping, Piaotang, Dalongshan, Muzhiyuan, Baoshan, Zhandongkeng, and Xialong mines.
Tanelli (1982).
Baoshan 25 33 N 114 16 E Skarn — — — — SCLT, GLEN, CLCP, SPLR
— Wu (1979).
Dalongshan 25 30 N 114 22 E Vein/stockwork — — — — — — —Dangping 25 28 N 114 20 E Vein/stockwork — — — — — — —Muzhiyuan 25 29 N 114 22 E Vein/stockwork — — — — — — Li (1993).Piaotang 25 31 N 114 24 E Vein/stockwork — — — — — — —Xialong 25 36 N 114 31 E Vein/stockwork Phyllite, quartzite;
PREC–CAMB.JUR PAL–MES–CEN
orogenic beltContact aureole above hidden JUR granite intrusion.
WLFM, QRTZ — Hsu (1943).
Xihuashan 25 28 N 114 19 E Vein/stockwork — — — — — — Editorial Committee of the Mineral Deposits of China (1992); Wu and others (1987); Clarke (1983);Li (1993); Giuliani and others (1988).
Zhandongkeng 25 26 N 114 11 E Vein/stockwork — — — — — — —China Gueimeishan (Jiangxi) 24 43 N 114 53 E Vein/stockwork Quartzite, phyllite;
CAMB–ORD. Granite; JUR.
JUR PAL–MES–CEN orogenic belt
Contact aureole of JUR granite intrusion.
WLFM, QRTZ, TRML
Sheeted vein zone is 1,500 m long and 200–500 m wide.
Hsu (1943).
China Huangsha (Jiangxi) 26 00 N 115 24 E Vein Quartzite, slate; CAMB. Granite; Tieshanglong granite; JUR (184–177 Ma).
JUR PAL–MES–CEN orogenic belt
Contact aureole of JUR granite pluton.
WLFM, QRTZ, MSCV, ARPR, BSMN, CSTR, PYRT, SPLR, CLCP, STNT, TRDR, BSMT
— Chen and Hu (1982);Xia and others (1982).
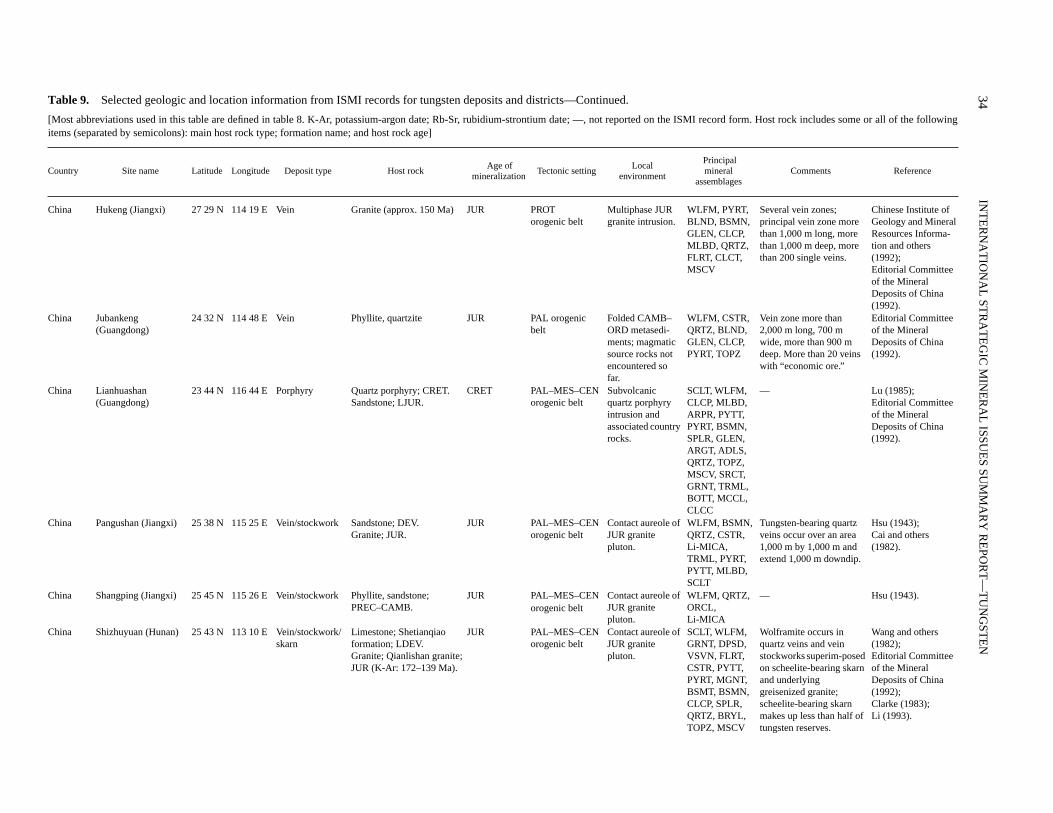
34
INT
ER
NA
TIO
NA
L ST
RA
TE
GIC
MIN
ER
AL
ISSUE
S SUM
MA
RY
RE
POR
T—
TU
NG
STE
N
Table 9.
Selected geologic and location information from ISMI records for tungsten deposits and districts—Continued.
[Most abbreviations used in this table are defined in table 8. K-Ar, potassium-argon date; Rb-Sr, rubidium-strontium date; —, not reported on the ISMI record form. Host rock includes some or all of the followingitems (separated by semicolons): main host rock type; formation name; and host rock age]
Country Site name Latitude Longitude Deposit type Host rock Age of
mineralizationTectonic setting
Localenvironment
Principalmineral
assemblagesComments Reference
China Hukeng (Jiangxi) 27 29 N 114 19 E Vein Granite (approx. 150 Ma) JUR PROTorogenic belt
Multiphase JUR granite intrusion.
WLFM, PYRT, BLND, BSMN, GLEN, CLCP, MLBD, QRTZ, FLRT, CLCT, MSCV
Several vein zones; principal vein zone more than 1,000 m long, more than 1,000 m deep, more than 200 single veins.
Chinese Institute of Geology and Mineral Resources Informa-tion and others (1992);Editorial Committee of the Mineral Deposits of China (1992).
China Jubankeng (Guangdong)
24 32 N 114 48 E Vein Phyllite, quartzite JUR PAL orogenic belt
Folded CAMB–ORD metasedi-ments; magmatic source rocks not encountered so far.
WLFM, CSTR, QRTZ, BLND, GLEN, CLCP, PYRT, TOPZ
Vein zone more than 2,000 m long, 700 m wide, more than 900 m deep. More than 20 veins with “economic ore.”
Editorial Committee of the Mineral Deposits of China (1992).
China Lianhuashan (Guangdong)
23 44 N 116 44 E Porphyry Quartz porphyry; CRET. Sandstone; LJUR.
CRET PAL–MES–CEN orogenic belt
Subvolcanic quartz porphyry intrusion and associated country rocks.
SCLT, WLFM, CLCP, MLBD, ARPR, PYTT, PYRT, BSMN, SPLR, GLEN, ARGT, ADLS, QRTZ, TOPZ, MSCV, SRCT, GRNT, TRML, BOTT, MCCL, CLCC
— Lu (1985);Editorial Committee of the Mineral Deposits of China (1992).
China Pangushan (Jiangxi) 25 38 N 115 25 E Vein/stockwork Sandstone; DEV. Granite; JUR.
JUR PAL–MES–CEN orogenic belt
Contact aureole of JUR granite pluton.
WLFM, BSMN, QRTZ, CSTR, Li-MICA, TRML, PYRT, PYTT, MLBD, SCLT
Tungsten-bearing quartz veins occur over an area 1,000 m by 1,000 m and extend 1,000 m downdip.
Hsu (1943);Cai and others (1982).
China Shangping (Jiangxi) 25 45 N 115 26 E Vein/stockwork Phyllite, sandstone; PREC–CAMB.
JUR PAL–MES–CEN orogenic belt
Contact aureole of JUR granite pluton.
WLFM, QRTZ, ORCL, Li-MICA
— Hsu (1943).
China Shizhuyuan (Hunan) 25 43 N 113 10 E Vein/stockwork/skarn
Limestone; Shetianqiao formation; LDEV.Granite; Qianlishan granite; JUR (K-Ar: 172–139 Ma).
JUR PAL–MES–CEN orogenic belt
Contact aureole of JUR granite pluton.
SCLT, WLFM, GRNT, DPSD, VSVN, FLRT, CSTR, PYTT, PYRT, MGNT, BSMT, BSMN, CLCP, SPLR, QRTZ, BRYL, TOPZ, MSCV
Wolframite occurs in quartz veins and vein stockworks superim-posed on scheelite-bearing skarn and underlying greisenized granite; scheelite-bearing skarn makes up less than half of tungsten reserves.
Wang and others (1982);Editorial Committee of the Mineral Deposits of China (1992);Clarke (1983);Li (1993).
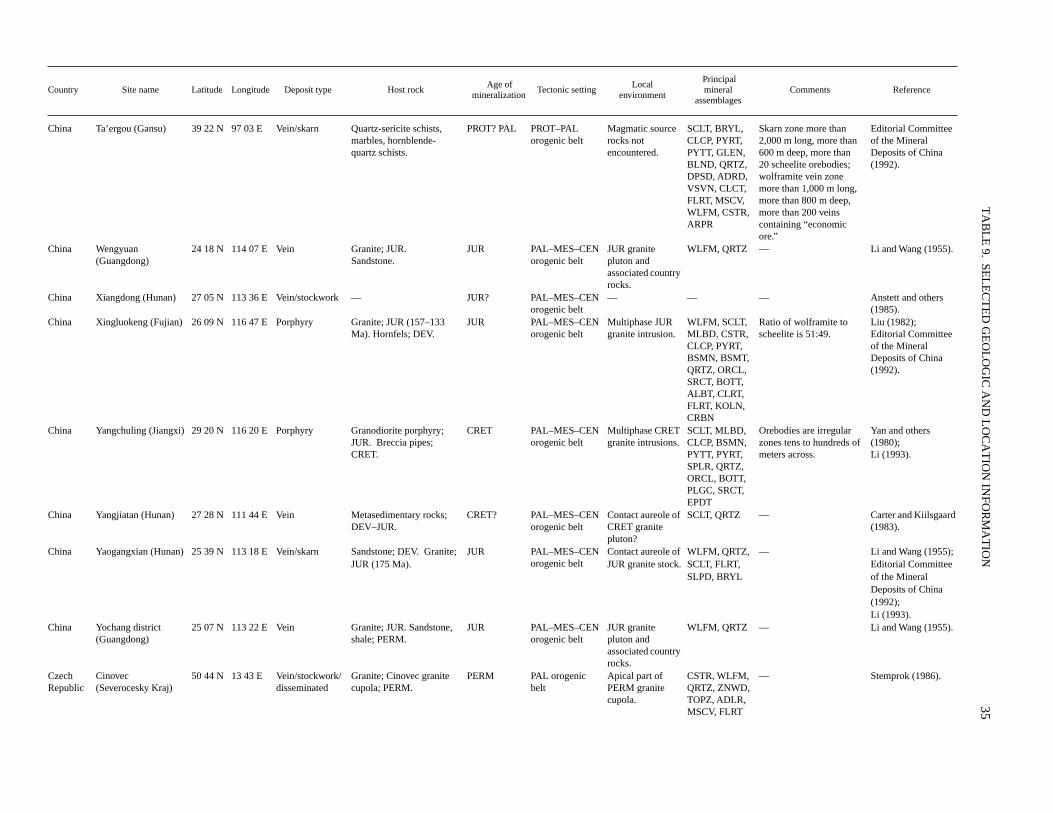
TA
BL
E 9.
SEL
EC
TE
D G
EO
LO
GIC
AN
D L
OC
AT
ION
INFO
RM
AT
ION
35
Country Site name Latitude Longitude Deposit type Host rock Age of
mineralizationTectonic setting
Localenvironment
Principalmineral
assemblagesComments Reference
China Ta’ergou (Gansu) 39 22 N 97 03 E Vein/skarn Quartz-sericite schists, marbles, hornblende-quartz schists.
PROT? PAL PROT–PAL orogenic belt
Magmatic source rocks not encountered.
SCLT, BRYL, CLCP, PYRT, PYTT, GLEN, BLND, QRTZ, DPSD, ADRD, VSVN, CLCT, FLRT, MSCV, WLFM, CSTR, ARPR
Skarn zone more than 2,000 m long, more than 600 m deep, more than 20 scheelite orebodies; wolframite vein zone more than 1,000 m long, more than 800 m deep, more than 200 veins containing “economic ore.”
Editorial Committee of the Mineral Deposits of China (1992).
China Wengyuan (Guangdong)
24 18 N 114 07 E Vein Granite; JUR. Sandstone.
JUR PAL–MES–CEN orogenic belt
JUR granite pluton and associated country rocks.
WLFM, QRTZ — Li and Wang (1955).
China Xiangdong (Hunan) 27 05 N 113 36 E Vein/stockwork — JUR? PAL–MES–CEN orogenic belt
— — — Anstett and others (1985).
China Xingluokeng (Fujian) 26 09 N 116 47 E Porphyry Granite; JUR (157–133 Ma). Hornfels; DEV.
JUR PAL–MES–CEN orogenic belt
Multiphase JUR granite intrusion.
WLFM, SCLT, MLBD, CSTR, CLCP, PYRT, BSMN, BSMT, QRTZ, ORCL, SRCT, BOTT, ALBT, CLRT, FLRT, KOLN, CRBN
Ratio of wolframite to scheelite is 51:49.
Liu (1982);Editorial Committee of the Mineral Deposits of China (1992).
China Yangchuling (Jiangxi) 29 20 N 116 20 E Porphyry Granodiorite porphyry; JUR. Breccia pipes; CRET.
CRET PAL–MES–CEN orogenic belt
Multiphase CRET granite intrusions.
SCLT, MLBD, CLCP, BSMN, PYTT, PYRT, SPLR, QRTZ, ORCL, BOTT, PLGC, SRCT, EPDT
Orebodies are irregular zones tens to hundreds of meters across.
Yan and others (1980);Li (1993).
China Yangjiatan (Hunan) 27 28 N 111 44 E Vein Metasedimentary rocks; DEV–JUR.
CRET? PAL–MES–CEN orogenic belt
Contact aureole of CRET granite pluton?
SCLT, QRTZ — Carter and Kiilsgaard (1983).
China Yaogangxian (Hunan) 25 39 N 113 18 E Vein/skarn Sandstone; DEV. Granite; JUR (175 Ma).
JUR PAL–MES–CEN orogenic belt
Contact aureole of JUR granite stock.
WLFM, QRTZ, SCLT, FLRT, SLPD, BRYL
— Li and Wang (1955); Editorial Committee of the Mineral Deposits of China (1992);Li (1993).
China Yochang district (Guangdong)
25 07 N 113 22 E Vein Granite; JUR. Sandstone, shale; PERM.
JUR PAL–MES–CEN orogenic belt
JUR granite pluton and associated country rocks.
WLFM, QRTZ — Li and Wang (1955).
Czech Republic
Cinovec (Severocesky Kraj)
50 44 N 13 43 E Vein/stockwork/ disseminated
Granite; Cinovec granite cupola; PERM.
PERM PAL orogenic belt
Apical part of PERM granite cupola.
CSTR, WLFM, QRTZ, ZNWD, TOPZ, ADLR, MSCV, FLRT
— Stemprok (1986).
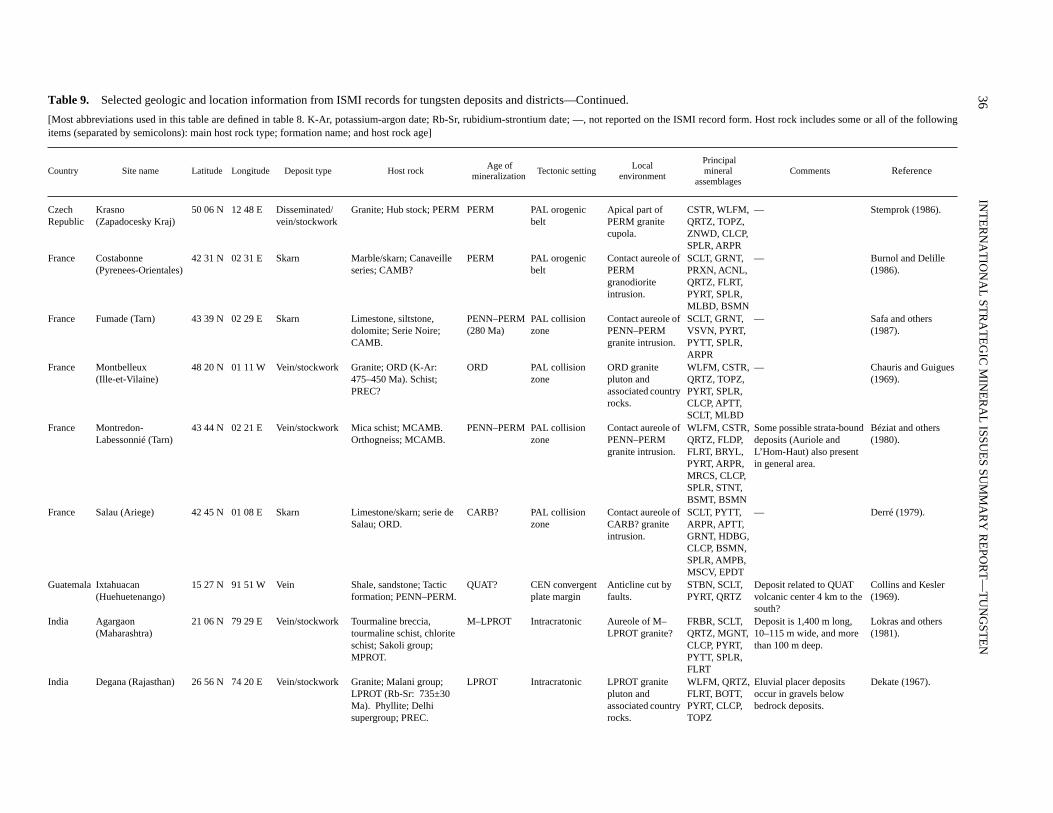
36
INT
ER
NA
TIO
NA
L ST
RA
TE
GIC
MIN
ER
AL
ISSUE
S SUM
MA
RY
RE
POR
T—
TU
NG
STE
N
Table 9.
Selected geologic and location information from ISMI records for tungsten deposits and districts—Continued.
[Most abbreviations used in this table are defined in table 8. K-Ar, potassium-argon date; Rb-Sr, rubidium-strontium date; —, not reported on the ISMI record form. Host rock includes some or all of the followingitems (separated by semicolons): main host rock type; formation name; and host rock age]
Country Site name Latitude Longitude Deposit type Host rock Age of
mineralizationTectonic setting
Localenvironment
Principalmineral
assemblagesComments
Reference
Czech Republic
Krasno(Zapadocesky Kraj)
50 06 N 12 48 E Disseminated/vein/stockwork
Granite; Hub stock; PERM PERM PAL orogenic belt
Apical part of PERM granite cupola.
CSTR, WLFM, QRTZ, TOPZ, ZNWD, CLCP, SPLR, ARPR
— Stemprok (1986).
France Costabonne (Pyrenees-Orientales)
42 31 N 02 31 E Skarn Marble/skarn; Canaveille series; CAMB?
PERM PAL orogenic belt
Contact aureole of PERM granodiorite intrusion.
SCLT, GRNT, PRXN, ACNL, QRTZ, FLRT, PYRT, SPLR, MLBD, BSMN
— Burnol and Delille (1986).
France Fumade (Tarn) 43 39 N 02 29 E Skarn Limestone, siltstone, dolomite; Serie Noire; CAMB.
PENN–PERM (280 Ma)
PAL collision zone
Contact aureole of PENN–PERM granite intrusion.
SCLT, GRNT, VSVN, PYRT, PYTT, SPLR, ARPR
— Safa and others (1987).
France Montbelleux (Ille-et-Vilaine)
48 20 N 01 11 W Vein/stockwork Granite; ORD (K-Ar: 475–450 Ma). Schist; PREC?
ORD PAL collision zone
ORD granite pluton and associated country rocks.
WLFM, CSTR, QRTZ, TOPZ, PYRT, SPLR, CLCP, APTT, SCLT, MLBD
— Chauris and Guigues (1969).
France Montredon-Labessonnié (Tarn)
43 44 N 02 21 E Vein/stockwork Mica schist; MCAMB. Orthogneiss; MCAMB.
PENN–PERM PAL collision zone
Contact aureole of PENN–PERM granite intrusion.
WLFM, CSTR, QRTZ, FLDP, FLRT, BRYL, PYRT, ARPR, MRCS, CLCP, SPLR, STNT, BSMT, BSMN
Some possible strata-bound deposits (Auriole and L’Hom-Haut) also present in general area.
Béziat and others (1980).
France Salau (Ariege) 42 45 N 01 08 E Skarn Limestone/skarn; serie de Salau; ORD.
CARB? PAL collision zone
Contact aureole of CARB? granite intrusion.
SCLT, PYTT, ARPR, APTT, GRNT, HDBG, CLCP, BSMN, SPLR, AMPB, MSCV, EPDT
— Derré (1979).
Guatemala Ixtahuacan(Huehuetenango)
15 27 N 91 51 W Vein Shale, sandstone; Tactic formation; PENN–PERM.
QUAT? CEN convergent plate margin
Anticline cut by faults.
STBN, SCLT, PYRT, QRTZ
Deposit related to QUAT volcanic center 4 km to the south?
Collins and Kesler (1969).
India Agargaon (Maharashtra)
21 06 N 79 29 E Vein/stockwork Tourmaline breccia, tourmaline schist, chlorite schist; Sakoli group; MPROT.
M–LPROT Intracratonic Aureole of M–LPROT granite?
FRBR, SCLT, QRTZ, MGNT, CLCP, PYRT, PYTT, SPLR, FLRT
Deposit is 1,400 m long, 10–115 m wide, and more than 100 m deep.
Lokras and others (1981).
India Degana (Rajasthan) 26 56 N 74 20 E Vein/stockwork Granite; Malani group; LPROT (Rb-Sr: 735±30 Ma). Phyllite; Delhi supergroup; PREC.
LPROT Intracratonic LPROT granite pluton and associated country rocks.
WLFM, QRTZ, FLRT, BOTT,PYRT, CLCP, TOPZ
Eluvial placer deposits occur in gravels below bedrock deposits.
Dekate (1967).
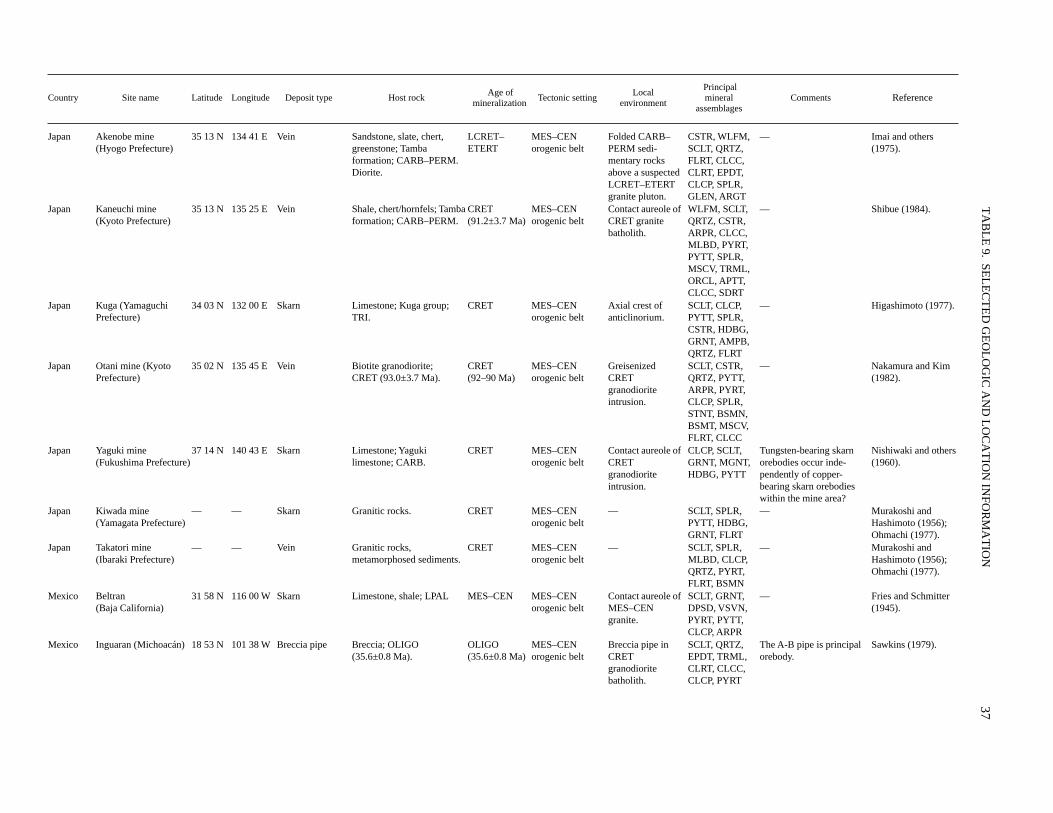
TA
BL
E 9.
SEL
EC
TE
D G
EO
LO
GIC
AN
D L
OC
AT
ION
INFO
RM
AT
ION
37
Country Site name Latitude Longitude Deposit type Host rock Age of
mineralizationTectonic setting
Localenvironment
Principalmineral
assemblagesComments
Reference
Japan Akenobe mine (Hyogo Prefecture)
35 13 N 134 41 E Vein Sandstone, slate, chert, greenstone; Tamba formation; CARB–PERM. Diorite.
LCRET–ETERT
MES–CEN orogenic belt
Folded CARB–PERM sedi-mentary rocks above a suspected LCRET–ETERT granite pluton.
CSTR, WLFM, SCLT, QRTZ, FLRT, CLCC, CLRT, EPDT, CLCP, SPLR, GLEN, ARGT
— Imai and others (1975).
Japan Kaneuchi mine(Kyoto Prefecture)
35 13 N 135 25 E Vein Shale, chert/hornfels; Tamba formation; CARB–PERM.
CRET (91.2±3.7 Ma)
MES–CEN orogenic belt
Contact aureole of CRET granite batholith.
WLFM, SCLT, QRTZ, CSTR, ARPR, CLCC, MLBD, PYRT, PYTT, SPLR, MSCV, TRML, ORCL, APTT, CLCC, SDRT
— Shibue (1984).
Japan Kuga (YamaguchiPrefecture)
34 03 N 132 00 E Skarn Limestone; Kuga group; TRI.
CRET MES–CEN orogenic belt
Axial crest of anticlinorium.
SCLT, CLCP, PYTT, SPLR, CSTR, HDBG, GRNT, AMPB, QRTZ, FLRT
— Higashimoto (1977).
Japan Otani mine (Kyoto Prefecture)
35 02 N 135 45 E Vein Biotite granodiorite; CRET (93.0±3.7 Ma).
CRET(92–90 Ma)
MES–CEN orogenic belt
Greisenized CRET granodiorite intrusion.
SCLT, CSTR, QRTZ, PYTT, ARPR, PYRT, CLCP, SPLR, STNT, BSMN, BSMT, MSCV, FLRT, CLCC
— Nakamura and Kim (1982).
Japan Yaguki mine(Fukushima Prefecture)
37 14 N 140 43 E Skarn Limestone; Yaguki limestone; CARB.
CRET MES–CEN orogenic belt
Contact aureole of CRET granodiorite intrusion.
CLCP, SCLT, GRNT, MGNT, HDBG, PYTT
Tungsten-bearing skarn orebodies occur inde-pendently of copper-bearing skarn orebodies within the mine area?
Nishiwaki and others (1960).
Japan Kiwada mine(Yamagata Prefecture)
— — Skarn Granitic rocks. CRET MES–CEN orogenic belt
— SCLT, SPLR, PYTT, HDBG, GRNT, FLRT
— Murakoshi and Hashimoto (1956);Ohmachi (1977).
Japan Takatori mine(Ibaraki Prefecture)
— — Vein Granitic rocks, metamorphosed sediments.
CRET MES–CEN orogenic belt
— SCLT, SPLR, MLBD, CLCP, QRTZ, PYRT, FLRT, BSMN
— Murakoshi and Hashimoto (1956);Ohmachi (1977).
Mexico Beltran (Baja California)
31 58 N 116 00 W Skarn Limestone, shale; LPAL MES–CEN MES–CEN orogenic belt
Contact aureole of MES–CEN granite.
SCLT, GRNT, DPSD, VSVN, PYRT, PYTT, CLCP, ARPR
— Fries and Schmitter (1945).
Mexico Inguaran (Michoacán) 18 53 N 101 38 W Breccia pipe Breccia; OLIGO (35.6±0.8 Ma).
OLIGO (35.6±0.8 Ma)
MES–CEN orogenic belt
Breccia pipe in CRET granodiorite batholith.
SCLT, QRTZ, EPDT, TRML, CLRT, CLCC, CLCP, PYRT
The A-B pipe is principal orebody.
Sawkins (1979).
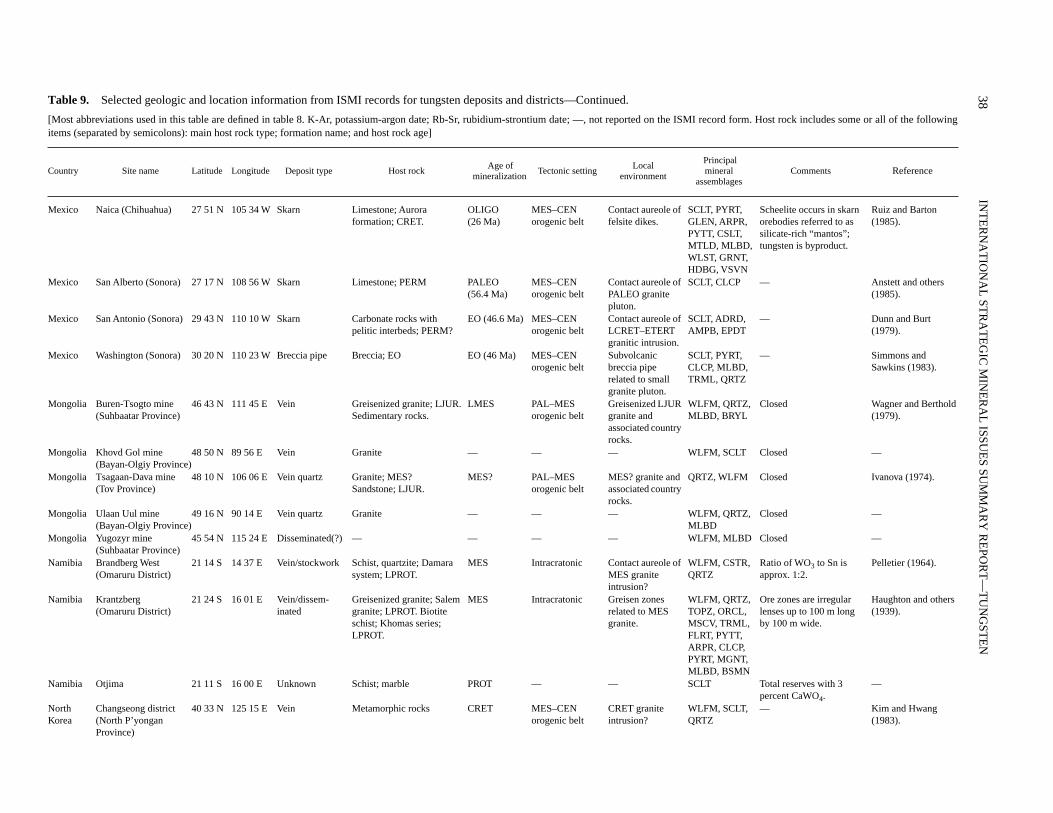
38
INT
ER
NA
TIO
NA
L ST
RA
TE
GIC
MIN
ER
AL
ISSUE
S SUM
MA
RY
RE
POR
T—
TU
NG
STE
N
Table 9.
Selected geologic and location information from ISMI records for tungsten deposits and districts—Continued.
[Most abbreviations used in this table are defined in table 8. K-Ar, potassium-argon date; Rb-Sr, rubidium-strontium date; —, not reported on the ISMI record form. Host rock includes some or all of the followingitems (separated by semicolons): main host rock type; formation name; and host rock age]
Country Site name Latitude Longitude Deposit type Host rock Age of
mineralizationTectonic setting
Localenvironment
Principalmineral
assemblagesComments
Reference
Mexico Naica (Chihuahua) 27 51 N 105 34 W Skarn Limestone; Aurora formation; CRET.
OLIGO (26 Ma)
MES–CEN orogenic belt
Contact aureole of felsite dikes.
SCLT, PYRT, GLEN, ARPR, PYTT, CSLT, MTLD, MLBD, WLST, GRNT, HDBG, VSVN
Scheelite occurs in skarn orebodies referred to as silicate-rich “mantos”; tungsten is byproduct.
Ruiz and Barton (1985).
Mexico San Alberto (Sonora) 27 17 N 108 56 W Skarn Limestone; PERM PALEO(56.4 Ma)
MES–CEN orogenic belt
Contact aureole of PALEO granite pluton.
SCLT, CLCP — Anstett and others (1985).
Mexico San Antonio (Sonora) 29 43 N 110 10 W Skarn Carbonate rocks with pelitic interbeds; PERM?
EO (46.6 Ma) MES–CEN orogenic belt
Contact aureole of LCRET–ETERT granitic intrusion.
SCLT, ADRD, AMPB, EPDT
— Dunn and Burt (1979).
Mexico Washington (Sonora) 30 20 N 110 23 W Breccia pipe Breccia; EO EO (46 Ma) MES–CEN orogenic belt
Subvolcanic breccia pipe related to small granite pluton.
SCLT, PYRT, CLCP, MLBD, TRML, QRTZ
— Simmons and Sawkins (1983).
Mongolia Buren-Tsogto mine(Suhbaatar Province)
46 43 N 111 45 E Vein Greisenized granite; LJUR. Sedimentary rocks.
LMES PAL–MES orogenic belt
Greisenized LJUR granite and associated country rocks.
WLFM, QRTZ, MLBD, BRYL
Closed Wagner and Berthold (1979).
Mongolia Khovd Gol mine(Bayan-Olgiy Province)
48 50 N 89 56 E Vein Granite — — — WLFM, SCLT Closed —
Mongolia Tsagaan-Dava mine(Tov Province)
48 10 N 106 06 E Vein quartz Granite; MES?Sandstone; LJUR.
MES? PAL–MES orogenic belt
MES? granite and associated country rocks.
QRTZ, WLFM Closed Ivanova (1974).
Mongolia Ulaan Uul mine(Bayan-Olgiy Province)
49 16 N 90 14 E Vein quartz Granite — — — WLFM, QRTZ, MLBD
Closed —
Mongolia Yugozyr mine(Suhbaatar Province)
45 54 N 115 24 E Disseminated(?) — — — — WLFM, MLBD Closed —
Namibia Brandberg West (Omaruru District)
21 14 S 14 37 E Vein/stockwork Schist, quartzite; Damara system; LPROT.
MES Intracratonic Contact aureole of MES granite intrusion?
WLFM, CSTR, QRTZ
Ratio of WO
3
to Sn is approx. 1:2.
Pelletier (1964).
Namibia Krantzberg (Omaruru District)
21 24 S 16 01 E Vein/dissem-inated
Greisenized granite; Salem granite; LPROT. Biotite schist; Khomas series; LPROT.
MES Intracratonic Greisen zones related to MES granite.
WLFM, QRTZ, TOPZ, ORCL, MSCV, TRML, FLRT, PYTT, ARPR, CLCP, PYRT, MGNT, MLBD, BSMN
Ore zones are irregular lenses up to 100 m long by 100 m wide.
Haughton and others (1939).
Namibia Otjima 21 11 S 16 00 E Unknown Schist; marble PROT — — SCLT Total reserves with 3 percent CaWO
4
.—
North Korea
Changseong district(North P’yongan Province)
40 33 N 125 15 E Vein Metamorphic rocks CRET MES–CEN orogenic belt
CRET granite intrusion?
WLFM, SCLT, QRTZ
— Kim and Hwang (1983).
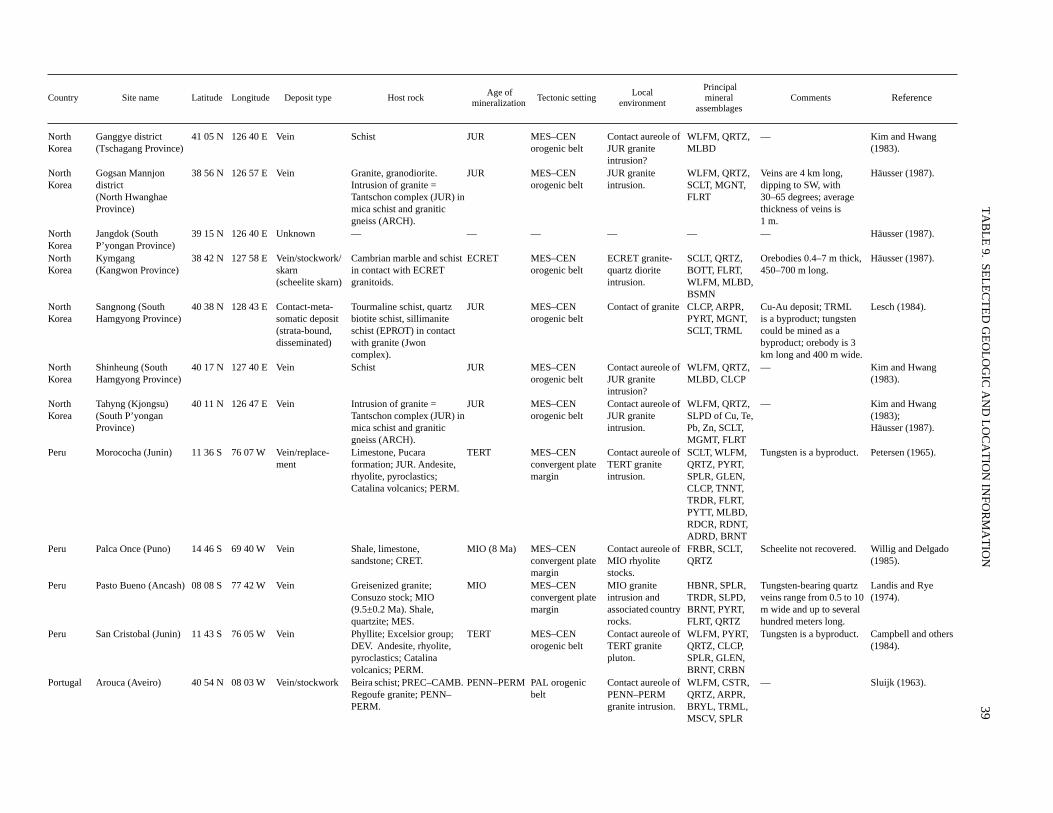
TA
BL
E 9.
SEL
EC
TE
D G
EO
LO
GIC
AN
D L
OC
AT
ION
INFO
RM
AT
ION
39
Country Site name Latitude Longitude Deposit type Host rock Age of
mineralizationTectonic setting
Localenvironment
Principalmineral
assemblagesComments
Reference
North Korea
Ganggye district (Tschagang Province)
41 05 N 126 40 E Vein Schist JUR MES–CEN orogenic belt
Contact aureole of JUR granite intrusion?
WLFM, QRTZ, MLBD
— Kim and Hwang (1983).
North Korea
Gogsan Mannjon district (North Hwanghae Province)
38 56 N 126 57 E Vein Granite, granodiorite. Intrusion of granite = Tantschon complex (JUR) in mica schist and granitic gneiss (ARCH).
JUR MES–CEN orogenic belt
JUR granite intrusion.
WLFM, QRTZ, SCLT, MGNT, FLRT
Veins are 4 km long, dipping to SW, with 30–65 degrees; average thickness of veins is 1 m.
Häusser (1987).
North Korea
Jangdok (South P’yongan Province)
39 15 N 126 40 E Unknown — — — — — — Häusser (1987).
North Korea
Kymgang(Kangwon Province)
38 42 N 127 58 E Vein/stockwork/ skarn (scheelite skarn)
Cambrian marble and schist in contact with ECRET granitoids.
ECRET MES–CEN orogenic belt
ECRET granite-quartz diorite intrusion.
SCLT, QRTZ, BOTT, FLRT, WLFM, MLBD, BSMN
Orebodies 0.4–7 m thick, 450–700 m long.
Häusser (1987).
North Korea
Sangnong (South Hamgyong Province)
40 38 N 128 43 E Contact-meta-somatic deposit (strata-bound, disseminated)
Tourmaline schist, quartz biotite schist, sillimanite schist (EPROT) in contact with granite (Jwon complex).
JUR MES–CEN orogenic belt
Contact of granite CLCP, ARPR, PYRT, MGNT, SCLT, TRML
Cu-Au deposit; TRML is a byproduct; tungsten could be mined as a byproduct; orebody is 3 km long and 400 m wide.
Lesch (1984).
North Korea
Shinheung (South Hamgyong Province)
40 17 N 127 40 E Vein Schist JUR MES–CEN orogenic belt
Contact aureole of JUR granite intrusion?
WLFM, QRTZ, MLBD, CLCP
— Kim and Hwang (1983).
North Korea
Tahyng (Kjongsu) (South P’yongan Province)
40 11 N 126 47 E Vein Intrusion of granite = Tantschon complex (JUR) in mica schist and granitic gneiss (ARCH).
JUR MES–CEN orogenic belt
Contact aureole of JUR granite intrusion.
WLFM, QRTZ, SLPD of Cu, Te, Pb, Zn, SCLT, MGMT, FLRT
— Kim and Hwang (1983);Häusser (1987).
Peru Morococha (Junin) 11 36 S 76 07 W Vein/replace-ment
Limestone, Pucara formation; JUR. Andesite, rhyolite, pyroclastics; Catalina volcanics; PERM.
TERT MES–CEN convergent plate margin
Contact aureole of TERT granite intrusion.
SCLT, WLFM, QRTZ, PYRT, SPLR, GLEN, CLCP, TNNT, TRDR, FLRT, PYTT, MLBD, RDCR, RDNT, ADRD, BRNT
Tungsten is a byproduct. Petersen (1965).
Peru Palca Once (Puno) 14 46 S 69 40 W Vein Shale, limestone, sandstone; CRET.
MIO (8 Ma) MES–CEN convergent plate margin
Contact aureole of MIO rhyolite stocks.
FRBR, SCLT, QRTZ
Scheelite not recovered. Willig and Delgado (1985).
Peru Pasto Bueno (Ancash) 08 08 S 77 42 W Vein Greisenized granite; Consuzo stock; MIO (9.5±0.2 Ma). Shale, quartzite; MES.
MIO MES–CEN convergent plate margin
MIO granite intrusion and associated country rocks.
HBNR, SPLR, TRDR, SLPD, BRNT, PYRT, FLRT, QRTZ
Tungsten-bearing quartz veins range from 0.5 to 10 m wide and up to several hundred meters long.
Landis and Rye (1974).
Peru San Cristobal (Junin) 11 43 S 76 05 W Vein Phyllite; Excelsior group; DEV. Andesite, rhyolite, pyroclastics; Catalina volcanics; PERM.
TERT MES–CEN orogenic belt
Contact aureole of TERT granite pluton.
WLFM, PYRT, QRTZ, CLCP, SPLR, GLEN, BRNT, CRBN
Tungsten is a byproduct. Campbell and others (1984).
Portugal Arouca (Aveiro) 40 54 N 08 03 W Vein/stockwork Beira schist; PREC–CAMB. Regoufe granite; PENN–PERM.
PENN–PERM PAL orogenic belt
Contact aureole of PENN–PERM granite intrusion.
WLFM, CSTR, QRTZ, ARPR, BRYL, TRML, MSCV, SPLR
— Sluijk (1963).
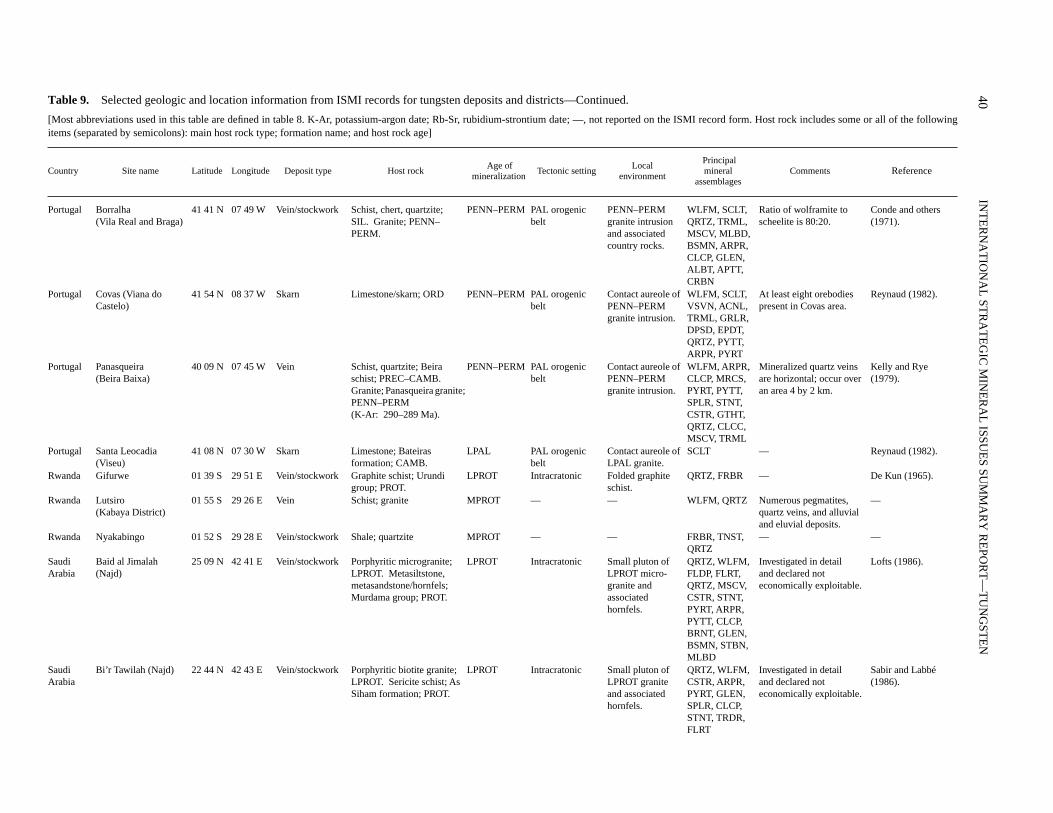
40
INT
ER
NA
TIO
NA
L ST
RA
TE
GIC
MIN
ER
AL
ISSUE
S SUM
MA
RY
RE
POR
T—
TU
NG
STE
N
Table 9.
Selected geologic and location information from ISMI records for tungsten deposits and districts—Continued.
[Most abbreviations used in this table are defined in table 8. K-Ar, potassium-argon date; Rb-Sr, rubidium-strontium date; —, not reported on the ISMI record form. Host rock includes some or all of the followingitems (separated by semicolons): main host rock type; formation name; and host rock age]
Country Site name Latitude Longitude Deposit type Host rock Age of
mineralizationTectonic setting
Localenvironment
Principalmineral
assemblagesComments
Reference
Portugal Borralha (Vila Real and Braga)
41 41 N 07 49 W Vein/stockwork Schist, chert, quartzite; SIL. Granite; PENN–PERM.
PENN–PERM PAL orogenic belt
PENN–PERM granite intrusion and associated country rocks.
WLFM, SCLT, QRTZ, TRML, MSCV, MLBD, BSMN, ARPR, CLCP, GLEN, ALBT, APTT, CRBN
Ratio of wolframite to scheelite is 80:20.
Conde and others (1971).
Portugal Covas (Viana do Castelo)
41 54 N 08 37 W Skarn Limestone/skarn; ORD PENN–PERM PAL orogenic belt
Contact aureole of PENN–PERM granite intrusion.
WLFM, SCLT, VSVN, ACNL, TRML, GRLR, DPSD, EPDT, QRTZ, PYTT, ARPR, PYRT
At least eight orebodies present in Covas area.
Reynaud (1982).
Portugal Panasqueira(Beira Baixa)
40 09 N 07 45 W Vein Schist, quartzite; Beira schist; PREC–CAMB. Granite; Panasqueira granite; PENN–PERM (K-Ar: 290–289 Ma).
PENN–PERM PAL orogenic belt
Contact aureole of PENN–PERM granite intrusion.
WLFM, ARPR, CLCP, MRCS, PYRT, PYTT, SPLR, STNT, CSTR, GTHT, QRTZ, CLCC, MSCV, TRML
Mineralized quartz veins are horizontal; occur over an area 4 by 2 km.
Kelly and Rye (1979).
Portugal Santa Leocadia (Viseu)
41 08 N 07 30 W Skarn Limestone; Bateiras formation; CAMB.
LPAL PAL orogenic belt
Contact aureole of LPAL granite.
SCLT — Reynaud (1982).
Rwanda Gifurwe 01 39 S 29 51 E Vein/stockwork Graphite schist; Urundi group; PROT.
LPROT Intracratonic Folded graphite schist.
QRTZ, FRBR — De Kun (1965).
Rwanda Lutsiro (Kabaya District)
01 55 S 29 26 E Vein Schist; granite MPROT — — WLFM, QRTZ Numerous pegmatites, quartz veins, and alluvial and eluvial deposits.
—
Rwanda Nyakabingo 01 52 S 29 28 E Vein/stockwork Shale; quartzite MPROT — — FRBR, TNST, QRTZ
— —
Saudi Arabia
Baid al Jimalah (Najd)
25 09 N 42 41 E Vein/stockwork Porphyritic microgranite; LPROT. Metasiltstone, metasandstone/hornfels; Murdama group; PROT.
LPROT Intracratonic Small pluton of LPROT micro-granite and associated hornfels.
QRTZ, WLFM, FLDP, FLRT, QRTZ, MSCV, CSTR, STNT, PYRT, ARPR, PYTT, CLCP, BRNT, GLEN, BSMN, STBN, MLBD
Investigated in detail and declared not economically exploitable.
Lofts (1986).
Saudi Arabia
Bi’r Tawilah (Najd) 22 44 N 42 43 E Vein/stockwork Porphyritic biotite granite; LPROT. Sericite schist; As Siham formation; PROT.
LPROT Intracratonic Small pluton of LPROT granite and associated hornfels.
QRTZ, WLFM, CSTR, ARPR, PYRT, GLEN, SPLR, CLCP, STNT, TRDR, FLRT
Investigated in detail and declared not economically exploitable.
Sabir and Labbé (1986).
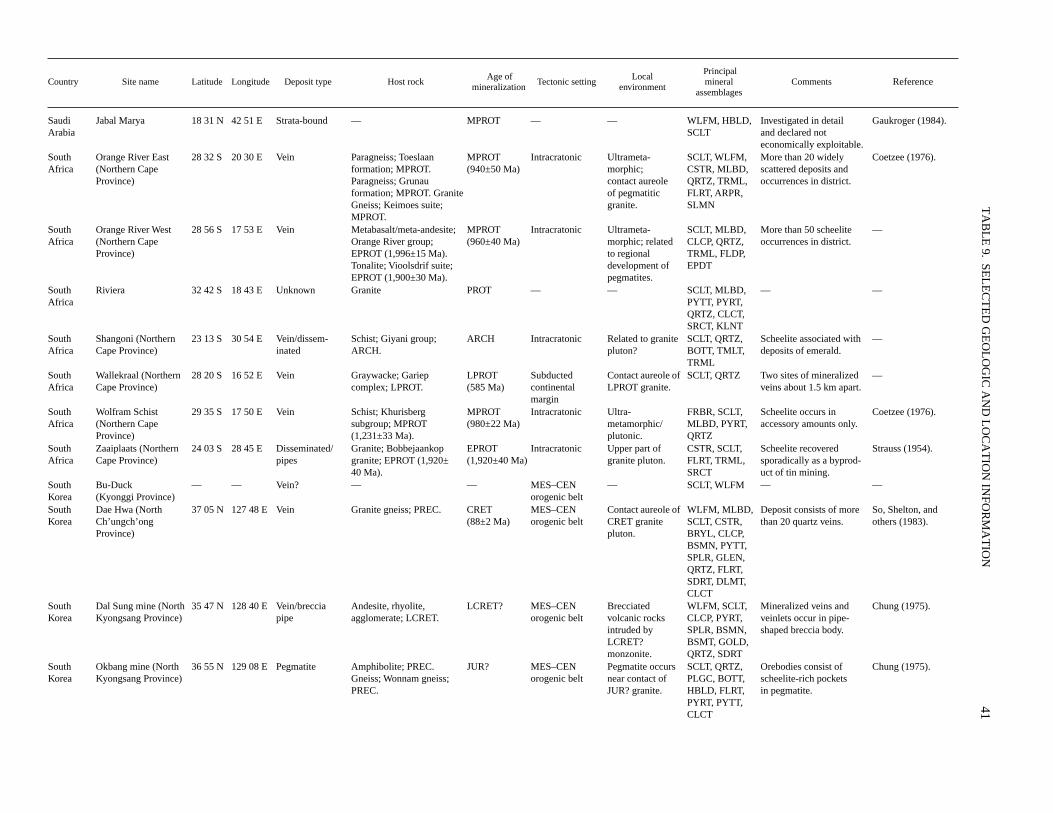
TA
BL
E 9.
SEL
EC
TE
D G
EO
LO
GIC
AN
D L
OC
AT
ION
INFO
RM
AT
ION
41
Country Site name Latitude Longitude Deposit type Host rock Age of
mineralizationTectonic setting
Localenvironment
Principalmineral
assemblagesComments
Reference
Saudi Arabia
Jabal Marya 18 31 N 42 51 E Strata-bound — MPROT — — WLFM, HBLD, SCLT
Investigated in detail and declared not economically exploitable.
Gaukroger (1984).
South Africa
Orange River East (Northern Cape Province)
28 32 S 20 30 E Vein Paragneiss; Toeslaan formation; MPROT. Paragneiss; Grunau formation; MPROT. Granite Gneiss; Keimoes suite; MPROT.
MPROT (940±50 Ma)
Intracratonic Ultrameta-morphic; contact aureole of pegmatitic granite.
SCLT, WLFM, CSTR, MLBD, QRTZ, TRML, FLRT, ARPR, SLMN
More than 20 widely scattered deposits and occurrences in district.
Coetzee (1976).
South Africa
Orange River West (Northern Cape Province)
28 56 S 17 53 E Vein Metabasalt/meta-andesite; Orange River group; EPROT (1,996±15 Ma). Tonalite; Vioolsdrif suite; EPROT (1,900±30 Ma).
MPROT (960±40 Ma)
Intracratonic Ultrameta-morphic; related to regional development of pegmatites.
SCLT, MLBD, CLCP, QRTZ, TRML, FLDP, EPDT
More than 50 scheelite occurrences in district.
—
South Africa
Riviera 32 42 S 18 43 E Unknown Granite PROT — — SCLT, MLBD, PYTT, PYRT, QRTZ, CLCT, SRCT, KLNT
— —
South Africa
Shangoni (Northern Cape Province)
23 13 S 30 54 E Vein/dissem-inated
Schist; Giyani group; ARCH.
ARCH Intracratonic Related to granite pluton?
SCLT, QRTZ, BOTT, TMLT, TRML
Scheelite associated with deposits of emerald.
—
South Africa
Wallekraal (Northern Cape Province)
28 20 S 16 52 E Vein Graywacke; Gariep complex; LPROT.
LPROT (585 Ma)
Subducted continental margin
Contact aureole of LPROT granite.
SCLT, QRTZ Two sites of mineralized veins about 1.5 km apart.
—
South Africa
Wolfram Schist (Northern Cape Province)
29 35 S 17 50 E Vein Schist; Khurisberg subgroup; MPROT (1,231±33 Ma).
MPROT (980±22 Ma)
Intracratonic Ultra-metamorphic/plutonic.
FRBR, SCLT, MLBD, PYRT, QRTZ
Scheelite occurs in accessory amounts only.
Coetzee (1976).
South Africa
Zaaiplaats (Northern Cape Province)
24 03 S 28 45 E Disseminated/pipes
Granite; Bobbejaankop granite; EPROT (1,920±40 Ma).
EPROT(1,920±40 Ma)
Intracratonic Upper part of granite pluton.
CSTR, SCLT, FLRT, TRML, SRCT
Scheelite recovered sporadically as a byprod-uct of tin mining.
Strauss (1954).
South Korea
Bu-Duck (Kyonggi Province)
— — Vein? — — MES–CEN orogenic belt
— SCLT, WLFM — —
South Korea
Dae Hwa (North Ch’ungch’ong Province)
37 05 N 127 48 E Vein Granite gneiss; PREC. CRET (88±2 Ma)
MES–CEN orogenic belt
Contact aureole of CRET granite pluton.
WLFM, MLBD, SCLT, CSTR, BRYL, CLCP, BSMN, PYTT, SPLR, GLEN, QRTZ, FLRT, SDRT, DLMT, CLCT
Deposit consists of more than 20 quartz veins.
So, Shelton, and others (1983).
South Korea
Dal Sung mine (North Kyongsang Province)
35 47 N 128 40 E Vein/breccia pipe
Andesite, rhyolite, agglomerate; LCRET.
LCRET? MES–CEN orogenic belt
Brecciated volcanic rocks intruded by LCRET? monzonite.
WLFM, SCLT, CLCP, PYRT, SPLR, BSMN, BSMT, GOLD, QRTZ, SDRT
Mineralized veins and veinlets occur in pipe-shaped breccia body.
Chung (1975).
South Korea
Okbang mine (North Kyongsang Province)
36 55 N 129 08 E Pegmatite Amphibolite; PREC. Gneiss; Wonnam gneiss; PREC.
JUR? MES–CEN orogenic belt
Pegmatite occurs near contact of JUR? granite.
SCLT, QRTZ, PLGC, BOTT, HBLD, FLRT, PYRT, PYTT, CLCT
Orebodies consist of scheelite-rich pockets in pegmatite.
Chung (1975).
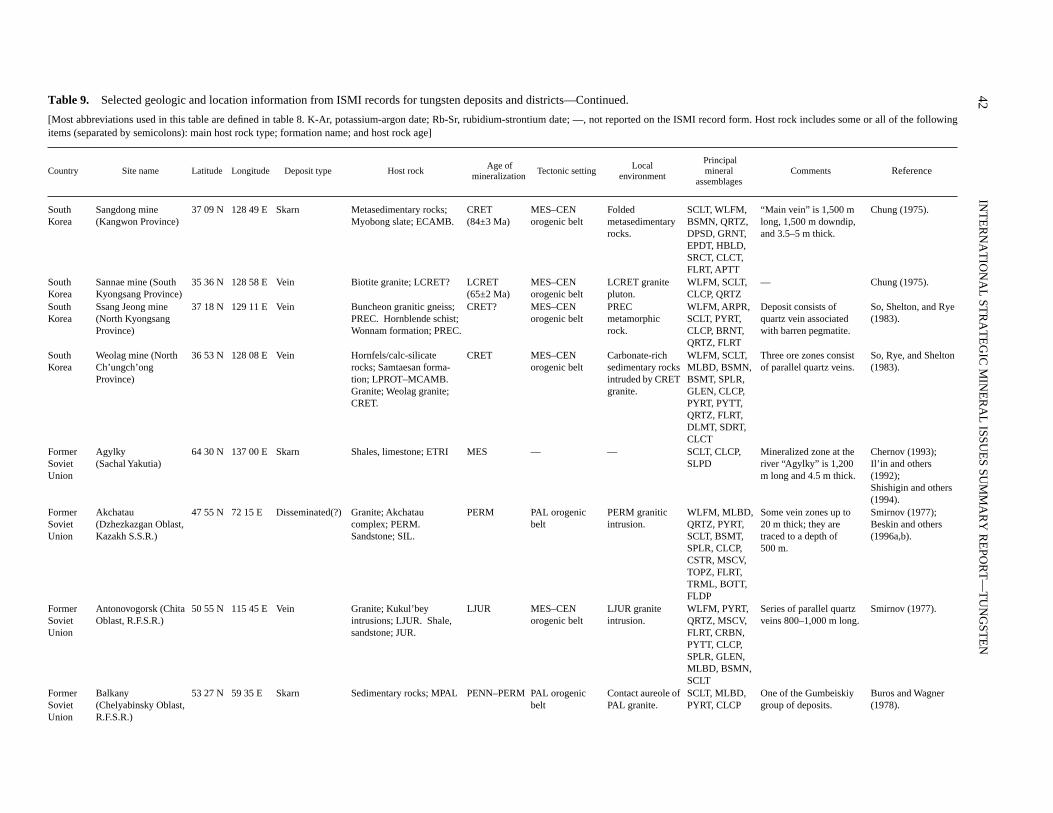
42
INT
ER
NA
TIO
NA
L ST
RA
TE
GIC
MIN
ER
AL
ISSUE
S SUM
MA
RY
RE
POR
T—
TU
NG
STE
N
Table 9.
Selected geologic and location information from ISMI records for tungsten deposits and districts—Continued.
[Most abbreviations used in this table are defined in table 8. K-Ar, potassium-argon date; Rb-Sr, rubidium-strontium date; —, not reported on the ISMI record form. Host rock includes some or all of the followingitems (separated by semicolons): main host rock type; formation name; and host rock age]
Country Site name Latitude Longitude Deposit type Host rock Age of
mineralizationTectonic setting
Localenvironment
Principalmineral
assemblagesComments
Reference
South Korea
Sangdong mine (Kangwon Province)
37 09 N 128 49 E Skarn Metasedimentary rocks; Myobong slate; ECAMB.
CRET(84±3 Ma)
MES–CEN orogenic belt
Folded metasedimentary rocks.
SCLT, WLFM, BSMN, QRTZ, DPSD, GRNT, EPDT, HBLD, SRCT, CLCT, FLRT, APTT
“Main vein” is 1,500 m long, 1,500 m downdip, and 3.5–5 m thick.
Chung (1975).
South Korea
Sannae mine (South Kyongsang Province)
35 36 N 128 58 E Vein Biotite granite; LCRET? LCRET (65±2 Ma)
MES–CEN orogenic belt
LCRET granite pluton.
WLFM, SCLT, CLCP, QRTZ
— Chung (1975).
South Korea
Ssang Jeong mine (North Kyongsang Province)
37 18 N 129 11 E Vein Buncheon granitic gneiss; PREC. Hornblende schist; Wonnam formation; PREC.
CRET? MES–CEN orogenic belt
PREC metamorphic rock.
WLFM, ARPR, SCLT, PYRT, CLCP, BRNT, QRTZ, FLRT
Deposit consists of quartz vein associated with barren pegmatite.
So, Shelton, and Rye (1983).
South Korea
Weolag mine (North Ch’ungch’ong Province)
36 53 N 128 08 E Vein Hornfels/calc-silicate rocks; Samtaesan forma-tion; LPROT–MCAMB. Granite; Weolag granite; CRET.
CRET MES–CEN orogenic belt
Carbonate-rich sedimentary rocks intruded by CRET granite.
WLFM, SCLT, MLBD, BSMN, BSMT, SPLR, GLEN, CLCP, PYRT, PYTT, QRTZ, FLRT, DLMT, SDRT, CLCT
Three ore zones consist of parallel quartz veins.
So, Rye, and Shelton (1983).
Former Soviet Union
Agylky (Sachal Yakutia)
64 30 N 137 00 E Skarn Shales, limestone; ETRI MES — — SCLT, CLCP, SLPD
Mineralized zone at the river “Agylky” is 1,200 m long and 4.5 m thick.
Chernov (1993);Il’in and others (1992);Shishigin and others (1994).
Former Soviet Union
Akchatau (Dzhezkazgan Oblast, Kazakh S.S.R.)
47 55 N 72 15 E Disseminated(?) Granite; Akchatau complex; PERM. Sandstone; SIL.
PERM PAL orogenic belt
PERM granitic intrusion.
WLFM, MLBD, QRTZ, PYRT, SCLT, BSMT, SPLR, CLCP, CSTR, MSCV, TOPZ, FLRT, TRML, BOTT, FLDP
Some vein zones up to 20 m thick; they are traced to a depth of 500 m.
Smirnov (1977);Beskin and others (1996a,b).
Former Soviet Union
Antonovogorsk (Chita Oblast, R.F.S.R.)
50 55 N 115 45 E Vein Granite; Kukul’bey intrusions; LJUR. Shale, sandstone; JUR.
LJUR MES–CEN orogenic belt
LJUR granite intrusion.
WLFM, PYRT, QRTZ, MSCV, FLRT, CRBN, PYTT, CLCP, SPLR, GLEN, MLBD, BSMN, SCLT
Series of parallel quartz veins 800–1,000 m long.
Smirnov (1977).
Former Soviet Union
Balkany (Chelyabinsky Oblast, R.F.S.R.)
53 27 N 59 35 E Skarn Sedimentary rocks; MPAL PENN–PERM PAL orogenic belt
Contact aureole of PAL granite.
SCLT, MLBD, PYRT, CLCP
One of the Gumbeiskiy group of deposits.
Buros and Wagner (1978).
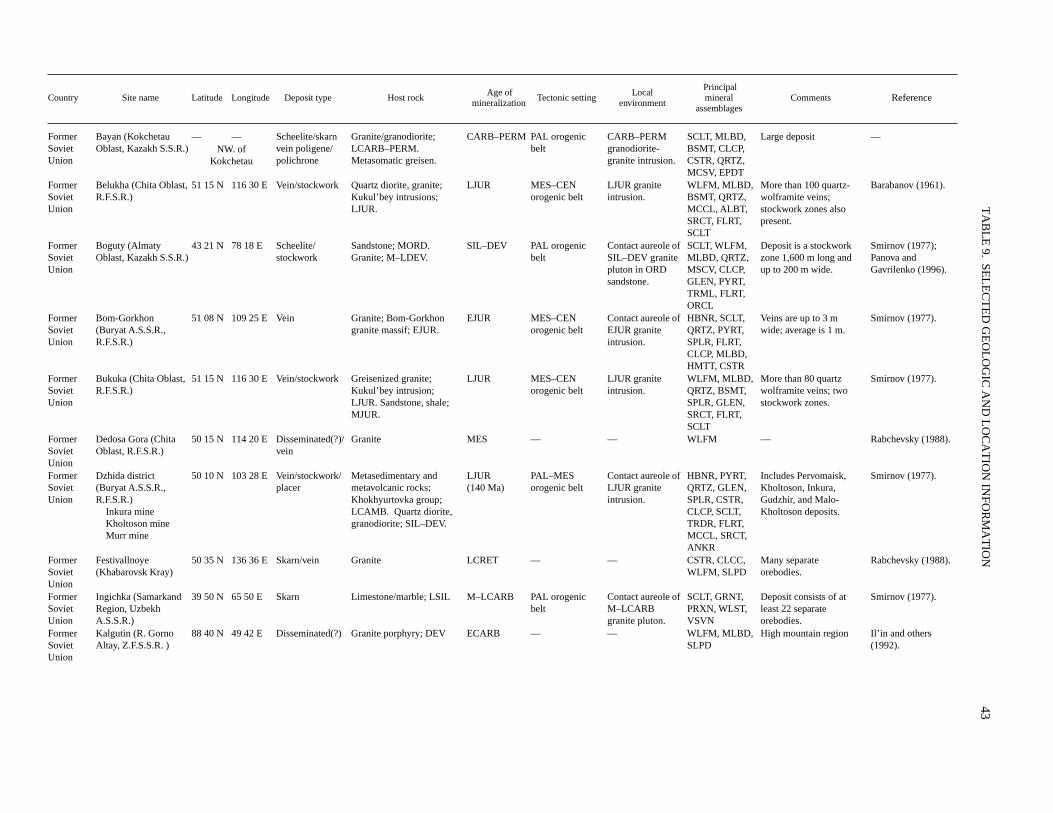
TA
BL
E 9.
SEL
EC
TE
D G
EO
LO
GIC
AN
D L
OC
AT
ION
INFO
RM
AT
ION
43
Country Site name Latitude Longitude Deposit type Host rock Age of
mineralizationTectonic setting
Localenvironment
Principalmineral
assemblagesComments
Reference
Former Soviet Union
Bayan (Kokchetau Oblast, Kazakh S.S.R.)
— — Scheelite/skarn vein poligene/polichrone
Granite/granodiorite; LCARB–PERM.Metasomatic greisen.
CARB–PERM PAL orogenic belt
CARB–PERM granodiorite-granite intrusion.
SCLT, MLBD, BSMT, CLCP, CSTR, QRTZ, MCSV, EPDT
Large deposit —NW. of
Kokchetau
Former Soviet Union
Belukha (Chita Oblast, R.F.S.R.)
51 15 N 116 30 E Vein/stockwork Quartz diorite, granite; Kukul’bey intrusions; LJUR.
LJUR MES–CEN orogenic belt
LJUR granite intrusion.
WLFM, MLBD, BSMT, QRTZ, MCCL, ALBT, SRCT, FLRT, SCLT
More than 100 quartz-wolframite veins; stockwork zones also present.
Barabanov (1961).
Former Soviet Union
Boguty (Almaty Oblast, Kazakh S.S.R.)
43 21 N 78 18 E Scheelite/stockwork
Sandstone; MORD. Granite; M–LDEV.
SIL–DEV PAL orogenic belt
Contact aureole of SIL–DEV granite pluton in ORD sandstone.
SCLT, WLFM, MLBD, QRTZ, MSCV, CLCP, GLEN, PYRT, TRML, FLRT, ORCL
Deposit is a stockwork zone 1,600 m long and up to 200 m wide.
Smirnov (1977);Panova and Gavrilenko (1996).
Former Soviet Union
Bom-Gorkhon (Buryat A.S.S.R., R.F.S.R.)
51 08 N 109 25 E Vein Granite; Bom-Gorkhon granite massif; EJUR.
EJUR MES–CEN orogenic belt
Contact aureole of EJUR granite intrusion.
HBNR, SCLT, QRTZ, PYRT, SPLR, FLRT, CLCP, MLBD, HMTT, CSTR
Veins are up to 3 m wide; average is 1 m.
Smirnov (1977).
Former Soviet Union
Bukuka (Chita Oblast, R.F.S.R.)
51 15 N 116 30 E Vein/stockwork Greisenized granite; Kukul’bey intrusion; LJUR. Sandstone, shale; MJUR.
LJUR MES–CEN orogenic belt
LJUR granite intrusion.
WLFM, MLBD, QRTZ, BSMT, SPLR, GLEN, SRCT, FLRT, SCLT
More than 80 quartz wolframite veins; two stockwork zones.
Smirnov (1977).
Former Soviet Union
Dedosa Gora (Chita Oblast, R.F.S.R.)
50 15 N 114 20 E Disseminated(?)/ vein
Granite MES — — WLFM — Rabchevsky (1988).
Former Soviet Union
Dzhida district (Buryat A.S.S.R., R.F.S.R.)
Inkura mineKholtoson mineMurr mine
50 10 N 103 28 E Vein/stockwork/placer
Metasedimentary and metavolcanic rocks; Khokhyurtovka group; LCAMB. Quartz diorite, granodiorite; SIL–DEV.
LJUR (140 Ma)
PAL–MES orogenic belt
Contact aureole of LJUR granite intrusion.
HBNR, PYRT, QRTZ, GLEN, SPLR, CSTR, CLCP, SCLT, TRDR, FLRT, MCCL, SRCT, ANKR
Includes Pervomaisk, Kholtoson, Inkura, Gudzhir, and Malo-Kholtoson deposits.
Smirnov (1977).
Former Soviet Union
Festivallnoye (Khabarovsk Kray)
50 35 N 136 36 E Skarn/vein Granite LCRET — — CSTR, CLCC, WLFM, SLPD
Many separate orebodies.
Rabchevsky (1988).
Former Soviet Union
Ingichka (Samarkand Region, Uzbekh A.S.S.R.)
39 50 N 65 50 E Skarn Limestone/marble; LSIL M–LCARB PAL orogenic belt
Contact aureole of M–LCARB granite pluton.
SCLT, GRNT, PRXN, WLST, VSVN
Deposit consists of at least 22 separate orebodies.
Smirnov (1977).
Former Soviet Union
Kalgutin (R. Gorno Altay, Z.F.S.S.R. )
88 40 N 49 42 E Disseminated(?) Granite porphyry; DEV ECARB — — WLFM, MLBD, SLPD
High mountain region Il’in and others (1992).
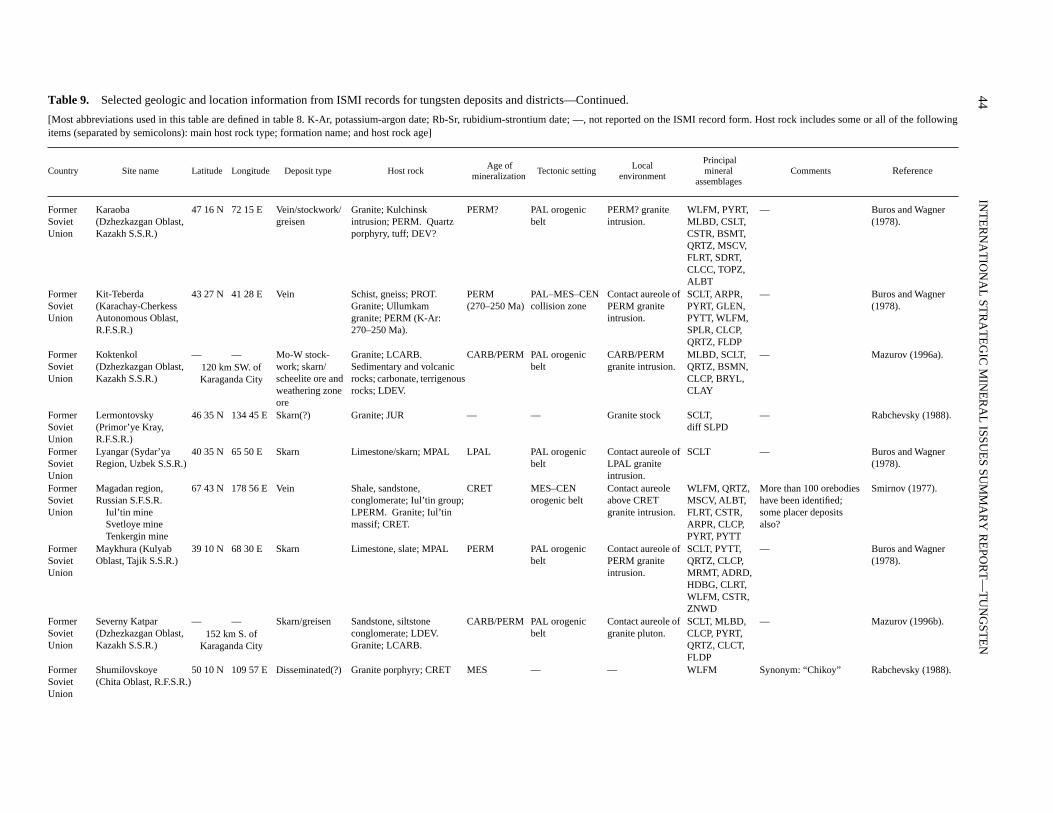
44
INT
ER
NA
TIO
NA
L ST
RA
TE
GIC
MIN
ER
AL
ISSUE
S SUM
MA
RY
RE
POR
T—
TU
NG
STE
N
Table 9.
Selected geologic and location information from ISMI records for tungsten deposits and districts—Continued.
[Most abbreviations used in this table are defined in table 8. K-Ar, potassium-argon date; Rb-Sr, rubidium-strontium date; —, not reported on the ISMI record form. Host rock includes some or all of the followingitems (separated by semicolons): main host rock type; formation name; and host rock age]
Country Site name Latitude Longitude Deposit type Host rock Age of
mineralizationTectonic setting
Localenvironment
Principalmineral
assemblagesComments
Reference
Former Soviet Union
Karaoba (Dzhezkazgan Oblast, Kazakh S.S.R.)
47 16 N 72 15 E Vein/stockwork/greisen
Granite; Kulchinsk intrusion; PERM. Quartz porphyry, tuff; DEV?
PERM? PAL orogenic belt
PERM? granite intrusion.
WLFM, PYRT, MLBD, CSLT, CSTR, BSMT, QRTZ, MSCV, FLRT, SDRT, CLCC, TOPZ, ALBT
— Buros and Wagner (1978).
Former Soviet Union
Kit-Teberda (Karachay-Cherkess Autonomous Oblast, R.F.S.R.)
43 27 N 41 28 E Vein Schist, gneiss; PROT. Granite; Ullumkam granite; PERM (K-Ar: 270–250 Ma).
PERM(270–250 Ma)
PAL–MES–CEN collision zone
Contact aureole of PERM granite intrusion.
SCLT, ARPR, PYRT, GLEN, PYTT, WLFM, SPLR, CLCP, QRTZ, FLDP
— Buros and Wagner (1978).
Former Soviet Union
Koktenkol (Dzhezkazgan Oblast, Kazakh S.S.R.)
— — Mo-W stock-work; skarn/scheelite ore and weathering zone ore
Granite; LCARB. Sedimentary and volcanic rocks; carbonate, terrigenous rocks; LDEV.
CARB/PERM PAL orogenic belt
CARB/PERM granite intrusion.
MLBD, SCLT, QRTZ, BSMN, CLCP, BRYL, CLAY
— Mazurov (1996a).120 km SW. of Karaganda City
Former Soviet Union
Lermontovsky (Primor’ye Kray, R.F.S.R.)
46 35 N 134 45 E Skarn(?) Granite; JUR — — Granite stock SCLT, diff SLPD
— Rabchevsky (1988).
Former Soviet Union
Lyangar (Sydar’ya Region, Uzbek S.S.R.)
40 35 N 65 50 E Skarn Limestone/skarn; MPAL LPAL PAL orogenic belt
Contact aureole of LPAL granite intrusion.
SCLT — Buros and Wagner (1978).
Former Soviet Union
Magadan region, Russian S.F.S.R.
Iul’tin mineSvetloye mineTenkergin mine
67 43 N 178 56 E Vein Shale, sandstone, conglomerate; Iul’tin group; LPERM. Granite; Iul’tin massif; CRET.
CRET MES–CEN orogenic belt
Contact aureole above CRET granite intrusion.
WLFM, QRTZ, MSCV, ALBT, FLRT, CSTR, ARPR, CLCP, PYRT, PYTT
More than 100 orebodies have been identified; some placer deposits also?
Smirnov (1977).
Former Soviet Union
Maykhura (Kulyab Oblast, Tajik S.S.R.)
39 10 N 68 30 E Skarn Limestone, slate; MPAL PERM PAL orogenic belt
Contact aureole of PERM granite intrusion.
SCLT, PYTT, QRTZ, CLCP, MRMT, ADRD, HDBG, CLRT, WLFM, CSTR, ZNWD
— Buros and Wagner (1978).
Former Soviet Union
Severny Katpar (Dzhezkazgan Oblast, Kazakh S.S.R.)
— — Skarn/greisen Sandstone, siltstone conglomerate; LDEV. Granite; LCARB.
CARB/PERM PAL orogenic belt
Contact aureole of granite pluton.
SCLT, MLBD, CLCP, PYRT, QRTZ, CLCT, FLDP
— Mazurov (1996b).152 km S. of
Karaganda City
Former Soviet Union
Shumilovskoye (Chita Oblast, R.F.S.R.)
50 10 N 109 57 E Disseminated(?) Granite porphyry; CRET MES — — WLFM Synonym: “Chikoy” Rabchevsky (1988).
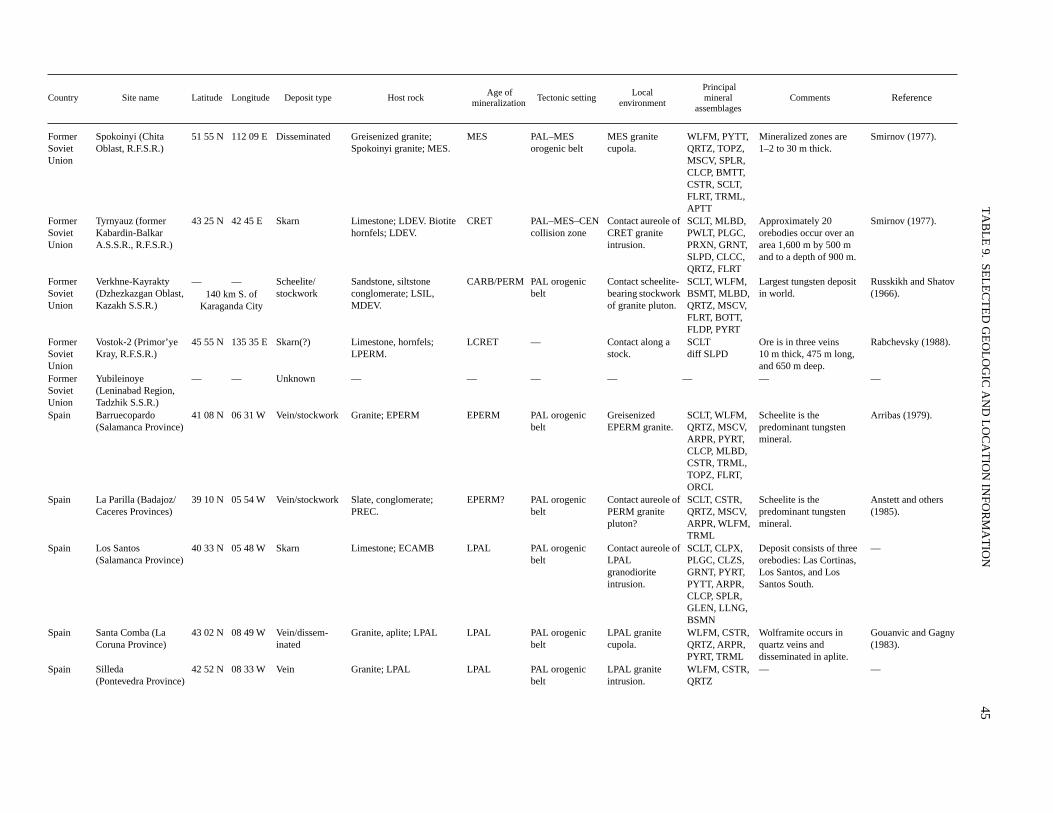
TA
BL
E 9.
SEL
EC
TE
D G
EO
LO
GIC
AN
D L
OC
AT
ION
INFO
RM
AT
ION
45
Country Site name Latitude Longitude Deposit type Host rock Age of
mineralizationTectonic setting
Localenvironment
Principalmineral
assemblagesComments
Reference
Former Soviet Union
Spokoinyi (Chita Oblast, R.F.S.R.)
51 55 N 112 09 E Disseminated Greisenized granite; Spokoinyi granite; MES.
MES PAL–MES orogenic belt
MES granite cupola.
WLFM, PYTT, QRTZ, TOPZ, MSCV, SPLR, CLCP, BMTT, CSTR, SCLT, FLRT, TRML, APTT
Mineralized zones are 1–2 to 30 m thick.
Smirnov (1977).
Former Soviet Union
Tyrnyauz (former Kabardin-Balkar A.S.S.R., R.F.S.R.)
43 25 N 42 45 E Skarn Limestone; LDEV. Biotite hornfels; LDEV.
CRET PAL–MES–CEN collision zone
Contact aureole of CRET granite intrusion.
SCLT, MLBD, PWLT, PLGC, PRXN, GRNT, SLPD, CLCC, QRTZ, FLRT
Approximately 20 orebodies occur over an area 1,600 m by 500 m and to a depth of 900 m.
Smirnov (1977).
Former Soviet Union
Verkhne-Kayrakty (Dzhezkazgan Oblast, Kazakh S.S.R.)
— — Scheelite/stockwork
Sandstone, siltstone conglomerate; LSIL, MDEV.
CARB/PERM PAL orogenic belt
Contact scheelite-bearing stockwork of granite pluton.
SCLT, WLFM, BSMT, MLBD, QRTZ, MSCV, FLRT, BOTT, FLDP, PYRT
Largest tungsten deposit in world.
Russkikh and Shatov (1966).140 km S. of
Karaganda City
Former Soviet Union
Vostok-2 (Primor’ye Kray, R.F.S.R.)
45 55 N 135 35 E Skarn(?) Limestone, hornfels; LPERM.
LCRET — Contact along a stock.
SCLT diff SLPD
Ore is in three veins 10 m thick, 475 m long, and 650 m deep.
Rabchevsky (1988).
Former Soviet Union
Yubileinoye (Leninabad Region, Tadzhik S.S.R.)
— — Unknown — — — — — — —
Spain Barruecopardo (Salamanca Province)
41 08 N 06 31 W Vein/stockwork Granite; EPERM EPERM PAL orogenic belt
Greisenized EPERM granite.
SCLT, WLFM, QRTZ, MSCV, ARPR, PYRT, CLCP, MLBD, CSTR, TRML, TOPZ, FLRT, ORCL
Scheelite is the predominant tungsten mineral.
Arribas (1979).
Spain La Parilla (Badajoz/ Caceres Provinces)
39 10 N 05 54 W Vein/stockwork Slate, conglomerate; PREC.
EPERM? PAL orogenic belt
Contact aureole of PERM granite pluton?
SCLT, CSTR, QRTZ, MSCV, ARPR, WLFM, TRML
Scheelite is the predominant tungsten mineral.
Anstett and others (1985).
Spain Los Santos(Salamanca Province)
40 33 N 05 48 W Skarn Limestone; ECAMB LPAL PAL orogenic belt
Contact aureole of LPAL granodiorite intrusion.
SCLT, CLPX, PLGC, CLZS, GRNT, PYRT, PYTT, ARPR, CLCP, SPLR, GLEN, LLNG, BSMN
Deposit consists of three orebodies: Las Cortinas, Los Santos, and Los Santos South.
—
Spain Santa Comba (La Coruna Province)
43 02 N 08 49 W Vein/dissem-inated
Granite, aplite; LPAL LPAL PAL orogenic belt
LPAL granite cupola.
WLFM, CSTR, QRTZ, ARPR, PYRT, TRML
Wolframite occurs in quartz veins and disseminated in aplite.
Gouanvic and Gagny (1983).
Spain Silleda (Pontevedra Province)
42 52 N 08 33 W Vein Granite; LPAL LPAL PAL orogenic belt
LPAL granite intrusion.
WLFM, CSTR, QRTZ
— —
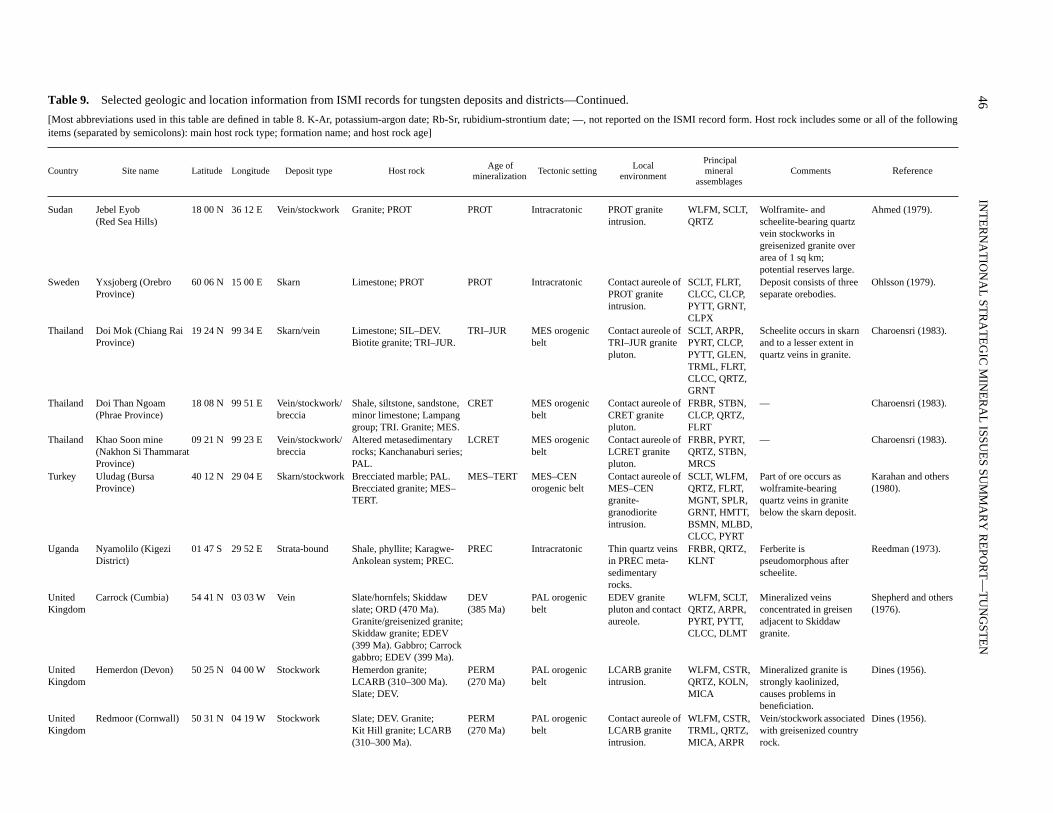
46
INT
ER
NA
TIO
NA
L ST
RA
TE
GIC
MIN
ER
AL
ISSUE
S SUM
MA
RY
RE
POR
T—
TU
NG
STE
N
Table 9.
Selected geologic and location information from ISMI records for tungsten deposits and districts—Continued.
[Most abbreviations used in this table are defined in table 8. K-Ar, potassium-argon date; Rb-Sr, rubidium-strontium date; —, not reported on the ISMI record form. Host rock includes some or all of the followingitems (separated by semicolons): main host rock type; formation name; and host rock age]
Country Site name Latitude Longitude Deposit type Host rock Age of
mineralizationTectonic setting
Localenvironment
Principalmineral
assemblagesComments
Reference
Sudan Jebel Eyob (Red Sea Hills)
18 00 N 36 12 E Vein/stockwork Granite; PROT PROT Intracratonic PROT granite intrusion.
WLFM, SCLT, QRTZ
Wolframite- and scheelite-bearing quartz vein stockworks in greisenized granite over area of 1 sq km; potential reserves large.
Ahmed (1979).
Sweden Yxsjoberg (Orebro Province)
60 06 N 15 00 E Skarn Limestone; PROT PROT Intracratonic Contact aureole of PROT granite intrusion.
SCLT, FLRT, CLCC, CLCP, PYTT, GRNT, CLPX
Deposit consists of three separate orebodies.
Ohlsson (1979).
Thailand Doi Mok (Chiang Rai Province)
19 24 N 99 34 E Skarn/vein Limestone; SIL–DEV. Biotite granite; TRI–JUR.
TRI–JUR MES orogenic belt
Contact aureole of TRI–JUR granite pluton.
SCLT, ARPR, PYRT, CLCP, PYTT, GLEN, TRML, FLRT, CLCC, QRTZ, GRNT
Scheelite occurs in skarn and to a lesser extent in quartz veins in granite.
Charoensri (1983).
Thailand Doi Than Ngoam(Phrae Province)
18 08 N 99 51 E Vein/stockwork/breccia
Shale, siltstone, sandstone, minor limestone; Lampang group; TRI. Granite; MES.
CRET MES orogenic belt
Contact aureole of CRET granite pluton.
FRBR, STBN, CLCP, QRTZ, FLRT
— Charoensri (1983).
Thailand Khao Soon mine (Nakhon Si Thammarat Province)
09 21 N 99 23 E Vein/stockwork/breccia
Altered metasedimentary rocks; Kanchanaburi series; PAL.
LCRET MES orogenic belt
Contact aureole of LCRET granite pluton.
FRBR, PYRT, QRTZ, STBN, MRCS
— Charoensri (1983).
Turkey Uludag (Bursa Province)
40 12 N 29 04 E Skarn/stockwork Brecciated marble; PAL. Brecciated granite; MES–TERT.
MES–TERT MES–CEN orogenic belt
Contact aureole of MES–CEN granite-granodiorite intrusion.
SCLT, WLFM, QRTZ, FLRT, MGNT, SPLR, GRNT, HMTT, BSMN, MLBD, CLCC, PYRT
Part of ore occurs as wolframite-bearing quartz veins in granite below the skarn deposit.
Karahan and others (1980).
Uganda Nyamolilo (Kigezi District)
01 47 S 29 52 E Strata-bound Shale, phyllite; Karagwe-Ankolean system; PREC.
PREC Intracratonic Thin quartz veins in PREC meta-sedimentary rocks.
FRBR, QRTZ, KLNT
Ferberite is pseudomorphous after scheelite.
Reedman (1973).
United Kingdom
Carrock (Cumbia) 54 41 N 03 03 W Vein Slate/hornfels; Skiddaw slate; ORD (470 Ma). Granite/greisenized granite; Skiddaw granite; EDEV (399 Ma). Gabbro; Carrock gabbro; EDEV (399 Ma).
DEV (385 Ma)
PAL orogenic belt
EDEV granite pluton and contact aureole.
WLFM, SCLT, QRTZ, ARPR, PYRT, PYTT, CLCC, DLMT
Mineralized veins concentrated in greisen adjacent to Skiddaw granite.
Shepherd and others (1976).
United Kingdom
Hemerdon (Devon) 50 25 N 04 00 W Stockwork Hemerdon granite; LCARB (310–300 Ma). Slate; DEV.
PERM (270 Ma)
PAL orogenic belt
LCARB granite intrusion.
WLFM, CSTR, QRTZ, KOLN, MICA
Mineralized granite is strongly kaolinized, causes problems in beneficiation.
Dines (1956).
United Kingdom
Redmoor (Cornwall) 50 31 N 04 19 W Stockwork Slate; DEV. Granite; Kit Hill granite; LCARB (310–300 Ma).
PERM(270 Ma)
PAL orogenic belt
Contact aureole of LCARB granite intrusion.
WLFM, CSTR, TRML, QRTZ, MICA, ARPR
Vein/stockwork associated with greisenized country rock.
Dines (1956).
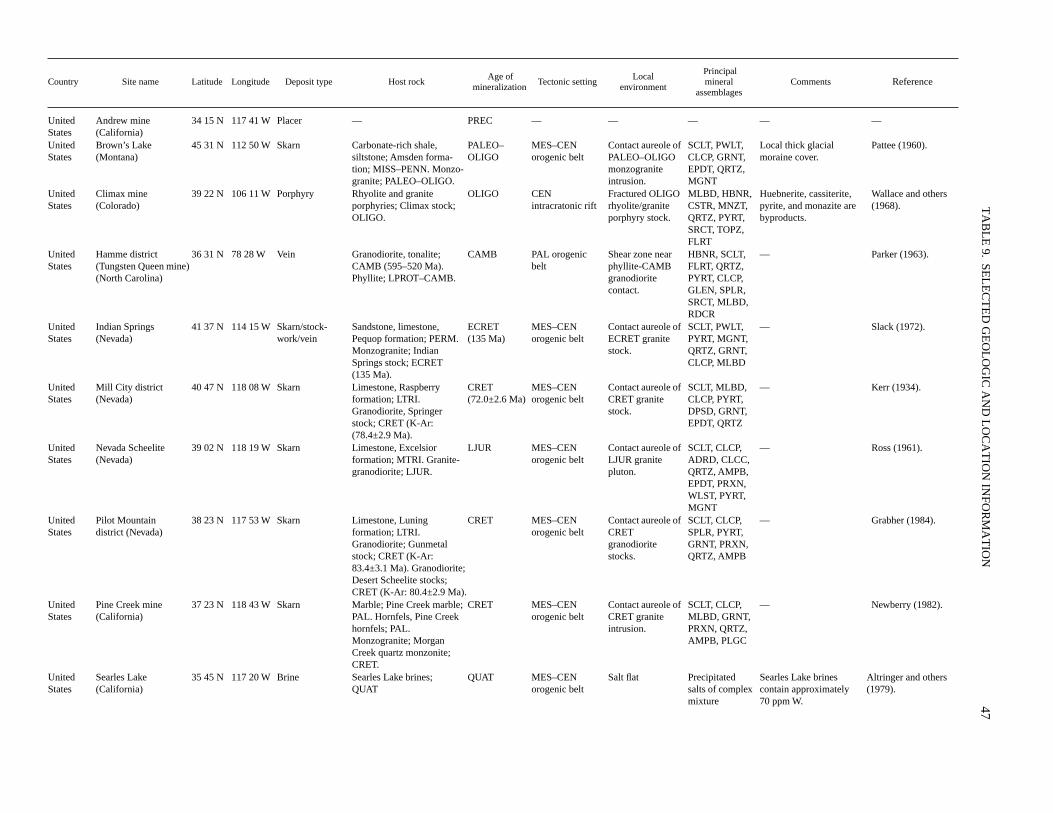
TA
BL
E 9.
SEL
EC
TE
D G
EO
LO
GIC
AN
D L
OC
AT
ION
INFO
RM
AT
ION
47
Country Site name Latitude Longitude Deposit type Host rock Age of
mineralizationTectonic setting
Localenvironment
Principalmineral
assemblagesComments
Reference
United States
Andrew mine (California)
34 15 N 117 41 W Placer — PREC — — — — —
United States
Brown’s Lake (Montana)
45 31 N 112 50 W Skarn Carbonate-rich shale, siltstone; Amsden forma-tion; MISS–PENN. Monzo-granite; PALEO–OLIGO.
PALEO–OLIGO
MES–CEN orogenic belt
Contact aureole of PALEO–OLIGO monzogranite intrusion.
SCLT, PWLT, CLCP, GRNT, EPDT, QRTZ, MGNT
Local thick glacial moraine cover.
Pattee (1960).
United States
Climax mine (Colorado)
39 22 N 106 11 W Porphyry Rhyolite and granite porphyries; Climax stock; OLIGO.
OLIGO CEN intracratonic rift
Fractured OLIGO rhyolite/granite porphyry stock.
MLBD, HBNR, CSTR, MNZT, QRTZ, PYRT, SRCT, TOPZ, FLRT
Huebnerite, cassiterite, pyrite, and monazite are byproducts.
Wallace and others (1968).
United States
Hamme district (Tungsten Queen mine) (North Carolina)
36 31 N 78 28 W Vein Granodiorite, tonalite; CAMB (595–520 Ma). Phyllite; LPROT–CAMB.
CAMB PAL orogenic belt
Shear zone near phyllite-CAMB granodiorite contact.
HBNR, SCLT, FLRT, QRTZ, PYRT, CLCP, GLEN, SPLR, SRCT, MLBD, RDCR
— Parker (1963).
United States
Indian Springs (Nevada)
41 37 N 114 15 W Skarn/stock-work/vein
Sandstone, limestone, Pequop formation; PERM. Monzogranite; Indian Springs stock; ECRET (135 Ma).
ECRET (135 Ma)
MES–CEN orogenic belt
Contact aureole of ECRET granite stock.
SCLT, PWLT, PYRT, MGNT,QRTZ, GRNT, CLCP, MLBD
— Slack (1972).
United States
Mill City district (Nevada)
40 47 N 118 08 W Skarn Limestone, Raspberry formation; LTRI. Granodiorite, Springer stock; CRET (K-Ar: (78.4±2.9 Ma).
CRET(72.0±2.6 Ma)
MES–CEN orogenic belt
Contact aureole of CRET granite stock.
SCLT, MLBD, CLCP, PYRT, DPSD, GRNT, EPDT, QRTZ
— Kerr (1934).
United States
Nevada Scheelite (Nevada)
39 02 N 118 19 W Skarn Limestone, Excelsior formation; MTRI. Granite-granodiorite; LJUR.
LJUR MES–CEN orogenic belt
Contact aureole of LJUR granite pluton.
SCLT, CLCP, ADRD, CLCC, QRTZ, AMPB, EPDT, PRXN, WLST, PYRT, MGNT
— Ross (1961).
United States
Pilot Mountain district (Nevada)
38 23 N 117 53 W Skarn Limestone, Luning formation; LTRI. Granodiorite; Gunmetal stock; CRET (K-Ar: 83.4±3.1 Ma). Granodiorite; Desert Scheelite stocks; CRET (K-Ar: 80.4±2.9 Ma).
CRET MES–CEN orogenic belt
Contact aureole of CRET granodiorite stocks.
SCLT, CLCP, SPLR, PYRT, GRNT, PRXN, QRTZ, AMPB
— Grabher (1984).
United States
Pine Creek mine (California)
37 23 N 118 43 W Skarn Marble; Pine Creek marble; PAL. Hornfels, Pine Creek hornfels; PAL. Monzogranite; Morgan Creek quartz monzonite; CRET.
CRET MES–CEN orogenic belt
Contact aureole of CRET granite intrusion.
SCLT, CLCP, MLBD, GRNT, PRXN, QRTZ, AMPB, PLGC
— Newberry (1982).
United States
Searles Lake (California)
35 45 N 117 20 W Brine Searles Lake brines; QUAT
QUAT MES–CEN orogenic belt
Salt flat Precipitated salts of complex mixture
Searles Lake brines contain approximately 70 ppm W.
Altringer and others (1979).
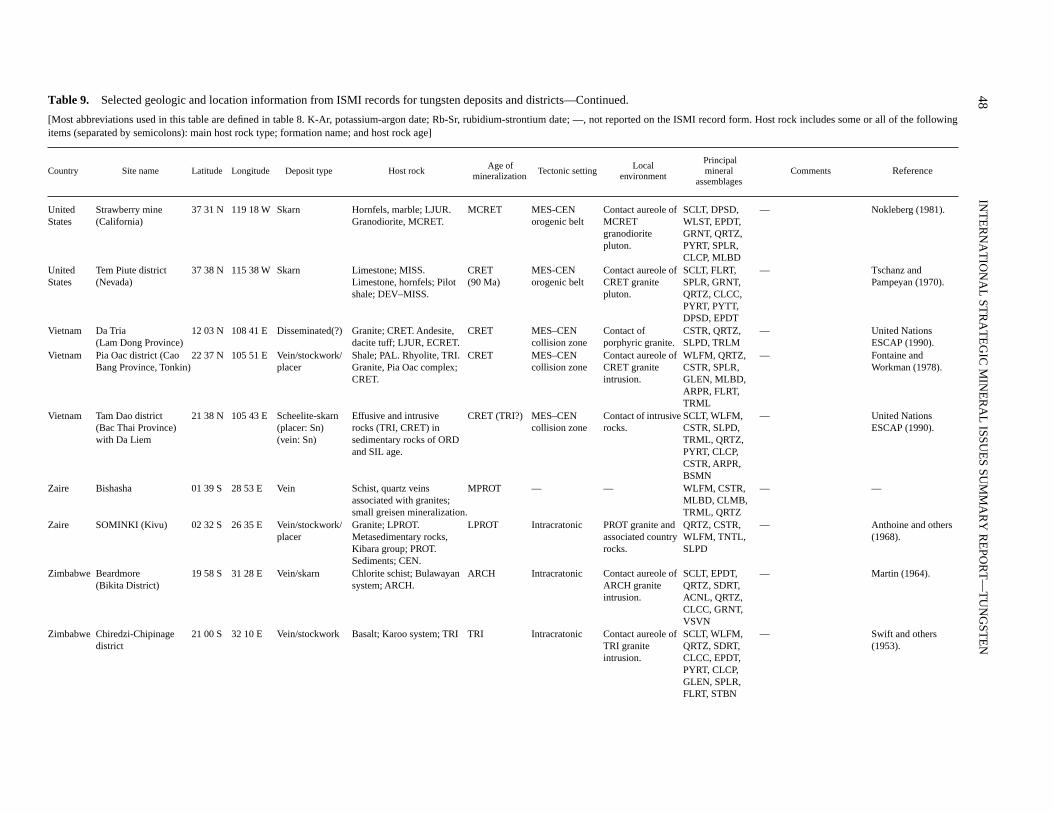
48
INT
ER
NA
TIO
NA
L ST
RA
TE
GIC
MIN
ER
AL
ISSUE
S SUM
MA
RY
RE
POR
T—
TU
NG
STE
N
Table 9.
Selected geologic and location information from ISMI records for tungsten deposits and districts—Continued.
[Most abbreviations used in this table are defined in table 8. K-Ar, potassium-argon date; Rb-Sr, rubidium-strontium date; —, not reported on the ISMI record form. Host rock includes some or all of the followingitems (separated by semicolons): main host rock type; formation name; and host rock age]
Country Site name Latitude Longitude Deposit type Host rock Age of
mineralizationTectonic setting
Localenvironment
Principalmineral
assemblagesComments
Reference
United States
Strawberry mine (California)
37 31 N 119 18 W Skarn Hornfels, marble; LJUR. Granodiorite, MCRET.
MCRET MES-CEN orogenic belt
Contact aureole of MCRET granodioritepluton.
SCLT, DPSD, WLST, EPDT, GRNT, QRTZ, PYRT, SPLR, CLCP, MLBD
— Nokleberg (1981).
United States
Tem Piute district (Nevada)
37 38 N 115 38 W Skarn Limestone; MISS. Limestone, hornfels; Pilot shale; DEV–MISS.
CRET(90 Ma)
MES-CEN orogenic belt
Contact aureole of CRET granite pluton.
SCLT, FLRT, SPLR, GRNT, QRTZ, CLCC, PYRT, PYTT, DPSD, EPDT
— Tschanz and Pampeyan (1970).
Vietnam Da Tria(Lam Dong Province)
12 03 N 108 41 E Disseminated(?) Granite; CRET. Andesite, dacite tuff; LJUR, ECRET.
CRET MES–CEN collision zone
Contact of porphyric granite.
CSTR, QRTZ, SLPD, TRLM
— United Nations ESCAP (1990).
Vietnam Pia Oac district (Cao Bang Province, Tonkin)
22 37 N 105 51 E Vein/stockwork/placer
Shale; PAL. Rhyolite, TRI. Granite, Pia Oac complex; CRET.
CRET MES–CEN collision zone
Contact aureole of CRET granite intrusion.
WLFM, QRTZ, CSTR, SPLR, GLEN, MLBD, ARPR, FLRT, TRML
— Fontaine and Workman (1978).
Vietnam Tam Dao district (Bac Thai Province) with Da Liem
21 38 N 105 43 E Scheelite-skarn (placer: Sn) (vein: Sn)
Effusive and intrusive rocks (TRI, CRET) in sedimentary rocks of ORD and SIL age.
CRET (TRI?) MES–CEN collision zone
Contact of intrusive rocks.
SCLT, WLFM, CSTR, SLPD, TRML, QRTZ, PYRT, CLCP, CSTR, ARPR, BSMN
— United Nations ESCAP (1990).
Zaire Bishasha 01 39 S 28 53 E Vein Schist, quartz veins associated with granites; small greisen mineralization.
MPROT — — WLFM, CSTR, MLBD, CLMB, TRML, QRTZ
— —
Zaire SOMINKI (Kivu) 02 32 S 26 35 E Vein/stockwork/placer
Granite; LPROT. Metasedimentary rocks, Kibara group; PROT. Sediments; CEN.
LPROT Intracratonic PROT granite and associated country rocks.
QRTZ, CSTR, WLFM, TNTL, SLPD
— Anthoine and others (1968).
Zimbabwe Beardmore (Bikita District)
19 58 S 31 28 E Vein/skarn Chlorite schist; Bulawayan system; ARCH.
ARCH Intracratonic Contact aureole of ARCH granite intrusion.
SCLT, EPDT, QRTZ, SDRT, ACNL, QRTZ, CLCC, GRNT, VSVN
— Martin (1964).
Zimbabwe Chiredzi-Chipinage district
21 00 S 32 10 E Vein/stockwork Basalt; Karoo system; TRI TRI Intracratonic Contact aureole of TRI granite intrusion.
SCLT, WLFM, QRTZ, SDRT, CLCC, EPDT, PYRT, CLCP, GLEN, SPLR, FLRT, STBN
— Swift and others (1953).
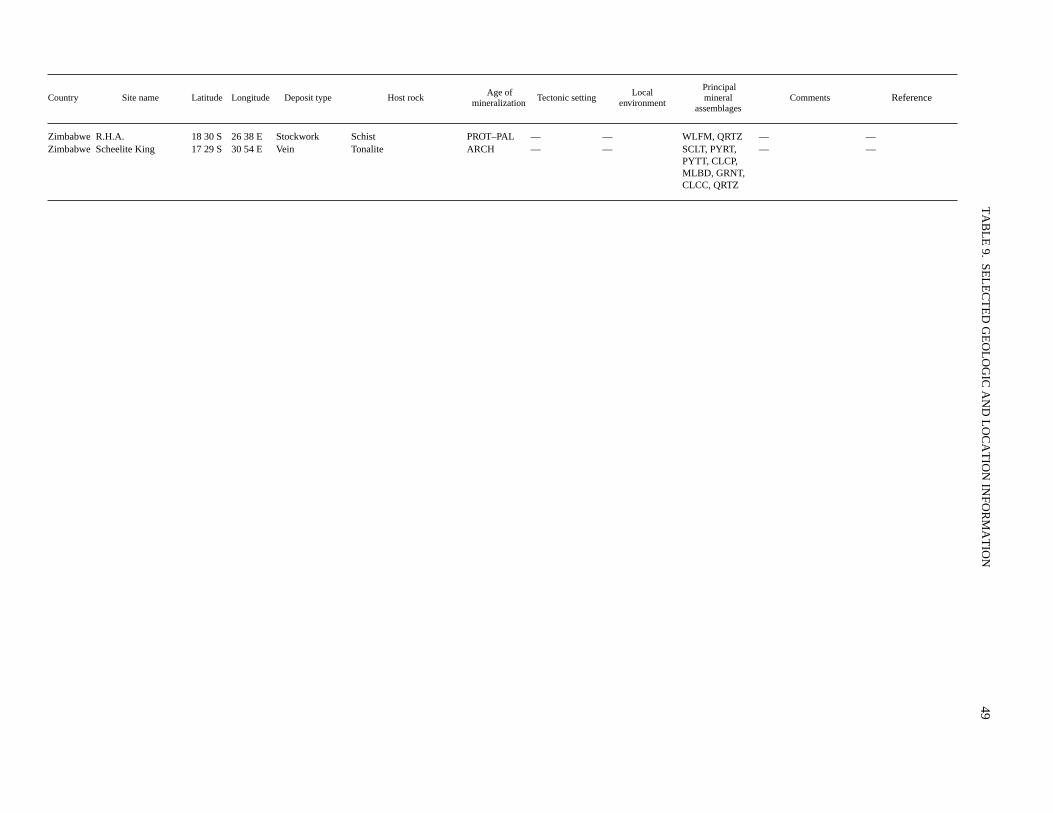
TA
BL
E 9.
SEL
EC
TE
D G
EO
LO
GIC
AN
D L
OC
AT
ION
INFO
RM
AT
ION
49
Country Site name Latitude Longitude Deposit type Host rock Age of
mineralizationTectonic setting
Localenvironment
Principalmineral
assemblagesComments
Reference
Zimbabwe R.H.A. 18 30 S 26 38 E Stockwork Schist PROT–PAL — — WLFM, QRTZ — —Zimbabwe Scheelite King 17 29 S 30 54 E Vein Tonalite ARCH — — SCLT, PYRT,
PYTT, CLCP, MLBD, GRNT, CLCC, QRTZ
— —
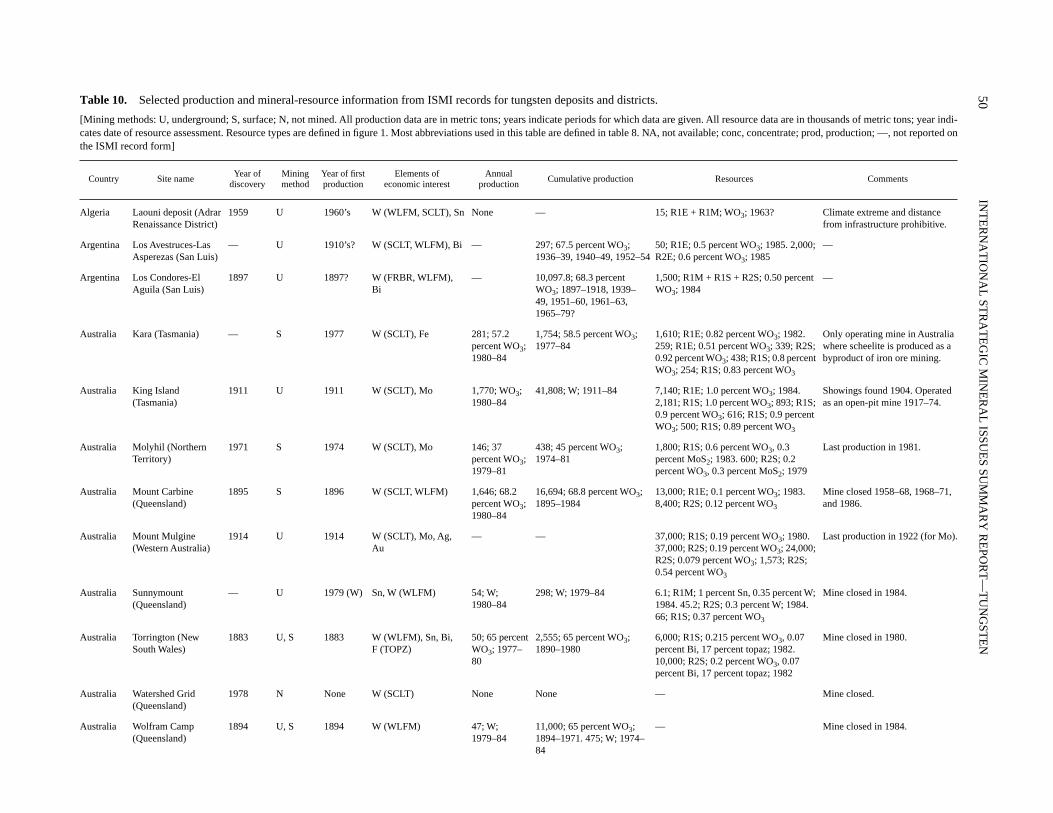
50
INT
ER
NA
TIO
NA
L ST
RA
TE
GIC
MIN
ER
AL
ISSUE
S SUM
MA
RY
RE
POR
T—
TU
NG
STE
N
Table 10.
Selected production and mineral-resource information from ISMI records for tungsten deposits and districts.
[Mining methods: U, underground; S, surface; N, not mined. All production data are in metric tons; years indicate periods for which data are given. All resource data are in thousands of metric tons; year indi-cates date of resource assessment. Resource types are defined in figure 1. Most abbreviations used in this table are defined in table 8. NA, not available; conc, concentrate; prod, production; —, not reported onthe ISMI record form]
Country Site nameYear of
discoveryMining method
Year of first production
Elements of economic interest
Annual production
Cumulative production Resources Comments
Algeria Laouni deposit (Adrar Renaissance District)
1959 U 1960’s W (WLFM, SCLT), Sn None — 15; R1E + R1M; WO
3
; 1963? Climate extreme and distance from infrastructure prohibitive.
Argentina Los Avestruces-Las Asperezas (San Luis)
— U 1910’s? W (SCLT, WLFM), Bi — 297; 67.5 percent WO
3
; 1936–39, 1940–49, 1952–54
50; R1E; 0.5 percent WO
3
; 1985. 2,000; R2E; 0.6 percent WO
3
; 1985—
Argentina Los Condores-El Aguila (San Luis)
1897 U 1897? W (FRBR, WLFM), Bi
— 10,097.8; 68.3 percent WO
3
; 1897–1918, 1939–49, 1951–60, 1961–63, 1965–79?
1,500; R1M + R1S + R2S; 0.50 percent WO
3
; 1984—
Australia Kara (Tasmania) — S 1977 W (SCLT), Fe 281; 57.2 percent WO
3
; 1980–84
1,754; 58.5 percent WO
3
; 1977–84
1,610; R1E; 0.82 percent WO
3
; 1982. 259; R1E; 0.51 percent WO
3
; 339; R2S; 0.92 percent WO
3
; 438; R1S; 0.8 percent WO
3
; 254; R1S; 0.83 percent WO
3
Only operating mine in Australia where scheelite is produced as a byproduct of iron ore mining.
Australia King Island (Tasmania)
1911 U 1911 W (SCLT), Mo 1,770; WO
3
; 1980–84
41,808; W; 1911–84 7,140; R1E; 1.0 percent WO
3
; 1984. 2,181; R1S; 1.0 percent WO
3
; 893; R1S; 0.9 percent WO
3
; 616; R1S; 0.9 percent WO
3
; 500; R1S; 0.89 percent WO
3
Showings found 1904. Operated as an open-pit mine 1917–74.
Australia Molyhil (Northern Territory)
1971 S 1974 W (SCLT), Mo 146; 37 percent WO
3
; 1979–81
438; 45 percent WO
3
; 1974–81
1,800; R1S; 0.6 percent WO
3
, 0.3 percent MoS
2
; 1983. 600; R2S; 0.2 percent WO
3
, 0.3 percent MoS
2
; 1979
Last production in 1981.
Australia Mount Carbine (Queensland)
1895 S 1896 W (SCLT, WLFM) 1,646; 68.2 percent WO
3
; 1980–84
16,694; 68.8 percent WO
3
; 1895–1984
13,000; R1E; 0.1 percent WO
3
; 1983. 8,400; R2S; 0.12 percent WO
3
Mine closed 1958–68, 1968–71, and 1986.
Australia Mount Mulgine (Western Australia)
1914 U 1914 W (SCLT), Mo, Ag, Au
— — 37,000; R1S; 0.19 percent WO
3
; 1980. 37,000; R2S; 0.19 percent WO
3
; 24,000; R2S; 0.079 percent WO
3
; 1,573; R2S; 0.54 percent WO
3
Last production in 1922 (for Mo).
Australia Sunnymount (Queensland)
— U 1979 (W) Sn, W (WLFM) 54; W; 1980–84
298; W; 1979–84 6.1; R1M; 1 percent Sn, 0.35 percent W; 1984. 45.2; R2S; 0.3 percent W; 1984. 66; R1S; 0.37 percent WO
3
Mine closed in 1984.
Australia Torrington (New South Wales)
1883 U, S 1883 W (WLFM), Sn, Bi, F (TOPZ)
50; 65 percent WO
3
; 1977–80
2,555; 65 percent WO
3
; 1890–1980
6,000; R1S; 0.215 percent WO
3
, 0.07 percent Bi, 17 percent topaz; 1982. 10,000; R2S; 0.2 percent WO
3
, 0.07 percent Bi, 17 percent topaz; 1982
Mine closed in 1980.
Australia Watershed Grid (Queensland)
1978 N None W (SCLT) None None — Mine closed.
Australia Wolfram Camp (Queensland)
1894 U, S 1894 W (WLFM) 47; W; 1979–84
11,000; 65 percent WO
3
; 1894–1971. 475; W; 1974–84
— Mine closed in 1984.
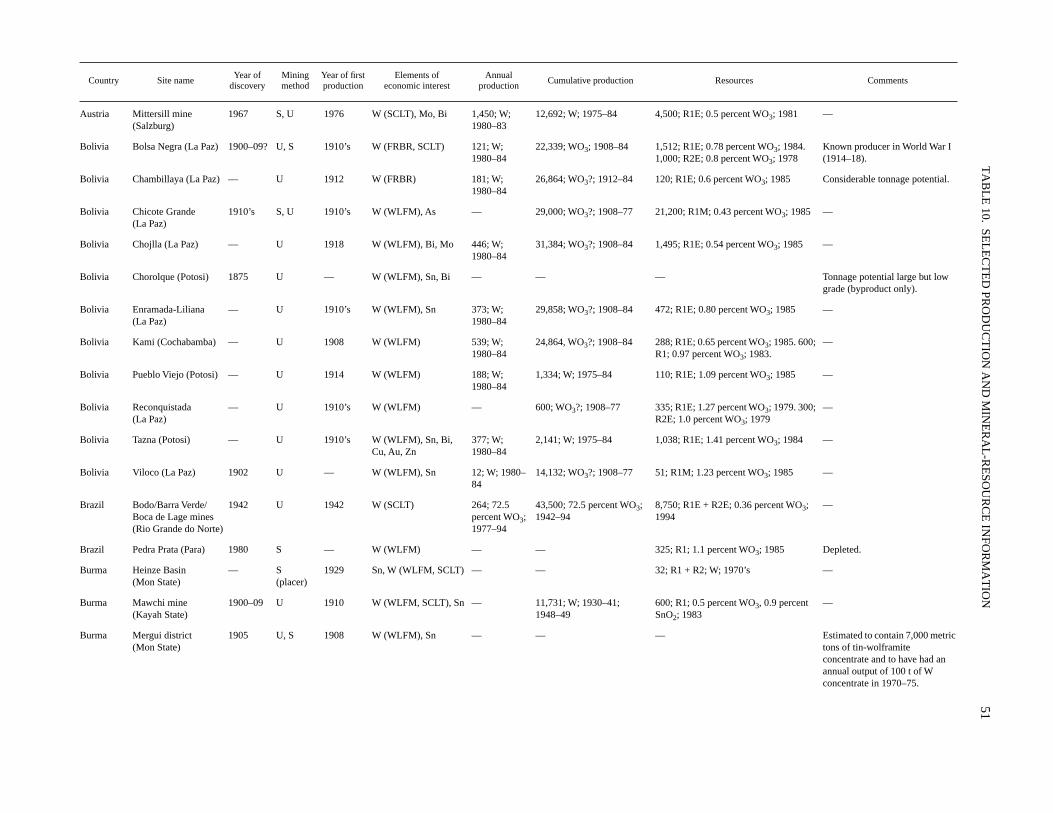
TA
BL
E 10.
SEL
EC
TE
D PR
OD
UC
TIO
N A
ND
MIN
ER
AL
-RE
SOU
RC
E IN
FOR
MA
TIO
N
51
Country Site nameYear of
discoveryMining method
Year of first production
Elements of economic interest
Annual production
Cumulative production Resources Comments
Austria Mittersill mine (Salzburg)
1967 S, U 1976 W (SCLT), Mo, Bi 1,450; W; 1980–83
12,692; W; 1975–84 4,500; R1E; 0.5 percent WO
3
; 1981 —
Bolivia Bolsa Negra (La Paz) 1900–09? U, S 1910’s W (FRBR, SCLT) 121; W; 1980–84
22,339; WO
3
; 1908–84 1,512; R1E; 0.78 percent WO
3
; 1984. 1,000; R2E; 0.8 percent WO
3
; 1978Known producer in World War I (1914–18).
Bolivia Chambillaya (La Paz) — U 1912 W (FRBR) 181; W; 1980–84
26,864; WO
3
?; 1912–84 120; R1E; 0.6 percent WO
3
; 1985 Considerable tonnage potential.
Bolivia Chicote Grande (La Paz)
1910’s S, U 1910’s W (WLFM), As — 29,000; WO
3
?; 1908–77 21,200; R1M; 0.43 percent WO
3
; 1985 —
Bolivia Chojlla (La Paz) — U 1918 W (WLFM), Bi, Mo 446; W; 1980–84
31,384; WO
3
?; 1908–84 1,495; R1E; 0.54 percent WO
3
; 1985 —
Bolivia Chorolque (Potosi) 1875 U — W (WLFM), Sn, Bi — — — Tonnage potential large but low grade (byproduct only).
Bolivia Enramada-Liliana (La Paz)
— U 1910’s W (WLFM), Sn 373; W; 1980–84
29,858; WO
3
?; 1908–84 472; R1E; 0.80 percent WO
3
; 1985 —
Bolivia Kami (Cochabamba) — U 1908 W (WLFM) 539; W; 1980–84
24,864, WO
3
?; 1908–84 288; R1E; 0.65 percent WO
3
; 1985. 600; R1; 0.97 percent WO
3
; 1983.—
Bolivia Pueblo Viejo (Potosi) — U 1914 W (WLFM) 188; W; 1980–84
1,334; W; 1975–84 110; R1E; 1.09 percent WO
3
; 1985 —
Bolivia Reconquistada (La Paz)
— U 1910’s W (WLFM) — 600; WO
3
?; 1908–77 335; R1E; 1.27 percent WO
3
; 1979. 300; R2E; 1.0 percent WO
3
; 1979—
Bolivia Tazna (Potosi) — U 1910’s W (WLFM), Sn, Bi, Cu, Au, Zn
377; W; 1980–84
2,141; W; 1975–84 1,038; R1E; 1.41 percent WO
3
; 1984 —
Bolivia Viloco (La Paz) 1902 U — W (WLFM), Sn 12; W; 1980–84
14,132; WO
3
?; 1908–77 51; R1M; 1.23 percent WO
3
; 1985 —
Brazil Bodo/Barra Verde/Boca de Lage mines (Rio Grande do Norte)
1942 U 1942 W (SCLT) 264; 72.5 percent WO
3
; 1977–94
43,500; 72.5 percent WO
3
; 1942–94
8,750; R1E + R2E; 0.36 percent WO
3
; 1994
—
Brazil Pedra Prata (Para) 1980 S — W (WLFM) — — 325; R1; 1.1 percent WO
3
; 1985 Depleted.
Burma Heinze Basin (Mon State)
— S (placer)
1929 Sn, W (WLFM, SCLT) — — 32; R1 + R2; W; 1970’s —
Burma Mawchi mine(Kayah State)
1900–09 U 1910 W (WLFM, SCLT), Sn — 11,731; W; 1930–41; 1948–49
600; R1; 0.5 percent WO
3
, 0.9 percent SnO
2
; 1983—
Burma Mergui district(Mon State)
1905 U, S 1908 W (WLFM), Sn — — — Estimated to contain 7,000 metric tons of tin-wolframite concentrate and to have had an annual output of 100 t of W concentrate in 1970–75.
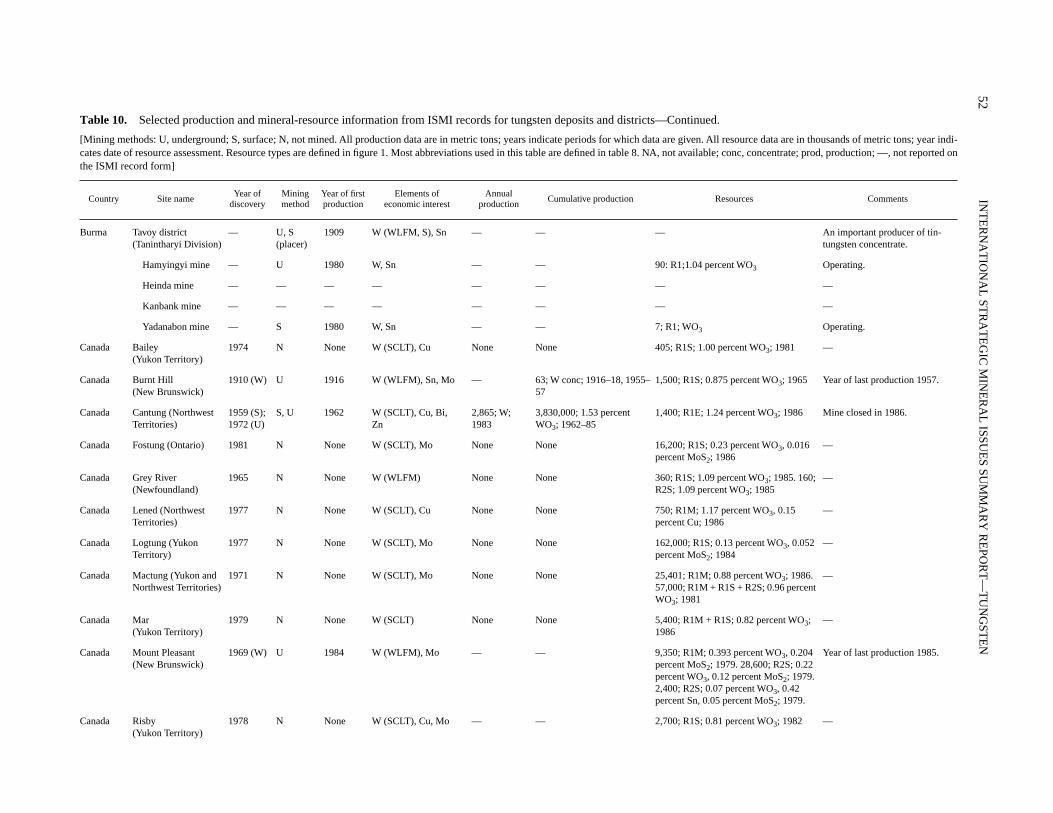
52
INT
ER
NA
TIO
NA
L ST
RA
TE
GIC
MIN
ER
AL
ISSUE
S SUM
MA
RY
RE
POR
T—
TU
NG
STE
N
Table 10.
Selected production and mineral-resource information from ISMI records for tungsten deposits and districts—Continued.
[Mining methods: U, underground; S, surface; N, not mined. All production data are in metric tons; years indicate periods for which data are given. All resource data are in thousands of metric tons; year indi-cates date of resource assessment. Resource types are defined in figure 1. Most abbreviations used in this table are defined in table 8. NA, not available; conc, concentrate; prod, production; —, not reported onthe ISMI record form]
Country Site nameYear of
discoveryMining method
Year of first production
Elements of economic interest
Annual production
Cumulative production Resources Comments
Burma Tavoy district (Tanintharyi Division)
— U, S (placer)
1909 W (WLFM, S), Sn — — — An important producer of tin-tungsten concentrate.
Hamyingyi mine — U 1980 W, Sn — — 90: R1;1.04 percent WO
3
Operating.
Heinda mine — — — — — — — —
Kanbank mine — — — — — — — —
Yadanabon mine — S 1980 W, Sn — — 7; R1; WO
3
Operating.
Canada Bailey (Yukon Territory)
1974 N None W (SCLT), Cu None None 405; R1S; 1.00 percent WO
3
; 1981 —
Canada Burnt Hill (New Brunswick)
1910 (W) U 1916 W (WLFM), Sn, Mo — 63; W conc; 1916–18, 1955–57
1,500; R1S; 0.875 percent WO 3 ; 1965 Year of last production 1957.
Canada Cantung (Northwest Territories)
1959 (S); 1972 (U)
S, U 1962 W (SCLT), Cu, Bi, Zn
2,865; W; 1983
3,830,000; 1.53 percent WO
3
; 1962–851,400; R1E; 1.24 percent WO
3
; 1986 Mine closed in 1986.
Canada Fostung (Ontario) 1981 N None W (SCLT), Mo None None 16,200; R1S; 0.23 percent WO
3
, 0.016 percent MoS
2
; 1986—
Canada Grey River (Newfoundland)
1965 N None W (WLFM) None None 360; R1S; 1.09 percent WO
3
; 1985. 160; R2S; 1.09 percent WO
3
; 1985—
Canada Lened (Northwest Territories)
1977 N None W (SCLT), Cu None None 750; R1M; 1.17 percent WO
3
, 0.15 percent Cu; 1986
—
Canada Logtung (Yukon Territory)
1977 N None W (SCLT), Mo None None 162,000; R1S; 0.13 percent WO
3
, 0.052 percent MoS
2
; 1984—
Canada Mactung (Yukon and Northwest Territories)
1971 N None W (SCLT), Mo None None 25,401; R1M; 0.88 percent WO
3
; 1986. 57,000; R1M + R1S + R2S; 0.96 percent WO
3
; 1981
—
Canada Mar (Yukon Territory)
1979 N None W (SCLT) None None 5,400; R1M + R1S; 0.82 percent WO
3
; 1986
—
Canada Mount Pleasant (New Brunswick)
1969 (W) U 1984 W (WLFM), Mo — — 9,350; R1M; 0.393 percent WO
3
, 0.204 percent MoS
2
; 1979. 28,600; R2S; 0.22 percent WO
3
, 0.12 percent MoS
2
; 1979. 2,400; R2S; 0.07 percent WO
3
, 0.42 percent Sn, 0.05 percent MoS
2
; 1979.
Year of last production 1985.
Canada Risby (Yukon Territory)
1978 N None W (SCLT), Cu, Mo — — 2,700; R1S; 0.81 percent WO
3
; 1982 —
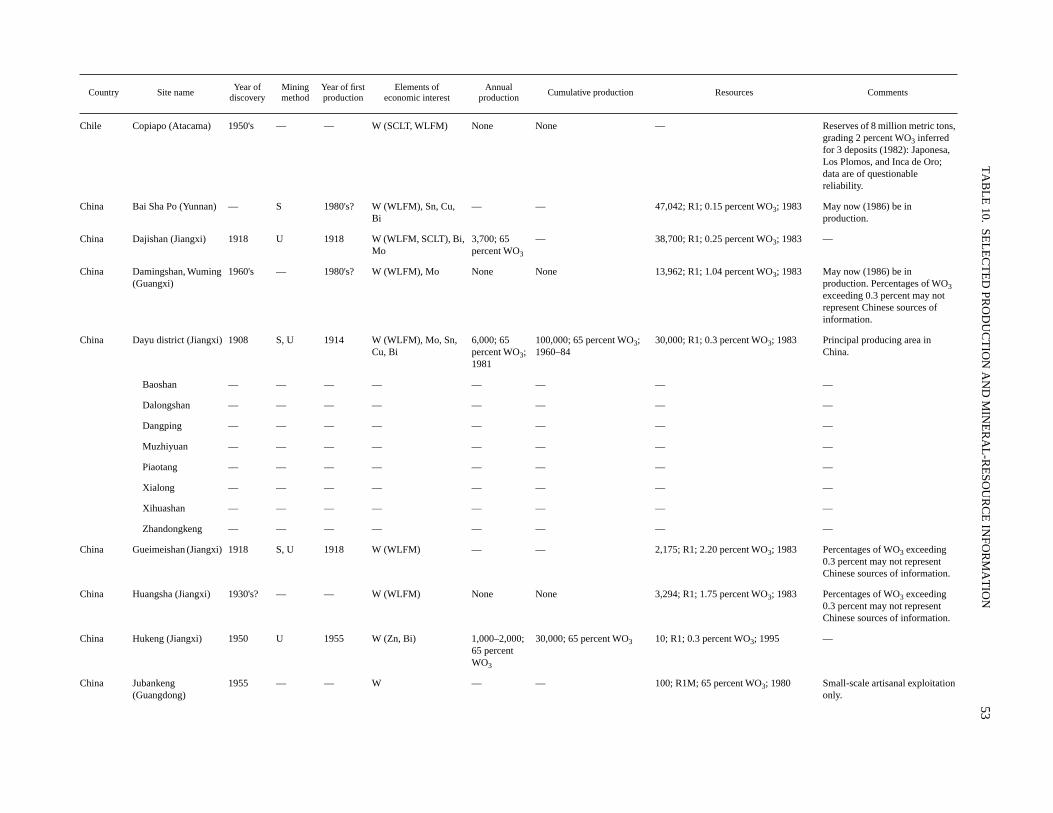
TA
BL
E 10.
SEL
EC
TE
D PR
OD
UC
TIO
N A
ND
MIN
ER
AL
-RE
SOU
RC
E IN
FOR
MA
TIO
N
53
Country Site nameYear of
discoveryMining method
Year of first production
Elements of economic interest
Annual production
Cumulative production Resources Comments
Chile Copiapo (Atacama) 1950's — — W (SCLT, WLFM) None None — Reserves of 8 million metric tons, grading 2 percent WO
3
inferred for 3 deposits (1982): Japonesa, Los Plomos, and Inca de Oro; data are of questionable reliability.
China Bai Sha Po (Yunnan) — S 1980's? W (WLFM), Sn, Cu, Bi
— — 47,042; R1; 0.15 percent WO
3
; 1983 May now (1986) be in production.
China Dajishan (Jiangxi) 1918 U 1918 W (WLFM, SCLT), Bi, Mo
3,700; 65 percent WO
3
— 38,700; R1; 0.25 percent WO
3
; 1983 —
China Damingshan, Wuming (Guangxi)
1960's — 1980's? W (WLFM), Mo None None 13,962; R1; 1.04 percent WO
3
; 1983 May now (1986) be in production. Percentages of WO
3
exceeding 0.3 percent may not represent Chinese sources of information.
China Dayu district (Jiangxi) 1908 S, U 1914 W (WLFM), Mo, Sn, Cu, Bi
6,000; 65 percent WO
3
; 1981
100,000; 65 percent WO
3
; 1960–84
30,000; R1; 0.3 percent WO
3
; 1983 Principal producing area in China.
Baoshan — — — — — — — —
Dalongshan — — — — — — — —
Dangping — — — — — — — —
Muzhiyuan — — — — — — — —
Piaotang — — — — — — — —
Xialong — — — — — — — —
Xihuashan — — — — — — — —
Zhandongkeng — — — — — — — —
China Gueimeishan (Jiangxi) 1918 S, U 1918 W (WLFM) — — 2,175; R1; 2.20 percent WO
3
; 1983 Percentages of WO
3
exceeding 0.3 percent may not represent Chinese sources of information.
China Huangsha (Jiangxi) 1930's? — — W (WLFM) None None 3,294; R1; 1.75 percent WO
3
; 1983 Percentages of WO
3
exceeding 0.3 percent may not represent Chinese sources of information.
China Hukeng (Jiangxi) 1950 U 1955 W (Zn, Bi) 1,000–2,000; 65 percent WO
3
30,000; 65 percent WO
3
10; R1; 0.3 percent WO
3
; 1995 —
China Jubankeng (Guangdong)
1955 — — W — — 100; R1M; 65 percent WO
3
; 1980 Small-scale artisanal exploitation only.
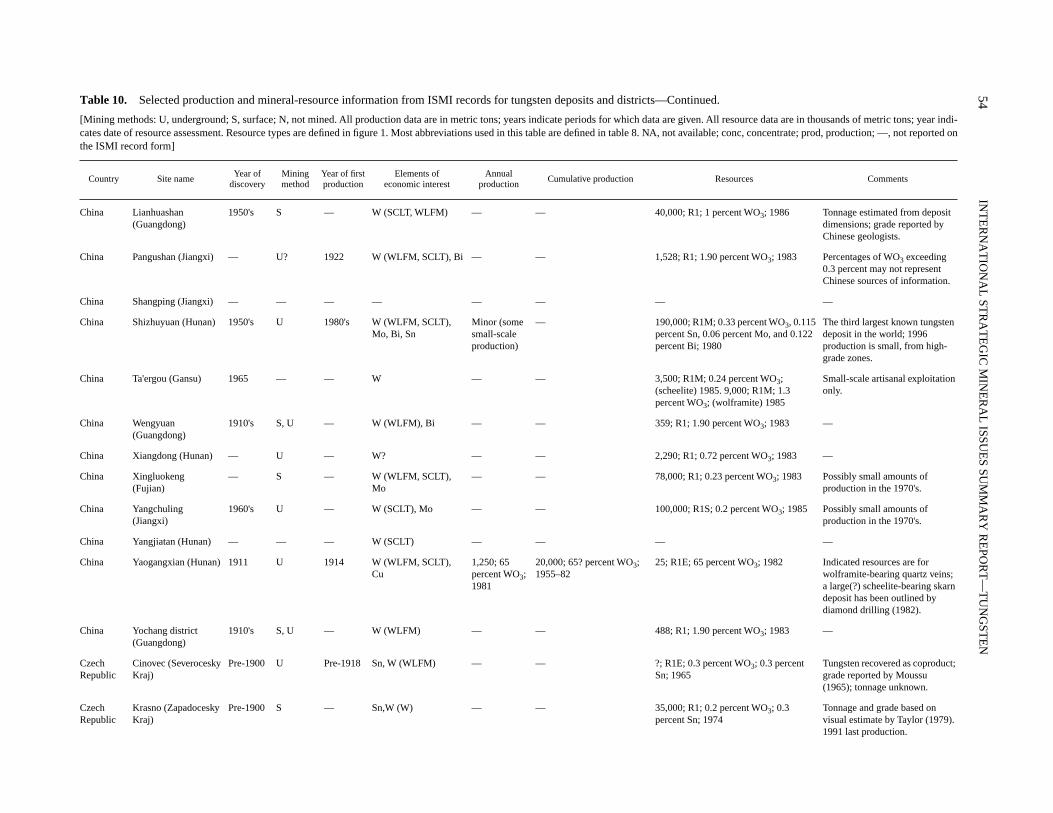
54
INT
ER
NA
TIO
NA
L ST
RA
TE
GIC
MIN
ER
AL
ISSUE
S SUM
MA
RY
RE
POR
T—
TU
NG
STE
N
Table 10.
Selected production and mineral-resource information from ISMI records for tungsten deposits and districts—Continued.
[Mining methods: U, underground; S, surface; N, not mined. All production data are in metric tons; years indicate periods for which data are given. All resource data are in thousands of metric tons; year indi-cates date of resource assessment. Resource types are defined in figure 1. Most abbreviations used in this table are defined in table 8. NA, not available; conc, concentrate; prod, production; —, not reported onthe ISMI record form]
Country Site nameYear of
discoveryMining method
Year of first production
Elements of economic interest
Annual production
Cumulative production Resources Comments
China Lianhuashan (Guangdong)
1950's S — W (SCLT, WLFM) — — 40,000; R1; 1 percent WO
3
; 1986 Tonnage estimated from deposit dimensions; grade reported by Chinese geologists.
China Pangushan (Jiangxi) — U? 1922 W (WLFM, SCLT), Bi — — 1,528; R1; 1.90 percent WO
3
; 1983 Percentages of WO
3
exceeding 0.3 percent may not represent Chinese sources of information.
China Shangping (Jiangxi) — — — — — — — —
China Shizhuyuan (Hunan) 1950's U 1980's W (WLFM, SCLT), Mo, Bi, Sn
Minor (some small-scale production)
— 190,000; R1M; 0.33 percent WO
3
, 0.115 percent Sn, 0.06 percent Mo, and 0.122 percent Bi; 1980
The third largest known tungsten deposit in the world; 1996 production is small, from high-grade zones.
China Ta'ergou (Gansu) 1965 — — W — — 3,500; R1M; 0.24 percent WO
3
; (scheelite) 1985. 9,000; R1M; 1.3 percent WO
3
; (wolframite) 1985
Small-scale artisanal exploitation only.
China Wengyuan (Guangdong)
1910's S, U — W (WLFM), Bi — — 359; R1; 1.90 percent WO
3
; 1983 —
China Xiangdong (Hunan) — U — W? — — 2,290; R1; 0.72 percent WO
3
; 1983 —
China Xingluokeng (Fujian)
— S — W (WLFM, SCLT), Mo
— — 78,000; R1; 0.23 percent WO
3
; 1983 Possibly small amounts of production in the 1970's.
China Yangchuling (Jiangxi)
1960's U — W (SCLT), Mo — — 100,000; R1S; 0.2 percent WO
3
; 1985 Possibly small amounts of production in the 1970's.
China Yangjiatan (Hunan) — — — W (SCLT) — — — —
China Yaogangxian (Hunan) 1911 U 1914 W (WLFM, SCLT), Cu
1,250; 65 percent WO
3
; 1981
20,000; 65? percent WO
3
; 1955–82
25; R1E; 65 percent WO
3
; 1982 Indicated resources are for wolframite-bearing quartz veins; a large(?) scheelite-bearing skarn deposit has been outlined by diamond drilling (1982).
China Yochang district (Guangdong)
1910's S, U — W (WLFM) — — 488; R1; 1.90 percent WO
3
; 1983 —
Czech Republic
Cinovec (Severocesky Kraj)
Pre-1900 U Pre-1918 Sn, W (WLFM) — — ?; R1E; 0.3 percent WO
3
; 0.3 percent Sn; 1965
Tungsten recovered as coproduct; grade reported by Moussu (1965); tonnage unknown.
Czech Republic
Krasno (Zapadocesky Kraj)
Pre-1900 S — Sn,W (W) — — 35,000; R1; 0.2 percent WO
3
; 0.3 percent Sn; 1974
Tonnage and grade based on visual estimate by Taylor (1979). 1991 last production.
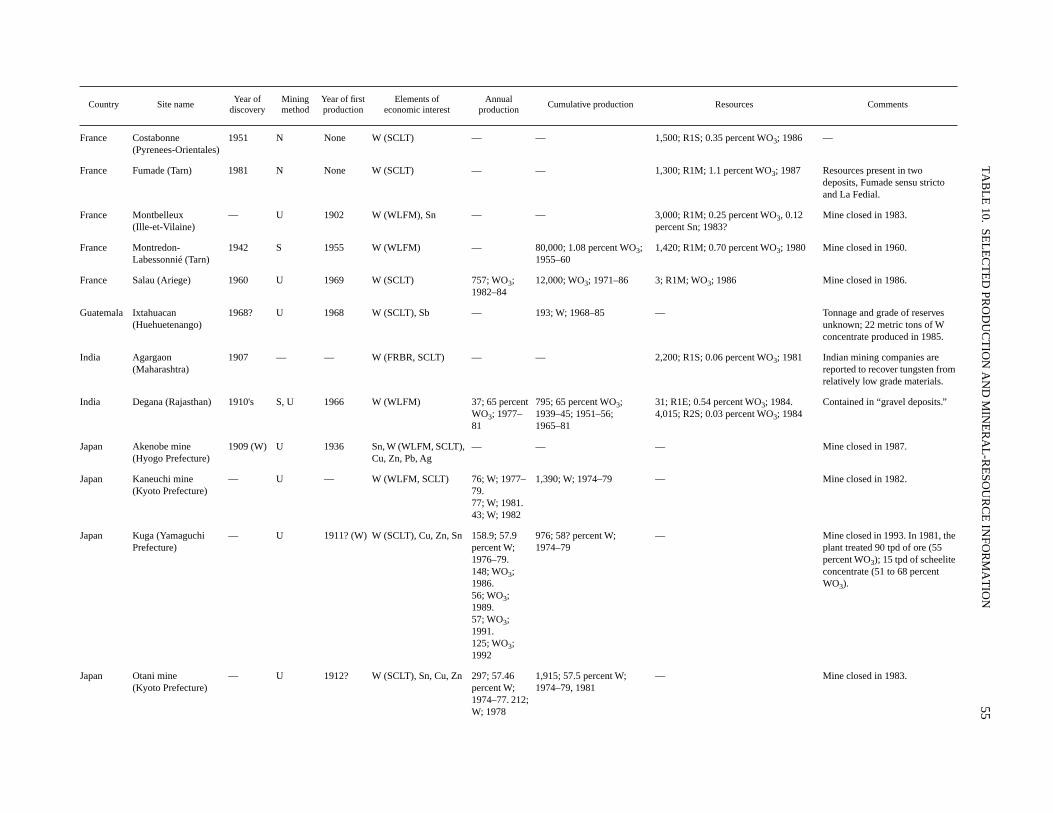
TA
BL
E 10.
SEL
EC
TE
D PR
OD
UC
TIO
N A
ND
MIN
ER
AL
-RE
SOU
RC
E IN
FOR
MA
TIO
N
55
Country Site nameYear of
discoveryMining method
Year of first production
Elements of economic interest
Annual production
Cumulative production Resources Comments
France Costabonne (Pyrenees-Orientales)
1951 N None W (SCLT) — — 1,500; R1S; 0.35 percent WO
3
; 1986 —
France Fumade (Tarn) 1981 N None W (SCLT) — — 1,300; R1M; 1.1 percent WO
3
; 1987 Resources present in two deposits, Fumade sensu stricto and La Fedial.
France Montbelleux (Ille-et-Vilaine)
— U 1902 W (WLFM), Sn — — 3,000; R1M; 0.25 percent WO
3
, 0.12 percent Sn; 1983?
Mine closed in 1983.
France Montredon-Labessonnié (Tarn)
1942 S 1955 W (WLFM) — 80,000; 1.08 percent WO
3
; 1955–60
1,420; R1M; 0.70 percent WO
3
; 1980 Mine closed in 1960.
France Salau (Ariege) 1960 U 1969 W (SCLT) 757; WO
3
; 1982–84
12,000; WO
3
; 1971–86 3; R1M; WO
3
; 1986 Mine closed in 1986.
Guatemala Ixtahuacan (Huehuetenango)
1968? U 1968 W (SCLT), Sb — 193; W; 1968–85 — Tonnage and grade of reserves unknown; 22 metric tons of W concentrate produced in 1985.
India Agargaon (Maharashtra)
1907 — — W (FRBR, SCLT) — — 2,200; R1S; 0.06 percent WO
3
; 1981 Indian mining companies are reported to recover tungsten from relatively low grade materials.
India Degana (Rajasthan) 1910's S, U 1966 W (WLFM) 37; 65 percent WO
3
; 1977–81
795; 65 percent WO
3
; 1939–45; 1951–56; 1965–81
31; R1E; 0.54 percent WO
3
; 1984. 4,015; R2S; 0.03 percent WO
3
; 1984Contained in “gravel deposits.”
Japan Akenobe mine (Hyogo Prefecture)
1909 (W) U 1936 Sn, W (WLFM, SCLT), Cu, Zn, Pb, Ag
— — — Mine closed in 1987.
Japan Kaneuchi mine (Kyoto Prefecture)
— U — W (WLFM, SCLT) 76; W; 1977–79. 77; W; 1981. 43; W; 1982
1,390; W; 1974–79 — Mine closed in 1982.
Japan Kuga (Yamaguchi Prefecture)
— U 1911? (W) W (SCLT), Cu, Zn, Sn 158.9; 57.9 percent W; 1976–79.148; WO
3
; 1986.56; WO
3
; 1989.57; WO
3
; 1991.125; WO
3
; 1992
976; 58? percent W; 1974–79
— Mine closed in 1993. In 1981, the plant treated 90 tpd of ore (55 percent WO
3
); 15 tpd of scheelite concentrate (51 to 68 percent WO
3
).
Japan Otani mine (Kyoto Prefecture)
— U 1912? W (SCLT), Sn, Cu, Zn 297; 57.46 percent W; 1974–77. 212; W; 1978
1,915; 57.5 percent W; 1974–79, 1981
— Mine closed in 1983.
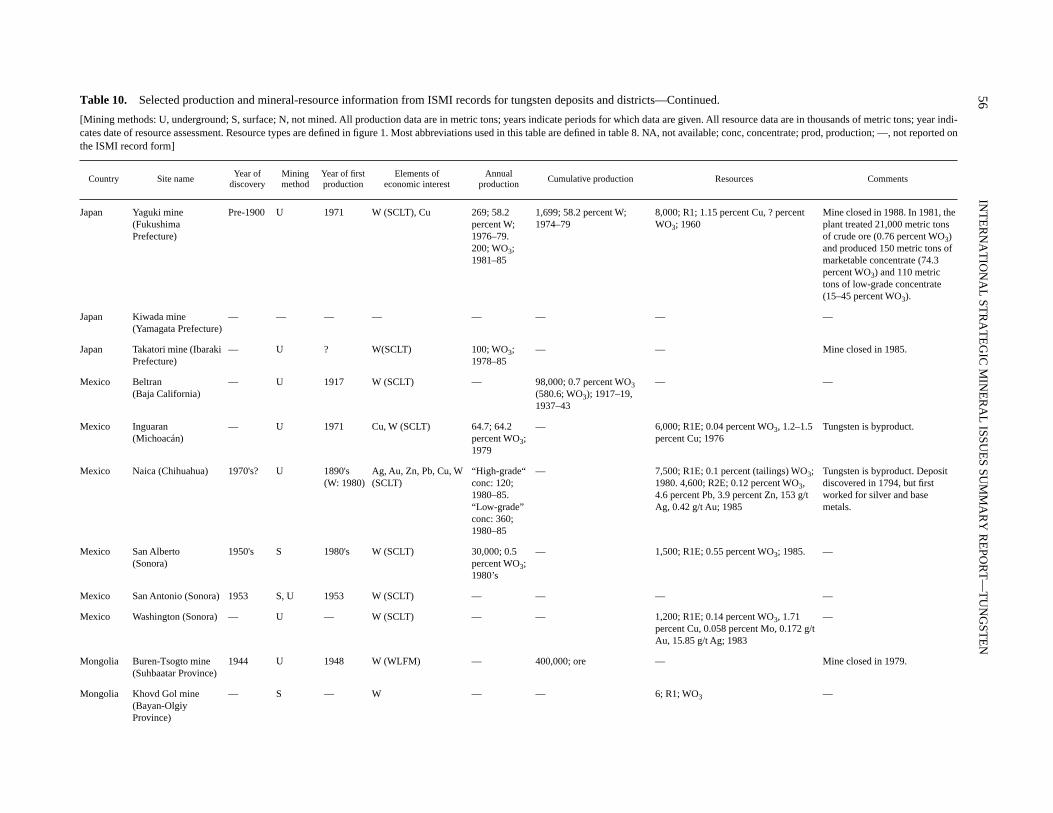
56
INT
ER
NA
TIO
NA
L ST
RA
TE
GIC
MIN
ER
AL
ISSUE
S SUM
MA
RY
RE
POR
T—
TU
NG
STE
N
Table 10.
Selected production and mineral-resource information from ISMI records for tungsten deposits and districts—Continued.
[Mining methods: U, underground; S, surface; N, not mined. All production data are in metric tons; years indicate periods for which data are given. All resource data are in thousands of metric tons; year indi-cates date of resource assessment. Resource types are defined in figure 1. Most abbreviations used in this table are defined in table 8. NA, not available; conc, concentrate; prod, production; —, not reported onthe ISMI record form]
Country Site nameYear of
discoveryMining method
Year of first production
Elements of economic interest
Annual production
Cumulative production Resources Comments
Japan Yaguki mine (Fukushima Prefecture)
Pre-1900 U 1971 W (SCLT), Cu 269; 58.2 percent W; 1976–79.200; WO
3
; 1981–85
1,699; 58.2 percent W; 1974–79
8,000; R1; 1.15 percent Cu, ? percent WO
3
; 1960Mine closed in 1988. In 1981, the plant treated 21,000 metric tons of crude ore (0.76 percent WO
3
) and produced 150 metric tons of marketable concentrate (74.3 percent WO
3
) and 110 metric tons of low-grade concentrate (15–45 percent WO
3
).
Japan Kiwada mine (Yamagata Prefecture)
— — — — — — — —
Japan Takatori mine (Ibaraki Prefecture)
— U ? W(SCLT) 100; WO
3
; 1978–85
— — Mine closed in 1985.
Mexico Beltran (Baja California)
— U 1917 W (SCLT) — 98,000; 0.7 percent WO
3
(580.6; WO3); 1917–19, 1937–43
— —
Mexico Inguaran (Michoacán)
— U 1971 Cu, W (SCLT) 64.7; 64.2 percent WO3; 1979
— 6,000; R1E; 0.04 percent WO3, 1.2–1.5 percent Cu; 1976
Tungsten is byproduct.
Mexico Naica (Chihuahua) 1970's? U 1890's (W: 1980)
Ag, Au, Zn, Pb, Cu, W (SCLT)
“High-grade“ conc: 120; 1980–85. “Low-grade” conc: 360; 1980–85
— 7,500; R1E; 0.1 percent (tailings) WO3; 1980. 4,600; R2E; 0.12 percent WO3, 4.6 percent Pb, 3.9 percent Zn, 153 g/t Ag, 0.42 g/t Au; 1985
Tungsten is byproduct. Deposit discovered in 1794, but first worked for silver and base metals.
Mexico San Alberto (Sonora)
1950's S 1980's W (SCLT) 30,000; 0.5 percent WO3; 1980’s
— 1,500; R1E; 0.55 percent WO3; 1985. —
Mexico San Antonio (Sonora) 1953 S, U 1953 W (SCLT) — — — —
Mexico Washington (Sonora) — U — W (SCLT) — — 1,200; R1E; 0.14 percent WO3, 1.71 percent Cu, 0.058 percent Mo, 0.172 g/t Au, 15.85 g/t Ag; 1983
—
Mongolia Buren-Tsogto mine (Suhbaatar Province)
1944 U 1948 W (WLFM) — 400,000; ore — Mine closed in 1979.
Mongolia Khovd Gol mine(Bayan-Olgiy Province)
— S — W — — 6; R1; WO3 —
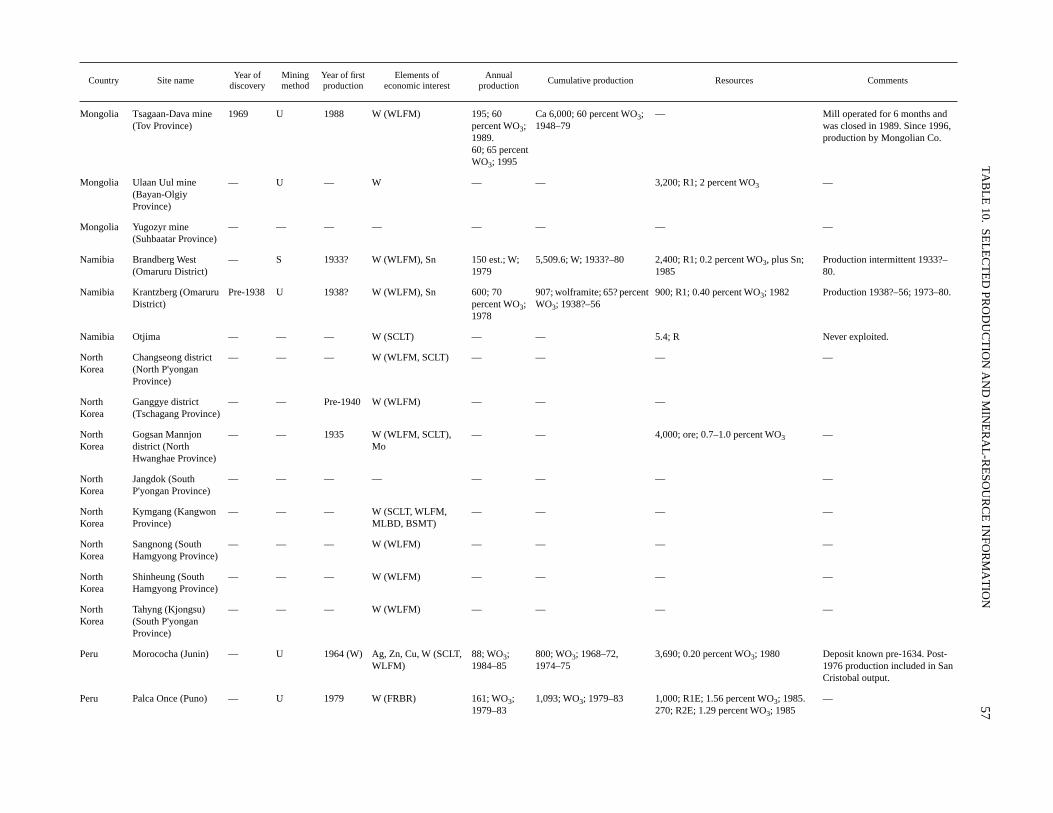
TA
BL
E 10.
SEL
EC
TE
D PR
OD
UC
TIO
N A
ND
MIN
ER
AL
-RE
SOU
RC
E IN
FOR
MA
TIO
N57
Country Site nameYear of
discoveryMining method
Year of first production
Elements of economic interest
Annual production
Cumulative production Resources Comments
Mongolia Tsagaan-Dava mine(Tov Province)
1969 U 1988 W (WLFM) 195; 60 percent WO3; 1989.60; 65 percent WO3; 1995
Ca 6,000; 60 percent WO3; 1948–79
— Mill operated for 6 months and was closed in 1989. Since 1996, production by Mongolian Co.
Mongolia Ulaan Uul mine (Bayan-Olgiy Province)
— U — W — — 3,200; R1; 2 percent WO3 —
Mongolia Yugozyr mine (Suhbaatar Province)
— — — — — — — —
Namibia Brandberg West (Omaruru District)
— S 1933? W (WLFM), Sn 150 est.; W; 1979
5,509.6; W; 1933?–80 2,400; R1; 0.2 percent WO3, plus Sn; 1985
Production intermittent 1933?–80.
Namibia Krantzberg (Omaruru District)
Pre-1938 U 1938? W (WLFM), Sn 600; 70 percent WO3; 1978
907; wolframite; 65? percent WO3; 1938?–56
900; R1; 0.40 percent WO3; 1982 Production 1938?–56; 1973–80.
Namibia Otjima — — — W (SCLT) — — 5.4; R Never exploited.
North Korea
Changseong district (North P'yongan Province)
— — — W (WLFM, SCLT) — — — —
North Korea
Ganggye district (Tschagang Province)
— — Pre-1940 W (WLFM) — — —
North Korea
Gogsan Mannjon district (North Hwanghae Province)
— — 1935 W (WLFM, SCLT), Mo
— — 4,000; ore; 0.7–1.0 percent WO3 —
North Korea
Jangdok (South P'yongan Province)
— — — — — — — —
North Korea
Kymgang (Kangwon Province)
— — — W (SCLT, WLFM, MLBD, BSMT)
— — — —
North Korea
Sangnong (South Hamgyong Province)
— — — W (WLFM) — — — —
North Korea
Shinheung (South Hamgyong Province)
— — — W (WLFM) — — — —
North Korea
Tahyng (Kjongsu) (South P'yongan Province)
— — — W (WLFM) — — — —
Peru Morococha (Junin) — U 1964 (W) Ag, Zn, Cu, W (SCLT, WLFM)
88; WO3; 1984–85
800; WO3; 1968–72, 1974–75
3,690; 0.20 percent WO3; 1980 Deposit known pre-1634. Post-1976 production included in San Cristobal output.
Peru Palca Once (Puno) — U 1979 W (FRBR) 161; WO3; 1979–83
1,093; WO3; 1979–83 1,000; R1E; 1.56 percent WO3; 1985. 270; R2E; 1.29 percent WO3; 1985
—
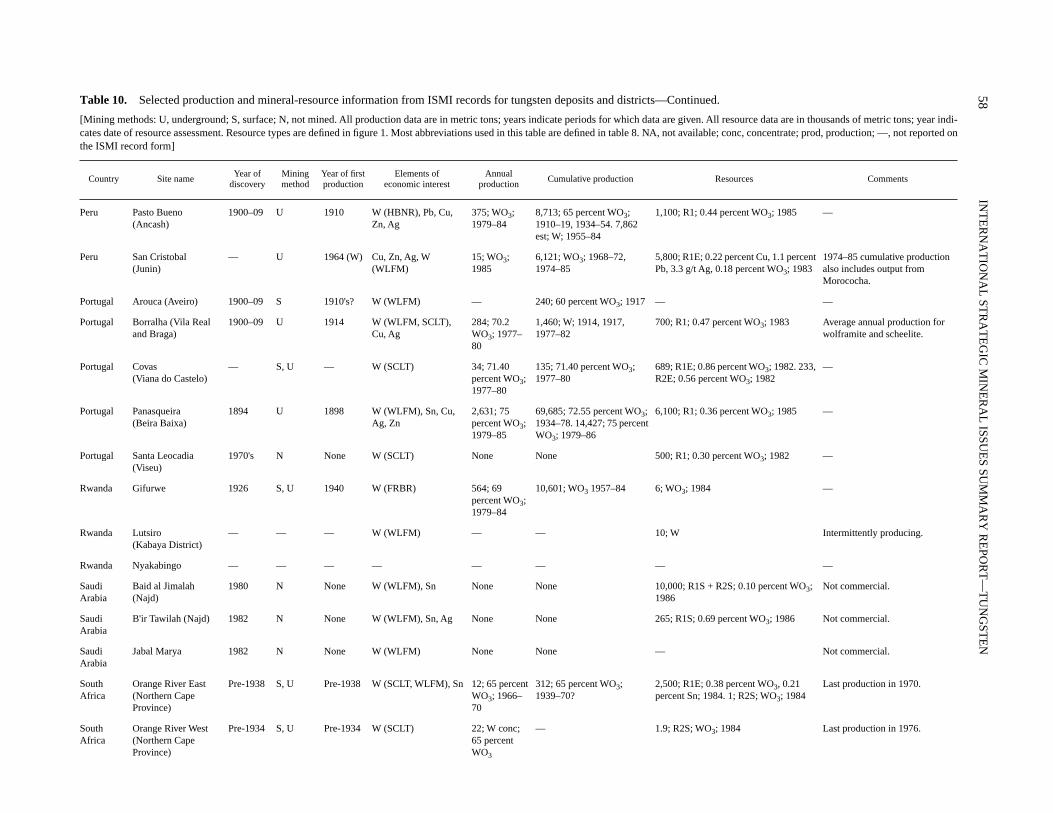
58IN
TE
RN
AT
ION
AL
STR
AT
EG
IC M
INE
RA
L ISSU
ES SU
MM
AR
Y R
EPO
RT
—T
UN
GST
EN
Table 10. Selected production and mineral-resource information from ISMI records for tungsten deposits and districts—Continued.
[Mining methods: U, underground; S, surface; N, not mined. All production data are in metric tons; years indicate periods for which data are given. All resource data are in thousands of metric tons; year indi-cates date of resource assessment. Resource types are defined in figure 1. Most abbreviations used in this table are defined in table 8. NA, not available; conc, concentrate; prod, production; —, not reported onthe ISMI record form]
Country Site nameYear of
discoveryMining method
Year of first production
Elements of economic interest
Annual production
Cumulative production Resources Comments
Peru Pasto Bueno (Ancash)
1900–09 U 1910 W (HBNR), Pb, Cu, Zn, Ag
375; WO3; 1979–84
8,713; 65 percent WO3; 1910–19, 1934–54. 7,862 est; W; 1955–84
1,100; R1; 0.44 percent WO3; 1985 —
Peru San Cristobal (Junin)
— U 1964 (W) Cu, Zn, Ag, W (WLFM)
15; WO3; 1985
6,121; WO3; 1968–72, 1974–85
5,800; R1E; 0.22 percent Cu, 1.1 percent Pb, 3.3 g/t Ag, 0.18 percent WO3; 1983
1974–85 cumulative production also includes output from Morococha.
Portugal Arouca (Aveiro) 1900–09 S 1910's? W (WLFM) — 240; 60 percent WO3; 1917 — —
Portugal Borralha (Vila Real and Braga)
1900–09 U 1914 W (WLFM, SCLT), Cu, Ag
284; 70.2 WO3; 1977–80
1,460; W; 1914, 1917, 1977–82
700; R1; 0.47 percent WO3; 1983 Average annual production for wolframite and scheelite.
Portugal Covas (Viana do Castelo)
— S, U — W (SCLT) 34; 71.40 percent WO3; 1977–80
135; 71.40 percent WO3; 1977–80
689; R1E; 0.86 percent WO3; 1982. 233, R2E; 0.56 percent WO3; 1982
—
Portugal Panasqueira(Beira Baixa)
1894 U 1898 W (WLFM), Sn, Cu, Ag, Zn
2,631; 75 percent WO3; 1979–85
69,685; 72.55 percent WO3; 1934–78. 14,427; 75 percent WO3; 1979–86
6,100; R1; 0.36 percent WO3; 1985 —
Portugal Santa Leocadia (Viseu)
1970's N None W (SCLT) None None 500; R1; 0.30 percent WO3; 1982 —
Rwanda Gifurwe 1926 S, U 1940 W (FRBR) 564; 69 percent WO3; 1979–84
10,601; WO3 1957–84 6; WO3; 1984 —
Rwanda Lutsiro (Kabaya District)
— — — W (WLFM) — — 10; W Intermittently producing.
Rwanda Nyakabingo — — — — — — — —
Saudi Arabia
Baid al Jimalah (Najd)
1980 N None W (WLFM), Sn None None 10,000; R1S + R2S; 0.10 percent WO3; 1986
Not commercial.
Saudi Arabia
B'ir Tawilah (Najd) 1982 N None W (WLFM), Sn, Ag None None 265; R1S; 0.69 percent WO3; 1986 Not commercial.
Saudi Arabia
Jabal Marya 1982 N None W (WLFM) None None — Not commercial.
South Africa
Orange River East (Northern Cape Province)
Pre-1938 S, U Pre-1938 W (SCLT, WLFM), Sn 12; 65 percent WO3; 1966–70
312; 65 percent WO3; 1939–70?
2,500; R1E; 0.38 percent WO3, 0.21 percent Sn; 1984. 1; R2S; WO3; 1984
Last production in 1970.
South Africa
Orange River West (Northern Cape Province)
Pre-1934 S, U Pre-1934 W (SCLT) 22; W conc; 65 percent WO3
— 1.9; R2S; WO3; 1984 Last production in 1976.
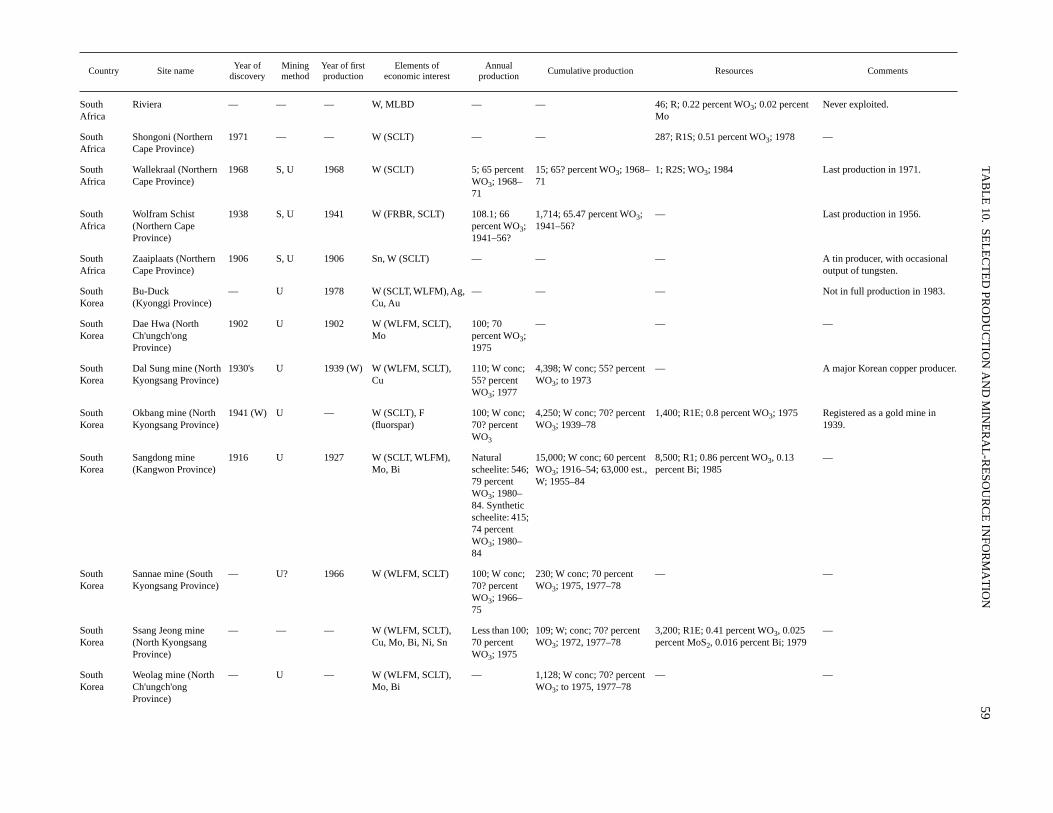
TA
BL
E 10.
SEL
EC
TE
D PR
OD
UC
TIO
N A
ND
MIN
ER
AL
-RE
SOU
RC
E IN
FOR
MA
TIO
N59
Country Site nameYear of
discoveryMining method
Year of first production
Elements of economic interest
Annual production
Cumulative production Resources Comments
South Africa
Riviera — — — W, MLBD — — 46; R; 0.22 percent WO3; 0.02 percent Mo
Never exploited.
South Africa
Shongoni (Northern Cape Province)
1971 — — W (SCLT) — — 287; R1S; 0.51 percent WO3; 1978 —
South Africa
Wallekraal (Northern Cape Province)
1968 S, U 1968 W (SCLT) 5; 65 percent WO3; 1968–71
15; 65? percent WO3; 1968–71
1; R2S; WO3; 1984 Last production in 1971.
South Africa
Wolfram Schist (Northern Cape Province)
1938 S, U 1941 W (FRBR, SCLT) 108.1; 66 percent WO3; 1941–56?
1,714; 65.47 percent WO3; 1941–56?
— Last production in 1956.
South Africa
Zaaiplaats (Northern Cape Province)
1906 S, U 1906 Sn, W (SCLT) — — — A tin producer, with occasional output of tungsten.
South Korea
Bu-Duck(Kyonggi Province)
— U 1978 W (SCLT, WLFM), Ag, Cu, Au
— — — Not in full production in 1983.
South Korea
Dae Hwa (North Ch'ungch'ong Province)
1902 U 1902 W (WLFM, SCLT), Mo
100; 70 percent WO3; 1975
— — —
South Korea
Dal Sung mine (North Kyongsang Province)
1930's U 1939 (W) W (WLFM, SCLT), Cu
110; W conc; 55? percent WO3; 1977
4,398; W conc; 55? percent WO3; to 1973
— A major Korean copper producer.
South Korea
Okbang mine (North Kyongsang Province)
1941 (W) U — W (SCLT), F (fluorspar)
100; W conc; 70? percent WO3
4,250; W conc; 70? percent WO3; 1939–78
1,400; R1E; 0.8 percent WO3; 1975 Registered as a gold mine in 1939.
South Korea
Sangdong mine (Kangwon Province)
1916 U 1927 W (SCLT, WLFM), Mo, Bi
Natural scheelite: 546; 79 percent WO3; 1980–84. Synthetic scheelite: 415; 74 percent WO3; 1980–84
15,000; W conc; 60 percent WO3; 1916–54; 63,000 est., W; 1955–84
8,500; R1; 0.86 percent WO3, 0.13 percent Bi; 1985
—
South Korea
Sannae mine (South Kyongsang Province)
— U? 1966 W (WLFM, SCLT) 100; W conc; 70? percent WO3; 1966–75
230; W conc; 70 percent WO3; 1975, 1977–78
— —
South Korea
Ssang Jeong mine (North Kyongsang Province)
— — — W (WLFM, SCLT), Cu, Mo, Bi, Ni, Sn
Less than 100; 70 percent WO3; 1975
109; W; conc; 70? percent WO3; 1972, 1977–78
3,200; R1E; 0.41 percent WO3, 0.025 percent MoS2, 0.016 percent Bi; 1979
—
South Korea
Weolag mine (North Ch'ungch'ong Province)
— U — W (WLFM, SCLT), Mo, Bi
— 1,128; W conc; 70? percent WO3; to 1975, 1977–78
— —
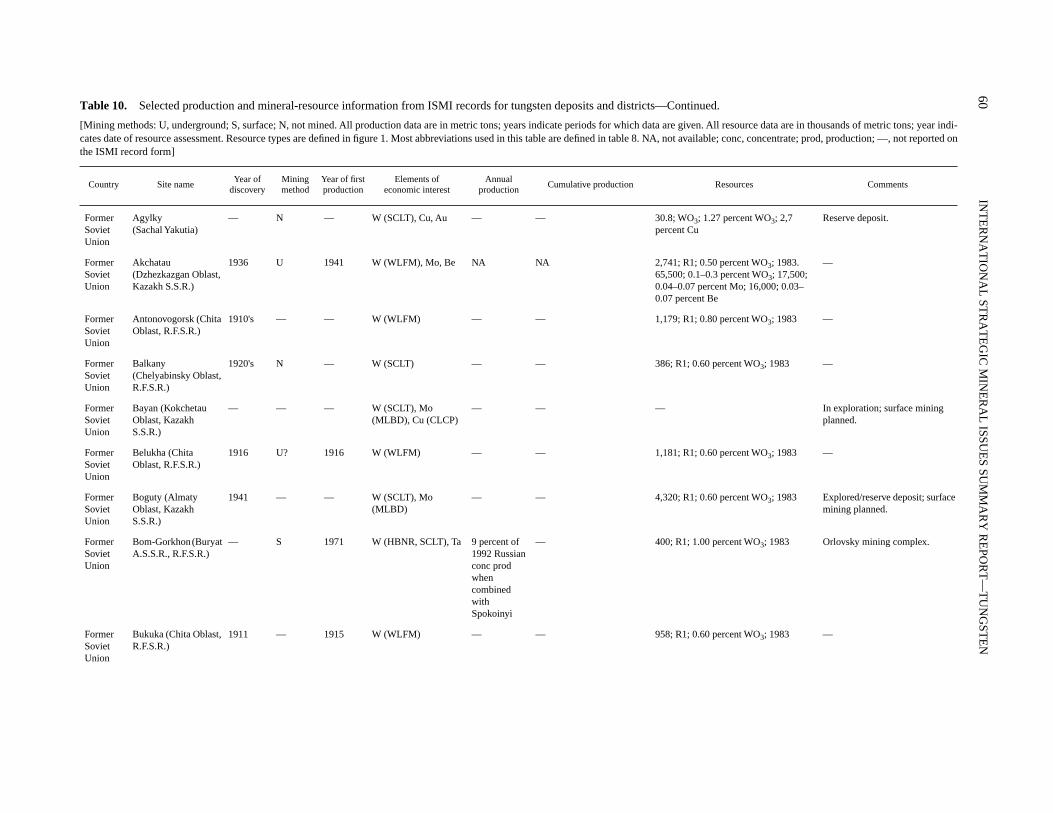
60IN
TE
RN
AT
ION
AL
STR
AT
EG
IC M
INE
RA
L ISSU
ES SU
MM
AR
Y R
EPO
RT
—T
UN
GST
EN
Table 10. Selected production and mineral-resource information from ISMI records for tungsten deposits and districts—Continued.
[Mining methods: U, underground; S, surface; N, not mined. All production data are in metric tons; years indicate periods for which data are given. All resource data are in thousands of metric tons; year indi-cates date of resource assessment. Resource types are defined in figure 1. Most abbreviations used in this table are defined in table 8. NA, not available; conc, concentrate; prod, production; —, not reported onthe ISMI record form]
Country Site nameYear of
discoveryMining method
Year of first production
Elements of economic interest
Annual production
Cumulative production Resources Comments
Former Soviet Union
Agylky (Sachal Yakutia)
— N — W (SCLT), Cu, Au — — 30.8; WO3; 1.27 percent WO3; 2,7 percent Cu
Reserve deposit.
Former Soviet Union
Akchatau (Dzhezkazgan Oblast, Kazakh S.S.R.)
1936 U 1941 W (WLFM), Mo, Be NA NA 2,741; R1; 0.50 percent WO3; 1983. 65,500; 0.1–0.3 percent WO3; 17,500; 0.04–0.07 percent Mo; 16,000; 0.03–0.07 percent Be
—
Former Soviet Union
Antonovogorsk (Chita Oblast, R.F.S.R.)
1910's — — W (WLFM) — — 1,179; R1; 0.80 percent WO3; 1983 —
Former Soviet Union
Balkany (Chelyabinsky Oblast, R.F.S.R.)
1920's N — W (SCLT) — — 386; R1; 0.60 percent WO3; 1983 —
Former Soviet Union
Bayan (Kokchetau Oblast, Kazakh S.S.R.)
— — — W (SCLT), Mo (MLBD), Cu (CLCP)
— — — In exploration; surface mining planned.
Former Soviet Union
Belukha (Chita Oblast, R.F.S.R.)
1916 U? 1916 W (WLFM) — — 1,181; R1; 0.60 percent WO3; 1983 —
Former Soviet Union
Boguty (Almaty Oblast, Kazakh S.S.R.)
1941 — — W (SCLT), Mo (MLBD)
— — 4,320; R1; 0.60 percent WO3; 1983 Explored/reserve deposit; surface mining planned.
Former Soviet Union
Bom-Gorkhon (Buryat A.S.S.R., R.F.S.R.)
— S 1971 W (HBNR, SCLT), Ta 9 percent of 1992 Russian conc prod when combined with Spokoinyi
— 400; R1; 1.00 percent WO3; 1983 Orlovsky mining complex.
Former Soviet Union
Bukuka (Chita Oblast, R.F.S.R.)
1911 — 1915 W (WLFM) — — 958; R1; 0.60 percent WO3; 1983 —
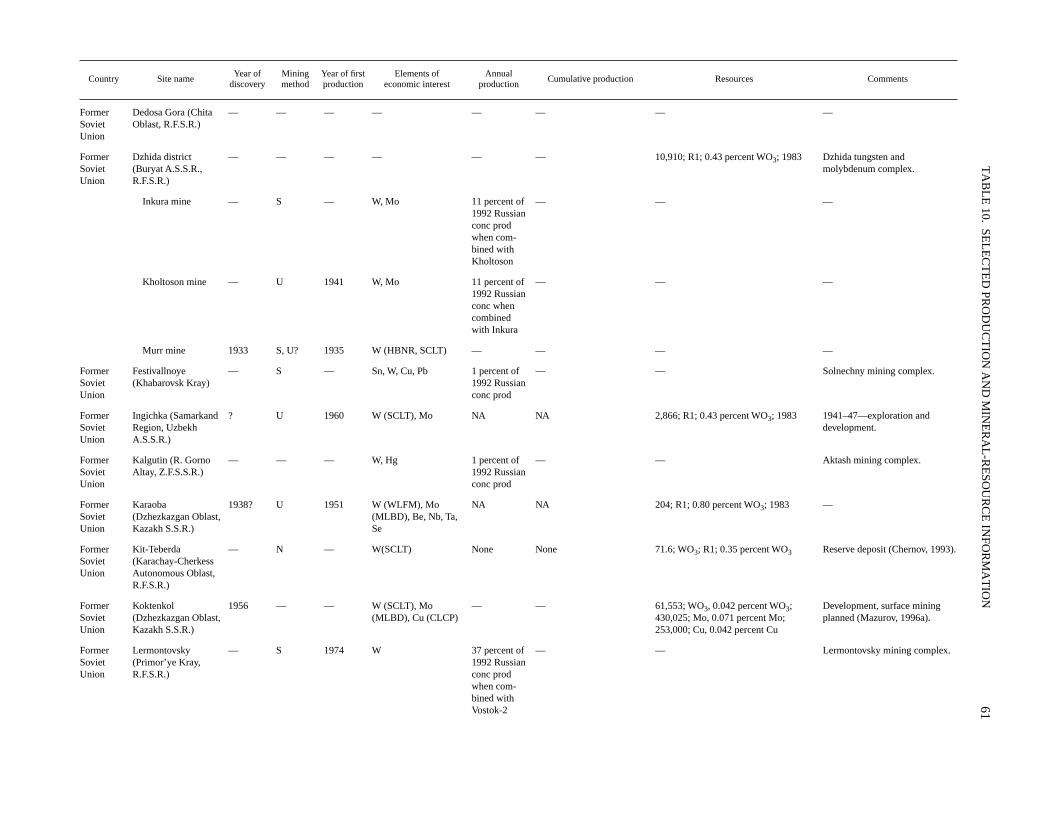
TA
BL
E 10.
SEL
EC
TE
D PR
OD
UC
TIO
N A
ND
MIN
ER
AL
-RE
SOU
RC
E IN
FOR
MA
TIO
N61
Country Site nameYear of
discoveryMining method
Year of first production
Elements of economic interest
Annual production
Cumulative production Resources Comments
Former Soviet Union
Dedosa Gora (Chita Oblast, R.F.S.R.)
— — — — — — — —
Former Soviet Union
Dzhida district (Buryat A.S.S.R., R.F.S.R.)
— — — — — — 10,910; R1; 0.43 percent WO3; 1983 Dzhida tungsten and molybdenum complex.
Inkura mine — S — W, Mo 11 percent of 1992 Russian conc prod when com-bined with Kholtoson
— — —
Kholtoson mine — U 1941 W, Mo 11 percent of 1992 Russian conc when combined with Inkura
— — —
Murr mine 1933 S, U? 1935 W (HBNR, SCLT) — — — —
Former Soviet Union
Festivallnoye (Khabarovsk Kray)
— S — Sn, W, Cu, Pb 1 percent of 1992 Russian conc prod
— — Solnechny mining complex.
Former Soviet Union
Ingichka (Samarkand Region, Uzbekh A.S.S.R.)
? U 1960 W (SCLT), Mo NA NA 2,866; R1; 0.43 percent WO3; 1983 1941–47—exploration and development.
Former Soviet Union
Kalgutin (R. Gorno Altay, Z.F.S.S.R.)
— — — W, Hg 1 percent of 1992 Russian conc prod
— — Aktash mining complex.
Former Soviet Union
Karaoba (Dzhezkazgan Oblast, Kazakh S.S.R.)
1938? U 1951 W (WLFM), Mo (MLBD), Be, Nb, Ta, Se
NA NA 204; R1; 0.80 percent WO3; 1983 —
Former Soviet Union
Kit-Teberda (Karachay-Cherkess Autonomous Oblast, R.F.S.R.)
— N — W(SCLT) None None 71.6; WO3; R1; 0.35 percent WO3 Reserve deposit (Chernov, 1993).
Former Soviet Union
Koktenkol (Dzhezkazgan Oblast, Kazakh S.S.R.)
1956 — — W (SCLT), Mo (MLBD), Cu (CLCP)
— — 61,553; WO3, 0.042 percent WO3; 430,025; Mo, 0.071 percent Mo; 253,000; Cu, 0.042 percent Cu
Development, surface mining planned (Mazurov, 1996a).
Former Soviet Union
Lermontovsky (Primor’ye Kray, R.F.S.R.)
— S 1974 W 37 percent of 1992 Russian conc prod when com-bined with Vostok-2
— — Lermontovsky mining complex.
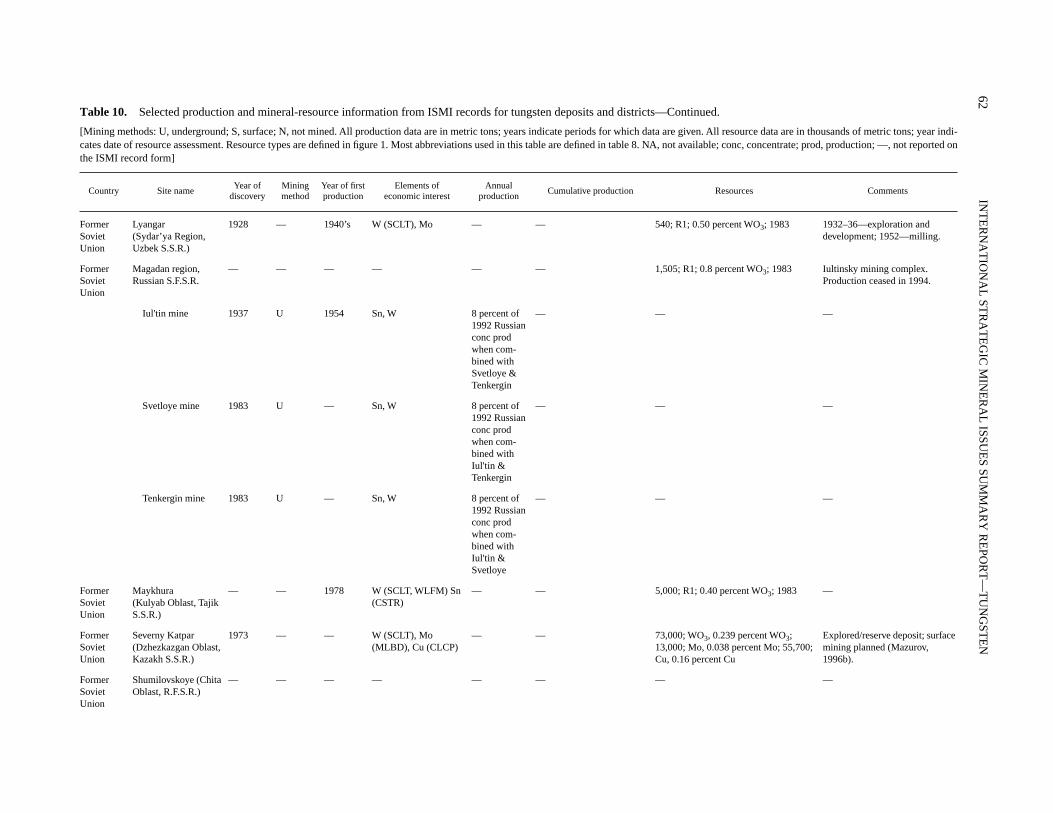
62IN
TE
RN
AT
ION
AL
STR
AT
EG
IC M
INE
RA
L ISSU
ES SU
MM
AR
Y R
EPO
RT
—T
UN
GST
EN
Table 10. Selected production and mineral-resource information from ISMI records for tungsten deposits and districts—Continued.
[Mining methods: U, underground; S, surface; N, not mined. All production data are in metric tons; years indicate periods for which data are given. All resource data are in thousands of metric tons; year indi-cates date of resource assessment. Resource types are defined in figure 1. Most abbreviations used in this table are defined in table 8. NA, not available; conc, concentrate; prod, production; —, not reported onthe ISMI record form]
Country Site nameYear of
discoveryMining method
Year of first production
Elements of economic interest
Annual production
Cumulative production Resources Comments
Former Soviet Union
Lyangar (Sydar’ya Region, Uzbek S.S.R.)
1928 — 1940’s W (SCLT), Mo — — 540; R1; 0.50 percent WO3; 1983 1932–36—exploration and development; 1952—milling.
Former Soviet Union
Magadan region, Russian S.F.S.R.
— — — — — — 1,505; R1; 0.8 percent WO3; 1983 Iultinsky mining complex. Production ceased in 1994.
Iul'tin mine 1937 U 1954 Sn, W 8 percent of 1992 Russian conc prod when com-bined with Svetloye & Tenkergin
— — —
Svetloye mine 1983 U — Sn, W 8 percent of 1992 Russian conc prod when com-bined with Iul'tin & Tenkergin
— — —
Tenkergin mine 1983 U — Sn, W 8 percent of 1992 Russian conc prod when com-bined with Iul'tin & Svetloye
— — —
Former Soviet Union
Maykhura (Kulyab Oblast, Tajik S.S.R.)
— — 1978 W (SCLT, WLFM) Sn (CSTR)
— — 5,000; R1; 0.40 percent WO3; 1983 —
Former Soviet Union
Severny Katpar (Dzhezkazgan Oblast, Kazakh S.S.R.)
1973 — — W (SCLT), Mo (MLBD), Cu (CLCP)
— — 73,000; WO3, 0.239 percent WO3; 13,000; Mo, 0.038 percent Mo; 55,700; Cu, 0.16 percent Cu
Explored/reserve deposit; surface mining planned (Mazurov, 1996b).
Former Soviet Union
Shumilovskoye (Chita Oblast, R.F.S.R.)
— — — — — — — —
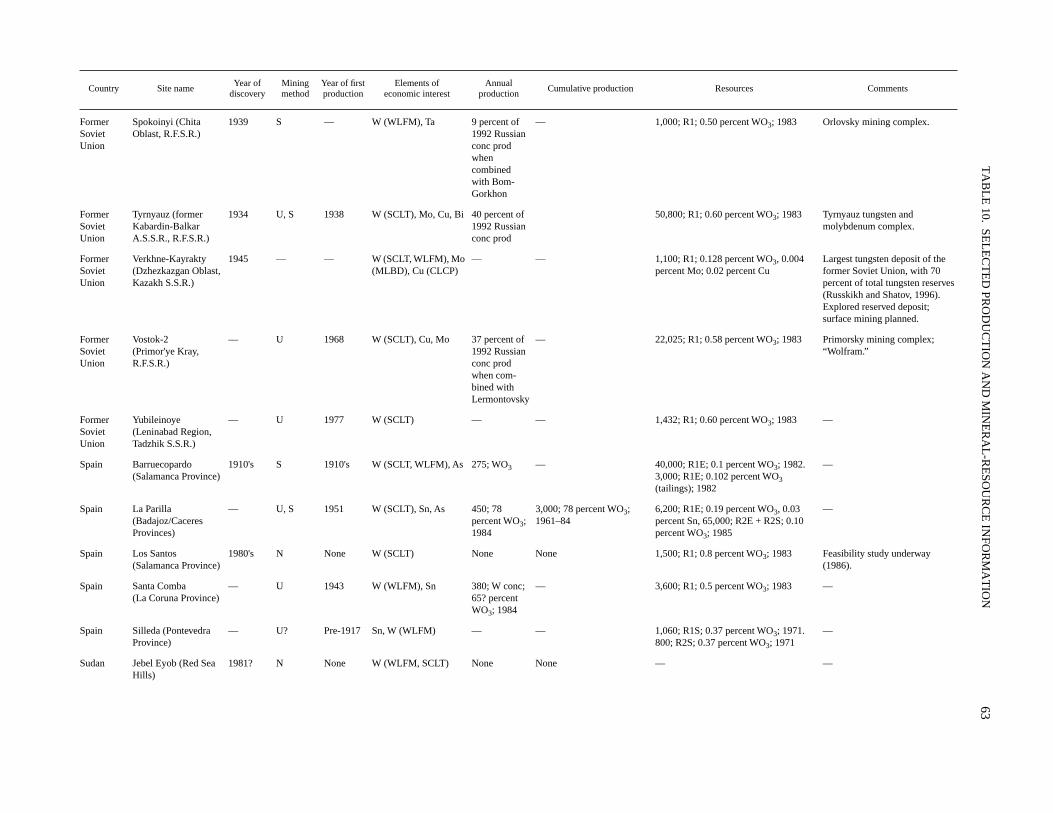
TA
BL
E 10.
SEL
EC
TE
D PR
OD
UC
TIO
N A
ND
MIN
ER
AL
-RE
SOU
RC
E IN
FOR
MA
TIO
N63
Country Site nameYear of
discoveryMining method
Year of first production
Elements of economic interest
Annual production
Cumulative production Resources Comments
Former Soviet Union
Spokoinyi (Chita Oblast, R.F.S.R.)
1939 S — W (WLFM), Ta 9 percent of 1992 Russian conc prod when combined with Bom-Gorkhon
— 1,000; R1; 0.50 percent WO3; 1983 Orlovsky mining complex.
Former Soviet Union
Tyrnyauz (former Kabardin-Balkar A.S.S.R., R.F.S.R.)
1934 U, S 1938 W (SCLT), Mo, Cu, Bi 40 percent of 1992 Russian conc prod
50,800; R1; 0.60 percent WO3; 1983 Tyrnyauz tungsten and molybdenum complex.
Former Soviet Union
Verkhne-Kayrakty (Dzhezkazgan Oblast, Kazakh S.S.R.)
1945 — — W (SCLT, WLFM), Mo (MLBD), Cu (CLCP)
— — 1,100; R1; 0.128 percent WO3, 0.004 percent Mo; 0.02 percent Cu
Largest tungsten deposit of the former Soviet Union, with 70 percent of total tungsten reserves (Russkikh and Shatov, 1996). Explored reserved deposit; surface mining planned.
Former Soviet Union
Vostok-2 (Primor'ye Kray, R.F.S.R.)
— U 1968 W (SCLT), Cu, Mo 37 percent of 1992 Russian conc prod when com-bined with Lermontovsky
— 22,025; R1; 0.58 percent WO3; 1983 Primorsky mining complex; “Wolfram.”
Former Soviet Union
Yubileinoye (Leninabad Region, Tadzhik S.S.R.)
— U 1977 W (SCLT) — — 1,432; R1; 0.60 percent WO3; 1983 —
Spain Barruecopardo (Salamanca Province)
1910's S 1910's W (SCLT, WLFM), As 275; WO3 — 40,000; R1E; 0.1 percent WO3; 1982. 3,000; R1E; 0.102 percent WO3 (tailings); 1982
—
Spain La Parilla(Badajoz/Caceres Provinces)
— U, S 1951 W (SCLT), Sn, As 450; 78 percent WO3; 1984
3,000; 78 percent WO3; 1961–84
6,200; R1E; 0.19 percent WO3, 0.03 percent Sn, 65,000; R2E + R2S; 0.10 percent WO3; 1985
—
Spain Los Santos (Salamanca Province)
1980's N None W (SCLT) None None 1,500; R1; 0.8 percent WO3; 1983 Feasibility study underway (1986).
Spain Santa Comba (La Coruna Province)
— U 1943 W (WLFM), Sn 380; W conc; 65? percent WO3; 1984
— 3,600; R1; 0.5 percent WO3; 1983 —
Spain Silleda (Pontevedra Province)
— U? Pre-1917 Sn, W (WLFM) — — 1,060; R1S; 0.37 percent WO3; 1971. 800; R2S; 0.37 percent WO3; 1971
—
Sudan Jebel Eyob (Red Sea Hills)
1981? N None W (WLFM, SCLT) None None — —
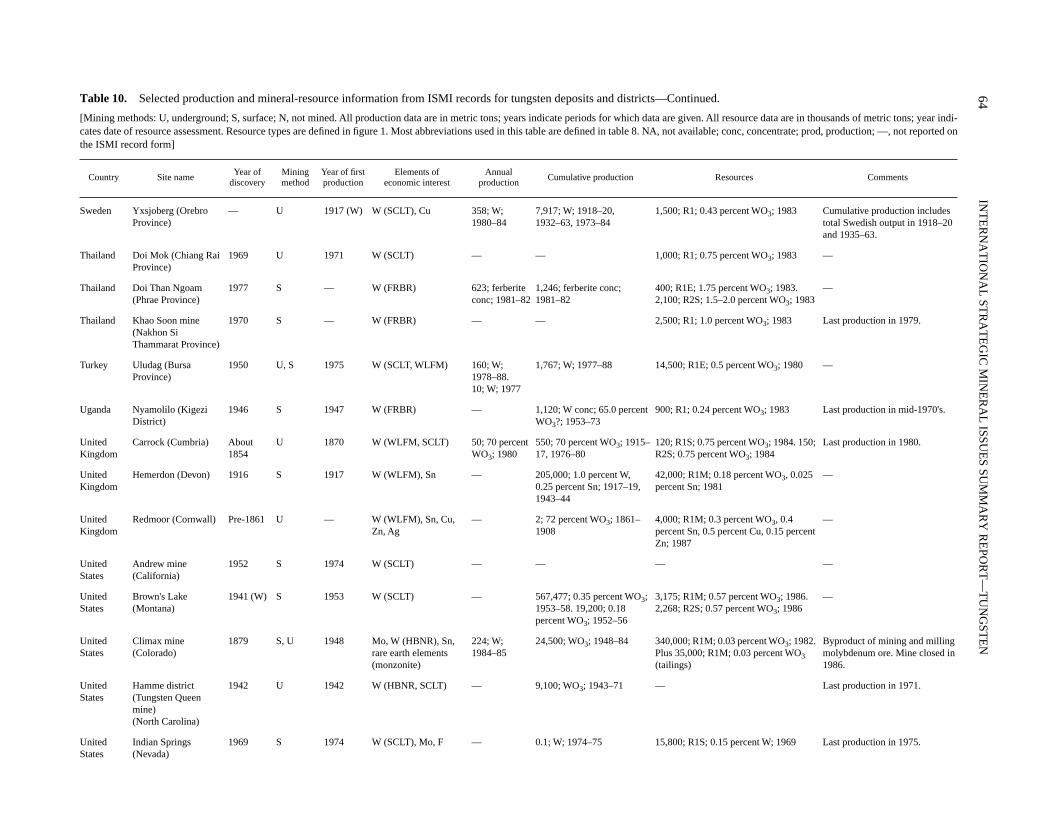
64IN
TE
RN
AT
ION
AL
STR
AT
EG
IC M
INE
RA
L ISSU
ES SU
MM
AR
Y R
EPO
RT
—T
UN
GST
EN
Table 10. Selected production and mineral-resource information from ISMI records for tungsten deposits and districts—Continued.
[Mining methods: U, underground; S, surface; N, not mined. All production data are in metric tons; years indicate periods for which data are given. All resource data are in thousands of metric tons; year indi-cates date of resource assessment. Resource types are defined in figure 1. Most abbreviations used in this table are defined in table 8. NA, not available; conc, concentrate; prod, production; —, not reported onthe ISMI record form]
Country Site nameYear of
discoveryMining method
Year of first production
Elements of economic interest
Annual production
Cumulative production Resources Comments
Sweden Yxsjoberg (Orebro Province)
— U 1917 (W) W (SCLT), Cu 358; W; 1980–84
7,917; W; 1918–20, 1932–63, 1973–84
1,500; R1; 0.43 percent WO3; 1983 Cumulative production includes total Swedish output in 1918–20 and 1935–63.
Thailand Doi Mok (Chiang Rai Province)
1969 U 1971 W (SCLT) — — 1,000; R1; 0.75 percent WO3; 1983 —
Thailand Doi Than Ngoam (Phrae Province)
1977 S — W (FRBR) 623; ferberite conc; 1981–82
1,246; ferberite conc; 1981–82
400; R1E; 1.75 percent WO3; 1983. 2,100; R2S; 1.5–2.0 percent WO3; 1983
—
Thailand Khao Soon mine (Nakhon Si Thammarat Province)
1970 S — W (FRBR) — — 2,500; R1; 1.0 percent WO3; 1983 Last production in 1979.
Turkey Uludag (Bursa Province)
1950 U, S 1975 W (SCLT, WLFM) 160; W; 1978–88. 10; W; 1977
1,767; W; 1977–88 14,500; R1E; 0.5 percent WO3; 1980 —
Uganda Nyamolilo (Kigezi District)
1946 S 1947 W (FRBR) — 1,120; W conc; 65.0 percent WO3?; 1953–73
900; R1; 0.24 percent WO3; 1983 Last production in mid-1970's.
United Kingdom
Carrock (Cumbria) About 1854
U 1870 W (WLFM, SCLT) 50; 70 percent WO3; 1980
550; 70 percent WO3; 1915–17, 1976–80
120; R1S; 0.75 percent WO3; 1984. 150; R2S; 0.75 percent WO3; 1984
Last production in 1980.
United Kingdom
Hemerdon (Devon) 1916 S 1917 W (WLFM), Sn — 205,000; 1.0 percent W, 0.25 percent Sn; 1917–19, 1943–44
42,000; R1M; 0.18 percent WO3, 0.025 percent Sn; 1981
—
United Kingdom
Redmoor (Cornwall) Pre-1861 U — W (WLFM), Sn, Cu, Zn, Ag
— 2; 72 percent WO3; 1861–1908
4,000; R1M; 0.3 percent WO3, 0.4 percent Sn, 0.5 percent Cu, 0.15 percent Zn; 1987
—
United States
Andrew mine (California)
1952 S 1974 W (SCLT) — — — —
United States
Brown's Lake (Montana)
1941 (W) S 1953 W (SCLT) — 567,477; 0.35 percent WO3; 1953–58. 19,200; 0.18 percent WO3; 1952–56
3,175; R1M; 0.57 percent WO3; 1986. 2,268; R2S; 0.57 percent WO3; 1986
—
United States
Climax mine (Colorado)
1879 S, U 1948 Mo, W (HBNR), Sn, rare earth elements (monzonite)
224; W; 1984–85
24,500; WO3; 1948–84 340,000; R1M; 0.03 percent WO3; 1982. Plus 35,000; R1M; 0.03 percent WO3 (tailings)
Byproduct of mining and milling molybdenum ore. Mine closed in 1986.
United States
Hamme district (Tungsten Queen mine)(North Carolina)
1942 U 1942 W (HBNR, SCLT) — 9,100; WO3; 1943–71 — Last production in 1971.
United States
Indian Springs (Nevada)
1969 S 1974 W (SCLT), Mo, F — 0.1; W; 1974–75 15,800; R1S; 0.15 percent W; 1969 Last production in 1975.
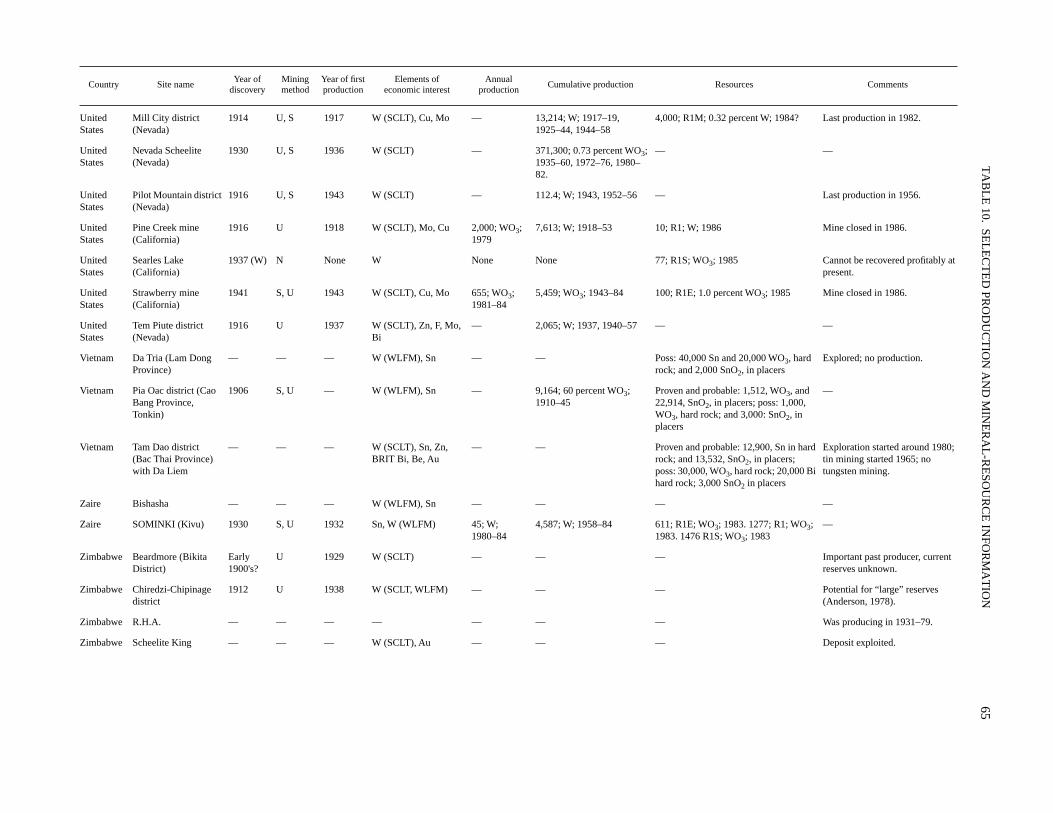
TA
BL
E 10.
SEL
EC
TE
D PR
OD
UC
TIO
N A
ND
MIN
ER
AL
-RE
SOU
RC
E IN
FOR
MA
TIO
N65
Country Site nameYear of
discoveryMining method
Year of first production
Elements of economic interest
Annual production
Cumulative production Resources Comments
United States
Mill City district (Nevada)
1914 U, S 1917 W (SCLT), Cu, Mo — 13,214; W; 1917–19, 1925–44, 1944–58
4,000; R1M; 0.32 percent W; 1984? Last production in 1982.
United States
Nevada Scheelite (Nevada)
1930 U, S 1936 W (SCLT) — 371,300; 0.73 percent WO3; 1935–60, 1972–76, 1980–82.
— —
United States
Pilot Mountain district (Nevada)
1916 U, S 1943 W (SCLT) — 112.4; W; 1943, 1952–56 — Last production in 1956.
United States
Pine Creek mine (California)
1916 U 1918 W (SCLT), Mo, Cu 2,000; WO3; 1979
7,613; W; 1918–53 10; R1; W; 1986 Mine closed in 1986.
United States
Searles Lake (California)
1937 (W) N None W None None 77; R1S; WO3; 1985 Cannot be recovered profitably at present.
United States
Strawberry mine (California)
1941 S, U 1943 W (SCLT), Cu, Mo 655; WO3; 1981–84
5,459; WO3; 1943–84 100; R1E; 1.0 percent WO3; 1985 Mine closed in 1986.
United States
Tem Piute district (Nevada)
1916 U 1937 W (SCLT), Zn, F, Mo, Bi
— 2,065; W; 1937, 1940–57 — —
Vietnam Da Tria (Lam Dong Province)
— — — W (WLFM), Sn — — Poss: 40,000 Sn and 20,000 WO3, hard rock; and 2,000 SnO2, in placers
Explored; no production.
Vietnam Pia Oac district (Cao Bang Province, Tonkin)
1906 S, U — W (WLFM), Sn — 9,164; 60 percent WO3; 1910–45
Proven and probable: 1,512, WO3, and 22,914, SnO2, in placers; poss: 1,000, WO3, hard rock; and 3,000: SnO2, in placers
—
Vietnam Tam Dao district (Bac Thai Province) with Da Liem
— — — W (SCLT), Sn, Zn, BRIT Bi, Be, Au
— — Proven and probable: 12,900, Sn in hard rock; and 13,532, SnO2, in placers; poss: 30,000, WO3, hard rock; 20,000 Bi hard rock; 3,000 SnO2 in placers
Exploration started around 1980; tin mining started 1965; no tungsten mining.
Zaire Bishasha — — — W (WLFM), Sn — — — —
Zaire SOMINKI (Kivu) 1930 S, U 1932 Sn, W (WLFM) 45; W; 1980–84
4,587; W; 1958–84 611; R1E; WO3; 1983. 1277; R1; WO3; 1983. 1476 R1S; WO3; 1983
—
Zimbabwe Beardmore (Bikita District)
Early 1900's?
U 1929 W (SCLT) — — — Important past producer, current reserves unknown.
Zimbabwe Chiredzi-Chipinage district
1912 U 1938 W (SCLT, WLFM) — — — Potential for “large” reserves (Anderson, 1978).
Zimbabwe R.H.A. — — — — — — — Was producing in 1931–79.
Zimbabwe Scheelite King — — — W (SCLT), Au — — — Deposit exploited.
66 INTERNATIONAL STRATEGIC MINERAL ISSUES SUMMARY REPORT—TUNGSTEN
REFERENCES CITED
Ahlfeld, Federico, 1954, Los yacimientos minerales de Bolivia:Bilbao, Imprenta Industrial, S.A., 277 p.
Ahmed, A.A.M., 1979, General outline of the geology and mineraloccurrences of the Red Sea Hills: Sudan Geological and Min-eral Resources Department Bulletin 30, 63 p.
Altringer, P.B., Brooks, P.T., Dannenberg, R.O., and Marchant,W.N., 1979, Tungsten recovery from Searles Lake brines byion exchange: Mining Engineering, v. 31, no. 8, p. 1220–1225.
Anderson, C.B., 1978, Tungsten in Rhodesia: Rhodesia GeologicalSurvey Annals, v. 4, p. 76–82.
Anstett, T.F., Bleiwas, D.I., and Hurdelbrink, R.J., 1985, Tungstenavailability—Market economy countries: U.S. Bureau ofMines Information Circular 9025, 51 p.
Anthoine, Pol, Evrard, Pierre, Kharkevitch, Cyrille, and Schaar,Georges, 1968, The Symétain tin deposits—Geology andmining, in A technical conference on tin [London, 1967,Papers]: London, International Tin Council, v. 2, p. 421–455.
Arribas, A., 1979, Le gisement de tungstène de Barruecopardo:Chronique de la Recherche Minière, no. 450, p. 42–49.
Barabanov, V.F., 1961, [Mineralogy of tungsten deposits in theEastern Transbaikal region]: Leningrad [former SovietUnion], Leningrad University, 360 p. (Reviewed by E.A.Alexandrov: International Geology Review, v. 5, no. 5 (May1963), p. 601–603.)
Baxter, J.L., 1978, Molybdenum, tungsten, vanadium and chro-mium in Western Australia: Western Australia GeologicalSurvey, Mineral Resources Bulletin 11, 140 p.
Bender, F., 1983, Geology of Burma: Berlin, Gebrüder Borntrae-ger, p. 185–192.
Beskin, S.M., Larin, V.N., and Martin, Y.B., 1996a, Physiographictypes of granitic rocks of Kazakhstan and their metallogenicsignificance, in Shatov, V., Seltmann, R., Kremenetsky, A.,Lehmann, B., Popov, V., and Ermolov, P., Granite-related oredeposits of central Kazakhstan and adjacent areas: St. Peters-burg, Russia, Glagol Publishing House, p. 259–268.
———1996b, The greisen Mo-W deposit of Aqshatau, centralKazakhstan, in Shatov, V., Seltmann, R., Kremenetsky, A.,Lehmann, B., Popov, V., and Ermolov, P., Granite-related oredeposits of central Kazakhstan and adjacent areas: St. Peters-burg, Russia, Glagol Publishing House, p. 145–154.
Béziat, P., Prouhet, J.P., and Tollon, F., 1980, Le district de Mon-tredon-Labessonnié (Tarn)—W, Sn, F: [France] Bureau deRecherches Géologiques et Minières Mémoire 112, 44 p.
Bunting, R.M., 1987, Tungsten—Chinese torpedo market: Engi-neering and Mining Journal, v. 188, no. 3, p. 60–62.
Burnol, L., and Delille, J.C., 1986, Tungsten deposits of France, inBeus, A.A., ed., Geology of tungsten: Earth Science [Paris], v.18, p. 89–113.
Buros, J., and Wagner, H., 1978, Rohstoffwirtschaftliche Länder-berichte, XVI. UdSSR—Molybdan und Wolfram: Hannover,West Germany, Bundesanstalt für Geowissenschaften undRohstoffe, 147 p.
Cai, Jianming, Liu, Ruolan, and Zeng, Guangsheng, 1982, Studyon fluid inclusion and its relation to mineralization of Pangus-han tungsten deposit, Jiangxi Province, China, in Hepworth,J.V., and Yu, H.Z., eds., Symposium on Tungsten Geology[Jiangxi, China, October 1981]: Bandung [Indonesia],
ESCAP/RMRDC (United Nations Economic and SocialCommission for Asia and the Pacific/Regional MineralResource Development Center), and Beijing, Geological Pub-lishing House, p. 233–243.
Campbell, A.R., Rye, Danny, and Petersen, Ulrich, 1984, A hydro-gen and oxygen isotope study of the San Cristobal mine,Peru—Implications of the role of water to rock ratio for thegenesis of wolframite deposits: Economic Geology, v. 79, no.8, p. 1818–1832.
Carter, W.D., and Kiilsgaard, T.H., 1983, Landsat analysis of theYangjiatan tungsten district, Hunan Province, People’sRepublic of China, in Carter, W.D., Rowan, L.C., and Weill,G., Remote sensing and mineral exploration—1982:Advances in Space Research, v. 3, no. 2, p. 113–123.
Charoensri, P., 1983, The major tungsten districts of Thailand:Conference on Geology and Mineral Resources of Thailand,Bangkok, 19–28 November 1983, 10 p.
Chauris, Louis, and Guigues, Jean, 1969, Gîtes minéraux de laFrance—Notices explicatives regionales des feuilles de lacarte au 1/320,000, v. 1, Massif Amoricain: [France] Bureaude Recherches Géologiques et Minières Mémoire 74, 96 p.
Chen, Z., and Hu, L., 1982, The geological characteristics and pri-mary zoning of Huangsha vein-type tungsten deposit, in Hep-worth, J.V., and Yu, H.Z., eds., Symposium on TungstenGeology [Jiangxi, China, October 1981]: Bandung [Indone-sia], ESCAP/RMRDC (United Nations Economic and SocialCommission for Asia and the Pacific/Regional MineralResource Development Center), and Beijing, Geological Pub-lishing House, p. 257–268.
Chernov, B.S., 1993, The present state and development prospectsof the tungsten raw material base of Russia: Moscow, Miner-alnye Resursy Rossii, 1993, p. 3, 15–19.
Chinese Institute of Geology and Mineral Resources Information,Chinese Institute of Mineral Deposits, and Chinese Academyof Geological Sciences, 1992, Mineral resources maps ofChina: Beijing, Geological Publishing House, scale 1:5,000,000.
Chung, C.K., 1975, Tungsten and molybdenum deposits in SouthKorea: Korean Institute of Mineral and Mining EngineersJournal, v. 12, no. 4, p. 192–199.
Clarke, M.C.G., 1983, Current Chinese thinking on the SouthChina tungsten province: Institution of Mining and Metal-lurgy Transactions, v. 92, sec. B, p. B10–B15.
Coakley, G.J., Crockett, R.N., and Hammerbeck, E.C.I., 1991,International Strategic Minerals Inventory summary report—A regional assessment of selected mineral commodities insubequatorial Africa: U.S. Bureau of Mines Mineral Perspec-tives, 44 p.
Coetzee, C.B., ed., 1976, Mineral resources of the Republic ofSouth Africa (5th ed.): South Africa Geological Survey Hand-book 7, 462 p.
Collins, E.M., and Kesler, S.E., 1969, High temperature telescopedtungsten-antimony mineralization, Guatemala: MineraliumDeposita, v. 4, no. 1, p. 65–71.
Conde, L.N., Pereira, V., Ribeiro, A., and Thadeu, D., 1971, Jazi-gos hipogénicos de estanho e volfrâmio: Congresso Hispano-Luso-Americano de Geologia Economica, 1st, Madrid-Lis-bon, 1971, Livro-guia Excursao, no. 1, pt. 7, 81 p.
Dawson, K.M., and Dick, L.A., 1978, Regional metallogeny of theNorthern Cordillera—Tungsten and base metal-bearing
REFERENCES CITED 67
skarns in southeastern Yukon and southwestern Mackenzie:Canada Geological Survey Paper 76–1A, p. 287–292.
Dekate, Y.G., 1967, Tungsten occurrences in India and their gene-sis: Economic Geology, v. 62, no. 4, p. 556–561.
De Kun, N., 1965, The mineral resources of Africa: New York,Elsevier Publishing Co., 478 p.
Derré, C., 1979, Le gisement de schéelite de Salau: Chronique dela Recherche Minière, no. 450, p. 12–26.
DeYoung, J.H., Jr., Sutphin, D.M., and Cannon, W.F., 1984, Inter-national Strategic Minerals Inventory summary report—Man-ganese: U.S. Geological Survey Circular 930–A, 22 p.
Dick, L.A., and Hodgson, C.J., 1982, The Mactung W-Cu (Zn)contact metasomatic and related deposits of the northeasternCanadian Cordillera: Economic Geology, v. 77, no. 4, p. 845–867.
Dines, H.G., 1956, The metalliferous mining region of south-westEngland: London, Great Britian Geological Survey Memoir,2 v., 795 p.
Dunn, D.P., and Burt, D.M., 1979, Skarn mineralization related topegmatites at the San Antonio tungsten mine, Baviacora,Sonora, Mexico [abs.]: Geological Society of AmericaAbstracts with Programs, v. 11, no. 7, p. 417.
Eadington, P.J., 1983, A fluid inclusion investigation of ore forma-tion in a tin-mineralized granite, New England, New SouthWales: Economic Geology, v. 78, no. 6, p. 1204–1221.
Editorial Committee of the Mineral Deposits of China, 1992, Min-eral deposits of China: Beijing, Geological Publishing House,v. 2.
Fontaine, H., and Workman, D.R., 1978, Review of the geologyand mineral resources of Kampuchea, Laos and Vietnam, inNutalaya, P., ed., Proceedings of the Third Regional Confer-ence on Geology and Mineral Resources of Southeast Asia,Bangkok, Thailand, 14–18 November 1978: p. 539–603.
Forster, C.N., Burson, M.J., and Glover, J.K., 1979, The Lenedtungsten deposit—Oral presentation at the 7th GeoscienceForum, Whitehorse, Yukon Territory, December 2–4, 1979.
Fries, Carl, Jr., and Schmitter, Eduardo, 1945, Scheelite deposits inthe northern part of the Sierra de Juarez, Northern Territory,Lower California, Mexico: U.S. Geological Survey Bulletin946–C, p. 73–101.
Gaukroger, K.F., 1984, A final report on the assessment ofscheelite mineralization in southern Asia: Saudi Arabian Dep-uty Ministry for Mineral Resources Open File Report, RF–OF–04–3, 11 p.
Ginn, R.M., and Beecham, A.W., 1986, The Fostung scheelitedeposit, Espanola, Ontario: Canadian Geology Journal ofCIM, v. 1, no. 1, p. 46–54.
Giuliani, G., Li, Y.D., and Sheng, T.F., 1988, Fluid inclusion studyof Xihuashan tungsten deposit in southern Jiangxi province,China: Mineralium Deposita, v. 23, no. 1, p. 24–33.
Goossens, P.J., 1978, The metallogenic provinces of Burma—Their definitions, geologic relationships, and extension intoChina, India, and Thailand, in Nutalaya, P., ed., Proceedingsof the Third Regional Conference on Geology and MineralResources of Southeast Asia, Bangkok, Thailand, 14–18November 1978: p. 431–492.
Gouanvic, Y., and Gagny, C., 1983, Étude d’une aplopegmatitelitée à cassitérite et wolframite, magma différencié de1’endogranite de la mine de Santa Comba (Galice, Espagne):
Société Géologique de France Bulletin, v. 25, no. 3, p. 335–348.
Grabher, D.E., 1984, Skarn deposits—Union Carbide’s PilotMountain project, geologic setting and field trip guide, inJohnson, J.L., ed., Exploration for ore deposits in NorthAmerican Cordillera—Field trip guidebook: Reno, Nev.,Association of Exploration Geochemists, p. FT5–FT24.
Grant, J.N., Halls, C., Sheppard, S.M.F., and Avila, W., 1980, Evo-lution of the porphyry tin deposits of Bolivia, in Ishihara, S.,and Takenouchi, S., eds., Granite magmatism and relatedmineralization: The Society of Mining Geologists of Japan,Mining Geology Special Issue no. 8, p. 151–173.
Häusser, I., 1987, Geologie und mineralische Rohstoffe der Kore-anischen Demokratischen Volksrepublik (KDVR): Berlin,Bundesanstalt für Geowissenschaften und Rohstoffe, unpub-lished report, 45 p.
Haughton, S.H., Frommurze, H.F., Gebers, T.W., Schwellnus,C.M., and Rossouw, P.J., 1939, The geology and mineraldeposits of the Omaruru Area, South West Africa—An expla-nation of Sheet No. 71: Union of South Africa, GeologicalSurvey, 160 p.
Higashimoto, S., 1977, Geology and ore deposits of the Kugamine, southwest Japan: Geological Survey of Japan Bulletin,v. 28, no. 12, p. 775–793.
Higgins, N.C., 1985, Wolframite deposition in a hydrothermal veinsystem—The Grey River tungsten prospect, Newfoundland,Canada: Economic Geology, v. 80, no. 5, p. 1297–1327.
Ho, C.E., 1987, Tungsten: Mining Magazine, v. 156, no. 3, p. 219–221.
Hsu, K.-C., 1943, Tungsten deposits of southern Kiangsi, China:Economic Geology, v. 38, no. 6, p. 431–474.
Il’in, K.B., Markov, K.A., Dragunov, V.I., Ermolaev, B.A., andTerentev, V.M., 1992, Map of mineral resources of Russia andadjacent countries (within the boundaries of the formerUSSR)—Brief explanatory notes: St. Petersburg, VSEGEI,112 p.
Imai, H., Lee, M.S., Ilda, K., Fujiki, Y., and Takenouchi, S., 1975,Geologic structure and mineralization of the xenothermalvein-type deposits in Japan: Economic Geology, v. 70, no. 4,p. 647–676.
Institution of Mining and Metallurgy, 1979, Report of the Institu-tion of Mining and Metallurgy Mission to China, 14–30 Octo-ber 1974, 14 p.
Ivanova, G.F., 1974, Geokhimicheskie Osobennosti VolframovykhMestorozhdenij Mongoli: Geologiya Mestorozhdenij, v. 16,no. 6 (November–December), p. 45–52.
Jones, A., 1996, Ferro-alloy directory and databook (4th ed.): Sur-rey, United Kingdom, Metal Bulletin Books, Ltd., 362 p.
Karahan, S., Demirci, A., and Atademir, R., 1980, Turkish tungstenproducer redesigns for efficiency: World Mining, v. 33, no.10, p. 46–51.
Kelly, W.C., and Rye, R.O., 1979, Geologic, fluid inclusion, andstable isotope studies of the tin-tungsten deposits ofPanasqueira, Portugal: Economic Geology, v. 74, no. 8, p.1721–1822.
Kerr, P.F., 1934, Geology of the tungsten deposits near Mill City,Nevada: University of Nevada Bulletin, v. 28, no. 2, 46 p.
Kim, S.E., and Hwang, D.H., 1983, Metallogenesis in Korea—Explanatory text for metallogenic map of Korea: Seoul,Korean Institute of Energy and Resources, 52 p.
68 INTERNATIONAL STRATEGIC MINERAL ISSUES SUMMARY REPORT—TUNGSTEN
Kooiman, G.J.A., McLeod, H.J., and Sinclair, W.D., 1986, Por-phyry tungsten-molybdenum orebodies, polymetallic veinsand replacement bodies and tin-bearing greisen zones in theFire Tower Zone, Mount Pleasant, New Brunswick: Eco-nomic Geology, v. 81, no. 6, p. 1356–1373.
Kwak, T.A.P., and Tan, T.H., 1981, The geochemistry of zoning inthe skarn minerals at King Island (Dolphin) mine: EconomicGeology, v. 76, no. 2, p. 468–497.
Landis, G.P., and Rye, R.O., 1974, Geologic, fluid inclusion, andstable isotope studies of the Pasto Bueno tungsten-base metalore deposit, northern Peru: Economic Geology, v. 69, no. 7,p. 1025–1059.
Lennan, W.B., 1983, Ray Gulch tungsten skarn deposit, DublinGulch area [abs.], in Mineral deposits of northern Cordillera,program with abstracts: Montreal, Canadian Institute of Min-ing and Metallurgy, p. 28–29.
Lesch, L., 1984, Bericht über die fachlichen Ergebnisse derDienstreise in die KDVR im Zeitraum vom 20.9 bis3.10.1984: Dresden, unpublished report, 11 p.
Li, K.C., and Wang, C.Y., 1955, Tungsten—Its history, geology,ore-dressing, metallurgy, chemistry, analysis, applications,and economics: New York, Reinhold Publishing Corporation,506 p.
Li, Y., 1993, Poly-type model for tungsten deposits and verticalstructural model for vein-type tungsten deposits in SouthChina, in Kirkham, R.V., Sinclair, W.D., Thorpe, R.I., andDuke, J.M., Mineral deposit modeling: Geological Associa-tion of Canada Special Paper 40, p. 555–568.
Liu, W., 1982, Geological features of mineralization of the Xinglu-okeng tungsten (molybdenum) deposit, Fujian Province, inHepworth, J.V., and Yu, H.Z., eds., Symposium on TungstenGeology [Jiangxi, China, October 1981]: Bandung [Indone-sia], ESCAP/RMRDC (United Nations Economic and SocialCommission for Asia and the Pacific/Regional MineralResource Development Center), and Beijing, Geological Pub-lishing House, p. 339–348.
Lofts, P.G., 1986, Baid al Jimalah tungsten prospect, Najd region,Kingdom of Saudi Arabia, in Drysdall, A.R., Ramsay, C.R.,and Stoeser, D.B., eds., Felsic plutonic rocks and associatedmineralization of the Kingdom of Saudi Arabia: Journal ofAfrican Earth Sciences, v. 4, p. 229–236.
Lokras, K.V., Gajbjiye, N.G., and Raju, A.V., 1981, Agargaontungsten deposit, Nagpur district, Maharashtra: India Geolog-ical Survey Bulletin, Series A—Economic Geology, no. 42,63 p.
Longe, R.V., and others, 1978, Computer-based files on mineraldeposit—Guidelines and recommended standards for datacontent [prepared by Mineral Deposits Working Committee,National Advisory Committee on Research in the GeologicalSciences]: Canada Geological Survey Paper 78–26, 72 p.
Lu, Huangzhang, 1985, Fluid inclusion studies of a new type ofore deposit—Porphyry tungsten occurrence in China:Geochemistry, v. 4, no. 1, p. 41–52.
Ma, Linqing, 1982, The geological characteristics of Damingshansedimentary-magmatic-hydrothermal wolframite deposit,Guangxi Zhuang Autonomous Region, China, in Hepworth,J.V., and Yu, H.Z., eds., Symposium on Tungsten Geology[Jiangxi, China, October 1981]: Bandung [Indonesia],ESCAP/RMRDC (United Nations Economic and SocialCommission for Asia and the Pacific/Regional Mineral
Resource Development Center), and Beijing, Geological Pub-lishing House, p. 374–384.
Martin, H.J., 1964, The Bikita tinfield: Southern Rhodesia Geolog-ical Survey Bulletin 58, 147 p.
Mathieson, G.A., and Clark, A.H., 1984, The Cantung E zone ore-body, Tungsten, Northwest Territories—A revised geneticmodel: Economic Geology, v. 79, no. 5, p. 883–901.
Mazurov, A.K., 1996a, The Koktenkol stockwork W-Mo deposit,central Kazakhstan, in Shatov, V., Seltmann, R.,Kremenetsky, A., Lehmann, B., Popov, V., and Ermolov, P.,Granite-related ore deposits of central Kazakhstan and adja-cent areas: St. Petersburg, Russia, Glagol Publishing House,p. 155–165.
———1996b, The skarn-greisen tungsten deposit of Qatpar, cen-tral Kazakhstan, in Shatov, V., Seltmann, R., Kremenetsky,A., Lehmann, B., Popov, V., and Ermolov, P., Granite-relatedore deposits of central Kazakhstan and adjacent areas: St.Petersburg, Russia, Glagol Publishing House, p. 181–186.
Moussu, R., 1965, Les gisements d’étain et wolfram de Saxe etBohème—Notes d’un voyage d’études: [France] Bureau deRecherches Géologiques et Minières Bulletin 4, p. 1–68.
Murakoshi, T., and Hashimoto, K., 1956, Geology and mineralresources of Japan: Geological Survey of Japan, March 1956,p. 188–190.
Nakamura, T., and Kim, M.Y., 1982, Macrostructure of vein fillingin ore veins, with special reference to those of plutonic tung-sten-tin-copper veins at Otani mine, Kyoto Prefecture, Japan:Mining Geology, v. 32, no. 172, p. 85–95.
Newberry, R.J., 1982, Tungsten-bearing skarns of the SierraNevada, I—The Pine Creek mine, California: EconomicGeology, v. 77, no. 4, p. 823–844.
Nishiwaki, Mikio, and others, 1960, Prospecting at the Yagukimine and its effects: Mining Geology (Tokyo), v. 10, p. 329–337.
Noble, S.R., Spooner, E.T.C., and Harris, F.R., 1984, The Logtunglarge tonnage, low-grade W (scheelite)-Mo porphyry deposit,south-central Yukon Territory: Economic Geology, v. 79,no. 5, p. 848–868.
Nokleberg, W.J., 1981, Geologic setting, petrology, and geochem-istry of zoned tungsten-bearing skarns at the Strawberrymine, central Sierra Nevada, California: Economic Geology,v. 76, no. 1, p. 111–133.
Ohlsson, L.G., 1979, Tungsten occurrences in central Sweden:Economic Geology, v. 74, no. 5, p. 1012–1034.
Ohmachi, H., 1977, Geology and mineral resources of Japan: Geo-logical Survey of Japan, unpublished paper.
Panova, E.G., and Gavrilenko, V.V., 1996, Mineralogy andgeochemistry of wallrock alteration at the tungsten depositsof Boguty and Aqshatau, south and central Kazakhstan, inShatov, V., Seltmann, R., Kremenetsky, A., Lehmann, B.,Popov, V., and Ermolov, P., Granite-related ore deposits ofcentral Kazakhstan and adjacent areas: St. Petersburg, Russia,Glagol Publishing House, p. 332–336.
Parker, J.M., 3d, 1963, Geologic setting of the Hamme tungstendistrict, North Carolina and Virginia: U.S. Geological SurveyBulletin 1122–G, 69 p.
Pattee, E.C., 1960, Tungsten resources of Montana—Deposits ofthe Mount Torrey batholith, Beaverhead County: U.S. Bureauof Mines Report of Investigations 5552, 41 p.
REFERENCES CITED 69
Pelletier, R.A., 1964, Mineral resources of south-central Africa:Capetown, Oxford University Press, 277 p.
Petersen, U., 1965, Regional geology and major ore deposits ofcentral Peru: Economic Geology, v. 60, no. 3, p. 407–476.
Plimer, I., 1975, Wolfram Camp wolframite-molybdenite-bismuth-quartz pipes, North Queensland, in Knight, C.L., ed., Eco-nomic geology of Australasia and Papua New Guinea, v. 1—Metals: Australasian Institute of Mining and MetallurgyMonograph Series 5, p. 760–762.
Plumridge, C.L., 1975, Mount Carbine tungsten reef swarm, inKnight, C.L., ed., Economic geology of Australia and PapuaNew Guinea, v. 1—Metals: Australasian Institute of Miningand Metallurgy Monograph Series 5, p. 762–764.
Pollard, P.J., 1981, Hydrothermal tin-tungsten mineralization andorigin of associated cordierite-anthophyllite rocks at TommyBurns Mine, North Queensland: Institution of Mining andMetallurgy Transactions, sec. B, v. 90, p. 365–370.
Proshin, J.M., 1995, On current state and measures to developthe raw material base of metallurgy: Moscow, Mineral’nyeresursy Rossii, p. 4, 34–35.
Rabchevsky, G.A., 1988, The tungsten industry of the U.S.S.R.:U.S. Bureau of Mines Mineral Issues, November 1988, 50 p.
Reedman, A.J., 1973, Partly mobilized syngenetic tungsten depositat Nyamalilo mine: Overseas Geology and MineralResources, no. 41, p. 101–106.
Reynaud, R., 1982, Production and trading of Portuguese tungstenores—Main production centers in Portugal, in EuropeanTungsten Seminar, Lisbon, 22–24 March 1982: Portugal-European Communities’ Document III/208/84–E, 24 p.
Ross, D.C., 1961, Geology and mineral deposits of MineralCounty, Nevada: Nevada Bureau of Mines Bulletin 58, 98 p.
Roush, G.A., 1935, Strategic mineral supplies 5.0, tungsten: TheMilitary Engineer, v. 27, no. 154, p. 280–285, and v. 27,no. 155, p. 343–348.
Ruiz, J., and Barton, H.D., 1985, Geology and geochemistry ofNaica, Chihuahua, Mexico: Preprint, 1985 Annual meeting ofthe Society of Mining Engineers of the American Institute ofMining, Metallurgical and Petroleum Engineers (SME–AIME), 3 p.
Russkikh, S.S., and Shatov, V.V., 1996, The Verkhnee Qairaqtyscheelite stockwork deposit in central Kazakhstan, in Shatov,V., Seltmann, R., Kremenetsky, A., Lehmann, B., Popov, V.,and Ermolov, P., Granite-related ore deposits of central Kaza-khstan and adjacent areas: St. Petersburg, Russia, Glagol Pub-lishing House, p. 167–180.
Sabir, H., and Labbé, J.-F., 1986, Bi’r Tawilah tungsten prospect,Najd region, Kingdom of Saudi Arabia, in Drysdall, A.R.,Ramsay, C.R., and Stoeser, D.B., eds., Felsic plutonic rocksand associated mineralization of the Kingdom of Saudi Ara-bia: Journal of African Earth Sciences, v. 4, p. 249–255.
Safa, P., Couilloud, D., Tessier, B., and Moine, B., 1987, Le gise-ment de tungstène de Fumade (Tarn, France)—Gitologie, car-actères pétrographiques et géochimiques des skarns et desgranites: Chronique de la Recherche Minière, no. 487, p. 39–51.
Sawkins, F.J., 1979, Fluid inclusion studies of the Inguaran cop-per-bearing breccia pipes, Michoacán, Mexico: EconomicGeology, v. 74, no. 4, p. 924–927.
Schanz, J.J., Jr., 1980, The United Nations’ endeavor to standard-ize mineral resource classification: Natural Resources Forum,v. 4, no. 3, p. 307–313.
Scherer, F.M., 1970, Industrial market structure and economic per-formance: Chicago, Rand McNally College Publishing Co.,576 p.
Segerstrom, K., 1967, Geology and ore deposits of central Ata-cama Province, Chile: Geological Society of America Bulle-tin, v. 79, p. 305–319.
Serjeantson, R., 1997, Non-ferrous metal works of the world (7thed.): Surrey, United Kingdom, Metal Bulletin Books, Ltd.,662 p.
Shepherd, T.J., Beckinsale, R.D., Rundle, C.C., and Durham, J.,1976, Genesis of Carrock Fell tungsten deposits, Cumbria—Fluid inclusions and isotopic study: Institution of Mining andMetallurgy Transactions, sec. B, v. 85, p. B63–B73.
Shi, Mingkui, and Hu, Xiongwei, 1988, The geological character-istics and genesis of the granite-hosted tungsten deposit atDajishan mine, Jiangxi Province, China: 7th QuadrennialIAGOD (International Association on the Genesis of OreDeposits) Symposium, Lulea, Sweden, 1986, Proceedings,p. 613–621.
Shibue, Y., 1984, Chemical compositions of tourmaline in the vein-type tungsten deposits of the Kaneuchi mine, Japan: Minera-lium Deposita, v. 19, no. 4, p. 298–303.
Shishigin, P.R., Yan-Zhin-Shin, V.A., Sitnikov, V.S., Ivanov, G.S.,Kovaley, L.N., Koshlyak, V.S., and Naumov, G.G., 1994,Mineral resources—Base economic development of SachaRepublic (Yakutiya): Otechestvennaya Geologiya, p. 3–9.
Simmons, S.F., and Sawkins, F.J., 1983, Mineralogic and fluidinclusion studies of the Washington Cu-Mo-W-bearing brec-cia pipe, Sonora, Mexico: Economic Geology, v. 78, no. 3,p. 521–526.
Sinclair, W.D., 1986, Molybdenum, tungsten and tin deposits andassociated granitoid intrusions in the northern Canadian Cor-dillera and adjacent parts of Alaska, in Morin, J.A., ed., Min-eral deposits of northern Cordillera: The Canadian Institute ofMining and Metallurgy Special Volume 37, p. 216–233.
Slack, J.F., 1972, Structure, petrology, and ore deposits of theIndian Springs (Delano Mts.) region, Elko County, Nevada:Oxford, Ohio, Miami University, M.S. thesis, 159 p.
Sluijk, D., 1963, Geology and tin-tungsten deposits of the Regoufearea, northern Portugal: Amsterdam, University of Amster-dam, Ph.D. thesis, 123 p.
Smirnov, V.I., ed., 1977, Ore deposits of the U.S.S.R.: San Fran-cisco, Pitman Publishing Ltd., v. III, 492 p.
So, C.-S., Rye, D.M., and Shelton, K.L., 1983, Carbon, hydrogen,oxygen, and sulfur isotope and fluid inclusion study of theWeolag tungsten-molybdenum deposit, Republic of Korea—Fluid histories of metamorphic and ore-forming events: Eco-nomic Geology, v. 78, no. 8, p. 1551–1553.
So, C.-S., Shelton, K.L., and Rye, D.M., 1983, Geologic, sulfurisotopic, and fluid inclusion study of the Ssang Jeong tung-sten mine, Republic of Korea: Economic Geology, v. 78,no. 1, p. 157–163.
So, C.-S., Shelton, K.L., Seidemann, D.E., and Skinner, B.J., 1983,The Dae Hwa tungsten-molybdenum mine, Republic ofKorea—A geochemical study: Economic Geology, v. 78,no. 5, p. 920–930.
70 INTERNATIONAL STRATEGIC MINERAL ISSUES SUMMARY REPORT—TUNGSTEN
Stafford, P.T., 1985, Tungsten, in Knoerr, A.W., ed., Mineral factsand problems: U.S. Bureau of Mines Bulletin 675, p. 881–894.
Stemprok, M., 1986, Tungsten deposits of central Europe, in Beus,A.A., ed., Geology of tungsten: Earth Sciences [Paris], v. 18,p. 79–87.
Strauss, C.A., 1954, The geology and mineral deposits of the Pot-geitersrus tin-fields: South Africa Geological Survey Memoir46, 252 p.
Swift, W.H., White, W.C., Wiles, J.W., and Worst, B.G., 1953, Thegeology of the Lower Sabi coalfield: Southern Rhodesia Geo-logical Survey Bulletin 40, 96 p.
Tanelli, G., 1982, Geological setting, mineralogy and genesis oftungsten mineralization in Dayu district, Jiangxi (People’sRepublic of China)—An outline: Mineralium Deposita, v. 17,no. 2, p. 279–294.
Taylor, R.G., 1979, Geology of tin deposits: Amsterdam, Elsevier,543 p.
Tschanz, C.M., and Pampeyan, G.H., 1970, Geology and mineraldeposits of Lincoln County, Nevada: Nevada Bureau of MinesBulletin 73, 187 p.
United Nations Economic and Social Commission for Asia and thePacific (ESCAP), 1990, Vietnam, v. 6 of Atlas of mineralresources of the ESCAP region: Bangkok, United NationsESCAP, 123 p.
United Nations Economic and Social Council, 1979, The interna-tional classification of mineral resources—Report of theGroup of Experts on Definitions and Terminology for MineralResources: United Nations document E/C.7/104, 28 p.,including annexes.
U.S. Bureau of Mines, 1923–95, Minerals yearbook: Washington,D.C., U.S. Government Printing Office, 108 v.
———1993, Metal prices in the United States through 1991: U.S.Bureau of Mines special publication, p. 179–184.
U.S. Geological Survey, 1905–22, Mineral resources of the UnitedStates: Washington, D.C., U.S. Government Printing Office,45 v. (Continued by U.S. Bureau of Mines).
———1996, Tungsten—Annual review—1995: U.S. GeologicalSurvey Mineral Industry Surveys, November 1996, 16 p.
Vaché, R., 1979, La gisement de schéelite de Mittersill: Chroniquede la Recherche Minière, no. 450, p. 9–13.
Victor, I., 1957, Burnt Hill wolframite deposit, New Brunswick,Canada: Economic Geology, v. 52, no. 1, p. 149–168.
Wagner, H., and Berthold, G., 1979, RohstoffwirtschaftlicheLänderberichte XXIII—COMECON rohstoffwirtschaflicherÜberblick: Hannover, West Germany, Bundesanstalt fürGeowissenschaften und Rohstoffe, 253 p.
Wallace, S.R., Muncaster, N.K., Jonson, D.C., Mackenzie, O.,Bookstrom, A., and Surface, V.E., 1968, Multiple intrusionand mineralization at Climax, Colorado, in Ridge, J.D., ed.,Ore deposits in the United States, 1933/1967: New York,American Institute of Mining, Metallurgical and PetroleumEngineers, v. 1, p. 605–640.
Wang, C., Xu, Y., Xie, C., and Xu, W., 1982, The geological char-acteristics of Shizhuyuan W-Sn-Mo-Bi deposit, Hunan Prov-ince, China, in Hepworth, J.V., and Yu, H.Z., eds.,Symposium on Tungsten Geology [Jiangxi, China, October1981]: Bandung [Indonesia], ESCAP/RMRDC (UnitedNations Economic and Social Commission for Asia and the
Pacific/Regional Mineral Resource Development Center), andBeijing, Geological Publishing House, p. 413–425.
Willig, C.D., and Delgado, J., 1985, South America as a source oftungsten, in Proceedings of the Third International TungstenSymposium, Madrid, 13–17 May 1985: Shrewsbury, England,MPR Publishing Services Ltd., p. 58–85.
Wolff, G.C., 1978, The Kara deposit, in Green, D.C., and Wil-liams, P.R., eds., Geology and mineralization of N.W. Tasma-nia (—Proceedings of a symposium held at Burnie, 11–12November 1978): Geological Society of Australia, TasmaniaDivision, p. 37–38.
World Bank, 1996, World development report 1996: New York,Oxford University Press, p. 90–93.
Wu, Y., Mei, Y., Lui, P., Cai, C., and Lu, T., 1987, Geology of theXihuashan tungsten ore field: Beijing, Geological PublishingHouse, Geological Memoirs, ser. 4, no. 2. (In Chinese with a27-page English abstract.)
Wu, W., 1979, Chinese tungsten ores, in Tungsten, ProceedingsFirst International Tungsten Symposium, Stockholm, 5–7September 1979: London, Mining Journal Books, p. 118–126.
Xia, Hongyuan, Linag, Shuyi, Xie, Weixin, and Shuai, Dequan,1982, Primary zoning of Huangsha tungsten deposit and itsgenesis, Jiangxi Province, China, in Hepworth, J.V., and Yu,H.Z., eds., Symposium on Tungsten Geology [Jiangxi, China,October 1981]: Bandung [Indonesia], ESCAP/RMRDC(United Nations Economic and Social Commission for Asiaand the Pacific/Regional Mineral Resource DevelopmentCenter), and Beijing, Geological Publishing House, p. 451–461.
Yan, H.Z., Wu, Y.L., and Li, C.Y., 1980, Metallogenetic systems oftungsten and their mineralization characteristics, in Ishihara,S., and Takenouchi, S., eds., Granite magmatism and relatedmineralization: Society of Mining Geologists of Japan, Min-ing Geology Special Issue, no. 8, p. 215–221.
Zaw, U.K., 1984, Geology and geothermometry of vein-type W-Sndeposits at Pennaichaung and Yetkanzintaung prospects,Tavoy Township, Tennasserim Division, southern Burma:Mineralium Deposita, v. 19, no. 2, p. 138–144.
ADDITIONAL REFERENCES ON TUNGSTEN RESOURCES
Angelleli, V., Fernandez Lima, J.C., Herrera, A., and Aristarain, L.,1970, Descripción del mapa metalogenético de la RepúblicaArgentina—Minerales metalíferos: Argentina Ministerio deEconomía y Trabajo, Secretaria de Estado de Mineria, Direc-ción Nacional de Geología y Minería, Anales XV, 172 p.
Barbier, C., 1971, The economics of tungsten: London, Metal Bul-letin Books Ltd., 191 p.
Beus, A.A., ed., 1986, Geology of tungsten: Earth Science [Paris],v. 18, 280 p.
Bichan, H.R., Gaskell, J.L., and Hubble, P.A., 1979, Availability oftin and tungsten to British industry, in Jones, M.J., ed., Avail-ability of strategic minerals: London, The Institution of Min-ing and Metallurgy, p. 18–31.
Brazil, Ministério das Minas e Energia, Departamento Nacional daProducao Mineral, 1980, Availiacao regional do setor mineral
ADDITIONAL REFERENCES ON TUNGSTEN RESOURCES 71
Rio Grande do Norte: Brazil Departamento Nacional da Prod-ucao Mineral Boletim no. 53, p. 89–114.
Burrows, J.C., 1971, Tungsten, an industry analysis: Lexington,Mass., Heath Lexington Books, 289 p.
Carlborg, H., 1930, Varldens Wolframmalmtillganger: Jernkon-torets Annaler, v. 114, p. 455–490.
Chermetinformatsia, 1992, Directory—Enterprises and organiza-tions of non-ferrous metallurgy: Moscow, Chermetinfor-matsin, 137 p.
Chhibber, H.L., 1934, The mineral resources of Burma: London,MacMillan and Co., Ltd., 320 p.
Felicissimo, J., Jr., and De Lima, P., 1945, Tungsténio: Estado deSao Paulo [Brazil], Secretaria de Agricultura, Industria eComércio, Boletim no. 31, 462 p.
Generalov, V.A., and Antonenko, L.K., 1995, The current state anddevelopment prospects of the raw material base of metal-lurgy: Gornyj Zhurnal, 1995, p. 7, 27–31.
Harris, P.M., 1983, Tungsten—A review: Institution of Mining andMetallurgy (London) Occasional Papers, no. 2, 42 p.
Hepworth, J.V., and Yu, H.Z., eds., 1982, Symposium on TungstenGeology [Jiangxi, China, October 1981]: Bandung [Indone-sia], ESCAP/RMRDC (United Nations Economic and SocialCommission for Asia and the Pacific/Regional MineralResource Development Center), and Beijing, Geological Pub-lishing House, 596 p.
Hobbs, S.W., and Elliott, J.E., 1973, Tungsten, in Brobst, D.A.,and Pratt, W.P., eds., United States mineral resources: U.S.Geological Survey Professional Paper 820, p. 667–678.
Ingham, F.T., and Bradford, E.F., 1960, The geology and mineralresources of the Kinta Valley, Perak: Federation of Malaya,Geological Survey District Memoir 9, p. 294–302.
Isaev, E.N., Beshanova, M.P., and Larichkin, V.A., 1995, Mineral-ressourcen der Welt (in Russian): Moscow, Roskomnedra/AOOT VNIIzarubezhgeologija, 575 p.
Kraft, M., and Kampe, A., 1991, Explorationsergebnisse vonAuslandsaktivitäten der DDR, Kurzbeschreibung ausge-wählter Lagerstätten/Vorkommen der Mongolei, Mozambiks,Vietnams, Angolas, Guinea-Bissaus: Berlin, Bundesanstalt
für Geowissenschaften und Rohstoffe, unpublished report, 56p.
Krivcov, A.I., 1993, Der Geologische Dienst und die Entwicklungder mineralischen Rohstoffbasis (in Russian): Moskow, Rosk-omnedra/ZNIGRI, v. I, 617 p., v. II, 161 p.
Kuznetsov, V.A., 1982, West Siberia—Mineral resources—Geologiya SSSR XIV/1: Moscow, Nedra, 319 p.
Mining Journal Books, Ltd., 1979, Tungsten: 1982, Proceedings ofthe First International Tungsten Symposium, Stockholm, 5–7September 1979: London, Mining Journal Books, Ltd., 181 p.
———1982, Tungsten: Proceedings of the Second InternationalTungsten Symposium, San Francisco, 1–5 June 1982: Lon-don, Mining Journal Books, Ltd., 179 p.
Mulligan, R., 1984, Geology of Canadian tungsten occurrences:Geological Survey of Canada, Economic Geology Report 32,121 p.
Pelissonier, H., 1987, Les gisements de tungstène dans le monde:Chronique de la Recherche Minière, no. 487, p. 3–10.
Rastall, R.H., and Wilcockson, M.A., 1920, Tungsten ores: Lon-don, Imperial Institute Monograph on Mineral Resourceswith Special Reference to the British Empire, John Murray,81 p.
Roskill Information Services, Ltd., 1977, The economics of tung-sten (3d ed.): London, Roskill Information Services, Ltd.,132 p.
Strishkov, V.V., 1988, The production of tungsten concentrates inthe U.S.S.R.: Mining Magazine, v. 159, no. 2, p. 112–116.
Surjono and Clarke, M.C.F., 1981, Primary tungsten occurrencesin Sumatra and the Indonesian tin islands, Indonesia: Indone-sia Directorate of Mineral Resources Bulletin, no. 5, v. 1,p. 1–40.
U.S. Department of Commerce, Business and Defense ServicesAdministration, 1956, Materials survey—Tungsten: Washing-ton, D.C., U.S. Government Printing Office, 126 p.
Waller, J., 1986, The outlook for tungsten: Metal Bulletin Monthly,no. 183, p. 76–91.
Yih, S.W.H., and Wang, C.T., 1979, Tungsten—Sources, metal-lurgy, properties and applications: New York, Plenum Press,500 p.
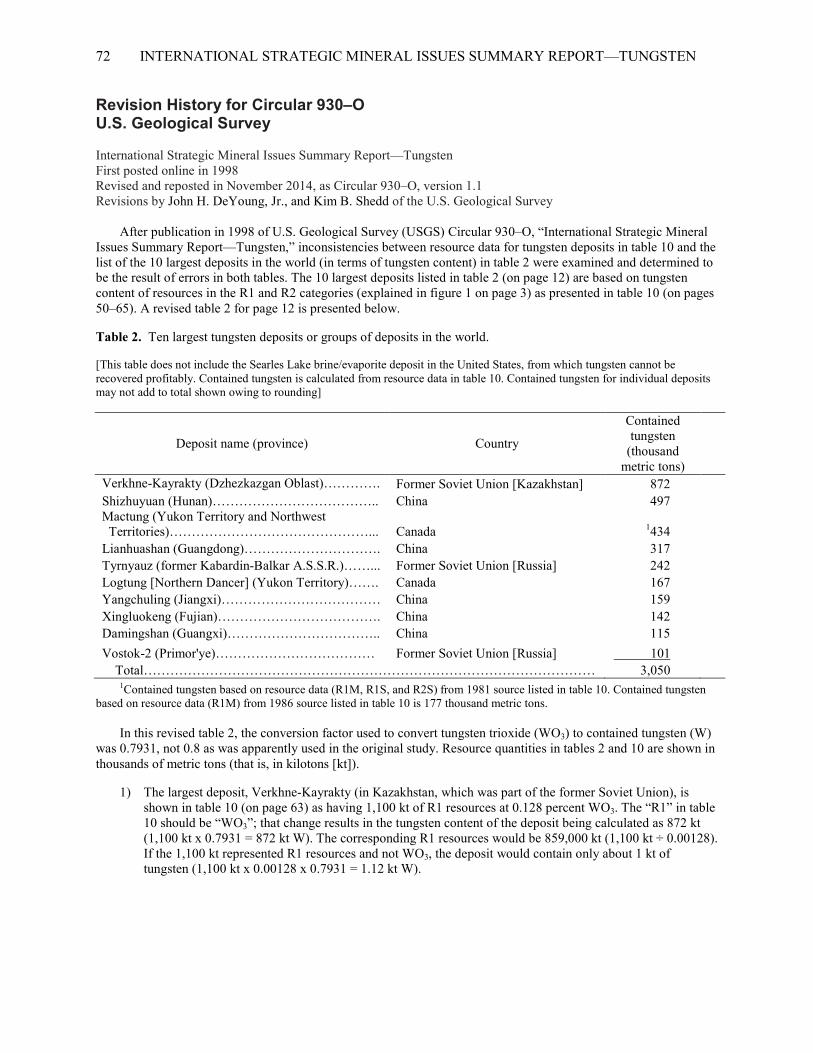
72 INTERNATIONAL STRATEGIC MINERAL ISSUES SUMMARY REPORT—TUNGSTEN
Revision History for Circular 930–O U.S. Geological Survey International Strategic Mineral Issues Summary Report—Tungsten First posted online in 1998 Revised and reposted in November 2014, as Circular 930–O, version 1.1 Revisions by John H. DeYoung, Jr., and Kim B. Shedd of the U.S. Geological Survey
After publication in 1998 of U.S. Geological Survey (USGS) Circular 930–O, “International Strategic Mineral Issues Summary Report—Tungsten,” inconsistencies between resource data for tungsten deposits in table 10 and the list of the 10 largest deposits in the world (in terms of tungsten content) in table 2 were examined and determined to be the result of errors in both tables. The 10 largest deposits listed in table 2 (on page 12) are based on tungsten content of resources in the R1 and R2 categories (explained in figure 1 on page 3) as presented in table 10 (on pages 50–65). A revised table 2 for page 12 is presented below.
Table 2. Ten largest tungsten deposits or groups of deposits in the world.
[This table does not include the Searles Lake brine/evaporite deposit in the United States, from which tungsten cannot be recovered profitably. Contained tungsten is calculated from resource data in table 10. Contained tungsten for individual deposits may not add to total shown owing to rounding]
Deposit name (province) Country
Contained tungsten
(thousand metric tons)
Verkhne-Kayrakty (Dzhezkazgan Oblast)…………. Former Soviet Union [Kazakhstan] 872 Shizhuyuan (Hunan)……………………………….. China 497 Mactung (Yukon Territory and Northwest
Territories)………………………………………... Canada 1434 Lianhuashan (Guangdong)…………………………. China 317 Tyrnyauz (former Kabardin-Balkar A.S.S.R.)……... Former Soviet Union [Russia] 242 Logtung [Northern Dancer] (Yukon Territory)……. Canada 167 Yangchuling (Jiangxi)……………………………… China 159 Xingluokeng (Fujian)………………………………. China 142 Damingshan (Guangxi)…………………………….. China 115 Vostok-2 (Primor'ye)……………………………… Former Soviet Union [Russia] 101 Total………………………………………………………………………………………… 3,050 1Contained tungsten based on resource data (R1M, R1S, and R2S) from 1981 source listed in table 10. Contained tungsten
based on resource data (R1M) from 1986 source listed in table 10 is 177 thousand metric tons.
In this revised table 2, the conversion factor used to convert tungsten trioxide (WO3) to contained tungsten (W) was 0.7931, not 0.8 as was apparently used in the original study. Resource quantities in tables 2 and 10 are shown in thousands of metric tons (that is, in kilotons [kt]).
1) The largest deposit, Verkhne-Kayrakty (in Kazakhstan, which was part of the former Soviet Union), is shown in table 10 (on page 63) as having 1,100 kt of R1 resources at 0.128 percent WO3. The “R1” in table 10 should be “WO3”; that change results in the tungsten content of the deposit being calculated as 872 kt (1,100 kt x 0.7931 = 872 kt W). The corresponding R1 resources would be 859,000 kt (1,100 kt ÷ 0.00128). If the 1,100 kt represented R1 resources and not WO3, the deposit would contain only about 1 kt of tungsten (1,100 kt x 0.00128 x 0.7931 = 1.12 kt W).
REVISION HISTORY FOR CIRCULAR 930–O 73
2) The contained tungsten for the Mactung deposit (in Canada) has been revised from 617 kt to 434 kt. In table 2 of the original report, the estimate for R1M resources from a 1986 source (179 kt W) was added to the R1M + R1S + R2S total from a 1981 source (438 kt W), thus double counting the R1M resources (179 kt W). When the double-counted resource is not included, and the more precise conversion factor is used, the revised tungsten content of the resource, based on data from table 10 (on page 52), is 434 kt (57,000 kt x 0.0096 x 0.7931 = 434 kt W).
3) Table 10 (on page 54) shows that the R1 resources of the Lianhuashan deposit (in China) are 40,000 kt at 1 percent WO3. This represents 317 kt of contained tungsten, ranking the deposit fourth in the revised table 2. It was not included in table 2 of the original report. As a result of this addition, the Ta’ergou deposit (in China), formerly ranked number 10, is not included in the revised table 2.
The identification of these inconsistencies and the preparation of a revised table 2 resulted from attention brought to the largest deposit list (table 2) when it was cited by Pitfield and Brown (2011, p. 15) and Silberglitt and others (2013, p. 41). These reports listed the 12 largest tungsten deposits based on contained tungsten data for the 10 deposits in table 2 of USGS Circular 930–O and more recent resource data for the Hemerdon deposit in the United Kingdom (309 kt W; was 60 kt W in USGS Circular 930–O) and the O’Callaghan’s deposit in Western Australia, which was discovered in mid-2008 (Pitfield and Brown, 2011, p. 15). The revised table 2 in this revision history is based on the data in table 10 of USGS Circular 930–O. No attempt has been made to update the data in table 10. For example, there are more recent resource estimates for Hemerdon (see above) and Mactung (estimates calculated to Canada’s National Instrument 43–101 standards result in indicated plus inferred resources of 382 kt WO3 or 303 kt W per Wardrop Engineering, Inc., 2009, p. 1–2 to 1–3). Also, recent discoveries, such as O’Callaghan’s (see above) or recent development of previously discovered deposits, such as at the Sisson deposit in New Brunswick, Canada (221 kt WO3 or 175 kt W; see Northcliff Resources Ltd., 2013) contain sufficient resources to be considered in a listing of large tungsten deposits. In addition, no attempt has been made to correct other parts of Circular 930–O (abstract, text, tables, figures, or maps) that may have been based on the original table 2.
In addition, the presentation of the resource data in table 2 with three significant digits implies greater precision than is inherent in resource estimates. The annual USGS Mineral Commodity Summaries report presents reserve and resource estimates with no more than two significant digits (U.S. Geological Survey, 2014).
Acknowledgment
The authors gratefully acknowledge the counsel of W. David Sinclair, economic geologist at the Geological Survey of Canada and a coauthor of Circular 930–O, for sharing his recollection of the construction of table 2 in that publication and for providing examples demonstrating the reasons that recent resource numbers may not be comparable to those of the original report. Some of these reasons are new information on the discovery of deposits after Circular 930–O was prepared (mid-1980s) and released (1998), reevaluation of deposits that were identified when the data were compiled, changes in resource reporting standards, and differences among applications of those standards in different countries.
References Cited
Northcliff Resources Ltd., 2013, Development/history [of the Sisson deposit]: Vancouver, British Columbia, Canada, Northcliff Resources Ltd., accessed June 4, 2014, at http://www.northcliffresources.com/s/Development.asp.
Pitfield, Peter, and Brown, Teresa, 2011, Tungsten [commodity profile]: Keyworth, Nottingham, United Kingdom, British Geological Survey, 33 p., accessed June 3, 2014, at http://www.bgs.ac.uk/downloads/start.cfm?id=1981.
Silberglitt, Richard, Bartis, J.T., Chow, B.G., An, D.L., and Brady, Kyle, 2013, Critical materials—Present danger to U.S. manufacturing (prepared for the National Intelligence Council): Santa Monica, Calif., RAND Corporation, document RR–133–MC, 46 p. [Also available at http://www.rand.org/pubs/research_reports/RR133.html.]
U.S. Geological Survey, 2014, Mineral commodity summaries 2014: U.S. Geological Survey, 196 p., accessed June 4, 2014, at http://minerals.usgs.gov/minerals/pubs/mcs/2014/mcs2014.pdf.
74 INTERNATIONAL STRATEGIC MINERAL ISSUES SUMMARY REPORT—TUNGSTEN
Wardrop Engineering, Inc., 2009, Amended technical report on the Mactung property, document no. 1053390100-REP-R0001-00, prepared for North American Tungsten Corporation, Ltd.: Vancouver, British Columbia, Canada, Wardrop Engineering, Inc., [372] p., accessed June 4, 2014, at the SEDAR (System for Electronic Document Analysis and Retrieval) Web site at http://www.sedar.com/.
Suggested Citation of USGS Circular 930–O, Version 1.1
Werner, A.B.T., Sinclair, W.D., and Amey, E.B., 2014, International strategic mineral issues summary report—Tungsten (ver. 1.1, November 2014): U.S. Geological Survey Circular 930–O, 74 p., http://pubs.usgs.gov/ circ/0930/o/. [Supersedes version 1.0 published in 1998; revisions in 2014 by John H. DeYoung, Jr., and Kim B. Shedd.]
International Strategic Mineral IssuesSummary Report
U.S. GEOLOGICAL SURVEY CIRCULAR 930
Prepared as a cooperative effort among earth-science and mineral-resource agencies of Australia, Canada, the Federal Republic of Germany, the Republic of South Africa, the United Kingdom, and the United States of America
This volume was published asseparate chapters A–O
U.S. DEPARTMENT OF THE INTERIORBRUCE BABBITT, Secretary
U.S. GEOLOGICAL SURVEYTHOMAS J. CASADEVALL, Acting Director
Any use of trade, product, or firm names in this publication is for descriptive purposes only anddoes not imply endorsement by the U.S. Government.
Published in the Eastern Region, Reston, Va.
VOLUME CONTENTS
[In 1997, the cooperative program named the International Strategic Minerals Inventory was renamed theInternational Strategic Mineral Issues. Therefore, the volume title for chapters A–N differs from that forchapter O]
A. International Strategic Minerals Inventory Summary Report—ManganeseBy John H. DeYoung, Jr., David M. Sutphin, and William F. Cannon
B. International Strategic Minerals Inventory Summary Report—ChromiumBy John H. DeYoung, Jr., Michael P. Lee, and Bruce R. Lipin
C. International Strategic Minerals Inventory Summary Report—PhosphateBy Ulrich H. Krauss, Henning G. Saam, and Helmut W. Schmidt
D. International Strategic Minerals Inventory Summary Report—NickelBy John H. DeYoung, Jr., David M. Sutphin, Antony B.T. Werner, and Michael P.
Foose
E. International Strategic Minerals Inventory Summary Report—Platinum-Group MetalsBy David M. Sutphin and Norman J Page
F. International Strategic Minerals Inventory Summary Report—CobaltBy Richard N. Crockett, Gregory R. Chapman, and Michael D. Forrest
G. International Strategic Minerals Inventory Summary Report—TitaniumBy Roy R. Towner, Jonathan M. Gray, and Lyn M. Porter
H. International Strategic Minerals Inventory Summary Report—Natural GraphiteBy Ulrich H. Krauss, Helmut W. Schmidt, Harold A. Taylor, Jr., and David M. Sutphin
I. International Strategic Minerals Inventory Summary Report—LithiumBy Terrance F. Anstett, Ulrich H. Krauss, Joyce A. Ober, and Helmut W. Schmidt
J. International Strategic Minerals Inventory Summary Report—TinBy David M. Sutphin, Andrew E. Sabin, and Bruce L. Reed
K. International Strategic Minerals Inventory Summary Report—VanadiumBy I. Goldberg, E.C.I. Hammerbeck, L.S. Labuschagne, and C. Rossouw
L. International Strategic Minerals Inventory Summary Report—ZirconiumBy Roy R. Towner
M. International Strategic Minerals Inventory Summary Report—Niobium (Columbium) and Tantalum
By Richard N. Crockett and David M. Sutphin
N. International Strategic Minerals Inventory Summary Report—Rare-Earth OxidesBy Wayne D. Jackson and Grey Christiansen
O. International Strategic Mineral Issues Summary Report—TungstenBy Antony B.T. Werner, W. David Sinclair, and Earle B. Amey
INTERNATIONAL STRATEGIC MINERAL ISSUES (ISMI)
PARTICIPATING AGENCIES
AustraliaBureau of Resource Sciences
CanadaDepartment of Natural Resources
Minerals and Metals SectorGeological Survey of Canada
Federal Republic of GermanyBundesanstalt für Geowissenschaften
und Rohstoffe
Republic of South AfricaMinerals BureauGeological Survey
United KingdomBritish Geological Survey
United StatesBureau of MinesGeological Survey
SUMMARY REPORTS
This circular is one of several reports on selected mineral commodities to be published in the U.S. Geological Survey Circular 930 volume. The circulars published to date are listed below; year of publication is shown in parentheses. Circulars 930–A to 930–N were produced by the International Strategic Minerals Inventory. Copies are available free on application to the U.S. Geological Survey, Information Services, Box 25286, Federal Center, Denver, CO 80225 U.S.A.
930–A. Manganese (1984) 930–I. Lithium (1990)930–B. Chromium (1984) 930–J. Tin (1990)930–C. Phosphate (1984) 930–K. Vanadium (1992)930–D. Nickel (1985) 930–L. Zirconium (1992)930–E. Platinum-Group Metals (1986) 930–M.Niobium (Columbium) and930–F. Cobalt (1987) Tantalum (1993)930–G. Titanium (1988) 930–N. Rare-Earth Oxides (1993)930–H. Natural Graphite (1988) 930–O. Tungsten (1998)
A report (by Coakley and others) on mineral commodities in subequatorial Africa was published in 1991 by the U.S.Bureau of Mines in the Mineral Perspective Series. Copies are available from the Mineral Resources Program, U.S. Geologi-cal Survey, 913 National Center, Reston, VA 20192 U.S.A.
Requests for copies of International Strategic Mineral Issues summary reports and for further information may also beaddressed to:
Ian Lambert, DirectorMineral Resources BranchBureau of Resource SciencesJohn Curtin House22 Brisbane AvenueBarton, ACT 2600AUSTRALIA
Minerals and Metals SectorCanadian Department of Natural Resources580 O’Connor Street—Room 729Ottawa, Ontario K1A 0E4CANADA
Distribution BranchBundesanstalt für Geowissenschaften und RohstoffePostfach 51 01 5330631 Hannover 51FEDERAL REPUBLIC OF GERMANY
Chief Director, Minerals BureauPrivate Bag X4Braamfontein 2017REPUBLIC OF SOUTH AFRICA
Gregory R. ChapmanBritish Geological SurveyKeyworthNottingham NG12 5GGUNITED KINGDOM
, version 1.1