Embed Size (px)
Citation preview
U.S. Department of the Interior v x U.S. Geological Survey TV\J°
Water Budgets for Pine Valley, Carico Lake Valley, and Upper Reese River Valley Hydrographic Areas, Middle Humboldt River Basin, North-Central Nevada Methods for Estimation and Results
Water-Resources Investigations Report 99-4272
Prepared in cooperation with theNEVADA DIVISION OF WATER RESOURCES
usesscience fora changing world
Water Budgets for Pine Valley, Carico Lake Valley, and Upper Reese River Valley Hydrographic Areas, Middle Humboldt River Basin, North-Central Nevada- Methods for Estimation and Results
By David L. Berger
U.S. GEOLOGICAL SURVEY
Water-Resources Investigations Report 99-4272
Prepared in cooperation with theNEVADA DIVISION OF WATER RESOURCES
Carson City, Nevada 2000
U.S. DEPARTMENT OF THE INTERIOR BRUCE BABBITT, Secretary
U.S. GEOLOGICAL SURVEY CHARLES G. GROAT, Director
Any use of trade, product, or firm names in this publication is for descriptive purposes only and does not imply endorsement by the U.S. Government
For additional information Copies of this report can be contact: purchased from:
District Chief U.S. Geological Survey U.S. Geological Survey Information Services 333 West Nye Lane, Room 203 Building 810 Carson City, NV 89706-0866 Box 25286, Federal Center
Denver, CO 80225-0286
email: GS-W-NVpublic-info @ usgs.gov
http://nevada.usgs.gov
CONTENTS
Abstract..................................................................^ 1Introduction.............................................................................................^^ 2
Background...................................................................................................^^ 2Purpose and Scope..................................................................................................................................................... 4Approach of Investigation.......................................................................................................................................... 4Location and General Features of Study Area........................................................................................................... 5Previous Investigations.............................................................................................................................................. 6
Conceptualization of Hydrologic System.............................................................................................................................. 6Delineation of Landforms.......................................................................................................................................... 6
Mountain Block.............................................................................................................................................. 8Piedmont Slope............................................................................................................................................... 8Valley Lowland............................................................................................................................................... 8
Identification of Water-Budget Components.............................................................................................................. 9Development of Water Budget................................................................................................................................... 10
Methods for Estimating Water-Budget Components............................................................................................................. 12Precipitation Distribution........................................................................................................................................... 12Runoff and Water Yield............................................................................................................................... 13Ground-Water Recharge and Subsurface Flow.......................................................................................................... 17
Revision of Maxey-Eakin Method................................................................................................................. 17Mass-Balance Approach................................................................................................................................. 18
Discharge by Evapotranspiration............................................................................................................................... 19Water-Budget Estimates ........................................................................................................................................................ 23
Pine Valley Hydrographic Area ................................................................................................................................. 23Carico Lake Valley Hydrographic Area..................................................................................................................... 26Upper Reese River Valley Hydrographic Area.......................................................................................................... 30Discussion of Water-Budget Estimates...................................................................................................................... 34
Summary and Conclusions................................................................................................................................................. 35Glossary .....................................................................................................................................................^ 37References Cited......................................................................................................................... 38
FIGURES
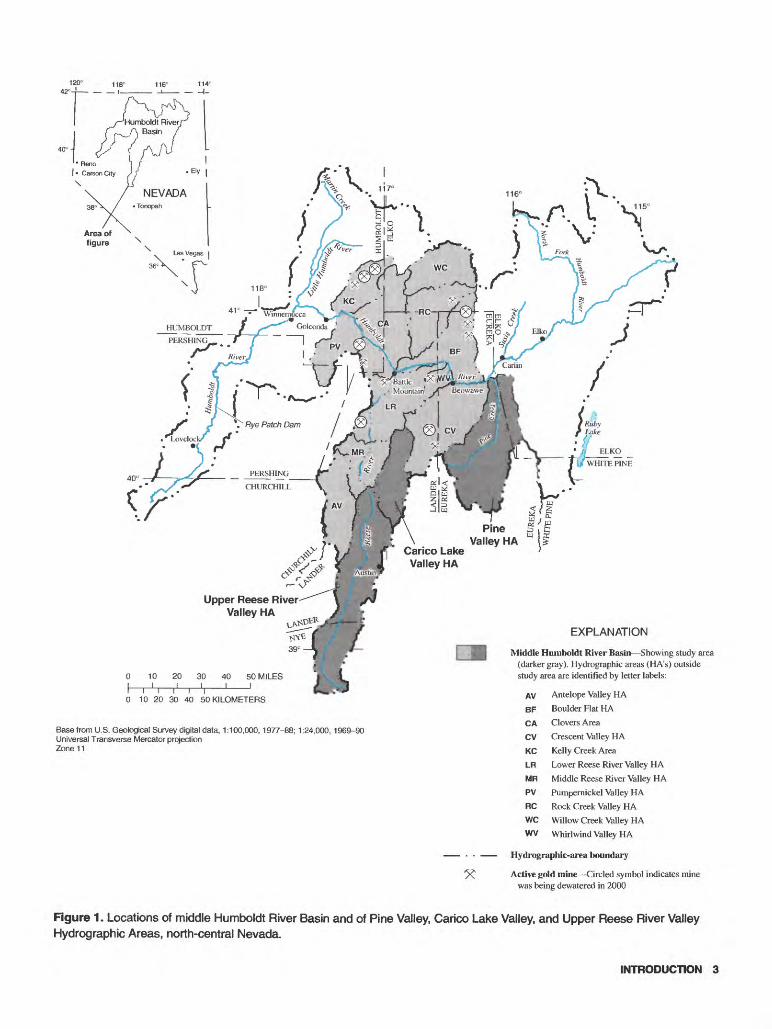
1. Map showing locations of middle Humboldt River Basin and of Pine Valley, Carico Lake Valley, and UpperReese River Valley Hydrographic Areas, north-central Nevada............................................................................ 3
2. Schematic cross sections of typical basins, showing lanforms and general patterns of ground-water movement, middle Humboldt River Basin, north-central Nevada ........................................................................................... 7
3. Schematic diagram showing interrelations among water-budget components and landforms for simplifiedhydrologic flow system, middle Humboldt River Basin, north-central Nevada.................................................... 11
4. Map showing locations of selected watersheds used in deriving relations among average annual precipitation, runoff, and water yield........................................................................................................................................... 14
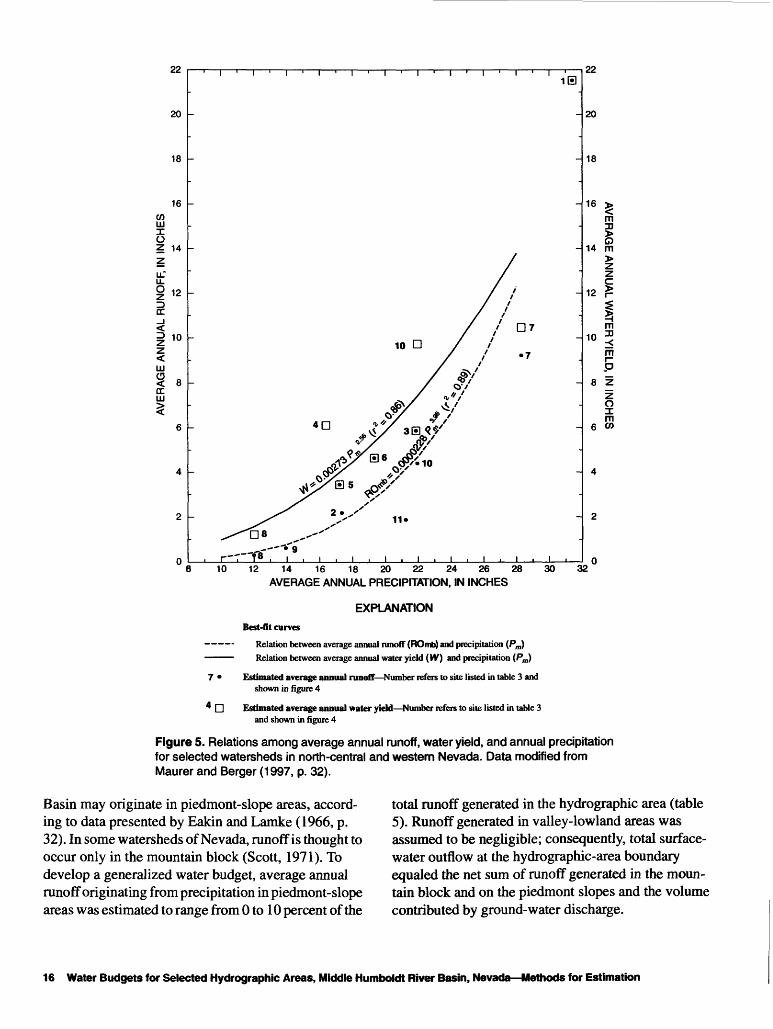
5. Graph showing relations among average annual runoff, water yield, and annual precipitation for selectedwatersheds in north-central and western Nevada .................................................................................................. 16
6. Graphs showing distribution of plant cover in Pine Valley, Carico Lake Valley, and Upper Reese River Valley Hydrographic Areas, middle Humboldt River Basin, north-central Nevada, June 1989 and June 1995............... 22
7-9. Maps showing distribution of precipitation and landforms in middle Humboldt River Basin, north-central Nevada, 1961-90:
7. Pine Valley Hydrographic Area.................................................................................................................. 248. Carico Lake Valley Hydrographic Area...................................................................................................... 289. Upper Reese River Valley Hydrographic Area........................................................................................... 31
CONTENTS III
TABLES
1. Equations of hydrologic equilibrium for average annual water budgets for landforms and typical basin inmiddle Humboldt River Basin, north-central Nevada........................................................................................... 10
2. Area of landforms and distribution of simulated average annual precipitation on landforms in Pine Valley, Carico Lake Valley, and Upper Reese River Valley Hydrographic Areas, middle Humboldt River Basin, north-central Nevada.............................................................................................................................................. 13
3. Simulated average annual precipitation and estimated average annual runoff and water yield for selected watersheds used in developing relations among average annual precipitation in a watershed, runoff, and water yield, north-central and western Nevada...................................................................................................... 15
4. Simulated average annual precipitation and estimated average annual runoff, water yield, evapotranspiration, and subsurface flow in mountain-block areas in Pine Valley, Carico Lake Valley, and Upper Reese River Valley Hydrographic Areas, middle Humboldt River Basin, north-central Nevada.............................................. 17
5. Estimated average annual runoff, evapotranspiration, and subsurface flow from piedmont-slope areas in Pine Valley, Carico Lake Valley, and Upper Reese River Valley Hydrographic Areas, middle Humboldt River Basin, north-central Nevada................................................................................................................................... 18
6. Average annual evapotranspiration rates from areas of bare soil or phreatophyte vegetation, evaporation rates from open water, and annual volume of ground-water evapotranspiration from valley lowlands, 1989 and 1995, in Pine Valley, Carico Lake Valley, and Upper Reese River Valley Hydrographic Areas, middle Hum boldt River Basin, north-central Nevada................................................................................................................ 21
7. Comparison of Hardman and PRISM-simulated average annual precipitation for Pine Valley, Carico Lake Valley, and Upper Reese River Valley Hydrographic Areas, middle Humboldt River Basin, north-central Nevada........................................................................._^^ 23
8. Average annual water budgets for Pine Valley Hydrographic Area, middle Humboldt River Basin, north-cend^Nevada............................................................................................^^ 25
9. Average annual ground-water budget for Pine Valley Hydrographic Area, middle Humboldt River Basin,north-central Nevada.............................................................................................................................................. 27
10. Average annual water budgets for Carico Lake Valley Hydrographic Area, middle Humboldt River Basin,north-central Nevada.............................................................................................................................................. 29
11. Average annual ground-water budget for Carico Lake Valley Hydrographic Area, middle Humboldt RiverBasin, north-central Nevada................................................................................................................................... 30
12. Average annual water budgets for Upper Reese River Valley Hydrographic Area, middle Humboldt RiverBasin, north-central Nevada................................................................................................................................... 32
13. Average annual ground-water budget for Upper Reese River Valley Hydrographic Area, middle HumboldtRiver Basin, north-central Nevada......................................................................................................................... 33
CONVERSION FACTORS and VERTICAL DATUM
Multiply By To obtain
acre 4,047 square meteracre-foot (acre-ft) 0.001233 cubic hectometer
acre-foot per year (acre-ft/yr) 0.001233 cubic hectometer per yearcubic foot per day (ft3/d) 0.02832 cubic meter per day
foot (ft) 0.3048 meterfoot per day (ft/d) 0.3048 meter per day
foot per foot (ft/ft) 1 meter per meterfoot per year (ft/yr) 0.3048 meter per year
inch (in or in.) 25.4 millimeterinch per year (in/yr) 25.4 millimeter per year
mile (mi) 1.609 kilometersquare foot (ft2) 0.09290 square meter
square mile (mi2) 2.590 square kilometer
Sea level: In this report, "sea level" refers to the National Geodetic Vertical Datum of 1929 (NGVD of 1929, formerly called "Sea-Level Datum of 1929"), which is derived from a general adjustment of the first-order leveling networks of the United States and Canada.
IV Water Budgets for Selected Hydrographic Areas, Middle Humboldt River Basin, Nevada Methods for Estimation
Water Budgets for Pine Valley, Carico Lake Valley, and Upper Reese River Valley Hydrographic Areas, Middle Humboldt River Basin, North-Central Nevada- Methods for Estimation and Results
By David L. Berger
Abstract
Water budgets were developed for three hydrographic areas in the middle Humboldt River Basin of north-central Nevada. The water budgets include estimates of average annual precipitation, runoff, water yield, ground-water recharge, and evapotranspiration determined from recently developed or revised methods. These water bud gets are compared to water budgets developed more than 30 years ago.
The distribution of precipitation was obtained from a statistical-topographic model, a precipitation-elevation regressions on inde pendent slopes model, or PRISM, that simulates average annual precipitation at regional scales. Estimates of runoff and water yield were derived by simple regression analysis. Ground-water recharge was estimated by using a revision of the Maxey-Eakin method and by mass-balance cal culations. Available climatic data, collected at remote automatic weather stations, were used in the Penman-Monteith equation to estimate evapo transpiration. Estimates of ground-water discharge based on distribution of phreatophyte vegetation were developed from micrometeorological meth ods and regionalized by using satellite imagery.
The three hydrographic areas Pine Valley, Carico Lake Valley, and Upper Reese River Val ley were subdivided into mountain blocks, pied
mont slopes, and valley lowlands on the basis of the distribution of these landforms within the basin and the patterns of ground-water flow in the under lying hydrogeologic units. Water budgets were determined for each of the three types of landform and were combined to estimate the water budget for each hydrographic area. The water budgets represent average annual conditions for the 1961- 90 reference period.
Compared to estimates from the Hardman precipitation map, PRISM-simulated precipitation is about 5 percent greater in Pine Valley, nearly 50 percent greater in Carico Lake Valley, and about 14 percent greater in Upper Reese River Valley. Because nearly half the simulated precipitation is in piedmont-slope areas, they may be areas of significant ground-water recharge.
About 95 percent of the precipitation that falls in the three hydrographic areas is lost to evapotranspiration. About 4 percent of the total precipitation falls on the valley lowlands and is lost to evapotranspiration. Evapotranspiration rates commonly applied in the earlier studies are about 2 feet per year less than rates more recently derived from micrometeorological measurements. Ground-water discharge in vegetated flood plains represents a large component of the total ground- water outflow from each hydrographic area.
Abstract 1
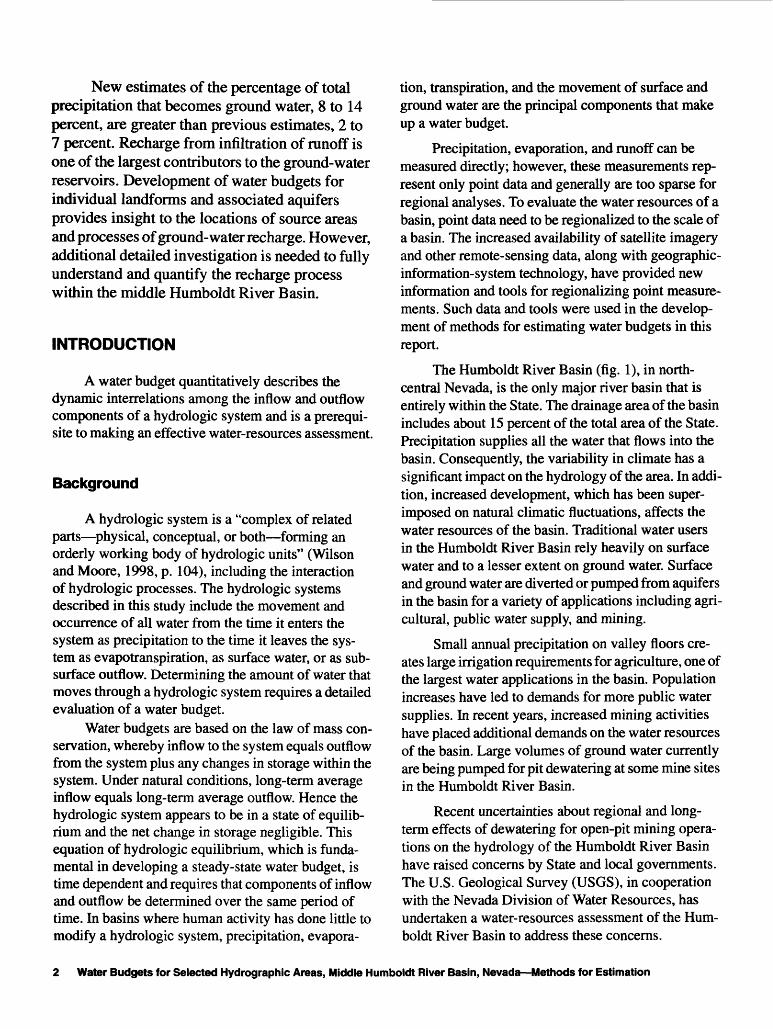
New estimates of the percentage of total precipitation that becomes ground water, 8 to 14 percent, are greater than previous estimates, 2 to 7 percent. Recharge from infiltration of runoff is one of the largest contributors to the ground-water reservoirs. Development of water budgets for individual landforms and associated aquifers provides insight to the locations of source areas and processes of ground-water recharge. However, additional detailed investigation is needed to fully understand and quantify the recharge process within the middle Humboldt River Basin.
INTRODUCTION
A water budget quantitatively describes the dynamic interrelations among the inflow and outflow components of a hydrologic system and is a prerequi site to making an effective water-resources assessment.
Background
A hydrologic system is a "complex of related parts physical, conceptual, or both forming an orderly working body of hydrologic units" (Wilson and Moore, 1998, p. 104), including the interaction of hydrologic processes. The hydrologic systems described in this study include the movement and occurrence of all water from the time it enters the system as precipitation to the time it leaves the sys tem as evapotranspiration, as surface water, or as sub surface outflow. Determining the amount of water that moves through a hydrologic system requires a detailed evaluation of a water budget.
Water budgets are based on the law of mass con servation, whereby inflow to the system equals outflow from the system plus any changes in storage within the system. Under natural conditions, long-term average inflow equals long-term average outflow. Hence the hydrologic system appears to be in a state of equilib rium and the net change in storage negligible. This equation of hydrologic equilibrium, which is funda mental in developing a steady-state water budget, is time dependent and requires that components of inflow and outflow be determined over the same period of time. In basins where human activity has done little to modify a hydrologic system, precipitation, evapora
tion, transpiration, and the movement of surface and ground water are the principal components that make up a water budget.
Precipitation, evaporation, and runoff can be measured directly; however, these measurements rep resent only point data and generally are too sparse for regional analyses. To evaluate the water resources of a basin, point data need to be regionalized to the scale of a basin. The increased availability of satellite imagery and other remote-sensing data, along with geographic- information-system technology, have provided new information and tools for regionalizing point measure ments. Such data and tools were used in the develop ment of methods for estimating water budgets in this report.
The Humboldt River Basin (fig. 1), in north- central Nevada, is the only major river basin that is entirely within the State. The drainage area of the basin includes about 15 percent of the total area of the State. Precipitation supplies all the water that flows into the basin. Consequently, the variability in climate has a significant impact on the hydrology of the area. In addi tion, increased development, which has been super imposed on natural climatic fluctuations, affects the water resources of the basin. Traditional water users in the Humboldt River Basin rely heavily on surface water and to a lesser extent on ground water. Surface and ground water are diverted or pumped from aquifers in the basin for a variety of applications including agri cultural, public water supply, and mining.
Small annual precipitation on valley floors cre ates large irrigation requirements for agriculture, one of the largest water applications in the basin. Population increases have led to demands for more public water supplies. In recent years, increased mining activities have placed additional demands on the water resources of the basin. Large volumes of ground water currently are being pumped for pit dewatering at some mine sites in the Humboldt River Basin.
Recent uncertainties about regional and long- term effects of dewatering for open-pit mining opera tions on the hydrology of the Humboldt River Basin have raised concerns by State and local governments. The U.S. Geological Survey (USGS), in cooperation with the Nevada Division of Water Resources, has undertaken a water-resources assessment of the Hum boldt River Basin to address these concerns.
2 Water Budgets for Selected Hydrographic Areas, Middle Humboldt River Basin, Nevada Methods for Estimation
k t[__ELKO _
TV WHITE PINE
Upper Reese River Valley HA
0 10 20 30 40 50 MILESl l ii___|___|I I I I I I0 10 20 30 40 50 KILOMETERS
Base from U.S. Geological Survey digital data, 1:100,000,1977-88; 1:24.000, 1969-90 Universal Transverse Mercator projection Zone 11
EXPLANATION
^^^H Middle Humboldt River Basin Showing study area (darker gray). Hydrographic areas (HA's) outside study area are identified by letter labels:
AV Antelope Valley HA
BF Boulder Flat HACA Clovers AreaCV Crescent Valley HA
KC Kelly Creek AreaLR Lower Reese River Valley HA
MR Middle Reese River Valley HAPV Pumpernickel Valley HARC Rock Creek Valley HAWC Willow Creek Valley HAWV Whirlwind Valley HA
- - Hydrographic-area boundary
<y^ Active gold mine Circled symbol indicates mine was being dewatered in 2000
Figure 1. Locations of middle Humboldt River Basin and of Pine Valley, Carico Lake Valley, and Upper Reese River Valley Hydrographic Areas, north-central Nevada.
INTRODUCTION 3
The Humboldt River Basin Assessment was designed to evaluate the water resources of the basin. The main objectives of the overall study are to(1) provide a scientific appraisal of surface-water and ground-water resources in the Humboldt River Basin,(2) determine the interactions between surface water and ground water among contributing areas and the main stem of the Humboldt River, and (3) determine the effects of all major water uses in the basin on the quantity, quality, and beneficial use of the basin's water resources.
For this assessment, the Humboldt River Basin (fig. 1) was divided into upper, middle, and lower basins, the boundaries of which are similar to those used by Eakin and Lamke (1966) in their hydrologic reconnaissance study. The focus of this current investi gation is on the middle Humboldt River Basin, which has the greatest current and proposed changes in tradi tional water uses including increases in mining activity. In general, the middle Humboldt River Basin is defined by the hydrographic areas tributary to the Humboldt River from about 10 miles downstream from Carlin to about 5 miles upstream from Golconda.
The main tasks in the assessment of the middle Humboldt River Basin are (1) to obtain hydrologic data for the basin and to tabulate the data in data bases main tained by the USGS, (2) to define the hydrogeologic framework in terms of aquifers that store and transmit ground water and confining units that impede ground- water movement, (3) to describe ground-water condi tions, with an emphasis on shallow ground water in basin fill, and (4) to develop and revise methods for estimating water budgets.
Purpose and Scope
This report presents the results of an investigation to develop a systematic approach for estimating water budgets for individual hydrographic areas 1 or basins
Formal hydrographic areas in Nevada were delineated sys tematically by the U.S. Geological Survey and Nevada Division of Water Resources in the late 1960's for scientific and administrative purposes (Cardinalli and others, 1968; Rush, 1968). The official hydrographic-area names, numbers, and geographic boundaries continue to be used in Geological Survey scientific reports and Division of Water Resources administrative activities.
within the middle Humboldt River Basin (the fourth assessment task, as listed above). A conceptualized hydrologic flow system, typical for areas in the Hum boldt River Basin, is described in terms of inflow and outflow components, the interrelations between those components, and the processes of water movement through the hydrogeologic units of the flow system.
The investigation began in October 1995 with the analysis of three hydrographic areas in the middle Humboldt River Basin: Pine Valley, Carico Lake Val ley, and Upper Reese River Valley. These three areas are used to demonstrate the methods for estimating components of a water budget. Selection of these areas was based in part on the availability of hydrologic data from previous investigations.
Data requirements and procedures for develop ment of the methods are described, and the results of applying the methods in the three selected basins are discussed. Budget estimates derived from this study are compared with those developed in earlier studies. The comparisons include ground-water budgets for each basin and, where possible, individual budget compo nents.
Approach of Investigation
The general approach of this investigation was to subdivide a hydrographic area into three principal physiographic units or landforms mountain blocks, piedmont slopes, and valley lowlands; this approach is similar to that taken by earlier investigators (Brede- hoeft, 1963; Eakin and others, 1965; Eakin and Lamke, 1966). The configuration of ground-water flow associ ated with each landform is controlled by characteristics of the hydrogeologic units that make up the underlying aquifers. For each landform the budget components were identified and then estimated. The movement of water in hydrogeologic units underlying each landform was taken into account, and the principal water-budget components were analyzed independently. Budget components estimated for each landform then were combined to develop a water budget for the entire hydrographic area.
Some budget components were estimated by newly developed methods or by methods revised from those originally developed more than 50 years ago by USGS scientists. Other components were estimated as
4 Water Budgets for Selected Hydrographic Areas, Middle Humboldt River Basin, Nevada Methods for Estimation
residuals from mass-balance calculations. Some bud get components are presented as a range based on two sets of data collected at different times. The range in values illustrates the uncertainty in estimating water- budget components, some of which may be due to climatic variability.
Management of data and processing procedures used to regionalize point measurements was facilitated by geographic information systems (GIS). The GIS was designed for the assembly, storage, and analysis of spatial-data sets. Spatial relations among several data sets are numerous and very complex. Only some of the relations could be defined in the GIS; other relations were calculated. The spatial-data sets developed and used in this investigation include land-surface altitude, determined from 1-degree digital elevation models (U.S. Geological Survey, 1987), which have an accu racy of about 300 ft; land-use and land-cover digital data (classified at minimum resolutions of 10 acres for open-water bodies and 40 acres for rangeland) derived from l:250,000-scale high-altitude photography col lected in 1980 and 1983 (U.S. Geological Survey, 1986); Landsat Thematic Mapper (TM) satellite data, collected in June 1989 and June 1995, at a resolution of about 320 ft2 ; hydrographic-area and watershed bound aries digitized from l:24,000-scale topographic maps having a minimum accuracy of about 43 ft; distribution of geologic units, modified from Plume and Carlton (1988), at 1:1,000,000 scale (accuracy unknown); and the distribution of average annual precipitation for Nevada, developed from Daly and others' (1994) pre cipitation-elevation regressions on independent slopes model (PRISM), resampled to about a 62-acre area.
Location and General Features of Study Area
The middle Humboldt River Basin covers an area^of nearly 7,470 mi in north-central Nevada (fig. 1). As
is typical of the Basin and Range Province, the area is characterized by northward-trending mountain ranges separated by broad alluvial valleys. Altitudes within the basin range from about 4,350 ft, where the Hum boldt River leaves the basin near Golconda, to almost 11,800 ft, in the Toiyabe Range south of Austin (figs. 1 and 9). The basin is sparsely populated and includes parts of Pershing, Humboldt, Lander, Eureka, Nye, and Elko Counties.
The geologic history of north-central Nevada is complex and is the major control on water movement through the hydrologic systems within the area. Con solidated bedrock ranging in age from Precambrian to late Tertiary composes the mountainous regions. The intervening valleys are filled with unconsolidated deposits of Tertiary and Quaternary age that commonly are several thousand feet thick. The hydrogeologic framework of the Humboldt River Basin was summa rized by Plume and Carlton (1988), Plume (1996), and Plume and Ponce (1999).
The climate of the study area is arid in the valleys to subhumid in the mountains and is characterized by hot summers and cold winters. Average annual precip itation over a 30-year reference period (1961-90) is commonly less than 10 in. on the valley floors and as much as 30 in. at the higher altitudes in the mountains (Owenby and Ezell, 1992). Because of the large range in annual precipitation between valley floors and sur rounding mountains, the vegetation in north-central Nevada is very diverse.
Fourteen hydrographic areas make up the middle Humboldt River Basin (fig. 1). For this investigation, Pine Valley, Carico Lake Valley, and Upper Reese River Valley Hydrographic Areas were selected for developing and refining methods of estimating water budgets. The boundaries of the three selected basins, initially delineated as hydrographic areas by Rush (1968) and Cardinalli and others (1968), were refined further during this investigation by using topographic- drainage boundaries interpreted from l:24,000-scale maps. The three basins are in the southern part of the middle Humboldt River Basin, south of the Humboldt River. These generally northward-trending and hydro- logically and topographically open basins have both surface and subsurface drainage. Mountain-block areas represent more than 40 percent of the total drainage area in each basin. Irrigation for agriculture is the prin cipal use of water in the three basins, and, as of 2000, no mines in the basins were being dewatered.
The Pine Valley Hydrographic Area covers about 1,010 mi2 in the southeastern part of the middle Hum boldt River Basin (fig. 1). Pine Valley is about 55 mi long and as much as 20 mi wide. Pine Creek drains the valley and flows northward directly to the Humboldt River. During the period 1947-58, estimates of dis charge were made from a continuous-stage-recording gage on Pine Creek, near where it leaves Pine Valley at the north end of the hydrographic area.
INTRODUCTION 5
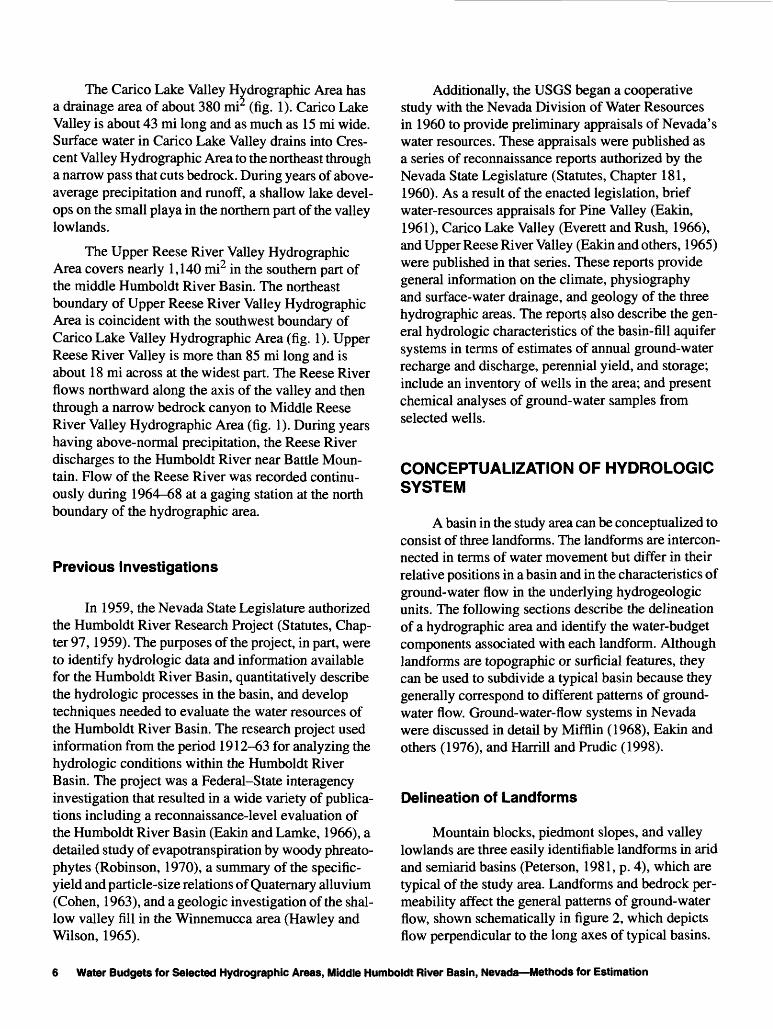
The Carico Lake Valley Hydrographic Area has a drainage area of about 380 mi2 (fig. 1). Carico Lake Valley is about 43 mi long and as much as 15 mi wide. Surface water in Carico Lake Valley drains into Cres cent Valley Hydrographic Area to the northeast through a narrow pass that cuts bedrock. During years of above- average precipitation and runoff, a shallow lake devel ops on the small playa in the northern part of the valley lowlands.
The Upper Reese River Valley Hydrographic Area covers nearly 1,140 mi2 in the southern part of the middle Humboldt River Basin. The northeast boundary of Upper Reese River Valley Hydrographic Area is coincident with the southwest boundary of Carico Lake Valley Hydrographic Area (fig. 1). Upper Reese River Valley is more than 85 mi long and is about 18 mi across at the widest part. The Reese River flows northward along the axis of the valley and then through a narrow bedrock canyon to Middle Reese River Valley Hydrographic Area (fig. 1). During years having above-normal precipitation, the Reese River discharges to the Humboldt River near Battle Moun tain. Flow of the Reese River was recorded continu ously during 1964-68 at a gaging station at the north boundary of the hydrographic area.
Previous Investigations
In 1959, the Nevada State Legislature authorized the Humboldt River Research Project (Statutes, Chap ter 97,1959). The purposes of the project, in part, were to identify hydrologic data and information available for the Humboldt River Basin, quantitatively describe the hydrologic processes in the basin, and develop techniques needed to evaluate the water resources of the Humboldt River Basin. The research project used information from the period 1912-63 for analyzing the hydrologic conditions within the Humboldt River Basin. The project was a Federal-State interagency investigation that resulted in a wide variety of publica tions including a reconnaissance-level evaluation of the Humboldt River Basin (Eakin and Lamke, 1966), a detailed study of evapotranspiration by woody phreato- phytes (Robinson, 1970), a summary of the specific- yield and particle-size relations of Quaternary alluvium (Cohen, 1963), and a geologic investigation of the shal low valley fill in the Winnemucca area (Hawley and Wilson, 1965).
Additionally, the USGS began a cooperative study with the Nevada Division of Water Resources in 1960 to provide preliminary appraisals of Nevada's water resources. These appraisals were published as a series of reconnaissance reports authorized by the Nevada State Legislature (Statutes, Chapter 181,1960). As a result of the enacted legislation, brief water-resources appraisals for Pine Valley (Eakin,1961), Carico Lake Valley (Everett and Rush, 1966), and Upper Reese River Valley (Eakin and others, 1965) were published in that series. These reports provide general information on the climate, physiography and surface-water drainage, and geology of the three hydrographic areas. The reports also describe the gen eral hydrologic characteristics of the basin-fill aquifer systems in terms of estimates of annual ground-water recharge and discharge, perennial yield, and storage; include an inventory of wells in the area; and present chemical analyses of ground-water samples from selected wells.
CONCEPTUALIZATION OF HYDROLOGIC SYSTEM
A basin in the study area can be conceptualized to consist of three landforms. The landforms are intercon nected in terms of water movement but differ in their relative positions in a basin and in the characteristics of ground-water flow in the underlying hydrogeologic units. The following sections describe the delineation of a hydrographic area and identify the water-budget components associated with each landform. Although landforms are topographic or surficial features, they can be used to subdivide a typical basin because they generally correspond to different patterns of ground- water flow. Ground-water-flow systems in Nevada were discussed in detail by Mifflin (1968), Eakin and others (1976), and Harrill and Prudic (1998).
Delineation of Landforms
Mountain blocks, piedmont slopes, and valley lowlands are three easily identifiable landforms in arid and semiarid basins (Peterson, 1981, p. 4), which are typical of the study area. Landforms and bedrock per meability affect the general patterns of ground-water flow, shown schematically in figure 2, which depicts flow perpendicular to the long axes of typical basins.
6 Water Budgets for Selected Hydrographic Areas, Middle Humboldt River Basin, Nevada Methods for Estimation
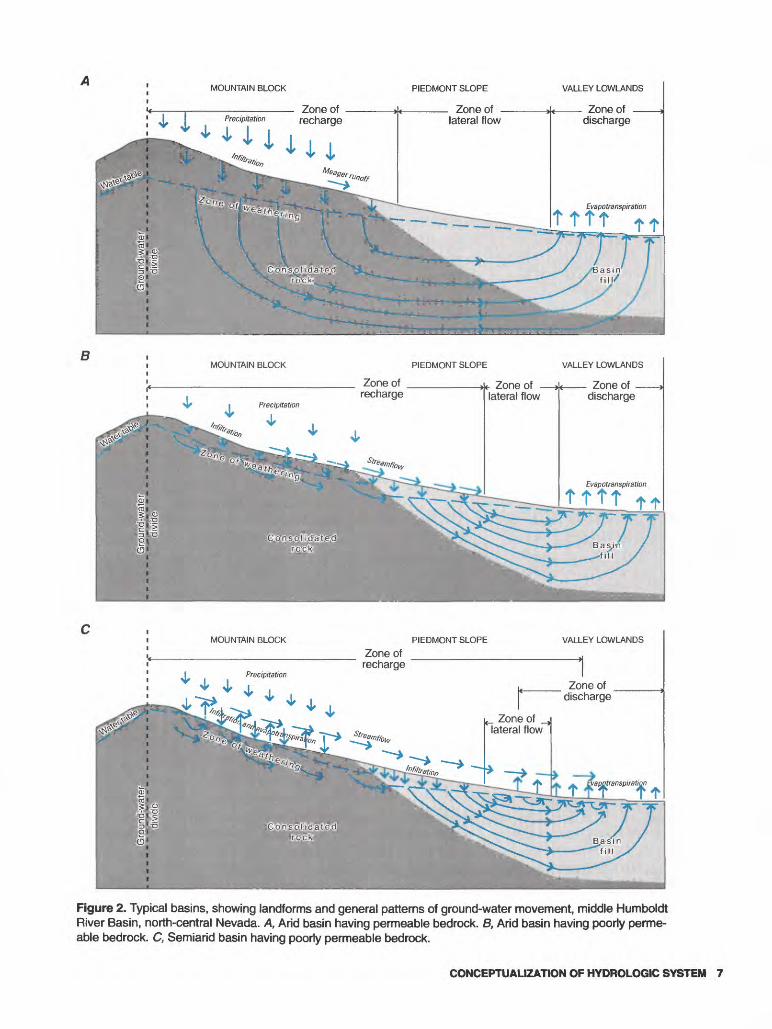
Figure 2. Typical basins, showing landforms and general patterns of ground-water movement, middle Humboldt River Basin, north-central Nevada. A, Arid basin having permeable bedrock. B, Arid basin having poorly perme able bedrock. C, Semiarid basin having poorly permeable bedrock.
CONCEPTUALIZATION OF HYDROLOGIC SYSTEM 7
In the study area, ground water also moves parallel to the long axis and commonly supports subsurface out flow. In general, mountain-block areas can be repre sented as the zone of recharge, piedmont slopes as the zone of lateral flow, and valley lowlands as the zone of ground-water discharge (Mifflin, 1968, p. 12). For most basins in the study area, the zone of recharge extends to the upper parts of the piedmont slopes (fig. 2B), where runoff is concentrated and sediment perm eability tends to be more favorable for infiltration. In basins where ground-water flow is part of a regional flow system and where depth to ground water is too great to sustain phreatophyte vegetation or large amounts of ground-water discharge by direct evapora tion, valley lowlands may not correspond to the zone of ground-water discharge.
Hydrogeologic units in mountain-block areas consist of bedrock aquifers that transmit water and con fining units that impede water movement. These hydro- geologic units also underlie the basin-fill sediments on piedmont slopes and in valley lowlands. The relations of ground-water flow shown in figure 2 commonly are not all found in the same hydrologic system. Patterns and characteristics of ground-water flow are controlled by the permeability of the hydrogeologic units and the aridity of the area. Because rock types have a wide range of permeabilities, various patterns of ground- water flow through bedrock are to be expected. Ground water originating in a mountain block of permeable bedrock follows deep flow paths (fig. 2A), whereas water originating in poorly permeable bedrock follows shallow flow paths through zones of weathered and fractured rock (figs. 2B and Q.
Mountain Block
Mountain blocks, which surround a basin, are the dominant feature of the landscape and commonly extend several thousand feet above adjacent valley floors. For this investigation, mountain-block areas were delineated by the topographic divide along the mountain crest and by the contact between bedrock of the mountain block and the alluvial sediments of the upper piedmont slopes. Mountain blocks commonly are believed to form ground-water divides because of their low permeability (Bredehoeft, 1963, p. 11). However, localized faulting or fracturing and weather ing may produce secondary permeability in the bed
rock aquifers. A substantial amount of ground water may move through these fractured zones or be stored, where saturated, even though their primary permea bility is low. In the Humboldt River Basin, mountain blocks receive a large part of the precipitation that falls in a basin and are the principal source areas of inflow.
Piedmont Slope
Representing about 50 percent of the total basin area, piedmont slopes typically form the largest part in the three basins. They are composed of several topo graphic parts, including dissected pediments and allu vial fans (Peterson, 1981, p. 8). Piedmont slopes form the transition between the mountain block and the nearly level land of the valley lowlands. Surface gradi ents of piedmont slopes generally range from about 8 to 15 percent near the mountain front to about 1 percent where the slopes meet the lowlands (Peterson, 1981, p. 8). The compositions of the geologic materials that comprise the piedmont slope and the underlying basin fill generally are controlled by the depositional envi ronment and the type of bedrock in the adjacent moun tain block. Textures of the sediments on the piedmont- slope surfaces typically grade from coarse grained near the mountain front to finer grained downslope toward the valley lowlands. Because of the coarse grain size of the upslope sediments, runoff that issues from the mountain block commonly infiltrates before reaching the valley lowlands. Consequently piedmont slopes are favorable areas for ground-water recharge. Basin-fill aquifers, which make up the principal hydrogeologic units beneath piedmont slopes, consist of unconsoli- dated to semiconsolidated deposits of poorly sorted gravel, sand, and silt.
Valley Lowland
Areas of the valley lowland include barren playas that are ephemerally flooded, vegetated flood plains, and alluvial flats. In most basins, the valley lowland is in the axial part of the basin and typically contains the principal tributary of the drainage basin. In general, population and agricultural development are concen trated in the valley lowland, where depth to ground water is commonly shallow. Because of the shallow water table in these areas, ground-water discharge by bare-soil evaporation and phreatophytic transpiration
8 Water Budgets for Selected Hydrographic Areas, Middle Humboldt River Basin, Nevada Methods for Estimation
is the dominant hydrologic process. For this investiga tion, the valley lowlands were delineated by the zone of active ground-water discharge, which includes areas of phreatophyte vegetation and bare soil. Unconsoli- dated basin-fill deposits, which typically are several thousand feet thick, form the principal hydrogeologic unit beneath the valley lowland. In topographically closed basins, the basin-fill deposits underlying the valley lowland commonly are fine grained, whereas in basins with surface-water outflow, the deposits tend to be more coarse grained. The basin-fill aquifers beneath piedmont-slope and valley-lowland areas are the prin cipal aquifers developed in most basins of the middle Humboldt River Basin.
Identification of Water-Budget Components
Water-budget components are influenced or con trolled by the climate, geomorphology, and geology. The most significant components in the middle Hum boldt River Basin are precipitation, water yield, runoff, ground-water recharge and subsurface flow, and evapo- transpiration (ET).
Precipitation, in the form of either rain or snow, is the principal source of inflow. Because precipitation generally increases with increasing altitude, the poten tial for ground-water recharge and runoff is greatest in mountain-block areas and upper parts of piedmont slopes. Because piedmont slopes make up such a large part of a basin area, much of the annual precipitation falls in this part of a basin. Most of the precipitation occurs from December to May as snow in the moun tain-block areas.
Runoff is defined as that part of the precipitation that eventually appears in streams (Langbein and Iseri, 1960, p. 17) and that can be divided, with respect to the water source, into direct runoff or baseflow runoff (Wilson and Moore, 1998, p. 172). In the middle Hum boldt River Basin, a large part of the runoff is produced by melting snow originating in the mountain blocks (Eakin and Lamke, 1966, p. 32). Runoff generated on piedmont-slope and valley-lowland areas, in part, is a function of the intensity, duration, and distribution of the precipitation; permeability of the surface sedi ments; temperature; and vegetation type. The water yield from mountain-block areas consists of runoff
generated in the watersheds and of ground water that flows from the bedrock aquifer along the mountain front.
In the study area, ground-water recharge takes place by direct infiltration of precipitation in excess of ET and soil-moisture requirements and by indirect infiltration from channelized or nonchannelized runoff or ponded water. Although, in terms of total ground- water recharge, indirect processes of recharge tend to be seasonal, they are significant to the overall water budget in a basin. In areas of permeable bedrock (fig. 2A), ground water flows from bedrock aquifers to the basin-fill aquifers underlying the valley along deep ground-water flow paths. In areas of less permeable bedrock (figs. 2 B and C), water percolates through the thin soil zone or weathered bedrock and moves down- gradient as shallow ground water. In semiarid basins (fig. 2C), ground water may discharge as spring flow along the mountain front or seep into stream channels and contribute to baseflow near the upper parts of the piedmont slopes, where it is available to flood-plain vegetation. Ground-water recharge from precipitation on valley lowlands generally is assumed to be negligi ble but may result from intense storms in areas where the water table is shallow (Olmsted, 1985, p. 15). In the subsurface, ground water moves laterally between aquifers and, in some places, across hydrographic-area boundaries.
Under natural conditions in the middle Humboldt River Basin, ET is the dominant outflow component. Much of the precipitation that falls in the mountain- block and piedmont-slope areas either is consumed by direct evaporation and sublimation or is transpired by vegetation before it is available to the ground-water reservoir. Results of investigations at a commercial waste-burial facility in the Amargosa Desert in south- era Nevada suggest that ground water may be dis charged by nonisothermal vapor flux through the unsaturated zone in areas where the depth to water is several hundred feet (Fischer, 1992; Prudic, 1996). Although such discharge has not been determined for the middle Humboldt River Basin, it may have signifi cant implications for the overall water budget. In the valley lowlands, annual ET typically exceeds annual precipitation because direct evaporation of ground water takes place in areas of shallow ground water.
CONCEPTUALIZATION OF HYDROLOGIC SYSTEM 9
Development of Water Budget
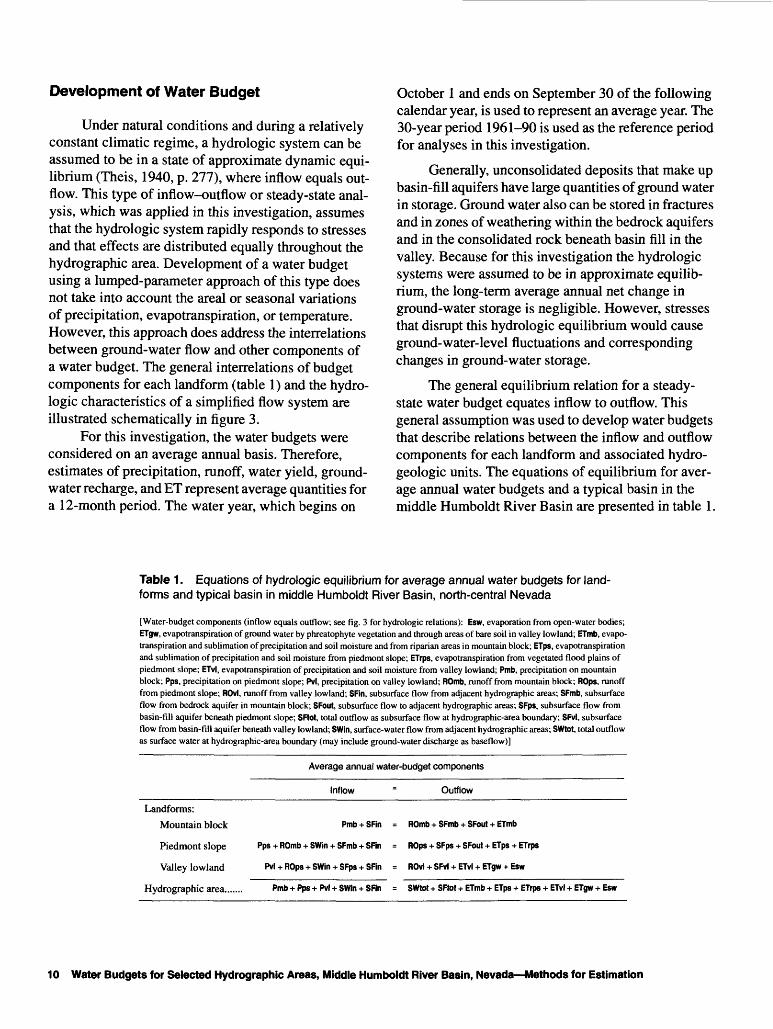
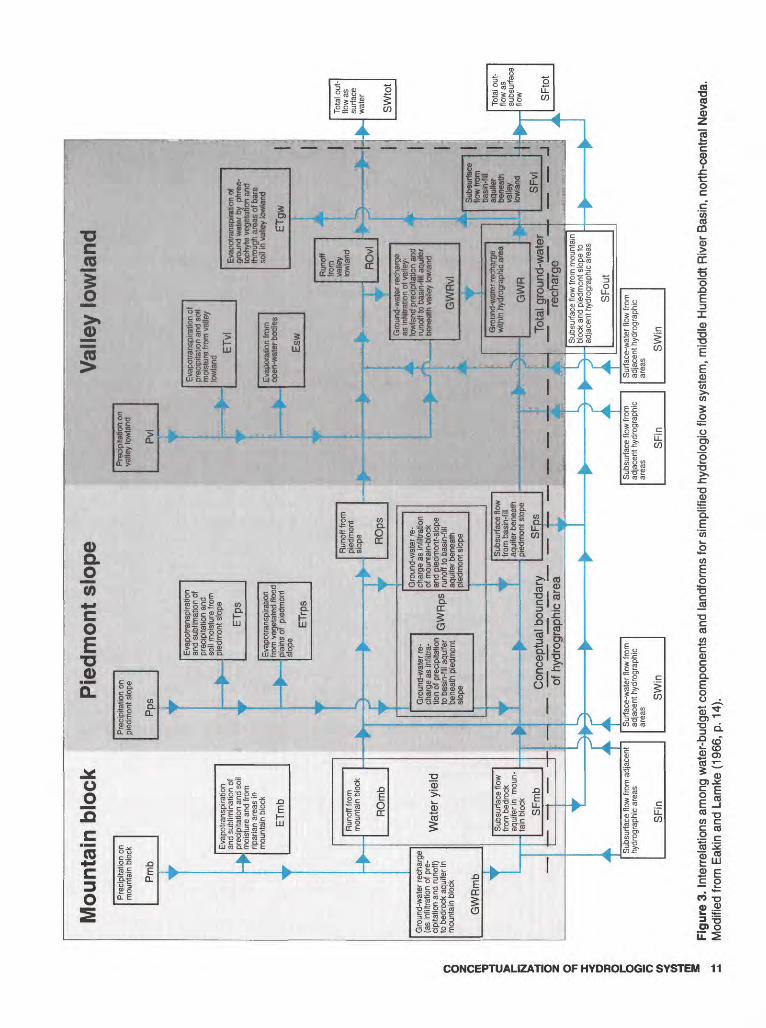
Under natural conditions and during a relatively constant climatic regime, a hydrologic system can be assumed to be in a state of approximate dynamic equi librium (Theis, 1940, p. 277), where inflow equals out flow. This type of inflow-outflow or steady-state anal ysis, which was applied in this investigation, assumes that the hydrologic system rapidly responds to stresses and that effects are distributed equally throughout the hydrographic area. Development of a water budget using a lumped-parameter approach of this type does not take into account the areal or seasonal variations of precipitation, evapotranspiration, or temperature. However, this approach does address the interrelations between ground-water flow and other components of a water budget. The general interrelations of budget components for each landform (table 1) and the hydro- logic characteristics of a simplified flow system are illustrated schematically in figure 3.
For this investigation, the water budgets were considered on an average annual basis. Therefore, estimates of precipitation, runoff, water yield, ground- water recharge, and ET represent average quantities for a 12-month period. The water year, which begins on
October 1 and ends on September 30 of the following calendar year, is used to represent an average year. The 30-year period 1961-90 is used as the reference period for analyses in this investigation.
Generally, unconsolidated deposits that make up basin-fill aquifers have large quantities of ground water in storage. Ground water also can be stored in fractures and in zones of weathering within the bedrock aquifers and in the consolidated rock beneath basin fill in the valley. Because for this investigation the hydrologic systems were assumed to be in approximate equilib rium, the long-term average annual net change in ground-water storage is negligible. However, stresses that disrupt this hydrologic equilibrium would cause ground-water-level fluctuations and corresponding changes in ground-water storage.
The general equilibrium relation for a steady- state water budget equates inflow to outflow. This general assumption was used to develop water budgets that describe relations between the inflow and outflow components for each landform and associated hydro- geologic units. The equations of equilibrium for aver age annual water budgets and a typical basin in the middle Humboldt River Basin are presented in table 1.
Table 1. Equations of hydrologic equilibrium for average annual water budgets for land- forms and typical basin in middle Humboldt River Basin, north-central Nevada
[Water-budget components (inflow equals outflow; see fig. 3 for hydrologic relations): Esw, evaporation from open-water bodies; ETgw, evapotranspiration of ground water by phreatophyte vegetation and through areas of bare soil in valley lowland; ETmb, evapo transpiration and sublimation of precipitation and soil moisture and from riparian areas in mountain block; ETps, evapotranspiration and sublimation of precipitation and soil moisture from piedmont slope; ETrps, evapotranspiration from vegetated flood plains of piedmont slope; ETvl, evapotranspiration of precipitation and soil moisture from valley lowland; Pmb, precipitation on mountain block; Pps, precipitation on piedmont slope; Pvl, precipitation on valley lowland; ROmb, runoff from mountain block; ROps, runoff from piedmont slope; ROvl, runoff from valley lowland; SFm, subsurface flow from adjacent hydrographic areas; SFmb, subsurface flow from bedrock aquifer in mountain block; SFout, subsurface flow to adjacent hydrographic areas; SFps, subsurface flow from basin-fill aquifer beneath piedmont slope; SFtot, total outflow as subsurface flow at hydrographic-area boundary; SFvl, subsurface flow from basin-fill aquifer beneath valley lowland; SWin, surface-water flow from adjacent hydrographic areas; SWtOt, total outflow as surface water at hydrographic-area boundary (may include ground-water discharge as baseflow)]
Average annual water-budget components
Inflow Outflow
Landforms:
Mountain block
Piedmont slope
Valley lowland
Hydrographic area.......
Pmb + SFin
Pps + ROmb + SWin + SFmb + SFin
Pvl + ROps + SWin + SFps + SFin
ROmb + SFmb + SFout + ETmb
ROps + SFps + SFout + ETps + ETrps
ROvl + SFvl + ETvl + ETgw + Esw
Pmb + Pps + Pvl + SWin + SFin = SWtot + SFtot + ETmb + ETps + ETrps + ETvl + ETgw + Esw
10 Water Budgets for Selected Hydrographic Areas, Middle Humboldt River Basin, Nevada Methods for Estimation
Mou
ntai
n bl
ock
Pie
dmon
t sl
ope
Val
ley
low
land
Evap
otra
nspi
ratio
n of
prec
ipita
tion
and
soil
Evap
otra
nspi
ratio
n of
gr
ound
wat
er b
y ph
rea
toph
yte
vege
tatio
n an
d th
roug
h ar
eas
of b
are
soil
in v
alle
y lo
wla
nd
Gro
und-
wat
er re
char
ge
as in
fittra
ttort
of v
atle
y-
low
iand
pre
cipi
tatio
n an
d ru
noff
to b
asin
-fill
aqui
fer
bene
ath
valle
y lo
wla
ndG
roun
d-w
ater
rec
harg
e(a
s in
filtra
tion
of p
re
cipi
tatio
n an
d ru
noff)
to b
edro
ck a
quife
r in
Gro
und-
wat
er re
char
gew
ithin
:hyd
rogr
aph!
c ar
ea
Con
cept
ual b
ound
ary
of h
ydro
grap
hic
area
Tota
l gro
und-
wat
er
~
rech
arge
Subs
urfa
ce fl
ow fr
om m
ount
ain
bloc
k an
d pi
edm
ont s
lope
to
adja
cent
hyd
rogr
aphi
c ar
eas
Subs
urfa
ce fl
ow fr
om a
djac
ent
hydr
ogra
phic
are
asSu
bsur
face
flow
from
ad
jace
nt h
ydro
grap
hic
area
s
SFi
n
Surfa
ce-w
ater
flow
from
ad
jace
nt h
ydro
grap
hic
area
s
SW
in
Figu
re 3
. Int
erre
latio
ns a
mon
g w
ater
-bud
get c
ompo
nent
s an
d la
ndfo
rms
for s
impl
ified
hyd
rolo
gic
flow
sys
tem
, m
iddl
e H
umbo
ldt R
iver
Bas
in,
north
-cen
tral N
evad
a.
Mod
ified
from
Eak
in a
nd L
amke
(19
66, p
. 14
).

The budgets for each landform and underlying hydro- geologic units are described in terms of inflows bal anced by outflows, where an outflow from one land- form commonly represents an inflow to another land- form.
In mountain-block areas, precipitation and inflow from adjacent areas are balanced by runoff, subsurface flow from the bedrock aquifer, sublimation and ET of precipitation and soil moisture, and ET from riparian areas. Runoff and subsurface flow that remain within the hydrographic area make up part of the inflow to the piedmont-slope area (fig. 3).
In piedmont-slope areas, precipitation, the water yield from the mountain block, and inflow from adja cent areas are balanced by runoff to the valley low lands, subsurface flow to the basin-fill aquifer beneath the valley lowlands or to adjacent areas, ET of precipi tation and soil moisture, and ET from vegetated flood plains. Subsurface flow leaving the basin-fill aquifer beneath the piedmont-slope area is made up of subsur face flow from the bedrock aquifer and the part of the runoff from the mountain-block and piedmont-slope areas that infiltrates to the ground-water reservoir. In addition, some precipitation on piedmont slopes may directly infiltrate to the ground-water reservoir.
In valley-lowland areas, total annual ET was assumed to be equal to the sum of evaporation from surface water, ET of precipitation, and ET of ground water. This sum is typically greater than the volume of precipitation that falls on the valley lowlands. To develop a water budget for valley-lowland areas, ET of precipitation (ETvl, fig. 3) was assumed to be equal to the average annual precipitation in the valley low lands. Consequently, net inflow consists of the com bined runoff from mountain-block and piedmont-slope areas, subsurface flow from basin-fill aquifers beneath the piedmont slope, and any additional water from adjacent basins. The inflow is balanced by surface- water and subsurface outflow at the hydrographic-area boundary, by evaporation from open-water bodies and from shallow ground water through bare soil, and by transpiration of ground water by phreatophyte vegeta tion. Evaporation of shallow ground water and soil moisture through areas of bare soil and transpiration of ground water by phreatophyte vegetation were esti mated as one outflow component and combined in one budget term (ETgw, fig. 3).
METHODS FOR ESTIMATING WATER- BUDGET COMPONENTS
The annual quantity of water associated with some of the discussed water-budget components can be estimated or measured directly, but the resulting point data generally are too sparse for regional analy sis. The following sections describe the management and processing procedures used to regionalize point data.
By definition, a method is a regular and sys tematic way of accomplishing a given task, and the assumption is that the set of procedures can be applied elsewhere and produce similar results. Thus, the meth ods applied to one basin should be applicable to other basins in the middle Humboldt River Basin without significant modification. Nonetheless, the procedures discussed herein are subject to refinement as more information about the identified water-budget compo nents becomes available. In addition, the use of these methods is limited by the uncertainties inherent in the measured or estimated values of the budget compo nents and in the techniques used to areally distribute those values. The conceptualized hydrologic flow system used in this investigation (fig. 3) is a simplifi cation of a real system and is limited by those compo nents that remain poorly understood. Although the water budgets derived by these methods are subject to uncertainty, the overall estimates are believed to repre sent the proportional distribution of those components within each landform over an average year based on the 30-year reference period 1961-90.
Precipitation Distribution
A statistical-topographic model was developed by Daly and others (1994) for simulating average annual precipitation at a regional scale over mountain ous terrain. The model, called a precipitation-elevation regressions on independent slopes model, or PRISM, was used to simulate precipitation for a map showing the distribution of average annual precipitation for Nevada (G.H. Taylor, Oregon Climate Service, Oregon State University, written commun., 1997). The simu lated precipitation distribution shown on that map was derived from weather-station data throughout Nevada.
12 Water Budgets for Selected Hydrographic Areas, Middle Humboldt River Basin, Nevada Methods for Estimation

The map represents average annual precipitation over the 30-year reference period 1961-90 and was used to estimate average annual precipitation in the Pine Valley, Carico Lake Valley, and Upper Reese River Valley Hydrographic Areas.
Specifically, the simulated-precipitation map (G.H. Taylor, Oregon Climate Service, Oregon State University, written commun., 1997) consists of digital vector lines of contoured precipitation at 2-in/yr inter vals. As part of the present study, a surface was fitted to the original precipitation contours and resampled to a 1,640-ft by 1,640-ft cell size. Areas then were deter mined from the gridded data set at 1-in/yr precipita tion intervals. Methods for estimating average annual runoff, water yield, and ground-water recharge were developed, in part, as functions of the distribution and
quantity of annual precipitation simulated by PRISM and were regionalized by using GIS techniques. A summary of the area and distribution of average annual precipitation for each landform in the three hydro- graphic areas is presented in table 2.
Runoff and Water Yield
The relation between runoff and water yield was used to develop estimates of subsurface flow from mountain-block areas. The difference between runoff and water yield was assumed equal to subsurface flow. Methods for estimating annual runoff and water yield in western Nevada (Maurer and Berger, 1997) were modified to include areas in north-central Nevada and were applied to the basins selected for this study.
Table 2. Area of landforms and distribution of simulated average annual precipitation on landforms in Pine Valley, Carico Lake Valley, and Upper Reese River Valley Hydrographic Areas, middle Humboldt River Basin, north-central Nevada
[PRISM, precipitation-elevation regressions on independent slopes model (Daly and others, 1994). <, less than]
LandformArea1 (acres)
PRISM-simulated average annual precipitation2 by precipitation zone (acre-feet per year)
Zone of at least 8 but <12 inches
Zone of at Zone of at least 12 but least 16 but <1 6 inches <20 inches
Zone of at least 20 but <34 inches
Total
Pine Valley Hydrographic Area
Mountain block
Piedmont slope
Valley lowland
Total
261,800
350,100
32,800
645,000
10,600
174,700
26,300
212,000
177,600 117,200
151,400 7,700
1,500 0
330,000 125,000
21,000
0
0
21,000
326,000
334,000
28,000
688,000
Carico Lake Valley Hydrographic Area
Mountain block
Piedmont slope
Valley lowland
Total
111,400
120,400
9,700
242,000
20,200
82,300
8,100
111,000
77,300 22,100
25,300 0
0 0
103,000 22,000
3,400
0
0
3,000
123.000
108,000
8,000
239,000
Upper Reese River Valley Hydrographic Area
Mountain block
Piedmont slope
Valley lowland
Total
339,200
352,100
36,000
727,000
32,600
78,800
5,500
117,000
200,600 135,400
269,600 6,100
29,500 0
500,000 142,000
45,300
0
0
45,000
414,000
354,000
35,000
803,000
Rounded to nearest 100 acres for each landform; totals rounded to nearest 1,000 acres.2 PRISM simulation based on 1961-90 data. Rounded to nearest 100 acre-feet per year for each landform; totals rounded to nearest 1,000
acre-feet per year. Zones based on Nichols (2000); PRISM simulated no annual precipitation of less than 8 inches or greater than 30 inches.
METHODS FOR ESTIMATING WATER-BUDGET COMPONENTS 13
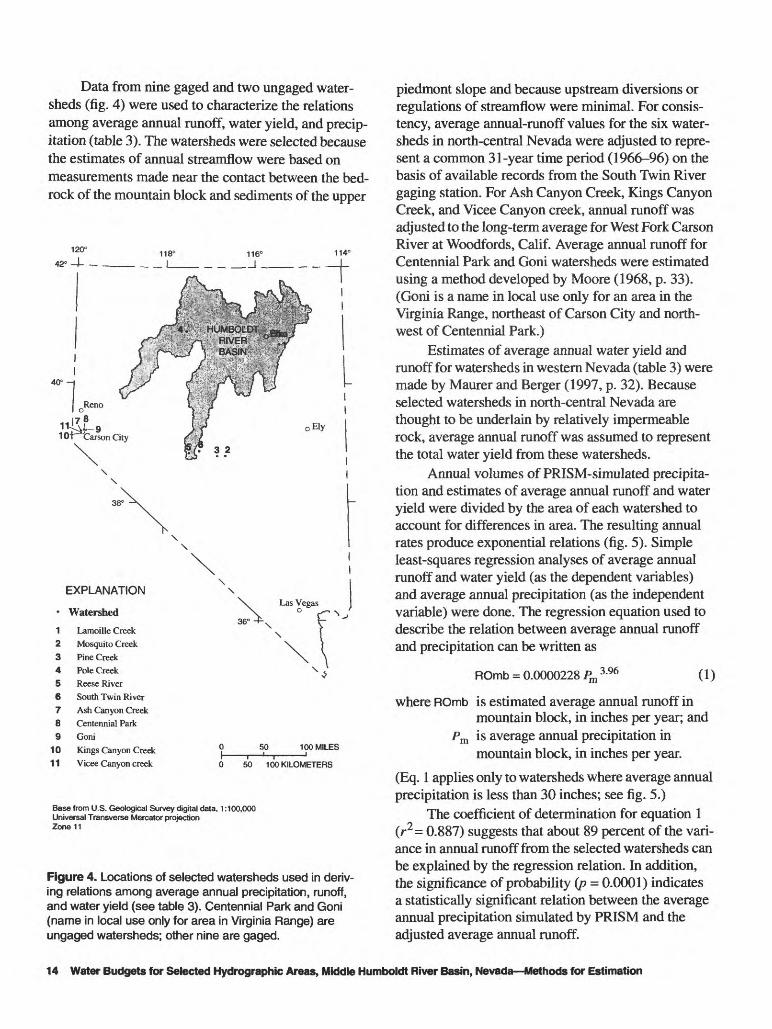
Data from nine gaged and two ungaged water sheds (fig. 4) were used to characterize the relations among average annual runoff, water yield, and precip itation (table 3). The watersheds were selected because the estimates of annual streamflow were based on measurements made near the contact between the bed rock of the mountain block and sediments of the upper
114°
40°
12
3456789
1011
EXPLANATION
Watershed
Lamoille Creek Mosquito Creek Pine Creek Pole Creek Reese River South Twin River Ash Canyon Creek Centennial Park GoniKings Canyon Creek Vicee Canyon creek
0 50 100 MILESI 1 1-| '0 50 100 KILOMETERS
Base from U.S. Geological Survey digital data, 1:100,000 Universal Transverse Mercator projection Zone 11
Figure 4. Locations of selected watersheds used in deriv ing relations among average annual precipitation, runoff, and water yield (see table 3). Centennial Park and Goni (name in local use only for area in Virginia Range) are ungaged watersheds; other nine are gaged.
piedmont slope and because upstream diversions or regulations of streamflow were minimal. For consis tency, average annual-runoff values for the six water sheds in north-central Nevada were adjusted to repre sent a common 31-year time period (1966-96) on the basis of available records from the South Twin River gaging station. For Ash Canyon Creek, Kings Canyon Creek, and Vicee Canyon creek, annual runoff was adjusted to the long-term average for West Fork Carson River at Woodfords, Calif. Average annual runoff for Centennial Park and Goni watersheds were estimated using a method developed by Moore (1968, p. 33). (Groni is a name in local use only for an area in the Virginia Range, northeast of Carson City and north west of Centennial Park.)
Estimates of average annual water yield and runoff for watersheds in western Nevada (table 3) were made by Maurer and Berger (1997, p. 32). Because selected watersheds in north-central Nevada are thought to be underlain by relatively impermeable rock, average annual runoff was assumed to represent the total water yield from these watersheds.
Annual volumes of PRISM-simulated precipita tion and estimates of average annual runoff and water yield were divided by the area of each watershed to account for differences in area. The resulting annual rates produce exponential relations (fig. 5). Simple least-squares regression analyses of average annual runoff and water yield (as the dependent variables) and average annual precipitation (as the independent variable) were done. The regression equation used to describe the relation between average annual runoff and precipitation can be written as
ROmb = 0.0000228 Pm 3 -96 (1)
where ROmb is estimated average annual runoff inmountain block, in inches per year; and
Pm is average annual precipitation in mountain block, in inches per year.
(Eq. 1 applies only to watersheds where average annual precipitation is less than 30 inches; see fig. 5.)
The coefficient of determination for equation 1 (r2 = 0.887) suggests that about 89 percent of the vari ance in annual runoff from the selected watersheds can be explained by the regression relation. In addition, the significance of probability (p = 0.0001) indicates a statistically significant relation between the average annual precipitation simulated by PRISM and the adjusted average annual runoff.
14 Water Budgets for Selected Hydrographic Areas, Middle Humboldt River Basin, Nevada Methods for Estimation
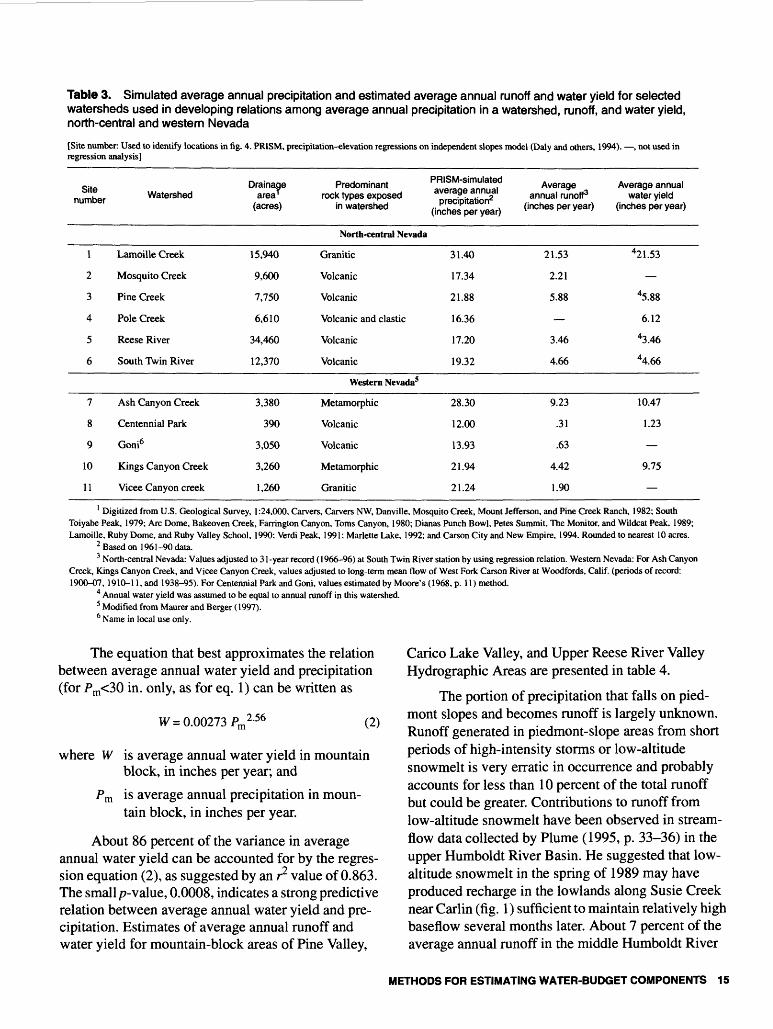
Table 3. Simulated average annual precipitation and estimated average annual runoff and water yield for selected watersheds used in developing relations among average annual precipitation in a watershed, runoff, and water yield, north-central and western Nevada
[Site number: Used to identify locations in fig. 4. PRISM, precipitation-elevation regressions on independent slopes model (Daly and others, 1994). , not used in regression analysis]
number WatershedDrainage
area' (acres)
Predominant PRISM-simulated <nv6r£LQ6 snnufll
p r@ci p itdt io nAverage
annual runoff3 (inches per year)
Average annual water yield
(inches per year)
North-central Nevada
1
2
3
4
5
6
Lamoille Creek
Mosquito Creek
Pine Creek
Pole Creek
Reese River
South Twin River
15,940
9,600
7,750
6,610
34,460
12,370
Granitic
Volcanic
Volcanic
Volcanic and clastic
Volcanic
Volcanic
31.40
17.34
21.88
16.36
17.20
19.32
21.53
2.21
5.88
3.46
4.66
421.53
45.88
6.12
43.46
44.66
Western Nevada5
7
8
9
10
11
Ash Canyon Creek
Centennial Park
Goni6
Kings Canyon Creek
Vicee Canyon creek
3,380
390
3,050
3,260
1,260
Metamorphic
Volcanic
Volcanic
Metamorphic
Granitic
28.30
12.00
13.93
21.94
21.24
9.23
.31
.63
4.42
1.90
10.47
1.23
9.75
1 Digitized from U.S. Geological Survey, 1:24,000, Carvers, Carvers NW, Danville, Mosquito Creek, Mount Jefferson, and Pine Creek Ranch, 1982; South Toiyabe Peak, 1979; Arc Dome, Bakeoven Creek, Farrington Canyon, Toms Canyon, 1980; Dianas Punch Bowl, Petes Summit, The Monitor, and Wildcat Peak, 1989; Lamoille, Ruby Dome, and Ruby Valley School, 1990; Verdi Peak, 1991; Marlette Lake, 1992; and Carson City and New Empire, 1994. Rounded to nearest 10 acres.
2 Based on 1961-90 data.3 North-central Nevada: Values adjusted to 31-year record (1966-96) at South Twin River station by using regression relation. Western Nevada: For Ash Canyon
Creek, Kings Canyon Creek, and Vicee Canyon Creek, values adjusted to long-term mean flow of West Fork Carson River at Woodfords, Calif, (periods of record: 1900-07, 1910-11,and 1938-95). For Centennial Park and Goni, values estimated by Moore's (1968, p. ll)method.
4 Annual water yield was assumed to be equal to annual runoff in this watershed.5 Modified from Maurer and Berger (1997).' Name in local use only.
The equation that best approximates the relation between average annual water yield and precipitation (for Pm<30 in. only, as for eq. 1) can be written as
W= 0.00273 Pm 2 -56 (2)
where W is average annual water yield in mountain block, in inches per year; and
Pm is average annual precipitation in moun tain block, in inches per year.
About 86 percent of the variance in average annual water yield can be accounted for by the regres sion equation (2), as suggested by an r2 value of 0.863. The smallp-value, 0.0008, indicates a strong predictive relation between average annual water yield and pre cipitation. Estimates of average annual runoff and water yield for mountain-block areas of Pine Valley,
Carico Lake Valley, and Upper Reese River Valley Hydrographic Areas are presented in table 4.
The portion of precipitation that falls on pied mont slopes and becomes runoff is largely unknown. Runoff generated in piedmont-slope areas from short periods of high-intensity storms or low-altitude snowmelt is very erratic in occurrence and probably accounts for less than 10 percent of the total runoff but could be greater. Contributions to runoff from low-altitude snowmelt have been observed in stream- flow data collected by Plume (1995, p. 33-36) in the upper Humboldt River Basin. He suggested that low- altitude snowmelt in the spring of 1989 may have produced recharge in the lowlands along Susie Creek near Carlin (fig. 1) sufficient to maintain relatively high baseflow several months later. About 7 percent of the average annual runoff in the middle Humboldt River
METHODS FOR ESTIMATING WATER-BUDGET COMPONENTS 15
22
7
D
12 14 16 18 20 22 24 26 28 AVERAGE ANNUAL PRECIPITATION, IN INCHES
EXPLANATION
Best-fit curves
Relation between average annual runoff (ROmb) and precipitation (Pm) Relation between average annual water yield (W) and precipitation (Pm)
Estimated average annual runoff Number refers to site listed in table 3 and shown in figure 4
Estimated average annual water yield Number refers to site listed in table 3 and shown in figure 4
30 32
Figure 5. Relations among average annual runoff, water yield, and annual precipitation for selected watersheds in north-central and western Nevada. Data modified from Maurer and Berger (1997, p. 32).
Basin may originate in piedmont-slope areas, accord ing to data presented by Eakin and Lamke (1966, p. 32). In some watersheds of Nevada, runoff is thought to occur only in the mountain block (Scott, 1971). To develop a generalized water budget, average annual runoff originating from precipitation in piedmont-slope areas was estimated to range from 0 to 10 percent of the
total runoff generated in the hydrographic area (table 5). Runoff generated in valley-lowland areas was assumed to be negligible; consequently, total surface- water outflow at the hydrographic-area boundary equaled the net sum of runoff generated in the moun tain block and on the piedmont slopes and the volume contributed by ground-water discharge.
16 Water Budgets for Selected Hydrographic Areas, Middle Humboldt River Basin, Nevada Methods for Estimation
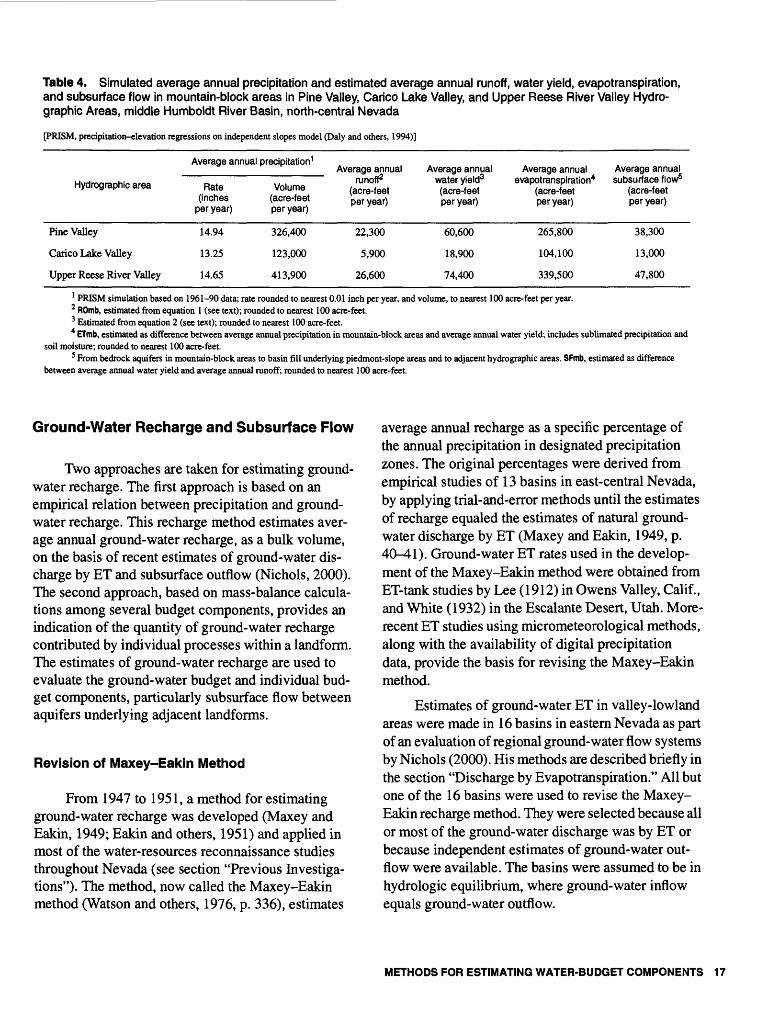
Table 4. Simulated average annual precipitation and estimated average annual runoff, water yield, evapotranspiration, and subsurface flow in mountain-block areas in Pine Valley, Carico Lake Valley, and Upper Reese River Valley Hydro- graphic Areas, middle Humboldt River Basin, north-central Nevada
[PRISM, precipitation-elevation regressions on independent slopes model (Daly and others, 1994)]
Average annual precipitation1
Hydrographic area
Pine Valley
Carico Lake Valley
Upper Reese River Valley
Rate (inches
per year)
14.94
13.25
14.65
Volume (acre-feet per year)
326,400
123,000
413,900
Average annual runoff2
(acre-feet per year)
22,300
5,900
26,600
Average annual water yield3 (acre-feet per year)
60,600
18,900
74,400
Average annual evapotranspiration4
(acre-feet per year)
265,800
104,100
339,500
Average annual subsurface flow5
(acre-feet per year)
38,300
13,000
47,800
1 PRISM simulation based on 1961-90 data; rate rounded to nearest 0.01 inch per year, and volume, to nearest 100 acre-feet per year.2 ROmb, estimated from equation 1 (see text); rounded to nearest 100 acre-feet.3 Estimated from equation 2 (see text); rounded to nearest 100 acre-feet.4 ETmb, estimated as difference between average annual precipitation in mountain-block areas and average annual water yield; includes sublimated precipitation and
soil moisture; rounded to nearest 100 acre-feet.5 From bedrock aquifers in mountain-block areas to basin fill underlying piedmont-slope areas and to adjacent hydrographic areas. SFmb, estimated as difference
between average annual water yield and average annual runoff; rounded to nearest 100 acre-feet.
Ground-Water Recharge and Subsurface Flow
Two approaches are taken for estimating ground- water recharge. The first approach is based on an empirical relation between precipitation and ground- water recharge. This recharge method estimates aver age annual ground-water recharge, as a bulk volume, on the basis of recent estimates of ground-water dis charge by ET and subsurface outflow (Nichols, 2000). The second approach, based on mass-balance calcula tions among several budget components, provides an indication of the quantity of ground-water recharge contributed by individual processes within a landform. The estimates of ground-water recharge are used to evaluate the ground-water budget and individual bud get components, particularly subsurface flow between aquifers underlying adjacent landforms.
Revision of Maxey-Eakin Method
From 1947 to 1951, a method for estimating ground-water recharge was developed (Maxey and Eakin, 1949; Eakin and others, 1951) and applied in most of the water-resources reconnaissance studies throughout Nevada (see section "Previous Investiga tions"). The method, now called the Maxey-Eakin method (Watson and others, 1976, p. 336), estimates
average annual recharge as a specific percentage of the annual precipitation in designated precipitation zones. The original percentages were derived from empirical studies of 13 basins in east-central Nevada, by applying trial-and-error methods until the estimates of recharge equaled the estimates of natural ground- water discharge by ET (Maxey and Eakin, 1949, p. 40-41). Ground-water ET rates used in the develop ment of the Maxey-Eakin method were obtained from ET-tank studies by Lee (1912) in Owens Valley, Calif., and White (1932) in the Escalante Desert, Utah. More- recent ET studies using micrometeorological methods, along with the availability of digital precipitation data, provide the basis for revising the Maxey-Eakin method.
Estimates of ground-water ET in valley-lowland areas were made in 16 basins in eastern Nevada as part of an evaluation of regional ground-water flow systems by Nichols (2000). His methods are described briefly in the section "Discharge by Evapotranspiration." All but one of the 16 basins were used to revise the Maxey- Eakin recharge method. They were selected because all or most of the ground-water discharge was by ET or because independent estimates of ground-water out flow were available. The basins were assumed to be in hydrologic equilibrium, where ground-water inflow equals ground-water outflow.
METHODS FOR ESTIMATING WATER-BUDGET COMPONENTS 17
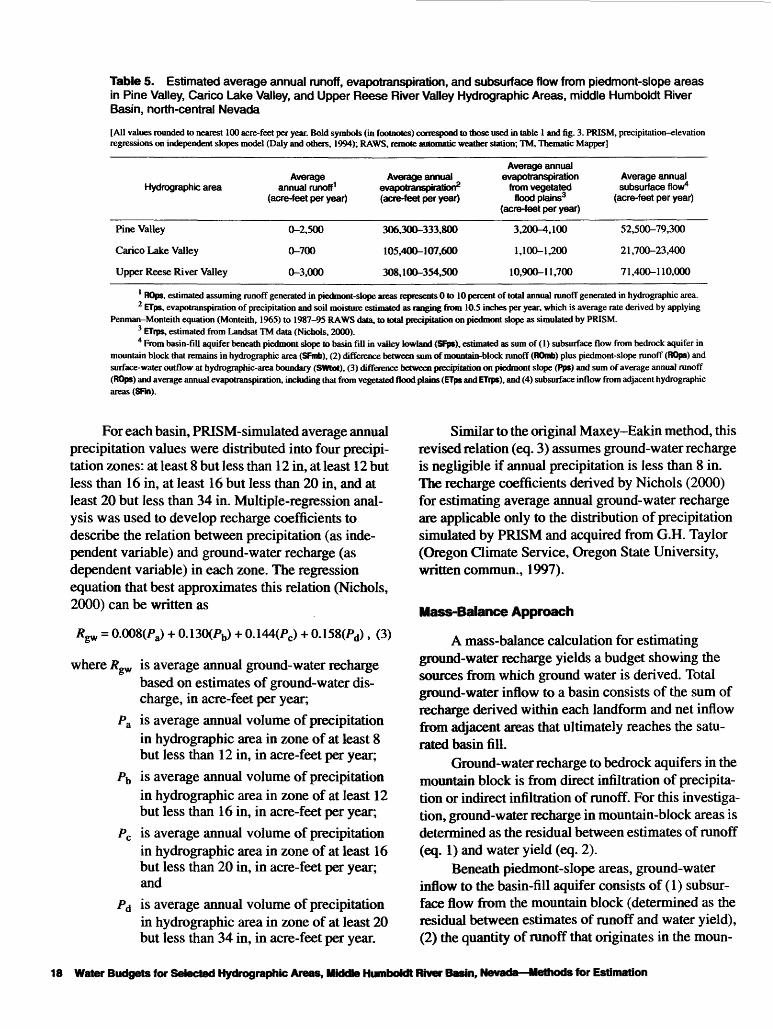
Table 5. Estimated average annual runoff, evapotranspiration, and subsurface flow from piedmont-slope areas in Pine Valley, Carico Lake Valley, and Upper Reese River Valley Hydrographic Areas, middle Humboldt River Basin, north-central Nevada
[All values rounded to nearest 100 acre-feet per year. Bold symbols (in footnotes) correspond to those used in table 1 and fig. 3. PRISM, precipitation-elevation regressions on independent slopes model (Daly and others, 1994); RAWS, remote automatic weather station; TM, Thematic Mapper]
Hydrographic area
Pine Valley
Carico Lake Valley
Upper Reese River Valley
Average annual runoff1
(acre-feet per year)
0-2,500
0-700
0-3,000
Average annual evapotranspiration2 (acre-feet per year)
306,300-333,800
105,400-107,600
308,100-354,500
Average annual evapotranspiration
from vegetated flood plains3
(acre-feet per year)
3,200-4,100
1,100-1,200
10,900-11,700
Average annual subsurface flow4
(acre-feet per year)
52,500-79,300
21,700-23,400
71,400-110,000
1 ROps, estimated assuming runoff generated in piedmont-slope areas represents 0 to 10 percent of total annual runoff generated in hydrographic area.2 ETps, evapotranspiration of precipitation and soil moisture estimated as ranging from 10.S inches per year, which is average rate derived by applying
Penman-Monteith equation (Monteith, 1965) to 1987-95 RAWS data, to total precipitation on piedmont slope as simulated by PRISM.3 ETrps, estimated from Landsat TM data (Nichols, 2000).4 From basin-fill aquifer beneath piedmont slope to basin fill in valley lowland (SFps), estimated as sum of (1) subsurface flow from bedrock aquifer in
mountain block that remains in hydrographic area (SFmb), (2) difference between sum of mountain-block runoff (ROmb) plus piedmont-slope runoff (ROps) and surface-water outflow at hydrographic-area boundary (SWtot), (3) difference between precipitation on piedmont slope (Pps) and sum of average annual runoff (ROps) and average annual evapotranspiration, including that from vegetated flood plains (ETps and ETrps), and (4) subsurface inflow from adjacent hydrographic areas (Sfin).
For each basin, PRISM-simulated average annual precipitation values were distributed into four precipi tation zones: at least 8 but less than 12 in, at least 12 but less than 16 in, at least 16 but less than 20 in, and at least 20 but less than 34 in. Multiple-regression anal ysis was used to develop recharge coefficients to describe the relation between precipitation (as inde pendent variable) and ground-water recharge (as dependent variable) in each zone. The regression equation that best approximates this relation (Nichols, 2000) can be written as
Rgv = 0.008(Pa) + 0.130(Pb) -I- 0.1440PC) + 0.158(Pd), (3)
where /fgw is average annual ground-water recharge based on estimates of ground-water dis charge, in acre-feet per year;
Pa is average annual volume of precipitation in hydrographic area in zone of at least 8 but less than 12 in, in acre-feet per year;
Pb is average annual volume of precipitation in hydrographic area in zone of at least 12 but less than 16 in, in acre-feet per year;
Pc is average annual volume of precipitation in hydrographic area in zone of at least 16 but less than 20 in, in acre-feet per year; and
Pd is average annual volume of precipitation in hydrographic area in zone of at least 20 but less than 34 in, in acre-feet per year.
Similar to the original Maxey-Eakin method, this revised relation (eq. 3) assumes ground-water recharge is negligible if annual precipitation is less than 8 in. The recharge coefficients derived by Nichols (2000) for estimating average annual ground-water recharge are applicable only to the distribution of precipitation simulated by PRISM and acquired from G.H. Taylor (Oregon Climate Service, Oregon State University, written commun., 1997).
Mass-Balance Approach
A mass-balance calculation for estimating ground-water recharge yields a budget showing the sources from which ground water is derived. Total ground-water inflow to a basin consists of the sum of recharge derived within each landform and net inflow from adjacent areas that ultimately reaches the satu rated basin fill.
Ground-water recharge to bedrock aquifers in the mountain block is from direct infiltration of precipita tion or indirect infiltration of runoff. For this investiga tion, ground-water recharge in mountain-block areas is determined as the residual between estimates of runoff (eq. 1) and water yield (eq. 2).
Beneath piedmont-slope areas, ground-water inflow to the basin-fill aquifer consists of (1) subsur face flow from the mountain block (determined as the residual between estimates of runoff and water yield), (2) the quantity of runoff that originates in the moun-
18 Water Budgets for Selected Hydrographic Areas, Middle Humboldt River Basin, Nevada Methods for Estimation
tain block and combines with runoff from the piedmont slope and subsequently infiltrates, (3) a portion of the precipitation that falls on the piedmont slope and infiltrates, and (4) subsurface inflow or surface-water inflow that subsequently infiltrates from adjacent hydrographic areas.
Ground-water recharge from infiltration of run off is estimated as the difference between the sum of mountain-block plus piedmont-slope runoff and the total volume of runoff that makes up the quantity of surface water leaving the basin at the hydrographic- area boundary (SWtot, fig. 3). This calculation does not account for losses from ET and direct evaporation along stream channels and therefore represents a max imum quantity of ground-water recharge. Runoff generated on valley-lowland areas is assumed to be minor because of the small amount of precipitation that falls on those areas. The portion of precipitation that recharges the basin-fill aquifer beneath piedmont slopes is estimated as the difference between precipi tation and the sum of runoff plus all ET losses from piedmont slopes. This calculation also represents a maximum quantity of ground-water recharge.
Ground water beneath the valley lowlands con sists of subsurface flow from the basin-fill aquifers underlying the piedmont slopes, subsurface inflow and infiltration of surface water from adjacent areas, and ground-water recharge that takes place on the valley lowlands from infiltration of precipitation and runoff, which are assumed to be a minor amount.
Although the quantity of subsurface flow that moves across hydrographic-area boundaries is gener ally unknown, it could represent a significant compo nent of the water budget. Determination of interbasin flow is at best difficult and should not be attempted without supporting hydrogeologic data. Results from a study by Plume and Ponce (1999) provided most of the information needed for estimating subsurface flow by using Darcy's law. As modified from Heath (1989, p. 12), Darcy's law can be expressed as
Q = 0.0084 KA(dh/df), (4)
where Q is quantity of subsurface flow, in acre-feetper year;
K is hydraulic conductivity, in feet per day; A is saturated cross-sectional area through
which flow occurs, perpendicular to the direction of flow, in square feet;
d/i/d/ is hydraulic gradient, in feet per feet; and 0.0084 is factor to convert cubic feet per day into
acre-feet per year.
A value of 10 ft/d was used to represent an average hydraulic-conductivity value for basin-fill sediments (Plume and Ponce, 1999). Cross-sectional areas of basin fill beneath hydrographic-area bound aries were estimated on the basis of interpretation of gravity data (D.A. Ponce, U.S. Geological Survey, written commun., 1997). Water-level data collected in the spring of 1996 (Plume and Ponce, 1999) were used to estimate hydraulic gradients.
Discharge by Evapotranspiration
Currently, no data to determine directly the loss of water by ET and sublimation are available for mountain-block areas of the Humboldt River Basin. For this investigation, ET was estimated as the differ ence between average annual precipitation that falls in mountain-block areas and the estimated average annual water yield (eq. 2).
Average annual ET in piedmont-slope areas was derived by applying the Penman-Monteith equation (Monteith, 1965) to available climatic data collected at remote automatic weather stations (RAWS). RAWS data used in the analyses were collected at 14 sites in and near the Humboldt River Basin; the sites are away from urban influences and generally are in the lower parts of piedmont-slope areas, at altitudes from 4,550 to 6,800 ft. The period of record for the RAWS data is 1990-95; several stations have records that were con tinuous since 1987. The Penman-Monteith equation uses energy balances and transport resistances related to plant canopy to estimate actual ET rates. Measure ments of net radiation and aerodynamic and canopy resistances are not made at RAWS, but because they are required to solve the Penman-Monteith equation, several assumptions had to be made for these variables.
Net radiation was estimated from calculations of solar radiation above each RAWS and correlated to a derived relation between solar and measured net radia tion (based on 1990 data) in Toano Draw, about 70 mi northeast of Elko (MJ. Johnson, U.S. Geological Sur vey, written commun., 1997). The derived relation is assumed to be similar to that for the middle Humboldt River Basin for similar periods of record, although it does not take into account variability in local climate conditions.
METHODS FOR ESTIMATING WATER-BUDGET COMPONENTS 19
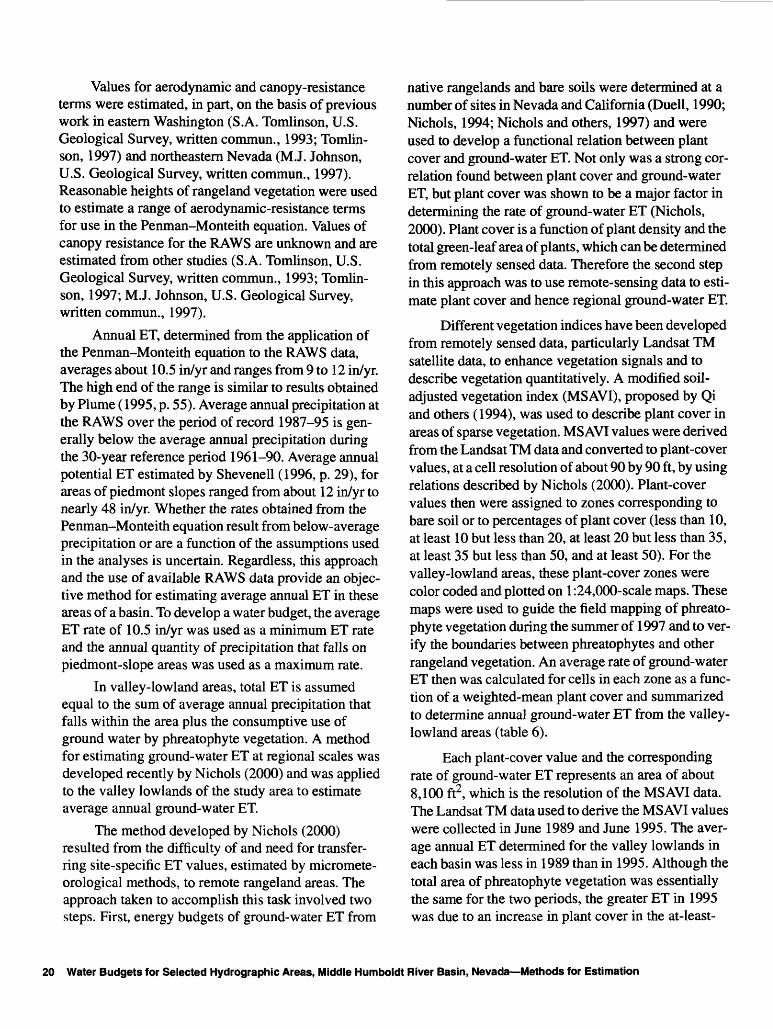
Values for aerodynamic and canopy-resistance terms were estimated, in part, on the basis of previous work in eastern Washington (S.A. Tomlinson, U.S. Geological Survey, written commun., 1993; Tomlin son, 1997) and northeastern Nevada (M.J. Johnson, U.S. Geological Survey, written commun., 1997). Reasonable heights of rangeland vegetation were used to estimate a range of aerodynamic-resistance terms for use in the Penman-Monteith equation. Values of canopy resistance for the RAWS are unknown and are estimated from other studies (S.A. Tomlinson, U.S. Geological Survey, written commun., 1993; Tomlin son, 1997; M.J. Johnson, U.S. Geological Survey, written commun., 1997).
Annual ET, determined from the application of the Penman-Monteith equation to the RAWS data, averages about 10.5 in/yr and ranges from 9 to 12 in/yr. The high end of the range is similar to results obtained by Plume (1995, p. 55). Average annual precipitation at the RAWS over the period of record 1987-95 is gen erally below the average annual precipitation during the 30-year reference period 1961-90. Average annual potential ET estimated by Shevenell (1996, p. 29), for areas of piedmont slopes ranged from about 12 in/yr to nearly 48 in/yr. Whether the rates obtained from the Penman-Monteith equation result from below-average precipitation or are a function of the assumptions used in the analyses is uncertain. Regardless, this approach and the use of available RAWS data provide an objec tive method for estimating average annual ET in these areas of a basin. To develop a water budget, the average ET rate of 10.5 in/yr was used as a minimum ET rate and the annual quantity of precipitation that falls on piedmont-slope areas was used as a maximum rate.
In valley-lowland areas, total ET is assumed equal to the sum of average annual precipitation that falls within the area plus the consumptive use of ground water by phreatophyte vegetation. A method for estimating ground-water ET at regional scales was developed recently by Nichols (2000) and was applied to the valley lowlands of the study area to estimate average annual ground-water ET.
The method developed by Nichols (2000) resulted from the difficulty of and need for transfer ring site-specific ET values, estimated by micromete- orological methods, to remote rangeland areas. The approach taken to accomplish this task involved two steps. First, energy budgets of ground-water ET from
native rangelands and bare soils were determined at a number of sites in Nevada and California (Duell, 1990; Nichols, 1994; Nichols and others, 1997) and were used to develop a functional relation between plant cover and ground-water ET. Not only was a strong cor relation found between plant cover and ground-water ET, but plant cover was shown to be a major factor in determining the rate of ground-water ET (Nichols, 2000). Plant cover is a function of plant density and the total green-leaf area of plants, which can be determined from remotely sensed data. Therefore the second step in this approach was to use remote-sensing data to esti mate plant cover and hence regional ground-water ET.
Different vegetation indices have been developed from remotely sensed data, particularly Landsat TM satellite data, to enhance vegetation signals and to describe vegetation quantitatively. A modified soil- adjusted vegetation index (MSAVI), proposed by Qi and others (1994), was used to describe plant cover in areas of sparse vegetation. MSAVI values were derived from the Landsat TM data and converted to plant-cover values, at a cell resolution of about 90 by 90 ft, by using relations described by Nichols (2000). Plant-cover values then were assigned to zones corresponding to bare soil or to percentages of plant cover (less than 10, at least 10 but less than 20, at least 20 but less than 35, at least 35 but less than 50, and at least 50). For the valley-lowland areas, these plant-cover zones were color coded and plotted on 1:24,000-scale maps. These maps were used to guide the field mapping of phreato phyte vegetation during the summer of 1997 and to ver ify the boundaries between phreatophytes and other rangeland vegetation. An average rate of ground-water ET then was calculated for cells in each zone as a func tion of a weighted-mean plant cover and summarized to determine annual ground-water ET from the valley- lowland areas (table 6).
Each plant-cover value and the corresponding rate of ground-water ET represents an area of about 8,100 ft2, which is the resolution of the MSAVI data. The Landsat TM data used to derive the MSAVI values were collected in June 1989 and June 1995. The aver age annual ET determined for the valley lowlands in each basin was less in 1989 than in 1995. Although the total area of phreatophyte vegetation was essentially the same for the two periods, the greater ET in 1995 was due to an increase in plant cover in the at-least-
20 Water Budgets for Selected Hydrographic Areas, Middle Humboldt River Basin, Nevada Methods for Estimation
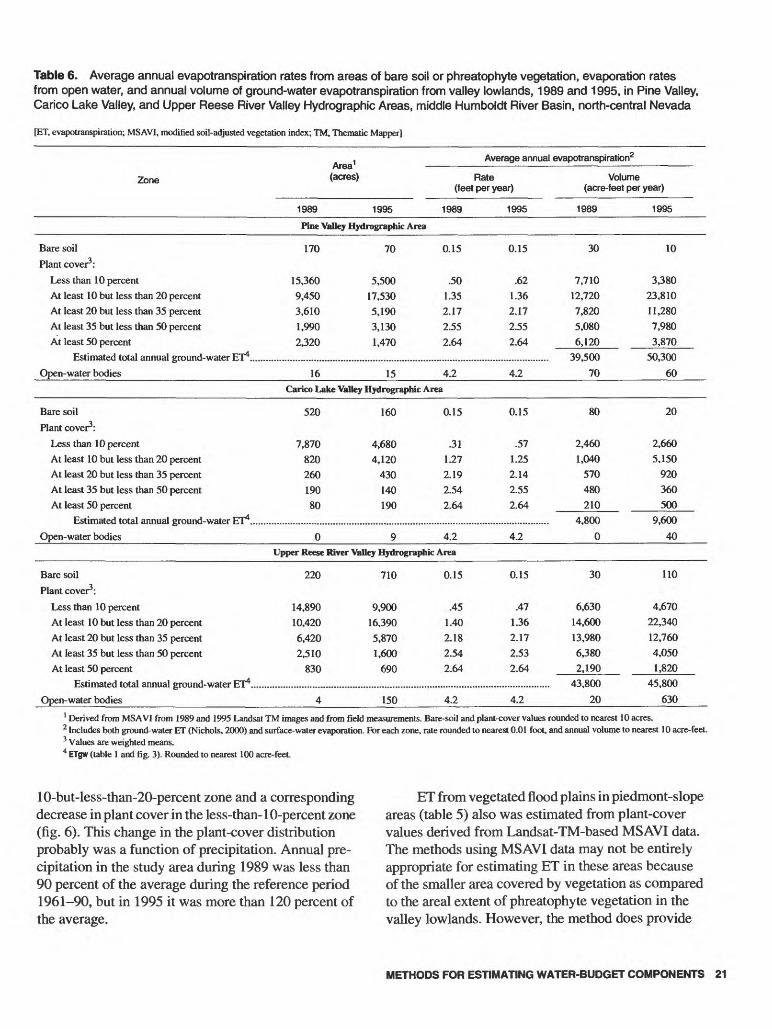
Table 6. Average annual evapotranspiration rates from areas of bare soil or phreatophyte vegetation, evaporation rates from open water, and annual volume of ground-water evapotranspiration from valley lowlands, 1989 and 1995, in Pine Valley, Carico Lake Valley, and Upper Reese River Valley Hydrographic Areas, middle Humboldt River Basin, north-central Nevada
[ET, evapotranspiration; MSAVI, modified soil-adjusted vegetation index; TM, Thematic Mapper]
Zone (acres)
Average annual evapotranspiration2
Rate(feet per year)
1989 1995 1989 1995
Volume(acre-feet per year)
1989 1995
Pine Valley Hydrographic Area
Bare soil
Plant cover3 :
Less than 10 percentAt least 10 but less than 20 percentAt least 20 but less than 35 percentAt least 35 but less than 50 percentAt least 50 percent
Estimated total annual ground-water ET4.....
Open-water bodies
170
15,3609,4503,6101,990
2,320
16
70
5,500
17,530
5,190
3,130
1,470
15
0.15
.50
1.35
2.17
2.55
2.64
4.2
0.15
.62
1.36
2.17
2.55
2.64
4.2
30
7,710
12,720
7,820
5,080
6,120
39,500
70
10
3,380
23,810
11,280
7,980
3,870
50,300
60
Carico Lake Valley Hydrographic Area
Bare soil
Plant cover3 :
Less than 10 percentAt least 10 but less than 20 percentAt least 20 but less than 35 percentAt least 35 but less than 50 percentAt least 50 percent
Estimated total annual ground-water ET4....,
Open-water bodies
520
7,87082026019080
0
160
4,680
4,120
430
140
190
9
0.15
.31
1.27
2.19
2.54
2.64
4.2
0.15
.57
1.25
2.14
2.55
2.64
4.2
80
2,460
1,040
570
480
210
4,800
0
20
2,660
5,150
920
360
500
9,600
40
Upper Reese River Valley Hydrographic Area
Bare soil
Plant cover3:
Less than 10 percentAt least 10 but less than 20 percentAt least 20 but less than 35 percentAt least 35 but less than 50 percentAt least 50 percent
Open- water bodies
220
14,89010,4206,4202,510
830
4
710
9,900
16,390
5,870
1,600
690
150
0.15
.45
1.40
2.18
2.54
2.64
4.2
0.15
.47
1.36
2.17
2.53
2.64
4.2
30
6,630
14,600
13,980
6,380
2,190
43,800
20
110
4,670
22,340
12,760
4,050
1,820
45,800
630
1 Derived from MSAVI from 1989 and 1995 Landsat TM images and from field measurements. Bare-soil and plant-cover values rounded to nearest 10 acres.2 Includes both ground-water ET (Nichols, 2000) and surface-water evaporation. For each zone, rate rounded to nearest 0.01 foot, and annual volume to nearest 10 acre-feet.3 Values are weighted means.4 ETgw (table 1 and fig. 3). Rounded to nearest 100 acre-feet.
10-but-less-than-20-percent zone and a corresponding decrease in plant cover in the less-than-10-percent zone (fig. 6). This change in the plant-cover distribution probably was a function of precipitation. Annual pre cipitation in the study area during 1989 was less than 90 percent of the average during the reference period 1961-90, but in 1995 it was more than 120 percent of the average.
ET from vegetated flood plains in piedmont-slope areas (table 5) also was estimated from plant-cover values derived from Landsat-TM-based MSAVI data. The methods using MSAVI data may not be entirely appropriate for estimating ET in these areas because of the smaller area covered by vegetation as compared to the areal extent of phreatophyte vegetation in the valley lowlands. However, the method does provide
METHODS FOR ESTIMATING WATER-BUDGET COMPONENTS 21

a lower ET limit for vegetated flood plains (Nichols, 2000). The consumptive use of water in vegetated flood plains in the piedmont-slope areas is assumed to repre sent ground-water discharge.
Evaporation from open-water bodies such as shallow lakes, including ephemeral lakes in playas, was estimated on the basis of pan-evaporation meas urements made at Beowawe and Rye Patch Dam in the Humboldt River Basin and at Ruby Lake in north eastern Nevada (fig. 1). Average annual pan-evapora
tion measurements from these three sites ranged from 3.9 to 4.6 ft (Shevenell, 1996, p. 5). A rate of 4.2 ft/yr was used for average annual evaporation from open- water bodies in the water budget for the valley low lands. Areas of open-water bodies in the study area were determined from Landsat TM data collected in June 1989 and June 1995. Total surface area of open water in the selected basins in 1989 was about 150 acres (about 89 percent) less than the total area in 1995 (table 6).
JUNE 1989 JUNE 199520,000
15,000
10,000
5,000
PINE VALLEY
8,000
LU
o 6,000
£ 4,0008o
2,000
CARICO LAKE VALLEY
15,000
10,000
5,000
0
UPPER REESE RIVER VALLEY
10 20 35 50 0 10 20
PLANT COVER, IN PERCENT
35 50
Figure 6. Distribution of plant cover in Pine Valley, Carico Lake Valley, and Upper Reese River Valley Hydrographic Areas, middle Humboldt River Basin, north-central Nevada. Derived from Landsat Thematic Mapper data for June 1989 and June 1995.
22 Water Budgets for Selected Hydrographic Areas, Middle Humboldt River Basin, Nevada Methods for Estimation
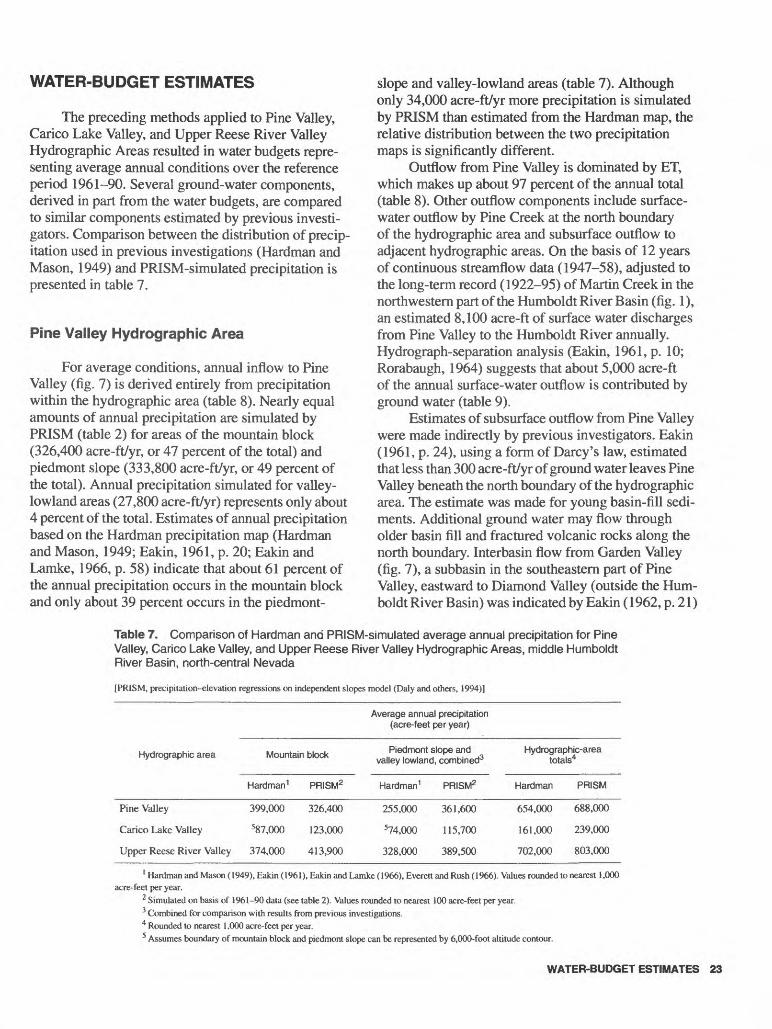
WATER-BUDGET ESTIMATES
The preceding methods applied to Pine Valley, Carico Lake Valley, and Upper Reese River Valley Hydrographic Areas resulted in water budgets repre senting average annual conditions over the reference period 1961-90. Several ground-water components, derived in part from the water budgets, are compared to similar components estimated by previous investi gators. Comparison between the distribution of precip itation used in previous investigations (Hardman and Mason, 1949) and PRISM-simulated precipitation is presented in table 7.
Pine Valley Hydrographic Area
For average conditions, annual inflow to Pine Valley (fig. 7) is derived entirely from precipitation within the hydrographic area (table 8). Nearly equal amounts of annual precipitation are simulated by PRISM (table 2) for areas of the mountain block (326,400 acre-ft/yr, or 47 percent of the total) and piedmont slope (333,800 acre-ft/yr, or 49 percent of the total). Annual precipitation simulated for valley- lowland areas (27,800 acre-ft/yr) represents only about 4 percent of the total. Estimates of annual precipitation based on the Hardman precipitation map (Hardman and Mason, 1949; Eakin, 1961, p. 20; Eakin and Lamke, 1966, p. 58) indicate that about 61 percent of the annual precipitation occurs in the mountain block and only about 39 percent occurs in the piedmont-
slope and valley-lowland areas (table 7). Although only 34,000 acre-ft/yr more precipitation is simulated by PRISM than estimated from the Hardman map, the relative distribution between the two precipitation maps is significantly different.
Outflow from Pine Valley is dominated by ET, which makes up about 97 percent of the annual total (table 8). Other outflow components include surface- water outflow by Pine Creek at the north boundary of the hydrographic area and subsurface outflow to adjacent hydrographic areas. On the basis of 12 years of continuous streamflow data (1947-58), adjusted to the long-term record (1922-95) of Martin Creek in the northwestern part of the Humboldt River Basin (fig. 1), an estimated 8,100 acre-ft of surface water discharges from Pine Valley to the Humboldt River annually. Hydrograph-separation analysis (Eakin, 1961, p. 10; Rorabaugh, 1964) suggests that about 5,000 acre-ft of the annual surface-water outflow is contributed by ground water (table 9).
Estimates of subsurface outflow from Pine Valley were made indirectly by previous investigators. Eakin (1961, p. 24), using a form of Darcy's law, estimated that less than 300 acre-ft/yr of ground water leaves Pine Valley beneath the north boundary of the hydrographic area. The estimate was made for young basin-fill sedi ments. Additional ground water may flow through older basin fill and fractured volcanic rocks along the north boundary. Interbasin flow from Garden Valley (fig. 7), a subbasin in the southeastern part of Pine Valley, eastward to Diamond Valley (outside the Hum boldt River Basin) was indicated by Eakin (1962, p. 21)
Table 7. Comparison of Hardman and PRISM-simulated average annual precipitation for Pine Valley, Carico Lake Valley, and Upper Reese River Valley Hydrographic Areas, middle Humboldt River Basin, north-central Nevada
[PRISM, precipitation-elevation regressions on independent slopes model (Daly and others, 1994)]
Average annual precipitation (acre-feet per year)
Hydrographic area
Pine Valley
Carico Lake Valley
Upper Reese River Valley
Mountain block
Hardman 1
399,000
587,000
374,000
PRISM2
326,400
123,000
413,900
Piedmont slope and valley lowland, combined3
Hardman 1
255,000
574,000
328,000
PRISM2
361,600
115,700
389,500
Hydrographic-area totals4
Hardman
654,000
161,000
702,000
PRISM
688,000
239,000
803,000
1 Hardman and Mason (1949), Eakin (1961), Eakin and Lamke (1966), Everett and Rush (1966). Values rounded to nearest 1,000 acre-feet per year.
2 Simulated on basis of 1961-90 data (see table 2). Values rounded to nearest 100 acre-feet per year.Combined for comparison with results from previous investigations.
4 Rounded to nearest 1,000 acre-feet per year.Assumes boundary of mountain block and piedmont slope can be represented by 6,000-foot altitude contour.
WATER-BUDGET ESTIMATES 23
EXPLANATION
Landforms
Valley lowland
Piedmont slope
Mountain block
Hydrographic-area boundary
20 Line of equal average annual precipitation Contour interval varies: 2 inches for 20 inches or less, 4 inches for greater than 20 inches
8 10 MILESI I
i i i i r02468 10 KILOMETERS
Base from U.S. Geological Survey digital data, 1:100,000,1977-88; 1:24,000,1985-86 Universal Transverse Mercator projection Zone 11
Figure 7. Distribution of precipitation and landforms in Pine Valley Hydrographic Area, middle Humboldt River Basin, north- central Nevada, 1961-90. Average annual-precipitation data derived from precipitation-elevation regressions on independent slopes model, or PRISM (Daly and others, 1994).
24 Water Budgets for Selected Hydrographic Areas, Middle Humboldt River Basin, Nevada Methods for Estimation
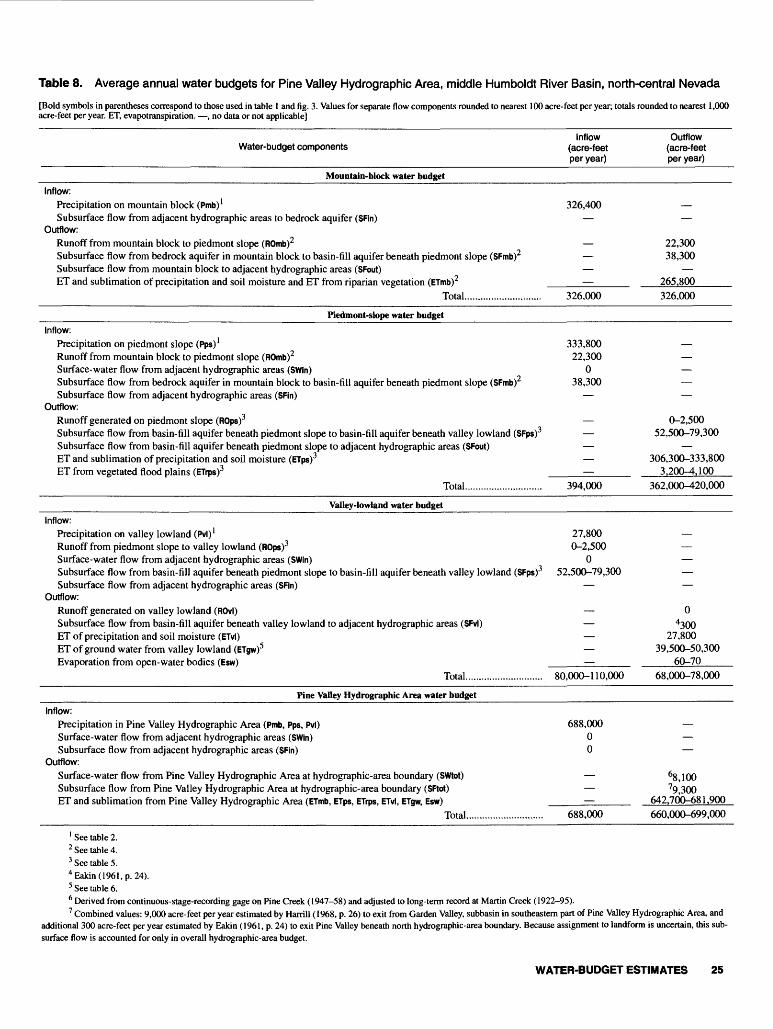
Table 8. Average annual water budgets for Pine Valley Hydrographic Area, middle Humboldt River Basin, north-central Nevada
[Bold symbols in parentheses correspond to those used in table 1 and fig. 3. Values for separate flow components rounded to nearest 100 acre-feet per year; totals rounded to nearest 1,000 acre-feet per year. ET, evapotranspiration. , no data or not applicable]
Water-budget componentsInflow
(acre-feet per year)
Outflow (acre-feet per year)
Mountain-block water budget
326,400Inflow:
Precipitation on mountain block (Pmb) 1Subsurface flow from adjacent hydrographic areas to bedrock aquifer (SFin)
Outflow:Runoff from mountain block to piedmont slope (ROmb)2Subsurface flow from bedrock aquifer in mountain block to basin-fill aquifer beneath piedmont slope (SFmb)2Subsurface flow from mountain block to adjacent hydrographic areas (SFout)ET and sublimation of precipitation and soil moisture and ET from riparian vegetation (ETmb)2
Total....................... 326,000
22,30038,300
265,800326,000
Piedmont-slope water budget
333,80022,300
038,300
Inflow:Precipitation on piedmont slope (Pps) 1Runoff from mountain block to piedmont slope (ROmb)2Surface-water flow from adjacent hydrographic areas (SWin)Subsurface flow from bedrock aquifer in mountain block to basin-fill aquifer beneath piedmont slope (SFmb)2Subsurface flow from adjacent hydrographic areas (SFin)
Outflow:Runoff generated on piedmont slope (ROps)3Subsurface flow from basin-fill aquifer beneath piedmont slope to basin-fill aquifer beneath valley lowland (SFps)3Subsurface flow from basin-fill aquifer beneath piedmont slope to adjacent hydrographic areas (SFout)ET and sublimation of precipitation and soil moisture (ETps)3ET from vegetated flood plains (ETrps)3
Total............................. 394,000
0-2,500 52,500-79,300
306,300-333,8003,200-4.100
362,000-420,000
Valley-lowland water budget
27,800 0-2,500
0 52,500-79,300
Inflow:
Precipitation on valley lowland (Pvl) 1Runoff from piedmont slope to valley lowland (ROps)3Surface-water flow from adjacent hydrographic areas (SWin)Subsurface flow from basin-fill aquifer beneath piedmont slope to basin-fill aquifer beneath valley lowland (SFps)Subsurface flow from adjacent hydrographic areas (SFin)
Outflow:Runoff generated on valley lowland (ROvl)Subsurface flow from basin-fill aquifer beneath valley lowland to adjacent hydrographic areas (SFvl)ET of precipitation and soil moisture (ETvl)ET of ground water from valley lowland (ETgw)5Evaporation from open-water bodies (Esw)
Total............................. 80,000-110,000
0
4300 27,800
39,500-50,30060-70
68,000-78,000
Pine Valley Hydrographic Area water budget
Inflow:Precipitation in Pine Valley Hydrographic Area (Pmb, Pps, Pvl) Surface-water flow from adjacent hydrographic areas (SWin) Subsurface flow from adjacent hydrographic areas (SFin)
Outflow:
Surface-water flow from Pine Valley Hydrographic Area at hydrographic-area boundary (SWtot) Subsurface flow from Pine Valley Hydrographic Area at hydrographic-area boundary (SFtot) ET and sublimation from Pine Valley Hydrographic Area (ETmb, ETps, ETrps, ETvl, ETgw, Esw)
Total.
688,00000
688,000
68,100 79,300
642.700-681.900660,000-699,000
See table 2.2 See table 4.3 See table 5. 4 Eakin(1961,p. 24).5 See table 6.6 Derived from continuous-stage-recording gage on Pine Creek (1947-58) and adjusted to long-term record at Martin Creek (1922-95).7 Combined values: 9,000 acre-feet per year estimated by Harrill (1968, p. 26) to exit from Garden Valley, subbasin in southeastern part of Pine Valley Hydrographic Area, and
additional 300 acre-feet per year estimated by Eakin (1961, p. 24) to exit Pine Valley beneath north hydrographic-area boundary. Because assignment to landform is uncertain, this sub surface flow is accounted for only in overall hydrographic-area budget.
WATER-BUDGET ESTIMATES 25
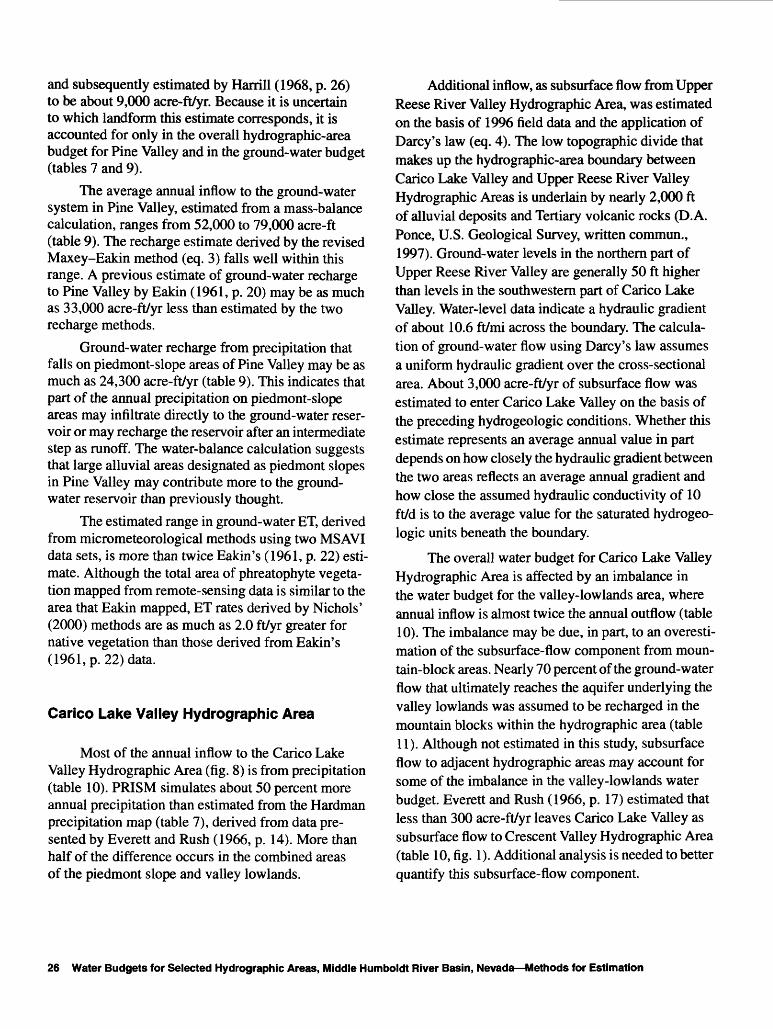
and subsequently estimated by Harrill (1968, p. 26) to be about 9,000 acre-ft/yr. Because it is uncertain to which landform this estimate corresponds, it is accounted for only in the overall hydrographic-area budget for Pine Valley and in the ground-water budget (tables 7 and 9).
The average annual inflow to the ground-water system in Pine Valley, estimated from a mass-balance calculation, ranges from 52,000 to 79,000 acre-ft (table 9). The recharge estimate derived by the revised Maxey-Eakin method (eq. 3) falls well within this range. A previous estimate of ground-water recharge to Pine Valley by Eakin (1961, p. 20) may be as much as 33,000 acre-ft/yr less than estimated by the two recharge methods.
Ground-water recharge from precipitation that falls on piedmont-slope areas of Pine Valley may be as much as 24,300 acre-ft/yr (table 9). This indicates that part of the annual precipitation on piedmont-slope areas may infiltrate directly to the ground-water reser voir or may recharge the reservoir after an intermediate step as runoff. The water-balance calculation suggests that large alluvial areas designated as piedmont slopes in Pine Valley may contribute more to the ground- water reservoir than previously thought.
The estimated range in ground-water ET, derived from micrometeorological methods using two MSAVI data sets, is more than twice Eakin's (1961, p. 22) esti mate. Although the total area of phreatophyte vegeta tion mapped from remote-sensing data is similar to the area that Eakin mapped, ET rates derived by Nichols' (2000) methods are as much as 2.0 ft/yr greater for native vegetation than those derived from Eakin's (1961, p. 22) data.
Carico Lake Valley Hydrographic Area
Most of the annual inflow to the Carico Lake Valley Hydrographic Area (fig. 8) is from precipitation (table 10). PRISM simulates about 50 percent more annual precipitation than estimated from the Hardman precipitation map (table 7), derived from data pre sented by Everett and Rush (1966, p. 14). More than half of the difference occurs in the combined areas of the piedmont slope and valley lowlands.
Additional inflow, as subsurface flow from Upper Reese River Valley Hydrographic Area, was estimated on the basis of 1996 field data and the application of Darcy's law (eq. 4). The low topographic divide that makes up the hydrographic-area boundary between Carico Lake Valley and Upper Reese River Valley Hydrographic Areas is underlain by nearly 2,000 ft of alluvial deposits and Tertiary volcanic rocks (D.A. Ponce, U.S. Geological Survey, written commun., 1997). Ground-water levels in the northern part of Upper Reese River Valley are generally 50 ft higher than levels in the southwestern part of Carico Lake Valley. Water-level data indicate a hydraulic gradient of about 10.6 ft/mi across the boundary. The calcula tion of ground-water flow using Darcy's law assumes a uniform hydraulic gradient over the cross-sectional area. About 3,000 acre-ft/yr of subsurface flow was estimated to enter Carico Lake Valley on the basis of the preceding hydrogeologic conditions. Whether this estimate represents an average annual value in part depends on how closely the hydraulic gradient between the two areas reflects an average annual gradient and how close the assumed hydraulic conductivity of 10 ft/d is to the average value for the saturated hydrogeo logic units beneath the boundary.
The overall water budget for Carico Lake Valley Hydrographic Area is affected by an imbalance in the water budget for the valley-lowlands area, where annual inflow is almost twice the annual outflow (table10). The imbalance may be due, in part, to an overesti- mation of the subsurface-flow component from moun tain-block areas. Nearly 70 percent of the ground-water flow that ultimately reaches the aquifer underlying the valley lowlands was assumed to be recharged in the mountain blocks within the hydrographic area (table11). Although not estimated in this study, subsurface flow to adjacent hydrographic areas may account for some of the imbalance in the valley-lowlands water budget. Everett and Rush (1966, p. 17) estimated that less than 300 acre-ft/yr leaves Carico Lake Valley as subsurface flow to Crescent Valley Hydrographic Area (table 10, fig. 1). Additional analysis is needed to better quantify this subsurface-flow component.
26 Water Budgets for Selected Hydrographic Areas, Middle Humboldt River Basin, Nevada Methods for Estimation

Table 9. Average annual ground-water budget for Pine Valley Hydrographic Area, middle Humboldt River Basin, north-central Nevada
[Values for separate flow components and subtotals rounded to nearest 100 acre-feet per year; totals rounded to nearest 1,000 acre-feet per year. Bold symbols (in footnotes) correspond to those used in table 1 and fig. 3. , no data or not applicable]
Ground-water-budget component
Ground- water recharge:
To mountain block
To piedmont slope, from runoff
To piedmont slope, from precipitation
To valley lowland
Subtotal ground-water recharge..................
Subsurface inflow from adjacent hydrographic areas
Total inflow.................................................
Ground-water evapotranspiration in valley lowland
Ground-water discharge from vegetated flood plains
Ground-water discharge to Pine Creek in valley lowland
Subsurface outflow to adjacent hydrographic areas
Total outflow...............................................
By mass-balance calculation,
this investigation
Inflow
'38,300
3 14,200-16,700
40-24,300
Negligible
.. 52,500-79,300
0
52,000-79,000
Outflow
739,500-50,300
93,200-4,100
10 5,000 129,300
.. 57,000-69,000
Estimated flow (acre-feet per year)
By revised recharge method, this investigation
565.900
66,000
By other methods, previous
investigations
2 14,000
646.00020
46,000
8 19,100
"5,000 I29,300
33,000
See table 4.2 Eakin and Lamke (1966, p. 58).3 Estimated as difference between sum of mountain-block runoff (ROmb; table 4) plus piedmont-slope runoff (ROps; table 5) and total surface-water outflow
at hydrographic-area boundary (SWtot; table 8).4 Estimated as difference between piedmont-slope precipitation (Pps; table 2) and sum of piedmont-slope runoff (ROps; table 5) plus evapotranspiration
components (ETps and ETrps; table 5).5 Estimated from equation 3 (see text).6 Eakin (1961, p. 20).7 See table 6.8 Derived from Eakin (1961, p. 22); Eakin applied correction of 2,000 acre-feet per year for below-average conditions.9 See table 5.
10 Estimated by hydrograph-separation analysis (Rorabaugh, 1964) and from Eakin (1961, p. 10). 1 ' Derived from Eakin (1961, p. 22).12 Mostly outflow to Diamond Valley Hydrographic Area (outside Humboldt River Basin), 9,000 acre-feet per year estimated by Harrill (1968, p. 26); value
also includes 300 acre-feet per year outflow to Humboldt River, estimated by Eakin (1961, p. 24).
Ground-water inflow to Carico Lake Valley Hydrographic Area is calculated to be almost five times that estimated earlier by Everett and Rush (1966, p. 14). The lower end of the range of ground-water recharge, derived from the mass-balance calculation, is only about 800 acre-ft/yr greater than the estimate derived by the revised Maxey-Eakin method (table 11). The revised method is based on the volume of pre cipitation that falls within the hydrographic area and does not account for ground water that originates out
side the area. Consequently, the estimated 3,000 acre-ft/yr of ground-water inflow from Upper Reese River Valley would be in addition to the estimate of ground-water recharge derived by the revised method. However, both methods for estimating ground-water recharge result in an imbalance of 12,000 to 16,000 acre-ft/yr between ground-water inflow and outflow, which may suggest additional subsurface outflow.
Although the area of ground-water discharge mapped by Everett and Rush (1966, p. 16) is nearly
WATER-BUDGET ESTIMATES 27

116°
EXPLANATION
Landforms
Valley lowland
Piedmont slope
Mountain block
Hydrographic-area boundary
20 Line of equal average annual precipitation Contour interval 2 inches
0 5 MILESiii i I
~~l I I I |
0 5 KILOMETERS
Base from U.S. Geological Survey digital data, 1-100000, 1977-88; 1:24,000, 1969-90 Universal Transverse Mercator projection Zone 11
Figure 8. Distribution of precipitation and landforms in Carico Lake Valley Hydrographic Area, middle Humboldt River Basin, north-central Nevada, 1961-90.
28 Water Budgets for Selected Hydrographic Areas, Middle Humboldt River Basin, Nevada Methods for Estimation
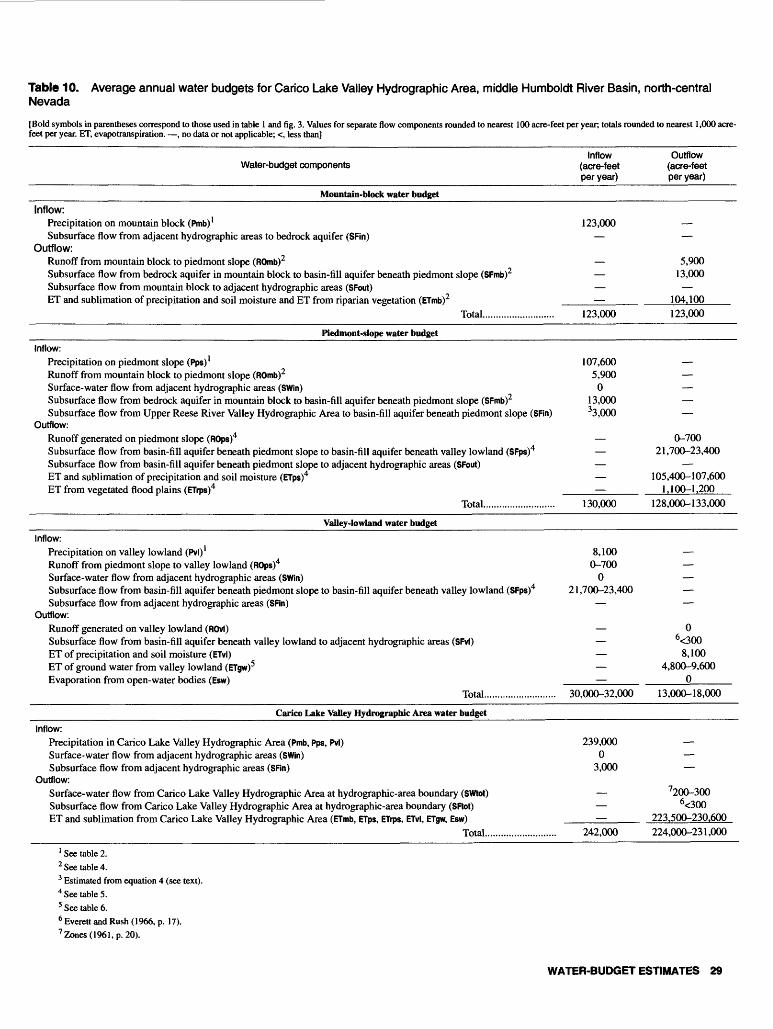
Table 10. Average annual water budgets for Carico Lake Valley Hydrographic Area, middle Humboldt River Basin, north-central Nevada
[Bold symbols in parentheses correspond to those used in table 1 and fig. 3. Values for separate flow components rounded to nearest 100 acre-feet per year; totals rounded to nearest 1,000 acre- feet per year. ET, evapotranspiration. , no data or not applicable; <, less than]
Water-budget componentsInflow
(acre-feet per year)
Outflow (acre-feet per year)
Mountain-block water budget
123,000Inflow:
Precipitation on mountain block (Pmb) 1Subsurface flow from adjacent hydrographic areas to bedrock aquifer (SFin)
Outflow:Runoff from mountain block to piedmont slope (ROmb)2Subsurface flow from bedrock aquifer in mountain block to basin-fill aquifer beneath piedmont slope (SFmb)2Subsurface flow from mountain block to adjacent hydrographic areas (SFout)ET and sublimation of precipitation and soil moisture and ET from riparian vegetation (ETmb)2
Total............
5,90013,000
104.100123,000 123,000
Piedmont-slope water budget
107,6005,9000
13,00033,000
Inflow:Precipitation on piedmont slope (Pps) 1Runoff from mountain block to piedmont slope (ROmb)2Surface-water flow from adjacent hydrographic areas (SWin)Subsurface flow from bedrock aquifer in mountain block to basin-fill aquifer beneath piedmont slope (SFmb)2Subsurface flow from Upper Reese River Valley Hydrographic Area to basin-fill aquifer beneath piedmont slope (SFin)
Outflow:Runoff generated on piedmont slope (ROps)4Subsurface flow from basin-fill aquifer beneath piedmont slope to basin-fill aquifer beneath valley lowland (SFps)4Subsurface flow from basin-fill aquifer beneath piedmont slope to adjacent hydrographic areas (SFout)ET and sublimation of precipitation and soil moisture (ETps)4ET from vegetated flood plains (ETrps)4
Total...........................
0-700 21,700-23,400
105,400-107,600 1.100-1.200
130,000 128,000-133,000
Valley-lowland water budget
8,100 0-700
0 21,700-23,400
Inflow:Precipitation on valley lowland (Pvl) 1Runoff from piedmont slope to valley lowland (ROps)4Surface-water flow from adjacent hydrographic areas (SWin)Subsurface flow from basin-fill aquifer beneath piedmont slope to basin-fill aquifer beneath valley lowland (SFps)Subsurface flow from adjacent hydrographic areas (SFin)
Outflow:Runoff generated on valley lowland (ROvl)Subsurface flow from basin-fill aquifer beneath valley lowland to adjacent hydrographic areas (SFvl)ET of precipitation and soil moisture (ETvl)ET of ground water from valley lowland (ETgw)5Evaporation from open-water bodies (Esw)
Total.....................
06<300
8,1004,800-9,600
030,000-32,000 13,000-18,000
Carico Lake Valley Hydrographic Area water budget
Inflow:Precipitation in Carico Lake Valley Hydrographic Area (Pmb, Pps, Pvl) Surface-water flow from adjacent hydrographic areas (SWin) Subsurface flow from adjacent hydrographic areas (SRn)
Outflow:Surface-water flow from Carico Lake Valley Hydrographic Area at hydrographic-area boundary (SWtot) Subsurface flow from Carico Lake Valley Hydrographic Area at hydrographic-area boundary (SRot) ET and sublimation from Carico Lake Valley Hydrographic Area (ETmb, ETps, ETrps, ETvl, ETgw, Esw)
Total...
239,0000
3,000
7200-3006<300
223.500-230.600242,000 224,000-231,000
1 See table 2.2 See table 4.3 Estimated from equation 4 (see text).4 See table 5.5 See table 6.6 Everett and Rush (1966, p. 17).7 Zones (1961, p. 20).
WATER-BUDGET ESTIMATES 29
Table 11. Average annual ground-water budget for Carico Lake Valley Hydrographic Area, middle Humboldt River Basin, north-central Nevada
[Values for separate flow components and subtotals rounded to nearest 100 acre-feet per year; totals rounded to nearest 1,000 acre-feet per year. Bold symbols (in footnotes) correspond to those used in table 1 and fig. 3. , no data or not applicable; <, less than]
Ground-water-budget component
Ground-water recharge: To mountain block To piedmont slope, from runoff To piedmont slope, from precipitation To valley lowland
Subtotal ground- water recharge. ..............Subsurface inflow from adjacent hydrographic areas
Total inflow..............................................
Ground- water evapotranspiration in valley lowland Ground-water discharge from vegetated flood plains
By mass-balance calculation,
this Investigation
Inflow
hs.ooo25,700-6,300
30-1,100 Negligible
18,700-20,40063,000
..... 22,000-23,000Outflow
84,800-9,600
101,100-1,200
Estimated flow (acre-feet per year)
By revised recharge method, this investigation
_
4 17,900
4 18,000
By other methods, previous
investigations
54,30070
4,000
93,800
Ground-water discharge as surface-water outflow at hydrographic-area boundary.
Subsurface outflow to adjacent hydrographic areas Total outflow...................................
ll<300 6,000-11,000
n300
4,000
1 See table 4.2 Estimated as difference between sum of mountain-block runoff (ROmb; table 4) plus piedmont-slope runoff (ROps; table 5) and total surface-water outflow
at hydrographic-area boundary (SWtot; table 10).3 Estimated as difference between piedmont-slope precipitation (Pps; table 2) and sum of piedmont-slope runoff (ROps; table 5) plus evapotranspiration
components (ETps and ETrps; table 5).4 Estimated from equation 3 (see text).5 Everett and Rush (1966, p. 14).6 Estimated from equation 4 (see text).7 Everett and Rush (1966, p. 11).8 See table 6.9 Everett and Rush (1966, p. 16).
10 See table 5.11 Everett and Rush (1966, p. 17).
twice the area derived from Landsat TM data collected in June 1989 and June 1995, their estimate of total ground-water ET is from 1,000 to 5,800 acre-ft/yr less than that estimated during this investigation (table 11). The difference is due, in part, to the higher rates derived from micrometeorological methods. Everett and Rush (1966, p. 16) used an average ET rate of 0.2 ft/yr for an area! density of 15 to 30 percent plant cover. For a plant cover of at least 10 but less than 35 percent, the average ET rate derived by micrometeorological methods is about 1.8 ft/yr (table 6).
Upper Reese River Valley Hydrographic Area
Inflow to Upper Reese River Valley Hydrographic Area (fig. 9) originates entirely as precipitation within the hydrographic area (table 12). About 100,000 acre- ft/yr more precipitation is simulated by PRISM than determined from the Hardman precipitation map (Hardman and Mason, 1949; Eakin and others, 1965, p. 28; Eakin and Lamke, 1966, p. 58). More than half the difference occurs in the piedmont-slope and valley- lowland areas (table 7).
30 Water Budgets for Selected Hydrographic Areas, Middle Humboldt River Basin, Nevada Methods for Estimation

39°30'
EXPLANATION
Landforms['. .'.".-." ' Valley lowland
Piedmont slope
^ ^ Hydrographic-area boundary
20 Line of equal average annual precipitation Contour interval varies: 2 inches for 20 inches or less, 4 inches for greater than 20 inches
10 MILES_____I
0 5 10 KILOMETERS
Base from U.S. Geological Survey digital data, 1:100,000, 1977-88; 1:24,000, 1969-88 Universal Transverse Mercator projection Zone 11
Figure 9. Distribution of precipitation and landforms in Upper Reese River Valley Hydrographic Area, middle Humboldt River Basin, north-central Nevada, 1961-90.
WATER-BUDGET ESTIMATES 31
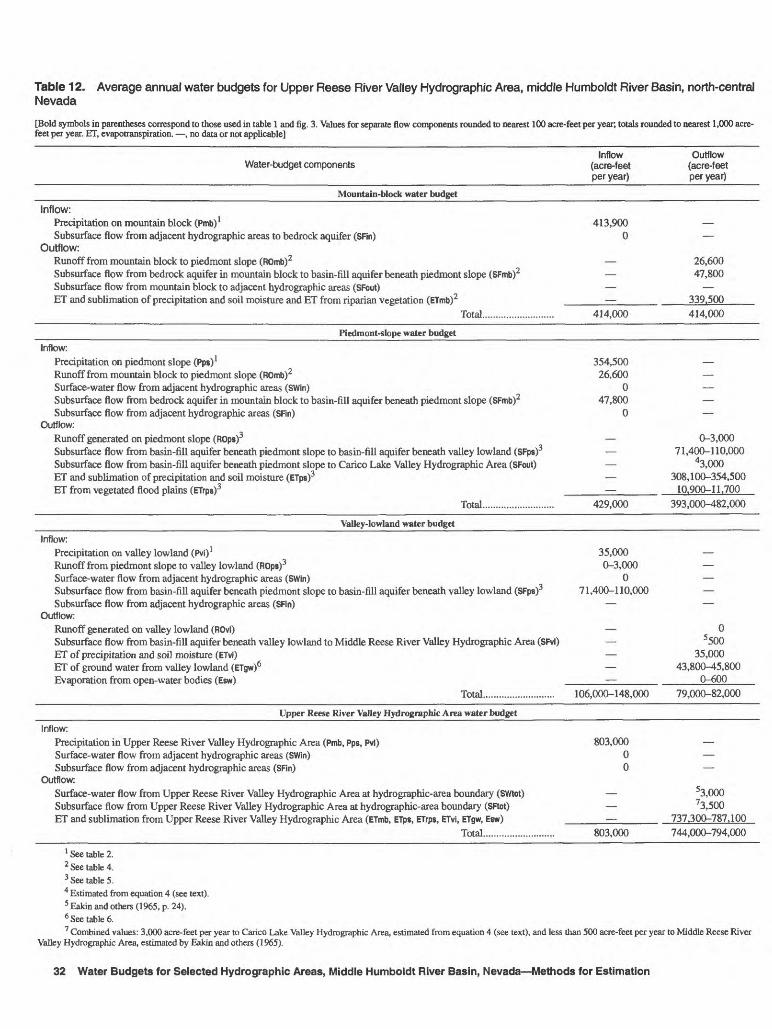
Table 12. Average annual water budgets for Upper Reese River Valley Hydrographic Area, middle Humboldt River Basin, north-central Nevada
[Bold symbols in parentheses correspond to those used in table 1 and fig. 3. Values for separate flow components rounded to nearest 100 acre-feet per year; totals rounded to nearest 1,000 acre- feet per year. ET, evapotranspiration. , no data or not applicable]
Water-budget componentsInflow
(acre-feet per year)
Outflow (acre-feet per year)
Mountain-block water budget
413,9000
Inflow:Precipitation on mountain block (Pmb) 1Subsurface flow from adjacent hydrographic areas to bedrock aquifer (SFin)
Outflow:Runoff from mountain block to piedmont slope (ROmb)2Subsurface flow from bedrock aquifer in mountain block to basin-fill aquifer beneath piedmont slope (SFmb)2Subsurface flow from mountain block to adjacent hydrographic areas (SFout)ET and sublimation of precipitation and soil moisture and ET from riparian vegetation (ETmb)2
Total................
26,60047,800
339.500414,000 414,000
Piedmont-slope water budget
354,50026,600
047,800
0
Inflow:Precipitation on piedmont slope (Pps) 1Runoff from mountain block to piedmont slope (ROmb)2Surface-water flow from adjacent hydrographic areas (SWin)Subsurface flow from bedrock aquifer in mountain block to basin-fill aquifer beneath piedmont slope (SFmb)2Subsurface flow from adjacent hydrographic areas (SFin)
Outflow:Runoff generated on piedmont slope (ROps)3Subsurface flow from basin-fill aquifer beneath piedmont slope to basin-fill aquifer beneath valley lowland (SFps)3Subsurface flow from basin-fill aquifer beneath piedmont slope to Carico Lake Valley Hydrographic Area (SFout)ET and sublimation of precipitation and soil moisture (ETps)3ET from vegetated flood plains (ETrps)3
Total........................
0-3,000 71,400-110,000
43,000308,100-354,500
10.900-11,700
429,000 393,000-482,000
Valley-lowland water budget
35,000 0-3,000
0 71,400-110,000
Inflow:Precipitation on valley lowland (Pvi) 1Runoff from piedmont slope to valley lowland (ROps)3Surface-water flow from adjacent hydrographic areas (SWin)Subsurface flow from basin-fill aquifer beneath piedmont slope to basin-fill aquifer beneath valley lowland (SFps)3Subsurface flow from adjacent hydrographic areas (SFin)
Outflow:Runoff generated on valley lowland (ROvl)Subsurface flow from basin-fill aquifer beneath valley lowland to Middle Reese River Valley Hydrographic Area (SFvl)ET of precipitation and soil moisture (ETvi)ET of ground water from valley lowland (ETgw)6Evaporation from open-water bodies (Esw)
Total...........................
05500
35,00043,800-45,800
0-600106,000-148,000 79,000-82,000
Upper Reese River Valley Hydrographic Area water budget
803,00000
Inflow:Precipitation in Upper Reese River Valley Hydrographic Area (Pmb, Pps, Pvl) Surface-water flow from adjacent hydrographic areas (SWin) Subsurface flow from adjacent hydrographic areas (SFin)
Outflow:Surface-water flow from Upper Reese River Valley Hydrographic Area at hydrographic-area boundary (SWtot) Subsurface flow from Upper Reese River Valley Hydrographic Area at hydrographic-area boundary (SFtot) ET and sublimation from Upper Reese River Valley Hydrographic Area (ETmb, ETps, ETrps, ETvi, ETgw, Esw)
Total.................
53,00073,500
737.300-787.100803,000 744,000-794,000
See table 2.2 See table 4.3 See table 5.
Estimated from equation 4 (see text).5 Eakin and others (1965, p. 24).6 See table 6.7 Combined values: 3,000 acre-feet per year to Carico Lake Valley Hydrographic Area, estimated from equation 4 (see text), and less than 500 acre-feet per year to Middle Reese River
Valley Hydrographic Area, estimated by Eakin and others (1965).
32 Water Budgets for Selected Hydrographic Areas, Middle Humboldt River Basin, Nevada Methods for Estimation

Nearly all the outflow from the Upper Reese River Valley is by ET (table 12). In addition, Eakin and others (1965, p. 24) estimated that about 3,000 acre- ft/yr leaves the hydrographic area as surface water through a narrow canyon in Reese River Valley. Most of the flow is during short periods of high-intensity rain or during the spring runoff. Hydrograph-separation analysis (Rorabaugh, 1964) on limited streamflow data indicates that about one third of the annual surface- water outflow is contributed by ground water. Other outflow includes about 3,500 acre-ft/yr of subsurface flow to adjacent hydrographic areas. As previously dis cussed, about 3,000 acre-ft/yr was estimated to leave
the hydrographic area as ground-water flow to Carico Lake Valley. Also, nearly 500 acre-ft/yr of ground water was estimated to flow northward beneath the nar row canyon to the Middle Reese River Valley Hydro- graphic Area (Eakin and others, 1965).
Estimates of ground-water recharge for Upper Reese River Valley derived by the revised Maxey- Eakin method and a mass-balance approach are more than twice Eakin and others' (1965) estimates (table 13). Because of the assumption that nearly all the run off is available for recharge, infiltrated runoff accounts for about 25 percent of the total ground-water recharge in the revised water budget. This is in good agreement
Table 13. Average annual ground-water budget for Upper Reese River Valley Hydrographic Area, middle Humboldt River Basin, north-central Nevada
[Values for separate flow components and subtotals rounded to nearest 100 acre-feet per year; totals rounded to nearest 1,000 acre-feet per year. Bold symbols (in footnotes) correspond to those used in table 1 and fig. 3. , no data or not applicable; <, less than]
Ground-water-budget component
Ground-water recharge: To mountain block To piedmont slope, from runoff To piedmont slope, from precipitation To valley lowland
Subtotal ground- water recharge. .........Subsurface inflow from adjacent hydrographic areas
Total inflow.......... ...............................
Ground-water evapotranspiration in valley lowland Ground-water discharge from vegetated flood plains Ground-water discharge as surface-water outflow at
hydrographic-area boundary.
Subsurface outflow to adjacent hydrographic areasTotal outflow......................................
1 See table 4.2 Ealrin onA T amir* f\ OAA r. «~k
By mass-balance calculation,
this investigation
Inflow
UT.SOO323,600-26,600
50-35,500
Negligible
71,400-110,000
0
71,000-110,000
Outflow
843,800-45,800 10 10,900-11,700
U<1,000
83,50059,000-62,000
Estimated flow (acre-feet per year)
By revised recharge method, this investigation
693,400
93,000
By other methods, previous
investigations
^.OOO 4 11,000
734,00020
34,000
933,000 94,000
9500
38,000
3 Estimated as difference between sum of mountain-block runoff (ROmb; table 4) plus piedmont-slope runoff (ROps; table 5) and total runoff at hydrographic-area boundary (SWtOt; table 12).
4 Eakin and others (1965, p. 25).5 Estimated as difference between piedmont-slope precipitation (Pps; table 2) and sum of piedmont-slope runoff (ROps; table 5) plus evapotranspira
tion components (ETps and ETrps; table 5).6 Estimated from equation 3 (see text).7 Eakin and others (1965, p. 27-28) calculated 58,000 acre-feet per year by Maxey-Eakin method (Watson and others, 1976) but reported it as 37,000
acre-feet per year because of assumed deficiency of precipitation in mountain areas.8 Rounded to nearest 1,000 acre-feet per year.9 See table 6.
10 Eakin and others (1965).11 See table 5.12 Estimated from hydrograph-separation analysis (Rorabaugh, 1964).
WATER-BUDGET ESTIMATES 33
with Eakin and others' (1965, p. 23) estimate that about 30 percent of the runoff generated in mountain-block areas within the Upper Reese River Valley becomes ground-water recharge. Additional work is needed to understand and quantify recharge processes that take place on piedmont slopes within the Humboldt River Basin.
Mass-balance calculations of ground-water out flow from Upper Reese River Valley are more than 20,000 acre-ft/yr greater than estimated earlier by Eakin and others (1965) (table 13). Half of this differ ence between the outflow estimates is a result of the larger estimates of ground-water ET from vegetated flood plains and the estimate of additional subsurface outflow to Carico Lake Valley Hydrographic Area. Application of higher ET rates, derived by micro- meteorological methods for phreatophyte vegetation, accounts for the remaining difference in outflow. The revised ground-water budget for the Upper Reese River Valley Hydrographic Area shows an imbalance between inflow and outflow that suggests additional, unaccounted outflow from the hydrographic area. Esti mates of ground-water ET from vegetated flood plains, which are considered to be minimum estimates, may account for some of the imbalance. Additional ground water may flow out through the fractured volcanic rock along the north boundary of Upper Reese River Valley.
Discussion of Water-Budget Estimates
Although the newly estimated water budgets are subject to a number of qualifications, they illustrate the relative distribution and movement of water and are considered to represent average annual conditions for the reference period 1961-90. Previous budget esti mates generally represent average conditions for the reference period 1912-63 (Eakin and Lamke, 1966, p. 63).
In Pine Valley, average annual precipitation simulated by PRISM is about 5 percent greater than that estimated from the Hardman precipitation map (Hardman and Mason, 1949); in Upper Reese River Valley, it is about 14 percent greater; and in Carico Lake Valley, nearly 50 percent greater. The Hardman precipitation map, which was developed from weather records and other data collected over a period of sev eral decades (through 1936), was correlated with data
on altitude and topography, latitude, and vegetation type. Precipitation measured at Austin, Battle Moun tain, Elko, Lovelock, and Winnemucca indicates below-average precipitation from about 1915 to the early 1930's (Hardman and Mason, 1949, p. 13; Eakin and Lamke, 1966, p. 21). The reference period 1961- 90 had an almost-equal number of years of below- and above-average precipitation (J.W. James, Nevada State Climatologist, oral commun., 1998).
Of equal importance to the total volume of pre cipitation is the difference in the relative distribution of the precipitation among the three landforms in a hydrographic area. Nearly half of the annual precipi tation occurs on piedmont slopes. Because these are relatively large areas and receive a substantial amount of annual precipitation, they may be more significant contributors to ground water and runoff than previ ously thought. According to the Hardman precipita tion map, more than 50 percent of Carico Lake Valley Hydrographic Area and about 30 percent of Upper Reese River Valley Hydrographic Area receive less than 8 in. of average annual precipitation. PRISM sim ulated no average annual precipitation of less than 8 in. in the three hydrographic areas.
More than 95 percent of the total precipitation in the three basins is lost to ET. Nearly equal amounts of precipitation in mountain-block and piedmont-slope areas are estimated to be lost to ET. The small amount of precipitation (about 4 percent) that falls on valley lowlands is lost to ET According to recent work using micrometeorological methods for determining ground- water discharge by ET (Nichols, 2000), annual ET rates from phreatophyte vegetation appear to be significantly greater than previously assumed. In general, the aver age annual ET rates used for areas having at least 50 percent plant cover in earlier studies ranged from about 0.1 to 0.5 ft/yr, whereas the rates determined from micrometeorological methods range from about 0.5 to more than 2.5 ft/yr. The higher rates are significant in hydrographic areas that currently are undergoing ground-water development based on the concept of perennial yield, or the volume of natural discharge that can be captured (Malmberg, 1967, p. 37). Ground- water ET from vegetated flood plains ranges from about 7 to 20 percent of the estimated total ground- water ET.
34 Water Budgets for Selected Hydrographic Areas, Middle Humboldt River Basin, Nevada Methods for Estimation
On the basis of the revised runoff method (eq. 1) and the water-yield equation (eq. 2), about 11 per cent of mountain-block precipitation becomes ground- water recharge. Eakin and Lamke (1966, p. 58) had estimated that contribution to be generally 6 to 8 per cent. However, total ground-water inflow, derived from mass-balance calculations, generally is much greater than previously estimated, owing, in part, to the greater precipitation simulated by PRISM. From 7 to 14 per cent of the total annual precipitation was estimated to become ground-water recharge on the basis of the new water budgets compared to earlier estimates of 3 to 7 percent. The earlier estimates of ground-water recharge were based on the original Maxey-Eakin method and resulted in bulk estimates of recharge with no indica tion of where recharge occurred. Developing water budgets for individual landforms and the associated aquifers and doing mass-balance calculations have provided some insight into the areal distribution and processes of ground-water recharge.
SUMMARY AND CONCLUSIONS
The middle Humboldt River Basin includes 14 hydrographic areas that cover about 7,470 mi2 in north-central Nevada. Although agricultural irrigation has accounted for much of the water use in the basin, increased mining activities in recent years have placed additional demands on the basin's limited water resources. In 1995, the USGS, in cooperation with the Nevada Division of Water Resources, began a water- resources assessment of the middle Humboldt River Basin to address concerns about regional and long-term effects of dewatering at open-pit mining operations. A systematic approach for estimating water budgets of individual hydrographic areas within the middle Hum boldt River Basin was developed as part of this assess ment. Pine Valley, Carico Lake Valley, and Upper Reese River Valley Hydrographic Areas were selected for demonstrating the methods for estimating compo nents of a water budget.
Each hydrographic area is subdivided on the basis of three easily identifiable landforms mountain blocks, piedmont slopes, and valley lowlands and the characteristics of ground-water flow in the underlying hydrogeologic units. Mountain blocks form the main zone of recharge, piedmont slopes the main zone of lateral flow, and the valley lowlands the main zone of ground-water discharge.
The most significant water-budget components identified in the middle Humboldt River Basin are pre cipitation, runoff, water yield, ground-water recharge and subsurface flow, and ET. Precipitation is the prin cipal source of inflow to the hydrographic areas, and ET is the dominant outflow component. The water yield from mountain blocks consists of runoff gener ated in the watersheds and subsurface flow from bed rock aquifers. Ground-water recharge occurs by infil tration of precipitation, runoff, nonchannelized flow, or ponded water.
The water budgets were developed assuming approximate equilibrium and no long-term average annual net change in ground-water storage (steady- state conditions). The estimated budget components represent average annual volumes over a 30-year ref erence period (1961-90). Equations of hydrologic equilibrium were used to describe the water budgets in terms of inflow balanced by outflow. In some instances, outflow from one landform represents inflow to an adjacent landform.
A statistical-topographic model developed by Oregon State University was used to determine the dis tribution of precipitation. Known as PRISM, the model simulates average annual precipitation at regional scales. The simulated precipitation was derived from weather-station data throughout Nevada and represents the average for the 30-year reference period. Methods were developed for estimating runoff, water yield, and ground-water recharge as functions of the distribution and quantity of average annual precipitation.
Runoff and water yield from mountain-block areas were estimated from regression analyses among average annual streamflow, water yield, and precipi tation. The estimated water yield was used in the water budgets to describe the relation between mountain- block runoff and subsurface flow. Runoff originating on piedmont slopes was estimated to range from 0 to 10 percent of the total runoff generated within hydro- graphic-area boundaries.
Ground-water recharge was estimated by a mod ified Maxey-Eakin method and by a mass-balance calculation. The ground-water recharge estimates were used to evaluate individual budget components, par ticularly subsurface flow between aquifers underlying adjacent landforms. The estimates also were used in identifying locations and processes of ground-water recharge in each basin.
SUMMARY AND CONCLUSIONS 35
Water loss by ET and sublimation in the moun tain blocks could only be determined indirectly as the difference between average annual precipitation and average annual water yield. Average annual ET from piedmont slopes was derived, in part, by the Penman- Monteith equation using weather-station data. ET from valley lowlands was estimated from a more recently developed method using micrometeorological tech niques and remotely sensed Landsat TM (satellite) data.
Applied to the three selected hydrographic areas, these methods yielded revised water budgets represent ing average annual conditions over the reference period 1961-90. Previous water budgets for Pine Valley, Car- ico Lake Valley, and Upper Reese River Valley Hydro- graphic Areas relied exclusively on the Hardman pre cipitation map and were assumed generally to represent average conditions for the reference period 1912-63.
Annual inflow to Pine Valley is derived entirely from precipitation within the hydrographic area. Nearly equal amounts of precipitation are simulated to occur on the mountain block and piedmont slope. Outflow from Pine Valley is mostly by ET but also includes some surface-water outflow (about 8,100 acre-ft/yr) and subsurface outflow (about 9,300 acre- ft/yr) to adjacent hydrographic areas. The average annual inflow to the ground-water system, estimated by mass balance, is 52,500 to 79,300 acre-ft, a range that includes the recharge estimate derived from the revised Maxey-Eakin method. The new estimates of recharge may be as much as 30,000 acre-ft/yr greater than previous results.
Annual inflow to Carico Lake Valley Hydro- graphic Area is mostly from precipitation but also includes some subsurface inflow (about 3,000 acre- ft/yr) from Upper Reese River Valley. Ground-water recharge to Carico Lake Valley estimated by the two methods is almost five times that previously estimated. The water budget for Carico Lake Valley is affected by an imbalance in the water budget for the valley- lowlands area, where annual inflow is almost twice the annual outflow.
Annual inflow to Upper Reese River Valley orig inates entirely as precipitation within the hydrographic area. More than 100,000 acre-ft/yr more precipitation
was simulated by PRISM than determined from the Hardman precipitation map. More than half the differ ence occurs on the piedmont slopes and in the valley lowlands. Nearly all the outflow from Upper Reese River Valley is by ET. The imbalance in the ground- water budget suggests that outflow may be greater than assumed in the current budget. For instance, ground- water discharge from vegetated flood plains may be higher than estimated, and subsurface outflow through the fractured volcanic rock along the north boundary may be greater than estimated.
The average annual precipitation simulated by PRISM is about 5 percent greater for Pine Valley than that estimated from the Hardman precipitation map, about 14 percent greater for Upper Reese River Valley, and nearly 50 percent greater for Carico Lake Valley. Some of the difference between the estimates may be because the periods of record of the PRISM and Hard man data only overlapped by a few years.
The relative distribution of annual precipitation among the three landforms in a hydrographic area is as significant as the total volume of precipitation. Because nearly half the annual precipitation occurs on piedmont slopes, more ground-water recharge may occur in these areas than previously assumed. The Hardman precipi tation map indicates that more than 50 percent of Carico Lake Valley Hydrographic Area and about 30 percent of Upper Reese River Valley Hydrographic Area receive less than 8 in. of annual precipitation. PRISM simulated no areas with precipitation of less than 8 in. in the three hydrographic areas.
Total ground-water inflow and outflow for all three hydrographic areas, derived from mass-balance calculations, are generally greater than estimated by previous investigators. The percentage of total precipi tation that becomes ground water was estimated to be about twice previous estimates (7 to 14 percent com pared to 3 to 7 percent). Most of the precipitation that falls in the three areas is lost to ET prior to becoming either runoff or ground water. The average annual ET rates derived by micrometeorological methods range from about 0.5 to more than 2.5 ft/yr, which is higher than the rates assumed in earlier studies (0.1-0.5 ft/yr).
36 Water Budgets for Selected Hydrographic Areas, Middle Humboldt River Basin, Nevada Methods for Estimation
GLOSSARY
Some of the technical terms and acronyms used in this report are defined for the convenience of the reader. Most of the following definitions were modified from (1) Langbein and Iseri (1960), (2) Tomlinson (1994), (3) Horton (1998), and (4) Wilson and Moore (1998).Aerodynamic resistance. Turbulent resistance between
average height of canopy and height at which tempera ture and wind speed were measured (2).
Aquifer. Formation, group of formations, or part of forma tion that contains sufficient saturated permeable material to yield significant quantities of water to wells and springs (4).
Average conditions. Conditions under which numerical value for hydrologic variable, such as precipitation or streamflow, is equal to arithmetic mean for selected time period. Also see definition of "natural conditions."
Baseflow. Sustained or fair-weather flow of stream, whether or not affected by works of man. That part of stream discharge that is not attributable to direct runoff from precipitation or melting snow (4).
Canopy resistance. Resistance to transport of water and vapor away from soil and canopy (2).
Coefficient of determination (r2). Measure of proportion of total variance of dependent variable that is accounted for by independent variables in regression analyses.
Dewatering (mining). Removal of ground water in conjunc tion with mining operations when excavation has pene trated below water table (3).
Evaporation. Process by which water passes from liquid state to vapor state (4).
Evapotranspiration (ET). Loss of water from land area through transpiration by plants and evaporation from soil and surface-water bodies (4).
Geographic information system (GIS). Computer program and associated data bases that organize data in layers which can be integrated, queried, and analyzed (3,4).
Ground water. That part of subsurface water that is in satu rated zone (4).
Ground-water discharge. Release of water from saturated zone (4).
Ground-water recharge. Process of downward movement of water to saturated zone and addition of water to ground-water reservoir (4).
Ground-water storage. Quantity of water in saturated zone (4).
Head. Height above standard datum (4).
Hydraulic conductivity. Volume of water that will move in porous medium in unit time under unit hydraulic gradient through unit area measured at right angles to direction of flow (4).
Hydraulic gradient In aquifer, rate of change of total head per unit of distance of flow at given point and in given direction (4).
Hydrograph. Graph showing multiple characteristics of water (such as flow) with respect to time.
Hydrologic equilibrium. Expression of law of mass conser vation for water budgets. State in which inflow equals outflow, corrected for changes in storage.
Hydrologic processes. Physical operation or series of oper ations that result in movement of water within hydrologic system.
Hydrologic system. Complex of related parts physical, conceptual, or both forming orderly working body of hydrologic units and interacting hydrologic processes (4).
Inflow. Process of flowing in or into; includes all water that enters hydrologic system (4).
Landsat Series of United States satellites that collect multi- spectral images of Earth's surface in visible, reflected, and thermal-infrared bands (4).
Natural conditions. Conditions under which hydrologic processes and variables are not affected by man. For water budgets, such conditions commonly are assumed to represent long-term steady state.
Net radiation. Difference between incoming and reflected radiation (2).
Open-pit mining. Process of removing mineral deposits that are found sufficiently close to surface that tunnels are unnecessary.
Outflow. Process of flowing out; includes all water that leaves hydrologic system (4).
Overland flow. That part of surface runoff flowing over land surfaces toward stream channels (4).
Permeability. Property or capacity of porous rock, sedi ment, or soil for transmitting water (4).
Phreatophyte. Plant that obtains its water supply from satu rated zone (4).
Residual. Difference between measured station value and value predicted by regression equation.
Runoff. That part of precipitation appearing in surface streams (4).
Spring. Place where ground water flows naturally from rock or soil onto land surface or into body of surface water (4).
Steady state. State of balance in hydrologic system where little or no change in hydraulic head occurs through time (4).
GLOSSARY 37

Streamflow. Type of channel flow; applies to that part of surface runoff traveling in stream whether or not it is affected by diversion or regulation (4).
Surface water. All waters on surface of Earth (1).
Transpiration. Process by which plants give off water vapor through their leaves (4).
Water budget Accounting of inflow to, outflow from, and storage in hydrologic unit such as drainage basin, aqui fer, soil zone, lake, or reservoir (4).
Watershed. Region drained by, or contributing water to, stream, lake, or other body of water (4).
Water table. Upper surface of saturated zone (4).
Water year. Period of 12 months from October 1 through September 30; term used by federal agencies in reference to surface-water supply (4).
Water yield. Runoff from drainage basin; includes ground- water outflow that appears in stream plus ground-water outflow that bypasses gaging station and leaves basin underground. May be expressed as precipitation minus evapotranspiration (4,1).
REFERENCES CITED
Bredehoeft, J.D., 1963, Hydrogeology of the lower Hum boldt River Basin, Nevada: Nevada Department of Conservation and Natural Resources, Water Resources Bulletin 21,50 p.
Cardinalli, J.L., Roach, L.M., Rush, F.E., and Vasey, B.J., 1968, State of Nevada hydrographic areas: Nevada Division of Water Resources map, scale 1:500,000.
Cohen, Philip, 1963, A summary of the specific-yield and particle-size relations of Quaternary alluvium, Hum boldt River valley, Nevada: Nevada Department of Conservation and Natural Resources, Water Resources Bulletin 20, 24 p.
Daly, Christopher, Neilson, R.P, and Phillips, D.L., 1994, A statistical-topographic model for mapping climato- logical precipitation over mountainous terrain: Journal of Applied Meteorology, v. 33, no. 2, p. 140-158.
Duell, Lowell, Jr., 1990, Estimates of evapotranspiration in alkaline scrub and meadow communities of Owens Valley, California, using the Bowen ratio, eddy-correla tion, and Penman-Monteith methods: U.S. Geological Survey Water-Supply Paper 2370, 39 p.
Eakin, T.E., 1961, Ground-water appraisal of Pine Valley, Eureka and Elko Counties, Nevada: Nevada Depart ment of Conservation and Natural Resources, Ground- Water Resources Reconnaissance Report 2,41 p.
1962, Ground-water appraisal of Diamond Valley, Eureka and Elko Counties, Nevada: Nevada Depart ment of Conservation and Natural Resources, Ground- Water Resources Reconnaissance Report 6, 60 p.
Eakin, T.E., and Lamke, R.D., 1966, Hydrologic reconnais sance of the Humboldt River Basin, Nevada, with a section on Quality of water, by D.E. Everett: Nevada Department of Conservation and Natural Resources, Water Resources Bulletin 32,107 p.
Eakin, T.E., Maxey, G.B., Robinson, T.W, Fredericks, J.C., and Loeltz, O.J., 1951, Contributions to the hydrology of eastern Nevada: Nevada State Engineer, Water Resources Bulletin 12,171 p.
Eakin, T.E., Moore, D.O., and Everett, D.E., 1965, Water- resources appraisal of the Upper Reese River Valley, Lander and Nye Counties, Nevada: Nevada Depart ment of Conservation and Natural Resources, Water Resources Reconnaissance Report 31,47 p.
Eakin, T.E., Price, Don., and Harrill, J.R., 1976, Summary appraisals of the Nation's ground-water resources Great Basin region: U.S. Geological Survey Profes sional Paper 813-G, 37 p.
Everett, D.E., and Rush, F.E., 1966, A brief appraisal of the water resources of Grass and Carico Lake Valleys, Lander and Eureka Counties, Nevada: Nevada Depart ment of Conservation and Natural Resources, Water Resources Reconnaissance Report 37, 27 p.
Fischer, J.M., 1992, Sediment properties and water move ment through shallow unsaturated alluvium at an arid site for disposal of low-level radioactive waste near Beatty, Nye County, Nevada: U.S. Geological Survey Water-Resources Investigations Report 92-4032,48 p.
Hardman, George, and Mason, H.G., 1949, Irrigated lands in Nevada: University of Nevada, Reno, Agricultural Experiment Station Bulletin 183, 57 p.
Harrill, J.R., 1968, Hydrologic response to irrigation pump ing in Diamond Valley, Eureka and Elko Counties, Nevada, 1950-65: Nevada Department of Conservation and Natural Resources, Water Resources Bulletin 35, 85 p.
Harrill, J.R., and Prudic, D.E., 1998, Aquifer systems in the Great Basin region of Nevada, Utah, and adjacent States Summary report: U.S. Geological Survey Professional Paper 1409-A, 66 p.
Hawley, J.W., and Wilson HI, WE., 1965, Quaternary geol ogy of the Winnemucca area, Nevada: University of Nevada, Desert Research Institute Technical Report H-W 5, 66 p.
Heath, R.C., 1989, Basic ground-water hydrology: U.S. Geological Survey Water-Supply Paper 2220, 84 p.
38 Water Budgets for Selected Hydrographic Areas, Middle Humboldt River Basin, Nevada Methods for Estimation
Horton, G.A., 1998, Water words dictionary, Pt. 1, A com pilation of technical water, water quality, environ mental, and water-related terms (8th ed.): Nevada Division of Water Planning, 385 p. (accessed May 7,1999, on the World Wide Web at URL http:// www.state.nv.us/cnr/ndwp/dict-1/ww-index.htm)
Langbein, W.B., and Iseri, K.T., 1960, Manual of hydrology, Pt. 1, General surface-water techniques General introduction and hydrologic definitions: U.S. Geolog ical Survey Water-Supply Paper 1541-A, 29 p.
Lee, C.H., 1912, Water resources of a part of Owens Valley, California: U.S. Geological Survey Water-Supply Paper 294,135 p.
Malmberg, G.T., 1967, Hydrology of the valley-fill and carbonate-rock reservoirs, Pahrump Valley, Nevada- California: U.S. Geological Survey Water-Supply Paper 1832, 47 p.
Maurer, O.K., and Berger, D.L., 1997, Subsurface flow and water yield from watersheds tributary to Eagle Valley Hydrographic Area, west-central Nevada: U.S. Geolog ical Survey Water-Resources Investigations Report 97-4191, 56 p.
Maxey, G.B., and Eakin, T.E., 1949, Ground water in White River Valley, White Pine, Nye, and Lincoln Counties, Nevada: Nevada State Engineer, Water Resources Bulletin 8, 53 p.
Mifflin, M.D., 1968, Delineation of ground-water flow systems in Nevada: University of Nevada, Desert Research Institute Technical Report H-W 4, 111 p.
Monteith, J.L., 1965, Evaporation and environment, the state and movement of water in living organisms, in G.E. Fogg, ed., Proceedings, Symposium No. 19, Society for Experimental Biology: New York, Academic Press, p. 205-234.
Moore, D.O., 1968, Estimating mean runoff in ungaged semiarid areas: Nevada Department of Conservation and Natural Resources, Water Resources Bulletin 36, lip.
Nichols, W.D., 1994, Groundwater discharge by phreato- phyte shrubs in the Great Basin as related to depth to groundwater: Water Resources Research, v. 30, no. 12,p. 3265-3274.
Nichols, W.D., 2000, Regional ground-water evapotran- spiration and ground-water budgets, Great Basin, Nevada: U.S. Geological Survey Professional Paper 1628, 82 p.
Nichols, W.D., Laczniak, RJ., DeMeo, G.A., and Rapp, T.R., 1997, Estimated ground-water discharge by evapotranspiration, Ash Meadows area, Nye County, Nevada, 1994: U.S. Geological Survey Water- Resources Investigations Report 97-4025, 13 p.
Olmsted, F.H., 1985, Ground-water discharge and recharge in the Soda Lakes and Upsal Hogback geothermal areas, Churchill County, Nevada: U.S. Geological Survey Water-Resources Investigations Report 85^K)33,27 p.
Owenby, J.H., and Ezell, D.S., 1992, Monthly station normals of temperature, precipitation, and heating and cooling degree days, 1961-90, Nevada: National Climatic Data Center, National Oceanic and Atmos pheric Administration, Climatography of the United States no. 81, [20] p.
Peterson, F.F., 1981, Landforms of the Basin and Range Province: University of Nevada, Reno, Agricultural Experiment Station, Technical Bulletin 28,52 p.
Plume, R.W., 1995, Water Resources and potential effects of ground-water development in Maggie, Marys, and Susie Creek Basins, Elko and Eureka Counties, Nevada: U.S. Geological Survey, Water-Resources Investigations Report 94-4222, 87 p.
Plume, R.W., 1996, Hydrogeologic framework of the Great Basin region of Nevada, Utah, and adjacent States: U.S. Geological Survey Professional Paper, 1409-B, 64 p.
Plume, R.W., and Carlton, S.M., 1988, Hydrogeology of the Great Basin region of Nevada, Utah, and adjacent States: U.S. Geological Survey Hydrologic Investiga tions Atlas, HA-694-A, 1 sheet, scale 1:1,000,000.
Plume, R.W, and Ponce, D.A., 1999, Hydrogeologic frame work and ground-water levels, 1982 and 1996, middle Humboldt River Basin, north-central Nevada: U.S. Geological Survey Water-Resources Investigation Report 98^209, 2 sheets.
Prudic, D.E., 1996, Water-vapor movement through unsat- urated alluvium in Amargosa Desert near Beatty, Nevada Current understanding and continuing stud ies, in Stevens, PR., and Nicholson, T.J., eds., Joint U.S. Geological Survey U.S. Nuclear Regulatory Commission workshop on research related to low-level radioactive-waste disposal, May 4-6,1993, National Center, Reston, Virginia, Proceedings: U.S. Geolog ical Survey Water-Resources Investigations Report 95^K)15, p. 157-166.
Qi, J., Chehbouni, A., Huete, A.R., Kerr, Y.H., and Soroo- shian, S., 1994, A modified soil-adjusted vegetation index: Remote Sensing of Environment, v. 48, p. 119-126.
Robinson, T.W, 1970, Evapotranspiration by woody phre- atophytes in the Humboldt River Valley near Winne- mucca, Nevada: U.S. Geological Survey Professional Paper 491-D, 41 p.
Rorabaugh, M.I., 1964, Estimating changes in bank storage and ground-water contribution to streamflow: Interna tional Association of Scientific Hydrology Publication 63, p. 432-441.
REFERENCES CITED 39
Rush, RE., 1968, Index of hydrographic areas in Nevada: Nevada Division of Water Resources, Information Report 6, 38 p.
Scott, B.R., ed., 1971, Average annual runoff, in Water for Nevada hydrologic atlas: Nevada Division of Water Resources, map S-^4,1 sheet, scale approx. 1:2,027,500.
Shevenell, Lisa, 1996, Statewide potential evapotranspira- tion maps for Nevada: Nevada Bureau of Mines and Geology report 48,32 p.
Theis, C.V., 1940, The source of water derived from wells, Civil Engineering, May 1940, v. 10, no. 5, p. 277-280.
Tomlinson, S.A., 1994, Instrumentation methods and preliminary evaluation of evapotranspiration for a grassland in the Arid Lands Ecology Reserve, Benton County, Washington, May-October 1990: U.S. Geo logical Survey Water-Resources Investigations Report 93^081, 32 p.
Tomlinson, S.A., 1997, Evapotranspiration for three sparse- canopy sites in Black Rock Valley, Yakima County, Washington, March 1992 to October 1995: U.S. Geo logical Survey Water-Resources Investigations Report 96-4207, 88 p.
U.S. Geological Survey, 1986, U.S. GeoData land-use and land-cover digital data from 1:250,000- and 1:100,000- scale maps Data users guide 4: U.S. Geological Sur vey National Mapping Program Technical Instructions, 36 p.
1987, U.S. GeoData digital elevation models Data users guide 5: U.S. Geological Survey National Map ping Program Technical Instructions, 38 p.
Watson, P., Sinclair, P., and Waggoner, R., 1976, Quanti tative evaluation of a method for estimating recharge to the desert basins of Nevada: Journal of Hydrology, v. 31, p. 335-357.
White, W.N., 1932, A method of estimating ground-water supplies based on discharge by plants and evapora tion from soil Results of investigations in Escalante Valley, Utah, in Contributions to the hydrology of the United States, 1932: U.S. Geological Survey Water- Supply Paper 659,105 p.
Wilson, WE., and Moore, I.E., eds., 1998, Glossary of hydrology: Alexandria, Va., American Geological Institute, 248 p.
Zones, C.P, 1961, Ground-water potentialities in the Cres cent Valley, Eureka and Lander Counties, Nevada: U.S. Geological Survey Water-Supply Paper 1581, 50 p.
40 Water Budgets for Selected Hydrographic Areas, Middle Humboldt River Basin, Nevada Methods for Estimation