Embed Size (px)
Citation preview

http://jbd.sagepub.com
Development International Journal of Behavioral
DOI: 10.1080/01650250143000481 2002; 26; 529 International Journal of Behavioral Development
Karen J. Pine and Avril Nash Dear Santa: The effects of television advertising on young children
http://jbd.sagepub.com/cgi/content/abstract/26/6/529 The online version of this article can be found at:
Published by:
http://www.sagepublications.com
On behalf of:
International Society for the Study of Behavioral Development
can be found at:International Journal of Behavioral Development Additional services and information for
http://jbd.sagepub.com/cgi/alerts Email Alerts:
http://jbd.sagepub.com/subscriptions Subscriptions:
http://www.sagepub.com/journalsReprints.navReprints:
http://www.sagepub.co.uk/journalsPermissions.navPermissions:
http://jbd.sagepub.com/cgi/content/refs/26/6/529 Citations
at SAGE Publications on November 12, 2009 http://jbd.sagepub.comDownloaded from

http://www.tandf.co.uk/journals/pp/01650254.html DOI: 10.1080/01650250143000481
Dear Santa: The effects of television advertising onyoung children*
Karen J. Pine and Avril NashUniversity of Hertfordshire, Hat�eld, UK
Every day children are exposed to the selling messages of advertisers via the television. There is somedebate in the literature over the age at which young children can distinguish television advertisementsfrom programmes, when they can remember and want what they see and when they are able tounderstand that the advertiser’s motive is to sell a product. Resolution of the debate has beenhampered by methodological dif�culties and paradigms which fail to fully capture and explainchildren’s responses to advertisements. This study uses a novel and ecologically valid method ofexploring how toy advertising affects children by studying their requests to Father Christmas,monitoring toy commercials and collecting television viewing data. Eighty-three children aged from4.8 to 6.5 years, who had written letters to Father Christmas, were interviewed regarding the extentand nature of their television viewing. Letters and similar data were also analysed for 16 nurseryschool children, aged 3.8 to 4.8 years, using questionnaire responses from their parents. Overall,children who watched more commercial television were found to request a greater number of itemsfrom Father Christmas. These children also requested more branded items than children whowatched less. However, the children’s requests did not correlate signi�cantly with the mostfrequently advertised toy products on television in the build-up to Christmas. Almost 90% of the toysadvertised did not feature once in the children’s letters, suggesting that recall for speci�c brandnames is poor in the under-7s. A positive correlation was found between watching television aloneand number of requests. One interpretation of this may be that lone viewing renders children moresusceptible to advertising. A comparison group of children from Sweden, where advertising tochildren is not permitted, asked for signi�cantly fewer items. It is argued that English children whowatch more TV, and especially those who watch alone, may be socialised to become consumers froma very early age.
Introduction
Television is a major part of children’s lives in the Westernworld today. In the UK children spend an average of 2½ hourseach day watching TV and 63% have their own TV set(Livingston & Bovill, 1999). Three of the �ve terrestrialchannels carry advertising and, within certain limits, adver-tisements can be aimed directly at children. What effect isincreasing exposure to television advertising having uponchildren in the UK today? This paper is concerned particularlywith younger children, below the age of 7 years, and aims toexplore how receptive they are to the commercial messages oftoy advertisers
It has been argued that, due to their limited memorycapacity, young children may not recall advertisements andtherefore will be relatively immune to advertisers’ messages(Macklin, 1994). Others claim that having a lack of cognitivemechanisms to defend themselves actually renders childrenmore susceptible to persuasive messages. Furthermore, there isa question mark over whether very young children candistinguish advertisements from programmes. Levin, Petros,and Petrella (1982) found that children as young as 3 yearswere able to make the distinction but had no understanding of
the selling motives of advertisers. Levin et al. say that it is notuntil 8 years of age that children begin to understand the sellingpurpose of an advertisement. Prior to this children regardadvertisements as simply announcements designed to help,entertain, or inform viewers. In making the decision not toallow advertising aimed at children, the Swedish governmentrelied on evidence from sociologist Erling Bjurstrom that it isnot until 12 years of age that all children can distinguishadvertisements and understand the selling motives of theadvertiser.
Being able to recognise that advertisements differ fromprogrammes appears to emerge early on in development ,whereas the kind of healthy scepticism needed to resistcommercial pressure requires far more sophisticated levels ofunderstanding. The cognitive skills that children lack, i.e.,understanding of persuasive intent, consumer literacy, andperception of realism, are discussed further here.
Understanding of persuasive intent
Young children do not realise that a message can portray onlypositive information, whilst withholding negative information,in order to manipulate another’s mental state (Aloise-Young,
International Journal of Behavioral Development # 2002 The International Society for the2002, 26 (6), 529–539 Study of Behavioural Development
Correspondence should be addressed to Karen J. Pine, PsychologyDepartment, University of Hertfordshire, College Lane, Hat�eld,Herts. AL10 9AB, UK; e-mail: [email protected].
The authors would like to thank the staff and pupils at Green LanesPrimary, New Briars Primary, and Underhill Infants’ School Hat�eld,
UK and the Head Start Nursery School, Leighton Buzzard, UK fortheir kind assistance and cooperation during the carrying out of thisresearch. Thanks also are due to Lillian Hedman, the staff and childrenat the preschool, ‘‘Capella’’, in Nacka, Sweden and to Geoff Jensenand Jose�ne Magnusson for translation assistance. at SAGE Publications on November 12, 2009 http://jbd.sagepub.comDownloaded from

530 PINE AND NASH / THE EFFECTS OF TELEVISION ADVERTISING
1993; Bennett & Yeeles, 1990). For example, in the Aloise-Young study, children were asked to present a description ofthemselves in order to get picked for a �ctitious team. Youngerchildren included negative as well as positive information,whereas older children were better at self-promotion andincluded only positive descriptions. Eight-year-olds’ ability toselectively self-promote suggests that this is the age whenchildren are also able to appreciate that advertisers try toin�uence us with persuasive messages. A lack of this awarenessin younger children, resulting in higher trust in the advertiser,renders them more vulnerable to selling messages. Allied tothis is the authoritative status of television messages for youngchildren, who believe that adults do not lie, and the youngerthe child is, the more likely they are to believe thatadvertisements always tell the truth (Greenberg, Fazal, &Wober, 1986). In a review of the literature, Dorr (1986) foundthat it is between 7 and 9 years of age that children understandthe persuasive intent of television advertising.
Consumer literacy
Young children have a limited understanding of commercialmarkets, and are unaware that advertisements are motivatedout of a desire for pro�ts. Somewhat surprisingly, Greenberg etal. (1986) claimed to have found that 80% of 4- to 13-year-oldchildren knew that advertisements ‘‘wanted to sell you some-thing’’, with no variation by age. In a study by Gaines andEsserman (1981), however, only 1% of 4- to 5-year-oldsrealised that the goal of an advertisement was ‘‘to try and makeyou buy things’’, rising to 28% in 6- to 8-year-olds. Clearly, thetype of question asked in these studies elicited different resultsbut when Ward, Wackman, and Wartella (1977) asked 11- to12-year-olds to explain the selling and pro�t motives ofadvertisers only 25% were able to do so, suggesting that realconsumer literacy emerges in early adolescence. Youngerchildren, who do not know that selling implies an exchangeof money for goods (and an opportunity for pro�t), are unlikelyto recognise advertisers’ motives (Henricksen, 1996). There-fore, it is probably around age 13 or 14 that young peopleunderstand consumer markets and acquire a healthy scepti-cism towards the truthfulness of product claims (Linn, DeBenedictis, & Delucchi, 1982; Robertson & Rossiter, 1976).
Perception of realism
In television commercials techniques are frequently employedto enhance the appearance of a product. Adults know that thesparkle on the newly cleaned �oor in the TV commercial isunlikely to be matched in reality. But before the age of 4 or 5years children are more heavily affected by product factors anddo not understand that appearances can differ from reality.Two- and three-year-olds, in fact, believe that images on TVscreens re�ect real objects inside the set (Flavell, Flavell, Gree,& Korfmacher, 1990; Huston & Wright, 1998). In Flavell’sstudy he found that these young children believed a bowl ofpopcorn would spill if the set was turned upside down. Andwhen Jaglom and Gardner (1981) showed 2- and 3-year-oldsan egg breaking on television, the children tried to clear it up.This reality perception is important because television that isperceived as real has a greater impact on children than if it isjudged unreal (Berry & Keiko Asamen, 1993). Without anawareness of production techniques and the representationalnature of television, young children will believe that a product
is exactly as it appears and will fail to realise that theadvertisement was created to promote it in the best possibleway. After the age of 4 years children develop the cognitiveskills, including a theory of mind, which helps them todistinguish reality from fantasy.
Thus a number of strategies and cognitive abilities need tobe in place before the child is fully aware of the selling motivesof the advertiser. Evidence from psychological studies suggeststhat these abilities emerge at different points in developmentand that full understanding of advertisers’ motives is likely tobe a process that takes a number of years. Parents have a role toplay in this. By watching television with their children they canhelp them to understand advertisers’ motives and thedifference between appearances and reality, thus neutralisingsome of the powerful messages their children are exposed to.There is little reliable data available on co-viewing although ithas been found that children who watch more commercialtelevision had parents who were less concerned about thenegative effects of watching television and perceived less needto control their child’s viewing (Gunter & McAleer, 1997).
Nonetheless, children’s lack of awareness about the motivesof television advertisers does not prevent the commercialmessages in�uencing their preferences and, as suggested, mayrender the child more susceptible. For the advertiser, asuccessful advertisement is one that is memorable since thereis usually a delay between seeing an advertisement andremembering to buy, or request, the product. Children’smemory for advertisements is a very complex issue and onethat has been investigated using a variety of methodologies .These include diary methods (Greenberg et al., 1986), surveysthat rely on free recall and ask about requests to parents(Robertson & Rossiter, 1976), and experimental studies thattest children’s recognition of advertised products (C.E. Hite &Hite, 1994; Macklin, 1994; Sharp, Dyer, & Divita, 1976).Discrepancies in the results of studies into the age at whichchildren can remember television advertisements may be dueto the limitations of each of these methodologies. Surveyssuffer from lack of veri�cation of the information gained andthe fact that children are often over-concerned with giving the‘‘right’’ answers. Younger children are also likely to be unableto recall brand names which, nonetheless, may still have left amemory trace. Studies that test recognition of products getaround this problem, usually by employing a forced-choicetest, but these have usually been conducted in laboratorysettings and suffer from a lack of ecological validity. Both typesof studies fail to successfully emulate the time lapse that canoccur between exposure to an advertisement and its recall, orto recreate the type of context in which children typicallyexpress a product preference.
The current study looks at the impact toy advertising, in therun-up to Christmas, has upon children below the age of7 years. As the literature has shown, this is the age group that islikely to have higher trust, lower recall, and lower under-standing of commercial messages than older children. Thiswould lead us to expect these children to have a highvulnerability to advertising, although perhaps with a low recallof brand names. The study also employs a novel method,which overcomes many of the methodological limitations ofearlier research by looking at a behaviour that many childrenengage in spontaneously: asking for toys in a letter to FatherChristmas. Thus it overcomes the lack of ecological validityfrom which laboratory experiments suffer, since many children
at SAGE Publications on November 12, 2009 http://jbd.sagepub.comDownloaded from

in the UK write a letter to Santa each year. Furthermore, it isless subject to the failings of survey methods, where misunder-standings about questions can produce inaccurate data. Bycollecting children’s letters at the beginning of December,when toy advertising has been intensifying for a number ofweeks, the study also makes use of the real time frame betweenexposure to the advertisements and the making of requests. Italso goes beyond measuring which advertised productschildren recognise or recall and tells us what they actuallywant. Finally, it is not complicated by the �nancial status of thechildren’s parents. Children from poorer families may havebeen socialised not to ask their parents for expensive toys, yetmay feel these constraints do not apply to their requests toSanta.
By looking at the under-7s’ requests in their letters to Santa,and also obtaining a measure of their television viewing habits,this study therefore aims to discover whether there is arelationship between young children’s exposure to commercialtelevision and requests for advertised products. The data onviewing habits also reveal whether children watch alone or witha parent and whether this is related to the requests made by thechildren. By comparing letters written by children in the UKwith those written by Swedish children it also asks whetherchildren raised in a country where there is a ban on toyadvertising ask for less.
Method
Design
A correlational design was used to examine the relationshipbetween the amount of television watched, and in particularcommercial television, and the proportion of branded productsrequested by children in their letters to Father Christmas. Thetwo principal variables were a television score (calculated fromresponses to a questionnaire) and the proportion of brandedproducts. Branded or brand name products referred to in thisreport are those which are marketed under a proprietary trademark or registered name, e.g., Barbie, as opposed to a genericterm, e.g., doll. The overall relationship was examined, as wererelationships using classifying variables of age, access to cableor satellite television, and whether or not the child watchedtelevision with an adult.
Another correlational analysis considered the relationshipbetween children’s requests and products advertised onchildren’s television (ITV) during the 6-week period prior tothe children writing their letters.
A between-groups design was used to compare theproportion of branded items requested by the UK childrenwith that of kindergarten children in Sweden, where toyadvertising aimed at children is banned.
It was predicted that (1) there would be a signi�cantrelationship between the television score and the proportion ofbranded products requested by the UK children in their lettersto Father Christmas, i.e., that a higher television score wouldindicate a higher proportion of branded products requested. Itwas also predicted that the relationship between the twovariables would be in�uenced by (2) the children’s age, (3)regular access to satellite or cable television, and (4) watchingwith an adult. It was further predicted that (5) there would be arelationship between the frequency of television advertisements
and the branded products requested and (6) there would besigni�cant differences between the amount of brandedproducts requested by the UK children and the Swedishchildren.
Participants
A total of 118 children took part in the study. The UK samplewere recruited from a nursery school in Bedfordshire, theReception and Year 1 classes of two primary schools inHertfordshire, and an infants’ school in the London Boroughof Barnet. The overall mean age of the children was 5;5 years(SD ˆ 8.59 months) and the sample comprised 45 boys and54 girls. The UK sample was composed as follows:
Nursery children: n ˆ 16. Ages 3;8 to 4;8 years.Mean age 4;2 years (SD ˆ 3.7 mths)
School children n ˆ 83. Ages 4;8 to 6;5 years.Mean age 5;8 years (SD ˆ 5.6 mths)
For the purposes of this study they were then subdividedfurther into age groups as follows:
Group 1: 3;8 to 4;8 years (n ˆ 16; mean age 4;2 years,SD ˆ 3.72 mths)
Group 2: 4;8 to 5;6 years (n ˆ 41; mean age 5;3 years,SD ˆ 2.84 mths)
Group 3: 5;7 to 6;5 years (n ˆ 42; mean age 6;2 years,SD ˆ 2.98 mths).
Group 1 represents the nursery school group. As thetelevision scores for these children were derived from parentalreport this group is considered separately for some of theanalyses. The other two groups are representative of Receptionand Year 1 classes. The overlap in age groups between Groups1 and 2 occurs because there was one child aged 56 months atschool.
Head teachers and parents consented to the childrenparticipating in the study. The �nal �gure of 118 takes intoaccount 9 parental withdrawals for religious (7), educational(1), or other (1) reasons, and 2 instances where childrendeclined to take part.
The sample size was chosen as a result of a priori powercalculations using G Power (Faul & Erdfelder, 1992). Based onthe ITC report, which suggests a strong effect of advertising,an effect size of r ˆ .5 was used. With alpha ˆ .05 and power ˆ.95, a sample of 34 participants is recommended for a one-tailed correlation.
The Swedish sample, Group 4, comprised 19 kindergartenchildren (9 girls and 10 boys). They were all 6 years old.Letters were obtained after contacting a preschool in Nacka,Sweden but no interviews were conducted.
Materials
The letters to Father Christmas were written on paperprovided by each individual school and this varied from schoolto school: in some it was printed with a seasonal decoration, inothers it was decorated by the children themselves, and oneschool provided areas on the paper for the children to bothwrite and draw their requests. The Swedish children all drewtheir requests, which were then labelled. Either the originalletter or a photocopy was used for analysis.
INTERNATIONAL JOURNAL OF BEHAVIORAL DEVELOPMENT, 2002, 26 (6), 529–539 531
at SAGE Publications on November 12, 2009 http://jbd.sagepub.comDownloaded from

532 PINE AND NASH / THE EFFECTS OF TELEVISION ADVERTISING
The questionnaire used for the structured interview withGroups 1, 2, and 3 was constructed to provide informationabout the children’s viewing habits in order to establish a TVscore for each child and to gather information.
CONSTRUCTION OF THE QUESTIONNAIRE
1. Do you watch children’s television?This acted as an introductory question to the rest of theinterview.
2. How often do you watch?Do you watch children’s television when you go home after school? Isthat:
Every day / A lot of days / Just some days?What about before you come to school in the morning (when you getup)? Is that:
Every day / A lot of days / Or just sometimes?Do you watch on a Saturday morning? Yes / Sometimes / NoOn a Sunday morning? Yes / Sometimes / No
Question 2 was designed to re�ect how much children’stelevision the child watched after school, before school, and atweekends . Television programmes in the UK aimed at childrenon ITV (CITV) cover a period of 1.75 hours each weekday(15.15–17.00 hours), 3.5 hours on a Saturday (08.00–11.30)and 1.5 hours on a Sunday (08.00–09.30). Responses to thevarious sections of questions were scored to re�ect these hoursproportionately.
3. Do you have a favourite programme, something you likewatching best?
This was designed as an interest question to stimulate thechildren’s thoughts about television programmes that theywatch.
4. Do you ever watch: The Forgotten Toys / Sooty / Kipper / ArtAttack / Sabrina / Diggit / SM:TV Live?
In order to examine how much commercial television thechildren watched, ITV (or CITV as the children’s program-ming is termed), was chosen as being the channel mostaccessible to all UK children. The programmes given asexamples in this question were from this channel and wereselected as being representative examples of children’s televi-sion viewing in the afternoon, after school, or at the weekend.The programmes selected were considered suitable for a rangeof age groups (e.g., The Mopatops Shop for younger childrenand Sabrina, the Teenage Witch for older children).
5. Do you know what adverts are? Can you tell me about them?6. Do you watch the adverts? OR Do you ever see Barbie (or
Action Man) on the telly, do you watch them when they’re on?
Questions 5 and 6 looked at whether the child knew what anadvertisement was and whether she or he paid attention tothem. Following a pilot study, Question 6 was modi�ed (from‘‘Do you watch them?’’) in order to allow for a negative responseto Question 5. Thus, if a child responded ‘‘no’’ to question 5,then question 6 would be phrased, ‘‘Do you ever see Barbie orAction Man on the telly, do you watch them when they’re on?’’, asthese products are only seen in advertisements.
7. Do you watch TV on your own or with a grown up, someonelike mum or dad?
This question established whether the child watched alone orwith a parent, as previous research has suggested this affectshow children process television’s messages.
8. Think about the televisions there are in your house, can youtell me how many there are?
Question 8 was designed to discover whether the children hadaccess to more than one television, thus increasing their overallaccess to commercial television.
9. Do you ever watch any of the satellite or cable TV channels(e.g., Nickelodeon, Disney Channel, Cartoon Network)? Is that athome?
Question 9 sought to discover whether the child had regularincreased access to commercial television in the form ofsatellite or cable broadcasting.
10. Do you do any after-school activities regularly (every week)?For example, swimming, dance, clubs, gym, football, etc.? Howoften / many days in the week?
Finally, question 10 sought to establish whether regularextracurricular activities curtailed viewing and the score forthis item was designed to be subtracted from the sum of scoresfrom questions 2 and 4 to give a �nal ‘‘TV score’’.
The children’s interview questionnaire was also distributed, ina modi�ed form, to the parents of the nursery children. Besidesamending the wording of the questions in order to ask theparent about the child, since the children were considered tooyoung to self-report, question 5 was modi�ed to ascertainwhether the parent thought that the child made somedistinction between advertisements and programmes. Afurtherquestion was added to establish how often the child attendednursery (i.e., number of morning or afternoon sessions) as thiswould affect the amount of exposure to children’s television,since television was not watched at nursery. As with theextracurricular activities, the number of afternoon nurserysessions was designed to be deducted from the sum ofquestions 2 and 4. As the questionnaire was designed to elicitinformation rather than attitude, no response order bias wasdeemed necessary.
Photocopies of the letters written by Swedish children werealso used for analysis. Translations were carried out by aSwedish person studying in England and an English personresiding in Sweden.
The interviews with the children were recorded using anOlympus S711 Micro cassette recorder. Television pro-grammes and advertisements were recorded using a PanasonicNV HD640 video recorder.
Procedure
Video recordings were made of a selection of children’s TVviewing between 23.10.99 and 28.11.99. This comprised sixSaturdays from 8.00 am to 11.30 am, �ve Sundays from8.00 am to 9.30 am, and two weekdays per week, chosenat random, from 3.15 to 5.00 pm (Tuesday n ˆ 3; Wednesday at SAGE Publications on November 12, 2009 http://jbd.sagepub.comDownloaded from

n ˆ 2; Thursday n ˆ 3; Friday n ˆ 3), giving a total of nearly50 hours of children’s commercial television.
In order to keep the study as naturalistic as possible, andthereby maintain external validity, the teachers at the schoolsand nursery were asked to proceed as they would normally doin asking the children to write their letters to Father Christmas.It was agreed that this would occur at some point convenient tothe teachers in the week beginning 29th November. Noexperimenter was present. Children were assisted by theteachers, where necessary, with spelling and writing. In thecase of the nursery the children were asked to dictate theirletter to a nursery teacher or nursery nurse who wrote it out inhighlighter so that the child could write over it. The originalletters or photocopies of these were used for the study. SeeFigure 1 for an example of children’s letters.
All interviews were conducted during the �rst 3 weeks ofDecember after the children had written their letters to FatherChristmas. The interviews were preceded by a brief explana-tion and time to settle the child, then each interview followedthe questionnaire closely. At the end of the interview each childwas thanked for his or her assistance.
The children in Sweden were asked by their teachers to senda letter to Father Christmas with their Christmas requests.Photocopies of these were used for the study.
Results
The results of the study are divided into four parts. The �rstsection considers an analysis of the questionnaire data and thesecond examines the relationship between television viewingand the proportion of branded products requested by childrenin their letters to Father Christmas. The third section thenlooks at the relationship between those branded itemsrequested and those advertised on television and, �nally, thefourth section compares requests made by UK school childrenwith those made by a contrast group of Swedish nurserychildren.
Analysis of questionnaire data
In this section it is important to note that the source of thequestionnaire data for one of the three groups, i.e. the nurserygroup, is parental report, whereas the source for the other twogroups is self-report. Therefore the analysis of this data will becarried out in two parts, commencing with the self-reportedschool children’s data. The information will then be combinedto give overall means and any differences that arise as a resultof these alternative sources will be examined. In general, evenwhere the distribution has not been normal, parametricinferential tests have been carried out on the data. However,due to the very varied, non-normal distribution of the parentalreport, or nursery children’s, data nonparametric tests havebeen used for inferential statistics in that instance.
Television scores were calculated by summing the scores forresponses to questions number 2 (three parts) and 4: Thisindicated how much television and, in particular, how muchcommercial television, the children watched. From this �gurewas deducted the number of days of after-school activities and,in the case of the nursery children, the number of afternoonsessions attended, since these would prevent the child fromwatching afternoon children’s television. The result was anindividual television score for each child. Construct validitywas evaluated by correlating the response scores with the totalTV score. Positive, reliable Pearson correlations were found forquestions 2 and 4, a total of four response scores (Q1a: r ˆ.615; Q1b: r ˆ .333; Q1c: r ˆ .760; Q2: r ˆ .640; in all cases, nˆ 99, p 5 .05). Question number 8, concerning the number oftelevisions per household, was discarded after internal con-sistency checks failed to produce a reliable correlation (p 4.05).
SCHOOL CHILDREN (SELF-REPORT DATA)
Amount of TV viewing. TV scores for this sample produceda negatively skewed distribution with no outliers. The meanTV score (n ˆ 83) was 9.68 (SD ˆ 3.709); scores ranged froma minimum of 0 to a maximum of 15. The mean televisionscores were analysed by gender and by age. A two-tailedbetween-groups ANOVA found no reliable main effects on TVscore for either age or gender (p 4 .05). However, there was atwo-way interaction between age and gender. As Figure 2shows, younger girls (55–66 months) had signi�cantly higherTV scores than boys of the same age but the situation wasreversed for the older children (67–77 months). This interac-tion was con�rmed as reliably different in a two-way ANOVA,F(1, 81) ˆ 4.082, p ˆ .047.
INTERNATIONAL JOURNAL OF BEHAVIORAL DEVELOPMENT, 2002, 26 (6), 529–539 533
Figure 1. An example of a letter written by the children to FatherChristmas. at SAGE Publications on November 12, 2009 http://jbd.sagepub.comDownloaded from

534 PINE AND NASH / THE EFFECTS OF TELEVISION ADVERTISING
Knowledge about advertisements. The question ‘‘Do you knowwhat an advert, or advertisement, is?’’ produced 56 negativeresponses and 27 positive responses from the sample of 83school children. However, of those who said that they didknow what an advertisement was only 16 were able to de�ne itin such a way that it was clear that they knew the differencebetween an advertisement and a programme. The other 11were unable to explain that an advertisement was different oroffer an example of one. Equally, of the 56 who said that theydid not know what an advertisement was, further probing inrelation to question 6 found that 11 of these children were ableto offer an explanation which showed that they were able tomake the distinction. Some of the children also mentioned theselling aspect of the advertisement. Missing data (10 missingvalues in total) in response to question 6 arose as a result of theoriginal wording of the question, which was corrected afterpiloting. Of the 73 children who did respond, 55 (66.3% ofthe total sample) appeared to watch advertisements and18 (21.7%) responded that they either did not watchadvertisements, or more speci�cally, Barbie or Action Manadvertisements.
Lone viewing and access to satellite/cable television. Of thesample (n ˆ 83), children (21.7%) regularly watched televisionwith an adult (parent), 31 (37.3%) sometimes watched with anadult, and 34 (41%) watched either on their own or with asibling. Fifty-two children (62.7%) had home access to satelliteor cable television channels.
NURSERY SCHOOL DATA (PARENTAL REPORT)
Amount of TV viewing. TV scores for the nursery childrenappeared to be not normally distributed and this wascon�rmed in a Shapiro Wilks Test for normality (W ˆ .849,p ˆ .013). The mean TV score for this sample (n ˆ 16) was5.375 (SD ˆ 3.6674) and the mode was 8. TV scores rangedfrom a minimum of 3 to a maximum of 9. The mean televisionscores were analysed by gender using a two-tailed MannWhitney U test and no reliable main effects of gender werefound for TV score (p 4 .05).
A comparison of the difference in mean TV viewing scores
of the school children and nursery school children, shown inFigure 3, was found to be signi�cant in a Mann Whitney U test(U ˆ 257, p .01). This suggests that the nursery schoolchildren watched signi�cantly less TV than the school children.However, it may be due to the sources of the data, withparental report data resulting in a far lower mean TV scorethan the self-report data.
Knowledge about advertisements. In response to the questionsabout understanding and watching advertisements, nineparents considered that their child did understand thatadvertisements were different to programmes whereas sixparents were uncertain of their child’s knowledge. Only oneparent felt that their child could not make the distinctionbetween programmes and advertisements.
Lone viewing and access to satellite/cable television. According tothe parental reports, 7 (44%) of the nursery school childrenregularly watched television with an adult and 9 (56%)sometimes watched with an adult. According to their parents,none of the children in the nursery group watched televisionregularly without an adult. Of the sample (n ˆ 16), 9 (56.3%)had regular/home access to satellite or cable televisionchannels.
This suggests that the nursery school children were lesslikely to watch alone than the school children, although thesource of the data (parent vs. self) report may account for someof this difference. The difference is con�rmed as signi�cant in aPearson chi-square, w
2 (n ˆ 99) ˆ 10.33, p ˆ 5 .01. Theimplications on reliability will be explored in the discussionsection.
DATA FROM NURSERY AND SCHOOL CHILDREN (COMBINED)
TV viewing data. When data from both sources wascombined (n ˆ 99) this produced a negatively skeweddistribution with two outliers (values: ¡1, ¡3). As the primarypurpose of the study was to examine relationships rather than
Figure 2. Mean scores on the TV Viewing questionnaire, for maleand female school children across ages.
Figure 3. Mean TV scores for nursery children (parental report data)and schoolchildren (self-report data).
at SAGE Publications on November 12, 2009 http://jbd.sagepub.comDownloaded from
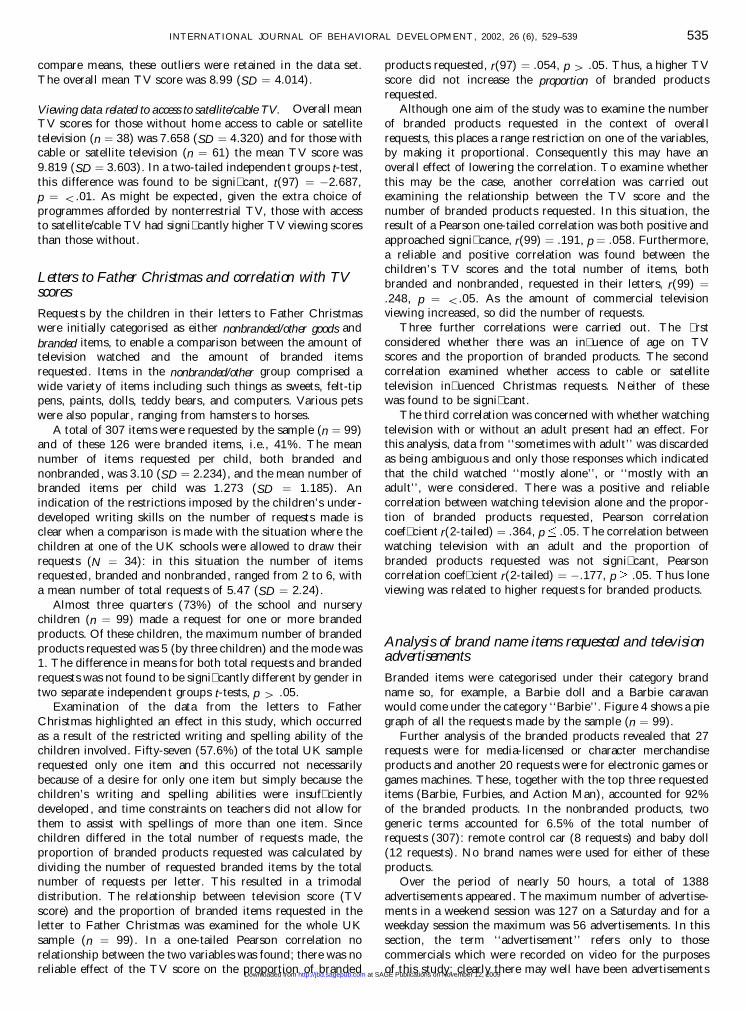
compare means, these outliers were retained in the data set.The overall mean TV score was 8.99 (SD ˆ 4.014).
Viewing data related to access to satellite/cable TV. Overall meanTV scores for those without home access to cable or satellitetelevision (n ˆ 38) was 7.658 (SD ˆ 4.320) and for those withcable or satellite television (n ˆ 61) the mean TV score was9.819 (SD ˆ 3.603). In a two-tailed independen t groups t-test,this difference was found to be signi�cant, t(97) ˆ ¡2.687,p ˆ 5.01. As might be expected, given the extra choice ofprogrammes afforded by nonterrestrial TV, those with accessto satellite/cable TV had signi�cantly higher TV viewing scoresthan those without.
Letters to Father Christmas and correlation with TVscores
Requests by the children in their letters to Father Christmaswere initially categorised as either nonbranded/other goods andbranded items, to enable a comparison between the amount oftelevision watched and the amount of branded itemsrequested. Items in the nonbranded/other group comprised awide variety of items including such things as sweets, felt-tippens, paints, dolls, teddy bears, and computers. Various petswere also popular, ranging from hamsters to horses.
A total of 307 items were requested by the sample (n ˆ 99)and of these 126 were branded items, i.e., 41%. The meannumber of items requested per child, both branded andnonbranded , was 3.10 (SD ˆ 2.234), and the mean number ofbranded items per child was 1.273 (SD ˆ 1.185). Anindication of the restrictions imposed by the children’s under-developed writing skills on the number of requests made isclear when a comparison is made with the situation where thechildren at one of the UK schools were allowed to draw theirrequests (N ˆ 34): in this situation the number of itemsrequested, branded and nonbranded, ranged from 2 to 6, witha mean number of total requests of 5.47 (SD ˆ 2.24).
Almost three quarters (73%) of the school and nurserychildren (n ˆ 99) made a request for one or more brandedproducts. Of these children, the maximum number of brandedproducts requested was 5 (by three children) and the mode was1. The difference in means for both total requests and brandedrequests was not found to be signi�cantly different by gender intwo separate independen t groups t-tests, p 4 .05.
Examination of the data from the letters to FatherChristmas highlighted an effect in this study, which occurredas a result of the restricted writing and spelling ability of thechildren involved. Fifty-seven (57.6%) of the total UK samplerequested only one item and this occurred not necessarilybecause of a desire for only one item but simply because thechildren’s writing and spelling abilities were insuf�cientlydeveloped , and time constraints on teachers did not allow forthem to assist with spellings of more than one item. Sincechildren differed in the total number of requests made, theproportion of branded products requested was calculated bydividing the number of requested branded items by the totalnumber of requests per letter. This resulted in a trimodaldistribution. The relationship between television score (TVscore) and the proportion of branded items requested in theletter to Father Christmas was examined for the whole UKsample (n ˆ 99). In a one-tailed Pearson correlation norelationship between the two variables was found; there was noreliable effect of the TV score on the proportion of branded
products requested, r(97) ˆ .054, p 4 .05. Thus, a higher TVscore did not increase the proportion of branded productsrequested.
Although one aim of the study was to examine the numberof branded products requested in the context of overallrequests, this places a range restriction on one of the variables,by making it proportional. Consequently this may have anoverall effect of lowering the correlation. To examine whetherthis may be the case, another correlation was carried outexamining the relationship between the TV score and thenumber of branded products requested. In this situation, theresult of a Pearson one-tailed correlation was both positive andapproached signi�cance, r(99) ˆ .191, p ˆ .058. Furthermore,a reliable and positive correlation was found between thechildren’s TV scores and the total number of items, bothbranded and nonbranded, requested in their letters, r(99) ˆ.248, p ˆ 5.05. As the amount of commercial televisionviewing increased, so did the number of requests.
Three further correlations were carried out. The �rstconsidered whether there was an in�uence of age on TVscores and the proportion of branded products. The secondcorrelation examined whether access to cable or satellitetelevision in�uenced Christmas requests. Neither of thesewas found to be signi�cant.
The third correlation was concerned with whether watchingtelevision with or without an adult present had an effect. Forthis analysis, data from ‘‘sometimes with adult’’ was discardedas being ambiguous and only those responses which indicatedthat the child watched ‘‘mostly alone’’, or ‘‘mostly with anadult’’, were considered. There was a positive and reliablecorrelation between watching television alone and the propor-tion of branded products requested, Pearson correlationcoef�cient r(2-tailed) ˆ .364, p .05. The correlation betweenwatching television with an adult and the proportion ofbranded products requested was not signi�cant, Pearsoncorrelation coef�cient r(2-tailed) ˆ ¡.177, p .05. Thus loneviewing was related to higher requests for branded products.
Analysis of brand name items requested and televisionadvertisements
Branded items were categorised under their category brandname so, for example, a Barbie doll and a Barbie caravanwould come under the category ‘‘Barbie’’. Figure 4 shows a piegraph of all the requests made by the sample (n ˆ 99).
Further analysis of the branded products revealed that 27requests were for media-licensed or character merchandiseproducts and another 20 requests were for electronic games orgames machines. These, together with the top three requesteditems (Barbie, Furbies, and Action Man), accounted for 92%of the branded products. In the nonbranded products, twogeneric terms accounted for 6.5% of the total number ofrequests (307): remote control car (8 requests) and baby doll(12 requests). No brand names were used for either of theseproducts.
Over the period of nearly 50 hours, a total of 1388advertisements appeared. The maximum number of advertise-ments in a weekend session was 127 on a Saturday and for aweekday session the maximum was 56 advertisements. In thissection, the term ‘‘advertisement’’ refers only to thosecommercials which were recorded on video for the purposesof this study; clearly there may well have been advertisements
INTERNATIONAL JOURNAL OF BEHAVIORAL DEVELOPMENT, 2002, 26 (6), 529–539 535
at SAGE Publications on November 12, 2009 http://jbd.sagepub.comDownloaded from

536 PINE AND NASH / THE EFFECTS OF TELEVISION ADVERTISING
for other products at other times but the advertisementsrecorded were designed to act as a representative sample.
The 1388 advertisements comprised 175 (12.6%) for foodor drink products, 88 (6.3%) for ‘‘other’’ products such aswashing powder, tissues, nappies, etc., and 24 (1.7%) for fastfood restaurants (McDonald’s 23; Burger King 1). Theadvertisements for McDonald’s and Burger King restaurantsboth promoted free gifts which were designed to appeal tochildren (i.e., models of Tarzan, Barbie, or Hot Wheels cars);nevertheless, for the purposes of this study they have not beenincluded as ‘‘toy’’ advertisements. The remaining 1101advertisements (79.3%) were for toys; these included compu-ters or games consoles and associated games and children’svideos.
In all 201 different toys were advertised. After collapsingwithin groups, i.e., amalgamating all the different productsrelated to one brand name, for example Action Man or Lego,this �gure reduced to 175. The 10 most frequently televisedadvertisements are listed in Table 1 together with the numberof requests made by children for those products.
In a one-way Pearson test this correlation was found to beboth positive and signi�cant, r(n ˆ 175) ˆ .433, p 5 .01. Thissuggests a positive relationship between the frequency of aproduct advertisement and the number of requests for thatproduct. However, this may be a spurious relationship as twooutliers, Barbie and Action Man products, appear to beresponsible for the strength of this relationship. If these twoproducts are excluded from the calculation, then the one-wayPearson correlation changes completely, �nding no relation-ship between the two variables r(n ˆ 173) ˆ .065, p 4 .05. Infact, of the 175 advertisements, a total of 152 (86.8%)products appeared for which no request was made.
With regard to those toys requested, Figure 5 shows thenumber of requests per item and also the number of televisedrecorded advertisements, if any, in the period 23.10.99 to28.11.99. Of the 27 media-related or character merchandiseproducts that were requested by the children, 9 were notadvertised.
CHILDREN’S NONBRANDED REQUESTS
In relation to the use of generic terms, i.e., remote controlcar and baby doll, analysis of the television advertisementsfound 21 advertisements for 7 individually named remotecontrol cars (e.g., Hex Wheeler, Super Rebound), and 168advertisements for 19 named baby dolls (e.g., Baby Expres-sions, My Sweet Love), thus suggesting that these advertise-ments may have created a desire for the products but no recallfor the brand-name.
Comparison with a contrast Swedish group of children
The letters from the Swedish children (n ˆ 19) were analysedas before. The letters from a matched group from the Englishsample, who had also been allowed to draw their requests andwhose age range matched those of the Swedish children (5–6years old), were used for comparison purposes.
As Table 2 shows, the UK children requested moreproducts generally than the Swedish children and this was
Figure 4. Pie chart showing requests made by UK children in theirletters to Father Christmas. * These account for a cumulative total ofitems for which only 1 or 2 requests were made. Numbers in bracketsindicate total number of requests.
Table 1The 10 most frequently televised advertisements and number ofrequests made by UK children.
ProductNo. ofadverts
No. ofrequests
Star Wars 43 4
Barbie 39 34
Action Man 38 17
Bugs Life 34 0
Hot Wheels 25 1
Tanya 24 0
My Sweet Love 23 0
Baby Expressions 23 0
Lego 19 0
Beast Wars Transformers 19 0
at SAGE Publications on November 12, 2009 http://jbd.sagepub.comDownloaded from

con�rmed as reliably different in a two-tailed independentgroups t-test, t(51) ˆ 2.301, p .05. Atwo-tailed independentgroups t-test of the difference in the mean number of brandedrequests between the UK children and the Swedish childrenapproached but did not reach signi�cance, t(51) ˆ 1.815, p ˆ.075.
Discussion
This study set out to examine whether the amount of televisionwatched in�uences children’s requests for toys. More speci�-cally, it searched for a positive relationship between theamount of commercial children’s television watched and theproportion of brand-named toys requested in children’s lettersto Father Christmas. It looked further at whether thisrelationship was affected by other covariants such as age,increased availability of commercial television in the form ofsatellite or cable television, and whether the presence of anadult when watching television mediated the effect.
The results of the study suggest that the proportion ofbranded products requested by children in their letters toFather Christmas is not in�uenced (1) by the amount ofcommercial television viewing; (2) by age, in this case across arange of 3 to 6 years; and (3) by increased access tocommercial television in the form of cable and satellitetelevision. However, by removing the range restriction imposedby proportional analysis, it appeared that children whowatched more television, and commercial television in parti-cular, were more likely to request not only more brandedgoods, but also more items generally. As these data are
correlational this does not constitute evidence for causality.However, one interpretation of this �nding may be thatincreased commercial television viewing encourages a moreconsumer-orientated and materialistic nature, a �nding thatconcurs with those of Ward et al. (1977), Robertson andRossiter (1974), and Robertson, Ward, Gatignon, and Klees(1989). Moreover, the fact that both the overall number ofrequests for toys and the number of requests for branded itemsincrease means that the proportion of branded productsrequested is likely to remain the same.
There was, as expected, an increased in�uence of adver-tisements when children watched the television on their own.This suggests that, when compared to adults, there is an effectof advertising on children which means the under-7s may beless resistant to the marketing intentions of advertisers andmanufacturers when watching alone (Bjustrom, 1994; Gunter& McAleer, 1997; Young, 1998). Of course, alternativeinterpretations are feasible. One is that unaccompaniedchildren may be more motivated to recall brand names inorder to request them when in the presence of an adult.Another interpretation is that these are the children of busierparents, who know they can persuade their parents to buy themmore as compensation for lack of attention. Clearly directionalcausality cannot be inferred. However, when comparingchildren of different ages, the lack of effect by age within oursample of under-7s suggests that 6-year-olds have developedno more cognitive resistance to television advertisements than3-year-olds. Despite having acquired more cognitive skills byage 6, particularly those relating to theory of mind and realitydistinction, the older children appeared to be as susceptible as
INTERNATIONAL JOURNAL OF BEHAVIORAL DEVELOPMENT, 2002, 26 (6), 529–539 537
Table 2Mean (SD) number of requests for items (total and branded) in children’s letters to Father Christmasaccording to nationality.
Nationality NAge
groupMean no. oftotal requests
Mean no. ofbranded requests
% of totalrequests
Swedish 19 5–6 years 4.316 (2.473) 1.5789 (1.304) 36.58%UK 34 5–6 years 5.470 (1.186) 2.206 (1.149) 40.33%
Figure 5. Number of requests per item/number of televised advertisements. at SAGE Publications on November 12, 2009 http://jbd.sagepub.comDownloaded from

538 PINE AND NASH / THE EFFECTS OF TELEVISION ADVERTISING
the younger ones. This emphasises the importance of the rolethat parents play in advertisement education and in helpingtheir children to acquire critical viewing skills. Even preschoolchildren have been found to be more advertising literate afterbeing taught, within the family, about market-place skills andthe purpose of advertising (R.E. Hite & Eck, 1987). Afterwardsthey were less susceptible to deception than those children infamilies who did not teach the same skills.
The novel use of letters to Father Christmas in this studyemulates the typical delay that occurs between seeing anadvertisement and the time of purchase or request, and lendsecological validity to these �ndings. Equally, construct validityappeared to be strong. However, the signi�cant differencebetween the television scores for the school children (self-report) and the nursery children (parental report) requiresfurther investigation. It may be that the scores accuratelyre�ect the different viewing habits of the two groups ofchildren. Alternatively it may be inaccuracy of memory oneither part, elaboration in a desire to create a good impressionor, in the case of parent report, a lack of awareness orunderestimation of their child’s viewing habits. As the wordingof the questions was derived from the children, it is unlikelythat the children’s understanding of the wording is a problem.Whatever the cause, measures of television viewing habitsemployed in future studies need to pay particular attention toissues of reliability and accuracy. Asking parents to keep a diarymay be one method of producing more reliable records of whatchildren watch and monitoring devices within the TV set thatrecord which programmes are watched could also be employedin future studies to address this issue.
A promising framework for understanding children’smemory for, and understanding of, advertisements involvesapplying a model based on implicit and explicit knowledge.This is explored well in Karmiloff-Smith’s (1992) Representa-tional Redescription model, whereby knowledge is redescribedfrom an implicit nonverbalisable level through transitionalstages to an explicit, and transferable, form (see also Pine &Messer, 1999). The idea of having knowledge at different levelsof explicitness also offers an explanation of previous �ndingswhereby a variety of ages have been accredited with under-standing of advertisements. A young child may not be able tode�ne an advertisement explicitly but, implicitly, may be ableto distinguish a commercial from a programme. Similarly,being able to tell what an advertisement is and understandingthe objectives of the advertiser are two very different areas ofknowledge. Children (and adults too) possess many dimen-sions of thought that are represented in a nonlinguistic formand television advertising is no exception. The challenge forresearchers is to employ methodologies that tap into implicitand explicit knowledge in order to achieve a fuller awareness ofhow children’s understanding of television develops.
In terms of the children’s requests for branded products inrelation to their total requests, 41% suggests either thatchildren below the age of 7 years are not oriented towardsbrand names, that they do not understand the salience of thebrand names, or, as was predicted, that they simply havedif�culty remembering them. Moreover, the 73% whorequested one or more branded items is less than Greenberget al. (1986) found. They issued diaries to children forcompletion during 1 week in October and found that 91% ofheavy viewers of commercial television requested advertisedproducts. Although these products included food and otheritems, rather than just toys, the lower number of requests
found here may also re�ect the normal delay that occursbetween advertisement and moment of purchase.
In light of the number of advertisements for toys aimed atchildren and the large proportion of advertised products forwhich no request was made, there is a poor effect of many ofthe individual advertisements themselves. This is con�rmed bythe lack of a relationship between children’s requests andtelevised advertisements after removing Barbie and ActionMan from the analysis, the only two products for which thereappears to be some effect. Collins and Wellman (1982)identi�ed a memory bias in young children, claiming theyattend more closely to familiar content on television. As thesetwo dolls have been on the market for a long time, and werepopular with the parents of today’s children, their familiaritymay have reinforced the impact of the commercials. Thissuggests that advertisers of new products are at a hugedisadvantage when it comes to trying to get their name acrossto young children, since familiarity takes a long time toestablish. As Vakratsas and Ambler (1999, p. 31) note, ‘‘aminimum number of exposures is necessary for the advertise-ment to have an effect’’.
Lack of product familiarity and memory de�cits offer someexplanations as to why many of the toys advertised were notrequested by any of the children in this study. Certainly theAdmap (2000) suggestion that ‘‘the visuals are key, wordssecondary’’ when advertising to children does not seem to haveresulted in production techniques that enhance the memor-ability of the product name. However, recognition memory atthis age is far better than recall (Gunter & McAleer, 1997), anda child would need to recall a product’s name explicitly inorder to ask for it in a letter. Future studies will includerecognition measures in order to tap in to the child’s implicitmemory. An alternative explanation is that the productsthemselves may not be appealing and fail to create a desireand that children are more shrewd and sophisticated than theadvertisers would believe. However, given the lack of cognitiveskills of children in the age group studied here, this is unlikely.Finally, the restrictions on advertisements imposed by theITC, and the self-regulation codes, may be seen here to beworking very effectively in preventing pester power. It isunlikely that children would be pestering their parents foradvertised toys and yet fail to mention the desired toy in theirletter to Santa. Although these �ndings are from a correlationstudy using cross-sectional data, one interpretation could bethat increased exposure to commercials has the effect ofmaking children want more toys in general, rather than speci�cnamed products, so pester power cannot be totally ruled out.The heavy viewing children in this study may possibly bepestering their parents for the latest type of toys, although notnecessarily by name. A similar positive relationship betweenhigh viewing and more requests was also found in a cross-cultural study carried out by Robertson et al. (1989). Theirstudy also investigated parent-child con�ict and found this washigher in families where children watched more television.Therefore, parents who allow their children to watch a lot ofTV in order to give themselves an ‘‘easier’’ life may, in fact, becreating more problems for themselves in the long run. Futurestudies could explore this relationship more systematically byuse of longitudinal observations. These could employ diarymethods, interviews, and children’s letters to Santa over a 2- or3-year period.
The comparison with the Swedish children con�rmed thatthe presence of advertisements on UK television tended to
at SAGE Publications on November 12, 2009 http://jbd.sagepub.comDownloaded from

result in more requests generally. Does this mean thatincreased exposure to commercial television generates moredemands from children and, where there are fewer advertise-ments, children ask for less? Of course, these data have to betreated with caution as the sample of Swedish children wassmall and it may be differences between British and Swedishcultures which account for the difference. However, it wouldbe useful to explore this further given that there exists a nationof children who are raised in a Western culture but without thelevels of exposure to TV advertising experienced by children inthe UK.
In summary, this study �nds that increasing amounts ofcommercial television watched are matched by an increase inthe overall amount of toys requested by children, and anincrease in the number of branded products requested. Oneinterpretation is that there is a general effect of advertising onchildren’s desires and the lone viewing data may be taken asevidence of young children’s susceptibility to the persuasiveintent of commercials. However, with the exception of twowell-established products, the paucity of a relationshipbetween the branded products requested and the frequencyof televised advertisements for them suggests that advertise-ments may not have an individual impact on the under-7s butmay simply contribute to a general increase in desire. Oneimplication of this is that a society which exposes youngchildren to many thousands of advertisements every year alsohas a duty to educate those children in consumer literacy andcritical viewing.
Manuscript received September 2000Revised manuscript received October 2001
References
Admap. (2000). Children: Victims or allies? January, 402, 19–20. AdmapPublications.
Aloise-Young, P.A. (1993). The development of self-presentation: Self-promo-tion in 6- to 10-year-old children. Social Cognition, 11, 201–222.
Bennett, M., & Yeeles, C. (1990). Children’s understanding of the self-presentational strategies of ingratiation and self-promotion. European Journalof Social Psychology, 20, 455–461.
Berry, G.L., & Keiko Asamen, J. (1993). Children and television: Images in achanging sociocultural world. London: Sage.
Bjurstrom, E. (1994). Children and television advertising. Sweden: ConsumentVerket.
Collins, W.A., & Wellman, H. (1982). Social scripts and developmental patternsin comprehension of televised narratives. Communication Research, 9, 380–398.
Dorr, A. (1986). Television and children: A special medium for a special audience.Beverley Hills, CA: Sage.
Faul, F., & Erdfelder, E. (1992). GPOWER: Apriori, post hoc, and compromisepower analyses for MS-DOS [Computer program]. Bonn, Germany: BonnUniversity, Dept. of Psychology.
Flavell, J.H., Flavell, E.R., Gree, F.L., & Korfmacher, J.E. (1990). Do youngchildren think of television images as pictures or as real objects? Journal ofBroadcasting and Electronic Media, 34, 399–417.
Gaines, L., & Esserman, J.F. (1981). A quantitative study of young children’scomprehension of television programmes and commercials. In J.F. Esserman(Ed.), Television advertising and children, New York: Child Research Service.
Greenberg, B.S., Fazal, S., & Wober, M. (1986). Children’s views on advertising.London: Independent Broadcasting Authority (now the Independent Televi-sion Commission).
Gunter, B., & McAleer, J. (1997). Children and television (2nd ed.). London:Routledge.
Henricksen, L. (1996). Naive theories of buying and selling: Implications forteaching critical viewing skills. Journal of Applied Communication Research, 24,93–109.
Hite, C.E., & Hite, R.E. (1994). Reliance on brand by young children. Journal ofthe Market Research Society, 37, 185–193.
Hite, R.E., & Eck, R. (1987). Advertising to children: Attitudes of business vs.consumers. Journal of Advertising Research, October/November, 40–53.
Huston, A.C., & Wright, J.C. (1998). Mass media and children’s development.In W. Damon (Gen. Ed.), I.E. Sigel, & K.A. Renninger (Vol. Eds.), Handbookof child psychology: Vol. 4, Child psychology in practice (pp. 999–1058). NewYork: Wiley.
Jaglom, L.M., & Gardner, H. (1981). The preschool television viewers asanthropologist. In H.L. Kelly & H. Gardner (Eds.), Viewing children throughtelevision (pp. 9–30). San Francisco: Jossey-Bass.
Karmiloff-Smith, A. (1992). Beyond modularity: A developmental perspective oncognitive science. Cambridge, MA: MIT Press.
Levin, S.R., Petros, T.V., & Petrella, F.W. (1982). Preschoolers’ awareness oftelevision advertising. Child Development, 53, 933–937.
Linn, M.C., De Benedictis, T., & Delucchi, K. (1982). Adolescent reasoningabout advertisements : Preliminary investigations. Child Development, 56,1479–1498.
Livingstone, S., & Bovill, D. (1999). Social perspectives: Have the media ruinedchildhood? Interactions, 6, 36–41.
Macklin, C. (1994). The effects of an advertising retrieval cue on youngchildren’s memory and brand evaluations. Psychology and Marketing, 11, 291–311.
Pine, K.J., & Messer, D.J. (1999). What children do and what children know:Looking beyond success using Karmiloff-Smith’s RR framework. New Ideas inPsychology, 17, 17–30.
Robertson, T.S., & Rossiter, J.R. (1976). Short-run advertising effects onchildren: A �eld study. Journal of Marketing Research, 13, 68–70.
Robertson, T .S., Ward, S., Gatignon, H., & Klees, D. (1989). Advertising andchildren: A cross cultural study. Communication Research, 16, 459–485.
Rossiter, J.R., & Robertson, T.S. (1974). Canonical analysis of developmental,social and experiential factors in children’s comprehension of televisionadvertising. Journal of Genetic Psychology, 129, 317–327.
Sharp, T ., Dyer, R., & Divita, S. (1976). An experimental test of the harmfuleffects of premium-orientated commercials on children. Journal of AdvertisingResearch, 3, 1–11.
Vakratsas, D., & Ambler, T. (1999). How advertising works: What do we reallyknow? Journal of Marketing, 63, 26–43.
Ward, S., Wackman, D.B., & Wartella, E. (1977). How children learn to buy,Beverley Hills, CA: Sage.
Young, B. (1998). Emulation, fears and understanding: A review of recent researchon children and television advertising. London: Independent TelevisionCommission.
INTERNATIONAL JOURNAL OF BEHAVIORAL DEVELOPMENT, 2002, 26 (6), 529–539 539
at SAGE Publications on November 12, 2009 http://jbd.sagepub.comDownloaded from