Embed Size (px)
Citation preview

M&A und Allianzen in Life ScienceAktuelle Entwicklungen und Trends Symposium Life Science am Kapitalmarkt
Frankfurt, 3. Juni 2008
M&A und Allianzen in Life Science - Aktuelle Entwicklungen und Trends Page 2
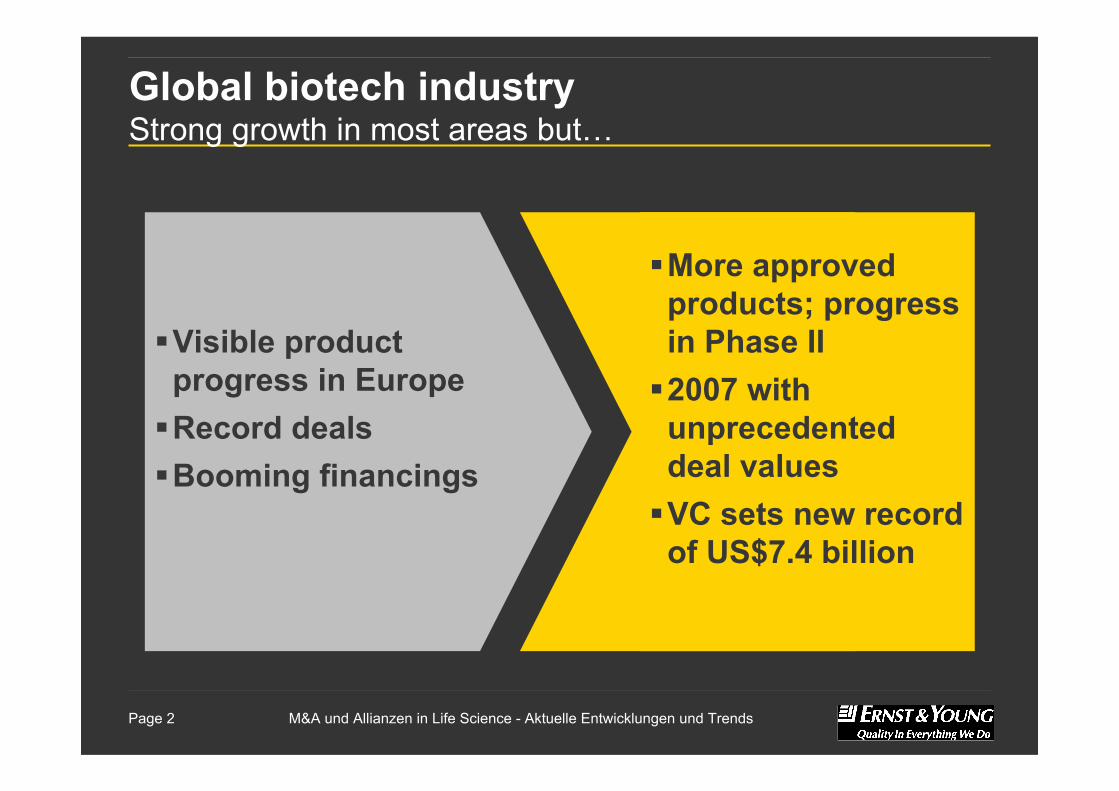
Global biotech industryStrong growth in most areas but…
Visible product progress in EuropeRecord dealsBooming financings
More approved products; progress in Phase II2007 with unprecedented deal valuesVC sets new record of US$7.4 billion

M&A und Allianzen in Life Science - Aktuelle Entwicklungen und Trends Page 3
Product developmentVisible pipeline progress in Europe
Source: Ernst & Young and company websites (Estimates show data for public and private companies that report pipeline information)
711
285
439
141
735
310
148
519
0
100
200
300
400
500
600
700
800
Preclinical Phase I Phase II Phase III
2006 2007
European product pipeline by phaseNumber of product candidates in studies
0
50
100
150
200
250
300
350
400
UK GER DK F CH IT
Phase IIIPhase IIPhase IPreclinical
Number of product candidates in studies
Pipeline by phase and major countries
M&A und Allianzen in Life Science - Aktuelle Entwicklungen und Trends Page 4
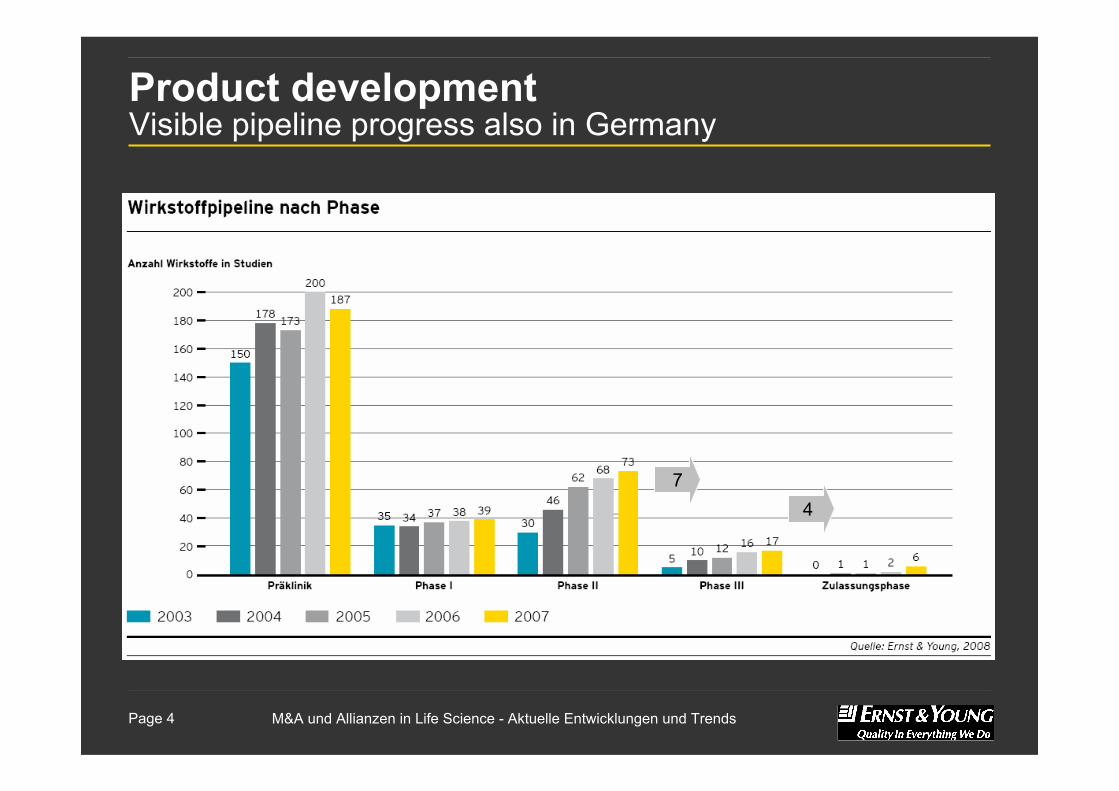
Product developmentVisible pipeline progress also in Germany
74
M&A und Allianzen in Life Science - Aktuelle Entwicklungen und Trends Page 5
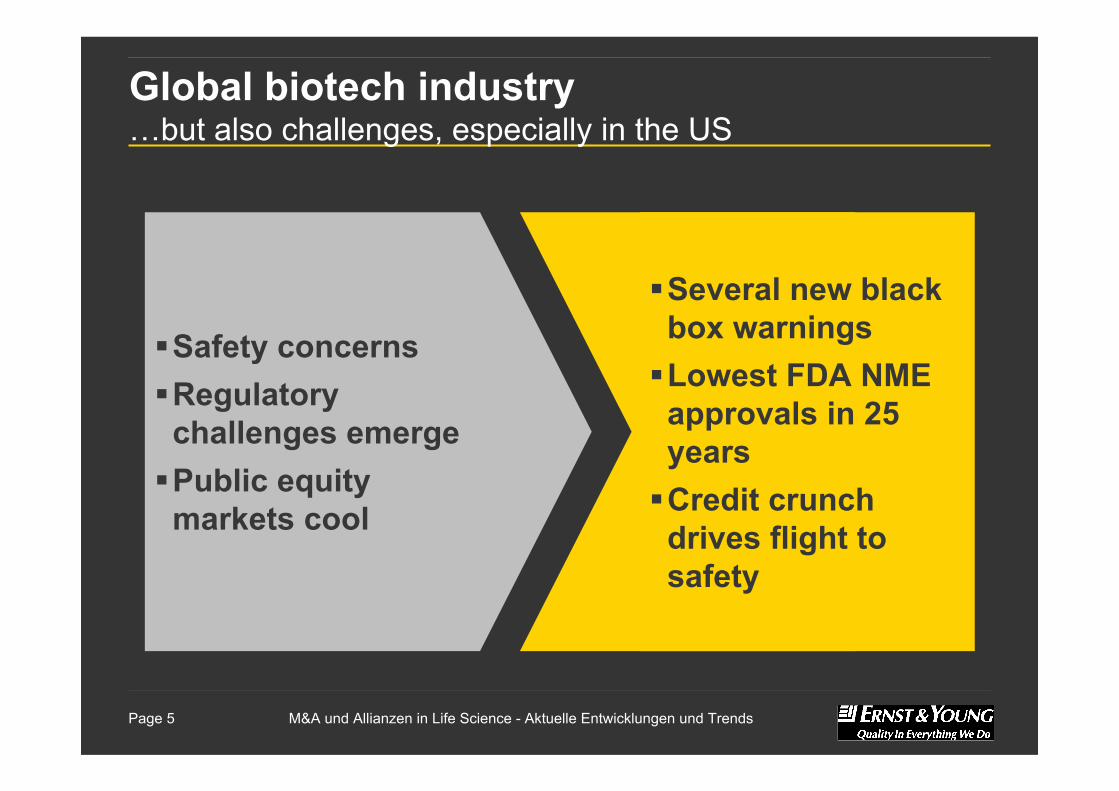
Global biotech industry…but also challenges, especially in the US
Safety concernsRegulatory challenges emergePublic equity markets cool
Several new black box warningsLowest FDA NME approvals in 25 yearsCredit crunch drives flight to safety
M&A und Allianzen in Life Science - Aktuelle Entwicklungen und Trends Page 6
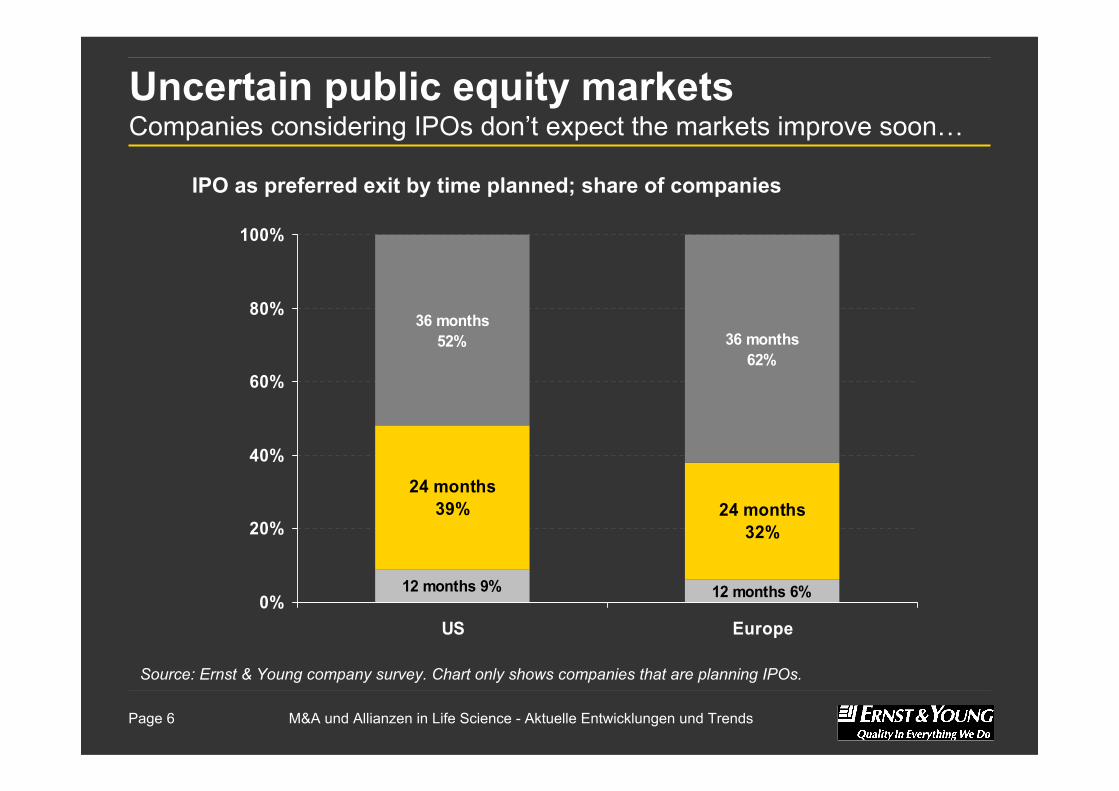
Uncertain public equity marketsCompanies considering IPOs don’t expect the markets improve soon…
24 months39% 24 months
32%
36 months52% 36 months
62%
12 months 6%12 months 9%0%
20%
40%
60%
80%
100%
US Europe
IPO as preferred exit by time planned; share of companies
Source: Ernst & Young company survey. Chart only shows companies that are planning IPOs.

M&A und Allianzen in Life Science - Aktuelle Entwicklungen und Trends Page 7
Uncertain public equity markets…thus most companies are planning on M&As or dual tracking for exits
IPO only16%
IPO only16%
Dual tracking45%
Dual tracking27%
M&A only40%
M&A only57%
0%
20%
40%
60%
80%
100%
US Europe
Preferred exits; share of companies
Source: Ernst & Young company survey. Chart does not include companies not planning exits, or planning exits other than IPOs or M&As.

M&A und Allianzen in Life Science - Aktuelle Entwicklungen und Trends Page 8
Long-term outlook:reinvention
M&A und Allianzen in Life Science - Aktuelle Entwicklungen und Trends Page 9
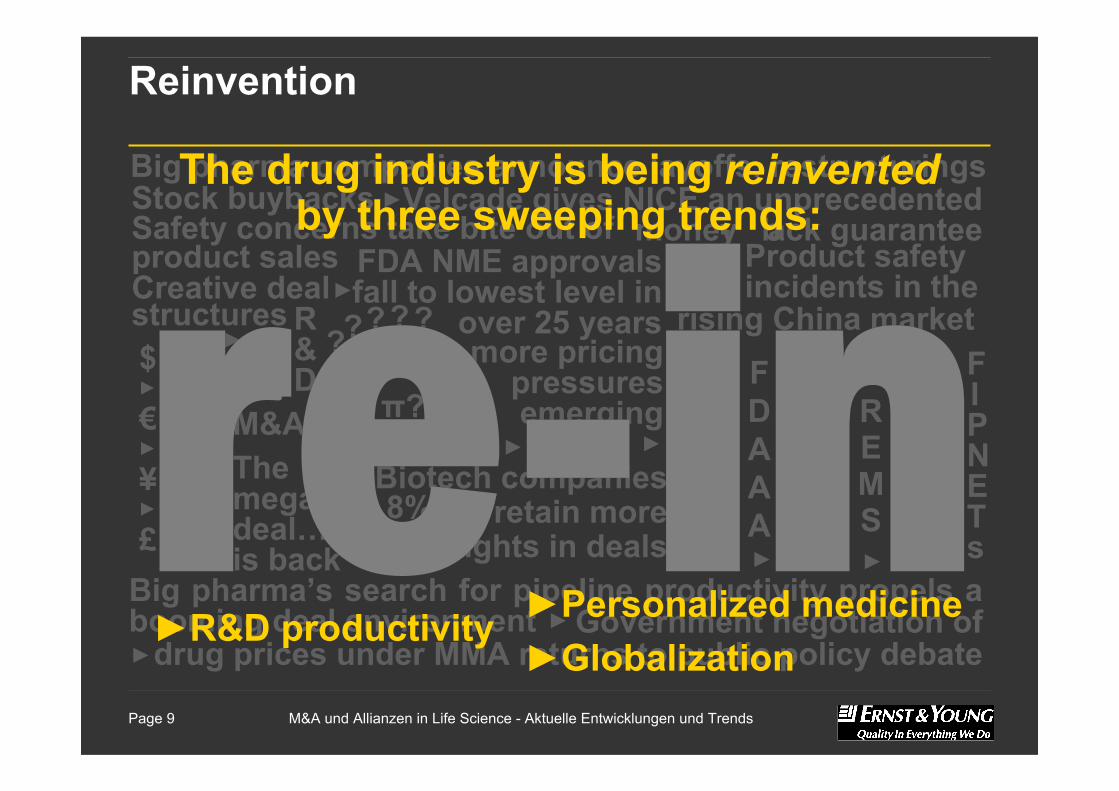
Reinvention
Big pharma companies announce layoffs, restructuringsStock buybacksSafety concerns take bite out of product sales
Velcade gives NICE an unprecedented money- back guarantee
FDA NME approvals fall to lowest level in
over 25 years more pricing
pressuresemerging
Product safety incidents in the
rising China market
Big pharma’s search for pipeline productivity propels a booming deal environment
Biotech companies retain more
rights in deals
The mega deal… is back
π?
8%
Government negotiation of drug prices under MMA returns to public policy debate
FIPNETs
Creative deal structures
►
►
►
►
►►M&A R
EMS
FDAAA ►
$►
€►
¥►
£
R&D
►
?????►
The drug industry is being reinventedby three sweeping trends:
►R&D productivity ►Personalized medicine►Globalization
M&A und Allianzen in Life Science - Aktuelle Entwicklungen und Trends Page 10
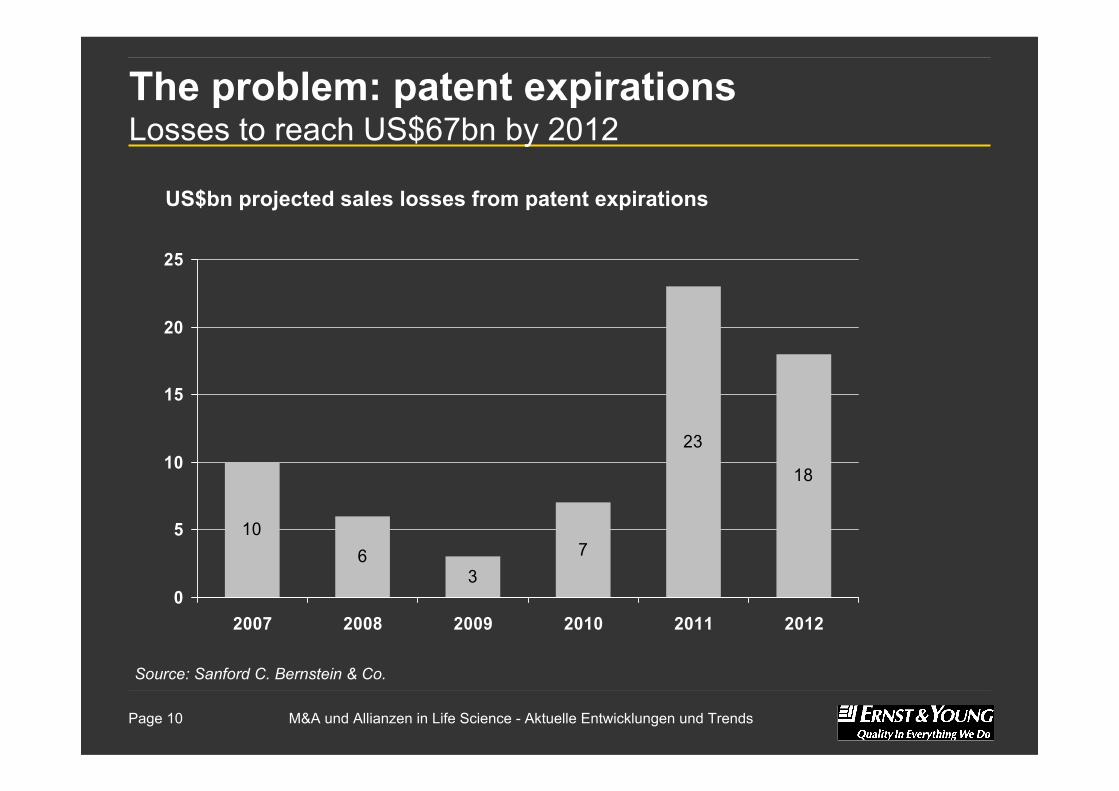
The problem: patent expirationsLosses to reach US$67bn by 2012
106
37
23
18
0
5
10
15
20
25
2007 2008 2009 2010 2011 2012
US$bn projected sales losses from patent expirations
Source: Sanford C. Bernstein & Co.

M&A und Allianzen in Life Science - Aktuelle Entwicklungen und Trends Page 11
Reinventing drug developmentPharma will continue to need biotech to fill their pipelines
Pharma’s patent productivity challenges drive change
Short- term: cost cutting, late- stage acquisitionsLong- term: platform deals, restructuring R&D (smaller teams, networked, more autonomous)
M&A und Allianzen in Life Science - Aktuelle Entwicklungen und Trends Page 12
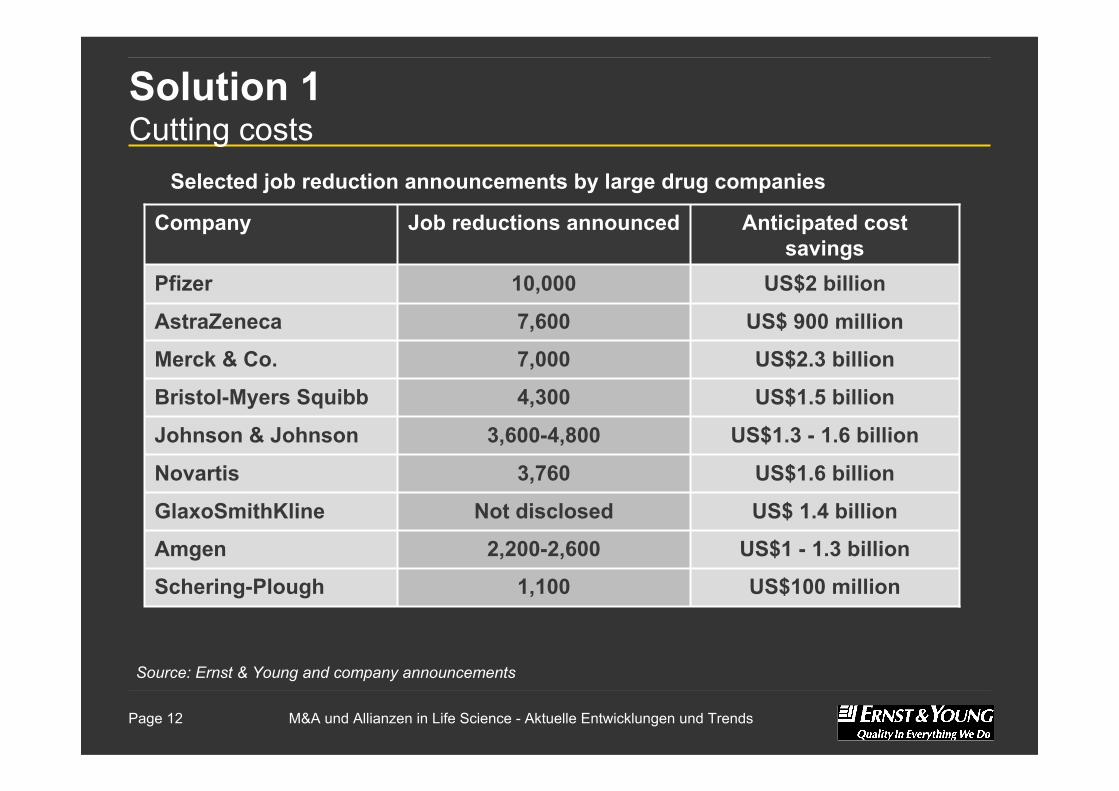
Solution 1Cutting costs
US$ 1.4 billionNot disclosedGlaxoSmithKline
US$1 - 1.3 billion2,200-2,600Amgen
US$100 million1,100Schering-Plough
US$1.6 billion3,760Novartis
US$1.3 - 1.6 billion3,600-4,800 Johnson & Johnson
US$1.5 billion4,300Bristol-Myers Squibb
US$2.3 billion7,000Merck & Co.
US$ 900 million7,600AstraZeneca
US$2 billion10,000Pfizer
Anticipated cost savings
Job reductions announcedCompany
Selected job reduction announcements by large drug companies
Source: Ernst & Young and company announcements
M&A und Allianzen in Life Science - Aktuelle Entwicklungen und Trends Page 13
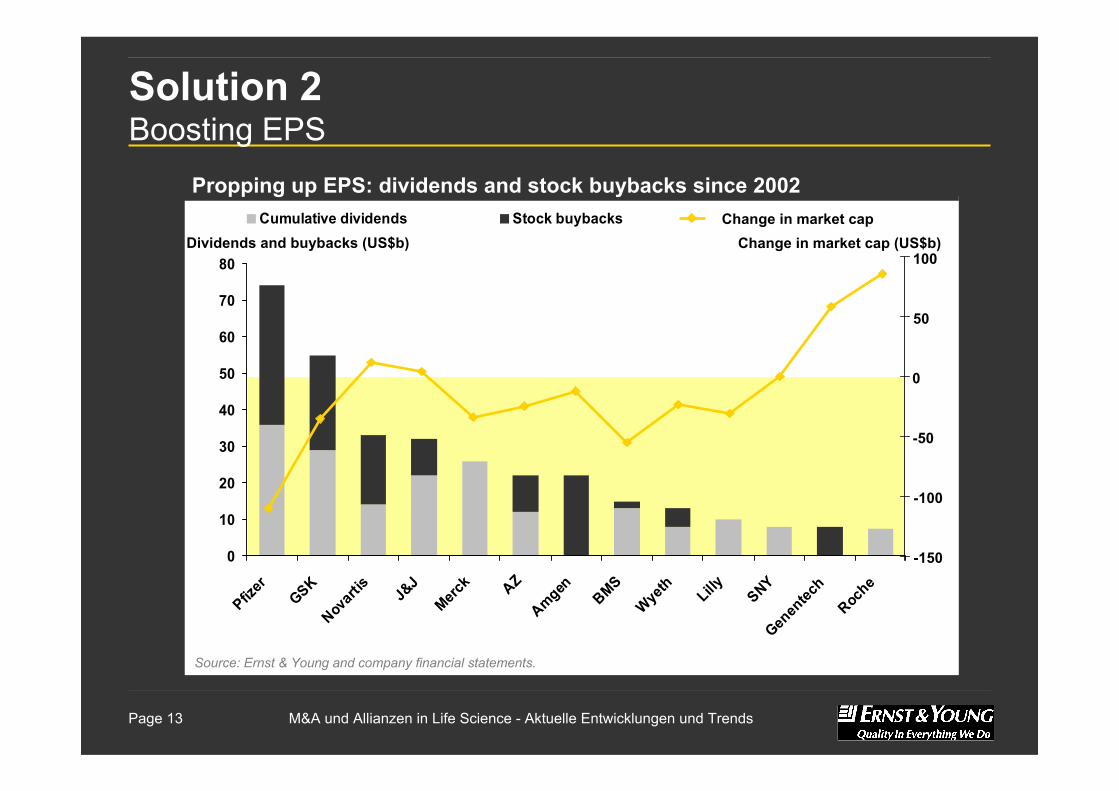
Solution 2 Boosting EPS
0
10
20
30
40
50
60
70
80
Pfizer
GSKNov
artis
J&J
Merck AZ
Amgen
BMS
Wyeth Lilly SNY
Genen
tech
Roche
Cumulative dividends Stock buybacks
Propping up EPS: dividends and stock buybacks since 2002
Source: Ernst & Young and company financial statements.
Dividends and buybacks (US$b)
-150
-100
-50
0
50
100
Change in market capChange in market cap (US$b)
M&A und Allianzen in Life Science - Aktuelle Entwicklungen und Trends Page 14
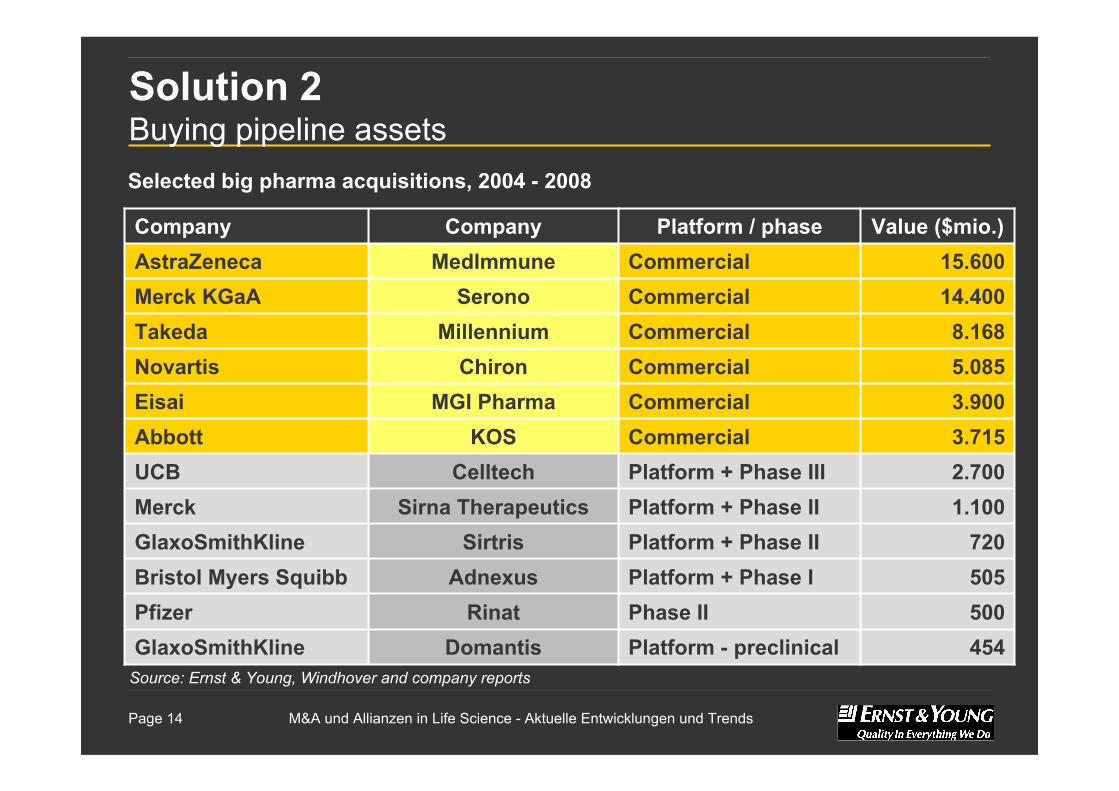
Solution 2 Buying pipeline assets
5.085CommercialChironNovartis
505Platform + Phase IAdnexusBristol Myers Squibb500Phase IIRinatPfizer
720Platform + Phase IISirtrisGlaxoSmithKline
2.700Platform + Phase IIICelltechUCB
Platform - preclinical
Platform + Phase II
CommercialCommercial
CommercialCommercialCommercial
Platform / phase
3.900MGI PharmaEisai
14.400SeronoMerck KGaA8.168MillenniumTakeda
1.100Sirna TherapeuticsMerck
454DomantisGlaxoSmithKline
15.600MedImmuneAstraZeneca
3.715KOSAbbott
Value ($mio.)CompanyCompany
Selected big pharma acquisitions, 2004 - 2008
Source: Ernst & Young, Windhover and company reports
M&A und Allianzen in Life Science - Aktuelle Entwicklungen und Trends Page 15
M&ADevelopments & Trends

M&A und Allianzen in Life Science - Aktuelle Entwicklungen und Trends Page 16
M&A in the USRecord-breaking M&As, led by a mega deal
0
5
10
15
20
25
30
35
1999 2000 2001 2002 2003 2004 2005 2006 2007
Pharma-biotech Biotech-biotech Pharma-biotech mega deals Biotech-biotech mega deals
US M&A history by value (US$bn)
Source: Ernst & Young, BioWorld, Recombinant Capital and Windhover
M&A und Allianzen in Life Science - Aktuelle Entwicklungen und Trends Page 17
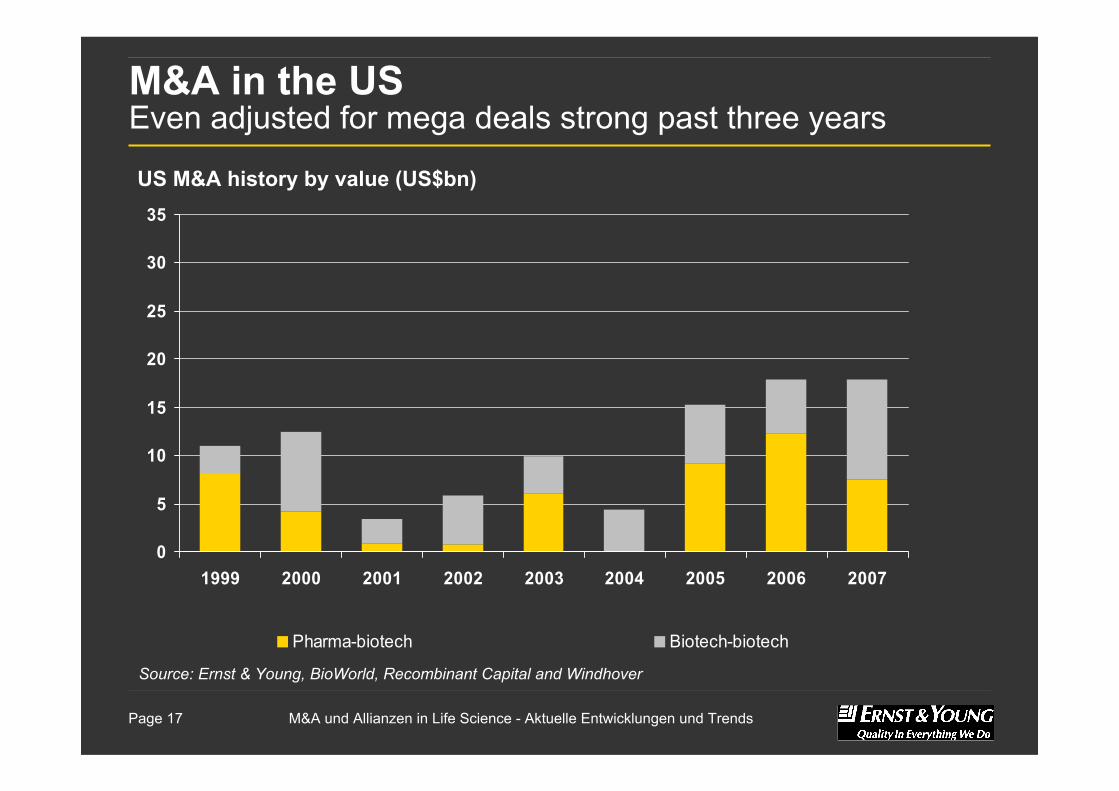
M&A in the US Even adjusted for mega deals strong past three years
0
5
10
15
20
25
30
35
1999 2000 2001 2002 2003 2004 2005 2006 2007
Pharma-biotech Biotech-biotech
US M&A history by value (US$bn)
Source: Ernst & Young, BioWorld, Recombinant Capital and Windhover
M&A und Allianzen in Life Science - Aktuelle Entwicklungen und Trends Page 18
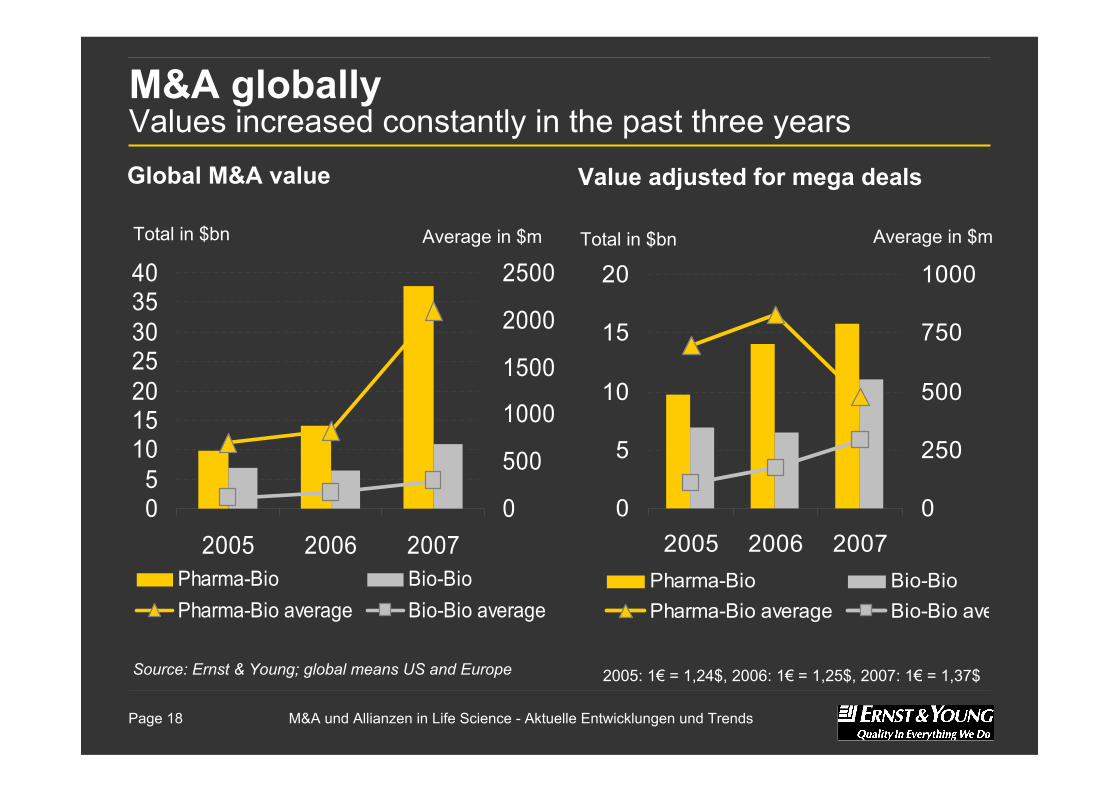
M&A globallyValues increased constantly in the past three years
Source: Ernst & Young; global means US and Europe 2005: 1€ = 1,24$, 2006: 1€ = 1,25$, 2007: 1€ = 1,37$
Total in $bn
Global M&A value
Average in $m
05
10152025303540
2005 2006 20070
500
1000
1500
2000
2500
Pharma-Bio Bio-BioPharma-Bio average Bio-Bio average
0
5
10
15
20
2005 2006 20070
250
500
750
1000
Pharma-Bio Bio-BioPharma-Bio average Bio-Bio ave
Value adjusted for mega deals
Total in $bn Average in $m

M&A und Allianzen in Life Science - Aktuelle Entwicklungen und Trends Page 19
M&A Europe vs. USEuropean M&A averages lower compared to the US
Source: Ernst & Young 2005: 1€ = 1,24$, 2006: 1€ = 1,25$, 2007: 1€ = 1,37$
0
3.000
6.000
9.000
12.000
2005 2006 20070
300
600
900
1200
Total in $m
US M&A value*
Average in $mTotal in $m
European M&A value*
Average in $m
0
3.000
6.000
9.000
12.000
2005 2006 20070
300
600
900
1200
Pharma-Bio Bio-BioPharma-Bio average Bio-Bio average
*2007 adjusted for mega deal
M&A und Allianzen in Life Science - Aktuelle Entwicklungen und Trends Page 20
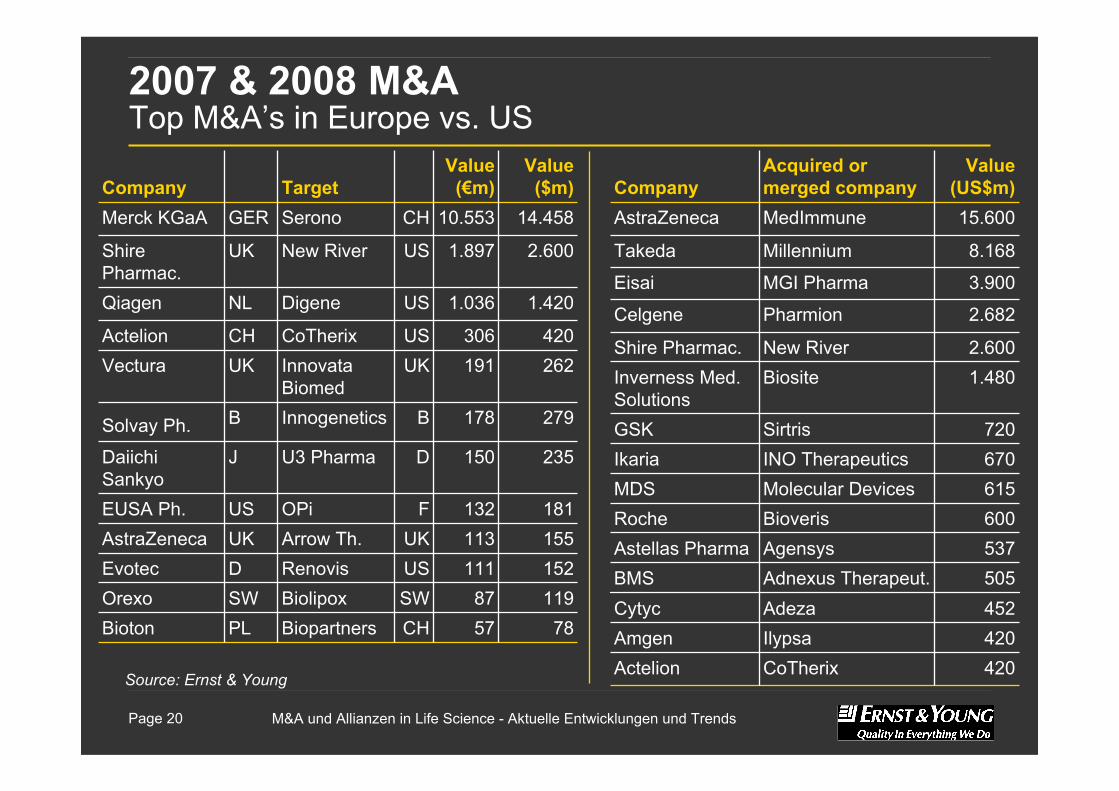
2007 & 2008 M&ATop M&A’s in Europe vs. US
8.168MillenniumTakeda
452AdezaCytyc505Adnexus Therapeut.BMS
420IlypsaAmgen
2.600New RiverShire Pharmac.1.480BiositeInverness Med.
Solutions720SirtrisGSK670INO TherapeuticsIkaria615Molecular DevicesMDS600BioverisRoche537AgensysAstellas Pharma
15.600MedImmuneAstraZeneca
3.900MGI PharmaEisai
2.682PharmionCelgene
420
Value (US$m)
CoTherix
Acquired or merged company
Actelion
Company
279178BInnogeneticsBSolvay Ph.
235150DU3 PharmaJDaiichi Sankyo
155113UKArrow Th.UKAstraZeneca
5787
111
132
191306
1.036
1.897
10.553
Value (€m)
CHSWUS
F
UKUS
US
US
CH
PLSWD
US
UKCH
NL
UK
GER
420CoTherixActelion262Innovata
BiomedVectura
181OPiEUSA Ph.
152RenovisEvotec119BiolipoxOrexo
78BiopartnersBioton
14.458SeronoMerck KGaA
2.600New RiverShire Pharmac.
1.420DigeneQiagen
Value ($m)TargetCompany
Source: Ernst & Young
M&A und Allianzen in Life Science - Aktuelle Entwicklungen und Trends Page 21
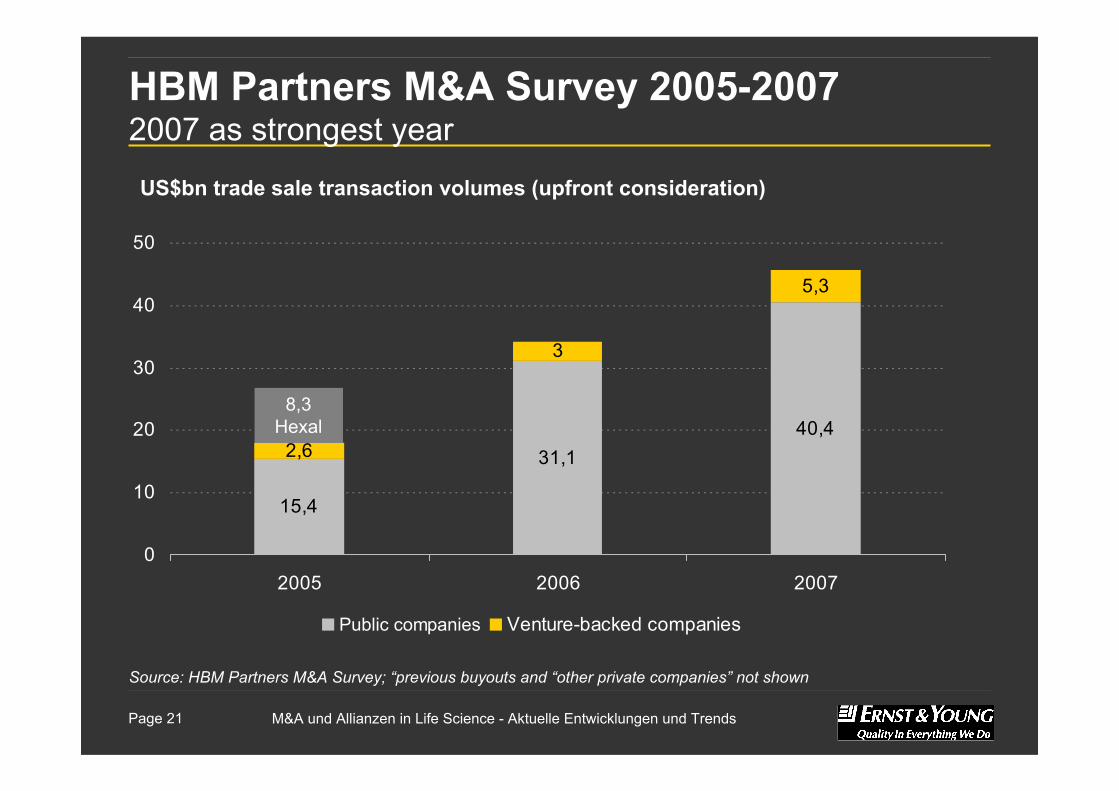
HBM Partners M&A Survey 2005-20072007 as strongest year
US$bn trade sale transaction volumes (upfront consideration)
Source: HBM Partners M&A Survey; “previous buyouts and “other private companies” not shown
15,4
31,140,4
2,6
3
5,3
0
10
20
30
40
50
2005 2006 2007
Public companies Venture-backed companies
8,3Hexal
M&A und Allianzen in Life Science - Aktuelle Entwicklungen und Trends Page 22
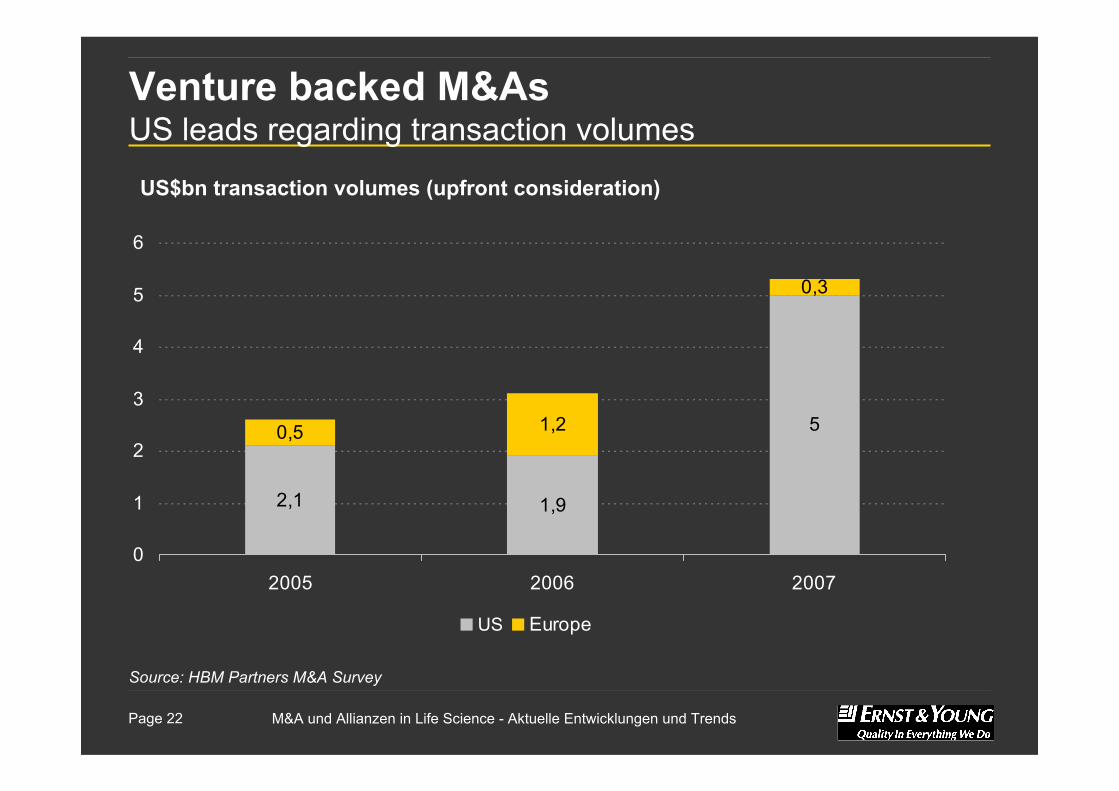
Venture backed M&AsUS leads regarding transaction volumes
US$bn transaction volumes (upfront consideration)
Source: HBM Partners M&A Survey
2,1 1,9
50,5 1,2
0,3
0
1
2
3
4
5
6
2005 2006 2007
US Europe
M&A und Allianzen in Life Science - Aktuelle Entwicklungen und Trends Page 23
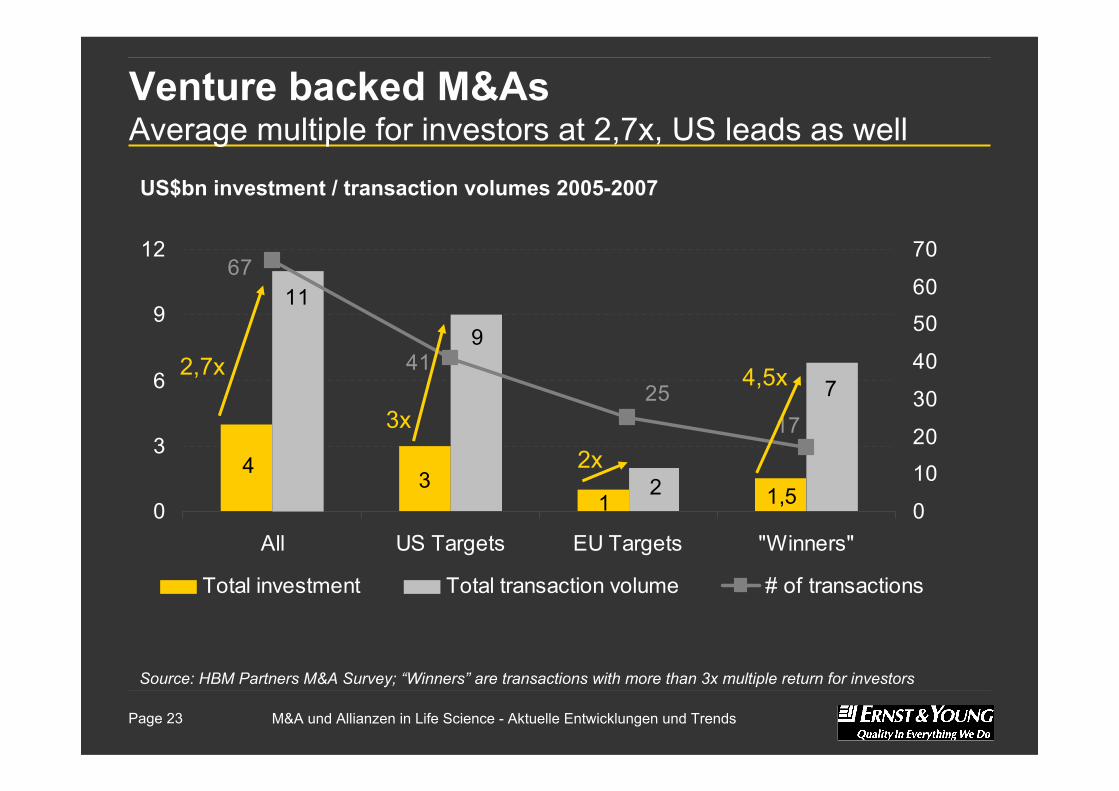
Venture backed M&AsAverage multiple for investors at 2,7x, US leads as well
US$bn investment / transaction volumes 2005-2007
Source: HBM Partners M&A Survey; “Winners” are transactions with more than 3x multiple return for investors
1,513
4
11
9
7
2
2517
41
67
0
3
6
9
12
All US Targets EU Targets "Winners"0
10
20
30
40
50
60
70
Total investment Total transaction volume # of transactions
2,7x
3x
2x
4,5x

M&A und Allianzen in Life Science - Aktuelle Entwicklungen und Trends Page 24
Venture backed M&AsTransactions with European targets created more loss
% of transactions by return to investors by region
Source: HBM Partners M&A Survey
22
4514
2028
2036
15
0
10
20
30
40
50
60
70
80
90
100
US Europe
Loss 1x - 2x 2x - 3x > 3x
M&A und Allianzen in Life Science - Aktuelle Entwicklungen und Trends Page 25
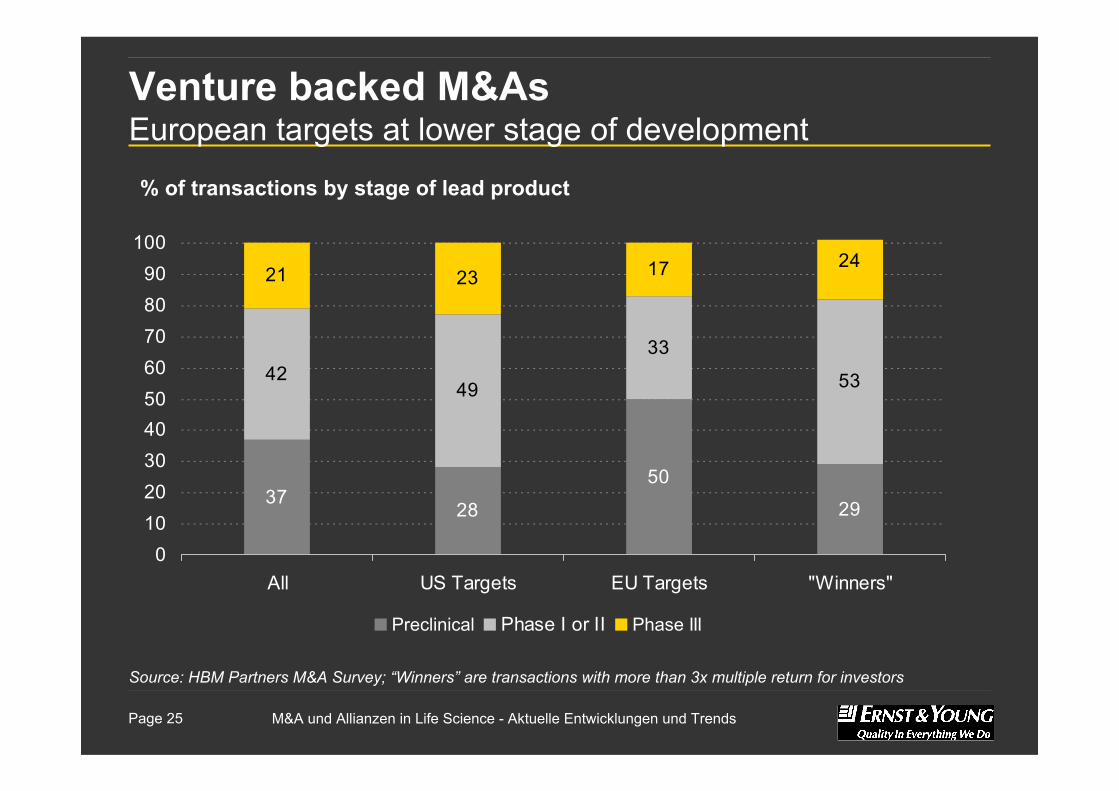
Venture backed M&AsEuropean targets at lower stage of development
% of transactions by stage of lead product
Source: HBM Partners M&A Survey; “Winners” are transactions with more than 3x multiple return for investors
3728
50
29
33
21 23 17 24
534942
0102030405060708090
100
All US Targets EU Targets "Winners"
Preclinical Phase I or II Phase III

M&A und Allianzen in Life Science - Aktuelle Entwicklungen und Trends Page 26
Venture backed M&AsUS relative size of VC market higher than in Europe
US$bn biotech venture capital
Source: Ernst & Young
2,4 2,22,8
3,63,3 3,3
5,5
1
1,8 1,91,61,5
11,2
0
1
2
3
4
5
6
2001 2002 2003 2004 2005 2006 2007
US Europe

M&A und Allianzen in Life Science - Aktuelle Entwicklungen und Trends Page 27
Venture backed M&AsHighest return at transaction involving Phase I&II companies% of return to investors by stage of lead product
Source: HBM Partners M&A Survey
44
22 2514
6
1115
29
1944 25
29
35 292231
0102030405060708090
100
Preclinical Phase I Phase II Phase III / Market
Loss 1x - 2x 2x - 3x > 3x
Median return multiples
0,6x 2,0x 1,9x 1,5x

M&A und Allianzen in Life Science - Aktuelle Entwicklungen und Trends Page 28
Venture backed M&AsProduct & platform produced the best returns for investors
% of return to investors by products vs. platforms
Source: HBM Partners M&A Survey
74
3
6
3
6
6
38
6
0%10%20%30%40%50%60%70%80%90%
100%
Product Product & Platform Platform
Loss 1x - 2x 2x - 3x > 3x
Number of transactions
M&A und Allianzen in Life Science - Aktuelle Entwicklungen und Trends Page 29
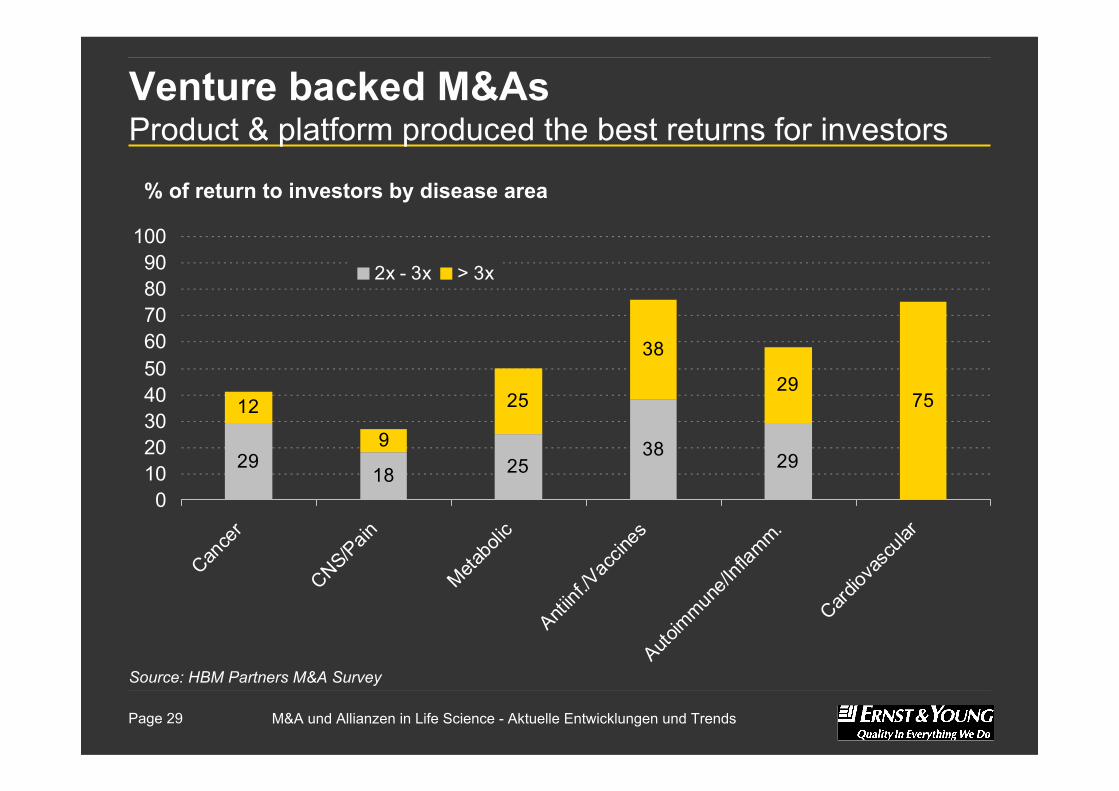
Venture backed M&AsProduct & platform produced the best returns for investors
% of return to investors by disease area
Source: HBM Partners M&A Survey
2918 25
38 29
12
9
38
297525
0102030405060708090
100
Cance
r
CNS/Pain
Metabo
lic
Antiinf
./Vac
cines
Autoim
mune/I
nflam
m.
Cardiov
ascu
lar
2x - 3x > 3x
M&A und Allianzen in Life Science - Aktuelle Entwicklungen und Trends Page 30
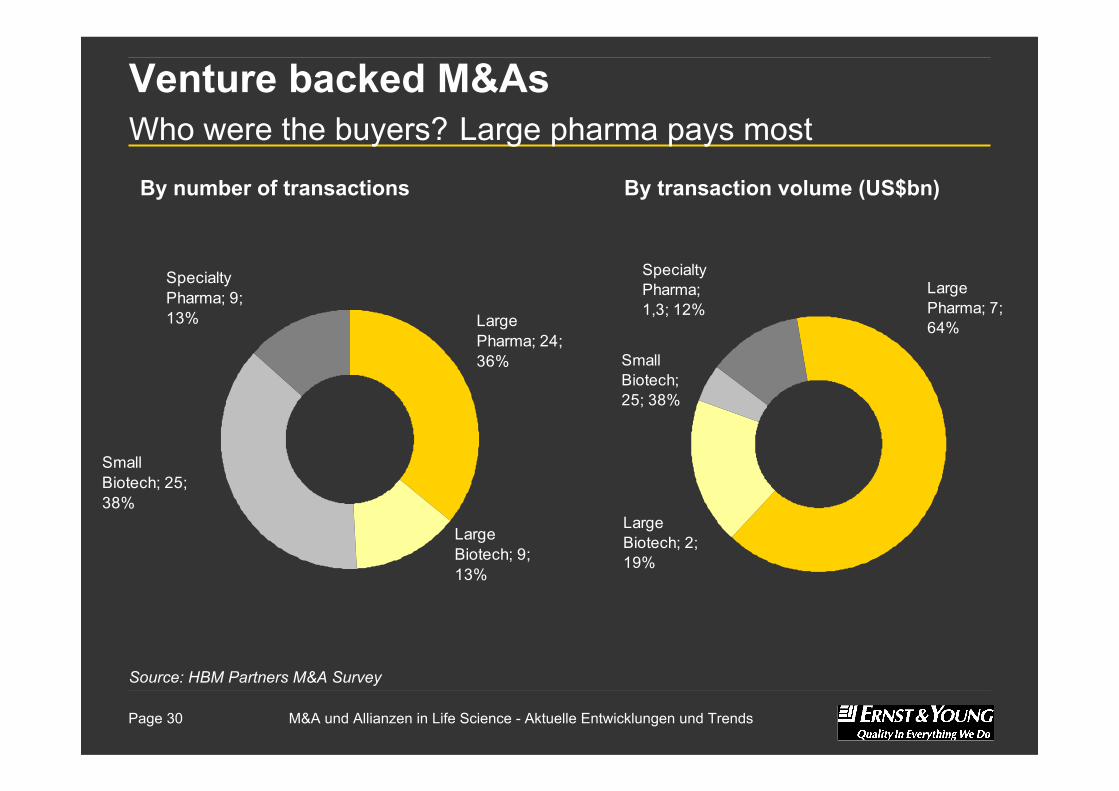
Venture backed M&AsWho were the buyers? Large pharma pays most
By number of transactions
Source: HBM Partners M&A Survey
Large Pharma; 24; 36%
Specialty Pharma; 9; 13%
Large Biotech; 9; 13%
Small Biotech; 25; 38%
By transaction volume (US$bn)
Large Pharma; 7; 64%
Specialty Pharma; 1,3; 12%
Large Biotech; 2; 19%
Small Biotech; 25; 38%
M&A und Allianzen in Life Science - Aktuelle Entwicklungen und Trends Page 31
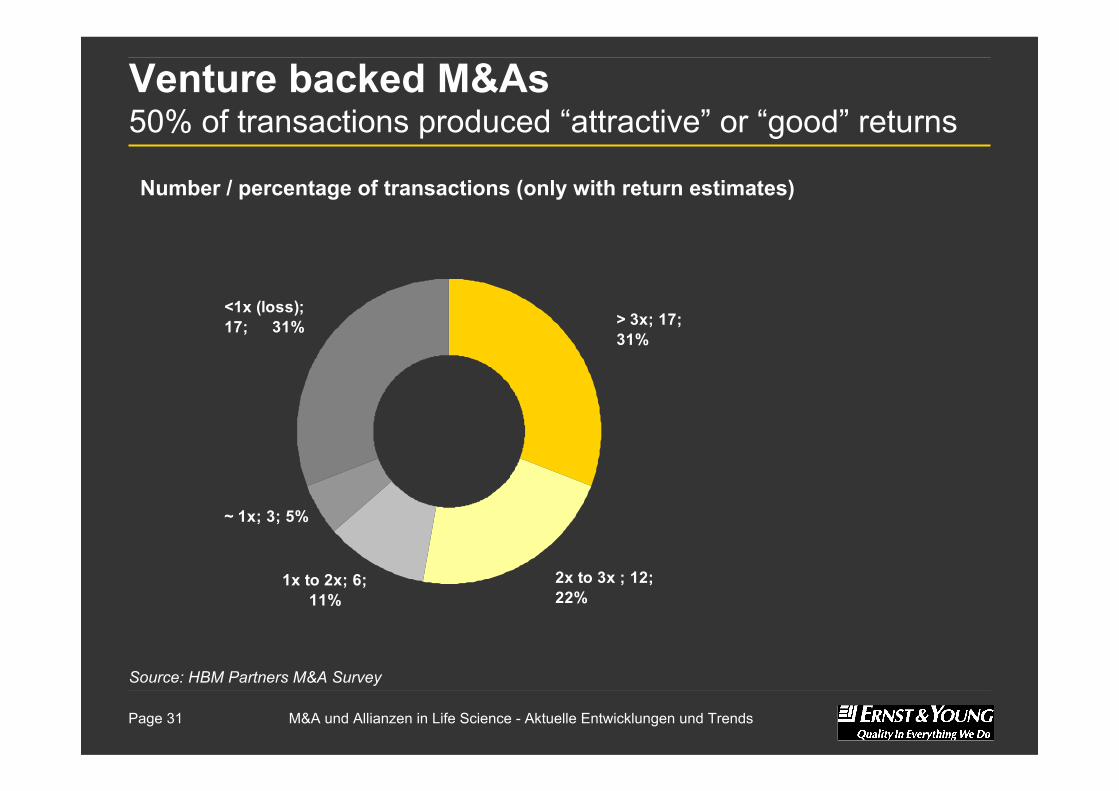
Venture backed M&As50% of transactions produced “attractive” or “good” returns
Number / percentage of transactions (only with return estimates)
Source: HBM Partners M&A Survey
<1x (loss); 17; 31% > 3x; 17;
31%
~ 1x; 3; 5%
2x to 3x ; 12; 22%
1x to 2x; 6; 11%

M&A und Allianzen in Life Science - Aktuelle Entwicklungen und Trends Page 32
AlliancesDevelopments & Trends
M&A und Allianzen in Life Science - Aktuelle Entwicklungen und Trends Page 33
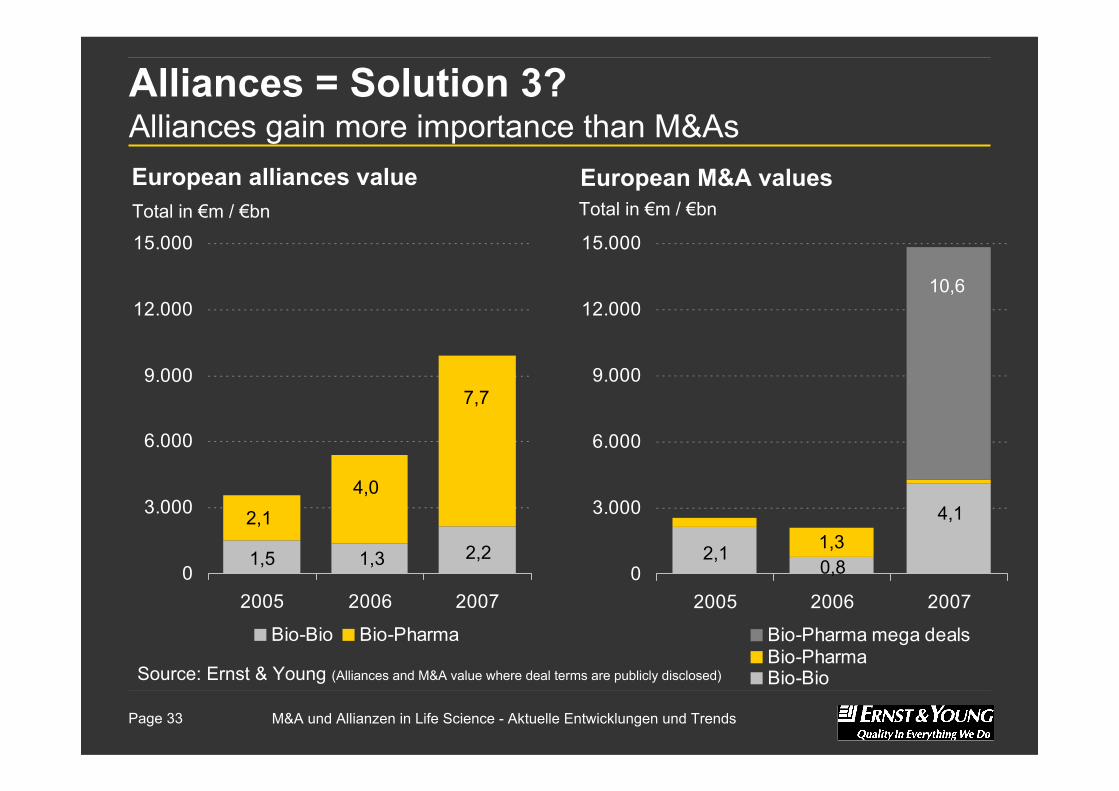
Alliances = Solution 3?Alliances gain more importance than M&As
Source: Ernst & Young (Alliances and M&A value where deal terms are publicly disclosed)
Total in €m / €bn
European alliances value
0
3.000
6.000
9.000
12.000
15.000
2005 2006 2007
Bio-Bio Bio-Pharma
0
3.000
6.000
9.000
12.000
15.000
2005 2006 2007
Bio-Pharma mega dealsBio-PharmaBio-Bio
European M&A valuesTotal in €m / €bn
1,5 1,3 2,2
2,14,0
7,7
2,10,8
4,11,3
10,6

M&A und Allianzen in Life Science - Aktuelle Entwicklungen und Trends Page 34
AlliancesSame is true for the US
Source: Ernst & Young (Alliances and M&A value where deal terms are publicly disclosed)
Total in $m / $bn
US alliances value
0
5.000
10.000
15.000
20.000
25.000
30.000
35.000
2005 2006 2007
Bio-Bio Bio-Pharma
0
5.000
10.000
15.000
20.000
25.000
30.000
35.000
2005 2006 2007
Bio-Pharma mega dealsBio-PharmaBio-Bio
US M&A valuesTotal in $m / $bn
5,0 4,06,2
8,7
21,6
20,9
6,1
10,4
5,7
15,6
9,112,2 7,5

M&A und Allianzen in Life Science - Aktuelle Entwicklungen und Trends Page 35
Alliances2007 brought similar average values compared to the US
Source: Ernst & Young 2005: 1€ = 1,24$, 2006: 1€ = 1,25$, 2007: 1€ = 1,37$
0
3.000
6.000
9.000
12.000
15.000
18.000
21.000
2005 2006 20070
50
100
150
200
250
300
350
Total in $m
US alliances value
Average in $mTotal in $m
European alliances value
Average in $m
0
3.000
6.000
9.000
12.000
15.000
18.000
21.000
2005 2006 20070
50
100
150
200
250
300
350
Bio-Pharma Bio-BioBio-Pharma average Bio-Bio average
M&A und Allianzen in Life Science - Aktuelle Entwicklungen und Trends Page 36
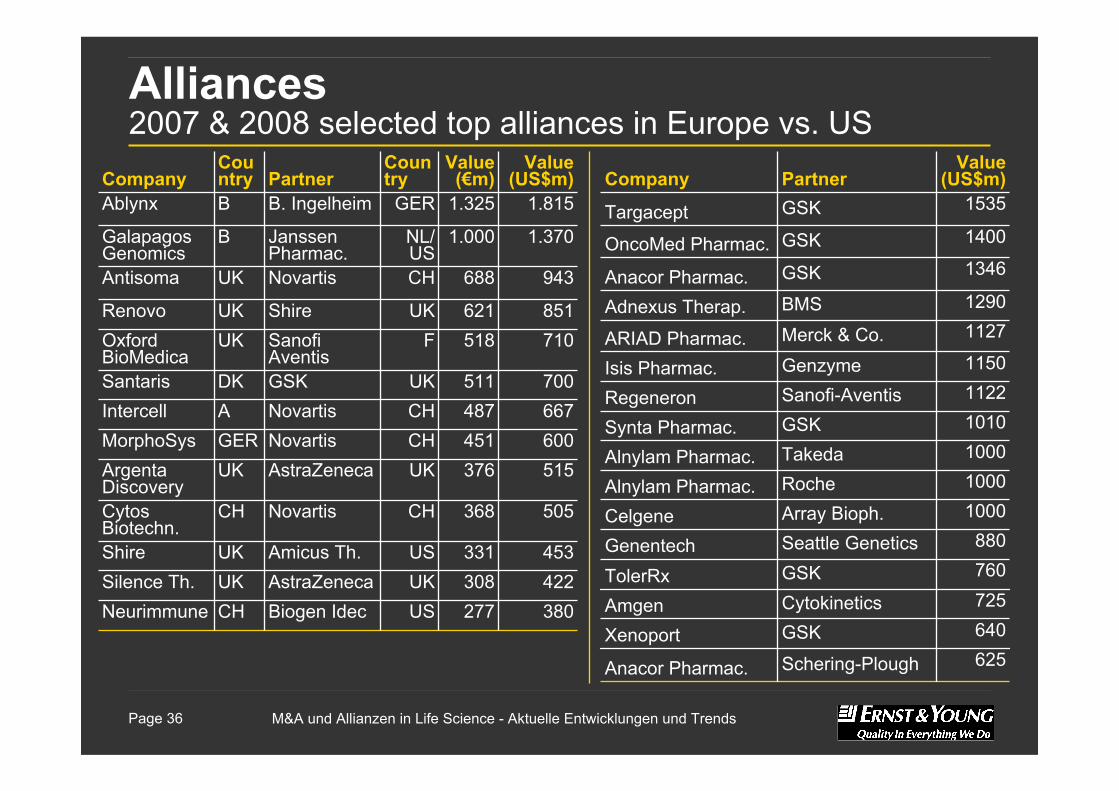
Alliances2007 & 2008 selected top alliances in Europe vs. US
1150GenzymeIsis Pharmac.
1000TakedaAlnylam Pharmac.
625Schering-PloughAnacor Pharmac.
725CytokineticsAmgen
760GSKTolerRx
640GSKXenoport
1290BMSAdnexus Therap.1127Merck & Co.ARIAD Pharmac.
1122Sanofi-AventisRegeneron1010GSKSynta Pharmac.
1000RocheAlnylam Pharmac.1000Array Bioph.Celgene880Seattle GeneticsGenentech
1535GSKTargacept1400GSKOncoMed Pharmac.1346GSKAnacor Pharmac.
Value (US$m)PartnerCompany
453331USAmicus Th.UKShire422308UKAstraZenecaUKSilence Th.
505368CHNovartisCHCytosBiotechn.
667487CHNovartisAIntercell700511UKGSKDKSantaris
277
376451
518621
688
1.000
1.325
Value (€m)
US
UKCH
FUK
CH
NL/US
GER
Country
CH
UKGER
UKUK
UK
B
B
Country
851ShireRenovo710Sanofi
AventisOxford BioMedica
600NovartisMorphoSys515AstraZenecaArgenta
Discovery
380Biogen IdecNeurimmune
1.815B. IngelheimAblynx
1.370Janssen Pharmac.
Galapagos Genomics
943NovartisAntisoma
Value (US$m)PartnerCompany
M&A und Allianzen in Life Science - Aktuelle Entwicklungen und Trends Page 37
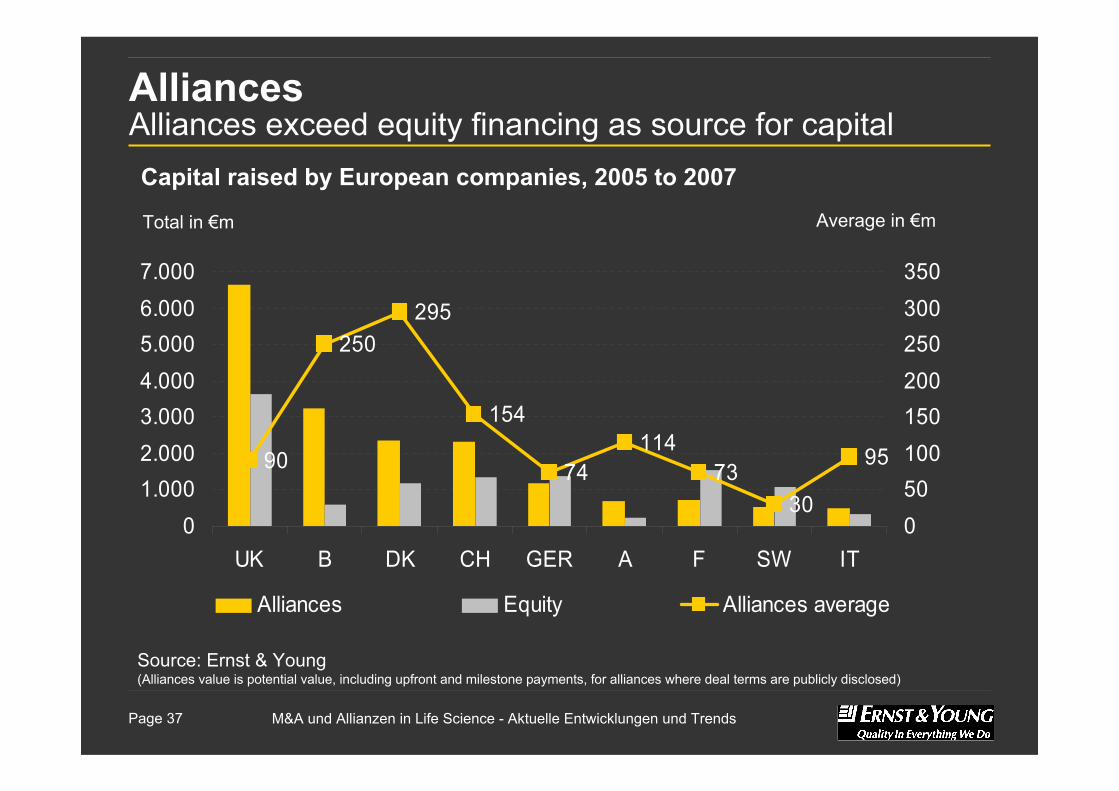
AlliancesAlliances exceed equity financing as source for capital
Source: Ernst & Young(Alliances value is potential value, including upfront and milestone payments, for alliances where deal terms are publicly disclosed)
90
250295
154
74114
7330
95
01.0002.0003.0004.0005.0006.0007.000
UK B DK CH GER A F SW IT050100150200250300350
Alliances Equity Alliances average
Total in €m Average in €m
Capital raised by European companies, 2005 to 2007
M&A und Allianzen in Life Science - Aktuelle Entwicklungen und Trends Page 38
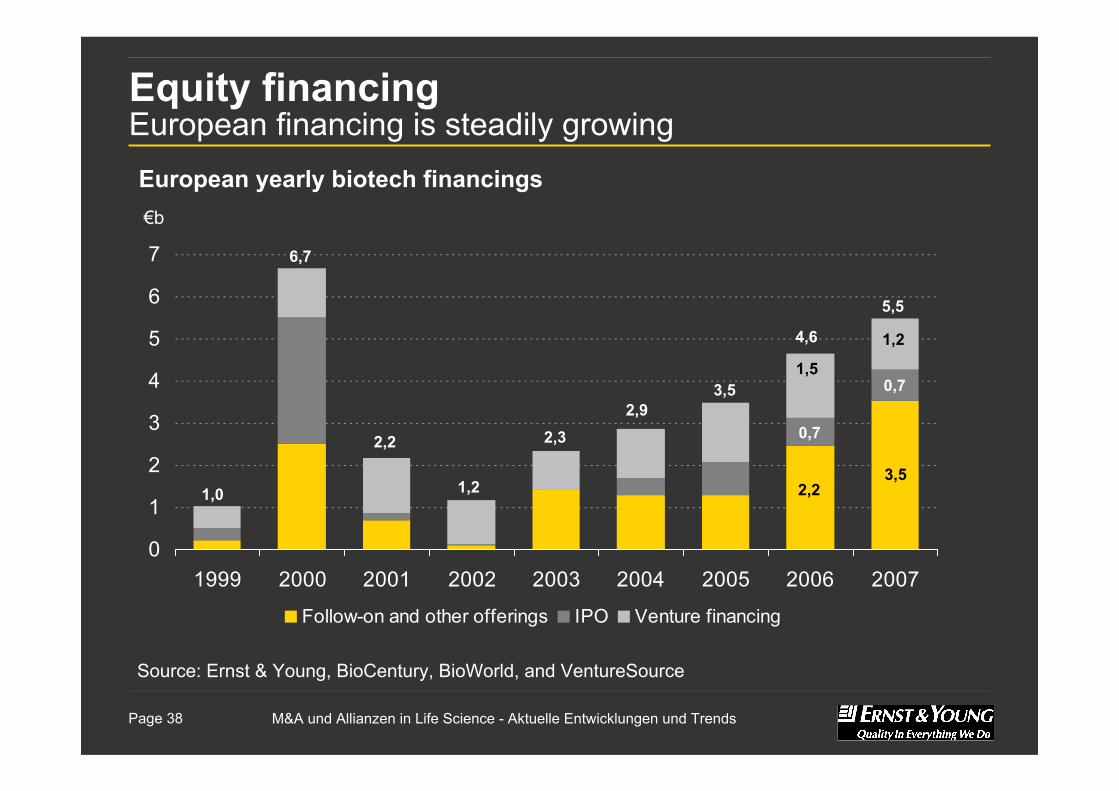
Equity financingEuropean financing is steadily growing
0
1
2
3
4
5
6
7
1999 2000 2001 2002 2003 2004 2005 2006 2007
Follow-on and other offerings IPO Venture financing
European yearly biotech financings€b
Source: Ernst & Young, BioCentury, BioWorld, and VentureSource
3,5
0,7
1,2
2,2
0,7
1,5
5,5
4,6
3,52,9
2,3
1,2
2,2
6,7
1,0
M&A und Allianzen in Life Science - Aktuelle Entwicklungen und Trends Page 39
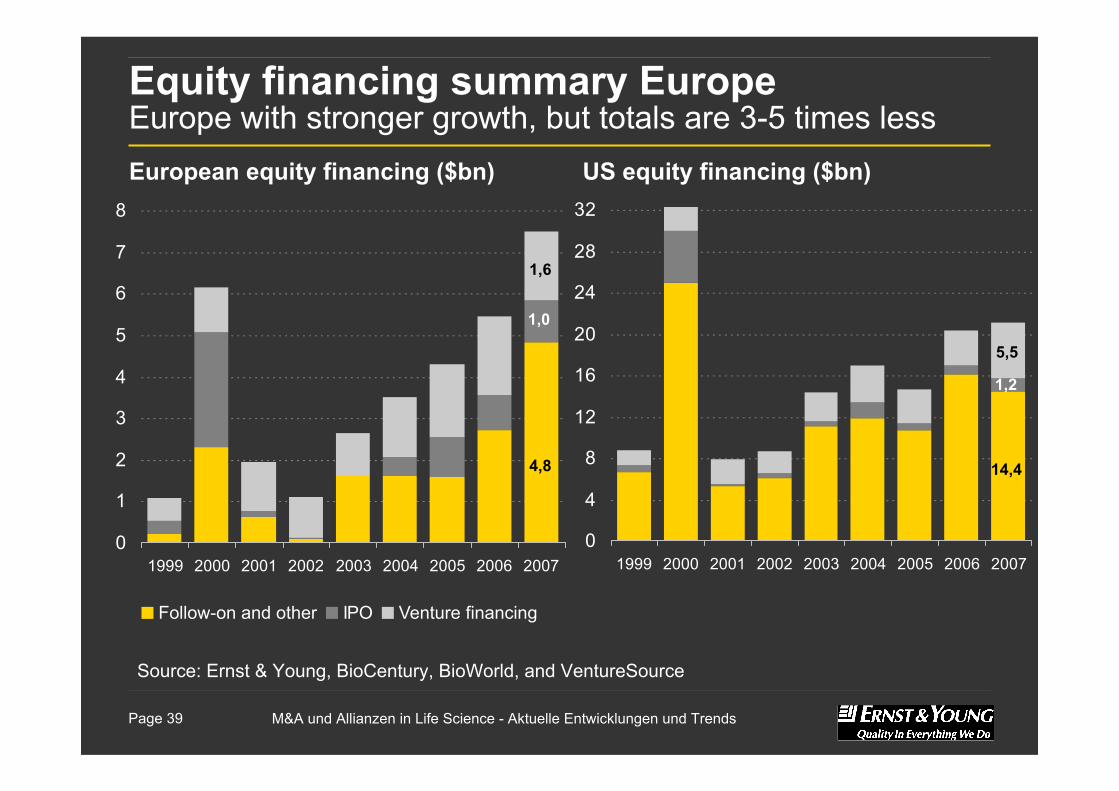
Equity financing summary Europe Europe with stronger growth, but totals are 3-5 times less
Source: Ernst & Young, BioCentury, BioWorld, and VentureSource
0
4
8
12
16
20
24
28
32
1999 2000 2001 2002 2003 2004 2005 2006 2007
14,4
5,5
1,2
0
1
2
3
4
5
6
7
8
1999 2000 2001 2002 2003 2004 2005 2006 2007
Follow-on and other IPO Venture financing
4,8
1,0
1,6
European equity financing ($bn) US equity financing ($bn)

M&A und Allianzen in Life Science - Aktuelle Entwicklungen und Trends Page 40
Outlook
M&A und Allianzen in Life Science - Aktuelle Entwicklungen und Trends Page 41
The business of drug development will fundamentally change
► Approaches to research and development► Business models► The value chain► Deal structures► Balance of power between biotech and big pharma► Partnerships between western companies and companies
in emerging markets
M&A und Allianzen in Life Science - Aktuelle Entwicklungen und Trends Page 42
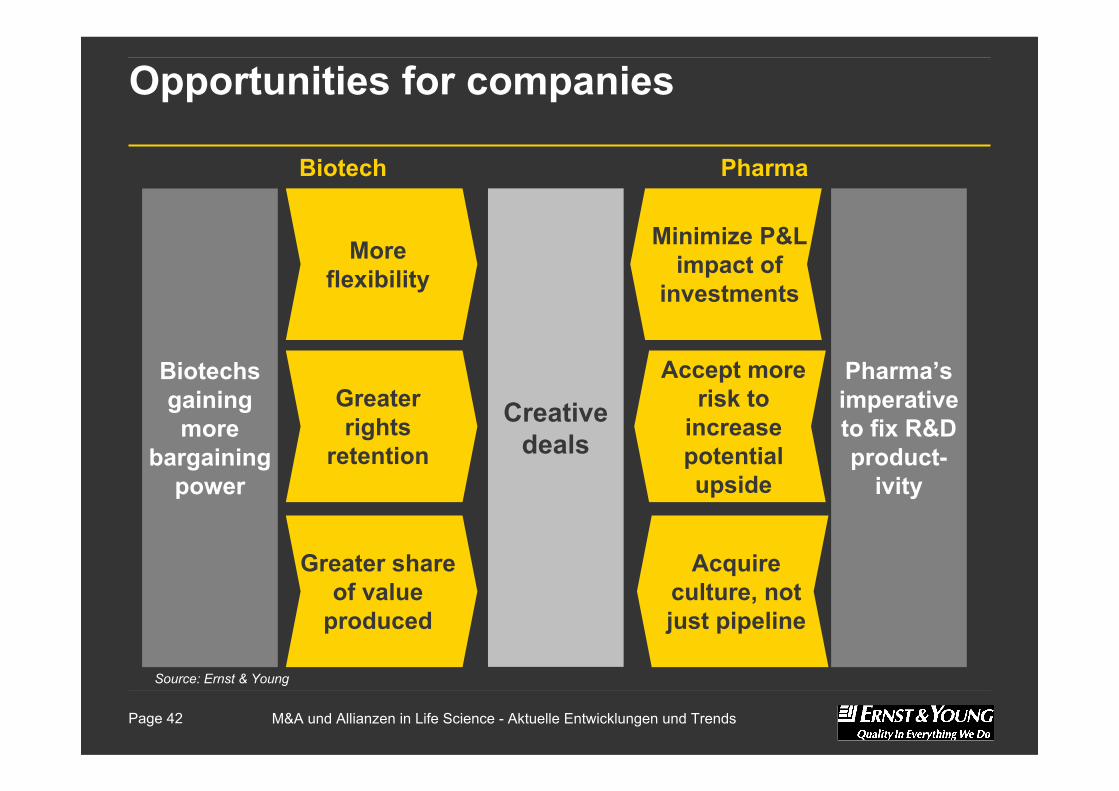
Opportunities for companies
Biotechsgaining more
bargaining power
More flexibility
Greater share of value
produced
Source: Ernst & Young
Pharma’simperative to fix R&D product-
ivity
Greater rights
retention
Minimize P&L impact of
investments
Creative deals
Accept more risk to
increase potential upside
Acquire culture, not just pipeline
Biotech Pharma
M&A und Allianzen in Life Science - Aktuelle Entwicklungen und Trends Page 43
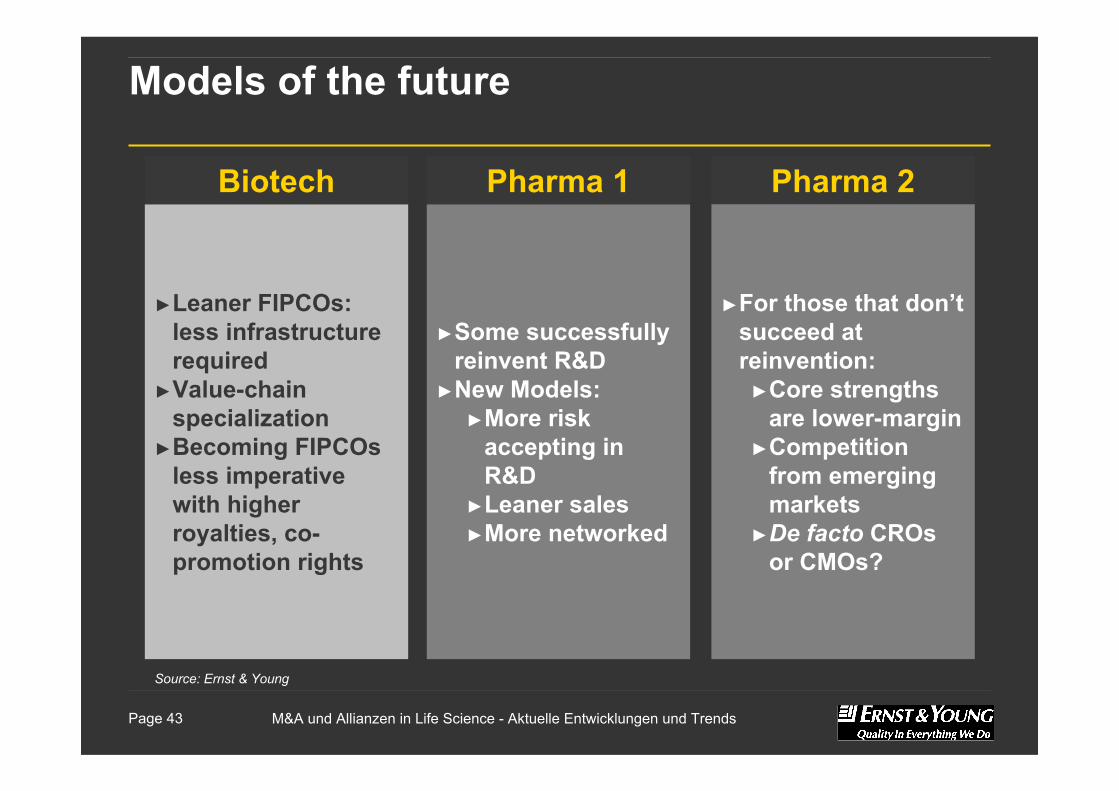
Models of the future
Source: Ernst & Young
►Leaner FIPCOs: less infrastructure required
►Value-chain specialization
►Becoming FIPCOsless imperative with higher royalties, co-promotion rights
Biotech
►Some successfully reinvent R&D
►New Models: ►More risk
accepting in R&D
►Leaner sales►More networked
Pharma 1 Pharma 2
►For those that don’t succeed at reinvention:►Core strengths
are lower-margin►Competition
from emerging markets
►De facto CROsor CMOs?
Thank you