Embed Size (px)
Citation preview

NARCCAP MeetingNARCCAP Meeting September 2009September 2009
Results from NCEP-driven RCMsResults from NCEP-driven RCMs
~ Overview ~~ Overview ~
William J. Gutowski, Jr. & Raymond W. ArrittWilliam J. Gutowski, Jr. & Raymond W. ArrittIowa State University Iowa State University
and and The NARCCAP TeamThe NARCCAP Team

NARCCAP MeetingNARCCAP Meeting September 2009September 2009
Simulations AnalyzedSimulations Analyzed
• DomainDomain
- Most of North America- Most of North America
• PeriodPeriod
- 1979-2004- 1979-2004
• Boundary ConditionsBoundary Conditions
- NCEP/DOE reanalysis- NCEP/DOE reanalysis
• ResolutionResolution
- 50 km- 50 km
MM5MM5Iowa Iowa
State/State/PNNLPNNL
RegCM3RegCM3UC Santa CruzUC Santa Cruz
ICTPICTP
CRCMCRCMQuebec,Quebec,OuranosOuranos
HADRM3HADRM3Hadley CentreHadley Centre
RSMRSMScrippsScripps
WRFWRFNCAR/NCAR/PNNLPNNL

NARCCAP MeetingNARCCAP Meeting September 2009September 2009
Part I: Interannual Variability
• Results shown for 1981-2002Results shown for 1981-2002
• Comparison with 0.5Comparison with 0.5oo gridded gridded precipitation analysis from the University precipitation analysis from the University of Delawareof Delaware

NARCCAP MeetingNARCCAP Meeting September 2009September 2009
Precipitation analysis for two regionsPrecipitation analysis for two regions
Coastal California Deep
South

NARCCAP MeetingNARCCAP Meeting September 2009September 2009
0
3
6
9
12
15
1981 1982 1983 1984 1985 1986 1987 1988 1989 1990 1991 1992 1993 1994 1995 1996 1997 1998 1999 2000 2001 2002
mm
/day
RCM3 MM5IECPC CRCMWRFP HRM3Observed (GPCC) Observed (UDEL)Observed (CRUT) Ensemble
1982-83 El Nino
1997-98 El Nino
multi-year drought
Monthly time series of precipitation in coastal California
small spread, high skillSubstantial annual cycle

NARCCAP MeetingNARCCAP Meeting September 2009September 2009
Correlation with Observed Precipitation - Coastal California
Model Correlation
HadRM3 0.857
RegCM3 0.916
MM5 0.925
RSM 0.945
CRCM 0.946
WRF 0.918
Ensemble 0.947
Ensemble mean has a higher correlation than any model
All models have high correlations with observed monthly time series of precipitation.

NARCCAP MeetingNARCCAP Meeting September 2009September 2009
Monthly Time Series - Deep South
Model Correlation
HadRM3 0.489
RegCM3 0.231
MM5 0.343
RSM 0.649
CRCM 0.649
WRF 0.513
Ensemble 0.640
Two models (RSM and CRCM) perform much better. These models inform the domain interior about the large scale.
0
3
6
9
12
15
1981 1982 1983 1984 1985 1986 1987 1988 1989 1990 1991 1992 1993 1994 1995 1996 1997 1998 1999 2000 2001 2002
mm
/da
y
RCM3 MM5I ECPCCRCM WRFP HRM3Observed (GPCC) Observed (UDEL) Observed (CRUT)Ensemble
Ensemble (black curve)

NARCCAP MeetingNARCCAP Meeting September 2009September 2009
Monthly Time Series - Deep South
Model Correlation
HadRM3 0.489
RegCM3 0.231
MM5 0.343
RSM 0.649
CRCM 0.649
WRF 0.513
Ensemble 0.640
RSM+CRCM 0.727
A “mini ensemble” of RSM and CRCM performs best in this region.
0
3
6
9
12
15
1981 1982 1983 1984 1985 1986 1987 1988 1989 1990 1991 1992 1993 1994 1995 1996 1997 1998 1999 2000 2001 2002
mm
/da
y
RCM3 MM5I ECPCCRCM WRFP HRM3Observed (GPCC) Observed (UDEL) Observed (CRUT)Ensemble
Ensemble (black curve)
NARCCAP MeetingNARCCAP Meeting September 2009September 2009
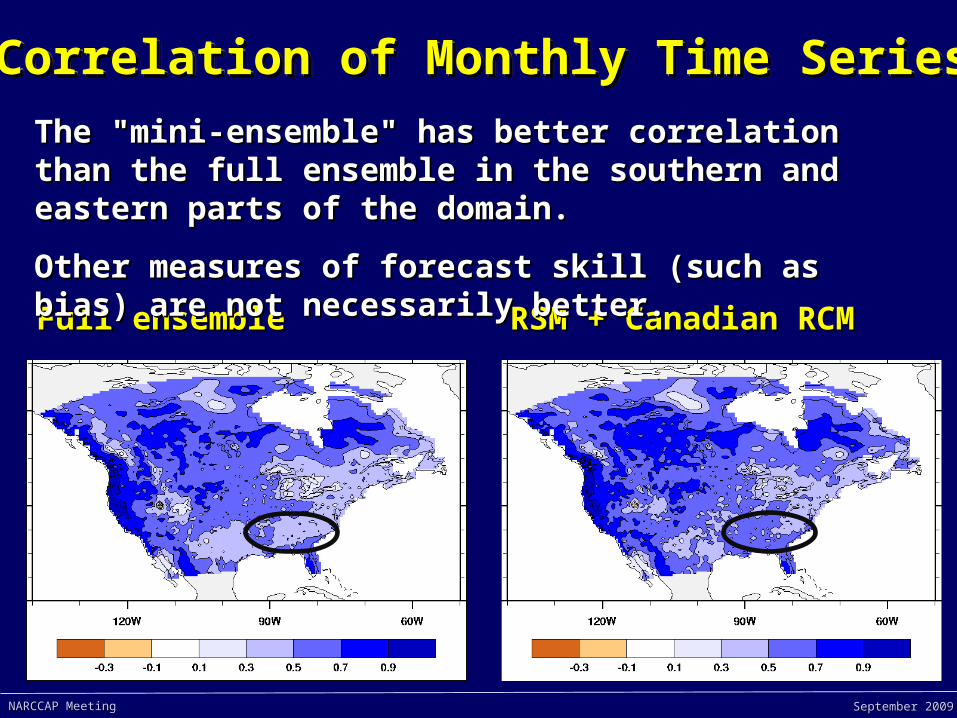
Full ensembleFull ensemble RSM + Canadian RCMRSM + Canadian RCM
The "mini-ensemble" has better correlation than the full The "mini-ensemble" has better correlation than the full ensemble in the southern and eastern parts of the domain.ensemble in the southern and eastern parts of the domain.
Other measures of forecast skill (such as bias) are not Other measures of forecast skill (such as bias) are not necessarily better.necessarily better.
Correlation of Monthly Time SeriesCorrelation of Monthly Time SeriesCorrelation of Monthly Time SeriesCorrelation of Monthly Time Series

NARCCAP MeetingNARCCAP Meeting September 2009September 2009
Ensemble error and spread (January)Ensemble error and spread (January)
BiasBias Ensemble spreadEnsemble spread
There are hints of a spread-skill relation but it is There are hints of a spread-skill relation but it is not consistent.not consistent.

NARCCAP MeetingNARCCAP Meeting September 2009September 2009
ensemble July minus Juneensemble July minus June observed July minus Juneobserved July minus June
The ensemble reproduces the dipole of June-The ensemble reproduces the dipole of June-July precipitation change, but the monsoon does July precipitation change, but the monsoon does not extend as far north as observed.not extend as far north as observed.

NARCCAP MeetingNARCCAP Meeting September 2009September 2009
Part 2: Extreme Monthly PrecipitationPart 2: Extreme Monthly Precipitation
• ObservationsObservations Precip: University of Washington VIC retrospective analysisPrecip: University of Washington VIC retrospective analysis
500 hPa Heights: North American Regional Reanalysis500 hPa Heights: North American Regional Reanalysis
• Comparison period: 1982 -1999Comparison period: 1982 -1999 1979-1981 omitted - spinup1979-1981 omitted - spinup UW data end in mid-2000UW data end in mid-2000
• AnalysisAnalysis Cold season (Oct-Mar)Cold season (Oct-Mar) 10 wettest months (top 10%)10 wettest months (top 10%)

NARCCAP MeetingNARCCAP Meeting September 2009September 2009
Regions AnalyzedRegions Analyzed
Boreal forest
Pacific coast
California coast
Deep South
Great LakesMaritimes
Upper Mississippi
River

NARCCAP MeetingNARCCAP Meeting September 2009September 2009
Frequency – Coastal CAFrequency – Coastal CA

NARCCAP MeetingNARCCAP Meeting September 2009September 2009
Ranked Precipitation – Coastal CARanked Precipitation – Coastal CA
Ensemble Ensemble average of average of top 10 top 10 = 9% smaller = 9% smaller than UWthan UW

NARCCAP MeetingNARCCAP Meeting September 2009September 2009
Interannual Variability – Coastal CAInterannual Variability – Coastal CA
59 of 60 (98%) 59 of 60 (98%) simulated simulated extremes occur extremes occur in cold seasons in cold seasons with an with an observed observed extreme.extreme.
(random (random chance: 27) chance: 27)

NARCCAP MeetingNARCCAP Meeting September 2009September 2009
Composite Composite 500 hPa Height 500 hPa Height Anomalies Anomalies
Top 10 ExtremesTop 10 Extremes
Coastal CACoastal CA

NARCCAP MeetingNARCCAP Meeting September 2009September 2009
Frequency – Deep SouthFrequency – Deep South

NARCCAP MeetingNARCCAP Meeting September 2009September 2009
Ranked Precipitation – Deep SouthRanked Precipitation – Deep South
Ensemble Ensemble average of average of top 10 top 10 = 22% smaller = 22% smaller than UWthan UW

NARCCAP MeetingNARCCAP Meeting September 2009September 2009
Interannual Variability – Deep SouthInterannual Variability – Deep South
27 of 60 (45%) 27 of 60 (45%) simulated simulated extremes occur extremes occur in cold seasons in cold seasons with an with an observed observed extreme.extreme.
(random (random chance: 27) chance: 27)

NARCCAP MeetingNARCCAP Meeting September 2009September 2009
500 hPa Height Anomalies – 500 hPa Height Anomalies – Deep South ExtremeDeep South Extreme
NARCCAP MeetingNARCCAP Meeting September 2009September 2009
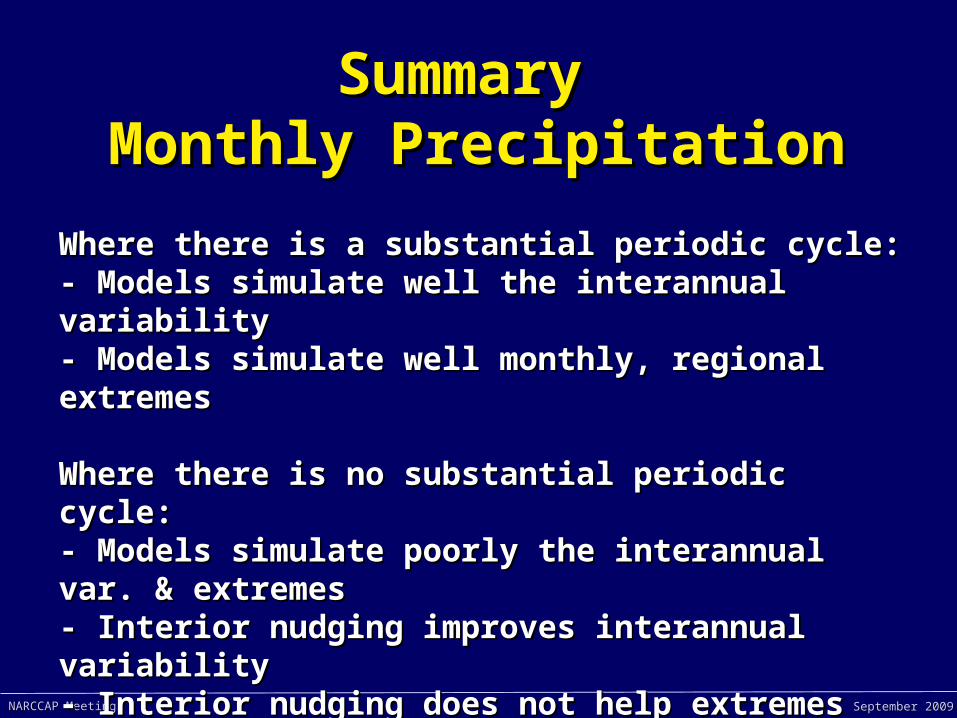
Summary Summary Monthly PrecipitationMonthly Precipitation
Where there is a substantial periodic cycle:Where there is a substantial periodic cycle:- Models simulate well the interannual variability- Models simulate well the interannual variability- Models simulate well monthly, regional extremes- Models simulate well monthly, regional extremes
Where there is no substantial periodic cycle:Where there is no substantial periodic cycle:- Models simulate poorly the interannual var. & - Models simulate poorly the interannual var. & extremesextremes- Interior nudging improves interannual variability- Interior nudging improves interannual variability- Interior nudging does not help extremes- Interior nudging does not help extremes

NARCCAP MeetingNARCCAP Meeting September 2009September 2009
Thank You!Thank You!
(www.narccap.ucar.edu)(www.narccap.ucar.edu)

NARCCAP MeetingNARCCAP Meeting September 2009September 2009
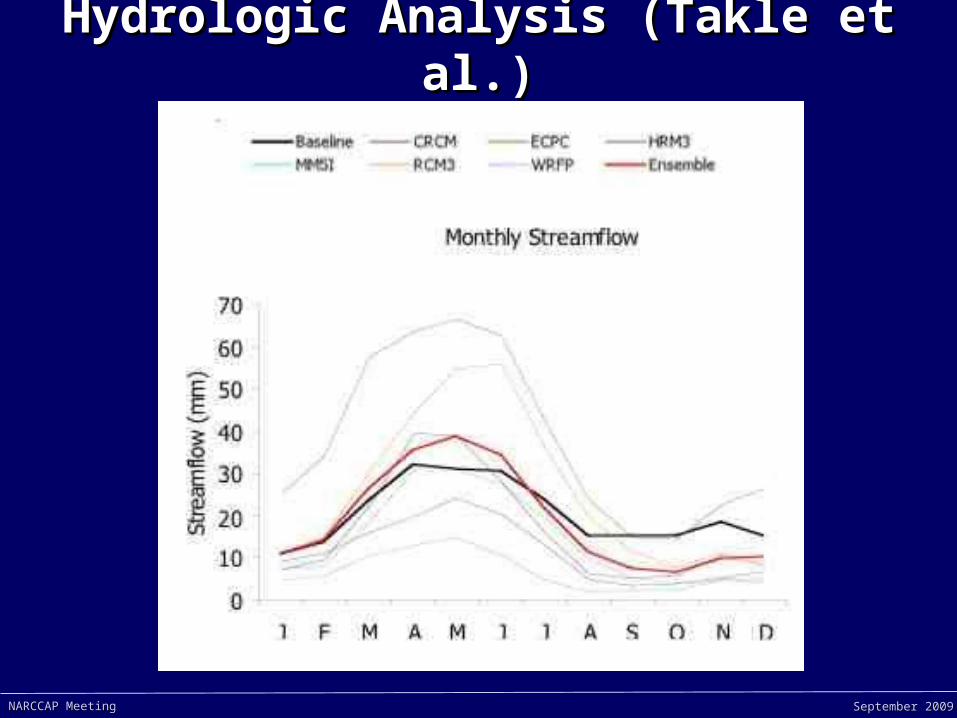
Hydrologic Analysis (Takle et al.)Hydrologic Analysis (Takle et al.)
SWAT model domainSimulation period: last 2 decades of 20C

NARCCAP MeetingNARCCAP Meeting September 2009September 2009
Hydrologic Analysis (Takle et al.)Hydrologic Analysis (Takle et al.)
Streamflow Interannual Variability

NARCCAP MeetingNARCCAP Meeting September 2009September 2009
Hydrologic Analysis (Takle et al.)Hydrologic Analysis (Takle et al.)
Precipitation Annual Cycle
NARCCAP MeetingNARCCAP Meeting September 2009September 2009
Hydrologic Analysis (Takle et al.)Hydrologic Analysis (Takle et al.)
Streamflow Annual Cycle

NARCCAP MeetingNARCCAP Meeting September 2009September 2009
Summary Summary MONTHLY PRECIPITATIONMONTHLY PRECIPITATIONWhere there is a substantial periodic cycle:Where there is a substantial periodic cycle:- Models simulate well the interannual variability- Models simulate well the interannual variability- Models simulate well monthly, regional extremes- Models simulate well monthly, regional extremes
Where there is no substantial periodic cycle:Where there is no substantial periodic cycle:- Models simulate poorly the interannual var. & - Models simulate poorly the interannual var. & extremesextremes- Interior nudging improves interannual variability- Interior nudging improves interannual variability-Interior nudging does not help extremesInterior nudging does not help extremes
UPPER MISSISSIPPI STREAMFLOWUPPER MISSISSIPPI STREAMFLOWEnsemble replicates well the interannual variabilityEnsemble replicates well the interannual variabilityAnnual cycle simulated less wellAnnual cycle simulated less well

NARCCAP MeetingNARCCAP Meeting September 2009September 2009
Thank You!Thank You!
(www.narccap.ucar.edu)(www.narccap.ucar.edu)

NARCCAP MeetingNARCCAP Meeting September 2009September 2009
Bias of the ensemble mean and correlation of Bias of the ensemble mean and correlation of ensemble monthly time series with observed time ensemble monthly time series with observed time
series.series.
Bias Correlation of monthly time series
NARCCAP MeetingNARCCAP Meeting September 2009September 2009
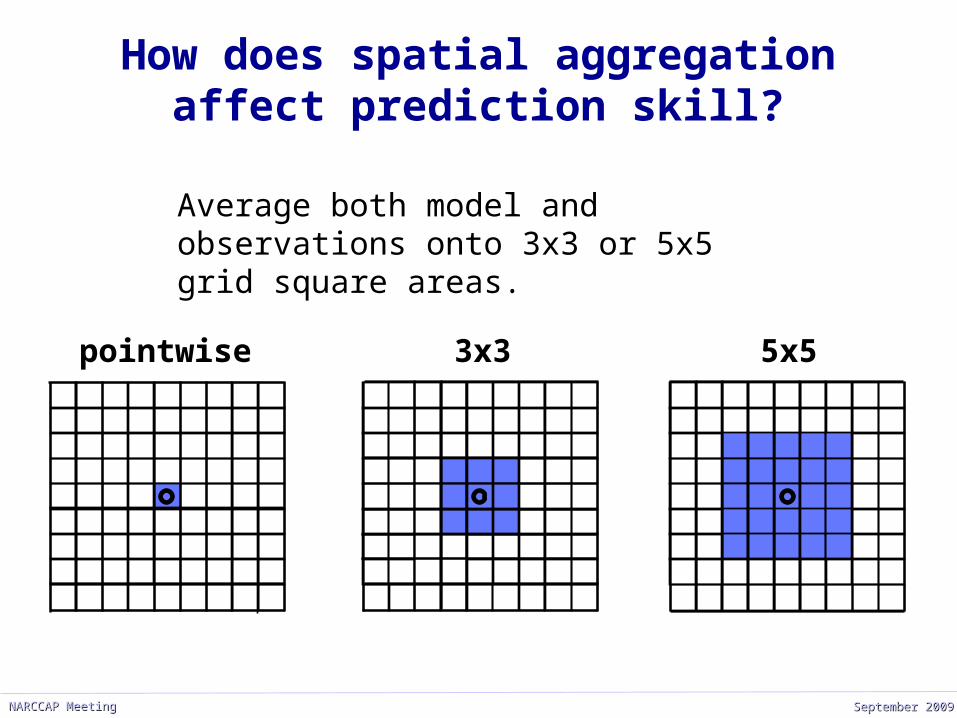
How does spatial aggregation affect prediction skill?
Average both model and observations onto 3x3 or 5x5 grid square areas.
pointwise 3x3 5x5

NARCCAP MeetingNARCCAP Meeting September 2009September 2009
Spatial aggregation tends to improve correlation, but
effect differs across the domain.Correlations, full yearpointwise
5x5 points
3x3 points
• Differs from model to model (MM5 shown here).
• Aggregation has more effect on individual models than on ensembles.
• Note improvement in central U.S. but not eastern U.S.

NARCCAP MeetingNARCCAP Meeting September 2009September 2009
Aggregation has a greater effect on correlation in a
model with spectral nudging.pointwise
5x5 points
3x3 points
• Canadian RCM shown here.
• Note improvement in eastern U.S.
• Hypothesis: Large scales are better represented in a model with spectral nudging, so smoothing out small-scale irregularities produces more improvement.

NARCCAP MeetingNARCCAP Meeting September 2009September 2009
Ensemble mean precipitation: JanuaryEnsemble mean precipitation: January

NARCCAP MeetingNARCCAP Meeting September 2009September 2009
Process oriented evaluation: the North Process oriented evaluation: the North American monsoonAmerican monsoon
North American monsoon

NARCCAP MeetingNARCCAP Meeting September 2009September 2009
Ensemble error and spread (July)Ensemble error and spread (July)
BiasBias Ensemble spreadEnsemble spread

NARCCAP MeetingNARCCAP Meeting September 2009September 2009
Analysis of ExtremesAnalysis of Extremes
Societal importance, esp. for climate changeSocietal importance, esp. for climate change
Key Question: Do climate models behave Key Question: Do climate models behave like observations?like observations?
Diagnosis of physical mechanismsDiagnosis of physical mechanisms• Necessary for model vs. obs. comparisonNecessary for model vs. obs. comparison• Basis for developing confidence in projectionsBasis for developing confidence in projections

NARCCAP MeetingNARCCAP Meeting September 2009September 2009
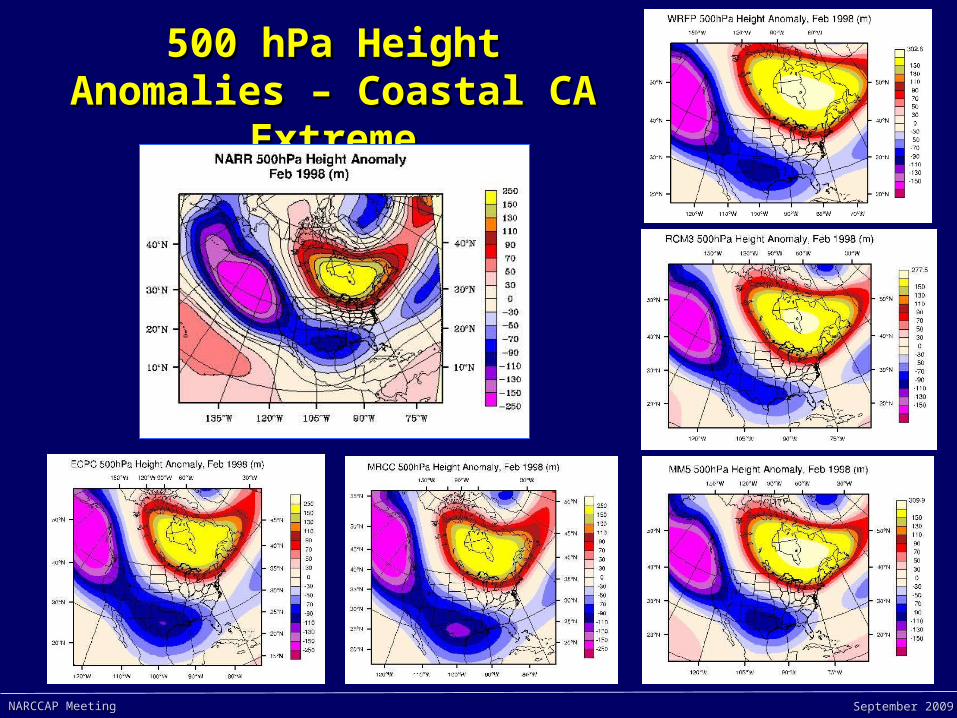
500 hPa Height Anomalies – Coastal CA Extreme500 hPa Height Anomalies – Coastal CA Extreme
NARCCAP MeetingNARCCAP Meeting September 2009September 2009
500 hPa Height Anomalies – 500 hPa Height Anomalies – Coastal CA ExtremeCoastal CA Extreme

NARCCAP MeetingNARCCAP Meeting September 2009September 2009
Frequency – Upper MSFrequency – Upper MS

NARCCAP MeetingNARCCAP Meeting September 2009September 2009
Ranked Precipitation – Upper MSRanked Precipitation – Upper MS
Ensemble Ensemble average of average of top 10 top 10 = 6% smaller = 6% smaller than UWthan UW

NARCCAP MeetingNARCCAP Meeting September 2009September 2009
Interannual Variability – Upper MSInterannual Variability – Upper MS46 of 60 (77%) 46 of 60 (77%) simulated simulated extremes occur extremes occur in cold seasons in cold seasons with an with an observed observed extreme.extreme.
(random (random chance: 33) chance: 33)

NARCCAP MeetingNARCCAP Meeting September 2009September 2009
500 hPa Height Anomalies – Upper MS Extreme500 hPa Height Anomalies – Upper MS Extreme

NARCCAP MeetingNARCCAP Meeting September 2009September 2009
500 hPa Height Anomalies – 500 hPa Height Anomalies – Upper MS ExtremeUpper MS Extreme

NARCCAP MeetingNARCCAP Meeting September 2009September 2009
Composite Composite 500 hPa Height 500 hPa Height Anomalies Anomalies
Top 10 ExtremesTop 10 Extremes
Upper MSUpper MS

NARCCAP MeetingNARCCAP Meeting September 2009September 2009
500 hPa Height Anomalies – Deep South Extreme500 hPa Height Anomalies – Deep South Extreme

NARCCAP MeetingNARCCAP Meeting September 2009September 2009
Correlation: Correlation: Monthly Observations and Ensemble MeanMonthly Observations and Ensemble Mean