Embed Size (px)
Citation preview
57
Patterns of composition, richness and phylogenetic diversity of woody plant communities of Quillaja saponaria Molina (Quillajaceae) in the Chilean sclerophyllous forest
Patrones de composición, riqueza y diversidad filogenética de las comunidades de plantas leñosas de Quillaja saponaria Molina (Quillajaceae) en el bosque esclerófilo de Chile
LUIS LETELIER1,2*, ALY VALDERRAMA2, ALEXANDRA STOLL3, ROLANDO GARCÍA-GONZÁLES4 & ANTONIO GONZÁLEZ-RODRÍGUEZ1
1Instituto de Investigaciones en Ecosistemas y Sustentabilidad, Universidad Nacional Autónoma de México, Antigua Carretera a Pátzcuaro Nº 8701, Col. Ex -Hacienda de San José de la Huerta, Morelia, CP 58190, México.2Universidad Bernardo O`Higgins, Centro de Investigación en Recursos Naturales y Sustentabilidad, Avenida Viel 1497, Santiago, Chile.3Centro de Estudios Avanzados en Zonas Áridas, Campus Andrés Bello, Universidad de La Serena, La Serena, Chile.4Facultad de Ciencias Agrarias y Forestales, Universidad Católica del Maule, Avenida San Miguel Nº 3605, Casilla 617, Talca, Chile.*[email protected]
ABSTRACT
Sclerophyllous forest is among the most representative types of woody plant communities in central Chile where Quillaja saponaria is considered to be one of the most important species. In this study, we analysed the main factors that explain the geographical patterns of variation in composition, richness and phylogenetic diversity of woody plant communities in the Chilean sclerophyllous forest where Quillaja saponaria is present. Vegetation surveys were performed for trees and shrubs in thirty-nine sites from 30° to 38° of latitude South in the Mediterranean biome of Chile. Composition, richness, alfa diversity and phylogenetic diversity metrics of the communities were calculated and associated with spatial (latitude, longitude and altitude), climate (annual mean temperature, annual precipitation, aridity), and disturbance variables (type of adjacent vegetation matrix) using multiple regression models. Sixty taxa were identified, distributed in 29 families, including 23 trees and 37 shrubs. A significant effect of the type of adjacent vegetation matrix (i.e. agricultural land, commercial forestry plantation or natural forest) on diversity and composition of the sampled communities was found. Significant effects of latitude on diversity, and altitude, latitude and annual mean temperature on composition were also found. Metrics of phylogenetic diversity and structure were only associated with altitude and latitude. In conclusion, diversity, composition and phylogenetic structure patterns of sclerophyllous forest communities are associated with spatial and climate variables, and anthropogenic disturbance has also caused important changes in these communities.
KEYWORDS: Diversity, forest fragmentation, Mediterranean flora, phylogenetic diversity, vegetation matrix.
RESUMEN
El Bosque Esclerófilo es uno de los tipos más representativos de las comunidades de plantas leñosas en el centro de Chile, donde Quillaja saponaria es considerada una de las especies más importantes. En este trabajo se analizaron los principales factores que explican la distribución geográfica de la variación en la composición, riqueza y diversidad filogenética de las comunidades de plantas leñosas del Bosque Esclerófilo de Chile, donde Q. saponaria está presente. Se llevaron a cabo censos de vegetación de árboles y arbustos en treinta y nueve sitios desde los 30° a los 38° de latitud sur en el bioma mediterráneo de Chile. Se calcularon la composición, riqueza, diversidad alfa y la diversidad filogenética de las comunidades y se asociaron con variables espaciales (latitud, longitud y altitud), climáticas (temperatura media anual, precipitación anual, aridez), y variables de perturbación (tipo de matriz de la vegetación adyacente) usando modelos de regresión múltiple. Se identificaron sesenta taxones, distribuidos en 29 familias, incluyendo 23 árboles y 37 arbustos. Se encontró un efecto significativo del tipo de matriz de vegetación adyacente (es decir, tierras agrícolas, plantaciones forestales comerciales o bosques naturales) en la diversidad y composición de las comunidades estudiadas. También se
ISSN 0016-5301Gayana Bot. 74(1): 57-72, 2017Original Article
58
Gayana Bot. 74(1), 2017
encontraron efectos significativos de la latitud sobre la diversidad; y de la altitud, latitud y temperatura media anual sobre la composición de las comunidades, la diversidad filogenética sólo se asoció con la altitud y la latitud. En conclusión, la diversidad, composición y patrones de estructura filogenética se asocian con variables espaciales y climáticas; y las perturbaciones antropogénicas también han provocado cambios importantes en estas comunidades.
PALABRAS CLAVE: Diversidad, fragmentación del bosque, flora mediterránea, diversidad filogenética, matriz vegetacional.
INTRODUCTION
Mediterranean biomes occur between approximately 30° to 40° of North and South latitude on the west sides of continents (Archibold 1995) and are known for their outstanding biodiversity and high level of endemism (Lavorel et al. 1998, Tang 2006). Worldwide, the total area covered by Mediterranean vegetation is 1,996,300 km2 (Keeley et al. 2012), divided into five floristic biome subtypes: 1) Mediterranean basin (Europe), 2) Californian (USA), 3) Chilean (Chile), 4) Capensic (South Africa) and 5) Australian (Australia) (Archibold 1995). The Chilean subtype ranks third in area, with 111,725 km2, being surpassed by the Mediterranean and Australian regions (Keeley et al. 2012). These five areas account for less than 5% of the surface of the Earth, but the richness of vascular plant species in these communities represents about 20% of known species (Cowling et al. 1996).
Due to their high biological diversity, Mediterranean ecosystems have been recognized as biodiversity hotspots and a prime target for conservation efforts (Matesanz & Valladares 2014, Squeo et al. 2012). These communities are not only exposed to a changing climate (Matesanz & Valladares 2014), but also have been profoundly transformed by human activities for centuries or millenia in the case of the European region. However, many of the traditional management practices of Mediterranean environments are also changing in the present time, resulting in increased disturbance (Arroyo et al. 1999, Briones et al. 2013, Mittermeier et al. 1998, Myers et al. 2000).
It is widely acknowledged that besides habitat loss per se, fragmentation is also a major threat for natural communities. Fragmentation has an effect on the composition and structure of the forest, and contributes to the degradation and loss of biodiversity (Harper et al. 2005). The edge effect, caused by fragmentation, creates gradients in abiotic variables such as sunlight, wind and moisture from the edge to the interior of the fragments, and also facilitates the establishment of invasive species, with important consequences for the richness, composition and structure of the remaining natural communities (Harper et al. 2005).
Recently, the incorporation of phylogenetic information into the analysis of community structure and composition has provided a new understanding of the processes that underlie species assemblages and their dynamics (Buerki et
al. 2015, Cavender-Bares et al. 2009). Increasing evidence shows the importance of incorporating the evolutionary history of the species in the analysis of conservation strategies, particularly given that the likelihood of extinction is not random, and that the phylogenetic diversity is lost at higher rates than species diversity (Buerki et al. 2015). Importantly, different patterns of phylogenetic diversity are expected depending on whether environmental filtering or biotic interactions (i.e. competition) predominate as processes shaping a particular community (Cavender-Bares et al. 2009). Several studies have now used this approach to evaluate how the phylogenetic structure of different plant and animal communities vary along altitudinal and latitudinal gradients (Hoiss et al. 2012, Machac et al. 2011, Qian et al. 2013) and also the effect of forest fragmentation on the phylogenetic diversity in tree communities (e.g. Arroyo-Rodríguez et al. 2012).
In the Mediterranean biome of Chile, the sclerophyllous forest is one of the most representative types of woody plant communities in the biodiversity hotspot called the Chilean Winter Rainfall-Valdivian Forest (Arroyo et al. 1999, Briones et al. 2013, Mittermeier et al. 1998, Myers et al. 2000). In these woody communities, Quillaja saponaria is considered one of the most important, abundant and representative species and therefore can be considered as a foundation species; i.e. a species that has a strong role in structuring the community (Gajardo 1994). The species also has a high economic importance since it is not only a source of timber (García & Ormazabal 2008), but it is also melliferous (Díaz-Forestier et al. 2009, Montenegro et al. 2009a, Montenegro et al. 2008, Montenegro et al. 2003, Montenegro et al. 2009b). Furthermore, the bark yields saponins (San Martín & Briones 1999), and medicinal coadjuvants (Kensil et al. 1991, San Martín & Briones 1999). Other abundant species in these forests are Acacia caven, Prosopis chilensis, Cryptocarya alba, Lithrea caustica, Maytenus boaria, Peumus boldus, Schinus areira, Kageneckia oblonga, Beilschmiedia berteroana, B. miersii and Crinodendron patagua (Hechenleitner et al. 2005).
Unfortunately, the Chilean Winter Rainfall-Valdivian Forest hotspot has experienced a strong decline of natural forest areas. In particular, sclerophyllous forest communities have been under strong pressure from changes in land use, either to forestry plantations, agriculture, and urbanization (Arroyo et al. 1999, Hechenleitner et al. 2005, Squeo et al.
59
Composition of communities of Quillaja saponaria: LETELIER, L. et al.
2010) and the remaining forest is estimated to cover less than 40% of its original area (Hechenleitner et al. 2005). For this reason, this area is considered a priority for conservation (Arroyo et al. 1999, Briones et al. 2013, Mittermeier et al. 1998, Myers et al. 2000). In addition, the effects of climate change are expected to produce a further decrease in cover area of the sclerophyllous forest in central Chile, together with a southwards displacement of about 350 km by year 2100 (Bambach et al. 2013).
The aim of the present work was to characterise and explain the geographical patterns of composition, richness, phylogenetic diversity, and similarity of woody plant communities of the Chilean sclerophyllous forest, based on sites with presence of Quillaja saponaria, in terms of spatial, climate and disturbance variables. In particular, we hypothesized that habitat fragmentation, and particularly the type of the adjacent plant matrix surrounding the sampled sites, would have an effect on the diversity and composition of the communities, with an agricultural matrix being associated with lower diversity than that found in communities where the matrix is native forest.
MATERIALS AND METHODS
SPECIES AND STUDY AREA
Sclerophyllous forest communities in Chile occur from the Coquimbo Region in the north to the O’Higgins Region in the south (Hechenleitner et al. 2005), although Gajardo (1994) and Moreira-Muñoz (2011) extended the range further south into the central valley of the Maule and Bío-Bío Regions. According to the second classification, the distribution of sclerophyllous communities coincides entirely with the range of Q. saponaria. The climate type in which these communities develop is Mediterranean with a dry summer season, changing to arid in the north, and to humid and sub-humid in the south (Di Castri & Hajek 1976); the annual mean precipitation varies from 50 mm in the north to 500 mm in the south (Moreira-Muñoz 2011), although in the Andes range southwards from Santiago it may reach 1000 mm. The rain is brought by frontal systems which originate in the Pacific Ocean and enter the continent from the South-West. The Coastal Range (with North-South orientation) acts as a barrier to the cloud masses and as a result the sites to the West of the range present a lower aridity index than those immediately to the East (Di Castri & Hajek 1976).
Quillaja saponaria, commonly named Quillay, is an endemic Chilean tree found from the Coquimbo Region to the Bío-Bío Region (Arauco Province), approximately between 31° and 38° south (García & Ormazábal 2008, Prehn et al. 2003). It grows from sea level to 1600 m a.s.l., preferably in dry areas which are poor in nutrients. The study area covered the whole distribution of Q. saponaria.
FIELD SURVEYS
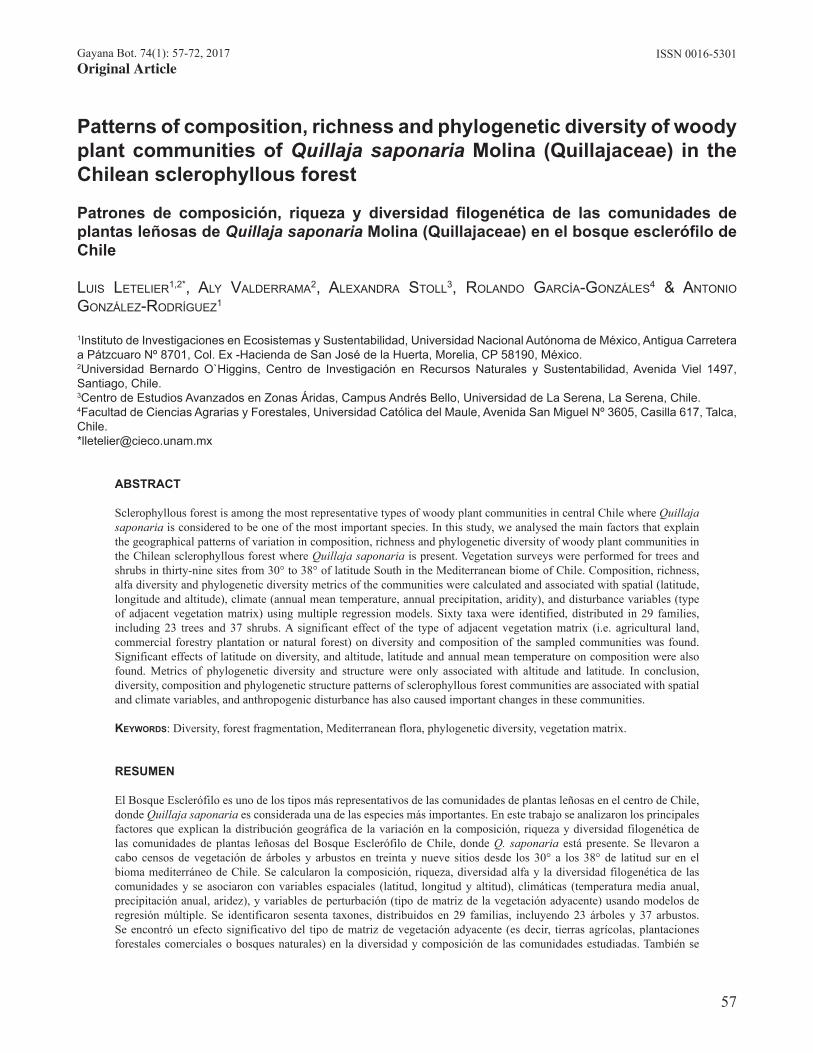
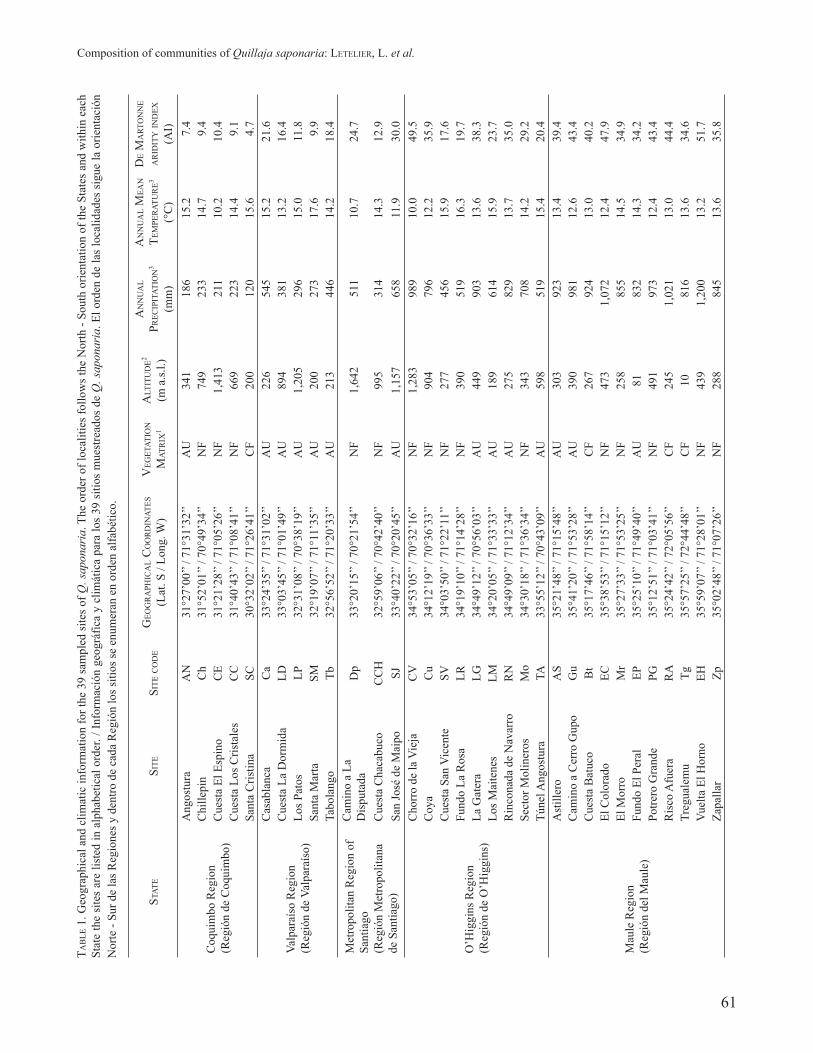
We visited 39 sites where Q. saponaria grows naturally, within the range of the species (Fig. 1, Table 1), in four field campaigns between August 2011 and April 2012. In each of the 39 sites visited, three sampling transects were established, each 400 m long. In each transect five plots were established, one every 85 m, giving a total of 15 sampling units per site. The plots were rectangular (20 × 5 m; 100 m2). In each plot all the woody species were recorded, including arborescent cacti. The abundance of each species was expressed as a percentage of the sampled area (Mueller-Dombois & Ellenberg 1974). The specific names followed the nomenclature proposed by Zuloaga et al. (2008), and in a few cases the nomenclature of Marticorena & Quezada (1985). In every case, the record included the botanical family, the chorological characterisation as an endemic species (geographical range restricted to Chile), element of the flora of the southern cone (native) and/or cosmopolitan species (adventitious), and the life form (tree or shrub).
PATTERNS OF RICHNESS AND DIVERSITY
The richness of species (number of species) was determined for each site, and the alpha diversity was calculated using the Shannon-Wiener index (H´) and the Simpson’s index (D) – the former attributes greater weight to rare species whereas in the latter rare species have little influence (Felfili & Felfili 2001). It is important to consider that these two indices are not collinear.
A Principal Coordinates Analysis (PCoA, Podani & Miklós 2002) was done to determine the similarity patterns between the species composition and abundance of the sites, using the Bray-Curtis similarity index (Podani & Miklós 2002). For this purpose, the sites were grouped according to the vegetation matrix adjacent to each sampling locality, with three types of matrix being defined: 1) native forest, when the sampled community was surrounded by a natural forest or matorral community; 2) commercial forestry plantations, when the community was surrounded by a commercial forestry matrix, principally plantations of Pinus radiata; and 3) agricultural use when the community was surrounded by farm crops. These analyses were done using the PAST 3.x software (Hammer et al. 2001).
To assess if the richness and diversity of the communities is influenced by climatic variables, the values of annual mean temperature and annual precipitation were obtained from Worldclim (Hijmans et al. 2005, Available: http://www.worldclim.org/) for each locality visited. Additionally, the De Martonne aridity index was calculated (sensu Mercado-Mancera et al. 2010, Wang & Takahashi 1999) for each site. This aridity index (AI) relates annual or monthly precipitation, as appropriate, with the average annual or monthly temperature. The value obtained allows classifying the plant community or site under study as desert, grassland or forest, depending on the degree of aridity (Wang &

60
Gayana Bot. 74(1), 2017
Takahashi 1999). The index was obtained as follows:
(Wang & Takahashi 1999)
Where P is the annual precipitation in millimetres and T the average annual temperature in Celsius degrees.
To detect spatial patterns in the variation of the number of species, alpha diversity, and composition of the communities (as summarized by coordinate axes 1 and 2 of the PCoA), multiple regression analyses (stepwise) of these variables were done with the spatial and climate variables of the sites. The variables included as predictors were latitude, longitude, the De Martonne aridity index, altitude, type of forestry matrix, annual mean temperature and annual precipitation. The parameters used for the analysis were: Probability to enter = 0.250, Probability to leave = 0.100, Direction = Forward, Rules = Combine. Subsequently, the variables identified as significant, were incorporated to a multiple regression model. These analyses were done with
the JMP 8.0 SAS Institute Inc., Cary, NC, 1989-2007.
ANALYSIS OF PHYLOGENETIC DIVERSITY
For each site visited, we calculated four abundance-based phylogenetic metrics (Vamosi et al. 2009, Webb et al. 2008, Webb et al. 2002): 1) mean phylogenetic distance (MPD), 2) mean nearest taxon phylogenetic distance (MNTD), 3) net related index (NRI) and 4) nearest taxon index (NTI). MPD and MNTD measure the average phylogenetic distance among pairs of individuals drawn at random from a sample, where MPD includes conspecifics and MNTD considers the closest non-conspecific relative (Vamosi et al. 2009; Webb et al. 2008). NRI is a calculation of the effect size of MPD relative to a null model and indicates whether taxa in a sample are more phylogenetically clustered (positive NRI) or even (negative NRI) than expected at random; NTI quantifies the extent of terminal clustering, that is, intrafamilial clustering (positive NTI also indicates phylogenetic clustering, while negative values represent phylogenetic uniformity).
AI= PT+10
FIGURE 1: Location of the sampled sites. Different symbols indicate the type of vegetation matrix adjacent to each site. The name codes are listed in Table 1. / Localización de los sitios muestreados. Diferentes símbolos indican el tipo de matriz de la vegetación adyacente a cada sitio. Los códigos de nombres se enumeran en la Tabla 1.
61
Composition of communities of Quillaja saponaria: LETELIER, L. et al.
TAB
LE 1
. Geo
grap
hica
l and
clim
atic
info
rmat
ion
for t
he 3
9 sa
mpl
ed si
tes o
f Q. s
apon
aria
. The
ord
er o
f loc
aliti
es fo
llow
s the
Nor
th -
Sout
h or
ient
atio
n of
the
Stat
es a
nd w
ithin
eac
h St
ate
the
site
s ar
e lis
ted
in a
lpha
betic
al o
rder
. / In
form
ació
n ge
ográ
fica
y cl
imát
ica
para
los
39 s
itios
mue
stre
ados
de
Q. s
apon
aria
. El o
rden
de
las
loca
lidad
es s
igue
la o
rient
ació
n N
orte
- Su
r de
las R
egio
nes y
den
tro d
e ca
da R
egió
n lo
s siti
os se
enu
mer
an e
n or
den
alfa
bétic
o.
STAT
ESI
TESI
TE C
OD
EG
EOG
RA
PHIC
AL
CO
OR
DIN
ATES
(Lat
. S /
Long
. W)
VEG
ETAT
ION
M
ATR
IX1
ALT
ITU
DE2
(m a
.s.l.)
AN
NU
AL
PREC
IPIT
ATIO
N3
(mm
)
AN
NU
AL
MEA
N
TEM
PER
ATU
RE3
(°C
)
DE
MA
RTO
NN
E A
RID
ITY
IND
EX
(AI)
Coq
uim
bo R
egio
n(R
egió
n de
Coq
uim
bo)
Ang
ostu
raA
N31
°27’
00’’
/ 71°
31’3
2’’
AU
341
186
15.2
7.4
Chi
llepi
nC
h31
°52’
01’’
/ 70°
49’3
4’’
NF
749
233
14.7
9.4
Cue
sta
El E
spin
oC
E31
°21’
28’’
/ 71°
05’2
6’’
NF
1,41
321
110
.210
.4C
uest
a Lo
s Cris
tale
sC
C31
°40’
43’’
/ 71°
08’4
1’’
NF
669
223
14.4
9.1
Sant
a C
ristin
aSC
30°3
2’02
’’ / 7
1°26
’41’
’C
F20
012
015
.64.
7
Valp
araí
so R
egio
n(R
egió
n de
Val
para
íso)
Cas
abla
nca
Ca
33°2
4’35
’’ / 7
1°31
’02’
’A
U22
654
515
.221
.6C
uest
a La
Dor
mid
aLD
33°0
3’45
’’ / 7
1°01
’49’
’A
U89
438
113
.216
.4Lo
s Pat
osLP
32°3
1’08
’’ / 7
0°38
’19’
’A
U1,
205
296
15.0
11.8
Sant
a M
arta
SM32
°19’
07’’
/ 71°
11’3
5’’
AU
200
273
17.6
9.9
Tabo
lang
oTb
32°5
6’52
’’ / 7
1°20
’33’
’A
U21
344
614
.218
.4
Met
ropo
litan
Reg
ion
of
Sant
iago
(Reg
ión
Met
ropo
litan
a de
San
tiago
)
Cam
ino
a La
D
ispu
tada
Dp
33°2
0’15
’’ / 7
0°21
’54’
’N
F1,
642
511
10.7
24.7
Cue
sta
Cha
cabu
coC
CH
32°5
9’06
’’ / 7
0°42
’40’
’N
F99
531
414
.312
.9Sa
n Jo
sé d
e M
aipo
SJ33
°40’
22’’
/ 70°
20’4
5’’
AU
1,15
765
811
.930
.0
O’H
iggi
ns R
egio
n(R
egió
n de
O’H
iggi
ns)
Cho
rro
de la
Vie
jaC
V34
°53’
05’’
/ 70°
32’1
6’’
NF
1,28
398
910
.049
.5C
oya
Cu
34°1
2’19
’’ / 7
0°36
’33’
’N
F90
479
612
.235
.9C
uest
a Sa
n V
icen
teSV
34°0
3’50
’’ / 7
1°22
’11’
’N
F27
745
615
.917
.6Fu
ndo
La R
osa
LR34
°19’
10’’
/ 71°
14’2
8’’
NF
390
519
16.3
19.7
La G
ater
aLG
34°4
9’12
’’ / 7
0°56
’03’
’A
U44
990
313
.638
.3Lo
s Mai
tene
sLM
34°2
0’05
’’ / 7
1°33
’33’
’A
U18
961
415
.923
.7R
inco
nada
de
Nav
arro
RN
34°4
9’09
’’ / 7
1°12
’34’
’A
U27
582
913
.735
.0Se
ctor
Mol
iner
osM
o34
°30’
18’’
/ 71°
36’3
4’’
NF
343
708
14.2
29.2
Túne
l Ang
ostu
raTA
33°5
5’12
’’ / 7
0°43
’09’
’A
U59
851
915
.420
.4
Mau
le R
egio
n(R
egió
n de
l Mau
le)
Ast
iller
oA
S35
°21’
48’’
/ 71°
15’4
8’’
AU
303
923
13.4
39.4
Cam
ino
a C
erro
Gup
oG
u35
°41’
20’’
/ 71°
53’2
8’’
AU
390
981
12.6
43.4
Cue
sta
Bat
uco
Bt
35°1
7’46
’’ / 7
1°58
’14’
’C
F26
792
413
.040
.2El
Col
orad
oEC
35°3
8’53
’’ / 7
1°15
’12’
’N
F47
31,
072
12.4
47.9
El M
orro
Mr
35°2
7’33
’’ / 7
1°53
’25’
’N
F25
885
514
.534
.9Fu
ndo
El P
eral
EP35
°25’
10’’
/ 71°
49’4
0’’
AU
8183
214
.334
.2Po
trero
Gra
nde
PG35
°12’
51’’
/ 71°
03’4
1’’
NF
491
973
12.4
43.4
Ris
co A
fuer
aR
A35
°24’
42’’
/ 72°
05’5
6’’
CF
245
1,02
113
.044
.4Tr
egua
lem
uTg
35°5
7’25
’’ / 7
2°44
’48’
’C
F10
816
13.6
34.6
Vue
lta E
l Hor
noEH
35°5
9’07
’’ / 7
1°28
’01’
’N
F43
91,
200
13.2
51.7
Zapa
llar
Zp35
°02’
48’’
/ 71°
07’2
6’’
NF
288
845
13.6
35.8

62
Gayana Bot. 74(1), 2017
STAT
ESI
TESI
TE C
OD
EG
EOG
RA
PHIC
AL
CO
OR
DIN
ATES
(Lat
. S /
Long
. W)
VEG
ETAT
ION
M
ATR
IX1
ALT
ITU
DE2
(m a
.s.l.)
AN
NU
AL
PREC
IPIT
ATIO
N3
(mm
)
AN
NU
AL
MEA
N
TEM
PER
ATU
RE3
(°C
)
DE
MA
RTO
NN
E A
RID
ITY
IND
EX
(AI)
Bío
-Bío
Reg
ion
(Reg
ión
del B
ío-B
ío)
Cue
sta
Tom
eco
CT
36°5
8’29
’’ / 7
2°39
’18’
’A
U20
51,
301
12.4
58.1
La In
vern
ada
LI36
°52’
11’’
/ 71°
37’2
0’’
NF
808
1,37
19.
769
.6Sa
n Fa
bián
de A
lico
FA36
°30’
52’’
/ 71°
37’3
7’’
CF
450
1,35
211
.961
.7Sa
nta
Bár
bara
SB37
°36’
37’’
/ 72°
07’4
2’’
AU
200
1,35
712
.859
.5Tr
ehua
coTr
36°2
3’56
’’ / 7
2°38
’44’
’C
F14
31,
070
13.5
45.5
Vill
a M
erce
des
VM
37°2
2’08
’’ / 7
1°52
’33’
’C
F40
61,
374
11.3
64.5
1 Typ
e of
veg
etat
ion
mat
rix: A
gric
ultu
ral U
se (A
U),
Com
mer
cial
For
est (
CF)
and
Nat
ive
Fore
st (N
F). /
Tip
o de
mat
riz v
eget
acio
nal:
Uso
Agr
ícol
a (A
U),
Plan
taci
ón F
ores
tal (
CF)
y
Bos
que
Nat
ivo
(NF)
. 2 T
he v
alue
s of a
ltitu
de (m
a.s.
l.) w
ere
extra
cted
from
“Sh
uttle
Rad
ar T
opog
raph
y M
issi
on”
(Rod
rígue
z et
al.
2005
, Far
r et a
l. 20
07).
/ Los
val
ores
de
altit
ud (m
snm
) fue
ron
obte
nido
s de
l “Sh
uttle
Rad
ar T
opog
raph
y M
issi
on”
(Rod
rígue
z et
al.
2005
, Far
r et a
l. 20
07).
3 The
val
ues
of A
nnua
l Pre
cipi
tatio
n (m
m)
and
Ann
ual M
ean
Tem
pera
ture
(°C
) ex
tract
ed f
rom
Wor
ldcl
im (
Hijm
ans
et a
l. 20
05).
/ Los
val
ores
de
prec
ipita
ción
anu
al (
mm
) y
tem
pera
tura
med
ia a
nual
(°C
) fue
ron
extra
ídos
de
Wor
ldcl
im (H
ijman
s et a
l. 20
05).
63
Composition of communities of Quillaja saponaria: LETELIER, L. et al.
To estimate these metrics, we compiled a full species list based on The Angiosperm Phylogeny Group (2009) classification for the 60 taxa sampled in the 39 sites. Then, species were classified by genus and family and we used the Phylomatic function of Phylocom 4.1 (Webb et al. 2008) and a maximally resolved supertree of angiosperms (R20100701 available at http://www.phylodiversity.net) to construct a regional phylogeny from the species list. The ‘bladj’ algorithm was used to estimate branch lengths in the phylogeny and the node ages provided by Wikström et al. (2001) were used. Then, we used the Construct function of Phylocom 4.1 to calculate the phylogenetic metrics for each sampled site. The switch ‘-a’ was used to weight phylogenetic distances by taxa abundances.
To detect spatial patterns in the variation of the phylogenetic diversity indices of the sites, multiple regression analyses (stepwise) were performed using the same set of spatial and climate variables and the same specifications previously explained for the analyses of richness diversity and composition of the communities, using the JMP 8.0 SAS Institute Inc., Cary, NC, 1989-2007.
RESULTS
FLORA
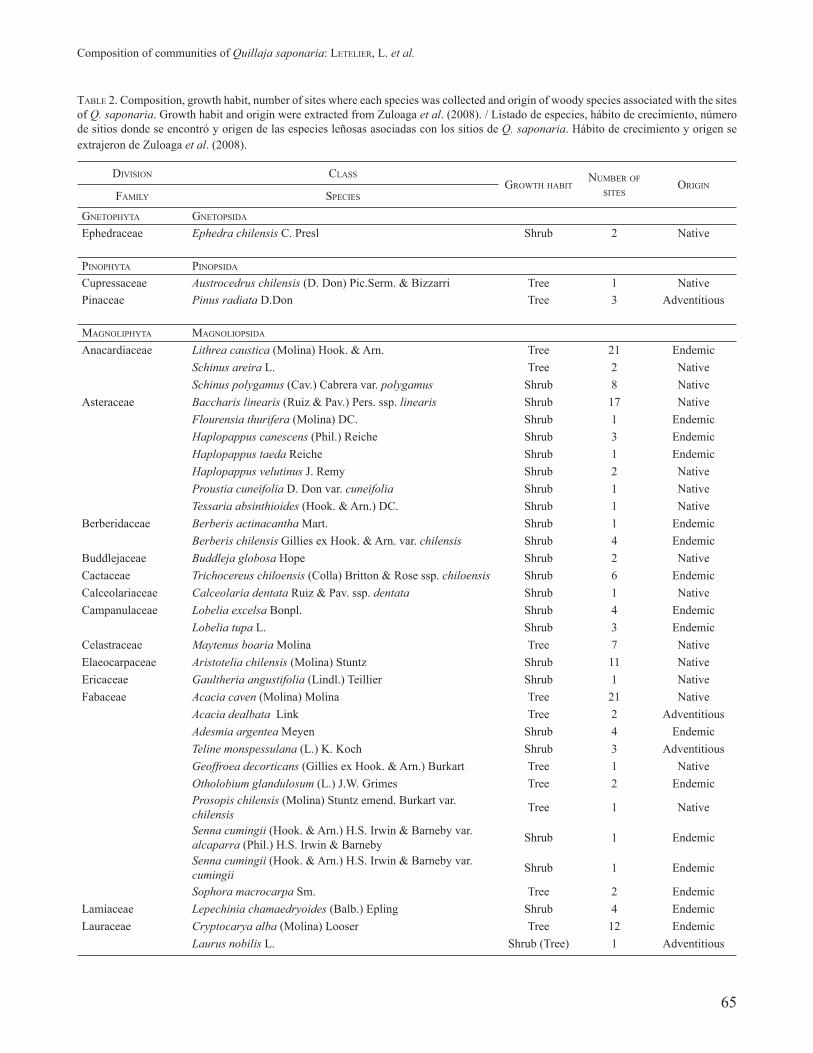
Analysis of the flora resulted in the presence of 59 taxa (species level or lower), distributed among 28 families. In terms of life forms, we distinguished 22 trees and 37 shrubs. The most frequent families were Fabaceae with 10 taxa, followed by Asteraceae with 7 taxa, Myrtaceae with 4 taxa and Anacardiaceae, Nothofagaceae and Solanaceae with 3 taxa each. 28 taxa were native, 27 were endemic to Chile and 5 were adventitious (see Table 2).
PATTERNS OF RICHNESS AND DIVERSITY
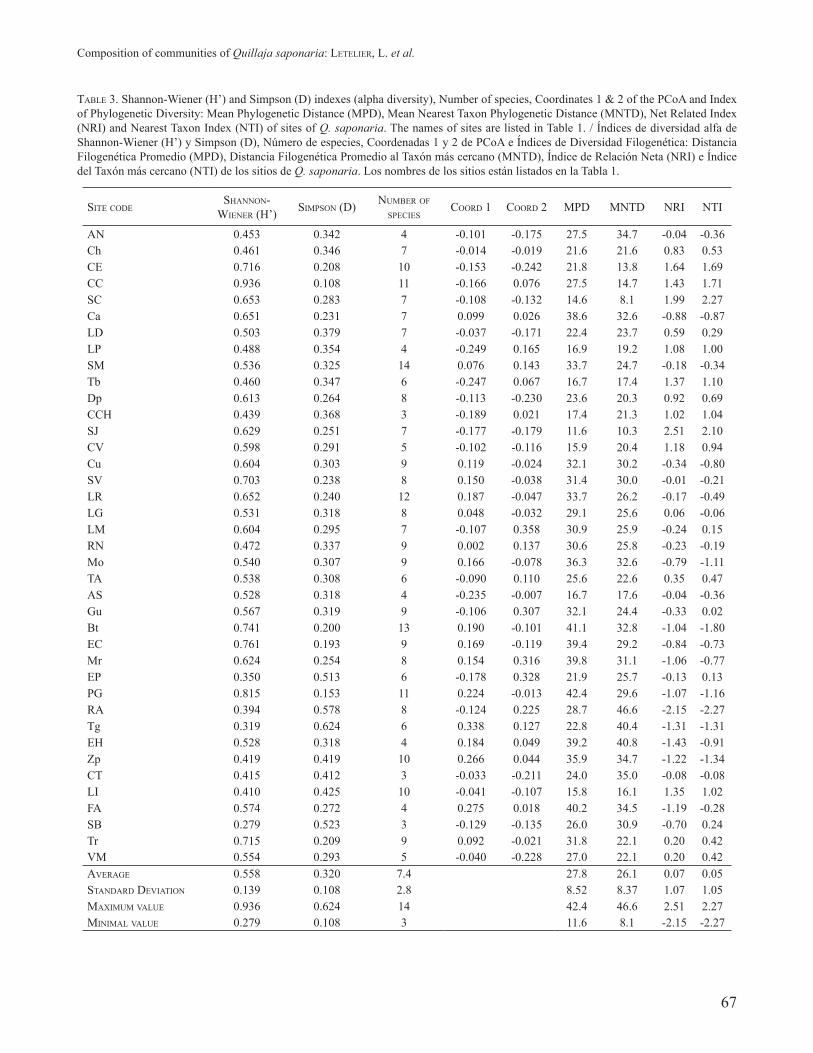
The lowest alpha diversities were found in the localities of Santa Bárbara (SB) in the Bío-Bío Region, and Tregualemu (Tg), Fundo El Peral (EP) and Risco Afuera (RA) in the Maule Region. The highest alpha diversities were found in the populations of Cuesta Los Cristales (CC) in the Coquimbo Region, and Potrero Grande (PG), El Colorado (EC) and Cuesta Batuco (Bt) in the Maule Region (see Table 3), surrounded by forest matrix. The mean species richness per site was seven, with a maximum of 14 species in Santa Marta (SM, Valparaíso Region) and a minimum of 3 species at sites of Cuesta Chacabuco (CCH, Metropolitan Region of Santiago), Santa Barbara (SB) and Cuesta Tomeco (CT), both in the Bío-Bío Region. The average of the Shannon-Wiener index for all sites was (mean ± standard deviation) 0.558 ± 0.139 and for the Simpson index the average was 0.320 ± 0.108.
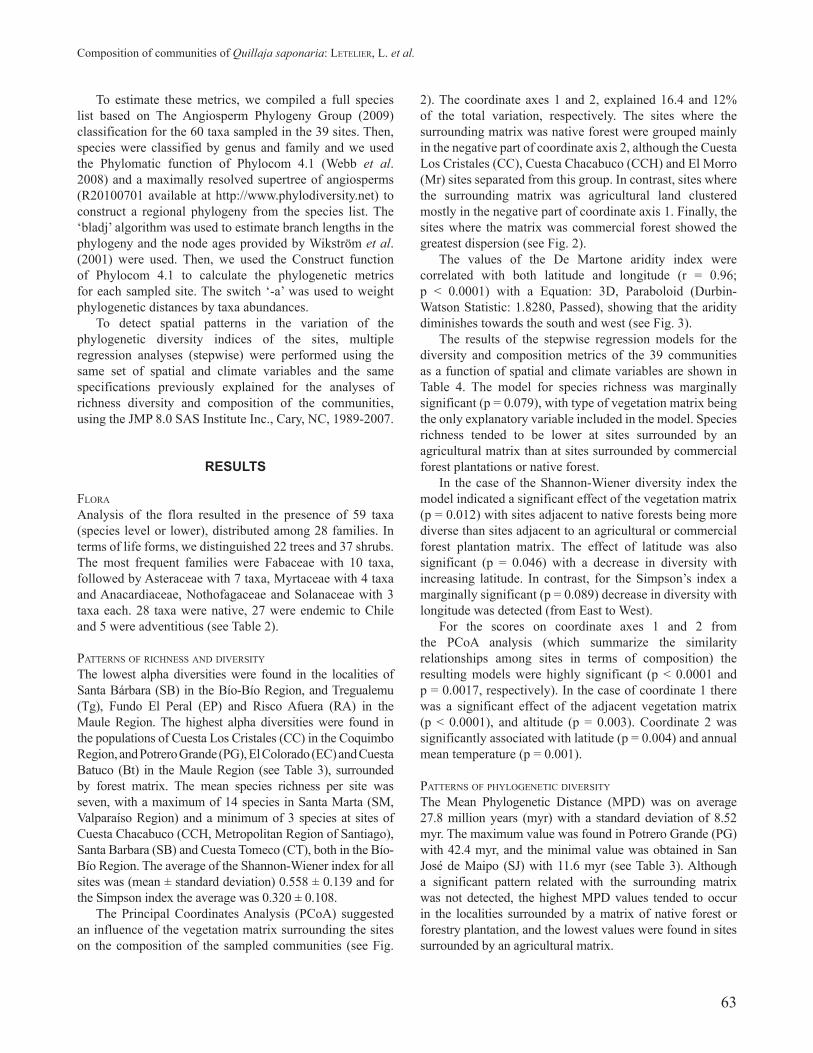
The Principal Coordinates Analysis (PCoA) suggested an influence of the vegetation matrix surrounding the sites on the composition of the sampled communities (see Fig.
2). The coordinate axes 1 and 2, explained 16.4 and 12% of the total variation, respectively. The sites where the surrounding matrix was native forest were grouped mainly in the negative part of coordinate axis 2, although the Cuesta Los Cristales (CC), Cuesta Chacabuco (CCH) and El Morro (Mr) sites separated from this group. In contrast, sites where the surrounding matrix was agricultural land clustered mostly in the negative part of coordinate axis 1. Finally, the sites where the matrix was commercial forest showed the greatest dispersion (see Fig. 2).
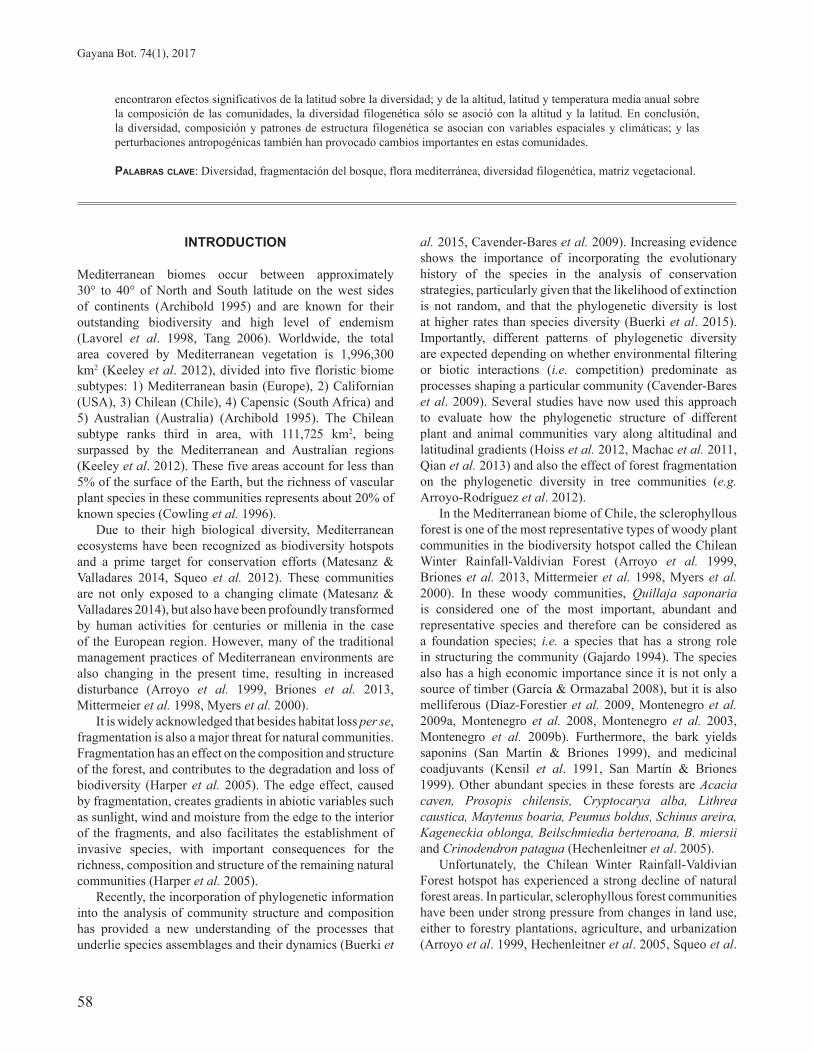
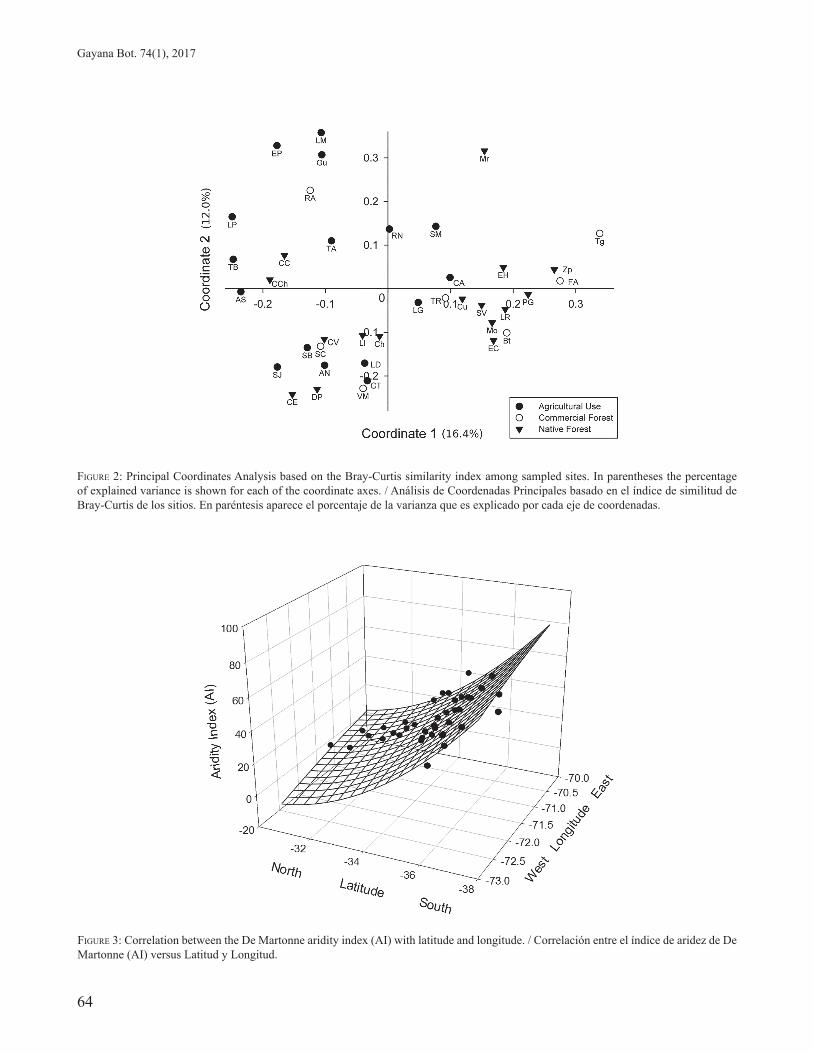
The values of the De Martone aridity index were correlated with both latitude and longitude (r = 0.96; p < 0.0001) with a Equation: 3D, Paraboloid (Durbin-Watson Statistic: 1.8280, Passed), showing that the aridity diminishes towards the south and west (see Fig. 3).
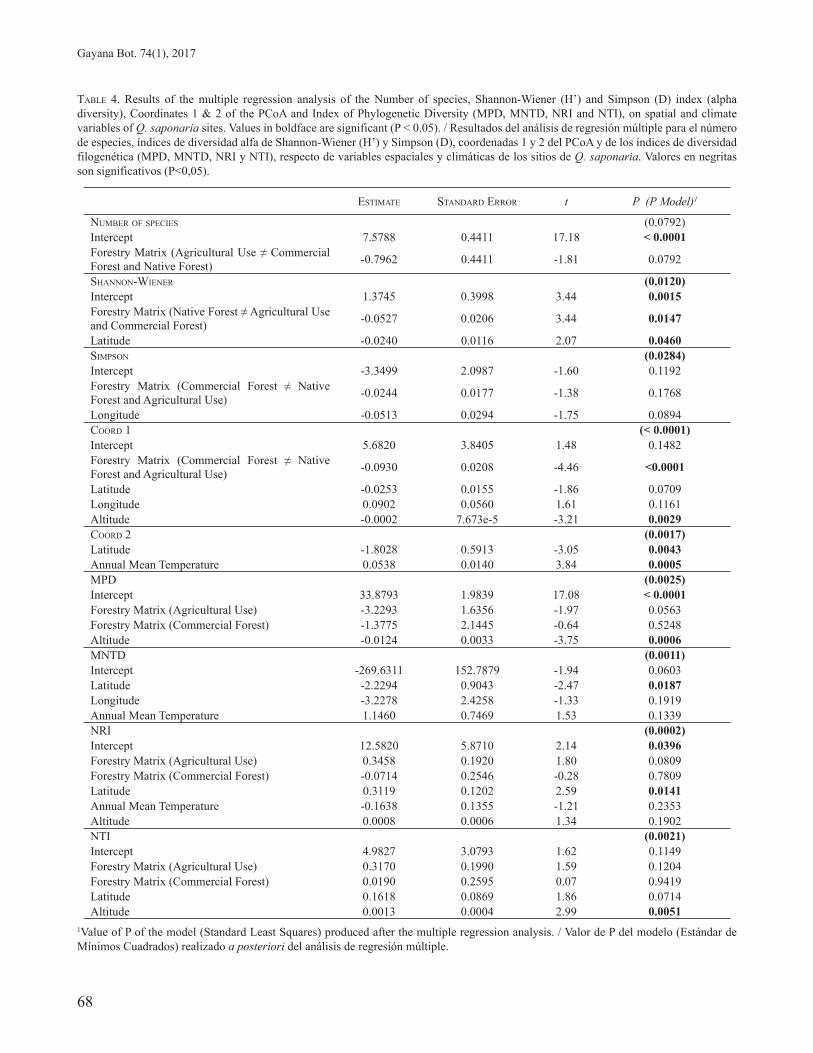
The results of the stepwise regression models for the diversity and composition metrics of the 39 communities as a function of spatial and climate variables are shown in Table 4. The model for species richness was marginally significant (p = 0.079), with type of vegetation matrix being the only explanatory variable included in the model. Species richness tended to be lower at sites surrounded by an agricultural matrix than at sites surrounded by commercial forest plantations or native forest.
In the case of the Shannon-Wiener diversity index the model indicated a significant effect of the vegetation matrix (p = 0.012) with sites adjacent to native forests being more diverse than sites adjacent to an agricultural or commercial forest plantation matrix. The effect of latitude was also significant (p = 0.046) with a decrease in diversity with increasing latitude. In contrast, for the Simpson’s index a marginally significant (p = 0.089) decrease in diversity with longitude was detected (from East to West).
For the scores on coordinate axes 1 and 2 from the PCoA analysis (which summarize the similarity relationships among sites in terms of composition) the resulting models were highly significant (p < 0.0001 and p = 0.0017, respectively). In the case of coordinate 1 there was a significant effect of the adjacent vegetation matrix (p < 0.0001), and altitude (p = 0.003). Coordinate 2 was significantly associated with latitude (p = 0.004) and annual mean temperature (p = 0.001).
PATTERNS OF PHYLOGENETIC DIVERSITY
The Mean Phylogenetic Distance (MPD) was on average 27.8 million years (myr) with a standard deviation of 8.52 myr. The maximum value was found in Potrero Grande (PG) with 42.4 myr, and the minimal value was obtained in San José de Maipo (SJ) with 11.6 myr (see Table 3). Although a significant pattern related with the surrounding matrix was not detected, the highest MPD values tended to occur in the localities surrounded by a matrix of native forest or forestry plantation, and the lowest values were found in sites surrounded by an agricultural matrix.
64
Gayana Bot. 74(1), 2017
FIGURE 3: Correlation between the De Martonne aridity index (AI) with latitude and longitude. / Correlación entre el índice de aridez de De Martonne (AI) versus Latitud y Longitud.
FIGURE 2: Principal Coordinates Analysis based on the Bray-Curtis similarity index among sampled sites. In parentheses the percentage of explained variance is shown for each of the coordinate axes. / Análisis de Coordenadas Principales basado en el índice de similitud de Bray-Curtis de los sitios. En paréntesis aparece el porcentaje de la varianza que es explicado por cada eje de coordenadas.
65
Composition of communities of Quillaja saponaria: LETELIER, L. et al.
TABLE 2. Composition, growth habit, number of sites where each species was collected and origin of woody species associated with the sites of Q. saponaria. Growth habit and origin were extracted from Zuloaga et al. (2008). / Listado de especies, hábito de crecimiento, número de sitios donde se encontró y origen de las especies leñosas asociadas con los sitios de Q. saponaria. Hábito de crecimiento y origen se extrajeron de Zuloaga et al. (2008).
DIVISION CLASSGROWTH HABIT
NUMBER OF SITES
ORIGINFAMILY SPECIES
GNETOPHYTA GNETOPSIDA Ephedraceae Ephedra chilensis C. Presl Shrub 2 Native PINOPHYTA PINOPSIDA Cupressaceae Austrocedrus chilensis (D. Don) Pic.Serm. & Bizzarri Tree 1 NativePinaceae Pinus radiata D.Don Tree 3 Adventitious MAGNOLIPHYTA MAGNOLIOPSIDA Anacardiaceae Lithrea caustica (Molina) Hook. & Arn. Tree 21 Endemic
Schinus areira L. Tree 2 NativeSchinus polygamus (Cav.) Cabrera var. polygamus Shrub 8 Native
Asteraceae Baccharis linearis (Ruiz & Pav.) Pers. ssp. linearis Shrub 17 NativeFlourensia thurifera (Molina) DC. Shrub 1 EndemicHaplopappus canescens (Phil.) Reiche Shrub 3 EndemicHaplopappus taeda Reiche Shrub 1 EndemicHaplopappus velutinus J. Remy Shrub 2 NativeProustia cuneifolia D. Don var. cuneifolia Shrub 1 NativeTessaria absinthioides (Hook. & Arn.) DC. Shrub 1 Native
Berberidaceae Berberis actinacantha Mart. Shrub 1 EndemicBerberis chilensis Gillies ex Hook. & Arn. var. chilensis Shrub 4 Endemic
Buddlejaceae Buddleja globosa Hope Shrub 2 NativeCactaceae Trichocereus chiloensis (Colla) Britton & Rose ssp. chiloensis Shrub 6 EndemicCalceolariaceae Calceolaria dentata Ruiz & Pav. ssp. dentata Shrub 1 NativeCampanulaceae Lobelia excelsa Bonpl. Shrub 4 Endemic
Lobelia tupa L. Shrub 3 EndemicCelastraceae Maytenus boaria Molina Tree 7 NativeElaeocarpaceae Aristotelia chilensis (Molina) Stuntz Shrub 11 NativeEricaceae Gaultheria angustifolia (Lindl.) Teillier Shrub 1 NativeFabaceae Acacia caven (Molina) Molina Tree 21 Native
Acacia dealbata Link Tree 2 AdventitiousAdesmia argentea Meyen Shrub 4 EndemicTeline monspessulana (L.) K. Koch Shrub 3 AdventitiousGeoffroea decorticans (Gillies ex Hook. & Arn.) Burkart Tree 1 NativeOtholobium glandulosum (L.) J.W. Grimes Tree 2 EndemicProsopis chilensis (Molina) Stuntz emend. Burkart var. chilensis Tree 1 Native
Senna cumingii (Hook. & Arn.) H.S. Irwin & Barneby var. alcaparra (Phil.) H.S. Irwin & Barneby Shrub 1 Endemic
Senna cumingii (Hook. & Arn.) H.S. Irwin & Barneby var. cumingii Shrub 1 Endemic
Sophora macrocarpa Sm. Tree 2 EndemicLamiaceae Lepechinia chamaedryoides (Balb.) Epling Shrub 4 EndemicLauraceae Cryptocarya alba (Molina) Looser Tree 12 Endemic
Laurus nobilis L. Shrub (Tree) 1 Adventitious

66
Gayana Bot. 74(1), 2017
The Mean Nearest Taxon Phylogenetic Distance (MNTD) showed an average of 26.1 myr with a standard deviation of 8.37 myr. The Risco Afuera (RA) site showed the maximum value with 46.6 myr, and the Santa Cristina (SC) site had the minimum value of 8.1 myr (see Table 3). In this case, the localities near to the forestry plantation matrix have the highest MNTD value (mean of 30.3 myr), and the localities near to native forest or agricultural matrix showed a MNTD mean of 25.6 myr and 24.7 myr, respectively.
The average Net Related Index (NRI) was 0.07 with a standard deviation of 1.07. The sites with the maximum values were San José de Maipo (SJ) and Santa Cristina (SC), with positive values of 2.51 and 1.99, respectively, indicating phylogenetic clustering at these sites. The minimum value was found in Risco Afuera (RA), with -2.15, indicating phylogenetic evenness (see Table 3). The localities near to the forestry plantation matrix showed the lowest NRI value.
For the Nearest Taxon Index (NTI) the average value was 0.05 with a standard deviation of 1.05. The higher positive values (indicating phylogenetic clustering) were found in Santa Cristina (SC) and San José de Maipo (SJ) (2.27 and 2.10, respectively). The largest negative value was found in Risco Afuera (RA) with -2.27 (see Table 3), indicating phylogenetic evenness.
The results of the stepwise multiple regression models calculated for the four metrics of phylogenetic diversity are shown in Table 4. The only explanatory variables significantly correlated with these metrics were altitude and latitude: MPD decreased and NTI increased with altitude, indicating less phylogenetic diversity and higher phylogenetic clustering at higher altitudes, while MNTD decreased and NRI increased with increasing latitude, indicating less diversity and higher clustering in the north in comparison to the south (Table 4).
DIVISION CLASSGROWTH HABIT
NUMBER OF SITES
ORIGINFAMILY SPECIES
Monimiaceae Peumus boldus Molina Tree 21 EndemicMyrtaceae Eucalyptus globulus Labill. Tree 1 Adventitious
Luma apiculata (DC.) Burret Shrub (Tree) 4 NativeLuma chequen (Molina) A. Gray Shrub 4 NativeUgni candollei (Barnéoud) O. Berg Shrub 1 Endemic
Nothofagaceae Nothofagus dombeyi (Mirb.) Oerst. Tree 3 NativeNothofagus macrocarpa (A. DC.) F.M. Vázquez & R.A. Rodr. Tree 2 EndemicNothofagus obliqua (Mirb.) Oerst. ssp. obliqua Tree 1 Native
Onagraceae Fuchsia lycioides Andrews Shrub 1 EndemicFuchsia magellanica Lam. Shrub 1 Native
Polygonaceae Muehlenbeckia hastulata (Sm.) I.M. Johnst. var. hastulata Shrub 7 NativeProteaceae Gevuina avellana Molina Tree 1 Native
Lomatia hirsuta (Lam.) Diels ssp. obliqua (Ruiz & Pav.) R.T. Penn. Tree 1 Native
Quillajaceae Quillaja saponaria Molina Tree 39 EndemicRhamnaceae Colletia hystrix Clos Shrub 8 Native
Retanilla trinervia (Gillies & Hook.) Hook. & Arn. Shrub 9 EndemicRosaceae Kageneckia oblonga Ruiz & Pav. Tree 10 EndemicSalicaceae Azara dentata Ruiz & Pav. Shrub 2 Endemic
Azara integrifolia Ruiz & Pav. Shrub 2 EndemicSolanaceae Cestrum parqui L’Hér. Shrub 8 Native
Fabiana imbricata Ruiz & Pav. Shrub 2 EndemicSolanum crispum Ruiz & Pav. Shrub 1 Native
Zygophyllaceae Porlieria chilensis I.M. Johnst. Tree 2 Endemic
67
Composition of communities of Quillaja saponaria: LETELIER, L. et al.
TABLE 3. Shannon-Wiener (H’) and Simpson (D) indexes (alpha diversity), Number of species, Coordinates 1 & 2 of the PCoA and Index of Phylogenetic Diversity: Mean Phylogenetic Distance (MPD), Mean Nearest Taxon Phylogenetic Distance (MNTD), Net Related Index (NRI) and Nearest Taxon Index (NTI) of sites of Q. saponaria. The names of sites are listed in Table 1. / Índices de diversidad alfa de Shannon-Wiener (H’) y Simpson (D), Número de especies, Coordenadas 1 y 2 de PCoA e Índices de Diversidad Filogenética: Distancia Filogenética Promedio (MPD), Distancia Filogenética Promedio al Taxón más cercano (MNTD), Índice de Relación Neta (NRI) e Índice del Taxón más cercano (NTI) de los sitios de Q. saponaria. Los nombres de los sitios están listados en la Tabla 1.
SITE CODESHANNON-
WIENER (H’) SIMPSON (D) NUMBER OF SPECIES
COORD 1 COORD 2 MPD MNTD NRI NTI
AN 0.453 0.342 4 -0.101 -0.175 27.5 34.7 -0.04 -0.36Ch 0.461 0.346 7 -0.014 -0.019 21.6 21.6 0.83 0.53CE 0.716 0.208 10 -0.153 -0.242 21.8 13.8 1.64 1.69CC 0.936 0.108 11 -0.166 0.076 27.5 14.7 1.43 1.71SC 0.653 0.283 7 -0.108 -0.132 14.6 8.1 1.99 2.27Ca 0.651 0.231 7 0.099 0.026 38.6 32.6 -0.88 -0.87LD 0.503 0.379 7 -0.037 -0.171 22.4 23.7 0.59 0.29LP 0.488 0.354 4 -0.249 0.165 16.9 19.2 1.08 1.00SM 0.536 0.325 14 0.076 0.143 33.7 24.7 -0.18 -0.34Tb 0.460 0.347 6 -0.247 0.067 16.7 17.4 1.37 1.10Dp 0.613 0.264 8 -0.113 -0.230 23.6 20.3 0.92 0.69CCH 0.439 0.368 3 -0.189 0.021 17.4 21.3 1.02 1.04SJ 0.629 0.251 7 -0.177 -0.179 11.6 10.3 2.51 2.10CV 0.598 0.291 5 -0.102 -0.116 15.9 20.4 1.18 0.94Cu 0.604 0.303 9 0.119 -0.024 32.1 30.2 -0.34 -0.80SV 0.703 0.238 8 0.150 -0.038 31.4 30.0 -0.01 -0.21LR 0.652 0.240 12 0.187 -0.047 33.7 26.2 -0.17 -0.49LG 0.531 0.318 8 0.048 -0.032 29.1 25.6 0.06 -0.06LM 0.604 0.295 7 -0.107 0.358 30.9 25.9 -0.24 0.15RN 0.472 0.337 9 0.002 0.137 30.6 25.8 -0.23 -0.19Mo 0.540 0.307 9 0.166 -0.078 36.3 32.6 -0.79 -1.11TA 0.538 0.308 6 -0.090 0.110 25.6 22.6 0.35 0.47AS 0.528 0.318 4 -0.235 -0.007 16.7 17.6 -0.04 -0.36Gu 0.567 0.319 9 -0.106 0.307 32.1 24.4 -0.33 0.02Bt 0.741 0.200 13 0.190 -0.101 41.1 32.8 -1.04 -1.80EC 0.761 0.193 9 0.169 -0.119 39.4 29.2 -0.84 -0.73Mr 0.624 0.254 8 0.154 0.316 39.8 31.1 -1.06 -0.77EP 0.350 0.513 6 -0.178 0.328 21.9 25.7 -0.13 0.13PG 0.815 0.153 11 0.224 -0.013 42.4 29.6 -1.07 -1.16RA 0.394 0.578 8 -0.124 0.225 28.7 46.6 -2.15 -2.27Tg 0.319 0.624 6 0.338 0.127 22.8 40.4 -1.31 -1.31EH 0.528 0.318 4 0.184 0.049 39.2 40.8 -1.43 -0.91Zp 0.419 0.419 10 0.266 0.044 35.9 34.7 -1.22 -1.34CT 0.415 0.412 3 -0.033 -0.211 24.0 35.0 -0.08 -0.08LI 0.410 0.425 10 -0.041 -0.107 15.8 16.1 1.35 1.02FA 0.574 0.272 4 0.275 0.018 40.2 34.5 -1.19 -0.28SB 0.279 0.523 3 -0.129 -0.135 26.0 30.9 -0.70 0.24Tr 0.715 0.209 9 0.092 -0.021 31.8 22.1 0.20 0.42VM 0.554 0.293 5 -0.040 -0.228 27.0 22.1 0.20 0.42AVERAGE 0.558 0.320 7.4 27.8 26.1 0.07 0.05STANDARD DEVIATION 0.139 0.108 2.8 8.52 8.37 1.07 1.05MAXIMUM VALUE 0.936 0.624 14 42.4 46.6 2.51 2.27MINIMAL VALUE 0.279 0.108 3 11.6 8.1 -2.15 -2.27
68
Gayana Bot. 74(1), 2017
TABLE 4. Results of the multiple regression analysis of the Number of species, Shannon-Wiener (H’) and Simpson (D) index (alpha diversity), Coordinates 1 & 2 of the PCoA and Index of Phylogenetic Diversity (MPD, MNTD, NRI and NTI), on spatial and climate variables of Q. saponaria sites. Values in boldface are significant (P < 0.05). / Resultados del análisis de regresión múltiple para el número de especies, índices de diversidad alfa de Shannon-Wiener (H’) y Simpson (D), coordenadas 1 y 2 del PCoA y de los índices de diversidad filogenética (MPD, MNTD, NRI y NTI), respecto de variables espaciales y climáticas de los sitios de Q. saponaria. Valores en negritas son significativos (P<0,05).
ESTIMATE STANDARD ERROR t P (P Model)1
NUMBER OF SPECIES (0.0792)Intercept 7.5788 0.4411 17.18 < 0.0001Forestry Matrix (Agricultural Use ≠ Commercial Forest and Native Forest) -0.7962 0.4411 -1.81 0.0792
SHANNON-WIENER (0.0120)Intercept 1.3745 0.3998 3.44 0.0015Forestry Matrix (Native Forest ≠ Agricultural Use and Commercial Forest) -0.0527 0.0206 3.44 0.0147
Latitude -0.0240 0.0116 2.07 0.0460SIMPSON (0.0284)Intercept -3.3499 2.0987 -1.60 0.1192Forestry Matrix (Commercial Forest ≠ Native Forest and Agricultural Use) -0.0244 0.0177 -1.38 0.1768
Longitude -0.0513 0.0294 -1.75 0.0894COORD 1 (< 0.0001)Intercept 5.6820 3.8405 1.48 0.1482Forestry Matrix (Commercial Forest ≠ Native Forest and Agricultural Use) -0.0930 0.0208 -4.46 <0.0001
Latitude -0.0253 0.0155 -1.86 0.0709Longitude 0.0902 0.0560 1.61 0.1161Altitude -0.0002 7.673e-5 -3.21 0.0029COORD 2 (0.0017)Latitude -1.8028 0.5913 -3.05 0.0043Annual Mean Temperature 0.0538 0.0140 3.84 0.0005MPD (0.0025)Intercept 33.8793 1.9839 17.08 < 0.0001Forestry Matrix (Agricultural Use) -3.2293 1.6356 -1.97 0.0563Forestry Matrix (Commercial Forest) -1.3775 2.1445 -0.64 0.5248Altitude -0.0124 0.0033 -3.75 0.0006MNTD (0.0011)Intercept -269.6311 152.7879 -1.94 0.0603Latitude -2.2294 0.9043 -2.47 0.0187Longitude -3.2278 2.4258 -1.33 0.1919Annual Mean Temperature 1.1460 0.7469 1.53 0.1339NRI (0.0002)Intercept 12.5820 5.8710 2.14 0.0396Forestry Matrix (Agricultural Use) 0.3458 0.1920 1.80 0.0809Forestry Matrix (Commercial Forest) -0.0714 0.2546 -0.28 0.7809Latitude 0.3119 0.1202 2.59 0.0141Annual Mean Temperature -0.1638 0.1355 -1.21 0.2353Altitude 0.0008 0.0006 1.34 0.1902NTI (0.0021)Intercept 4.9827 3.0793 1.62 0.1149Forestry Matrix (Agricultural Use) 0.3170 0.1990 1.59 0.1204Forestry Matrix (Commercial Forest) 0.0190 0.2595 0.07 0.9419Latitude 0.1618 0.0869 1.86 0.0714Altitude 0.0013 0.0004 2.99 0.0051
1Value of P of the model (Standard Least Squares) produced after the multiple regression analysis. / Valor de P del modelo (Estándar de Mínimos Cuadrados) realizado a posteriori del análisis de regresión múltiple.

69
Composition of communities of Quillaja saponaria: LETELIER, L. et al.
DISCUSSION
In this study, we have explored the patterns of richness, diversity and phylogenetic diversity of woody plant communities in the sclerophyllous forests of Chile across their whole native range. Furthermore, we evaluated whether these patterns can be explained by geographic, climatic and human disturbance variables.
In general, the species found in this study correspond to the woody flora defined historically as components of sclerophyllous forest communities (Amigo & Flores-Toro 2012, García & Ormazábal 2008, Hechenleitner et al. 2005). The presence of species belonging to genera such as Nothofagus, Lomatia or Austrocedrus at some sites was atypical for these types of communities. This occurred particularly at some of the southernmost sites, located in areas that are probably transitional towards more humid types of forest (Gajardo 1994, Luebert & Pliscoff 2004).
The stepwise multiple regression models allowed determining the relevance of the different spatial, climate and disturbance variables (i.e. the type of the surrounding vegetation matrix) on the patterns of richness, diversity and composition of the sites. Interestingly, the type of vegetation matrix was found to have a marginally significant effect on species richness and a significant effect on the Shannon-Wiener diversity index and on the scores of the first axis of the Principal Coordinates Analysis, which summarizes the similarity relationships among sites in terms of composition. These results indicated that sites surrounded by the same type of vegetation matrix also tended to be more similar in their species composition and also that the diversity of the communities was in general lower, intermediate and higher at sites surrounded by agricultural, commercial forestry plantation and natural forest matrices, respectively.
For example, the low alpha diversity found in Santa Bárbara (SB) in the Bío-Bío Region, and Tregualemu (Tg), Fundo El Peral (EP) and Risco Afuera (RA) in the Maule Region, may be related to the surrounding vegetation matrix, which in the cases of SB and EP is agricultural land, and in the RA and Tg communities is commercial forestry plantation of Pinus radiata D. Don. Furthermore, the clear separation of the Risco Afuera (RA) community from the other sites where the adjacent matrix was commercial forest is explained by the very high abundance of Pinus radiata at this site. This pine covered 60% of the sampled area and defined the community, evidencing the colonising ability of the species, reported previously by Gómez et al. (2011), who found that in small fragments of native forest (less than or equal to 20 hectares, as is the case with the RA site), colonisation by seeds of P. radiata from the adjacent matrix was higher than in larger fragments.
A reduction in the diversity of communities frequently results from disturbance caused by human activity (Hobbs & Huenneke 1992). Furthermore, as described by Gómez
et al. (2011), P. radiata plantations may be a source of propagation into natural communities. This effect may be seen as an increase in the diversity of the community suffering the invasion, but also as a threat, since the presence of this species increases competition for soil (Jorquera-Jaramillo 2008). In addition, as mentioned by Figueroa et al. (2004), pasture regimes and propagation pressure result in a threat by exotic species to native plant communities. This supports the idea that the surrounding matrix affects the number of species in a location, and therefore the alpha diversity of the communities, since transformation to commercial forestry plantations or agriculture leads to a reduction in the diversity of the adjacent remaining natural communities (Hobbs & Huenneke 1992).
A different case is probably represented by the Cuesta Chacabuco (CCH) site, which is surrounded by native forest but showed a low diversity, with only three tree species recorded (i.e., Acacia caven, Lithrea caustica and Quillaja saponaria). This site is situated in the northern part of the study region in a transitional zone to more arid vegetation types. Also, the unusual composition of this locality is related to its classification as “spiny open woodland” (bosque espinoso abierto), a type of sclerophyllous forest particularly poor in species (Gajardo 1994).
In contrast, the communities of Cuesta Los Cristales (CC) in the Coquimbo Region, and Potrero Grande (PG), El Colorado (EC) and Cuesta Batuco (Bt) in the Maule Region presented the highest values of alpha diversity. All these communities, with the exception of Bt, are surrounded by native forest and situated in the foothills of the Andes cordillera (i.e. pre-cordilleran sites), where the effect of land-use changes is still smaller than those reported for the Central Valley or the Coastal Range (Squeo et al. 2012, Squeo et al. 2010). In the case of CC, the high diversity and composition distinctness (see Fig. 2) is also due to the presence of Flourensia thurifera and Porlieria chilensis, species that are characteristic of the Atacama Desert flora (Gajardo 1994).
The other variables that according to the regression models contributed significantly to explain the diversity and composition of the studied communities were latitude in the case of the Shannon-Wiener index, altitude in the case of the first axis of the PCoA and latitude and annual mean temperature in the case of the second axis of the PCoA. Besides, the decrease of Shannon-Wiener index with increased latitude could be explained by the higher anthropogenic pressure on natural communities towards the south caused by land use change from native forest to commercial forest (Squeo et al. 2010, 2012).
The effect of altitude and latitude on the pattern of similarity in the composition of the communities (given the correlations with the first and second axis of the PCoA) probably results from the fact that contiguous sites tend to share more species than distant sites. For example, as
70
Gayana Bot. 74(1), 2017
previously mentioned, in the sites located to the southermost of the study area we found species of genera like Nothofagus, Lomatia or Austrocedrus, which are characteristic of the mesophilous forest (Hechenleitner et al. 2005), while to the north of the study area we found species that belong to the Atacama Desert flora, like Flourensia thurifera and Porlieria chilensis. The effect of annual mean temperature is probably because this climatic variable imposes a physiological limit to distributional patterns of species and therefore sites with similar temperature have a more similar floristic composition than sites with different temperatures.
The patterns detected for the phylogenetic diversity metrics in the communities indicated two clear trends. Firstly, there was a decrease in phylogenetic diversity of the communities (indicated by a decrease in Mean Phylogenetic Distance) and an increase in phylogenetic clustering (indicated by a change from negative to positive values in Nearest Taxon Index) with increasing altitude. Secondly, there was also a pattern of south to north decrease in phylogenetic diversity (indicated by a decrease in Mean Nearest Taxon Phylogenetic Distance) and an increase in phylogenetic clustering (indicated by a change from negative to positive values in the Net Related Index). Similar patterns have been found in other regions of the world for insect communities (Hoiss et al. 2012; Machac et al. 2011) and angiosperm trees (Qian et al. 2013) and can be explained by an increase in environmental filtering effects towards higher altitude sites (perhaps because of lower temperatures) and more northern locations (in our case, possibly due to increased aridity). However, an effect of anthropogenic disturbance is also possible, since the presence of adventitious (e.g. Pinus radiata) species may result in a higher phylogenetic evenness within communities. The abundance of such species was higher at sites surrounded by agricultural or commercial forestry matrices and these sites predominated at lower altitudes and at the southern portion of the studied region.
The highest MPD values were obtained in localities near the native forest or forestry plantation matrix. The values from the forestry plantation matrix are explained by the introduction of exotic plant species to the native communities (Bennett et al. 2014), for example P. radiata. In addition, the native forest matrix has a high stability of the community due the presence of native flora (Cadotte et al. 2012).
CONCLUSIONS
This work provides an update of the diversity and composition of Chilean sclerophyllous forest communities containing Quillaja saponaria. We have also evaluated how this diversity and composition changed with variations in the vegetation matrix surrounding these plant communities. It
was found that the alpha diversity index of the communities studied was affected by the matrix surrounding the community, with native forest as adjacent matrix being associated with the greatest diversity and number of species in the communities. The results show that studies in greater depth are needed to assess the effects of changes in land use on sclerophyllous forest plant communities, particularly those formed by Q. saponaria. There is also a need to study the plant species of the herbaceous stratum, and to associate them with the analyses already carried out, so as to demonstrate whether a greater effect of human activity is found when these elements are incorporated into the analysis.
ACKNOWLEDGEMENTS
Chile Abroad Grants programme, Doctorate level – Call 2010, National Commission for Scientific and Technological Research (CONICYT, Chile); II Competitive Native Forest Research Fund (Project N° 041-2011), National Forestry Corporation (CONAF, Chile); Post-graduate Programme in Biological Sciences of the National Autonomous University of Mexico (UNAM). This article constitutes a partial fulfillment of the graduate program in Biological Sciences of UNAM. The authors also thank Dr. Alfonso Valiente-Banuet for his valuable comments on the initial version of the manuscript. We also thank two anonymous reviewers for valuable comments on the paper.
REFERENCES
AMIGO, J., FLORES-TORO, L. 2012. Revisión sintaxonómica de los bosques esclerófilos de Chile Central: La alianza Cryptocaryon albae. Lazaroa 33(1): 171-196.
ARCHIBOLD, O.W. 1995. Ecology of World Vegetation. Springer Netherlands, Amsterdam, Netherlands. 522 pp.
ARROYO, M.T.K., ROZZI, R., SIMONETTI, J.A., MARQUET, P., SALABERRY, M. 1999. Central Chile. In: Mittermeier, R.A., Myers, N., Robles Gil, P., Goettsch Mittermeier, C. (eds.), Hotspots: Earth’s Biologically Richest and Most Endangered Terrestrial Ecosystems,161-171. Cemex, Conservation International, México.
ARROYO-RODRÍGUEZ, V., CAVENDER-BARES, J., ESCOBAR, F., MELO, F.P.L., TABARELLI, M., SANTOS, B.A. 2012. Maintenance of tree phylogenetic diversity in a highly fragmented rain forest. Journal of Ecology 100(3): 702-711.
BAMBACH, N., MEZA, F.J., GILABERT, H., MIRANDA, M. 2013. Impacts of climate change on the distribution of species and communities in the Chilean Mediterranean ecosystem. Regional Environmental Change 13(6): 1245-1257.
BENNETT, J.A., STOTZ, G.C., CAHILL, J.F. 2014. Patterns of phylogenetic diversity are linked to invasion impacts, not invasion resistance, in a native grassland. Journal of Vegetation Science 25(6): 1315-1326.
71
Composition of communities of Quillaja saponaria: LETELIER, L. et al.
BRIONES, R., JEREZ, V., BENÍTEZ, H.A. 2013. Vertical diversity of beetles (Insecta: Coleoptera) associated with Lithraea caustica (Anacardiaceae) in patches of sclerophyllous forest in Central Chile. Journal of the Entomological Research Society 15(3): 41-52.
BUERKI, S., CALLMANDER, M.W., BACHMAN, S., MOAT, J., LABAT, J.-N., FOREST, F. 2015. Incorporating evolutionary history into conservation planning in biodiversity hotspots. Philosophical Transactions of the Royal Society B: Biological Sciences 370(1662): 1-8.
CADOTTE, M.W., DINNAGE, R., TILMAN, D. 2012. Phylogenetic diversity promotes ecosystem stability. Ecology 93(sp8): S223-S233.
CAVENDER-BARES, J., KOZAK, K.H., FINE, P.V.A., KEMBEL, S.W. 2009. The merging of community ecology and phylogenetic biology. Ecology Letters 12(7): 693-715.
COWLING, R.M., RUNDEL, P.W., LAMONT, B.B., ARROYO, M.T.K., ARIANOUTSOU, M. 1996. Plant diversity in mediterranean-climate regions. Trends in Ecology & Evolution 11(9): 362-366.
DI CASTRI, F., HAJEK, E.R. 1976. Bioclimatología de Chile. Universidad Católica de Chile, Santiago, Chile. 128 pp.
DÍAZ-FORESTIER, J., GÓMEZ, M., MONTENEGRO, G. 2009. Nectar volume and floral entomofauna as a tool for the implementation of sustainable apicultural management plans in Quillaja saponaria Mol. Agroforestry Systems 76(1): 149-162.
FARR, T.G., ROSEN, P.A., CARO, E., CRIPPEN, R., DUREN, R., HENSLEY, S., KOBRICK, M., PALLER, M., RODRIGUEZ, E., ROTH, L., SEAL, D., SHAFFER, S., SHIMADA, J., UMLAND, J., WERNER, M., OSKIN, M., BURBANK, D., ALSDORF, D. 2007. The Shuttle Radar Topography Mission. Reviews of Geophysics 45(2): RG2004.
FELFILI, M.C., FELFILI, J.M. 2001. Diversidade alfa e beta no Cerrado sensu stricto da Chapada Pratinha, Brasil. Acta Botanica Brasilica 15(2): 243-254.
FIGUEROA, J.A., CASTRO, S.A., MARQUET, P.A., JAKSIC, F.M. 2004. Exotic plant invasions to the mediterranean region of Chile: Causes, history and impacts. Revista Chilena de Historia Natural 77(3): 465-483.
GAJARDO, R. 1994. La Vegetación Natural de Chile: Clasificación y Distribución Geográfica. Editorial Universitaria, Santiago, Chile. 165 pp.
GARCÍA, N., ORMAZABAL, C. 2008. Árboles Nativos de Chile. Enersis S.A., Santiago, Chile. 196 pp.
GÓMEZ, P., BUSTAMANTE, R.O., SAN MARTÍN, J., HAHN, S. 2011. Estructura poblacional de Pinus radiata D. Don en fragmentos de Bosque Maulino en Chile central. Gayana Botánica 68(1): 97-101.
HAMMER, Ø., HARPER, D.A.T., RYAN, P.D. 2001. PAST: Paleontological statistics software package for education and data analysis. Palaeontologia Electronica 4(1): 1-9.
HARPER, K.A., MACDONALD, S.E., BURTON, P.J., CHEN, J., BROSOFSKE, K.D., SAUNDERS, S.C., EUSKIRCHEN, E.S., ROBERTS, D., JAITEH, M.S., ESSEEN, P.-A. 2005. Edge influence on forest structure and composition in fragmented landscapes. Conservation Biology 19(3): 768-782.
HECHENLEITNER, P., GARDNER, M.F., THOMAS, P.I., ECHEVERRÍA, C., ESCOBAR, B., BROWNLESS, P., MARTÍNEZ, C. 2005. Plantas Amenazadas del Centro-Sur de Chile: Distribución,
Conservación y Propagación. Universidad Austral de Chile y Real Jardín Botánico de Edinburgo, Valdivia, Chile. 188 pp.
HIJMANS, R.J., CAMERON, S.E., PARRA, J.L., JONES, P.G., JARVIS, A. 2005. Very high resolution interpolated climate surfaces for global land areas. International Journal of Climatology 25(15): 1965-1978.
HOBBS, R.J., HUENNEKE, L.F. 1992. Disturbance, diversity, and invasion: Implications for conservation. Conservation Biology 6(3): 324-337.
HOISS, B., KRAUSS, J., POTTS, S.G., ROBERTS, S., STEFFAN-DEWENTER, I. 2012. Altitude acts as an environmental filter on phylogenetic composition, traits and diversity in bee communities. Proceedings of the Royal Society B-Biological Sciences 279(1746): 4447-4456.
JORQUERA-JARAMILLO, C. 2008. Agricultura y flora nativa en la Región de Atacama: ¿Es posible producir y conservar? En: Squeo, F.A., Arancio, G., Gutiérrez, J.R. (eds.), Libro Rojo de la Flora Nativa y de los Sitios Prioritarios para su Conservación: Región de Atacama, pp. 305-322. Ediciones Universidad de La Serena, La Serena, Chile.
KEELEY, J.E., BOND, W.J., BRADSTOCK, R.A., PAUSAS, J.G., RUNDEL, P.W. 2012. Fire in Mediterranean Ecosystems: Ecology, Evolution and Management. Cambridge University Press, Cambridge, UK. 515 pp.
KENSIL, C.R., PATEL, U., LENNICK, M., MARCIANI, D. 1991. Separation and characterization of saponins with adjuvant activity from Quillaja saponaria Molina cortex. The Journal of Immunology 146(2): 431-437.
LAVOREL, S., CANADELL, J., RAMBAL, S., TERRADAS, J. 1998. Mediterranean terrestrial ecosystems: Research priorities on global change effects. Global Ecology and Biogeography Letters 7(3): 157-166.
LUEBERT, F., PLISCOFF, P. 2004. Clasificación de Pisos de Vegetación y Análisis de Representatividad Ecológica de Áreas Propuestas para la Protección en la Ecorregión. WWF Chile, Programa Ecoregión Valdiviana, Valdivia, Chile. iii + 175 pp.
MACHAC, A., JANDA, M., DUNN, R.R., SANDERS, N.J. 2011. Elevational gradients in phylogenetic structure of ant communities reveal the interplay of biotic and abiotic constraints on diversity. Ecography 34(3): 364-371.
MARTICORENA, C., QUEZADA, M. 1985. Catálogo de la flora vascular de Chile. Gayana Botánica 42(1-2): 5-157.
MATESANZ, S., VALLADARES, F. 2014. Ecological and evolutionary responses of Mediterranean plants to global change. Environmental and Experimental Botany 103: 53-67.
MERCADO-MANCERA, G., TROYO-DIÉGUEZ, E., AGUIRRE-GÓMEZ, A., MURILLO-AMADOR, B., BELTRÁN-MORALES, L.F., GARCÍA-HERNÁNDEZ, J.L. 2010. Calibración y aplicación del índice de aridez de De Martonne para el análisis del déficit hídrico como estimador de la aridez y desertificación en zonas áridas. Universidad y Ciencia 26(1): 51-64.
MITTERMEIER, R.A., MYERS, N., THOMSEN, J.B., DA FONSECA, G.A.B., OLIVIERI, S. 1998. Biodiversity hotspots and major tropical wilderness areas: Approaches to setting conservation priorities. Conservation Biology 12(3): 516-520.
MONTENEGRO, G., GÓMEZ, M., CASAUBON, G., BELANCIC, A., MUJICA, A.M., PEÑA, R.C. 2009a. Analysis of volatile compounds in three unifloral native Chilean honeys. Phyton (Buenos Aires) 78(1): 61-65.
72
Gayana Bot. 74(1), 2017
MONTENEGRO, G., GÓMEZ, M., PIZARRO, R., CASAUBON, G., PEÑA, R.C. 2008. Implementación de un panel sensorial para mieles chilenas. Ciencia e Investigación Agraria 35(1): 51-58.
MONTENEGRO, G., PIZARRO, R., AVILA, G., CASTRO, R., RIOS, C., MUÑOZ, O., BAS, F. 2003. Origen botánico y propiedades químicas de las mieles de la región mediterránea árida de Chile. Ciencia e Investigación Agraria 30(3): 161-174.
MONTENEGRO, G., SALAS, F., PEÑA, R.C., PIZARRO, R. 2009b. Actividad antibacteriana y antifúngica de mieles monoflorales de Quillaja saponaria, especie endémica de Chile. Phyton (Buenos Aires) 78(2): 141-146.
MOREIRA-MUÑOZ, A. 2011. Plant Geography of Chile. Springer Dordrecht Heidelberg, London, UK and New York, USA. xxii + 346 pp.
MUELLER-DOMBOIS, D., ELLENBERG, H. 1974. Aims and Methods of Vegetation Ecology. John Wiley & Sons, New York. 547 pp.
MYERS, N., MITTERMEIER, R.A., MITTERMEIER, C.G., DA FONSECA, G.A.B., KENT, J. 2000. Biodiversity hotspots for conservation priorities. Nature 403(6772): 853-858.
PODANI, J., MIKLÓS, I. 2002. Resemblance coefficients and the horseshoe effect in Principal Coordinates Analysis. Ecology 83(12): 3331-3343.
PREHN, D., SERRANO, C., BERRÍOS, C.G., ARCE-JOHNSON, P. 2003. Micropropagación de Quillaja saponaria Mol. a partir de semillas. Bosque (Valdivia) 24(2): 3-12.
QIAN, H., ZHANG, Y., ZHANG, J., WANG, X. 2013. Latitudinal gradients in phylogenetic relatedness of angiosperm trees in North America. Global Ecology and Biogeography 22(11): 1183-1191.
RODRÍGUEZ, E., MORRIS, C.S., BELZ, J.E., CHAPIN, E.C., MARTIN, J.M., DAFFER, W. HENSLEY, S. 2005. An Assessment of the SRTM Topographic Products. Jet Propulsion Laboratory, NASA, Pasadena, California. 143 pp.
SAN MARTÍN, R., BRIONES, R. 1999. Industrial uses and sustainable supply of Quillaja saponaria (Rosaceae) saponins. Economic Botany 53(3): 302-311.
SQUEO, F.A., ESTÉVEZ, R.A., STOLL, A., GAYMER, C.F., LETELIER, L., SIERRALTA, L. 2012. Towards the creation of an integrated
system of protected areas in Chile: Achievements and challenges. Plant Ecology & Diversity 5(2): 233-243.
SQUEO, F.A., LETELIER, L., GAYMER, C.F., STOLL, A., SMITH-RAMÍREZ, C., MIETHKE, S., CUNDILL, G., L’HERMITTE, S., MARQUET, P.A., SAMANIEGO, H.A., GUERRERO, P.C., ARANCIO, G., MARTICORENA, A., LÓPEZ, D., MARTÍNEZ-TILLERÍA, K.P. 2010. Informe Final: Estudio de Análisis de Omisiones y Vacíos de Representatividad en los Esfuerzos de Conservación de la Biodiversidad en Chile [GAP-Chile 2009]. Comisión Nacional del Medio Ambiente, Santiago, Chile. 261 pp.
TANG, C.Q. 2006. Evergreen sclerophyllous Quercus forests in northwestern Yunnan, China as compared to the Mediterranean evergreen Quercus forests in California, USA and northeastern Spain. Web Ecology 6(1): 88-101.
THE ANGIOSPERM PHYLOGENY, G. 2009. An update of the Angiosperm Phylogeny Group classification for the orders and families of flowering plants: APG III. Botanical Journal of the Linnean Society 161(2): 105-121.
VAMOSI, S.M., HEARD, S.B., VAMOSI, J.C., WEBB, C.O. 2009. Emerging patterns in the comparative analysis of phylogenetic community structure. Molecular Ecology 18(4): 572-592.
WANG, Q., TAKAHASHI, H. 1999. A land surface water deficit model for an arid and semiarid region: Impact of desertification on the water deficit status in the Loess Plateau, China. Journal of Climate 12(1): 244-257.
WEBB, C.O., ACKERLY, D.D., KEMBEL, S.W. 2008. Phylocom: Software for the analysis of phylogenetic community structure and trait evolution. Bioinformatics 24(18): 2098-2100.
WEBB, C.O., ACKERLY, D.D., MCPEEK, M.A., DONOGHUE, M.J. 2002. Phylogenies and community ecology. Annual Review of Ecology and Systematics 33(1): 475-505.
WIKSTRÖM, N., SAVOLAINEN, V., CHASE, M.W. 2001. Evolution of the angiosperms: Calibrating the family tree. Proceedings of the Royal Society B-Biological Sciences 268(1482): 2211-2220.
ZULOAGA, F.O., MORRONE, O., BELGRANO, M.J. 2008. Catálogo de las Plantas Vasculares del Cono Sur. Ediciones Missouri Botanical Garden, St. Louis. 3888 pp.
Recibido: 24.05.2016Aceptado: 25.10.2016